Absolute and relative family affluence and psychosomatic symptoms in adolescents Frank J. Elgar a, b, * , Bart De Clercq c , Christina W. Schnohr d , Phillippa Bird e , Kate E. Pickett e , Torbjørn Torsheim f , Felix Hofmann g , Candace Currie h a Institute for Health and Social Policy, McGill University,1130 Pine Avenue West, Montreal, Canada b Douglas Mental Health University Institute, Montreal, Canada c Department of Public Health, Ghent University, Ghent, Belgium d Institute of Public Health, University of Copenhagen, Copenhagen, Denmark e Department of Health Sciences, University of York, York, England f Department of Psychosocial Science, University of Bergen, Bergen, Norway g Ludwig Boltzmann Institute Health Promotion Research, Vienna, Austria h School of Medicine, University of St. Andrews, St Andrews, Scotland article info Article history: Available online 10 May 2013 Keywords: Adolecence Relative deprivation Yitzhaki index Health inequalities Social rank Psychosomatic symptoms Health Behaviour in School-aged Children abstract Previous research on the links between income inequality and health and socioeconomic differences in health suggests that relative differences in affluence impact health and well-being more than absolute affluence. This study explored whether self-reported psychosomatic symptoms in adolescents relate more closely to relative affluence (i.e., relative deprivation or rank affluence within regions or schools) than to absolute affluence. Data on family material assets and psychosomatic symptoms were collected from 48,523 adolescents in eight countries (Austria, Belgium, Canada, Norway, Scotland, Poland, Turkey, and Ukraine) as part of the 2009/10 Health Behaviour in School-aged Children study. Multilevel regression analyses of the data showed that relative deprivation (Yitzhaki Index, calculated in regions and in schools) and rank affluence (in regions) (1) related more closely to symptoms than absolute affluence, and (2) related to symptoms after differences in absolute affluence were held constant. However, differences in family material assets, whether they are measured in absolute or relative terms, account for a significant variation in adolescent psychosomatic symptoms. Conceptual and empirical issues relating to the use of material affluence indices to estimate socioeconomic position are discussed. Ó 2013 Elsevier Ltd. All rights reserved. Introduction The likelihood that young people are happy, healthy and doing well in school is significantly greater as social class rises. Research has found that adolescents at a lower socioeconomic status (SES) display more health compromising behaviours (e.g., physical inactivity, poor nutrition, smoking), report poorer physical health and lower life satisfaction, and exhibit more emotional problems (e.g., depression, anxiety), behavioural problems (e.g., inattentiveness, hyperactivity, aggression) and social skills deficits (Brooks-Gunn, Duncan, & Maritato, 1997; Chen & Paterson, 2006; Elgar, Trites, & Boyce, 2010). Other research has found that income inequality negatively relates to adolescent health, as evidenced in international differences in child wellbeing, teenage pregnancy and school bullying (Elgar, Craig, Boyce, Morgan, & Vella-Zarb, 2009; Pickett & Wilkinson, 2007). However, the health consequences of relative deprivation (RD) and rank differences in affluence have not been thoroughly studied in this age group. The focus of this study was to examine absolute and relative differences in family material affluence with regard to their links to psychosomatic symptoms in adolescents. Adolescence is a formative stage of development for coping resources, mental health and health habits, and SES differences in adolescent health are well documented (Chen, Matthews, & Boyce, 2002). Some research has found that the health consequences of family affluence wanes during the adolescent years as peer re- lationships supplant the family as a dominant reference group (West & Sweeting, 2004) and personal assets (e.g., spending money) become more important than family assets or income (Åberg Yngwe & Östberg, 2013). Still, SES appears to relate to * Corresponding author. Institute for Health and Social Policy, McGill University, 1130 Pine AvenueWest, Montreal, Quebec H3A 1A3, Canada. Tel.: þ1 514 398 1739; fax: þ1 514 398 8983. E-mail address: [email protected] (F.J. Elgar). Contents lists available at SciVerse ScienceDirect Social Science & Medicine journal homepage: www.elsevier.com/locate/socscimed 0277-9536/$ e see front matter Ó 2013 Elsevier Ltd. All rights reserved. http://dx.doi.org/10.1016/j.socscimed.2013.04.030 Social Science & Medicine 91 (2013) 25e31

Welcome message from author
This document is posted to help you gain knowledge. Please leave a comment to let me know what you think about it! Share it to your friends and learn new things together.
Transcript
at SciVerse ScienceDirect
Social Science & Medicine 91 (2013) 25e31
Contents lists available
Social Science & Medicine
journal homepage: www.elsevier .com/locate/socscimed
Absolute and relative family affluence and psychosomatic symptomsin adolescents
Frank J. Elgar a,b,*, Bart De Clercq c, Christina W. Schnohr d, Phillippa Bird e, Kate E. Pickett e,Torbjørn Torsheim f, Felix Hofmann g, Candace Currie h
a Institute for Health and Social Policy, McGill University, 1130 Pine Avenue West, Montreal, CanadabDouglas Mental Health University Institute, Montreal, CanadacDepartment of Public Health, Ghent University, Ghent, Belgiumd Institute of Public Health, University of Copenhagen, Copenhagen, DenmarkeDepartment of Health Sciences, University of York, York, EnglandfDepartment of Psychosocial Science, University of Bergen, Bergen, Norwayg Ludwig Boltzmann Institute Health Promotion Research, Vienna, Austriah School of Medicine, University of St. Andrews, St Andrews, Scotland
a r t i c l e i n f o
Article history:Available online 10 May 2013
Keywords:AdolecenceRelative deprivationYitzhaki indexHealth inequalitiesSocial rankPsychosomatic symptomsHealth Behaviour in School-aged Children
* Corresponding author. Institute for Health and So1130 Pine Avenue West, Montreal, Quebec H3A 1A3, Cfax: þ1 514 398 8983.
E-mail address: [email protected] (F.J. Elgar).
0277-9536/$ e see front matter � 2013 Elsevier Ltd.http://dx.doi.org/10.1016/j.socscimed.2013.04.030
a b s t r a c t
Previous research on the links between income inequality and health and socioeconomic differences inhealth suggests that relative differences in affluence impact health and well-being more than absoluteaffluence. This study explored whether self-reported psychosomatic symptoms in adolescents relatemore closely to relative affluence (i.e., relative deprivation or rank affluence within regions or schools)than to absolute affluence. Data on family material assets and psychosomatic symptoms were collectedfrom 48,523 adolescents in eight countries (Austria, Belgium, Canada, Norway, Scotland, Poland, Turkey,and Ukraine) as part of the 2009/10 Health Behaviour in School-aged Children study. Multilevelregression analyses of the data showed that relative deprivation (Yitzhaki Index, calculated in regionsand in schools) and rank affluence (in regions) (1) related more closely to symptoms than absoluteaffluence, and (2) related to symptoms after differences in absolute affluence were held constant.However, differences in family material assets, whether they are measured in absolute or relative terms,account for a significant variation in adolescent psychosomatic symptoms. Conceptual and empiricalissues relating to the use of material affluence indices to estimate socioeconomic position are discussed.
� 2013 Elsevier Ltd. All rights reserved.
Introduction
The likelihood that young people are happy, healthy and doingwell in school is significantly greater as social class rises. Research hasfound that adolescents at a lower socioeconomic status (SES) displaymore health compromising behaviours (e.g., physical inactivity, poornutrition, smoking), report poorer physical health and lower lifesatisfaction, and exhibit more emotional problems (e.g., depression,anxiety), behavioural problems (e.g., inattentiveness, hyperactivity,aggression) and social skills deficits (Brooks-Gunn, Duncan, &Maritato, 1997; Chen & Paterson, 2006; Elgar, Trites, & Boyce, 2010).Other research has found that income inequality negatively relates to
cial Policy, McGill University,anada. Tel.: þ1 514 398 1739;
All rights reserved.
adolescent health, as evidenced in international differences in childwellbeing, teenage pregnancy and school bullying (Elgar, Craig,Boyce, Morgan, & Vella-Zarb, 2009; Pickett & Wilkinson, 2007).However, the health consequences of relative deprivation (RD) andrank differences in affluence have not been thoroughly studied in thisage group. The focus of this study was to examine absolute andrelative differences in family material affluence with regard to theirlinks to psychosomatic symptoms in adolescents.
Adolescence is a formative stage of development for copingresources, mental health and health habits, and SES differences inadolescent health are well documented (Chen, Matthews, & Boyce,2002). Some research has found that the health consequences offamily affluence wanes during the adolescent years as peer re-lationships supplant the family as a dominant reference group(West & Sweeting, 2004) and personal assets (e.g., spendingmoney) become more important than family assets or income(Åberg Yngwe & Östberg, 2013). Still, SES appears to relate to

F.J. Elgar et al. / Social Science & Medicine 91 (2013) 25e3126
mental and physical health in adolescents regardless of how theirstatus is established, and salient peer influences on status suggeststhat their health relates not only to absolute affluence but to rela-tive affluence as well.
Research on the mechanisms that underlie SES differences inadult health focuses on the direct consequences of material depri-vation and the indirect psychosocial consequences of socioeco-nomic position (Adler & Snibbe, 2003; Diener, Sandvik, Seidlitz, &Diener, 1993; Mackenbach, 2012). According to the materialist hy-pothesis, SES differences in health arise from unequal distributionsof material goods and services and financial resources that can beused to support health or fight and prevent illness. The psychosocialhypothesis posits that feeling poor in comparison to others elicitspsychological stress, erodes social resources that help people tocope with stress, and thus contributes to stress-related illness(Marmot & Wilkinson, 2001; Wilkinson & Pickett, 2009). Thesehypotheses are not mutually exclusive, but only the psychosocialinterpretation explains why two people with the same incomemaydiffer in health when one is surrounded by more affluent peopleand the other by less affluent people. What differentiates theseindividuals is not deprivation in absolute terms, such as inadequatenutrition or shelter, but rather feelings of deprivation from adesirable standard of living that is established by society.
These mechanisms have not been thoroughly investigated inadolescents. Although RD is conceptually and computationallyrelated to the Gini coefficient of income inequality, and both RD andsocial rank are used to interpret contextual effects of incomeinequality on adolescent health (Wilkinson & Pickett, 2009), we areunaware of any previous studies that have directly compared abso-lute affluence, RD and rank affluence in terms of their associationswith adolescent health. A recent review of studies of RD and healthby Adjaye-Gbewonyo and Kawachi (2012) identified just one studythat included data on child health, and it linkedmaternal RD to birthoutcomes (Reagan, Salsberry, & Randall, 2007). By contrast, ninestudies in the review found a significant association between RD andadult health, someafter controlling individual differences in absoluteincome (e.g., Subramanyam, Kawachi, Berkman, & Subramanian,2009). Another line of research on income rank and adult well-being has found that mental distress (i.e., depressive and anxietysymptoms, social difficulties) and happiness relate more closely toincome rank within a reference group than to absolute income(Boyce, Brown, &Moore, 2010;Wood, Boyce,Moore, & Brown, 2012).
It is unclear, based on the adult literature, whether relativeaffluence impacts adolescent health more than absolute affluence.Both are likely to contribute to health inequalities, however theresearch carried out in modern welfare states appears to favourthe psychosocial hypothesis. First, SES differences in mental andphysical health are moderated by feelings of autonomy, isolation,stress and social support (Elgar et al., 2010; Marmot, 2004). Havingmany social connections and low stress helps protect the health oflow-SES individuals. Second, the socioeconomic gradient in healthexists across the full range of SES, even among relatively affluentgroups (Chen & Paterson, 2006; Marmot, 2004). That the gradientdoes not disappear above a certain threshold suggests that statusmatters more to health than the availability of material goods andservices. Third, among modern welfare states that have attainedthe basic material standards to support health of all citizens, therelation between affluence and health is stronger within thesecountries than between them (Easterlin, 1995; Wilkinson &Pickett, 2009). Fourth, socioeconomic gradients in health persistafter differences in accessing health services and prevalence ofhealth compromising behaviours are held constant (Marmot,2004). It is difficult to explain these aspects of socioeconomicgradients in health in terms of the direct effects of material con-ditions alone.
These findings pose unanswered questions about how relativedifferences in affluence relate to adolescent health. Are adolescents,like adults, similarly affected by absolute and relative affluence?Does RD or affluence rank relate to health after differences in ab-solute affluence are held constant? The present study addressedthese questions using international data on family material assetsand psychosomatic symptoms in 11- to 15-year-olds. The data werecollected in eight rich and middle-income countries. We used dataon psychosomatic symptom frequency, rather than global assess-ments of health, to achieve the most objective measure of healthpossible (Loughnan et al., 2011). Our first objective was to comparethree methods of operationalizing socioeconomic conditions withregard to their relation to symptoms: (1) absolute affluence was asummation of family material assets in the home; (2) RD wasestimated using the Yitzhaki Index, which is the average differencebetween an individual’s affluence and those with greater affluencein the same reference group (Yitzhaki, 1979); (3) rank affluencewasthe ordinal position of absolute affluence within a reference group(Boyce et al., 2010;Wood et al., 2012).We hypothesised that RD andrank affluence relate more closely to psychosomatic symptomsthan absolute affluence. We also hypothesised, based on similarresearch on adults, that relative affluence relates to symptoms afterdifferences in absolute affluence are taken into account.
Method
Participants
Data on family affluence and psychosomatic symptoms werecollected in the 2009/10 Health Behaviours in School-aged Children(HBSC) study. The HBSC study is a school-based survey of nationallyrepresentative samples of 11-, 13-, and 15-year-olds in 39 countriesin Europe and North America (Currie et al., 2012). Schools thatrepresented the socioeconomic conditions of each participatingcountry were recruited into the study. The HBSC study protocolspecifies that samples submitted for international comparisons aresufficient to provide confidence intervals of �3% for representativeestimates with sample design effects no more than 1.4 timesgreater than would be obtained from a simple random sample(Currie et al., 2012). Teachers or trained interviewers administeredthe survey in classroom settings. Student participation was volun-tary. Each participating country obtained approval to conduct thesurvey from the ethics review board or equivalent regulatory bodyassociated with the institution conducting each respective nationalsurvey.
We analysed data from eight countries (Table 1): Austria,Belgium (Flanders region), Canada, Norway, Poland, Scotland,Turkey, and Ukraine. Table 1 summarises the number of students,schools and regions per country. These countries were selected torepresent high- and middle-income groups of countries withdiffering levels of absolute affluence. In 2011, their gross nationalincome per capita ranged from $3120 (Ukraine) to $88,890 (Nor-way) US dollars (World Bank, 2012). We excluded individual caseswith missing data on geocodes (region or school) or key variables(i.e., gender, age, family affluence and psychosomatic symptoms)and excluded schools with fewer than 10 student observationsgiven our focus on relative differences within schools. Theseexclusion criteria reduced the sample by 7.7%e to 48,523 studentsin 2166 schools, in 141 regions. The number of regions per countryranged from 2 (Norway) to 36 (Austria), number of schools rangedfrom 105 (Poland) to 434 (Canada) and number of students rangedfrom 3740 (Belgium-Flanders) to 14,394 (Canada). The sample was48.97% male, 51.03% female and ranged in age from 10.50 to 16.50years (M ¼ 13.61, SD ¼ 1.63).

Table 1Family affluence and psychosomatic symptoms among adolescents in eight countries.
Country n Absolute affluence Symptoms
Students Schools Regions Mean SD Skew Mean SD Skew
Austria 4752 346 36 6.04 1.78 �.28 33.45 13.09 .04Belgium 3740 138 12 6.32 1.72 �.37 34.98 11.97 �.26Canada 14,394 434 11 6.19 1.76 �.39 38.97 11.84 �.35Norway 4210 177 2 7.23 1.50 �.91 38.20 11.31 �.30Poland 4101 105 17 5.34 2.03 �.17 39.44 12.62 �.32Turkey 5391 199 4 3.09 2.05 .39 45.35 11.99 �.73Scotland 6566 273 33 6.17 1.78 �.61 37.29 12.46 �.41Ukraine 5569 517 26 4.25 1.92 �.11 41.23 11.50 �.61Total 48,523 2189 141 5.64 2.15 �.46 38.84 12.46 .25
Note: SD ¼ Standard deviation.
F.J. Elgar et al. / Social Science & Medicine 91 (2013) 25e31 27
Measures
Family affluenceAll affluence measures were based on data collected using the
HBSC Family Affluence Scale (FAS), a four-item index of materialassets or common indicators of wealth (Currie, Elton, Todd, & Platt,1997; Wardle, Robb, & Johnson, 2002). The FAS is composed of fouritems: “Does your family own a car, van or truck?” (No ¼ 0, Yes,one ¼ 1, Yes, two or more ¼ 2); “During the past 12 months, howmany times did you travel away on holiday with your family?” (Notat all ¼ 0, Once ¼ 1, Twice ¼ 2, More than twice ¼ 3); How manycomputers does your family own (None ¼ 0, One ¼ 1, Two ¼ 2,More than two ¼ 3); “Do you have your own bedroom for your-self?” (No ¼ 0, Yes ¼ 1). The validity of the FAS has been testedalongside longermeasures of socioeconomic status that collect dataon parental education or income and was found to have bettercriterion validity and to be less affected by nonresponse bias (Boyce,Torsheim, Currie, & Zambon, 2006; Torsheim et al., 2004).
Consistent with previous applications of the FAS, absoluteaffluence was measured by a sum of its items, ranging from0 (lowest affluence) to 9 (highest affluence; Boyce et al., 2006;Currie et al., 2012). In our analyses, absolute affluence scores werecentred around the grand mean of the total sample.
We calculated relative deprivation of each individual withinschools and within regions using the Yitzhaki Index (Yitzhaki,1979). For an individual adolescent i with affluence score of yiwho is a member of a reference group of N individuals, relativedeprivation (RD) is:
RDi ¼1N
Xj
�yj � yi
�; c
�yj > yi
�
where the amount of deprivation is operationalized as the averagedifference in affluence between the individual i and other membersof the group who have greater affluence. As such, the Yitzhaki is an“upward looking” index of deprivation. We calculated two esti-mates of RD for each individual using schools and regions asreference groups.
We also calculated rank affluence of each individual within theirschools and regions, thus ignoring distances in affluence betweenindividuals. Rank affluence was calculated within 141 regions and2189 schools by first calculating the percentile rank in absoluteaffluence for each student (i) within each group (n), or ((i e .5)/n),and then normalising their distribution using an inverse normalfunction.
Psychosomatic symptomsAn eight-item psychosomatic symptom checklist measured
three psychological symptoms: irritability or bad temper, feelinglow, and feeling nervous, and five somatic symptoms, sleeping
difficulty, headache, stomach ache, back ache and feeling dizzy(Torsheim & Wold, 2001). Respondents reported the frequency ofeach symptom during the previous six months (0¼ Rarely or never,1 ¼ Every month, 2 ¼ Every week, 3 ¼ More than once a week,4 ¼ Every day). The validity of this psychosomatic symptomchecklist was supported by cross-national studies and qualitativeinterviews with adolescents (Haugland & Wold, 2001; Torsheim &Wold, 2001). Ravens-Sieberer et al. (2008) carried out a Raschmeasurement analysis of differential item functioning (DIF) in thismeasure and found the scale functioned equally well in 35 HBSCcountries. However, to maximise the validity of the scale in ourstudy, we applied Ravens-Sieberer et al.’s (2008) scoring algorithmthat removed one item (sleeping difficulty) and recalibrated thescores to control for country-related DIF.
Data analysis
Calculations of comparative and rank affluence scores anddescriptive statistics were compiled used the svy commands inStata 12.1 (StataCorp Inc., College Station, TX), which adjustedstandard errors for country differences and sampling design effectsof school cluster. Given the nested structure of the data, we testedassociations between affluence and symptoms by fitting three-level, random effects linear regression models to the data, withstudents (i) clustered within schools (j) and within countries (k):
yijk ¼ b0ijk þ b1xijk þ b2xijk þ b3xijkb0ijk ¼ b0 þ n0k þ m0jk þ e0ijk
where psychosomatic symptoms (yijk) were predicted by a constant(b0ijk) that included random effects at the country level (n0k) andschool level (m0jk) and by fixed effects of individual-level charac-teristics: female gender (b1xijk), age in years (b2xijk) and familyaffluence (b3xijk). Random effects at different levels of variancewere assumed to be uncorrelated. The fit of non-nested models tothe data were compared using Akaike’s Information Criterion (AIC),which is a measure of model deviance (d) adjusted for the numberof parameters (q) in the model (AIC ¼ d þ 2q), and the more con-servative Bayesian information criterion (BIC), which also correctsfor differences in the number of observations (n) in the model(Burnham & Anderson, 2002; BIC ¼ d þ log(n)*q). Nested modelswere compared using model deviance and likelihood ratio (LR)tests. Model fit was evaluated using the xtmixed command in Stata12.1. Where interactions were found between affluent terms, wecalculated the simple slopes of RD or rank affluence at high and lowlevels of absolute affluence (mean þ/� 2 SD). Variance inflationfactors (VIF) were used to test for multicollinearity, or the lack ofindependence between independent variables in a model. VIFvalues larger than 10 suggests that regression results may be biaseddue to high degree of multicollinearity (Chatterjee & Price, 1991).
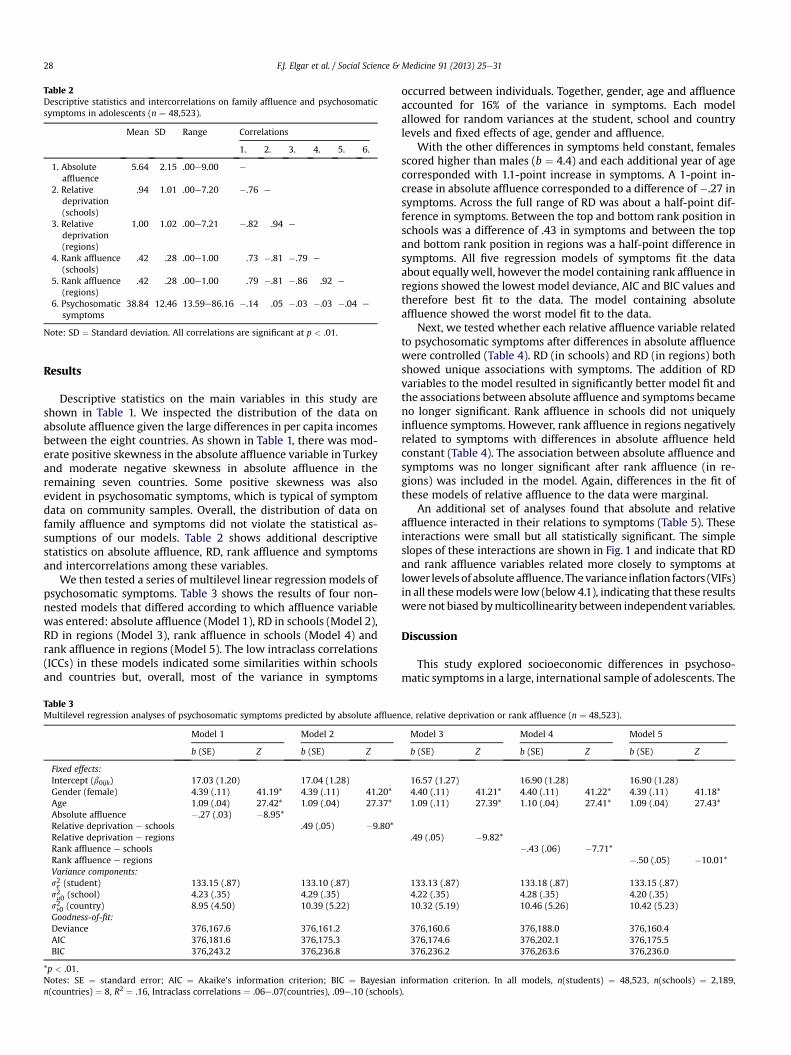
Table 2Descriptive statistics and intercorrelations on family affluence and psychosomaticsymptoms in adolescents (n ¼ 48,523).
Mean SD Range Correlations
1. 2. 3. 4. 5. 6.
1. Absoluteaffluence
5.64 2.15 .00e9.00 e
2. Relativedeprivation(schools)
.94 1.01 .00e7.20 �.76 e
3. Relativedeprivation(regions)
1.00 1.02 .00e7.21 �.82 .94 e
4. Rank affluence(schools)
.42 .28 .00e1.00 .73 �.81 �.79 e
5. Rank affluence(regions)
.42 .28 .00e1.00 .79 �.81 �.86 .92 e
6. Psychosomaticsymptoms
38.84 12.46 13.59e86.16 �.14 .05 �.03 �.03 �.04 e
Note: SD ¼ Standard deviation. All correlations are significant at p < .01.
F.J. Elgar et al. / Social Science & Medicine 91 (2013) 25e3128
Results
Descriptive statistics on the main variables in this study areshown in Table 1. We inspected the distribution of the data onabsolute affluence given the large differences in per capita incomesbetween the eight countries. As shown in Table 1, there was mod-erate positive skewness in the absolute affluence variable in Turkeyand moderate negative skewness in absolute affluence in theremaining seven countries. Some positive skewness was alsoevident in psychosomatic symptoms, which is typical of symptomdata on community samples. Overall, the distribution of data onfamily affluence and symptoms did not violate the statistical as-sumptions of our models. Table 2 shows additional descriptivestatistics on absolute affluence, RD, rank affluence and symptomsand intercorrelations among these variables.
We then tested a series of multilevel linear regression models ofpsychosomatic symptoms. Table 3 shows the results of four non-nested models that differed according to which affluence variablewas entered: absolute affluence (Model 1), RD in schools (Model 2),RD in regions (Model 3), rank affluence in schools (Model 4) andrank affluence in regions (Model 5). The low intraclass correlations(ICCs) in these models indicated some similarities within schoolsand countries but, overall, most of the variance in symptoms
Table 3Multilevel regression analyses of psychosomatic symptoms predicted by absolute affluen
Model 1 Model 2
b (SE) Z b (SE) Z
Fixed effects:Intercept (b0ijk) 17.03 (1.20) 17.04 (1.28)Gender (female) 4.39 (.11) 41.19* 4.39 (.11) 41.20*Age 1.09 (.04) 27.42* 1.09 (.04) 27.37*Absolute affluence �.27 (.03) �8.95*Relative deprivation e schools .49 (.05) �9.80*Relative deprivation e regionsRank affluence e schoolsRank affluence e regionsVariance components:s2e (student) 133.15 (.87) 133.10 (.87)s2m0 (school) 4.23 (.35) 4.29 (.35)s2n0 (country) 8.95 (4.50) 10.39 (5.22)Goodness-of-fit:Deviance 376,167.6 376,161.2AIC 376,181.6 376,175.3BIC 376,243.2 376,236.8
*p < .01.Notes: SE ¼ standard error; AIC ¼ Akaike’s information criterion; BIC ¼ Bayesiann(countries) ¼ 8, R2 ¼ .16, Intraclass correlations ¼ .06e.07(countries), .09e.10 (schools
occurred between individuals. Together, gender, age and affluenceaccounted for 16% of the variance in symptoms. Each modelallowed for random variances at the student, school and countrylevels and fixed effects of age, gender and affluence.
With the other differences in symptoms held constant, femalesscored higher than males (b ¼ 4.4) and each additional year of agecorresponded with 1.1-point increase in symptoms. A 1-point in-crease in absolute affluence corresponded to a difference of �.27 insymptoms. Across the full range of RD was about a half-point dif-ference in symptoms. Between the top and bottom rank position inschools was a difference of .43 in symptoms and between the topand bottom rank position in regions was a half-point difference insymptoms. All five regression models of symptoms fit the dataabout equally well, however the model containing rank affluence inregions showed the lowest model deviance, AIC and BIC values andtherefore best fit to the data. The model containing absoluteaffluence showed the worst model fit to the data.
Next, we tested whether each relative affluence variable relatedto psychosomatic symptoms after differences in absolute affluencewere controlled (Table 4). RD (in schools) and RD (in regions) bothshowed unique associations with symptoms. The addition of RDvariables to the model resulted in significantly better model fit andthe associations between absolute affluence and symptoms becameno longer significant. Rank affluence in schools did not uniquelyinfluence symptoms. However, rank affluence in regions negativelyrelated to symptoms with differences in absolute affluence heldconstant (Table 4). The association between absolute affluence andsymptoms was no longer significant after rank affluence (in re-gions) was included in the model. Again, differences in the fit ofthese models of relative affluence to the data were marginal.
An additional set of analyses found that absolute and relativeaffluence interacted in their relations to symptoms (Table 5). Theseinteractions were small but all statistically significant. The simpleslopes of these interactions are shown in Fig. 1 and indicate that RDand rank affluence variables related more closely to symptoms atlower levels of absolute affluence. Thevariance inflation factors (VIFs)in all thesemodelswere low (below4.1), indicating that these resultswere not biased bymulticollinearity between independent variables.
Discussion
This study explored socioeconomic differences in psychoso-matic symptoms in a large, international sample of adolescents. The
ce, relative deprivation or rank affluence (n ¼ 48,523).
Model 3 Model 4 Model 5
b (SE) Z b (SE) Z b (SE) Z
16.57 (1.27) 16.90 (1.28) 16.90 (1.28)4.40 (.11) 41.21* 4.40 (.11) 41.22* 4.39 (.11) 41.18*1.09 (.11) 27.39* 1.10 (.04) 27.41* 1.09 (.04) 27.43*
.49 (.05) �9.82*�.43 (.06) �7.71*
�.50 (.05) �10.01*
133.13 (.87) 133.18 (.87) 133.15 (.87)4.22 (.35) 4.28 (.35) 4.20 (.35)10.32 (5.19) 10.46 (5.26) 10.42 (5.23)
376,160.6 376,188.0 376,160.4376,174.6 376,202.1 376,175.5376,236.2 376,263.6 376,236.0
information criterion. In all models, n(students) ¼ 48,523, n(schools) ¼ 2,189,).
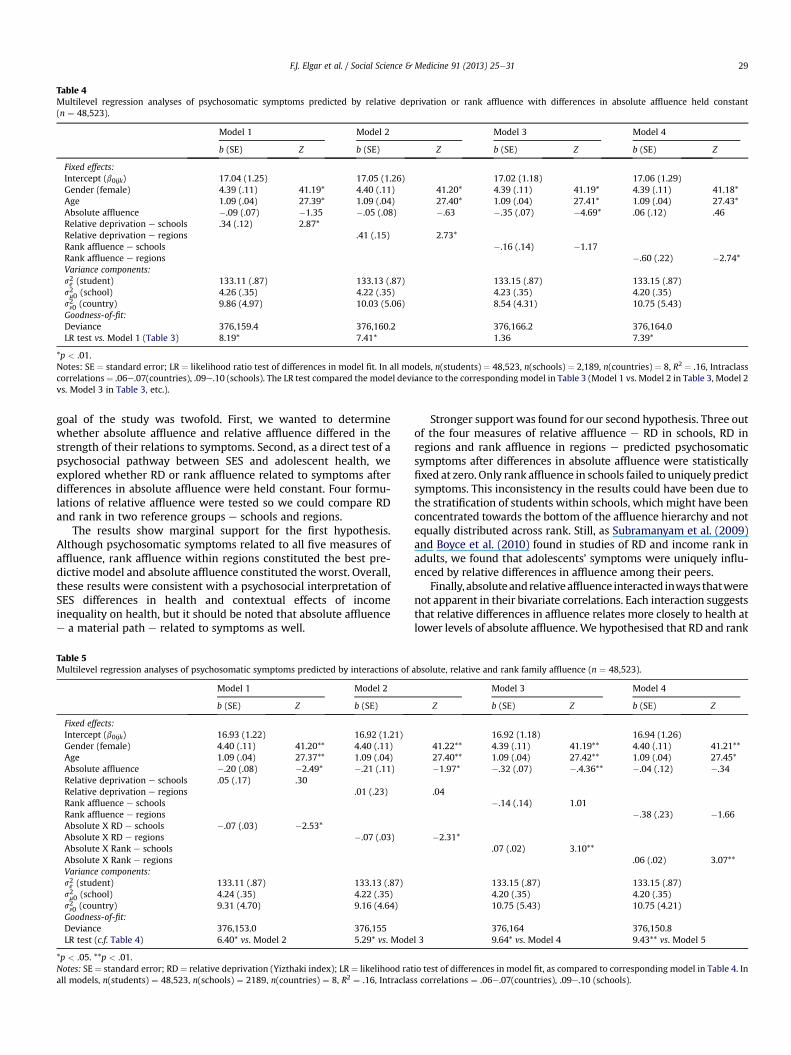
Table 4Multilevel regression analyses of psychosomatic symptoms predicted by relative deprivation or rank affluence with differences in absolute affluence held constant(n ¼ 48,523).
Model 1 Model 2 Model 3 Model 4
b (SE) Z b (SE) Z b (SE) Z b (SE) Z
Fixed effects:Intercept (b0ijk) 17.04 (1.25) 17.05 (1.26) 17.02 (1.18) 17.06 (1.29)Gender (female) 4.39 (.11) 41.19* 4.40 (.11) 41.20* 4.39 (.11) 41.19* 4.39 (.11) 41.18*Age 1.09 (.04) 27.39* 1.09 (.04) 27.40* 1.09 (.04) 27.41* 1.09 (.04) 27.43*Absolute affluence �.09 (.07) �1.35 �.05 (.08) �.63 �.35 (.07) �4.69* .06 (.12) .46Relative deprivation e schools .34 (.12) 2.87*Relative deprivation e regions .41 (.15) 2.73*Rank affluence e schools �.16 (.14) �1.17Rank affluence e regions �.60 (.22) �2.74*Variance components:s2e (student) 133.11 (.87) 133.13 (.87) 133.15 (.87) 133.15 (.87)s2m0 (school) 4.26 (.35) 4.22 (.35) 4.23 (.35) 4.20 (.35)s2n0 (country) 9.86 (4.97) 10.03 (5.06) 8.54 (4.31) 10.75 (5.43)Goodness-of-fit:Deviance 376,159.4 376,160.2 376,166.2 376,164.0LR test vs. Model 1 (Table 3) 8.19* 7.41* 1.36 7.39*
*p < .01.Notes: SE ¼ standard error; LR ¼ likelihood ratio test of differences in model fit. In all models, n(students) ¼ 48,523, n(schools) ¼ 2,189, n(countries) ¼ 8, R2 ¼ .16, Intraclasscorrelations¼ .06e.07(countries), .09e.10 (schools). The LR test compared the model deviance to the corresponding model in Table 3 (Model 1 vs. Model 2 in Table 3, Model 2vs. Model 3 in Table 3, etc.).
F.J. Elgar et al. / Social Science & Medicine 91 (2013) 25e31 29
goal of the study was twofold. First, we wanted to determinewhether absolute affluence and relative affluence differed in thestrength of their relations to symptoms. Second, as a direct test of apsychosocial pathway between SES and adolescent health, weexplored whether RD or rank affluence related to symptoms afterdifferences in absolute affluence were held constant. Four formu-lations of relative affluence were tested so we could compare RDand rank in two reference groups e schools and regions.
The results show marginal support for the first hypothesis.Although psychosomatic symptoms related to all five measures ofaffluence, rank affluence within regions constituted the best pre-dictive model and absolute affluence constituted the worst. Overall,these results were consistent with a psychosocial interpretation ofSES differences in health and contextual effects of incomeinequality on health, but it should be noted that absolute affluencee a material path e related to symptoms as well.
Table 5Multilevel regression analyses of psychosomatic symptoms predicted by interactions of
Model 1 Model 2
b (SE) Z b (SE)
Fixed effects:Intercept (b0ijk) 16.93 (1.22) 16.92 (1.21)Gender (female) 4.40 (.11) 41.20** 4.40 (.11)Age 1.09 (.04) 27.37** 1.09 (.04)Absolute affluence �.20 (.08) �2.49* �.21 (.11)Relative deprivation e schools .05 (.17) .30Relative deprivation e regions .01 (.23)Rank affluence e schoolsRank affluence e regionsAbsolute X RD e schools �.07 (.03) �2.53*Absolute X RD e regions �.07 (.03)Absolute X Rank e schoolsAbsolute X Rank e regionsVariance components:s2e (student) 133.11 (.87) 133.13 (.87)s2m0 (school) 4.24 (.35) 4.22 (.35)s2n0 (country) 9.31 (4.70) 9.16 (4.64)Goodness-of-fit:Deviance 376,153.0 376,155LR test (c.f. Table 4) 6.40* vs. Model 2 5.29* vs. Mode
*p < .05. **p < .01.Notes: SE ¼ standard error; RD ¼ relative deprivation (Yizthaki index); LR ¼ likelihood ratall models, n(students) ¼ 48,523, n(schools) ¼ 2189, n(countries) ¼ 8, R2 ¼ .16, Intraclas
Stronger support was found for our second hypothesis. Three outof the four measures of relative affluence e RD in schools, RD inregions and rank affluence in regions e predicted psychosomaticsymptoms after differences in absolute affluence were statisticallyfixed at zero. Only rank affluence in schools failed to uniquely predictsymptoms. This inconsistency in the results could have been due tothe stratification of students within schools, which might have beenconcentrated towards the bottom of the affluence hierarchy and notequally distributed across rank. Still, as Subramanyam et al. (2009)and Boyce et al. (2010) found in studies of RD and income rank inadults, we found that adolescents’ symptoms were uniquely influ-enced by relative differences in affluence among their peers.
Finally, absoluteandrelativeaffluence interacted inways thatwerenot apparent in their bivariate correlations. Each interaction suggeststhat relative differences in affluence relates more closely to health atlower levels of absolute affluence.We hypothesised that RD and rank
absolute, relative and rank family affluence (n ¼ 48,523).
Model 3 Model 4
Z b (SE) Z b (SE) Z
16.92 (1.18) 16.94 (1.26)41.22** 4.39 (.11) 41.19** 4.40 (.11) 41.21**27.40** 1.09 (.04) 27.42** 1.09 (.04) 27.45*�1.97* �.32 (.07) �.4.36** �.04 (.12) �.34
.04�.14 (.14) 1.01
�.38 (.23) �1.66
�2.31*.07 (.02) 3.10**
.06 (.02) 3.07**
133.15 (.87) 133.15 (.87)4.20 (.35) 4.20 (.35)10.75 (5.43) 10.75 (4.21)
376,164 376,150.8l 3 9.64* vs. Model 4 9.43** vs. Model 5
io test of differences in model fit, as compared to corresponding model in Table 4. Ins correlations ¼ .06e.07(countries), .09e.10 (schools).

14
15
16
17
18
19
20
-0.94 6.76
Psyc
hoso
mat
ic S
ympt
oms
High RD (schools) Low RD (schools)
14
15
16
17
18
19
20
Psyc
hoso
mat
ic S
ympt
oms
High Rank (regions) Low Rank (regions)
(a) (b)
(d)(c)
14
15
16
17
18
19
20
Psyc
hoso
mat
ic S
ympt
oms
High Rank (schools) Low Rank (schools)
14
15
16
17
18
19
20
-1.00 6.22
Psyc
hoso
mat
ic S
ympt
oms
Low
Medium
High
High RD (regions) Low RD (regions)
Absolute Affluence
Fig. 1. Simple slopes of the interaction for (a) RD in schools, (b) RD in regions, (c) rank affluence in schools and (d) rank affluence in regions at high and low levels of absoluteaffluence (1 SD above and 1 SD below the mean).
F.J. Elgar et al. / Social Science & Medicine 91 (2013) 25e3130
would relate to health equally at all levels of absolute affluence, butfound instead that relative deprivation and statusmatter more at thebottom and have diminishing returns at higher levels of absoluteaffluence. An alternative interpretation of these findings is that therelations between relative affluence and symptoms were attenuatedby a ‘floor effect’ caused by a narrower range of symptom scoresamong themost affluent (and healthiest) adolescents.
Taken together, these results indicate that family materialaffluence is a robust predictor of psychosomatic symptoms in ad-olescents. Regardless of whether affluence was measured in purelyabsolute terms (i.e., as an index of material assets listed on the FAS)or as relative differences within groups, family affluence negativelyrelated to symptoms in adolescents. The findings dovetail with thelarge body of evidence on SES differences in health and well-being(Adler & Snibbe, 2003; Chen & Paterson, 2006; Elgar et al., 2010;Galobardes, Smith, & Lynch, 2006). Unique to this study was thedemonstration that relative affluence is at least as strong a pre-dictor of adolescent symptoms as absolute affluence, thus sup-porting the psychosocial hypothesis about mechanisms thatunderlie socioeconomic inequalities in adolescent health. Thefindings are consistent with those on RD, income rank and adulthealth (Adjaye-Gbewonyo & Kawachi, 2012; Boyce et al., 2010) andextend these constructs to adolescent health. We conclude thatsocioeconomic status impacts adolescent health through the psy-chosocial impact of relative deprivation and social rank, in additionto an uneven distribution of material goods and services thatsupport health (Chen & Paterson, 2006; Currie et al., 2008).
Our findings also highlight a fundamental distinction betweenabsolute and relative affluence and its implications for how SES isoperationalized in research e not only in the HBSC study but inother international studies as well. Given the type of data measuredby the FAS (i.e., cars, computers, vacations and bedrooms), it couldbe argued that relative differences in FAS scores are conceptuallycloser to the construct of SES than a simple summation of its items.Differentiating absolute and relative affluence is especially impor-tant in research carried out on samples representing different
socioeconomic contexts. The principle of RD explains why a score of4 on the FAS can simultaneously indicate high SES in a poor countryand low SES in a rich country. The summation of material assets, aseasily done with the FAS, disregards context and therefore does notmeasure relative socioeconomic position. Yet, in numerous studiesthat are grounded in theory and evidence about socioeconomicdifferences in health, assessments of absolute and relative affluenceare used interchangeably to measure SES. We show that availabledata on absolute affluence can be transformed to RD or rank toprovide more precise estimates of SES.
Indices of material assets have other limitations that are moredifficult to overcome. In the HBSC study, for example, some items inthe FAS show differential item functioning across gender and rural/urban groups, countries or survey cycles, which makes it difficult tointerpret differences in its total score (Schnohr et al., 2008). As well,past research has not agreed on whether the types of assetsmeasured by the FAS reflect an underlying construct of affluence orif these assets themselves constitute affluence. This debate focuseson whether the FAS is a reflective or formative index of materialaffluence (Currie et al., 2008; Schnohr et al., 2008).
In summary, this examination of absolute and relative socio-economic conditions in relation to psychosomatic symptoms con-tributes to the research literature on social inequalities in health. Anobvious limitation was its cross-sectional design, which precludedstrong conclusions about the direction of effects on affluence andhealth. Longitudinal research would provide clearer evidence ofhow socioeconomic circumstances early in life shape health in-equalities in adolescence. Also, multiple assessments of socioeco-nomic conditions using standard measures of parental occupationor household income might have provided more precise estimatesof SES than material assets. Continued development of such mea-sures of socioeconomic differences in youth has implications tohealth policy. Such research has the potential to provide a betterunderstanding of the origins of socioeconomic differences in adulthealth and the material and psychosocial mechanisms that supportthem (Starfield, Riley, Witt, & Robertson, 2002).
F.J. Elgar et al. / Social Science & Medicine 91 (2013) 25e31 31
Acknowledgements
The Health Behaviour in School-aged Children (HBSC) study is aWorld Health Organization collaborative study and funded by eachof its member countries. The HBSC International CoordinatingCentre is located at St. Andrew’s University (Scotland) and databankis managed at the University of Bergen (Norway). A list of theparticipating researchers can be found online at www.hbsc.org.This research was also funded by grants from the Social Sciencesand Humanities Research Council of Canada and Canada ResearchChairs Programme awarded to the first author. The authors alsothank Malavika Subramanyam and S.V. Subramanian for theassistance with the analysis and two blind reviewers for theirhelpful suggestions.
References
Åberg Yngwe, M., & Östberg, V. (2013). The family’s economic resources and ado-lescents’ health complaintsedo adolescents’ own economic resources matter?European Journal of Public Health, 23(1), 24e29.
Adjaye-Gbewonyo, K., & Kawachi, I. (2012). Use of the Yitzhaki index as a test ofrelative deprivation for health outcomes: a review of recent literature. SocialScience & Medicine, 75(1), 129e137.
Adler, N. E., & Snibbe, A. C. (2003). The role of psychosocial processes in explainingthe gradient between socioeconomic status and health. Current Directions inPsychological Science, 12(4), 119e123.
Boyce, C. J., Brown, G. D., & Moore, S. C. (2010). Money and happiness: rank of in-come, not income, affects life satisfaction. Psychological Science, 21(4), 471e475.
Boyce, W., Torsheim, T., Currie, C., & Zambon, A. (2006). The family affluence scale asa measure of national wealth: validation of an adolescent self-report measure.Social Indicators Research, 78(3), 473e487.
Brooks-Gunn, J., Duncan, G. J., & Maritato, N. (1997). Poor families, poor outcomes:the well being of children and youth. In G. J. Duncan, & J. Brooks-Gunn (Eds.),Consequences of growing up poor (pp. 1e17). New York: Russel Sage Foundation.
Burnham, K. P., & Anderson, D. R. (2002).Model selection and multimodel inference: Apractical information-theoretic approach (2nd ed.). New York: Springer.
Chatterjee, S., & Price, B. (1991). Regression analysis by example (2nd ed.). New York:Wiley.
Chen, E., Matthews, K. A., & Boyce, W. T. (2002). Socioeconomic differences inchildren’s health: how and why do these relationships change with age? Psy-chological Bulletin, 128(2), 295e329.
Chen, E., & Paterson, L. Q. (2006). Neighborhood, family, and subjective socioeco-nomic status: how do they relate to adolescent health? Health Psychology, 25(6),704e714.
Currie, C. E., Elton, R. A., Todd, J., & Platt, S. (1997). Indicators of socioeconomicstatus for adolescents: the WHO health behaviour in school-aged childrensurvey. Health Education Research, 12(3), 385e397.
Currie, C., Molcho, M., Boyce, W., Holstein, B., Torsheim, T., & Richter, M. (2008).Researching health inequalities in adolescents: the development of the healthbehaviour in school-aged children (HBSC) family affluence scale. Social Science& Medicine., 66(6), 1429e1436.
Currie, C., Zanotti, C., Morgan, A., Currie, D., de Looze, M., Roberts, C., et al. (2012).Social determinants of health and well-being among young people. Healthbehaviour in school-aged children (HBSC) study: International report from the2009/2010 survey. In Health policy for children and adolescents (No. 6). Copen-hagen: WHO Regional Office for Europe.
Diener, E., Sandvik, E., Seidlitz, L., & Diener, M. (1993). The relationship betweenincome and subjective well-being: relative or absolute? Social IndicatorsResearch, 28, 195e223.
Easterlin, R. A. (1995). Will raising the incomes of all increase the happiness of all?Journal of Economic Behavior and Organization, 27(1), 35e48.
Elgar, F. J., Craig, W., Boyce, W., Morgan, A., & Vella-Zarb, R. (2009). Incomeinequality and school bullying: multilevel study of adolescents in 37 countries.Journal of Adolescent Health, 45(4), 351e359.
Elgar, F. J., Trites, S. J., & Boyce, W. (2010). Social capital reduces socio-economicdifferences in child health: evidence from the Canadian health behaviour inschool-aged children study. Canadian Journal of Public Health, 101(Suppl. 3),23e27.
Galobardes, B., Smith, G. D., & Lynch, J. W. (2006). Systematic review of the influ-ence of childhood socioeconomic circumstances on risk for cardiovasculardisease in adulthood. Annals of Epidemiology, 16(2), 91e104.
Haugland, S., & Wold, B. (2001). Subjective health complaints in adolescence:reliability and validity of survey methods. Journal of Adolescence, 24(5),611e624.
Loughnan, S., Kuppens, P., Allik, J., Balazs, K., de Lemus, S., Dumont, K., et al. (2011).Economic inequality is linked to biased self-perception. Psychological Science,22(10), 1254e1258.
Mackenbach, J. P. (2012). The persistence of health inequalities in modern welfarestates: the explanation of a paradox. Social Science & Medicine, 75(4), 761e769.
Marmot, M. (2004). Status syndrome: How your social standing directly affects yourhealth and life expectancy. London: Bloomsbury Publishing.
Marmot, M., & Wilkinson, R. G. (2001). Psychosocial and material pathways in therelation between income and health: a response to Lynch et al. British MedicalJournal, 322(7296), 1233e1236.
Pickett, K. E., & Wilkinson, R. G. (2007). Child wellbeing and income inequality inrich societies: ecological cross sectional study. British Medical Journal,335(7629), 1080.
Ravens-Sieberer, U., Erhart, M., Torsheim, T., Hetland, J., Freeman, J., Danielson, M.,et al. (2008). An international scoring system for self-reported health com-plaints in adolescents. European Journal of Public Health, 18(3), 294e299.
Reagan, P. B., Salsberry, P. J., & Randall, O. J. (2007). Does the measure of economicdisadvantage matter? Exploring the effect of individual and relative deprivationon intrauterine growth restriction. Social Science &Medicine, 64(10), 2016e2029.
Schnohr, C., Kreiner, S., Due, P., Currie, C., Boyce, W., & Diderichsen, F. (2008). Dif-ferential item functioning of a family affluence scale: validation study on datafrom HBSC 2001/02. Social Indicators Research, 89(1), 79e95.
Starfield, B., Riley, A.,W., Witt, W. P., & Robertson, J. (2002). Social class gradients inhealth during adolescence. Journal of Epidemiology and Community Health,56(5), 354e361.
Subramanyam, M., Kawachi, I., Berkman, L., & Subramanian, S. V. (2009). Relativedeprivation in income and self-rated health in the United States. Social Science& Medicine, 69(3), 327e334.
Torsheim, T., Currie, C., Boyce, W., Kalnins, I., Overpeck, M., & Haugland, S. (2004).Material deprivation and self-rated health: a multilevel study of adolescentsfrom 22 European and North American countries. Social Science & Medicine,59(1), 1e12.
Torsheim, T., & Wold, B. (2001). School-related stress, support, and subjective healthcomplaints among early adolescents: a multilevel approach. Journal of Adoles-cence, 24(6), 701e713.
Wardle, J., Robb, K., & Johnson, F. (2002). Assessing socioeconomic status in ado-lescents: the validity of a home affluence scale. Journal of Epidemiology andCommunity Health, 56(8), 595e599.
West, P., & Sweeting, H. (2004). Evidence on equalisation in health in youth fromthe west of Scotland. Social Science & Medicine, 59(1), 13e27.
Wilkinson, R. G., & Pickett, K. (2009). The spirit level: Why more equal societies almostalways do better. London: Allen Lane.
Wood, A. M., Boyce, C. J., Moore, S. C., & Brown, G. D. (2012). An evolutionarybased social rank explanation of why low income predicts mental distress: a17-year cohort study of 30,000 people. Journal of Affective Disorders, 136(3),882e888.
World Bank. (2012). World development indicators database. Accessed 17.09.12http://databank.worldbank.org.
Yitzhaki, S. (1979). Relative deprivation and the Gini coefficient. The QuarterlyJournal of Economics, 93(2), 321e324.
Related Documents