The role of incentives in improving engagement and outcomes in population health management: An evidence-based perspective Changing behavior. Changing lives. ® By Paul Terry, Ph.D., chief executive officer David R. Anderson, Ph.D., L.P., senior vice president and chief health officer StayWell Health Management Research department

Welcome message from author
This document is posted to help you gain knowledge. Please leave a comment to let me know what you think about it! Share it to your friends and learn new things together.
Transcript

The role of incentives in improving
engagement and outcomes in population
health management: An evidence-based
perspective
Changing behavior. Changing lives.®
By
Paul Terry, Ph.D., chief executive officer
David R. Anderson, Ph.D., L.P., senior vice president and chief health officer
StayWell Health Management Research department

Changing behavior. Changing lives.®
Contents
Executive summary 3
Introduction 5
Incentives and employee engagement in health 5
The three pillars of engagement 5
Best practices in engagement 8
Laying the foundation for using incentives 9
Current trends in employer use of health-related incentives 12
Recent trends in types and amounts of incentives 12
Current trends in what is rewarded in employee health 13
Opportunities and threats of outcomes-based incentives 15
The economic rationale 15
Concerns about outcomes-based incentives 15
Incentives, HIPAA and the Patient Protection and Affordable Care Act 16
Unsettled benefits landscape: The debates go on 17
A new precedent concerning ADA and the voluntariness standards 18
What behavioral science says about incentives 18
The psychology of reward 19
Behavioral economics research 20
Framework and guidelines for incentives: a progress-based approach 21
Conclusions 29
References 30
Appendices 34
Resources 47
Copyright © 2011 StayWell Health Management, LLC. StayWell and “Changing behavior. Changing lives.” are registered trademarks of StayWell Health Management, LLC.

Executive summary
As a leading evidence-based provider of population health management with
unmatched experience across a diverse range of clients, StayWell Health Management
takes a practical but disciplined approach to consulting with employers about their
health-related strategies and programs. Rapidly evolving trends in the use of financial
incentives in worksite wellness make this an exciting time to consider policy changes in
health plan design that advance employee health and productivity. However, because
the evidence regarding the impact of incentives still is preliminary and somewhat
equivocal, employers testing new incentive strategies run the risk of making well-
intended changes that lead to troubling unintended consequences.
Research by StayWell and others offers considerable insight into the pros and cons of
“participation based” incentives, and we have quantified their effects in a best-practice
approach to program design. It is clear incentives can drive significantly greater
participation, particularly when they are supported by effective communications and
a strong culture of health. What is less clear is whether this increased participation
yields incremental employee engagement and improvements in population health
or primarily represents compliance with incentive rules. Focusing on this key issue,
StayWell research is beginning to reveal when incentives deliver more health, and at
what cost, and when they primarily stimulate activity and incremental costs with little
marginal value.
The 2010 health care reform legislation authorized the use of wellness incentives by
group health plan sponsors and specified when premium reductions, rebates or other
rewards may be given to an enrollee contingent on “satisfying a standard that is related
to a health status factor.” Encouraged by this legislation, many of our clients and
other employers are moving toward what often are referred to as “outcomes based”
incentives, where financial rewards are tied to whether employees are within healthy
ranges on biometric measures such as blood pressure, lipids or body mass index.
Notably, the legislation requires incentive implementers to offer either a “reasonable
alternative standard” or a waiver to individuals for whom meeting the outcomes-based
standard would be either unreasonably difficult due to a medical condition or medically
inadvisable.
We have examined all of the evidence available, including large StayWell data sets, to
assess whether and how an outcomes-based incentive strategy yields better overall
engagement and health improvement for an employee population. Findings to date
can best be summarized in four words: We don’t yet know. Nevertheless, innovators
always have pushed boundaries and seldom have the luxury of conclusive evidence
before moving ahead with new ideas. Accordingly, we will continue to aggressively
pursue research on outcomes-based and other incentive strategies. In the meantime,
this white paper aims to provide leaders with the latest research and commentary on
the use of financial incentives in employee health improvement strategies.
Our recommendations focus on making incentive designs compatible with five core
principles — that they be safe, effective, participant-centered, timely and equitable. It is
clear that framers of the wellness incentive section of the health reform bill had such
principles in mind when they included the “reasonable alternative standard” provision.
Research by StayWell and
others offers considerable
insight into the pros and cons of
“participation-based” incentives,
and we have quantified their
effects in a best-practice
approach to program design.
3Changing behavior. Changing lives.® 3

1Changing behavior. Changing lives.®
Some employers are choosing not to integrate the “reasonable alternative standard”
into their incentive strategy and simply require individuals who do not meet the
health standard to seek a waiver from a physician. We believe this approach misses
an important opportunity to engage almost all employees in improving their health
regardless of whether they can meet the outcomes-based health standard. A better
approach deploys highly trained health coaches (with relevant physician involvement)
to help those who do not meet the health standard set an individually tailored health
goal as a reasonable alternative standard. In addition to encouraging adherence to
the health standard, this progress-based approach has the potential to engage the
many who deem the health standard unattainable, as well as others for whom it is not
medically appropriate, in behavior changes that meaningfully improve their health and
performance.
We understand that executive leaders and human resource policy makers are faced
with a daunting balancing act of increasing employee responsibility for their health
while still providing popular and competitive benefits. This is one reason the current
landscape for outcomes-based incentives varies considerably — from employers
philosophically opposed to any financial incentives to those who aspire to tie sizable
incentives solely to employee health outcomes. Although a few employers are already
eliminating rewards not tied to health outcomes, several factors line up against the
exclusive use of biometric outcomes as the most effective strategy for producing
population-wide health improvements. Some individuals fall so far short of the health
standard it is neither realistic nor even healthy for them to try to attain it in the time
required to earn the reward. Additionally, since health status is not solely the product
of lifestyle but also of genetic, environmental and physiological factors, what works for
one person may not work for another who makes exactly the same lifestyle changes.
These fundamental pitfalls of a purely outcomes-based incentive model are additional
reasons we recommend offering progress-based rewards to satisfy the “reasonable
alternative standard” of the health care reform act rather than simply penalizing or
waiving those unable to meet the health standard. In a progress-based model, health
coaches support setting and attaining a realistic health goal, such as losing 10 percent
of body weight. This offers all participants an opportunity to earn incentives regardless
of where they are on the health continuum. Consistent with Institute of Medicine
guidelines (Institute of Medicine & Committee on Quality of Health Care in America,
2001), a progress-based approach is safer because it considers the starting point of
each individual and sets a “risk adjusted” target rather than presuming that one size
fits all in the attainment of health goals. We also believe a progress-based approach
incorporates participant-centered programming, equity and effectiveness as described
in this white paper.
The most appropriate and cost-effective use of incentives remains high on the StayWell
research and development agenda. We will continue to evaluate the role of behavioral
economics, the impact of varying incentive designs, and the effectiveness of incentives
across gender, age, income, and other socio-demographic variations in our client base.
At StayWell, we believe true innovation should be effective as well as new, and in that
spirit of innovation we will continue to share the best available evidence for informing
policy makers in this exciting new era of employee health management.
In addition to encouraging
adherence to the health
standard, this progress-based
approach has the potential
to engage the many who
deem the health standard
unattainable, as well as others
for whom it is not medically
appropriate, in behavior
changes that meaningfully
improve their health and
performance.
4

1Changing behavior. Changing lives.®
Introduction
America’s legacy of independence suggests we are culturally taught from an early
age to believe we can achieve anything if we put our mind to it. But we also are a
society steeped in the value of holding one another accountable for our actions. When
Congress passed a health care reform law that included provisions for offering financial
incentives in the form of a health plan premium discount, rebate, or other reward for
satisfying a standard related to a health status factor (“PPACA,” 2010), national policy
makers clearly signaled an interest in staking out new territory in balancing individual
freedom and social responsibility in the area of personal health choices. By increasing
the maximum amount of this incentive from 20 percent of the cost of health care
coverage currently allowed under the Health Insurance Portability and Accountability
Act of 1996 (HIPAA) to 30 percent in 2014, and up to 50 percent at a later date if
demonstrations prove effective, lawmakers signaled that providing incentives to citizens
for engaging in healthy behavior is an essential ingredient in improving the health of
the nation, and set the stage for dramatic changes in the practice of population health
management.
StayWell is working with an increasing number of employers interested in basing part
or all of their incentives on employee satisfaction of a health standard (e.g., achieving
body mass index, blood pressure, and cholesterol targets), as provided for by the
health care reform law. Commonly referred to as an “outcomes-based” incentive, we
do not know if this kind of strategy will prove to be more effective in reducing risks and
costs than participation-based incentive strategies, although it clearly is more cost-
effective because incentives only are provided to those who meet desired health goals.
Additionally, it is not clear whether any incentive strategy is as effective in the long run
as cultural or environmental change.
This paper describes current financial incentive issues in workplace health management
and identifies research evidence to inform decision makers concerning health
management incentive strategies.
Incentives and employee engagement in health
Very few studies have attempted to determine the most effective use of financial
incentives for improving the health of employee populations. Findings to date suggest
that increasing participation in simple activities is relatively straightforward, but the role
of incentives in changing complex health behaviors in sustainable ways is less clear.
Some studies have raised concerns about the use of incentives in health management,
and the evidence to date indicates they are at best a double-edged sword. Evidence of
effectiveness is especially important for employers. However, early adopters must rely
on limited evidence concerning the risks and benefits of new incentive approaches.
The three pillars of engagement
StayWell researchers have demonstrated a positive and curvilinear relationship
between the size of an incentive and health assessment (HA) participation rates
(Anderson, Grossmeier, Seaverson, & Snyder, 2008). Further analysis demonstrated
When Congress passed a health
care reform law that included
provisions for offering financial
incentives in the form of a
health plan premium discount,
rebate, or other reward for
satisfying a standard related to
a health status factor (“PPACA,”
2010), national policy makers
clearly signaled an interest in
staking out new territory in
balancing individual freedom
and social responsibility in the
area of personal health choices.
5

1Changing behavior. Changing lives.®
that while financial incentives for HA completion are effective, a supportive culture and
strong communications greatly increase their effectiveness (Seaverson, Grossmeier,
Miller, & Anderson, 2009). This research showed that incentives, communications and
culture all were positively related to greater HA participation.
Incentives and HA participation
0%
10%
20%
30%
40%
50%
60%
70%
80%
90%
100%
$0 $100 $200 $300 $400 $500 $600
Source: Anderson D, Grossmeier J, Seaverson ELD, Snyder D. The Role of Financial Incentives in Driving Employee Engagement in Health Management. ACSM’S Health & Fitness Journal. 2008;12(4):18-22.
Incentives, communication and culture
Comm. Culture Comm. Culture Comm. Culture
Non-cash incentives
(n=4)
Cash incentives
(n=16)
Benefits-integrated incentives
(n=16)
27%33%
41%44%51%
65%
33%37%
53%
41%
51%
69%
0%
20%
40%
60%
80%
100%
HA
pa
rtic
ipa
tio
n ra
te
Weaker Strong
Source: Seaverson ELD, Grossmeier J, Miller TM, Anderson DR. The role of incentive design, communication strategy and worksite culture on health assessment participation. American Journal of Health Promotion, 2009; 23: 343-352.
Other researchers also have shown the vital interaction between organizational
characteristics and the use of incentives. For example, a study by Taitel and colleagues
investigated factors associated with HA participation rates (Taitel, Haufle, Heck, Loeppke,
& Fetterolf, 2008). This study found that value of incentives, communications, and level
of organizational commitment are the strongest predictors of HA participation rates.
Specifically, this study used regression analysis to demonstrate that to achieve a 50-
percent HA participation rate, employers with low levels of organizational commitment
and weak communications would need an incentive value of approximately $120
6

1Changing behavior. Changing lives.®
compared to only $40 to achieve this rate of participation with strong commitment
and communication. These results mirror our own in demonstrating that incentive
effectiveness is highly dependent on both culture and communications (Seaverson et
al., 2009).
A similar study of 87 employer groups showed that incentives paired with a wide
variety of communications strategies produced the greatest participation levels
(Wilhide, Hayes, & Farah, 2008). Larger incentives (i.e., greater than $50) led to higher
participation, but communication strategies such as “high blast” repeated emails and
health fairs had a significant impact on both program participation and completion. To
be sure, money alone can drive participation — if enough is offered for what is being
asked. For example, one analysis showed that HA or biometric screening participation
rates increased by about 10 percentage points for each $100 increase in financial
incentives and reached universal participation at a $600 incentive (Nyce, 2010).
Our research also has shown incentives to be a strong predictor of health coaching
enrollment. Our recent study that explored predictors of program enrollment
demonstrated that participants were 40 percent more likely to enroll in a health
coaching program when there was an incentive to do so (Grossmeier, 2010). However,
incentives do not seem to influence active participation or retention even though most
of the organizations included in the study tied the incentive to program completion
rather than enrollment. In other words, the incentive influenced the simple act of
enrolling in a coaching program but had no direct impact on program participation
or completion. Our research also indicated that strong communications and a
comprehensive program design were significant predictors of enrollment, and that the
enrollment decisions of women were more influenced by incentives while men were
more influenced by strong communications.
Given these results, we know that incentives are effective in increasing rates of simple
behaviors, like completing an HA, that do not require sustained motivation (Anderson
et al., 2008; Seaverson et al., 2009; Taitel et al., 2008). However, the cost-effectiveness
of incentives needs to be compared to other strategies. Long-term change and risk
reduction require helping participants achieve and maintain a high level of motivation
(i.e., commitment or “engagement”) to change unhealthy behaviors. Research has
shown that, to be successful, changing a problem behavior needs to be one of the
most important priorities in an individual’s life for an extended period of time. It is
common for individuals to take six months to a year to establish new habits, and this
daily attention to a healthier lifestyle often needs to be sustained over a lifetime for risk
factors like obesity (Prochaska, Norcross, & DiClemente, 1994).
The evidence on using financial incentives as rewards for behavior change
demonstrates that, while incentives provide external motivation that can initiate
attempts to change, they may also decrease the intrinsic motivation required for
changes to be sustained (Ryan & Deci, 2000). Essentially, financial incentives can buy
compliance but this may come at the expense of true engagement. For this reason,
incentives alone are not likely to be a practical approach to health behavior change
because the cost of buying daily compliance with externally imposed health standards
may be prohibitive. While incentives tied to achieving health outcomes have intuitive
appeal, the required alternative standard ties the success of outcomes-based models to
their ability to sustain health behavior change.
Our recent study that explored
predictors of program
enrollment demonstrated that
participants were 40 percent
more likely to enroll in a health
coaching program when there
was an incentive to do so
(Grossmeier, 2010).
7
1Changing behavior. Changing lives.®
StayWell recommends that incentives always be applied within the context of
the communications, climate and culture of the organization. According to Buck
Consultants, only 33 percent of participants believe they have a culture of health
today, but 81 percent intend to pursue it for the future (Buck Consultants, 2010).
The importance of this trend is underscored in the research by StayWell and others
described above, showing that the impact of incentives on employee behavior is closely
bound to the workplace culture in which they are used (Grossmeier, 2010; Seaverson
et al., 2009; Taitel et al., 2008). In the right circumstances, initial compliance can indeed
become long-term engagement. In fact, most major social changes have required
the smart pairing of culture change, communications and policy-related incentives.
Our nearly universal acceptance and use of seat belts, the vigilance of our children in
recycling, the decades-long and continuing saga and success story in reducing tobacco
use — these all provide great examples and reasons for hope in our ability to fashion
the right combination of education, policies and incentives to tackle today’s formidable
health issues. StayWell has concluded based on the research that each of these
elements serves as a pillar supporting overall engagement, where culture is the most
important pillar followed by communications and then incentives. Not only is each of
these three pillars of engagement important, our experience indicates that how well
they are strategically and operationally aligned is critical to maximizing engagement
and, ultimately, health outcomes.
Best practices in engagement
Too often the term “engagement” is used in health management circles when
referring to the percent of individuals who participate in programs. At StayWell, we
are interested in advancing a much more robust definition of engagement, where
“engaged participants” attend programs because they are intent on improving their
health and are excited about contributing positive energy and productivity to their
companies, families and communities. As the extensive focus of this paper on incentives
attests, StayWell believes well-designed incentives can play a valuable role in this more
robust type of engagement. However, beyond incentives alone, StayWell has studied
the role of incentives in the context of other relevant program components. We have
concluded that incentives, particularly those tied to health plan premiums, are just one
component of a comprehensive “best practice” strategy for reducing population health
risks and curbing health care costs (Grossmeier, Terry, Cipriotti, & Burtaine, 2010; Terry,
Seaverson, Grossmeier, & Anderson, 2008).
Like the focus of the national employee health survey conducted by Towers Watson
(Towers Watson & National Business Group on Health, 2011), StayWell views
employee health programs as an important part of building a high-performance
workforce. To capitalize on the potential market advantage that healthier employees
can provide, corporate leaders should view the use of incentives in the context of a
range of promising investments in employee health. Measurement and evaluation
tools are readily available to help CEOs and CFOs build a strategic advantage based
on improved employee health. Yet, despite the availability of these tools, there is a
large gap between employers that know what they should do and those that are
actually doing it. When it comes to employing industry best practices in employee
health management, such as using incentives in the context of multiple intervention
modalities, measuring program outcomes, tracking financial impact and, especially,
We have concluded that
incentives, particularly those
tied to health plan premiums,
are just one component of a
comprehensive “best practice”
strategy for reducing population
health risks and curbing health
care costs (Grossmeier, Terry,
Cipriotti, & Burtaine, 2010;
Terry, Seaverson, Grossmeier, &
Anderson, 2008).
48

1Changing behavior. Changing lives.®
engaging leadership in creating healthy workplace culture, that large gap becomes
more like a quality chasm.
Organizational leaders who consider using incentives of any kind (e.g., compensation
strategy, bonuses, recognition programs) usually do so with a goal of creating a more
productive and efficient workforce. They also have the tenacity to execute on the best
practices they strongly believe will build and maintain a workforce that out-produces
and out-innovates competitors. In his best-selling book “Good to Great,” Jim Collins
describes a formula for success followed by a select group of distinguished companies
that is both simple and compelling (Collins, 2001). Their core business principles and
practices include having a clear and compelling vision, having willful but humble
leadership, and staunchly supporting the metrics that really matter for the business.
Similarly, health management researchers have gathered together some of the
longest running programs with the greatest success in improving employee health.
Among the best examples are employers chosen as winners of the C. Everett Koop
National Health Award (i.e., Koop Award). Applicants for the prestigious Koop Award
are judged according to corporate culture and leadership commitment, strategic
planning, communication and marketing, how health programs are integrated with
benefit design, use of incentives, program coordination and data management. The
Koop Award’s orientation toward scientific rigor is evidenced in the requirement that
programs are evaluated primarily for their ability to provide documented evidence
of improving health status and reducing health care costs. The Wellness Council of
America (WELCOA), a long-standing advocacy group for employee health, offers similar
“rules of the road” for a results-oriented workplace wellness program that includes CEO
support, wellness teams, data, an operating plan, a supportive environment and careful
evaluation of outcomes.
Moving from good to great in health management may start with pulling these
ingredients together, but the difference between top performers and the rest of the
pack always has far less to do with what they do and more to do with how they do
it. Many employers are eligible to apply for the National Business Group on Health’s
Best Employers for Healthy Lifestyles Award, but very few can prove they have found
the regimen needed to beat secular trends presently driving poorer health and higher
health care costs. To do so, an employer must demonstrate it has high-level executive
support as well as a dedicated steering committee or team to advance initiatives.
Employers also must show that they have conducted health risk assessment or claims
analyses to collect population-specific data, and implemented programs or services that
support healthy lifestyles. The highest recognition level is reserved for organizations
that use data based on their populations to continue to innovate and improve their
overall program and strategy for health improvement.
It is this distinction — achieving continuous improvement based on routinely collected
measures — that will ultimately determine the best-practice incentive strategies that
play a role in realizing the market advantage offered by a healthy, high-performance
workforce.
Laying the foundation for using incentives
How can we distinguish best practices in the use of incentives in employee health
management? This question led StayWell researchers to conduct a study that explored
It is this distinction — achieving
continuous improvement based
on routinely collected measures
— that will ultimately determine
the best-practice incentive
strategies that play a role in
realizing the market advantage
offered by a healthy, high-
performance workforce.
9

1Changing behavior. Changing lives.®
whether implementation of defined best practices would definitively lead to program
success as measured by participation rates and health improvement trends (Terry
et al., 2008). We also aimed to establish benchmarks for quality in employee health
management programs based on implementation of quality program components.
All of the employers studied were rated on nine components identified as best practices
for worksite population health management by researchers, award programs and
experts in the field (see sidebar ) (Terry et al., 2008). Based on a rigorous ranking
methodology to derive cut-points based on the quality of delivery, we determined
that six of the 22 employers included in the study stood out as a “best-practice group”
based on these nine components. This best-practice group of employers was compared
to a “standard-practice group” composed of the other 16 employers, all of which still
included incentives and comprehensive programs in their health management strategy.
This is important to consider when reading reports that employee health programs
often achieve poor employee participation rates. Such reports are not surprising given
how few employers can attest to anything resembling a well-designed, fully funded
and long-term strategy for employee health management. In fact, one national survey
concluded that fewer than seven percent of all worksite health programs could be
described as comprehensive (Linnan et al., 2008).
And did the best-practice employers excel when it came to results? Absolutely! Starting
with the basics, the best-practice employers got 44-percent greater HA participation
than the standard-practice employers (68 percent vs. 47 percent). Additionally, best
practice employers achieved 41-percent greater participation in health coaching
programs designed to support their employees in improving their health habits (48
percent vs. 34 percent). Did this greater program engagement also produce a better
bottom line? Again, the best-practice employers got a much bigger payoff in employee
health. Specifically, the standard-practice employers in our study achieved a two-
percent risk reduction, which is a level that, for many employers we’ve analyzed, can
yield a positive return on investment. In comparison, the best-practice organizations
achieved nearly a five-percent risk reduction, yielding about 2.4 times as much
improvement in this key measure of organizational health (Terry et al., 2008).
Engagement among best-practice and standard-practice organizations
47%
67%
34%
84%
68%
85%
48%
85%
0%
20%
40%
60%
80%
100%
HA participation Coaching eligibility
Coaching participation
Coaching completion
Pa
rtic
ipa
tio
n r
ate
s
Standard practice Best practice
Nine best practices
Biometric health screenings
Comprehensive program design
Dedicated onsite staff
Integrated, comprehensive communication plan
Integrated incentives
Multiple program modalities
Population-based awareness-building activities
Strong senior management support
Vendor integration
Source: Terry PE, Seaverson EL, Grossmeier J, Anderson DR. Association between nine quality components and superior worksite health management program results. J Occup Environ Med. Jun 2008;50(6):633-641.
410

1Changing behavior. Changing lives.®
Population-level health risk change among best-practice and standard-practice organizations
Source: Terry PE, Seaverson EL, Grossmeier J, Anderson DR. Association between nine quality components and superior worksite health management program results. J Occup Environ Med. Jun 2008;50(6):633-641.
The healthy competitive advantage achieved by the best-practice employers in this
study was not solely due to incentives but, rather, was the cumulative result of a full
range of integrated quality components all adding up to much better organizational
health improvement. Nevertheless, it is notable that 100 percent of the best-practice
organizations had integrated incentives into their health plan, compared to only 56
percent of the standard-practice organizations (Terry et al., 2008). This integration
suggests that these best-practice employers also were more likely to be using incentives
to establish the link in their employees’ minds between their personal health behaviors
and the cost of their health care coverage.
Implementation of best practices
0%
20%
40%
60%
80%
100%
Standard Practice Best Practice
Source: Terry PE, Seaverson EL, Grossmeier J, Anderson DR. Association between nine quality components and superior worksite health management program results. J Occup Environ Med. Jun 2008;50(6):633-641.
3.46
3.393.43
3.27
3.20
3.25
3.30
3.35
3.40
3.45
3.50
Baseline HA Follow-up HA
Nu
mb
er
of
he
alt
h r
isk
s
Standard practice Best practice
-2.0%
-4.7%
11

1Changing behavior. Changing lives.®
Current trends in employer use of health-related incentives
It is important to separate trends for incentives for simple actions like participating
in an HA or screening from incentives that encourage more complex activities, like
enrolling in and completing a behavior change program (e.g., health coaching) or
those for incentives for meeting a health standard such as a healthy body weight. Use
of incentives for simple actions has been growing for the past decade among StayWell
clients and now is pervasive, with more than 90 percent offering such incentives.
Incentive use for more complex long-term behaviors has grown more slowly during
this time (Buck Consultants, 2007, 2010) but also is quite common, with about 40
percent of StayWell clients also offering these kinds of participation-based incentives.
In contrast, very few employers tied incentives to meeting health standards in 2007
(Buck Consultants, 2007) before the passage of the 2010 health care reform bill, but
that number is expected to grow very rapidly (Buck Consultants, 2010). The inclusion of
health standards has grown from almost nonexistent to about 10 percent of StayWell
clients in the past year, and we project usage will exceed 20 percent in 2012.
A common refrain in health care reform has been that containing health care costs
will require more personal responsibility by consumers. It is quite reasonable for
employers to anticipate that as employees bear more of the financial cost of unhealthy
choices, they will become more motivated to stay well. A small number of employers
are adopting a “tough love” approach of tying sizable incentives solely to attaining a
health standard, except for employees whose physician signs a waiver stating that they
have a medical condition preventing them from doing so. Still, if employees believe that
incentives are merely being used as a tactic for shifting costs to those in poor health,
wellness program planners become cast as purveyors of financial penalties for the
least healthy rather than as advocates for preventing illness by offering engaging and
popular programs. Accordingly, our client experience suggests that most companies
incorporating health standards into their incentive are testing a mixed model, with
employees who do not achieve the health standard being able to earn the full
incentive through participation in program activities.
As they are asking more responsibility of their employees by introducing health
standards into incentive designs, more employers also are signaling their
understanding of their shared responsibility by instituting policies aimed at creating a
healthy work culture and environment. One such illustration is provided in a Towers
Watson report showing organizations most effective at controlling health care
costs also offered significantly healthier food options in cafeteria/vending machines
compared to those that were less effective (69 percent versus 39 percent, respectively)
(Nyce, 2010; Towers Watson & National Business Group on Health, 2010).
Recent trends in types and amounts of incentives
While some companies are adding outcomes-based incentives to their strategy,
the overall value of incentives also is growing. Surveys by major consulting firms
show gradual increases in average incentive dollar amounts in recent years (Buck
Consultants, 2010; Hewitt Associates, 2010; Marlo, Dan, & Lykens, 2010). This likely
is because of studies by StayWell and others demonstrating the positive relationship
between incentive amounts and program participation rates.
... our client experience
suggests that most companies
incorporating health standards
into their incentive are testing
a mixed model with employees
who do not achieve the health
standard being able to earn
the full incentive through
participation in program
activities.
12

1Changing behavior. Changing lives.®
According to the National Business Group on Health (NBGH), the amounts used range
widely from $50 to $1,200 (Marlo et al., 2010). For most organizations, the amount
of incentives grows as programs mature, with decreasing incentive amounts used
over time for completing an HA (although the HA usually is required to be eligible for
additional amounts) and increasing amounts directed toward completion of a coaching
program or attaining a health standard. Escalating incentive levels will continue to test
the observation in the Towers Watson report that, “The impact of financial incentives
is less noticeable for ‘action based’ programs like weight management and smoking
cessation which require ongoing commitment from individuals” (Nyce, 2010). The
wide range in the size of incentives also may be related to the wide variation among
employers in how much emphasis they put on the role of incentives compared to
culture for engaging employees in health promotion. The analysis from Towers
Watson concluded that healthy culture tactics such as engaged leaders and simple
environmental supports can increase participation in an employee HA as much as a
$140 financial incentive.
The typical value of incentives used by StayWell clients has increased substantially over
the past 10 years, from the $10 to $50 annual range per employee ten years ago to the
$100 to $1,700 range today (Appendix A). These larger incentives also are being tied to
a growing list of program requirements, representing higher expectations about what
is required to earn the maximum incentive. As incentives have grown in value, the
type of incentive most commonly used also has migrated from tokens, such as T-shirts
and water bottles worth less than $25, to cash or equivalents like gift cards worth $25
to $100, to health plan incentives like premium reductions or contributions, to health
savings accounts totaling $200 to $1,000 or more.
Trends among StayWell clients are consistent with national patterns. Hewitt Associates
reported, for example, that use of cash payouts for completion of an HA nearly doubled
between 2009 (35 percent) and 2010 (63 percent) (Hewitt Associates, 2010). NBGH
reports that the average incentive amount in 2010 was $386, up from $318 in 2009
(Marlo et al., 2010). The average annual incentive expenditure by U.S. employers
reported by Buck Consultants in its annual global wellness survey more than doubled
from $100 per employee in 2007 to $220 in 2010 (Buck Consultants, 2007, 2010).
StayWell clients are increasingly using point systems to administer their incentive
programs, with the growing menu of activities available to earn incentives representing
an effort to make participation in employee health programs a robust and continuous
process rather than merely a once-a-year HA or screening activity. Incentive points can
be earned by participating in education classes, campaigns or contests, and through
completing coaching programs, volunteering in the community or helping with
wellness committee work.
Current trends in what is rewarded in employee health
Beyond driving employee participation or “engagement” in health-promoting activities,
incentives increasingly are being used to recognize specific levels of goal attainment,
such as adhering to a chronic condition management program or achieving a
health standard. According to a survey of the top tactics planned for 2012, financial
incentives or penalties represent five of the top 12 changes in health plan options
being implemented in 2011 by best-performing employers (Towers Watson & National
The typical value of incentives
used by StayWell clients has
increased substantially over
the past ten years, from the
$10 to $50 annual range per
employee ten years ago to the
$100 to $1,700 range today
(Appendix A).
413

1Changing behavior. Changing lives.®
Business Group on Health, 2011). Current approaches to providing health-related
incentives are quite variable among companies, which may be driven by the newness
of this balancing act of increasing employee responsibility for health while still
providing popular and competitive benefits. Towers Watson summarizes the trend by
noting that, “While employers are clearly raising the bar for earning wellness program
financial rewards, few seem willing to penalize employees via premium surcharges,
with exceptions for smokers/tobacco use.”
Most benefit consulting firms are now monitoring the use of incentives (see Appendix
B). However, comparisons across surveys are challenging due to differences in
measurement and terminology, as well as definitions of incentives and program
components. The Mercer survey suggested that the use of incentives increased slightly
in the past year (Mercer, 2010), while the Buck Consultants survey reported that 25
percent of their respondents plan to add incentives in coming years (Buck Consultants,
2010). In contrast, Hewitt Associates reported that the role of incentives as a key
“component of health care strategy” declined from 57 percent in 2009 to 44 percent
in 2010. Perhaps related to this decline is their finding that “promoting employee
accountability” also has waned as a key strategy while “offering competitive benefits”
is now the top benefit strategy. On the other hand, the same Hewitt Associates report
found that about half (47 percent) of those surveyed planned to impose penalties for
nonparticipation in health programs either in 2010 or in the next three to five years,
which is up from 18 percent presently imposing such penalties (Hewitt Associates,
2010).
Despite widespread interest in incentives tied to health standards, recent surveys
indicated that employer use of such incentives is not yet the norm. The Buck
Consultants and Hewitt Associates surveys reported that 23 percent and 17 percent
of companies, respectively, include an outcomes-based standard in their incentive
strategies (Buck Consultants, 2010; Hewitt Associates, 2010). Towers Watson reported
only one percent of companies presently require employees to achieve a healthy
weight, blood pressure or cholesterol value to qualify for a preferred health plan
option (Nyce, 2010; Towers Watson & National Business Group on Health, 2010). It
also is unclear how many organizations will move in this direction in the near future
due to the variability in estimates reported in various consultant reports. For example,
Towers Watson reported that 92 percent of companies have no plans to implement
outcomes-based incentive strategies (Towers Watson & National Business Group on
Health, 2010), whereas Buck Consultants reported 33 percent of companies (Buck
Consultants, 2010). What is more clear is that higher premiums will be the choice when
penalties are imposed, with Hewitt Associates reporting that 81 percent indentified
this as a current or planned “disincentive type.” Larger deductibles and co-pays also are
methods being used or considered as penalties for nonparticipation in employee health
programs (Hewitt Associates, 2010).
Despite widespread interest
in incentives tied to health
standards, recent surveys
indicated that employer use of
such incentives is not yet the
norm.
14

1Changing behavior. Changing lives.®
Opportunities and threats of outcomes-based incentives
The possibility that outcomes-based incentives could take population health to a new
level of impact is an empirical question well worth testing (Halpern, Madison, & Volpp,
2009), but testing new engagement methods with busy working adults is bound to
suffer from the usual vagaries of innovation through trial and error. Some have argued
that well-intentioned users of incentives often produce the opposite of their desired
results or that their efforts backfire in other ways (Kim, Kamyab, Zhu, & Volpp, 2011;
Kohn, 1993; Pink, 2009; Volpp et al., 2008; Volpp et al., 2009). Regardless of whether
incentives tied to actions or outcomes ultimately prove helpful in improving population
health, complex issues face those contemplating their use. This section reviews the
economic rationale for tying incentives to health outcomes, identifies opportunities
presented by the health care reform act, summarizes legal and ethical issues of
the increasing use of incentives, and provides information that human resources
professionals may find helpful in guiding policies on incentives.
The economic rationale
Those moving from incentives for participation to basing incentives as much as possible
on achieving health outcomes are undoubtedly motivated by a desire to get more
bang for the incentive bucks, whether through rewarding success or punishing failure
or complacency. Tying a financial reward directly to a desired result has a logical appeal
because the dollars only will be spent for those who actually achieve a health standard
associated with better health and lower health care costs. Proponents also argue that
an outcomes-based approach will motivate more people to improve their health, and
that it is fair because those who choose not to do so should be responsible for the
additional cost of their unhealthy choice (O’Donnell, 2010).
Concerns about outcomes-based incentives
Despite their apparent appeal, there are several concerns about the ultimate
effectiveness as well as the efficacy of outcomes-based incentives. People begin from
very different starting points relative to a health standard. If the standard is viewed as
unachievable by those most in need of health improvement (who tend to be the older,
less educated, highest-risk segments of the population), then the planned carrot may
actually be perceived as an unfairly used stick that alienates rather than motivates the
highest-risk individuals who drive the greatest portion of health care costs. Incentives
tied solely to outcomes may inadvertently overcompensate some (e.g., the young or
socioeconomically advantaged) while effectively disenfranchising many of those most
in need. In public health parlance, finding the right balance is referred to as “doing the
greatest good for the greatest number.” Regrettably, with obesity rates over 30 percent
of many populations and morbid obesity (body mass index above 40) representing the
fastest growing segment of obese people (Flegal, Carroll, Ogden, & Curtin, 2010), the
starting point for attaining recommended health standards may be moving too far from
the goal for financial incentives alone to address. This underscores the need to plan
incentives in concert with a best-practice approach to population health management.
If the standard is viewed as
unachievable by those most in
need of health improvement
(who tend to be the older, less
educated, highest-risk segments
of the population), then the
planned carrot may actually
be perceived as an unfairly
used stick that alienates rather
than motivates the highest-
risk individuals who drive the
greatest portion of health care
costs.
15

1Changing behavior. Changing lives.®
Incentives, HIPAA and the Patient Protection and Affordable Care Act
Empirical evidence supporting the use of incentives for increasing participation in
programs is persuasive (Anderson et al., 2008; Grossmeier, 2010; Seaverson et al., 2009;
Taitel et al., 2008; Wilhide et al., 2008). Studies concerning the effects of outcomes-
based incentives in employee health programs still are scarce and, while findings
to date suggest a short-term benefit, there is not yet solid evidence that they yield
sustained population health improvement (Volpp et al., 2009). Aside from the lack
of research to guide incentive policies, employers also must weigh important legal
and ethical issues in deciding about such benefit approaches. One trend is clear —
employers will increasingly share the responsibility for solving the growing health
care cost burden with their employees. As the Hewitt Associates report states, “the
deal between employers and employees is changing” (Hewitt Associates, 2010). Many
employers believe the most generous benefits should be provided to those taking good
care of their health, with 81 percent of those surveyed by Hewitt Associates naming
higher insurance premiums as “the penalty of choice” for those not taking good care
of their health (Hewitt Associates, 2010). Employers pursuing this approach, however,
should include in their planning the concerns of the 32% of employees in the recent
Towers Watson survey who “would not feel comfortable if my employer increased the
premium costs for workers unwilling to take steps to manage their illness or lower their
health risk” (Towers Watson, 2011).
Though the Equal Employment Opportunity Commission (EEOC) has signaled concerns
about voluntariness and the potential of wellness programs to discriminate against
higher-risk employees (“Regulations Under the Genetic Information Nondiscrimination
Act of 2008,” 2010), recent surveys indicate that the average incentive level still is less
than $400 (Buck Consultants, 2010; Marlo et al., 2010; Towers Watson & National
Business Group on Health, 2010). At this incentive level, it appears the legal definition
of voluntariness is not a concern for most employers testing outcomes-based incentives.
In addition to achieving budget neutrality by integrating these incentives into their
group health plan, doing so also enables employers to comply directly with the
limit on rewards of 20 percent of health care coverage costs specified in the HIPAA
regulations and codified in the health care reform act (a.k.a., the Patient Protection
and Affordable Care Act or PPACA) (“Health Insurance Portability and Accountability
Act,” 1996; “PPACA,” 2010). Employers and researchers are just beginning to evaluate
the effectiveness of benefits-integrated incentives for program participation versus
outcomes. As such, it remains to be seen which approach ultimately will prove more
effective in controlling employee health care utilization and claims costs.
The unpredictability of the current legal and regulatory climate regarding benefit
design weighs every bit as heavily on employers as the challenges of employee
relations. Congress and the EEOC have sent mixed messages, countering what they
give with what they may take away. They have provided employers encouragement
and support for tying significant financial incentives to individual health status factors
under the HIPAA regulations and, more recently, the PPACA non-discrimination
rules (“Health Insurance Portability and Accountability Act,” 1996; “PPACA,” 2010).
But, the EEOC issued rules under the Genetic Information Nondiscrimination Act
(GINA) limiting the collection of family history information to calibrate HA participant
The unpredictability of the current
legal and regulatory climate
regarding benefit design weighs
every bit as heavily on employers
as the challenges of employee
relations. Congress and the
EEOC have sent mixed messages,
countering what they give with
what they may take away.
16

1Changing behavior. Changing lives.®
risk status when incentives are tied to participation (“Regulations Under the Genetic
Information Nondiscrimination Act of 2008,” 2010). In addition, future EEOC rules
under the Americans with Disabilities Act (ADA) may limit the use of incentives for HAs
that include disability-related questions, a move that would render these tools much
less effective in assessing individual risk and supporting participants in improving their
health.
Over 250 medical and public health groups, including the American Public Health
Association, the American Cancer Society and the American Medical Association,
supported the GINA regulations, arguing in a letter that wellness programs “need
not collect and retain private genetic information to be effective” and that wellness
programs should not be exempted from the law (“An open letter to the Secretaries of
Treasury, Health and Human Services, and Labor,” 2009). But other groups, including
Health Promotion Advocates and the Care Continuum Alliance, have opposed the new
GINA rules and argued that using family-history information provides vital program
planning, risk identification and program management data intended to make wellness
more accessible and effective for employees.
Unsettled benefits landscape: The debates go on
HIPAA and PPACA requirements for employers providing wellness programs include
a provision that outcomes-based incentives must offer a reasonable alternative or
waiver to those who cannot meet the health standard due to a medical condition.
Such language signals a caution that employees should not be “punished by rewards”
they cannot achieve. Indeed, the varying language used in different consultant firm
surveys illustrates the unsettled benefits landscape concerning whether outcomes-
based incentives constitute penalties or rewards. For example, one survey of employers
asks questions about “health premium increases” that are characterized as penalties
and the same survey asks similarly worded questions about an employer’s plans for
using “health premium reductions” that are positioned as rewards (Buck Consultants,
2010). For a wellness program nonparticipant, whether his or her decision not to
participate leads to a premium increase or to ineligibility for getting a premium
reduction may seem all the same. In a behavioral economics context, however, studies
suggest avoiding a loss may actually be a more powerful motivator than seeking a gain
(Kahneman, Knetsch, & Thaler, 1990; Tversky & Kahneman, 1991).
The level at which a financial incentive is considered voluntary versus coercive or
punitive versus supportive will be only partially answered by researchers. Although
the EEOC allows that an HA is permissible as part of a voluntary wellness program, it
has not yet clearly established financial size limits on incentives that could be offered
without rendering the program involuntary. Like debates concerning whether health
care in America is a privilege or an entitlement, employers’ views of the role for
incentives or disincentives varies across the political and ideological spectrum. Consider
other health policy changes in recent years, such as smoke-free restaurants and bars,
motorcycle helmet laws or hand gun regulations. There is predictable variation among
states. In many communities restrictive regulations passed by one legislature have been
repealed by the next, more libertarian-leaning body. In the end, the intent of incentives
will be a function of one’s values and beliefs. As Halpern and colleagues note, for
example, “we may properly condemn programs that would charge fees to restrict
Like debates concerning
whether health care in America
is a privilege or an entitlement,
employers’ views of the role for
incentives or disincentives varies
across the political and ideological
spectrum.
17

1Changing behavior. Changing lives.®
insurance eligibility for people who fail to attain targeted results (Halpern et al., 2009).
However, whereas such disincentive programs may deprive those most in need of help
and widen welfare gaps among employees or citizens, offering positive incentives for
better health can only promote individuals’ well-being.” But, even this selective, widely
held endorsement of “positive” incentives is countered by some who view incentives as
problematic or even inherently counterproductive (Kohn, 1993; Pink, 2009).
A new precedent concerning ADA and the voluntariness standards
Until very recently, the question of whether a wellness program that connected a
financial penalty for non-participation would violate the ADA was an open question.
This year, U.S. District Judge K. Michael Moore dismissed a Florida case against a
Broward County health plan that assessed employees a $20 bi-weekly surcharge if they
declined to participate in a “voluntary” wellness plan (“SEFF v. Broward County,” 2011).
The program required that employees attend a health screening that used a finger-
stick blood sample along with the completion of an HA. In his ruling, Moore held that
the wellness program fell under the “safe harbor” provision of the ADA and wrote, “It is
clear to this court that the wellness program is not a subterfuge; it was not designed to
evade the purpose of the ADA.”
Although the Broward County health plan ruling could be appealed, it responds
to concerns of Health Promotion Advocates and other health promotion groups
that possible interpretations of the ADA could pose a serious threat to the ability of
employers to use incentives and deliver wellness programs effectively. However, it
is important to note that the decision did not explicitly address the “voluntariness
standard” about which the EEOC has expressed concern. The EEOC notes that it still
is studying the issue and has indicated it understands that this issue concerns many
health promotion advocates.
What behavioral science says about incentives
Whether premium differentials that shift costs to higher-risk health plan enrollees are
sustainable is a problem that actuaries will need to monitor. Similarly, debates about
the fairness of insurance cost-shifting according to community or individual risks are far
from new and are likely to continue into the future (Terry, 1994). To inform both the
financial and policy questions, StayWell researchers, along with other behavioral and
health sciences experts across the country, continue to focus on what size and what
form of incentives are most likely to evoke and sustain health actions and behavior
change. We also understand that research findings about the role for incentives in
facilitating behavior change must be placed in the context of what is most cost-effective
for employers designing these programs (Appendix B).
As with most value-based budgeting, planners want to produce the greatest impact
achievable at the lowest cost possible. The StayWell research described above showed
a positive but gradually diminishing effect of financial incentives on participation in
an HA (Anderson et al., 2008). This relationship provides a basis for evaluating cost-
effectiveness despite the fact that the primary “costs” when incentives are integrated
into a health plan design are not financial but, rather, opportunity costs versus other
incentive options in a value-based benefit model.
To inform both the financial
and policy questions, StayWell
researchers, along with other
behavioral and health sciences
experts across the country,
continue to focus on what size
and what form of incentives are
most likely to evoke and sustain
health actions and behavior
change.
18

1Changing behavior. Changing lives.®
There is an analogous question regarding the relationship between the size of financial
incentives and behavior changes. Although there are very few studies offering
guidance on this issue, it is clear that the relationship between incentives and sustained
behavior change is much more complex than for simple actions at a single point in
time. When it comes to tying incentives to sustained behavior changes, there is little
evidence that such incentives are more effective, much less more cost-effective, than
the results produced by best-practice alternative engagement strategies. The challenge
of creating cost-effective incentive strategies tied directly to daily behaviors is one of the
reasons interest is shifting toward tying incentives directly to outcomes or measurable
progress toward achieving them.
The psychology of reward
Although incentives play a well-established role in eliciting compliance with simple
actions like completing an HA or screening, or enrolling in a coaching program
(Anderson et al., 2008; Grossmeier, 2010; Seaverson et al., 2009; Taitel et al., 2008;
Wilhide et al., 2008), it is less clear whether incentives can play a role in establishing
and, more importantly, sustaining more complex behavior change. Psychologists
often refer to the vital importance of “intrinsic motivation” for successful behavioral
adaptations. Financial incentives, which are “extrinsic” rewards, are enticing but not
typically salient (Ryan & Deci, 2000).
A striking illustration of these concepts comes from a recent randomized controlled
trial that tested the effectiveness of a $750 incentive in smoking cessation (Volpp et al.,
2009). Though short-term (i.e., three to six months) quit rates were significantly higher
for the incentive group compared to a control group (21 percent vs. 12 percent), 36
percent of the incentive group participants relapsed back to smoking over the long
term. Volpp and colleagues noted that relapse rates in their study group were higher
than in current evidence-based standards for smoking cessation, suggesting that
“relapse rates differ according to whether smoking cessation occurs in the presence
or absence of incentives.” In a process evaluation of participants in this same research
program, Kim and colleagues interviewed both quitters and nonquitters in the
incentive groups (Kim et al., 2011). Interestingly, 87 percent of the quitters said they
would have quit for less money. Conversely, among participants who were offered the
incentive, the median amount nonquitters reported would have motivated them to quit
was $1,500, double the $750 used in the study. A significant proportion (36 percent)
reported that amounts greater than $3,400 would be needed to motivate them to quit
(Kim et al., 2011). This is noteworthy because the authors cited $3,400 as the increased
annual medical cost per current smoker, suggesting it may not be cost-effective in the
short term to pay people to quit smoking. These findings also highlight the powerful
nonfinancial motives sustaining both healthy and unhealthy habits.
At StayWell, our own research and practical experiences have revealed this same
bimodal distribution when it comes to making long-term behavior changes. Some
employees are willing to engage in changing behaviors for little or no financial reward,
while others are not likely to comply without being offered a very large extrinsic
reward. In between are those who are happy to complete programs to earn an
incentive but have no intention of making sustained behavior changes. Accordingly,
our recommendation is that incentives tied to behavior change programs be kept
... our recommendation is that
incentives tied to behavior
change programs be kept
modest – just large enough to
tip forward those teetering on
the edge of engaging while
not so much as to reduce their
already considerable intrinsic
motivation.
19

1Changing behavior. Changing lives.®
modest — just large enough to tip forward those teetering on the edge of engaging
while not so much as to reduce their already considerable intrinsic motivation. Unless
the form of this incentive is a cost-neutral plan design reward, our preliminary data to
date suggest that even a modest incentive is quite costly per additional risk reduced.
Behavioral economics research
The emergent field of behavioral economics uses social, cognitive and emotional
factors in understanding individuals’ economic decisions, with a primary focus on
the relationship between rational and actual decisions. The work of behavioral
economists has had a significant positive influence on the thinking of population health
management practitioners, as evidenced by efforts to create work sites “where the
healthy choices are the easy choices.” Whether it is the food available in the workplace,
opportunities to take breaks or the personal support from co-workers and leaders,
health promotion practitioners with training in psychology have long been aware that
interpersonal and physical environments influence behaviors and that behaviors, in
turn, shape environments. Behavioral economists have built on these well-established
concepts by showing how economic policies can influence behavioral choices.
When aligned with environmental and educational strategies, economic incentives
have played important roles in changing attitudes and practices across behaviors as
diverse as smoking, seat belt use and littering. It is both counterproductive and ironic,
then, when employers use incentives to make connecting with a health coach easy,
but do not confront the workplace stumbling blocks that make healthy behavior
change hard for these same employees. An example of making healthy choices the
easy choices is subsidizing healthy foods in cafeterias and vending machines while
increasing prices for unhealthy alternatives. Another is a policy change, investing in
“exercise breaks” during work hours while discouraging smoking breaks by banning
smoking on company property.
These subtle monetary and nonmonetary “rewards” and “costs” that nudge people in
socially valued directions are the grist of behavioral economics. Researchers in this field
are exploring a wide variety of monetary contingencies to determine which are most
effective in eliciting and sustaining change. One example is a randomized trial designed
to test the differential impact of two forms of incentives in achieving a weight loss goal
of 16 pounds over 16 weeks: a lottery where participants could earn rewards based
on their weight loss achievements compared to a deposit contract where participants
invested their own money (Volpp et al., 2008). Those in the lottery condition who met
their goals were eligible for daily prizes randomly ranging from $10 to $100. Those
in the deposit contract condition could earn as little as $0 and up to $252 per month
depending on their attainment of weight loss goals and the amount they had risked
via their deposits. About half of those in both incentive groups achieved the 16-pound
weight loss goal after 16 weeks compared to only 10 percent of those in the control
groups. These differences in net weight loss between the incentive and the control
groups were sizable but not statistically significant.
It is noteworthy that the amount of money participants earned in the study by Volpp et
al. focusing on one risk factor ($378 and $273 for the incentive conditions) is essentially
the same as the average level of incentives employers are using to motivate employees
to participate in a much wider variety of interventions. The authors note that their study
It is both counterproductive and
ironic, then, when employers
use incentives to make
connecting with a health coach
easy, but do not confront the
workplace stumbling blocks that
make healthy behavior change
hard for these same employees.
20

1Changing behavior. Changing lives.®
population consisted of voluntary participants who “were likely more motivated than
the average obese patient.” It also is important to contrast this experimentation on the
relative merits of lotteries and deposit contracts with the compliance-oriented incentive
systems used by most employers to date. A growing interest in the principles of
behavioral economics, such as those summarized so well in the book “Nudge” (Thaler
& Sunstein, 2009), suggest that mechanisms to induce behavior change identified in
behavioral economics research warrant further investigation within the context of
employer incentive designs.
For recommended readings about behavioral economics and the impact of incentives
on intrinsic motivation see Appendix C.
Framework and guidelines for incentives: A progress-based approach
Because benefits designed to encourage participation and, more recently, employee
health behavior change are still in a fledgling stage, population health program
planners have based their changes on a mix of science, guesswork and bandwagon-
hopping. To encourage a balance of evidence-based planning with a proactive,
progress-based approach that offers all employees an opportunity to earn incentives
regardless of where they are on the health continuum, we offer the following
framework and guidelines for incentive design. Like the broader health care reform
movement that has influenced current changes in employer incentive programs, the
stakes are high relative to the impact of benefit changes on health care costs and the
impact of reforms on human lives. Accordingly, we have embraced the tenets of the
influential report from the Institute of Medicine, “Crossing the Quality Chasm” (Institute
of Medicine & Committee on Quality of Health Care in America, 2001), and have
adapted the core features of its reform strategy into a framework for incentive redesign.
We align each component with guidelines that are evidence-based and consistent with
behavior change and health improvement principles.
Incentive strategy Incentive tactics
Safety
• HIPAA rules relating to the use
of incentives include providing a
reasonable alternative standard for
those for whom an outcomes-based
health standard, such as achieving
a target body mass index (BMI),
is either unreasonable due to a
medical condition or not medically
advisable. Like a wrestler attempting
to make weight, anecdotes depicting
participants purging themselves to
attain an incentive highlight
Safety
• Encourage employees to review
health goals with their physician
but avoid putting doctors in a
policing role. As one expert observer
suggests, “Requiring physicians
to certify an employee’s medical
unsuitability for an incentive scheme
or to attest to their achievement
of a target might introduce an
adversarial element into the doctor-
patient relationship” (Schmidt, Voigt,
& Wikler, 2010; Terry, 1993).
Like the broader health care
reform movement that has
influenced current changes in
employer incentive programs,
the stakes are high relative to
the impact of benefit changes
on health care costs and the
impact of reforms on human
lives.
21

1Changing behavior. Changing lives.®
Incentive strategy Incentive tactics
Safety (continued)
the caution needed in designing
incentive levels and criteria for
rewards. Similarly, studies of the
detrimental effects of weight recycling
show the importance of adapting
the target to the starting point of the
individual.
• A progress-based incentive strategy
as an interim step before adopting an
outcomes-based strategy may provide
a safer, risk-adjusted approach to
achieving health goals and related
incentives. In a progress-based
model, the attainment of a reasonable
target based on current guidelines,
such as losing 10% of body weight
in a year, offers all participants a
reasonable chance to earn incentives
regardless of how far away they
are starting from the recommended
standard.
Safety (continued)
• Consider the demographics and
living conditions of employees
if considering outcomes-based
incentives. In setting individual
health goals, factor in variation
in circumstances such as age-
related metabolic changes, family
environment, living in unsafe
neighborhoods, working extra
shifts, or dealing with other physical
or environmental disadvantages
beyond their control.
Effectiveness
• Provide incentives based on scientific
evidence and avoid designs that fail
to motivate some due to too little
reward for great effort or over-
reward others for little or no effort.
Evidence suggests that incentives are
effective for enlisting participation
in transactional events such as
completing an HA or enrolling with
a health coach, particularly when the
program is well communicated in a
supportive culture.
• Using incentives for achieving a
health goal is likely to prove more
cost-effective than tying incentives to
adherence to a prescribed regimen,
such as completing a certain number
of coaching sessions. Because
everyone has a different starting point
and learning needs and styles vary
considerably, an effective regimen
Effectiveness
• Institute alternative ways to achieve
an incentive if targeted health
standards are out of reach for some
participants.
• Provide a multi-faceted approach
to the use of incentives rather
than single-strategy designs, such
as purely “participation based” or
purely “outcomes based” systems.
That is, provide incentives for a
range of activities and attainments
that provide rewards for
participation, as well as for progress
toward or achievement of health
outcomes. This formula provides
individuals with as much choice
as possible regarding how they
meet incentive requirements. It also
recognizes individuals’ efforts to
achieve meaningful health
22

1Changing behavior. Changing lives.®
Incentive strategy Incentive tactics
Effectiveness (continued)
for one individual may not match the
needs of another.
• Evidence still is insufficient concerning
whether incentives can induce and
sustain significant health behavior
changes for large populations. More
research is needed to determine
whether incentives can effectively
support the attainment of a
population-based guideline, such as
a healthy blood pressure, especially
for individuals with chronic and
significant health problems.
• When considering outcomes-based
incentives, the issues of measurement
effects and sensitivity to “false
positive” findings can become keen.
For example, participants who need
to attain a blood pressure target to
earn a large incentive may experience
measurement stress that increases
their blood pressure reading.
• Incentives are most effective when
used in conjunction with broad-
based culture change and strong
communications about the value
of health to employees and the
company. For example, consider
using incentives to encourage healthy
eating while also making access to
healthy food choices very easy in
work settings that align corporate
values and individual actions. To
provide incentives for weight loss
while sponsoring vending machines
with no attractive healthy options is
self-defeating and may be perceived
as insincere.
Effectiveness (continued)
improvements both within and
outside the formal program.
• While keeping the overall incentive
approach as clear and simple as
possible, vary incentive levels and
consider strategies including use of
a lottery, attainment of incentives
and contract incentives over time
to appeal to the broadest range
of participant motives and needs.
Adjust incentive strategies over
time as the culture is ready in order
to keep the population engaged
and progressively moving toward
better health.
• Do not hesitate to change
incentives over time as you
build new program features. For
example, some organizations have
stopped providing incentives for
taking an HA and now apply that
incentive amount to other activities.
Taking the HA simply becomes an
eligibility requirement for other
new activities or attainments that
earn incentives.
• For biometric health screening,
only use Clinical Laboratory
Improvement Amendments (CLIA)
certified screeners and confirm that
those taking blood pressures are
using American Heart Association
blood pressure measurement
protocols (i.e., wait times before
taking the blood pressure, no
sleeves, legs uncrossed, repeated
measures).
23

1Changing behavior. Changing lives.®
Incentive strategy Incentive tactics
Participant-centered
• Provide incentives that are respectful
of and responsive to the needs and
values of employees. Incentives can
be used to address an organization’s
unique epidemiological trends
along with those risk factors for
which employees indicate a higher
readiness to change. Participant-
centered organizations, like patient-
centered health care systems,
include participants in decision-
making concerning program design
and gather information from a
representative cross-section of
participants to best understand how
employees will embrace or resist
changes. Creating your incentive
strategy with employees rather than
imposing it on them will go a long
way toward building a sense of shared
accountability in the workforce.
Participant-centered
• Provide varied and stimulating
choices that give individuals
autonomy in qualifying for
incentives. Include a mix of learning
modalities that respond to learner
differences, such as offering choices
among phone, online or face-to-
face interventions.
• Incentives tied to specific
interventions will increase
participation even among those
for whom the intervention is not
appropriate. Offering a range of
program options, supported by
incentive and triage strategies
that encourage individuals to
choose activities most appropriate
to their current needs, maximizes
the impact of the program on
population health in the most cost-
effective manner.
Timeliness
• Wherever practical, minimize waits
or delays between the attainment
of goals and the receipt of rewards.
Behavior modification research also
indicates that varying rewards over
time is more effective than giving
rewards on a predictable schedule.
• Previewing the next tenet concerning
“efficiency,” timeliness needs to be
balanced with the practical need to
keep incentive systems simple and
understandable. When incentives
are integrated into benefit plans, for
example, it often is most efficient to tie
current-year accomplishments to next
year’s premiums. Attempts to make
plan-integrated incentives more timely
sometimes have created complexities
that are administratively inefficient
Timeliness
• Employ a phased approach to
the use of incentives. Begin with
simple strategies such as using
incentives for a transactional event
like completing an HA. Incorporate
additional requirements gradually
over a number of years, only as the
population internalizes a shared
responsibility for health.
• Use tracking systems for rewards
that enable and encourage
participants to keep routine records
of their progress toward goals.
• Especially for rewards that will
be provided some time in the
future (e.g., next year’s premium
reduction), offer regular visual cues
or other monitoring systems that
24

1Changing behavior. Changing lives.®
Incentive strategy Incentive tactics
Timeliness (continued)
and difficult to communicate.
Fortunately, unlike the animals that
many behavior modification principles
are based upon, humans are quite
good at linking current behaviors to
future rewards.
• Since intrinsic motivation is the main
predictor of long-term behavior
change, the primary role of an
extrinsic motivator like a financial
incentive is to serve as a short-term
catalyst for initiating action that
is ultimately sustained by intrinsic
motivation. Accordingly, aim
incentives at creating the inertia
to begin a program for those who
have been “chronic contemplators”
and offer interventions that engage
the participant in ways that shift the
motivation to intrinsic factors.
Timeliness (continued)
make record keeping easy and
interesting to participants and
remind them of the reward to
come.
• Modest rewards can be effective
if they are immediate, and smaller
rewards are less of a threat
to intrinsic motivation. Future
rewards need to be larger to
make the wait seem worthwhile.
To maintain intrinsic motivation
when larger incentives are used,
build cultural support for and
focus communications on shared
responsibility rather than a “do this,
get that” focus on the reward.
Efficiency
• Avoid wasting employee and
administrative time and effort.
Compliance with a requirement is
far from employee engagement in a
health improvement campaign.
• Incentive dependency needs to be
avoided. If not designed carefully and
communicated strategically, incentives
may create a compliance response.
Long-term behavior changes generally
depend on intrinsic motivation, since it
may not be cost-effective to continue
offering incentives large enough to
support maintenance of the behavior.
This limitation does not apply to
outcomes-based incentives, since
they are only paid if the outcome is
attained. Similarly, it may not apply
if incentives are integrated into the
health plan, since the “costs” are
Efficiency
• Integrate incentives into your
health plan design rather than
using direct cash-equivalent
rewards. Assuming actuarial
assumptions about the percentage
of enrollees earning the incentive
are correct, this strategy makes
incentives cost-neutral (aside from
opportunity costs).
• Ensure that incentives improve
the outcome you are seeking. For
example, if incentives are used
in program activities to improve
population health outcomes, this
should be based on evidence that
the incentive is effective and cost-
effective in achieving that goal.
• Communicate about incentives
early and often. Focus your
25

1Changing behavior. Changing lives.®
Incentive strategy Incentive tactics
Efficiency (continued)
opportunity costs rather than
incremental expenditures.
Efficiency (continued)
messaging on shared responsibility
rather than a “do this, get that”
emphasis that encourages
compliance rather than
engagement. Keep rules and
criteria for earning a reward simple
so they are readily understood by
all employees regardless of their
education and reading level. This
also helps participants focus on
their health rather than incentive
rules.
• Clearly align environmental and
cultural changes such as healthy
vending machines, regular break
times and health education
offerings with the activities or
outcome standards that will be
rewarded.
• Healthy leaders and healthy
leadership are vital for bringing
consistent and congruent support
to employee health improvement
efforts.
• Avoid invalidating HA results.
Incentives tied to HA completion
are effective in increasing
completion rates. Incentives tied
to HA results, however, should
generally be avoided because they
may intentionally or unintentionally
influence HA responses.
26

1Changing behavior. Changing lives.®
Incentive strategy Incentive tactics
Equity
• Incentive strategies should take into
account employee differences such
as ethnicity, geographic location and
socioeconomic status. The increase of
a premium differential to the new 30%
threshold will amount to about $1,500
for individual health care coverage or
$4,000 for family coverage. Such cost
differences would “disproportionately
hurt lower-paid workers, who,
generally, are less healthy than higher-
paid workers and thus in greater need
of health care, less likely to meet the
targets, and less likely to afford higher
premiums and deductibles” (Voight &
Schmidt, 2010). Considerable research
shows that those living with chronic
conditions such as hypertension or
diabetes are less able to manage
their health when their costs related
to insurance coverage are too high
(“American Heart Association Position
Statement on Financial Incentives
within Worksite Wellness Programs,”
7/18/2011).
• Not only do people have different
starting lines concerning their
capacity to afford and manage their
health, wide variations in genetics
and physiology create a complex
relationship between behavior and
outcomes. For example, one recent
study showed that, when following
identical exercise regimens, some
participants showed significant
improvements in aerobic capacity,
some showed only moderate
improvement, and others showed little
or no improvement (Karavirta et al.,
2011). Similarly, a post-menopausal
Equity
• Communicate early and often
about the relationship between
the health of the business and
the health of employees. Position
personal responsibility for health as
an equitable exchange for valuable
health benefits and employer
support for healthy lifestyles.
• Use a multi-faceted incentive model
rather than narrow strategies such
as pure outcomes-based designs.
As suggested in the Towers
Watson report, with a third of
employees opposed to outcomes-
based incentives: “more aggressive
approaches could have unintended
consequences, ultimately
undermining one of employers’
primary goals — cultivating a
healthier and more productive
workforce” (Nyce, 2010).
• Consider a progress-based
incentive strategy instead of a pure
outcomes-based design. That is,
reward attainment of progress
toward a recommended standard
such as losing 10 percent of body
weight for all those who do not
meet targets even if they do not
have a medical condition.
• Incentives tied to specific
interventions will increase
participation even among those
for whom the intervention is not
appropriate. Offering a range of
program options with incentives
indexed to program intensity, along
with a strategy for triaging
27

1Changing behavior. Changing lives.®
Incentive strategy Incentive tactics
Equity continued
woman will have a much greater
challenge losing weight than a young
man. A single parent will have a much
greater challenge finding the time and
energy to commit to lifestyle changes
than an individual with family support
or a single individual.
• This complexity, as well as health
disparities linked to education
and income, is likely to keep many
employers focused on tying incentives
to participation with very judicious
consideration of outcomes-based
incentives, especially given all of
the legal, ethical, social, behavioral
and practical entanglements such a
direction entails.
Equity continued
individuals into appropriate
activities, is essential for maximizing
participation.
• Consider moderating standards
according to the risk level of
participants, especially in the first
few years of the program. Examples
include setting more lenient
targets (e.g., BMI < 30 versus < 25)
or requiring participants to meet
a subset of the health outcome
targets (e.g., meet the standard by
achieving three of four targets).
• Minimize use of “do this, get
that” compliance-focused
communications, and maximize
the use of “shared responsibility”
themes in communications.
• Consider requiring multiple
activities throughout the year in
lieu of achieving outcomes. Do not
tie a large incentive to completing
a single activity (e.g., a coaching
program).
• For outcomes-based or progress-
based incentive designs, consider a
lower incentive tier for participation
(e.g., earn the full incentive for
outcomes or progress and a partial
incentive for participation).
28
1Changing behavior. Changing lives.®
Conclusions
Health care reform comes with extraordinary new opportunities to elevate wellness
and disease prevention efforts to a new level of effectiveness, contributing both to
the improved productivity of citizens and to renewed health and competitiveness for
American business. There is much to learn about how best to align financial incentives
and new health benefit strategies with employers’ goals to compete and win in
the global marketplace. The use of financial incentives will accelerate as research
demonstrating their effectiveness is produced. We hope such evidence will emerge in
advance of the implementation of poorly designed incentive strategies.
Although some employers already are considering eliminating rewards not tied to
health outcomes, several factors argue against the exclusive use of biometric outcome
targets as an effective strategy for producing populationwide health improvements.
Since health status is not solely the result of lifestyle but also genetic and physiological
factors, what works for one person may not work for another who makes exactly the
same lifestyle changes. Demographic, socio-economic and environmental factors also
influence a person’s ability to achieve certain outcomes, which creates further equity
concerns. An incentive strategy needs to take these other factors into account, possibly
by rewarding meaningful effort as well as health outcomes. For example, setting and
achieving individually tailored health improvement goals or participation in multiple
activities throughout the year could be considered meaningful effort. Even if the
incentive is set at a lower value than the full outcomes-based incentive, rewarding
meaningful effort draws people into the program. Confining rewards only to those
who hit all of the outcome targets risks alienating those at highest risk, who have the
furthest to go and generate the highest costs to the organization.
A progress-based incentive strategy can provide a safer, more effective,
participant-centered and equitable approach to achieving population health
goals. In a progress-based model, the attainment of a reasonable, individually tailored
health goal, such as losing 10 percent of body weight, offers every participant an
opportunity to earn incentives regardless of how far from the recommended health
standard they begin their journey.
The concepts and recommendations in this paper are largely derived from the scientific
and health policy literature. At the same time, employers who are early innovators in
health benefits design are essentially providing “natural experiments” into what works
and what doesn’t in employee health management. Appendix D offers recent case
studies from progressive employers who we consider to be achieving a good balance
between investing in their culture of health and abetting that effort with a judicious
use of financial incentives.
A progress-based incentive
strategy can provide a safer,
more effective, participant-
centered and equitable
approach to achieving
population health goals.
29

1Changing behavior. Changing lives.®
References
American Heart Association Position Statement on Financial Incentives within Worksite
Wellness Programs. (7/18/2011). Retrieved August 2, 2011, from http://www.heart.
org/idc/groups/heart-public/@wcm/@adv/documents/downloadable/ucm_428966.pdf
Anderson, D. R., Grossmeier, J., Seaverson, E. L. D., & Snyder, D. (2008). The role of
financial incentives in driving employee emngagement in health management. ACSM’s
Health & Fitness Journal, 12(4), 18-22.
Anderson, D. R., Whitmer, R. W., Goetzel, R. Z., Ozminkowski, R. J., Dunn, R. L.,
Wasserman, J., et al. (2000). The relationship between modifiable health risks and group-
level health care expenditures. Health Enhancement Research Organization (HERO)
Research Committee. American Journal of Health Promotion, 15(1), 45-52.
Ariely, D. (2008). Predictably Irrational: The Hidden Forces That Shape Our Decisions.
New York, NY: HarperCollins.
Buck Consultants. (2007). WORKING WELL: A Global Survey of Health Promotion and
Workplace Wellness Strategies. San Francisco, CA: Buck Consultants, LLC.
Buck Consultants. (2010). WORKING WELL: A Global Survey of Health Promotion and
Workplace Wellness Strategies. San Francisco, CA: Buck Consultants, LLC.
Collins, J. C. (2001). Good to great: Why some companies make the leap--and others
don’t: HarperBusiness.
Flegal, K. M., Carroll, M. D., Ogden, C. L., & Curtin, L. R. (2010). Prevalence and trends
in obesity among US adults, 1999-2008. JAMA: The Journal of the American Medical
Association, 303(3), 235-241.
Goetzel, R. Z., Anderson, D. R., Whitmer, R. W., Ozminkowski, R. J., Dunn, R. L., &
Wasserman, J. (1998). The relationship between modifiable health risks and health care
expenditures. An analysis of the multi-employer HERO health risk and cost database.
Journal of Occupational and Environmental Medicine, 40(10), 843-854.
Grossmeier, J. (2010). The influence of worksite and employee variables on employee
engagement in telephonic health coaching programs: A retrospective multivariate
analysis. Unpublished Dissertation, Walden University, Minneapolis.
Grossmeier, J., Terry, P., Cipriotti, A., & Burtaine, J. (2010). Best practices in evaluating
worksite health promotion programs. American Journal of Health Promotion.
Halpern, S. D., Madison, K. M., & Volpp, K. G. (2009). Patients as mercenaries?: the
ethics of using financial incentives in the war on unhealthy behaviors. Circulation:
Cardiovascular Quality and Outcomes, 2(5), 514-516.
Health Insurance Portability and Accountability Act, U.S.C. (1996).
Hewitt Associates. (2010). The Road Ahead: Under Construction with Increasing Tolls.
Institute of Medicine, & Committee on Quality of Health Care in America. (2001).
30

1Changing behavior. Changing lives.®
Crossing the quality chasm: A new health system for the 21st century. Washington,
D.C.: National Academies Press.
Kahneman, D., Knetsch, J. L., & Thaler, R. H. (1990). Experimental Tests of the
Endowment Effect and the Coase Theorem. The Journal of Political Economy, 98(6),
1325-1348.
Karavirta, L., Häkkinen, K., Kauhanen, A., Arija-Blázquez, A., Sillanpää, E., Rinkinen, N., et
al. (2011). Individual responses to combined endurance and strength training in older
adults. Medicine & Science in Sports & Exercise, 43(3), 484-490.
Kim, A., Kamyab, K., Zhu, J., & Volpp, K. (2011). Why are Financial Incentives not
Effective at Influencing Some Smokers to Quit? Results of a Process Evaluation of a
Worksite Trial Assessing the Efficacy of Financial Incentives for Smoking Cessation.
Journal of Occupational and Environmental Medicine, 53(1), 62-67.
Kohn, A. (1993). Punished by Rewards: The Trouble with Gold Stars, Incentive Plans,
A’s, Praise, and Other Bribes. Boston, MA: Houghton Mifflin.
Levitt, S. D., & Dubner, S. J. (2005). Freakonomics: A Rogue Economist Explores the
Hidden Side of Everything. New York, NY: HarperCollins.
Linnan, L., Bowling, M., Childress, J., Lindsay, G., Blakey, C., Pronk, S., et al. (2008).
Results of the 2004 National Worksite Health Promotion Survey. American Journal of
Public Health, 98(8), 1503-1509.
Marlo, K., Dan, D., & Lykens, C. (2010). Large Employers’ 2011 Health Plan Design
Changes. Washington, D.C.: National Business Group on Health.
Mercer. (2010). National Survey of Employer-Sponsored Health Plans.
Nyce, S. (2010). Boosting wellness participation without breaking the bank: Watson
Wyatt.
O’Donnell, M. P. (2010). Making the Impossible Possible: Engaging the Entire
Population in Comprehensive Workplace Health Promotion Programs at No Net Cost to
Employers or Employees. American Journal of Health Promotion, 24(6), fmiv-fmv.
An open letter to the Secretaries of Treasury, Health and Human Services, and Labor.
(2009). http://www.aucd.org/docs/GINA%20Agency%20Sign-on%20letter%20_11-25-
09_.pdf, accessed 7-15-2011.
Patient Protection and Affordable Care Act, United States Congress, 2nd Sess. 974
(2010).
Pink, D. H. (2009). Drive: The surprising truth about what motivates us. New York, NY:
Riverhead Books.
Prochaska, J. O., Norcross, J. C., & DiClemente, C. C. (1994). Changing for Good. New
York: William Morrow and Company, Inc.
31

1Changing behavior. Changing lives.®
Regulations Under the Genetic Information Nondiscrimination Act of 2008, 29 C.F.R. §
1635 (2010).
Riedel, J. E., Grossmeier, J., Haglund-Howieson, L., Buraglio, C., Anderson, D. R., & Terry,
P. E. (2009). Use of a normal impairment factor in quantifying avoidable productivity
loss because of poor health. Journal of Occupational and Environmental Medicine,
51(3), 283-295.
Ryan, R. M., & Deci, E. L. (2000). Self-determination theory and the facilitation of intrinsic
motivation, social development, and well-being. Am Psychologist, 55(1), 68-78.
Schmidt, H., Voigt, K., & Wikler, D. (2010). Carrots, sticks, and health care reform -
problems with wellness incentives. New England Journal of Medicine, 362(2).
Seaverson, E. L., Grossmeier, J., Miller, T. M., & Anderson, D. R. (2009). The role of
incentive design, incentive value, communications strategy, and worksite culture on
health risk assessment participation. American Journal of Health Promotion, 23(5), 343-
352.
SEFF v. Broward County (Dist. Court, SD Florida 2011).
Taitel, M. S., Haufle, V., Heck, D., Loeppke, R., & Fetterolf, D. (2008). Incentives and other
factors associated with employee participation in health risk assessments. Journal of
Occupational and Environmental Medicine, 50(8), 863-872.
Terry, P. E. (1993). Health incentive systems and risk rating: do physicians become
sentinels or shepherds? HMO Practice, 7(1), 15-19.
Terry, P. E. (1994). A case for no-fault health insurance: from the ”worried well” to the
“guilty ill.” American Journal of Health Promotion, 8(3), 165.
Terry, P. E., Seaverson, E. L., Grossmeier, J., & Anderson, D. R. (2008). Association
between nine quality components and superior worksite health management program
results. Journal of Occupational and Environmental Medicine, 50(6), 633-641.
Terry, P.E., & Anderson, D. R. (2011). Finding common ground in the use of financial
incentives for employee health management: A call for a progress-based approach.
American Journal of Health Promotion, 26(1), ev-evii.
Thaler, R. H., & Sunstein, C. R. (2009). Nudge: Improving Descisions About Health,
Wealth, and Happiness. New York, NY: Penguin Books Ltd.
Towers Watson. (2011). Employee Perspectives on Health Care, Part II: Employee
Engagement. New York, NY.
Towers Watson, & National Business Group on Health. (2010). Raising the Bar on
Health Care Moving Beyond Incremental Change.
Towers Watson, & National Business Group on Health. (2011). The Road Ahead:
Shaping Health Care Strategy In a Post-Reform Environment.
32

1Changing behavior. Changing lives.®
Tversky, A., & Kahneman, D. (1991). LOSS AVERSION IN RISKLESS CHOICE: A
REFERENCE-DEPENDENT MODEL. The Quarterly Journal of Economics, 106(4), 1039-
1061.
Voight, K., & Schmidt, H. (2010). Wellness programs: a threat to fairness and affordable
care. Health Care Cost Monitor, 1-2.
Volpp, K. G., John, L. K., Troxel, A. B., Norton, L., Fassbender, J., & Loewenstein, G.
(2008). Financial Incentive-Based Approaches for Weight Loss: A Randomized Trial.
JAMA: The Journal of the American Medical Association, 300(22), 2631-2637.
Volpp, K. G., Troxel, A. B., Pauly, M. V., Glick, H. A., Puig, A., Asch, D. A., et al. (2009). A
randomized, controlled trial of financial incentives for smoking cessation. New England
Journal of Medicine, 360(7), 699-709.
Watson Wyatt, & National Business Group on Health. (2008). Building an Effective
Health & Productivity Framework.
Wilhide, C., Hayes, J. R., & Farah, J. R. (2008). The use and influence of employee
incentives on participation and throughput in a telephonic disease management
program. Population Health Management, 11(4), 197-202.
33
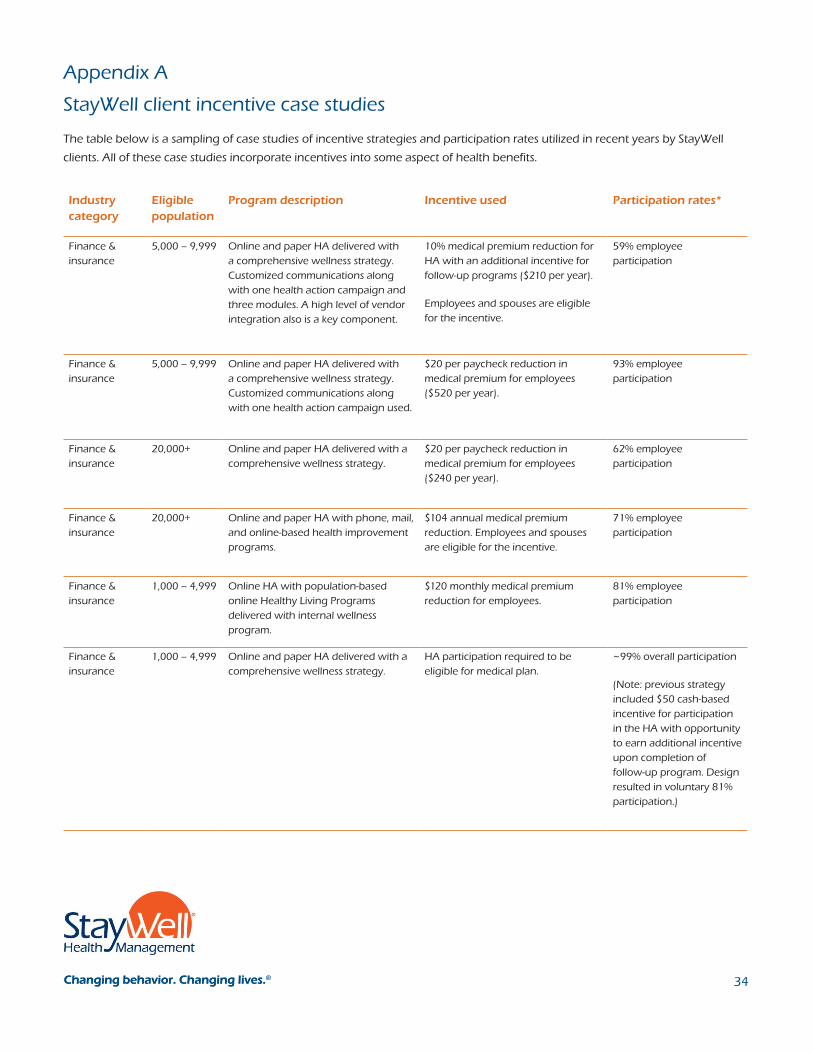
1Changing behavior. Changing lives.® 1Changing behavior. Changing lives.®
Appendix A
StayWell client incentive case studies
The table below is a sampling of case studies of incentive strategies and participation rates utilized in recent years by StayWell
clients. All of these case studies incorporate incentives into some aspect of health benefits.
Industry category
Eligible population
Program description Incentive used Participation rates*
Finance & insurance
5,000 – 9,999 Online and paper HA delivered with a comprehensive wellness strategy. Customized communications along with one health action campaign and three modules. A high level of vendor integration also is a key component.
10% medical premium reduction for HA with an additional incentive for follow-up programs ($210 per year).
Employees and spouses are eligible for the incentive.
59% employee participation
Finance & insurance
5,000 – 9,999 Online and paper HA delivered with a comprehensive wellness strategy. Customized communications along with one health action campaign used.
$20 per paycheck reduction in medical premium for employees ($520 per year).
93% employee participation
Finance & insurance
20,000+ Online and paper HA delivered with a comprehensive wellness strategy.
$20 per paycheck reduction in medical premium for employees ($240 per year).
62% employee participation
Finance & insurance
20,000+ Online and paper HA with phone, mail, and online-based health improvement programs.
$104 annual medical premium reduction. Employees and spouses are eligible for the incentive.
71% employee participation
Finance & insurance
1,000 – 4,999 Online HA with population-based online Healthy Living Programs delivered with internal wellness program.
$120 monthly medical premium reduction for employees.
81% employee participation
Finance & insurance
1,000 – 4,999 Online and paper HA delivered with a comprehensive wellness strategy.
HA participation required to be eligible for medical plan.
~99% overall participation
(Note: previous strategy included $50 cash-based incentive for participation in the HA with opportunity to earn additional incentive upon completion of follow-up program. Design resulted in voluntary 81% participation.)
34

1Changing behavior. Changing lives.®
Industry category
Eligible population
Program description Incentive used Participation rates*
Manufacturing & mining
20,000+ Online and paper delivery of HA with a comprehensive, onsite delivery model.
$240 in flex dollars for HA and biometric screening for non-bargaining employee population. An additional $240 for tobacco- free credits are awarded to non-tobacco users and to tobacco users who agree to complete a focused tobacco cessation intervention program.
77% non-bargaining unit (NBU)
(Note: NBU HA participation nearly doubled with implementation of the NBU incentive program; previous incentive was a themed T-shirt)
Manufacturing & mining
5,000 – 9,999 Online and paper HA delivered with a comprehensive wellness strategy.
$10 monthly reduction in medical premium for employees ($120 per year).
53% employee participation
Manufacturing & mining
5,000 – 9,999 Online and paper HA and onsite screenings delivered as a comprehensive wellness strategy including interventions.
$100 annual medical premium discount for completion of HA, biometric health screening, and follow-up program.
50% employee participation
Manufacturing & mining
20,000+ Online and paper HA with phone- and mail-based health improvement programs.
$60 medical premium reduction. 32% employee participation
Manufacturing & mining
10,000 – 19,999
Online and paper HA delivered with a comprehensive wellness strategy.
$60 medical premium reduction. 52% employee participation
Manufacturing & mining
20,000+ Online and paper HA delivered with a comprehensive wellness strategy.
Medical premium reduction; value ranges from $200 to $600 and varies by participant. Both employee and spouse are required to participate in the HA to receive incentive.
83% overall participation
Manufacturing & mining
1,000 – 4,999 Paper HA delivered via onsite processing in conjunction with comprehensive wellness components.
$1,000 medical premium reduction for employees who sign participation pledge, complete the HA, biometric health screening, and receive follow up from a disease management vendor, if recommended.
91% overall participation
StayWell client incentive case studies (continued)
35

1Changing behavior. Changing lives.®
Industry category
Eligible population
Program description Incentive used Participation rates*
Retail 5,000 – 9,999 Online and paper HA along with phone-based NextSteps, creating a comprehensive wellness strategy.
$15 to $30 monthly reduction in medical premiums with a $100 gift certificate for enrolling in the Healthy Pregnancy Program ($180 to $360 per year).
44% employee participation
Retail 5,000 – 9,999 Online HA along with phone-based NextSteps, creating a comprehensive wellness strategy.
$10 per pay period medical premium reduction ($240 per year).
71% employee participation
Service 5,000 – 9,999 Online and paper HA delivered with a comprehensive wellness strategy
HA is mandatory for employees to receive medical benefits. Employees will receive 25 points towards an internal incentive program if they complete a NextSteps phone program (3 calls).
97% employee participation
Service 10,000 – 19,999
Online and paper HA delivered with a comprehensive wellness strategy.
Eligible for richer benefit plan plus $200 employer contribution to FSA for completion of HA and biometric screening. HA participation required for premier medical benefits. Both employee and spouse required to participate to receive incentive.
96% overall participation
Utility 10,000 – 19,999
Online and paper HA delivered with a comprehensive wellness strategy. A high level of vendor integration also is a key component.
$100 medical premium discount and gift certificate for non-bargaining population. Employees and spouses are eligible for the incentive.
67% non-bargaining employee participation
Utility 10,000 – 19,999
Online and paper HA delivered with a comprehensive wellness strategy.
Election of a PPO plan with a $200 reduction in medical plans for single, $400 reduction for employee and spouse plan. Employee HA participation required to be eligible for medical plan. Both employee and spouse are required to participate to receive incentive.
89% employee participation
* Participation rates are based on employees only and are highly dependent on incentive offered, communication/promotion plan and company culture.
StayWell client incentive case studies (continued)
436

1Changing behavior. Changing lives.® 1Changing behavior. Changing lives.®
Appendix B
Trends in the use of incentives for population health management
Mercer, 2010
Towers Watson (Nyce, 2010)
Buck Consultants, 2010
Hewitt Associates, 2010
NBGH (Marlo et al., 2010)
Use of
financial
incentives
21% to 27% of
employers offered
incentives in 2010
to encourage
participation.
62% of employers
presently offer
incentives and 25% plan
to offer them.
Employers offering
incentives to engage
employees decreased
from 57% in 2009 to
44% in 2010.
Outcomes-
based
incentives
28% of employers
offered lower
premiums for
nonsmokers in
2011 (up from
23% in 2010).
6% of employers are
considering having
employees achieve a
standard to be eligible for a
preferred plan option. (1% of
respondents currently do this)
92% are not considering it.
Employers
implementing health
insurance premiums
based on achieving a
standard: today, 15%;
next year, 8%; in two
to three years, 11%; no
plans, 68%.
18% of employers are
currently using penalties
and 47% intend to use
them in the next three to
five years.
For employers
offering health
savings accounts,
29% use incentives for
healthy behavior as a
contribution strategy.
Size of
incentives
From token
gifts to $180
average premium
reduction.
Larger financial rewards are
strongly linked to higher
participation rates. The link
is especially robust with HAs,
biometric screenings and
health coaching. Completion
rates for HAs rise by nearly 11
percentage points for every
$100 increase in financial
incentives. Participation
in biometric screenings
increases by about 10
percentage points for a
similar reward. HAs reach
universal participation given a
$600 incentive.
Global average of $220
in 2010 (up from $163
in 2009).
Average in 2010 of
$386 (up from $318
in 2009). Range from
$50 to $1,200.
37

1Changing behavior. Changing lives.®
Mercer, 2010
Towers Watson (Nyce, 2010)
Buck Consultants, 2010
Hewitt Associates, 2010
NBGH (Marlo et al., 2010)
Building a
culture of
health
Strengthening the focus on a
healthy workplace culture (by
adding four additional tactics)
can boost HA participation
by as much as offering a $140
financial incentive.
Only 33 percent of
employers believe that
they have a culture
of health today, but
81 percent intend to
pursue it for the future.
“Keeping employees
healthy” (82%) has
been the number-
one workforce issue
for the last two years
(surpassing worker
satisfaction and safety).
Cost-
sharing
trends
32% of employees
report “I
would not feel
comfortable if
my employer
increased the
premium costs for
workers unwilling
to take steps to
manage their
illness or lower
their health risk.”
Employee cost sharing
as a strategy has
increased from 33% in
2008 to 43% in 2010.
Per disincentives, 81% of
employers name higher
premiums as penalty of
choice.
Most often reported as
the three most effective
tactics for containing
plan costs were wellness
initiatives (56%), disease/
condition management
(47%) and pharmacy
benefit design (39%).
38

1Changing behavior. Changing lives.® 1Changing behavior. Changing lives.® 1Changing behavior. Changing lives.® 1Changing behavior. Changing lives.®
Appendix C
Recommended readings and resources
Recommended readings
As described in the previous sections, some components of health care reform
support an employer’s increased use of financial incentives for wellness. At the same
time, employee protections against health discrimination, such as those provided by
HIPAA, are written to ensure incentives are used judiciously. There never has been a
more vital time to carefully study the opportunities and threats posed by incentives.
Thankfully, there also is new thinking, particularly related to behavioral economics, that
practitioners can use as resources when making incentive policies. Here are four books
StayWell recommends:
“Nudge” by Richard Thaler and Cass Sunstein (http://nudges.org) (Thaler &
Sunstein, 2009) — This book is having an impact on health promotion professionals
by supporting their efforts to “make healthy choices the easy choices” — a common
phrase in current conferences and periodicals. If you only read one book on behavioral
economics, this is the best at providing credible evidence for how to balance individual
versus social responsibility for health. The authors capture this in their clever but
provocative idea that policymakers need to be “paternalistic libertarians,” meaning we
are duty-bound to set policy that advances the public good, while assuring we don’t
interfere with fundamental individual freedoms.
“Drive: The Surprising Truth About What Motivates Us” by Daniel Pink
(www.danpink.com) (Pink, 2009) — If you like Malcolm Gladwell’s writing and the way
he weaves interesting research together with instructive anecdotes, you’ll love Daniel
Pink’s ability to knock you upside the head with studies that drive home his thesis:
When it comes to behavior change, there can be no substitute for intrinsic motivation,
and well-intentioned incentives can backfire. Not only does this book offer scientific
justification for limiting the use of rewards to simple behaviors, like showing up for
something, Pink also smartly illustrates how incentives too often diminish motivation.
Health coaches will resonate with his conclusions that successful self-changers almost
always manage to connect new habits to long-held personal passions.
“Predictably Irrational” by Dan Ariely (http://danariely.com) (Ariely, 2008) — If you
liked Dubner and Levitt’s “Freakonomics” (Levitt & Dubner, 2005) you will like Ariely’s
penchant for using obscure but useful studies to change your assumptions about the
supremacy of money. What’s more, if you subscribe to the common-sense idea that
when given the “right” financial or policy incentives, we will make rational choices
that advance our personal interests, think again. Ariely offers multiple examples
where people make the irrational choice, meaning policy makers need to take these
predictable human foibles into account. In contrast to “nudges,” if Ariely had his way,
the “paternalistic libertarianism” movement would tilt strongly in favor of “father knows
best.”
“Punished by Rewards” by Alfie Kohn (www.alfiekohn.org/index.php) (Kohn, 1993)
— If you are not persuaded by the above scholars that rewards come with landmines
attached, Kohn may tip you over the edge. Though Kohn’s book selectively highlights
39

1Changing behavior. Changing lives.®
studies advancing his condemnation of incentives, his case for caution is compelling
and, at minimum, thought-provoking. If you supplement Kohn’s conclusions with those
of scientists like Albert Bandura, James Prochaska or Marshall Becker, who clearly have
mapped the path where rewards for small steps can be catalysts for larger changes,
then this book offers useful caveats concerning the usual path to successful change.
Moreover, Kohn has an enthusiastic following in education reform circles and has been
a leader in preventing ill-considered use of incentives.
Together, these books lead to the following basic guidelines for health promotion
practitioners.
• Make incentives a catalyst or a means to an end. Financial incentives can lead a
horse to water, but intrinsic motivation is what makes it drink for a lifetime.
• Focus on intrinsic rewards. Once you have led them to water, make sure they are
reminded how sweet it has been for those who’ve chosen to drink. Tell success
stories early and often.
• Keep participation-based incentives as modest as possible. The larger the reward,
the more the focus shifts from doing what I think may be good for me to resenting
attempts to control my personal choices.
• Create a culture of shared responsibility for health. Balance demands for greater
personal responsibility with organizational support for healthier behaviors.
• Introduce larger progress-based incentives into a prepared culture. A culture of
shared responsibility increases acceptance of larger incentives tied to achieving
outcomes or making progress toward better health.
• Consider reward reductions for nonparticipation. Research consistently
demonstrates that losing a benefit we already enjoy is more powerful than gaining
a benefit we don’t currently have.
• Keep it simple. There’s nothing more counterproductive than employees struggling
to understand complicated incentive rules rather than focusing on the real work:
setting goals and adopting new health behaviors tailored to their needs and
values.
40

1Changing behavior. Changing lives.® 1Changing behavior. Changing lives.®
Appendix D
Case studies of the role of incentives in population health management
StayWell worked with Wachovia Corporation, a national banking and financial
services company with 110,000 employees in 49 states, to fashion a participation-
based incentive program consistent with the company’s goals and benefits strategies.
Wachovia launched its wellness program in 2004 and encouraged completion of the
HA by conducting a drawing for a $50 gift certificate, with multiple winners. In year
one, only 10 percent of incentive-eligible employees completed the assessment. In
2005, Wachovia dropped the incentive and likewise, saw its program participation rate
drop to just five percent of eligible participants.
Then, in 2006, the company began offering a $75 cash incentive for all eligible
employees who completed the HA, with the incentive delivered through the
employee’s paycheck. Participation reached an all-time high of 66 percent. Wachovia
expanded its incentive program in 2007 to include all benefit-eligible employees,
spouses and domestic partners. Employees received a $75 incentive for completing
the HA and an additional $50 incentive if their covered spouse or domestic partner
completed it.
According to Donna Shenoha, who was vice president and senior consultant of
health and welfare for Wachovia, the company’s success was a result of its ability to
understand its employee population and corporate culture, as well as its strategic
use of employee communications and program monitoring. “We really wanted our
employees’ first experience with an incentive of this type to be positive and easy to
understand,” said Shenoha. “The participation level showed that employees were
pleased with the incentive amount and type, and the aggregate results from 2006
allowed us to refine our health management strategy so it truly fit our culture and
demographics.”
Shenoha added that Wachovia supported its wellness program with a comprehensive
communications strategy that included intranet articles, desk-top videos, employee
newsletter articles, and email announcements and reminders. In addition, employees
who started but did not complete an HA received a separate, tailored communication.
Wachovia continued to build and refine its program in 2008 by focusing its incentive
strategy on the “next steps” to a healthier lifestyle; namely, participation in lifestyle
change and disease management programs.
Applying best practices
The term “best practices” exists for a reason. We watch and learn from the success of
companies like Wachovia, and try to apply similar principles or practices to our own
situations. When it comes to best practices for using incentives, a clear pattern has
emerged over the past several years. At StayWell, we have identified four key successful
According to Donna Shenoha,
who was vice president and senior
consultant of health and welfare
for Wachovia, the company’s
success was a result of its ability
to understand its employee
population and corporate culture,
as well as its strategic use of
employee communications and
program monitoring.
41

1Changing behavior. Changing lives.®
incentive strategies that are present in health management programs:
• Use incentives as a reward for completing an HA.
• Use incentives as a reward for completing related follow-up activities to the HA
(e.g., health behavior change programs).
• Use a points system that is tied to a menu of program activities to give employees
opportunities to participate in activities that are appropriate for their stage of
readiness to make behavior changes. Reward such healthy behaviors as attending
smoking cessation classes.
• If considering outcomes-based incentives, retain incentives that reward effort and
progress toward the outcomes of interest so as not to lose the hardest-to-reach
employees.
Examples of the types of incentives that have been used in these campaigns include:
• Money or cash equivalents
• Health plan premium reductions
• Increased company contribution to the employee’s medical spending account
• Opportunity to enroll in a richer plan design
Other incentives that often are used, and that appear to have the potential to be
effective are:
• Company-branded merchandise like tote bags and jackets
• Culturally significant “tokens,” such as the chance to win a prime parking spot
• Employee recognition by management and peers
• Reduced co-pays or deductibles
Incentives that have proven to be the least effective include stand-alone drawings and
healthy rewards with limited choices. These incentives typically do not work because
they appeal to people who already are in the healthy segment of the population, and
not those who need the most help. Granted, what works in one setting may not work
in another, so the key to effective incentives is identifying a meaningful reward for your
employees.
Putting best practices to work
So, how do you identify the most appropriate incentive strategy for your company
and then roll it out to your workforce? Your wellness partner ultimately will provide
guidance regarding the use of incentives as part of your overall program design
and strategy. But at StayWell, we have identified five key guiding principles for
incorporating incentives into a wellness program:
• Make the reward — and what the employee has to do to earn the reward — easy to
understand and easy to communicate.
42

1Changing behavior. Changing lives.®
• Choose a reward that has a perceived value by all or most employees. Like
Wachovia found, a simple cash reward delivered via the employee’s paycheck may
be the most appropriate and appealing incentive.
• Make sure the effort or activity required to receive the reward is reasonable
compared to the value of the reward.
• Test the program to make sure employees are unable to “beat the system” to get
the reward without full program participation.
• Choose an incentive and an approach that can be sustained over time. Remember
that it is much easier to add to an incentive rather than reduce it over time.
Perhaps the most important rule when using incentives is to remember that incentives
are just one part of the equation. Ask yourself these questions: What is your objective
for using incentives? How would an incentive fit into your overall long-term wellness
program? What do your employees value? Are you able and willing to maintain the
incentive?
In addition to these thought starters, here are some tips for rolling out your wellness
program to make it more effective and increase participation.
1. Direct the program to all employee mindsets, from the program champions to the
grassroots supporters and even the detractors.
2. Assess your program on a regular basis.
3. Continually nurture a culture of health within your workplace.
4. Position your program so everyone, from leadership to front-line employees,
realizes the value of the effort.
5. Target your employee communications with clear and simple messaging.
6. Conduct one-on-one employee outreach.
7. Offer a menu of intervention options to reach employees at all stages of change.
8. Use incentives wisely.
9. Regularly track and monitor key participation indicators.
10. Establish specific program goals and measure against them.
Connecting incentives to your overall strategy
What does the future hold for employers who currently are using incentives and those
who are looking to adopt incentives in the coming years? Incentives will undoubtedly
continue to hold a significant place in wellness and population health management.
The key to ongoing successful incentives will be to implement them as part of the
overall wellness package and use them in ways that make sense within a positive and
healthy company culture. Here is how Bob Ihrie, senior vice president of employee
rewards and services for Lowe’s companies frames the challenge: “For Lowe’s,
The key to ongoing successful
incentives will be to implement
them as part of the overall
wellness package and use them
in ways that make sense within
a positive and healthy company
culture.
43

1Changing behavior. Changing lives.®
success is a combination of having a great program and the ability to reach people.
Our employees are spread out at retail locations across the country, so if a program
doesn’t effectively reach and engage employees at all locations, it won’t last. The keys
to measuring our employee health management program at Lowe’s really boil down
to the effectiveness of the program, the ability to reach employees in our spread-out
world, employee satisfaction, and some form of ROI.”
Incentives and return-on-investment (ROI)
The ultimate measure of incentive effectiveness will be whether increased participation
produces greater total risk reduction in the organization. Related to this, the total
spending on incentives will need to be reconciled against the value of risk reduction.
Researchers at StayWell have conducted such studies to help employers quantify the
relationship between reduced employee health risks and costs. Most well-known have
been the formative research papers by Dr. David Anderson, senior vice president
and chief health officer at StayWell. Anderson’s studies were the first to codify the
relationship between health risks and health care costs based on very large data sets
merging medical claims codes with health risk assessment data (Anderson et al., 2000;
Goetzel et al., 1998). The results showed how a lower-risk older employee essentially
had the “health age” and medical spend of a higher-risk younger employee. And while
many wellness programs remained focused on cardiovascular health improvement,
this StayWell research clearly highlighted how psychological risk factors like stress
and depression were far more costly than previously had been thought. Accordingly,
an incentive strategy that can guide you to ROI requires routine (usually annually)
collection of HA data that is broadly gauged and robust enough to capture physical,
mental, social and cultural drivers of health care costs. This explains the current trend
toward offering a “health plan” as an alternative to the usual sick-care insurance model.
In such a health plan, completing a comprehensive employee HA is a gateway for
eligibility to the preferred health promotion and disease prevention coverage.
But reduction in health care costs alone may not be enough to justify significant
investments in an incentive strategy. StayWell recently published a case study of a
large manufacturing company that not only illustrates the pathway to a positive ROI,
but provides a best-practices evaluation methodology that can produce the more
formidable “value of investment” (VOI) (Grossmeier et al., 2010). After adjusting for
plan design changes, inflation and factors like age, union status and other baseline
utilization patterns, we found that the program, which included an evolving incentive
strategy, did indeed “bend the trend.” Over the two-year intervention period, medical
spending had increased by five percent among employees who did not participate
in the programs. Conversely, costs decreased by three percent for health program
participants. This difference produced a $3.1 million savings from the program, but
the overall value of the program far surpassed the impact on the bottom line. More
engaged employees, higher self-esteem, fewer health risks, greater satisfaction with
the company and many other readily measurable gains continue to guide the ongoing
program strategy. These results also provided reinforcement that the programs are
accruing value for the company and its employees each step of the way.
... an incentive strategy that
can guide you to a ROI requires
routine (usually annually)
collection of HA data that is
broadly gauged and robust
enough to capture physical,
mental, social and cultural
drivers of health care costs.
44

1Changing behavior. Changing lives.®
Measures that matter
Aligning incentives not only with the wellness program but with a total rewards and
benefits philosophy will require data credible enough to illustrate that the use of
incentives is about much more than improving your employees’ health and productivity.
You also need to choose measures that clearly demonstrate how your investment in
health is making your company run leaner, allowing you to recruit and retain better
talent and insuring that you can out-innovate and out-execute your competitors.
Bob Ihrie sums up the benefits of strategic planning and measurement in a way that a
CEO intent on excellence can readily appreciate. “For a large employer like Lowe’s, the
investment in measuring our program is small compared to the large return that we
get from this effort, both in terms of using that information to guide what we do and
improving our ability to choose programs that are effective.”
Data-driven program administrators always keep their eye on the whole dashboard.
“Our medical spend drives a lot of our planning, but I often remind senior leaders that
we need to cast the net broadly to be successful at containing health related costs,”
says Tammy Green, director of health management at Providence Health Systems in
Anchorage, Alaska. “In some respects, medical costs are easier to predict and intervene
on than workers’ compensation, FMLA, disabilities, productivity and absenteeism. The
impact of poor health will show up somewhere and it’s not always the doctor’s office.”
Though much more difficult to quantify than ROI, it is possible to monetize the
contribution of incentives to employee health improvement as well as to employee
productivity. In quality improvement circles, it is obvious that if you cannot measure
something, you cannot improve it. To this end, StayWell has been studying how health
improvements affect both productivity and “presenteeism,” a measure of how engaged
someone is on the job, even when dealing with a health problem. StayWell consulted
with leading researchers from Harvard University and Tufts University, who developed
health and productivity questionnaires that have been used widely enough now that
companies can benchmark their level of productivity loss due to poor health against
other like companies.
Smart use of such survey data affords leaders the ability to determine wage replacement
costs, the costs of lost production and absence costs for the company, including
losses due to specific claims such as workers’ compensation or short-term disability. In
cooperation with groups such as the Integrated Benefits Institute (IBI) or the Health
Enhancement Research Organization (HERO), employers are beginning to complete
productivity calculators and best-practices scorecards that illustrate the size of their
health and productivity problems and opportunities.
When it comes to deciding the size of an incentive investment and the overall health
management strategy, it helps to know the size of the problem we are trying to solve.
StayWell researchers quantified the difference between the productivity of workers with
poor health habits and chronic conditions, and those without (Riedel et al., 2009). Not
only did we monetize these differences, we provided key benchmarking data about
which employees are most affected by their health risks and which are most willing
and able to improve them. The results we found are troubling, but the opportunity also
looms large. We examined health and productivity data from a sample of 106 employers
StayWell researchers quantified
the difference between the
productivity of workers with
poor health habits and chronic
conditions, and those without
(Riedel et al., 2009). Not only did
we monetize these differences,
we provided key benchmarking
data about which employees
are most affected by their health
risks and which are most willing
and able to improve them.
45

1Changing behavior. Changing lives.®
from five industry sectors. Employees in this study averaged 2.4 risks, such as back pain,
smoking, overweight or lack of exercise. We found that there is normal productivity
impairment of 3.4 percent independent of health risks. Obviously, even the healthiest
of us can’t be 100-percent productive 100 percent of the time. But we also found that
those with the average number of risks lost 8.4 percent of their productivity on the job.
That is five percent less productivity or, viewed another way, nets out 2.6 weeks of lost
work time annually.
According to our estimates, those with three health risks cost $4,480 more per year in
on-the-job productivity loss than those with normal impairment. More alarming still, we
showed that a person at risk for all eight risk factors reportedly was 24% less productive.
An analysis of the various productivity detractors showed back pain as the largest
contributor, but depression, stress and tobacco use also are serious impediments when
it comes to health issues that tax a company’s productivity.
“We’re beating them a bit with a carrot.”
That is how Tammy Green describes her strategy to tune up financial incentives
at Providence Health and Services in Alaska in a way that increases employee
accountability while supporting employees with more tools to help them improve their
health. Green, who has a background in epidemiology and experience in statewide
public health practice, tracked numerous sources of company health metrics to hone in
on heart disease and stroke as top cost drivers. “I advise our CEO and senior leaders to
keep expectations realistic and make the long-term commitment to employee health.
That means it’s less about financial penalties and more about behavioral economics.
Matching our incentive strategy with robust offerings tells our employees we’re
prepared to meet them halfway. My goal is to quickly switch employee reliance on
extrinsic motivators like financial incentives to the more lasting intrinsic motivation
that will come with their participation in effective programs.” It is a philosophy that has
Providence piloting, among other things, a pre-hypertension management project.
Green notes that blood pressure is among the most tangible risk factors to monitor, and
following a cohort over two to three years will give Providence insight into trends in
related risks such as obesity, tobacco use and fitness.
This penchant for using data to set strategic priorities and then move quickly to
launching tactical projects also has been in the heart of leaders at Lowe’s. “We’re
always looking at the ROI, so when we’re considering a program change, we look
at the five disease stages and our 10 highest risk factors,” says Bob Ihrie, “then we
determine where it makes the most numeric sense to implement changes.”
How much should you invest in incentives?
Though the use of incentives is too new to offer a formula for success, StayWell advises
companies to consider incentives in the context of their ROI objectives. Our experience
suggests that the ratio of incentives compared to the intervention costs is about four to
one. That is, for every one dollar spent on providing employee health education, four
dollars are spent encouraging them to participate. If organizations are focused on the
overall “value of investment,” then larger incentives focused on greater participation
StayWell advises companies
to consider incentives in the
context of their ROI objectives.
Our experience suggests that
the ratio of incentives compared
to the intervention costs is
about four to one.
46

1Changing behavior. Changing lives.®
can be justified and a four-to-one ratio may be appropriate, although more research
is needed to test this hypothesis. For organizations more focused on health care cost
trends, a ratio that focuses more of the total health promotion budget on programs
and less on incentives should be considered.
For employers interested in considering their incentive investments in the context of
savings, StayWell offers clients a cost impact model that estimates cost and productivity
savings based on reductions in employees health risks. Similarly, many of the consulting
firms produce annual reports against which you can judge your progress and build
a case for continued and deeper investment in incentives and employee health
programs. According to the 2007/2008 Watson Wyatt “Staying@Work® Report”
(Watson Wyatt & National Business Group on Health, 2008), companies with the most
effective health management programs can see:
• 2.4 percent versus 11.0 percent health care cost trend
• 20 percent more revenue per employee
• 16 percent higher market value
• 57 percent higher shareholder returns
As noted earlier, it is likely that incentives with long-term staying power will increasingly
emphasize a carrot, rather than a stick approach to engaging employees. We will
see tools and technology that better tie incentives to specific participation goals and
requirements. For instance, at StayWell we offer an online point tracker that allows
employees to track their program participation and their progress toward their goals.
Additionally, we will become more sophisticated about having just the right incentive
at just the right time to support just the right goals in the behavior-change process.
In the end, good health is its own reward. Still, with a well-chosen reward here and a
nicely presented recognition there, before we know it, our spending on incentives will
pay dividends in employee health and productivity.
ResourcesNBGH: Best Employers for Healthy Lifestyles Award.http://www.businessgrouphealth.org/lightenup/lightenup/Best_Empl_Award09_WEB_nonmembers.pdf
The C. Everett Koop National Health Awardhttp://www.thehealthproject.com/
Well Workplace Awards
http://www.welcoa.org/wellworkplace/index.php?category=19
... it is likely that incentives with
long-term staying power will
increasingly emphasize a carrot,
rather than a stick approach to
engaging employees.
47
Related Documents