Faculty of Engineering and Computing Department of Civil Engineering The Reliability of Rock Mass Classification Systems as Underground Excavation Support Design Tools Jayantha Ranasooriya This thesis is presented for the Degree of Doctor of Philosophy of Curtin University of Technology July 2009

Welcome message from author
This document is posted to help you gain knowledge. Please leave a comment to let me know what you think about it! Share it to your friends and learn new things together.
Transcript
Faculty of Engineering and Computing
Department of Civil Engineering
The Reliability of Rock Mass Classification Systems as
Underground Excavation Support Design Tools
Jayantha Ranasooriya
This thesis is presented for the Degree of
Doctor of Philosophy
of
Curtin University of Technology
July 2009
ii
DECLARATION
This thesis contains no material which has been accepted for the award of any other
degree or diploma in any university.
To the best of my knowledge and belief this thesis contains no material previously
published by any other person except where due acknowledgment has been made.
The following publications have resulted from the work carried out for this degree.
Peer Reviewed Conference Papers:
1. Ranasooriya, J. and Nikraz, H. (2007) “Comparison of Rock Mass
Classification Systems with an Analytical Method of Underground
Excavation Design”, Sri Lankan Geotechnical Society’s First International
Conference on Soil & Rock Engineering, Colombo, Sri Lanka, 5-11 August
2007, CD-ROM.
2. Ranasooriya, J. and Nikraz, H. (2007) “Comparison of Empirical Methods
with Analytical Methods of Underground Excavation Design”, Common
Ground, !0th
Australia New Zealand Conference on Geomechanics,
Australian Geomechanics Society and the New Zealand Geotechnical
Society, 21-24 October 2007, Brisbane, Vol. 2, pp. 436-441.
3. Ranasooriya, J. and Nikraz, H. (2008) “Tetrahedral Wedge Stability Under
Empirically Derived Support”, First Southern Hemisphere International Rock
Mechanics Symposium - SHIRMS 2008, Australian Centre for Geomechanics
and the International Society for Rock Mechanics, 16-19 September 2008,
Perth, Vol. 1, pp. 633-440.
4. Ranasooriya, J. and Nikraz, H. (2008) “An Evaluation of Rock Mass
Classification Methods Used for Tunnel Support Design”, Proc ISRM Intl
Symp, ARMS5, Tehran, Vol. pp. 819-826
iii
5. Ranasooriya, J. and Nikraz, H. (2009) “An Assessment of Rock Mass
Classification Methods Used for Tunnel Support Design”, International
Conference on Rock Joints and Rock Masses, Tucson, Jan 2009, CD-ROM.
6. Ranasooriya, J. and Nikraz, H. (2008b) “Evaluation of Empirically Derived
Support for an Access Tunnel – a Case Study”, SINOROCK 2009 Rock
Characterisation, Modelling and Engineering Design Methods, ISRM
International Symposium on Rock Mechanics, 19-22 May 2009, Hong Kong,
Paper No. 264, CD-ROM.
7. Bahadorbeygi, D., Ranasooriya, J. and Nikraz, H. (2009) “Predicted and
actual conditions of the Namroud project diversion tunnel”. Rock
Engineering in Difficult Ground Conditions - Soft Rocks and Karst, ISRM
Regional Symposium EUROCK’2009, 29-31 October 2009, Dubrovnik-
Cavtat, Croatia, Paper No. D001, CD-ROM (accepted for publication).
Refereed Journal Papers:
8. Ranasooriya, J. and Nikraz, H. (2009) “Reliability of the linear relationship
between Rock Mass Rating (RMR) and Tunnelling Quality Index (Q)”.
Australian Geomechanics, Institution of Engineers Australia, June 2009.
9. Ranasooriya, J. and Nikraz, H. (2009) “On the linear relationship between
Rock Mass Rating (RMR) and Tunnelling Quality Index (Q)”. International
Journal of Mining and Mineral Processing, Serials Publications, (to be
published).
10. Ranasooriya, J., Nikraz, H. and Myo Min Swe (2009) “Application of rock
mass classification methods to the Klong Tha Dan project tunnels”,
International Journal of Mining and Mineral Processing, Serials
Publications, (to be published).
Copies of these papers are presented in Appendix A.

iv
v
The Reliability of Rock Mass Classification Systems as
Underground Excavation Support Design Tools
ABSTRACT
This thesis examines the reliability of rock mass classification systems available for
underground excavation support design. These methods are sometimes preferred to
rational methods of support design particularly if detailed information required for
the latter mentioned methods is lacking. The classification approach requires no
analysis of any specific failure mechanisms or the forces required to stabilise
unstable rocks, yet, the support measures thus designed are considered to deal with
all possible failure mechanisms in a rock mass.
Amongst the several rock mass classification methods developed for application in
underground excavation engineering, two have stood out. These are known as rock
mass rating (RMR) and tunnelling quality index (Q), introduced by Bieniawski
(1973) and Barton et al. (1974), respectively. Over the years, the two methods have
been revised and updated so as to improve their reliability as support design tools,
yet the two methods are know to have limitations and their reliability has long been a
subject of considerable debate. Nevertheless, attempts to assess their reliability in a
systematic manner have been limited. Further, some practitioners in the field of rock
engineering continue to use these methods as the sole methods of support design for
underground rock excavations. The objective of thesis, therefore, is to contribute to
a better understanding of the reliability of the two classification methods.
This study considered that the reliability of the RMR and Q methods can be assessed
by comparing their support predictions with those derived by other applicable
methods and also with the actual support installed. Such an assessment can best be
carried out during excavation of an underground opening because representative data
can be collected by direct observation of the as-excavated ground conditions and
monitoring the performance of the support installed. In this context, the geotechnical
data obtained during the construction of several case tunnels were reviewed and the
two classification methods were applied. The effectiveness of their support
vi
predictions was then evaluated against the potential failures that can be predicted by
some of the applicable rational methods. Since the rock masses intersected in the
case tunnels are jointed, mostly the structurally controlled failure modes were
analysed. The support measures predicted by the two methods were compared with
each other and with the actual support installed in the case tunnels. Further, the
RMR and Q vales assigned to the case tunnels were correlated to observe any
relationship between the two.
The study showed that the RMR and Q predicted support measures are not always
compatible. In some circumstances, the two methods can either overestimate or
under estimate support requirements.

vii
ACKNOWLEDGEMENTS
This thesis would not have been possible without the encouragement and enthusiasm
of Dr Hamid Nikraz, Professor of Civil Engineering, Department of Civil
Engineering, Curtin University of Technology, Western Australia. It is with a deep
sense of gratitude and much appreciation I acknowledge Hamid for his always
positive approach during all stages of this research. He has been the driving force
behind the conference and journal papers prepared based on the findings of my
research. In addition to playing the all important role as thesis supervisor, during the
course of this research he has become a personal friend, particularly when help is
needed to overcome personal difficulties. He is in fact a friend in need.
I extend my sincere gratitude to Professor David Scott for serving as the Chairman of
the thesis supervisory committee. Without his support the final product would not
have been possible. I would also like to thank Curtin staff Sucy Leong, Dian Garth
and Liz Field for their kind assistance on administrative matters. I also extend my
gratitude to Mr K J Whitbread for his proof reading of the manuscript.
Thanks are also due to Mr D Bahadorbeygi for providing data from the Namroud
project diversion tunnel in Iran reported as Case Study 8. For the Ramboda Pass
tunnel in Sri Lanka (Case Study 10) the data were provided by Messrs L Gaspe and
Weerakkody. The latter has also facilitated a site visit. Without their support the
inclusion of this case study would not have been possible.
While employed full-time, I conducted this research mostly on evenings and
weekends neglecting routine domestic matters. This might have caused some
inconvenience to my son Moshan who was an undergraduate student at this
engineering school at the time. He has been a great listener whenever I wanted to
say anything about my work and a tremendous moral supporter throughout.
Finally, I wholeheartedly thank Curtin University for providing me the opportunity
to achieve my goal at this late stage of my career. In fact it was my daughter Bonita
who first entered Curtin from my family and completed Bachelors and Masters
degrees. I simply followed in her footsteps back to the university.
viii
TABLE OF CONTENTS
Contents Page
Declaration ii
Abstract iv
Acknowledgment vi
Table of Content vii
List of Figures xv
List of Tables xv
List of Notations xv
1.0 INTRODUCTION 1
1.1 Background 1
1.2 Objectives and scope 5
1.3 Significance 7
1.4 Research approach 7
1.5 Structure of the thesis 9
2.0 INSTABILITY IN UNDERGROUND EXCAVATIONS 10
2.1 Underground Excavations in Rock 10
2.2 Intact Rocks and Rock Masses 12
2.3 Geological Structural Features 13
2.4 In Situ Stress 14
2.5 Strength and Deformability of Rock Masses 15
2.5.1 Strength and deformation of intact rock 15
2.5.2 Strength and stiffness of discontinuities 19
2.5.2.1 Stiffness of discontinuities 21
2.5.3 Strength of rock masses 22
2.5.4 Deformability of rock masses 25
ix
2.6 Rock Mass Instability in Underground Excavations 28
2.6.1 Structurally controlled gravity driven failures 29
2.6.1.1 Wedge failure 29
2.6.1.2 Prism failure 32
2.6.1.3 Beam or slab failure 33
2.6.2 Strength controlled stress driven failures 36
2.6.3 Combined effect of stress and discontinuities on rock instability 41
2.6.4 The Effects of Groundwater in Excavations 44
3.0 METHODS OF UNDERGROUND SUPPORT DESIGN 45
3.1 Introduction 45
3.2 The Observational Approach 46
3.3 The Empirical Approach 48
3.4 The Rational Approach 48
3.4.1 Support Design by the Rational Approach 50
3.4.1.1 Design against beam failure 51
3.4.2 Triangular roof prism 54
3.4.3 Tetrahedral wedge analysis 56
3.4.3 Numerical modelling of stress controlled failure 62
4.0 ROCK MASS CLASSIFICATION METHODS 66
4.1 Introduction 66
4.1.1 Applicability and robustness 67
4.1.2 Easily determinable parameters 68
4.1.3 Accuracy of the method 68
4.1.4 Subjectivity 69
4.1.5 Safety and economy 70
4.1.6 The Available Rock Mass Classification Methods 70
4.2 Rock Quality Designation (RQD) 73
4.3 Rock Mass Rating (RMR) 76
4.3.1 Modification of the RMR System 88
4.3.2 Modification of RMR for Mining 89
4.3.3 Limitations of the RMR method 90
4.4 Tunnelling Quality Index (Q) 94
x
4.4.1 Limitations of the Q system 106
4.5 The Main Differences between the RMR and Q Systems 109
5.0 PREVIOUS STUDIES ON RMR AND Q 112
5.1 Introduction 112
5.2 Studies on the Reliability of RMR and Q 112
5.2.1 Application to the Kielder Experimental Tunnel 115
5.2.2 Review and Comparison by Bieniawski 116
5.2.3 New Zealand Tunnelling Experience 117
5.2.4 Review by Steiner and Einstein 119
5.2.5 South African Tunnelling Experience 121
5.2.6 Spanish Tunnelling Experience 124
5.2.7 Application to Japanese Ground Conditions 127
5.2.8 Application at the Mt Isa Mine, Queensland 128
5.2.9 Experience from the Porter Square Station Cavern, USA 130
5.2.10 Canadian Mining Experience 132
5.2.11 Application to Civil and Mining Tunnels in Sri Lanka 134
5.2.12 Application to BC Rail Tunnels, Canada 138
5.2.13 Problems in Changing Loading Conditions 140
5.2.14 Indian Tunnelling Experience 142
5.2.15 Indian Coal Mining Experience 151
5.2.16 Review and Application to Bore Core Data from the UK 154
5.2.17 Experience from Israel 156
5.2.18 Sydney Experience 156
5.2.19 Experience from Italy and Spain 158
5.2.20 General Review Comments by Stille and Palmstrom 161
5.2.21 Experience from the Higher Himalayas 162
5.2.22 Critical Review Comments by Palmstrom and Broch 164
5.2.23 Australian Experience 165
5.2.24 Experience from TBM Driven Tunnels 170
5.3 The Reliability of RMR and Q Correlations 174
5.3.1 Background of the first RMR-Q correlation 174
5.3.2 Data scattering 177
5.3.3 Correlation of modified (or truncated) RMR and Q values 183
xi
5.3.4 Choice of the independent variable and method of analysis 186
5.3.5 Limitations of the Correlations 187
5.4 Conclusions Drawn from the Previous Studies 188
5.4.1 The common conclusions 189
5.4.2 Conclusions on the predictions of support measures 191
5.4.2.1 Overconservative support recommendations 191
5.4.2.2 Optimistic support recommendations 192
5.4.2.3 Adequate support recommendations 195
5.4.3 Conclusions on the prediction of support pressures (rock loads) 196
5.4.3 Conclusions on correlations between the RMR and Q values 197
6.0 ANALYSIS OF CASE STUDIES 199
6.1 Introduction 199
6.2 The Case Studies 201
6.3 CASE STUDY 1: The Chiew Larn Diversion (CLD) Tunnel, Chiew
Larn Hydro Project, Thailand 204
6.3.1 Project Site Geology 205
6.3.2 CLD Tunnel Rock Mass Data 205
6.3.3 Support Prediction for the CLD Tunnel using RMR and Q 208
6.3.4 Tetrahedral Wedge Stability Analysis 212
6.3.4.1 Shear strength parameters of joints 212
6.3.4.2 Changing groundwater conditions 214
6.3.4.2 The results of the UNWEDGE analysis 214
6.3.5 The Installed Support 217
6.3.6 Discussion 218
6.3.7 Conclusion 219
6.4 CASE STUDY 2: The Chiew Larn Hydropower (CLH) Tunnel,
Thailand 220
6.4.1 Project Site Geology 220
6.4.2 CLH Tunnel Rock Mass Data 220
6.4.3 Support Predictions by the RMR and Q Methods 222
6.4.4 Tetrahedral Wedge Stability Analysis 225
6.4.5 Assessment of Internal Water Pressure Effects 229
6.4.6 The Installed Support 231
xii
6.4.7 Discussion 231
6.4.8 Conclusion 232
6.5 CASE STUDY 3: The Huai Saphan Hin Power (HSHP) Tunnel,
Thailand 233
6.5.1 Project Site Geology 233
6.5.2 Rock Mass Data 233
6.5.3 Support Predictions by the RMR and Q Methods 235
6.5.4 Tetrahedral Wedge Stability Analysis 238
6.5.5 The Installed Support 240
6.5.6 Discussion 240
6.5.6 Conclusion 242
6.6 CASE STUDY 4: The Central Tunnel, Taiwan, Republic of China 243
6.6.1 Project Site Geology 243
6.6.2 Rock Mass Data 243
6.6.3 Support Predictions Using the RMR and Q Methods 245
6.6.4 Tetrahedral Wedge Stability Analysis 248
6.6.5 The Installed Support 249
6.6.6 Discussion 249
6.6.7 Conclusion 251
6.7 CASE STUDY 5: The Lam Ta Khong Exploratory (LTKE) Tunnel,
Thailand 252
6.7.1 LTKE Project Site Geology 252
6.7.2 LTKE Tunnel Rock Mass data 252
6.7.3 Support Predictions for the LTKE Tunnel Using RMR and Q 254
6.7.4 Rock Instability in the LTKE Tunnel 257
6.7.5 The Actual Support Installed 259
6.7.6 Discussion 260
6.7.7 Conclusion 261
6.8 CASE STUDY 6: The Lam Ta Khong Powerhouse Access
(LTKPA) Tunnel, Thailand 262
6.8.1 Project Site Geology 262
6.8.2 LTKPA Tunnel Rock Mass Data 262
6.8.3 Application of RMR and Q to the LTKPA Tunnel 264
6.8.4 The Support Measures Installed 268
xiii
6.8.4.1 Performance of the Installed Support 270
6.8.5 Assessment of the RMR and Q Derived Support Measures 270
6.8.5.1 Suspended beam analysis 271
6.8.5.2 Tetrahedral rock wedge stability analysis 272
6.8.5.3 Numerical modelling using UDEC 273
6.8.6 Discussion 278
6.8.7 Conclusion 278
6.9 CASE STUDY 7: The Klong Tha Dan (KTD) Project Tunnels,
Thailand 280
6.9.1 Project Site Geology 281
6.9.2 Rock Mass Data Intersected in the Five Tunnels 281
6.9.3 Application of RMR and Q to the KTDP Tunnels 283
6.9.4 Comparison of RMR and Q derived support with those installed 285
6.9.5 Tetrahedral Rock Wedge Analysis 288
6.9.6 Comparison of predicted support pressures 289
6.9.7 Conclusions 292
6.10 CASE STUDY 8: The Namroud Water Resources Project
Diversion (NWRPD) Tunnel, Iran 294
6.10.1 Project Site Geology 294
6.10.2 Rock Mass Data Along the NWRPD Tunnel 295
6.10.3 Excavation Methods and Primary Support Measures Used 296
6.10.4 Application of RMR and Q During Construction 297
6.10.5 Actual Support Installed 300
6.10.6 Discussion 300
6.10.7 Conclusion 301
6.11 CASE STUDY 9: The Boztepe Dam Project Diversion (BDPD)
Tunnel, Turkey 303
6.11.1 Project Site Geology 303
6.11.2 BDPD Tunnel Rock Mass Data 303
6.11.3 Support Predictions Using Classification Methods 306
6.11.4 Tetrahedral Wedge Stability Analysis 307
6.11.5 Numerical Analysis of the BDPD Tunnel 308
6.11.6 Actual Support Installed 309
6.11.7 Discussion 309
xiv
6.11.8 Conclusion 310
6.12 CASE STUDY 10: The Ramboda Pass Highway (RPH) Tunnel,
Sri Lanka 311
6.12.1 Project Site Geology 311
6.12.2 Rock Mass Data 311
6.12.3 Support Predictions by the RMR and Q Methods 313
6.12.4 Tetrahedral Wedge Stability Analysis 315
6.12.5 The Primary Support Measures Installed 316
6.12.5 Permanent Support Measures 317
6.12.6 Discussion 318
6.12.7 Conclusion 318
6.13 Correlation of RMR and Q Values 319
6.13.1 Data analysis 320
6.13.2 Conclusions 322
7.0 CONCLUSIONS AND RECOMMENDATIONS
7.1 Introduction 323
7.2 Conclusions on the RMR System 323
7.3 Conclusions on the Q System 325
7.4 Conclusions Common to Both the RMR and Q Systems 326
7.5 Correlations of the RMR and Q Systems 328
7.6 Recommendations for Future Research 328
REFERENCES 330
APPENDICES:
APPENDIX A:
APPENDIX B:
APPENDIX C:
xv
LIST OF FIGURES
Figure No: Title Page
Figure 2.1 Relationship between intact rock and rock mass 13
Figure 2.2 Example of geological structural features in rock 14
Figure 2.3 Stress-strain curves for brittle, ductile and brittle-ductile
transition 16
Figure 2.4 Relationship between Jr in the Q system and JRC for 200 mm
and 1000 mm samples (after Barton, 1987) 21
Figure 2.5 GSI chart for blocky rock masses 24
Figure 2.6 Potentially unstable tetrahedral rock wedges 30
Figure 2.7 Wedge fall from roof near the portal of an excavation 30
Figure 2.8 Structurally-controlled failure of polyhedral rock blocks 31
Figure 2.9 Wedge failure (a) key wedge (b) progressive failure 31
Figure 2.10 A discrete prism in the crown of an excavation 32
Figure 2.11 A prism failure from the roof of an excavation 33
Figure 2.12 Deflection of roof beam 34
Figure 2.13 Cross-cutting joints and peaked roof formed by beam failure 35
Figure 2.14 Gravity induced rock slab failure 35
Figure 2.15 Jointed rock with compression arch or voussoir beam 36
Figure 2.16 Failure mechanisms of voussoir beam (a) snap-through, (b)
crushing, (c) sliding, (d) diagonal cracking 36
Figure 2.17 Spalling and crushing under high stress 37
Figure 2.18 Rock burst causing failure of the installed support in sidewall 38
Figure 2.19 Strain burst damage on the excavation face 39
Figure 2.20 Spalling rock in the roof held by mesh 40
Figure 2.21 Buckling failure 40
Figure 2.22 Squeezing rock on left wall 41
Figure 2.23 Failure modes in underground excavations in rock 42
Figure 2.24 Unravelling in heavily jointed rock in a intermediate stress
conditions 43
Figure 3.1 Examples of rock mass compositions along a tunnel route 47
xvi
Figure 3.2 Suspended beam support for horizontally layered rock 52
Figure 3.3 Compression arch or voussoir beam in jointed rock 54
Figure 3.4 Rock bolt support for a falling roof wedge 55
Figure 3.5 Rock bolt support for a sliding wedge 56
Figure 3.6 An equal area lower hemisphere stereographic plot of three
joints, which form a tetrahedral wedge in the tunnel roof 57
Figure 3.7 A tetrahedral roof wedge formed by three joints 58
Figure 3.8 An equal area lower hemisphere stereographic plot of three
joints which form a tetrahedral wedge on left wall of a tunnel 59
Figure 3.9 The tetrahedral wedge in the left wall formed by three joints 60
Figure 3.10 The effect of stress on symmetric roof wedge 61
Figure 3.11 UDEC model for four joint sets in a rock mass 64
Figure 4.1 Definition and example application of RQD 74
Figure 4.2 Ratings chart for intact rock strength (IRS) 81
Figure 4.3 Ratings chart for RQD 81
Figure 4.4 Ratings chart for discontinuity spacing 82
Figure 4.5 Chart for correlation of RQD and discontinuity spacing (JS) 82
Figure 4.6 Stand-up time and span relationship for various rock classes 86
Figure 4.7 Q-System support chart 102
Figure 5.1 Tunnel beneath a road cutting which was subsequently
widened 140
Figure 5.2 Modified Q support chart for TBM tunnels (Barton, 2000) 170
Figure 5.3 Q predicted and installed support (after Asche & Cooper, 2002) 172
Figure 5.4 Q support chart for TBM tunnels (Asche and Cooper, 2002) 173
Figure 5.5 RMR-Q correlation with 90% confidence limits
(after Bieniawski, 1976) 175
Figure 5.6 RMR-Q correlation (after Bieniawski, 1989) 178
Figure 6.1 Distribution of joint spacing, aperture size, roughness and RQD
in the CLD tunnel 207
Figure 6.2 Distribution of JC and GW ratings of the CLD tunnel 208
Figure 6.3 Distribution of the Jn, Jr, Ja and Jw ratings of the CLD tunnel 209
Figure 6.4 Indicative groundwater level along the CLD tunnel alignment 213
Figure 6.5 Indicative groundwater level in a CLD tunnel section 214
Figure 6.6 A wedge formed by J3, J5 and J6 with RMR derived rock bolts 216
xvii
Figure 6.7 CLH tunnel discontinuity orientations 221
Figure 6.8 Possible seepage paths from the CLH tunnel 230
Figure 6.9 Displacement vectors showing ground movement at the
surface above the CLH tunnel 231
Figure 6.10 Frequency distribution of RQD in the Central Tunnel 244
Figure 6.11 Spatial distribution of the RMR and Q values along
the Central Tunnel 246
Figure 6.12 Spatial variation of the RMR and Q values along the LTKE
tunnel 254
Figure 6.13 Percentage of RMR and Q classes in the LTKE tunnel 255
Figure 6.14 Modes of rock falls in the LTKE tunnel 258
Figure 6.15 RMR and Q values along the LTKPA tunnel 265
Figure 6.16 The amount of rock in each RMR and Q class (LTKAP tunnel) 266
Figure 6.17 The support installed in the LTKPA tunnel 269
Figure 6.18 Displacement vectors showing potential roof instability 275
Figure 6.19 Displacement vectors showing potential wall instability 275
Figure 6.20 Tensile stress zones on side walls 276
Figure 6.21 Failure of URF shotcrete at Sta. 410 m when k=2 (rock bolts
installed) 277
Figure 6.22 Reduction in failure at Sta. 410 m when mesh reinforcement
was added 277
Figure 6.23 A long section of the KTD dam showing the tunnel locations
(upstream view) 281
Figure 6.24 Percentages of rock mass classes in the KTD tunnels 284
Figure 6.25 Percentages of RMR89, Q74 and actual support classes in
the KTD tunnels 287
Figure 6.26 RMR and Q derived Support pressure for the KTD tunnels 290
Figure 6.27 Q value versus PQ:PRMR ratio in the KTD tunnels 291
Figure 6.28 Proposed and actual excavation and support methods of
the NWRPD tunnel 297
Figure 6.29 Percentage of rock in each relevant class (RPH tunnel) 313
Figure 6.30 RMR and Q correlations for the CLHP, HSHP, LTKP and
KTDP tunnels 320
xviii
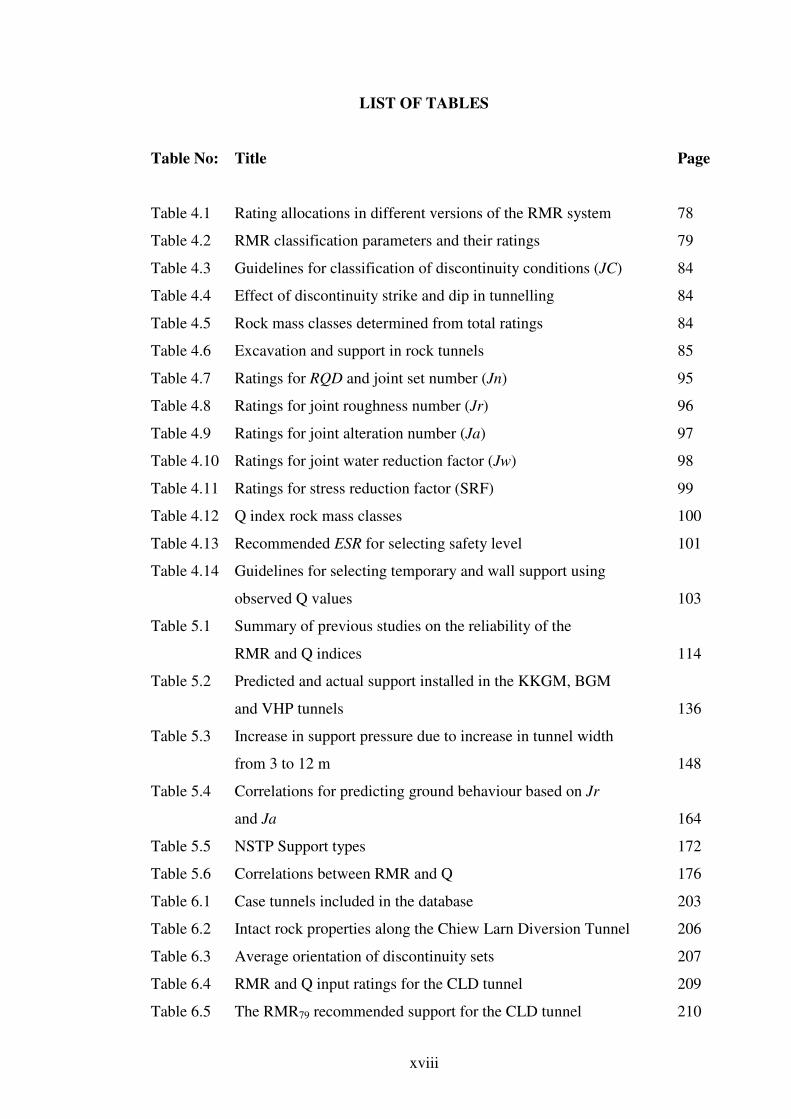
LIST OF TABLES
Table No: Title Page
Table 4.1 Rating allocations in different versions of the RMR system 78
Table 4.2 RMR classification parameters and their ratings 79
Table 4.3 Guidelines for classification of discontinuity conditions (JC) 84
Table 4.4 Effect of discontinuity strike and dip in tunnelling 84
Table 4.5 Rock mass classes determined from total ratings 84
Table 4.6 Excavation and support in rock tunnels 85
Table 4.7 Ratings for RQD and joint set number (Jn) 95
Table 4.8 Ratings for joint roughness number (Jr) 96
Table 4.9 Ratings for joint alteration number (Ja) 97
Table 4.10 Ratings for joint water reduction factor (Jw) 98
Table 4.11 Ratings for stress reduction factor (SRF) 99
Table 4.12 Q index rock mass classes 100
Table 4.13 Recommended ESR for selecting safety level 101
Table 4.14 Guidelines for selecting temporary and wall support using
observed Q values 103
Table 5.1 Summary of previous studies on the reliability of the
RMR and Q indices 114
Table 5.2 Predicted and actual support installed in the KKGM, BGM
and VHP tunnels 136
Table 5.3 Increase in support pressure due to increase in tunnel width
from 3 to 12 m 148
Table 5.4 Correlations for predicting ground behaviour based on Jr
and Ja 164
Table 5.5 NSTP Support types 172
Table 5.6 Correlations between RMR and Q 176
Table 6.1 Case tunnels included in the database 203
Table 6.2 Intact rock properties along the Chiew Larn Diversion Tunnel 206
Table 6.3 Average orientation of discontinuity sets 207
Table 6.4 RMR and Q input ratings for the CLD tunnel 209
Table 6.5 The RMR79 recommended support for the CLD tunnel 210
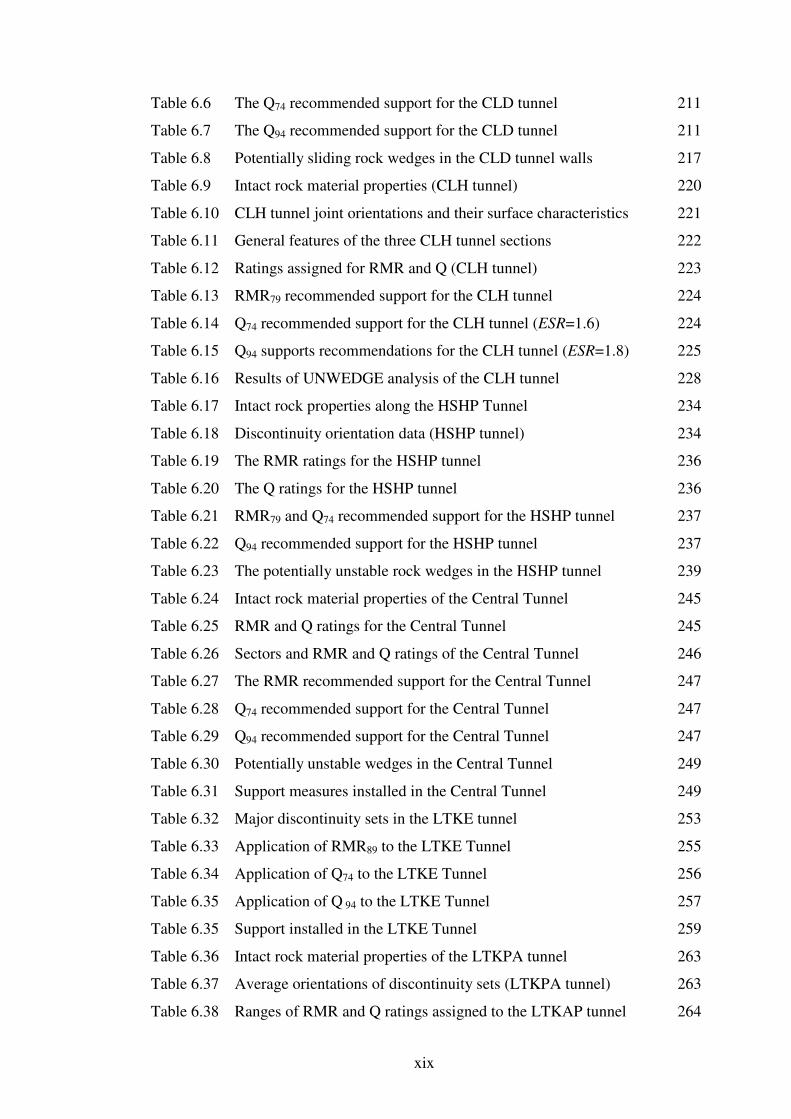
xix
Table 6.6 The Q74 recommended support for the CLD tunnel 211
Table 6.7 The Q94 recommended support for the CLD tunnel 211
Table 6.8 Potentially sliding rock wedges in the CLD tunnel walls 217
Table 6.9 Intact rock material properties (CLH tunnel) 220
Table 6.10 CLH tunnel joint orientations and their surface characteristics 221
Table 6.11 General features of the three CLH tunnel sections 222
Table 6.12 Ratings assigned for RMR and Q (CLH tunnel) 223
Table 6.13 RMR79 recommended support for the CLH tunnel 224
Table 6.14 Q74 recommended support for the CLH tunnel (ESR=1.6) 224
Table 6.15 Q94 supports recommendations for the CLH tunnel (ESR=1.8) 225
Table 6.16 Results of UNWEDGE analysis of the CLH tunnel 228
Table 6.17 Intact rock properties along the HSHP Tunnel 234
Table 6.18 Discontinuity orientation data (HSHP tunnel) 234
Table 6.19 The RMR ratings for the HSHP tunnel 236
Table 6.20 The Q ratings for the HSHP tunnel 236
Table 6.21 RMR79 and Q74 recommended support for the HSHP tunnel 237
Table 6.22 Q94 recommended support for the HSHP tunnel 237
Table 6.23 The potentially unstable rock wedges in the HSHP tunnel 239
Table 6.24 Intact rock material properties of the Central Tunnel 245
Table 6.25 RMR and Q ratings for the Central Tunnel 245
Table 6.26 Sectors and RMR and Q ratings of the Central Tunnel 246
Table 6.27 The RMR recommended support for the Central Tunnel 247
Table 6.28 Q74 recommended support for the Central Tunnel 247
Table 6.29 Q94 recommended support for the Central Tunnel 247
Table 6.30 Potentially unstable wedges in the Central Tunnel 249
Table 6.31 Support measures installed in the Central Tunnel 249
Table 6.32 Major discontinuity sets in the LTKE tunnel 253
Table 6.33 Application of RMR89 to the LTKE Tunnel 255
Table 6.34 Application of Q74 to the LTKE Tunnel 256
Table 6.35 Application of Q 94 to the LTKE Tunnel 257
Table 6.35 Support installed in the LTKE Tunnel 259
Table 6.36 Intact rock material properties of the LTKPA tunnel 263
Table 6.37 Average orientations of discontinuity sets (LTKPA tunnel) 263
Table 6.38 Ranges of RMR and Q ratings assigned to the LTKAP tunnel 264
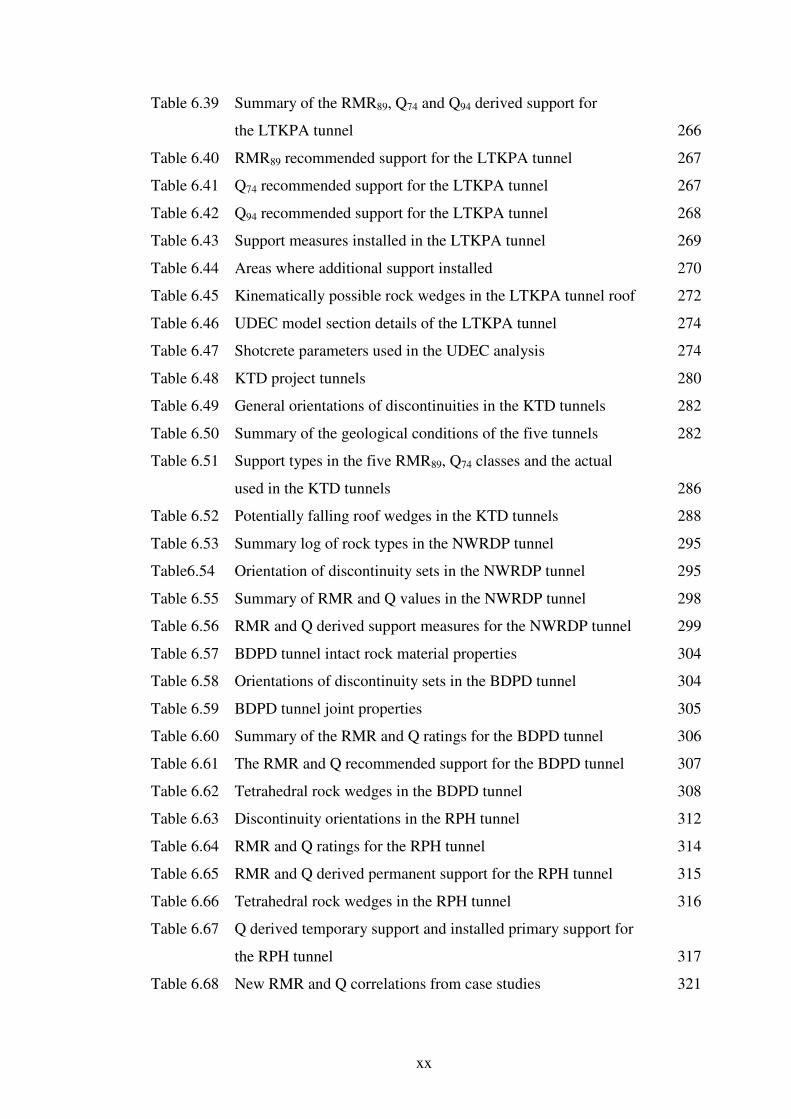
xx
Table 6.39 Summary of the RMR89, Q74 and Q94 derived support for
the LTKPA tunnel 266
Table 6.40 RMR89 recommended support for the LTKPA tunnel 267
Table 6.41 Q74 recommended support for the LTKPA tunnel 267
Table 6.42 Q94 recommended support for the LTKPA tunnel 268
Table 6.43 Support measures installed in the LTKPA tunnel 269
Table 6.44 Areas where additional support installed 270
Table 6.45 Kinematically possible rock wedges in the LTKPA tunnel roof 272
Table 6.46 UDEC model section details of the LTKPA tunnel 274
Table 6.47 Shotcrete parameters used in the UDEC analysis 274
Table 6.48 KTD project tunnels 280
Table 6.49 General orientations of discontinuities in the KTD tunnels 282
Table 6.50 Summary of the geological conditions of the five tunnels 282
Table 6.51 Support types in the five RMR89, Q74 classes and the actual
used in the KTD tunnels 286
Table 6.52 Potentially falling roof wedges in the KTD tunnels 288
Table 6.53 Summary log of rock types in the NWRDP tunnel 295
Table6.54 Orientation of discontinuity sets in the NWRDP tunnel 295
Table 6.55 Summary of RMR and Q values in the NWRDP tunnel 298
Table 6.56 RMR and Q derived support measures for the NWRDP tunnel 299
Table 6.57 BDPD tunnel intact rock material properties 304
Table 6.58 Orientations of discontinuity sets in the BDPD tunnel 304
Table 6.59 BDPD tunnel joint properties 305
Table 6.60 Summary of the RMR and Q ratings for the BDPD tunnel 306
Table 6.61 The RMR and Q recommended support for the BDPD tunnel 307
Table 6.62 Tetrahedral rock wedges in the BDPD tunnel 308
Table 6.63 Discontinuity orientations in the RPH tunnel 312
Table 6.64 RMR and Q ratings for the RPH tunnel 314
Table 6.65 RMR and Q derived permanent support for the RPH tunnel 315
Table 6.66 Tetrahedral rock wedges in the RPH tunnel 316
Table 6.67 Q derived temporary support and installed primary support for
the RPH tunnel 317
Table 6.68 New RMR and Q correlations from case studies 321
1
CHAPTER 1
INTRODUCTION
1.1 Background
Rock mass classification methods constitute an integral part of empirical design tools
used in rock engineering, particularly in underground excavation support design and
construction. They have always played an important role in predicting support
requirements for excavations. The main reason for their application in underground
excavation design can be directly related to the following:
o Rock, being a complex material with widely varying properties, presents
unique design and construction problems that are not common in other
engineering materials.
o Engineering excavations in rock, underground excavations in particular, often
intersect more than one rock type, each with its own range of properties.
o Determination of the exact engineering properties of rock masses involved in
an excavation project is virtually impractical, even with the sophisticated
tools and techniques available at present.
o The stress field in a rock is governed by both the weight of the overlying
rocks and several other factors including geological structure, the tectonic
forces and geological history of the rock, and is often difficult to determine
accurately.
Put simply, underground excavations are often planned and made in an environment
with widely varying engineering properties and loading conditions that are not easily
determinable with the currently available tools and techniques.
To undertake engineering design tasks in such complex and unknown environments,
it is possible to apply theoretical solutions developed based on rock mechanics
principles. However, this usually requires a considerable level of simplification of
the environment by making simplifying assumptions. This means the theoretical
2
solutions do not necessarily guarantee an accurate representation of the environment,
unless a detailed and rigorous sensitivity analysis is undertaken taking into account
its inherent variability, i.e. variation in rock mass properties, groundwater conditions
and stresses in the rock mass. Such detailed assessments require access to accurate
information on rock mass properties, groundwater and in situ stress conditions,
together with high levels of experience and skills in the application of the theoretical
methods. Further, these assessments are time consuming and costly.
In contrast, the empirical design methods based on rock mass classifications systems
provide quick assessments of the support requirements for underground excavations
at any stage of a project, even if the available geotechnical data are limited.
Compared to the analytical methods the empirical methods do not require high levels
of skills. Thus, unlike other disciplines of engineering such as structural or
mechanical where engineering material properties and loading conditions are fairly
well understood and can be controlled, the underground excavation industry tends to
lean on empirical approaches such as rock mass classification methods, which
provide a rapid means of assessing rock mass quality and support requirements.
To meet the industry’s demand for rapid assessments of rock mass quality and
support requirements for excavations, over the years, several classification methods
have been developed. Two methods known as Rock Mass Rating (RMR) and
Tunnelling Quality Index (Q), introduced by Bieniawski (1973) and Barton et al.
(1974), respectively, have stood out. They are easy to use and can be applied from
the preliminary planning stage through to the construction stage of a project.
Applied within their limitations they serve as excellent means of communication
between all parties involved in an underground excavation project. When used in
conjunction with other applicable design methods, they are useful design tools,
particularly in the early stages of a project.
Since their introduction some three and half decades ago, these two methods have
been applied to various underground excavation projects throughout the world,
particularly to rock masses and projects that are closely related to the conditions and
circumstances for which these methods were originally developed, and a plethora of
technical papers have been published on their successful application. The
3
information provided in these publications is useful not only to users of the
classification systems, but also to their creators. Much of this information has
subsequently been added to the databases used in developing the classification
systems so as to revise and improve them. Despite these, the two methods are known
to have limitations, some of which have been reported by Einstein et al. (1983);
Kaiser et al. (1986); Speers (1992); Palmstrom et al. (2000); Peck (2000); Stille &
Palmstrom (2003); Palmstrom & Broch (2006): and Pells and Bertuzzi (2008).
In fact, the reliability of tunnel support designed using these methods has long been a
subject of considerable debate. However, attempts to evaluate their reliability in a
systematic manner have been few and far between and publications on case studies in
which these methods are of limited use are at best rare. Hence the available literature
on rock mass classification systems is somewhat biased towards their successful
applications while case histories in which they are unsuccessful are not given much
attention and are seldom reported. In this background, among some practitioners of
rock engineering, there has been a tendency to overly rely on these methods without
due regard for their limitations, and this could (and has) lead to potentially disastrous
consequences in underground excavations. In recognition of the seriousness of this
injudicious tendency, several eminent experts in the field of rock engineering have
cautioned rock engineering practitioners by making the following comments:
“In essence, rock mass classifications are not to be taken as a substitute for
engineering design. They should be applied intelligently and used in
conjunction with observational and analytical studies to formulate an overall
design rationale compatible with the design objectives and site geology.”
- Bieniawski (1989) -
“The use of empirical design methods such as the RMR method and the Q
method will lead to under designs, particularly with regard to the capacity of
the bolts.”
- Speers (1992) -
4
“It is important to understand that the use of a rock mass classification
scheme does not (and cannot) replace some of the more elaborate design
procedures.”
- Hoek, Kaiser and Bawden (1995) -
"… none of the techniques has any solid scientific foundation and can quite
clearly be dangerously misleading, if the potential failure mechanism is not
identified within the classification system."
- Hudson and Harrison (1997) -
“Neither the Q nor RMR systems apply to all rock masses. It is important
that practitioners know what behaviour and what types of ground are covered
by the classification system and that they become familiar with its database.”
- Palmstrom, Milne and Peck (2000) -
“The classification scheme approach does not always fully evaluate
important aspects of a problem, so that if blindly applied without any
supporting analysis of the problem, it can lead to disastrous results.”
- Brady and Brown (2004) -
“… Classification systems, and not least the Q system, may be useful tools
for estimating the need for tunnel support at the planning stage, particularly
for tunnels in hard rock and jointed rock masses without overstressing. There
are, however, a number of restrictions that should be applied if and when the
system is going to be used in other rock masses and in complicated ground
conditions. So far such restrictions have not been much discussed in
available literature.”
- Palmstrom and Broch (2006) -
5
“… the design correlations published in the various papers on the Q and
RMR systems should be used with great caution in geological environments
significantly different from those comprising the original case studies.”
- Pells and Bertuzzi (2008) -
In spite of clear warnings, some practitioners continue to use rock mass classification
methods as the sole method of support design for underground excavations. This
may be partly attributed to the fact that, up to now, as pointed out by Palmstrom and
Broch (2006), efforts to identify the limitations of the rock mass classification
methods on a systematic basis have been limited. It is in this background that this
research aims to contribute to a more detailed understanding of the limitations of the
most commonly used rock mass classification systems at present. This
understanding can lead to the development of improved guidelines for more reliable
ways of applying the classification methods for design purposes and to form
recommendations on where they have their best applications. The findings of this
research provide insight for future research on this subject and are one step towards a
more rationally based application of rock mass classification methods.
1.2 Objective and Scope of Work
The fundamental objective of this research was to assess the reliability of rock mass
classification systems used for underground excavation support design. The study
focused on the most widely used rock mass classification systems, RMR and Q, and
their reliability when applied to tunnels excavated in jointed rock formations. More
specifically, the objective of the research was to examine the reliability of the two
classification systems under different jointed rock formations and project conditions,
suggest improvements, if necessary, and highlight their limitations so that caution
can be exercised when using them for underground excavation design.
The scope of the research was to fulfil the above mentioned objectives by applying
the two classification methods to several case tunnels and compare their predictions
with those of other relevant methods. Rock mass and project data for the application
6
of the two methods were obtained from the published and unpublished literature and
from study visits to underground excavations. More specifically, the scope of the
research was to:
o Compile and review previous studies on the reliability of the two
classification methods.
o Compare and evaluate the support requirements predicted by one
classification method with those of the other.
o Compare the support requirements predicted by the two classification
methods with those of the other methods applicable to jointed rocks.
o Evaluate the support predicted by the classification methods against the
performance of the support installed in excavations.
o Compare the RMR and Q predicted support pressures with each other.
o Examine whether a reliable correlation exists between the two methods so as
to confirm that the two methods lead to similar conclusions regarding the
rock mass quality and the support predictions. If a reliable correlation exists
the ratings of one classification method can be transformed to those of the
other.
o Draw conclusions based on the findings of the research and highlight the
limitations of the classifications and where they have their best applications.
The tasks undertaken for this research included a review of instability in
underground excavations, an overview of the underground excavation support design
methods, a literature review on the development, application and evaluation of the
two rock mass classification methods, application of the two methods to several case
tunnels, comparison of the support predicted by the two methods with those
predicted by the analytical methods, followed by a comparison of the support
predicted by the two methods with the support installed in the excavations.
7
In order to assess the adequacy of the support predicted by the classification
methods, two analytical approaches were used to determine support requirements for
the case tunnels. The two approaches were limit equilibrium analyses of rock block
stability and numerical simulation of the rock mass behaviour around the tunnel.
The study covers the application of the RMR and Q methods to permanent
excavations such as tunnels constructed for infrastructure development as well as
access declines, drifts and drives excavated for mining mineral deposits.
Applications of these methods to large mine openings such as stope voids, which are
usually abandoned immediately after the extraction of ore, are not dealt with in this
thesis.
1.3 Significance
The significance of this research is it highlights on a scientific basis some of the
limitations of the two rock mass classification methods and provides a list of
practical examples where these methods are of only limited use. On the basis of the
findings of the research, rock engineering practitioners can avoid misuse and/or
incorrect application of these methods for underground excavation support design.
1.4 Research Approach
The method of this research was case study driven. It was considered that, under a
given set of conditions, the reliability of the classification methods derived support
can be assessed by comparing them with those derived by other applicable methods
and also with the actual support installed. It was also considered that such an
assessment can be carried out more efficiently during excavation of an underground
opening by close observation and monitoring of the intersected ground conditions.
In this context, the geotechnical data obtained during the construction of several case
tunnels were reviewed and the two classification methods were applied. The
effectiveness of the support measures predicted by the two methods was then
8
evaluated against the potential failures that can be predicted by some of the
applicable theoretical methods. Both structurally controlled gravity driven failures
and stress induced failures in jointed rocks were considered. The structurally
controlled gravity driven failures were analysed using limit equilibrium methods of
analysis and stress controlled failures were analysed using the numerical approach.
The structurally controlled failure modes considered in this study were tetrahedral
rock wedges formed by three intersecting joints and the free surface of the
excavation. Tetrahedral wedge analysis was undertaken using UNWEDGE software
code (Rocscience, 2003), based on the block theory proposed by Goodman and Shi
(1985). UNWEDGE provides an effective means of identifying all possible tetrahedral
wedges in a rock mass, provided discontinuity orientations are known. The stability
of kinematically unstable tetrahedral rock wedges identified in the rock mass is then
assessed by limit equilibrium analysis, and the support measures required to stabilise
potentially unstable rock wedges are then determined. The UNWEDGE analysis
assumes that the geological discontinuities are ubiquitous. This is justifiable because
the application of the two rock mass classification methods also assumed that the
joints were ubiquitous in each sector (or structural domain) of the case tunnels.
Beam failure was also analysed when horizontally bedded or laminated rocks were
intersected in the case tunnels. Beam analysis was undertaken using suspended beam
concept presented by Stilborg (1994) and Brady and Brown (2004).
For numerical simulation of the rock mass behaviour around the case tunnels, the
two dimensional software package Universal Distinct Element Code (UDEC) (Itasca,
2004), based on the distinct element method, was used in which a rock mass is
represented as an assembly of discrete blocks and discontinuities are viewed as
interfaces between distinct bodies. UDEC simulates the response of jointed rock
masses subjected to either static or dynamic loading and allows modelling of rock
mass failure along discontinuities as well as through intact rock material.
The outcomes were developed by analysis of a case study database consisting of data
representing approximately 7000 m of tunnels from ten projects in five different
countries.
9
1.5 Structure of the Thesis
This thesis is divided into seven chapters as outlined below:
o Chapter 1 presents an introduction to the research highlighting the
background, objectives, scope and methodology, and briefly outlines the
structure of the thesis.
o Chapter 2 presents a discussion on the modes and mechanisms of instability
in underground openings in rock.
o Chapter 3 outlines the support design methods available for preventing rock
instability in underground excavations.
o Chapter 4 presents a brief review of the rock mass classification methods.
Detailed discussions are presented on the structure of RMR and Q
classification methods and their modifications.
o Chapter 5 reviews the previous studies on the reliability of the RMR and Q
classification methods. These studies include previous applications,
evaluations and correlation of the two methods.
o Chapter 6 presents the details of the application of the two classification
methods and selected analytical methods to case studies.
o Chapter 7 presents the conclusions drawn from the present study and
recommendations for future research.
10
CHAPTER 2
INSTABILITY IN UNDERGROUND EXCAVATIONS
2.1 Underground Excavations in Rock
Underground excavations in rock have played an important role in the development
of human civilisations throughout the world. According to Bieniawski (1984) the
oldest known underground mine in the world, Bomvu Ridge in Swaziland in South
Africa, was in operation before 40 000 B.C. Here Neanderthal Man mined hematite,
literally “blood stone”, which due to its colour was much prized for burial rites and
personal decoration. Detailed accounts of historical developments in tunnelling
provided by Sandstrom (1963), Beaver (1972) and Bieniawski (1984) indicate that
underground excavations have been used for various purposes throughout recorded
human history, and some have stood in serviceable conditions for several centuries.
At present, the uses of underground space in rock are many, varying from simple
stand-alone openings for exploration to large complexes of interconnected openings
in three dimensions for commercial and public facilities and for mining underground
ore bodies. Several different types of excavations are in use including tunnels,
shafts, caverns, and stopes etc, the first being the most common.
Today, underground openings are made for both infrastructure development (civil
applications) and the extraction of economically valuable mineral deposits (mining
applications). In civil applications the most common excavations are tunnels
constructed for highways, railways, water conveyance, sewer discharge, and utility
corridors etc. Tunnels built for civil applications may be short and shallow beneath
valley sides or urban areas (e.g. for roads, sewage etc), or very long and deep
structures underneath major mountains or below the ocean floor. Caverns are also
commonly used in civil applications for power stations, train and bus stations,
shopping and sporting complexes, defence chambers, oil and gas storage facilities
and nuclear waste repositories etc. Caverns of up to 62 m span are in use for public
sporting facilities in Norway (Bhasin et al., 1993; Barton et al., 1994) and shafts are

11
used for the access and ventilation of other subsurface openings and water supply to
underground power stations etc throughout the world.
In mining applications, there are two main types of underground openings: (a) those
that are intended to be stable while the ore is extracted from a particular area of a
mine or during the operating life the mine, and (b) those that are created to produce
broken-rock (ore) that is drawn off as the ground caves. The first type of
excavations in mining includes tunnels and shafts to gain access to ore bodies and
caverns for underground workshops, crib rooms, refuge chambers, temporary
stockpiling of broken ore, and storage of explosives and other consumables for
mining operations. The second type includes various forms of stopes created to
produce broken-rock for subsequent removal from the mine. Some of these are
backfilled with mine waste while others are left open for ever. In general, stopes can
be abandoned once the extraction of ore is complete. In contrast, the tunnels, shafts
and caverns are important infrastructure and must remain open for their expected
operating life.
With such a vast range of underground excavations, many different kinds of
construction and user requirements need to be addressed for successful design of a
project. However, there are certain features common to all underground excavations
in rock. One of the key features is that the rock within which an excavation is to be
made is not usually accessible or directly observable until the construction is in
progress. Often the designer will have to begin deliberations from information
acquired from exploratory drill holes, shafts and galleries, which usually represent
only a very small part of the conditions likely to be encountered in a project.
Occasionally, when an existing installation is expanded it is possible to begin by
direct observations at the site. There are other common features as well. Rock in
which underground openings are constructed is initially stressed and openings cause
changes in the stress field. Further, rocks often have pre-existing weakness planes or
zones, along which rock block can move against each other after the creation of
openings. Regardless of the purpose of the excavations, the effects of such features
on them are generally similar, if not identical. The modes of rock instability and the
mechanisms involved are common to all excavations depending on the condition of
the rock and the excavation shape and dimensions.
12
In spite of the common features mentioned above, civil excavations generally differ
from mining excavations. Often the location of mining excavations is fixed in and
around the ore body to be mined. The location of a civil excavation on the other
hand may be adjusted for convenience or economic reasons. Usually, the operating
lives of civil excavations are much longer than those of mining excavations. Mining
excavations are generally accessed only by a small number of individuals who are
specifically trained to work in that environment and are familiar with the problems
such as rock falls in underground excavations. In contrast, civil excavations are
often used by the general public and others who are not skilled to deal with rock
instability problems in underground excavations. The foremost difference is that the
consequences of rock instability in civil excavations are vastly different to those of
mining excavations. In a civil tunnel constructed for a major railway, for example,
rigorous measures are required to prevent instability during its operating life,
whereas in a mining excavation some instability may be tolerable providing that the
condition of the excavation is inspected and assessed before entering. This is
possible in mining projects because the regular users of these excavations are trained
to do so.
2.2 Intact Rocks and Rock Masses
Rock is an assemblage of minerals formed by various geological processes in the
earth’s crust. The composition of mineral constituents in a rock can vary widely and
their texture can be crystalline, fine grained or clastic. On the basis of mineralogy
and texture, rocks can be divided into different groups but from a genesis point of
view, they are divided into three main groups: igneous, metamorphic and
sedimentary.
Rock usually contains geological structural features such as joints, beddings,
foliations and faults etc which subdivide it into discrete blocks of different sizes and
shapes. These structural features, also known as discontinuities or defects, possess
the common characteristics of low shear strength and negligible tensile strength
compared to the surrounding rock material. For engineering purposes the solid rock
material bounded by various discontinuities is termed “intact rock” material. Intact
13
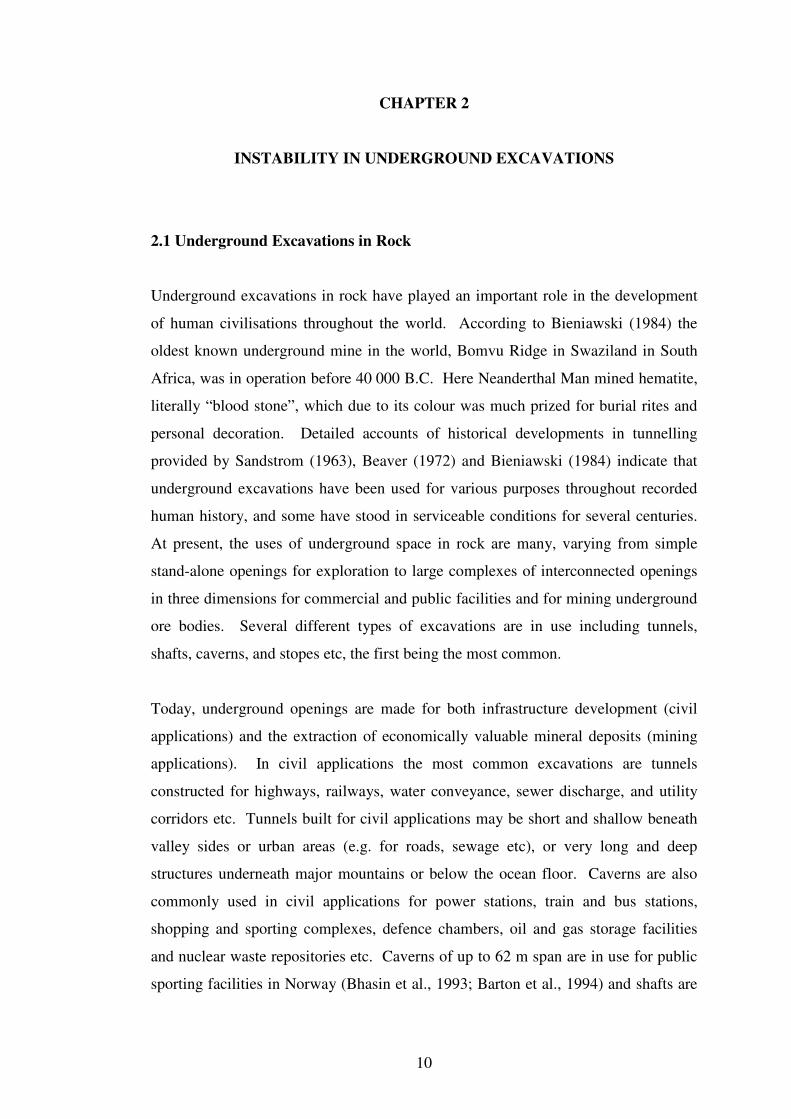
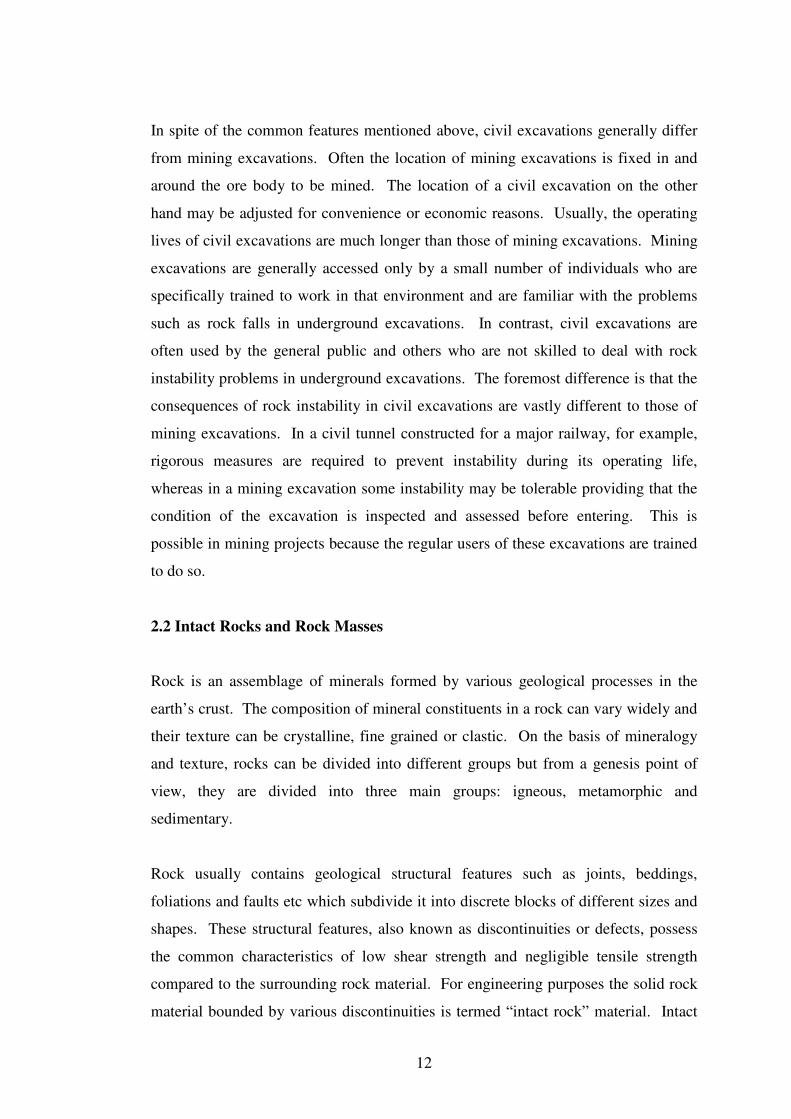
rock pieces may range from several cubic millimetres to several cubic meters in size
and their behaviour is generally elastic and isotropic. Rock when taken together with
the discontinuities and their inherent characteristics is defined as the “rock mass”.
Figure 2.1, modified after Hoek and Brown (1980a), schematically illustrates the
transition from intact rock to a heavily jointed rock mass.
Figure 2.1 Intact rock and rock mass (modified after Hoek and Brown, 1980a)
2.3 Geological Structural Features
Rock masses invariably include numerous structural features or discontinuities
formed from a wide range of geological processes, the most common of which
present in a rock mass are joints, beddings, foliations and faults. Joint is a plane of
weakness or break in the continuity of a body of rock along which there has been
little or no displacement. Joints may be tightly healed or open with an aperture
(opening) of a fraction of a millimetre to several centimetres. The joint openings
may contain infill materials weaker than the parent rock. Faults are planes of shear
failure with obvious signs of movement of the rock on either side of the plane. Fault
surfaces are often striated and polished resulting from the shear displacement and the
fault openings can be several millimetres to several meters wide. Faults usually
contain crushed rock and clayey gouge. Bedding and foliation partings are planer
features of significant surface extent in sedimentary and metamorphic rocks,
respectively, and are created by a change in the size, orientation, shape or
composition of the constituent mineral grains. These changes occur during the
genesis of the sedimentary and metamorphic rocks. There are other structural
14
features such as fractures, fissures, flow bands, shears and cleavage etc depending on
the origin, mineralogy and geological history of a rock mass. Since joints are by far
the most common geological structure, the term “joint” is sometimes used to include
all types of discontinuities in a rock. From an engineering point of view the
discontinuity orientation, persistence and spacing as well as their surface
characteristics such as roughness, aperture, infilling material and waviness are of
paramount importance, as these properties govern the strength and engineering
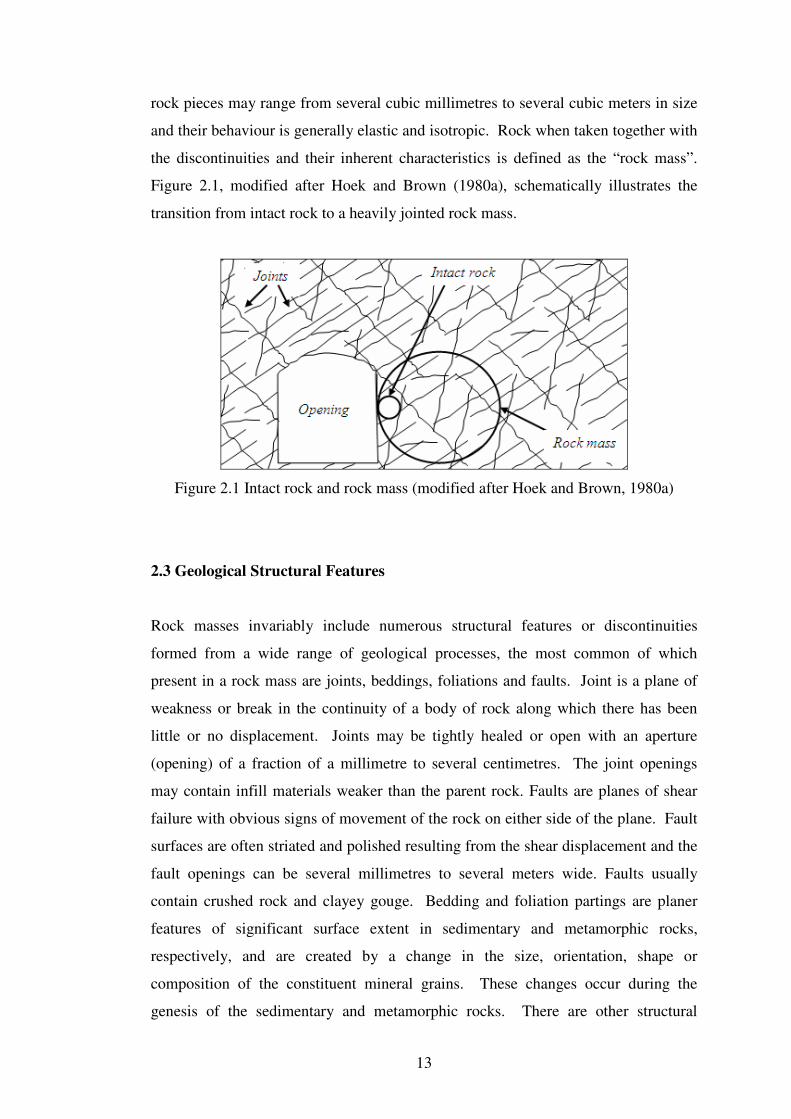
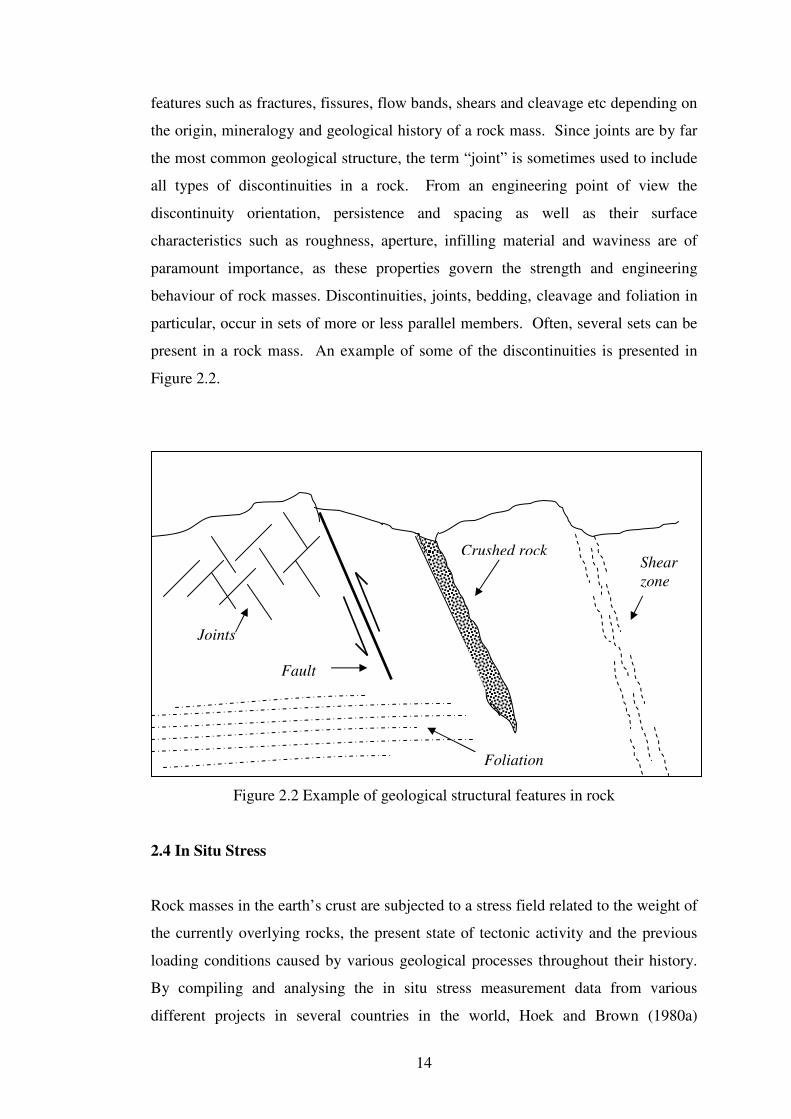
behaviour of rock masses. Discontinuities, joints, bedding, cleavage and foliation in
particular, occur in sets of more or less parallel members. Often, several sets can be
present in a rock mass. An example of some of the discontinuities is presented in
Figure 2.2.
Figure 2.2 Example of geological structural features in rock
2.4 In Situ Stress
Rock masses in the earth’s crust are subjected to a stress field related to the weight of
the currently overlying rocks, the present state of tectonic activity and the previous
loading conditions caused by various geological processes throughout their history.
By compiling and analysing the in situ stress measurement data from various
different projects in several countries in the world, Hoek and Brown (1980a)
Joints
Shear
zone
Fault
Crushed rock
Foliation
15
observed that in general, the vertical stress component is related to the depth below
surface. This is, however, not always the case due to the presence of structural
features such as faults and folds, or local variations in rock material properties. It has
also been observed that the ratio of the average of the horizontal stress components
to the vertical stress varies with depth. At shallow depths the ratio is extremely
variable and frequently greater than unity (Brady and Brown, 2004). With increasing
depth, variability of the ratio decreases and approaches unity. Hudson and Harrison
(1997) and Brady and Brown (2004) noted that several factors contribute to changes
in the state of stress in a rock mass. These include surface topography, surface
erosion, residual stresses, thermal effects, inclusions, tectonic stress and
discontinuities. Often in discontinuous or jointed rocks, a highly variable stress
distribution can be present. It should be mentioned here that as pointed out by Brady
and Brown (2004), the virgin state of stress in a rock mass is not amenable to
calculation by any known method, but must be determined experimentally.
2.5 Strength and Deformability of Rock Masses
As discussed in the preceding sections, a rock mass consists of intact rock material
and naturally occurring discontinuities subjected to an initial state of stress. When an
opening is created in a rock mass, the virgin state of stress is disturbed and a new
stress field is induced. Further, the discrete blocks formed by the discontinuities,
which were perfectly fitted and interlocked before the creation of the opening, may
now be free to move or rotate. Depending on the induced stress magnitude and the
degree of kinematical feasibility of discrete rock block movement, the behaviour of
the rock mass surrounding the opening is governed by mechanical properties of the
intact rock material or the individual discontinuities, or by the combination of the
two. It is, therefore, important to understand the mechanical properties of intact rock
materials, discontinuities and also of the jointed rock mass as a single composite
system.
2.5.1 Strength and deformation of intact rock
Throughout the history of rock mechanics, samples of intact rock material have been
tested under a variety of laboratory conditions and there is a vast amount of
16
information on almost every aspect of intact rock behaviour. From the wealth of
available information it has been known for several decades that the strength of intact
rock increases with increasing confinement. Under unconfined or low confining
stresses, strong intact rock suffers brittle failure, which may occur suddenly and
catastrophically with little or no permanent deformation before failure. When
confining pressures are high, the material can sustain permanent deformation without
losing its ability to resist load. Failure of intact rock in this manner is said to be
ductile. Ductility of competent rock increases with increasing confining pressures,
but can also occur in weathered rocks, some weak rocks and heavily jointed rock
masses under moderate stress. Between fully brittle and fully ductile behaviour,
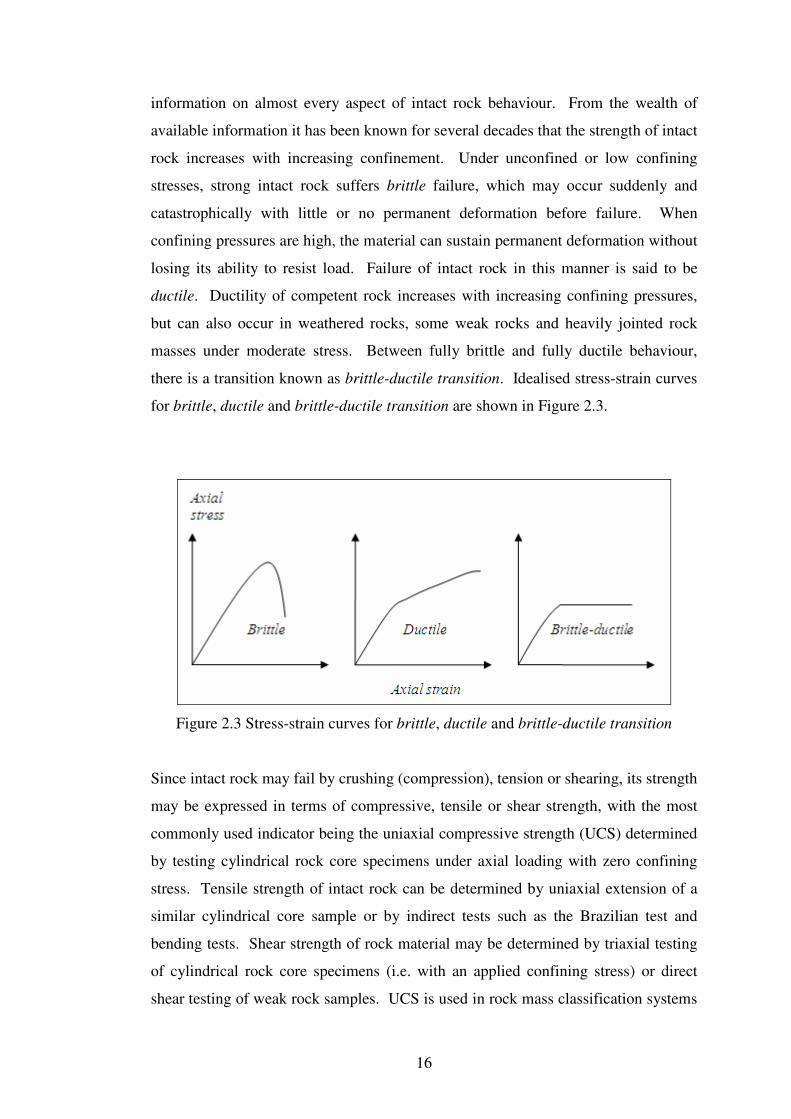
there is a transition known as brittle-ductile transition. Idealised stress-strain curves
for brittle, ductile and brittle-ductile transition are shown in Figure 2.3.
Figure 2.3 Stress-strain curves for brittle, ductile and brittle-ductile transition
Since intact rock may fail by crushing (compression), tension or shearing, its strength
may be expressed in terms of compressive, tensile or shear strength, with the most
commonly used indicator being the uniaxial compressive strength (UCS) determined
by testing cylindrical rock core specimens under axial loading with zero confining
stress. Tensile strength of intact rock can be determined by uniaxial extension of a
similar cylindrical core sample or by indirect tests such as the Brazilian test and
bending tests. Shear strength of rock material may be determined by triaxial testing
of cylindrical rock core specimens (i.e. with an applied confining stress) or direct
shear testing of weak rock samples. UCS is used in rock mass classification systems
17
and as a basic parameter in the rock mass strength failure criterion to be discussed
later in this section and in Section 2.5.3.
For analysing the stability of underground excavations that are subjected to medium
to high stress regimes it is also important to understand and be able to predict the
response of the rock under confining stresses. Two other important mechanical
properties of rock material which influence the response of a rock under stress are
elastic constants, i.e. Young’s modulus (static modulus of elasticity) E, and Poisson’s
ratio ν. These are measured during UCS tests and the methods used are identical to
those used for concrete samples.
The strength of intact rock under different loading conditions can be described by the
Coulomb criterion or Griffith criterion, discussed in detail by Jaeger (1972) and
Jaeger and Cook (1976), with the Coulomb failure criterion being the most widely
accepted of the two. The Coulomb shear strength criterion expresses the relation
between the shear stress and the normal stress at failure. The shear strength τ that can
be developed on a failure plane through the intact rock is given as
τ = c + σn tan Φ (2.1)
where, c is cohesion, σn is the normal stress acting on the failure plane, and Φ is the
angle of internal friction. By stress transformation the uniaxial compressive strength
σc and tensile strength σt of the rock material can also be related to the shear strength
as given below:
)2.2(sin1
cos2
φ
φσ
−=
cc
)3.2(sin1
cos2
φ
φσ
+=
ct
The Griffith crack criterion expresses the uniaxial tensile strength, σt, in terms of the
strain energy required to propagate micro-cracks, and expresses the UCS in terms of
the tensile strength. The formula for tensile failure is
18
σt = (2Eα/πC)0.5
(2.4)
where, E is the Young’s modulus of the uncracked material, α is the surface energy
per unit area of the crack surface, C is half the initial crack length. This criterion can
also be expressed in terms of the shear stress and normal stress acting on the plane
containing the major axis of the crack, but it does not lend itself to accurately predict
the uniaxial compressive strength of rock material. The Griffith crack theory has
been modified by several researchers to overcome its limitations and comprehensive
discussions on these modifications are provided by Jaeger (1972) and Jaeger and
Cook (1976). Despite its modifications the theory is not in wide use at present.
Following on from the Griffith theory, Hoek and Brown (1980a, 1980b) proposed an
empirical failure criterion for rock, Hoek-Brown failure criterion, based on a review
of published information on intact rock strength and a trial and error search for a
relationship that best describes the response of a rock to the principal stresses acting
on it. Based on experience using this criterion on a number of projects, an updated
version was presented by Hoek and Brown (1988) and a modified criterion was
published by Hoek et al. (1992). The criterion for intact rock expressed in effective
stress terms (Hoek et al., 1995) is
)4.2(12
1
'
3'
3
'
1
++=
c
ic mσ
σσσσ
where, σ1’ is the major principal effective stress, σ3
’ is the minor principal effective
stress, σc is the uniaxial compressive strength of intact rock, mi is a material constant
for the intact rock. In the original version of the criterion, for intact rock σc and mi
are determined by linear regression analysis of the results of triaxial tests. For
situations where triaxial testing programmes are prohibitive, σc and mi are estimated
from the tables, which relate σc and mi to rock types based on the analysis of
published strength data. The relevant tables are provided by Hoek et al. (1995);
Marinos and Hoek (2001) and Hoek (2009).
19
2.5.2 Strength and stiffness of discontinuities
For most practical rock engineering work, it is generally assumed that discontinuities
have zero or negligible tensile strength and that it is the shear strength of the
discontinuities that is important. In discontinuous rock masses, conditions for rock
blocks sliding along discontinuities are governed by the shear strength. The shear
strength of planar discontinuities can be described by the Coulomb shear strength
criterion given in equation 2.1. However, it is generally assumed that the shear
strength of discontinuities is a function of the angle of friction only rather than both
the friction and cohesion, and the Coulomb equation is reduced to that given in
equation 2.5:
τ = σn tan Φ (2.5)
Since discontinuities are not perfectly planar and are often wavy and have surface
roughness (asperities), the Coulomb criterion has some limitations. When sheared at
low normal loading conditions, the roughness causes the discontinuity surface to
dilate (or ride up on the asperities) giving an additional frictional component.
According to Patton (1966) this additional friction can be approximated to the
asperity angle i and the shear strength is then expressed in terms of total friction as
given by
τ = σn tan (Φb+i) (2.6)
where, Φb is basic friction angle of the surface and i is the asperity angle measured
from the horizontal. This equation is valid at low normal stresses, but at high normal
stresses the discontinuity opening will be tightly closed and asperities tend to break
off resulting in a shear strength behaviour which is more closely related to the intact
material strength than to the frictional characteristics of the surface. The effects of
discontinuity roughness and waviness were further studied and different failure
criteria have been proposed by several workers including Ladanyi and Archambault
(1970), Jaeger (1971), McMahon (1985) and Papaliangas et al. (1996). These
criteria have their own merits and limitations.
20
Barton (1976) and Barton and Choubey (1977) proposed that the Coulomb equation
modified by Patton (1966) can be further modified to include discontinuity surface
roughness and compressive strength of the discontinuity wall rock and rewritten as
given below:
τp = σn tan { Φb + JRC Log10(JCS/σn)} (2.7)
where τp is joint shear strength; σn is joint normal stress; Φb is basic (or residual)
friction angle of intact rock material; JRC is joint roughness coefficient; and JCS is
joint compressive strength. JRC is a number representing the discontinuity surface
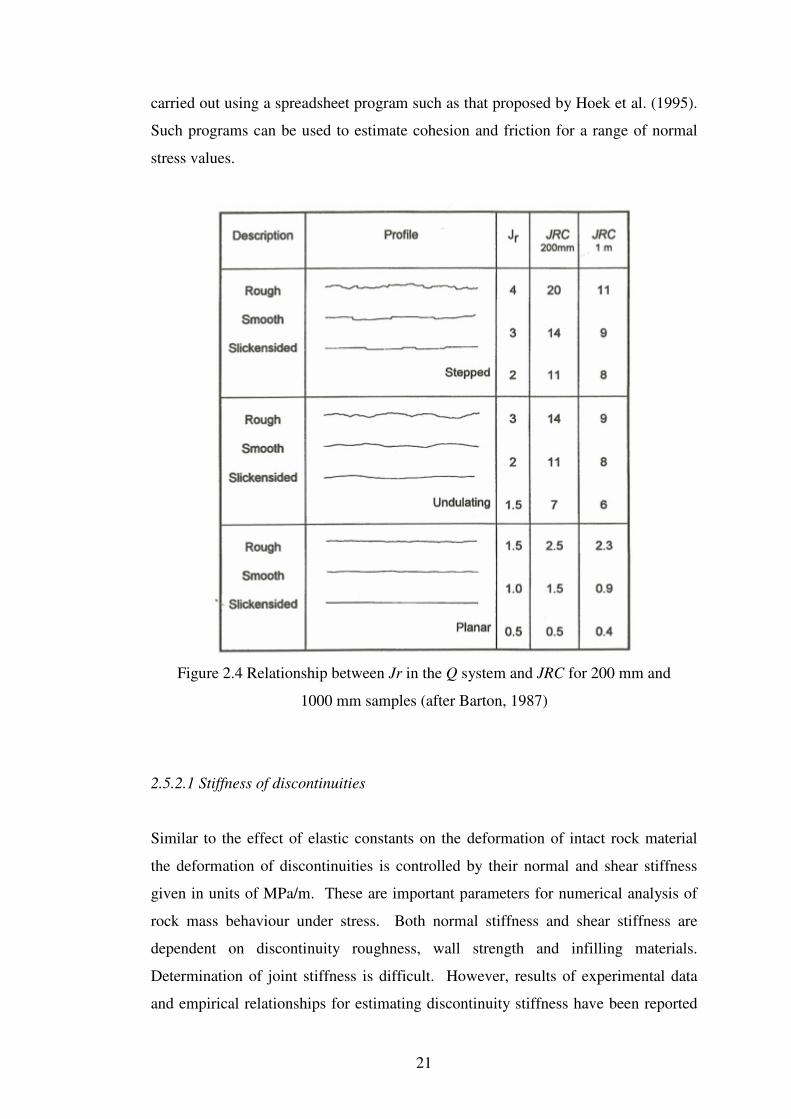
roughness and waviness. Barton and Choubey (1977) provided guidelines for
determining JRC. Barton (1987) also published a table relating Jr (joint roughness
term used in the Q system) to JRC as shown in Figure 2.4. Barton and Bandis (1990)
suggested that JRC can also be estimated from a simple tilt test in which two
matching discontinuity surfaces are tilted until one slides on the other. JCS is
estimated by the methods suggested by ISRM (1978). Barton and Bandis (1982,
1990) showed that JRC and JCS are scale dependent and provided methods for
scaling these parameters with increasing physical dimension. Although subject to
conjecture, these methods are often used when expensive and complicated laboratory
testing is prohibitive.
For discontinuities with infilling materials, the shear strength is a function of among
other things, the strength and deformability of infill material and the strength and
planarity of discontinuity surface. For major discontinuities with a thick layer of
infilling and no rock wall contact during shearing the shear strength of infilling
material should apply. For planar surfaces, a thin coating of clay could result in a
significant reduction in shear strength compared to that of a clean discontinuity with
wall-to-wall contact.
For most practical applications many of the stability analysis methods calculate
factor of safety against sliding using the shear strength parameters expressed in terms
of the Mohr-Coulomb cohesion, c, and friction, Φ, defined in Equation 2.1. It is
therefore necessary to transform the shear strength determined by none linear
relationships such as Equation 2.7 into cohesion and friction angle. This can be
21
carried out using a spreadsheet program such as that proposed by Hoek et al. (1995).
Such programs can be used to estimate cohesion and friction for a range of normal
stress values.
Figure 2.4 Relationship between Jr in the Q system and JRC for 200 mm and
1000 mm samples (after Barton, 1987)
2.5.2.1 Stiffness of discontinuities
Similar to the effect of elastic constants on the deformation of intact rock material
the deformation of discontinuities is controlled by their normal and shear stiffness
given in units of MPa/m. These are important parameters for numerical analysis of
rock mass behaviour under stress. Both normal stiffness and shear stiffness are
dependent on discontinuity roughness, wall strength and infilling materials.
Determination of joint stiffness is difficult. However, results of experimental data
and empirical relationships for estimating discontinuity stiffness have been reported
22
by several authors including Bandis et al. (1983), Bandis (1990), Nelson and Kanji
(1990), Yoshinaka and Yamabe (1986) and Rechitskii (1998).
2.5.3 Strength of rock masses
The strength of composite rock masses has not been investigated as frequently as the
strength of intact rock and discontinuities. However, it is generally known that the
strength of a rock mass is a function of the strength of intact rock and discontinuities
and is significantly reduced with increasing sample size as more and more
discontinuities will be included in the composite. This has been verified for
laboratory scale samples by Hoek and Brown (1980a) and for field scale testing on
coal pillars by Bieniawski (1968). It has been also established that rock masses with
only a single discontinuity may fail preferentially along the surface of the
discontinuity depending on the direction of loading with respect to its orientation.
When the number of discontinuities increase, the rock blocks will have more than
one direction to move or rotate and when the rock mass is heavily jointed, its
behaviour can be approximated to an isotropic material, having no preferential
direction of weakness. Since the determination of strength of a rock mass is difficult
and theoretical models for describing the strength of a rock mass are very scarce,
empirical approaches such as the correlations between rock mass quality and the
Coulomb shear strength parameters (e.g. Bieniawski, 1976; Laubscher, 1990;
Laubscher and Jakube, 2001; and Barton, 2002) may be used, but with significant
limitations.
In the absence of reliable theoretical models for describing the strength of a rock
mass, the most commonly used empirical failure criteria is that introduced by Hoek
and Brown (1980a, b) and subsequently modified by Hoek (1983), Hoek and Brown
(1988), and Hoek et al. (1992) in order to meet the needs of users who were applying
it to problems that were not considered when the original criterion was developed.
Based on the experience acquired in practical application, Hoek and Brown (1997)
changed the criterion and introduced new elements. Further updates and
clarifications of the criterion were provided by Marinos and Hoek (2000), Hoek et al.
(2002) and Brown (2003). The current generalised version of the Hoek-Brown
failure criterion for rock masses given by Hoek (2009) is:
23
)8.2(
'
3'
3
'
1
a
c
bc sm
++=
σ
σσσσ
where, σ1 is the major principal stress at failure, σ3 is the minor principal stress
applied to the specimen, σc is the UCS of intact rock material in the specimen, mb and
s are constants which depend upon the properties of the rock and upon the extent to
which it has been broken before being subjected to the stresses σ1 and σ3, with s = 1
for intact rock materials. In the original version of the Hoek-Brown failure criterion
the mb and s were related to RMR and Q values and guidelines were provided on
how to estimate them. However, in recognition of the problems associated with the
use of RMR and Q for estimating these constants, a new classification called the
Geological Strength Index (GSI) (Hoek, 1994; Hoek, Kaiser and Bawden, 1995;
Hoek and Brown, 1997; Hoek, Marinos and Benissi, 1998; Marinos and Hoek, 2001)
for estimating the mb and s was developed. A major revision was carried out by
Hoek et al. (2002) in order to smooth out the curves, necessary for the application of
the criterion in numerical models and to update the methods for estimating Mohr
Coulomb parameters.
In determining constants mb, s and a, Hoek et al. (2002) took into account the
influence of blast damage on the near excavation surface rock properties as follows:
)9.2(1428
100exp
−
−=
D
GSImm ib
)10.2(39
100exp
−
−=
D
GSIs
( ) )11.2(6
1
2
1 3/2015/ −− −+= eeaGSI
where, D is a factor depends on the degree of disturbance due to blast damage and
stress relaxation. It varies from 0 for undisturbed in situ rock masses to 1 for very
disturbed rock masses. D applies only to the blast damaged zone and it should not be
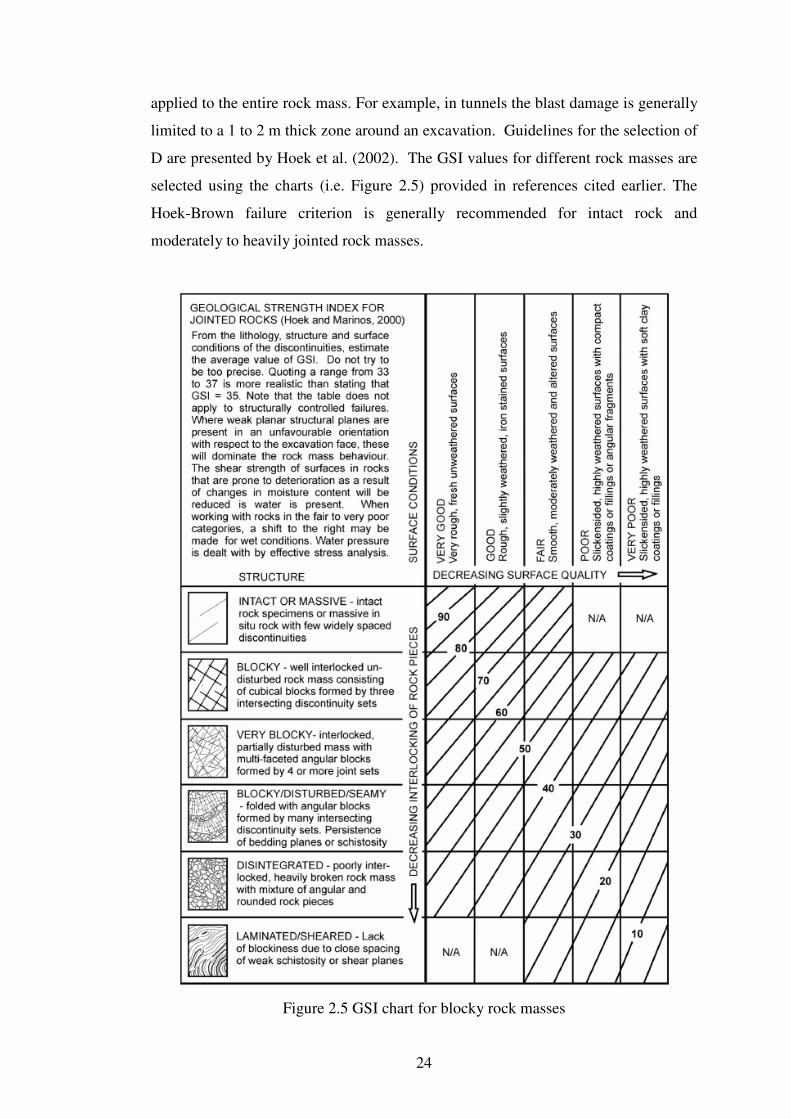
24
applied to the entire rock mass. For example, in tunnels the blast damage is generally
limited to a 1 to 2 m thick zone around an excavation. Guidelines for the selection of
D are presented by Hoek et al. (2002). The GSI values for different rock masses are
selected using the charts (i.e. Figure 2.5) provided in references cited earlier. The
Hoek-Brown failure criterion is generally recommended for intact rock and
moderately to heavily jointed rock masses.
Figure 2.5 GSI chart for blocky rock masses
25
2.5.4 Deformability of rock masses
Deformability of a rock mass is a function of the elastic modulus of intact rock
material and the stiffness of the discontinuities. For rock masses with a regularly
spaced single set of parallel discontinuities, it is possible to calculate elastic constants
for an equivalent continuous material representative of the rock mass. The formula
given by Goodman (1989) for the modulus of elasticity Em, when loading is normal
to the discontinuities is
)11.2(111
KnSEEm
+=
where, E is elastic modulus of intact rock, Kn is normal stiffness of discontinuities
and S is discontinuity spacing. The formula for shear modulus (or modulus of
rigidity) Gm when loading is parallel to the orientation of the discontinuities is
)12.2(111
KsSGGm
+=
where, G is shear modulus of intact rock material, Ks is shear stiffness of
discontinuities and S is discontinuity spacing. Similar solutions for cases involving
more than one set of discontinuities are given by Amadei and Goodman (1981) and
by Gerrad (1982). If the rock mass is highly jointed, the mathematics associated
with the derivation of the relevant formulas becomes complex and the data required
to apply these solutions are not available in practice. In these cases, it is common to
determine EM as the modulus of deformation from in situ compression tests. The
term modulus of deformation signifies that the value EM is calculated from the data
of the loading portion of the load-deformation curve using both elastic and
permanent deformation.
The rock mass modulus of deformation can also be estimated from empirical
relations. Bieniawski (1978) showed that EM in GPa can be estimated from RMR
value when the latter is greater than 50 using the following formula
26
EM = 2 RMR – 100 (2.13)
For rock masses with RMR < 50, based on the work of Serafim and Pereira (1983),
the formula given by Bieniawski (1989) is
EM = 10(RMR-10)/40
(2.14)
Hoek and Brown (1997) proposed a correction for Equation 2.14 by introducing
average UCS of intact rock material qc in MPa as given in Equation 2.14a, where
qc≤100 MPa.
EM = (qc/100)1/2
10(RMR-10)/40
(2.14a)
For dry and weak rock masses in underground excavations at depths exceeding 50 m
where modulus of deformation dependent on the confining pressure due to
overburden, Verman (1993) also proposed a correction as given in Equation 2.14b.
EM = 0.3 Hα 10
(RMR-20)/38 (2.14b)
where, α=0.16 to 0.30 (higher for poor rocks) and H=depth in metres (≥50m).
The Q system can also be used for estimating in situ modulus of rock mass
deformation (EM). Barton et al. (1980) and Barton (1995) provided the following
formulas for estimating EM (in GPa) when Q >1 and Q <1, respectively
EM = 25 log Q (when Q > 1) (2.15)
EM = 10Qc1/3
(when Q < 1) (2.16)
where Qc = (Qσc)/100 with σc being the compressive strength of intact rock
substance. Hoek et al. (2002) also proposed a somewhat complex empirical
relationship between EM and GSI as given in Equation 2.17:
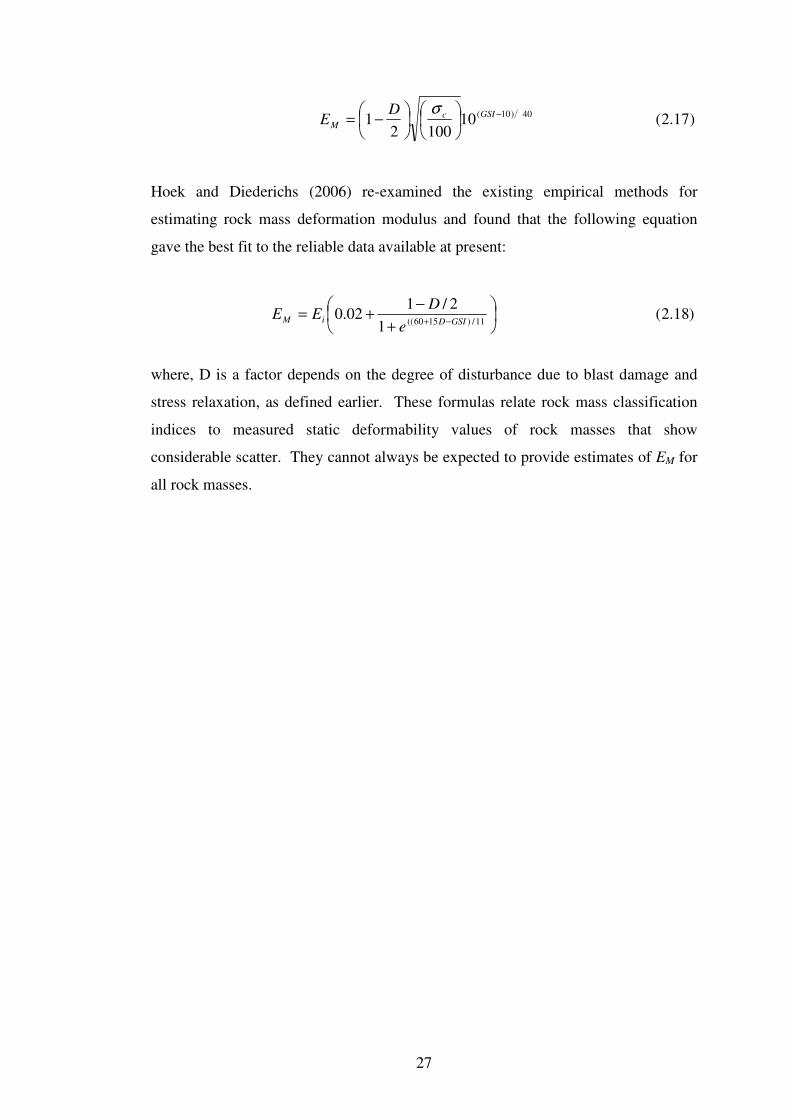
27
)17.2(101002
1 40)10( −
−= GSIc
M
DE
σ
Hoek and Diederichs (2006) re-examined the existing empirical methods for
estimating rock mass deformation modulus and found that the following equation
gave the best fit to the reliable data available at present:
)18.2(1
2/102.0
11/)1560((
+
−+=
−+ GSIDiMe
DEE
where, D is a factor depends on the degree of disturbance due to blast damage and
stress relaxation, as defined earlier. These formulas relate rock mass classification
indices to measured static deformability values of rock masses that show
considerable scatter. They cannot always be expected to provide estimates of EM for
all rock masses.

28
2.6 Rock Mass Instability in Underground Excavations
When an excavation is created in a rock mass, the in situ stress field is disturbed and
a new stress field is induced around the excavation. If the induced stresses are
appreciably lower than the intact rock strength, rock mass instability is possible only
through the geological structural features, which have low shear strength and
negligible tensile strength compared to the intact rock material. In such situations
the main stability concern is the dislodgement of rock blocks formed by the
discontinuities, primarily under the influence of gravity with the in situ stress field
playing only a secondary role.
In high in situ stress conditions, discontinuities are usually rare or tightly closed
together the excavation induced stresses could be high enough to cause failure of the
intact rock material. Thus, instability in underground excavations in rock can arise
from two broad categories of rock mass failures:
o structurally controlled gravity driven failures
o strength controlled stress driven failures
While the above two categories of failure may be considered to represent most of the
instability problems encountered in underground excavations, there are situations
where rock mass instability is actually a combined effect of the geological structure,
intact rock strength, stress field and gravity. Nevertheless, traditionally, instability in
underground excavations has been dealt with under the two categories of failures
mentioned above. There are also other categories of instability caused directly by the
presence of large volumes of water. These situations are usually dealt with on a case
by case basis as they are encountered during construction.
In the following sections the two categories are briefly described. This is followed
by a brief discussion on the failures caused by the combined effect of geological
structure, intact rock strength, stress field and gravity. The effects of water on the
stability of underground excavations are also briefly outlined. In discussing the
instability in underground excavations, emphasis is placed on the failure modes
observed in the case studies used in this research.
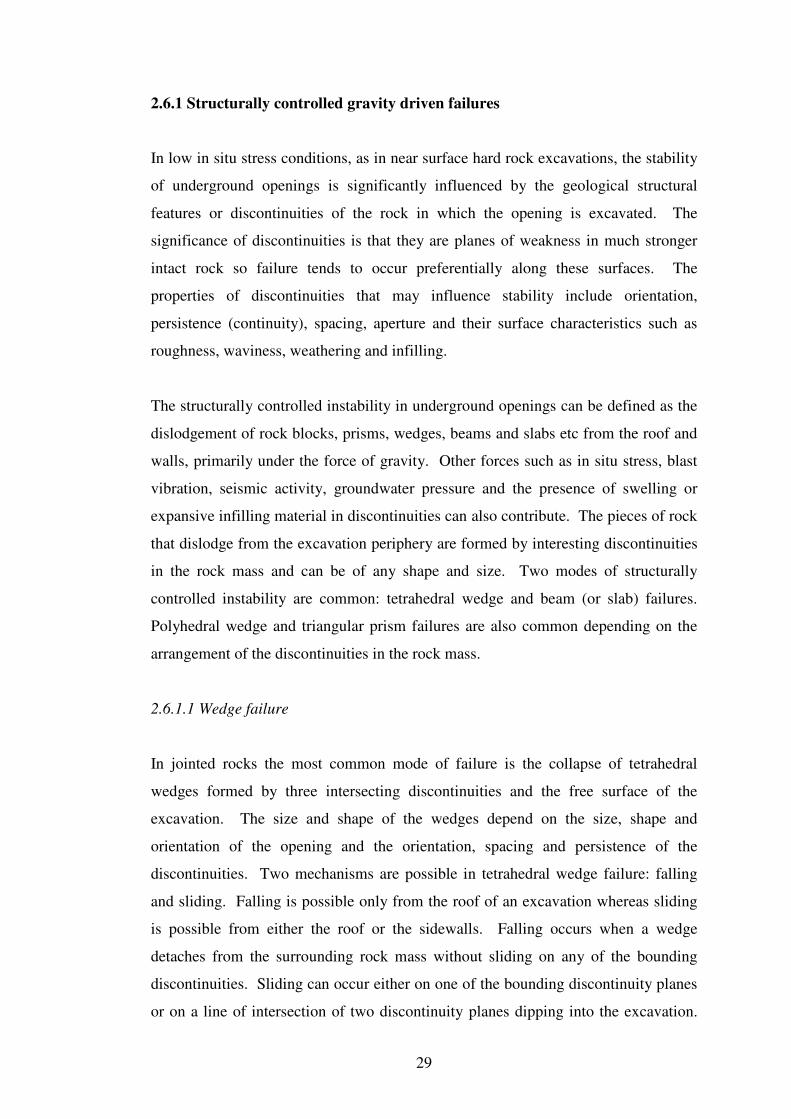
29
2.6.1 Structurally controlled gravity driven failures
In low in situ stress conditions, as in near surface hard rock excavations, the stability
of underground openings is significantly influenced by the geological structural
features or discontinuities of the rock in which the opening is excavated. The
significance of discontinuities is that they are planes of weakness in much stronger
intact rock so failure tends to occur preferentially along these surfaces. The
properties of discontinuities that may influence stability include orientation,
persistence (continuity), spacing, aperture and their surface characteristics such as
roughness, waviness, weathering and infilling.
The structurally controlled instability in underground openings can be defined as the
dislodgement of rock blocks, prisms, wedges, beams and slabs etc from the roof and
walls, primarily under the force of gravity. Other forces such as in situ stress, blast
vibration, seismic activity, groundwater pressure and the presence of swelling or
expansive infilling material in discontinuities can also contribute. The pieces of rock
that dislodge from the excavation periphery are formed by interesting discontinuities
in the rock mass and can be of any shape and size. Two modes of structurally
controlled instability are common: tetrahedral wedge and beam (or slab) failures.
Polyhedral wedge and triangular prism failures are also common depending on the
arrangement of the discontinuities in the rock mass.
2.6.1.1 Wedge failure
In jointed rocks the most common mode of failure is the collapse of tetrahedral
wedges formed by three intersecting discontinuities and the free surface of the
excavation. The size and shape of the wedges depend on the size, shape and
orientation of the opening and the orientation, spacing and persistence of the
discontinuities. Two mechanisms are possible in tetrahedral wedge failure: falling
and sliding. Falling is possible only from the roof of an excavation whereas sliding
is possible from either the roof or the sidewalls. Falling occurs when a wedge
detaches from the surrounding rock mass without sliding on any of the bounding
discontinuities. Sliding can occur either on one of the bounding discontinuity planes
or on a line of intersection of two discontinuity planes dipping into the excavation.
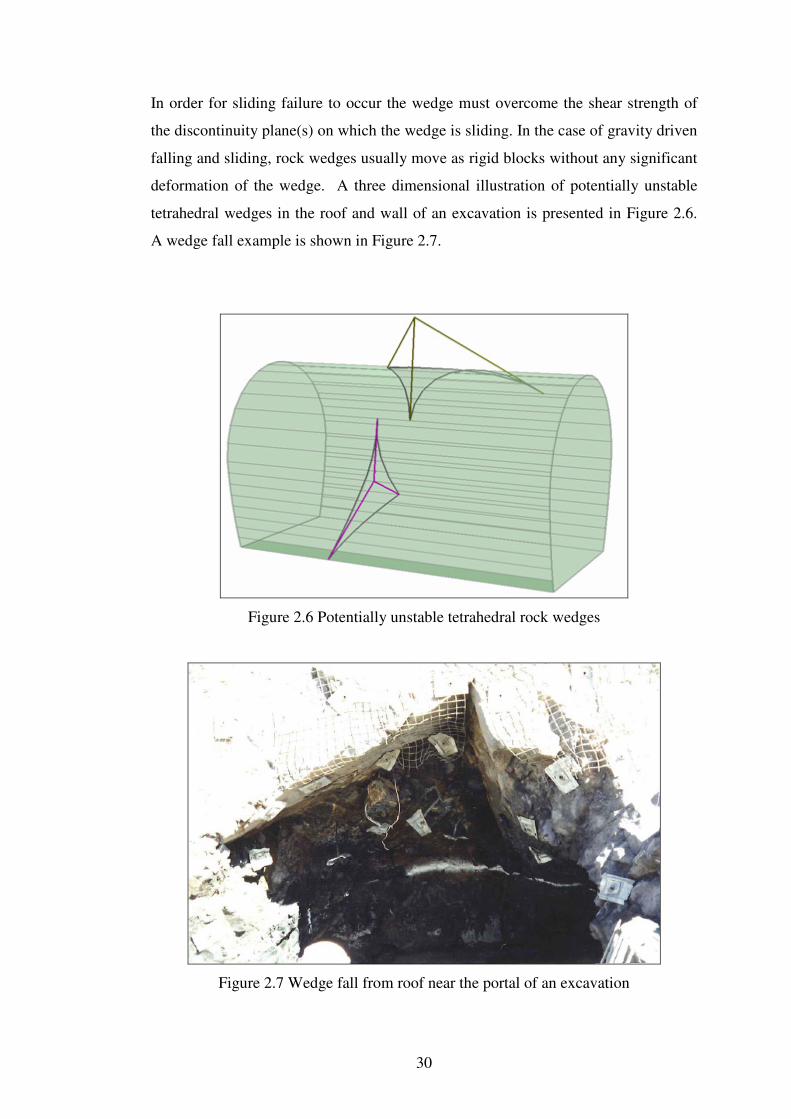
30
In order for sliding failure to occur the wedge must overcome the shear strength of
the discontinuity plane(s) on which the wedge is sliding. In the case of gravity driven
falling and sliding, rock wedges usually move as rigid blocks without any significant
deformation of the wedge. A three dimensional illustration of potentially unstable
tetrahedral wedges in the roof and wall of an excavation is presented in Figure 2.6.
A wedge fall example is shown in Figure 2.7.
Figure 2.6 Potentially unstable tetrahedral rock wedges
Figure 2.7 Wedge fall from roof near the portal of an excavation
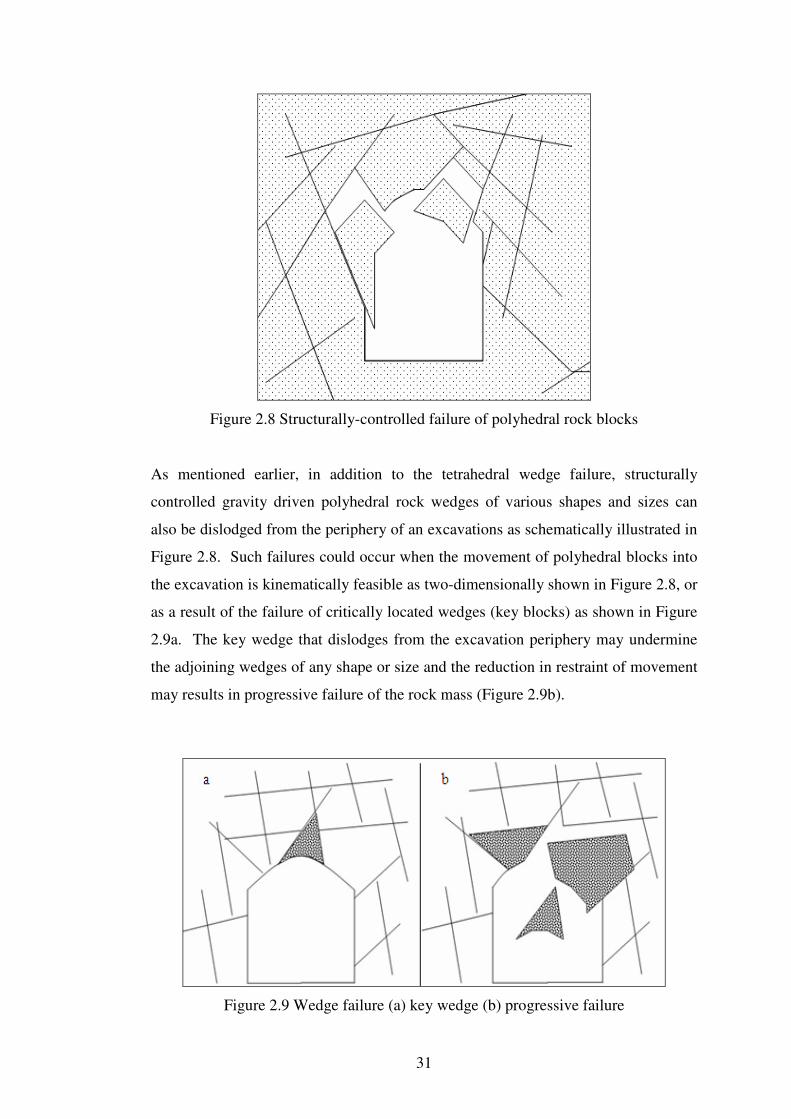
31
Figure 2.8 Structurally-controlled failure of polyhedral rock blocks
As mentioned earlier, in addition to the tetrahedral wedge failure, structurally
controlled gravity driven polyhedral rock wedges of various shapes and sizes can
also be dislodged from the periphery of an excavations as schematically illustrated in
Figure 2.8. Such failures could occur when the movement of polyhedral blocks into
the excavation is kinematically feasible as two-dimensionally shown in Figure 2.8, or
as a result of the failure of critically located wedges (key blocks) as shown in Figure
2.9a. The key wedge that dislodges from the excavation periphery may undermine
the adjoining wedges of any shape or size and the reduction in restraint of movement
may results in progressive failure of the rock mass (Figure 2.9b).
Figure 2.9 Wedge failure (a) key wedge (b) progressive failure
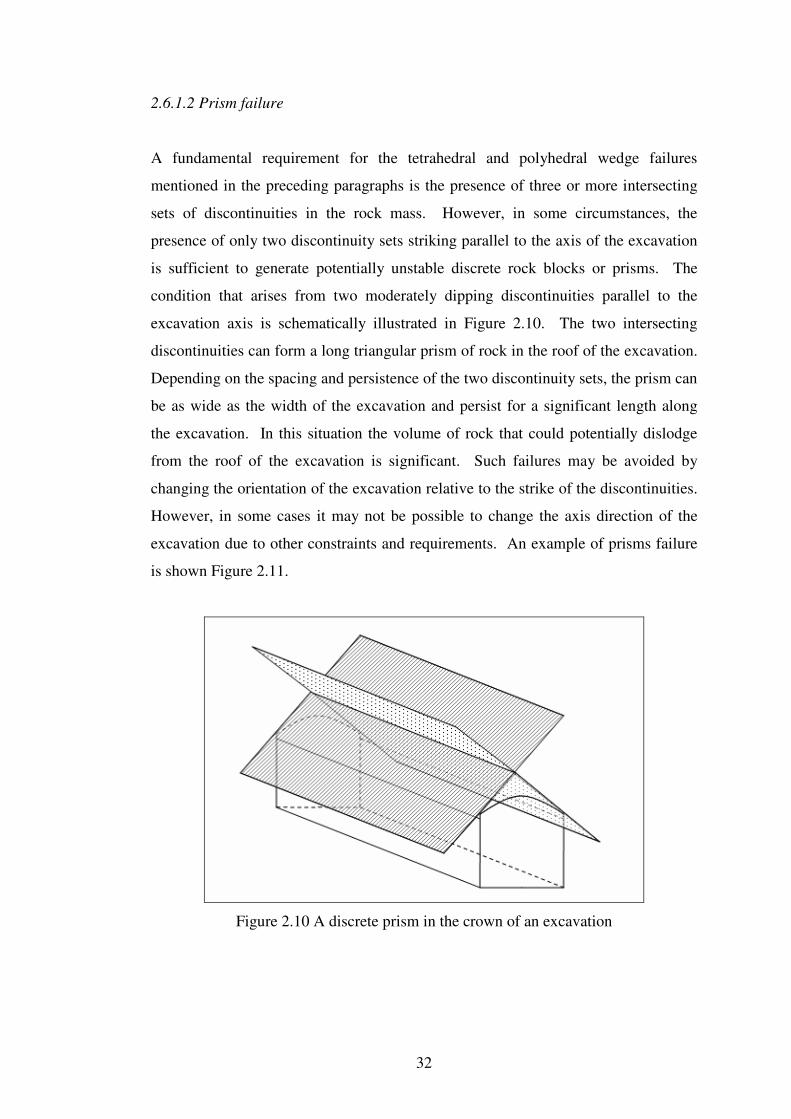
32
2.6.1.2 Prism failure
A fundamental requirement for the tetrahedral and polyhedral wedge failures
mentioned in the preceding paragraphs is the presence of three or more intersecting
sets of discontinuities in the rock mass. However, in some circumstances, the
presence of only two discontinuity sets striking parallel to the axis of the excavation
is sufficient to generate potentially unstable discrete rock blocks or prisms. The
condition that arises from two moderately dipping discontinuities parallel to the
excavation axis is schematically illustrated in Figure 2.10. The two intersecting
discontinuities can form a long triangular prism of rock in the roof of the excavation.
Depending on the spacing and persistence of the two discontinuity sets, the prism can
be as wide as the width of the excavation and persist for a significant length along
the excavation. In this situation the volume of rock that could potentially dislodge
from the roof of the excavation is significant. Such failures may be avoided by
changing the orientation of the excavation relative to the strike of the discontinuities.
However, in some cases it may not be possible to change the axis direction of the
excavation due to other constraints and requirements. An example of prisms failure
is shown Figure 2.11.
Figure 2.10 A discrete prism in the crown of an excavation
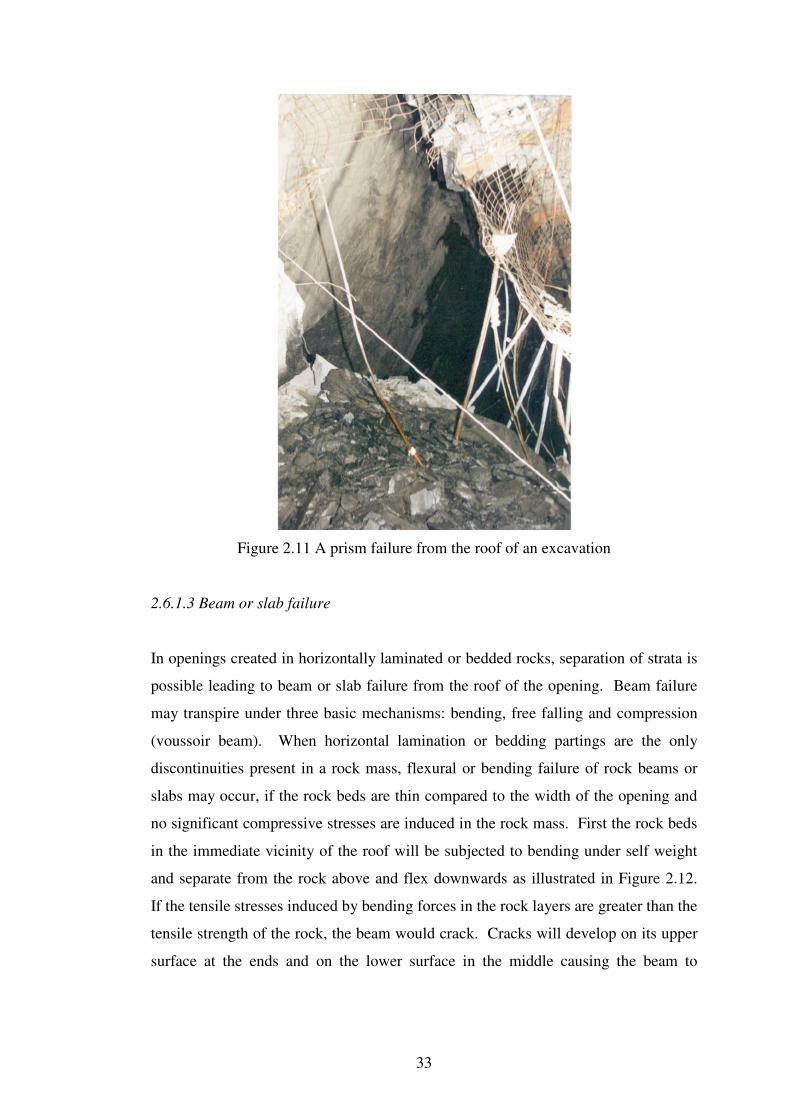
33
Figure 2.11 A prism failure from the roof of an excavation
2.6.1.3 Beam or slab failure
In openings created in horizontally laminated or bedded rocks, separation of strata is
possible leading to beam or slab failure from the roof of the opening. Beam failure
may transpire under three basic mechanisms: bending, free falling and compression
(voussoir beam). When horizontal lamination or bedding partings are the only
discontinuities present in a rock mass, flexural or bending failure of rock beams or
slabs may occur, if the rock beds are thin compared to the width of the opening and
no significant compressive stresses are induced in the rock mass. First the rock beds
in the immediate vicinity of the roof will be subjected to bending under self weight
and separate from the rock above and flex downwards as illustrated in Figure 2.12.
If the tensile stresses induced by bending forces in the rock layers are greater than the
tensile strength of the rock, the beam would crack. Cracks will develop on its upper
surface at the ends and on the lower surface in the middle causing the beam to
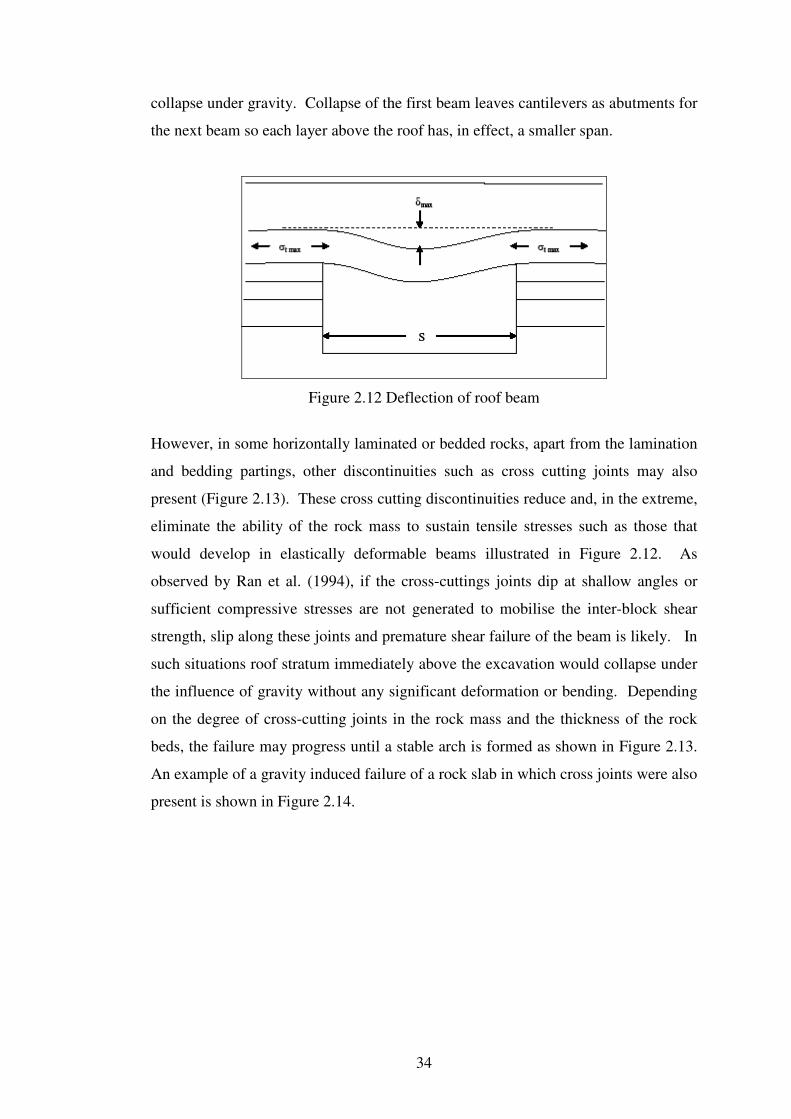
34
collapse under gravity. Collapse of the first beam leaves cantilevers as abutments for
the next beam so each layer above the roof has, in effect, a smaller span.
Figure 2.12 Deflection of roof beam
However, in some horizontally laminated or bedded rocks, apart from the lamination
and bedding partings, other discontinuities such as cross cutting joints may also
present (Figure 2.13). These cross cutting discontinuities reduce and, in the extreme,
eliminate the ability of the rock mass to sustain tensile stresses such as those that
would develop in elastically deformable beams illustrated in Figure 2.12. As
observed by Ran et al. (1994), if the cross-cuttings joints dip at shallow angles or
sufficient compressive stresses are not generated to mobilise the inter-block shear
strength, slip along these joints and premature shear failure of the beam is likely. In
such situations roof stratum immediately above the excavation would collapse under
the influence of gravity without any significant deformation or bending. Depending
on the degree of cross-cutting joints in the rock mass and the thickness of the rock
beds, the failure may progress until a stable arch is formed as shown in Figure 2.13.
An example of a gravity induced failure of a rock slab in which cross joints were also
present is shown in Figure 2.14.
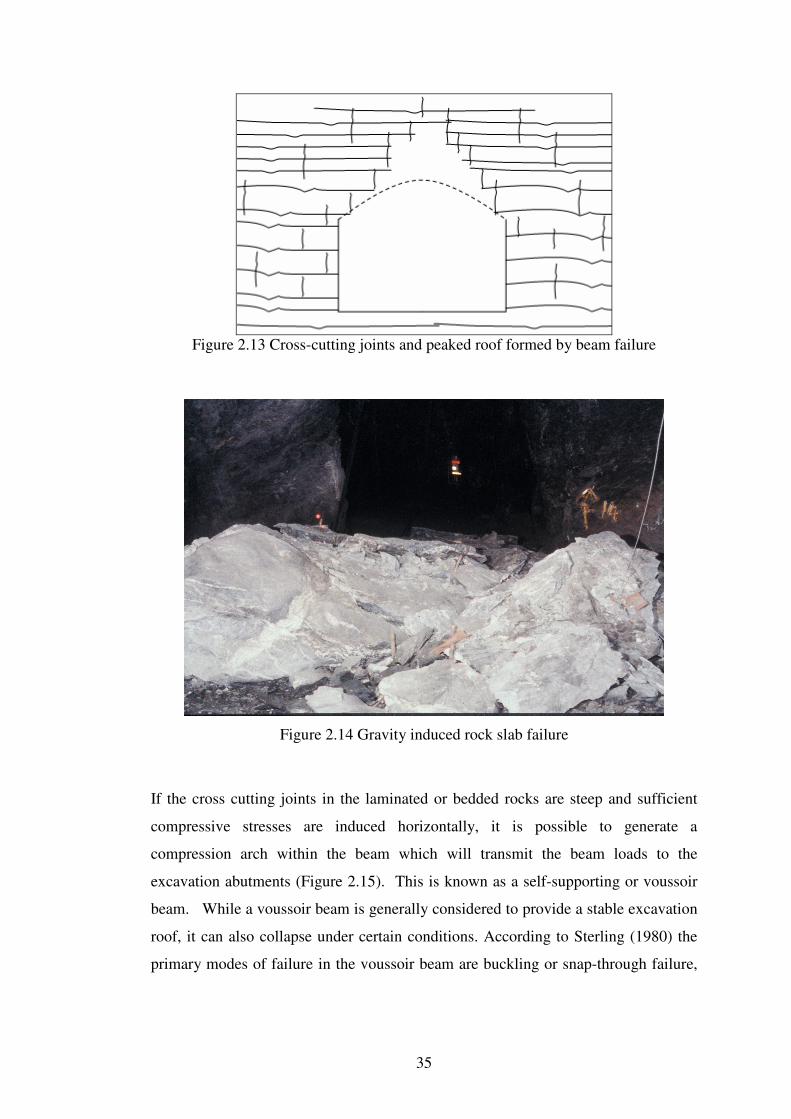
35
Figure 2.13 Cross-cutting joints and peaked roof formed by beam failure
Figure 2.14 Gravity induced rock slab failure
If the cross cutting joints in the laminated or bedded rocks are steep and sufficient
compressive stresses are induced horizontally, it is possible to generate a
compression arch within the beam which will transmit the beam loads to the
excavation abutments (Figure 2.15). This is known as a self-supporting or voussoir
beam. While a voussoir beam is generally considered to provide a stable excavation
roof, it can also collapse under certain conditions. According to Sterling (1980) the
primary modes of failure in the voussoir beam are buckling or snap-through failure,
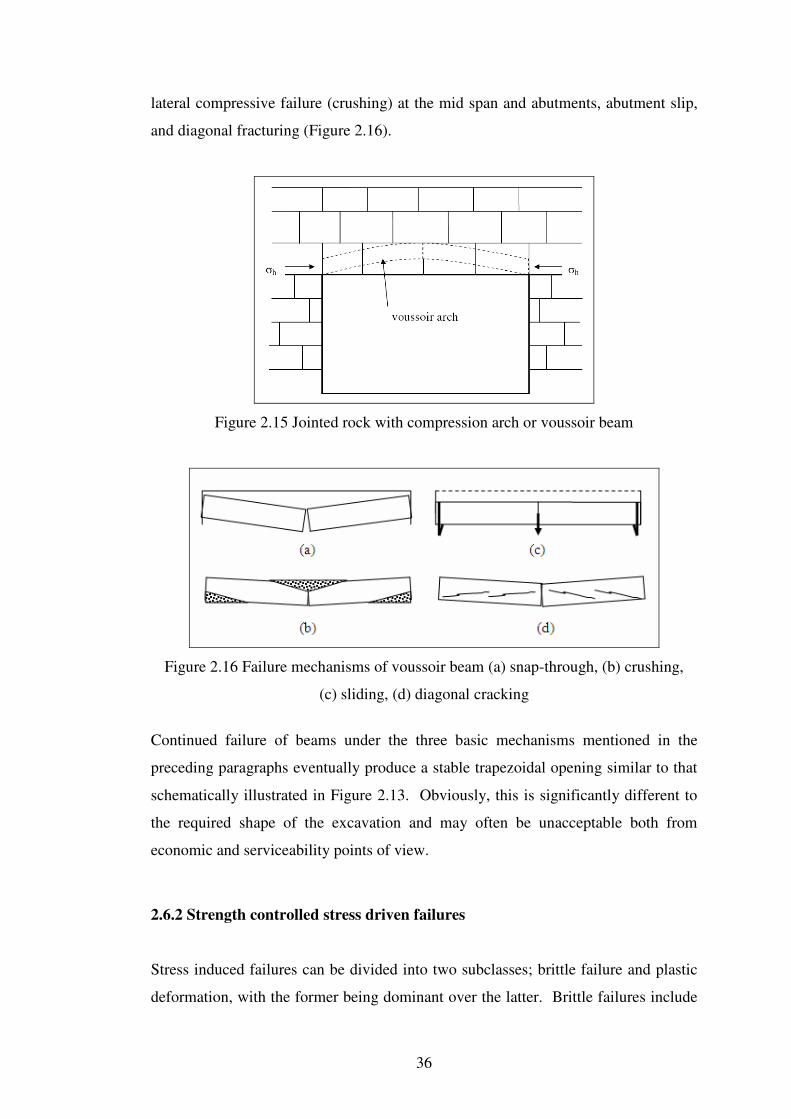
36
lateral compressive failure (crushing) at the mid span and abutments, abutment slip,
and diagonal fracturing (Figure 2.16).
Figure 2.15 Jointed rock with compression arch or voussoir beam
Figure 2.16 Failure mechanisms of voussoir beam (a) snap-through, (b) crushing,
(c) sliding, (d) diagonal cracking
Continued failure of beams under the three basic mechanisms mentioned in the
preceding paragraphs eventually produce a stable trapezoidal opening similar to that
schematically illustrated in Figure 2.13. Obviously, this is significantly different to
the required shape of the excavation and may often be unacceptable both from
economic and serviceability points of view.
2.6.2 Strength controlled stress driven failures
Stress induced failures can be divided into two subclasses; brittle failure and plastic
deformation, with the former being dominant over the latter. Brittle failures include
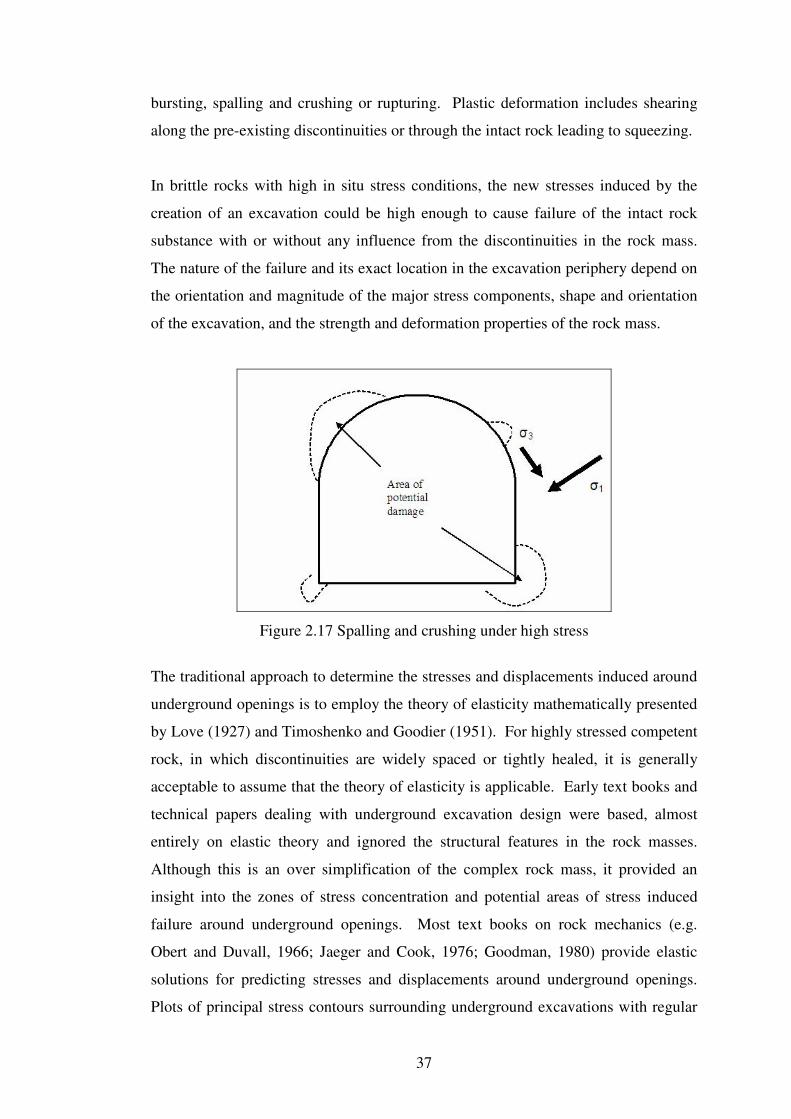
37
bursting, spalling and crushing or rupturing. Plastic deformation includes shearing
along the pre-existing discontinuities or through the intact rock leading to squeezing.
In brittle rocks with high in situ stress conditions, the new stresses induced by the
creation of an excavation could be high enough to cause failure of the intact rock
substance with or without any influence from the discontinuities in the rock mass.
The nature of the failure and its exact location in the excavation periphery depend on
the orientation and magnitude of the major stress components, shape and orientation
of the excavation, and the strength and deformation properties of the rock mass.
Figure 2.17 Spalling and crushing under high stress
The traditional approach to determine the stresses and displacements induced around
underground openings is to employ the theory of elasticity mathematically presented
by Love (1927) and Timoshenko and Goodier (1951). For highly stressed competent
rock, in which discontinuities are widely spaced or tightly healed, it is generally
acceptable to assume that the theory of elasticity is applicable. Early text books and
technical papers dealing with underground excavation design were based, almost
entirely on elastic theory and ignored the structural features in the rock masses.
Although this is an over simplification of the complex rock mass, it provided an
insight into the zones of stress concentration and potential areas of stress induced
failure around underground openings. Most text books on rock mechanics (e.g.
Obert and Duvall, 1966; Jaeger and Cook, 1976; Goodman, 1980) provide elastic
solutions for predicting stresses and displacements around underground openings.
Plots of principal stress contours surrounding underground excavations with regular
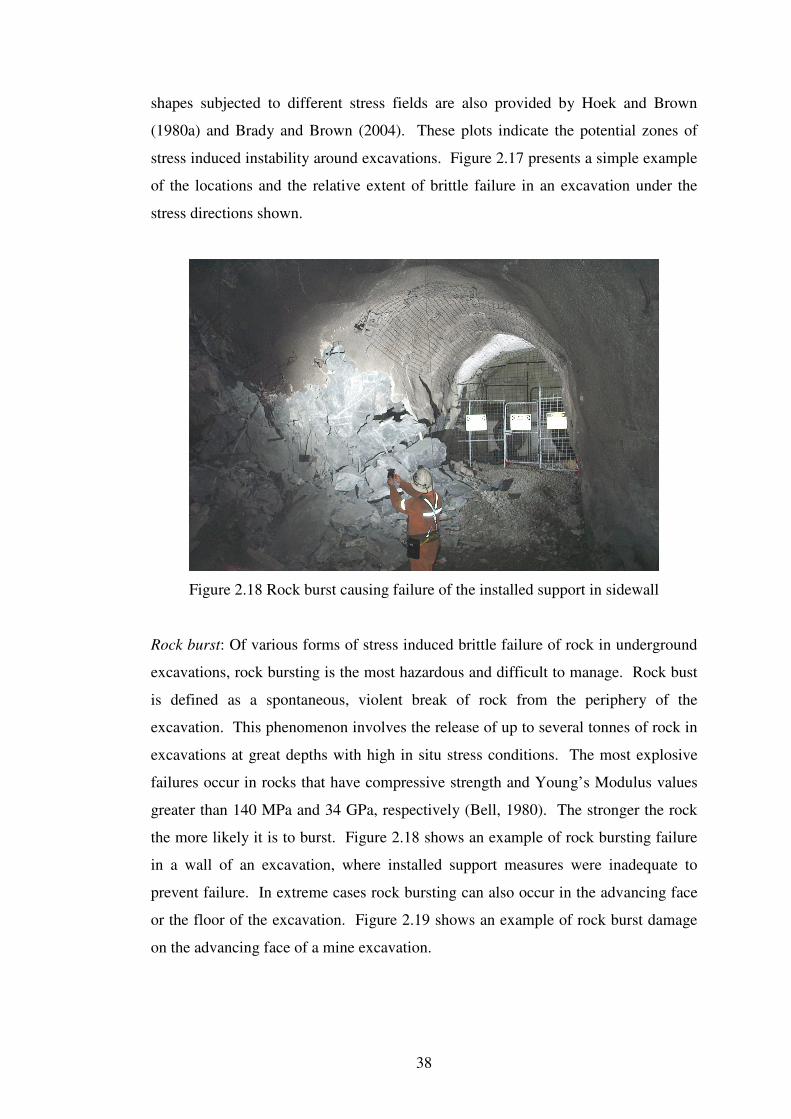
38
shapes subjected to different stress fields are also provided by Hoek and Brown
(1980a) and Brady and Brown (2004). These plots indicate the potential zones of
stress induced instability around excavations. Figure 2.17 presents a simple example
of the locations and the relative extent of brittle failure in an excavation under the
stress directions shown.
Figure 2.18 Rock burst causing failure of the installed support in sidewall
Rock burst: Of various forms of stress induced brittle failure of rock in underground
excavations, rock bursting is the most hazardous and difficult to manage. Rock bust
is defined as a spontaneous, violent break of rock from the periphery of the
excavation. This phenomenon involves the release of up to several tonnes of rock in
excavations at great depths with high in situ stress conditions. The most explosive
failures occur in rocks that have compressive strength and Young’s Modulus values
greater than 140 MPa and 34 GPa, respectively (Bell, 1980). The stronger the rock
the more likely it is to burst. Figure 2.18 shows an example of rock bursting failure
in a wall of an excavation, where installed support measures were inadequate to
prevent failure. In extreme cases rock bursting can also occur in the advancing face
or the floor of the excavation. Figure 2.19 shows an example of rock burst damage
on the advancing face of a mine excavation.
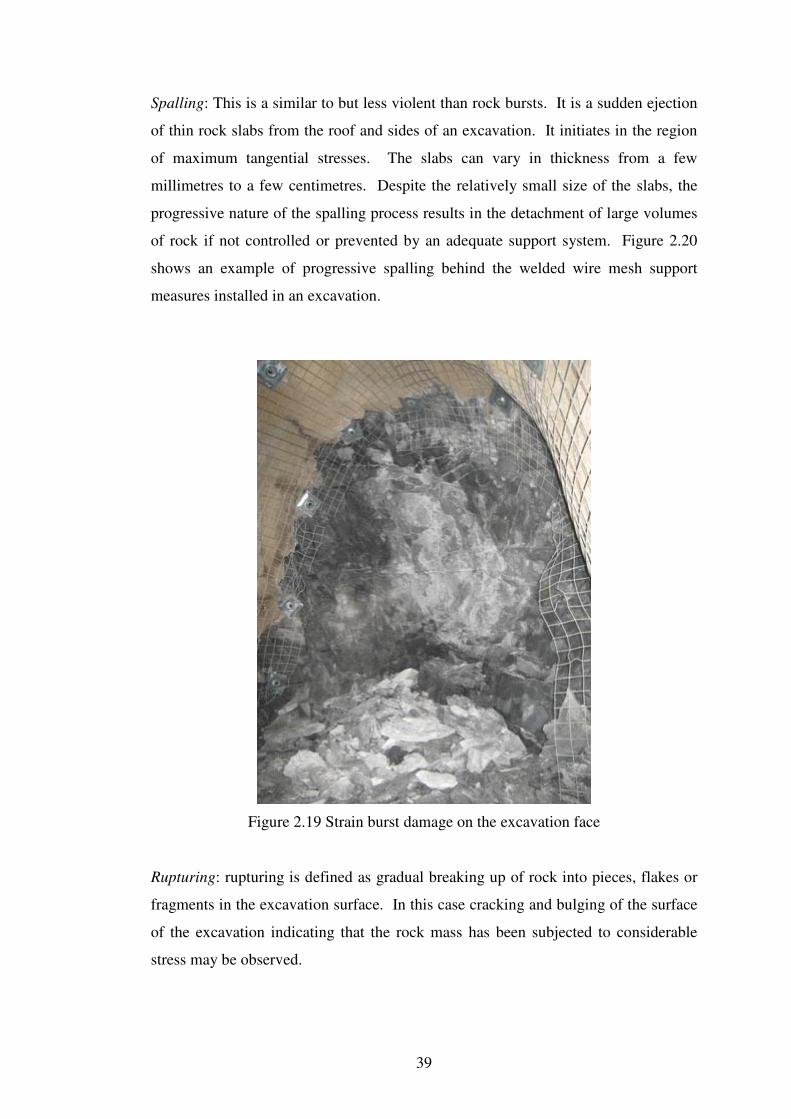
39
Spalling: This is a similar to but less violent than rock bursts. It is a sudden ejection
of thin rock slabs from the roof and sides of an excavation. It initiates in the region
of maximum tangential stresses. The slabs can vary in thickness from a few
millimetres to a few centimetres. Despite the relatively small size of the slabs, the
progressive nature of the spalling process results in the detachment of large volumes
of rock if not controlled or prevented by an adequate support system. Figure 2.20
shows an example of progressive spalling behind the welded wire mesh support
measures installed in an excavation.
Figure 2.19 Strain burst damage on the excavation face
Rupturing: rupturing is defined as gradual breaking up of rock into pieces, flakes or
fragments in the excavation surface. In this case cracking and bulging of the surface
of the excavation indicating that the rock mass has been subjected to considerable
stress may be observed.
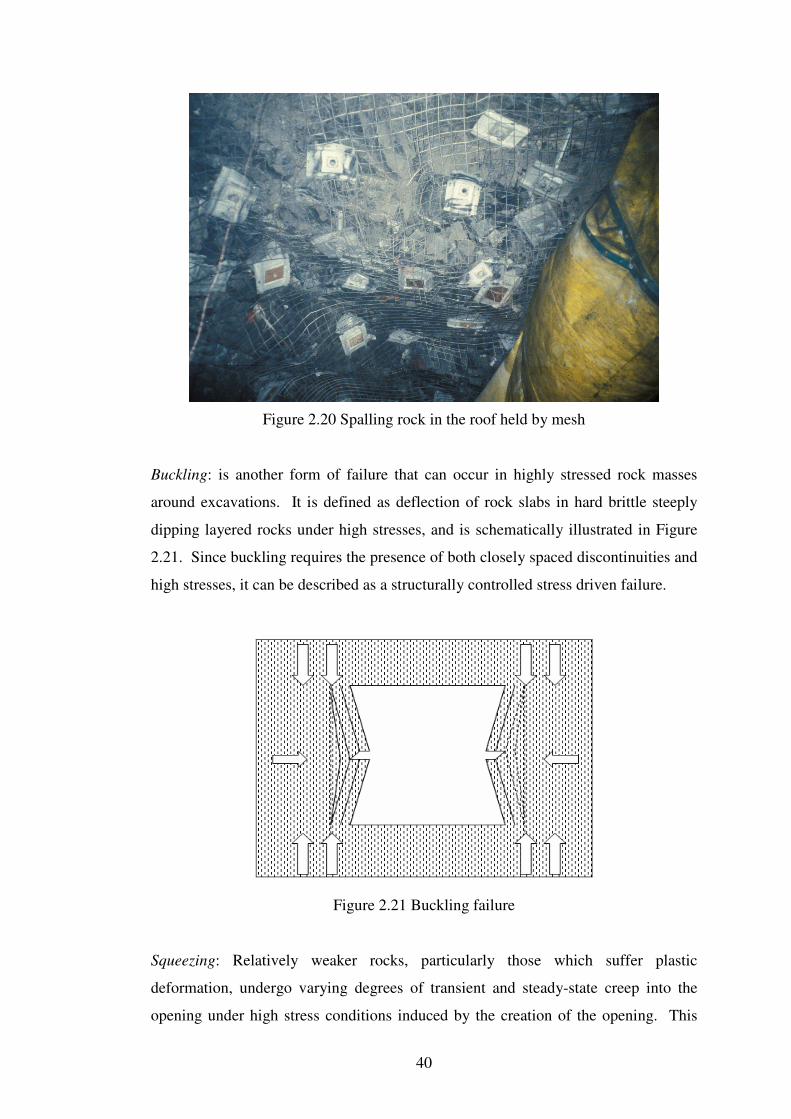
40
Figure 2.20 Spalling rock in the roof held by mesh
Buckling: is another form of failure that can occur in highly stressed rock masses
around excavations. It is defined as deflection of rock slabs in hard brittle steeply
dipping layered rocks under high stresses, and is schematically illustrated in Figure
2.21. Since buckling requires the presence of both closely spaced discontinuities and
high stresses, it can be described as a structurally controlled stress driven failure.
Figure 2.21 Buckling failure
Squeezing: Relatively weaker rocks, particularly those which suffer plastic
deformation, undergo varying degrees of transient and steady-state creep into the
opening under high stress conditions induced by the creation of the opening. This
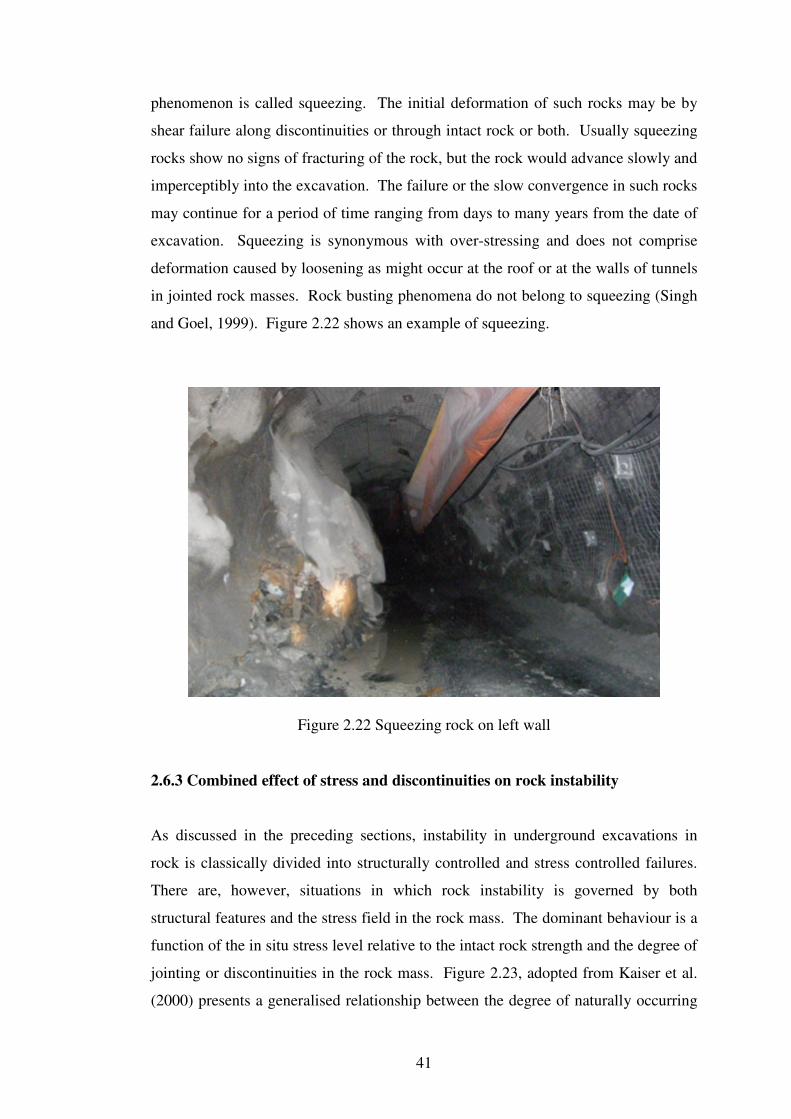
41
phenomenon is called squeezing. The initial deformation of such rocks may be by
shear failure along discontinuities or through intact rock or both. Usually squeezing
rocks show no signs of fracturing of the rock, but the rock would advance slowly and
imperceptibly into the excavation. The failure or the slow convergence in such rocks
may continue for a period of time ranging from days to many years from the date of
excavation. Squeezing is synonymous with over-stressing and does not comprise
deformation caused by loosening as might occur at the roof or at the walls of tunnels
in jointed rock masses. Rock busting phenomena do not belong to squeezing (Singh
and Goel, 1999). Figure 2.22 shows an example of squeezing.
Figure 2.22 Squeezing rock on left wall
2.6.3 Combined effect of stress and discontinuities on rock instability
As discussed in the preceding sections, instability in underground excavations in
rock is classically divided into structurally controlled and stress controlled failures.
There are, however, situations in which rock instability is governed by both
structural features and the stress field in the rock mass. The dominant behaviour is a
function of the in situ stress level relative to the intact rock strength and the degree of
jointing or discontinuities in the rock mass. Figure 2.23, adopted from Kaiser et al.
(2000) presents a generalised relationship between the degree of naturally occurring
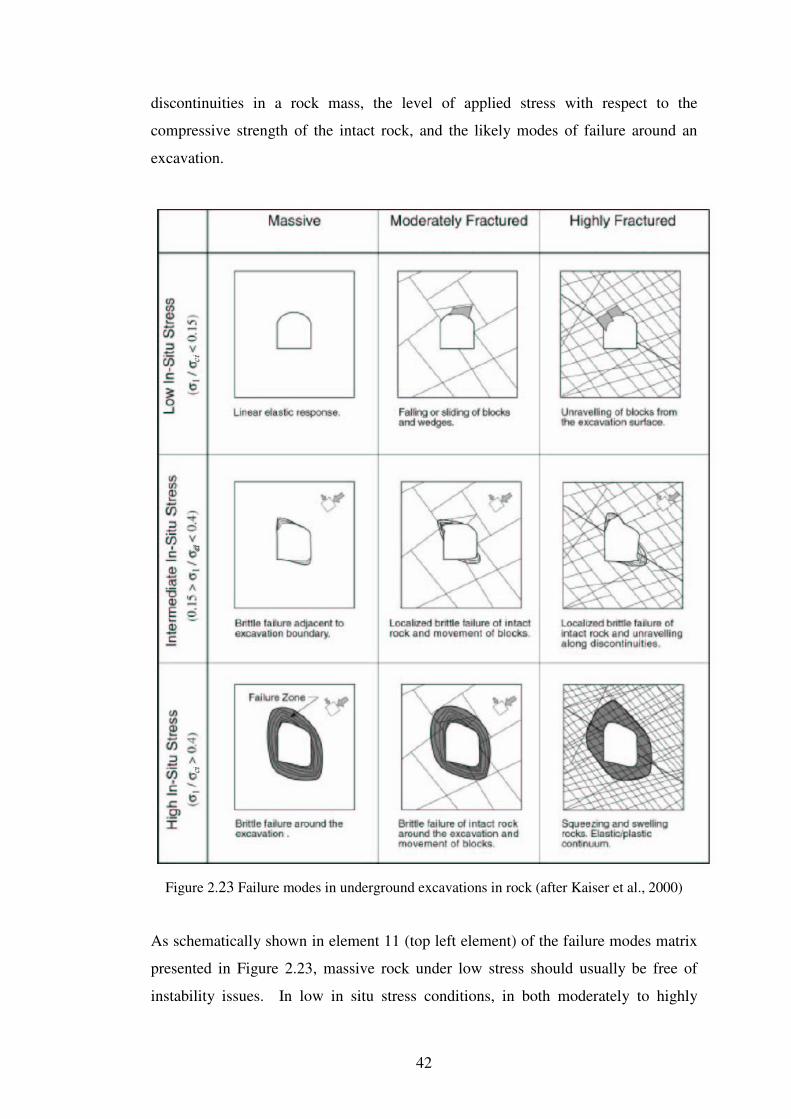
42
discontinuities in a rock mass, the level of applied stress with respect to the
compressive strength of the intact rock, and the likely modes of failure around an
excavation.
Figure 2.23 Failure modes in underground excavations in rock (after Kaiser et al., 2000)
As schematically shown in element 11 (top left element) of the failure modes matrix
presented in Figure 2.23, massive rock under low stress should usually be free of
instability issues. In low in situ stress conditions, in both moderately to highly
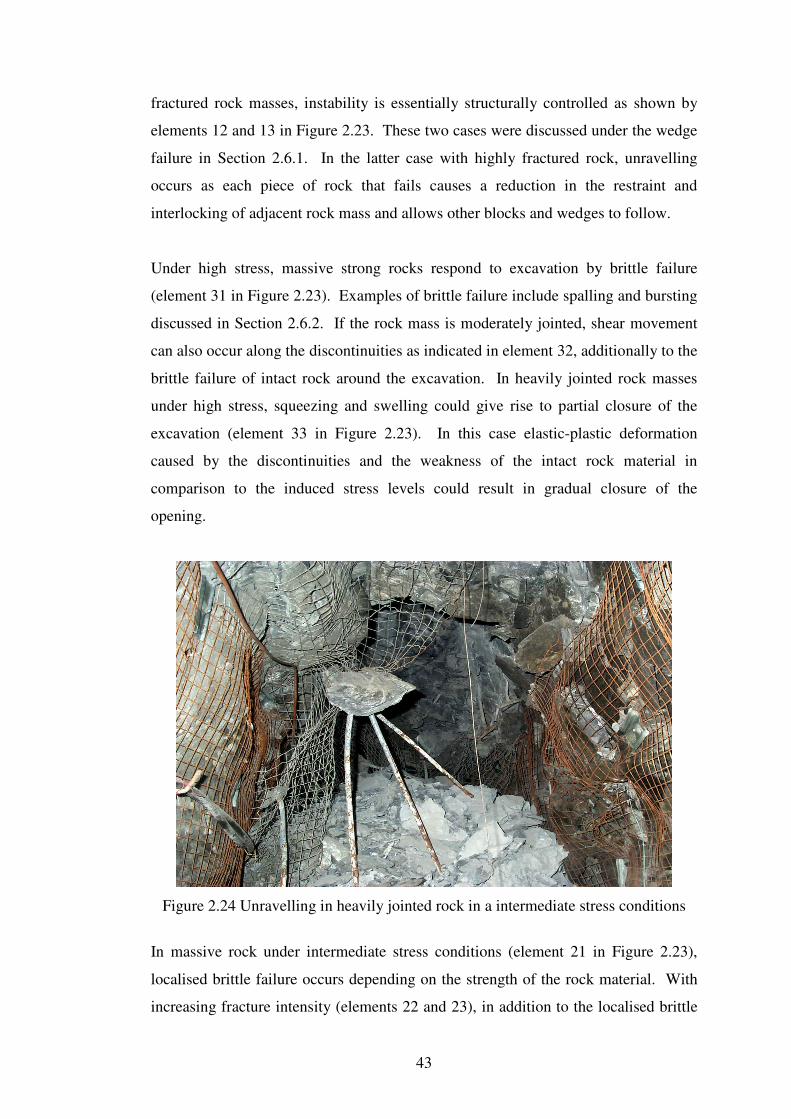
43
fractured rock masses, instability is essentially structurally controlled as shown by
elements 12 and 13 in Figure 2.23. These two cases were discussed under the wedge
failure in Section 2.6.1. In the latter case with highly fractured rock, unravelling
occurs as each piece of rock that fails causes a reduction in the restraint and
interlocking of adjacent rock mass and allows other blocks and wedges to follow.
Under high stress, massive strong rocks respond to excavation by brittle failure
(element 31 in Figure 2.23). Examples of brittle failure include spalling and bursting
discussed in Section 2.6.2. If the rock mass is moderately jointed, shear movement
can also occur along the discontinuities as indicated in element 32, additionally to the
brittle failure of intact rock around the excavation. In heavily jointed rock masses
under high stress, squeezing and swelling could give rise to partial closure of the
excavation (element 33 in Figure 2.23). In this case elastic-plastic deformation
caused by the discontinuities and the weakness of the intact rock material in
comparison to the induced stress levels could result in gradual closure of the
opening.
Figure 2.24 Unravelling in heavily jointed rock in a intermediate stress conditions
In massive rock under intermediate stress conditions (element 21 in Figure 2.23),
localised brittle failure occurs depending on the strength of the rock material. With
increasing fracture intensity (elements 22 and 23), in addition to the localised brittle
44
failure of the intact rock material, the discontinuities also play a role by allowing
block movement into the excavation. In heavily jointed rock masses with
intermediate stress conditions, if rock blocks or wedges are allowed to fall, failure
may progress into unravelling as in the example shown in Figure 2.24.
2.6.4 The Effects of Groundwater in Excavations
The underground excavation rock mass failures discussed earlier are either
structurally controlled-gravity driven or strength controlled-stress induced or a
combined result of the two. In some rocks containing water sensitive minerals, a
third group of failure is possible if groundwater is present in the rock mass
surrounding an underground excavation. The most common water induced failures
that do not fall into the failure categories discussed earlier are slaking and swelling.
Slaking is defined as a gradual breaking up of rock into pieces, flakes or fragments
when in contact with water. Slaking occurs in some moderately coherent and friable
rocks such as mudstone. Swelling is defined as gradual advancement of surrounding
rock into the excavation due to expansion caused by water absorption into the
constituent minerals. Typical examples of rocks that may suffer swelling are
anhydrite, halite and rocks that comprise swelling clay minerals such as
montmorillonite.
Apart from the above, as briefly mentioned in Section 2.6.1, water pressures in
discontinuities could contribute to structurally controlled failure by forcing the rock
blocks out of their sockets and also by reducing the shear strength of the
discontinuity surfaces, especially those with soft fillings. Large quantities of water
may also cause flowing ground in highly fractured or crushed rock masses with little
or no coherence.
Groundwater could also play a role in strength controlled-stress driven failures in
massive rock with no discontinuities discussed in Section 2.6.2. Here the water
pressure acting within the micro-cracks in a solid rock could reduce its strength and
influence failure. This phenomenon is similar to the effective stress concept in soil
mechanics but at much greater depths with significantly high stress conditions.
45
CHAPTER 3
METHODS OF UNDERGROUND SUPPORT DESIGN
3.1 Introduction
The design of support for underground excavations is often complicated due to the
lack of control over the rock mass conditions and the in situ stress field. For
instance, it is seldom possible to make an accurate measurement of either the
mechanical properties of a rock mass or the forces acting on it (Palmstrom and Stille,
2007). In almost all major underground openings constructed in rock, it is not
uncommon to intersect several different rock mass conditions. The differences could
be due to the presence of several rock types and discontinuity systems at the
excavation site or simply due to spatial variations in weathering, alteration and
fracturing of the same rock. An example of rock mass conditions that may be
encountered along a tunnel route is graphically presented in Figure 3.1. Even if a
comprehensive site investigation program is implemented, all variations in ground
conditions along an excavation route may not be detectable. In addition, the in situ
stresses acting on a rock mass can also vary due to several factors including surface
topography, depth and geological structure etc, and accurate determination of
stresses is difficult. As Brady and Brown (2004) succinctly put it, “The virgin state
of stress in a rock mass is not amenable to calculation by any known method, but
must be determined experimentally”. Thus, for major projects involving several
excavations, site specific stress fields may be determined during geotechnical
investigation or in the detailed design stage. However, for small to medium size
projects site specific in situ stress measurements may be cost prohibitive.
The complexity of the operating geological environment in some projects is such that
a precise understanding of its engineering behaviour can be obtained only after the
completion of the construction. Thus the underground excavation support design
process often has to be formalised for a largely unknown environment. Further, the
inherent variability of the engineering characteristics of rock masses and the
variability in the in situ stress field mean that no single design method would be
46
versatile enough to deal with all possible rock mass conditions that may be
encountered in an excavation project, even if conditions are known in advance.
Despite these complexities, during the past four decades, there have been significant
developments in support design methods. These are based on different approaches,
but they can supplement each other when applied to the conditions for which they
were developed. They can be broadly categorised into three different approaches:
o Observational,
o Empirical, and
o Rational.
These approaches are outlined in the following sections.
3.2 The Observational Approach
This approach calls for the instrumentation and monitoring of the excavation and the
development and implementation of the support design as excavation is progressed.
The aim is to determine the ground response to installed support, allowing the early
identification of possible problems and areas for improvements in the implemented
design. A well known observational method is the New Austrian Tunnelling Method
(NATM) (Rabcewicz, 1964a, 1964b, 1965). It is generally accepted that NATM has
evolved as a result of experience and innovations achieved in Austrian Alpine
tunnelling conditions (Whitaker and Frith, 1990). It involves the installation of
immediate temporary support (usually shotcrete; wire mesh, rock bolts and steel sets,
if necessary) to preserve the rock mass strength by minimising deformations and is
particularly suited to squeezing ground conditions. A major aim of NATM is to
learn from experience and continually update the support system by monitoring the
rock mass from within the tunnel (Whittaker and Frith, 1990). NATM relies on
performance monitoring for prediction and classification of ground conditions. It is
adapted to each new project based on previous experience and is also adapted during
a single project based on performance monitoring. A particular (NATM)
classification is, therefore, only applicable to the case for which it was developed and
modified so its use by others on other projects may be difficult (Barton, 1988).
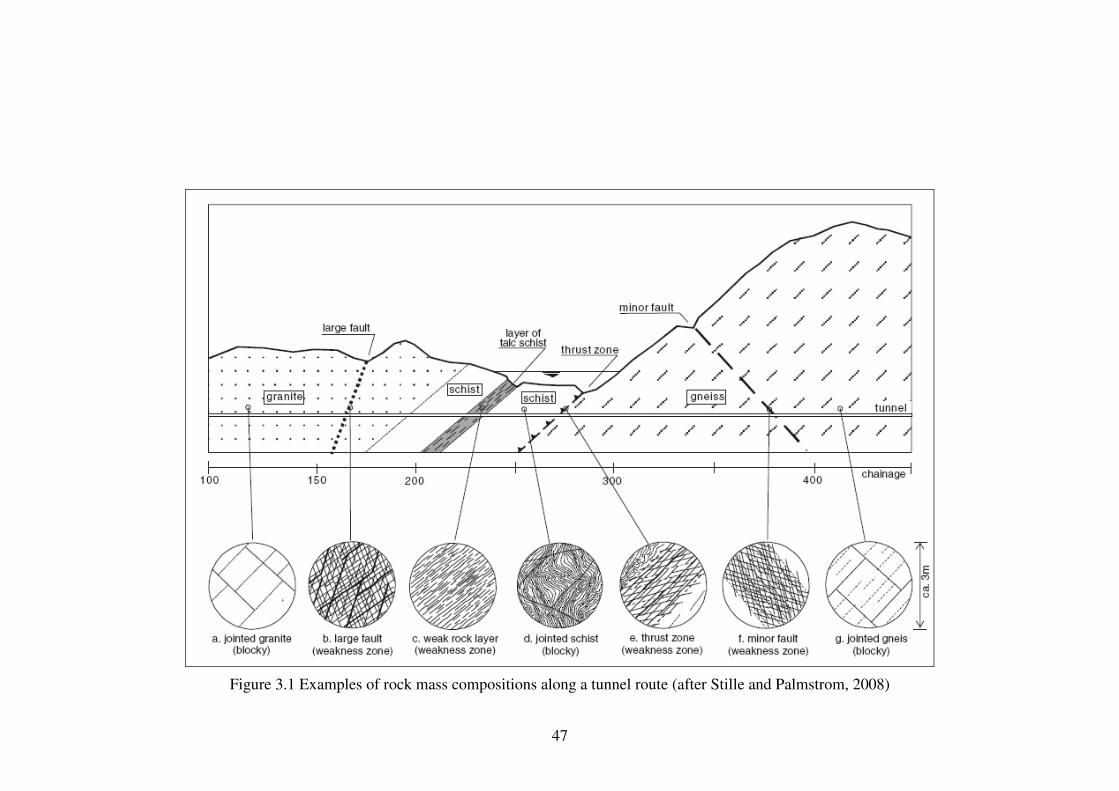
47
Figure 3.1 Examples of rock mass compositions along a tunnel route (after Stille and Palmstrom, 2008)
48
3.3 The Empirical Approach
A wide range of empirical methods has been developed over the years for the design
of support for underground excavations. These methods are based on precedent
practice and often involve some form of ground characterisation and a set of design
rules or guidelines. The rock mass classification systems such as RMR and Q, the
reliability of which is the subject of this study, constitute an integral part of the
empirical design approach of support design. Detailed discussions on the
development and relative merits of these methods are covered in Chapter 4. The
empirical design rules which are not based on rock mass classification are also in
use, such as that proposed by Lang (1961) for pattern bolting of underground
excavation. These guidelines developed based on a range of laboratory, field and
theoretical studies were subsequently adopted by the U.S. Corps of Engineers (1980).
Lang’s design rules are for the minimum bolt length L, with respect to bolt spacing s,
excavation span B, and the width of the critical and potentially unstable rock blocks
defined by the average discontinuity spacing b. Detailed discussion of Lang’s
guidelines can be found in Stillborg (1994), Brown (1999) and Brady and Brown
(2004). These guidelines can be used to determine the minimum rock bolts to be
included in the preliminary design.
3.4 The Rational Approach
Rational design methods are primarily aimed at predicting rock mass behaviour or
failure after the creation of underground excavations and the influence of different
support systems. They are founded on theoretical solutions involving the analysis of
(a) forces and stresses acting on the rock mass, (b) strains and deformations in the
rock mass, and (c) modes and mechanisms of its eventual collapse. In this approach
the problem at hand is expressed mathematically using simple equations in analytical
form such that a solution can be found by direct calculations, or using complex
differential equations which are solved by numerical methods. Depending on the
problem and the method used, design calculations may be simple limit equilibrium
type or may use comprehensive computations involving rock-support interaction
calculations taking account of the deformation and strength properties of the support
system and the complete stress-strain response of the rock mass.
49
Analytical methods include solutions based on elastic-plastic analysis of
rock-support interaction and rigid block stability analysis based on statics. As
mentioned in Section 2.6.2, for competent massive rock masses that may be assumed
to behave elastically, the solutions developed using the theory of elasticity are used.
Such solutions are readily available in numerous rock mechanics text books
including those by Obert and Duvall (1966), Jaeger (1972), Jaeger and Cook (1976),
Goodman (1989), Hoek and Brown (1980a) and Brady and Brown (2004). When
the rock is layered where bending and separation of strata are possible and the beds
are elastically deformable, the theory of elastic beam and plates can be invoked. For
weak rocks that undergo slow convergence or squeezing under stress, a solution for
stress and displacement derived from the theory of plasticity can be used. For rocks
that present time dependent properties, such as rock salt, the theory of linear
viscoelasticity provides useful concepts (Goodman, 1989). A main disadvantage of
these solutions is that they exist for simple or regular excavation geometries and
idealised rock mass conditions only. Nevertheless, they allow a better understanding
of rock-support interaction when the behaviour of rock mass is governed by its
elastic and/or plastic deformation properties and the stress field acting on it.
Analytical methods based on statics on the other hand specifically deal with the
stability issues arising from the presence of discontinuities in the rock mass. They
are aimed at predicting the stability of pre-identified kinematically unstable rock
blocks by limit equilibrium analysis. These methods assume that the potentially
unstable rock blocks are rigid and their movement is induced by the force of gravity.
They often ignore the in situ stress field and elastic deformation of the unstable rock
blocks and the surrounding rock mass. However, theoretical solutions such as those
developed by Elsworth (1986), Sofianos (1986), Sofianos et al. (1999), Nomikos et
al. (2002) can incorporate the in situ stresses and deformation of the rock mass.
Numerical modelling involves the derivation and solving of complex differential
equations representing the conditions and behaviour of rock masses. Basic
pre-requisites are the idealisation of the actual excavation within the rock mass and,
based on the available information, the division of the rock mass into different
sectors. Material property models are established for each of the sectors and also for
50
support elements. Complex differential equations are then derived to represent these
models and are solved by numerical methods. Most numerical modelling methods
apply discretisation of the rock mass into a large number of individual elements and
achieve an iterative solution by repetitive calculation in a computer. This technique
is used mainly for predicting induced stresses and elastic or plastic deformation in
massive rock masses, but can also be used for predicting discrete block movement in
jointed rock.
3.4.1 Support Design by the Rational Approach
Traditionally, the rational approach to underground excavation support design is
divided into two procedural domains based on the analysis of structurally controlled
gravity driven modes of instability and strength controlled stress driven instability
discussed in Chapter 2.
Structurally controlled gravity driven falls are common in underground excavations
in jointed rocks. The kinematically potential collapse modes such as slabs, beams,
prisms and wedges etc in the roof and walls of an excavation are identified by
detailed examination of the configuration of blocks defined by the known geometric
properties of the discontinuities and the size, shape and the orientation of the
excavation. Several techniques can be applied to assess the potential for such ground
falls provided that an appropriate failure mode is assumed. Typical failure modes that
can be analysed include prism, wedge and slab or beam failures. Models taking these
failure modes into account are generally utilized for stability assessments in low-
stress or near-surface excavations in jointed rock masses. For deep excavations with
high stress conditions or for shallower excavations in weaker rock masses, models
based on linear elastic stress and strain analysis, or variations thereof, can be used to
determine the location and extent of problematic stress concentrations around the
openings.
However, as outlined in Section 2.6.3 and illustrated in Figure 2.22, there are many
situations in which instability is a result of both structurally controlled and stress
induced failure of the rock mass. Recent developments in sophisticated numerical
modelling tools have made it possible to analyse some of the potential failures
51
caused by the combined effects of the geological structure and the high in situ stress
field in the rock mass surrounding excavations. Some of these tools are based on
discrete block models and can model the discontinuous nature of rock masses.
At present, depending on the rock mass conditions, several different rational methods
are used for underground excavation support design including: beam analysis,
tetrahedral wedge analysis, symmetric triangular prism analysis, natural rock arch
concept, rock-support interaction analysis, convergence control method and
numerical modelling based on both continuum and discrete block methods. In this
study three rational methods were used as and when applicable to the case studies
considered, namely, (a) suspended beam concept, (b) tetrahedral wedge analysis, and
(c) numerical modelling based on distinct element method. They are briefly
discussed in the following sections.
3.4.1.1 Design against beam failure
In horizontally stratified or layered rocks, the horizontal discontinuities create a
structural setup for rock beams or slabs to be formed in the excavation roof. In such
rocks, if the lamination partings are the only discontinuity set present, roof deflection
and stability can be assessed using conventional elastic beam deflection and lateral
stress calculation methods presented by Obert and Duvall (1966) and Hoek and
Brown (1980a). However, it is not uncommon to encounter other joint sets cutting
through the laminations of the stratified rock. These cross-cutting joints reduce and,
in the extreme, eliminate the ability of the rock mass to sustain boundary parallel
tensile stresses such as those assumed in conventional elastic beam analysis. In
laminated rocks with cross cutting joints, design against beam or slab failure can be
undertaken by two approaches: (a) the self-supporting (voussoir) beam concept, and
(b) the suspended beam concept.
The self-supporting beam concept
Several researchers have made significant contributions based on both experimental
and computational investigation to develop theoretical solutions for self supporting
roof beam (voussoir beam) design. Notable among these include the work of Adler
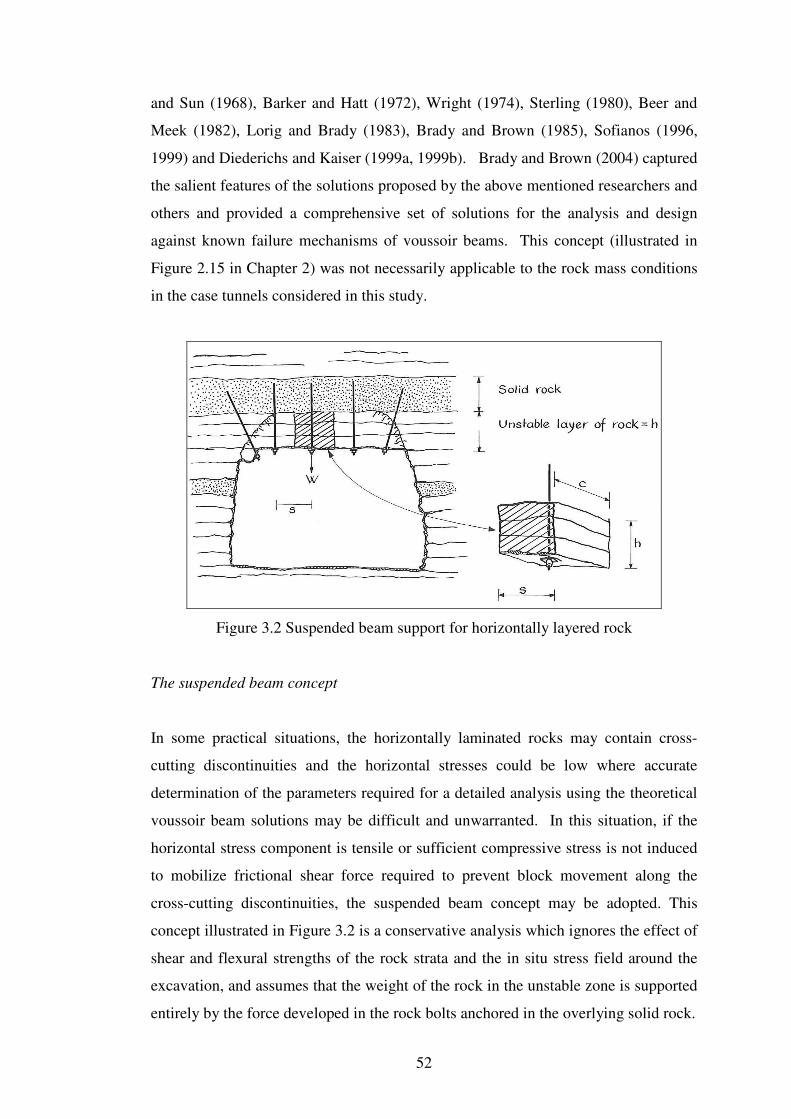
52
and Sun (1968), Barker and Hatt (1972), Wright (1974), Sterling (1980), Beer and
Meek (1982), Lorig and Brady (1983), Brady and Brown (1985), Sofianos (1996,
1999) and Diederichs and Kaiser (1999a, 1999b). Brady and Brown (2004) captured
the salient features of the solutions proposed by the above mentioned researchers and
others and provided a comprehensive set of solutions for the analysis and design
against known failure mechanisms of voussoir beams. This concept (illustrated in
Figure 2.15 in Chapter 2) was not necessarily applicable to the rock mass conditions
in the case tunnels considered in this study.
Figure 3.2 Suspended beam support for horizontally layered rock
The suspended beam concept
In some practical situations, the horizontally laminated rocks may contain cross-
cutting discontinuities and the horizontal stresses could be low where accurate
determination of the parameters required for a detailed analysis using the theoretical
voussoir beam solutions may be difficult and unwarranted. In this situation, if the
horizontal stress component is tensile or sufficient compressive stress is not induced
to mobilize frictional shear force required to prevent block movement along the
cross-cutting discontinuities, the suspended beam concept may be adopted. This
concept illustrated in Figure 3.2 is a conservative analysis which ignores the effect of
shear and flexural strengths of the rock strata and the in situ stress field around the
excavation, and assumes that the weight of the rock in the unstable zone is supported
entirely by the force developed in the rock bolts anchored in the overlying solid rock.
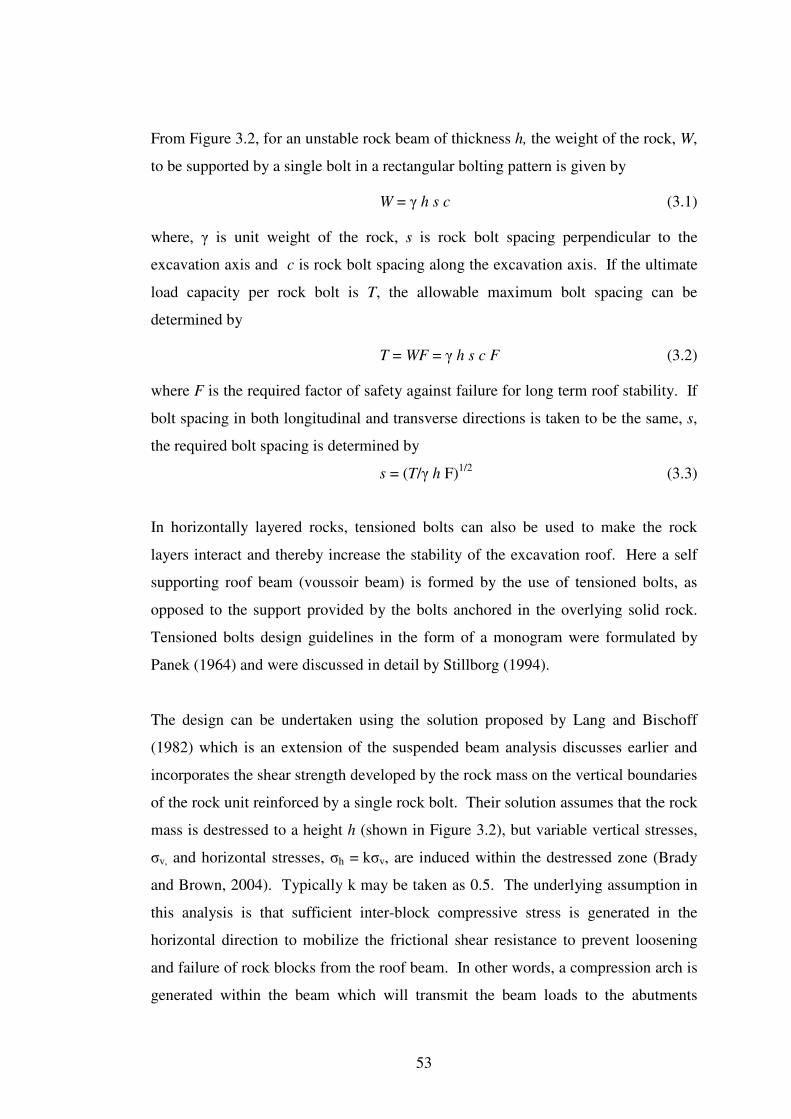
53
From Figure 3.2, for an unstable rock beam of thickness h, the weight of the rock, W,
to be supported by a single bolt in a rectangular bolting pattern is given by
W = γ h s c (3.1)
where, γ is unit weight of the rock, s is rock bolt spacing perpendicular to the
excavation axis and c is rock bolt spacing along the excavation axis. If the ultimate
load capacity per rock bolt is T, the allowable maximum bolt spacing can be
determined by
T = WF = γ h s c F (3.2)
where F is the required factor of safety against failure for long term roof stability. If
bolt spacing in both longitudinal and transverse directions is taken to be the same, s,
the required bolt spacing is determined by
s = (T/γ h F)1/2
(3.3)
In horizontally layered rocks, tensioned bolts can also be used to make the rock
layers interact and thereby increase the stability of the excavation roof. Here a self
supporting roof beam (voussoir beam) is formed by the use of tensioned bolts, as
opposed to the support provided by the bolts anchored in the overlying solid rock.
Tensioned bolts design guidelines in the form of a monogram were formulated by
Panek (1964) and were discussed in detail by Stillborg (1994).
The design can be undertaken using the solution proposed by Lang and Bischoff
(1982) which is an extension of the suspended beam analysis discusses earlier and
incorporates the shear strength developed by the rock mass on the vertical boundaries
of the rock unit reinforced by a single rock bolt. Their solution assumes that the rock
mass is destressed to a height h (shown in Figure 3.2), but variable vertical stresses,
σv, and horizontal stresses, σh = kσv, are induced within the destressed zone (Brady
and Brown, 2004). Typically k may be taken as 0.5. The underlying assumption in
this analysis is that sufficient inter-block compressive stress is generated in the
horizontal direction to mobilize the frictional shear resistance to prevent loosening
and failure of rock blocks from the roof beam. In other words, a compression arch is
generated within the beam which will transmit the beam loads to the abutments
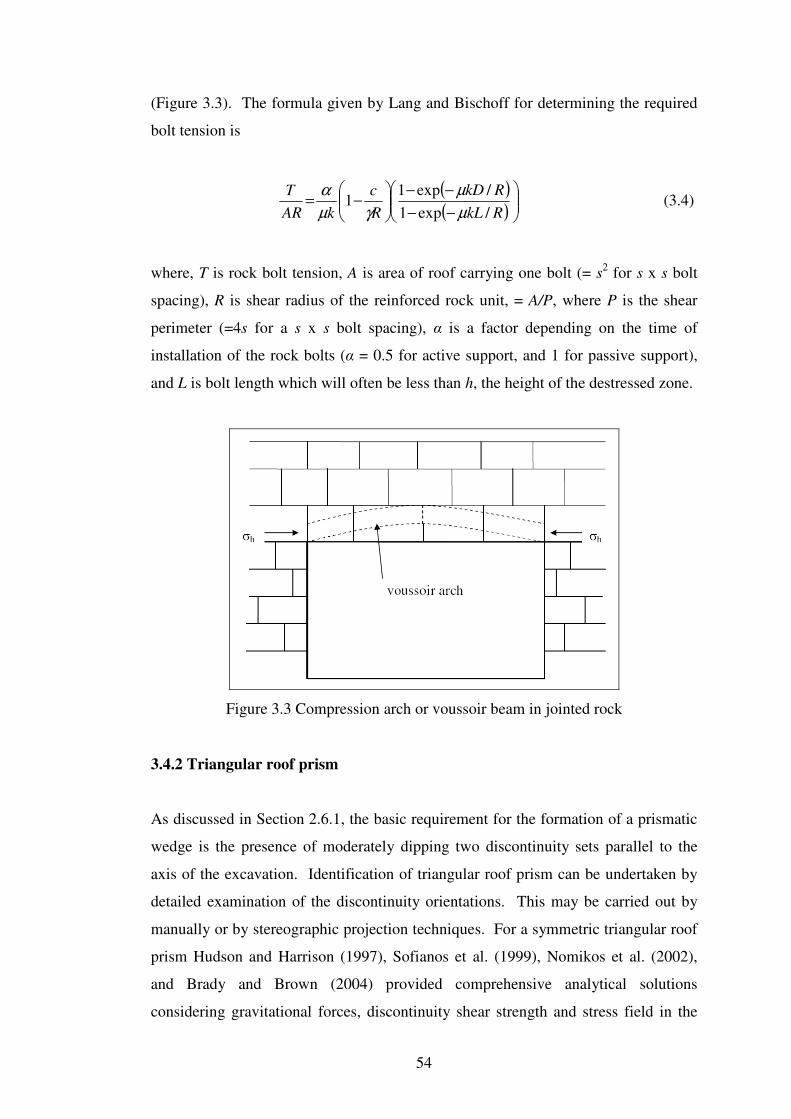
54
(Figure 3.3). The formula given by Lang and Bischoff for determining the required
bolt tension is
( )( )
)4.3(/exp1
/exp11
−−
−−
−=
RkL
RkD
R
c
kAR
T
µ
µ
γµ
α
where, T is rock bolt tension, A is area of roof carrying one bolt (= s2 for s x s bolt
spacing), R is shear radius of the reinforced rock unit, = A/P, where P is the shear
perimeter (=4s for a s x s bolt spacing), α is a factor depending on the time of
installation of the rock bolts (α = 0.5 for active support, and 1 for passive support),
and L is bolt length which will often be less than h, the height of the destressed zone.
Figure 3.3 Compression arch or voussoir beam in jointed rock
3.4.2 Triangular roof prism
As discussed in Section 2.6.1, the basic requirement for the formation of a prismatic
wedge is the presence of moderately dipping two discontinuity sets parallel to the
axis of the excavation. Identification of triangular roof prism can be undertaken by
detailed examination of the discontinuity orientations. This may be carried out by
manually or by stereographic projection techniques. For a symmetric triangular roof
prism Hudson and Harrison (1997), Sofianos et al. (1999), Nomikos et al. (2002),
and Brady and Brown (2004) provided comprehensive analytical solutions
considering gravitational forces, discontinuity shear strength and stress field in the
55
rock mass surrounding the excavation. However, for asymmetric roof prisms, the
analytical solution is somewhat more complex than that for the symmetric prism.
For the general (asymmetric) case, the solution can be simplified if the stress field
around the excavation is ignored. For a falling roof wedge illustrated in Figure 3.4
which ignores the effect of stress field, the number of bolts required is given by
)5.3(B
FWN
×=
where, N=number of rock bolts, W=weight of wedge, F=factor of safety, B=load
bearing capacity of each bolt.
Figure 3.4 Rock bolt support for a falling roof wedge (after Stillborg, 1994)
For a sliding wedge in sidewalls as illustrated in Figure 3.5, the number of bolts, N,
required is
)6.3()sintan(cos
)tancossin(
αφα
φββ
FB
cAFWN
+
−−=
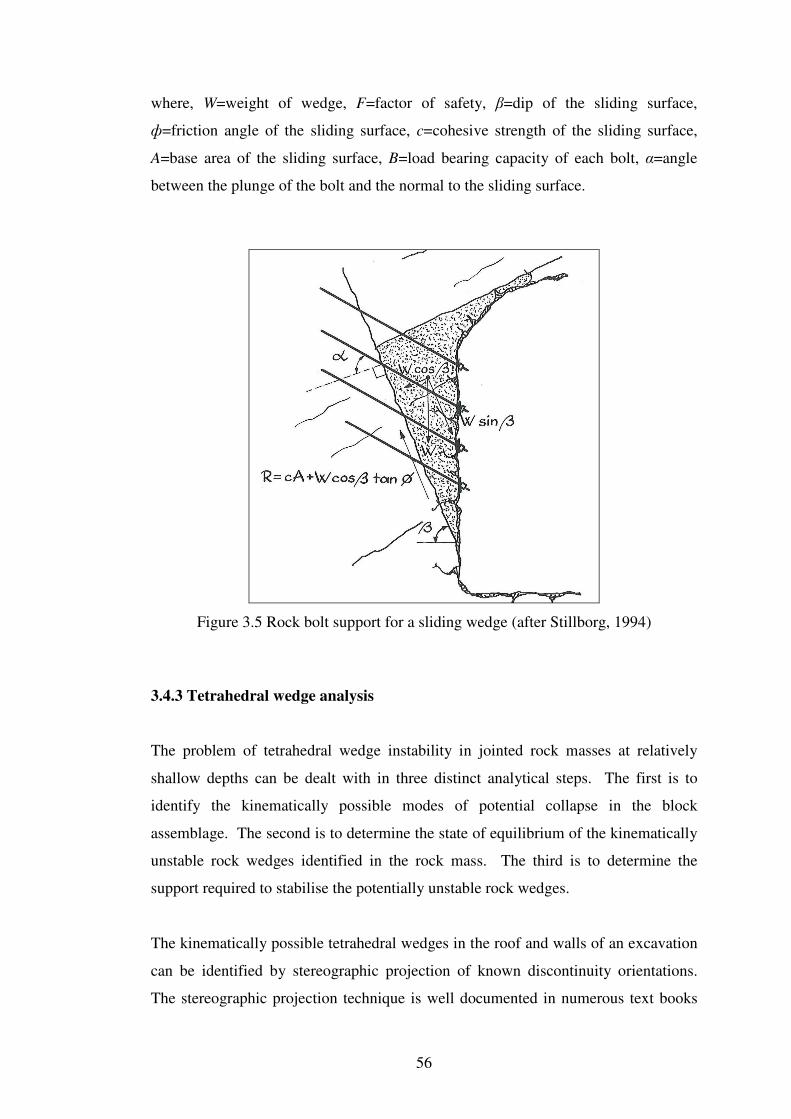
56
where, W=weight of wedge, F=factor of safety, β=dip of the sliding surface,
ф=friction angle of the sliding surface, c=cohesive strength of the sliding surface,
A=base area of the sliding surface, B=load bearing capacity of each bolt, α=angle
between the plunge of the bolt and the normal to the sliding surface.
Figure 3.5 Rock bolt support for a sliding wedge (after Stillborg, 1994)
3.4.3 Tetrahedral wedge analysis
The problem of tetrahedral wedge instability in jointed rock masses at relatively
shallow depths can be dealt with in three distinct analytical steps. The first is to
identify the kinematically possible modes of potential collapse in the block
assemblage. The second is to determine the state of equilibrium of the kinematically
unstable rock wedges identified in the rock mass. The third is to determine the
support required to stabilise the potentially unstable rock wedges.
The kinematically possible tetrahedral wedges in the roof and walls of an excavation
can be identified by stereographic projection of known discontinuity orientations.
The stereographic projection technique is well documented in numerous text books
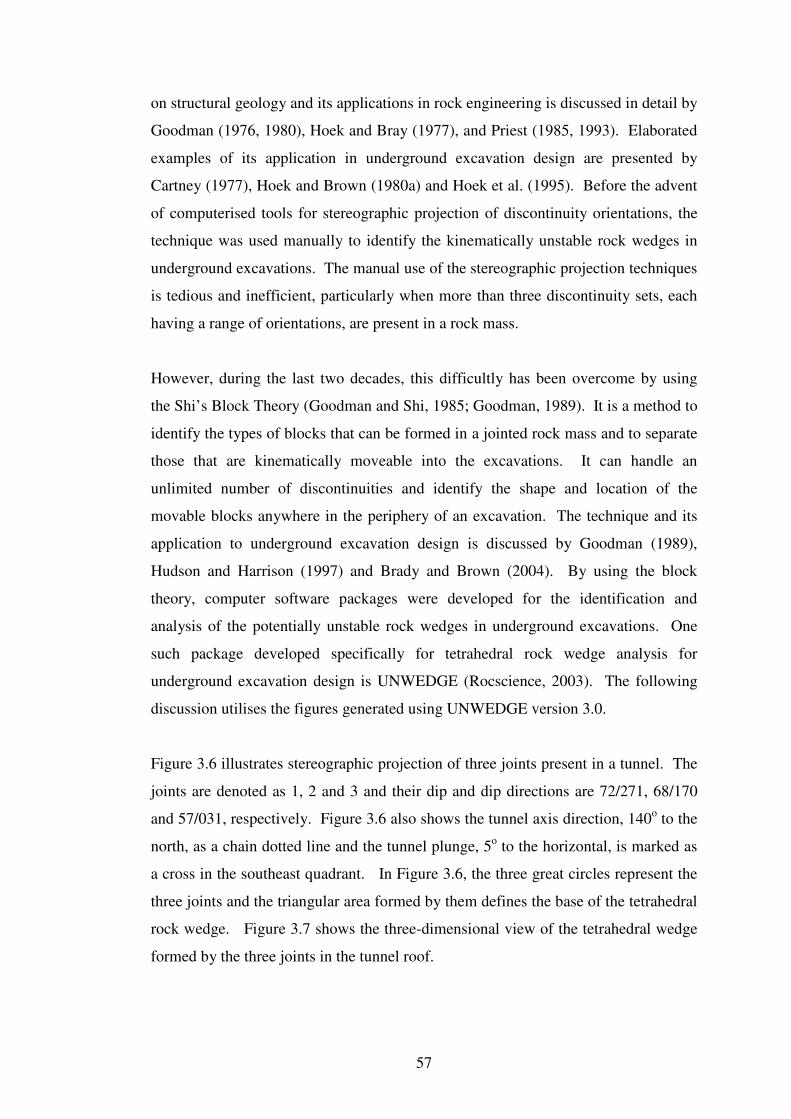
57
on structural geology and its applications in rock engineering is discussed in detail by
Goodman (1976, 1980), Hoek and Bray (1977), and Priest (1985, 1993). Elaborated
examples of its application in underground excavation design are presented by
Cartney (1977), Hoek and Brown (1980a) and Hoek et al. (1995). Before the advent
of computerised tools for stereographic projection of discontinuity orientations, the
technique was used manually to identify the kinematically unstable rock wedges in
underground excavations. The manual use of the stereographic projection techniques
is tedious and inefficient, particularly when more than three discontinuity sets, each
having a range of orientations, are present in a rock mass.
However, during the last two decades, this difficultly has been overcome by using
the Shi’s Block Theory (Goodman and Shi, 1985; Goodman, 1989). It is a method to
identify the types of blocks that can be formed in a jointed rock mass and to separate
those that are kinematically moveable into the excavations. It can handle an
unlimited number of discontinuities and identify the shape and location of the
movable blocks anywhere in the periphery of an excavation. The technique and its
application to underground excavation design is discussed by Goodman (1989),
Hudson and Harrison (1997) and Brady and Brown (2004). By using the block
theory, computer software packages were developed for the identification and
analysis of the potentially unstable rock wedges in underground excavations. One
such package developed specifically for tetrahedral rock wedge analysis for
underground excavation design is UNWEDGE (Rocscience, 2003). The following
discussion utilises the figures generated using UNWEDGE version 3.0.
Figure 3.6 illustrates stereographic projection of three joints present in a tunnel. The
joints are denoted as 1, 2 and 3 and their dip and dip directions are 72/271, 68/170
and 57/031, respectively. Figure 3.6 also shows the tunnel axis direction, 140o to the
north, as a chain dotted line and the tunnel plunge, 5o to the horizontal, is marked as
a cross in the southeast quadrant. In Figure 3.6, the three great circles represent the
three joints and the triangular area formed by them defines the base of the tetrahedral
rock wedge. Figure 3.7 shows the three-dimensional view of the tetrahedral wedge
formed by the three joints in the tunnel roof.

58
Figure 3.6 An equal area lower hemisphere stereographic plot of three joints, which
form a tetrahedral wedge in the tunnel roof
Figure 3.7 A tetrahedral roof wedge formed by three joints
In the lower hemisphere stereographic projection shown in Figure 3.6, any vertical
line is represented by the cross in the centre. If a vertical line drawn through the
apex of a tetrahedral wedge falls within its base area as in Figure 3.6, the wedge has
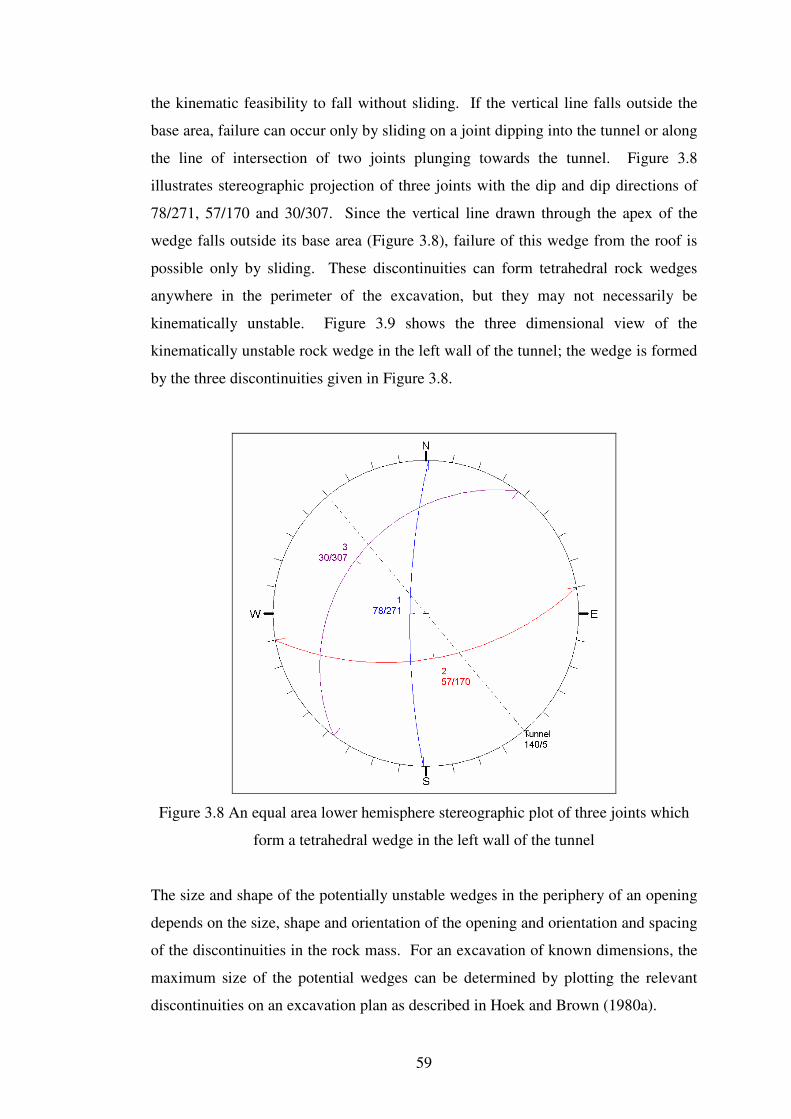
59
the kinematic feasibility to fall without sliding. If the vertical line falls outside the
base area, failure can occur only by sliding on a joint dipping into the tunnel or along
the line of intersection of two joints plunging towards the tunnel. Figure 3.8
illustrates stereographic projection of three joints with the dip and dip directions of
78/271, 57/170 and 30/307. Since the vertical line drawn through the apex of the
wedge falls outside its base area (Figure 3.8), failure of this wedge from the roof is
possible only by sliding. These discontinuities can form tetrahedral rock wedges
anywhere in the perimeter of the excavation, but they may not necessarily be
kinematically unstable. Figure 3.9 shows the three dimensional view of the
kinematically unstable rock wedge in the left wall of the tunnel; the wedge is formed
by the three discontinuities given in Figure 3.8.
Figure 3.8 An equal area lower hemisphere stereographic plot of three joints which
form a tetrahedral wedge in the left wall of the tunnel
The size and shape of the potentially unstable wedges in the periphery of an opening
depends on the size, shape and orientation of the opening and orientation and spacing
of the discontinuities in the rock mass. For an excavation of known dimensions, the
maximum size of the potential wedges can be determined by plotting the relevant
discontinuities on an excavation plan as described in Hoek and Brown (1980a).
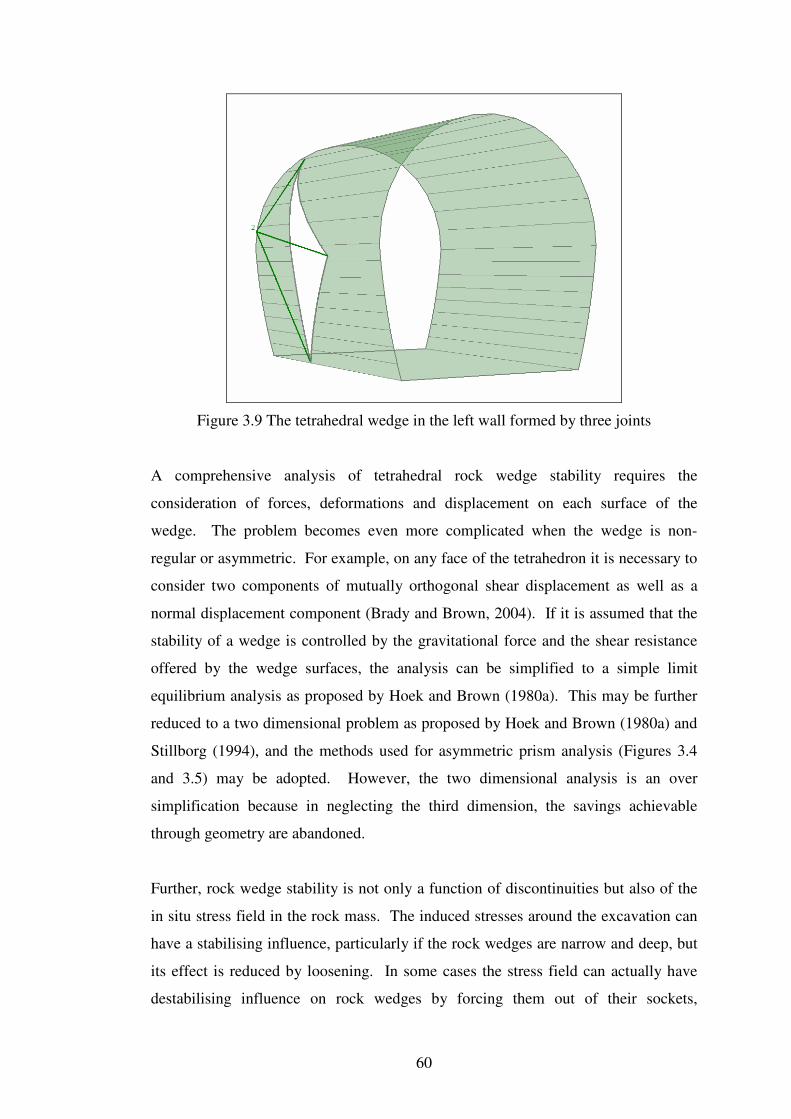
60
Figure 3.9 The tetrahedral wedge in the left wall formed by three joints
A comprehensive analysis of tetrahedral rock wedge stability requires the
consideration of forces, deformations and displacement on each surface of the
wedge. The problem becomes even more complicated when the wedge is non-
regular or asymmetric. For example, on any face of the tetrahedron it is necessary to
consider two components of mutually orthogonal shear displacement as well as a
normal displacement component (Brady and Brown, 2004). If it is assumed that the
stability of a wedge is controlled by the gravitational force and the shear resistance
offered by the wedge surfaces, the analysis can be simplified to a simple limit
equilibrium analysis as proposed by Hoek and Brown (1980a). This may be further
reduced to a two dimensional problem as proposed by Hoek and Brown (1980a) and
Stillborg (1994), and the methods used for asymmetric prism analysis (Figures 3.4
and 3.5) may be adopted. However, the two dimensional analysis is an over
simplification because in neglecting the third dimension, the savings achievable
through geometry are abandoned.
Further, rock wedge stability is not only a function of discontinuities but also of the
in situ stress field in the rock mass. The induced stresses around the excavation can
have a stabilising influence, particularly if the rock wedges are narrow and deep, but
its effect is reduced by loosening. In some cases the stress field can actually have
destabilising influence on rock wedges by forcing them out of their sockets,
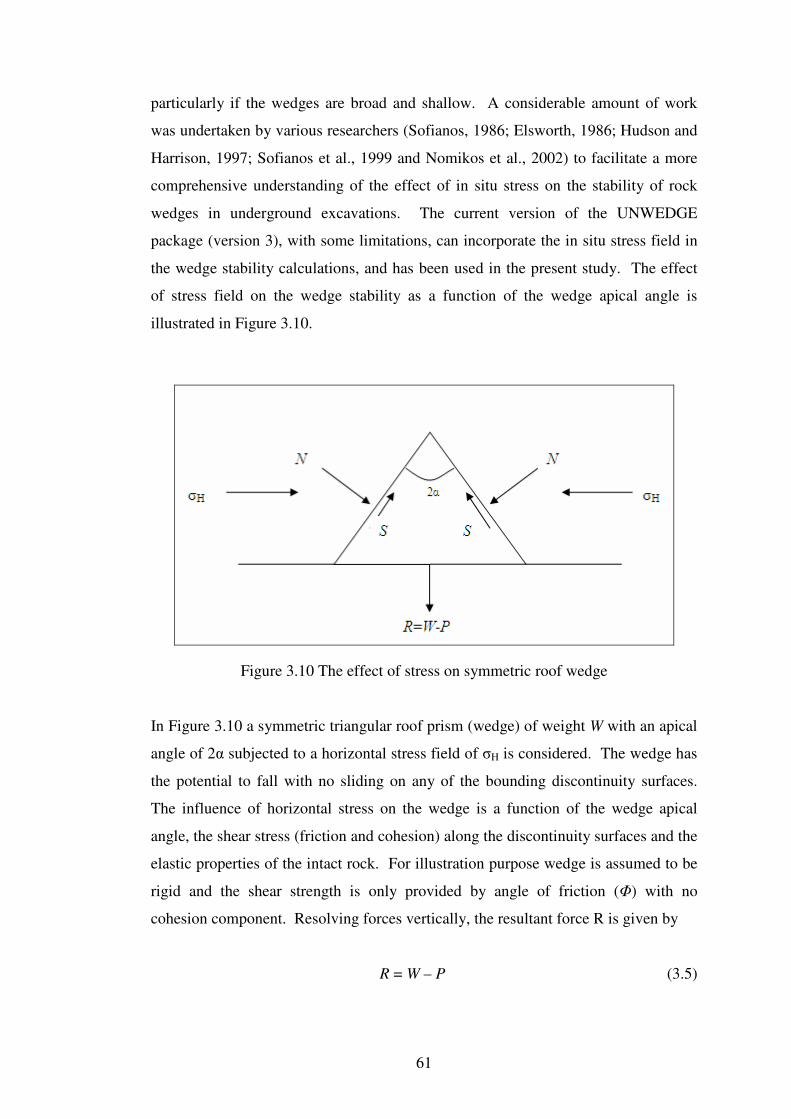
61
particularly if the wedges are broad and shallow. A considerable amount of work
was undertaken by various researchers (Sofianos, 1986; Elsworth, 1986; Hudson and
Harrison, 1997; Sofianos et al., 1999 and Nomikos et al., 2002) to facilitate a more
comprehensive understanding of the effect of in situ stress on the stability of rock
wedges in underground excavations. The current version of the UNWEDGE
package (version 3), with some limitations, can incorporate the in situ stress field in
the wedge stability calculations, and has been used in the present study. The effect
of stress field on the wedge stability as a function of the wedge apical angle is
illustrated in Figure 3.10.
Figure 3.10 The effect of stress on symmetric roof wedge
In Figure 3.10 a symmetric triangular roof prism (wedge) of weight W with an apical
angle of 2α subjected to a horizontal stress field of σH is considered. The wedge has
the potential to fall with no sliding on any of the bounding discontinuity surfaces.
The influence of horizontal stress on the wedge is a function of the wedge apical
angle, the shear stress (friction and cohesion) along the discontinuity surfaces and the
elastic properties of the intact rock. For illustration purpose wedge is assumed to be
rigid and the shear strength is only provided by angle of friction (Φ) with no
cohesion component. Resolving forces vertically, the resultant force R is given by
R = W – P (3.5)
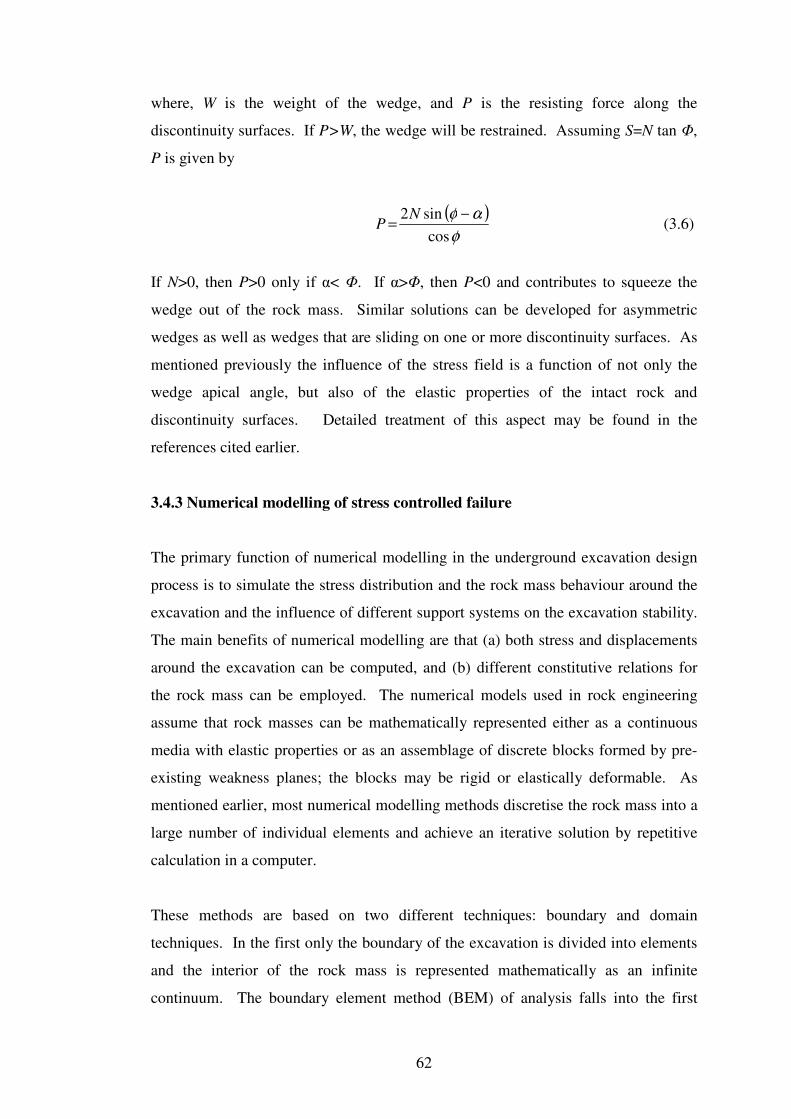
62
where, W is the weight of the wedge, and P is the resisting force along the
discontinuity surfaces. If P>W, the wedge will be restrained. Assuming S=N tan Φ,
P is given by
( ))6.3(
cos
sin2
φ
αφ −=
NP
If N>0, then P>0 only if α< Φ. If α>Φ, then P<0 and contributes to squeeze the
wedge out of the rock mass. Similar solutions can be developed for asymmetric
wedges as well as wedges that are sliding on one or more discontinuity surfaces. As
mentioned previously the influence of the stress field is a function of not only the
wedge apical angle, but also of the elastic properties of the intact rock and
discontinuity surfaces. Detailed treatment of this aspect may be found in the
references cited earlier.
3.4.3 Numerical modelling of stress controlled failure
The primary function of numerical modelling in the underground excavation design
process is to simulate the stress distribution and the rock mass behaviour around the
excavation and the influence of different support systems on the excavation stability.
The main benefits of numerical modelling are that (a) both stress and displacements
around the excavation can be computed, and (b) different constitutive relations for
the rock mass can be employed. The numerical models used in rock engineering
assume that rock masses can be mathematically represented either as a continuous
media with elastic properties or as an assemblage of discrete blocks formed by pre-
existing weakness planes; the blocks may be rigid or elastically deformable. As
mentioned earlier, most numerical modelling methods discretise the rock mass into a
large number of individual elements and achieve an iterative solution by repetitive
calculation in a computer.
These methods are based on two different techniques: boundary and domain
techniques. In the first only the boundary of the excavation is divided into elements
and the interior of the rock mass is represented mathematically as an infinite
continuum. The boundary element method (BEM) of analysis falls into the first
63
class. Examples of commercially available BEM codes that are widely used in
underground excavation design are EXAMINE-2D and EXAMINE-3D (Rocscience,
2009a, 2009b).
The domain technique divides the interior of the rock mass into geometrically simple
zones each with assumed properties. The collective behaviour and interaction of
these simplified zones model the more complex behaviour of the rock mass. Both
continuous and discontinuous media can be modelled using domain technique. The
finite element method (FEM) and finite difference method (FDM) are domain
methods that treat the rock mass as a continuum, and the distinct element method
(DEM) and discontinuous deformation analysis (DDA) are domain methods that
model each individual block as a unique element in a discontinuous medium.
PHASE2 (Rocscience, 1999) is a two dimensional, plane strain, FEM code suitable
for modelling continuous media. FLAC and FLAC3D (Itasca, 2003a, 2003b) are
FDM codes intended for rock masses that may behave as a continuum media, or
sparsely jointed media. These software codes are useful for the analysis of rock
instability caused by stresses with little or no influence from the discontinuities in the
rock mass. The problem with the continuum media codes is that the assumption of a
continuum may not be realistic for moderately jointed rock masses with intermediate
stress conditions.
In contrast, UDEC and 3DEC (Itasca, 2004a, 2004b) are DEM codes that treat rock
mass as an assemblage of discrete polygonal blocks and are well suited for modelling
the effects of discontinuities in the rock mass and the behaviour of rock blocks
formed by intersecting discontinuities. Since the rock masses encountered in the
case tunnels studied in this research were mostly moderately jointed with
intermediate stress conditions, UDEC was suitable and used.
The Universal Distinct Element Code (UDEC)
UDEC is a two dimensional stress and deformation analysis program that simulates
the response of discontinuous media such as jointed rock masses subjected to either
static or dynamic loading; the media is represented as an assemblage of discrete
blocks. This approach requires that the location and, more importantly, the
64
orientation of the discontinuities are known before the analysis is begun. The
program can best be used when the geologic structure of the rock mass is fairly well
understood from observations or mapping. Both manual and automatic joint
generators are built into the program to create individual and sets of discontinuities
which represent in two dimensions the jointed structure in a rock mass. Figure 3.11
shows a two dimensional presentation of four sets of discontinuities in a rock mass.
Another advantage of UDEC is its ability to model excavations with irregular shapes
resulting from geological over breaks, as can be seen from Figure 3.11.
Figure 3.11 UDEC model for four joint sets in a rock mass
In UDEC the discontinuities are treated as boundary conditions between blocks;
large displacements along discontinuities and rotation of blocks are allowed.
Individual blocks behave as either rigid or deformable material. Deformable blocks
are subdivided into a mesh of finite difference elements, and each element responds
according to a prescribed linear or nonlinear stress-strain law. The relative motion of
the discontinuities is also governed by linear or nonlinear force-displacement
relations for movements in both the normal and shear directions. UDEC is ideally
suited to study potential modes of rock failure directly related to the presence of
discontinuities. Failure through the intact rock material can be judged from the

65
results of the modelling in the same manner as for the continuum models, but it is not
possible to simulate the formation of a fracture through intact rock material.
The program allows the simulation of the effects of support elements such as rock
bolts, cable anchors ands shotcrete etc installed in an excavation as well as several
other features including water seepage into and out of an excavation.
66
CHAPTER 4
ROCK MASS CLASSIFICATION METHODS
4.1 Introduction
In underground excavation engineering, rock mass classification methods have
always played an important role, particularly in predicting support requirements for
excavations in rock. Based on experience in broadly similar ground conditions
elsewhere in previous projects, these methods relate rock mass conditions to support
requirements and construction procedures in new projects. In other words, the
classification methods are derived from a collection of prototype observations and
they avoid the analysis of the potential failure mechanisms and the forces required to
stabilise unstable rocks.
In contrast the rational or theoretical approach to underground excavation design
uses explicit models representing the behaviour of rock masses developed based on
the principles of the mechanics of materials. The application of this approach
requires access to accurate information on the rock mass properties, groundwater
conditions and in situ stress condition, and is often time consuming and costly.
While both approaches serve the same purpose, the classification methods are used
when there is insufficient information to establish an explicit model or when time
and cost limitations prevent the use of other models. This means in underground
excavation engineering these are primarily found in two applications:
1. Before the commencement of construction when geological, geotechnical and
construction data are limited, but time is not strictly limited. At this stage the
main applications are for detailed planning and the design of initial support,
determination of construction procedure and preliminary design of final
support.
67
2. During construction when detailed information on the rock mass can be
readily obtained by observations or simple tests, but time is limited due to
contractual obligations and project completion deadlines. The main
applications at this stage are for the determination and adaptation of initial
support details, determination or confirmation of construction procedure and
detailed design of the final support.
In order to be efficient and reliable at both stages of these applications, as noted by
Steiner and Einstein (1980), a rock mass classification method should:
o be easily applicable and robust
o use easily determinable input parameters
o accurately represent rock mass behaviour
o avoid subjectivity
o ensure safety and economy
These are briefly discussed.
4.1.1 Applicability and robustness
A classification method should be applicable to a wide range of ground conditions,
opening sizes and shapes, different construction procedures and support types.
Although some experience in underground excavation design and construction may
be a prerequisite, the application process of classification methods should not require
a high level of skills. After a few applications, a user should be able to easily and
confidently make required judgemental decisions. Simplicity of form and clarity and
un-ambiguity of the terminology used are important features. In particular, the
method should be relatively insensitive to vagaries in judgement either by the same
user or by different users (Steiner and Einstein, 1980). It should be robust and
repeatable without subjectivity and user bias, and also be applicable to a wide range
of projects and project specific requirements. If this is not the case, the range of
applicability should be explicitly described. For instance, road and railway tunnels
have different requirements compared to water conveyance tunnels. Diverse
requirements may also be applicable to different water conveyance tunnels. For
68
example, water seepage from a water tunnel may be acceptable in some situations
but not in others due to the economic value of water and potential problems in the
surrounding environment that may not be acceptable.
4.1.2 Easily determinable parameters
While incorporation of the most significant geological and geotechnical parameters
is of paramount importance, these should be easily determinable from standard
investigation methods, which generally include core drilling and logging, rock
outcrop mapping and geophysical techniques, and also from direct observations in
excavations. Some simple physical testing may also be used. Only a limited number
of parameters can be determined from the data sources available at the
pre-construction (or exploration) stage, but time is not a limiting factor. In contrast,
observations during construction in the excavation detect many details, but time is
often limited. Parameters that can be easily obtained from outcrops and boreholes or
quickly observed or measured in the excavation are desirable. Ideally, the
parameters obtained at any stage of a project should lead to the same conclusions
regarding the rock mass conditions and support requirements for excavations.
4.1.3 Accuracy of the method
Ground behaviour around an excavation is generally influenced by several factors
such as lithology, the geological structure, groundwater and the in situ stress field.
Some of these factors have several sub-factors with widely varying properties. For
instance, geological structure includes joints, bedding shears and faults etc as well as
their orientation, spacing, continuity, surface characteristics and filling materials etc.
Lithology on the other hand may represent intact rock characteristics such as
strength, elastic or plastic deformability, swelling and slaking etc. In strong
discontinuous rock masses, the physical characteristics of geological structural
features, i.e. orientation, persistence, spacing, aperture etc can vary in a wide range
and their effect on the rock mass can be significant. However, in weak or weathered
rock, the intact rock strength may become more important compared to geological
discontinuities. The effect of geological structure may also depend on the size and
orientation of the excavation. Similarly in deep excavations in situ or induced stress
69
field may be the governing factor of stability while geological structure plays only a
secondary role. Ideally the classification method should assess the relative
importance of these factors and represent as exactly as possible their relative
influence on different excavations. All relevant parameters should be accounted for
by giving adequate ratings in the system, but no parameter should be counted more
than once as this may reduce the weight of the other relevant parameters. In other
words, the ground should be characterised by parameters that are exactly congruent
with the true factors and their relative influence, and precautions be taken to avoid
double counting of the same parameter.
4.1.4 Subjectivity
Naturally occurring rocks are anisotropic and non-homogeneous with widely varying
properties. For instance, as already indicated, the characteristics of geological
structural features, i.e. joint spacing, orientation, persistence etc that govern the
behaviour of the rock mass can vary in a wide range. Similarly, other factors such as
groundwater and lithology etc can also vary significantly. The determination of
representative conditions or values of these factors should not involve uncertainty
and subjectivity.
For a classification system to be devoid of subjectivity, the rock mass parameters
should be identified quantitatively and their variations within the zone of interest
accounted for in the assessment of a rock mass. The assessment or the allocation of
numerical values for the parameters should not be user dependant. Where possible
use of lump-sum ratings should be avoided as this leads to subjective adjustments
when allocating rating values. Continuous rating systems, instead of lump-ratings,
as proposed by Sen and Sadagah (2003) could reduce subjectivity. When the
condition of a parameter varies, meaning the allocation of more than one value is
possible, the system should provide guidance on the selection of the most critical
value or a range of values for the assessment of the rock mass.
70
4.1.5 Safety and economy
Support and construction procedures should neither be overly conservative nor be
optimistic and compromise safety. Ideally, the degree of safety provided should be
known and be congruent with that required for different projects and different stages
and/or sections of the same project. This means a pre-determinable factor of safety,
which may change from case to case, should be included in the method. Built-in
safety factors of unknown magnitude are not desirable.
4.1.6 The Available Rock Mass Classification Methods
Rock mass classification methods are known to have been used as a tool in rock
engineering for over 100 years. According to Hoek et al. (1995), the earliest
recorded attempt to formalise a rock mass classification method for predicting tunnel
support requirements was by Ritter in 1879. Since then several methods have been
developed and used in tunnel support design in different parts of the world. A
comprehensive review of the classification methods was undertaken by Steiner and
Einstein (1980). Subsequent to that review, some of the methods have been revised
and updated and new methods have also been introduced. Methods that have been
used in designing support for underground excavations in rock known to be available
in the public domain include:
o Ritter’s Method (Ritter, 1879)
o Bierbaumer’s Method (Bierbaumer (1913)
o Kommerell’s Method (Kommerell, 1940)
o Terzaghi’s Rock Load Method (Terzaghi, 1946)
o Lauffer’s Method (Lauffer, 1958, 1960)
o Stini’s Method (Stini, 1960)
o Rock Quality Designation - RQD (Deere, 1963, 1968; Deere et al., 1967)
o Rock Structure Rating – RSR (Wickham et al., 1972, 1974)
o Rock Mass Rating – RMR (Bieniawski, 1973); and modifications thereof
o Tunnelling Quality Index – Q (Barton et al., 1974)
o Louis Method (Louis, 1974a, 1974b)
o Franklin’s Method (Franklin, 1975, 1976)
71
o Rock Mass Index – RMi (Palmstrom, 1995, 1996a, 199b)
Up until the mid 1970s, Terzagi’s Method, which is based on a descriptive
classification of rock masses to estimate the rock load carried by steel sets, received
the greatest attention of the tunnelling industry. Since its introduction, this method
was extensively used for some 40 years, particularly in the USA, however, it is not
directly applicable to the modern techniques of tunnel support comprising shotcrete
and rock bolts, and is not widely used at present.
In general, of all the methods listed, Rock Quality Designation (RQD) can be singled
out as the only method accepted universally, albeit not necessarily for tunnel support
design. While RQD may be used for tunnel support design, it was originally
developed as a simple and inexpensive indicator of general rock mass quality for
various rock engineering projects. Subsequently, its use was extended to several
different applications including the estimation of support for underground
excavations. However, its application as a support design tool did not receive much
acceptance, because a single parameter index system such as this cannot accurately
predict the behaviour of a rock mass.
At present, the most widely used rock mass classification methods for underground
excavation support design are Rock Mass Rating (RMR) and Tunnelling Quality
Index (Q). In some situations some of the other methods can be of relevance and of
considerable use, but unlike RMR and Q, they are not widely used in underground
excavation design applications at present.
A relatively recent addition to the list of rock mass classifications is the RMi system
(Palmstrom, 1996, 2000 and 2005). Compared to the other systems, this method is
considered to better represent the size of rock blocks that form the rock mass.
However, it is yet to gain wide acceptance as a support design tool for underground
excavations. Among the other rock mass classification methods used in rock
engineering applications, the Geological Strength Index (GSI) discussed in Section
2.5.2 deserves a mention. Developed by Hoek and co-workers (Hoek, 1994; Hoek,
Kaiser and Bawden, 1995; Hoek and Brown, 1997; Hoek, Marinos and Benissi,
1998; Marinos and Hoek, 2001) it is a tool for estimating two of the constants in the
72
Hoek-Brown failure criterion of intact rock and rock masses. Although GSI is useful
as a platform for providing input values to numerical methods of underground
excavation design, on its own right, it is not a method of support design.
During the past few decades, rock engineering researchers in China have also
proposed several rock mass classification methods for the application in tunnelling.
These methods were published in Chinese and up to now are not available in English
to rock engineering practitioners in other countries. Chinese researchers Lee et al.
(1996), however, presented a classification system intended for water resources and
hydroelectric power tunnels in China. This system is based on six rock mass
parameters similar to the RMR and Q systems and may be considered an
improvement of the RMR and Q systems as it takes into account almost all the
parameters covered by the two.
A method known as the CRIEPI system also deserves mention as it was used in some
of the case tunnels discussed in this research. The CRIEPI system was initially
developed for dam engineering works by Tanaka (1964) and Kikuchi et al. (1982) of
the Central Research Institute of Electric Power Industry (CRIEPI) of Japan. The
Electric Power Development Co Ltd (EPDC) of Japan modified the CRIEPI system
and used a simplified version for underground excavations in sedimentary rocks in
the Northeastern Province of Thailand and the modified system was found to give
reasonable results in underground excavation design (Phienwej and Anwar, 2005).
The system uses three rock mass parameters: weathering, hardness (expressed in
terms of UCS of intact rock substance) and joint spacing. However, up to now, the
use of this method is limited to projects designed by EPDC.
One other method widely used (not included in the list) is the New Austrian
Tunnelling Method (NATM) (Rabcewicz, 1964a, 1964b, 1965). Although NATM is
sometimes considered as an empirical design tool based on the classification of rock
mass, it can be more accurately described as an observational approach. A brief
discussion of NATM is provided in Section 3.2.
Singh and Goel (1999) provided a comprehensive discussion on the application of
some of the rock mass classification methods to both underground and surface
73
excavations as well as to predict engineering properties of rock masses. They dealt
with the application of Terzaghi’s rock load concept, RQD, RMR, Q, RMi, GSI,
NATM and one truncated version each of RMR and Q. They proposed some
improvements, particularly to the Q system, based on the research undertaken in
India in collaboration with the Norwegian Geotechnical Institute where the Q system
was developed. Their research has mostly being in the tunnel constructed under high
in situ stress conditions in the Himalayas. Their finding and recommendations will
be discussed in Chapter 5.
Despite the availability of several rock mass classification methods, only the RMR
and Q methods have been universally accepted as underground excavation design
tools. Unlike the single parameter RQD, these two methods are multi-parameter
classifications. Both use RQD as one of the key parameters to classify a rock mass.
The RQD, RMR and Q methods are discussed in the following sections.
4.2 Rock Quality Designation (RQD)
Rock Quality Designation (RQD) is a measure of the quality of rock core recovered
by core drilling. It was introduced by Deere (1963) as an index of rock quality and
was defined as the proportion of borehole core that consists of intact lengths that are
100 mm or longer. To calculate the RQD value, these intact lengths are summed and
expressed as a percentage of the total length as given below:
)1.4(1001
∑=
=n
i
i
L
XRQD
where Xi is the length of the ith
length ≥ 100 mm, n is the number of intact lengths
≥ 100 mm, L is the length of borehole section along which the RQD value is
required. Though RQD can be calculated for various sections or the complete length
of the borehole, usually L is taken as the length of each core run (governed by the
length of core barrel) in the determination of the RQD value. The correct procedure
for measuring RQD is illustrated in Figure 4.1.
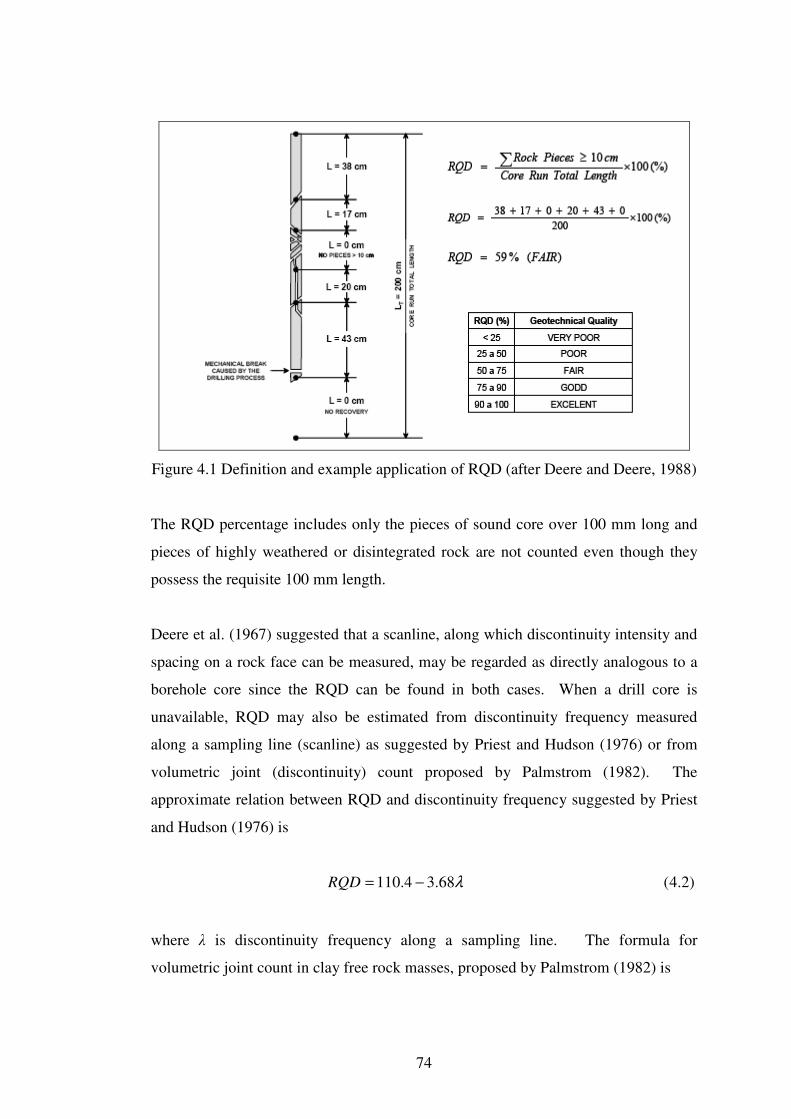
74
Figure 4.1 Definition and example application of RQD (after Deere and Deere, 1988)
The RQD percentage includes only the pieces of sound core over 100 mm long and
pieces of highly weathered or disintegrated rock are not counted even though they
possess the requisite 100 mm length.
Deere et al. (1967) suggested that a scanline, along which discontinuity intensity and
spacing on a rock face can be measured, may be regarded as directly analogous to a
borehole core since the RQD can be found in both cases. When a drill core is
unavailable, RQD may also be estimated from discontinuity frequency measured
along a sampling line (scanline) as suggested by Priest and Hudson (1976) or from
volumetric joint (discontinuity) count proposed by Palmstrom (1982). The
approximate relation between RQD and discontinuity frequency suggested by Priest
and Hudson (1976) is
)2.4(68.34.110 λ−=RQD
where λ is discontinuity frequency along a sampling line. The formula for
volumetric joint count in clay free rock masses, proposed by Palmstrom (1982) is
75
)3.4(3.3115 vJRQD −=
where Jv is the total number of discontinuity per cubic meter.
RQD is a simple and inexpensive general indicator of rock mass quality. The
recording of RQD is virtually standard practice in drill core logging for a wide
variety of rock engineering investigations. This index has been frequently used to
indicate the general quality of rock and is a good indicator of the presence of
fractured or weak zones which usually receive a low RQD value. Since RQD is
relatively easy to calculate and provides an unambiguous numerical value, it has
become widely accepted as a measure of discontinuity spacing (Priest, 1993). The
RQD values provide a basis for (a) making preliminary design decisions involving
estimation of required depths of excavation for foundations of structures,
(b) identifying potential problems related to bearing capacity, settlement, erosion, or
sliding in rock foundations, and (c) indicating rock quality in quarries for concrete
aggregate, rock fill, or large riprap.
Based on RQD, Deere and co-workers (Deere et al., 1967, Deere, 1968, Cording and
Deere, 1972 and Merritt, 1972) developed guidelines for the selection of support for
6 to 12 m wide rock tunnels. Different support quantities are given for conventional
drill and blast excavated tunnels and bored tunnels. The support types are steel sets,
rock bolts and shotcrete or a combination of the three.
RQD has some limitations. Although it is considered to represent the “jointing”, and
to some extent the “strength of intact rock substance” in a rock mass, it does not fully
represent the true nature of the joints or the intact rock strength. For instance, the
same RQD may represent different rock structures with respect to joint spacing,
roughness, tightness, persistence and orientation. RQD is sensitive to the orientation
of joint sets with respect to the orientation of the core, that is, a joint set parallel to
the core axis will not intersect the core unless the drill hole happens to run along the
joint. A joint set perpendicular to the core axis will intersect the core axis at intervals
equal to the joint spacing. For intermediate orientations, the spacing of joint
intersections with the core will be a cosine function of angle between joints and the
76
core axis. If zones of low joint shear strength are in a rock with high RQD, more
support may be necessary than predicted only with RQD. Further, the pieces of core
that are 100 mm or larger may have different strengths. In other words, the intact
rock strength is also not well represented by the RQD value. It is universally
accepted that no single parameter or index such as RQD can describe completely and
quantitatively rock mass behaviour for engineering purpose (Sen and Sadagah,
2003). Used alone, RQD is not sufficient to provide an adequate description of rock
mass quality. It must be used in combination with other geological and geotechnical
input. While the determination of RQD is an integral part of a wide variety of
geotechnical investigations, it alone is no longer used as a tool to predict tunnelling
conditions and support requirements. However, as already mentioned, it forms an
important input parameter to the two most widely used classification systems
available at present which are discussed in the following sections of this chapter.
4.3 Rock Mass Rating (RMR)
The Rock Mass Rating (RMR) system was developed by Bieniawski (1973) based on
experience gained from civil engineering tunnels constructed primarily in South
Africa. The method uses six parameters considered to represent the engineering
behaviour of rock masses. Each parameter is divided into five separate ranges of
values (ratings), and is rated based on the observed or measured condition in a rock
mass. The sum of the ratings assigned to the six parameters is defined as the RMR
value. The six parameters are not given equal importance in the overall classification
of a rock mass and different ranges of ratings are allocated to different parameters.
Nevertheless, a higher rating indicates a better rock mass condition. The six
parameters used in the RMR method are:
Intact rock strength (IRS): is the uniaxial compressive strength (UCS) of intact
rock substance determined by laboratory testing of
cylindrical core samples. The UCS may be indirectly
determined by point load strength (PLS) index test.
77
Drill core quality (RQD): is the rock quality designation. This may be
determined by drill core logging or scan line surveys
of the exposed rock surfaces (see section 4.2).
Joint spacing (JS): is the spacing of the joints (which included joints,
bedding, shears and faults etc) present in the rock
mass.
Joint surface condition (JC): represents the joint surface characteristics which
include joint persistence, aperture, roughness,
infilling material and weathering.
Groundwater condition (GW): represents the amount of water inflow in 10 m
intervals of a tunnel or the groundwater pressure in
joints.
Rating adjustment (RA): represents the orientation of the most significant joint
set with respect to the direction of the tunnel.
Since its introduction in 1973, revised versions of the RMR method have also been
published (Bieniawski 1974, 1975, 1976, 1979 and 1989).
From 1973 to 1989 the ratings scales and some of the parameters used in the RMR
system have changed as listed in Table 4.1. In the 1973 version, eight parameters
were used and from 1974 this was reduced to six by combining joint separation,
continuity and weathering parameters of the first version to create the joint condition
parameter, JC. From 1974 to 1975 the maximum ratings given to JC and IRS were
increased by 10 and 5 points, respectively.
In the 1973 and 1974 versions, the RA parameter was given a positive rating ranging
from 0 for the most unfavourable orientation to 15 for the most favourable
orientation. Since 1975 this parameter was given a negative rating from 0 for the
most favourable orientation to -12 for the most unfavourable orientation. From 1975
to 1976 the rating scales were not changed but the rock mass class boundaries for
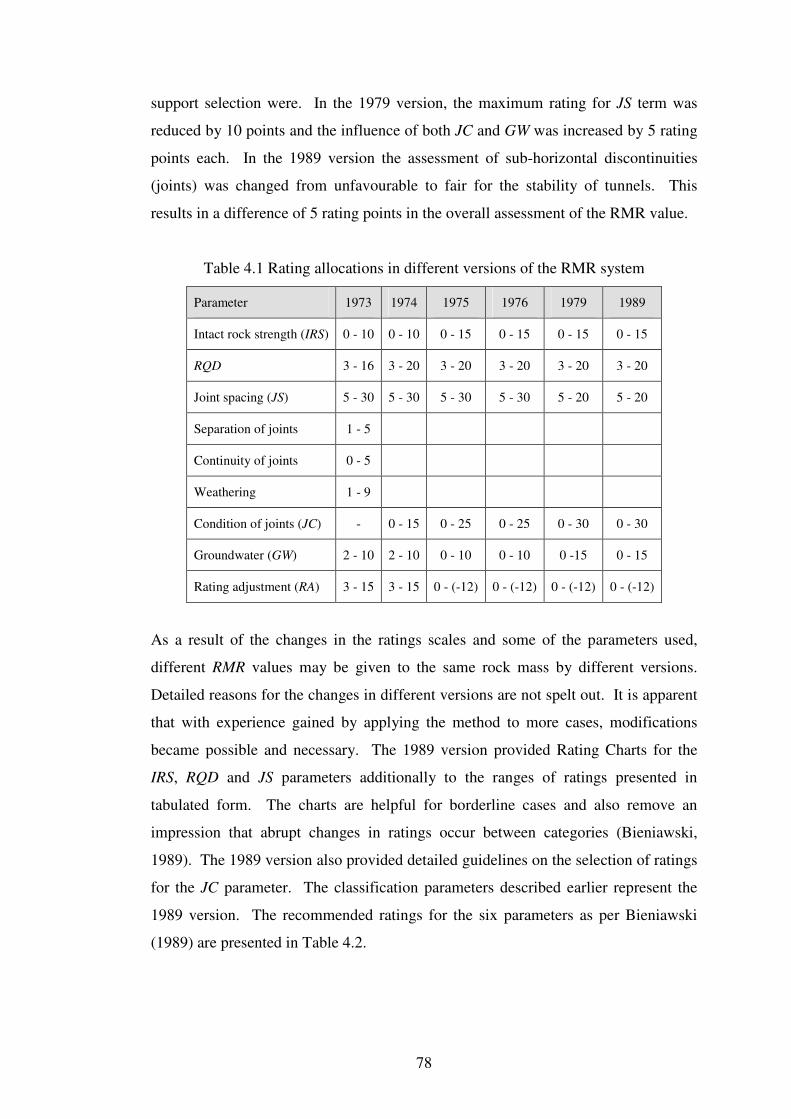
78
support selection were. In the 1979 version, the maximum rating for JS term was
reduced by 10 points and the influence of both JC and GW was increased by 5 rating
points each. In the 1989 version the assessment of sub-horizontal discontinuities
(joints) was changed from unfavourable to fair for the stability of tunnels. This
results in a difference of 5 rating points in the overall assessment of the RMR value.
Table 4.1 Rating allocations in different versions of the RMR system
Parameter 1973 1974 1975 1976 1979 1989
Intact rock strength (IRS) 0 - 10 0 - 10 0 - 15 0 - 15 0 - 15 0 - 15
RQD 3 - 16 3 - 20 3 - 20 3 - 20 3 - 20 3 - 20
Joint spacing (JS) 5 - 30 5 - 30 5 - 30 5 - 30 5 - 20 5 - 20
Separation of joints 1 - 5
Continuity of joints 0 - 5
Weathering 1 - 9
Condition of joints (JC) - 0 - 15 0 - 25 0 - 25 0 - 30 0 - 30
Groundwater (GW) 2 - 10 2 - 10 0 - 10 0 - 10 0 -15 0 - 15
Rating adjustment (RA) 3 - 15 3 - 15 0 - (-12) 0 - (-12) 0 - (-12) 0 - (-12)
As a result of the changes in the ratings scales and some of the parameters used,
different RMR values may be given to the same rock mass by different versions.
Detailed reasons for the changes in different versions are not spelt out. It is apparent
that with experience gained by applying the method to more cases, modifications
became possible and necessary. The 1989 version provided Rating Charts for the
IRS, RQD and JS parameters additionally to the ranges of ratings presented in
tabulated form. The charts are helpful for borderline cases and also remove an
impression that abrupt changes in ratings occur between categories (Bieniawski,
1989). The 1989 version also provided detailed guidelines on the selection of ratings
for the JC parameter. The classification parameters described earlier represent the
1989 version. The recommended ratings for the six parameters as per Bieniawski
(1989) are presented in Table 4.2.
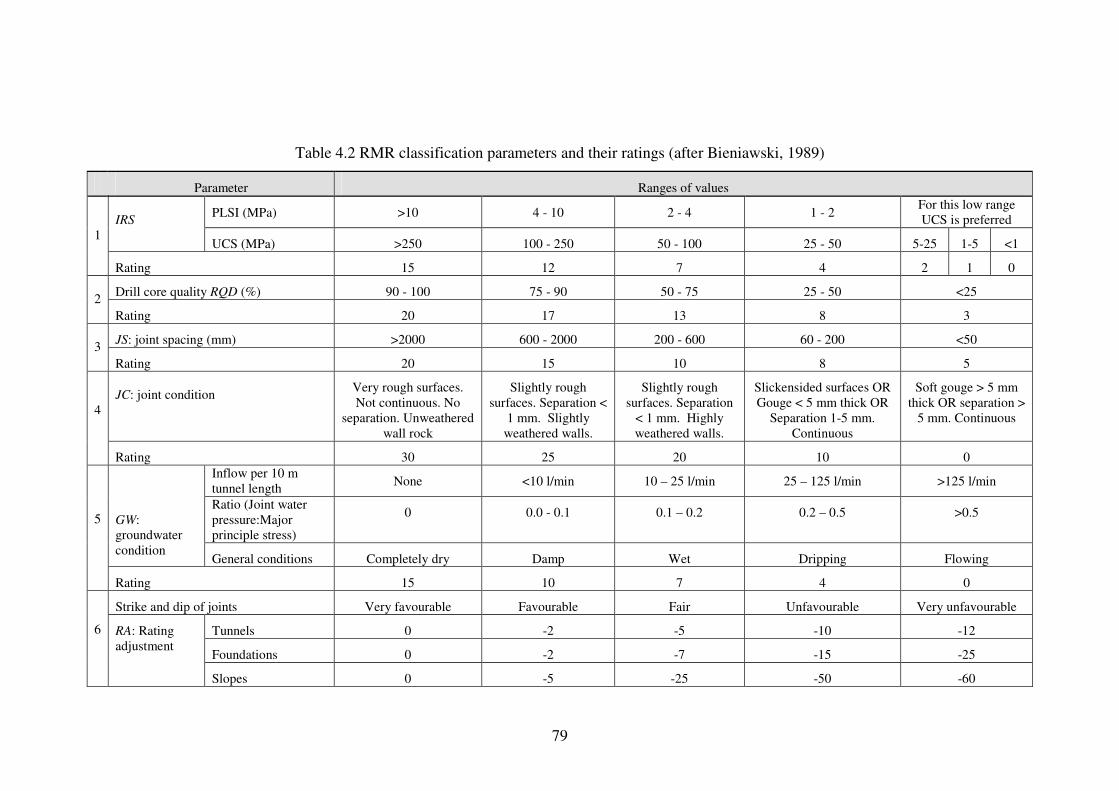
79
Table 4.2 RMR classification parameters and their ratings (after Bieniawski, 1989)
Parameter Ranges of values
PLSI (MPa) >10 4 - 10 2 - 4 1 - 2 For this low range
UCS is preferred
IRS
UCS (MPa) >250 100 - 250 50 - 100 25 - 50 5-25 1-5 <1
1
Rating 15 12 7 4 2 1 0
Drill core quality RQD (%) 90 - 100 75 - 90 50 - 75 25 - 50 <25
2
Rating 20 17 13 8 3
JS: joint spacing (mm) >2000 600 - 2000 200 - 600 60 - 200 <50
3
Rating 20 15 10 8 5
JC: joint condition Very rough surfaces.
Not continuous. No
separation. Unweathered
wall rock
Slightly rough
surfaces. Separation <
1 mm. Slightly
weathered walls.
Slightly rough
surfaces. Separation
< 1 mm. Highly
weathered walls.
Slickensided surfaces OR
Gouge < 5 mm thick OR
Separation 1-5 mm.
Continuous
Soft gouge > 5 mm
thick OR separation >
5 mm. Continuous
4
Rating 30 25 20 10 0
Inflow per 10 m
tunnel length None <10 l/min 10 – 25 l/min 25 – 125 l/min >125 l/min
Ratio (Joint water
pressure:Major
principle stress)
0 0.0 - 0.1 0.1 – 0.2 0.2 – 0.5 >0.5
GW:
groundwater
condition General conditions Completely dry Damp Wet Dripping Flowing
5
Rating 15 10 7 4 0
Strike and dip of joints Very favourable Favourable Fair Unfavourable Very unfavourable
Tunnels 0 -2 -5 -10 -12
Foundations 0 -2 -7 -15 -25
6 RA: Rating
adjustment
Slopes 0 -5 -25 -50 -60
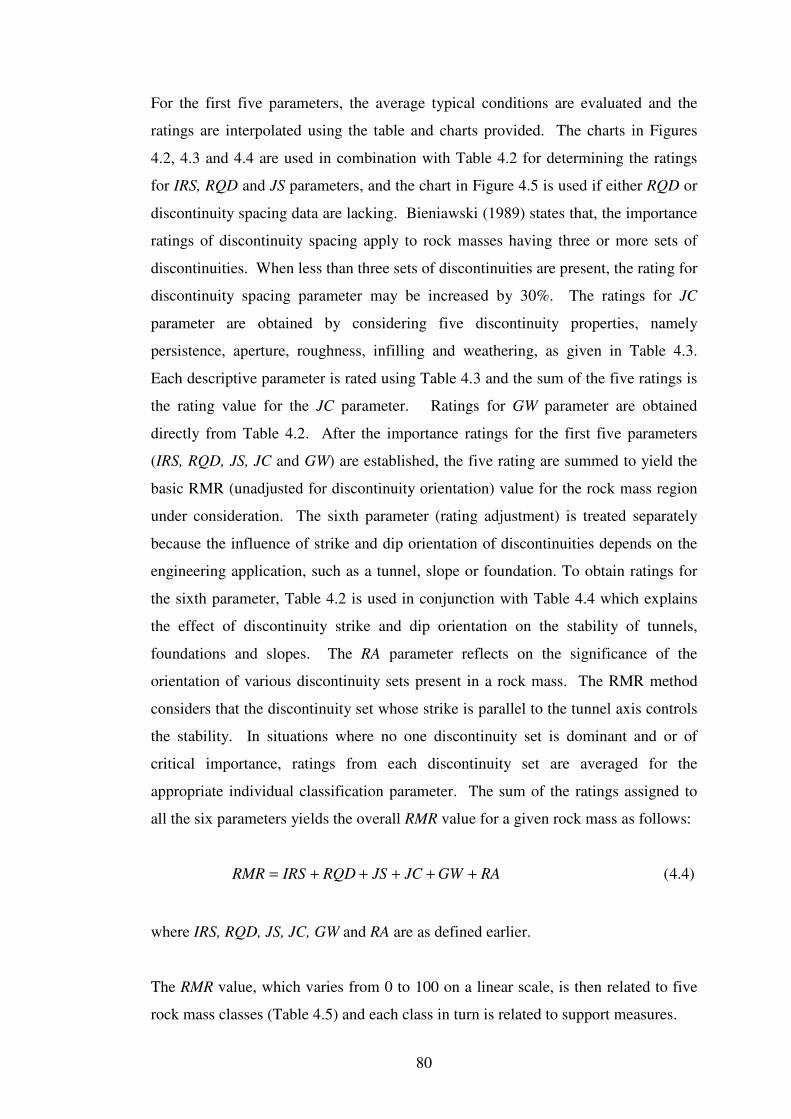
80
For the first five parameters, the average typical conditions are evaluated and the
ratings are interpolated using the table and charts provided. The charts in Figures
4.2, 4.3 and 4.4 are used in combination with Table 4.2 for determining the ratings
for IRS, RQD and JS parameters, and the chart in Figure 4.5 is used if either RQD or
discontinuity spacing data are lacking. Bieniawski (1989) states that, the importance
ratings of discontinuity spacing apply to rock masses having three or more sets of
discontinuities. When less than three sets of discontinuities are present, the rating for
discontinuity spacing parameter may be increased by 30%. The ratings for JC
parameter are obtained by considering five discontinuity properties, namely
persistence, aperture, roughness, infilling and weathering, as given in Table 4.3.
Each descriptive parameter is rated using Table 4.3 and the sum of the five ratings is
the rating value for the JC parameter. Ratings for GW parameter are obtained
directly from Table 4.2. After the importance ratings for the first five parameters
(IRS, RQD, JS, JC and GW) are established, the five rating are summed to yield the
basic RMR (unadjusted for discontinuity orientation) value for the rock mass region
under consideration. The sixth parameter (rating adjustment) is treated separately
because the influence of strike and dip orientation of discontinuities depends on the
engineering application, such as a tunnel, slope or foundation. To obtain ratings for
the sixth parameter, Table 4.2 is used in conjunction with Table 4.4 which explains
the effect of discontinuity strike and dip orientation on the stability of tunnels,
foundations and slopes. The RA parameter reflects on the significance of the
orientation of various discontinuity sets present in a rock mass. The RMR method
considers that the discontinuity set whose strike is parallel to the tunnel axis controls
the stability. In situations where no one discontinuity set is dominant and or of
critical importance, ratings from each discontinuity set are averaged for the
appropriate individual classification parameter. The sum of the ratings assigned to
all the six parameters yields the overall RMR value for a given rock mass as follows:
)4.4(RAGWJCJSRQDIRSRMR +++++=
where IRS, RQD, JS, JC, GW and RA are as defined earlier.
The RMR value, which varies from 0 to 100 on a linear scale, is then related to five
rock mass classes (Table 4.5) and each class in turn is related to support measures.
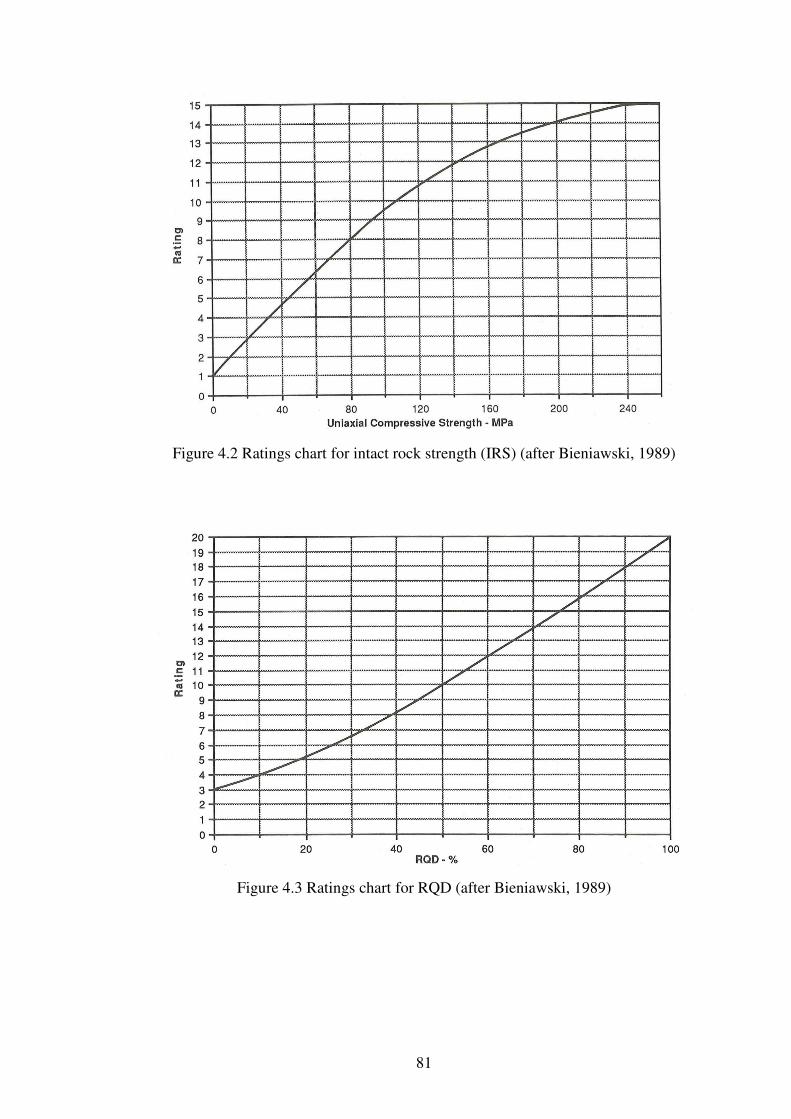
81
Figure 4.2 Ratings chart for intact rock strength (IRS) (after Bieniawski, 1989)
Figure 4.3 Ratings chart for RQD (after Bieniawski, 1989)
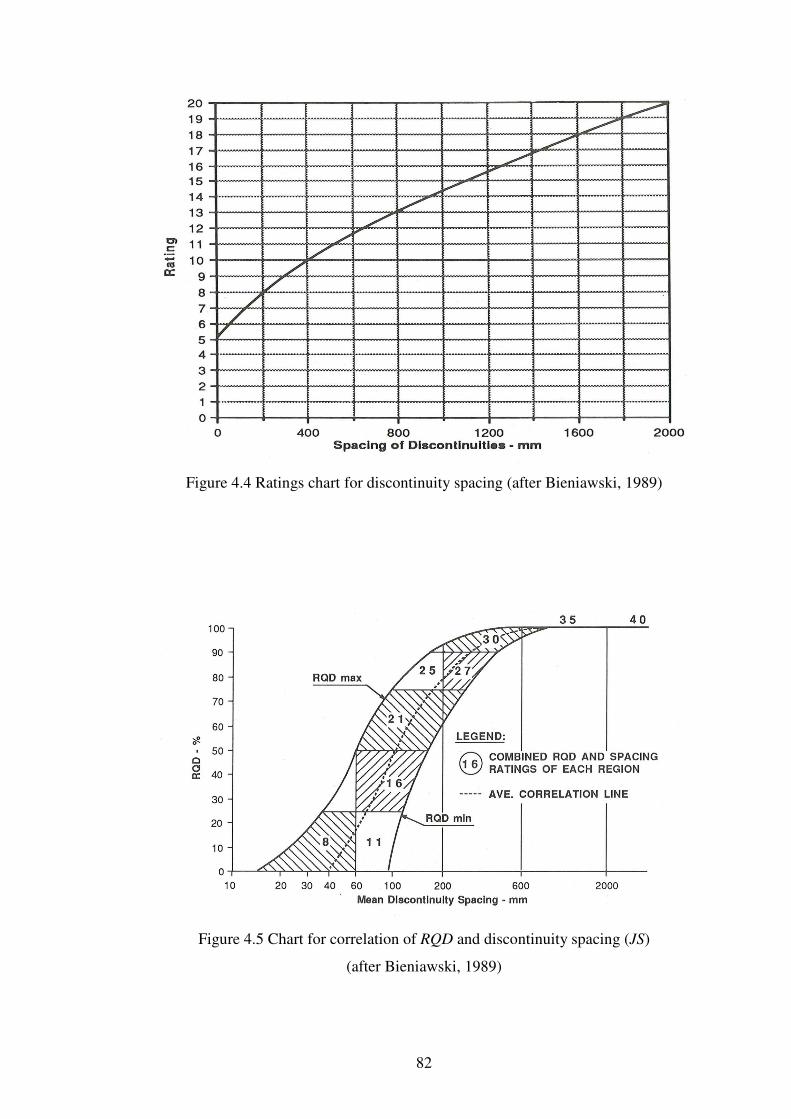
82
Figure 4.4 Ratings chart for discontinuity spacing (after Bieniawski, 1989)
Figure 4.5 Chart for correlation of RQD and discontinuity spacing (JS)
(after Bieniawski, 1989)
83
With changing versions the RMR class boundaries have also changed somewhat.
From 1973 to 1975 rock mass class V was assigned for RMR<25, class IV for
RMR=25-50, class III for RMR=50-70, class II for RMR=70-90 and class I for
RMR=90-100. From 1976 the classes were separated evenly on the RMR scale with
the boundaries at multiples of 20. The class boundaries given in Table 4.5 represent
the current version. Table 4.5 also provides rock mass shear strength in terms of
cohesion and friction angle. From 1976 to 1979 strength properties of some of the
RMR classes were also changed. In class I cohesion was increased, the friction angle
remained the same. In class V cohesion remained the same but the friction angle was
reduced by a factor of two.
The RMR system provides guidelines detailed in Table 4.6 for the selection of
support and construction procedures for 10 m wide tunnels with a vertical stress
magnitude of less than 25 MPa excavated by drill and blast methods. The support
measures recommended are for permanent and not primary support. It should be
noted that between different versions some changes were also made to the RMR
recommended support and excavation procedures. The recommendations of 1973
and 1974 versions had three separate support systems a user can select: the first
being rock bolts with shotcrete and wire mesh as additional support; the second is
shotcrete with rock bolts, wire mesh and steel sets as additional support; the third is
steel sets with shotcrete as additional support. In 1975 the support comprised a
combination of rock bolts, shotcrete, wire mesh and steel sets depending on the rock
class. From 1975 to 1989 the support recommendations virtually remained the same
apart from minor adjustments. Recommendations up to the 1975 version were for 5
to 12 m wide tunnels with a maximum vertical stress of 30 MPa (the maximum stress
was given only in 1975). From 1976 the support measures are only for 10 m wide
tunnels with a maximum vertical stress of 25 MPa. Ironically, the support
recommended from 1976 onwards is identical to that recommended for 5 to 12 m
wide tunnels with a maximum vertical stress of 30 MPa.
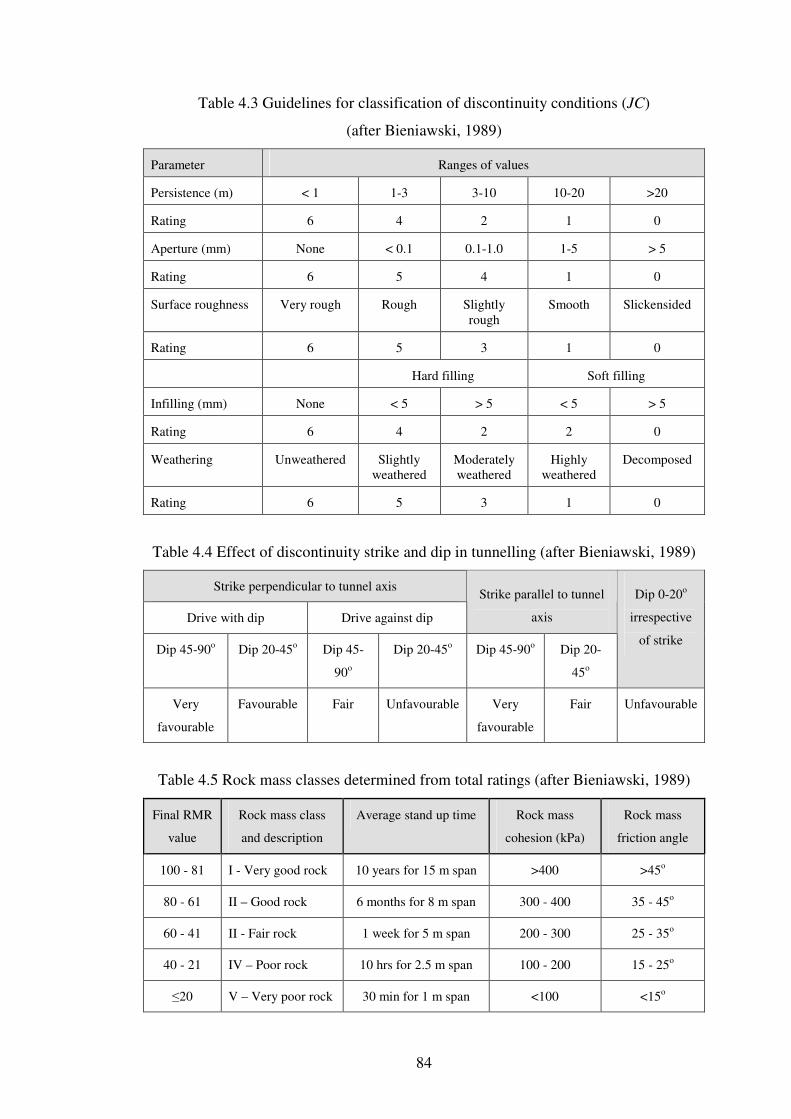
84
Table 4.3 Guidelines for classification of discontinuity conditions (JC)
(after Bieniawski, 1989)
Parameter Ranges of values
Persistence (m) < 1 1-3 3-10 10-20 >20
Rating 6 4 2 1 0
Aperture (mm) None < 0.1 0.1-1.0 1-5 > 5
Rating 6 5 4 1 0
Surface roughness Very rough Rough Slightly
rough
Smooth Slickensided
Rating 6 5 3 1 0
Hard filling Soft filling
Infilling (mm) None < 5 > 5 < 5 > 5
Rating 6 4 2 2 0
Weathering Unweathered Slightly
weathered
Moderately
weathered
Highly
weathered
Decomposed
Rating 6 5 3 1 0
Table 4.4 Effect of discontinuity strike and dip in tunnelling (after Bieniawski, 1989)
Strike perpendicular to tunnel axis
Drive with dip Drive against dip
Strike parallel to tunnel
axis
Dip 45-90o
Dip 20-45o
Dip 45-
90o
Dip 20-45o
Dip 45-90o
Dip 20-
45o
Dip 0-20o
irrespective
of strike
Very
favourable
Favourable Fair Unfavourable Very
favourable
Fair Unfavourable
Table 4.5 Rock mass classes determined from total ratings (after Bieniawski, 1989)
Final RMR
value
Rock mass class
and description
Average stand up time Rock mass
cohesion (kPa)
Rock mass
friction angle
100 - 81 I - Very good rock 10 years for 15 m span >400 >45o
80 - 61 II – Good rock 6 months for 8 m span 300 - 400 35 - 45o
60 - 41 II - Fair rock 1 week for 5 m span 200 - 300 25 - 35o
40 - 21 IV – Poor rock 10 hrs for 2.5 m span 100 - 200 15 - 25o
≤20 V – Very poor rock 30 min for 1 m span <100 <15o
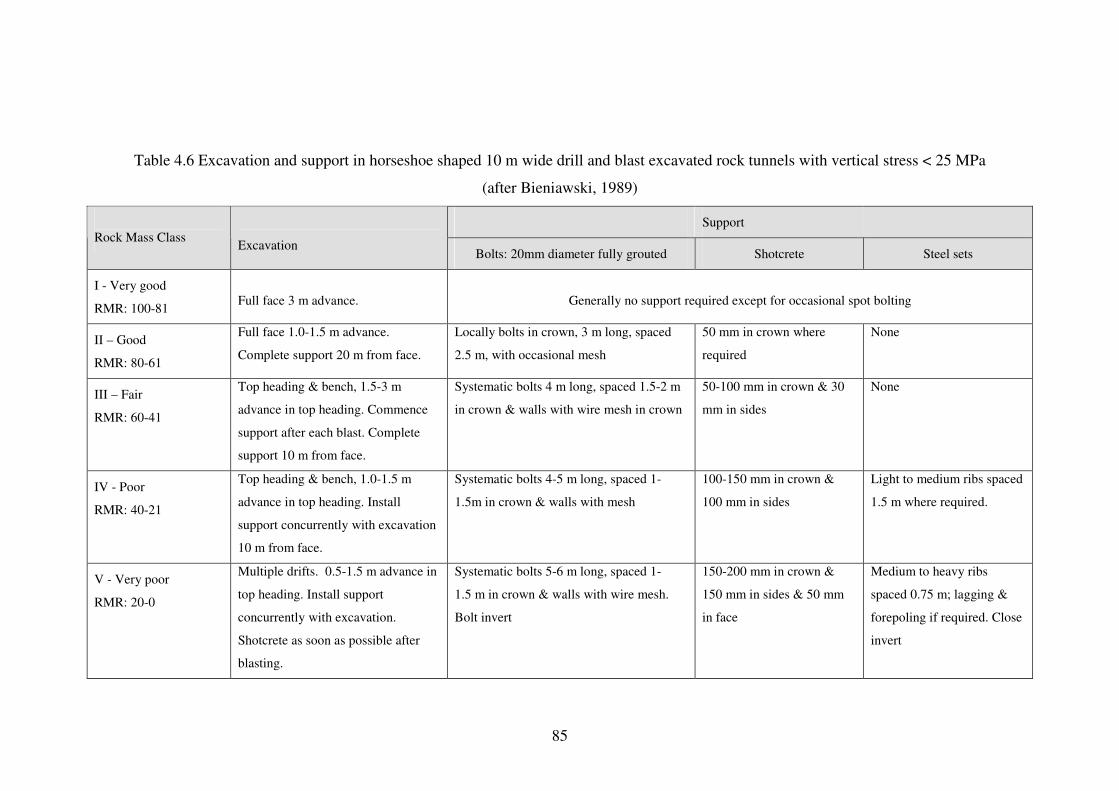
85
Table 4.6 Excavation and support in horseshoe shaped 10 m wide drill and blast excavated rock tunnels with vertical stress < 25 MPa
(after Bieniawski, 1989)
Support
Rock Mass Class
Excavation Bolts: 20mm diameter fully grouted Shotcrete Steel sets
I - Very good
RMR: 100-81
Full face 3 m advance.
Generally no support required except for occasional spot bolting
II – Good
RMR: 80-61
Full face 1.0-1.5 m advance.
Complete support 20 m from face.
Locally bolts in crown, 3 m long, spaced
2.5 m, with occasional mesh
50 mm in crown where
required
None
III – Fair
RMR: 60-41
Top heading & bench, 1.5-3 m
advance in top heading. Commence
support after each blast. Complete
support 10 m from face.
Systematic bolts 4 m long, spaced 1.5-2 m
in crown & walls with wire mesh in crown
50-100 mm in crown & 30
mm in sides
None
IV - Poor
RMR: 40-21
Top heading & bench, 1.0-1.5 m
advance in top heading. Install
support concurrently with excavation
10 m from face.
Systematic bolts 4-5 m long, spaced 1-
1.5m in crown & walls with mesh
100-150 mm in crown &
100 mm in sides
Light to medium ribs spaced
1.5 m where required.
V - Very poor
RMR: 20-0
Multiple drifts. 0.5-1.5 m advance in
top heading. Install support
concurrently with excavation.
Shotcrete as soon as possible after
blasting.
Systematic bolts 5-6 m long, spaced 1-
1.5 m in crown & walls with wire mesh.
Bolt invert
150-200 mm in crown &
150 mm in sides & 50 mm
in face
Medium to heavy ribs
spaced 0.75 m; lagging &
forepoling if required. Close
invert
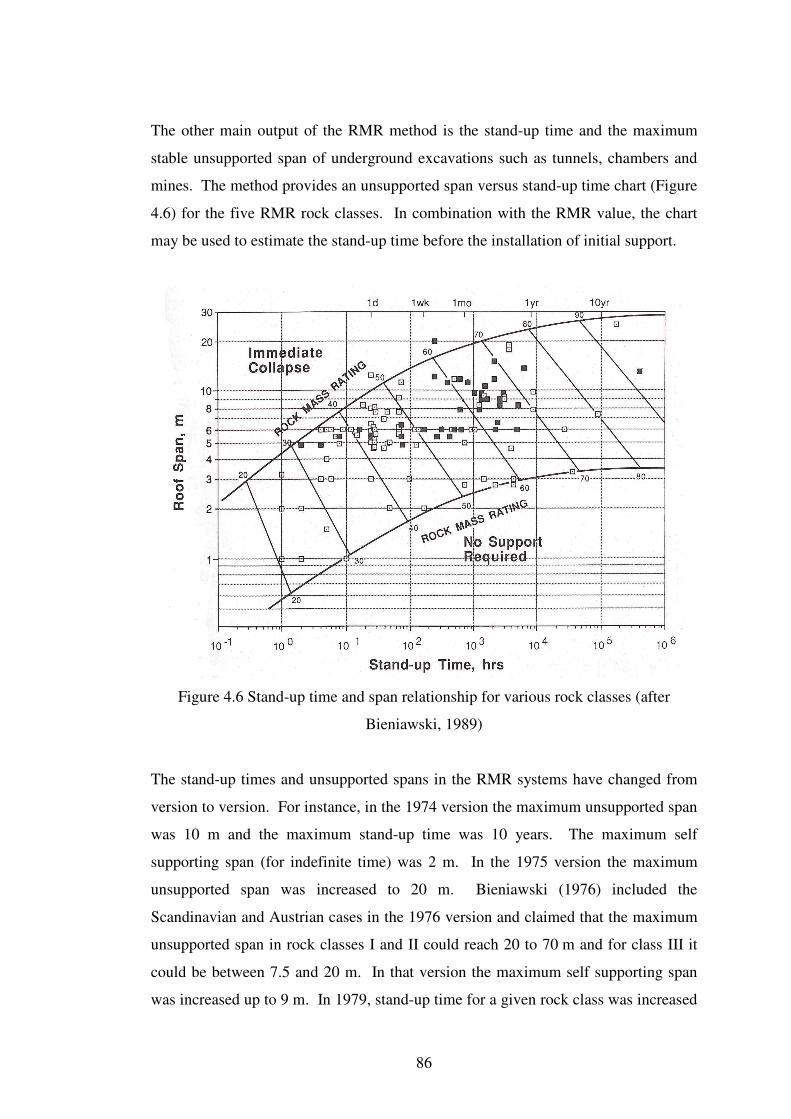
86
The other main output of the RMR method is the stand-up time and the maximum
stable unsupported span of underground excavations such as tunnels, chambers and
mines. The method provides an unsupported span versus stand-up time chart (Figure
4.6) for the five RMR rock classes. In combination with the RMR value, the chart
may be used to estimate the stand-up time before the installation of initial support.
Figure 4.6 Stand-up time and span relationship for various rock classes (after
Bieniawski, 1989)
The stand-up times and unsupported spans in the RMR systems have changed from
version to version. For instance, in the 1974 version the maximum unsupported span
was 10 m and the maximum stand-up time was 10 years. The maximum self
supporting span (for indefinite time) was 2 m. In the 1975 version the maximum
unsupported span was increased to 20 m. Bieniawski (1976) included the
Scandinavian and Austrian cases in the 1976 version and claimed that the maximum
unsupported span in rock classes I and II could reach 20 to 70 m and for class III it
could be between 7.5 and 20 m. In that version the maximum self supporting span
was increased up to 9 m. In 1979, stand-up time for a given rock class was increased
87
and the maximum unsupported span was reduced to 30 m. The unsupported span
versus stand-up time chart was amended once more in 1989 to that given as Figure
4.6, in which the maximum stand-up time is 100 years as opposed to 10 years in the
previous versions. A point that should be mentioned here is that while the
aforementioned changes are being made to the unsupported span versus stand-up
time chart, the support recommendations remained the same as in the 1976 version.
Bieniawski (1989) also provided a RMR versus support load relationship that may be
used to determine the support pressure required to stabilise the rock mass
surrounding an excavation. The relationship proposed on the basis of the work by
Unal (1983) in flat roofed coal mine openings is
)5.4(100
100B
RMRP γ
−=
where, P is the support load in kN, B is the tunnel width in meters and γ is the rock
density in kg/m3. Goel and Jethwa (1991) have evaluated the applicability of
Equation 4.5 to rock tunnels with arched roof and found that the estimated support
pressures were unsafe for all sizes of tunnels under squeezing ground conditions.
Further the estimates for non-squeezing ground conditions were unsafe for small
diameter tunnels (diameter up to 6 m) and over-safe for large diameter tunnels
(diameter>9 m), which implied the size effect was over-emphasised for large
diameter arched openings. Subsequently, based on measured support pressure values
from 30 Indian tunnels, Goel and Jethwa (1991) proposed Equation 4.6 for
estimating short term support pressures for tunnels in both squeezing and non-
squeezing ground conditions in the case of excavation by drill and blast methods
with steel arch support:
)6.4(2
75.0 5.01.0
RMR
RMRHBPs
−=
where, Ps is short-term support pressure in MPa, B is tunnel span in metres, H is
overburden or tunnel depth in metres.

88
As can be seen from the above equations, the RMR system considers that the support
pressure not only depends on the rock mass quality (or RMR value), but also on the
width of the opening. This means that although the RMR recommended support
quantities are primarily aimed at 10 m span tunnels, the RMR versus support pressure
relationship can be applied to any tunnel regardless of its span. Naturally, as would
be expected, according to Equation 4.5 and 4.6 different support pressures will be
required for different tunnel spans in the same rock mass.
The RMR system can also be used for estimating the modulus of rock mass
deformation (EM). Bieniawski (1978) provided the following formula for estimating
EM (in GPa) when RMR > 50 is
EM = 2RMR – 100 (4.7)
For rock masses with RMR < 50, based on the work of Serafim and Pereira (1983),
the formula given by Bieniawski (1989) is
EM = 10(RMR-10)40
(4.7a)
Hoek and Brown (1997) suggested that a correction in terms of intact rock material
strength, σc, should be included in Equation 4.7a to better represent poor rocks with
σc<100 MPa. The suggested correction is given below in Equation 4.7b:
EM = {(σc)1/2
/10} 10(RMR-10)40
(4.7b)
The RMR system has also found applications in Hoek-Brown failure criterion for
rocks (Hoek and Brown, 1980a), which is widely used for estimating rock mass
strength for various rock engineering applications. The RMR method is easy to use,
with relatively less expertise requirements.
4.3.1 Modification of the RMR System
In spite of the fact that the RMR system was primarily aimed at civil engineering
tunnel construction, the method was not robust enough to apply to all possible rock
89
conditions in civil projects. In order to broaden its application to a wider range of
ground conditions, several researchers have modified the RMR system. Notable
among these is the work of Gonzalez de Vallejo (1983, 1985) who modified it
primarily to take into account the in situ stress field in a rock mass. The modified
version denoted as Surface Rock Classification (SRC) is intended to be used in civil
engineering tunnels under moderately to very highly stressed rock mass conditions
and allows for the consideration of data obtained from rock outcrops, rock durability,
the effect of adjacent excavations and portals on stability and tunnel construction
method.
Similar to the RMR system, the modified system also first determines the basic SRC
value based on five parameters. In the SRC system, the RMR parameters IRS, JC
and GW have not been changed and the RQD and JS parameters have been linked to
eliminate double counting of joint spacing and renamed as RQD/JS. A new
parameter called State of Stress (SS) which comprised four sub-parameters, namely,
competence factor, tectonic structure, stress relief factor and neo-tectonic activity has
been added. The sum of the ratings allocated to the first five parameters in the basic
SRC value. The basic SRC value is then adjusted to take into account the
construction conditions using construction adjustment (CA), which is a function of
method of excavation, stand-up time (based on RMR), distance to the adjacent
excavation and/or portal, rock resistance to weathering (durability) and discontinuity
orientation (as per RMR). In the SRC system, the rating scales and the manner in
which the final SRC value is computed is very much similar to that of the RMR
system and therefore the same rock mass classes and support measures are used. The
SRC system takes into account some of the missing parameters in the RMR system,
namely, in situ stress, rock durability, construction method and the effect of adjacent
excavations. The system has been applied in civil engineering tunnels in Spain and
Northern Italy. However, it has not received much attention in other parts of the
world.
4.3.2 Modification of RMR for Mining
The RMR method, originally developed based on case records mainly drawn from
civil engineering projects, was modified to make it more relevant to mining
90
applications. One such modification introduced by Laubscher in the mid 1970s is
designated as Mining Rock Mass Rating (MRMR) (Laubscher, 1975, 1977;
Laubscher and Taylor, 1976). This MRMR system takes the basic RMR value as
defined by Bieniawski and adjusts it to account for in situ and induced stresses, stress
changes and the effects of blasting and weathering. A set of support
recommendations is also provided with the MRMR. Application of the MRMR to
mining projects has been presented by Laubscher (1984, 1990, 1993, 1994, 2000),
Laubscher and Page (1990), Jakubec and Laubscher (2000) and Laubscher and
Jakubec (2001). In MRMR, the form of computation and the values of the ratings
associated with the different parameters used have changed several times since the
introduction of the method in 1975 to the latest version presented by Laubscher and
Jakubec (2001). MRMR was initially proposed for block caving mines in Africa, but
other cases were subsequently added to its database. Nevertheless, up to now
MRMR has not been widely used in other mining operations.
Cummings et al. (1982) and Kendorski et al. (1983) have also modified the RMR
method for mining applications in the USA and introduced Modified Basic Rock
Mass Rating (MBR). This system was also proposed for block caving operations. It
involves the use of different ratings for the original parameters used to determine the
value of RMR and subsequent adjustment of the resulting MBR value to allow for
blast damage, induced stresses, structural features, distance from the cave front and
size of the caving block (Hoek et al., 1995). It provides support recommendations
for isolated or development drifts as well as the final support of intersections and
drifts. This method also has not been widely used in other mining applications.
Brook and Dharmaratne (1985) proposed a simplified version of RMR (SRMR) for
mining applications. From the available literature it is apparent that this version also
did not receive much attention.
4.3.3 Limitations of the RMR method
In addition to the six rock mass parameters considered in the RMR method, the
support requirements for an excavation depend on the in situ stress field, excavation
91
size and shape, and the method of excavation. In the RMR method, the in situ stress
field is not considered specifically though it is used indirectly when recommending
support. The 25 MPa maximum vertical stress limit means that the support measures
recommended are applicable to an approximate tunnel depth or overburden thickness
range of 0 (near surface) to 1000 m. Within this depth range, depending on the
horizontal to vertical stress ratio k, a range of horizontal stress magnitudes is possible
and the horizontal stresses could be more critical to the stability of an excavation
compared to the vertical stress. This aspect does not appear to have been considered
in developing the RMR method.
For different IRS and JS values of the RMR system, similar RMR values could be
achieved for different rock masses if the other four parameters are identical. This
may be explained using a hypothetical example. In a rock mass with no
discontinuities and an IRS range of 5 to 25 MPa, the JS and IRS parameters would
contribute 22 points to the total RMR value. Similarly, a rock mass with JS of 200 to
600 mm with an IRS range of 100 to 250 MPa would also contribute 22 points to the
total RMR value. In the first case, as there are no discontinuities the RQD is likely to
be 100%. This means the combined contribution of IRS, JS and RQD to the total
RMR value is 42. With a joint spacing range of 200 to 600 mm, the RQD in the
second case is also likely to be high and a rating of 20 can be assigned assuming
RQD≥90%, which is possible. The contribution of IRS, JS and RQD to the total
RMR is again 42. If the other parameters of the two rock masses are similar, the
overall RMR values of the two rock masses will be the same. However, the
behaviour of the two rock masses can be significantly different, even if the stress
fields in the two rock masses are the same.
Kirsten (1988a) observed that the structure of the RMR system is not sufficiently
sensitive to the individual parameters. As a result, the functional dependence of the
RMR value on any one of the parameters is not strongly represented in the system.
Kirsten illustrated this lack of sensitivity of the RMR value to changes in the
parameters by considering a value of 79 which is based on a rating of 26 for the JC
parameter. This RMR value corresponds to good rock in which the joints are very
rough, tight and discontinuous with unweathered wall rock. If, instead, the joints are
slickensided or contain gouge up to 5 mm thick or are separated up to 5 mm, the
92
corresponding JC rating could be 9 and the RMR value would be reduced to 62. This
would still represent good rock but the behaviour of the rock mass in a tunnel,
foundation, or slope would be very different from the first case because of the major
differences in the joint strength as represented by the difference of 17 points in the
JC rating.
Further, in the earlier versions of RMR, the ratings allocated to classification
parameters are lumped and a wide gap existed between two rating values. For
instance, the joint spacing (JS) parameter is allocated ratings of 20, 15, 10, 8 and 5.
As pointed out by Sen and Sadagah (2003), the lump ratings in this system lead to
quite subjective adjustments. This may be overcome by using the charts provided by
Bieniawski (1989) for IRS, RQD and JS parameters and those provided by Sen and
Sadagah (2003) for IRS, RQD, JS and GW parameters. These charts allow allocation
of continuous ratings based on observed or measured conditions of the relevant
parameters. The subjectivity of the RMR method can then be confined to JC and RA
parameters. Nevertheless, the rock mass class boundaries in RMR are abrupt and a
difference of ±5 rating points, which is considered possible between two different
users, could push the rock mass up or down into a different class. Common
criticisms of the RMR method are that the system is relatively insensitive to minor
variations in rock quality and that the support recommendations appear conservative
and have not been revised to reflect new reinforcement tools (Milne et al., 1998).
The current version of RMR (Bieniawski, 1989) provides support recommendations
only for a 10 m diameter horseshoe shaped tunnel with a vertical stress magnitude of
less than 25 MPa. No guidelines are provided for the selection of support quantities
for tunnels with dimensions other than 10 m span. Users of this method have to rely
on other empirical guidelines or rules of thumb to determine rock bolt lengths and
spacing for tunnel diameters other than 10 m. For instance a 10 m span tunnel in a
RMR rock mass class III may require systematic rock bolting plus mesh reinforced
shotcrete, whereas a 3.5 m span tunnel in the same rock mass class may not require
systematic bolting, shotcrete alone may be sufficient to stabilise the potentially
unstable rocks. While the support recommendations provided in the literature may
be overly conservative for smaller diameter tunnels, they may not be adequate for
excavations with more than 10 m spans.

93
Singh and Goel (1999) cautioned that the RMR system is found to be unreliable in
very poor rock masses and that care should, therefore, be exercised in applying in
such rock masses. They also noted that in the case of wider tunnels and caverns, the
RMR value obtained may be somewhat less than that obtained from drifts because in
drifts, one may miss intrusions of weaker rocks and joint sets having lower condition
ratings.
94
4.4 Tunnelling Quality Index (Q)
The tunnelling quality index (Q) was proposed by Barton and co-workers of the
Norwegian Geotechnical Institute (Barton et al., 1974, 1975, 1977, and Barton,
1976). The Q system can be used for classifying rock masses and estimation of
support requirements for underground excavations. Developed primarily based on
the data collected from civil engineering tunnels and caverns, the Q system uses six
parameters considered to represent the behaviour of rock masses:
Drill core quality (RQD): is the rock quality designation. This is determined by
drill core logging or scan line surveys of the exposed
rock surfaces as discussed in Section 4.2.
Joint set number (Jn): is the number of geological discontinuity sets (joints,
shears, bedding etc) in the rock mass.
Joint roughness number (Jr): is the surface roughness of the most unfavourable
joint (discontinuity) set in the rock mass.
Joint alteration number (Ja): is the extent of alteration of the discontinuity surfaces
and/or extent and the nature of any filling material in
discontinuities.
Water reduction factor (Jw): is a parameter related to the groundwater condition in
the discontinuities in the rock mass.
Stress reduction factor (SRF): is a parameter that takes into account the possible
effects of in situ stresses and major weakness zones
intersecting or adjacent to the excavation. It is a
measure of stress in competent rock, squeezing loads
in plastic incompetent rocks and loosening loads in
excavations in shear zones or clay bearing rocks.
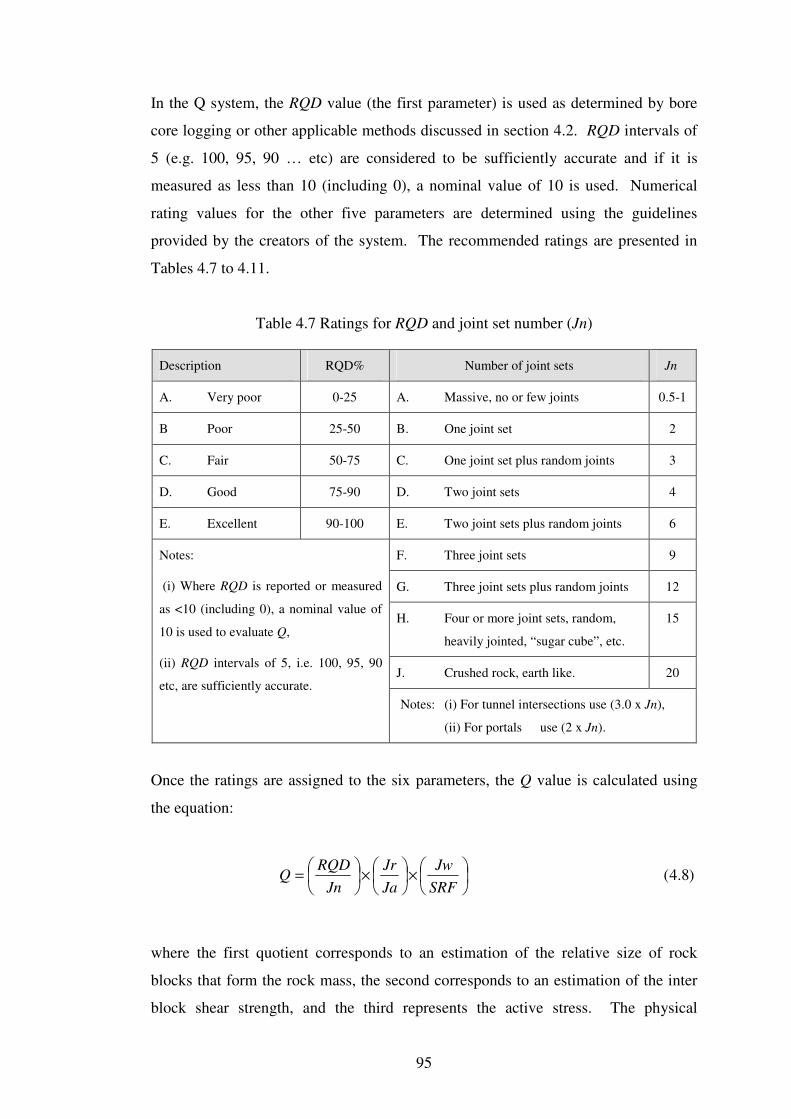
95
In the Q system, the RQD value (the first parameter) is used as determined by bore
core logging or other applicable methods discussed in section 4.2. RQD intervals of
5 (e.g. 100, 95, 90 … etc) are considered to be sufficiently accurate and if it is
measured as less than 10 (including 0), a nominal value of 10 is used. Numerical
rating values for the other five parameters are determined using the guidelines
provided by the creators of the system. The recommended ratings are presented in
Tables 4.7 to 4.11.
Table 4.7 Ratings for RQD and joint set number (Jn)
Description RQD% Number of joint sets Jn
A. Very poor 0-25 A. Massive, no or few joints 0.5-1
B Poor 25-50 B. One joint set 2
C. Fair 50-75 C. One joint set plus random joints 3
D. Good 75-90 D. Two joint sets 4
E. Excellent 90-100 E. Two joint sets plus random joints 6
F. Three joint sets 9
G. Three joint sets plus random joints 12
H. Four or more joint sets, random,
heavily jointed, “sugar cube”, etc.
15
J. Crushed rock, earth like. 20
Notes:
(i) Where RQD is reported or measured
as <10 (including 0), a nominal value of
10 is used to evaluate Q,
(ii) RQD intervals of 5, i.e. 100, 95, 90
etc, are sufficiently accurate.
Notes: (i) For tunnel intersections use (3.0 x Jn),
(ii) For portals use (2 x Jn).
Once the ratings are assigned to the six parameters, the Q value is calculated using
the equation:
)8.4(
×
×
=
SRF
Jw
Ja
Jr
Jn
RQDQ
where the first quotient corresponds to an estimation of the relative size of rock
blocks that form the rock mass, the second corresponds to an estimation of the inter
block shear strength, and the third represents the active stress. The physical
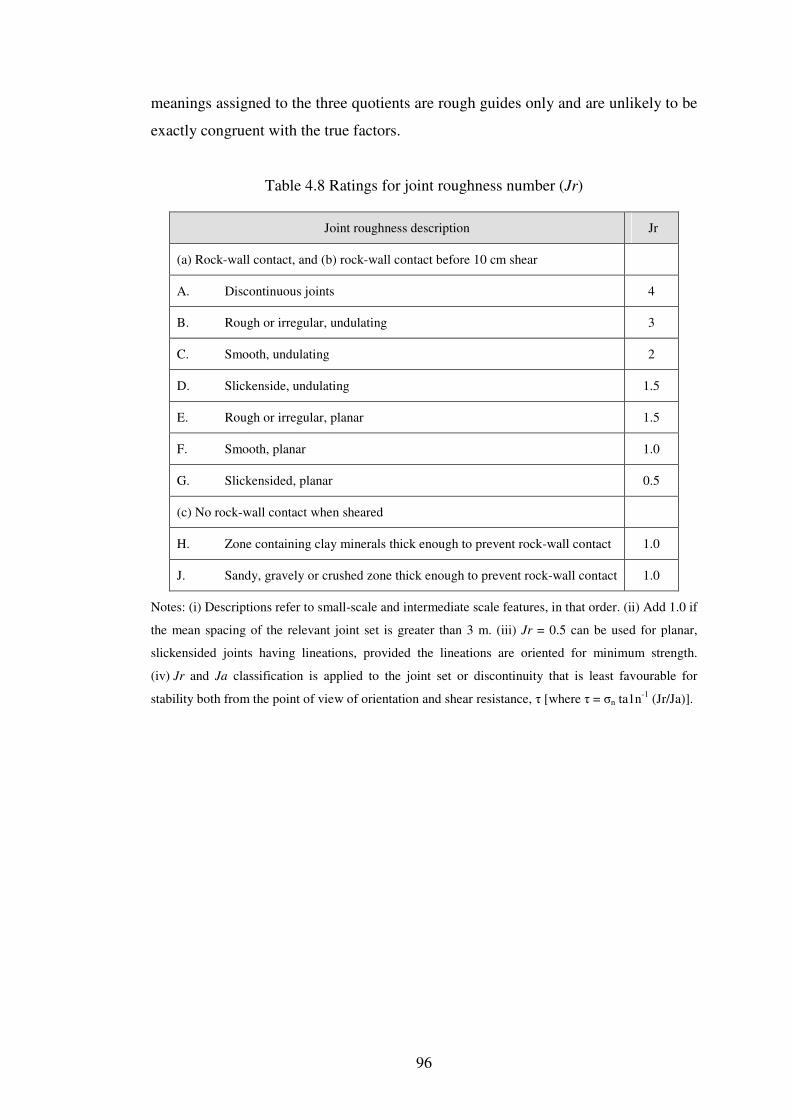
96
meanings assigned to the three quotients are rough guides only and are unlikely to be
exactly congruent with the true factors.
Table 4.8 Ratings for joint roughness number (Jr)
Joint roughness description Jr
(a) Rock-wall contact, and (b) rock-wall contact before 10 cm shear
A. Discontinuous joints 4
B. Rough or irregular, undulating 3
C. Smooth, undulating 2
D. Slickenside, undulating 1.5
E. Rough or irregular, planar 1.5
F. Smooth, planar 1.0
G. Slickensided, planar 0.5
(c) No rock-wall contact when sheared
H. Zone containing clay minerals thick enough to prevent rock-wall contact 1.0
J. Sandy, gravely or crushed zone thick enough to prevent rock-wall contact 1.0
Notes: (i) Descriptions refer to small-scale and intermediate scale features, in that order. (ii) Add 1.0 if
the mean spacing of the relevant joint set is greater than 3 m. (iii) Jr = 0.5 can be used for planar,
slickensided joints having lineations, provided the lineations are oriented for minimum strength.
(iv) Jr and Ja classification is applied to the joint set or discontinuity that is least favourable for
stability both from the point of view of orientation and shear resistance, τ [where τ = σn ta1n-1
(Jr/Ja)].
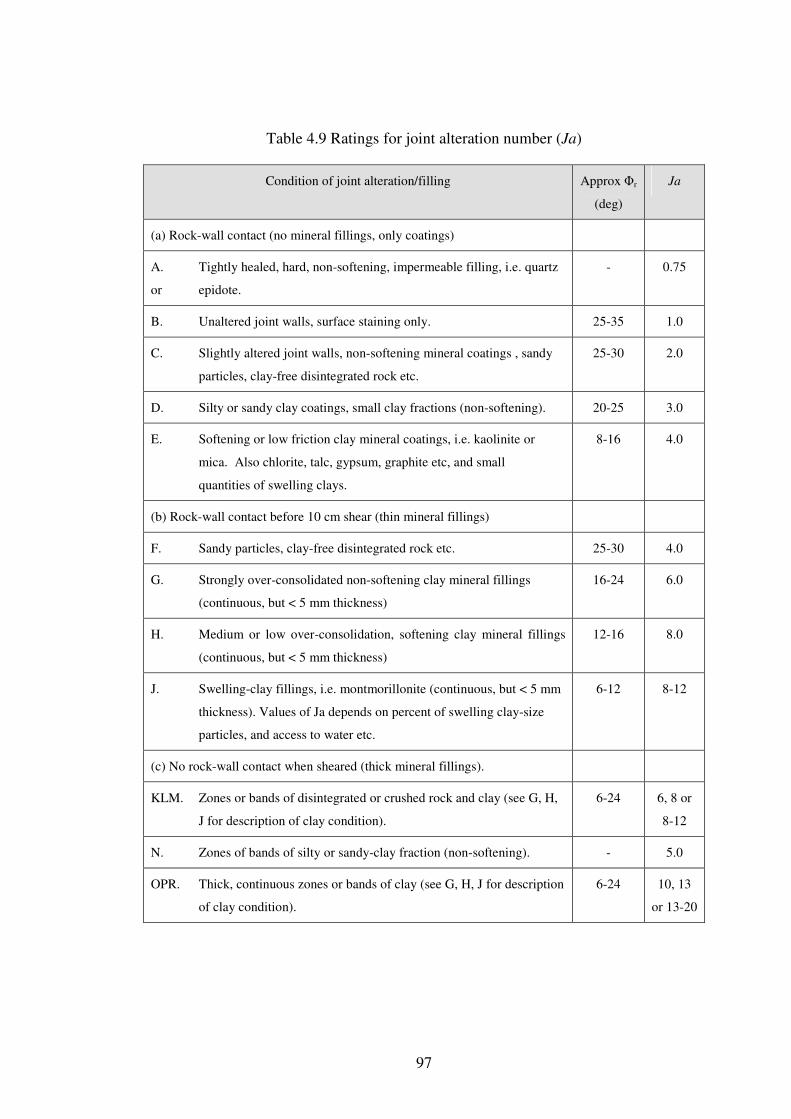
97
Table 4.9 Ratings for joint alteration number (Ja)
Condition of joint alteration/filling Approx Φr
(deg)
Ja
(a) Rock-wall contact (no mineral fillings, only coatings)
A. Tightly healed, hard, non-softening, impermeable filling, i.e. quartz
or epidote.
- 0.75
B. Unaltered joint walls, surface staining only. 25-35 1.0
C. Slightly altered joint walls, non-softening mineral coatings , sandy
particles, clay-free disintegrated rock etc.
25-30 2.0
D. Silty or sandy clay coatings, small clay fractions (non-softening). 20-25 3.0
E. Softening or low friction clay mineral coatings, i.e. kaolinite or
mica. Also chlorite, talc, gypsum, graphite etc, and small
quantities of swelling clays.
8-16 4.0
(b) Rock-wall contact before 10 cm shear (thin mineral fillings)
F. Sandy particles, clay-free disintegrated rock etc. 25-30 4.0
G. Strongly over-consolidated non-softening clay mineral fillings
(continuous, but < 5 mm thickness)
16-24 6.0
H. Medium or low over-consolidation, softening clay mineral fillings
(continuous, but < 5 mm thickness)
12-16 8.0
J. Swelling-clay fillings, i.e. montmorillonite (continuous, but < 5 mm
thickness). Values of Ja depends on percent of swelling clay-size
particles, and access to water etc.
6-12 8-12
(c) No rock-wall contact when sheared (thick mineral fillings).
KLM. Zones or bands of disintegrated or crushed rock and clay (see G, H,
J for description of clay condition).
6-24 6, 8 or
8-12
N. Zones of bands of silty or sandy-clay fraction (non-softening). - 5.0
OPR. Thick, continuous zones or bands of clay (see G, H, J for description
of clay condition).
6-24 10, 13
or 13-20
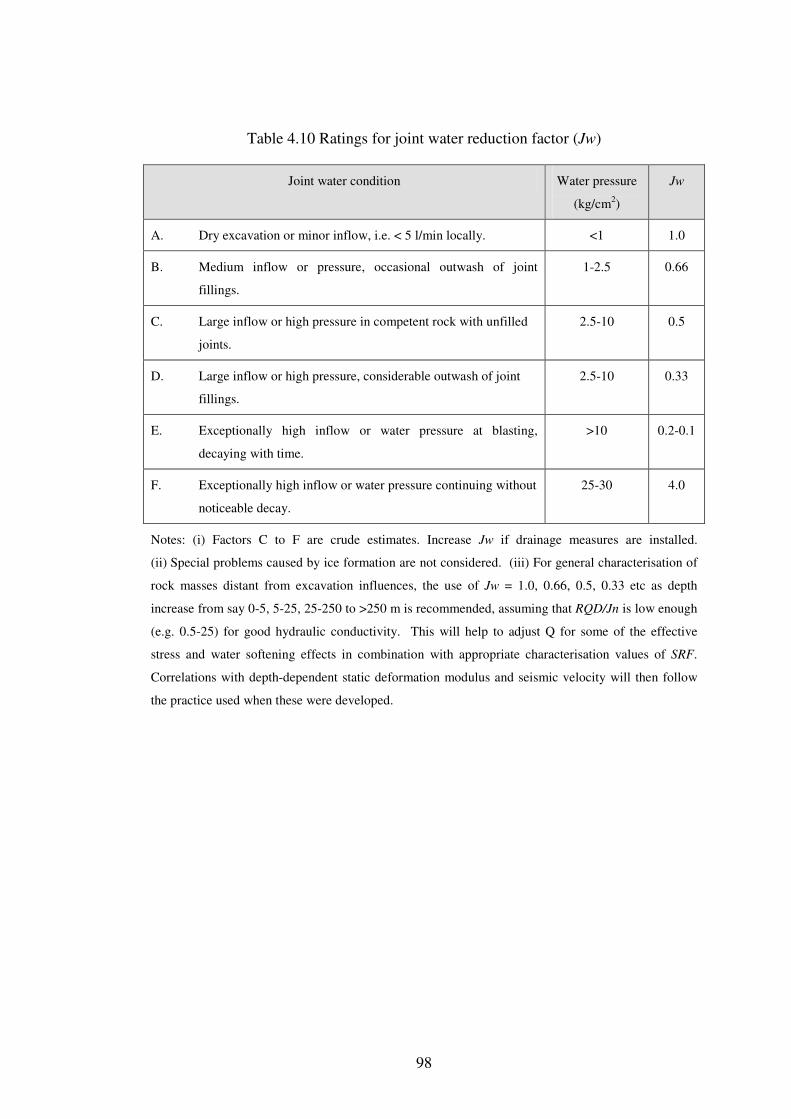
98
Table 4.10 Ratings for joint water reduction factor (Jw)
Joint water condition Water pressure
(kg/cm2)
Jw
A. Dry excavation or minor inflow, i.e. < 5 l/min locally. <1 1.0
B. Medium inflow or pressure, occasional outwash of joint
fillings.
1-2.5 0.66
C. Large inflow or high pressure in competent rock with unfilled
joints.
2.5-10 0.5
D. Large inflow or high pressure, considerable outwash of joint
fillings.
2.5-10 0.33
E. Exceptionally high inflow or water pressure at blasting,
decaying with time.
>10 0.2-0.1
F. Exceptionally high inflow or water pressure continuing without
noticeable decay.
25-30 4.0
Notes: (i) Factors C to F are crude estimates. Increase Jw if drainage measures are installed.
(ii) Special problems caused by ice formation are not considered. (iii) For general characterisation of
rock masses distant from excavation influences, the use of Jw = 1.0, 0.66, 0.5, 0.33 etc as depth
increase from say 0-5, 5-25, 25-250 to >250 m is recommended, assuming that RQD/Jn is low enough
(e.g. 0.5-25) for good hydraulic conductivity. This will help to adjust Q for some of the effective
stress and water softening effects in combination with appropriate characterisation values of SRF.
Correlations with depth-dependent static deformation modulus and seismic velocity will then follow
the practice used when these were developed.
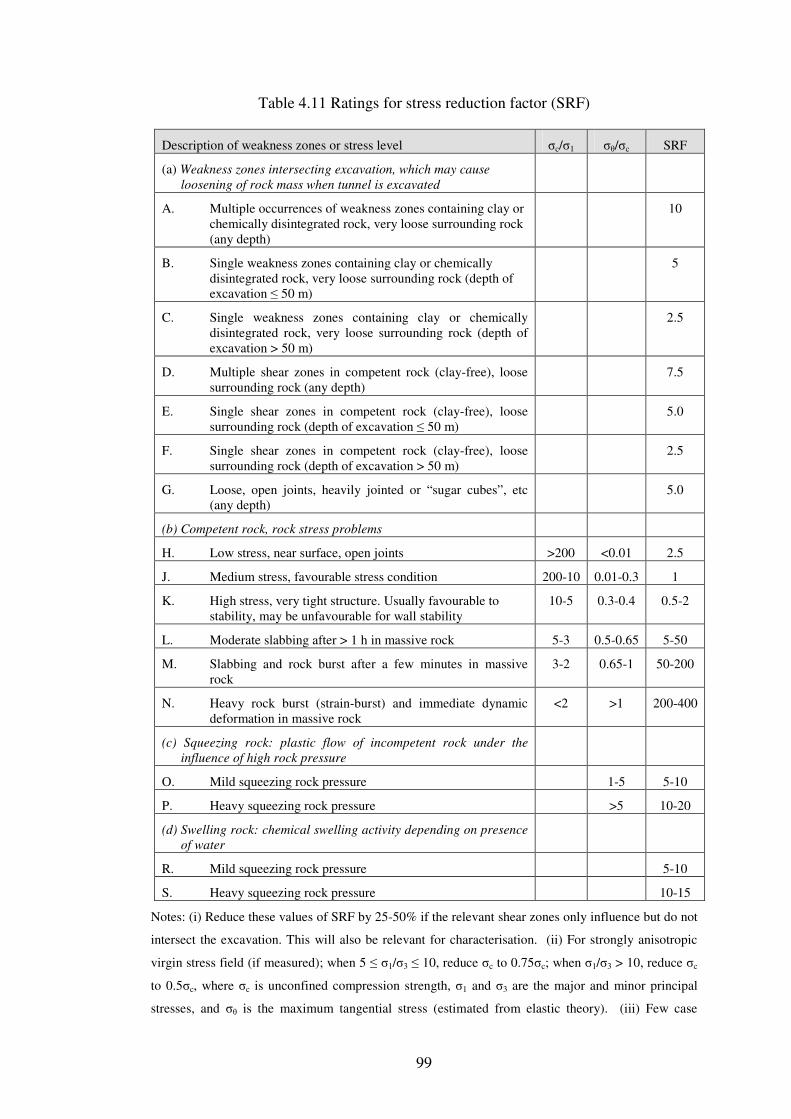
99
Table 4.11 Ratings for stress reduction factor (SRF)
Description of weakness zones or stress level σc/σ1 σθ/σc SRF
(a) Weakness zones intersecting excavation, which may cause
loosening of rock mass when tunnel is excavated
A. Multiple occurrences of weakness zones containing clay or
chemically disintegrated rock, very loose surrounding rock
(any depth)
10
B. Single weakness zones containing clay or chemically
disintegrated rock, very loose surrounding rock (depth of
excavation ≤ 50 m)
5
C. Single weakness zones containing clay or chemically
disintegrated rock, very loose surrounding rock (depth of
excavation > 50 m)
2.5
D. Multiple shear zones in competent rock (clay-free), loose
surrounding rock (any depth)
7.5
E. Single shear zones in competent rock (clay-free), loose
surrounding rock (depth of excavation ≤ 50 m)
5.0
F. Single shear zones in competent rock (clay-free), loose
surrounding rock (depth of excavation > 50 m)
2.5
G. Loose, open joints, heavily jointed or “sugar cubes”, etc
(any depth)
5.0
(b) Competent rock, rock stress problems
H. Low stress, near surface, open joints >200 <0.01 2.5
J. Medium stress, favourable stress condition 200-10 0.01-0.3 1
K. High stress, very tight structure. Usually favourable to
stability, may be unfavourable for wall stability
10-5 0.3-0.4 0.5-2
L. Moderate slabbing after > 1 h in massive rock 5-3 0.5-0.65 5-50
M. Slabbing and rock burst after a few minutes in massive
rock
3-2 0.65-1 50-200
N. Heavy rock burst (strain-burst) and immediate dynamic
deformation in massive rock
<2 >1 200-400
(c) Squeezing rock: plastic flow of incompetent rock under the
influence of high rock pressure
O. Mild squeezing rock pressure 1-5 5-10
P. Heavy squeezing rock pressure >5 10-20
(d) Swelling rock: chemical swelling activity depending on presence
of water
R. Mild squeezing rock pressure 5-10
S. Heavy squeezing rock pressure 10-15
Notes: (i) Reduce these values of SRF by 25-50% if the relevant shear zones only influence but do not
intersect the excavation. This will also be relevant for characterisation. (ii) For strongly anisotropic
virgin stress field (if measured); when 5 ≤ σ1/σ3 ≤ 10, reduce σc to 0.75σc; when σ1/σ3 > 10, reduce σc
to 0.5σc, where σc is unconfined compression strength, σ1 and σ3 are the major and minor principal
stresses, and σθ is the maximum tangential stress (estimated from elastic theory). (iii) Few case
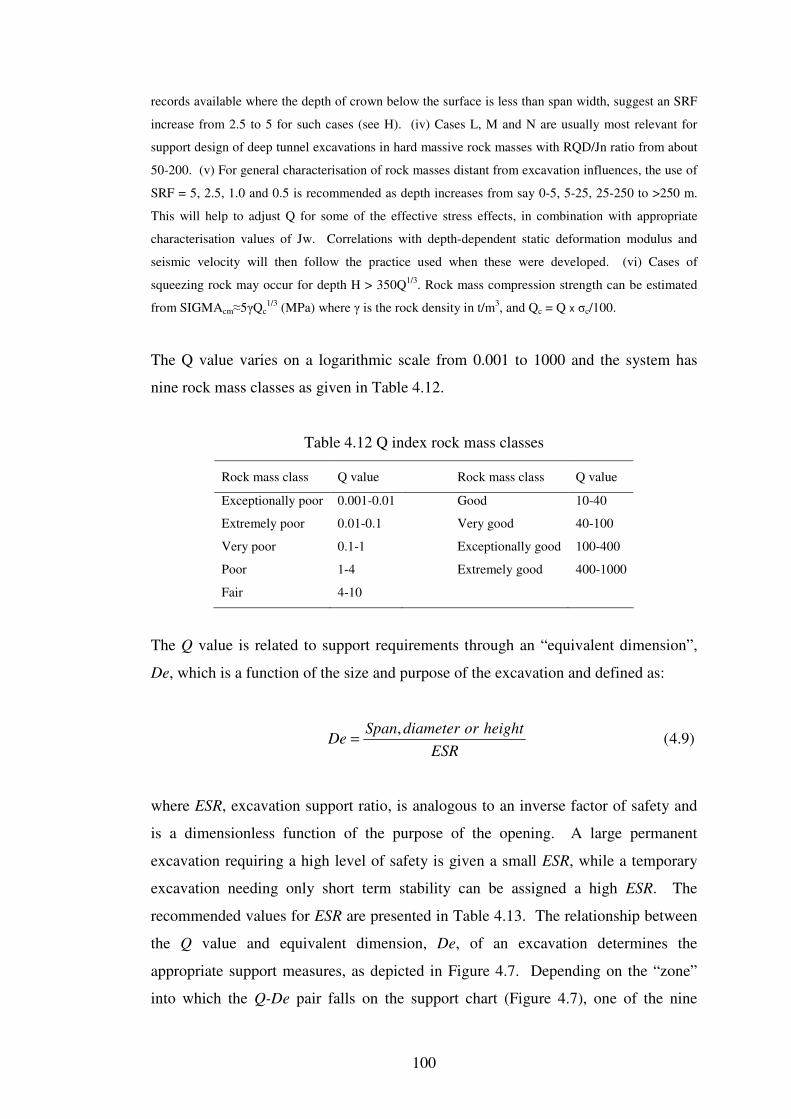
100
records available where the depth of crown below the surface is less than span width, suggest an SRF
increase from 2.5 to 5 for such cases (see H). (iv) Cases L, M and N are usually most relevant for
support design of deep tunnel excavations in hard massive rock masses with RQD/Jn ratio from about
50-200. (v) For general characterisation of rock masses distant from excavation influences, the use of
SRF = 5, 2.5, 1.0 and 0.5 is recommended as depth increases from say 0-5, 5-25, 25-250 to >250 m.
This will help to adjust Q for some of the effective stress effects, in combination with appropriate
characterisation values of Jw. Correlations with depth-dependent static deformation modulus and
seismic velocity will then follow the practice used when these were developed. (vi) Cases of
squeezing rock may occur for depth H > 350Q1/3
. Rock mass compression strength can be estimated
from SIGMAcm≈5γQc1/3
(MPa) where γ is the rock density in t/m3, and Qc = Q x σc/100.
The Q value varies on a logarithmic scale from 0.001 to 1000 and the system has
nine rock mass classes as given in Table 4.12.
Table 4.12 Q index rock mass classes
Rock mass class Q value Rock mass class Q value
Exceptionally poor 0.001-0.01 Good 10-40
Extremely poor 0.01-0.1 Very good 40-100
Very poor 0.1-1 Exceptionally good 100-400
Poor 1-4 Extremely good 400-1000
Fair 4-10
The Q value is related to support requirements through an “equivalent dimension”,
De, which is a function of the size and purpose of the excavation and defined as:
)9.4(,
ESR
heightordiameterSpanDe =
where ESR, excavation support ratio, is analogous to an inverse factor of safety and
is a dimensionless function of the purpose of the opening. A large permanent
excavation requiring a high level of safety is given a small ESR, while a temporary
excavation needing only short term stability can be assigned a high ESR. The
recommended values for ESR are presented in Table 4.13. The relationship between
the Q value and equivalent dimension, De, of an excavation determines the
appropriate support measures, as depicted in Figure 4.7. Depending on the “zone”
into which the Q-De pair falls on the support chart (Figure 4.7), one of the nine
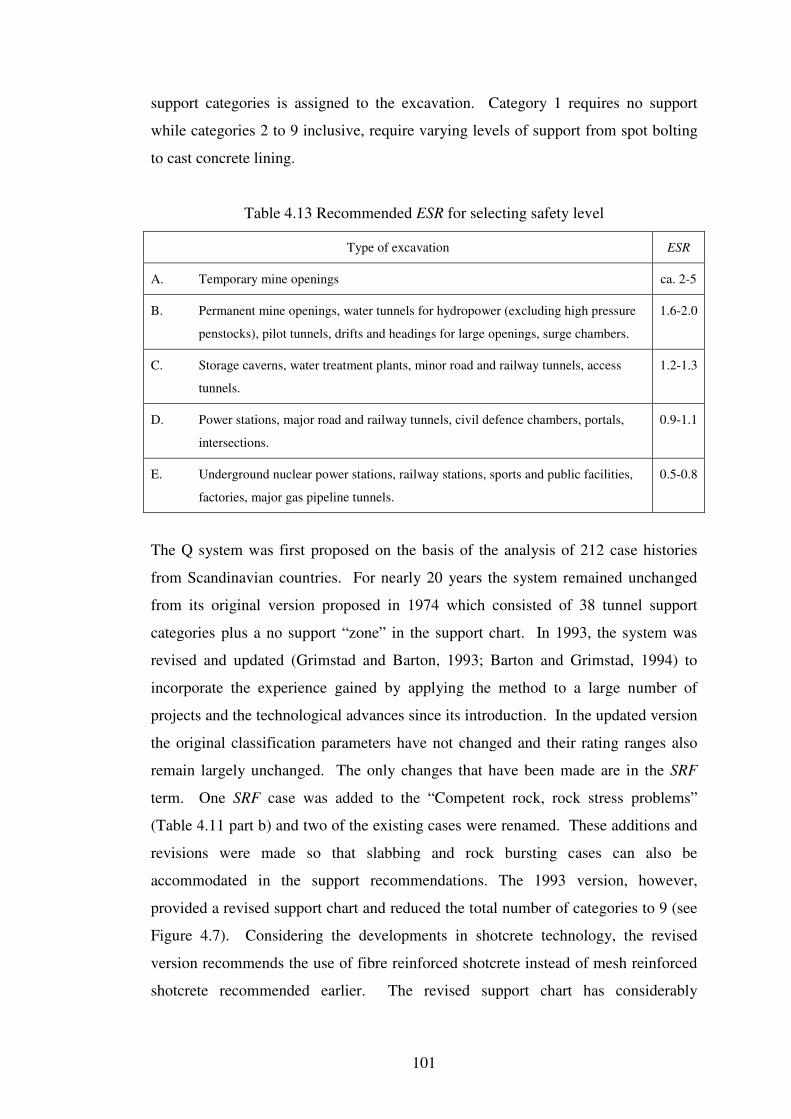
101
support categories is assigned to the excavation. Category 1 requires no support
while categories 2 to 9 inclusive, require varying levels of support from spot bolting
to cast concrete lining.
Table 4.13 Recommended ESR for selecting safety level
Type of excavation ESR
A. Temporary mine openings ca. 2-5
B. Permanent mine openings, water tunnels for hydropower (excluding high pressure
penstocks), pilot tunnels, drifts and headings for large openings, surge chambers.
1.6-2.0
C. Storage caverns, water treatment plants, minor road and railway tunnels, access
tunnels.
1.2-1.3
D. Power stations, major road and railway tunnels, civil defence chambers, portals,
intersections.
0.9-1.1
E. Underground nuclear power stations, railway stations, sports and public facilities,
factories, major gas pipeline tunnels.
0.5-0.8
The Q system was first proposed on the basis of the analysis of 212 case histories
from Scandinavian countries. For nearly 20 years the system remained unchanged
from its original version proposed in 1974 which consisted of 38 tunnel support
categories plus a no support “zone” in the support chart. In 1993, the system was
revised and updated (Grimstad and Barton, 1993; Barton and Grimstad, 1994) to
incorporate the experience gained by applying the method to a large number of
projects and the technological advances since its introduction. In the updated version
the original classification parameters have not changed and their rating ranges also
remain largely unchanged. The only changes that have been made are in the SRF
term. One SRF case was added to the “Competent rock, rock stress problems”
(Table 4.11 part b) and two of the existing cases were renamed. These additions and
revisions were made so that slabbing and rock bursting cases can also be
accommodated in the support recommendations. The 1993 version, however,
provided a revised support chart and reduced the total number of categories to 9 (see
Figure 4.7). Considering the developments in shotcrete technology, the revised
version recommends the use of fibre reinforced shotcrete instead of mesh reinforced
shotcrete recommended earlier. The revised support chart has considerably
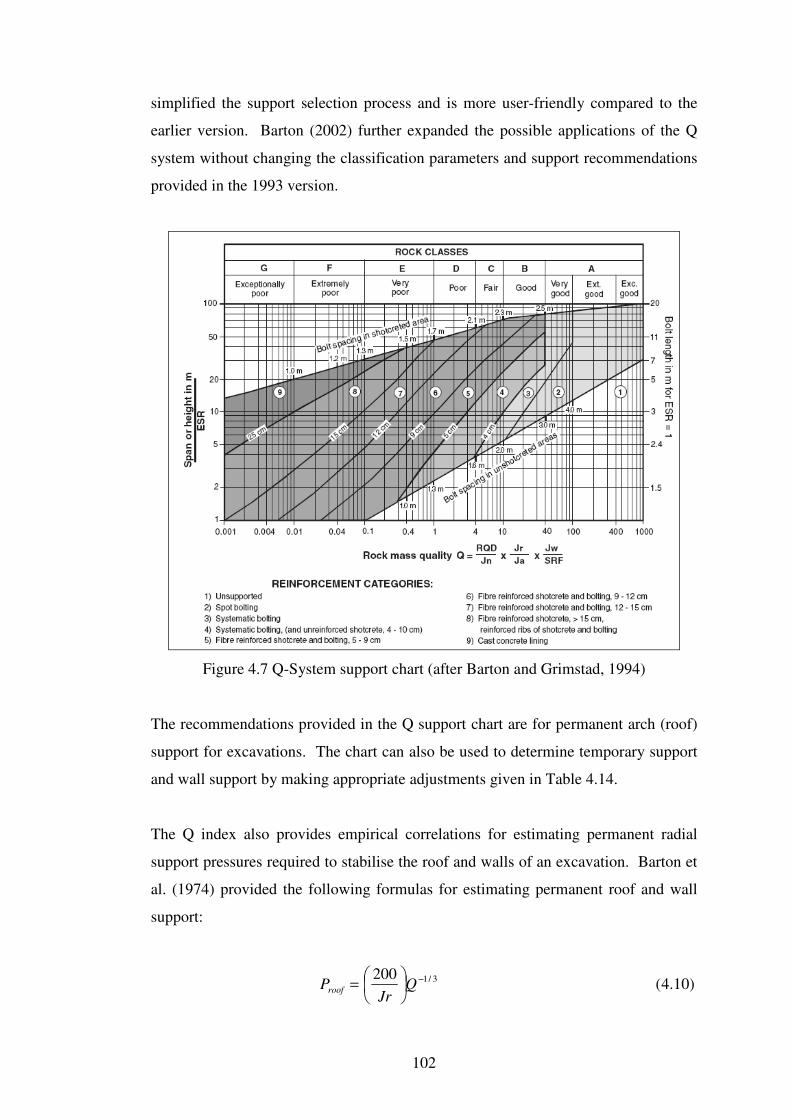
102
simplified the support selection process and is more user-friendly compared to the
earlier version. Barton (2002) further expanded the possible applications of the Q
system without changing the classification parameters and support recommendations
provided in the 1993 version.
Figure 4.7 Q-System support chart (after Barton and Grimstad, 1994)
The recommendations provided in the Q support chart are for permanent arch (roof)
support for excavations. The chart can also be used to determine temporary support
and wall support by making appropriate adjustments given in Table 4.14.
The Q index also provides empirical correlations for estimating permanent radial
support pressures required to stabilise the roof and walls of an excavation. Barton et
al. (1974) provided the following formulas for estimating permanent roof and wall
support:
)10.4(200 3/1−
= Q
JrProof
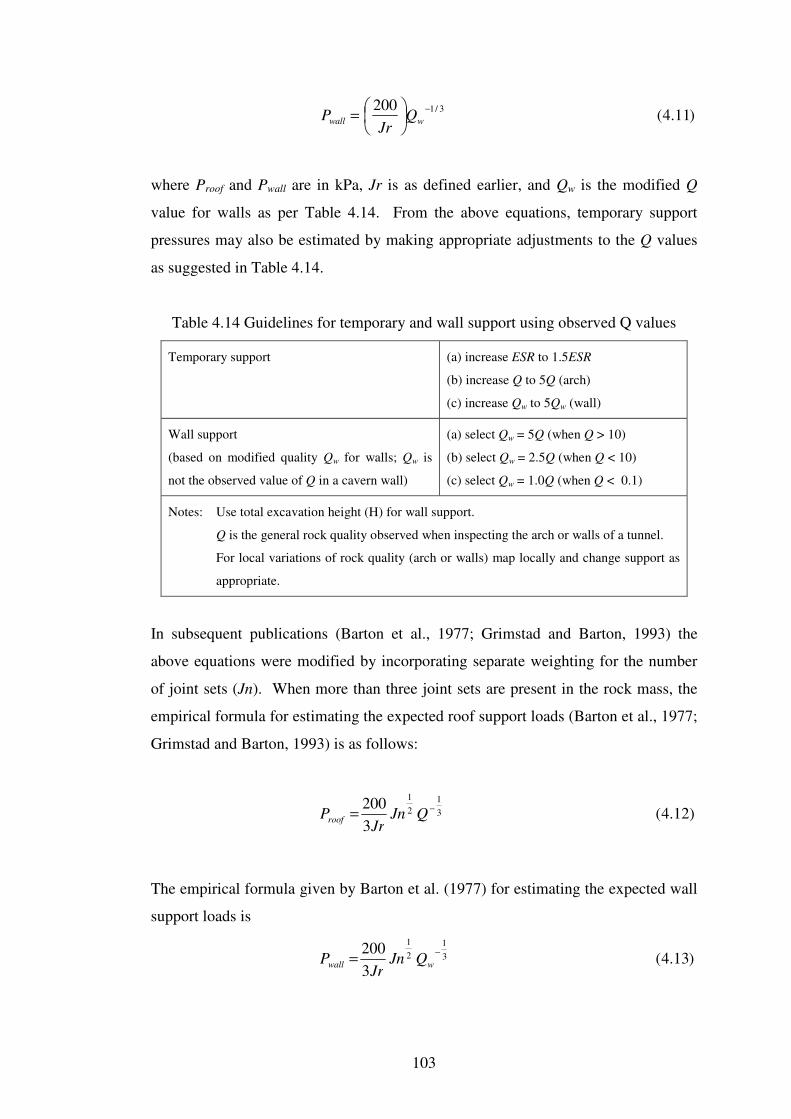
103
)11.4(200 3/1−
= wwall Q
JrP
where Proof and Pwall are in kPa, Jr is as defined earlier, and Qw is the modified Q
value for walls as per Table 4.14. From the above equations, temporary support
pressures may also be estimated by making appropriate adjustments to the Q values
as suggested in Table 4.14.
Table 4.14 Guidelines for temporary and wall support using observed Q values
Temporary support (a) increase ESR to 1.5ESR
(b) increase Q to 5Q (arch)
(c) increase Qw to 5Qw (wall)
Wall support
(based on modified quality Qw for walls; Qw is
not the observed value of Q in a cavern wall)
(a) select Qw = 5Q (when Q > 10)
(b) select Qw = 2.5Q (when Q < 10)
(c) select Qw = 1.0Q (when Q < 0.1)
Notes: Use total excavation height (H) for wall support.
Q is the general rock quality observed when inspecting the arch or walls of a tunnel.
For local variations of rock quality (arch or walls) map locally and change support as
appropriate.
In subsequent publications (Barton et al., 1977; Grimstad and Barton, 1993) the
above equations were modified by incorporating separate weighting for the number
of joint sets (Jn). When more than three joint sets are present in the rock mass, the
empirical formula for estimating the expected roof support loads (Barton et al., 1977;
Grimstad and Barton, 1993) is as follows:
)12.4(3
2003
1
2
1
−= QJnJr
Proof
The empirical formula given by Barton et al. (1977) for estimating the expected wall
support loads is
)13.4(3
2003
1
2
1−
= wwall QJnJr
P
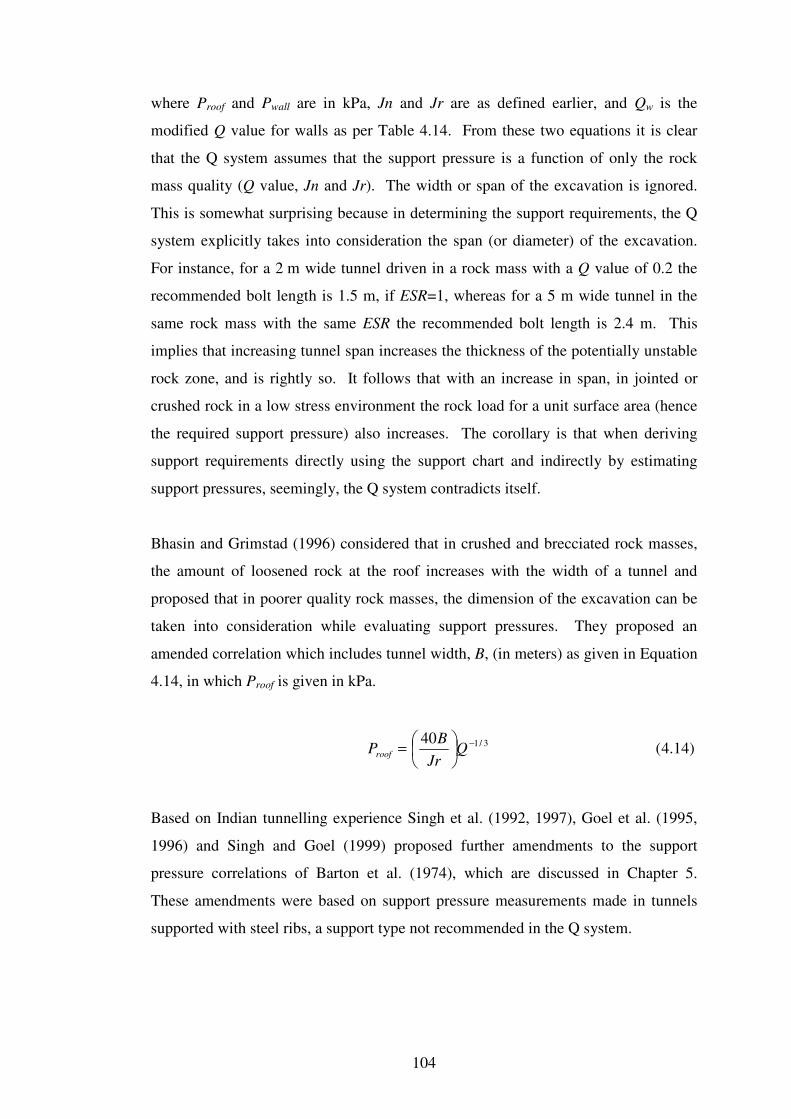
104
where Proof and Pwall are in kPa, Jn and Jr are as defined earlier, and Qw is the
modified Q value for walls as per Table 4.14. From these two equations it is clear
that the Q system assumes that the support pressure is a function of only the rock
mass quality (Q value, Jn and Jr). The width or span of the excavation is ignored.
This is somewhat surprising because in determining the support requirements, the Q
system explicitly takes into consideration the span (or diameter) of the excavation.
For instance, for a 2 m wide tunnel driven in a rock mass with a Q value of 0.2 the
recommended bolt length is 1.5 m, if ESR=1, whereas for a 5 m wide tunnel in the
same rock mass with the same ESR the recommended bolt length is 2.4 m. This
implies that increasing tunnel span increases the thickness of the potentially unstable
rock zone, and is rightly so. It follows that with an increase in span, in jointed or
crushed rock in a low stress environment the rock load for a unit surface area (hence
the required support pressure) also increases. The corollary is that when deriving
support requirements directly using the support chart and indirectly by estimating
support pressures, seemingly, the Q system contradicts itself.
Bhasin and Grimstad (1996) considered that in crushed and brecciated rock masses,
the amount of loosened rock at the roof increases with the width of a tunnel and
proposed that in poorer quality rock masses, the dimension of the excavation can be
taken into consideration while evaluating support pressures. They proposed an
amended correlation which includes tunnel width, B, (in meters) as given in Equation
4.14, in which Proof is given in kPa.
)14.4(40 3/1−
= Q
Jr
BProof
Based on Indian tunnelling experience Singh et al. (1992, 1997), Goel et al. (1995,
1996) and Singh and Goel (1999) proposed further amendments to the support
pressure correlations of Barton et al. (1974), which are discussed in Chapter 5.
These amendments were based on support pressure measurements made in tunnels
supported with steel ribs, a support type not recommended in the Q system.
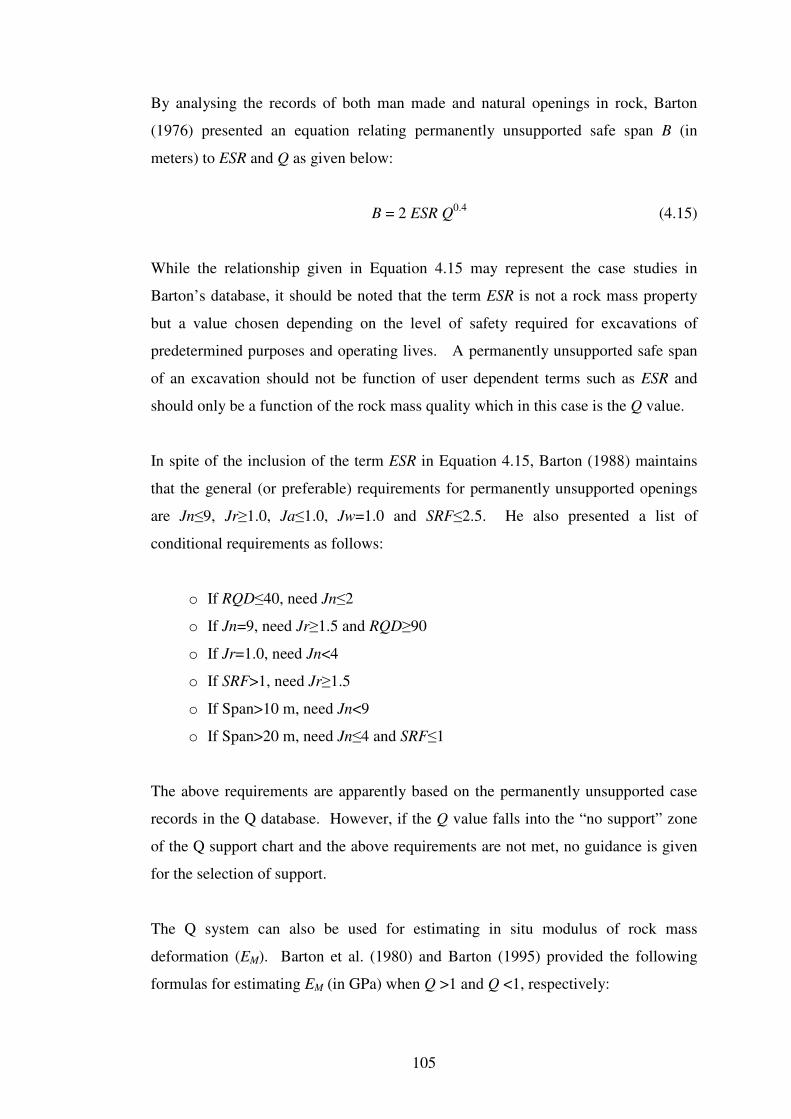
105
By analysing the records of both man made and natural openings in rock, Barton
(1976) presented an equation relating permanently unsupported safe span B (in
meters) to ESR and Q as given below:
B = 2 ESR Q0.4
(4.15)
While the relationship given in Equation 4.15 may represent the case studies in
Barton’s database, it should be noted that the term ESR is not a rock mass property
but a value chosen depending on the level of safety required for excavations of
predetermined purposes and operating lives. A permanently unsupported safe span
of an excavation should not be function of user dependent terms such as ESR and
should only be a function of the rock mass quality which in this case is the Q value.
In spite of the inclusion of the term ESR in Equation 4.15, Barton (1988) maintains
that the general (or preferable) requirements for permanently unsupported openings
are Jn≤9, Jr≥1.0, Ja≤1.0, Jw=1.0 and SRF≤2.5. He also presented a list of
conditional requirements as follows:
o If RQD≤40, need Jn≤2
o If Jn=9, need Jr≥1.5 and RQD≥90
o If Jr=1.0, need Jn<4
o If SRF>1, need Jr≥1.5
o If Span>10 m, need Jn<9
o If Span>20 m, need Jn≤4 and SRF≤1
The above requirements are apparently based on the permanently unsupported case
records in the Q database. However, if the Q value falls into the “no support” zone
of the Q support chart and the above requirements are not met, no guidance is given
for the selection of support.
The Q system can also be used for estimating in situ modulus of rock mass
deformation (EM). Barton et al. (1980) and Barton (1995) provided the following
formulas for estimating EM (in GPa) when Q >1 and Q <1, respectively:
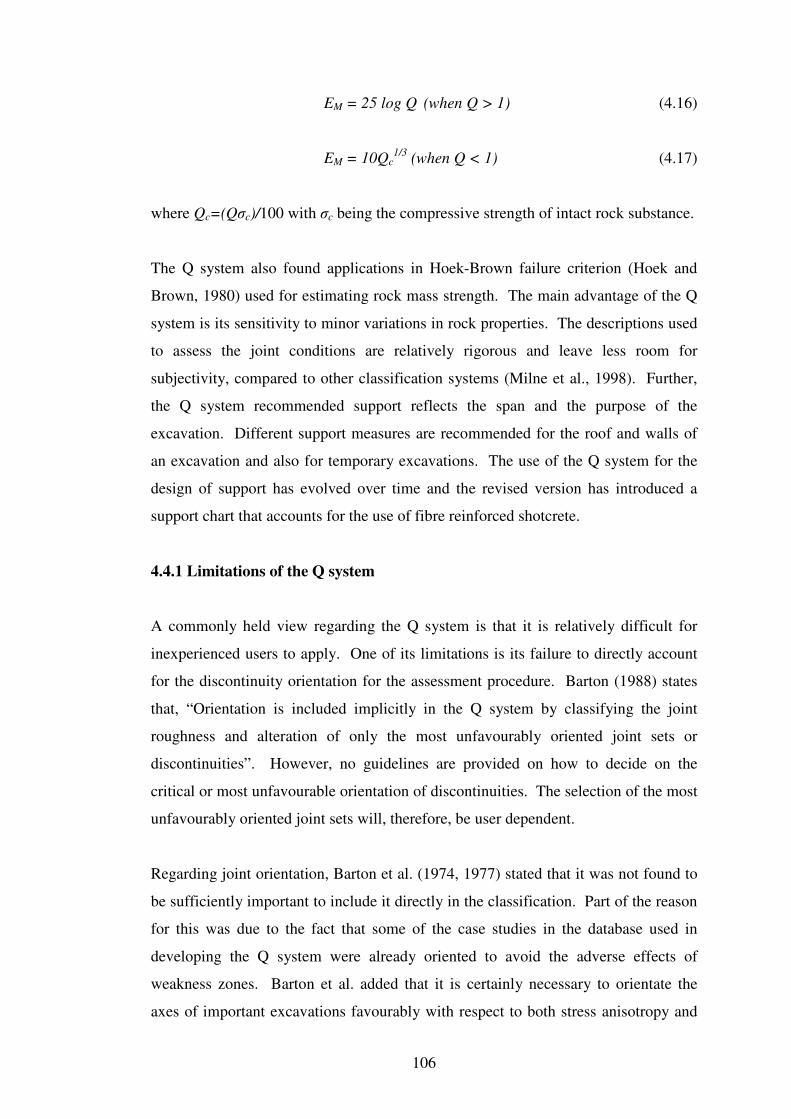
106
EM = 25 log Q (when Q > 1) (4.16)
EM = 10Qc1/3
(when Q < 1) (4.17)
where Qc=(Qσc)/100 with σc being the compressive strength of intact rock substance.
The Q system also found applications in Hoek-Brown failure criterion (Hoek and
Brown, 1980) used for estimating rock mass strength. The main advantage of the Q
system is its sensitivity to minor variations in rock properties. The descriptions used
to assess the joint conditions are relatively rigorous and leave less room for
subjectivity, compared to other classification systems (Milne et al., 1998). Further,
the Q system recommended support reflects the span and the purpose of the
excavation. Different support measures are recommended for the roof and walls of
an excavation and also for temporary excavations. The use of the Q system for the
design of support has evolved over time and the revised version has introduced a
support chart that accounts for the use of fibre reinforced shotcrete.
4.4.1 Limitations of the Q system
A commonly held view regarding the Q system is that it is relatively difficult for
inexperienced users to apply. One of its limitations is its failure to directly account
for the discontinuity orientation for the assessment procedure. Barton (1988) states
that, “Orientation is included implicitly in the Q system by classifying the joint
roughness and alteration of only the most unfavourably oriented joint sets or
discontinuities”. However, no guidelines are provided on how to decide on the
critical or most unfavourable orientation of discontinuities. The selection of the most
unfavourably oriented joint sets will, therefore, be user dependent.
Regarding joint orientation, Barton et al. (1974, 1977) stated that it was not found to
be sufficiently important to include it directly in the classification. Part of the reason
for this was due to the fact that some of the case studies in the database used in
developing the Q system were already oriented to avoid the adverse effects of
weakness zones. Barton et al. added that it is certainly necessary to orientate the
axes of important excavations favourably with respect to both stress anisotropy and
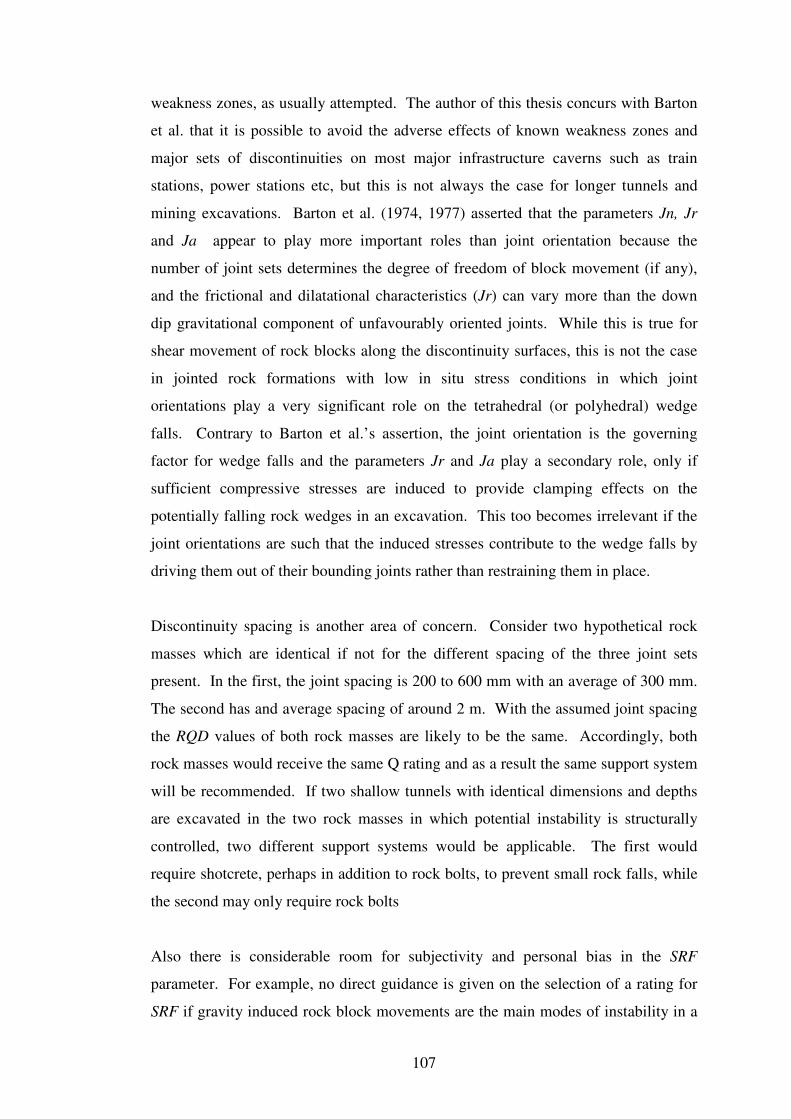
107
weakness zones, as usually attempted. The author of this thesis concurs with Barton
et al. that it is possible to avoid the adverse effects of known weakness zones and
major sets of discontinuities on most major infrastructure caverns such as train
stations, power stations etc, but this is not always the case for longer tunnels and
mining excavations. Barton et al. (1974, 1977) asserted that the parameters Jn, Jr
and Ja appear to play more important roles than joint orientation because the
number of joint sets determines the degree of freedom of block movement (if any),
and the frictional and dilatational characteristics (Jr) can vary more than the down
dip gravitational component of unfavourably oriented joints. While this is true for
shear movement of rock blocks along the discontinuity surfaces, this is not the case
in jointed rock formations with low in situ stress conditions in which joint
orientations play a very significant role on the tetrahedral (or polyhedral) wedge
falls. Contrary to Barton et al.’s assertion, the joint orientation is the governing
factor for wedge falls and the parameters Jr and Ja play a secondary role, only if
sufficient compressive stresses are induced to provide clamping effects on the
potentially falling rock wedges in an excavation. This too becomes irrelevant if the
joint orientations are such that the induced stresses contribute to the wedge falls by
driving them out of their bounding joints rather than restraining them in place.
Discontinuity spacing is another area of concern. Consider two hypothetical rock
masses which are identical if not for the different spacing of the three joint sets
present. In the first, the joint spacing is 200 to 600 mm with an average of 300 mm.
The second has and average spacing of around 2 m. With the assumed joint spacing
the RQD values of both rock masses are likely to be the same. Accordingly, both
rock masses would receive the same Q rating and as a result the same support system
will be recommended. If two shallow tunnels with identical dimensions and depths
are excavated in the two rock masses in which potential instability is structurally
controlled, two different support systems would be applicable. The first would
require shotcrete, perhaps in addition to rock bolts, to prevent small rock falls, while
the second may only require rock bolts
Also there is considerable room for subjectivity and personal bias in the SRF
parameter. For example, no direct guidance is given on the selection of a rating for
SRF if gravity induced rock block movements are the main modes of instability in a
108
jointed rock mass in which no major weakness or shear zones (described in Section
“a” of Table 4.11) intersect the excavation. Further, for weakness zones intersecting
excavation (Table 4.11 Section “a”), the rating boundaries are abrupt. For some of
the possible conditions listed under SRF parameters, wide ranges of ratings are
recommended (see Table 4.11 Section “b”). For instance, “moderately slabbing”
condition is given a rating range of 5 to 50, which could result in a vastly different Q
values depending on the rating chosen by the user and this could lead to the
recommendation of distinctly different support types and quantities for the same rock
mass by different users of the Q system.
Kirsten (1988b) considered that selection of ratings for Ja parameter in the Q system
is quite complex and relatively open to interpretation. He provided a revised table
based on the original table (Table 4.9) of ratings for the Ja parameter provided by
Barton et al. (1974). Kirsten’s revised table included changes to the original rating
values and also additional rating values for the Ja parameter. However, Barton and
co-workers did not include Kirsten’s suggestions in the revised Q system published
in 1993 or in subsequent publications.
Kirsten (1988b) maintains that the determination of SRF is also open to interpretation
because of the qualitative nature of the criteria given in the Q system and the
difficulties that often arise in the case of homogeneous rock masses with regard to
assessing the degree of stressing, bursting, squeezing and swelling. He observed that
in the case of non-homogeneous rock, SRF is related to the overall quality of the
rock, Q, and, in the case of homogeneous rock, to the field stress state relative to the
rock mass strength. The perspective relationships for SRF of non-homogeneous and
homogeneous rock masses were given by the expressions
SRFn = 1.809 Q-0.329
(4.18)
SRFh = 0.244 K0.346
(H/UCS)1.322
+ 0.176(UCS/H)1.413
(4.19)
where, Q = (RQD/Jn)(Jr/Ja)(Jw/SRF); K = maximum to minimum principal stress
ratio; H = head of rock corresponding to maximum principal stress field; UCS is
unconfined compressive strength of rock in MPa. As per the first expression, before
109
determining SRFn the Q value should be determined for the rock mass in question.
However, it is uncertain as to which SRF value should be used in the determination
of the Q value to be used in the first expression. Although these expressions may
remove some of the uncertainties in the SRF term, they may complicate an otherwise
relatively straightforward assessment of a rock mass using the Q system. Barton and
co-workers did not include these suggestions in the updated version of the Q system
or in subsequent publications dealing with the Q system. Nevertheless, Kirsten’s
suggestions for estimating the SRF term have been adopted by some users of the Q
system.
For cases L, M and N (moderate slabbing, slabbing and rock burst, and heavy rock
burst, respectively) the SRF values selected based on σc/σ1 and σθ/σc ratios pertain to
massive rocks only, which should really be the case since slabbing, rock burst etc are
associated with competent massive rocks only. As pointed out by Kumar et al.
(2004) there are, however, situations in which ratios σc/σ1 and σθ/σc lie in ranges
corresponding to conditions L, M and N, but the rock is moderately jointed and not
massive. For these situations Table 4.11 does not provide SRF values. If SRF values
are selected for “rock stress problems” purely on the basis of σc/σ1 and σθ/σc ratios,
the results might be correct for massive rocks but are bound to be incorrect for
jointed rock masses.
4.5 The Main Differences between the RMR and Q Systems
As mentioned previously, both methods are based on six parameters considered to
represent the behaviour of rock masses. When viewed from a broader perspective,
the basic concepts of both schemes are similar and allocate ratings to the properties
that influence the rock mass behaviour. However, there are differences in the
parameter ratings and the manner in which the final RMR and Q values are
computed. For instance, the RMR value is computed by adding the ratings assigned
to the constituent parameters, while the Q value is obtained by division and
multiplication. In addition, the assessment of some of the key rock mass parameters
is significantly different in the two methods as discussed below:
110
o Intact rock strength (IRS) is a factor in the SRF term of the Q system, only if
the excavation stability is affected by the in situ stress field. In contrast IRS is
always included in the RMR value. If IRS changes while all the other
parameters remain virtually the same, several RMR values are possible for a
single Q value.
o The in situ stress field is not accounted for in the RMR system in classifying
a rock mass. In the Q system it is a factor in the SRF term if excavation
instability is stress driven. Thus for a rock mass with a given RMR value,
several different Q values are possible depending on the SRF value used.
o Joint spacing (JS) is a key parameter in the RMR system; the closer the JS the
lower the RMR value and the wider the JS the higher the RMR value. This is
not so in the Q system. As pointed out by Milne et al. (1998), if three or
more joint sets are present and the joints are widely spaced, it is difficult to
get the Q system to reflect the competent nature of a rock mass. For widely
spaced jointing, the joint set parameter Jn in the Q system appears to unduly
reduce the resulting Q value (Milne et al., 1998). Thus for a single Q value
several RMR values are possible depending on JS.
o RQD is used in both methods, and is a function of joint spacing, albeit it does
not fully represent the true nature of joint spacing. In addition to RQD, as
already mentioned, JS is also a key parameter in the RMR method. In the Q
system, although the number of joint sets is taken into account, spacing is not
considered directly. This means joint spacing is counted twice in the RMR
method, while the Q system uses it indirectly only once.
o Joint orientation (JA) is accounted for directly in the RMR method by
allocating a rating between 0 and -12. In the Q system this is considered
implicitly, but no guidelines are provided to identify the adversely oriented
discontinuities. Thus the selection of the most critical discontinuity set is
user-dependent. In any case no rating is given to the JA in the Q system.
Thus for a given Q value, different RMR values are possible depending on the
orientation of the excavation relative to the discontinuity set orientation.
111
o Rating scale: The rating scales in the RMR method have been changed
several times as shown in Table 4.1, while Q remained unchanged for some
20 years until 1993. For a rock mass with a given Q value, different RMR
values can be obtained depending on the RMR version used. Since 1993, the
SRF parameter of the Q system is given a rating scale of 1 to 400 for
competent rock with rock stress problems. As mentioned earlier, depending
on the SRF valued used, different Q values can be obtained for a rock mass
with a given RMR value. With the 1 to 400 range of SRF values, the
difference in the Q value can be more than two orders of magnitude. By
setting the SRF value to 1 in deriving the Q values this problem may be
overcome if the SRF term represents only the stress. It is not, however,
strictly a stress factor as it also represents weakness zones, which are rock
mass parameters.
From the foregoing, it is clear that the predictions made by the two systems are
unlikely to match perfectly for all rock mass conditions in underground excavations.
A universally applicable single formula for linking RMR and Q value is also unlikely
to be obtained.
112
CHAPTER 5
PREVIOUS STUDIES ON RMR AND Q
5.1 Introduction
Research on the literature undertaken for the present study has shown that a plethora
of technical papers have been published on the RMR and Q indices since their advent
as underground excavation support design tools. The vast majority of these papers
covered the general application of the two indices to new underground excavation
projects without attempting to evaluate their reliability and therefore has no direct
relevance to the present study. Several studies dealing with the limitations and
reliability of the RMR and Q classification indices and possible areas for their
improvements were, however, found and this chapter presents a brief overview of
these.
5.2 Studies on the Reliability of RMR and Q
Studies on the reliability of the two classifications methods can be divided into two
broad groups. The first comprises experience-based reviews with no detailed
application of the two methods to any particular excavation project. The second
group, which represents the majority, is based on the direct application of the two
indices to underground excavation support design.
The first group reviews the two classification methods from the points of view of the
ease of application, the accuracy and subjectivity of ratings allocation, and the
accuracy of their predictions for assumed rock mass conditions. These studies are
very limited in number and are largely desk studies carried out by researchers fully
conversant with the classification methods. They do not directly apply the two
methods to any particular case study, however, where necessary, in order to clarify
issues of concern, the classification methods are applied to examples taken from
113
excavation projects. Notable amongst these are the studies by Bieniawski (1976),
Speers (1992), Stille and Plamstom (2003), and Palmstrom and Broch (2006).
The second group, which represent the majority, is based on the direct application of
the two indices, as a design tool, to underground excavations during either the initial
design stage or the construction stage or both stages. This group maintains that
despite some differences in the RMR and Q methods, both are based on six
parameters considered to represent the behaviour of rock masses. It is, therefore,
reasonable to expect the two methods to deliver comparable conclusions with respect
to support requirements of excavations. If the two methods are reliable and
applicable to any project, their predictions should also be comparable to the design
predictions made by other applicable methods. Taking these factors into
consideration the second group was mostly based on the comparison of:
o the applicability of different classification methods,
o the support measures and support pressures (rock loads) predicted by one
classification method with those of the other,
o the support requirements predicted by classification methods with those of
the other applicable methods,
o the support requirements predicted by classification methods with the
support installed in excavations, and
o the support pressures predicted by classification methods with those
measured using instrumentation.
While no single study has attempted to cover all these five items, most have dealt
with more than one. A summary of the second group of studies is presented in Table
5.1. A brief overview of each previous study on the reliability of the two methods
and a summary of their conclusions are presented in Section 5.2.
The literature also revealed that several researchers have attempted to establish a
correlation between the rating values produced by the RMR and Q systems, some
researchers specifically focussing on this aspect alone. A discussion on the
correlations between the two methods is presented in Section 5.3.
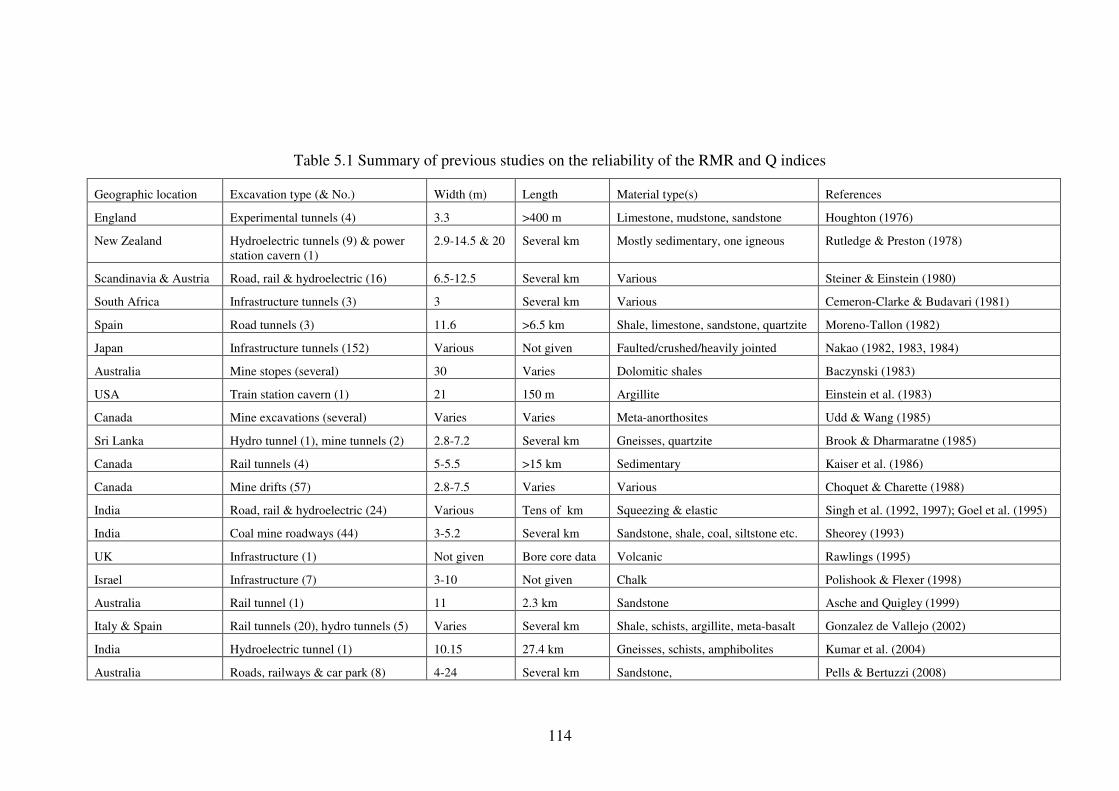
114
Table 5.1 Summary of previous studies on the reliability of the RMR and Q indices
Geographic location Excavation type (& No.) Width (m) Length Material type(s) References
England Experimental tunnels (4) 3.3 >400 m Limestone, mudstone, sandstone Houghton (1976)
New Zealand Hydroelectric tunnels (9) & power
station cavern (1)
2.9-14.5 & 20 Several km Mostly sedimentary, one igneous Rutledge & Preston (1978)
Scandinavia & Austria Road, rail & hydroelectric (16) 6.5-12.5 Several km Various Steiner & Einstein (1980)
South Africa Infrastructure tunnels (3) 3 Several km Various Cemeron-Clarke & Budavari (1981)
Spain Road tunnels (3) 11.6 >6.5 km Shale, limestone, sandstone, quartzite Moreno-Tallon (1982)
Japan Infrastructure tunnels (152) Various Not given Faulted/crushed/heavily jointed Nakao (1982, 1983, 1984)
Australia Mine stopes (several) 30 Varies Dolomitic shales Baczynski (1983)
USA Train station cavern (1) 21 150 m Argillite Einstein et al. (1983)
Canada Mine excavations (several) Varies Varies Meta-anorthosites Udd & Wang (1985)
Sri Lanka Hydro tunnel (1), mine tunnels (2) 2.8-7.2 Several km Gneisses, quartzite Brook & Dharmaratne (1985)
Canada Rail tunnels (4) 5-5.5 >15 km Sedimentary Kaiser et al. (1986)
Canada Mine drifts (57) 2.8-7.5 Varies Various Choquet & Charette (1988)
India Road, rail & hydroelectric (24) Various Tens of km Squeezing & elastic Singh et al. (1992, 1997); Goel et al. (1995)
India Coal mine roadways (44) 3-5.2 Several km Sandstone, shale, coal, siltstone etc. Sheorey (1993)
UK Infrastructure (1) Not given Bore core data Volcanic Rawlings (1995)
Israel Infrastructure (7) 3-10 Not given Chalk Polishook & Flexer (1998)
Australia Rail tunnel (1) 11 2.3 km Sandstone Asche and Quigley (1999)
Italy & Spain Rail tunnels (20), hydro tunnels (5) Varies Several km Shale, schists, argillite, meta-basalt Gonzalez de Vallejo (2002)
India Hydroelectric tunnel (1) 10.15 27.4 km Gneisses, schists, amphibolites Kumar et al. (2004)
Australia Roads, railways & car park (8) 4-24 Several km Sandstone, Pells & Bertuzzi (2008)
115
5.2.1 Application to the Kielder Experimental Tunnel
In a comprehensive study on the role of rock quality classification indices in the
assessment of rock masses, Houghton (1976) applied the RMR73, Q74 and RSR
methods to the Kielder experimental tunnel system in England. It comprised an
access decline (adit) and three horizontal tunnels, all with a diameter of
approximately 3.3 m. A sequence of more or less horizontally stratified four rock
types, Great Limestone, Four Fathom Mudstone, Four Fathom Limestone and
Natrass Gill Sandstone, in that order from top to bottom, were present on the site.
No major faults were present in the rocks although joints were well developed. Drill
and blast and machine excavation methods were employed for tunnel construction as
part of the experiment. The adit was driven through all four rock types and one
tunnel each was driven in Four Fathom Mudstone, Four Fathom Limestone and
Natrass Gill Sandstone. Houghton produced a series of analyses using the three
classification indices in the access adit and three horizontal tunnels. Different
support systems were tested and classification indices were related to the actual
support used. The main conclusions drawn from the study were:
o The three classification systems gave consistent predictions and variations
reflect the different parameters used in the three systems rather than
functional differences in the interpretation of rock mass behaviour.
o Each classification system gives a range of values reflecting the variation in
the constituent parameters. Thus for any rigorous analysis a series of
values should be obtained rather than one value.
o Classification systems need to be interpreted in the context of local
geological environment.
o For practical work RMR is easier to apply. The degree of sophistication in
the Q system requires considerable expertise and did not produce any
significant improvement in the final predictions.
116
o A classification index is only an average value. Zones of lower quality
rock will exist, defined often by a single major discontinuity controlling
tunnel stability. Thus in making any assessment one needs not only to
define the average condition, but also to indicate potentially poorer quality
zones.
o Machine excavated rock has a higher overall quality score compared to that
excavated by conventional drill and blast techniques.
Houghton also found that the quantification of the effect of groundwater is the least
understood parameter in the classification systems. Since both groundwater pressure
and flow quantity exert a considerable influence on the rock mass, further
improvements should be made in the measurement and assessment of this parameter
in a more meaningful way.
5.2.2 Review and Comparison by Bieniawski
Bieniawski (1976) presented a review of the rock mass classification methods
available up to that time and found that RMR and Q methods received particular
attention both from researchers and underground excavation industry personnel.
Bieniawski emphasised that for a rock mass classification method to be of practical
value, it should be possible to select ratings for input parameters from bore core data
alone. This is important because they are the only available sources of information at
early stages of most new projects. Based on his review, Bieniawski made the
following observations with regard to the RMR and Q indices:
o The RMR system places emphasis on, amongst other things, the orientation
of structural features and material strength which are not direct parameters
in the Q system. On the other hand the Q system takes account of the rock
stress which is only indirectly considered in the RMR system.
o A classification approach should not be taken too far as a substitute for rock
engineering design. While very powerful when correctly used, in the case
117
of complex structures created in rock such as large multiple caverns, the
classification approaches are just not sufficient.
o One should not necessarily rely on any one classification system and aim at
its standardisation but cross check the findings of one classification with
those of others.
Bieniawski (1976) also presented a correlation based on a linear regression analysis
of 111 sets of RMR and Q values obtained from several Scandinavian, South African,
North American, European and Australian case histories as given below:
RMR = 9 ln Q + 44 (5.1)
Since the data used in deriving Equation 5.1 were widely scattered about the linear
regression line, Bieniawski also provided the 90% confidence limits (given as
Equation 5.1a) within which 90% of the data used would fall.
RMR = 9 ln Q + 44 ± 18 (5.1a)
Subsequently in 1989, by adding data from Indian case histories compiled by Jethwa
et al. (1982), Bieniawski (1989) supplemented the database used for Equation 5.1.
5.2.3 New Zealand Tunnelling Experience
Rutledge and Preston (1978) applied RMR76 and Q74, together with the RSR method,
to six tunnelling projects in New Zealand. They consisted of nine tunnel headings,
with horseshoe, inverted U and circular shapes, and one powerhouse cavern. The
excavation techniques employed in these projects were drill and blast, tunnel boring
machine (TBM), and road-header with and without partial shield. The tunnel spans
varied from 2.9 to 14.5 m. The powerhouse cavern span is 20.5 m with a height of
36 m. Five of the projects were constructed in sedimentary rock formations and the
sixth was in igneous rocks. The tunnels were mostly supported with steel sets. The
study included comparisons of support pressures predicted by Q (using Equation
118
4.10) and RSR with those measured using strain gauges installed in steel sets. The
main conclusions drawn from the study of relevance to RMR and Q were:
o In general, the classification methods were easy to apply.
o The systems place strong emphasis on geological/rock mechanics
parameters and not enough emphasis on the method of excavation. The
most important parameter affecting the loading (support pressure) is the
method of excavation.
o In general, one should use all the methods available without relying on any
one classification method.
o Rock durability is an important parameter not included in any of the
systems.
o For a given rock class, the support pressure does not increase linearly from
zero at zero tunnel width, but shows a less than linear increase with
increasing tunnel width.
o Many of the rock support pressures predicted by the Q system were greater
than the measured rock loads by an excessively conservative margin.
o An equation can be developed for the estimation of support pressure using
RMR values (note that the 1976 version of RMR used in this study did not
provide a formula for estimating support pressures).
The most important observation in this study is that many of the support pressures
predicted by the Q system (using Equation 4.10) were greater than the measured rock
loads by an excessively conservative margin. A possible argument against this
observation is that the equation intended to predict the pressures on shotcrete and
rock bolts rather than rock loads on steel sets. However, Rutledge and Preston
commented that because of rock loosening, the loads on steel sets would be higher
119
than loads on rock bolts and shotcrete, and therefore the observed conservatism in
the Q predicted support pressures is realistic.
Rutledge and Preston also presented linear correlations between RMR and Q, RSR
and Q, and RMR and RSR for the data collected from the six tunnelling projects. The
correlation between RMR and Q is presented as Equation 5.2 below.
RMR = 5.9 ln Q + 43 = 13.5 log Q + 43 (5.2)
The data used for deriving the above formula are not presented by the two authors.
However, a plot of data for RSR and Q presented in their paper shows wide scattering
of the data. Regarding the RMR-Q correlation the two authors commented that, “It
was expected that there would have been a better correlation than that obtained and
it is obvious that more development of the systems is required, especially in the
weighting given to each parameter making up the classification”. This implies that
RMR and Q data points are also scattered about the regression line defined by
Equation 5.2.
5.2.4 Review by Steiner and Einstein
In a comprehensive study of empirical design methods in rock tunnelling, Steiner and
Einstein (1980) reviewed several methods including the RMR and Q indices used for
tunnel support design. The study included application of five empirical methods,
RMR, Q, RSR, RQD and Terzaghi’s method, to some of the Scandinavian case
studies reported by Cecil (1970, 1975) and also to the Arlberg and Tauern tunnels in
Austria. At the time, Cecil’s cases formed the basis of the Q system. The Arlberg
and Tauern tunnels were driven and supported using NATM. Steiner and Einstein
(1980) provided the results of example application of the five methods to eight
unsupported cases and six supported cases reported by Cecil. The widths of the eight
unsupported cases are as follows: one tunnel each at 6.5 m, 8 m and 11.25 m; two
tunnels at 12.5 m; and three tunnels 9 m. The widths of the six supported cases are:
three tunnels at 5.9 m; two tunnels 12.5 m; one tunnel 6.5 m. The conclusions
relevant to the RMR and Q systems drawn from the review were:
120
o The RMR system does not require much user experience. The six
parameters can be easily determined either during preliminary
investigations or during construction.
o The limit of applicability of RMR is not fully known. The changes,
however, suggests that the method is not generally applicable.
o During construction, time constraints may limit the use of the Q system, not
so much regarding measurements of the parameters but ground assessment
with the relatively complex set of tables and notes.
o Jr and Ja parameters of the Q system require experience and may be
difficult to determine if the tunnel is outside the range of base cases. The
selection may also be problematic if multiple joint sets are encountered.
o Discontinuity orientation is only indirectly considered in the Q system and
no guidelines are given on how to decide on the critical discontinuities and
combination of Jr and Ja parameters.
o Unsurprisingly, the Q method predicted no support for the Cecil’s
unsupported cases as these formed part of its database. Q predictions
agreed well with the Cecil’s supported cases, except for one for which Q
predicted no support.
o The RMR system predicted considerable support for all Cecil’s
unsupported cases. In the supported cases the RMR predictions were
conservative compared to the actually placed support.
o Support pressure relations of the Q system are not reliable.
o For the Arlberg and Tauern tunnels the predictions using the Q method
showed large variations for both ground support and support pressures.
RMR predicted support requirements came very close to the actually placed
ones.
121
o Overall none of the methods could be judged to be better than another.
According to Steiner and Einstein (1980), Cecil’s cases were known to the creator of
the RMR system when its first version was published. The RMR method’s
conservatism with respect to the Cecil’s cases is therefore astonishing.
5.2.5 South African Tunnelling Experience
Cameron-Clarke and Budavari (1981) used both bore core data and in situ
observations to evaluate the reliability of RMR76 and Q74. The reliability of the use
of bore core data alone for classifying rock masses was also assessed by comparing
the ratings obtained for the classification parameters from the same locations by both
bore core and in situ observations. The in situ rock mass data were accepted as the
basis of comparison. Data were obtained from three tunnels (Bushkoppies, Delvers
and Du Toitskloof) in South Africa, excavated in widely differing geological
environments. All three tunnels have an inverted U shape with equal horizontal and
vertical dimensions of about 3 m. Bushkoppies is a sewer tunnel with a total length
of 6.5 km and an overburden thickness of 5 to 65 m, Delvers is an electric cable
tunnel of 1.2 km with an overburden of between 2.5 and 11 m, and Du Toitskloof is a
pilot tunnel of 4 km long with an overburden range of 10 to 20 m for investigating
the route of a major highway tunnel.
The Bushkoppies tunnel was driven through volcanic lava which varies from soft,
completely weathered and closely jointed material at the eastern portal, to very hard
almost massive rock in other sections. Most of it was excavated in hard, widely to
closely jointed rock with three or more joint sets and occasional clay filled faults and
fault zones. The Delvers tunnel passes through an alternating sequence of
arenaceous and argillaceous strata, with its northern end passing through a sheared
fault zone. The Du Toitskloof tunnel passes through granites and sandstone which
are separated by the Du Toitskloof Fault. The study covered virtually the full lengths
of the first two tunnels and approximately 60% of the third.
122
The results derived from the bore core and in situ observations in the three tunnels
were compared and correlated. The support measures installed in the Bushkoppies
and Du Toitskloof tunnels were also compared with those recommended by the two
methods when bore core data and in situ observations were used separately as the
basis of classifying the rock masses. The main conclusions drawn from the study
were:
o For both classification systems, bore core can be used to classify rock masses
for engineering purposes. Bore core measurements, however, tend to indicate
poorer rock mass conditions than in situ measurements.
o With regard to site investigation for underground excavation in rock, both
systems can be useful. Their values must be seen in perspective and their
limitations always recognised. Their best applications would seem to be
towards providing a general picture of the anticipated rock conditions and an
initial assessment of the likely support requirements in a planned
underground excavation. However, the data should never be regarded as the
final results in this respect.
o Since bore core results are generally expected to be directly applicable to the
rock mass in the immediate vicinity of the borehole only, great care is
necessary when attempting to extrapolate between boreholes.
o At the Bushkoppies tunnel, the support predictions of the Q system using in
situ observations compared favourably with the support actually installed.
The agreement was not good for the prediction by Q using bore core
observations. The RMR predicted support using both bore core and in situ
observations did not compare well with the installed support.
o At the Du Toitskloof tunnel, the support correlations were again better for Q
than for RMR. For the latter the predicted support measures were generally
more conservative than those installed.
123
o With a few exceptions, the correlation between the bore core and in situ
stand-up times and unsupported spans for both classification systems is very
poor. The differences are so marked in some cases that although RMR
stand-up time is less than Q stand-up time, the unsupported span predicted by
the former is greater than the limiting span predicted by the latter.
o The support predictions from each system appear to correlate slightly better,
although when examined in detail they are very often quite different.
Cameron-Clarke and Budavari also noted that the tendency for bore core data to
produce lower classification values than those of in situ data is opposite to that
indicated by the results presented by Barton (1976) from a similar type of
investigation. Barton’s bore core Q values were about twice his in situ values. This
discrepancy appears to be related to the different rock conditions examined in each
case. The study by Cameron-Clarke and Budavari was based on measurements taken
from a variety of geological environments which included predominantly jointed
rocks, although massive rocks were also examined. Barton’s data were obtained
from “quite massive biotite gneiss” only. This suggests that the relationship between
the bore core and in situ classification values may be linked to the rock mass
conditions with lower bore core data based classification values than in situ
observations based values being associated with jointed rocks, and the opposite being
the case in massive varieties.
They also obtained linear correlations for RMR and Q values determined by bore
core observations (Equation 5.3) and in situ observations (Equation 5.4) in the three
tunnels.
RMR = 4.6 ln Q + 55.5 (from bore core data) (5.3)
RMR = 5.0 ln Q + 60.8 (from in situ data) (5.4)
The relationships obtained for bore core and in situ observations were similar,
however, the scattering of data points about the regression line is greater for the in
situ values than for the bore core values. In general, for both cases the scatter around
124
the regression lines is too great to suggest that a good correlation exists between the
two systems. Further, the two relationships are different to Equation 5.1 obtained by
Bieniawski (1976). Although the two correlations are based on a small data set
compared to that used for Equation 5.1, Cameron-Clarke and Budavari considered
that the two correlations are representative of the types of rock mass conditions
investigated.
5.2.6 Spanish Tunnelling Experience
Moreno Tallon (1982) applied RMR, RSR and Q indices to three road tunnels in the
northern part of Spain and the results compared. In this study the RMR73 and Q74
versions were used. (Note that RMR73 used eight parameters.) The three tunnels are
Pando, Negron and Barrios with lengths of 1227 m, 4106 m and 1576 m,
respectively. Rock mass data were collected from Pando North, Negron North and
South, and Barrios South headings. The tunnels were driven through sedimentary
rocks consisting of shale, limestone, sandstone and quartzite, and are circular with a
diameter of 11.6 m. The shale is sometimes in isolated layers and sometimes
interstratified within other rocks. The whole area was subjected to severe tectonic
disturbances which resulted in a high degree of fracturing with faults and folds. The
direction of discontinuities varies, as do their characteristics. They vary from closed
and non-filled joints to shear zones more than 1 m wide. The data were obtained by
applying the three methods directly to 150 advancing tunnel faces. The ratings are
therefore representative of the state of the rock mass at the excavation face. The
number of data sets obtained from Pando, Negron North, Negron South and Barrios
were 37, 31, 65 and 17, respectively.
In addition to the comparison of the rock mass quality ratings obtained directly from
the advancing tunnel faces, Moreno Tallon analysed the behaviour of rock bolts in
relation to the RMR value by pull testing a proportion of the bolts installed in the
tunnels. For this purpose each tunnel was divided into 25 m lengths and percentages
of satisfactory bolts were determined for each length. Of the eight parameters used
in RMR73 those which might directly affect the performance of the rock bolt
anchorage (resin type) were selected as IRS, JS, joint separation and weathering.
The sum of the ratings assigned to these four parameters was referred to as “A”.
125
Then a new parameter X, defined as X = (A/RMR)100% was considered to reflect
the behaviour of rock bolt anchorage. In theory, the higher the X value, the better
should be the anchorage. As for the RMR, this value was assigned to each of the
25 m lengths in the tunnels, and to simplify the analysis, a comparison between the
average values for different lengths was carried out.
Moreno Tallon observed that the rock masses intersected in the case tunnels behaved
differently depending on whether the RMR value was higher or lower than 60, hence
the rock masses were divided into two classes based on whether the RMR value was
greater or smaller than 60. The main conclusions drawn from the study were:
o Obtaining the quality index is made more difficult by increased heterogeneity
of the rock mass exposed in the excavation face from which the data were
obtained.
o Suitable criteria must be established among the members of the working
group to reduce judgemental errors in deciding the most unfavourable
combination of rock mass parameters.
o It is necessary to check the results obtained for the classification when rating
the rock mass and adjust them for the working areas, based on experience.
o RMR usually makes a better distinction between average and good rock, but
not as good a distinction for rocks of lower quality.
o The Q index establishes the best definition for average, good and bad quality
rocks mass conditions.
o There is no clear correlation between bolt behaviour and RMR or X when the
RMR value is greater than 60. It was inferred that the behaviour of installed
rock bolts does not depend on the rock mass quality when RMR > 60.
126
o When the RMR value < 60, there is a logarithmic type correlation between X
and the behaviour of rock bolts. It was inferred that bolt failures in this type
of rock are related to the X value rather than to the RMR value itself.
Moreno Tallon correlated rock mass rating values obtained by the RMR, Q and RSR
classification methods. By linear regression analysis of the data obtained from the
four tunnel headings as well as the combined set of data from all headings, he
obtained semi logarithmic type correlations between the three classification methods.
The correlations between RMR and Q for the four tunnel headings and for the
combined data are similar, but not identical, to those obtained by Bieniawski (1976)
and Rutledge and Preston (1978). The RMR and Q correlation obtained for the
combined data from the four headings is given as Equation 5.5.
RMR = 5.4 ln Q + 55.2 = 12.5 log Q + 55.2 (5.5)
Equations 5.5a, 5.5b, 5.5c and 5.5d are the RMR and Q correlations for Pando North,
Negron North, Negron South and Barrios South, respectively.
RMR = 5.9 ln Q + 58.5 = 13.5 log Q + 58.5 (5.5a)
RMR = 7 ln Q + 47.96 = 16 log Q + 47.96 (5.5b)
RMR = 5.3 ln Q + 54.6 = 12.3 log Q + 54.6 (5.5c)
RMR = 6.5 ln Q + 54 = 14.97 log Q + 54 (5.5d)
Moreno Tallon emphasised that the correlation derived from all the data from four
tunnel headings is similar to those derived separately for each heading, although the
data for the correlations were obtained at different places, from rocks of little
similarity in many cases and between indices obtained by different people. Since the
data used in deriving the correlations have not been provided, it is uncertain to what
extent the data points scattered about the regressions lines of the above relationships.
However, it can be shown that despite the apparent similarity of the five equations,
127
they return different RMR values for a given Q value. While in most cases these
differences may be insignificant, in some instances the difference could be high
enough to cause erroneous results if these correlations were used for estimating the
ratings of one system from the ratings of another. For instance, for a given Q value
of 2, the relationship for Pando North (Equation 5.5a) returns a RMR value of 63,
whereas that for Negro North (Equation 5.5b) returns a RMR value of 53. As
mentioned previously, Moreno Tallon observed differing rock mass behaviour
depending on whether the RMR value is greater or less than 60 and proposed a
method for rock bolting design based on whether the RMR value was greater or
smaller than 60. As can be seen from the foregoing, Equation 5.5a would transform
a rock mass with a Q value of 2 to a good rock with a RMR value > 60 whereas,
Equation 5.5b would transform the same rock mass into the poor quality in the RMR
scale, with a RMR value < 60.
5.2.7 Application to Japanese Ground Conditions
Nakao and co-workers (1982, 1983, 1984) undertook a brief review of the databases
used in developing the RMR, RSR and Q systems and examined whether the three
systems are applicable to the soft and crushed rock conditions with complicated
geological structures encountered in the tunnels constructed in Japan. They
compiled a tunnelling conditions database comprising data concerning geology,
excavation techniques and tunnel deformation. By statistical processing of the data
from 152 case tunnels, they attempted to prepare a rock classification system suitable
for the geological conditions in Japan. They examined the relative importance of the
various parameters i.e. rock type, intact rock strength, joint orientation, joint spacing,
joint alteration (opening), water inflow, overburden thickness and tunnel section and
the degree of interdependence between different parameters. They then established
the relevance and influence of the parameters used in the RMR, RSR and Q systems
to the tunnel deformation under the Japanese tunnelling conditions. With respect to
the RMR and Q indices, the study found that when they are to be applied to the
Japanese conditions:
o Various parameters used in the RMR and Q systems seem to be effectively
applicable to the geological classification of Japanese tunnelling conditions.
128
o The only difference lies in the great weight placed on RQD and joint
condition in the two classifications whereas in the Japanese classification, the
tunnel overburden thickness constitutes the greatest factor.
o Most of the geology of Japan belongs to the so called “fault zone”, that is, the
rock body has turned into debris with many joints, thereby making the rock
mass classification by joint spacing difficult.
o It is, therefore, necessary to consider the strength ratio which is determined
by the strength of rock specimen and the overburden thickness. This ratio
was found to be the factor governing the stability of tunnels.
o The size of the tunnel section to be excavated should also be given full
consideration in evaluating the geology.
In summary, Nakao et al. found that while input parameters of the RMR and Q
indices may be applicable to the geological conditions of Japanese tunnels, it may be
necessary to correct the weighting given to the parameters to better reflect the true
nature of soft and crushed rock with complicated geological structures.
5.2.8 Application at the Mt Isa Mine, Queensland
Baczynski (1983) applied five rock mass classification methods including RMR,
MRMR and Q to unsupported mine openings (open stopes) at the Mount Isa Mine in
Queensland, Australia. The aim of his study was to assess the usefulness and
limitations of the classification methods for unsupported open stope design in tabular
lead-zinc ore bodies trending parallel to the bedding planes that dip 65o to the
horizontal. The hanging wall and foot wall of the stopes were defined by moderately
to highly jointed and bedded dolomitic shales. He investigated three ore bodies
within dolomitic shales and apparently used the RMR76 and Q74 versions.
Baczynski used the “Monte Carlo” simulation method (Hamersley and Handscomb,
1964) for statistical analysis of the RMR, MRMR and Q index parameters within the
129
hanging wall shales of the three orebodies. The aim was to evaluate the local
variability in ground conditions within single stopes as well as the overall variability
in mean ground conditions between stopes within particular orebodies. The main
conclusions drawn from the study were:
o There are certain difficulties associated with the application of the three
systems, and none of the systems appeared to be completely satisfactory.
However, they are considered to be potentially useful subject to modifications
to suit local mining requirements.
o For the determination of stable unsupported stope spans the Q index appeared
to be the most promising classification. However, the system needs
modifications to suit the structural environment at the mine.
o The RMR system yields conservative estimates for unsupported stope spans.
This appeared to be due to three factors: (a) the system does not provide for
the incorporation of stress effects on stability; (b) although the system
attempts to determine stand-up time which could then be indirectly related to
stability in mining situations, the proposed times appear to be conservative
with respect to past experience at the mine; (c) there is an upper limit of 20 m
for the maximum permissible span dimension. This value is extremely
conservative, especially since stopes with hanging wall spans in excess of
30 m have been mined.
Baczynski found a linear correlation between RMR and Q, based on the analysis of
2000 statistically generated rock mass blocks for two dolomitic shale ore bodies at
the Mt Isa mine. With the Q system he used a SRF value of 2 in determining Q
values. The correlation obtained by Baczynski (Equation 5.6) is in close agreement
with Equation 5.1 proposed by Bieniawski (1976).
RMR = 7.5 ln Q + 42 (5.6)
130
Despite the apparent similarity of the two equations, Baczynski observed that the
correlation would have been different if the Q system recommended SRF values
were used in deriving the Q values, and stated that, “However, it must be strongly
emphasised that the correlations are stress dependent. The relationship will be
significantly altered, if, for example, different SRF values are assumed in the
determination of the Barton’s Q rating. It is therefore important that any
relationship for the transformation from one classification rating to another is not
assumed to have universal application”.
5.2.9 Experience from the Porter Square Station Cavern, Massachusetts
As part of a study on empirical methods of underground excavation support design,
Einstein et al. (1983) applied RMR and Q with three other methods, to a 21 m span,
14 m high and 150 m long subway station cavern and a 3.6 m x 3.6 m pilot tunnel
driven along the crown of the cavern, and compared them with regard to the
subjectivity and the influence of available information through four phases of the
project (i.e. three phases of exploration and during excavation). Specifically the four
phases were: Phase I (data from 19 borehole logs), Phase II (data from an exploration
shaft and Phase I), Phase III (data from the pilot tunnel, the rock mass was classified
every 3 m along the tunnel axis), and Phase IV (data from the station cavern, the rock
mass was classified every 3 m along the cavern concentrating on the vertical face of
a permanent bench, and supplementary mapping of the cavern face after each round
of excavation).
The cavern located in Cambridge, Massachusetts, USA, was excavated in a
sedimentary rock (argillite). The study conducted using several investigators also
included a comparison of empirically derived support measures with those installed
(derived by analytical and numerical methods). It was based on the assessment of
three possible rock mass scenarios: best, worst and most probable. The main
conclusions drawn from the study were:
o The boring detected only two joint sets. It did not reveal the presence of a
third joint set, while the exploration shaft and the pilot tunnel did. This
unfavourably oriented third joint set did not affect the predictions because
131
other conditions had already led to classify the rock mass into lower classes.
This may be different in other applications and the three dimensional
exposure will have a greater effect.
o The additional data obtained from the exploration shaft and pilot tunnel did
not change the most probable and extreme support requirements predicted
from the (extensive) boring program.
o Increased support requirements that resulted from the cavern survey were not
predicted in any of the exploration phases.
o The two methods are not affected by subjectivity of the user. This is mostly
due to the dampening of parameter differences when relating rock classes to
support. However, the effect of subjectivity did not disappear in the spatial
fluctuation of rock class predictions by different investigators. These
fluctuations, which indicate the length over which a construction procedure
and a support system would be used, are important in longer tunnels.
o The support predicted for most probable ground conditions falls into a narrow
range below the actually placed support. Two methods are thus roughly
equivalent for this purpose.
o The predictions for the worst conditions in the cavern seem to be possible
only with Q which covers the particular combination of large span and low
quality rock mass conditions.
o The encountered conditions in the cavern deviated from those predicted in an
extensive exploration program. In such situations a conservative design or an
adaptable design and construction approach is required. For an adaptable
approach the empirical methods can be used only if the methods cover the
entire range of conditions.
132
5.2.10 Canadian Mining Experience
Two separate studies were conducted in Canadian hard rock mines: the first by Udd
and Wang (1985) and the second by Choquet and Charette (1988).
Udd and Wang (1985) assessed the advantages and disadvantages of four
classification systems by applying them to the rock masses in an underground mine
in Canada. The four systems were RMR, Q, RQD and Rock Consolidation
Coefficient (RCC). The RCC method, which is now obsolete, is defined as the ratio
IRS/100. The main rock types in the mine are meta-anorthosite and its various stages
of alterations consisting sericite, chlorite, chloritoid and talcose minerals. The rock
masses in the mine are extensively fractured. Udd and Wang applied the RMR and
Q systems to ten rock types and obtained 153 RMR and Q data pairs and then
compared the results of the application of the two methods. The main conclusions
drawn from the study were:
o Both RMR and Q methods were found to be easy to use in the field, with
RMR being the easiest.
o There was not always good agreement between the RMR and Q methods.
The rocks which were described as being good or better quality by RMR
were described as of lesser quality on the Q scale. Rock masses rated as good
or better by the Q system would sometimes be less than good on the RMR
scale.
o The Q system was the most appropriate for the site conditions.
By linear regression analysis of the 153 data pairs Udd and Wang obtained a
correlation between the RMR and Q values as give in Equation 5.7.
RMR = 5.3 ln Q + 50.81 = 12.11 log Q + 50.81 (5.7)
The range of Q values used in the study was 0.01 to 1000 and that of RMR was 20 to
100. These ranges do not include the lowest quality rock mass classes in the RMR
133
and Q rating scales, i.e. exceptionally poor class in the Q system and very poor class
in the RMR system. The RMR-Q data plot provided by Udd and Wang shows wide
scattering about the regression line given by Equation 5.7 which confirms the
commentary by the two authors: “There is not always good agreement between the
two methods”.
Choquet and Charette (1988), conducted their study in ten underground mines in
Quebec, Canada, and assessed the applicability of six rock mass classification
systems to mine drifts. The six methods were RMR, MRMR, Q, SRMR and one
modified version each of RMR and MRMR. These were applied to 57 drifts in the
ten underground mines representing different rock mass conditions. The drift spans
varied between 2.8 and 7.5 m with the majority between 3.5 and 5.5 m. Their depths
ranged from 50 to 1000 m with the majority between 100 and 500 m. All of them
were stable.
The two authors have correlated the RMR and Q ratings assigned to the 57 drifts and
obtained the relationship given by Equation 5.29 with a correlation coefficient of
0.86.
RMR = 10 ln Q +39 (5.8)
Their RMR-Q data plot shows data scattering. Comparing the above equation with
that of Bieniawski (1976), Equation 5.1, the authors commented that the main
differences were observed for the low values of the Q ratings.
Choquet and Charette also compared the predicted rock bolt densities with the actual
bolt densities in the 57 drifts. They found that, in general, the installed support
density is inversely proportional to the rock mass quality but the scatter of actual
support densities about the predicted bolt density line is very large. They observed
that seven drifts were unsupported and such a situation should correspond to better
rock mass conditions with higher ratings compared to supported drifts. However,
four of the classification systems assigned equal or higher ratings for some of the
supported drifts. The four systems are RMR, MRMR, SRMR and RMRmod. They
concluded that these four methods cannot be used on their own to determine if a drift
134
needs support. Preferably MRMRmod and Q should be used for this purpose. They
found that the installed support measures in the drifts are significantly higher than
those predicted by the classification systems.
5.2.11 Application to Civil and Mining Tunnels in Sri Lanka
Brook and Dharmaratne (1985) critically reviewed three rock mass classification
systems: RMR, Q and the modified or adjusted RMR system proposed by Laubscher
(1975). They applied these three systems to mine and hydroelectric tunnels in Sri
Lanka and compared the support requirements predicted by them with the actual
support installed. Three projects were considered: the Bogala graphite mine (BGM),
the Kahatagaha-Kolonggaha graphite mine (KKGM) and the Victoria hydropower
project (VHP) headrace tunnel.
At KKGM the rock types are garnet biotite gneiss and amphibolite biotite gneiss,
inter-banded with quartzite. The tunnels are about 2.8 m in width and height, and the
rock mass has only two joint sets. The mine is almost dry and no rock instability
problems were present. The 700 m deep mine has been in operation for more than
100 years without any form of significant support apart from occasional spot bolting
where joint intersections create potentially dangerous rock blocks.
At BGM the main rock types are gneisses, charnockite and quartzite. Tunnels are
smaller in cross section to those of KKGM but the number of joint sets varies from
one to three in different parts of the mine. The rock mass is weathered in many
places. The tunnels and stopes encounter large water inflows in some areas giving
rise to instability problems. The main support type is timber sets but rock bolting
and concreting are also used occasionally. The mine is operated at a depth of 400 m.
The VHP headrace tunnel was excavated by full face drill and blast methods to a
horseshoe shape with a 7.2 m span. The main rock types intersected along the tunnel
were garnetiferrous quartz gneiss, granulite, quartz granulite and crystalline
limestone (marble). The rock mass is fresh to highly weathered (HW) and the tunnel
was dry to very wet during construction. Faults and foliation planes give rise to
over-breaks and uneven tunnel periphery. Rock bolts, shotcrete and concrete were
135
adopted as temporary support. The tunnel was fully concrete lined to give a 6.2 m
internal diameter circular shape for hydraulic considerations.
Brook and Dharmaratne assessed eleven sites from the three projects: one, four and
six sites from KKGM, BGM and VHP, respectively. They provided a representative
sample of rock mass characteristics from each of the eleven sites with the final RMR
and Q ratings assigned, support predicted by the two methods and the actual support
installed at each site. A summary of the support predicted using the RMR and Q
methods and the actual support installed is given in Table 5.2.
It should be emphasised that the RMR support recommendations are for 10 m span
horseshoe shape permanent tunnels and are not necessarily applicable to 2.8 m wide
mine tunnels at KKGM and BGM, A particular problem arises in the application of
RMR deduced support because the recommended bolt lengths and spacing are too
great for small span tunnels such as those of KKGM and BGM. For the VHP
headrace tunnel with an as-excavated span of 7.2 m, the RMR recommended support
may be considered applicable providing that bolts lengths are adjusted to suit the size
of the excavation. Nonetheless, in Table 5.2 Brook and Dharmaratne listed the RMR
recommended support for all three projects. It should also be noted that the VHP
tunnel was fully concrete lined mainly for hydraulic reasons and partly for stability.
Therefore the actual support installed, and listed in Table 5.2, was mainly for short
term safety and can be considered the absolute minimum required to stabilise the
potentially unstable rock masses observed during construction.
In their study, Brook and Dharmaratne (1985) used RMR76 and Q74. A check against
RMR89 showed no difference in the support recommendations from those presented
by them except for what might be considered as minor typographical errors which
were corrected in Table 5.2. A check against Q94 showed a reduction in support
quantities compared to those recommended by the earlier version. This means Q94
support recommendations would be much less than the actual support installed.
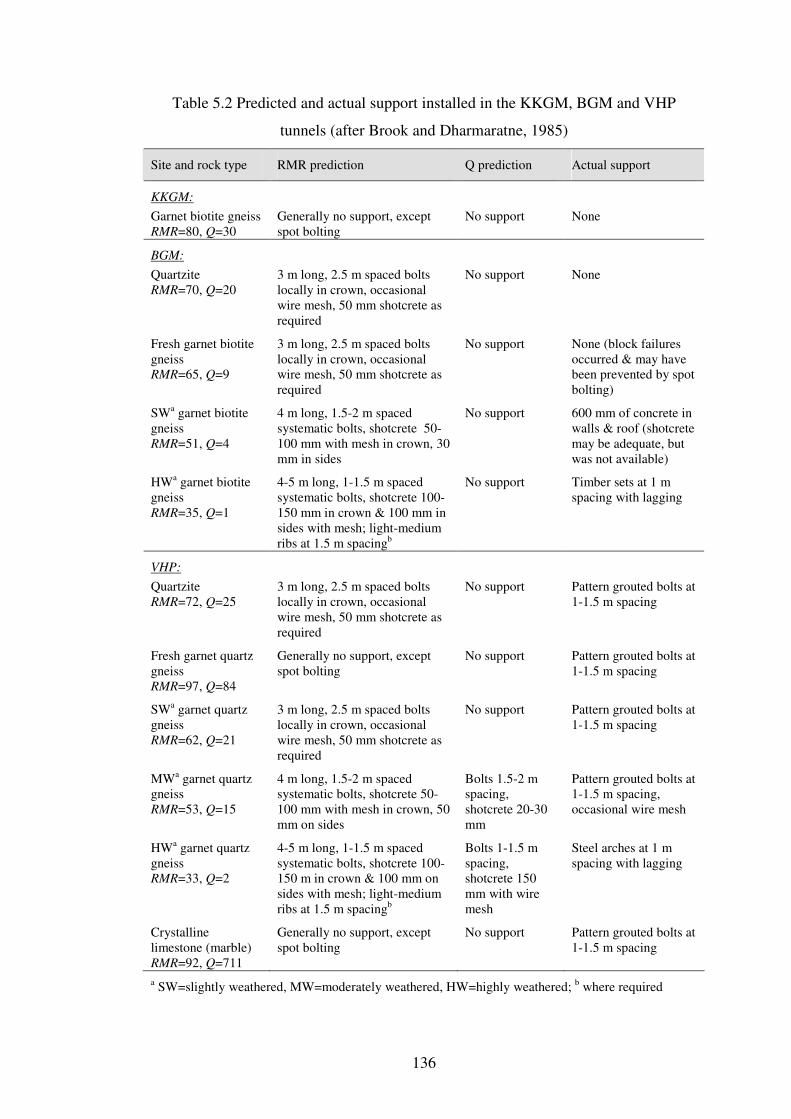
136
Table 5.2 Predicted and actual support installed in the KKGM, BGM and VHP
tunnels (after Brook and Dharmaratne, 1985)
Site and rock type RMR prediction Q prediction Actual support
KKGM:
Garnet biotite gneiss
RMR=80, Q=30
Generally no support, except
spot bolting
No support None
BGM:
Quartzite
RMR=70, Q=20
3 m long, 2.5 m spaced bolts
locally in crown, occasional
wire mesh, 50 mm shotcrete as
required
No support None
Fresh garnet biotite
gneiss
RMR=65, Q=9
3 m long, 2.5 m spaced bolts
locally in crown, occasional
wire mesh, 50 mm shotcrete as
required
No support None (block failures
occurred & may have
been prevented by spot
bolting)
SWa garnet biotite
gneiss
RMR=51, Q=4
4 m long, 1.5-2 m spaced
systematic bolts, shotcrete 50-
100 mm with mesh in crown, 30
mm in sides
No support 600 mm of concrete in
walls & roof (shotcrete
may be adequate, but
was not available)
HWa garnet biotite
gneiss
RMR=35, Q=1
4-5 m long, 1-1.5 m spaced
systematic bolts, shotcrete 100-
150 mm in crown & 100 mm in
sides with mesh; light-medium
ribs at 1.5 m spacingb
No support Timber sets at 1 m
spacing with lagging
VHP:
Quartzite
RMR=72, Q=25
3 m long, 2.5 m spaced bolts
locally in crown, occasional
wire mesh, 50 mm shotcrete as
required
No support Pattern grouted bolts at
1-1.5 m spacing
Fresh garnet quartz
gneiss
RMR=97, Q=84
Generally no support, except
spot bolting
No support Pattern grouted bolts at
1-1.5 m spacing
SWa garnet quartz
gneiss
RMR=62, Q=21
3 m long, 2.5 m spaced bolts
locally in crown, occasional
wire mesh, 50 mm shotcrete as
required
No support Pattern grouted bolts at
1-1.5 m spacing
MWa garnet quartz
gneiss
RMR=53, Q=15
4 m long, 1.5-2 m spaced
systematic bolts, shotcrete 50-
100 mm with mesh in crown, 50
mm on sides
Bolts 1.5-2 m
spacing,
shotcrete 20-30
mm
Pattern grouted bolts at
1-1.5 m spacing,
occasional wire mesh
HWa garnet quartz
gneiss
RMR=33, Q=2
4-5 m long, 1-1.5 m spaced
systematic bolts, shotcrete 100-
150 m in crown & 100 mm on
sides with mesh; light-medium
ribs at 1.5 m spacingb
Bolts 1-1.5 m
spacing,
shotcrete 150
mm with wire
mesh
Steel arches at 1 m
spacing with lagging
Crystalline
limestone (marble)
RMR=92, Q=711
Generally no support, except
spot bolting
No support Pattern grouted bolts at
1-1.5 m spacing
a SW=slightly weathered, MW=moderately weathered, HW=highly weathered;
b where required
137
From the study carried out by Brook and Dharmaratne the following conclusions can
be drawn regarding the RMR and Q classification systems.
o There is not always good agreement between RMR and Q predicted support
measures. The two systems predicted comparable support for only four out
of the eleven sites studied, three of these sites are in the VHP tunnel and the
other is the KKGM tunnel.
o The RMR support predictions were generally conservative for the five mine
tunnels. This is primarily due to the small span of the mine excavations.
o The RMR recommended bolt spacing was often greater than those used in
the VHP tunnel.
o For HW garnet biotite gneiss in the VHP tunnel, the RMR recommended
steel sets were generally comparable to those installed, yet the predicted
rock bolts and shotcrete exceeded the actual support.
o The Q predicted support requirements matched only for two of the eleven
sites considered, both being small span mine tunnels that required no
support.
o For MW garnet quartz gneiss in the VHP tunnel, Q recommended support
agreed with the installed support.
o For nine out of the eleven sites studied the Q system underestimated the
support requirements.
Since the RMR recommendations are for permanent support, the comparison of the
RMR predicted support with the temporary support installed in the VHP tunnel may
seem an unfair test for this particular classification system. Yet, as can be seen from
Table 5.1, smaller rock bolt spacing (higher bolt densities) was adopted for
construction safety than those deduced using the RMR system. The Q system
recommendations given in Table 5.1 are also for permanent support. Q predicted no
138
support requirements for four out of the six sites in the VHP tunnel, yet all four sites
were temporarily supported with rock bolts for construction safety. From the
foregoing, it can be concluded that both RMR and Q systems underestimated support
requirements for the VHP headrace tunnel.
5.2.12 Application to BC Rail Tunnels, Canada
In a detailed study to evaluate the reliability of the empirical classification approach
to tunnel support design, Kaiser et al. (1986) applied RMR and Q along with RSR
and RQD methods to four single track rail tunnels driven through sedimentary rocks
in central British Columbia, Canada. The four tunnels were 271, 367, 9050 and
5936 m long with excavated widths 5 to 5.5 m and heights 8 to 8.5 m. All four are
horseshoe shaped and were excavated by conventional drill and blast techniques.
The study was based on detailed mapping of 85 sectors representing the seven
different rock formations and the full spectrum of conditions encountered in the four
tunnels. The study included comparisons of support predicted by different methods
with each other and with the support installed, a correlation of final RMR and Q
values, and an assessment of no-support limit and opening size effects. Some of the
key conclusions drawn from the study were:
o Verbal descriptions given by RMR and Q systems do not correspond well.
Too many ground class boundaries are specified by the Q system.
o The no support limit given in RMR was found to be too conservative. Based
on RMR, stand-up times of as little as one day to several months were
predicted for sections that were permanently unsupported.
o Poor agreement between RMR predicted and actually installed support was
observed even if it is considered RMR charts were developed for permanent
support. While no support (except for occasional bolting) was recommended
only for RMR>80, unsupported sections were found at RMR=30 to 100.
Heavy support with bolts at less than 1.5 m spacing and more than 100 mm of
shotcrete at the crown and tunnel walls was recommended for RMR<60. In
reality, pattern bolting was applied for a RMR value range of 20 to 80 and
139
shotcrete was used when RMR=30 to 80. This clearly indicated that the RMR
system is far too conservative for the rock types encountered and the size of
openings.
o The significant overlap of support types for very similar ranges of RMR also
suggests that the RMR method is not sensitive enough for the grouping of
rock conditions to select tunnel support types.
o Despite established correlations, these two classification systems do not lead
to similar conclusions concerning tunnel support requirements. Both are
conservative but RMR is more so. This discrepancy must be attributed to the
influence of opening size on tunnel performance and cannot be eliminated by
simultaneous application of both classification systems to assess the factors
that have been neglected.
o Bolts were consistently spaced at 2 m in areas where 1.0 to 1.5 m spacing was
recommended by Q.
o In areas prone to rock popping and bursting, it may be more appropriate to
neglect the SRF factor of Q during rock mass classification and assess the
detrimental effects of high stresses separately.
o Overall, the recommendations for tunnel support based on Q were found to
correspond better with the conditions encountered at the BC-Rail tunnels.
The study by Kaiser et al. (1986) also included a detailed analysis of RMR and Q
values to obtain reliable correlations between the two ratings. They pointed out that
the correlations developed using least square linear regression analysis should be
viewed with caution because the results depend on the choice of the dependent
variable. To overcome this weakness, they used a probabilistic approach to
determine a unique relationship between RMR and Q assuming that RMR and ln Q
are normal variates and satisfy the central limit theorem of probability theory. The
correlations obtained by the least square linear regression analysis and the
probabilistic approach are presented as Equations 5.9 and 5.10, respectively.
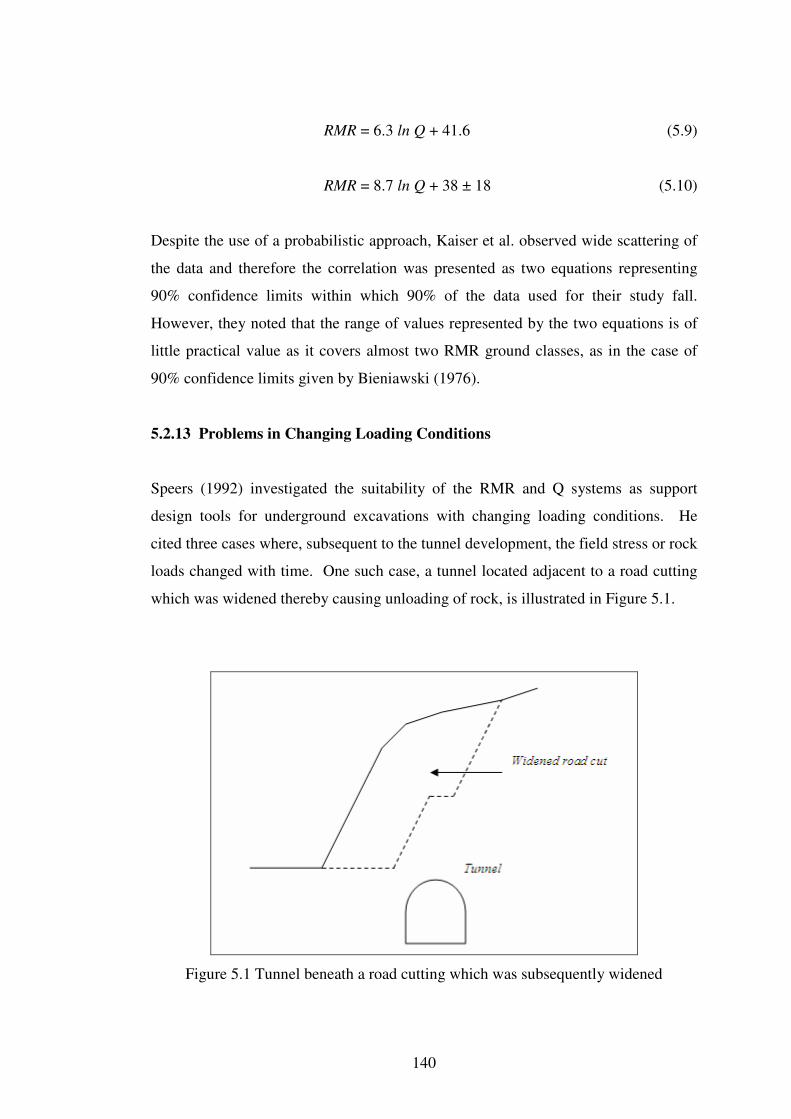
140
RMR = 6.3 ln Q + 41.6 (5.9)
RMR = 8.7 ln Q + 38 ± 18 (5.10)
Despite the use of a probabilistic approach, Kaiser et al. observed wide scattering of
the data and therefore the correlation was presented as two equations representing
90% confidence limits within which 90% of the data used for their study fall.
However, they noted that the range of values represented by the two equations is of
little practical value as it covers almost two RMR ground classes, as in the case of
90% confidence limits given by Bieniawski (1976).
5.2.13 Problems in Changing Loading Conditions
Speers (1992) investigated the suitability of the RMR and Q systems as support
design tools for underground excavations with changing loading conditions. He
cited three cases where, subsequent to the tunnel development, the field stress or rock
loads changed with time. One such case, a tunnel located adjacent to a road cutting
which was widened thereby causing unloading of rock, is illustrated in Figure 5.1.
Figure 5.1 Tunnel beneath a road cutting which was subsequently widened
141
As part of his investigation, using a simplified numerical analysis, Speers illustrated
that the support pressure can be constant for different size tunnels only if the length
of rock bolts is equal to the tunnel radius. If the bolt length is not equal to the tunnel
radius, the support pressure will depend on the tunnel size and the bolt length. This
is important because the empirical formula given in the Q system for support
pressure estimation does not take into account the size of the excavation.
Speers compared the RMR and Q derived support measures with those designed by
numerical stress analysis using FLAC. The support designs were for a tunnel
situated in a block cave mine with a constant horizontal load and three different
vertical loads at various stages of its operation: (a) an initial load of 265 m during
construction, (b) a 1325 m load while drawing caved ore, and (c) a 63 m load after
exhaustion of the caved ore. Two tunnel sizes were examined: the first 3 m high and
3.5 m wide; the second 6 m high and 6.5 m wide. With the Q method, different SRF
values were used as proposed by Kirsten (1988b) to calculate the support pressures.
The main conclusions drawn from the study were:
o RMR does not take into account variable rock loads. Hence the same
support measures are recommended for all stages of loading.
o For the initial stage with intermediate loading, the support pressures are
independent of tunnel size for a given bolt length. If the bolt length is
increased, however, the pressure increases. The pressures are similar in
order of magnitude to those predicted by the Q method.
o For the maximum and minimum vertical loading stages, the pressures
calculated using FLAC are considerably higher than those predicted by Q.
o The support pressures are not independent of tunnel size: the bigger the
tunnel, the greater the pressure. Further, the pressure for a given tunnel size
increases with increasing bolt length because the tunnel deformations are
reduced with an increase in bolt length and, therefore, the equivalent
pressure is higher.
142
o The highest pressures occur at minimum loading stage and not at maximum
loading, as was predicted by the Q method. The result demonstrated the
severity of unloading on an initially developed and supported tunnel.
o The use of empirical approaches such as the RMR and Q methods will lead
to under designs, particularly with regard to the capacity of the bolts.
o RMR provides a reasonable estimate of rock mass strengths, but not the
rock mass modulus.
o Although bolt lengths can be estimated using the Q method, the predicted
bolt lengths will be too short. It appears that this is because the Q method
inherently provides a means of stability control, but not a deformation
means of control. Also, the Q method applies to tunnels that do not
undergo changing rock loads after the initial excavation and support.
5.2.14 Indian Tunnelling Experience
Indian rock engineering researchers attached to the University of Roorkee, the
Nagpur University and the Central Mining Research Station, over several years, have
undertaken a detailed study on support pressures in tunnels excavated in both
squeezing and non-squeezing ground conditions in India. Much of this work was
undertaken in poor quality rocks with difficult tunnelling conditions in the
Himalayas. The vast majority of the tunnels studied were for hydroelectric schemes
and the rest were for roads and railways as well as mining. Squeezing conditions are
usually encountered in the hydroelectric tunnels excavated in the lower Himalayas
where the rocks are weak, highly jointed, faulted, folded and tectonically disturbed,
and the overburden is very high. The combination of weak rock mass and the high in
situ stress causes squeezing. A summary of the Indian research is presented below.
Singh et al. (1992) compared the observed support pressure and rock mass quality
based on systematically collected field data from 24 tunnel sections in India. The
field data collected were tunnel radius and depth, unit weight of overburden material,
Q and RMR values of tunnel sections, hoop loads and radial pressures on steel ribs,
143
tunnel closure and deep-seated radial displacement measurements. The study
focussed on several important aspects including the prediction of squeezing ground
conditions, comparison of predicted and measured support pressures, influence of
overburden (tunnel depth) on support pressure, relationship between support pressure
and tunnel closure in squeezing ground conditions, variation of support pressure with
time, and the effect of excavation size on support pressure. For predicting roof
support pressures, Singh et al. used six classification methods including RMR and Q
and found that the predictions of all the six methods are unreliable except for the Q
predictions for non-squeezing ground conditions. The wall support pressures were
excluded from the comparison because of the insufficient number of measurements.
The main conclusions drawn were:
o Q predicted roof support pressures were reliable for non-squeezing ground
conditions, but the predictions tuned out to be unreliable for squeezing
ground.
o Squeezing is likely to occur in a tunnel section where the height of
overburden in meters exceeds 350Q1/3
.
o The short term roof support pressure, Proof, is given by
'3/1)5(2
ffQJr
Proof
−= (5.11)
in which f is the correction factor for overburden thickness (H) in meters and
f’ is the correction factor for tunnel closure. The correction factor f is defined
as
1800)320(1 ≥−+= Hf
The correction factor f’ for tunnel closure varies from 0.7 to 1.8 in the case of
a single tunnel in squeezing ground conditions in which support pressure is
significantly influenced by tunnel closure. For non-squeezing ground f’=1.
o Minimum support pressure occurs when the tunnel closure is about 5% of the
tunnel diameter and pressure increases rapidly beyond this limiting closure.
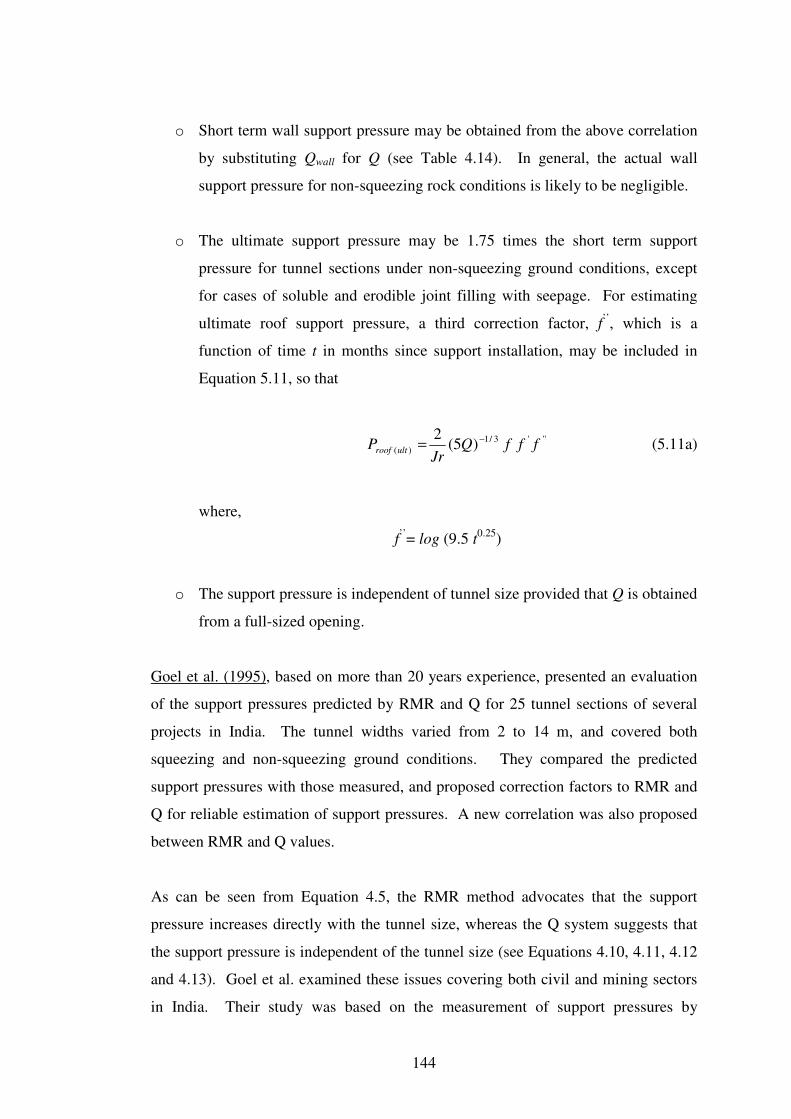
144
o Short term wall support pressure may be obtained from the above correlation
by substituting Qwall for Q (see Table 4.14). In general, the actual wall
support pressure for non-squeezing rock conditions is likely to be negligible.
o The ultimate support pressure may be 1.75 times the short term support
pressure for tunnel sections under non-squeezing ground conditions, except
for cases of soluble and erodible joint filling with seepage. For estimating
ultimate roof support pressure, a third correction factor, f’’, which is a
function of time t in months since support installation, may be included in
Equation 5.11, so that
'''3/1
)( )5(2
fffQJr
P ultroof
−= (5.11a)
where,
f’’= log (9.5 t
0.25)
o The support pressure is independent of tunnel size provided that Q is obtained
from a full-sized opening.
Goel et al. (1995), based on more than 20 years experience, presented an evaluation
of the support pressures predicted by RMR and Q for 25 tunnel sections of several
projects in India. The tunnel widths varied from 2 to 14 m, and covered both
squeezing and non-squeezing ground conditions. They compared the predicted
support pressures with those measured, and proposed correction factors to RMR and
Q for reliable estimation of support pressures. A new correlation was also proposed
between RMR and Q values.
As can be seen from Equation 4.5, the RMR method advocates that the support
pressure increases directly with the tunnel size, whereas the Q system suggests that
the support pressure is independent of the tunnel size (see Equations 4.10, 4.11, 4.12
and 4.13). Goel et al. examined these issues covering both civil and mining sectors
in India. Their study was based on the measurement of support pressures by
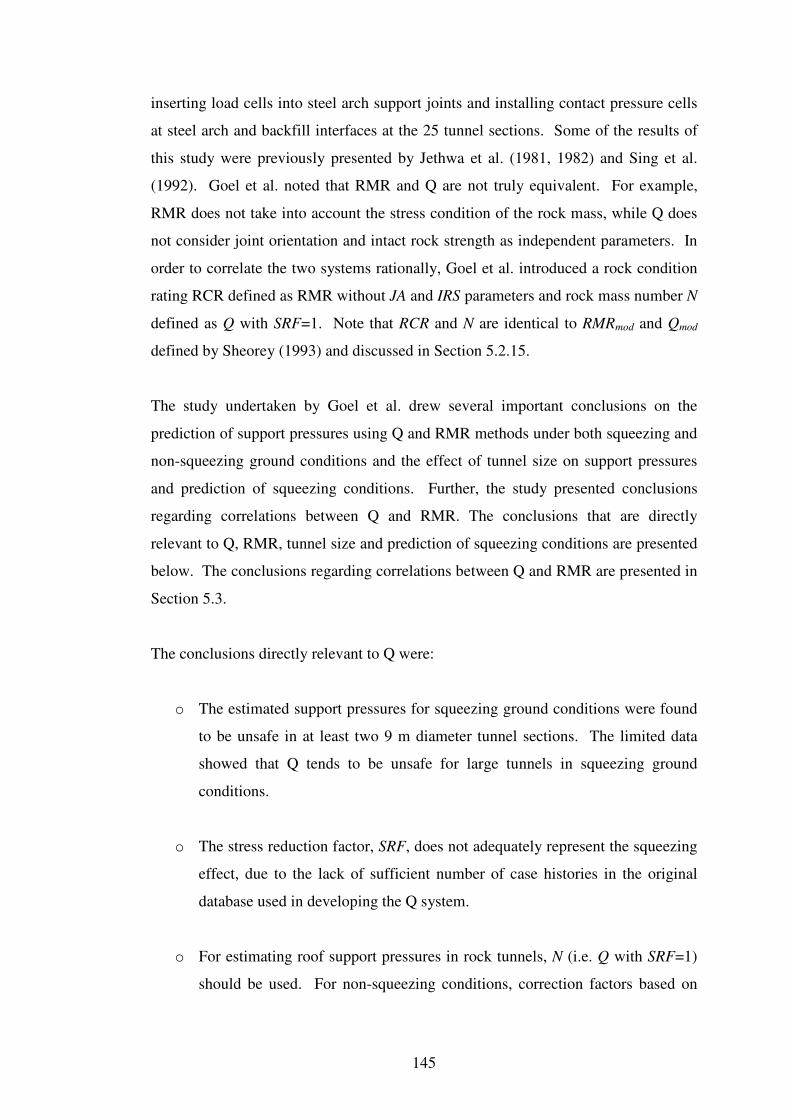
145
inserting load cells into steel arch support joints and installing contact pressure cells
at steel arch and backfill interfaces at the 25 tunnel sections. Some of the results of
this study were previously presented by Jethwa et al. (1981, 1982) and Sing et al.
(1992). Goel et al. noted that RMR and Q are not truly equivalent. For example,
RMR does not take into account the stress condition of the rock mass, while Q does
not consider joint orientation and intact rock strength as independent parameters. In
order to correlate the two systems rationally, Goel et al. introduced a rock condition
rating RCR defined as RMR without JA and IRS parameters and rock mass number N
defined as Q with SRF=1. Note that RCR and N are identical to RMRmod and Qmod
defined by Sheorey (1993) and discussed in Section 5.2.15.
The study undertaken by Goel et al. drew several important conclusions on the
prediction of support pressures using Q and RMR methods under both squeezing and
non-squeezing ground conditions and the effect of tunnel size on support pressures
and prediction of squeezing conditions. Further, the study presented conclusions
regarding correlations between Q and RMR. The conclusions that are directly
relevant to Q, RMR, tunnel size and prediction of squeezing conditions are presented
below. The conclusions regarding correlations between Q and RMR are presented in
Section 5.3.
The conclusions directly relevant to Q were:
o The estimated support pressures for squeezing ground conditions were found
to be unsafe in at least two 9 m diameter tunnel sections. The limited data
showed that Q tends to be unsafe for large tunnels in squeezing ground
conditions.
o The stress reduction factor, SRF, does not adequately represent the squeezing
effect, due to the lack of sufficient number of case histories in the original
database used in developing the Q system.
o For estimating roof support pressures in rock tunnels, N (i.e. Q with SRF=1)
should be used. For non-squeezing conditions, correction factors based on
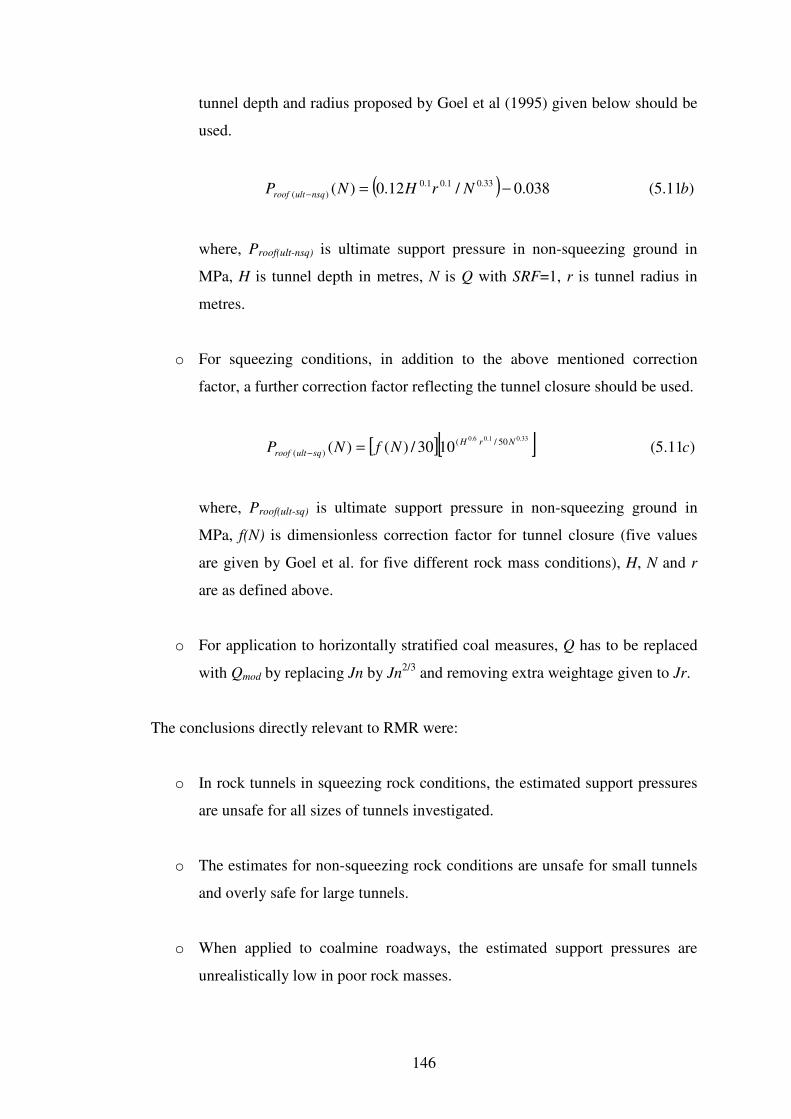
146
tunnel depth and radius proposed by Goel et al (1995) given below should be
used.
( ) )11.5(038.0/12.0)( 33.01.01.0
)( bNrHNP nsqultroof −=−
where, Proof(ult-nsq) is ultimate support pressure in non-squeezing ground in
MPa, H is tunnel depth in metres, N is Q with SRF=1, r is tunnel radius in
metres.
o For squeezing conditions, in addition to the above mentioned correction
factor, a further correction factor reflecting the tunnel closure should be used.
[ ][ ] )11.5(1030/)()(33.01.06.0 50/(
)( cNfNPNrH
squltroof =−
where, Proof(ult-sq) is ultimate support pressure in non-squeezing ground in
MPa, f(N) is dimensionless correction factor for tunnel closure (five values
are given by Goel et al. for five different rock mass conditions), H, N and r
are as defined above.
o For application to horizontally stratified coal measures, Q has to be replaced
with Qmod by replacing Jn by Jn2/3
and removing extra weightage given to Jr.
The conclusions directly relevant to RMR were:
o In rock tunnels in squeezing rock conditions, the estimated support pressures
are unsafe for all sizes of tunnels investigated.
o The estimates for non-squeezing rock conditions are unsafe for small tunnels
and overly safe for large tunnels.
o When applied to coalmine roadways, the estimated support pressures are
unrealistically low in poor rock masses.
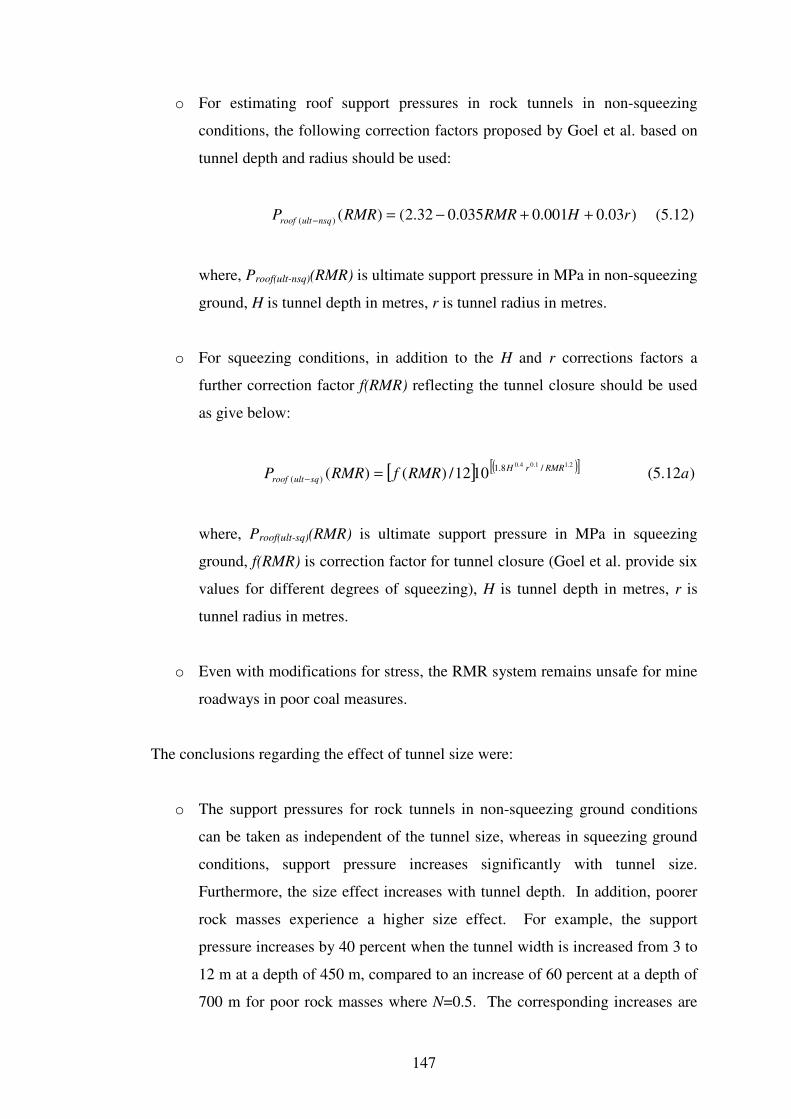
147
o For estimating roof support pressures in rock tunnels in non-squeezing
conditions, the following correction factors proposed by Goel et al. based on
tunnel depth and radius should be used:
)12.5()03.0001.0035.032.2()()( rHRMRRMRP nsqultroof ++−=−
where, Proof(ult-nsq)(RMR) is ultimate support pressure in MPa in non-squeezing
ground, H is tunnel depth in metres, r is tunnel radius in metres.
o For squeezing conditions, in addition to the H and r corrections factors a
further correction factor f(RMR) reflecting the tunnel closure should be used
as give below:
[ ] ( )[ ] )12.5(1012/)()(2.11.04.0 /8.1
)( aRMRfRMRPRMRrH
squltroof =−
where, Proof(ult-sq)(RMR) is ultimate support pressure in MPa in squeezing
ground, f(RMR) is correction factor for tunnel closure (Goel et al. provide six
values for different degrees of squeezing), H is tunnel depth in metres, r is
tunnel radius in metres.
o Even with modifications for stress, the RMR system remains unsafe for mine
roadways in poor coal measures.
The conclusions regarding the effect of tunnel size were:
o The support pressures for rock tunnels in non-squeezing ground conditions
can be taken as independent of the tunnel size, whereas in squeezing ground
conditions, support pressure increases significantly with tunnel size.
Furthermore, the size effect increases with tunnel depth. In addition, poorer
rock masses experience a higher size effect. For example, the support
pressure increases by 40 percent when the tunnel width is increased from 3 to
12 m at a depth of 450 m, compared to an increase of 60 percent at a depth of
700 m for poor rock masses where N=0.5. The corresponding increases are
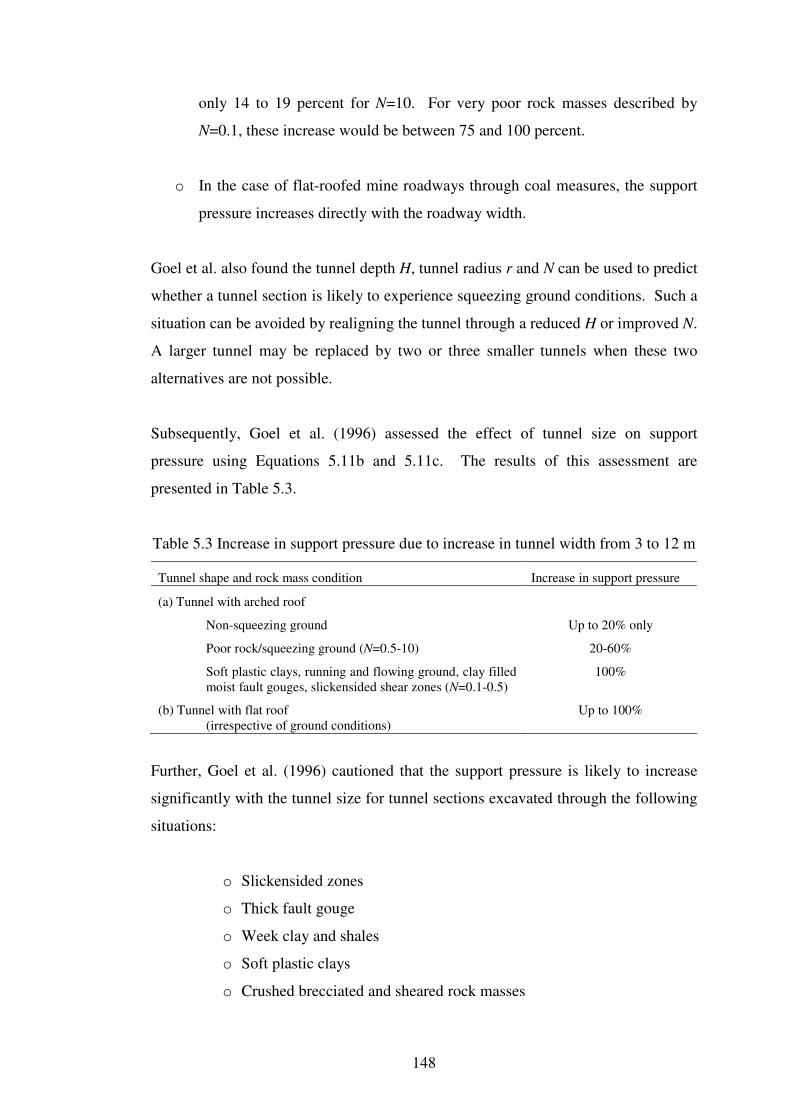
148
only 14 to 19 percent for N=10. For very poor rock masses described by
N=0.1, these increase would be between 75 and 100 percent.
o In the case of flat-roofed mine roadways through coal measures, the support
pressure increases directly with the roadway width.
Goel et al. also found the tunnel depth H, tunnel radius r and N can be used to predict
whether a tunnel section is likely to experience squeezing ground conditions. Such a
situation can be avoided by realigning the tunnel through a reduced H or improved N.
A larger tunnel may be replaced by two or three smaller tunnels when these two
alternatives are not possible.
Subsequently, Goel et al. (1996) assessed the effect of tunnel size on support
pressure using Equations 5.11b and 5.11c. The results of this assessment are
presented in Table 5.3.
Table 5.3 Increase in support pressure due to increase in tunnel width from 3 to 12 m
Tunnel shape and rock mass condition Increase in support pressure
(a) Tunnel with arched roof
Non-squeezing ground Up to 20% only
Poor rock/squeezing ground (N=0.5-10) 20-60%
Soft plastic clays, running and flowing ground, clay filled
moist fault gouges, slickensided shear zones (N=0.1-0.5)
100%
(b) Tunnel with flat roof
(irrespective of ground conditions)
Up to 100%
Further, Goel et al. (1996) cautioned that the support pressure is likely to increase
significantly with the tunnel size for tunnel sections excavated through the following
situations:
o Slickensided zones
o Thick fault gouge
o Week clay and shales
o Soft plastic clays
o Crushed brecciated and sheared rock masses
149
o Clay filled joints, and
o Extremely delayed support in poor rock masses.
Singh et al. (1997) presented the results of a study on the assessment of support
pressure in arched underground openings through poor rock masses. The assessment
was based on Indian tunnelling experience of over 20 years in more than 60
instrumented tunnel sections in the Himalayas and in other parts of the country and
also on the experience of the Norwegian Geotechnical Institute. The study
considered Q, RMR, RSR, RQD and Terzaghi’s rock load concept, and presented an
assessment of predicted and measured support pressures under squeezing ground
conditions in the lower Himalayas in India, where the rock masses are weak, highly
jointed, faulted and the overburden is high. The study highlighted the difficulties in
estimating the SRF parameter of Q and a criterion for predicting the ground
conditions was proposed using the rock mass number N (defined as Q with SRF=1).
Regarding the prediction of support pressures, Singh et al. reiterated the findings of
Goel et al. that, “while none of the approaches are applicable under squeezing
ground conditions, Q provides a reasonable estimate of support pressure in non-
squeezing conditions and for smaller tunnels under squeezing ground conditions”.
The main conclusions drawn from the study were:
o Experience in Himalayan tunnels suggest that the correction factor f for
tunnel depth proposed by Singh et al. (1992) adequately accounts for the
stress conditions for both non-squeezing and squeezing ground conditions.
Therefore, there is no need to use increased SRF values suggested by
Grimstad and Barton (1993).
o The correction factor f’ for tunnel closure proposed by Singh et al. (1992) is
almost equal in magnitude for both roof and walls.
o In non-squeezing ground conditions the support pressure is independent of
tunnel size between 2 and 22 m.
o The Q values estimated from a larger tunnel would be smaller than those
obtained from small drifts in a similar rock mass. This is due to the
150
possibility of intersecting more geological discontinuities and intrusions in
a large opening.
o In poor quality brecciated rock masses experiencing squeezing conditions,
the support pressure increases with tunnel span.
o The support pressure in rock tunnels and caverns does not increase directly
with excavation size due mainly to the dilatant behaviour of rock masses,
joint roughness and prevention of loosening of rock mass by modern
tunnelling technology. However, the support pressure is likely to increase
directly with the excavation width for tunnels through slickensided shear
zones, thick clay filled fault gouges, weak clay shales and running or
flowing ground conditions where interlocking of blocks is likely to be
missing.
o The support pressures in squeezing ground conditions decrease with tunnel
closure significantly and increase rapidly beyond a 6% closure.
Assessment of support pressures in shear zones and walls of caverns should
be carried out cautiously. Shear zones treatment should be done properly.
o Under swelling ground conditions, the reliability of any of the approaches
is yet to be established. Therefore, laboratory tests and field
instrumentation are suggested.
Singh et al. noted that there are problems in obtaining correct values of SRF near
weakness zones intersecting an excavation. For example, two tunnels at depths of
100 and 300 m from the surface, indicating different magnitudes of cover pressure,
are being excavated through the same rock mass with a single weakness zone
containing clay or chemically disintegrated rock. For both tunnels, the SRF value
will be 2.5, because the depth of excavation is more than 50 m. This clearly shows
that precise weightage to stress condition is missing from SRF, thereby indicating
inadequacy in the Q system in the complex Himalayan region.
151
Further, a large range of SRF values are suggested when a shear zone only influences
but does not intersect the excavation. For “competent rock masses” the
determination of SRF is based on σ1, σ3, σc and σθ values (where σ1 and σ3 are major
and minor principal stresses, σc and σθ are UCS and tensile strength of rock material)
and the suggested values of SRF have wide ranges.
It should be noted that the empirical formulas for predicting support pressures using
Q values (or N values), discussed in this section, are based on the experience gained
from measurements in tunnels driven in the Himalayas and supported with steel ribs.
When using these equations for practical applications it is advisable to take
cognisance of the following:
o The Q system does not recommend steel ribs as a method of tunnel support.
o The empirical formulas for support pressure given in the Q system intend to
predict pressures on shotcrete and rock bolts. Mechanics of their behaviour
are different to those of steel ribs.
o In the Indian case tunnels σ1 is assumed to be due to the overburden and
vertical. The horizontal stress magnitudes are not provided.
o In high horizontal stress conditions the reliability of the suggested formulas
is doubtful.
5.2.15 Indian Coal Mining Experience
Sheorey (1993) applied three rock mass classification methods, namely RMR, Q and
CMRS (Central Mining Research Station) method, to underground coal mine
roadways in India and provided the results from 44 case studies. The rock types
covered in the study were more or less horizontally bedded sandstone, shale,
siltstone, coal, shaly coal, mudstone, shaly sandstone and sandy shale. The roadway
widths varied between 3.0 and 5.2 m with the majority being 3.5 to 4.5 m.
The study included estimation of support pressures and the determination of safe
unsupported spans using the empirical formulas given in the RMR and Q methods.
For simplicity, Sheorey used Equation 4.10 (see Chapter 4) provided by Barton et al.
(1974) instead of Equation 4.12 presented in subsequent publications on the Q
152
system. Despite the fact that all the case studies presented by Sheorey had operating
lives of more than five years, long-term excavations for coalmining, the permanent
support pressures estimated using Equation 4.10 were found to be very high and
were clearly impracticable from the point of view of mining. Hence, Sheorey
estimated temporary support pressure by using 5Q (recommended in the system for
temporary support) in place of Q in Equation 4.10 as given below with the
expectation of obtaining more viable support pressures.
Proof = (2/Jr) Q-1/3
(4.10)
Proof = (2/Jr) 5Q-1/3
(4.10a)
Sheorey also determined the safe unsupported spans for roadways using Equation
4.14, but for roadway intersections, which are wider, he used an amended version
(using Q/3 instead of Q) as given in Equation 4.14a.
B = 2 ESR Q0.4
(4.14)
Bj = 2 ESR (Q/3)0.4
(4.14a)
where, junction span Bj is the distance between two adjacent corners in an
intersection. The main findings of the Sheorey’s study relevant to the Q system
were:
o The support pressures estimated using the equation recommended by the Q
system for permanent excavations were very high and were clearly
impracticable from the point of view of mining.
o The modified Q Equation 4.14a also overestimated support pressures for 43
cases out of 44, sometimes excessively.
o When ESR was taken as 3 to 5 as recommended in the Q system for temporary
mine openings, Equation 4.14 and the modified version (Equation 4.14a)
predicted unrealistic unsupported spans for roadways.
153
o When ESR was taken as 1.6 for the 44 roadway cases, seven “unstable cases”
were predicted as “stable”. In the case of junctions, three unstable cases were
predicted as stable while five stable cases were predicted as unstable.
o The Q system is inadequate for certain geological features not covered by it
and also when joint orientation is unfavourable.
Based on the results of the study Sheorey recommended the reduction of the rating
given to Jn by one third for horizontally stratified rocks (i.e. change Jn to Jn2/3
) when
computing the Q value and reduce (divide) the Q value by a factor of 3 to 5
depending on the rock mass conditions in coal measures before using it for predicting
stable unsupported spans. Sheorey also made the following observation with respect
to the RMR system:
o Support pressures were underestimated in poorer rock masses. This happened
for two reasons: firstly, this system does not consider stress; and secondly, the
load factor in support pressure equation of RMR system has a maximum value
of 1.0.
In considering these two points, Sheorey attempted to include the influence of stress
in the RMR system and to alter Equation 4.5 for better estimation of support
pressures.
Sheorey presented a plot of RMR and Q values obtained from the 44 case studies
representing coal mine roadways. Since the data points were widely scattered, he did
not perform a regression analysis of the data to obtain a correlation between the two
systems. As part of the present research, a regression analysis of the data presented
by Sheorey (1993) was undertaken and the following equation was obtained:
RMR = 6.8 ln Q + 42 (5.13)
154
5.2.16 Review and Application to Bore Core Data from the UK
Rawlings et al. (1995) reviewed the RMR and Q classification methods and applied
the two methods to a geological formation comprising volcanic rocks. Rock mass
data were obtained by logging approximately 1700 m of rock core recovered from
three bore holes. The following conclusions were drawn:
o The RMR method has the advantage that its six parameters are relatively easy
to estimate and the RMR value is formed by simply adding the ratings for the
various parameters. However, this limits the range of materials over which
the system can be applied.
o The RMR system considers RQD and joint spacing separately, both of which
are measures of block size which is therefore overemphasised (receiving up
to 50% of the total rating) at the expense of other parameters which may have
greater influence on the engineering properties. Bieniawski (1989)
recommends that where less than three joint sets are present, the joint spacing
rating should be increased by 30% which puts even more emphasis on block
size.
o The output of the RMR system tends to be rather conservative which can lead
to over-design of support.
o In comparison, very detailed treatment of joint roughness and alteration are
the strongest features of the Q system. In addition, the numeric Q value
range, 0.001 to 1000, encompasses the whole spectrum of rock mass qualities
from heavily squeezing ground up to sound unjointed rock.
o Of the six parameters in the Q system, Ja and SRF are probably the two most
subjective. A correct assessment of Ja requires proper training in the use of
the system and the SRF rating in rock affected by high stress is difficult to
estimate by visual observations.
155
Rawlings et al. analysed RMR and Q values assigned to the bore core data to find a
correlation between the two systems. Two sets of Q values were considered: the first
assumed SRF=1 and the second used the SRF values recommended in the Q system.
By correlating the two sets of Q values with the relevant RMR values, Rawlings et al.
first obtained the following two correlations:
RMR = 6.5 ln Q + 48.6 (with SRF = 1) (5.14)
RMR = 6.1 ln Q + 53.4 (with relevant SRF values) (5.15)
They observed that the addition of the relevant SRF values in the Q indices mostly
affected the lower end of the Q scale leading to many more values of Q<1. They also
observed the poorest fit to the linear relationship occurs when Q<1. In order to
obtain a better fit for the correlations between RMR and Q values, bilinear
relationships were applied. The bilinear relationship for the RMR and un-factored
(meaning SRF=1) Q values were:
RMR = 10.3 ln Q + 49.3 (when Q ≤ 1) (5.16)
RMR = 6.2 ln Q + 49.2 (when Q > 1) (5.17)
The bilinear relationship for the RMR and regular Q values obtained using the
relevant SRF values were:
RMR = 6.6 ln Q + 53.0 (when Q ≤ 0.65) (5.18)
RMR = 5.7 ln Q + 54.1 (when Q > 0.85) (5.19)
Rawlings et al. found that the bilinear relationship fitted well for the RMR and
un-factored Q values. However, no such commentary was provided on the bilinear
relationship derived for the RMR and regular Q values. Although Rawlings et al.
(1995) did not provide a plot of the data used in the analysis, the possibility of
obtaining two different formulas from each of the two data sets indicates that data
may be widely scattered.
156
5.2.17 Experience from Israel
Polishook and Flexer (1998) assessed the applicability of the RMR and Q systems to
chalk rock masses in excavations in Israel. They examined the chalk rock in seven
unsupported excavations and from each site four to six measurements were taken by
applying the two systems. The rock mass is characterised by non-continuous joints
and bedding planes. The excavation spans varied from 3 to 10 m and their age varied
from 10 to 1500 years. The purposes of the excavations were wide ranging and
included contemporary infrastructure such as a railway tunnel, an access gallery and
petroleum storage caverns etc and ancient tunnel complexes for residence, ritual,
shelter and burial etc. The conclusions drawn from the study were:
o As a result of the presence of non-continuous joints and bedding planes,
RMR and Q classification methods are too conservative and therefore
unsuitable for chalk rock mass.
o The RMR and Q methods indicate that the tunnels studied needed support,
yet they can in fact stand up independently (some of them for nearly 1500
years) with minimal or no support.
o Tunnels are unsupported and there were no signs of collapse.
5.2.18 Sydney Experience
Asche and Quigley (1999) present the results of a review of the application of the Q
system to the New Southern Railway (NSR) tunnels in Sydney. The review was
undertaken as part of a study undertaken to formalise a design approach for another
project in the Sydney region. The NSR involved the construction of 11 m wide
10 km long tunnel, but only about 2.3 km of which was driven in rock and the review
covered approximately 1.1 km representing Hawkesbury sandstone. Typically this
rock has two joint sets and occasionally up to three plus random joints.
Asche and Quigley examined the support predicted based on the Q ratings obtained
from 12 preconstruction boreholes with the installed support and observed that,
157
o There were noticeable differences between the Q ratings carried out by
various parties using the bore core information.
o Support predicted using these ratings varied from random bolting to pattern
bolting and fibre reinforced shotcrete. However, the installed support was
limited to pattern bolting to pattern bolting and mesh.
o The differences in Q ratings and therefore the support predictions can be
linked to those geological parameters that are not directly derived from
bore core observation. Different assumptions were made for each set of Q
values calculations.
o In Hawkesbury sandstone which is known to have two joints sets, there are
areas where the spacing of one of the sets is so wide that it should not be
taken into consideration for Q calculations. It is however very difficult to
assess these variations from bore cores, especially if the joints and the
boreholes are vertical.
o To improve on the accuracy of design parameter values, it is necessary to
understand the geological characteristics of the rock mass before
commencing the Q ratings. Where the geology varies locally, there will be
a lower bound and upper bound Q rating resulting in a range of predicted
support for each location.
Subsequent to the tunnel construction, Asche and Quigley, with the benefit of the
observations made during excavation, reassigned three Q values for the 12 boreholes.
For each borehole minimum, maximum and median Q values were computed and
support requirements were determined for each of the three cases. From this Asche
and Quigley concluded that support deduced using Q median value best reflects the
support installed in the tunnel. However, the graph showing the predicted and
installed support classes presented by Asche and Quigley (1999) shows that only
seven out of the 12 cases of Q median support predictions agreed with the installed
158
support. The correlation of both Q maximum and minimum support predictions with
the installed support was poorer than that of the Q median value.
In their study Asche and Quigley also compared the support predicted using the
tunnel mapping data with the installed support. Minimum and maximum Q values
were calculated for each geological unit from the geological maps and support
requirements were determined for both cases. Generally, compared to the support
predicted based on borehole data, a good correlation existed between the installed
support and that predicted using tunnel mapping data. In some areas of the tunnel
length studied, however, the installed support was heavier than the Q predicted
support, whereas in other areas it was less.
5.2.19 Experience from Italy and Spain
Gonzalez de Vallejo (2002) applied RMR and SRC (see Section 4.3.1) systems to 25
tunnels in Spain and Northern Italy, and evaluated the two systems in terms of their
suitability for tunnels in weak rocks affected by high horizontal tectonic stresses.
The evaluation was undertaken by comparing support estimated by RMR and SRC
methods with those actually installed. The Q system was also applied occasionally
and only partial results were obtained for this index.
Out of the 25 tunnels, 20 are high speed railway tunnels and the remaining five are
hydroelectric power tunnels. These tunnels have cross sections up to 120 m2 in
highly variable conditions both in geological and construction aspects. However,
they also have some common features such as predominance of low strength rocks
(shales, schists and argillites etc), significant folding and deformation structures
(folds, faults, thrusts etc) and overburden thicknesses under 700 m. In 22 tunnels the
main rocks were low strength shales, schists and argilites with typical UCS values of
10 to 15 MPa and highly anisotropic behaviour. The other three tunnels intersected
meta-basalt and gneiss. In the 25 tunnels, the state of stresses was evaluated by
considering the tectonic history, the presence of deformation structures and current
tectonic regime, measurements of in situ stress in the regions where the tunnels were
excavated and instability problems occurred during tunnel excavation and their
relation to tectonic structure. Based on this information, the in situ stress fields
159
around the tunnels were classified into four classes using the horizontal to vertical
stress ratio k (=σh/σv). The four are Low (k≤0.5), Moderate (0.5<k≤1.0), High
(1.0<k≤2.0), and Very high (k>2.0). The relevant information showed that the stress
fields around six of the tunnels were very high to high, around 13 of the tunnels were
high and around the remaining six were low to moderate. In this study the RMR and
SRC indices were applied to the 25 tunnels and support requirements were
determined during the project design stage as well as during construction. In the
latter case RMR and SRC data were collected from several excavation fronts in each
tunnel. Additionally, tunnel section convergence measurements, problems related to
ground instability and the actual support installed were also recorded. Q values were
also determined for four of the tunnels. In order to analyse the data collected the
tunnels were divided to three groups based on in situ stress levels:
o Group I: tunnels located in zones of high horizontal tectonic stresses with
low overburden thicknesses (generally less than 150 m).
o Group II: tunnels located in zones of high horizontal tectonic stresses with
high overburden thicknesses (higher than 150 m, mostly more than 250 m).
o Group III: tunnels located in zones of low to moderate horizontal stresses
irrespective overburden thicknesses.
For the purpose of comparing the installed support with the RMR and SRC predicted
support, the former was also classified into one of the five RMR classes. While the
RMR and SRC were applied to all 25 tunnels, the Q system was applied only to a
sample of Group II and III tunnels. The result of the analysis showed that
o For Group I tunnels the actual support installed significantly exceeded
those predicted by the RMR system. In 64% of the cases examined, the
difference between the predicted and installed was two RMR classes and
for the remaining 36% the difference was one RMR class indicating in
100% of the cases, installed support exceeded the RMR predictions.

160
o In Group I tunnels the installed support also exceeded the SRC predictions,
but the difference was less compared to the RMR predictions. In 9% of the
cases examined, the difference between the predicted and installed was two
RMR classes and for the remaining 55% the difference was one RMR class
which means in 64% of the cases, the installed support exceeded the SRC
predictions.
o The predictions for Group II tunnels showed the same tendency but the
difference was less. In 22% of the cases, the difference between the RMR
predicted and installed was two RMR classes and for 67% the difference
was one RMR class which means in 89% the installed support exceeded the
RMR predictions. In the remaining 11% the predicted and installed were
comparable.
o For Group II tunnels, in 78% of the cases examined, the installed support
and the SRC predictions were comparable but in the remaining 22%, the
difference between the predicted and installed was two RMR classes.
o In Group III tunnels the installed support and those predicted by RMR and
SRC were comparable in 100% of the cases examined.
o For Groups I and II, the ratio of the mean of the installed support classes to
the mean of RMR predicted support classes was 0.5, and the corresponding
ratio for SRC predictions was 0.8.
o In Group II tunnels the difference between the installed and the Q predicted
support was one Q support class, i.e. predicted poor class, but actual was
very poor class. In Group III tunnels the actual support installed was same
as the Q predicted support.
In his study Gonzalez de Vallejo also attempted to establish correlations between the
tunnel convergence or deformation and the RMR and SRC indices. He observed that
in general, neither index could adequately predict convergence nor establish a
reliable correlation between rock classification indices and deformation. This is
161
interpreted to be due to (a) high horizontal stresses, (b) low intact rock strength,
(c) thin overburden and (d) unfavourable structural anisotropy with respect to tunnel
axis. The other possible contributing factors which are not accounted for in the
classification systems are shape and size of tunnel sections, the excavation methods
and type of support installed. In tunnels with low overburden the effect of structural
anisotropy caused by the presence of bedding planes and schistocity was marked,
while this effect was much reduced when overburden is high. The orientation of
schistocity is also a governing factor. For instance, for a tunnel with low overburden
and schistocity parallel to its axis the correlation between convergence and RMR and
SRC classification indices was poor, but for a tunnel with high overburden and
schistocity perpendicular to its axis the correlation was improved.
5.2.20 General Review Comments by Stille and Palmstrom
Stille and Palmstom (2003) reviewed the role of rock mass classification systems in
rock engineering and design. They considered four classification systems, GSi, RMi,
RMR and Q, as well as the well known observational method, NATM. The
conclusions arising from their review were:
o The existing quantitative rock mass classification systems can be applied as a
useful tool to establish a preliminary design. At least two systems should be
applied. They are not recommended for use in detailed and final design,
especially for complex underground openings.
o Classification systems are unreliable for rock support determination during
construction, as local geometric and geological features may override the
rock mass quality defined by the classification system.
o RMR cannot be used as the only indicator, especially when rock stresses or
time dependent rock properties are of importance for the rock engineering
issue.
o The accuracy of the estimation of rock support using the Q system is very
difficult to evaluate. Especially in the poorer rock class (Q<1), the system
162
may give erroneous design. The true nature of the rock mass (i.e. popping
squeezing, swelling, etc) that is essential for the determination of the support
measures is not explicitly considered in the Q system.
Regarding the Q system, the two authors also commented that in fractured ground
the orientation of joint is an important parameter. In such cases it is very important
to follow the guidelines given by Barton et al. (1974) that the parameters Jr and Ja
should be related to joint surfaces most likely to allow failure to initiate. From the
rock mechanics point of view, it is obvious that even such a simple case as block
instability is much more complicated than can be given by a single number like a Q
value.
5.2.21 Experience from the Higher Himalayas
Kumar et al. (2004) applied RMR and Q classification methods, along with RSR and
RMi methods, to 22 km of a 27.4 km long tunnel driven in the Higher Himalayas,
India. This tunnel encountered many challenges related to geothermic heavy inflows
of groundwater, excessive overburden, flowing, slabbing and squeezing ground
conditions. The tunnel was driven through metamorphic rock formations comprising
schists, gneisses and amphibolites. In all 685 tunnel sections, inclusive of 50
sections in squeezing ground conditions and 69 in shear zones, were studied. The
total length of tunnel facing squeezing ground conditions is more than 1 km with
individual lengths varying from 3 to 63 m. Shear zones have a total length of 1 km
with individual lengths varying from 2 to 63 m. The tunnel passes under a rock
cover of more than 1000 m with a maximum of 1430 m over a distance of 800 m. In
addition to RMR, Q, RSR and RMi, Kumar et al. also applied RCR (RMR without
IRS and RA parameters) and N (Q with SRF=1). The RCR and N are as defined by
Goel et al. (1995). Kumar et al. also attempted to develop correlations between these
methods and assessed the SRF values recommended in the Q system for stress related
problems in moderately jointed rocks.
In the Q system, for “Competent rock, rock stress problems” (Table 4.11 Section b)
SRF values are recommended on the basis of σc/σ1 and σθ/σc for six different
conditions denoted as H, J, K, L, M and N (where of σc, σ1 and σθ are intact rock
163
strength, major principal stress and maximum tangential stress, respectively). The
recommended SRF values for conditions H, J and K (low, medium and high stresses,
respectively) are understood to be applicable for both massive as well as moderately
jointed rock. On the other hand, in conditions L, M and N (moderate slabbing,
slabbing and rock burst, and heavy rock burst, respectively) the recommended SRF
values pertain to massive rocks only, which should really be the case since slabbing,
rock burst etc are associated with competent massive rocks only. There are,
however, situations in which ratios σc/σ1 and σθ/σc lie in ranges corresponding to
conditions L, M and N, but the rock is moderately jointed and not massive. For these
situations Table 4.11 does not provide SRF values. If SRF values are selected for
“rock stress problems” purely on the basis of σc/σ1 and σθ/σc ratios, the results might
be correct for massive rocks but are bound to be incorrect for jointed rock masses. In
order to address this problem Kumar et al. attempted to estimate appropriate SRF
values for moderately jointed rock experiencing high stresses, and proposed new
guidelines for estimating SRF. New correlations have also been proposed for
estimating support pressure using RMi system support recommendations and
prediction of ground conditions based on joint roughness and alteration. The
conclusions relevant to RMR and Q that may be drawn from the study were:
o For “rock stress problems” Q values determined by selecting SRF ratings
purely on the basis of σc/σ1 and σθ/σc ratios, the only option available to the
user, might be erroneous.
o New SRF values have been proposed for “rock stress problems” in
moderately jointed rocks. The proposed SRF values range from 1.5 to 3.0,
which are significantly smaller than the range of values (5 to 400) given by
Barton and Grimstad (1994) for slabbing and bursting in competent rocks.
o Correlations for predicting ground behaviour based on joint roughness (Jr)
and alteration (Ja) of Q have been developed as given in Table 5.4.
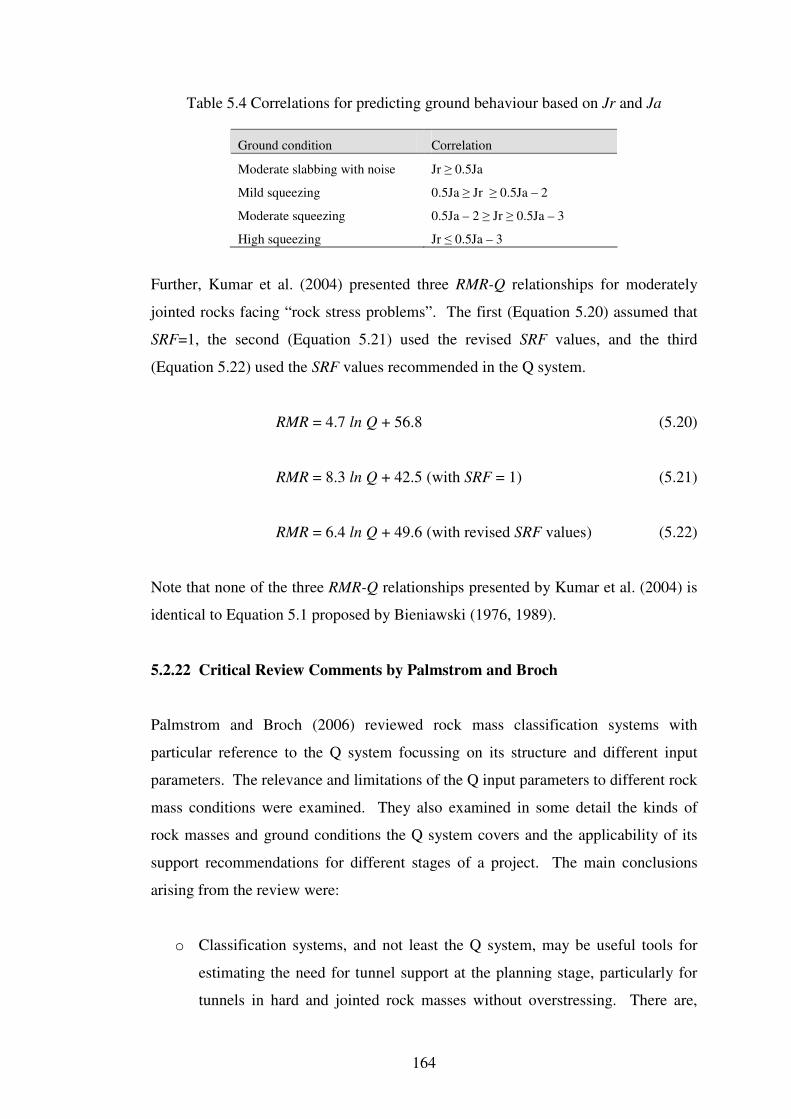
164
Table 5.4 Correlations for predicting ground behaviour based on Jr and Ja
Ground condition Correlation
Moderate slabbing with noise Jr ≥ 0.5Ja
Mild squeezing 0.5Ja ≥ Jr ≥ 0.5Ja – 2
Moderate squeezing 0.5Ja – 2 ≥ Jr ≥ 0.5Ja – 3
High squeezing Jr ≤ 0.5Ja – 3
Further, Kumar et al. (2004) presented three RMR-Q relationships for moderately
jointed rocks facing “rock stress problems”. The first (Equation 5.20) assumed that
SRF=1, the second (Equation 5.21) used the revised SRF values, and the third
(Equation 5.22) used the SRF values recommended in the Q system.
RMR = 4.7 ln Q + 56.8 (5.20)
RMR = 8.3 ln Q + 42.5 (with SRF = 1) (5.21)
RMR = 6.4 ln Q + 49.6 (with revised SRF values) (5.22)
Note that none of the three RMR-Q relationships presented by Kumar et al. (2004) is
identical to Equation 5.1 proposed by Bieniawski (1976, 1989).
5.2.22 Critical Review Comments by Palmstrom and Broch
Palmstrom and Broch (2006) reviewed rock mass classification systems with
particular reference to the Q system focussing on its structure and different input
parameters. The relevance and limitations of the Q input parameters to different rock
mass conditions were examined. They also examined in some detail the kinds of
rock masses and ground conditions the Q system covers and the applicability of its
support recommendations for different stages of a project. The main conclusions
arising from the review were:
o Classification systems, and not least the Q system, may be useful tools for
estimating the need for tunnel support at the planning stage, particularly for
tunnels in hard and jointed rock masses without overstressing. There are,
165
however, a number of restrictions that should be applied if and when the
system is going to be used in other rock masses and in complicated ground
conditions.
o Potential users of the Q system should carefully study the limitations of this
system as well as other classification systems they may want to apply, before
using them.
o For practical use the Q system works best for the approximate range
0.1<Q<40, which represents Very Poor to Good Rock mass classes of the
system. This range of Q values might be referred to as normal hard rock
conditions.
o On the recently introduced QTBM to estimate “penetration rate” for TBM, the
review found that the Q input parameters are irrelevant or even misguiding
for TBM performance, and the total effects are difficult to follow in the
model.
5.2.23 Australian Experience
Pells and Bertuzzi (2008) compared the actual support installed in 14 major tunnels
and caverns with those deduced from RMR and Q classification methods, and
commented on the reliability of the two empirically methods for support design.
Eleven of the projects are in Sydney, two are in Melbourne and one is in Brisbane.
The data presented include (a) the support designed (or would have designed) using
RMR or Q, (b) the actual support installed, and (c) the performance of the tunnels
and caverns. The Sydney area is underlain by a sequence of near horizontal
sandstone and shale. The projects presented by Pells and Bertuzzi are:
o Three ocean outfall tunnels: 4 m wide 3.5 km long at North Head; 3 m wide
1.3 km long at Bondi; and 4 m wide 4 km long at Malabar.
o The Sydney Opera House underground car park, doughnut-shaped in plan
view with an 18 m span and 6 to 8 m rock cover.
166
o The M2 tollway: two 11.9 m wide 450 m long twin two-lane tunnels
separated by a 5.5 m wide pillar, with typical cover of 16 m and 22 m. The
predominant rock type is very good quality sandstone with some 1 to 1.5 m
horizons of poor quality sandstone.
o The New Southern Railway: only about 2.3 km of this 11 m wide 10 km
long tunnel was driven in rock. The results of the application of the Q
system to about 1.1 km is provided by Asche and Quigley (1999) and
discussed earlier in Section 5.2.18 of the thesis.
o The Eastern Distributor tollway: a 50 m length of >20 m span tunnel with a
total cover of about 30 m. The project comprised a 15 to 24 m span 2.4 km
long three-lane double-decker tunnel and about 1 km of associated ramp
tunnels with spans up to 24 m.
o The M5 Motorway: 8.6 m wide 4 km long twin two-lane tunnels excavated
in Hawkesbury sandstone with an overburden of between 15 and 70 m. In
the ramp bifurcation areas at the ends of the main tunnels spans increase up
to 19 m. The tunnels were excavated by roadheaders. The average strength
of sandstone intact rock was between 25 and 30 MPa. The predominant
rock mass defects were gently undulating bedding planes, with the typical
regional near vertical joints being quite sparse where depth of cover was
greater than about 40 m. The major principal stress in the sandstone was
near horizontal and oriented approximately NNE with a range of 4 to
7.5 MPa for overburden depths between 25 and 70 m.
o The North-side sewer storage tunnels, comprising 3.8 m wide 6.5 km long,
6 m wide 3.7 km long and 6.3 m wide 3.5 km long TBM driven tunnels.
All tunnels were in sandstone with depth of cover ranging from
approximately 20 to 80 m.
o Three parallel gas storage caverns, 14 m wide 11 m high and 120 m long
with a depth of about 120 m beneath Botany Bay.
167
o The Epping-Chatswood rail link, 7 m wide 14 km long twin tunnels and
four train stations with spans up to 20 m.
o Two three-lane road tunnels in the Melbourne City Link project. The 1.6
km long Domain Tunnel driven at a maximum depth of about 25 m beneath
a parkland hill and a cut and cover length (not included in the study)
beneath the Yarra River. The 3.5 km long Burnley Tunnel driven at a depth
of 60 m beneath the Yarra River. Two tunnels were excavated primarily in
Melbourne mudstone. The tunnels were driven using full face top headings
excavated by a 100 tonne roadheader, followed by removal of 4 to 5 m high
bench using a combination of roadheader, impact breaker and a small
amount of blasting.
o Approximately 3.6 km of a 3 m diameter S1 main sever tunnel in Brisbane
driven through hard rocks comprising metasediments and occasional
meta-basalts.
The conclusions drawn by Pells and Bertuzzi from the Sydney projects were:
o For the North Head and Malabar ocean outfall tunnels, excavated by drill
and blast methods and road header respectively, the RMR system was
conservative in terms of support requirements, particularly for machine
excavated tunnels. The Q system provided a reasonable prediction for
machine excavation but was non-conservative where drill and blast was
concerned.
o In the Sydney Opera House car park cavern, the support measures installed
were significantly more than those predicted by the RMR and Q methods.
Pells and Bertuzzi acknowledge that, in a way, this cavern is an unfair test
of the classification systems because of its low rock cover. However, there
is nothing in the relevant publications (particularly in the Q system)
suggesting it should not be applied to such structures.
168
o In the M2 tollway tunnels, the RMR predicted support measures were
comparable to those installed, whereas Q predictions could have been
undesirably non-conservative.
o In the Eastern Distributor tunnel, a 50 m length with a span of >20 m was
studied. Since the RMR support recommendations are for 10 m diameter
tunnels, they are not considered applicable to this tunnel. However, it was
obvious that the adopted support design is substantially greater than that
deduced from the Q system.
o For Botany Bay gas storage caverns with spans of about 14 m the RMR
support recommendations may not be considered applicable. During
construction two roof collapses occurred when the support installed was in
accordance with the Q system. The actual support installed subsequently
was of a substantially higher capacity than the Q recommendations.
o In the North-side sewer storage project TBM driven tunnels, the initial
primary support, comprising rock bolts and mesh, was designed using the Q
system. The actual density of rock bolting (bolts per metre) which proved
necessary to install following inadequate performance of the initial design
ranged between 5 and 9 times the initial design densities (Pells, 2002, Pells
and Bertuzzi, 2008).
o In the M5 Motorway tunnels, the actual support installed were substantially
more than those deduced using the Q system.
o In the New Southern railway tunnel, the Q predicted support only
occasionally matched the actual support installed, as discussed earlier under
Asche and Quigley (1999).
o In the Epping-Chatswood rail link tunnels there is no correlation between
the Q value (or the recommended support) and the installed support.
169
o The primary support used in the two Melbourne tunnels comprised rock
bolts, shotcrete, mesh and steel sets. Other than for the very poor quality
rock (fault zones and weathered igneous intrusions) there is no correlation
between the Q value (or the recommended support) and the installed
support.
o In the Brisbane S1 main sewer tunnel, apart from the very poor and
extremely poor rock classes, much greater support was installed than that
recommended by Q. According to the Q system the bulk (~70%) of the
tunnel would require no support, but during excavation some of these areas
required spot bolting and the remaining areas required systematic bolting
and occasional wire mesh.
The main conclusions drawn from the comparison based on the factual data from the
14 projects were:
o The design correlations published in the various papers on the Q and RMR
systems should be used with great caution in geological environments
significantly different from those comprising the original case studies.
o Cognisance must be taken of the fact that use of the general classification
design approach is contrary to normal engineering design process. It is not a
proper application of the scientific method. There are no applied mechanics
calculations of stress or displacement, no computations, or information, as to
loads, strains and stresses in the support elements (shotcrete, rock bolts and
sets), and therefore nothing against which to compare field monitoring data.
The position of the classification design approach in relation to modern limit
state design is unknown and unknowable. It covers neither ultimate no
serviceable limit states.
Pells and Bertuzzi (2008) further stated that “Classification systems are good for
communication and in many cases good for producing correlations in particular
geological environments. However, … … they should not be used as the primary
tool for the design of primary support”.
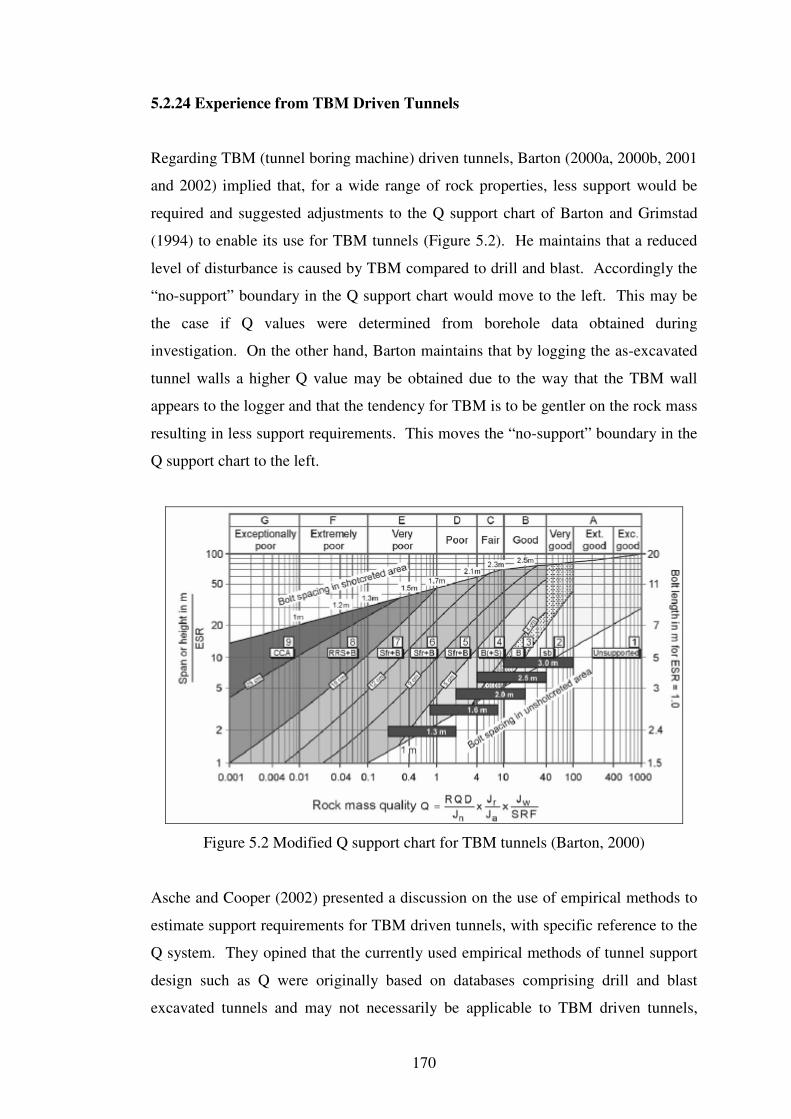
170
5.2.24 Experience from TBM Driven Tunnels
Regarding TBM (tunnel boring machine) driven tunnels, Barton (2000a, 2000b, 2001
and 2002) implied that, for a wide range of rock properties, less support would be
required and suggested adjustments to the Q support chart of Barton and Grimstad
(1994) to enable its use for TBM tunnels (Figure 5.2). He maintains that a reduced
level of disturbance is caused by TBM compared to drill and blast. Accordingly the
“no-support” boundary in the Q support chart would move to the left. This may be
the case if Q values were determined from borehole data obtained during
investigation. On the other hand, Barton maintains that by logging the as-excavated
tunnel walls a higher Q value may be obtained due to the way that the TBM wall
appears to the logger and that the tendency for TBM is to be gentler on the rock mass
resulting in less support requirements. This moves the “no-support” boundary in the
Q support chart to the left.
Figure 5.2 Modified Q support chart for TBM tunnels (Barton, 2000)
Asche and Cooper (2002) presented a discussion on the use of empirical methods to
estimate support requirements for TBM driven tunnels, with specific reference to the
Q system. They opined that the currently used empirical methods of tunnel support
design such as Q were originally based on databases comprising drill and blast
excavated tunnels and may not necessarily be applicable to TBM driven tunnels,
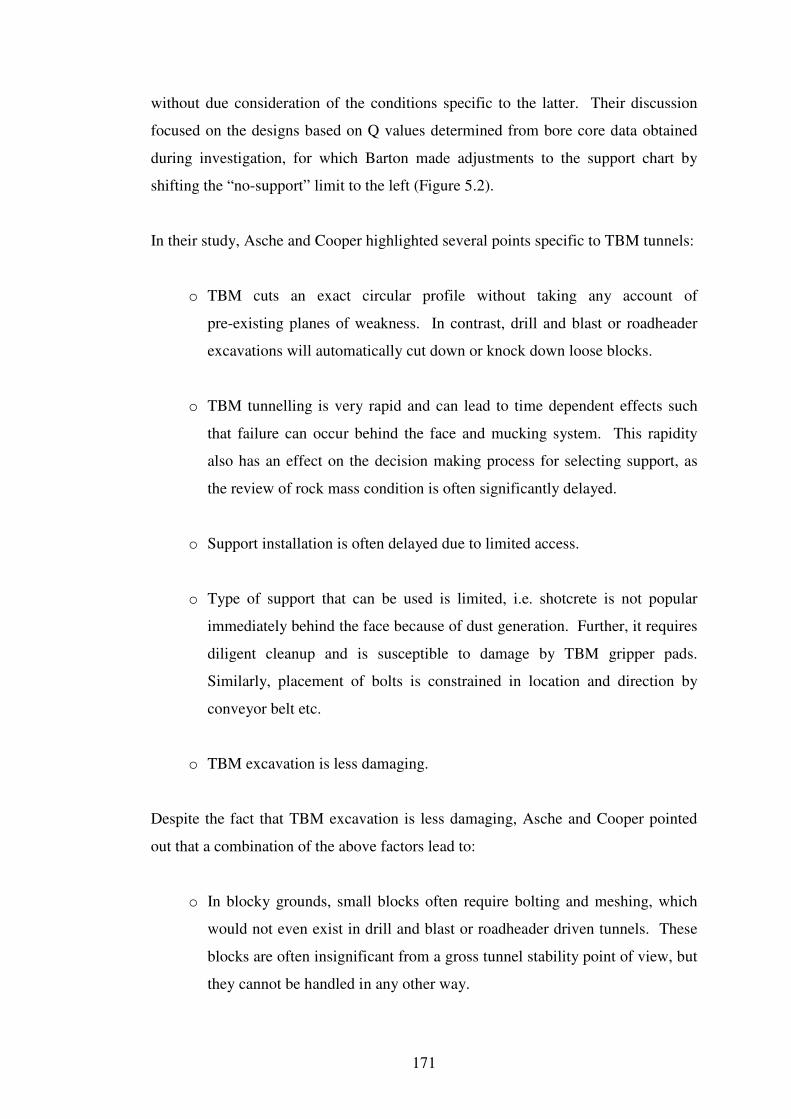
171
without due consideration of the conditions specific to the latter. Their discussion
focused on the designs based on Q values determined from bore core data obtained
during investigation, for which Barton made adjustments to the support chart by
shifting the “no-support” limit to the left (Figure 5.2).
In their study, Asche and Cooper highlighted several points specific to TBM tunnels:
o TBM cuts an exact circular profile without taking any account of
pre-existing planes of weakness. In contrast, drill and blast or roadheader
excavations will automatically cut down or knock down loose blocks.
o TBM tunnelling is very rapid and can lead to time dependent effects such
that failure can occur behind the face and mucking system. This rapidity
also has an effect on the decision making process for selecting support, as
the review of rock mass condition is often significantly delayed.
o Support installation is often delayed due to limited access.
o Type of support that can be used is limited, i.e. shotcrete is not popular
immediately behind the face because of dust generation. Further, it requires
diligent cleanup and is susceptible to damage by TBM gripper pads.
Similarly, placement of bolts is constrained in location and direction by
conveyor belt etc.
o TBM excavation is less damaging.
Despite the fact that TBM excavation is less damaging, Asche and Cooper pointed
out that a combination of the above factors lead to:
o In blocky grounds, small blocks often require bolting and meshing, which
would not even exist in drill and blast or roadheader driven tunnels. These
blocks are often insignificant from a gross tunnel stability point of view, but
they cannot be handled in any other way.
172
o The speed of TBM tunnelling, the limited access for viewing the rock at the
face and the organisational aspects often lead to heavier support installation
than actually necessary.
o In some cases, movement on joints can happen behind the face due to the
speed of excavation.
Asche and Cooper (2002) compared the Q predicted support and installed support in
the North Side Storage Tunnel in Sydney. This project involved the construction
more than 16 km of tunnels. The support design was based in part on the Q system
and included rock bolts, mesh and steel sets as listed in Table 5.5. They compared
the support predicted using Q values obtained by logging the tunnel and the actual
support installed and the results are presented in Figure 5.3.
Table 5.5 NSTP Support types
Support type Designed Q range Support
ST1 >5 Random bolts
ST2 3-5 2 bolts + mesh
ST3 2-3 4 bolts + mesh
ST4 1-2 6 bolts + mesh
ST5 0.2-1 8 bolts + mesh
ST6 <0.2 Steel sets
0 5000 10000 15000 20000
ST6
ST5
ST4
ST3
ST2
ST1
Su
pp
ort
ty
pe
Tunnel length (in m)
Support from logged Q Actual support installed
Figure 5.3 Q predicted and installed support (after Asche and Cooper, 2002)
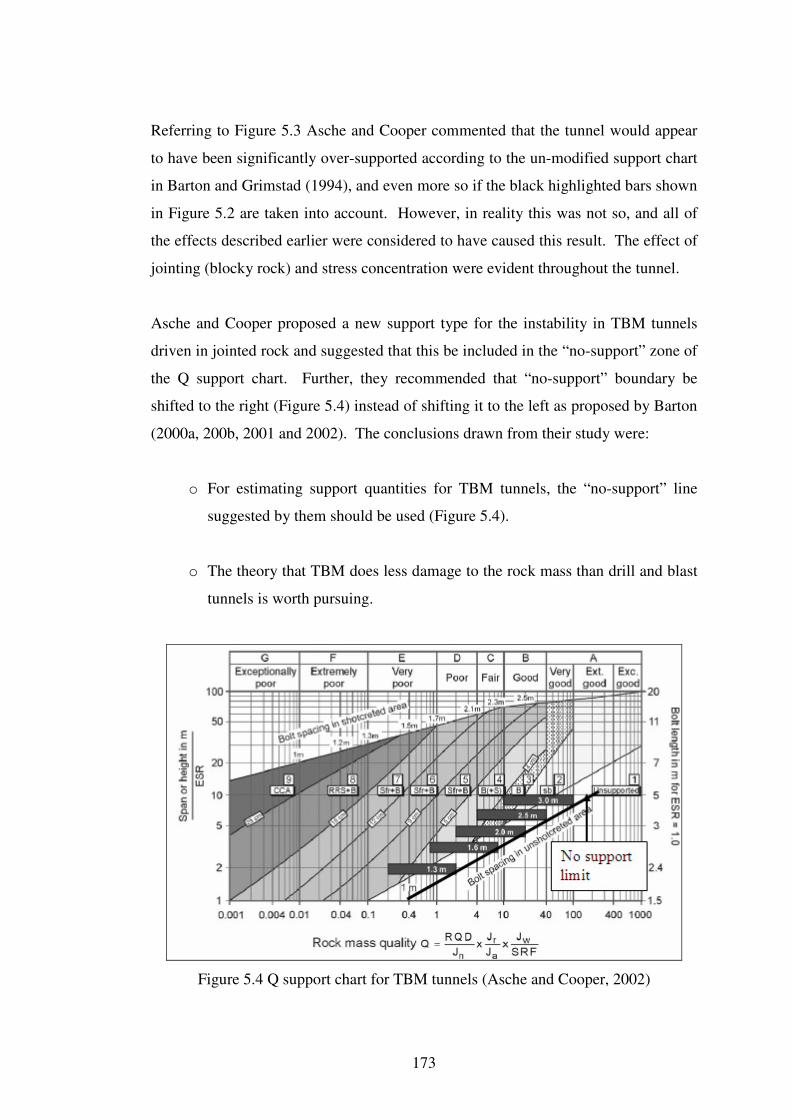
173
Referring to Figure 5.3 Asche and Cooper commented that the tunnel would appear
to have been significantly over-supported according to the un-modified support chart
in Barton and Grimstad (1994), and even more so if the black highlighted bars shown
in Figure 5.2 are taken into account. However, in reality this was not so, and all of
the effects described earlier were considered to have caused this result. The effect of
jointing (blocky rock) and stress concentration were evident throughout the tunnel.
Asche and Cooper proposed a new support type for the instability in TBM tunnels
driven in jointed rock and suggested that this be included in the “no-support” zone of
the Q support chart. Further, they recommended that “no-support” boundary be
shifted to the right (Figure 5.4) instead of shifting it to the left as proposed by Barton
(2000a, 200b, 2001 and 2002). The conclusions drawn from their study were:
o For estimating support quantities for TBM tunnels, the “no-support” line
suggested by them should be used (Figure 5.4).
o The theory that TBM does less damage to the rock mass than drill and blast
tunnels is worth pursuing.
Figure 5.4 Q support chart for TBM tunnels (Asche and Cooper, 2002)
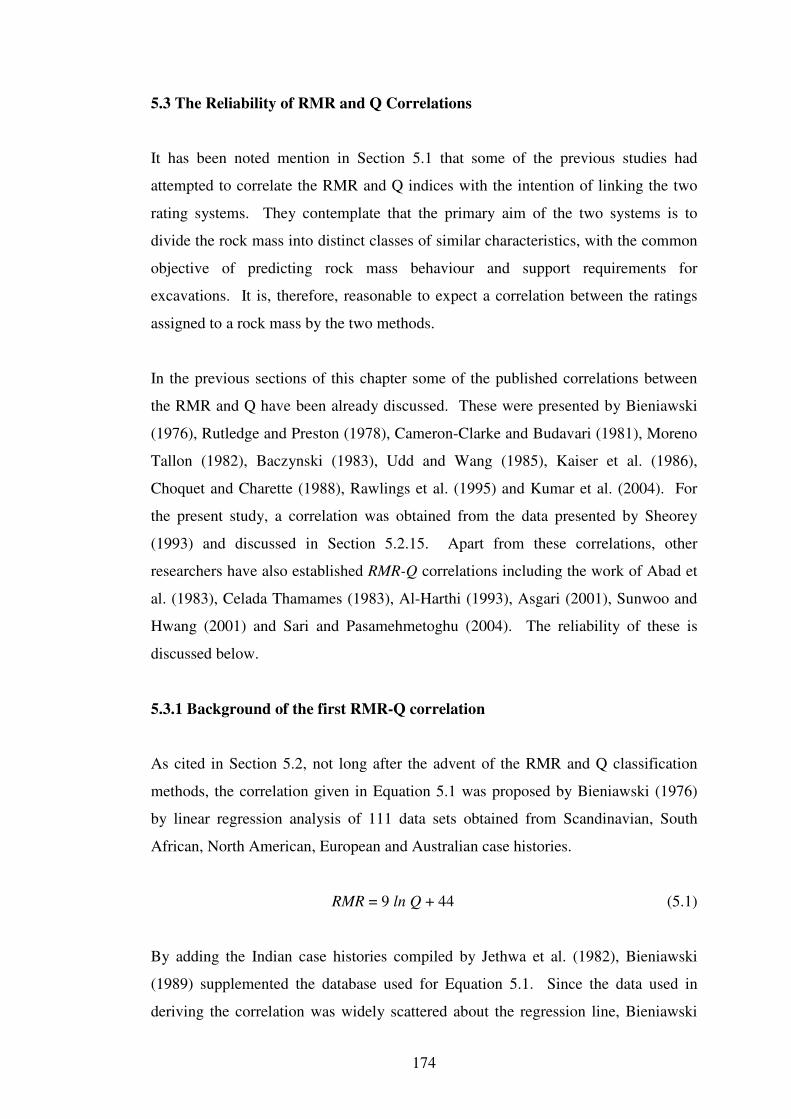
174
5.3 The Reliability of RMR and Q Correlations
It has been noted mention in Section 5.1 that some of the previous studies had
attempted to correlate the RMR and Q indices with the intention of linking the two
rating systems. They contemplate that the primary aim of the two systems is to
divide the rock mass into distinct classes of similar characteristics, with the common
objective of predicting rock mass behaviour and support requirements for
excavations. It is, therefore, reasonable to expect a correlation between the ratings
assigned to a rock mass by the two methods.
In the previous sections of this chapter some of the published correlations between
the RMR and Q have been already discussed. These were presented by Bieniawski
(1976), Rutledge and Preston (1978), Cameron-Clarke and Budavari (1981), Moreno
Tallon (1982), Baczynski (1983), Udd and Wang (1985), Kaiser et al. (1986),
Choquet and Charette (1988), Rawlings et al. (1995) and Kumar et al. (2004). For
the present study, a correlation was obtained from the data presented by Sheorey
(1993) and discussed in Section 5.2.15. Apart from these correlations, other
researchers have also established RMR-Q correlations including the work of Abad et
al. (1983), Celada Thamames (1983), Al-Harthi (1993), Asgari (2001), Sunwoo and
Hwang (2001) and Sari and Pasamehmetoghu (2004). The reliability of these is
discussed below.
5.3.1 Background of the first RMR-Q correlation
As cited in Section 5.2, not long after the advent of the RMR and Q classification
methods, the correlation given in Equation 5.1 was proposed by Bieniawski (1976)
by linear regression analysis of 111 data sets obtained from Scandinavian, South
African, North American, European and Australian case histories.
RMR = 9 ln Q + 44 (5.1)
By adding the Indian case histories compiled by Jethwa et al. (1982), Bieniawski
(1989) supplemented the database used for Equation 5.1. Since the data used in
deriving the correlation was widely scattered about the regression line, Bieniawski
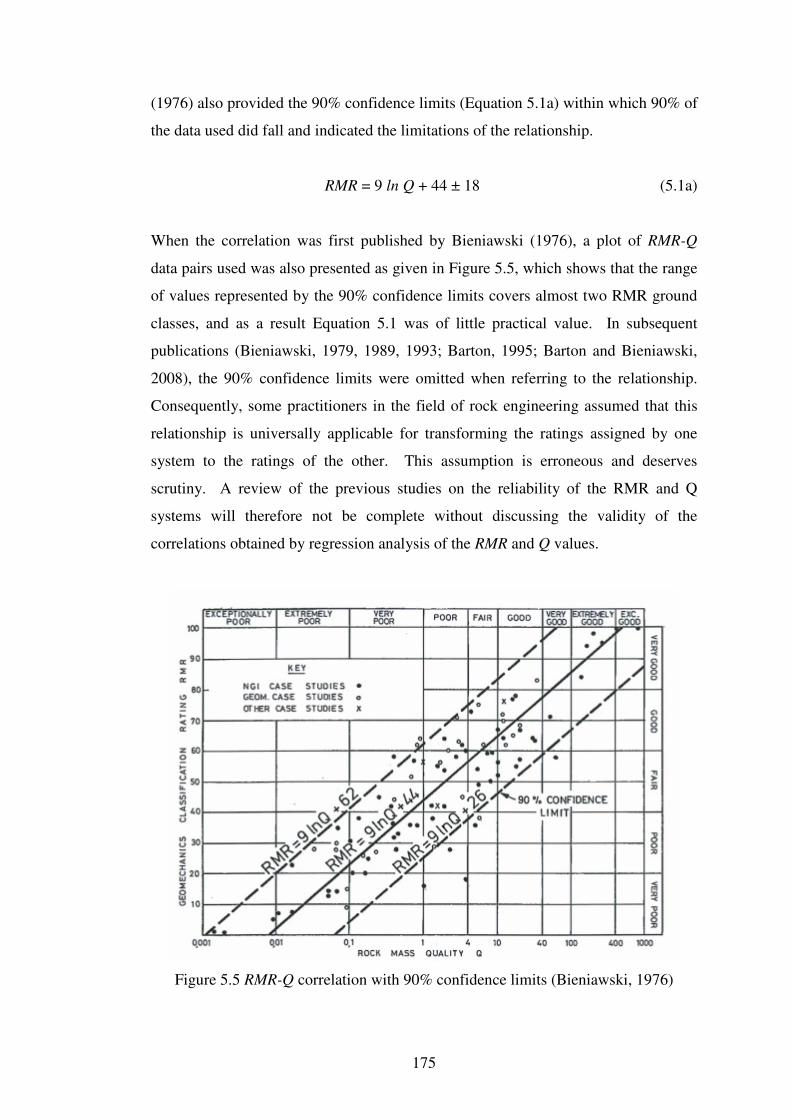
175
(1976) also provided the 90% confidence limits (Equation 5.1a) within which 90% of
the data used did fall and indicated the limitations of the relationship.
RMR = 9 ln Q + 44 ± 18 (5.1a)
When the correlation was first published by Bieniawski (1976), a plot of RMR-Q
data pairs used was also presented as given in Figure 5.5, which shows that the range
of values represented by the 90% confidence limits covers almost two RMR ground
classes, and as a result Equation 5.1 was of little practical value. In subsequent
publications (Bieniawski, 1979, 1989, 1993; Barton, 1995; Barton and Bieniawski,
2008), the 90% confidence limits were omitted when referring to the relationship.
Consequently, some practitioners in the field of rock engineering assumed that this
relationship is universally applicable for transforming the ratings assigned by one
system to the ratings of the other. This assumption is erroneous and deserves
scrutiny. A review of the previous studies on the reliability of the RMR and Q
systems will therefore not be complete without discussing the validity of the
correlations obtained by regression analysis of the RMR and Q values.
Figure 5.5 RMR-Q correlation with 90% confidence limits (Bieniawski, 1976)
176
Table 5.6 Correlations between RMR and Q
Correlation Source Eq. No.
RMR = 9 ln Q + 44 Bieniawski (1976) 5.1
RMR = 13.5 log Q + 43 = 5.9 ln Q + 43 Rutledge and Preston (1978) 5.2
RMR = 5 ln Q + 60.8 (from in situ data) Cameron-Clarke & Budavari (1981) 5.3
RMR = 4.6 ln Q + 55.5 (from bore core data) Cameron-Clarke & Budavari (1981) 5.4
RMR = 12.5 log Q + 55.2 = 5.4 ln Q + 55.2 Moreno Tallon (1982) 5.5
RMR = 7.5 ln Q + 42 Baczynski (1983) 5.6
RMR = 12.11 log Q + 50.81 = 5.3 ln Q + 50.81 Udd and Wang (1985) 5.7
RMR = 10 ln Q +39 Choquet & Charette (1988) 5.8
RMR = 6.3 ln Q + 41.6 Kaiser et al. (1986) 5.9
RMR = 8.7 ln Q + 38 ± 18 (probability theory)a
Kaiser et al. (1986) 5.10
RMR = 6.8 ln Q + 42b Sheorey (1993) 5.13
RMR = 10.3 ln Q + 49.3 (when Q ≤ 1, SRF = 1)c Rawlings et al. (1995) 5.16
RMR = 6.2 ln Q + 49.2 (when Q > 1, SRF = 1)c
Rawlings et al. (1995) 5.17
RMR = 6.6 ln Q + 53 (when Q ≤ 0.65)c
Rawlings et al. (1995) 5.18
RMR = 5.7 ln Q + 54.1 (when Q > 0.65)c
Rawlings et al. (1995) 5.19
RMR = 4.7 ln Q + 56.8 Kumar et al. (2004) 5.20
RMR = 8.3 ln Q + 42.5 (with SRF = 1) Kumar et al. (2004) 5.21
RMR = 6.4 ln Q + 49.6 (with revised SRF values) Kumar et al. (2004) 5.22
RMR = 10.5 ln Q + 41.8 Abad et al. (1983) 5.23
RMR = 7 ln Q + 36 Tugrul (1998) 5.24
RMR = 5.97 ln Q + 49.5 Sunwoo & Hwang (2001) 5.25
RMR = 3.7 ln Q + 53.1 Sari & Pasamehmetoglu (2004) 5.29
RMR = 43.89 – 9.19 ln Q Celada Thamames (1983) 5.30
RMR = 9 ln Q +49 Al-Harthi (1993) 5.31
RMR = 4.2 ln Q + 50.6 Asgari (2001) 5.32
a assuming RMR and ln Q are normal variates and satisfy the central limit theory of probability;
b
derived from the data presented by Sheorey (1993); c from bore core data
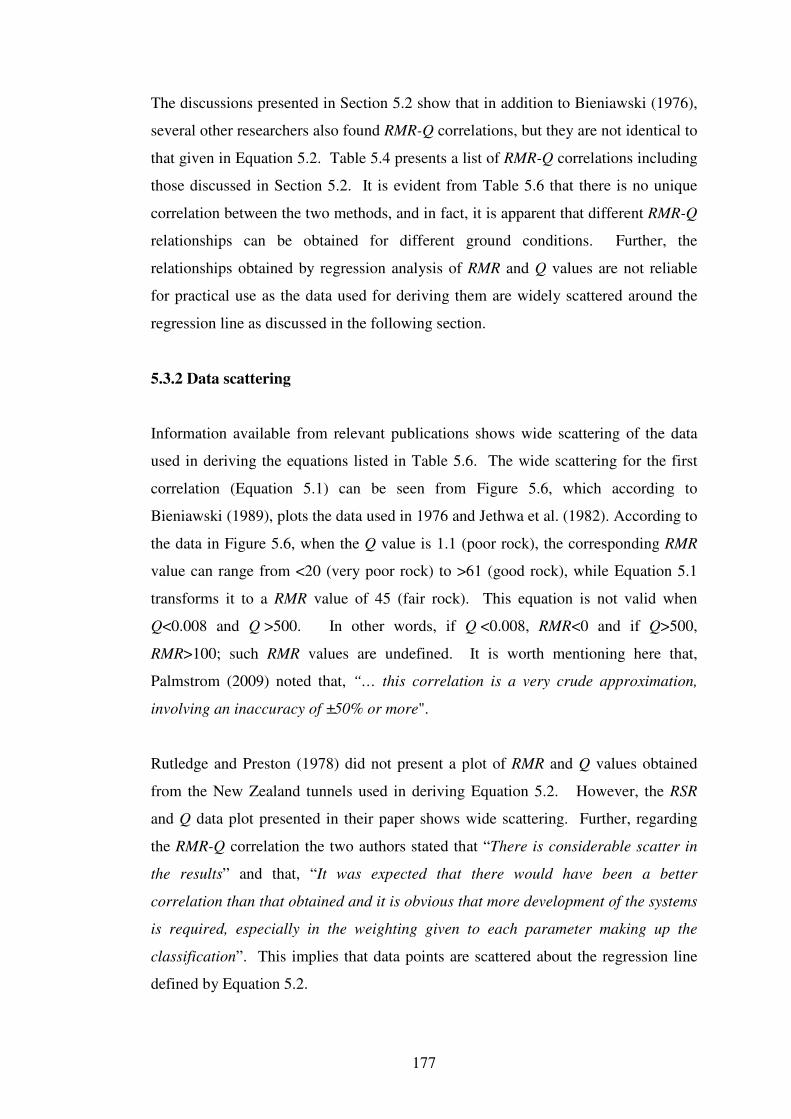
177
The discussions presented in Section 5.2 show that in addition to Bieniawski (1976),
several other researchers also found RMR-Q correlations, but they are not identical to
that given in Equation 5.2. Table 5.4 presents a list of RMR-Q correlations including
those discussed in Section 5.2. It is evident from Table 5.6 that there is no unique
correlation between the two methods, and in fact, it is apparent that different RMR-Q
relationships can be obtained for different ground conditions. Further, the
relationships obtained by regression analysis of RMR and Q values are not reliable
for practical use as the data used for deriving them are widely scattered around the
regression line as discussed in the following section.
5.3.2 Data scattering
Information available from relevant publications shows wide scattering of the data
used in deriving the equations listed in Table 5.6. The wide scattering for the first
correlation (Equation 5.1) can be seen from Figure 5.6, which according to
Bieniawski (1989), plots the data used in 1976 and Jethwa et al. (1982). According to
the data in Figure 5.6, when the Q value is 1.1 (poor rock), the corresponding RMR
value can range from <20 (very poor rock) to >61 (good rock), while Equation 5.1
transforms it to a RMR value of 45 (fair rock). This equation is not valid when
Q<0.008 and Q >500. In other words, if Q <0.008, RMR<0 and if Q>500,
RMR>100; such RMR values are undefined. It is worth mentioning here that,
Palmstrom (2009) noted that, “… this correlation is a very crude approximation,
involving an inaccuracy of ±50% or more".
Rutledge and Preston (1978) did not present a plot of RMR and Q values obtained
from the New Zealand tunnels used in deriving Equation 5.2. However, the RSR
and Q data plot presented in their paper shows wide scattering. Further, regarding
the RMR-Q correlation the two authors stated that “There is considerable scatter in
the results” and that, “It was expected that there would have been a better
correlation than that obtained and it is obvious that more development of the systems
is required, especially in the weighting given to each parameter making up the
classification”. This implies that data points are scattered about the regression line
defined by Equation 5.2.
178
On the two relationships obtained using bore core data and in situ observations in
South African tunnels, Cameron-Clarke and Budavari (1981) stated the following:
“The scatter of points about the regression lines is greater for the in situ values than
for the bore core values. In both cases, however, it is probably too great to indicate
any meaningful correlation between the two classification systems.”
Figure 5.6 RMR-Q correlation (after Bieniawski, 1989)
The RMR-Q correlation (Equation 5.6) obtained by Baczynski (1983) assumed that
SRF=2 in the Q values. Despite the fact that his correlation is in close agreement
with that proposed by Bieniawski (1976), Baczynski stated that, “However, it must
be strongly emphasised that the correlations are stress dependent. The relationship
will be significantly altered, if, for example, different SRF values are assumed in the
determination of the Barton’s Q rating. It is therefore important that any
relationship for the transformation from one classification rating to another is not
assumed to have universal application”.
The RMR-Q correlation given in Equation 5.7 obtained by Udd and Wang (1985)
used 153 data pairs. As mentioned in Section 5.2, the RMR-Q data plot they
presented shows wide scattering of the data about the regression line. Consequently,
based on the plot the two authors commented that there is not always good
agreement between the RMR and Q methods.
179
Kaiser et al. (1986) used two different approaches to obtain RMR-Q correlations.
Firstly, they used the least square linear regression analysis as used by the creators of
all the other RMR-Q correlations listed in Table 5.4, and obtained Equation 5.8.
Secondly, they used a probabilistic approach assuming that RMR and ln Q are normal
variates and satisfy the central limit theorem of probability theory, and obtained
Equation 5.9. Despite the use of a probabilistic approach, Kaiser et al. observed
wide scattering of the data and the correlation was presented as two equations
representing 90% confidence limits within which 90% of the data used for their study
fall. However, Kaiser et al. (1986) noted that the range of values represented by the
two equations is of little practical value as it covers almost two RMR ground classes,
as in the case of 90% confidence limits given by Bieniawski (1976).
Since the RMR and Q data obtained from the 44 case studies representing coalmine
roadways were widely scattered, Sheorey (1993) did not perform a regression
analysis to obtain a linear correlation. Nevertheless, for the present study, a
regression analysis of this data was performed to obtain the correlation in Equation
5.13 (Section 5.2.15). Due to the wide scattering of data, this correlation is also of
very limited practical value.
Rawlings et al. (1995) analysed RMR and Q values assigned to some 1700 m of bore
core from a geological formation comprising volcanic rocks. Two sets of Q values
were considered: the first assumed SRF=1 and the second used the SRF values
recommended in the Q system. By correlating the two sets of Q values with the
relevant RMR values, Rawlings et al. obtained three equations for each set of Q
values as described in Section 5.2.16. Although Rawlings et al. did not provide a
plot of the data used in the analysis the apparent need for obtaining bilinear
correlations from each of the two data sets indicate wide scattering of the data used.
Kumar et al. (2004) from observations in major tunnelling projects in the Himalaya,
India, found that the SRF values provided in the Q system are not applicable to
overstressed moderately jointed rocks that are subject to rock slabbing and bursting,
and proposed a revised set of SRF values for such rock stress problems. As
mentioned in Section 5.2.21, the proposed range of SRF values is 1.5 to 3.0, which is
180
significantly smaller than the range of values (5 to 400) given by Barton and
Grimstad (1994) for slabbing and bursting in competent rocks. Kumar et al. (2004)
then presented three RMR-Q relationships for moderately jointed rocks facing “rock
stress problems”. The first (Equation 5.20) assumed that SRF=1, the second
(Equation 5.21) used the revised SRF values, and the third (Equation 5.22) used the
SRF values recommended in the Q system. Note that none of the three RMR-Q
relationships presented by Kumar et al. (2004) is identical to Equation 5.1 proposed
by Bieniawski (1976, 1989).
In addition to the RMR-Q correlations presented in Section 5.2, several other
researchers have also obtained correlations based on linear regression analysis of
RMR and Q data gathered from various projects in different parts of the world.
These are also of limited practical value as the data used in deriving them are also
widely scattered.
Abad et al. (1983), in a study conducted on roof support design for coal mine
roadways in Spain, applied amongst other tools, the RMR and Q classification
methods. They correlated the RMR and Q values and obtained the following
relationship with a correlation coefficient r2 =0.93.
RMR = 10.53 ln Q + 41.83 (5.23)
Despite the high correlation coefficient, the RMR-Q plot provided by Abad et al.
shows significant scattering of the data used.
Tugrul (1998) applied RMR, Q and RSR classification indices to two grouting
galleries in Turkey and compared their support predictions. The galleries were
driven through very closely to moderately jointed limestone with low RQD values
and some karstic features. The tunnels are 4.1 m wide with a total length of 2113 m.
By linear regression analysis of RMR and Q values Tugrul found a correlation in the
form of
RMR = 7 ln Q + 36 (5.24)
181
In deriving the above correlation, Tugrul used only 35 data sets, yet the data are well
represented by the regression line with relatively low scattering.
Sunwoo and Hwang (2001) applied RQD, RMR and Q systems to several tunnels in
Korea and collected approximately 300 data sets from widely different geological
environments representing igneous, metamorphic and sedimentary rocks. By linear
regression analysis of the RMR and Q data they obtained four correlations, one for
the combined data (Equation 5.25) and one each for igneous, metamorphic and
sedimentary rocks (Equations 5.26, 5.27 and 5.28, respectively).
RMR = 5.97 ln Q + 49.5 (5.25)
RMR = 5.69 ln Q + 47.0 (5.26)
RMR = 6.04 ln Q + 49.6 (5.27)
RMR = 6.07 ln Q + 50.1 (5.28)
It is clear that the four correlations are similar. Since the combined data sample used
is statistically significant and represents a wide range of rock mass conditions,
Equation 5.25 may be considered to represent a reliable correlation between RMR
and Q. Nevertheless, the RMR-Q data plot provided by Sunwoo and Hwang (2001)
shows wide scattering about the linear regression line. For instance, according to the
plot when the Q value is 1 (poor rock) the corresponding RMR value can vary from
<30 (poor rock) to >61 (good rock). Similarly, when the RMR is 35 (poor rock), the
corresponding Q value can range from <0.1 (extremely poor rock) to >10 (good
rock).
Sari and Pasamehmetoglu (2004) correlated RMR and Q values collected during the
preliminary design stage of a 2.5 km highway tunnel in Turkey. The main rock type
along the proposed alignment is limestone olistolites, with occasional spilite and
sandstones intrusions. The majority of the rock mass is moderately jointed with four
discontinuity sets. Spilite and sandstone are characterised by faults. When
constructed the tunnel will be 12.7 m wide and 9.6 m high and have a maximum
182
overburden of 300 m. The rock mass parameters were collected from rock core
samples recovered from bore holes. They found that the RMR system was less
sensitive to the weak featured rock mass than the Q system which showed better
performance in defining the weak rock mass present along the tunnel alignment. By
linear regression analysis of the RMR and Q values, they obtained the following
correlation:
RMR = 3.7 ln Q + 53.1 (5.29)
Equation 5.29 is different (its gradient is flatter) from the other equations listed in
Table 5.4 and may be attributed to the type and condition of the rock mass present
along the tunnel alignment.
Celada Tamames (1983) presented a discussion on 14 years of rock bolting
experience, particularly from coalmine roadways, in Spain. Based on the experience
acquired from rock bolting in coalmine roadways in carboniferous rock formations
not affected by creep phenomena, he obtained a correlation between the RMR and Q
values as given in Equation 5.30, which has a correlation coefficient of 0.94.
RMR = 43.89 – 9.19 ln Q (5.30)
The data used to obtain Equation 5.28 were not provided in Celada Tamames (1983).
Nevertheless, he maintains that for coalmine road headings in carboniferous rock
formations in northern Spain, Q values could be obtained from RMR values using
this equation. He further maintains that the road headings produce an RMR index of
30. This indicates that the correlation given in Equation 5.30 is probably valid for
RMR and Q values of around 30 and 4.5, respectively.
Al-Harthi (1993) applied RMR and Q classification systems to a road tunnel at Al-
Dela Descent in the Kingdom of Saudi Arabia. The tunnel was to be driven through
weak Precambrian slate and chlorite schist intercalated by meta-basaltic rock
affected by three sets of structural discontinuities. The two methods were applied to
the 180 m long tunnel during investigations using the data collected by surface
mapping and bore core logging. Al-Harthi correlated the RMR and Q values
183
obtained from this study and three other tunnels in the area and obtained Equation
5.31, which is similar to that presented by Bieniawski (1976).
RMR = 9 ln Q +49 (5.31)
The RMR-Q data plot used for obtaining the above equation shows a relatively better
correlation. However, the plot has only 16 data points with a Q value range of
between 0.1 and 5 and a RMR range of 30 to 75. The small sample size and the
narrow range of ratings reduce its statistical significance.
Asgari (2001) applied RMR and Q to Iranian geological conditions and used 47 data
pairs to obtain the correlation given as Equation 5.32.
RMR = 4.2 ln Q + 50.6 (5.32)
Since his work was published in Persian and only an abstract is available in English
the details of the study could not be reviewed.
5.3.3 Correlation of modified (or truncated) RMR and Q values
In an attempt to reduce data scattering and to obtain better RMR-Q correlations,
Sheorey (1993), Goel et al. (1996) and Kumar et al. (2004) used modified or
truncated versions of the RMR and Q systems. Sheorey (1993) defined RMRmod as
RMR without ratings for IRS and JA, and Qmod as Q with SRF=1, and found a
reduction in the data scattering compared to the original RMR and Q values. Goel et
al. (1995, 1996) also noted that RMR and Q are not truly equivalent, and defined
RCR (rock condition rating) as RMR without IRS and JA, and N as Q with SRF=1,
which are essentially the same as RMRmod and Qmod defined by Sheorey (1993).
Kumar et al. (2004) also used RCR and N in their study. By regression analysis of
the truncated versions of the two methods, Sheorey (1993), Goel et al. (1996) and
Kumar et al. (2004) obtained the relationships given by Equations 33, 34 and 35,
respectively.
RCR = 9.5 ln N + 31 = 21.8 log N + 31 (5.33)
184
RCR = 8.0 ln N + 30 (5.34)
RCR = 8.0 ln N + 42.7 (5.35)
Goel et al. (1996) hold the view that Equation 5.34, which has a correlation
coefficient of 0.92, provides a reliable correlation between the two systems and can
be used for obtaining RMR from Q and vice-versa. Based on their study, the
following conclusions were drawn regarding the correlations between RMR and Q:
o Available correlations between Q and RMR have high scatter because the two
systems are not truly equivalent.
o Equation 5.34 should be used for determining the interrelationship between N
and RCR before interchanging Q and RMR.
o For mine roadways through coal measures, the correlation between RCR and
N proposed by Sheorey (1993) should be used.
It should be noted, however, the data plot presented by Goel et al. shows scattering
of data about the regression line given by Equation 5.34. Despite the relatively high
correlation coefficients (r2=0.87, 0.92 and 0.88, respectively) of Equations 5.33, 5.34
and 5.35, the relevant data plots show that the data are still scattered around the
regression lines of the three equations. For instance, according to the data provided
by Goel et al. (1996) when N is 3, the corresponding RCR can be between 25 and 45.
Further, Sari and Pasamehmetoglu (2004) found that regression analysis of RCR and
N values does not always yield high correlation coefficients. Their RMR-Q
correlation (Equation 5.29) with r2=0.86 is better than their RCR-N correlation given
as Equation 5.36 with r2=0.65, showing a distinction from the three equations given
above.
RCR = 1.7 ln N + 51.5 (5.36)
185
Based on their analysis, Sari and Pasamehmetoglu stated that the correlation between
RCR and N cannot be generalised.
Further, Asgari (2001), using Iranian case studies, obtain the RCR-N correlation
given as Equation 5.36. This again is different to the four RCR-N correlations listed
earlier.
RCR = 6 ln N + 45 (5.37)
Tzamos and Sofianos (2007) correlated four classification methods, RMR, Q, GSI
and RMi, using their common parameters, namely joint surface conditions (JC) and
the block size (BS). They provided charts for selecting ratings for JC and BS
parameters of the four systems and defined a rock mass fabric index F, a function of
JC and BS, and is expressed as
),( BSJCfF = (5.38)
The rock mass fabric indices of the four classification methods were denoted as
FRMR, FQ, FGSI and FRMi, respectively, and a common chart was prepared for all four
rock mass fabric indices. The required index value can be estimated by direct
measurements of appropriate parameters (i.e. to determine FQ index, JCQ and BSQ
should be measured) or by estimating other system parameters. In the RMR system
BS is represented by RQD and JS (joint spacing). Therefore,
JCJSRQDFRMR ++= (5.39)
In the Q system BS is represented by RQD and Jn (joint set number) and JC is
represented by Jr and Ja. Therefore,
Ja
Jr
Jn
RQDFQ ×= (5.40)
186
For validation of the chart, Tzamos and Sofianos applied the four rock mass fabric
indices to several case tunnels using the data sourced from the literature. Similarly,
they defined FGSI and FRMi for GSI and RMi classification methods, respectively, as
well. Since this thesis deals with only the RMR and Q methods, GSI and RMi are
excluded from this discussion.
The FRMR and FQ values obtained by applying the rock mass indices to several case
tunnel data sets sourced from the literature allowed them to identify a correlation
between the two indices as given below:
32log1532ln52.6 +=+= QQRMR FFF (5.41)
Although this relationship has a correlation coefficient of 0.96, the database used has
only about 30 data pairs and is not statistically significant. Further, the FRMR-FQ data
plot shows data scattering about the line defined by the above equation. For
instance, according to the data plot presented by the two authors, for a given FQ
value the corresponding FRMR value can have a range of up to 15 points. Similarly,
for a given FRMR value the corresponding FQ can vary by about one order of
magnitude. This clearly shows that the attempts made to correlate the RMR and Q
values serve no useful purpose from the point of view of rock engineering.
5.3.4 Choice of the independent variable and method of analysis
The relationships listed in Table 5.4 are based on least square linear regression
analysis of RMR and Q values with Q as the independent variable (abscissa of the
RMR-Q plot as in Figure 5.2). Kaiser et al. (1986) pointed out that the correlations
developed using linear regression analysis should be viewed with caution because the
results depend on the choice of the dependent variable. By linear regression analysis
of the data collected from the Wolverine West Tunnel in Canada they derived two
relationships; the first (Equation 5.8) used Q as the independent variable, and the
second (Equation 5.8a) used RMR as the independent variable.
RMR = 6.3 ln Q + 41.6 (5.8)
187
ln Q = 0.087 RMR – 2.28 (5.8a)
In spite of the fact that the two relationships were derived using the same data set,
they do not lead to the same result. For example, the first equation would predict an
RMR value of 40 from a Q value of 0.8, while in turn, the second equation would
predict a Q value of 3.35 from a RMR value of 40. This clearly demonstrates the
weakness of the conventional least square linear regression analysis. To overcome
this weakness, Kaiser et al. (1986) used a probabilistic approach to determine a
unique relationship between RMR and Q systems assuming that RMR and ln Q are
normal variants and satisfy the central limit theorem of probability theory. Despite
the use of a probabilistic approach, Kaiser et al. (1986) observed wide scattering of
the data and therefore proposed Equation 5.9, which represents the 90% confidence
limits within which 90% of the data used for their study fall. However, they noted
that the range of values represented by the two equations is of little practical value as
the range covers almost two RMR ground classes, as in the case of 90% confidence
limits given by Bieniawski (1976).
5.3.5 Limitations of the Correlations
The possibility of deriving somewhat different RMR-Q correlations from different
rock masses and the wide scattering of the data used in deriving them may be
attributed to the fact that the assessment of some of the rock mass parameters is
significantly different in the two methods as detailed in Section 4.5. For instance, in
the Q system, the intact rock strength is considered as a factor in the SRF term only if
the stability is likely to be affected by the in situ stress field around the excavation.
When the potential instability in the excavation is due to the presence of weak zones,
the intact rock strength is not considered in the Q value. In contrast, regardless of the
critical factor governing the potential instability in the excavation, the intact rock
strength is included in the RMR value. Similarly, in RMR the in situ stress field is
not considered in the classification, although the support recommendations are for
tunnels with a vertical stress magnitude of less than 25 MPa. In Q stress is a factor if
the excavation stability is likely to be affected by the in situ stress field. Further, as
pointed out by Milne et al. (1998), another difference between RMR and Q is evident
188
in the assessment of joint spacing. If three or more joint sets are present and the
joints are widely spaced, it is difficult to get the Q system to reflect the competent
nature of a rock mass. For widely spaced jointing, the joint set parameter Jn in the Q
system appears to unduly reduce the resulting Q value.
From the foregoing it is clear that there is unlikely to be a universally applicable
single formula for linking RMR and Q values. Any relationship will be specific to
the rock mass from which the data were obtained, the potential failure mode assumed
in deriving the Q values and the orientation of the excavation considered for the
RMR values. It is also noteworthy that the data used for deriving the RMR and Q
correlations listed in Table 5.4 were obtained by applying different versions of the
RMR system. For instance, the correlation given in Equation 5.1 was probably
obtained using the pre-1976 version(s) of RMR, while the subsequent correlations
may be based on either pre or post 1976 versions. Since different versions of the
RMR method use somewhat different ranges of ratings, it is important to state which
version is being used when correlating the RMR and Q values. The lumping of the
ratings assigned using different RMR versions to compare and correlate them with
the Q values has no scientific basis.
5.4 Conclusions Drawn from the Previous Studies
From the previous studies presented in this chapter several important conclusions on
the reliability of the RMR and Q classification methods for underground excavation
support design may be drawn. Since each study deals with a set of rock mass
conditions or a geological environment specific to a particular project and the main
focus of one study is not exactly the same as that of the next, conclusions do not
necessarily always complement each other. While some conclusions complement
each other, some conflict with others. In general, they can be divided into three
broad groups:
(a) Common conclusions: the conclusions common to most (or all) of the case
studies. These are likely to be of relevance to almost any past or future
application of the classification approach, and deal with the relative easiness
189
of application, structure, robustness and general applicability of the two
systems.
(b) Predictions of support measures and/or support pressures. Prediction of the
latter is an indirect method of support design. These conclusions could be
specific to a single case or to closely similar cases and may either agree with
or conflict with the conclusions drawn from the other cases. They can be
further divided into three subsets of support predictions: overconservative,
optimistic and adequate.
(c) Findings on the empirical formulas for support pressures. These conclusions
directly deal with the empirical formulas given in the two methods for the
prediction of support pressures. While some of these conclusions may be
case specific and may or may not conflict with each other, they aimed at
improving the support pressure formulas.
These conclusions are presented in the following sections.
5.4.1 The common conclusions
o Both methods are easier to use with RMR being the easiest.
o The size of the excavation relative to joint spacing is not considered,
though this relation can be an important factor.
o The classification systems place strong emphasis on geological or rock
mass parameters and not enough emphasis on the method of excavation.
o Rock durability is an important parameter not included in the two systems.
o In general, one should not necessarily rely on any one classification
method.
190
o The classification approach should not be taken too far as a substitute for
rock engineering design.
o There is not always good agreement between RMR and Q methods.
Despite established correlations, the two systems do not lead to similar
conclusions concerning tunnel support requirements.
o Under swelling ground conditions, the reliability of any of the approaches
is yet to be established.
o The RMR system is relatively insensitive to minor variations in rock
quality and is more so for the weak featured rock masses compared to the Q
system.
o The RMR and Q values estimated from a larger tunnel would be smaller
than those obtained from small drifts in a similar rock mass. This is due to
the possibility of intersecting more discontinuity sets and weaker rock
intrusions in a large opening.
o The RMR support recommendations are for 10 m wide tunnels only, and
prediction of support requirements for larger tunnels (span>10 m) or
smaller tunnels (span<10 m) is difficult with the current RMR system. The
RMR support recommendations are often conservative for small diameter
(~3 m) tunnels in better quality (fair to very good) rock masses.
o It is problematic to obtain correct SRF values near weakness zones
intersecting an excavation. For example, consider two tunnels at depths of
100 and 300 m from surface, indicating different magnitudes of cover
pressure, excavated through the same rock mass with a single weakness
zone containing clay or chemically disintegrated rock. For both tunnels,
the SRF value will be 2.5, because the depth of excavation is more than
50 m. This clearly shows that precise weightage to stress condition is
missing from SRF, thereby indicating inadequacy in the Q system.
191
o A large range of SRF values is suggested when a shear zone only influences
but does not intersect the excavation.
o Classification systems may be useful tools for estimating the need for
tunnel support at the planning stage, particularly in hard and jointed rock
masses without overstressing. There are, however, a number of restrictions
that should be applied if and when these systems are to be used in other
rock masses and in complicated ground conditions.
o Potential users of these systems should carefully study their limitations
before adopting them.
5.4.2 Conclusions on the predictions of support measures
Conclusions on the prediction of support requirements can be further divided into
three subsets of support predictions: overconservative, optimistic and adequate. In
other words, from different case studies, while some researchers found that the
support recommendations were conservative, others found that they were under
conservative or optimistic. In some cases the recommended support measures were
comparable to those installed. These are summarised below:
5.4.2.1 Overconservative support recommendations
o As a result of the presence of non-continuous joints and bedding planes, the
RMR and Q methods are too conservative and therefore unsuitable for
chalk rock mass. According to the two methods, the seven tunnels in chalk
needed support, yet these in fact had stood up for many years (some of
them for nearly 1500 years) with minimal or no support (Polishook and
Flexer, 1998).
o Both RMR and Q are conservative for 5 to 5.5 m diameter BC rail tunnels
but RMR is more so. This discrepancy must be attributed to the influence
of opening size on tunnel performance and cannot be eliminated by
192
simultaneous application of both classification systems to assess the factors
that have been neglected (Kaiser et al., 1986).
o Many of the rock support pressures predicted by the Q system were greater
than the measured rock loads (in non-squeezing rock) by an excessively
conservative margin (Rutledge and Preston, 1978). The Q system
overestimates support pressures for coalmine roadways (Sheorey, 1993).
o No support limit of RMR is found to be too conservative (Kaiser et al.,
1986).
o The RMR system yields conservative estimates for unsupported stope spans
(in hard rock mining). The 20 m upper limit of maximum permissible
unsupported span is extremely conservative (Baczynski, 1983).
o The Q system overestimates support pressures for coalmine roadways yet
also overestimates un-supported safe spans (Sheorey, 1993). In other
words, while predicting high support pressures (or rock loads), the Q
systems predicts the opening will be safe without support.
o The RMR estimates of support pressure for non-squeezing rock conditions
are overly safe for large tunnels (Goel et al., 1995).
o For the North Head and Malabar ocean outfall tunnels in Sydney, excavated
by drill and blast methods and road header respectively, the RMR system
was conservative in terms of support requirements, particularly for machine
excavated tunnels (Pells and Bertuzzi, 2008).
5.4.2.2 Optimistic support recommendations
o The Q predicted support matched only for two of the eleven sites studied,
both being small span (~2.8 m) mine tunnels. For the other nine (six of
them are from a 7.2 m span hydroelectric tunnel) the Q system
193
underestimated support requirements (Brook and Dharmaratne, 1985). For
the 7.2 m span tunnel RMR also underestimated support requirements.
o The Q system overestimates un-supported safe spans for coalmine
roadways (Sheorey, 1993).
o The RMR system underestimated support pressures in poorer rock masses
in coalmine roadways (Sheorey, 1993).
o The RMR estimated support pressures for tunnels in squeezing rock
conditions are unsafe for all sizes of tunnels investigated (Goel et al.,
1995).
o The RMR estimates of support pressures for non-squeezing rock are unsafe
for small tunnels. When applied to coalmine roadways the estimated
support pressures are unrealistically low in poor rock masses (Goel et al.,
1995).
o The Q estimated support pressures for squeezing ground conditions were
unsafe at least in two 9 m diameter tunnel sections. Limited data showed
that Q tends to be unsafe for large tunnels in squeezing ground conditions
(Goel et al., 1995).
o In the M2 tollway tunnels in Sydney the Q predictions could have been
undesirably non-conservative (Pells and Bertuzzi, 2008).
o In the 50 m length of the Eastern Distributor tunnel in Sydney with a span
of >20 m, the adopted support design is substantially greater than that
deduced from the Q system (Pells and Bertuzzi, 2008).
o In the 14 m wide Botany Bay gas storage caverns in Sydney, two roof
collapses occurred during construction when the support installed was in
accordance with the Q system. The actual support installed subsequently
194
was substantially of a higher capacity than the Q recommendations (Pells
and Bertuzzi, 2008).
o In the M5 Motorway tunnels, the actual support installed were substantially
more than those deduced using the Q system.
o In the Brisbane S1 main sewer tunnel, apart from the very poor and
extremely poor rock classes, much greater support was installed than that
recommended by Q which predicted that approximately 70% of the tunnel
would be unsupported. However, some of these areas were supported with
spot bolting and the remaining areas with systematic bolting and occasional
mesh.
o In the North-side sewer storage project TBM driven tunnels, the installed
support quantities were often different to those derived by the Q system.
The actual density of rock bolting (bolts per metre) which proved necessary
to install following inadequate performance of the initial design (based on
the Q system), ranged between 5 and 9 times the initial densities (Pells,
2002; Pells and Bertuzzi, 2008).
o In the New Southern railway tunnel, Q predicted support using bore core
data alone varied from random bolting to pattern bolting and fibre
reinforced shotcrete, however, the installed support was limited to pattern
bolting to pattern bolting and mesh (Asche and Quigley, 1999).
o In approximately 2 km of the Epping-Chatswood rail link tunnels
considered by Pells and Bertuzzi (2008), there is no correlation between the
Q value (or the recommended support) and the installed primary support.
In most areas the support installed exceeded the Q predictions.
o For shallow tunnels under high horizontal stresses excavated in weak rocks
with highly anisotropic behaviour due to schistocity, the RMR under
predicted support requirements compared to the support installed. In all the
25 tunnels examined the installed support exceeded the RMR predictions.
195
In 64% of the cases, the difference between the predicted and installed was
two RMR classes and the rest had a difference of one RMR class (Gonzalez
de Vallejo, 2002).
o In tunnels excavated in weak rocks with high overburden thickness and
high horizontal stresses, the RMR system underestimated support for 89%
of the tunnel headings investigated in the 25 tunnels. The difference was
one RMR class in 67% of the cases examined and in the remaining 22% the
difference was two RMR classes. In these tunnels the difference between
the installed and the Q predicted support was one Q support class, i.e.
predicted poor class, but actual was very poor class, however, the sample
size for the Q system was small (Gonzalez de Vallejo, 2002).
o The primary support used in the two Melbourne tunnels comprised rock
bolts, shotcrete, mesh and steel sets. Other than for the very poor quality
rock (fault zones and weathered igneous intrusions) there is no correlation
between the Q value (or the recommended support) and the installed
support.
o For TBM tunnels in jointed rock and laminated rock with high horizontal
stress the Q system under estimate support requirements.
o Highly variable correlations were observed between tunnel convergence or
deformation and the RMR index (Gonzalez de Vallejo, 2002).
5.4.2.3 Adequate support recommendations
o The Q system provides a reasonable estimate of support pressure in
non-squeezing conditions and for smaller tunnels under squeezing ground
conditions (Goel et al., 1995; Singh et al., 1997).
o For the North Head and Malabar ocean outfall tunnels in Sydney, the Q
system provided a reasonable prediction where machine excavation was
196
concerned, but was non-conservative for the drill and blast methods (Pells
and Bertuzzi, 2008).
o In the M2 tollway tunnels in Sydney, the RMR predicted support measures
were comparable to those installed (Pells and Bertuzzi, 2008).
o In the New Southern railway tunnel, the support deduced by Asche and
Quigley (1999) subsequent to the tunnel excavation using the Q median
values obtained from preconstruction bore core data best reflects the
support installed in the tunnel with 7 out of 12 cases of Q median support
predictions agreeing with the installed support.
o Tunnels excavated in weak rocks under low to moderate horizontal stresses
regardless of overburden thickness the support installed were consistent
with those predicted by the RMR method. In these tunnels the actual
support installed was same as the Q predicted support (Gonzalez de
Vallejo, 2002).
5.4.3 Findings on the support pressure (rock load) formulas
As discussed in Section 4.4, the empirical support pressure formulas of the Q system
(see Equations 4.10 to 4.13) assume that the support pressure is independent of the
width of the excavation and is only a function of the rock mass quality (i.e. Q value,
Jr and Ja). In contrast, the RMR system takes the width of the excavation into
account directly when estimating support pressures (see Equation 4.5). As already
mentioned, some conclusions drawn from previous case studies directly deal with the
support pressure formulas given in the two methods. Some of the findings from
these studies have already been included in the Q system as can be seen from
Equation 4.14. These conclusions are presented below:
o For a given rock class (in non-squeezing rock) the support pressure does
not increase linearly from zero at zero tunnel width, but shows a less than
linear increase with increasing tunnel width (Rutledge and Preston, 1978).
197
o The support pressures for rock tunnels in non-squeezing ground conditions
can be taken as independent of the tunnel size, whereas in squeezing
ground conditions the support pressure increases significantly with tunnel
size. Furthermore, the size effect increases with tunnel depth. In addition,
poorer rock masses experience a higher size effect (Goel et al., 1995).
o Support pressure in tunnels and caverns does not increase directly with
span size due mainly to the dilatant behaviour of rock masses, joint
roughness and prevention of loosening of rock mass by modern tunnelling
technology. However, the support pressure is likely to increase directly
with the excavation width for tunnels through slickensided shear zones,
thick clay filled fault gouges, weak clay shales and running or flowing
ground conditions where interlocking of blocks is likely to be missing
(Singh et al. 1997).
o In poor quality brecciated rock masses experiencing squeezing conditions
the support pressure increases with tunnel span (Singh et al., 1997).
o Support pressures in squeezing ground conditions decrease with tunnel
closure significantly and increase rapidly beyond 6% closure (Singh et al.,
1997).
o In the case of flat-roofed mine roadways through coal measures, the support
pressure increases directly with the roadway width.
5.4.3 Conclusions on correlations between the RMR and Q values
As mentioned in Section 5.3 and listed in Table 5.4, several researchers have derived
RMR and Q correlations by linear regression analysis of data. The review of the
published information showed that each correlation is different from the next and the
data used in deriving them are often widely scattered. The main reasons for this are
the differences in the parameters and the rating methods used and the manner in
which the final RMR and Q values are computed.
198
It is clear from the available information that a different relationship can be obtained
for each case study and that each is applicable only to that particular rock mass and
project conditions from which the relationship was obtained. Even for the same rock
mass, if the data used are widely scattered, such relationships are of very little
practical value and their use for transforming the ratings between the two methods
could lead to errors. Further, Kaiser et al. (1986) showed that the results of
correlations depend on the choice of the dependent variable. From the foregoing, it
is apparent that there is no sound scientific basis to assume a universally applicable
linear relationship between the two systems.
When both methods are to be applied to a project, which is desirable, each should
always be applied independent of the other, without attempting to convert the ratings
of one method to that of the other using the relationships published in the literature.
Such relationships, bearing in mind their obvious limitations, may be used as a crude
guide for checking the general accuracy of the ratings derived by the two systems.
199
CHAPTER 6
ANALYSIS OF CASE STUDIES
6.1 Introduction
In this chapter the details of the application of the RMR and Q to several case studies
and an assessment of the reliability of their support predictions are presented. This
research considers that under a given set of conditions, the reliability of the RMR and
Q derived support for an underground excavation can be assessed by comparing
them with those derived by other applicable methods and also with the actual support
installed. Such an assessment can best be carried out during excavation of an
underground opening because representative data can be collected by direct
observation of the intersected ground conditions and monitoring the performance of
the support installed. In this context, ten case studies were analysed for the present
study. For nine of which the RMR and Q systems were applied by detailed mapping
during excavation and for the remaining case they were applied during design stage
using the data obtained by site investigation. For the present study the geotechnical
data obtained and the ratings assigned to the RMR and Q input parameters during the
construction of the case tunnels were reviewed and where deemed necessary minor
adjustments were made to reflect the extreme ground conditions reported in the case
studies. The effectiveness of the support predictions of the two classification
methods was then evaluated against the potential failures that can be predicted by
some of the applicable rational methods. Both structurally controlled gravity driven
failures and stress induced failures in jointed rocks were considered depending on
their relevance to the rock mass conditions intersected in the case tunnels. The
structurally controlled gravity driven failures were analysed using limit equilibrium
methods of analysis. For some of the selected case tunnels, the stress controlled
failures in jointed rocks were also analysed by numerical modelling using the
discontinuum approach.
The main mode of structurally controlled instability analysed in this study was
tetrahedral rock wedge failure caused by three intersecting joints in rock masses.
200
Beam failure was also analysed when horizontally bedded or laminated rocks were
intersected in the case tunnels. Tetrahedral rock wedge analysis was undertaken
using UNWEDGE software code (Rocscience, 2003), developed based on the block
theory proposed by Goodman and Shi (1985). UNWEDGE provides an effective means
of identifying all kinematically unstable tetrahedral wedges in a rock mass, provided
discontinuity orientations are known. The stability of kinematically unstable
tetrahedral rock wedges identified in the rock mass was then assessed by limit
equilibrium analysis, and the support measures required to stabilise potentially
unstable rock wedges were determined. The UNWEDGE analysis assumes that the
geological discontinuities are ubiquitous. For the present study this is acceptable
because the application of the two rock classification indices also assumed that the
joints were ubiquitous in each sector (or structural domain) of the case tunnels. Rock
wedge stability is not only a function of discontinuities but also of the stress field in
the rock mass. The induced stress field around the excavation can have a stabilising
influence, particularly for narrow and deep rock wedges, but its effect may be
reduced if wedges have loosened during excavation, i.e. due to blast vibration. In
some cases the stress field can have a destabilising influence by forcing them out of
their sockets, particularly if the wedges are broad and shallow. UNWEDGE does not
accurately model the wedge failure caused by the stress field around the tunnel.
However, it allows identification of wedges that have no restraining effect from the
in situ stress field. For such wedges the stability analysis under gravity loading alone
(unstressed state) may be considered applicable (Rocscience, 2008).
UNWEDGE can model the effect of both mechanically (point) anchored and full
column grouted rock bolts installed in a rock mass. It can also analyse the effect of
shotcrete by computing punching shear capacity of shotcrete along the edge of a rock
wedge. In this study the bolts considered were the cement grouted type with 100%
bond efficiency and an ultimate tensile strength of 180 kN installed normal to the
rock face. The shotcrete was assumed to have a nominal compressive strength of 30
MPa and a tensile strength of 3 MPa. The effect of mesh or fibre reinforcement was
analysed by doubling these values. A factor of safety (FOS) of 1.5 for walls and 2
for roof were selected for long term stability.
201
The beam analysis was undertaken using the suspended beam concept presented by
Stilborg (1994) and Brady and Brown (2004), discussed in Chapter 3. It is a
simplified method of analysis which ignores the in situ stress field around the
excavation. The same type of rock bolts installed normal to the rock face was
considered for the beam analysis. A FOS of 2 was used for long term stability. The
effect of shotcrete was considered only implicitly.
Both tetrahedral wedge analysis and suspended beam analysis are based on three
dimensional models and may be considered to represent a close approximation of the
actual failure modes in a jointed rock mass around an underground opening.
In some of the case studies, the in situ stress field is considered to be high enough to
warrant numerical analysis of stress induced failures. Since the rock masses in these
case tunnels are moderately jointed, the discontinuum approach using UDEC
developed by Itasca (2004) was adopted for numerical modelling of the stress
induced rock mass behaviour around the case tunnels. UDEC is a two dimensional
numerical modelling software package based on the distinct element method in
which a rock mass is represented as an assembly of discrete blocks and
discontinuities are viewed as interfaces between distinct bodies. UDEC can simulate
the response of jointed rock masses subjected to either static or dynamic loading. It
allows modelling of rock mass failure along discontinuities as well as through intact
rock material. In this study UDEC analysis was applied only to the case studies in
which the stability is considered to be governed by both discontinuities and the stress
field. Only the static loading conditions were modelled using UDEC and the same
rock bolts and shotcrete parameters were used as in the case of the limit equilibrium
analyses. The adhesive strength and elastic modulus of shotcrete were assumed to be
0.5 MPa and 30 MPa, respectively. The elastic modulus of mesh/fibre reinforced
shotcrete was assumed to be 35 MPa.
6.2 The Case Studies
The case studies used in this research comprised civil engineering project tunnels in
different parts of the world representing a range of geological, geotechnical and
project conditions. The tunnels in the database were constructed for hydroelectric,
202
water supply, road and railway projects, underground power station access,
exploration and grouting and drainage of a major dam foundation. For most of the
case tunnels, detailed data were available from research reports, conference and
journal papers or project specific documentation. The tunnels included in the
database and the relevant data sources are listed in Table 6.1 and the details of each
case tunnel are discussed in the following sections.
The tunnel mapping and the application of the RMR and Q methods to the case
tunnels were conducted by several researchers with the participation of experienced
site based geotechnical professionals. It is therefore considered that the data
presented are devoid of individual bias and judgemental errors.
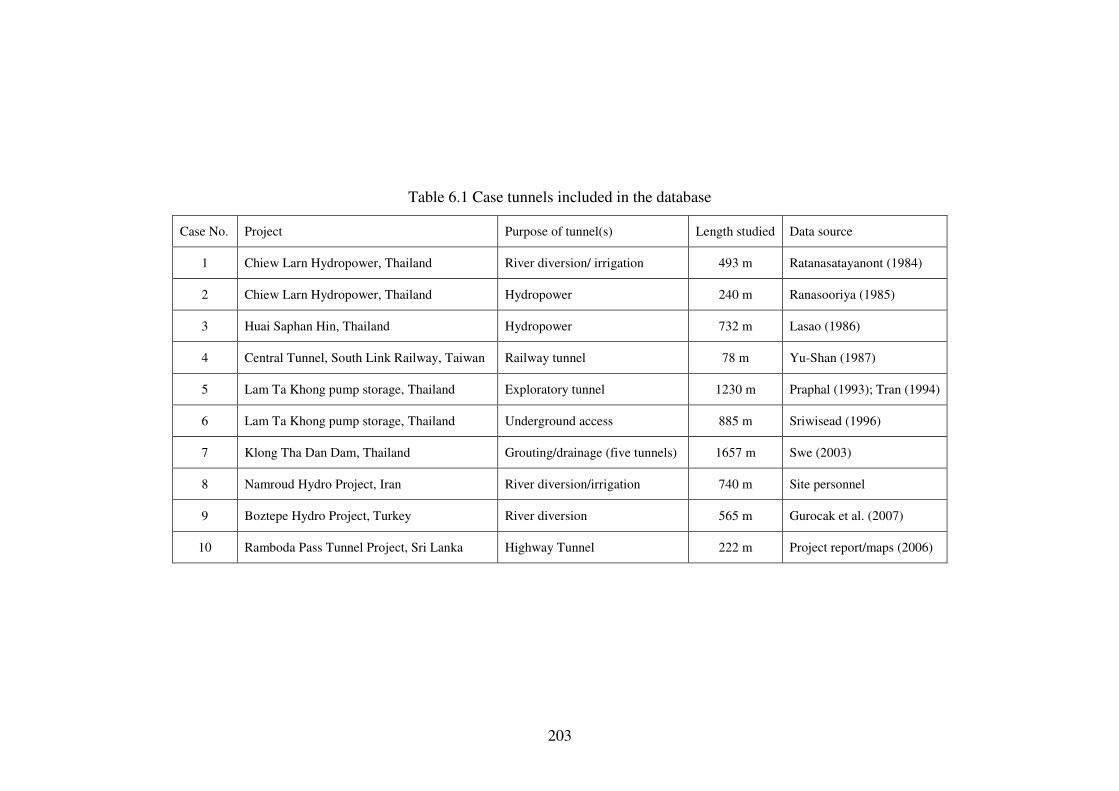
203
Table 6.1 Case tunnels included in the database
Case No. Project Purpose of tunnel(s) Length studied Data source
1 Chiew Larn Hydropower, Thailand River diversion/ irrigation 493 m Ratanasatayanont (1984)
2 Chiew Larn Hydropower, Thailand Hydropower 240 m Ranasooriya (1985)
3 Huai Saphan Hin, Thailand Hydropower 732 m Lasao (1986)
4 Central Tunnel, South Link Railway, Taiwan Railway tunnel 78 m Yu-Shan (1987)
5 Lam Ta Khong pump storage, Thailand Exploratory tunnel 1230 m Praphal (1993); Tran (1994)
6 Lam Ta Khong pump storage, Thailand Underground access 885 m Sriwisead (1996)
7 Klong Tha Dan Dam, Thailand Grouting/drainage (five tunnels) 1657 m Swe (2003)
8 Namroud Hydro Project, Iran River diversion/irrigation 740 m Site personnel
9 Boztepe Hydro Project, Turkey River diversion 565 m Gurocak et al. (2007)
10 Ramboda Pass Tunnel Project, Sri Lanka Highway Tunnel 222 m Project report/maps (2006)
204
6.3 CASE STUDY 1:
The Chiew Larn Diversion (CLD) Tunnel, Chiew Larn Hydro Project, Thailand
The Chiew Larn project is a multipurpose water resources development project
located in the Southern Province of Thailand, constructed between 1984 and 1986.
The project comprised a 95 m high rock/earth main dam built across the Klong
Saeng River, a 240 MW power station, a 493 m long diversion tunnel, and a 240 m
long hydropower tunnel. The main purposes of the project are power generation,
irrigation and groundwater salinity control by maximising the use of the Klong
Saeng River flow. Additional benefits of the project include flood control, river
pollution control, transportation, recreation and fishing.
The excavated diameter of the 493 m long CLD tunnel was 11.3 with an internal
finished diameter of 10 m. Located in a ridge and running parallel to the ridge line,
the tunnel has an overburden of 40 to 80 m with an average of about 60 m. Its
general alignment is NW-SE with a 0.2% down gradient towards SE.
The horseshoe shaped CLD tunnel was constructed for two purposes: (a) to
temporarily divert the Klong Saeng River to facilitate the construction of the main
dam; and (b) as an irrigation water supply tunnel for downstream users. To fulfil the
second purpose, after the completion of the main dam construction, the tunnel was
plugged at approximately 105 m from the inlet and below the centreline of the main
dam, which crosses the tunnel alignment. An irrigation outlet valve was provided in
the plug. After filling the reservoir, the tunnel length upstream of the plug functions
as a pressure tunnel under a hydraulic head equivalent to the reservoir level, which
has a maximum elevation of 95 m RL (The tunnel invert level is approximately 10 m
RL). In contrast the tunnel length downstream of the plug has an external water
pressure equivalent to the groundwater level artificially elevated by the reservoir, and
functions as a groundwater sink. During construction groundwater flow into the
tunnel was generally nil to low, except for some isolated areas of water flow during
the wet season.
205
6.3.1 Project Site Geology
The project area consists of clastic rocks of the Kanchanaburi group which includes
greywacke, sandstone, pebbly sandstone, shale, mudstone and quartzite of Silurian to
Permocarboniferous age. Intrusive quartz veins are widespread in the rock
formation. The regional geological structures include major transcurrent faults
which occurred in the Jurassic-Cretaceous period with 20 to 150 km displacements.
These major regional faults do not traverse through the project area, but they caused
other minor geological structures including minor faults striking NW-SE in the
project area.
6.3.2 CLD Tunnel Rock Mass Data
Two rock types are present along the CLD tunnel: greywacke and subarkosic
sandstone, with the former being the main rock type. Greywacke composed of silts,
very fine sand and clay matrix with megaclasts of quartz, feldspar, chert, calcareous
and granite rock fragments of 1 to 70 mm in diameter. Subarkosic sandstone is
present as layers or lenses of less than 30 m in thickness within greywacke and has
sharp contacts with the latter. This rock is composed of very fine to medium grained
quartz and feldspar which are fused together with siliceous cement. The top 5 m of
the 40 to 50 m thick overburden comprised completely weathered rock and residual
soil materials.
The tunnel is located below the regional groundwater table, but pockets of perched
water appeared to be present. During the dry season groundwater flow into the
tunnel was generally low and did not affect construction. An increase in the
groundwater inflow through crushed zones and very persistent discontinuities in the
rock mass was evident during the wet season. This was interpreted as an indication
of relatively high hydraulic conductivity of the rock mass surrounding the tunnel.
During the excavation, a suite of tests was conducted to determine the engineering
properties of intact rock material in the tunnel, the results of which are given in Table
6.2. Based on the testing the main rock type (greywacke) is described as fresh,
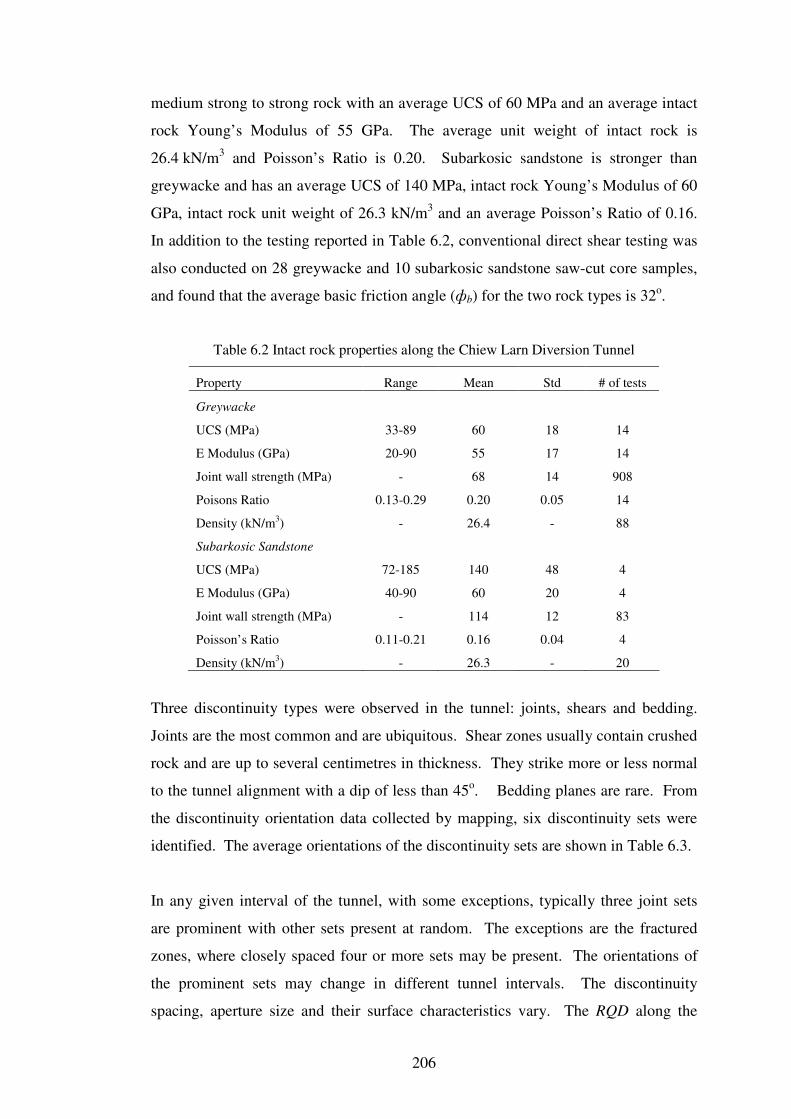
206
medium strong to strong rock with an average UCS of 60 MPa and an average intact
rock Young’s Modulus of 55 GPa. The average unit weight of intact rock is
26.4 kN/m3 and Poisson’s Ratio is 0.20. Subarkosic sandstone is stronger than
greywacke and has an average UCS of 140 MPa, intact rock Young’s Modulus of 60
GPa, intact rock unit weight of 26.3 kN/m3 and an average Poisson’s Ratio of 0.16.
In addition to the testing reported in Table 6.2, conventional direct shear testing was
also conducted on 28 greywacke and 10 subarkosic sandstone saw-cut core samples,
and found that the average basic friction angle (фb) for the two rock types is 32o.
Table 6.2 Intact rock properties along the Chiew Larn Diversion Tunnel
Property Range Mean Std # of tests
Greywacke
UCS (MPa) 33-89 60 18 14
E Modulus (GPa) 20-90 55 17 14
Joint wall strength (MPa) - 68 14 908
Poisons Ratio 0.13-0.29 0.20 0.05 14
Density (kN/m3) - 26.4 - 88
Subarkosic Sandstone
UCS (MPa) 72-185 140 48 4
E Modulus (GPa) 40-90 60 20 4
Joint wall strength (MPa) - 114 12 83
Poisson’s Ratio 0.11-0.21 0.16 0.04 4
Density (kN/m3) - 26.3 - 20
Three discontinuity types were observed in the tunnel: joints, shears and bedding.
Joints are the most common and are ubiquitous. Shear zones usually contain crushed
rock and are up to several centimetres in thickness. They strike more or less normal
to the tunnel alignment with a dip of less than 45o. Bedding planes are rare. From
the discontinuity orientation data collected by mapping, six discontinuity sets were
identified. The average orientations of the discontinuity sets are shown in Table 6.3.
In any given interval of the tunnel, with some exceptions, typically three joint sets
are prominent with other sets present at random. The exceptions are the fractured
zones, where closely spaced four or more sets may be present. The orientations of
the prominent sets may change in different tunnel intervals. The discontinuity
spacing, aperture size and their surface characteristics vary. The RQD along the
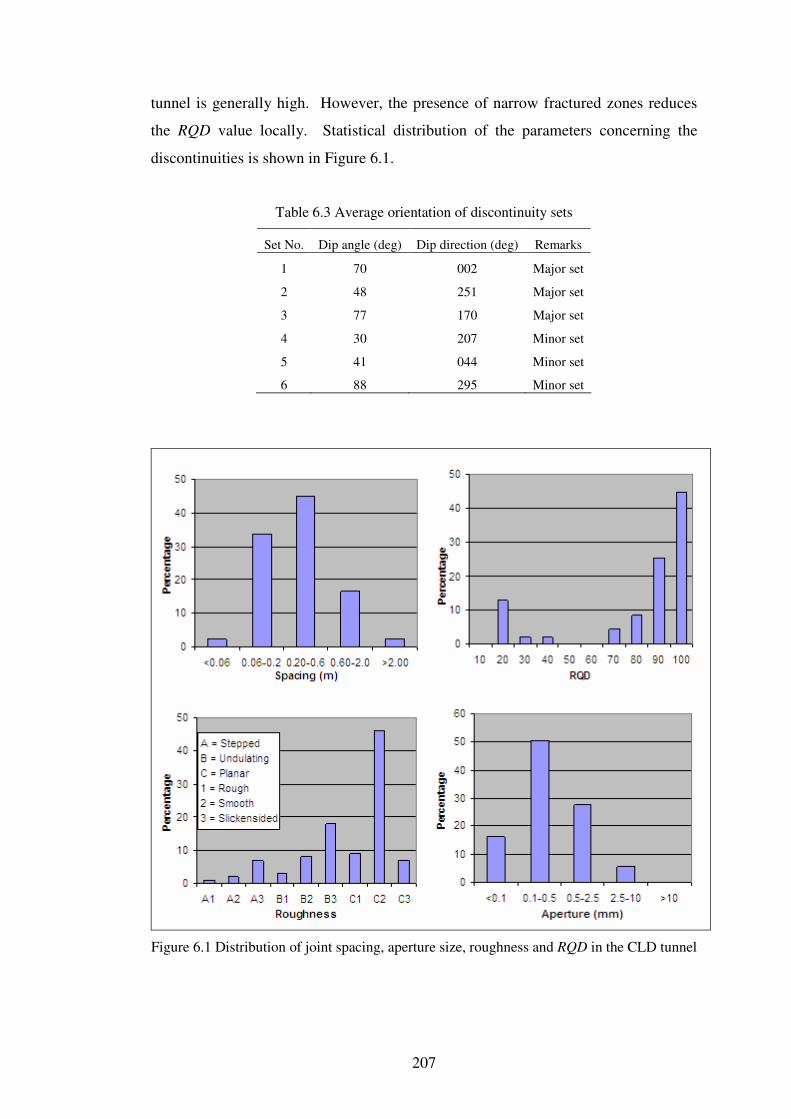
207
tunnel is generally high. However, the presence of narrow fractured zones reduces
the RQD value locally. Statistical distribution of the parameters concerning the
discontinuities is shown in Figure 6.1.
Table 6.3 Average orientation of discontinuity sets
Set No. Dip angle (deg) Dip direction (deg) Remarks
1 70 002 Major set
2 48 251 Major set
3 77 170 Major set
4 30 207 Minor set
5 41 044 Minor set
6 88 295 Minor set
Figure 6.1 Distribution of joint spacing, aperture size, roughness and RQD in the CLD tunnel
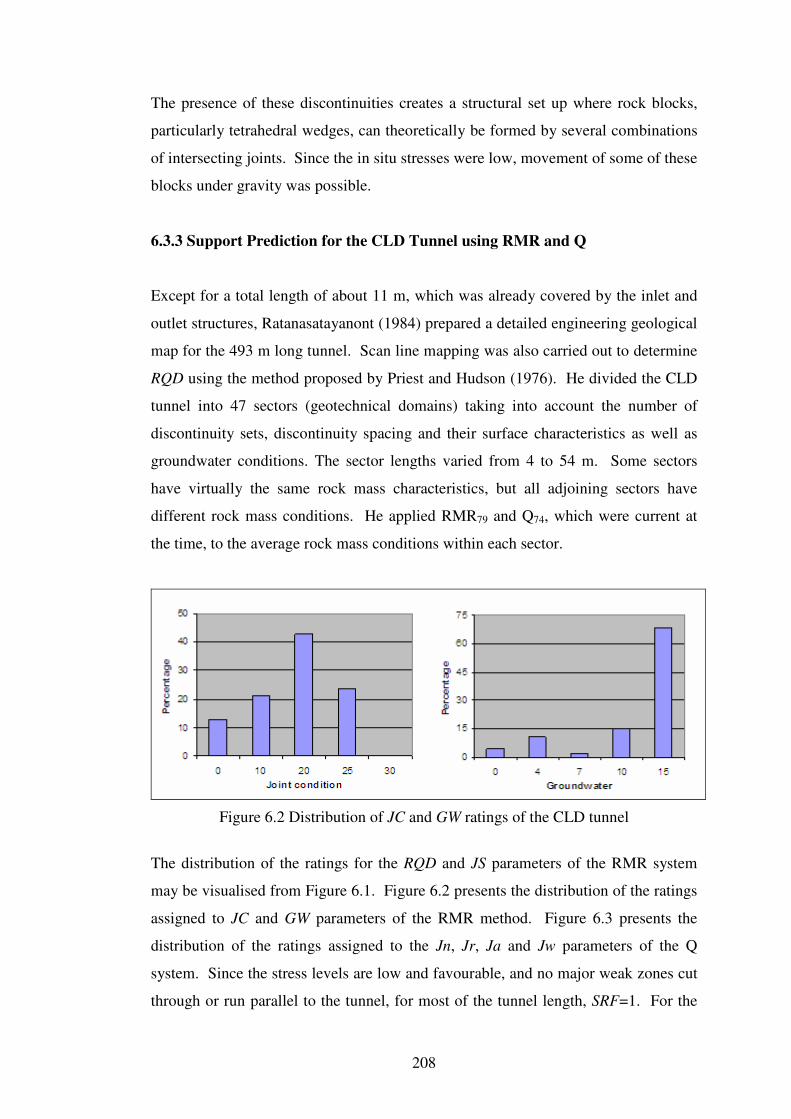
208
The presence of these discontinuities creates a structural set up where rock blocks,
particularly tetrahedral wedges, can theoretically be formed by several combinations
of intersecting joints. Since the in situ stresses were low, movement of some of these
blocks under gravity was possible.
6.3.3 Support Prediction for the CLD Tunnel using RMR and Q
Except for a total length of about 11 m, which was already covered by the inlet and
outlet structures, Ratanasatayanont (1984) prepared a detailed engineering geological
map for the 493 m long tunnel. Scan line mapping was also carried out to determine
RQD using the method proposed by Priest and Hudson (1976). He divided the CLD
tunnel into 47 sectors (geotechnical domains) taking into account the number of
discontinuity sets, discontinuity spacing and their surface characteristics as well as
groundwater conditions. The sector lengths varied from 4 to 54 m. Some sectors
have virtually the same rock mass characteristics, but all adjoining sectors have
different rock mass conditions. He applied RMR79 and Q74, which were current at
the time, to the average rock mass conditions within each sector.
Figure 6.2 Distribution of JC and GW ratings of the CLD tunnel
The distribution of the ratings for the RQD and JS parameters of the RMR system
may be visualised from Figure 6.1. Figure 6.2 presents the distribution of the ratings
assigned to JC and GW parameters of the RMR method. Figure 6.3 presents the
distribution of the ratings assigned to the Jn, Jr, Ja and Jw parameters of the Q
system. Since the stress levels are low and favourable, and no major weak zones cut
through or run parallel to the tunnel, for most of the tunnel length, SRF=1. For the
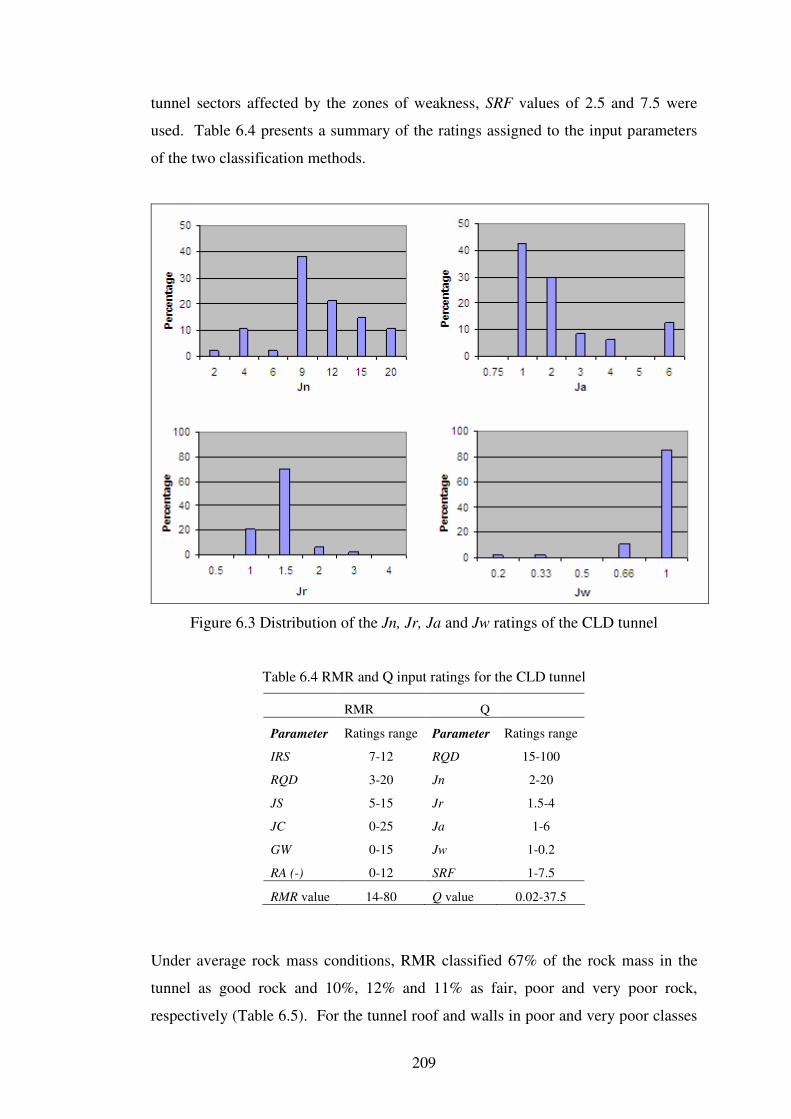
209
tunnel sectors affected by the zones of weakness, SRF values of 2.5 and 7.5 were
used. Table 6.4 presents a summary of the ratings assigned to the input parameters
of the two classification methods.
Figure 6.3 Distribution of the Jn, Jr, Ja and Jw ratings of the CLD tunnel
Table 6.4 RMR and Q input ratings for the CLD tunnel
RMR Q
Parameter Ratings range Parameter Ratings range
IRS 7-12 RQD 15-100
RQD 3-20 Jn 2-20
JS 5-15 Jr 1.5-4
JC 0-25 Ja 1-6
GW 0-15 Jw 1-0.2
RA (-) 0-12 SRF 1-7.5
RMR value 14-80 Q value 0.02-37.5
Under average rock mass conditions, RMR classified 67% of the rock mass in the
tunnel as good rock and 10%, 12% and 11% as fair, poor and very poor rock,
respectively (Table 6.5). For the tunnel roof and walls in poor and very poor classes
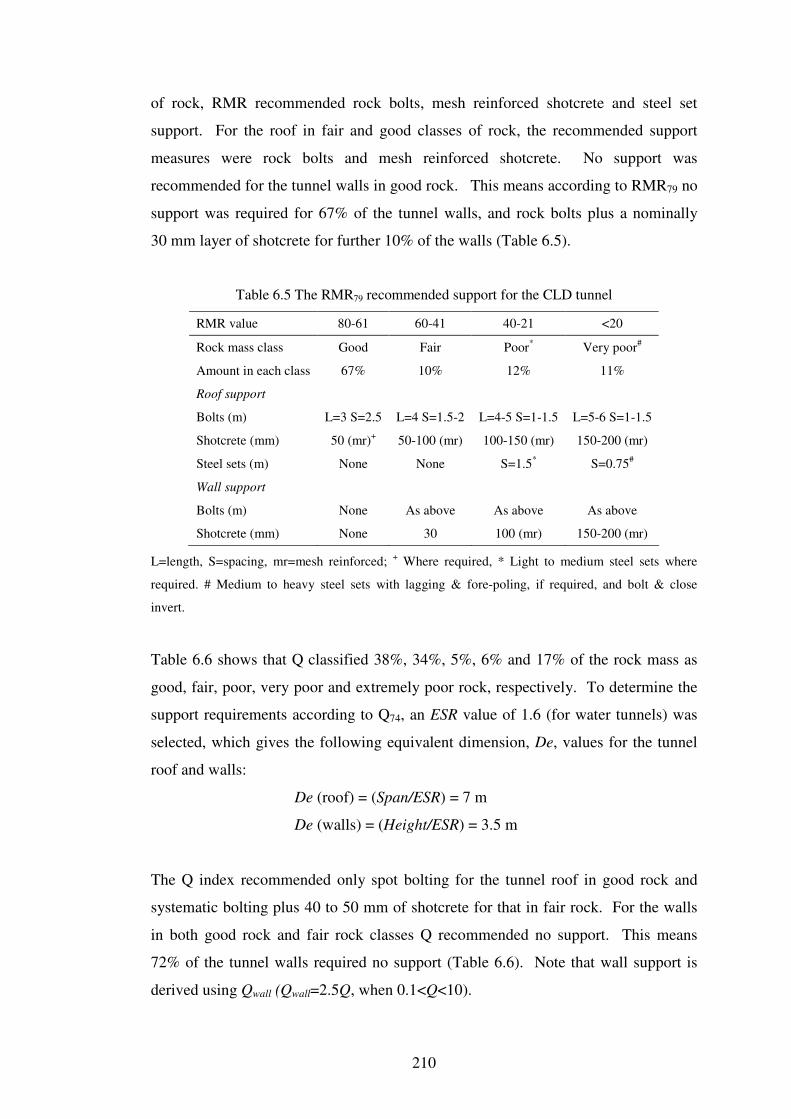
210
of rock, RMR recommended rock bolts, mesh reinforced shotcrete and steel set
support. For the roof in fair and good classes of rock, the recommended support
measures were rock bolts and mesh reinforced shotcrete. No support was
recommended for the tunnel walls in good rock. This means according to RMR79 no
support was required for 67% of the tunnel walls, and rock bolts plus a nominally
30 mm layer of shotcrete for further 10% of the walls (Table 6.5).
Table 6.5 The RMR79 recommended support for the CLD tunnel
RMR value 80-61 60-41 40-21 <20
Rock mass class Good Fair Poor*
Very poor#
Amount in each class 67% 10% 12% 11%
Roof support
Bolts (m) L=3 S=2.5 L=4 S=1.5-2 L=4-5 S=1-1.5 L=5-6 S=1-1.5
Shotcrete (mm) 50 (mr)+ 50-100 (mr) 100-150 (mr) 150-200 (mr)
Steel sets (m) None None S=1.5*
S=0.75#
Wall support
Bolts (m) None As above As above As above
Shotcrete (mm) None 30 100 (mr) 150-200 (mr)
L=length, S=spacing, mr=mesh reinforced; + Where required, * Light to medium steel sets where
required. # Medium to heavy steel sets with lagging & fore-poling, if required, and bolt & close
invert.
Table 6.6 shows that Q classified 38%, 34%, 5%, 6% and 17% of the rock mass as
good, fair, poor, very poor and extremely poor rock, respectively. To determine the
support requirements according to Q74, an ESR value of 1.6 (for water tunnels) was
selected, which gives the following equivalent dimension, De, values for the tunnel
roof and walls:
De (roof) = (Span/ESR) = 7 m
De (walls) = (Height/ESR) = 3.5 m
The Q index recommended only spot bolting for the tunnel roof in good rock and
systematic bolting plus 40 to 50 mm of shotcrete for that in fair rock. For the walls
in both good rock and fair rock classes Q recommended no support. This means
72% of the tunnel walls required no support (Table 6.6). Note that wall support is
derived using Qwall (Qwall=2.5Q, when 0.1<Q<10).
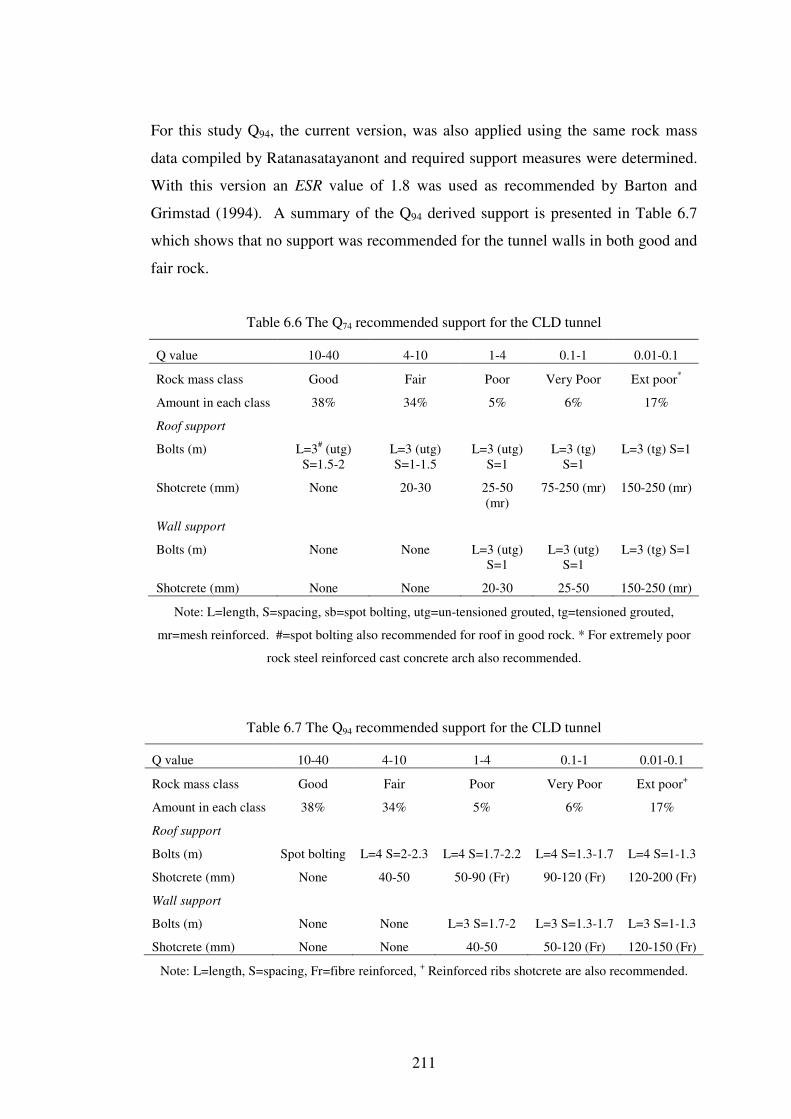
211
For this study Q94, the current version, was also applied using the same rock mass
data compiled by Ratanasatayanont and required support measures were determined.
With this version an ESR value of 1.8 was used as recommended by Barton and
Grimstad (1994). A summary of the Q94 derived support is presented in Table 6.7
which shows that no support was recommended for the tunnel walls in both good and
fair rock.
Table 6.6 The Q74 recommended support for the CLD tunnel
Q value 10-40 4-10 1-4 0.1-1 0.01-0.1
Rock mass class Good Fair Poor Very Poor Ext poor*
Amount in each class 38% 34% 5% 6% 17%
Roof support
Bolts (m) L=3# (utg)
S=1.5-2
L=3 (utg)
S=1-1.5
L=3 (utg)
S=1
L=3 (tg)
S=1
L=3 (tg) S=1
Shotcrete (mm) None 20-30 25-50
(mr)
75-250 (mr) 150-250 (mr)
Wall support
Bolts (m) None None L=3 (utg)
S=1
L=3 (utg)
S=1
L=3 (tg) S=1
Shotcrete (mm) None None 20-30 25-50 150-250 (mr)
Note: L=length, S=spacing, sb=spot bolting, utg=un-tensioned grouted, tg=tensioned grouted,
mr=mesh reinforced. #=spot bolting also recommended for roof in good rock. * For extremely poor
rock steel reinforced cast concrete arch also recommended.
Table 6.7 The Q94 recommended support for the CLD tunnel
Q value 10-40 4-10 1-4 0.1-1 0.01-0.1
Rock mass class Good Fair Poor Very Poor Ext poor+
Amount in each class 38% 34% 5% 6% 17%
Roof support
Bolts (m) Spot bolting L=4 S=2-2.3 L=4 S=1.7-2.2 L=4 S=1.3-1.7 L=4 S=1-1.3
Shotcrete (mm) None 40-50 50-90 (Fr) 90-120 (Fr) 120-200 (Fr)
Wall support
Bolts (m) None None L=3 S=1.7-2 L=3 S=1.3-1.7 L=3 S=1-1.3
Shotcrete (mm) None None 40-50 50-120 (Fr) 120-150 (Fr)
Note: L=length, S=spacing, Fr=fibre reinforced, + Reinforced ribs shotcrete are also recommended.
212
Classification of the rock mass using RMR89 yielded the same ratings as those of
RMR79 because the changes in the former have no direct effect on the rock mass
interested in the CLD tunnel. Therefore the support recommendations of the current
version, RMR89, are the same as those of RMR79.
6.3.4 Tetrahedral Wedge Stability Analysis
As mentioned in Section 6.2.2, the intersecting sets of joints in the rock mass could
create kinematically unstable tetrahedral rock wedges at the periphery of the tunnel.
Since the tunnel is shallow and the in situ stresses are low, movement of these rock
blocks under gravity is possible. The kinematically unstable rock wedges were
identified and their stability under the empirically recommended support measures
was analysed using UNWEDGE. Since the tunnel overburden is between 40 and
80 m, two stress scenarios were considered in the analysis. The first assumed that
the wedges are subjected to gravity loading only with no effect from the in situ stress
field. The second included an inferred in situ stress field; the stress field was
assumed to be due to the weight of the overlying rock with the horizontal to vertical
stress ratio k=σh/σv=1.5.
6.3.4.1 Shear strength parameters of joints
Potentially unstable rock wedges may be present in either the most favourable or the
most unfavourable ground conditions in the tunnel. To take this into account, three
joint shear strength scenarios representing different rock mass conditions were
considered in the wedge analysis. The first scenario shear strength parameters,
representing a best case (with no clay filling in joints), were estimated using the
shear strength relationship of Barton and Choubey (1977) given in Equation 2.7 and
discussed in Section 2.5.2.
τp = σn tan {Φb + JRC Log10(JCS/σn)} (2.7)
where τp=shear strength; σn=joint normal stress; Φb=basic friction angle; JRC=joint
roughness coefficient; and JCS=joint compressive strength.
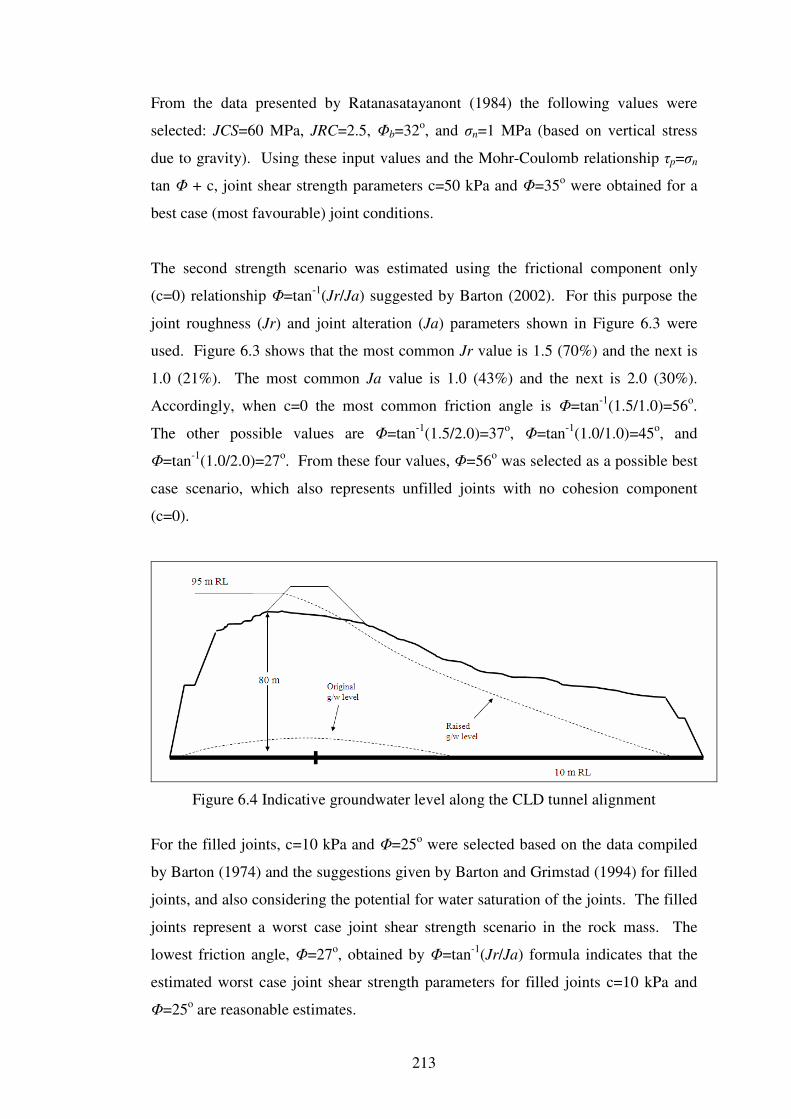
213
From the data presented by Ratanasatayanont (1984) the following values were
selected: JCS=60 MPa, JRC=2.5, Φb=32o, and σn=1 MPa (based on vertical stress
due to gravity). Using these input values and the Mohr-Coulomb relationship τp=σn
tan Φ + c, joint shear strength parameters c=50 kPa and Φ=35o were obtained for a
best case (most favourable) joint conditions.
The second strength scenario was estimated using the frictional component only
(c=0) relationship Φ=tan-1
(Jr/Ja) suggested by Barton (2002). For this purpose the
joint roughness (Jr) and joint alteration (Ja) parameters shown in Figure 6.3 were
used. Figure 6.3 shows that the most common Jr value is 1.5 (70%) and the next is
1.0 (21%). The most common Ja value is 1.0 (43%) and the next is 2.0 (30%).
Accordingly, when c=0 the most common friction angle is Φ=tan-1
(1.5/1.0)=56o.
The other possible values are Φ=tan-1
(1.5/2.0)=37o, Φ=tan
-1(1.0/1.0)=45
o, and
Φ=tan-1
(1.0/2.0)=27o. From these four values, Φ=56
o was selected as a possible best
case scenario, which also represents unfilled joints with no cohesion component
(c=0).
Figure 6.4 Indicative groundwater level along the CLD tunnel alignment
For the filled joints, c=10 kPa and Φ=25o were selected based on the data compiled
by Barton (1974) and the suggestions given by Barton and Grimstad (1994) for filled
joints, and also considering the potential for water saturation of the joints. The filled
joints represent a worst case joint shear strength scenario in the rock mass. The
lowest friction angle, Φ=27o, obtained by Φ=tan
-1(Jr/Ja) formula indicates that the
estimated worst case joint shear strength parameters for filled joints c=10 kPa and
Φ=25o are reasonable estimates.
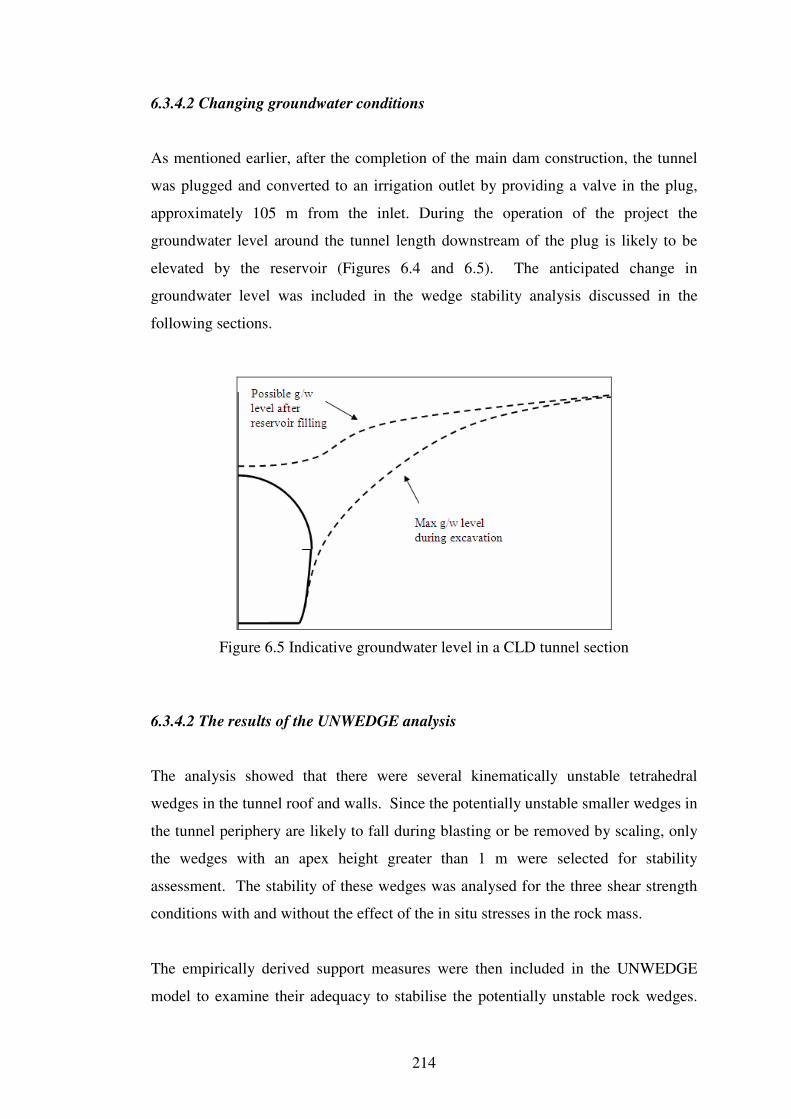
214
6.3.4.2 Changing groundwater conditions
As mentioned earlier, after the completion of the main dam construction, the tunnel
was plugged and converted to an irrigation outlet by providing a valve in the plug,
approximately 105 m from the inlet. During the operation of the project the
groundwater level around the tunnel length downstream of the plug is likely to be
elevated by the reservoir (Figures 6.4 and 6.5). The anticipated change in
groundwater level was included in the wedge stability analysis discussed in the
following sections.
Figure 6.5 Indicative groundwater level in a CLD tunnel section
6.3.4.2 The results of the UNWEDGE analysis
The analysis showed that there were several kinematically unstable tetrahedral
wedges in the tunnel roof and walls. Since the potentially unstable smaller wedges in
the tunnel periphery are likely to fall during blasting or be removed by scaling, only
the wedges with an apex height greater than 1 m were selected for stability
assessment. The stability of these wedges was analysed for the three shear strength
conditions with and without the effect of the in situ stresses in the rock mass.
The empirically derived support measures were then included in the UNWEDGE
model to examine their adequacy to stabilise the potentially unstable rock wedges.
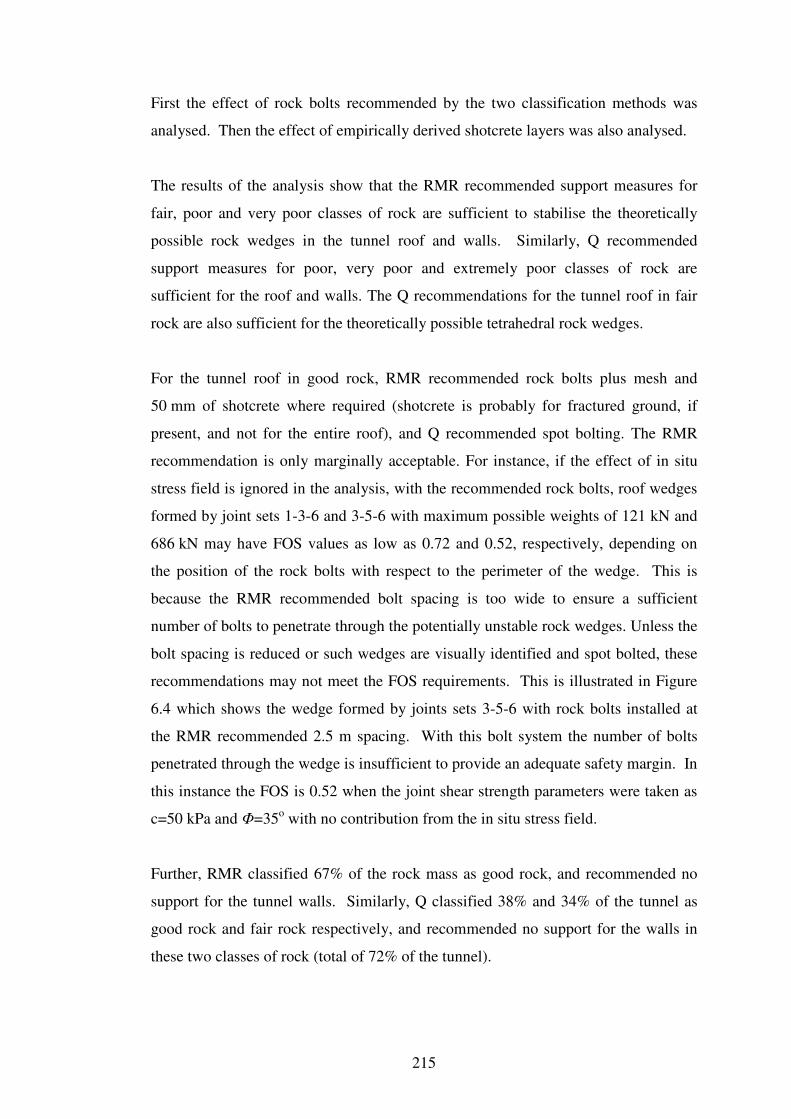
215
First the effect of rock bolts recommended by the two classification methods was
analysed. Then the effect of empirically derived shotcrete layers was also analysed.
The results of the analysis show that the RMR recommended support measures for
fair, poor and very poor classes of rock are sufficient to stabilise the theoretically
possible rock wedges in the tunnel roof and walls. Similarly, Q recommended
support measures for poor, very poor and extremely poor classes of rock are
sufficient for the roof and walls. The Q recommendations for the tunnel roof in fair
rock are also sufficient for the theoretically possible tetrahedral rock wedges.
For the tunnel roof in good rock, RMR recommended rock bolts plus mesh and
50 mm of shotcrete where required (shotcrete is probably for fractured ground, if
present, and not for the entire roof), and Q recommended spot bolting. The RMR
recommendation is only marginally acceptable. For instance, if the effect of in situ
stress field is ignored in the analysis, with the recommended rock bolts, roof wedges
formed by joint sets 1-3-6 and 3-5-6 with maximum possible weights of 121 kN and
686 kN may have FOS values as low as 0.72 and 0.52, respectively, depending on
the position of the rock bolts with respect to the perimeter of the wedge. This is
because the RMR recommended bolt spacing is too wide to ensure a sufficient
number of bolts to penetrate through the potentially unstable rock wedges. Unless the
bolt spacing is reduced or such wedges are visually identified and spot bolted, these
recommendations may not meet the FOS requirements. This is illustrated in Figure
6.4 which shows the wedge formed by joints sets 3-5-6 with rock bolts installed at
the RMR recommended 2.5 m spacing. With this bolt system the number of bolts
penetrated through the wedge is insufficient to provide an adequate safety margin. In
this instance the FOS is 0.52 when the joint shear strength parameters were taken as
c=50 kPa and Φ=35o with no contribution from the in situ stress field.
Further, RMR classified 67% of the rock mass as good rock, and recommended no
support for the tunnel walls. Similarly, Q classified 38% and 34% of the tunnel as
good rock and fair rock respectively, and recommended no support for the walls in
these two classes of rock (total of 72% of the tunnel).
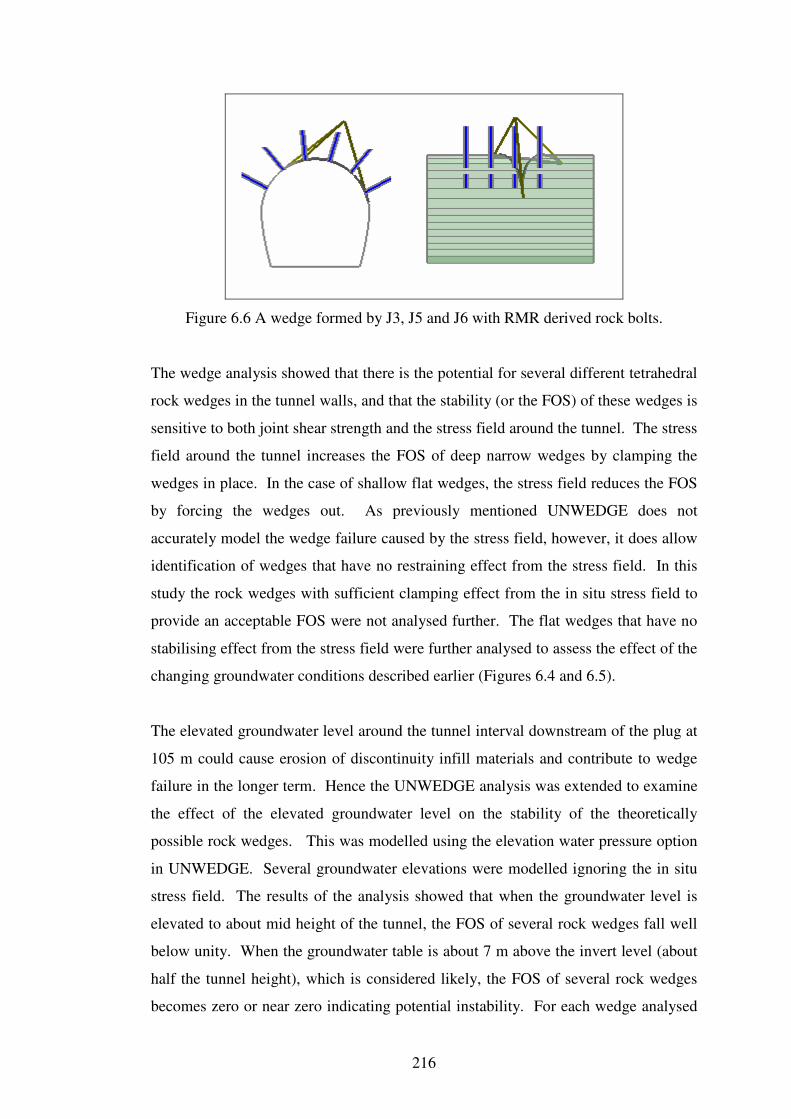
216
Figure 6.6 A wedge formed by J3, J5 and J6 with RMR derived rock bolts.
The wedge analysis showed that there is the potential for several different tetrahedral
rock wedges in the tunnel walls, and that the stability (or the FOS) of these wedges is
sensitive to both joint shear strength and the stress field around the tunnel. The stress
field around the tunnel increases the FOS of deep narrow wedges by clamping the
wedges in place. In the case of shallow flat wedges, the stress field reduces the FOS
by forcing the wedges out. As previously mentioned UNWEDGE does not
accurately model the wedge failure caused by the stress field, however, it does allow
identification of wedges that have no restraining effect from the stress field. In this
study the rock wedges with sufficient clamping effect from the in situ stress field to
provide an acceptable FOS were not analysed further. The flat wedges that have no
stabilising effect from the stress field were further analysed to assess the effect of the
changing groundwater conditions described earlier (Figures 6.4 and 6.5).
The elevated groundwater level around the tunnel interval downstream of the plug at
105 m could cause erosion of discontinuity infill materials and contribute to wedge
failure in the longer term. Hence the UNWEDGE analysis was extended to examine
the effect of the elevated groundwater level on the stability of the theoretically
possible rock wedges. This was modelled using the elevation water pressure option
in UNWEDGE. Several groundwater elevations were modelled ignoring the in situ
stress field. The results of the analysis showed that when the groundwater level is
elevated to about mid height of the tunnel, the FOS of several rock wedges fall well
below unity. When the groundwater table is about 7 m above the invert level (about
half the tunnel height), which is considered likely, the FOS of several rock wedges
becomes zero or near zero indicating potential instability. For each wedge analysed
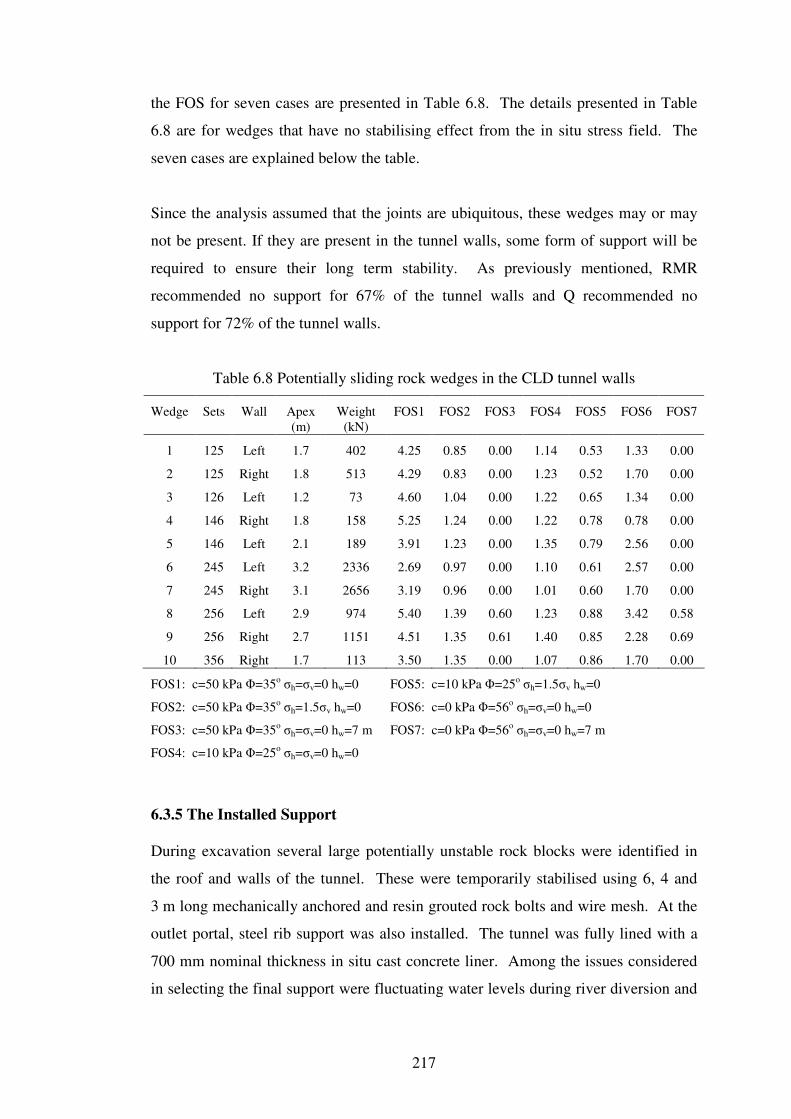
217
the FOS for seven cases are presented in Table 6.8. The details presented in Table
6.8 are for wedges that have no stabilising effect from the in situ stress field. The
seven cases are explained below the table.
Since the analysis assumed that the joints are ubiquitous, these wedges may or may
not be present. If they are present in the tunnel walls, some form of support will be
required to ensure their long term stability. As previously mentioned, RMR
recommended no support for 67% of the tunnel walls and Q recommended no
support for 72% of the tunnel walls.
Table 6.8 Potentially sliding rock wedges in the CLD tunnel walls
Wedge Sets Wall Apex
(m)
Weight
(kN)
FOS1 FOS2 FOS3 FOS4 FOS5 FOS6 FOS7
1 125 Left 1.7 402 4.25 0.85 0.00 1.14 0.53 1.33 0.00
2 125 Right 1.8 513 4.29 0.83 0.00 1.23 0.52 1.70 0.00
3 126 Left 1.2 73 4.60 1.04 0.00 1.22 0.65 1.34 0.00
4 146 Right 1.8 158 5.25 1.24 0.00 1.22 0.78 0.78 0.00
5 146 Left 2.1 189 3.91 1.23 0.00 1.35 0.79 2.56 0.00
6 245 Left 3.2 2336 2.69 0.97 0.00 1.10 0.61 2.57 0.00
7 245 Right 3.1 2656 3.19 0.96 0.00 1.01 0.60 1.70 0.00
8 256 Left 2.9 974 5.40 1.39 0.60 1.23 0.88 3.42 0.58
9 256 Right 2.7 1151 4.51 1.35 0.61 1.40 0.85 2.28 0.69
10 356 Right 1.7 113 3.50 1.35 0.00 1.07 0.86 1.70 0.00
FOS1: c=50 kPa Φ=35o σh=σv=0 hw=0 FOS5: c=10 kPa Φ=25
o σh=1.5σv hw=0
FOS2: c=50 kPa Φ=35o σh=1.5σv hw=0 FOS6: c=0 kPa Φ=56
o σh=σv=0 hw=0
FOS3: c=50 kPa Φ=35o σh=σv=0 hw=7 m FOS7: c=0 kPa Φ=56
o σh=σv=0 hw=7 m
FOS4: c=10 kPa Φ=25o σh=σv=0 hw=0
6.3.5 The Installed Support
During excavation several large potentially unstable rock blocks were identified in
the roof and walls of the tunnel. These were temporarily stabilised using 6, 4 and
3 m long mechanically anchored and resin grouted rock bolts and wire mesh. At the
outlet portal, steel rib support was also installed. The tunnel was fully lined with a
700 mm nominal thickness in situ cast concrete liner. Among the issues considered
in selecting the final support were fluctuating water levels during river diversion and
218
an increase in groundwater pressure around the tunnel after the reservoir filling.
Both could cause erosion of joint filling material, which in turn could lead to
instability in the tunnel.
6.3.6 Discussion
In general, both rock mass classification methods recommended adequate support
measures for the entire tunnel roof. The two methods did not recommend any
support for a significant length of the walls in this tunnel. Tetrahedral rock wedge
analysis showed that several wedges are kinematically possible in the tunnel walls.
The stability of these wedges depends on the joint surface characteristics and the
magnitude and direction of stresses in the rock mass. While these wedges may be
stable in general, the sensitivity analysis showed that when the groundwater level is
artificially elevated by the creation of the reservoir, the wedges listed in Table 6.8
could become unstable. This is a changing loading scenario which needs
consideration for support design.
The limitations of the rock mass classification methods for tunnels subjected to
changing loading conditions, in both civil and mining projects, are known and were
discussed in detail by Speers (1992). He concluded that “the use of empirical
support design methods such as the RMR-method and Q-method will lead to under
designs …” and consequently recommended analytical approaches for such
situations. For mining excavations with changing stress conditions, Mikula and Lee
(2003) showed that Q can be applied by adjusting the SRF rating to reflect the
expected future stress conditions. Similarly, the change in groundwater level
subsequent to the construction of a tunnel may be accounted for by adjusting the Jw
rating of Q (and ground water rating of RMR) to reflect the anticipated groundwater
pressure. However, the artificially elevated groundwater head considered in the
analysis of the CLD tunnel is not high enough to downgrade the Jw rating. It falls
within the minor inflow/pressure range and receives a Jw rating of 1, which means
no change. With RMR, the inferred groundwater pressure lowers the overall rating
by three points. But this does not significantly change the recommended support.
219
6.3.7 Conclusion
Both RMR and Q methods recommended adequate support measures for the rock
wedge instability in the tunnel roof. An exception is the roof in good rock where
RMR recommended bolt spacing is too wide for some of the potentially unstable
rock wedges identified by wedge analysis.
The two methods did not recommend any support for a significant length (RMR 67%
and Q 72%) of the tunnel walls where rock wedges were identified during excavation
and supported with rock bolts. The tetrahedral rock wedge analysis confirmed the
presence of kinematically unstable rock wedges in the tunnel walls. The analysis
showed that the RMR and Q recommendations were not sufficient to stabilise the
potentially unstable rock wedges in the CLD tunnel walls, particularly under the
artificially elevated groundwater levels.
For long term stability and project specific requirements, the support installed
exceeded those recommended by the RMR and Q methods.
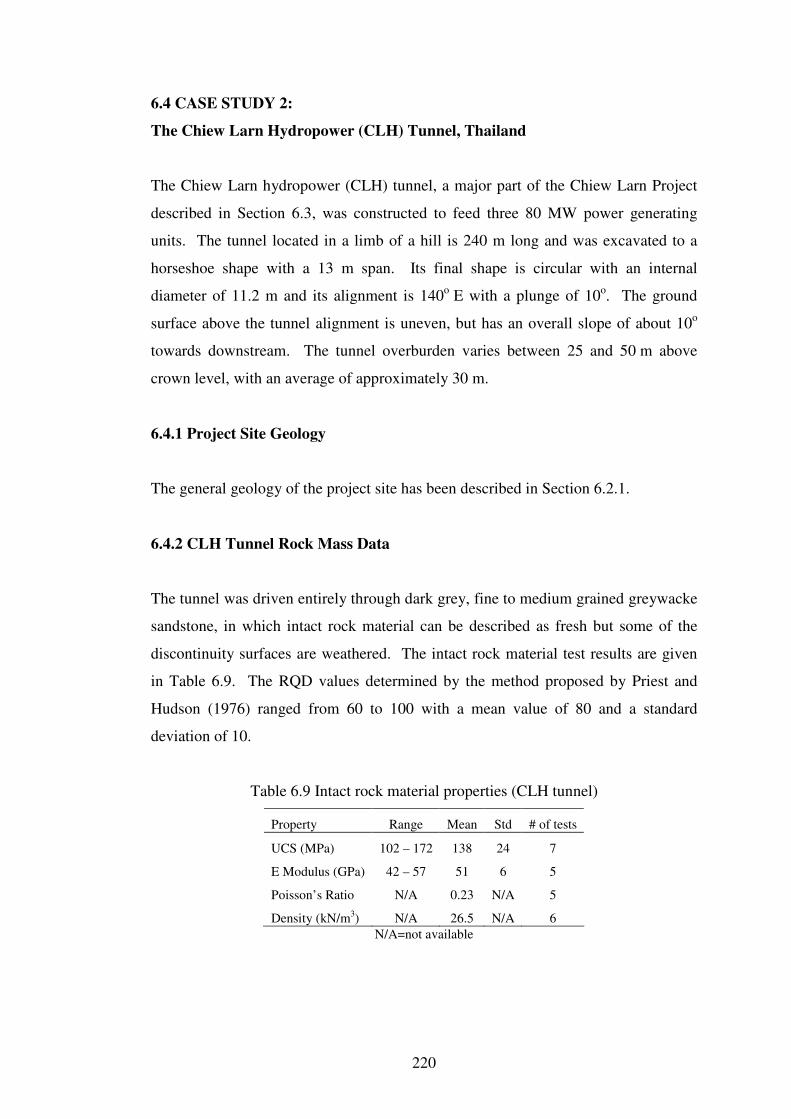
220
6.4 CASE STUDY 2:
The Chiew Larn Hydropower (CLH) Tunnel, Thailand
The Chiew Larn hydropower (CLH) tunnel, a major part of the Chiew Larn Project
described in Section 6.3, was constructed to feed three 80 MW power generating
units. The tunnel located in a limb of a hill is 240 m long and was excavated to a
horseshoe shape with a 13 m span. Its final shape is circular with an internal
diameter of 11.2 m and its alignment is 140o
E with a plunge of 10o. The ground
surface above the tunnel alignment is uneven, but has an overall slope of about 10o
towards downstream. The tunnel overburden varies between 25 and 50 m above
crown level, with an average of approximately 30 m.
6.4.1 Project Site Geology
The general geology of the project site has been described in Section 6.2.1.
6.4.2 CLH Tunnel Rock Mass Data
The tunnel was driven entirely through dark grey, fine to medium grained greywacke
sandstone, in which intact rock material can be described as fresh but some of the
discontinuity surfaces are weathered. The intact rock material test results are given
in Table 6.9. The RQD values determined by the method proposed by Priest and
Hudson (1976) ranged from 60 to 100 with a mean value of 80 and a standard
deviation of 10.
Table 6.9 Intact rock material properties (CLH tunnel)
Property Range Mean Std # of tests
UCS (MPa) 102 – 172 138 24 7
E Modulus (GPa) 42 – 57 51 6 5
Poisson’s Ratio N/A 0.23 N/A 5
Density (kN/m3) N/A 26.5 N/A 6
N/A=not available
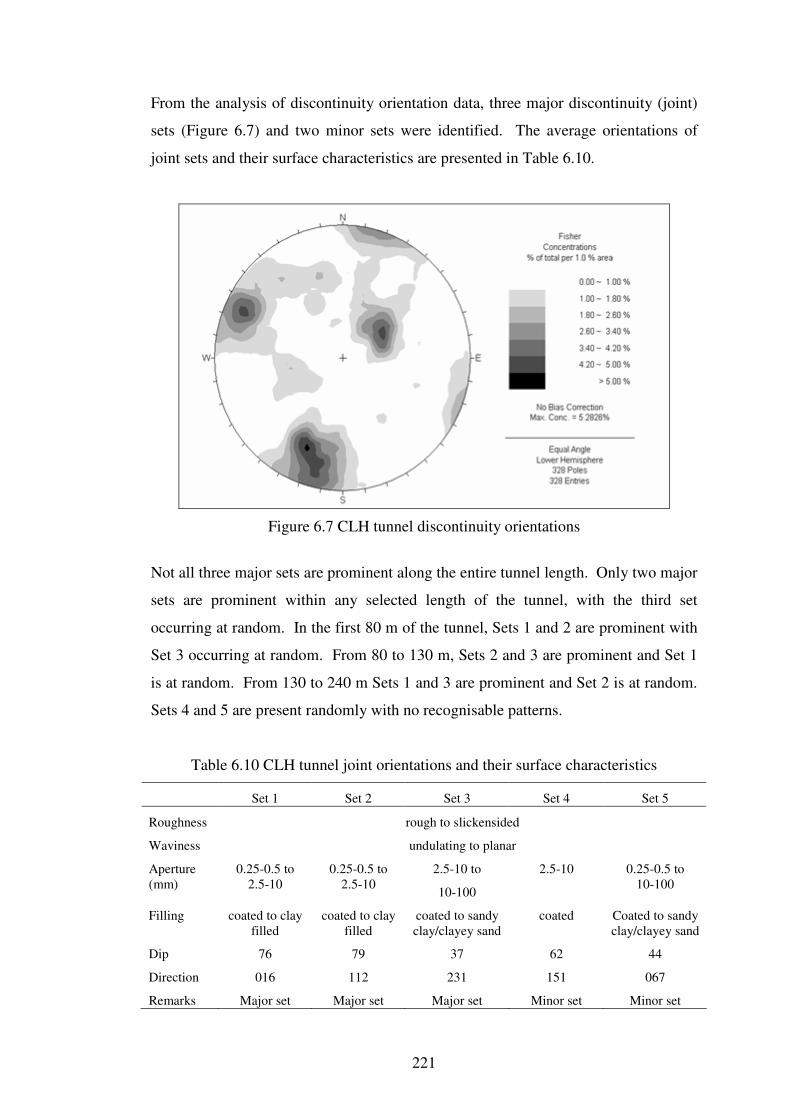
221
From the analysis of discontinuity orientation data, three major discontinuity (joint)
sets (Figure 6.7) and two minor sets were identified. The average orientations of
joint sets and their surface characteristics are presented in Table 6.10.
Figure 6.7 CLH tunnel discontinuity orientations
Not all three major sets are prominent along the entire tunnel length. Only two major
sets are prominent within any selected length of the tunnel, with the third set
occurring at random. In the first 80 m of the tunnel, Sets 1 and 2 are prominent with
Set 3 occurring at random. From 80 to 130 m, Sets 2 and 3 are prominent and Set 1
is at random. From 130 to 240 m Sets 1 and 3 are prominent and Set 2 is at random.
Sets 4 and 5 are present randomly with no recognisable patterns.
Table 6.10 CLH tunnel joint orientations and their surface characteristics
Set 1 Set 2 Set 3 Set 4 Set 5
Roughness rough to slickensided
Waviness undulating to planar
Aperture
(mm)
0.25-0.5 to
2.5-10
0.25-0.5 to
2.5-10
2.5-10 to
10-100
2.5-10 0.25-0.5 to
10-100
Filling coated to clay
filled
coated to clay
filled
coated to sandy
clay/clayey sand
coated Coated to sandy
clay/clayey sand
Dip 76 79 37 62 44
Direction 016 112 231 151 067
Remarks Major set Major set Major set Minor set Minor set
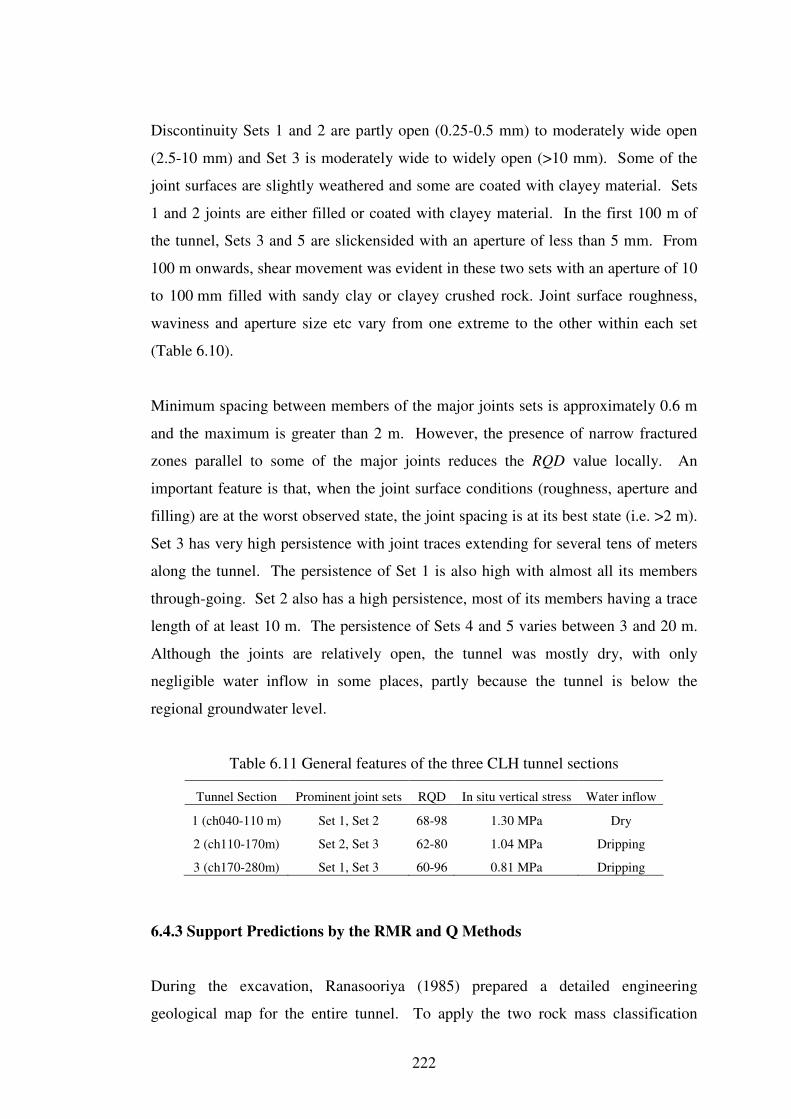
222
Discontinuity Sets 1 and 2 are partly open (0.25-0.5 mm) to moderately wide open
(2.5-10 mm) and Set 3 is moderately wide to widely open (>10 mm). Some of the
joint surfaces are slightly weathered and some are coated with clayey material. Sets
1 and 2 joints are either filled or coated with clayey material. In the first 100 m of
the tunnel, Sets 3 and 5 are slickensided with an aperture of less than 5 mm. From
100 m onwards, shear movement was evident in these two sets with an aperture of 10
to 100 mm filled with sandy clay or clayey crushed rock. Joint surface roughness,
waviness and aperture size etc vary from one extreme to the other within each set
(Table 6.10).
Minimum spacing between members of the major joints sets is approximately 0.6 m
and the maximum is greater than 2 m. However, the presence of narrow fractured
zones parallel to some of the major joints reduces the RQD value locally. An
important feature is that, when the joint surface conditions (roughness, aperture and
filling) are at the worst observed state, the joint spacing is at its best state (i.e. >2 m).
Set 3 has very high persistence with joint traces extending for several tens of meters
along the tunnel. The persistence of Set 1 is also high with almost all its members
through-going. Set 2 also has a high persistence, most of its members having a trace
length of at least 10 m. The persistence of Sets 4 and 5 varies between 3 and 20 m.
Although the joints are relatively open, the tunnel was mostly dry, with only
negligible water inflow in some places, partly because the tunnel is below the
regional groundwater level.
Table 6.11 General features of the three CLH tunnel sections
Tunnel Section Prominent joint sets RQD In situ vertical stress Water inflow
1 (ch040-110 m) Set 1, Set 2 68-98 1.30 MPa Dry
2 (ch110-170m) Set 2, Set 3 62-80 1.04 MPa Dripping
3 (ch170-280m) Set 1, Set 3 60-96 0.81 MPa Dripping
6.4.3 Support Predictions by the RMR and Q Methods
During the excavation, Ranasooriya (1985) prepared a detailed engineering
geological map for the entire tunnel. To apply the two rock mass classification
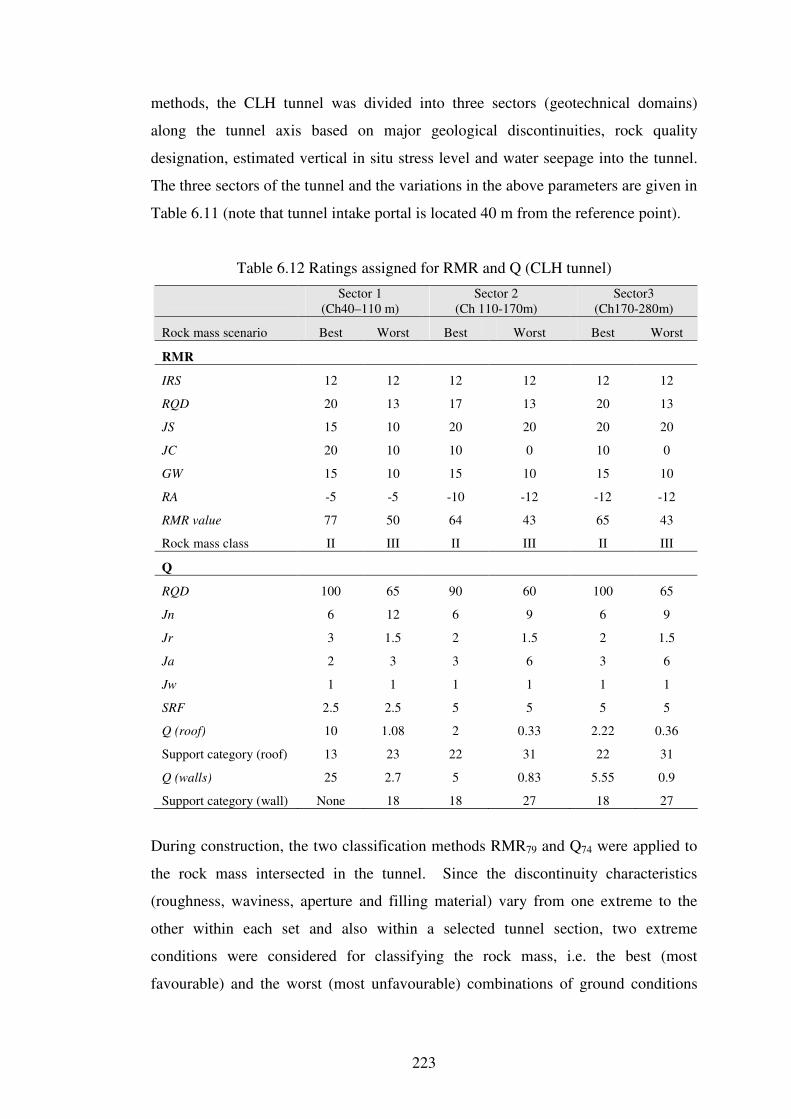
223
methods, the CLH tunnel was divided into three sectors (geotechnical domains)
along the tunnel axis based on major geological discontinuities, rock quality
designation, estimated vertical in situ stress level and water seepage into the tunnel.
The three sectors of the tunnel and the variations in the above parameters are given in
Table 6.11 (note that tunnel intake portal is located 40 m from the reference point).
Table 6.12 Ratings assigned for RMR and Q (CLH tunnel)
Sector 1
(Ch40–110 m)
Sector 2
(Ch 110-170m)
Sector3
(Ch170-280m)
Rock mass scenario Best Worst Best Worst Best Worst
RMR
IRS 12 12 12 12 12 12
RQD 20 13 17 13 20 13
JS 15 10 20 20 20 20
JC 20 10 10 0 10 0
GW 15 10 15 10 15 10
RA -5 -5 -10 -12 -12 -12
RMR value 77 50 64 43 65 43
Rock mass class II III II III II III
Q
RQD 100 65 90 60 100 65
Jn 6 12 6 9 6 9
Jr 3 1.5 2 1.5 2 1.5
Ja 2 3 3 6 3 6
Jw 1 1 1 1 1 1
SRF 2.5 2.5 5 5 5 5
Q (roof) 10 1.08 2 0.33 2.22 0.36
Support category (roof) 13 23 22 31 22 31
Q (walls) 25 2.7 5 0.83 5.55 0.9
Support category (wall) None 18 18 27 18 27
During construction, the two classification methods RMR79 and Q74 were applied to
the rock mass intersected in the tunnel. Since the discontinuity characteristics
(roughness, waviness, aperture and filling material) vary from one extreme to the
other within each set and also within a selected tunnel section, two extreme
conditions were considered for classifying the rock mass, i.e. the best (most
favourable) and the worst (most unfavourable) combinations of ground conditions
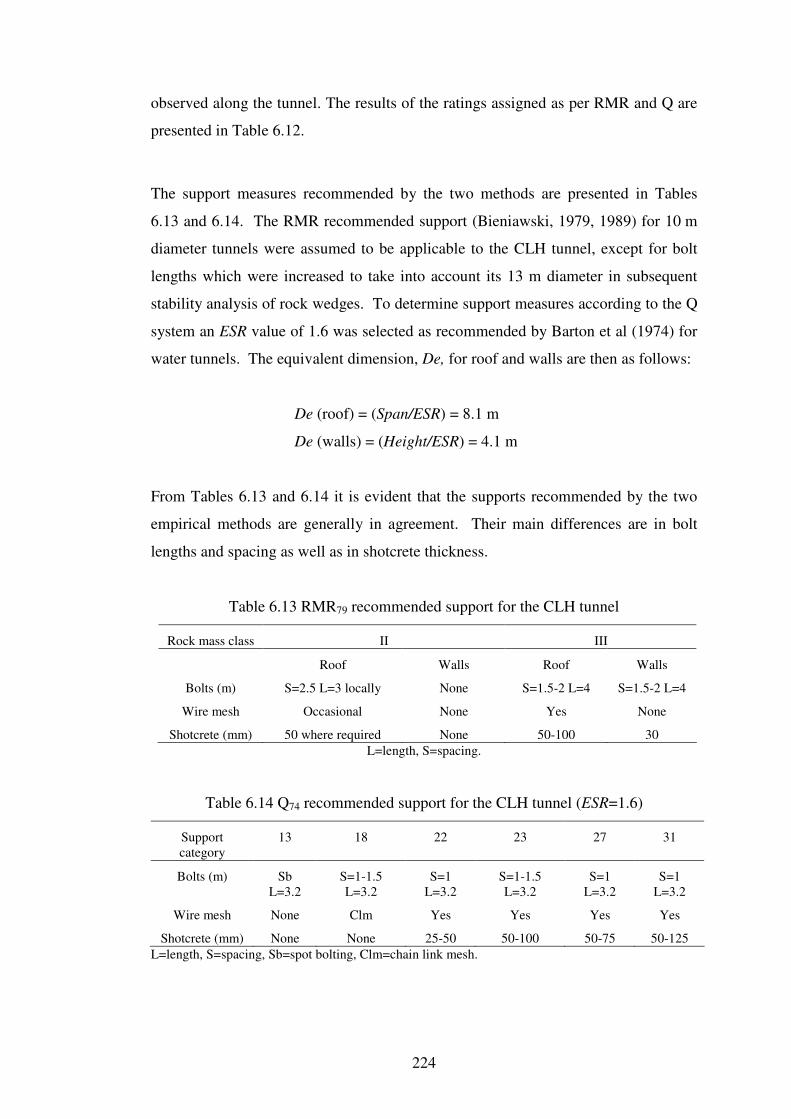
224
observed along the tunnel. The results of the ratings assigned as per RMR and Q are
presented in Table 6.12.
The support measures recommended by the two methods are presented in Tables
6.13 and 6.14. The RMR recommended support (Bieniawski, 1979, 1989) for 10 m
diameter tunnels were assumed to be applicable to the CLH tunnel, except for bolt
lengths which were increased to take into account its 13 m diameter in subsequent
stability analysis of rock wedges. To determine support measures according to the Q
system an ESR value of 1.6 was selected as recommended by Barton et al (1974) for
water tunnels. The equivalent dimension, De, for roof and walls are then as follows:
De (roof) = (Span/ESR) = 8.1 m
De (walls) = (Height/ESR) = 4.1 m
From Tables 6.13 and 6.14 it is evident that the supports recommended by the two
empirical methods are generally in agreement. Their main differences are in bolt
lengths and spacing as well as in shotcrete thickness.
Table 6.13 RMR79 recommended support for the CLH tunnel
Rock mass class II III
Roof Walls Roof Walls
Bolts (m) S=2.5 L=3 locally None S=1.5-2 L=4 S=1.5-2 L=4
Wire mesh Occasional None Yes None
Shotcrete (mm) 50 where required None 50-100 30
L=length, S=spacing.
Table 6.14 Q74 recommended support for the CLH tunnel (ESR=1.6)
Support
category
13 18 22 23 27 31
Bolts (m) Sb
L=3.2
S=1-1.5
L=3.2
S=1
L=3.2
S=1-1.5
L=3.2
S=1
L=3.2
S=1
L=3.2
Wire mesh None Clm Yes Yes Yes Yes
Shotcrete (mm) None None 25-50 50-100 50-75 50-125
L=length, S=spacing, Sb=spot bolting, Clm=chain link mesh.
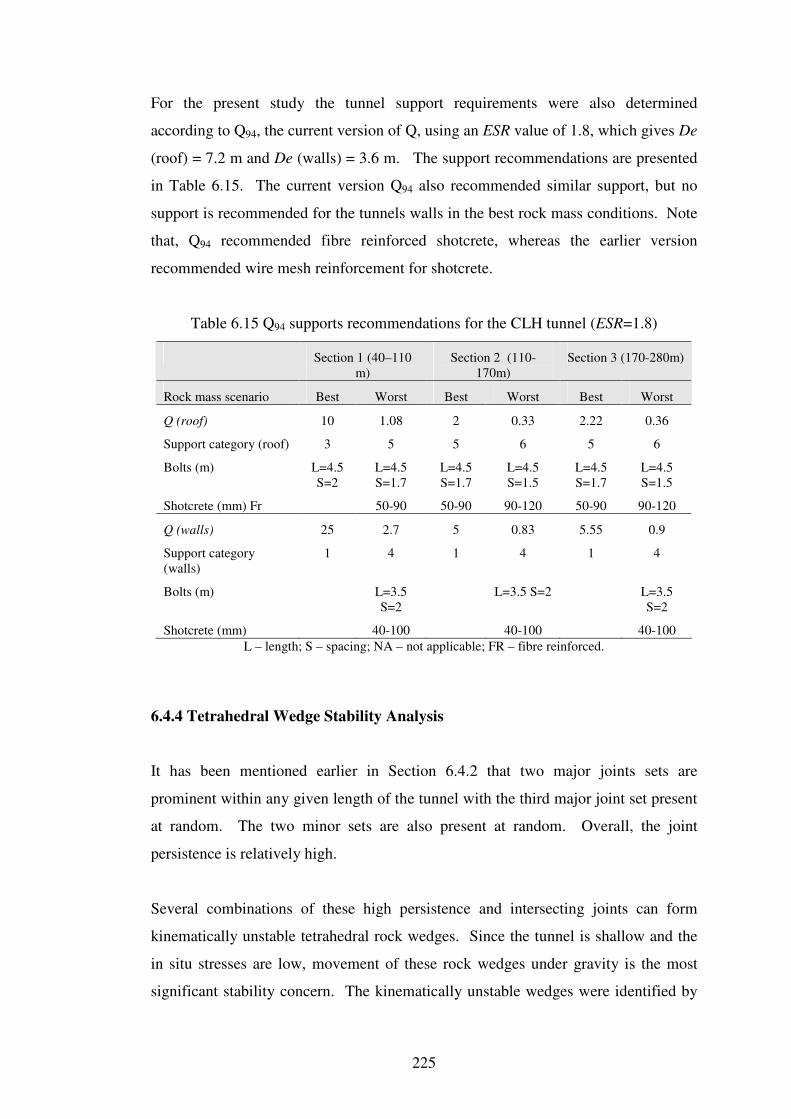
225
For the present study the tunnel support requirements were also determined
according to Q94, the current version of Q, using an ESR value of 1.8, which gives De
(roof) = 7.2 m and De (walls) = 3.6 m. The support recommendations are presented
in Table 6.15. The current version Q94 also recommended similar support, but no
support is recommended for the tunnels walls in the best rock mass conditions. Note
that, Q94 recommended fibre reinforced shotcrete, whereas the earlier version
recommended wire mesh reinforcement for shotcrete.
Table 6.15 Q94 supports recommendations for the CLH tunnel (ESR=1.8)
Section 1 (40–110
m)
Section 2 (110-
170m)
Section 3 (170-280m)
Rock mass scenario Best Worst Best Worst Best Worst
Q (roof) 10 1.08 2 0.33 2.22 0.36
Support category (roof) 3 5 5 6 5 6
Bolts (m) L=4.5
S=2
L=4.5
S=1.7
L=4.5
S=1.7
L=4.5
S=1.5
L=4.5
S=1.7
L=4.5
S=1.5
Shotcrete (mm) Fr 50-90 50-90 90-120 50-90 90-120
Q (walls) 25 2.7 5 0.83 5.55 0.9
Support category
(walls)
1 4 1 4 1 4
Bolts (m) L=3.5
S=2
L=3.5 S=2 L=3.5
S=2
Shotcrete (mm) 40-100 40-100 40-100
L – length; S – spacing; NA – not applicable; FR – fibre reinforced.
6.4.4 Tetrahedral Wedge Stability Analysis
It has been mentioned earlier in Section 6.4.2 that two major joints sets are
prominent within any given length of the tunnel with the third major joint set present
at random. The two minor sets are also present at random. Overall, the joint
persistence is relatively high.
Several combinations of these high persistence and intersecting joints can form
kinematically unstable tetrahedral rock wedges. Since the tunnel is shallow and the
in situ stresses are low, movement of these rock wedges under gravity is the most
significant stability concern. The kinematically unstable wedges were identified by
226
the UNWEDGE analysis. The ubiquitous joint method was adopted in the analysis
because the classification of the rock mass using the two empirical methods also
assumed that joints were ubiquitous.
The analysis showed that 19 different combinations of joints had the potential to
form tetrahedral rock wedges with an apex height greater than 1 m. Table 6.16
shows the joint set combination, location, maximum apex height and maximum
weight of the 19 rock wedges. The factor of safety (FOS) against failure of each
wedge was computed using joint shear strength parameters representative of the best
and the worst joint surface conditions considered for RMR and Q methods. The
Joint shear strength parameters (best: c=10 kPa, Φ=30o) and (worst: c=0 kPa, Φ=20
o)
were estimated taking into account the joint surface conditions and the presence of
filling materials discussed in Section 6.4.2. In estimating these parameters, the
suggestions given in Section 4 of Table 1 of the paper by Barton & Grimstad (1994)
and the potential for water saturation of the joints were also taken into account.
Since the tunnel overburden is between 25 and 50 m and the tunnel is to be operated
with an internal water pressure, it was assumed that the wedges are subjected to
gravity loading only. The FOS of unsupported rock wedges in the best and the worst
ground conditions, denoted as F-B and F-W respectively, are given in Table 6.16.
The analysis was extended to examine whether the empirically predicted support
could stabilise the 19 theoretically possible rock wedges. Since the wedges may be
present in the best or the worst ground conditions, the analysis considered both the
best and worst joint shear strength scenarios mentioned earlier. Table 6.16 also
shows the FOS assuming that only the bolts recommended by the two empirical
methods were installed. The bolts considered were the cement grouted type with
100% bond efficiency and an ultimate tensile strength of 180 kN installed normal to
the rock face.
The effect of empirically recommended shotcrete layers was also analysed. The
results of the analysis (not provided here) showed that shotcrete increased the FOS of
large rock wedges beyond the desired level. (A FOS of 1.5 and 2 for the walls and
roof, respectively, were selected for long term stability.) The shotcrete layers would
also provide the necessary support for the smaller rock blocks in between bolts and
227
for fractured ground and would meet the desired FOS. The analysis shows that the
support predicted by the two methods for the worst ground conditions were adequate
to stabilise the theoretically possible tetrahedral rock wedges in the roof and walls.
For the tunnel walls in the best rock mass, the two empirical methods recommended
no support. However, the analysis showed that there is potential for 14 different
tetrahedral rock wedges in the tunnel walls (Table 6.16). Four of these wedges (# 8,
10, 11 & 15) have a FOS of less than or equal to one indicating potential instability
in the best rock mass. Three more wedges (# 9, 12 & 17) have a FOS of less than
1.2, which is considered to be below the acceptable level.
For the tunnel roof in the best rock mass conditions, RMR recommended rock bolts
plus mesh and 50 mm of shotcrete where required (mesh and shotcrete are probably
for fractured ground, if present, and not for the entire roof). As can be seen from
Table 6.16, there is potential for five rock wedges with zero or near zero FOS in the
roof. The first three of these wedges, with maximum possible weights of 983, 261
and 585 kN, will have a FOS of less than or equal to one, if RMR recommended rock
bolting pattern for the best rock mass conditions is used (Table 6.16). With the same
bolting pattern the fourth wedge with a maximum possible weight of 628 kN will
have a FOS of only 1.18. The analysis showed that shotcrete would increase the
FOS of these possible rock wedges to an acceptable level. However, RMR did not
recommend shotcrete for large rock wedges in the roof.
With the Q recommendation for the tunnel roof in the best rock mass conditions the
FOS for wedge nos. 1, 3 and 4 are below the acceptable level for long term stability
of large rock blocks in the tunnel roof. The Q system did not recommend shotcrete
for the roof in the best rock mass.
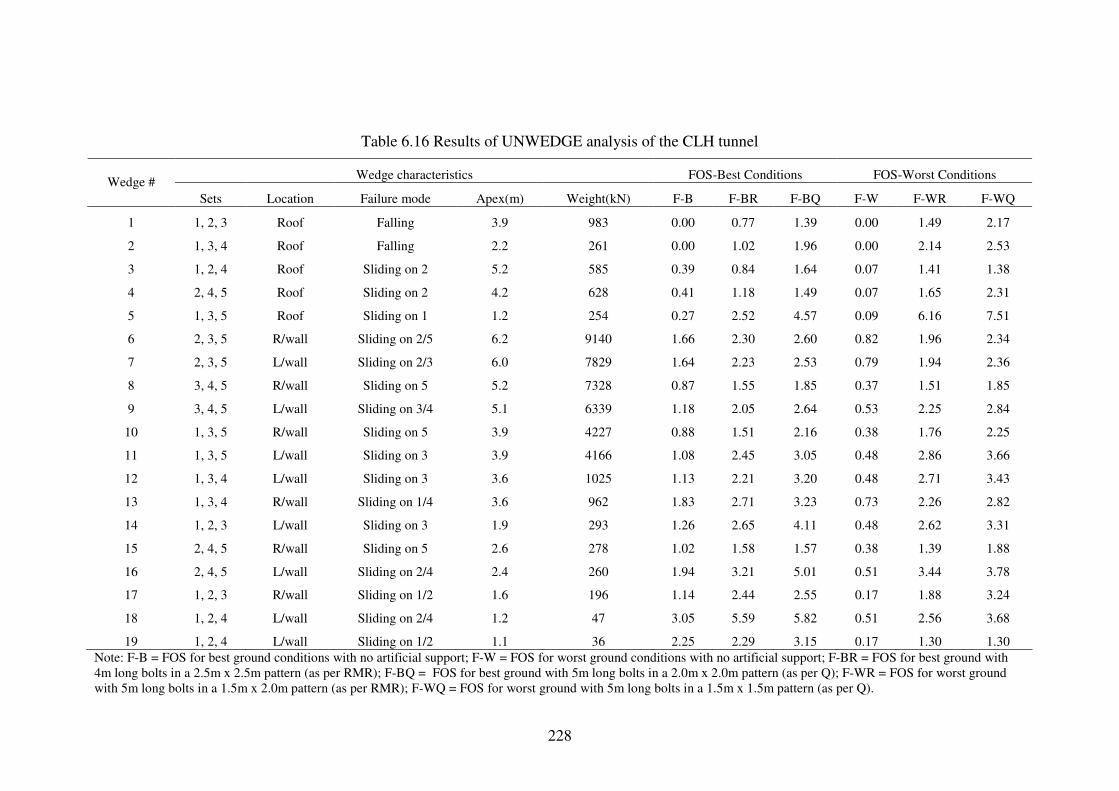
228
Table 6.16 Results of UNWEDGE analysis of the CLH tunnel
Wedge characteristics FOS-Best Conditions FOS-Worst Conditions
Wedge #
Sets Location Failure mode Apex(m) Weight(kN) F-B F-BR F-BQ F-W F-WR F-WQ
1 1, 2, 3 Roof Falling 3.9 983 0.00 0.77 1.39 0.00 1.49 2.17
2 1, 3, 4 Roof Falling 2.2 261 0.00 1.02 1.96 0.00 2.14 2.53
3 1, 2, 4 Roof Sliding on 2 5.2 585 0.39 0.84 1.64 0.07 1.41 1.38
4 2, 4, 5 Roof Sliding on 2 4.2 628 0.41 1.18 1.49 0.07 1.65 2.31
5 1, 3, 5 Roof Sliding on 1 1.2 254 0.27 2.52 4.57 0.09 6.16 7.51
6 2, 3, 5 R/wall Sliding on 2/5 6.2 9140 1.66 2.30 2.60 0.82 1.96 2.34
7 2, 3, 5 L/wall Sliding on 2/3 6.0 7829 1.64 2.23 2.53 0.79 1.94 2.36
8 3, 4, 5 R/wall Sliding on 5 5.2 7328 0.87 1.55 1.85 0.37 1.51 1.85
9 3, 4, 5 L/wall Sliding on 3/4 5.1 6339 1.18 2.05 2.64 0.53 2.25 2.84
10 1, 3, 5 R/wall Sliding on 5 3.9 4227 0.88 1.51 2.16 0.38 1.76 2.25
11 1, 3, 5 L/wall Sliding on 3 3.9 4166 1.08 2.45 3.05 0.48 2.86 3.66
12 1, 3, 4 L/wall Sliding on 3 3.6 1025 1.13 2.21 3.20 0.48 2.71 3.43
13 1, 3, 4 R/wall Sliding on 1/4 3.6 962 1.83 2.71 3.23 0.73 2.26 2.82
14 1, 2, 3 L/wall Sliding on 3 1.9 293 1.26 2.65 4.11 0.48 2.62 3.31
15 2, 4, 5 R/wall Sliding on 5 2.6 278 1.02 1.58 1.57 0.38 1.39 1.88
16 2, 4, 5 L/wall Sliding on 2/4 2.4 260 1.94 3.21 5.01 0.51 3.44 3.78
17 1, 2, 3 R/wall Sliding on 1/2 1.6 196 1.14 2.44 2.55 0.17 1.88 3.24
18 1, 2, 4 L/wall Sliding on 2/4 1.2 47 3.05 5.59 5.82 0.51 2.56 3.68
19 1, 2, 4 L/wall Sliding on 1/2 1.1 36 2.25 2.29 3.15 0.17 1.30 1.30
Note: F-B = FOS for best ground conditions with no artificial support; F-W = FOS for worst ground conditions with no artificial support; F-BR = FOS for best ground with
4m long bolts in a 2.5m x 2.5m pattern (as per RMR); F-BQ = FOS for best ground with 5m long bolts in a 2.0m x 2.0m pattern (as per Q); F-WR = FOS for worst ground
with 5m long bolts in a 1.5m x 2.0m pattern (as per RMR); F-WQ = FOS for worst ground with 5m long bolts in a 1.5m x 1.5m pattern (as per Q).
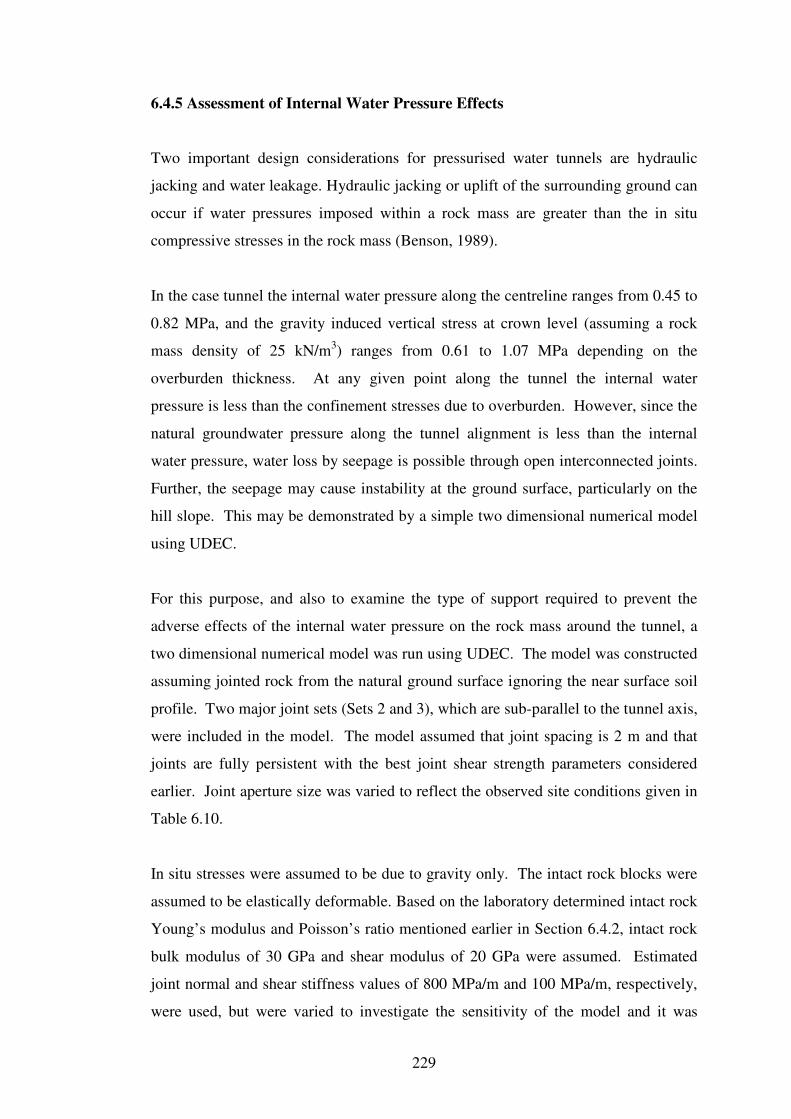
229
6.4.5 Assessment of Internal Water Pressure Effects
Two important design considerations for pressurised water tunnels are hydraulic
jacking and water leakage. Hydraulic jacking or uplift of the surrounding ground can
occur if water pressures imposed within a rock mass are greater than the in situ
compressive stresses in the rock mass (Benson, 1989).
In the case tunnel the internal water pressure along the centreline ranges from 0.45 to
0.82 MPa, and the gravity induced vertical stress at crown level (assuming a rock
mass density of 25 kN/m3) ranges from 0.61 to 1.07 MPa depending on the
overburden thickness. At any given point along the tunnel the internal water
pressure is less than the confinement stresses due to overburden. However, since the
natural groundwater pressure along the tunnel alignment is less than the internal
water pressure, water loss by seepage is possible through open interconnected joints.
Further, the seepage may cause instability at the ground surface, particularly on the
hill slope. This may be demonstrated by a simple two dimensional numerical model
using UDEC.
For this purpose, and also to examine the type of support required to prevent the
adverse effects of the internal water pressure on the rock mass around the tunnel, a
two dimensional numerical model was run using UDEC. The model was constructed
assuming jointed rock from the natural ground surface ignoring the near surface soil
profile. Two major joint sets (Sets 2 and 3), which are sub-parallel to the tunnel axis,
were included in the model. The model assumed that joint spacing is 2 m and that
joints are fully persistent with the best joint shear strength parameters considered
earlier. Joint aperture size was varied to reflect the observed site conditions given in
Table 6.10.
In situ stresses were assumed to be due to gravity only. The intact rock blocks were
assumed to be elastically deformable. Based on the laboratory determined intact rock
Young’s modulus and Poisson’s ratio mentioned earlier in Section 6.4.2, intact rock
bulk modulus of 30 GPa and shear modulus of 20 GPa were assumed. Estimated
joint normal and shear stiffness values of 800 MPa/m and 100 MPa/m, respectively,
were used, but were varied to investigate the sensitivity of the model and it was
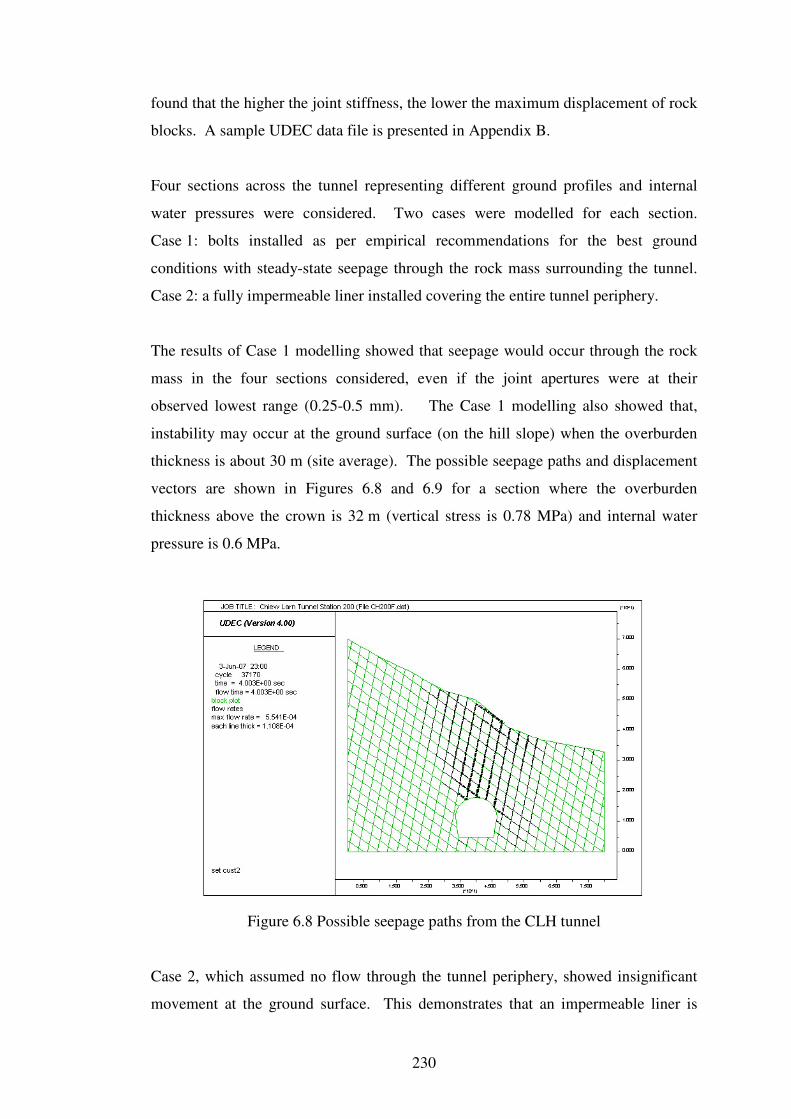
230
found that the higher the joint stiffness, the lower the maximum displacement of rock
blocks. A sample UDEC data file is presented in Appendix B.
Four sections across the tunnel representing different ground profiles and internal
water pressures were considered. Two cases were modelled for each section.
Case 1: bolts installed as per empirical recommendations for the best ground
conditions with steady-state seepage through the rock mass surrounding the tunnel.
Case 2: a fully impermeable liner installed covering the entire tunnel periphery.
The results of Case 1 modelling showed that seepage would occur through the rock
mass in the four sections considered, even if the joint apertures were at their
observed lowest range (0.25-0.5 mm). The Case 1 modelling also showed that,
instability may occur at the ground surface (on the hill slope) when the overburden
thickness is about 30 m (site average). The possible seepage paths and displacement
vectors are shown in Figures 6.8 and 6.9 for a section where the overburden
thickness above the crown is 32 m (vertical stress is 0.78 MPa) and internal water
pressure is 0.6 MPa.
Figure 6.8 Possible seepage paths from the CLH tunnel
Case 2, which assumed no flow through the tunnel periphery, showed insignificant
movement at the ground surface. This demonstrates that an impermeable liner is
231
required to prevent water losses from the tunnel and to minimise the risk of
instability on the hill slope above the tunnel.
F
Figure 6.9 Displacement vectors showing ground movement at the
surface above the CLH tunnel
6.4.6 The Installed Support
During excavation of the tunnel, several potentially unstable large rock blocks were
identified within both the best and worst ground conditions described earlier. These
blocks were temporarily stabilised using 6, 4 and 3 m long mechanically anchored
and resin grouted rock bolts. Considering the potential for leakage losses and
hydraulic jacking, the tunnel was fully steel lined with the annulus between the
tunnel and the lining filled with concrete. Rock bolting was used only as a
temporary rock mass stabilisation measure. No shotcrete was used.
6.4.7 Discussion
The support measures predicted by RMR and Q classification methods represent
permanent (or long term) requirements and the predictions take into account the
purpose of the excavation. For instance, Q (Barton & Grimstad, 1994) recommends
an ESR value of between 1.6 and 2.0 for hydropower tunnels and a value of 1.8 was
232
used for the case tunnel. Bieniawski (1989) presents an example application of RMR
to a shallow water tunnel with an overburden of between 15.3 and 61 m above crown
level. This overburden thickness range is comparable to that of the case tunnel.
As mentioned earlier the empirical methods recommended rock bolts and shotcrete
for the worst ground conditions intersected in the tunnel. For the best rock mass, no
support was recommended for the walls and only bolts were recommended for the
roof. Clearly, the empirically derived supports are unlikely to eliminate seepage,
which could eventually lead to instability at the ground surface. The application of
shotcrete along the entire tunnel including the invert, additional to the empirical
recommendations for the worst ground conditions, may be an option to control
seepage. However, since shotcrete is known to have numerous incipient cracks
formed by shrinkage, expansion and shear movement etc, it may not completely
eliminate seepage and the risk of instability at the ground surface. It would perhaps
delay the problem, as the pressures tend to build up slowly due to decreased flow
through the shotcrete.
Given the project specific requirement to prevent seepage losses the final lining
design was not entirely based on stability concerns and is therefore not a reasonable
test to evaluate the reliability of the empirical recommendations. However, purely
from a stability point of view, the most favourable (best) rock mass surrounding this
tunnel provides an interesting example. If a tunnel with similar diameter were to be
constructed in this best rock mass for low pressure water conveyance, i.e. for flood or
river diversion, the predictions of “no support” by the two rock mass classifications
methods would not meet long term stability requirements against potentially unstable
large rock wedges, particularly on the tunnel walls.
6.4.8 Conclusion
From purely a stability point of view the support recommendations of RMR and Q
for the worst rock mass conditions in the tunnel were adequate to prevent structurally
controlled failures. However, the recommendations for walls in best rock mass were
found to be inadequate for stabilising potentially unstable large rock wedges.
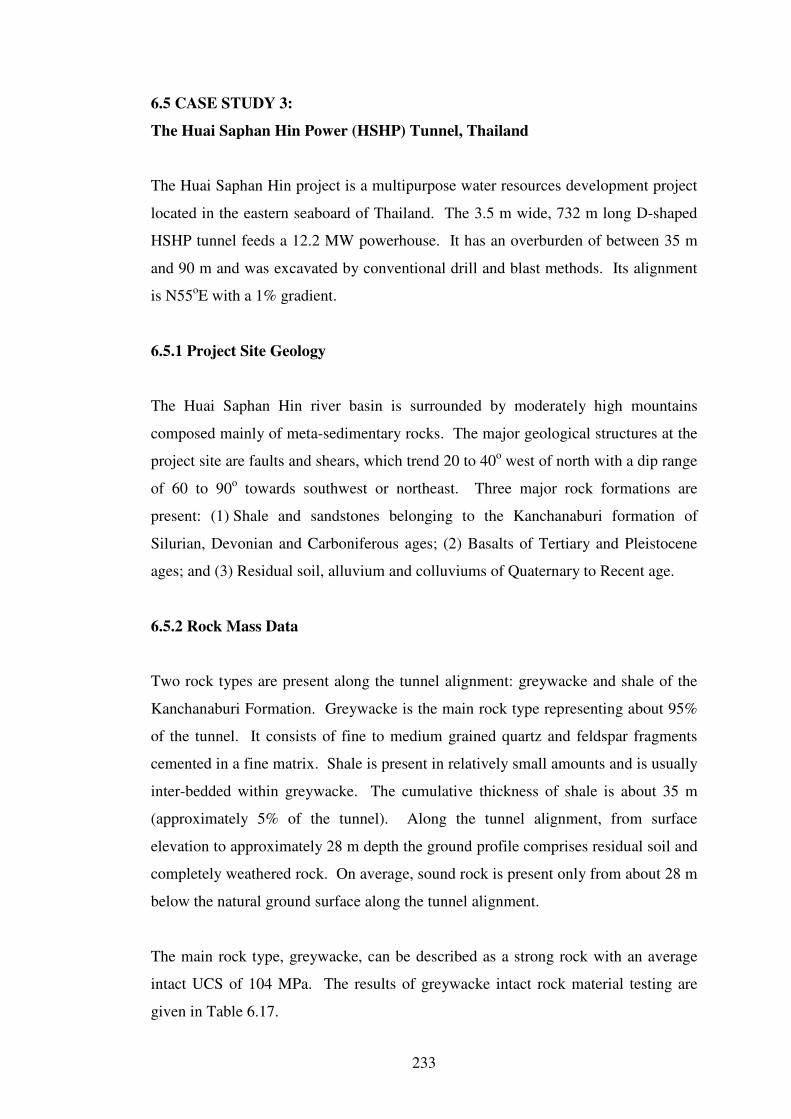
233
6.5 CASE STUDY 3:
The Huai Saphan Hin Power (HSHP) Tunnel, Thailand
The Huai Saphan Hin project is a multipurpose water resources development project
located in the eastern seaboard of Thailand. The 3.5 m wide, 732 m long D-shaped
HSHP tunnel feeds a 12.2 MW powerhouse. It has an overburden of between 35 m
and 90 m and was excavated by conventional drill and blast methods. Its alignment
is N55oE with a 1% gradient.
6.5.1 Project Site Geology
The Huai Saphan Hin river basin is surrounded by moderately high mountains
composed mainly of meta-sedimentary rocks. The major geological structures at the
project site are faults and shears, which trend 20 to 40o west of north with a dip range
of 60 to 90o towards southwest or northeast. Three major rock formations are
present: (1) Shale and sandstones belonging to the Kanchanaburi formation of
Silurian, Devonian and Carboniferous ages; (2) Basalts of Tertiary and Pleistocene
ages; and (3) Residual soil, alluvium and colluviums of Quaternary to Recent age.
6.5.2 Rock Mass Data
Two rock types are present along the tunnel alignment: greywacke and shale of the
Kanchanaburi Formation. Greywacke is the main rock type representing about 95%
of the tunnel. It consists of fine to medium grained quartz and feldspar fragments
cemented in a fine matrix. Shale is present in relatively small amounts and is usually
inter-bedded within greywacke. The cumulative thickness of shale is about 35 m
(approximately 5% of the tunnel). Along the tunnel alignment, from surface
elevation to approximately 28 m depth the ground profile comprises residual soil and
completely weathered rock. On average, sound rock is present only from about 28 m
below the natural ground surface along the tunnel alignment.
The main rock type, greywacke, can be described as a strong rock with an average
intact UCS of 104 MPa. The results of greywacke intact rock material testing are
given in Table 6.17.
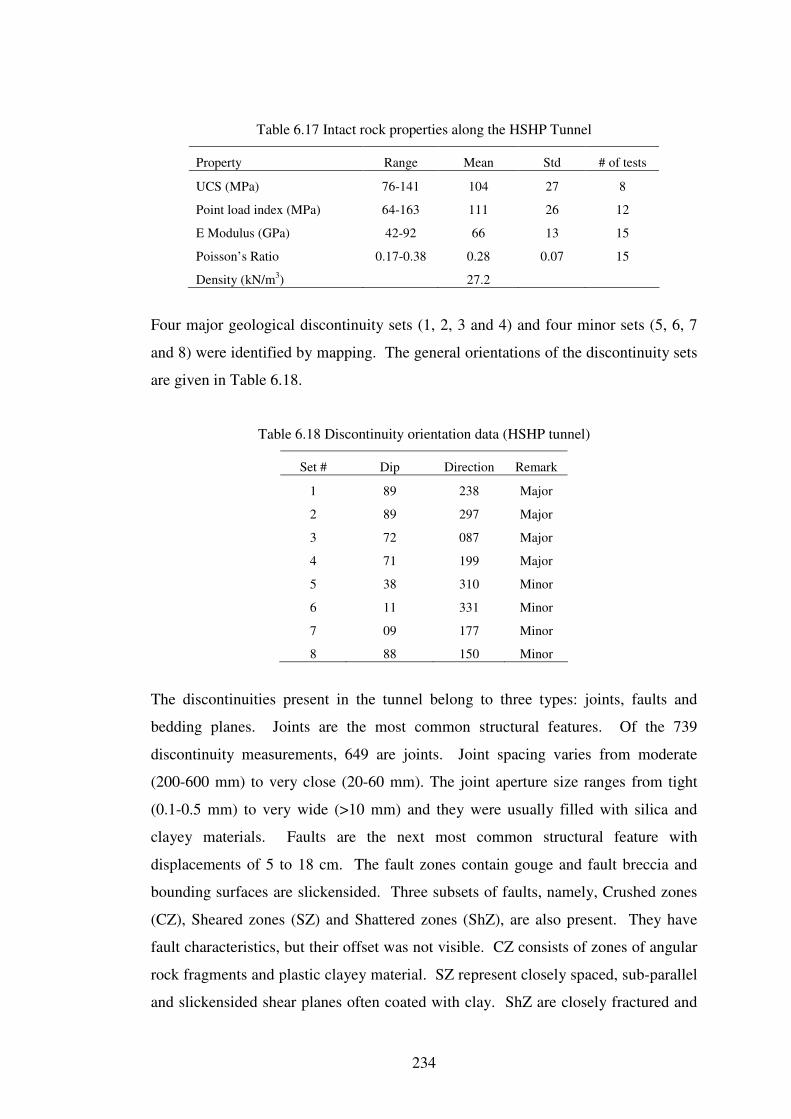
234
Table 6.17 Intact rock properties along the HSHP Tunnel
Property Range Mean Std # of tests
UCS (MPa) 76-141 104 27 8
Point load index (MPa) 64-163 111 26 12
E Modulus (GPa) 42-92 66 13 15
Poisson’s Ratio 0.17-0.38 0.28 0.07 15
Density (kN/m3) 27.2
Four major geological discontinuity sets (1, 2, 3 and 4) and four minor sets (5, 6, 7
and 8) were identified by mapping. The general orientations of the discontinuity sets
are given in Table 6.18.
Table 6.18 Discontinuity orientation data (HSHP tunnel)
Set # Dip Direction Remark
1 89 238 Major
2 89 297 Major
3 72 087 Major
4 71 199 Major
5 38 310 Minor
6 11 331 Minor
7 09 177 Minor
8 88 150 Minor
The discontinuities present in the tunnel belong to three types: joints, faults and
bedding planes. Joints are the most common structural features. Of the 739
discontinuity measurements, 649 are joints. Joint spacing varies from moderate
(200-600 mm) to very close (20-60 mm). The joint aperture size ranges from tight
(0.1-0.5 mm) to very wide (>10 mm) and they were usually filled with silica and
clayey materials. Faults are the next most common structural feature with
displacements of 5 to 18 cm. The fault zones contain gouge and fault breccia and
bounding surfaces are slickensided. Three subsets of faults, namely, Crushed zones
(CZ), Sheared zones (SZ) and Shattered zones (ShZ), are also present. They have
fault characteristics, but their offset was not visible. CZ consists of zones of angular
rock fragments and plastic clayey material. SZ represent closely spaced, sub-parallel
and slickensided shear planes often coated with clay. ShZ are closely fractured and
235
shattered rock zones consisting of angular rock fragments with minor amounts of
clay. Generally the faults (including subsets) observed were less than 10 cm in
thickness, occasionally up to 30 cm. A total of 72 faults were observed at regular
intervals. Bedding planes are rare with only 18 measurements and present only
along the contact between the two rock types. Their openings are usually filled with
clay and surfaces are generally smooth. The faults (including CZ, SZ and ShZ) and
beddings strike northwest (more or less normal to the tunnel axis) and dip 60 to 90o
towards northeast or southwest. They represent discontinuity set 1.
Based on a detailed engineering geological map prepared during the construction,
Lasao (1986) divided the tunnel into five geotechnical sectors considering the major
discontinuities and groundwater conditions: Sector 1: 011 to 150 m, Sector 2: 150 to
220 m, Sector 3: 220 to 320 m, Sector 4: 320 to 550 m and Sector 5: 550 to 733 m.
In Sector 1 heavy water inflow was common due to open joints, and in Sectors 2, 3
and 4 water inflow was limited to dripping. Sector 5 was generally dry with wet
surfaces and occasional dripping. During heavy rains a significant increase in water
inflow in Sector 1 and a significant increase in dripping in Sectors 3 and 4 were
observed. The increase in groundwater inflow was interpreted as an indication of
high permeability of the rock mass due to the presence of open discontinuities.
During mapping, Lasao (1986) observed that the most common modes of failure in
the tunnel were loosening of the rock mass around major discontinuity zones such as
CZ, SZ and ShZ mentioned earlier, wedge failures due to intersecting joints and slab
failure from the roof due to flat dipping joints.
6.5.3 Support Predictions by the RMR and Q Methods
Lasao (1986) applied RMR79 and Q74, which were current at the time, to the most
favourable (best) and most unfavourable (worst) rock mass conditions in each of the
five sectors (domains) of the tunnel. A review of the RMR ratings assigned and the
brief explanations given by Lasao showed that the ratings accurately represent the
rock mass conditions recorded in the tunnel map. Nevertheless, for the present study
the worst case JC rating for tunnel Sectors 2 and 4 was downgraded to “0”, instead of
“6” used by him, so that the selected value is consistent with the ratings
236
recommended by Bieniawski (1979). However, this did not change the RMR
recommended support measures for the worst case rock in tunnel Sectors 2 and 4.
The RMR ratings are presented in Table 6.19.
Table 6.19 The RMR ratings for the HSHP tunnel
Sector Condition IRS RQD JS JC GW RA RMR
Best 12 20 20 20 10 0 82 1
Worst 12 13 10 10 4 0 39
Best 12 20 20 20 10 -12 70 2
Worst 12 13 10 0 4 -12 27
Best 12 20 10 12 10 0 64 3
Worst 12 8 5 0 4 0 29
Best 12 20 20 25 10 0 87 4
Worst 12 17 10 0 4 0 43
Best 12 20 20 25 10 -5 82 5
Worst 12 17 10 0 7 -5 41
Table 6.20 The Q ratings for the HSHP tunnel
Sector Condition RQD Jn Jr Ja Jw SRF Q
Best 96 9 3 2 1 2.5 6.40 1
Worst 70 15 2 3 0.5 2.5 0.62
Best 96 9 3 2 1 2.5 6.40 2
Worst 70 12 2 3 0.66 5 0.50
Best 95 9 2 2 1 5 2.11 3
Worst 32 9 1 6 0.66 10 0.04
Best 99 9 3 2 1 2.5 6.60 4
Worst 77 12 2 3 0.66 2.5 1.13
Best 98 9 3 2 1 2.5 6.53 5
Worst 77 12 1.5 3 1 2.5 1.28
A review of Lasao’s tunnel map indicated that some of the Q rating values he
selected could be downgraded to better represent the rock mass conditions in the
tunnel. The reassigned values reduced the final Q rating for both best and worst
conditions considered in all five sectors except for the worst conditions in Sector 5.
The Q ratings are presented in Table 6.20.
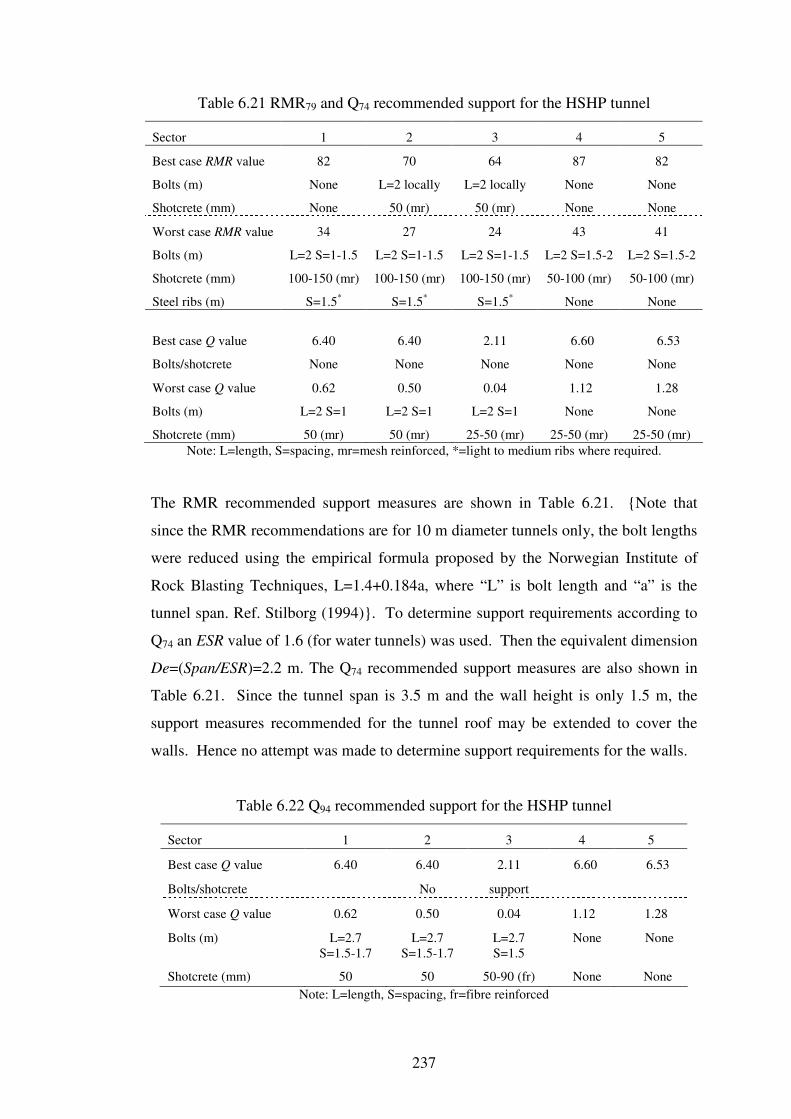
237
Table 6.21 RMR79 and Q74 recommended support for the HSHP tunnel
Sector 1 2 3 4 5
Best case RMR value 82 70 64 87 82
Bolts (m) None L=2 locally L=2 locally None None
Shotcrete (mm) None 50 (mr) 50 (mr) None None
Worst case RMR value 34 27 24 43 41
Bolts (m) L=2 S=1-1.5 L=2 S=1-1.5 L=2 S=1-1.5 L=2 S=1.5-2 L=2 S=1.5-2
Shotcrete (mm) 100-150 (mr) 100-150 (mr) 100-150 (mr) 50-100 (mr) 50-100 (mr)
Steel ribs (m) S=1.5*
S=1.5*
S=1.5*
None None
Best case Q value 6.40 6.40 2.11 6.60 6.53
Bolts/shotcrete None None None None None
Worst case Q value 0.62 0.50 0.04 1.12 1.28
Bolts (m) L=2 S=1 L=2 S=1 L=2 S=1 None None
Shotcrete (mm) 50 (mr) 50 (mr) 25-50 (mr) 25-50 (mr) 25-50 (mr)
Note: L=length, S=spacing, mr=mesh reinforced, *=light to medium ribs where required.
The RMR recommended support measures are shown in Table 6.21. {Note that
since the RMR recommendations are for 10 m diameter tunnels only, the bolt lengths
were reduced using the empirical formula proposed by the Norwegian Institute of
Rock Blasting Techniques, L=1.4+0.184a, where “L” is bolt length and “a” is the
tunnel span. Ref. Stilborg (1994)}. To determine support requirements according to
Q74 an ESR value of 1.6 (for water tunnels) was used. Then the equivalent dimension
De=(Span/ESR)=2.2 m. The Q74 recommended support measures are also shown in
Table 6.21. Since the tunnel span is 3.5 m and the wall height is only 1.5 m, the
support measures recommended for the tunnel roof may be extended to cover the
walls. Hence no attempt was made to determine support requirements for the walls.
Table 6.22 Q94 recommended support for the HSHP tunnel
Sector 1 2 3 4 5
Best case Q value 6.40 6.40 2.11 6.60 6.53
Bolts/shotcrete No support
Worst case Q value 0.62 0.50 0.04 1.12 1.28
Bolts (m) L=2.7
S=1.5-1.7
L=2.7
S=1.5-1.7
L=2.7
S=1.5
None None
Shotcrete (mm) 50 50 50-90 (fr) None None
Note: L=length, S=spacing, fr=fibre reinforced
238
For the present study, Q94 (the current version of Q) was also applied and required
support measures were determined. A summary of the support measures
recommended by Q94 is presented in Table 6.22. RMR89 was not applied as support
measures recommended by the two versions are the same.
6.5.4 Tetrahedral Wedge Stability Analysis
As discussed earlier, four major joints sets and four minor joint sets were present in
the rock mass. In any given length of the tunnel, generally three joint sets are
prominent with the other sets present at random. Intersecting members of these joint
sets have the potential to create kinematically unstable tetrahedral rock wedges in the
tunnel. The analysis performed using UNWEDGE confirmed that several rock
wedges were kinematically unstable in both the roof and walls. The stability of
these rock wedges was then analysed. As for Case Study 1 (CLD tunnel), two stress
scenarios were considered taking into account that the overburden is between 35 and
90 m with 90% of the tunnel having more than 50m of overburden. The first
scenario assumed that the wedges are subjected to gravity loading only; the second
scenario included an assumed in situ stress field corresponding to the weight of the
overburden and k=σh/σv=1.5. In order to assess the sensitivity of wedge stability
(wedge FOS) to the shear strength parameters of discontinuities, two shear strength
scenarios were considered. Since the rock type and its joint filling materials are
similar to those of the CLD tunnel (Case Study 1) discussed earlier, it was assumed
that the same shear strength values c=50 kPa, Φ=35o and c=10 kPa, Φ=25
o represent,
respectively, the best case and the worst case ground conditions considered for
classifying the rock mass using RMR and Q. The results of the analysis showed that
several rock wedges would be unstable in both roof and walls of the tunnel. The
FOS of each wedge under the two joint shear strength scenarios with and without the
effect of stress field, along with the joint set combination, location, maximum apex
height and maximum weight of the rock wedges, are presented in Table 6.23.
The analysis showed that the RMR recommended support measures for the worst
case ground conditions are sufficient for theoretically possible tetrahedral rock
wedges in the tunnel. The RMR recommendations for the best rock mass conditions
in tunnel Sectors 2 and 3 are also sufficient for tetrahedral rock wedges. RMR did
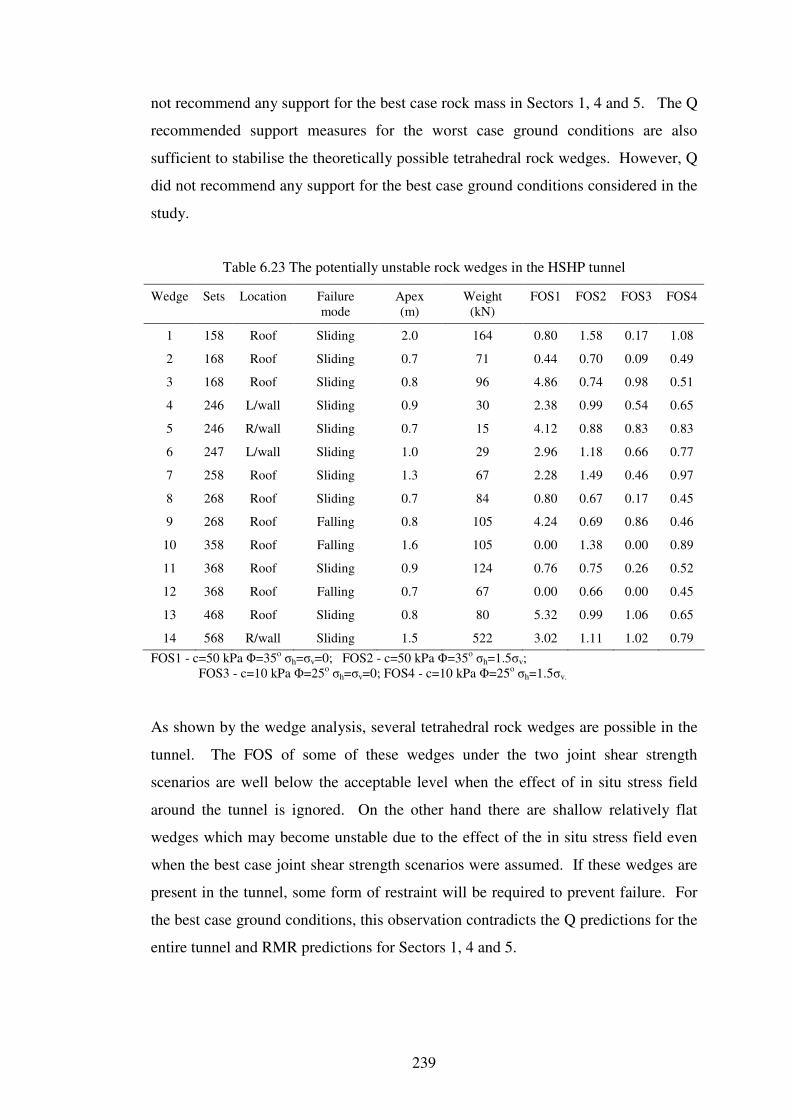
239
not recommend any support for the best case rock mass in Sectors 1, 4 and 5. The Q
recommended support measures for the worst case ground conditions are also
sufficient to stabilise the theoretically possible tetrahedral rock wedges. However, Q
did not recommend any support for the best case ground conditions considered in the
study.
Table 6.23 The potentially unstable rock wedges in the HSHP tunnel
Wedge Sets Location Failure
mode
Apex
(m)
Weight
(kN)
FOS1 FOS2 FOS3 FOS4
1 158 Roof Sliding 2.0 164 0.80 1.58 0.17 1.08
2 168 Roof Sliding 0.7 71 0.44 0.70 0.09 0.49
3 168 Roof Sliding 0.8 96 4.86 0.74 0.98 0.51
4 246 L/wall Sliding 0.9 30 2.38 0.99 0.54 0.65
5 246 R/wall Sliding 0.7 15 4.12 0.88 0.83 0.83
6 247 L/wall Sliding 1.0 29 2.96 1.18 0.66 0.77
7 258 Roof Sliding 1.3 67 2.28 1.49 0.46 0.97
8 268 Roof Sliding 0.7 84 0.80 0.67 0.17 0.45
9 268 Roof Falling 0.8 105 4.24 0.69 0.86 0.46
10 358 Roof Falling 1.6 105 0.00 1.38 0.00 0.89
11 368 Roof Sliding 0.9 124 0.76 0.75 0.26 0.52
12 368 Roof Falling 0.7 67 0.00 0.66 0.00 0.45
13 468 Roof Sliding 0.8 80 5.32 0.99 1.06 0.65
14 568 R/wall Sliding 1.5 522 3.02 1.11 1.02 0.79
FOS1 - c=50 kPa Φ=35o σh=σv=0; FOS2 - c=50 kPa Φ=35
o σh=1.5σv;
FOS3 - c=10 kPa Φ=25o σh=σv=0; FOS4 - c=10 kPa Φ=25
o σh=1.5σv.
As shown by the wedge analysis, several tetrahedral rock wedges are possible in the
tunnel. The FOS of some of these wedges under the two joint shear strength
scenarios are well below the acceptable level when the effect of in situ stress field
around the tunnel is ignored. On the other hand there are shallow relatively flat
wedges which may become unstable due to the effect of the in situ stress field even
when the best case joint shear strength scenarios were assumed. If these wedges are
present in the tunnel, some form of restraint will be required to prevent failure. For
the best case ground conditions, this observation contradicts the Q predictions for the
entire tunnel and RMR predictions for Sectors 1, 4 and 5.
240
During excavation of the HSHP tunnel, Lasao (1986) observed that structurally
controlled failures were the main modes of instability which included wedge failures
due to intersecting discontinuities, slab failure from the roof due to flat dipping joints
and loosening of the rock mass around weakness zones such as faults, which cut
across the tunnel alignment. The results of the wedge analysis agree with these
observations.
6.5.5 The Installed Support
The actual support installed in the tunnel included steel ribs with steel/timber
lagging, liner plates and invert struts near the portals and at four intervals inside the
tunnel in the worst ground conditions (a 5 m interval each in Sectors 3 and 4, and a
4 m and an 8 m interval in Sector 5). In other areas, rock bolts and wire mesh were
used as necessary to provide safety during construction. No shotcrete was used.
After the completion of the excavation, a 500 mm thick cast in place concrete lining
was constructed, partly for hydraulic reasons. While the rock bolts and wire mesh
quantities installed were minimal, the final support (lining) installed was
substantially greater than the support recommended by the two empirical methods.
6.5.6 Discussion
Both methods recommended rock bolts and shotcrete as the main types of rock mass
stabilisations measures for the HSHP tunnel. However, the recommended rock bolt
quantities and shotcrete thicknesses vary between the two methods. For the best rock
mass conditions in all five sectors of the tunnel, Q recommended no support, whereas
RMR recommended spot bolting and 50 mm of shotcrete with occasional wire mesh
for Sectors 2 and 3. For the worst rock mass conditions, RMR recommended pattern
bolting with 100 to 150 mm of mesh reinforced shotcrete and light to medium steel
ribs at 1.5 m spacing where required. Q74 recommended pattern bolting with 50 mm
of mesh reinforced shotcrete for the first three sectors of the tunnel, but only 50 mm
of mesh reinforced shotcrete for the last two sectors. Q94 also recommended a
similar support system for the first three sectors but no support for the last two. This
illustrates that for small diameter tunnels the RMR and Q derived support measures
241
are not always comparable, and depending on the rock mass conditions they differ
considerably.
One of the reasons for the above mentioned difference is that RMR support
recommendations are for 10 m diameter tunnels only. No guidelines are provided for
selection of support quantities for tunnels with dimensions other than 10 m span.
Some difficulties may arise when support measures are designed for small diameter
tunnels such as the HSHP tunnel. In this situation, other empirical guidelines should
be used for selecting bolt lengths, shotcrete thickness and steel ribs spacing etc.
While bolt lengths may be easily adjusted using other empirical guidelines or rules of
thumb as in this case, the adjustment of bolt and rib spacing, shotcrete thickness and
mesh reinforcement etc using other relevant empirical guidelines could result in
significant deviation from the RMR recommendations.
The Q system also has some major limitations for small diameter (i.e. 3.5 m) water
tunnels such as this, for which ESR=1.6 to 2.0 and De=1.75 to 2.2. When De≤2, the
Q system recommends no support if Q>1. As seen in the HSHP case tunnel, support
could be warranted when the Q value is as high as 6.
In this 3.5 m diameter HSHP tunnel, the RMR and Q74 derived support measurers
were sufficient to stabilise the potentially unstable tetrahedral rock wedges in the
worst case ground conditions. However, the Q94 recommendations were adequate
only for the first three sectors of the tunnel. It did not recommend any support for
the last two sectors where wedge instability was possible.
For the best scenario ground conditions, both versions of Q did not recommend any
support for the entire tunnel and RMR recommended no support for Sectors 1, 4 and
5. Nevertheless, the wedge analysis showed that even under the best case joint shear
strength parameters considered, tetrahedral rock wedge instability was possible.
During construction several structurally controlled failures occurred and the potential
failures identified in advance were stabilised using rock bolts. Steel ribs were also
used in the poor rock mass conditions, for which RMR recommended steel ribs, rock
bolts and shotcrete and Q recommended rock bolts and shotcrete.
242
6.5.6 Conclusion
The results of the analysis of the data available from the HSHP tunnel show that the
support systems recommended by the two empirical methods were significantly
different to the final support (concrete lining) installed for rock mass stability and
hydraulic reasons.
This case study also showed that for small diameter tunnels RMR and Q derived
support measures are not always comparable and depending on the rock mass
conditions they differ considerably.
Both methods have some major limitations for small diameter (i.e. 3.5 m) water
tunnels such as the HSHP tunnel. Depending on the condition of the rock mass the
RMR system may be overconservative, whereas the Q system could lead to under
design.
For the best scenario ground conditions in the entire tunnel and the worst case
ground conditions in two of the five sectors, Q did not recommend any support, yet
the wedge stability analysis showed that support would be warranted in these areas.
During construction primary support measures (rock bolts) were installed in areas
where Q did not even recommend permanent support. For the best scenario ground
conditions, RMR recommended no support for Sectors 4 and 5, where support would
be required for wedge stabilisation.
243
6.6 CASE STUDY 4:
The Central Tunnel, Taiwan, Republic of China
The Central Tunnel is part of the Southern Link Railway Project (SLRP) in the
Southern part of Taiwan, Republic of China. The Central Tunnel, the longest double
track railway tunnel in the SLRP, is 8070 m long with a 10 m diameter horseshoe
shape. It has a general alignment of N75oE and passes underneath Mt Chaliu at the
southern end of the Central Mountain Range. Excavated by drill and blast
techniques, its construction was completed in 1990. The present study deals with
only a 78 m length of the tunnel with difficult ground conditions. The average
overburden of the tunnel length is 218 m.
6.6.1 Project Site Geology
The project area is characterised by the Lushan Formation of Miocene age, which
can be divided into two members: the upper member is mainly argillite with massive
meta-sandstone and the lower member consists of argillite with a lesser amount of
thinly layered meta-sandstone. The rocks are slightly metamorphosed and rock beds
steeply dip to the east and partly overturned to the west. Well developed bedding
planes, tight folds, drag folds and cleavages are common in the rock formations in
the project area. The surface topography is rough with steep scarps, and the regional
tectonic trend has a north-south orientation.
6.6.2 Rock Mass Data
The rock types intersected in the tunnel are argillite and meta-sandstone of Lushan
Formation. Argillite is the main rock type and is massive. Meta-sandstones are thick
and massive or inter-bedded with argillite. Yu-Shan (1987) undertook a detailed rock
mass survey of the 78 m length of the tunnel from chainage 25K+904.8m to
25K+982.4m (western portal is at Ch. 23K+258m and eastern portal is at
31K+328m). The survey was conducted by examining and recording all the relevant
rock mass parameters after each excavation round. In the 78 m tunnel interval
selected for Yu-Shan’s study, there were 59 excavation rounds varying in length
from 1 to 2.9 m, with the majority having a length of only 1 m. The rock mass
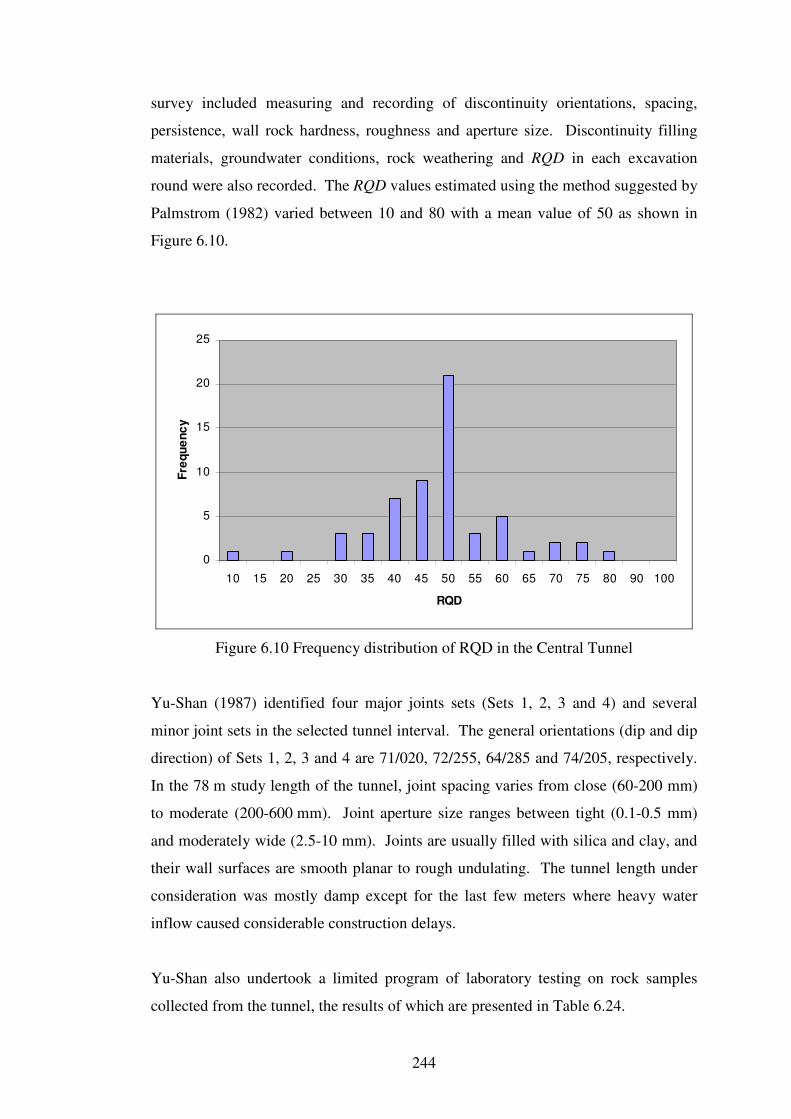
244
survey included measuring and recording of discontinuity orientations, spacing,
persistence, wall rock hardness, roughness and aperture size. Discontinuity filling
materials, groundwater conditions, rock weathering and RQD in each excavation
round were also recorded. The RQD values estimated using the method suggested by
Palmstrom (1982) varied between 10 and 80 with a mean value of 50 as shown in
Figure 6.10.
0
5
10
15
20
25
10 15 20 25 30 35 40 45 50 55 60 65 70 75 80 90 100
RQD
Fre
qu
en
cy
Figure 6.10 Frequency distribution of RQD in the Central Tunnel
Yu-Shan (1987) identified four major joints sets (Sets 1, 2, 3 and 4) and several
minor joint sets in the selected tunnel interval. The general orientations (dip and dip
direction) of Sets 1, 2, 3 and 4 are 71/020, 72/255, 64/285 and 74/205, respectively.
In the 78 m study length of the tunnel, joint spacing varies from close (60-200 mm)
to moderate (200-600 mm). Joint aperture size ranges between tight (0.1-0.5 mm)
and moderately wide (2.5-10 mm). Joints are usually filled with silica and clay, and
their wall surfaces are smooth planar to rough undulating. The tunnel length under
consideration was mostly damp except for the last few meters where heavy water
inflow caused considerable construction delays.
Yu-Shan also undertook a limited program of laboratory testing on rock samples
collected from the tunnel, the results of which are presented in Table 6.24.
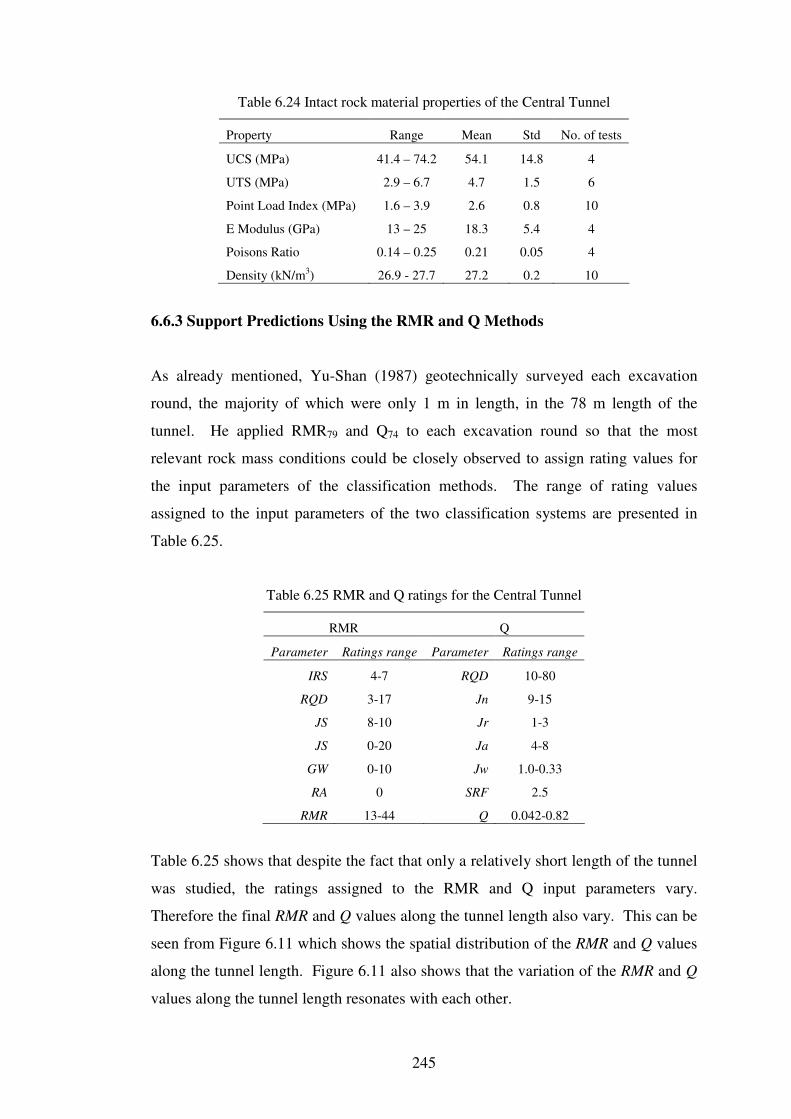
245
Table 6.24 Intact rock material properties of the Central Tunnel
Property Range Mean Std No. of tests
UCS (MPa) 41.4 – 74.2 54.1 14.8 4
UTS (MPa) 2.9 – 6.7 4.7 1.5 6
Point Load Index (MPa) 1.6 – 3.9 2.6 0.8 10
E Modulus (GPa) 13 – 25 18.3 5.4 4
Poisons Ratio 0.14 – 0.25 0.21 0.05 4
Density (kN/m3) 26.9 - 27.7 27.2 0.2 10
6.6.3 Support Predictions Using the RMR and Q Methods
As already mentioned, Yu-Shan (1987) geotechnically surveyed each excavation
round, the majority of which were only 1 m in length, in the 78 m length of the
tunnel. He applied RMR79 and Q74 to each excavation round so that the most
relevant rock mass conditions could be closely observed to assign rating values for
the input parameters of the classification methods. The range of rating values
assigned to the input parameters of the two classification systems are presented in
Table 6.25.
Table 6.25 RMR and Q ratings for the Central Tunnel
RMR Q
Parameter Ratings range Parameter Ratings range
IRS 4-7 RQD 10-80
RQD 3-17 Jn 9-15
JS 8-10 Jr 1-3
JS 0-20 Ja 4-8
GW 0-10 Jw 1.0-0.33
RA 0 SRF 2.5
RMR 13-44 Q 0.042-0.82
Table 6.25 shows that despite the fact that only a relatively short length of the tunnel
was studied, the ratings assigned to the RMR and Q input parameters vary.
Therefore the final RMR and Q values along the tunnel length also vary. This can be
seen from Figure 6.11 which shows the spatial distribution of the RMR and Q values
along the tunnel length. Figure 6.11 also shows that the variation of the RMR and Q
values along the tunnel length resonates with each other.
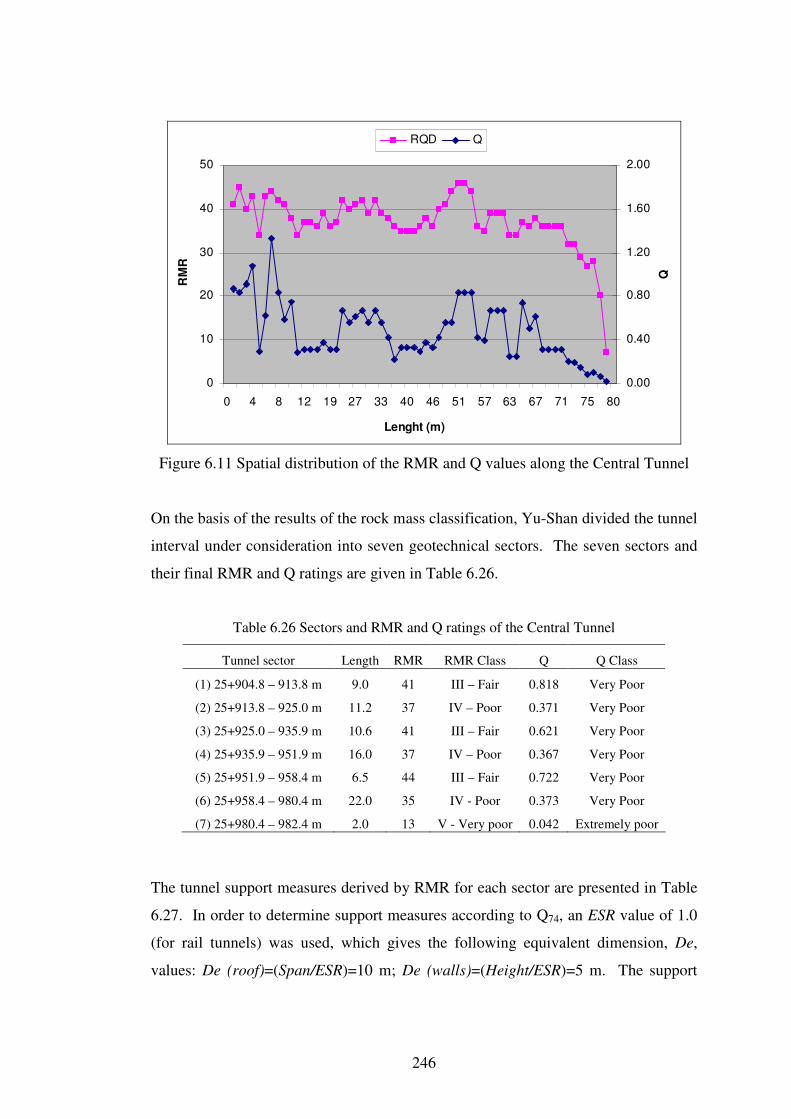
246
0
10
20
30
40
50
0 4 8 12 19 27 33 40 46 51 57 63 67 71 75 80
Lenght (m)
RM
R
0.00
0.40
0.80
1.20
1.60
2.00
Q
RQD Q
Figure 6.11 Spatial distribution of the RMR and Q values along the Central Tunnel
On the basis of the results of the rock mass classification, Yu-Shan divided the tunnel
interval under consideration into seven geotechnical sectors. The seven sectors and
their final RMR and Q ratings are given in Table 6.26.
Table 6.26 Sectors and RMR and Q ratings of the Central Tunnel
Tunnel sector Length RMR RMR Class Q Q Class
(1) 25+904.8 – 913.8 m 9.0 41 III – Fair 0.818 Very Poor
(2) 25+913.8 – 925.0 m 11.2 37 IV – Poor 0.371 Very Poor
(3) 25+925.0 – 935.9 m 10.6 41 III – Fair 0.621 Very Poor
(4) 25+935.9 – 951.9 m 16.0 37 IV – Poor 0.367 Very Poor
(5) 25+951.9 – 958.4 m 6.5 44 III – Fair 0.722 Very Poor
(6) 25+958.4 – 980.4 m 22.0 35 IV - Poor 0.373 Very Poor
(7) 25+980.4 – 982.4 m 2.0 13 V - Very poor 0.042 Extremely poor
The tunnel support measures derived by RMR for each sector are presented in Table
6.27. In order to determine support measures according to Q74, an ESR value of 1.0
(for rail tunnels) was used, which gives the following equivalent dimension, De,
values: De (roof)=(Span/ESR)=10 m; De (walls)=(Height/ESR)=5 m. The support
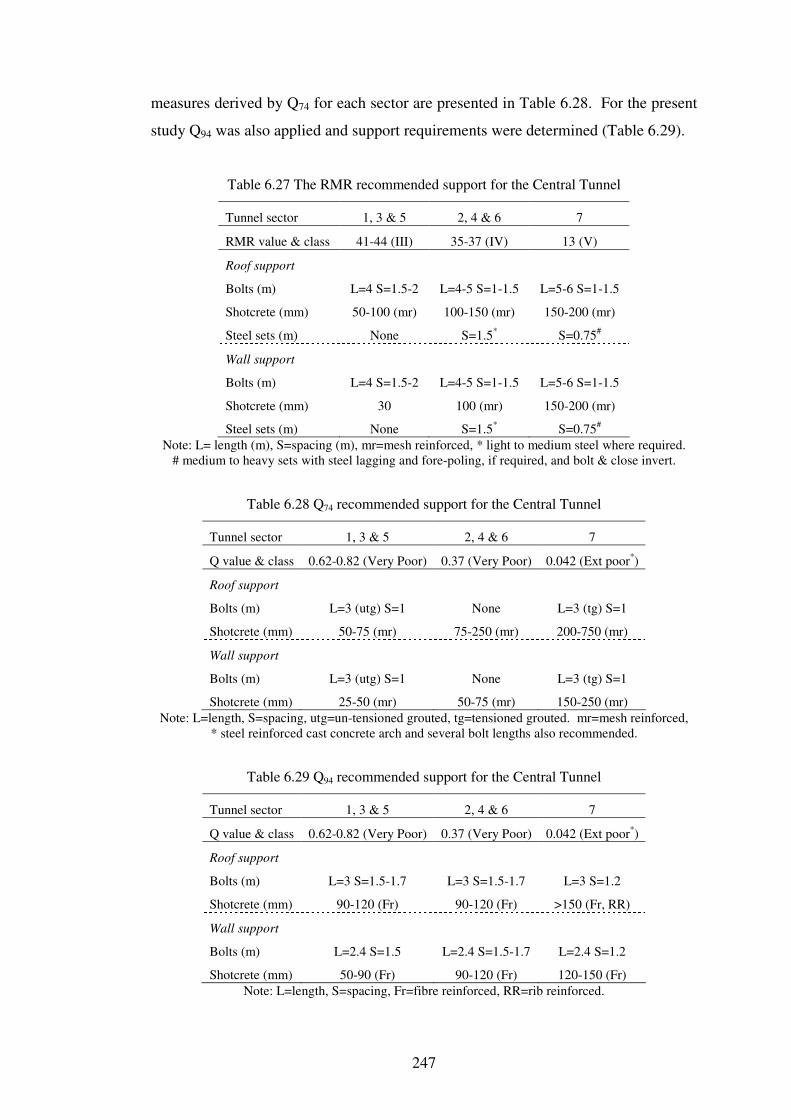
247
measures derived by Q74 for each sector are presented in Table 6.28. For the present
study Q94 was also applied and support requirements were determined (Table 6.29).
Table 6.27 The RMR recommended support for the Central Tunnel
Tunnel sector 1, 3 & 5 2, 4 & 6 7
RMR value & class 41-44 (III) 35-37 (IV) 13 (V)
Roof support
Bolts (m) L=4 S=1.5-2 L=4-5 S=1-1.5 L=5-6 S=1-1.5
Shotcrete (mm) 50-100 (mr) 100-150 (mr) 150-200 (mr)
Steel sets (m) None S=1.5*
S=0.75#
Wall support
Bolts (m) L=4 S=1.5-2 L=4-5 S=1-1.5 L=5-6 S=1-1.5
Shotcrete (mm) 30 100 (mr) 150-200 (mr)
Steel sets (m) None S=1.5*
S=0.75#
Note: L= length (m), S=spacing (m), mr=mesh reinforced, * light to medium steel where required.
# medium to heavy sets with steel lagging and fore-poling, if required, and bolt & close invert.
Table 6.28 Q74 recommended support for the Central Tunnel
Tunnel sector 1, 3 & 5 2, 4 & 6 7
Q value & class 0.62-0.82 (Very Poor) 0.37 (Very Poor) 0.042 (Ext poor*)
Roof support
Bolts (m) L=3 (utg) S=1 None L=3 (tg) S=1
Shotcrete (mm) 50-75 (mr) 75-250 (mr) 200-750 (mr)
Wall support
Bolts (m) L=3 (utg) S=1 None L=3 (tg) S=1
Shotcrete (mm) 25-50 (mr) 50-75 (mr) 150-250 (mr)
Note: L=length, S=spacing, utg=un-tensioned grouted, tg=tensioned grouted. mr=mesh reinforced,
* steel reinforced cast concrete arch and several bolt lengths also recommended.
Table 6.29 Q94 recommended support for the Central Tunnel
Tunnel sector 1, 3 & 5 2, 4 & 6 7
Q value & class 0.62-0.82 (Very Poor) 0.37 (Very Poor) 0.042 (Ext poor*)
Roof support
Bolts (m) L=3 S=1.5-1.7 L=3 S=1.5-1.7 L=3 S=1.2
Shotcrete (mm) 90-120 (Fr) 90-120 (Fr) >150 (Fr, RR)
Wall support
Bolts (m) L=2.4 S=1.5 L=2.4 S=1.5-1.7 L=2.4 S=1.2
Shotcrete (mm) 50-90 (Fr) 90-120 (Fr) 120-150 (Fr)
Note: L=length, S=spacing, Fr=fibre reinforced, RR=rib reinforced.
248
6.6.4 Tetrahedral Wedge Stability Analysis
The tetrahedral rock wedge analysis performed using UNWEDGE showed that
several rock wedges are kinematically unstable, however, only three are large enough
to warrant a stability analysis. To assess the sensitivity of the stability of these
wedges to joint shear strength, two strength scenarios were considered: the best
scenario c=20 kPa and Φ=35o and the worst scenario c=10 kPa and Φ=20
o. The best
scenario was determined using the empirical relationship of Barton and Choubey
(1977) discussed in Chapter 2 and given below:
τp = σn tan {Φb + JRC Log10(JCS/σn)} (2.7)
where τp = shear strength; σn=joint normal stress; JRC=joint roughness coefficient;
JCS=joint compressive strength. From the data presented by Yu-Shan (1987), the
following values were selected for the determination of joint shear strength: JCS=54
MPa, JRC=2.5, Φb=30o (assumed based on test results reported in Case Study 1), and
σn=5.4 MPa (vertical stress due to gravity). These values return c=20 kPa and
Φ=31o. These joint shear strength values were validated using the “frictional
component only” (c=0) relationship Φ=tan-1
(Jr/Ja) suggested by Barton (2002). For
the tunnel interval studied, the Jr parameter was given a rating from 1 to 3 inclusive
and the Ja parameter was given a rating from 4 to 8 inclusive. For the best case Jr
and Ja ratings Φ(best)=tan-1
(3.0/4.0)=37o. This is comparable to the above quoted
strength values. For the worst and average Jr and Ja ratings Φ(worst)=tan-
1(1.0/8.0)=7
o and Φ(avg)=tan
-1(2.0/6.0)=18
o. These joint friction angles show that
the selected worst case joint shear strength parameters are not unrealistically low for
the purpose of this study.
The analysis also considered two field stress scenarios. The first assumed that the
wedges are subjected to gravity loading only with no effect from the in situ stress
field. The second included an inferred in situ stress field assumed to be due to the
weight of the overlying rock/soil only with k=σh/σv=1.5. The FOS of the three
wedges under the best and worst joint shear strength scenarios with and without the
effect of in situ stress field are presented in Table 6.30. The effect of the empirically
derived support on the three wedges was also analysed. The results showed that the
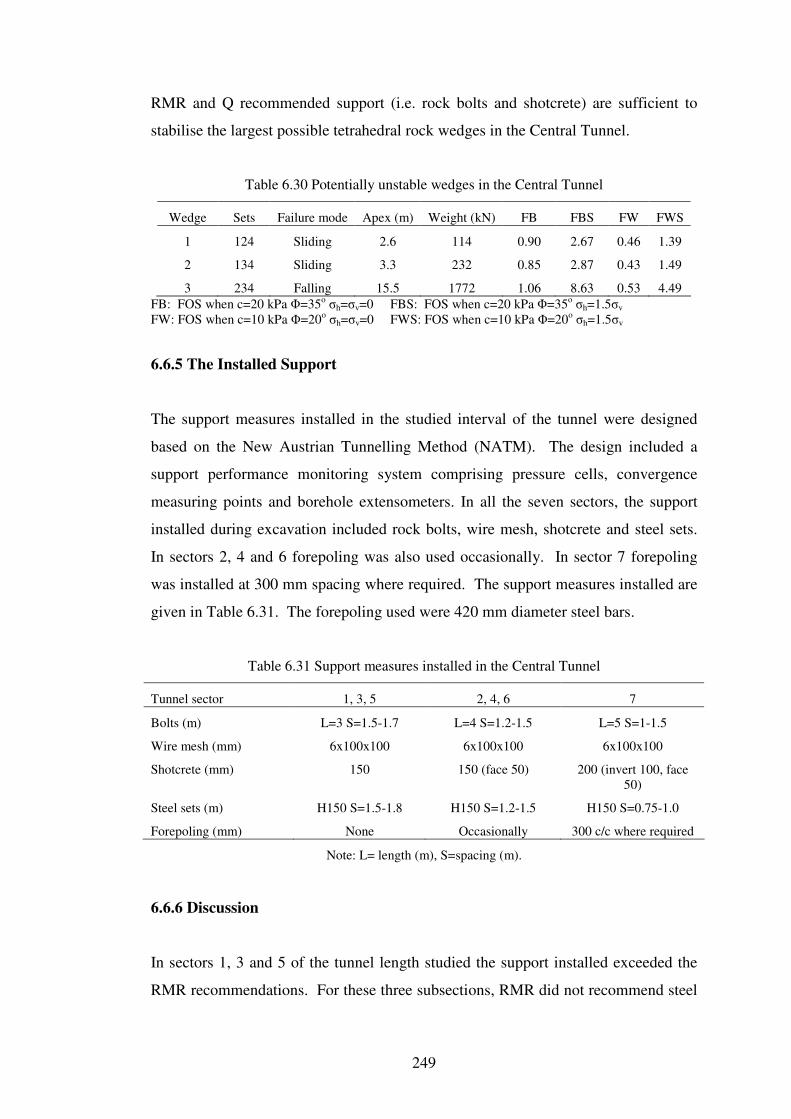
249
RMR and Q recommended support (i.e. rock bolts and shotcrete) are sufficient to
stabilise the largest possible tetrahedral rock wedges in the Central Tunnel.
Table 6.30 Potentially unstable wedges in the Central Tunnel
Wedge Sets Failure mode Apex (m) Weight (kN) FB FBS FW FWS
1 124 Sliding 2.6 114 0.90 2.67 0.46 1.39
2 134 Sliding 3.3 232 0.85 2.87 0.43 1.49
3 234 Falling 15.5 1772 1.06 8.63 0.53 4.49
FB: FOS when c=20 kPa Φ=35o σh=σv=0 FBS: FOS when c=20 kPa Φ=35
o σh=1.5σv
FW: FOS when c=10 kPa Φ=20o σh=σv=0 FWS: FOS when c=10 kPa Φ=20
o σh=1.5σv
6.6.5 The Installed Support
The support measures installed in the studied interval of the tunnel were designed
based on the New Austrian Tunnelling Method (NATM). The design included a
support performance monitoring system comprising pressure cells, convergence
measuring points and borehole extensometers. In all the seven sectors, the support
installed during excavation included rock bolts, wire mesh, shotcrete and steel sets.
In sectors 2, 4 and 6 forepoling was also used occasionally. In sector 7 forepoling
was installed at 300 mm spacing where required. The support measures installed are
given in Table 6.31. The forepoling used were 420 mm diameter steel bars.
Table 6.31 Support measures installed in the Central Tunnel
Tunnel sector 1, 3, 5 2, 4, 6 7
Bolts (m) L=3 S=1.5-1.7 L=4 S=1.2-1.5 L=5 S=1-1.5
Wire mesh (mm) 6x100x100 6x100x100 6x100x100
Shotcrete (mm) 150 150 (face 50) 200 (invert 100, face
50)
Steel sets (m) H150 S=1.5-1.8 H150 S=1.2-1.5
H150 S=0.75-1.0
Forepoling (mm) None Occasionally 300 c/c where required
Note: L= length (m), S=spacing (m).
6.6.6 Discussion
In sectors 1, 3 and 5 of the tunnel length studied the support installed exceeded the
RMR recommendations. For these three subsections, RMR did not recommend steel
250
ribs, but steel ribs were installed during construction. Further, RMR recommended a
shotcrete layer considerably thinner than the installed shotcrete thickness of 150 mm.
Only the RMR recommended rock bolting pattern is comparable to the installed
bolting pattern. The support measures installed in tunnel sector 7 are virtually the
same as those recommended by RMR. In sectors 2, 4 and 6 the RMR
recommendations are comparable to the support measures installed (see Tables 6.27
and 6.31).
The Q74 recommendations on the other hand are not comparable to the actual support
installed except for the sector 7 for which Q74 recommends rock bolts plus 200 to
750 mm of mesh reinforced shotcrete. Q74 also recommended steel reinforced cast
concrete arch as an option for sector 7. In the case of sectors 1, 3 and 5, bolt lengths
and spacing recommended by Q74 were comparable to the actual bolting pattern
installed. Nevertheless, Q74 did not recommend steel ribs. Furthermore Q74
recommended a shotcrete thickness much less than the installed shotcrete thickness.
For sectors 2, 4 and 6, Q74 recommended only shotcrete and no rock bolts or steel
sets. As can be seen from Table 6.31, both rock bolts and steel sets were installed
during construction.
Q94 recommendations for Sectors 1 to 6 inclusive comprised 3 m long rock bolts at
1.5 to 1.7 m spacing and 90 to 120 mm of fibre reinforced shotcrete (Table 6.29).
For Sector 7 in addition to the bolts and shotcrete, reinforced ribs were also
recommended. As can be seen from Tables 6.29 and 6.31 the actual support
measures installed far exceeded those recommended by Q94.
Although the UNWEDGE analysis showed that the empirically determined support
measures are sufficient to stabilise the potentially unstable rock wedges, instability in
the tunnel during construction was not controlled by large rock wedges. The main
mode of failure during construction was loosening and unravelling due to the
fractured nature of the rock mass. This is clearly evidenced from the fact that the 78
m length of the tunnel required 59 excavation cycles with lengths varying from 1 to
2.9 m, the majority having a length of only 1 m. Moreover, the tunnel sectors 2, 4, 5
and 7 required forepoling.
251
6.6.7 Conclusion
The support measures installed in approximately 65% the tunnel section studied are
generally comparable to those recommended by RMR. For the remainder
(approximately 34%) of the tunnel length studied, the support installed exceeded the
RMR predictions. The Q recommendations are not comparable to the RMR
recommended support and the actual support measures installed far exceeded the Q
recommendations.
252
6.7 CASE STUDY 5:
The Lam Ta Khong Exploratory (LTKE) Tunnel, Thailand
The LTKE tunnel is part of the Lam Ta Khong pumped storage project constructed
between 1992 and 1997. The project is situated on the Lam Ta Khong River about
200 km northeast of Bangkok and involved the construction of the first underground
power station in Thailand. The major project components included several caverns
and tunnels. During the detailed design stage of the project, the D-shaped 3 m high,
3 m wide and 1340 m long exploratory tunnel was excavated by conventional drill
and blast methods to investigate the rock mass conditions in the project site. The
tunnel is horizontal with an alignment of 110o to the north, and the tunnel intervals
from 83 to 103 m and 158 to 179 m were located beneath a winding highway. The
tunnel overburden at the portal is about 15 m, at the far end is about 275 m, and
under the highway is between 20 and 30 m. Only the tunnel length from 110 m to
the far end at 1340 m was considered in the present study.
6.7.1 LTKE Project Site Geology
The bedrock in the project area composed of Phu Kradung Formation and Phra
Wihan Formation. The former comprised siltstone, fine-grained sandstone and
conglomerate, and the latter comprised coarse-grained sandstone, claystone and an
alternating sequence of fine-grained sandstone and siltstone. The rock beds are sub-
horizontal with a strike direction of N30oW to N70
oW and a dip of 5 to 10
o NE. The
bedrock formation is overlain by a several metres thick residual soil cover. Up to
30 m thick colluvial and talus deposits are present in the lower reaches of the hill
slopes where the exploratory tunnel portal is located.
6.7.2 LTKE Tunnel Rock Mass data
From the portal to about 110 m, the materials intersected in the tunnel are colluviums
and talus deposits consisting pieces of sandstone and siltstone ranging from gravel
size to large boulders in a very stiff to hard clay matrix. In the tunnel interval from
110 m to the far end at 1340 m an alternating sequence of muddy siltstone and sandy
siltstone is present. The average intact rock UCS of muddy siltstone is 32 MPa and
253
that of sandy siltstone is 68 MPa. The rock intersected in the tunnel can be described
as medium strong to strong rock according to ISRM suggested methods (ISRM,
1978).
The siltstone and sandstone intersected from 110 m onwards are bedded rocks with
well developed bedding planes. From the data collected by mapping four
discontinuity sets were identified. The orientations of the discontinuity sets are given
in Table 6.32.
Table 6.32 Major discontinuity sets in the LTKE tunnel
Set Dip Direction
North dipping 00 – 35 000 – 035
South dipping 00 – 35 165 – 225
West dipping 00 – 45 255 – 315
East dipping 00 – 30 090 – 135
North dipping and south dipping joints are consistently present throughout the
tunnel. They occur as single joints or as zones of several joints. The zones are
usually 200 to 500 mm thick. Since the tunnel alignment is approximately 110o to
the north, these north and south dipping joints strike sub-parallel to the tunnel axis.
They are closely spaced, continuous, slickensided, undulating and have clay, calcite
or gypsum infilling materials with a general thickness of 1 to 5 mm with an
occasional maximum of 20 mm. They represent the bedding plane joint set. The
west dipping joint set has three sub sets with dip ranges from 0 to 30o, 30 to 45
o and
>45o. Persistence of these joints varies from 3 to 10 m. Their surfaces are planar,
fresh to slightly weathered and mostly tight, but sometimes slickensided and has a
clay gouge, calcite or gypsum filling of less than 50 mm in thickness. Often steeply
dipping members of this set splay off from the flatter ones dipping more or less in the
same direction. The east dipping joint set has a smaller joint population compared to
the others and may be a part of the west dipping set. Their surface characteristics are
similar to those of the west dipping set.
All these four joint systems are consistent throughout the tunnel with spacing ranging
from 300 to 1500 mm with the majority having spacing between 300 to 700 mm.
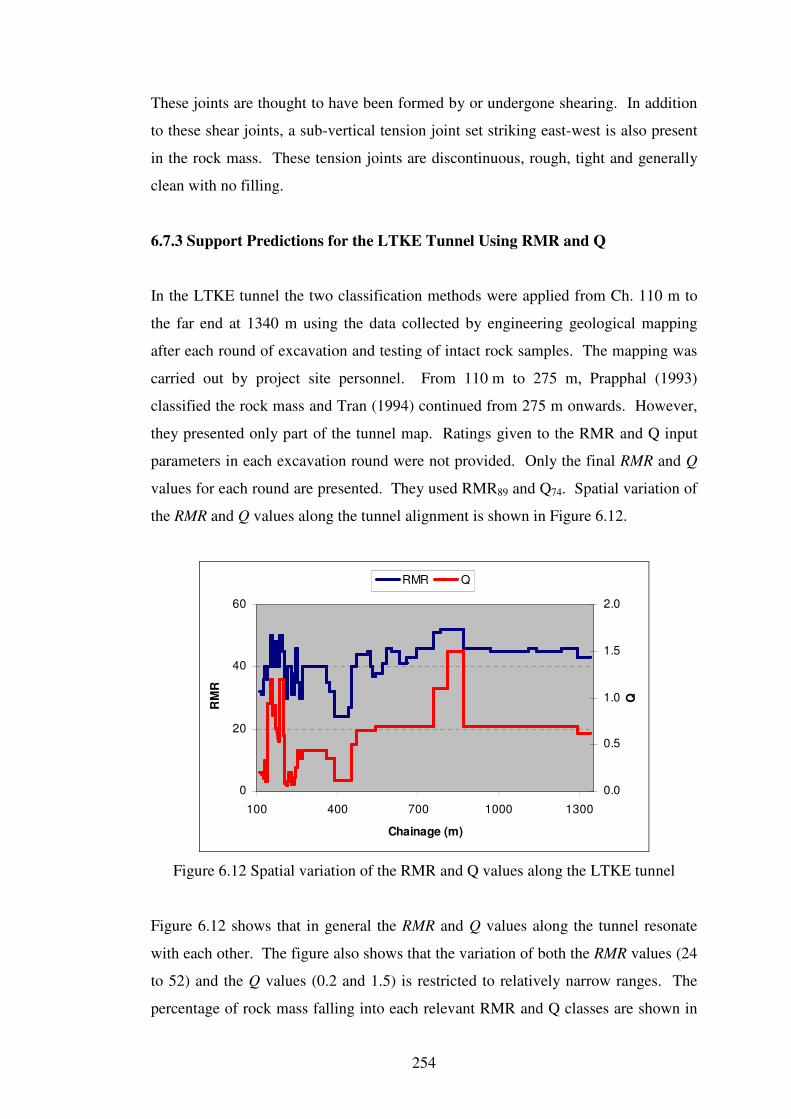
254
These joints are thought to have been formed by or undergone shearing. In addition
to these shear joints, a sub-vertical tension joint set striking east-west is also present
in the rock mass. These tension joints are discontinuous, rough, tight and generally
clean with no filling.
6.7.3 Support Predictions for the LTKE Tunnel Using RMR and Q
In the LTKE tunnel the two classification methods were applied from Ch. 110 m to
the far end at 1340 m using the data collected by engineering geological mapping
after each round of excavation and testing of intact rock samples. The mapping was
carried out by project site personnel. From 110 m to 275 m, Prapphal (1993)
classified the rock mass and Tran (1994) continued from 275 m onwards. However,
they presented only part of the tunnel map. Ratings given to the RMR and Q input
parameters in each excavation round were not provided. Only the final RMR and Q
values for each round are presented. They used RMR89 and Q74. Spatial variation of
the RMR and Q values along the tunnel alignment is shown in Figure 6.12.
0
20
40
60
100 400 700 1000 1300
Chainage (m)
RM
R
0.0
0.5
1.0
1.5
2.0
Q
RMR Q
Figure 6.12 Spatial variation of the RMR and Q values along the LTKE tunnel
Figure 6.12 shows that in general the RMR and Q values along the tunnel resonate
with each other. The figure also shows that the variation of both the RMR values (24
to 52) and the Q values (0.2 and 1.5) is restricted to relatively narrow ranges. The
percentage of rock mass falling into each relevant RMR and Q classes are shown in
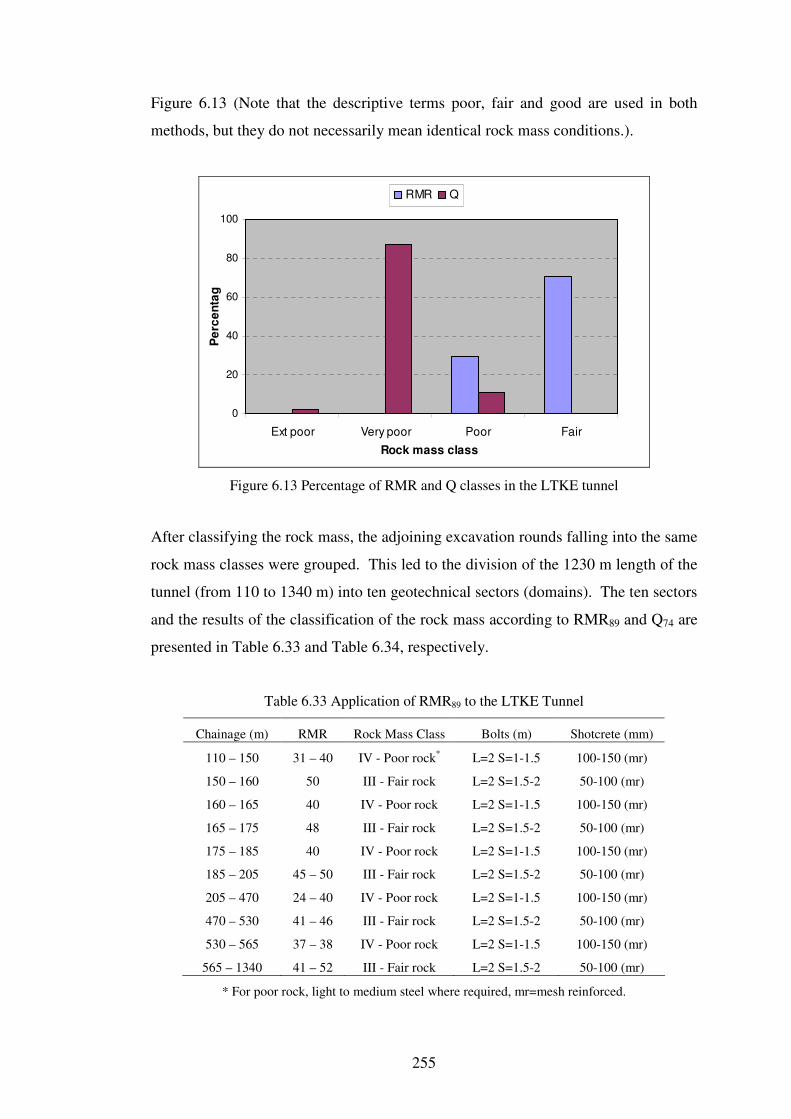
255
Figure 6.13 (Note that the descriptive terms poor, fair and good are used in both
methods, but they do not necessarily mean identical rock mass conditions.).
0
20
40
60
80
100
Ext poor Very poor Poor Fair
Rock mass class
Pe
rce
nta
g
RMR Q
Figure 6.13 Percentage of RMR and Q classes in the LTKE tunnel
After classifying the rock mass, the adjoining excavation rounds falling into the same
rock mass classes were grouped. This led to the division of the 1230 m length of the
tunnel (from 110 to 1340 m) into ten geotechnical sectors (domains). The ten sectors
and the results of the classification of the rock mass according to RMR89 and Q74 are
presented in Table 6.33 and Table 6.34, respectively.
Table 6.33 Application of RMR89 to the LTKE Tunnel
Chainage (m) RMR Rock Mass Class Bolts (m) Shotcrete (mm)
110 – 150 31 – 40 IV - Poor rock*
L=2 S=1-1.5 100-150 (mr)
150 – 160 50 III - Fair rock L=2 S=1.5-2 50-100 (mr)
160 – 165 40 IV - Poor rock L=2 S=1-1.5 100-150 (mr)
165 – 175 48 III - Fair rock L=2 S=1.5-2 50-100 (mr)
175 – 185 40 IV - Poor rock L=2 S=1-1.5 100-150 (mr)
185 – 205 45 – 50 III - Fair rock L=2 S=1.5-2 50-100 (mr)
205 – 470 24 – 40 IV - Poor rock L=2 S=1-1.5 100-150 (mr)
470 – 530 41 – 46 III - Fair rock L=2 S=1.5-2 50-100 (mr)
530 – 565 37 – 38 IV - Poor rock L=2 S=1-1.5 100-150 (mr)
565 – 1340 41 – 52 III - Fair rock L=2 S=1.5-2 50-100 (mr)
* For poor rock, light to medium steel where required, mr=mesh reinforced.
256
RMR classified 29% of the rock mass in the tunnel as poor rock and 71% as fair
rock. Q classified 7% of the rock mass in the tunnel as extremely poor rock, 82% as
very poor rock and the remaining 11% as poor rock.
Table 6.34 Application of Q74 to the LTKE Tunnel
Chainage (m) Q Rock Mass Class Rock Bolts (m) Shotcrete (mm)
110 – 150 0.11 – 0.94 Very poor L=2 S=1 (tg) 50 (mr)
150 – 160 1.2 Poor None None
160 – 185 0.54 – 0.81 Very poor L=2 S=1 (tg) 50 (mr)
185 – 200 1.2 Poor None None
200 – 205 0.6 Very poor L=2 S=1 (tg) 50 (mr)
205 – 215 0.06 – 0.09 Extremely poor L=2 S=1 (tg) 25-50 (mr)
215 – 230 0.11 – 0.2 Very poor L=2 S=1 (tg) 50 (mr)
230 – 240 0.07 Extremely poor L=2 S=1 (tg) 25-50 (mr)
240 – 760 0.12 – 0.7 Very poor L=2 S=1 (tg) 50 (mr)
760 – 870 1.13 – 1.5 Poor None None
870 – 1340 0.62 – 0.7 Very poor L=2 S=1 (tg) 50 (mr)
Note: tg=tensioned grouted, mr=mesh reinforced.
For the poor rock class, RMR89 recommended systematic bolting at 1 to 1.5 m
spacing plus 100 to 150 mm of mesh reinforced shotcrete and light to medium steel
ribs spaced at 1.5 m. For fair rock, RMR89 recommended the same bolting pattern
plus 50 to 100 mm of mesh reinforced shotcrete. Since the RMR recommended bolts
lengths are for 10 m diameter tunnels only, for the case tunnel, bolt lengths were
estimated using the formula L=1.4+0.184a, where “L” is bolt length and “a” is tunnel
span, proposed by the Norwegian Institute of Rock Blasting Techniques.
In order to determine the support requirements according to Q74, it was assumed that
ESR=3 (temporary opening), hence the equivalent dimension, De=1. For extremely
poor rock, which represents only about 7% of the tunnel, depending on the block size
(RQD/Jn), Q74 would recommend 2 m long tensioned grouted systematic bolts in a 1
m grid plus 25 to 50 mm of wire mesh reinforced shotcrete, or 50 to 100 mm of wire
mesh reinforced shotcrete without rock bolts. For very poor rock Q74 would
recommend the same bolt pattern plus 50 mm of wire mesh reinforced shotcrete.
According to Q74 no support is required for the poor rock, which represents
approximately 11% of the tunnel. Even if a lower ESR value is used (i.e. 1.8 for pilot
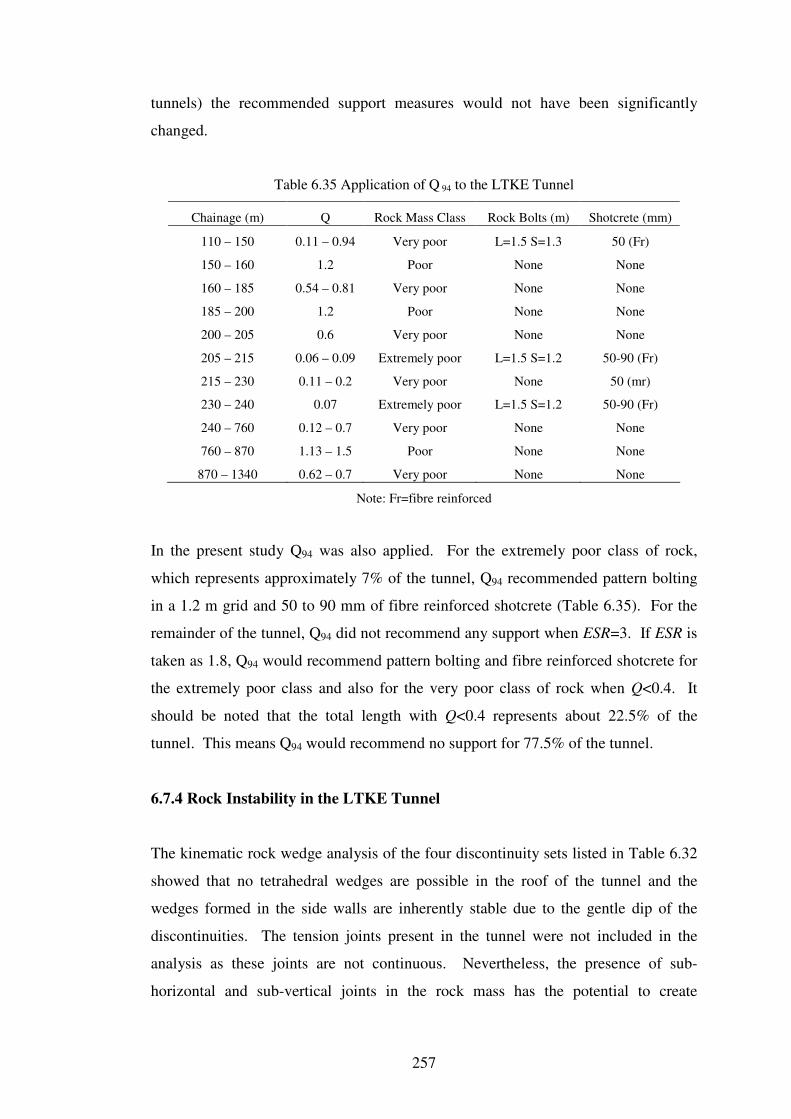
257
tunnels) the recommended support measures would not have been significantly
changed.
Table 6.35 Application of Q 94 to the LTKE Tunnel
Chainage (m) Q Rock Mass Class Rock Bolts (m) Shotcrete (mm)
110 – 150 0.11 – 0.94 Very poor L=1.5 S=1.3 50 (Fr)
150 – 160 1.2 Poor None None
160 – 185 0.54 – 0.81 Very poor None None
185 – 200 1.2 Poor None None
200 – 205 0.6 Very poor None None
205 – 215 0.06 – 0.09 Extremely poor L=1.5 S=1.2 50-90 (Fr)
215 – 230 0.11 – 0.2 Very poor None 50 (mr)
230 – 240 0.07 Extremely poor L=1.5 S=1.2 50-90 (Fr)
240 – 760 0.12 – 0.7 Very poor None None
760 – 870 1.13 – 1.5 Poor None None
870 – 1340 0.62 – 0.7 Very poor None None
Note: Fr=fibre reinforced
In the present study Q94 was also applied. For the extremely poor class of rock,
which represents approximately 7% of the tunnel, Q94 recommended pattern bolting
in a 1.2 m grid and 50 to 90 mm of fibre reinforced shotcrete (Table 6.35). For the
remainder of the tunnel, Q94 did not recommend any support when ESR=3. If ESR is
taken as 1.8, Q94 would recommend pattern bolting and fibre reinforced shotcrete for
the extremely poor class and also for the very poor class of rock when Q<0.4. It
should be noted that the total length with Q<0.4 represents about 22.5% of the
tunnel. This means Q94 would recommend no support for 77.5% of the tunnel.
6.7.4 Rock Instability in the LTKE Tunnel
The kinematic rock wedge analysis of the four discontinuity sets listed in Table 6.32
showed that no tetrahedral wedges are possible in the roof of the tunnel and the
wedges formed in the side walls are inherently stable due to the gentle dip of the
discontinuities. The tension joints present in the tunnel were not included in the
analysis as these joints are not continuous. Nevertheless, the presence of sub-
horizontal and sub-vertical joints in the rock mass has the potential to create
258
polyhedral rock blocks or slabs. Tran (1994) observed that the main modes of
instability in the exploratory tunnel were loosening of rock from tunnel crown and
walls due to the presence of these discontinuities. Very often rock falls occurred not
in the form of true wedges (Tran, 1994). In the crown, slab or block falls occurred
through intact rock failure while flat dipping bedding planes provided separation
(release plane). The sub-vertical tension joints parallel to the tunnel axis (striking
east-west), although discontinuous, may also have contributed to the slab or block
falls from the tunnel roof as illustrated in Figure 6.14.
Figure 6.14 Modes of rock falls in the LTKE tunnel
Other modes of instability in the exploratory tunnel include immediate and delayed
stress induced rock slabbing in side walls and water dependent slaking and swelling.
Stress slabbing was more noticeable when the tunnel depth exceeded 150 m below
ground surface, i.e. from Station 945 m onwards where inferred in situ stress levels
were higher than in the rest of the tunnel. The vertical stress at Stations 945 and
1340 m was estimated to be 4 and 7 MPa and corresponding σH normal to the tunnel
axis is 8 and 14 MPa respectively (dry unit weight of the rock is 2.7 t/m3, k=2 and
the respective overburden is 150 and 275 m). In this length the tunnel walls below
the spring line were not covered with shotcrete. Thin rock slabs of 5 to 100 mm
thickness were formed up to a depth of about 0.5 m into the side walls. Stress
slabbing was also seen in the tunnel face. Slaking was observed in siltstone when in
contact with water or moisture. In general, the tunnel was mostly dry, except for
some isolated wet patches, yet slaking occurred apparently due to the moisture in the
air. Water used for drilling is considered to have contributed to the high moisture
259
content during excavation. However, the slaking was restricted to walls not covered
with shotcrete and not significant to compromise safety during the required operating
life of the LTKE tunnel.
6.7.5 The Actual Support Installed
In the first 110 m of the tunnel, which was driven through colluvial and talus
deposits, heavy steel support plus timber lagging were used. From 110 to 1340 m
depending on the rock mass conditions the support included steel sets, shotcrete with
or without wire mesh and rock bolts. A summary of the support installed in this
length of the tunnel is presented in Table 6.35. From 110 to 187 m the support
installed included steel sets with 0.6 to 1.2 m spacing and shotcrete with a nominal
thickness of 70 mm. For the tunnel intervals from 95 to 116 m and 158 to 179 m,
located under the highway, 0.6 m spaced steel sets and a 250 mm thick shotcrete
layer were used. The closer steel set spacing and thicker shotcrete layer were to
reduce the risk of long term ground settlement and damage to the highway.
Therefore the support installed in these two intervals cannot be directly compared
with those predicted by the classification approach. (Note that part of the first tunnel
interval beneath the highway was located within colluvial material.)
Table 6.35 Support installed in the LTKE Tunnel
Chainage (m) Rock bolts (m) Shotcrete (mm) Steel sets (m) Remarks
110-116 250 H125 S=0.6 Transition zone
116-136 70 H125 S=0.6
136-143 70 H125 S=1.2
143-179 250 H125 S=0.9 Highway above
179-187 70 H125 S=1.2
187-378 70 (mr)
378-389 70 H125 S=0.6
389-400 L=1.5; S=1-1.5 70 H125 S=1.2
400-420 L=1.5; S=1-1.5 70
420-430 70 H125 S=1.2
430-780 L=1.5; S=1-1.5 70
780-1340 L=1.5; S=1-1.5 70 Walls unsupported
Note: L= length (m), S=spacing (m), mr=mesh reinforced.
260
From chainage 187 to 378 m (191 m interval) the actual support installed were 70
mm of shotcrete with wire mesh reinforcement, from 378 to 389 m and from 420 to
430 m steel sets and 70 mm of shotcrete, from 389 to 400 m steel sets rock bolts and
shotcrete, from 400 to 420 m and from 430 to 1340 m bolts and shotcrete (Table
6.35).
6.7.6 Discussion
From chainage 187 to 378 m the actual support installed were 70 mm of shotcrete
with wire mesh reinforcement without rock bolts. Both RMR89 and Q74
recommended support for this interval included systematic rock bolting. In addition,
for poorer sections of this interval, RMR89 also recommended light to medium steel
ribs spaced at 1.5 m. This means the RMR89 and Q74 recommendations for the 191 m
interval were more conservative than those actually installed. For tunnel intervals
from 378 to 400 m and 420 to 430 m support installed included steel ribs, rock bolts
and shotcrete. These support measures are closely comparable to the RMR89
recommended support. The Q74 recommended support does not include steel sets
and can be considered insufficient for this interval. Apart from the above, the
support measures installed from 430 to 1340 m and from 400 to 420 m (76% of the
tunnel) were comparable to those predicted by Q74. The only difference is that
although Q74 recommended wire mesh reinforced shotcrete, no wire mesh was used
with shotcrete for this length (76% of the total length) of the tunnel. Again the
RMR89 recommended support measures are closely comparable to the support
installed within this length.
For the extremely poor class of rock, which represents approximately 7% of the
tunnel, Q94 recommended pattern bolting in a 1.2 m grid and 50 to 90 mm of fibre
reinforced shotcrete (Table 6.35). For the remainder of the tunnel, Q94 did not
recommend any support when ESR=3. If ESR is taken as 1.8, Q94 would recommend
pattern bolting and fibre reinforced shotcrete for the very poor class of rock when
Q<0.4. It should be noted that the total length with Q<0.4 is about 22.5% of the
tunnel. This means Q94 would recommend no support for 77.5% of the tunnel.
From the foregoing it is apparent that for small diameter (~3 m) tunnels such as
261
LTKE the current version of the Q system, Q94, recommended less support compared
to the earlier version, Q74.
6.7.7 Conclusion
In the exploratory tunnel, support measures installed from 430 to 1340 m and from
400 to 420 m (76% of the tunnel) were comparable to those predicted by RMR89 and
Q74 the only difference being that although Q74 recommended wire mesh reinforced
shotcrete, no wire mesh was used with shotcrete in these intervals. In the remaining
24% of the tunnel, the support measures recommended by the two empirical methods
were more conservative than those installed. The only exceptions were the intervals
from 378 to 400 m and 420 to 430 m, for which the Q74 recommendation falls short
of the support installed. However, the comparison showed that Q94 did not
recommend any support for 77.5% of the tunnel. Even if ESR is taken as 1.8 (pilot
or water tunnel), Q94 would recommend pattern bolting and fibre reinforced shotcrete
for only 22%. For this small diameter tunnel the current version of the Q system,
Q94, is less conservative compared to the earlier version, Q74, and did not recommend
adequate support.
262
6.8 CASE STUDY 6:
The Lam Ta Khong Powerhouse Access (LTKPA) Tunnel, Thailand
The LTKPA tunnel is the main access route to the underground power station of the
Lam Ta Khong pumped storage project discussed in Section 6.7. The tunnel is 1060
m long and has a D-shape. The excavated diameter of the tunnel is 6.8 m and the
finished diameter is 6 m. The tunnel alignment is approximately 107o with a
downward slope of 1:12 (V:H) towards the power station. The tunnel was excavated
by conventional drill and blast methods. Its overburden varies from about 15 m at
the entrance portal to approximately 350 m at the powerhouse end. Construction of
the tunnel took place between October 1994 and October 1995. The tunnel interval
from 94 m to 125 m is located under a highway. For this study only an 885 m length
of the tunnel (from 180 m to 1065 m) was considered.
6.8.1 Project Site Geology
The geology of the project area is described in Section 6.7.1.
6.8.2 LTKPA Tunnel Rock Mass Data
According to Sriwisead (1996), from the portal to 180 m, the tunnel was driven
through talus material and highly weathered siltstone. Slightly weathered siltstone
intersected in the tunnel interval from 180 to 220 m. From 220 m to the powerhouse
end, a fresh rock sequence consisting of sandy siltstone and sandstone is present.
Sandstone contains 2 to 20 mm thick micaceous seams and occasional 5 to 30 mm
peat or lignite bearing layers. Sandstone beds are 200 to 1000 mm thick. Sandy
siltstone is an inter-bedded rock consisting of 100 to 1500 mm thick beds of siltstone
with occasional beds of sandstone. The results of the intact rock material testing
conducted at various stages of the project were reported by Sriwisead (1996) and
Praphal (1993). A summary of the relevant results is presented in Table 6.36.
Five discontinuity sets are present in the rock mass. In any selected interval of the
tunnel, typically two to three sets are present with others at random. The
discontinuity orientations vary along the tunnel. The average orientations of the five
263
sets are presented in Table 6.37. The flat dipping bedding plane set (Set 1) with a
dip range of 3 to 10o is the most prominent in the entire length of the tunnel.
Bedding is well developed with a consistent orientation. Bedding planes are defined
by thin alternating seams of mica and mud with smooth planar to slickensided planar
surface characteristics (Sriwisead, 1996).
Table 6.36 Intact rock material properties of the LTKPA tunnel
Property Sandstone Siltstone
UCS (MPa) 20-100 20-80
E Modulus (GPa) 25-33 20-22
Poisson’s Ratio 0.29 0.16
Density (kN/m3) 25.5 25.9
Tensile strength (MPa) 7.6 9.3
Table 6.37 Orientations of discontinuity sets (LTKPA tunnel)
Set # 1 2 3 4 5
Dip 7 83 82 29 32
Direction 285 207 298 320 231
Sets 2 and 3 are major joint sets consistently present throughout the 885 m length of
the tunnel. Their spacing varies from 500 to 2000 mm. The two sets are continuous
across the tunnel and are mostly tight and undulating to planar. In siltstone, they are
sometimes slickensided with a 2 to 8 mm thick calcite infilling, and their surfaces are
slightly weathered to fresh. Joint Sets 4 and 5, developed only in siltstone, are
mostly tight, slickensided and planar with calcite or gypsum infill material. Set 1 has
a significant effect on the stability of the tunnel as it forms rock slabs, particularly in
the crown. The sub-vertical joints (Sets 2 and 3) in combination with Set 1 were
responsible for flat roofs, stepped over-breaks and block falls (Gurung, and Iwao,
1998). The in situ stress levels at relevant depths were determined by hydraulic
fracturing tests conducted in boreholes. The tests indicated that the major principal
stress is horizontal (σH) and normal to the tunnel axis (Sriwisead, 1996; Nitaramorn,
1997). The intermediate principal stress is vertical (σv) and is slightly greater than
the minor principal stress (σh). The σH:σv ratio, k, is interpreted to be in the vicinity
of 2. The tunnel was mostly dry, except for localized wet areas with water dripping
along sub-vertical discontinuities, mostly in sandstone.
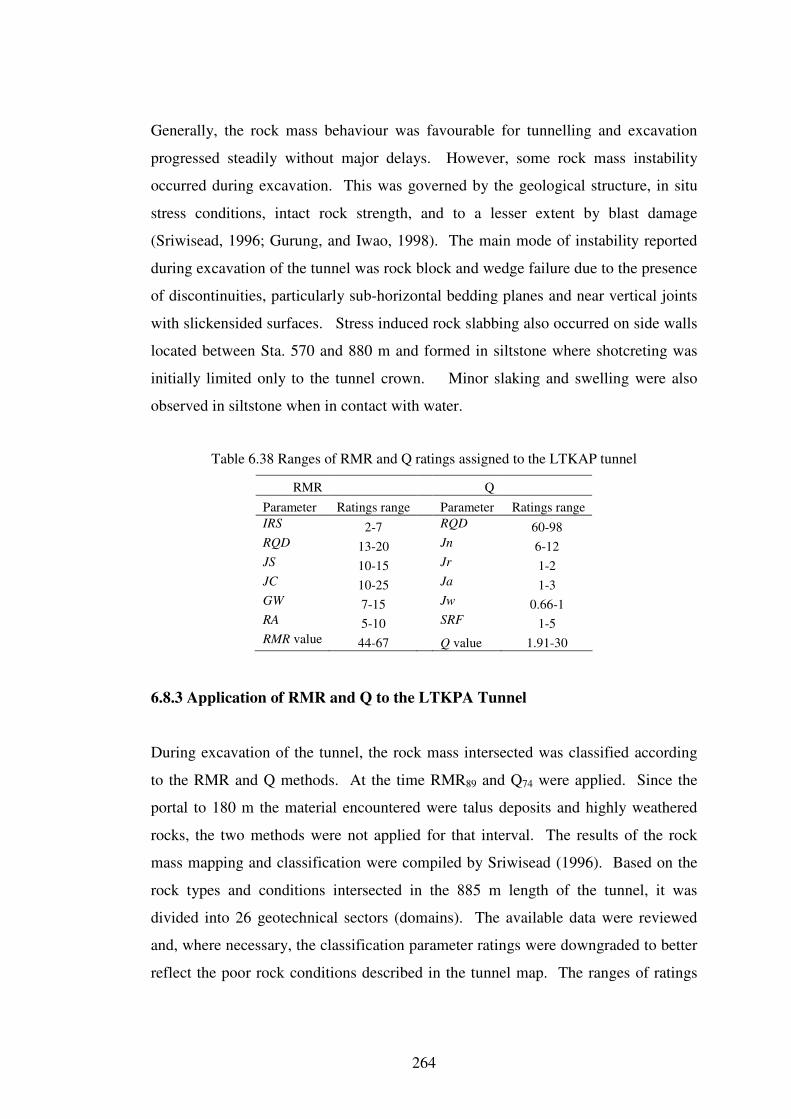
264
Generally, the rock mass behaviour was favourable for tunnelling and excavation
progressed steadily without major delays. However, some rock mass instability
occurred during excavation. This was governed by the geological structure, in situ
stress conditions, intact rock strength, and to a lesser extent by blast damage
(Sriwisead, 1996; Gurung, and Iwao, 1998). The main mode of instability reported
during excavation of the tunnel was rock block and wedge failure due to the presence
of discontinuities, particularly sub-horizontal bedding planes and near vertical joints
with slickensided surfaces. Stress induced rock slabbing also occurred on side walls
located between Sta. 570 and 880 m and formed in siltstone where shotcreting was
initially limited only to the tunnel crown. Minor slaking and swelling were also
observed in siltstone when in contact with water.
Table 6.38 Ranges of RMR and Q ratings assigned to the LTKAP tunnel
RMR Q
Parameter Ratings range Parameter Ratings range
IRS 2-7 RQD 60-98
RQD 13-20 Jn 6-12
JS 10-15 Jr 1-2
JC 10-25 Ja 1-3
GW 7-15 Jw 0.66-1
RA 5-10 SRF 1-5
RMR value 44-67 Q value 1.91-30
6.8.3 Application of RMR and Q to the LTKPA Tunnel
During excavation of the tunnel, the rock mass intersected was classified according
to the RMR and Q methods. At the time RMR89 and Q74 were applied. Since the
portal to 180 m the material encountered were talus deposits and highly weathered
rocks, the two methods were not applied for that interval. The results of the rock
mass mapping and classification were compiled by Sriwisead (1996). Based on the
rock types and conditions intersected in the 885 m length of the tunnel, it was
divided into 26 geotechnical sectors (domains). The available data were reviewed
and, where necessary, the classification parameter ratings were downgraded to better
reflect the poor rock conditions described in the tunnel map. The ranges of ratings
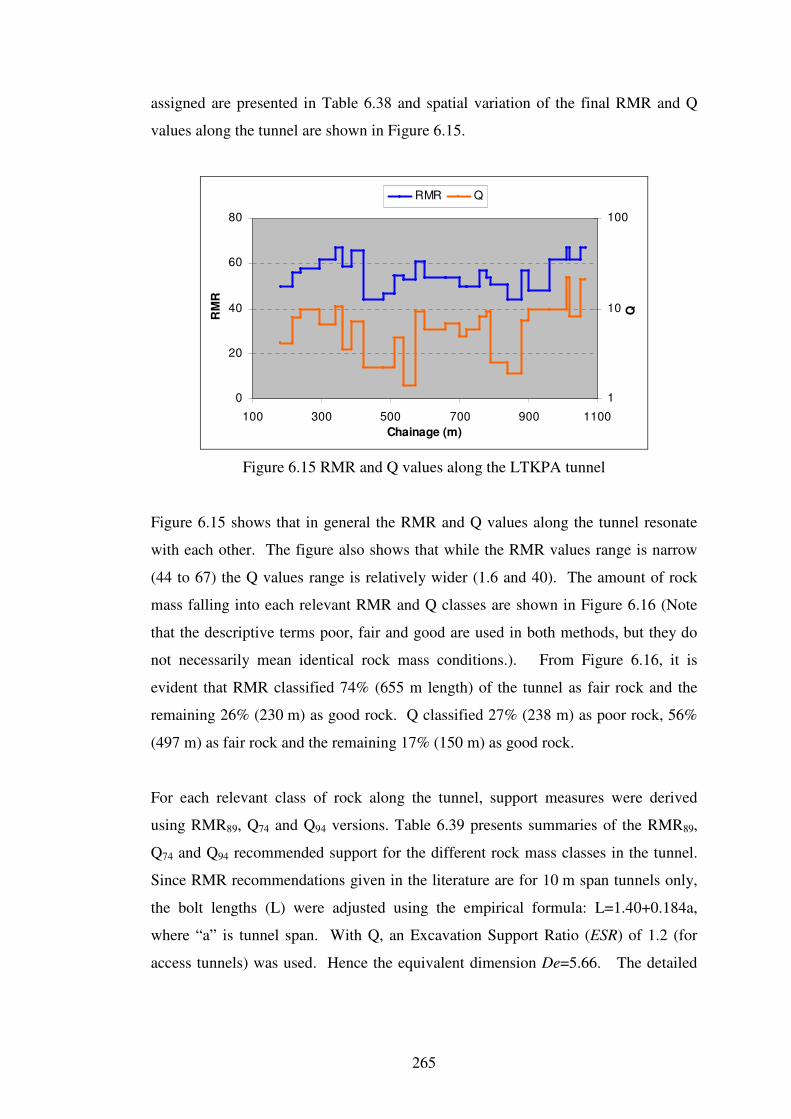
265
assigned are presented in Table 6.38 and spatial variation of the final RMR and Q
values along the tunnel are shown in Figure 6.15.
0
20
40
60
80
100 300 500 700 900 1100
Chainage (m)
RM
R
1
10
100
Q
RMR Q
Figure 6.15 RMR and Q values along the LTKPA tunnel
Figure 6.15 shows that in general the RMR and Q values along the tunnel resonate
with each other. The figure also shows that while the RMR values range is narrow
(44 to 67) the Q values range is relatively wider (1.6 and 40). The amount of rock
mass falling into each relevant RMR and Q classes are shown in Figure 6.16 (Note
that the descriptive terms poor, fair and good are used in both methods, but they do
not necessarily mean identical rock mass conditions.). From Figure 6.16, it is
evident that RMR classified 74% (655 m length) of the tunnel as fair rock and the
remaining 26% (230 m) as good rock. Q classified 27% (238 m) as poor rock, 56%
(497 m) as fair rock and the remaining 17% (150 m) as good rock.
For each relevant class of rock along the tunnel, support measures were derived
using RMR89, Q74 and Q94 versions. Table 6.39 presents summaries of the RMR89,
Q74 and Q94 recommended support for the different rock mass classes in the tunnel.
Since RMR recommendations given in the literature are for 10 m span tunnels only,
the bolt lengths (L) were adjusted using the empirical formula: L=1.40+0.184a,
where “a” is tunnel span. With Q, an Excavation Support Ratio (ESR) of 1.2 (for
access tunnels) was used. Hence the equivalent dimension De=5.66. The detailed
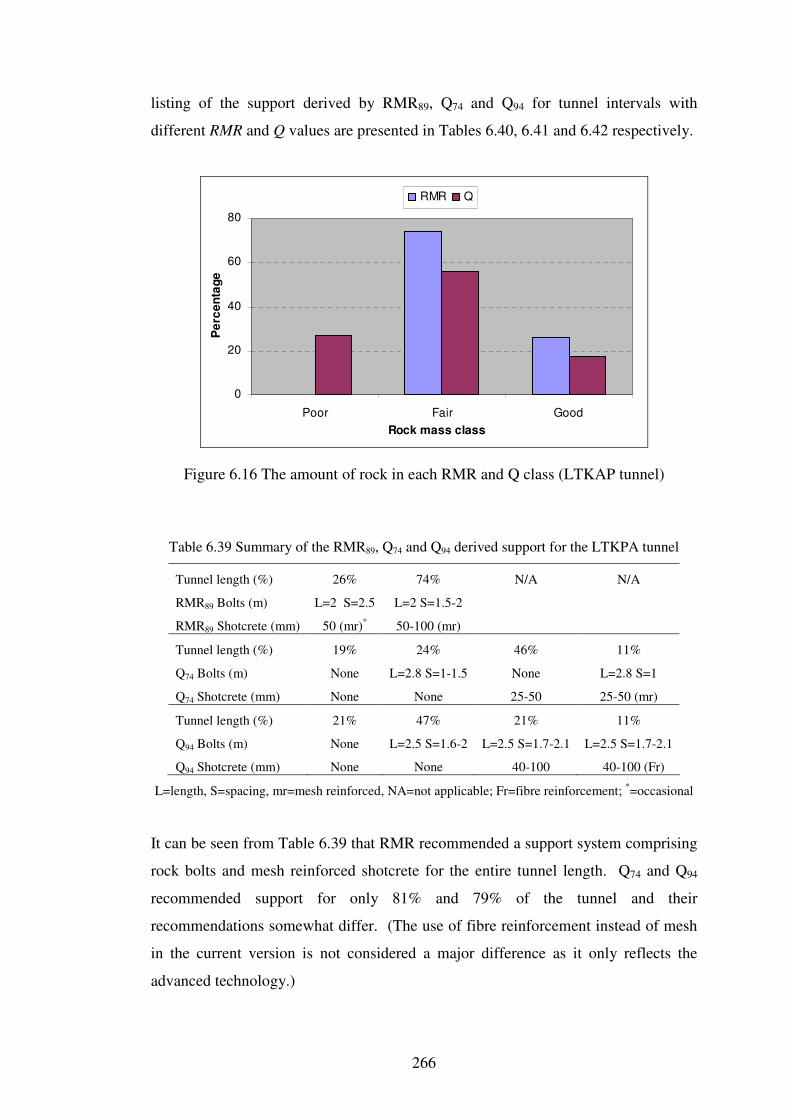
266
listing of the support derived by RMR89, Q74 and Q94 for tunnel intervals with
different RMR and Q values are presented in Tables 6.40, 6.41 and 6.42 respectively.
0
20
40
60
80
Poor Fair Good
Rock mass class
Pe
rce
nta
ge
RMR Q
Figure 6.16 The amount of rock in each RMR and Q class (LTKAP tunnel)
Table 6.39 Summary of the RMR89, Q74 and Q94 derived support for the LTKPA tunnel
Tunnel length (%) 26% 74% N/A N/A
RMR89 Bolts (m) L=2 S=2.5 L=2 S=1.5-2
RMR89 Shotcrete (mm) 50 (mr)*
50-100 (mr)
Tunnel length (%) 19% 24% 46% 11%
Q74 Bolts (m) None L=2.8 S=1-1.5 None L=2.8 S=1
Q74 Shotcrete (mm) None None 25-50 25-50 (mr)
Tunnel length (%) 21% 47% 21% 11%
Q94 Bolts (m) None L=2.5 S=1.6-2 L=2.5 S=1.7-2.1 L=2.5 S=1.7-2.1
Q94 Shotcrete (mm) None None 40-100
40-100 (Fr)
L=length, S=spacing, mr=mesh reinforced, NA=not applicable; Fr=fibre reinforcement; *=occasional
It can be seen from Table 6.39 that RMR recommended a support system comprising
rock bolts and mesh reinforced shotcrete for the entire tunnel length. Q74 and Q94
recommended support for only 81% and 79% of the tunnel and their
recommendations somewhat differ. (The use of fibre reinforcement instead of mesh
in the current version is not considered a major difference as it only reflects the
advanced technology.)
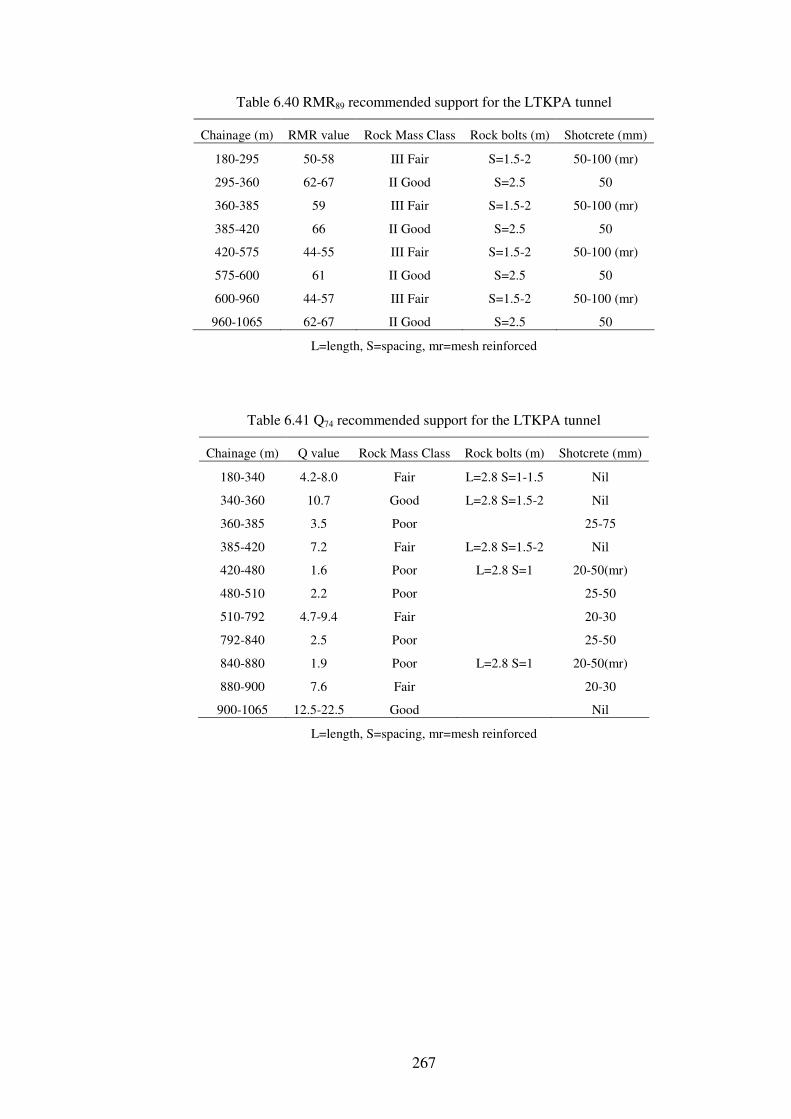
267
Table 6.40 RMR89 recommended support for the LTKPA tunnel
Chainage (m) RMR value Rock Mass Class Rock bolts (m) Shotcrete (mm)
180-295 50-58 III Fair S=1.5-2 50-100 (mr)
295-360 62-67 II Good S=2.5 50
360-385 59 III Fair S=1.5-2 50-100 (mr)
385-420 66 II Good S=2.5 50
420-575 44-55 III Fair S=1.5-2 50-100 (mr)
575-600 61 II Good S=2.5 50
600-960 44-57 III Fair S=1.5-2 50-100 (mr)
960-1065 62-67 II Good S=2.5 50
L=length, S=spacing, mr=mesh reinforced
Table 6.41 Q74 recommended support for the LTKPA tunnel
Chainage (m) Q value Rock Mass Class Rock bolts (m) Shotcrete (mm)
180-340 4.2-8.0 Fair L=2.8 S=1-1.5 Nil
340-360 10.7 Good L=2.8 S=1.5-2 Nil
360-385 3.5 Poor 25-75
385-420 7.2 Fair L=2.8 S=1.5-2 Nil
420-480 1.6 Poor L=2.8 S=1 20-50(mr)
480-510 2.2 Poor 25-50
510-792 4.7-9.4 Fair 20-30
792-840 2.5 Poor 25-50
840-880 1.9 Poor L=2.8 S=1 20-50(mr)
880-900 7.6 Fair 20-30
900-1065 12.5-22.5 Good Nil
L=length, S=spacing, mr=mesh reinforced
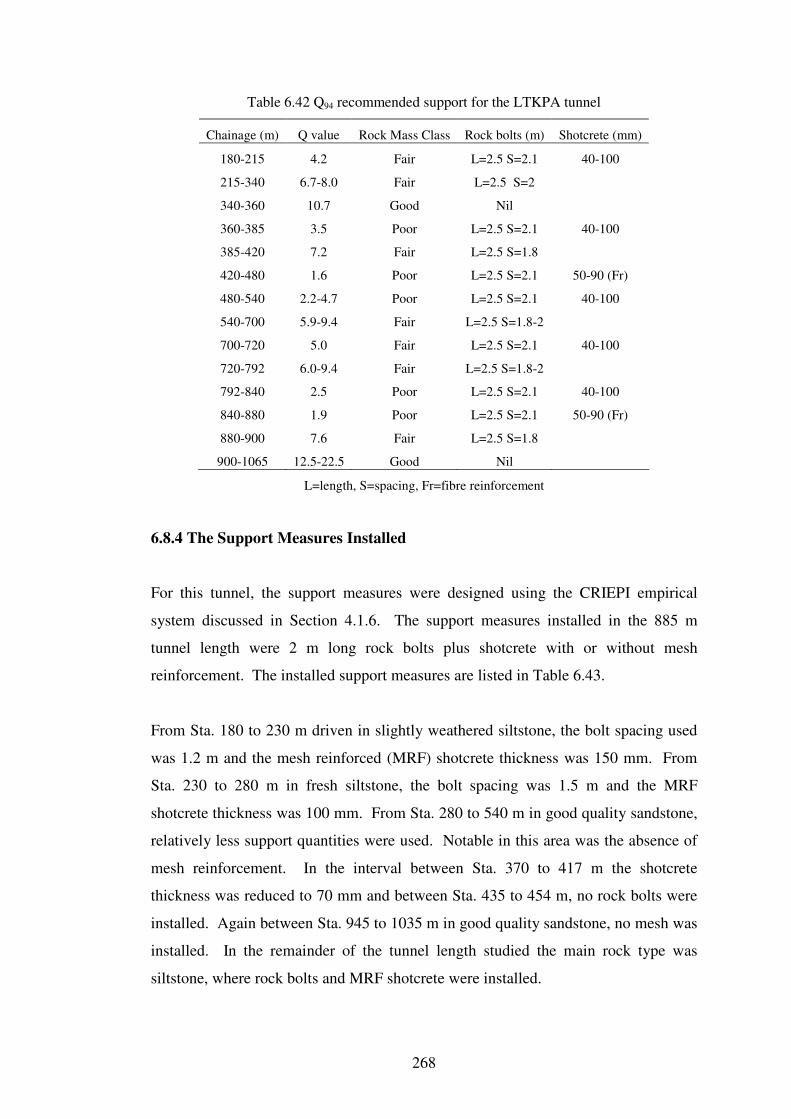
268
Table 6.42 Q94 recommended support for the LTKPA tunnel
Chainage (m) Q value Rock Mass Class Rock bolts (m) Shotcrete (mm)
180-215 4.2 Fair L=2.5 S=2.1 40-100
215-340 6.7-8.0 Fair L=2.5 S=2
340-360 10.7 Good Nil
360-385 3.5 Poor L=2.5 S=2.1 40-100
385-420 7.2 Fair L=2.5 S=1.8
420-480 1.6 Poor L=2.5 S=2.1 50-90 (Fr)
480-540 2.2-4.7 Poor L=2.5 S=2.1 40-100
540-700 5.9-9.4 Fair L=2.5 S=1.8-2
700-720 5.0 Fair L=2.5 S=2.1 40-100
720-792 6.0-9.4 Fair L=2.5 S=1.8-2
792-840 2.5 Poor L=2.5 S=2.1 40-100
840-880 1.9 Poor L=2.5 S=2.1 50-90 (Fr)
880-900 7.6 Fair L=2.5 S=1.8
900-1065 12.5-22.5 Good Nil
L=length, S=spacing, Fr=fibre reinforcement
6.8.4 The Support Measures Installed
For this tunnel, the support measures were designed using the CRIEPI empirical
system discussed in Section 4.1.6. The support measures installed in the 885 m
tunnel length were 2 m long rock bolts plus shotcrete with or without mesh
reinforcement. The installed support measures are listed in Table 6.43.
From Sta. 180 to 230 m driven in slightly weathered siltstone, the bolt spacing used
was 1.2 m and the mesh reinforced (MRF) shotcrete thickness was 150 mm. From
Sta. 230 to 280 m in fresh siltstone, the bolt spacing was 1.5 m and the MRF
shotcrete thickness was 100 mm. From Sta. 280 to 540 m in good quality sandstone,
relatively less support quantities were used. Notable in this area was the absence of
mesh reinforcement. In the interval between Sta. 370 to 417 m the shotcrete
thickness was reduced to 70 mm and between Sta. 435 to 454 m, no rock bolts were
installed. Again between Sta. 945 to 1035 m in good quality sandstone, no mesh was
installed. In the remainder of the tunnel length studied the main rock type was
siltstone, where rock bolts and MRF shotcrete were installed.
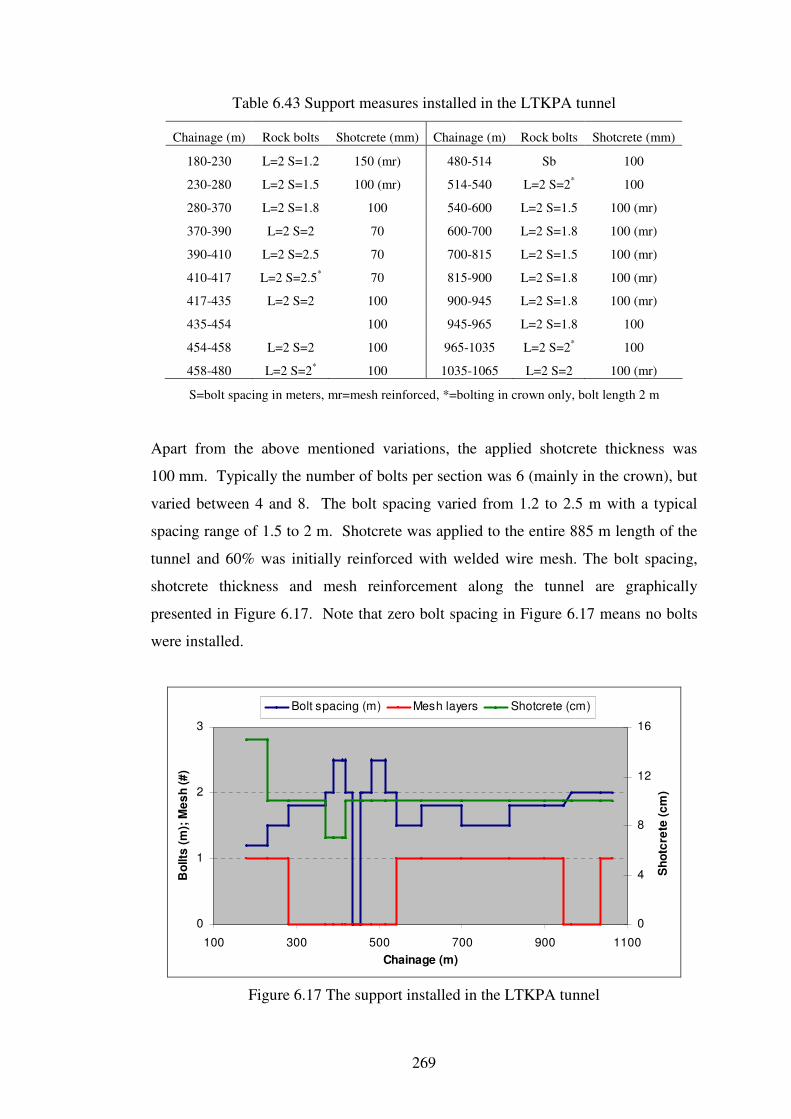
269
Table 6.43 Support measures installed in the LTKPA tunnel
Chainage (m) Rock bolts Shotcrete (mm) Chainage (m) Rock bolts Shotcrete (mm)
180-230 L=2 S=1.2 150 (mr) 480-514 Sb 100
230-280 L=2 S=1.5 100 (mr) 514-540 L=2 S=2* 100
280-370 L=2 S=1.8 100 540-600 L=2 S=1.5 100 (mr)
370-390 L=2 S=2 70 600-700 L=2 S=1.8 100 (mr)
390-410 L=2 S=2.5 70 700-815 L=2 S=1.5 100 (mr)
410-417 L=2 S=2.5* 70 815-900 L=2 S=1.8 100 (mr)
417-435 L=2 S=2 100 900-945 L=2 S=1.8 100 (mr)
435-454 100 945-965 L=2 S=1.8 100
454-458 L=2 S=2 100 965-1035 L=2 S=2* 100
458-480 L=2 S=2* 100 1035-1065 L=2 S=2 100 (mr)
S=bolt spacing in meters, mr=mesh reinforced, *=bolting in crown only, bolt length 2 m
Apart from the above mentioned variations, the applied shotcrete thickness was
100 mm. Typically the number of bolts per section was 6 (mainly in the crown), but
varied between 4 and 8. The bolt spacing varied from 1.2 to 2.5 m with a typical
spacing range of 1.5 to 2 m. Shotcrete was applied to the entire 885 m length of the
tunnel and 60% was initially reinforced with welded wire mesh. The bolt spacing,
shotcrete thickness and mesh reinforcement along the tunnel are graphically
presented in Figure 6.17. Note that zero bolt spacing in Figure 6.17 means no bolts
were installed.
0
1
2
3
100 300 500 700 900 1100
Chainage (m)
Bo
llts
(m
); M
es
h (
#)
0
4
8
12
16
Sh
otc
rete
(c
m)
Bolt spacing (m) Mesh layers Shotcrete (cm)
Figure 6.17 The support installed in the LTKPA tunnel
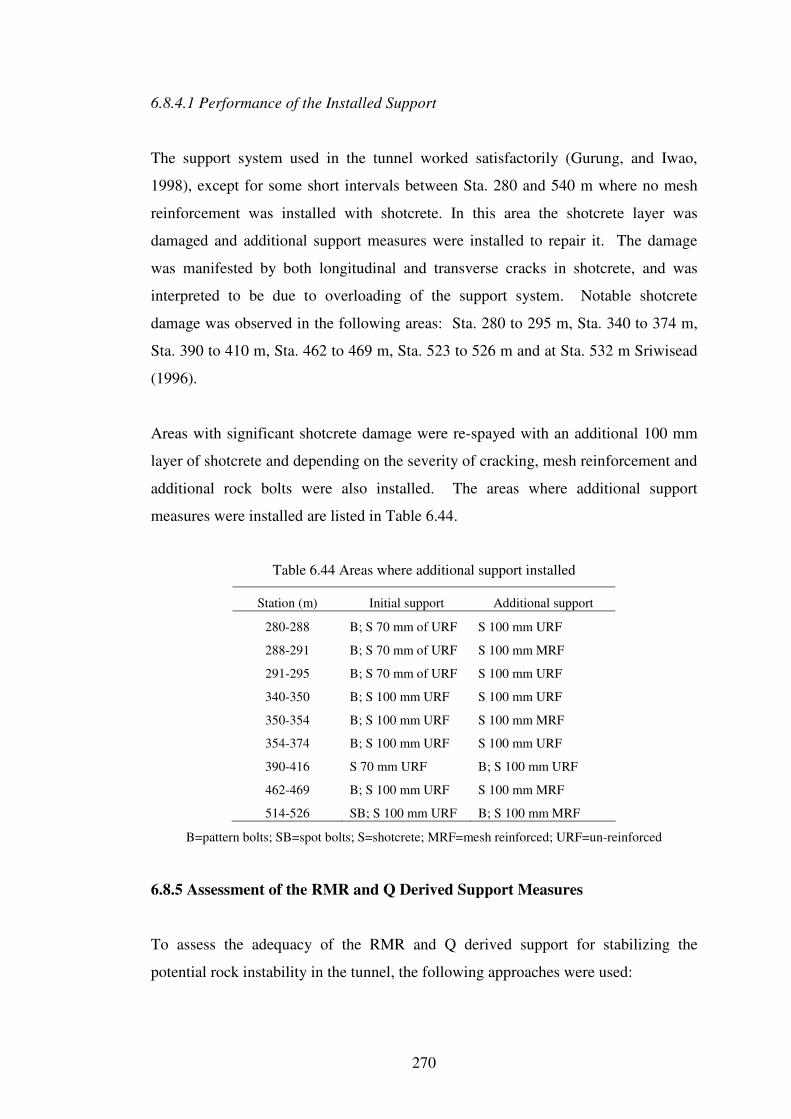
270
6.8.4.1 Performance of the Installed Support
The support system used in the tunnel worked satisfactorily (Gurung, and Iwao,
1998), except for some short intervals between Sta. 280 and 540 m where no mesh
reinforcement was installed with shotcrete. In this area the shotcrete layer was
damaged and additional support measures were installed to repair it. The damage
was manifested by both longitudinal and transverse cracks in shotcrete, and was
interpreted to be due to overloading of the support system. Notable shotcrete
damage was observed in the following areas: Sta. 280 to 295 m, Sta. 340 to 374 m,
Sta. 390 to 410 m, Sta. 462 to 469 m, Sta. 523 to 526 m and at Sta. 532 m Sriwisead
(1996).
Areas with significant shotcrete damage were re-spayed with an additional 100 mm
layer of shotcrete and depending on the severity of cracking, mesh reinforcement and
additional rock bolts were also installed. The areas where additional support
measures were installed are listed in Table 6.44.
Table 6.44 Areas where additional support installed
Station (m) Initial support Additional support
280-288 B; S 70 mm of URF S 100 mm URF
288-291 B; S 70 mm of URF S 100 mm MRF
291-295 B; S 70 mm of URF S 100 mm URF
340-350 B; S 100 mm URF S 100 mm URF
350-354 B; S 100 mm URF S 100 mm MRF
354-374 B; S 100 mm URF S 100 mm URF
390-416 S 70 mm URF B; S 100 mm URF
462-469 B; S 100 mm URF S 100 mm MRF
514-526 SB; S 100 mm URF B; S 100 mm MRF
B=pattern bolts; SB=spot bolts; S=shotcrete; MRF=mesh reinforced; URF=un-reinforced
6.8.5 Assessment of the RMR and Q Derived Support Measures
To assess the adequacy of the RMR and Q derived support for stabilizing the
potential rock instability in the tunnel, the following approaches were used:
271
• Suspended beam analysis,
• Tetrahedral wedge analysis,
• Numerical simulation, and
• Comparisons with the installed support.
6.8.5.1 Suspended beam analysis
The presence of sub-horizontal bedding planes and near vertical joints parallel to and
normal to the tunnel axis creates a structural setup for rock beams to be formed in the
roof. The support required for stabilizing the potentially unstable rock beams was
determined by a conservative analysis using the suspended beam concept discussed
in Section 3.4.1.2. The analysis assumed that the weight of the rock in the unstable
zone is supported entirely by the force developed in the rock bolts anchored in the
overlying solid rock. Ignoring the effect of shear and flexural strengths of the strata
and the in situ stress field around the tunnel, the required bolt spacing was
determined by Equation 3.3.
s = (T/γ h F)1/2
(3.3)
where s=rock bolt spacing on both longitudinal and transverse directions, T=ultimate
load capacity per rock bolt, h=thickness of unstable rock beam, γ=unit weight of the
rock, and F=required factor of safety against failure for long term roof stability,
which is assumed to be 2.0 for this study.
As mentioned in Section 6.7.2, sandstone and sandy siltstone beds are up to 1 m and
1.5 m in thickness, respectively. Their respective unit weights are 25.5 and
25.9 kN/m3. If 100% bond efficiency cement grouted bolts with an ultimate tensile
strength of 180 kN were to be installed normal to the rock face, the required bolt
spacing for 1.5 m thick sandy siltstone beds is 1.5 m and that for 1 m thick sandstone
beds is 1.8 m.
It can be seen from Table 6.39 that the bolt spacing recommended by RMR89 for
74% of the tunnel and that by Q94 for 83% of the tunnel are comparable to the range
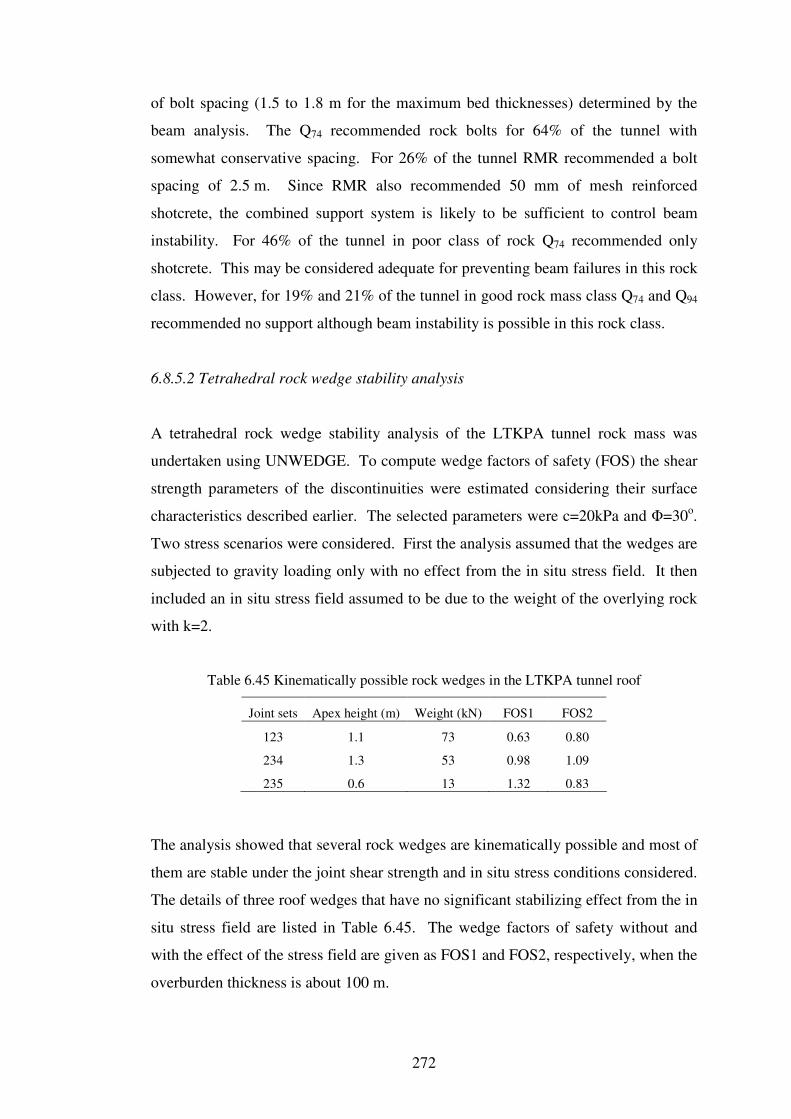
272
of bolt spacing (1.5 to 1.8 m for the maximum bed thicknesses) determined by the
beam analysis. The Q74 recommended rock bolts for 64% of the tunnel with
somewhat conservative spacing. For 26% of the tunnel RMR recommended a bolt
spacing of 2.5 m. Since RMR also recommended 50 mm of mesh reinforced
shotcrete, the combined support system is likely to be sufficient to control beam
instability. For 46% of the tunnel in poor class of rock Q74 recommended only
shotcrete. This may be considered adequate for preventing beam failures in this rock
class. However, for 19% and 21% of the tunnel in good rock mass class Q74 and Q94
recommended no support although beam instability is possible in this rock class.
6.8.5.2 Tetrahedral rock wedge stability analysis
A tetrahedral rock wedge stability analysis of the LTKPA tunnel rock mass was
undertaken using UNWEDGE. To compute wedge factors of safety (FOS) the shear
strength parameters of the discontinuities were estimated considering their surface
characteristics described earlier. The selected parameters were c=20kPa and Φ=30o.
Two stress scenarios were considered. First the analysis assumed that the wedges are
subjected to gravity loading only with no effect from the in situ stress field. It then
included an in situ stress field assumed to be due to the weight of the overlying rock
with k=2.
Table 6.45 Kinematically possible rock wedges in the LTKPA tunnel roof
Joint sets Apex height (m) Weight (kN) FOS1 FOS2
123 1.1 73 0.63 0.80
234 1.3 53 0.98 1.09
235 0.6 13 1.32 0.83
The analysis showed that several rock wedges are kinematically possible and most of
them are stable under the joint shear strength and in situ stress conditions considered.
The details of three roof wedges that have no significant stabilizing effect from the in
situ stress field are listed in Table 6.45. The wedge factors of safety without and
with the effect of the stress field are given as FOS1 and FOS2, respectively, when the
overburden thickness is about 100 m.
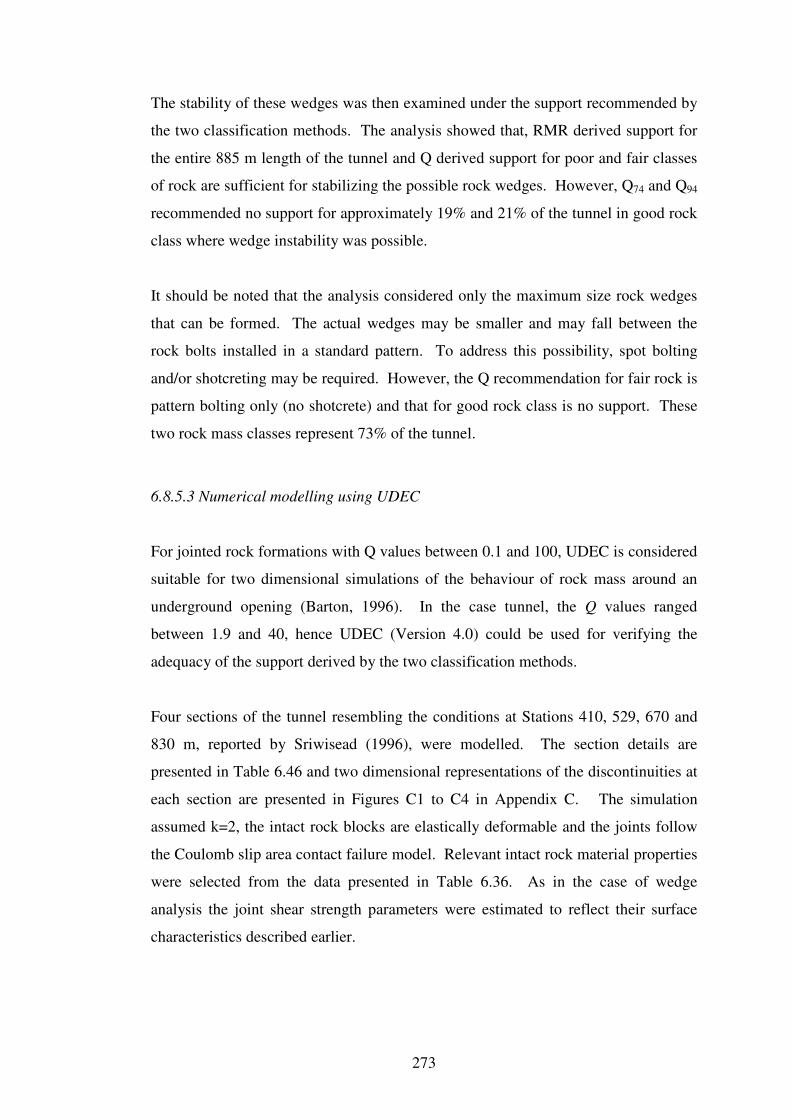
273
The stability of these wedges was then examined under the support recommended by
the two classification methods. The analysis showed that, RMR derived support for
the entire 885 m length of the tunnel and Q derived support for poor and fair classes
of rock are sufficient for stabilizing the possible rock wedges. However, Q74 and Q94
recommended no support for approximately 19% and 21% of the tunnel in good rock
class where wedge instability was possible.
It should be noted that the analysis considered only the maximum size rock wedges
that can be formed. The actual wedges may be smaller and may fall between the
rock bolts installed in a standard pattern. To address this possibility, spot bolting
and/or shotcreting may be required. However, the Q recommendation for fair rock is
pattern bolting only (no shotcrete) and that for good rock class is no support. These
two rock mass classes represent 73% of the tunnel.
6.8.5.3 Numerical modelling using UDEC
For jointed rock formations with Q values between 0.1 and 100, UDEC is considered
suitable for two dimensional simulations of the behaviour of rock mass around an
underground opening (Barton, 1996). In the case tunnel, the Q values ranged
between 1.9 and 40, hence UDEC (Version 4.0) could be used for verifying the
adequacy of the support derived by the two classification methods.
Four sections of the tunnel resembling the conditions at Stations 410, 529, 670 and
830 m, reported by Sriwisead (1996), were modelled. The section details are
presented in Table 6.46 and two dimensional representations of the discontinuities at
each section are presented in Figures C1 to C4 in Appendix C. The simulation
assumed k=2, the intact rock blocks are elastically deformable and the joints follow
the Coulomb slip area contact failure model. Relevant intact rock material properties
were selected from the data presented in Table 6.36. As in the case of wedge
analysis the joint shear strength parameters were estimated to reflect their surface
characteristics described earlier.
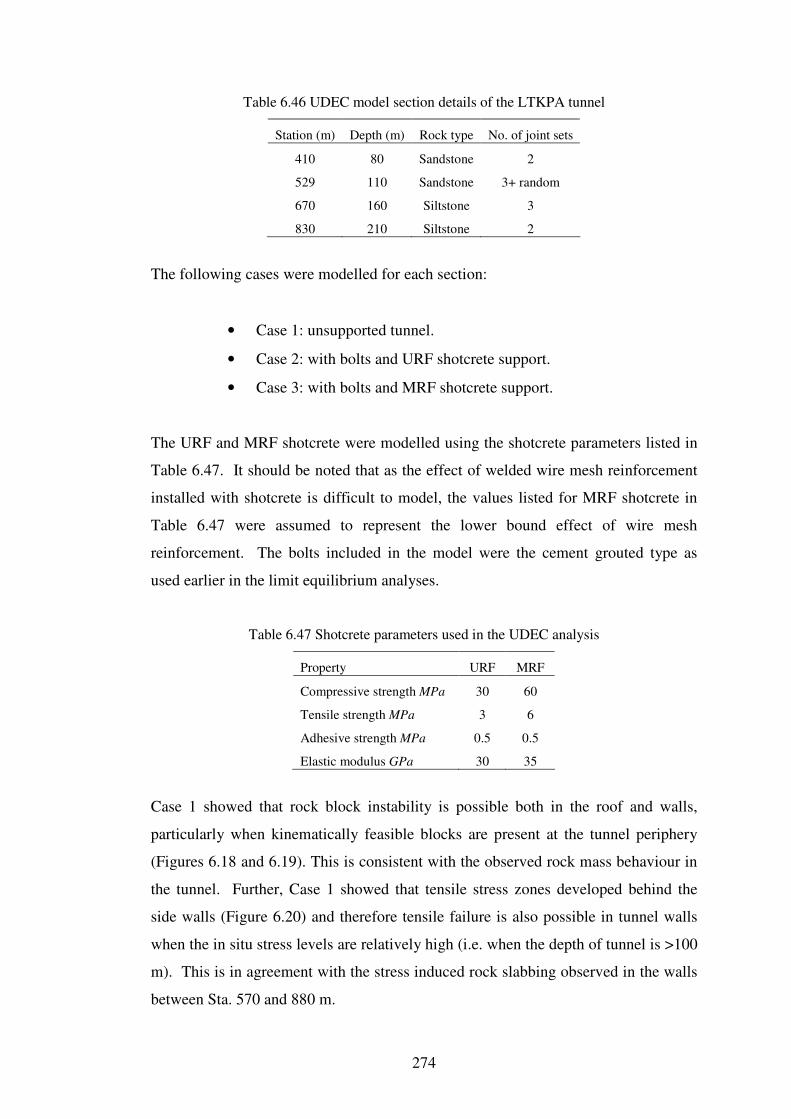
274
Table 6.46 UDEC model section details of the LTKPA tunnel
Station (m) Depth (m) Rock type No. of joint sets
410 80 Sandstone 2
529 110 Sandstone 3+ random
670 160 Siltstone 3
830 210 Siltstone 2
The following cases were modelled for each section:
• Case 1: unsupported tunnel.
• Case 2: with bolts and URF shotcrete support.
• Case 3: with bolts and MRF shotcrete support.
The URF and MRF shotcrete were modelled using the shotcrete parameters listed in
Table 6.47. It should be noted that as the effect of welded wire mesh reinforcement
installed with shotcrete is difficult to model, the values listed for MRF shotcrete in
Table 6.47 were assumed to represent the lower bound effect of wire mesh
reinforcement. The bolts included in the model were the cement grouted type as
used earlier in the limit equilibrium analyses.
Table 6.47 Shotcrete parameters used in the UDEC analysis
Property URF MRF
Compressive strength MPa 30 60
Tensile strength MPa 3 6
Adhesive strength MPa 0.5 0.5
Elastic modulus GPa 30 35
Case 1 showed that rock block instability is possible both in the roof and walls,
particularly when kinematically feasible blocks are present at the tunnel periphery
(Figures 6.18 and 6.19). This is consistent with the observed rock mass behaviour in
the tunnel. Further, Case 1 showed that tensile stress zones developed behind the
side walls (Figure 6.20) and therefore tensile failure is also possible in tunnel walls
when the in situ stress levels are relatively high (i.e. when the depth of tunnel is >100
m). This is in agreement with the stress induced rock slabbing observed in the walls
between Sta. 570 and 880 m.
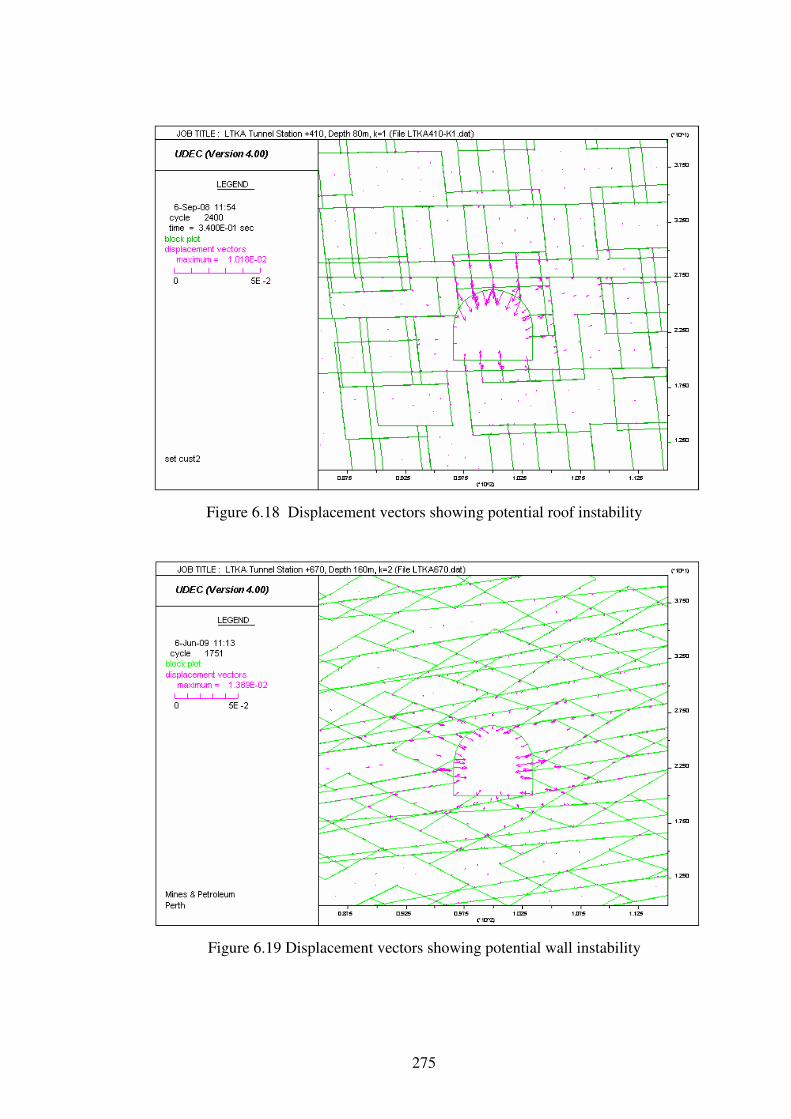
275
Figure 6.18 Displacement vectors showing potential roof instability
Figure 6.19 Displacement vectors showing potential wall instability
276
Case 2 indicated compressive failure and axial yielding of URF shotcrete under the
conditions simulated in all four sections. As mentioned in Section 6.7.4.1, some
damage occurred in the URF shotcrete layer installed from Sta. 280 to 540 m.
Interestingly, the predicted failure zones in the tunnel periphery (Figure 6.21)
compare well with the actual locations of shotcrete damage reported by Sriwisead
(1996). Case 3 showed that the extent of predicted shotcrete damage can be reduced
significantly by using MRF shotcrete (Figure 6.22). The simulation also showed that
a marginal increase in the MRF shotcrete strength parameters above those listed in
Table 6.47 would be sufficient to eliminate the predicted failure zone. Since no
damage was reported in the areas supported with MRF shotcrete, it may be deduced
that URF shotcrete is not the best option for the tunnel, although Q94 recommended
URF shotcrete with rock bolts for 37% of the tunnel and no shotcrete for the
remaining 63%. In the case of Q74, URF and MRF shotcrete was recommended for
only 46% and 11% of the tunnel, respectively.
Figure 6.20 Tensile stress zones on side walls
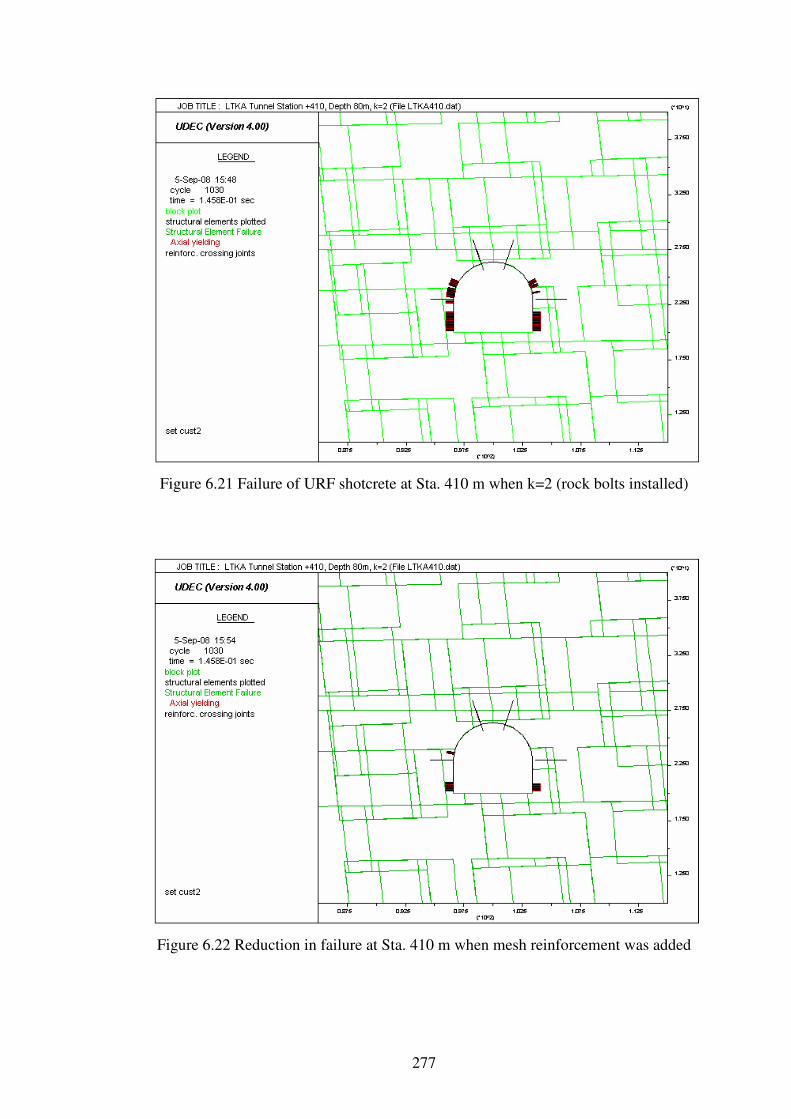
277
Figure 6.21 Failure of URF shotcrete at Sta. 410 m when k=2 (rock bolts installed)
Figure 6.22 Reduction in failure at Sta. 410 m when mesh reinforcement was added
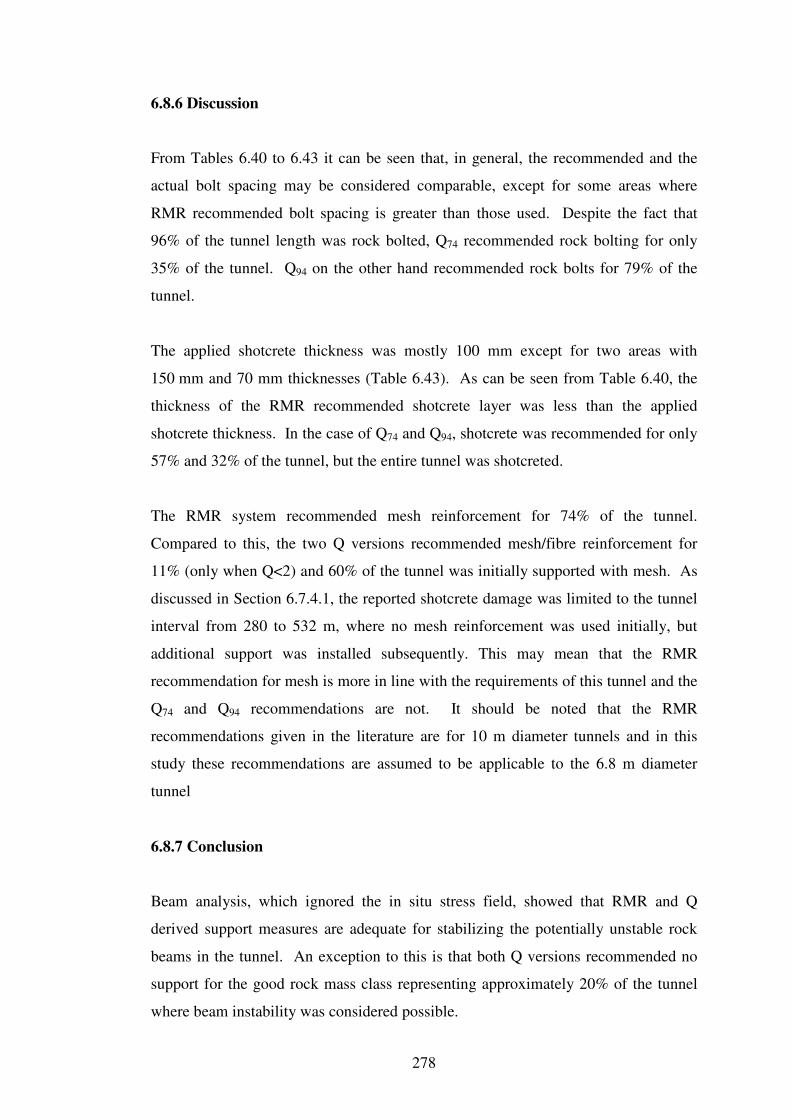
278
6.8.6 Discussion
From Tables 6.40 to 6.43 it can be seen that, in general, the recommended and the
actual bolt spacing may be considered comparable, except for some areas where
RMR recommended bolt spacing is greater than those used. Despite the fact that
96% of the tunnel length was rock bolted, Q74 recommended rock bolting for only
35% of the tunnel. Q94 on the other hand recommended rock bolts for 79% of the
tunnel.
The applied shotcrete thickness was mostly 100 mm except for two areas with
150 mm and 70 mm thicknesses (Table 6.43). As can be seen from Table 6.40, the
thickness of the RMR recommended shotcrete layer was less than the applied
shotcrete thickness. In the case of Q74 and Q94, shotcrete was recommended for only
57% and 32% of the tunnel, but the entire tunnel was shotcreted.
The RMR system recommended mesh reinforcement for 74% of the tunnel.
Compared to this, the two Q versions recommended mesh/fibre reinforcement for
11% (only when Q<2) and 60% of the tunnel was initially supported with mesh. As
discussed in Section 6.7.4.1, the reported shotcrete damage was limited to the tunnel
interval from 280 to 532 m, where no mesh reinforcement was used initially, but
additional support was installed subsequently. This may mean that the RMR
recommendation for mesh is more in line with the requirements of this tunnel and the
Q74 and Q94 recommendations are not. It should be noted that the RMR
recommendations given in the literature are for 10 m diameter tunnels and in this
study these recommendations are assumed to be applicable to the 6.8 m diameter
tunnel
6.8.7 Conclusion
Beam analysis, which ignored the in situ stress field, showed that RMR and Q
derived support measures are adequate for stabilizing the potentially unstable rock
beams in the tunnel. An exception to this is that both Q versions recommended no
support for the good rock mass class representing approximately 20% of the tunnel
where beam instability was considered possible.
279
The RMR derived support measures for the entire 885 m tunnel length and the Q
derived support measures for the poor rock class were adequate for the potentially
unstable tetrahedral rock wedges. Q recommended only pattern bolting for fair rock
and no support for good rock. The recommended pattern bolting is adequate for
stabilizing the largest possible tetrahedral rock wedges in the tunnel, however, in fair
rock class, shotcrete was warranted as there was the potential for small rock block
instability in between the installed rock bolts. Further, Q recommended no support
for good rock class which represents approximately 20% of the tunnel length studied
where wedge instability was possible.
The numerical simulation showed that the RMR derived support measures meet the
numerically predicted support requirements. The simulation indicated that instead of
the URF shotcrete recommended by Q94, MRF (or fibre reinforced) shotcrete is a
better option to reduce the risk of damage to shotcrete. Both Q versions
recommended reinforced shotcrete only for 11% of the tunnel
The study showed that the RMR recommended support types are in agreement with
the support installed which consisted of rock bolts, shotcrete and mesh
reinforcement. There were differences in the RMR recommended and installed bolt
spacing and shotcrete thickness, but in general, they were comparable. Q94
recommended rock bolts for 79% of the tunnel, shotcrete for 32% and fibre
reinforcement for only about 11%. Although the Q94 derived bolt pattern may be
considered comparable to the installed bolt pattern, its recommended shotcrete and
fibre reinforcement fall well short of the extent of shotcrete and mesh installed in the
tunnel. The support recommended by Q74 also falls well short of the actual support
installed, i.e. it recommended bolts for 35% whereas 96% was actually supported
with rock bolts.
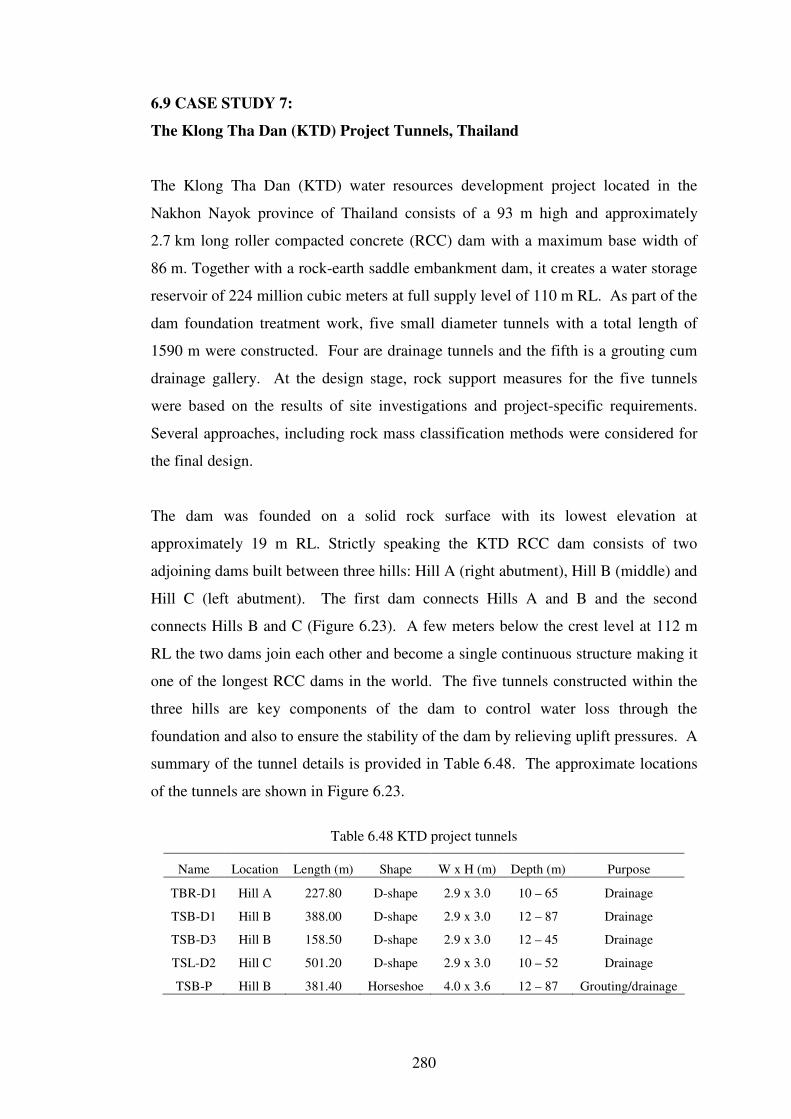
280
6.9 CASE STUDY 7:
The Klong Tha Dan (KTD) Project Tunnels, Thailand
The Klong Tha Dan (KTD) water resources development project located in the
Nakhon Nayok province of Thailand consists of a 93 m high and approximately
2.7 km long roller compacted concrete (RCC) dam with a maximum base width of
86 m. Together with a rock-earth saddle embankment dam, it creates a water storage
reservoir of 224 million cubic meters at full supply level of 110 m RL. As part of the
dam foundation treatment work, five small diameter tunnels with a total length of
1590 m were constructed. Four are drainage tunnels and the fifth is a grouting cum
drainage gallery. At the design stage, rock support measures for the five tunnels
were based on the results of site investigations and project-specific requirements.
Several approaches, including rock mass classification methods were considered for
the final design.
The dam was founded on a solid rock surface with its lowest elevation at
approximately 19 m RL. Strictly speaking the KTD RCC dam consists of two
adjoining dams built between three hills: Hill A (right abutment), Hill B (middle) and
Hill C (left abutment). The first dam connects Hills A and B and the second
connects Hills B and C (Figure 6.23). A few meters below the crest level at 112 m
RL the two dams join each other and become a single continuous structure making it
one of the longest RCC dams in the world. The five tunnels constructed within the
three hills are key components of the dam to control water loss through the
foundation and also to ensure the stability of the dam by relieving uplift pressures. A
summary of the tunnel details is provided in Table 6.48. The approximate locations
of the tunnels are shown in Figure 6.23.
Table 6.48 KTD project tunnels
Name Location Length (m) Shape W x H (m) Depth (m) Purpose
TBR-D1 Hill A 227.80 D-shape 2.9 x 3.0 10 – 65 Drainage
TSB-D1 Hill B 388.00 D-shape 2.9 x 3.0 12 – 87 Drainage
TSB-D3 Hill B 158.50 D-shape 2.9 x 3.0 12 – 45 Drainage
TSL-D2 Hill C 501.20 D-shape 2.9 x 3.0 10 – 52 Drainage
TSB-P Hill B 381.40 Horseshoe 4.0 x 3.6 12 – 87 Grouting/drainage

281
Figure 6.23 A long section of the dam showing the tunnel locations (upstream view)
6.9.1 Project Site Geology
The KTD dam site mainly comprised undifferentiated Permo-Triassic volcanic rocks
of the Khao Yai Volcanic Formation, which consists of rhyolite, andesite, rhyolitic
and andesitic tuff and agglomerate and basalt (Phuntumat, 1997; Swe, 2003). Within
the site, the predominant geological discontinuities in the rocks are flow bands, joints
and minor faults. No major structures were present.
The main rocks of Hill A are pyroclastic consisting of agglomerate and tuff with
basalt and andesite present at random. Hill C comprised lava rocks, namely rhyolite,
andesite and basalt and in Hill B (middle hill), the main rock type is rhyolite
interrupted by basalt dykes.
6.9.2 Rock Mass Data Intersected in the Five Tunnels
In the five tunnels rhyolite and tuff were the main rock types. Andesite, basalt and
dacite were also present in small amounts usually as intrusions. A series of
laboratory tests conducted by Phuntumat (1997) showed that the average UCS values
of rhyolite, andesite, agglomerate and tuff intact rock materials were 76, 134, 102
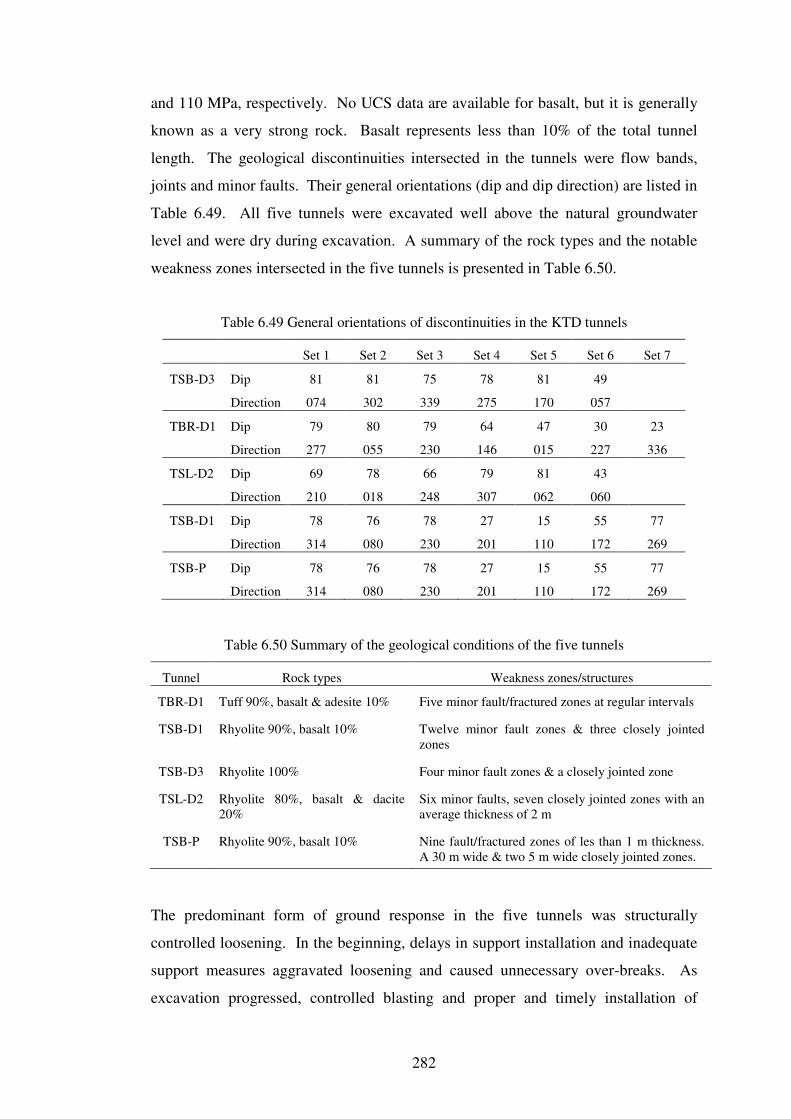
282
and 110 MPa, respectively. No UCS data are available for basalt, but it is generally
known as a very strong rock. Basalt represents less than 10% of the total tunnel
length. The geological discontinuities intersected in the tunnels were flow bands,
joints and minor faults. Their general orientations (dip and dip direction) are listed in
Table 6.49. All five tunnels were excavated well above the natural groundwater
level and were dry during excavation. A summary of the rock types and the notable
weakness zones intersected in the five tunnels is presented in Table 6.50.
Table 6.49 General orientations of discontinuities in the KTD tunnels
Set 1 Set 2 Set 3 Set 4 Set 5 Set 6 Set 7
TSB-D3 Dip 81 81 75 78 81 49
Direction 074 302 339 275 170 057
TBR-D1 Dip 79 80 79 64 47 30 23
Direction 277 055 230 146 015 227 336
TSL-D2 Dip 69 78 66 79 81 43
Direction 210 018 248 307 062 060
TSB-D1 Dip 78 76 78 27 15 55 77
Direction 314 080 230 201 110 172 269
TSB-P Dip 78 76 78 27 15 55 77
Direction 314 080 230 201 110 172 269
Table 6.50 Summary of the geological conditions of the five tunnels
Tunnel Rock types Weakness zones/structures
TBR-D1 Tuff 90%, basalt & adesite 10% Five minor fault/fractured zones at regular intervals
TSB-D1 Rhyolite 90%, basalt 10% Twelve minor fault zones & three closely jointed
zones
TSB-D3 Rhyolite 100% Four minor fault zones & a closely jointed zone
TSL-D2 Rhyolite 80%, basalt & dacite
20%
Six minor faults, seven closely jointed zones with an
average thickness of 2 m
TSB-P Rhyolite 90%, basalt 10% Nine fault/fractured zones of les than 1 m thickness.
A 30 m wide & two 5 m wide closely jointed zones.
The predominant form of ground response in the five tunnels was structurally
controlled loosening. In the beginning, delays in support installation and inadequate
support measures aggravated loosening and caused unnecessary over-breaks. As
excavation progressed, controlled blasting and proper and timely installation of
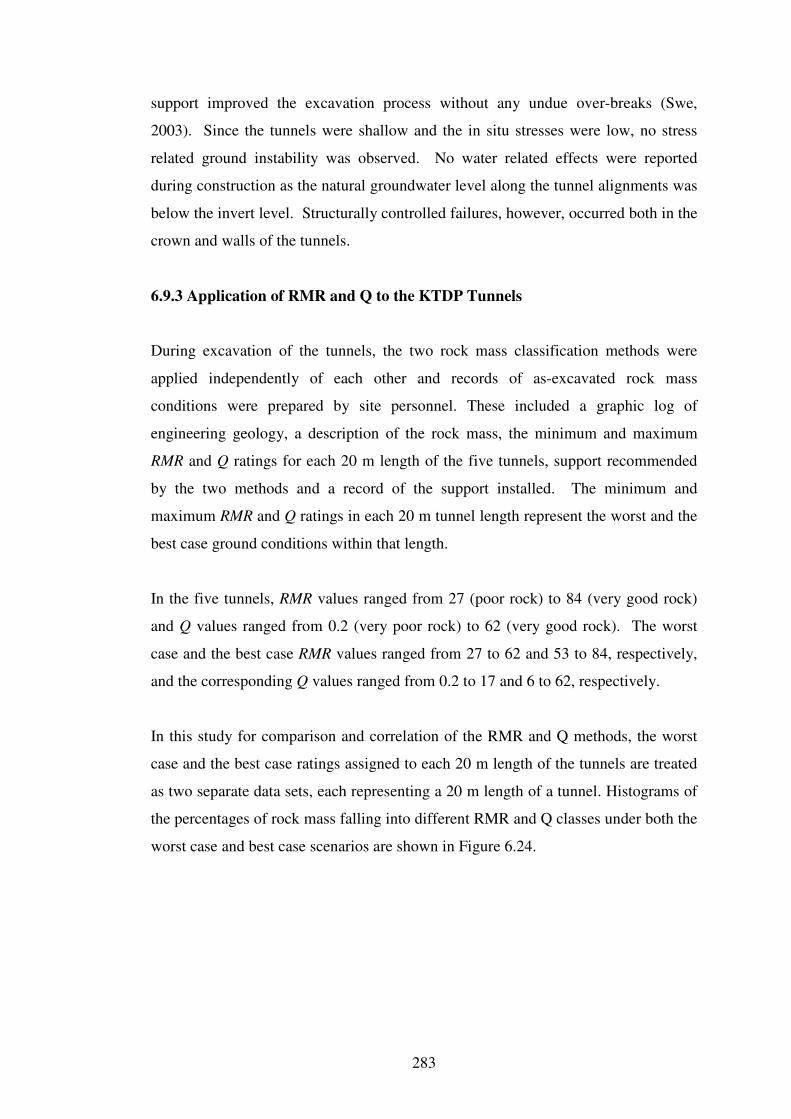
283
support improved the excavation process without any undue over-breaks (Swe,
2003). Since the tunnels were shallow and the in situ stresses were low, no stress
related ground instability was observed. No water related effects were reported
during construction as the natural groundwater level along the tunnel alignments was
below the invert level. Structurally controlled failures, however, occurred both in the
crown and walls of the tunnels.
6.9.3 Application of RMR and Q to the KTDP Tunnels
During excavation of the tunnels, the two rock mass classification methods were
applied independently of each other and records of as-excavated rock mass
conditions were prepared by site personnel. These included a graphic log of
engineering geology, a description of the rock mass, the minimum and maximum
RMR and Q ratings for each 20 m length of the five tunnels, support recommended
by the two methods and a record of the support installed. The minimum and
maximum RMR and Q ratings in each 20 m tunnel length represent the worst and the
best case ground conditions within that length.
In the five tunnels, RMR values ranged from 27 (poor rock) to 84 (very good rock)
and Q values ranged from 0.2 (very poor rock) to 62 (very good rock). The worst
case and the best case RMR values ranged from 27 to 62 and 53 to 84, respectively,
and the corresponding Q values ranged from 0.2 to 17 and 6 to 62, respectively.
In this study for comparison and correlation of the RMR and Q methods, the worst
case and the best case ratings assigned to each 20 m length of the tunnels are treated
as two separate data sets, each representing a 20 m length of a tunnel. Histograms of
the percentages of rock mass falling into different RMR and Q classes under both the
worst case and best case scenarios are shown in Figure 6.24.
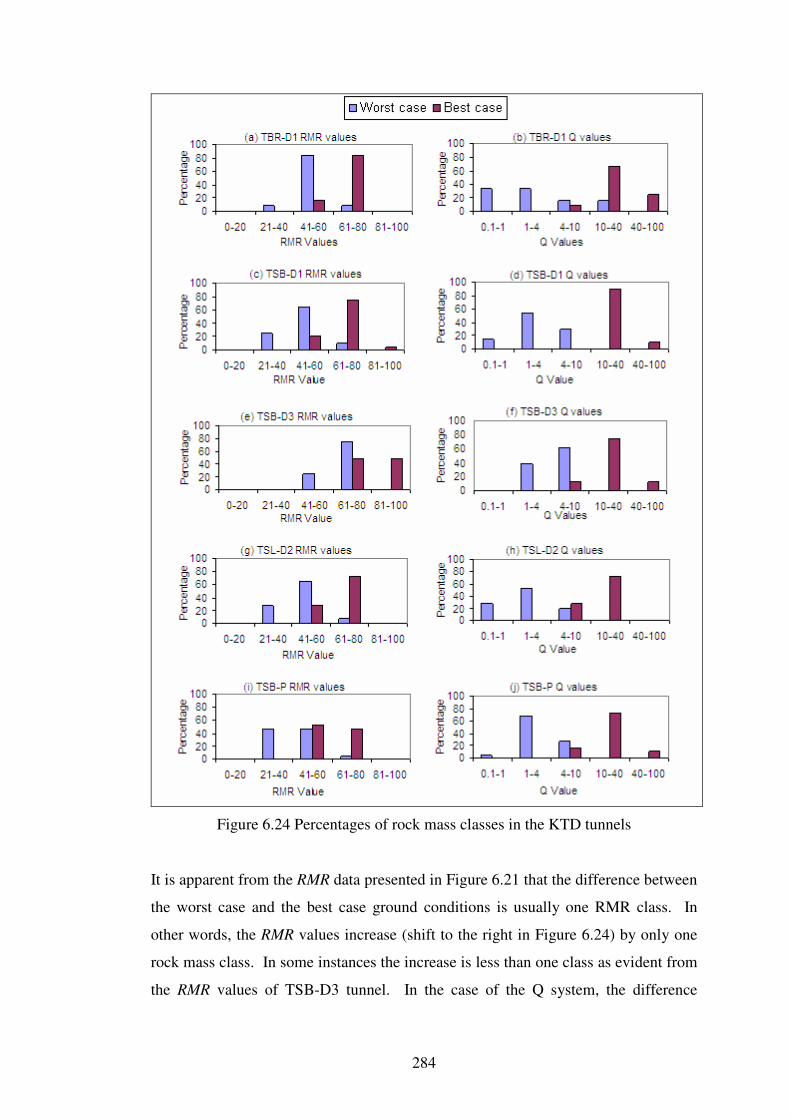
284
Figure 6.24 Percentages of rock mass classes in the KTD tunnels
It is apparent from the RMR data presented in Figure 6.21 that the difference between
the worst case and the best case ground conditions is usually one RMR class. In
other words, the RMR values increase (shift to the right in Figure 6.24) by only one
rock mass class. In some instances the increase is less than one class as evident from
the RMR values of TSB-D3 tunnel. In the case of the Q system, the difference
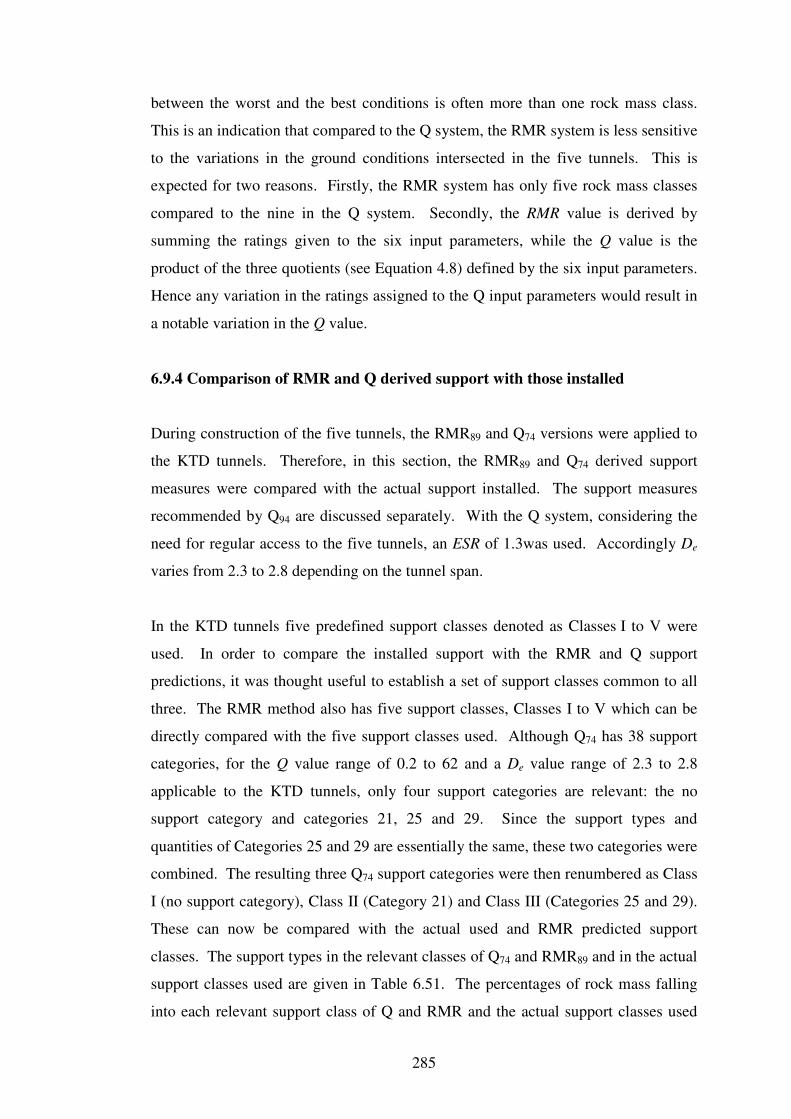
285
between the worst and the best conditions is often more than one rock mass class.
This is an indication that compared to the Q system, the RMR system is less sensitive
to the variations in the ground conditions intersected in the five tunnels. This is
expected for two reasons. Firstly, the RMR system has only five rock mass classes
compared to the nine in the Q system. Secondly, the RMR value is derived by
summing the ratings given to the six input parameters, while the Q value is the
product of the three quotients (see Equation 4.8) defined by the six input parameters.
Hence any variation in the ratings assigned to the Q input parameters would result in
a notable variation in the Q value.
6.9.4 Comparison of RMR and Q derived support with those installed
During construction of the five tunnels, the RMR89 and Q74 versions were applied to
the KTD tunnels. Therefore, in this section, the RMR89 and Q74 derived support
measures were compared with the actual support installed. The support measures
recommended by Q94 are discussed separately. With the Q system, considering the
need for regular access to the five tunnels, an ESR of 1.3was used. Accordingly De
varies from 2.3 to 2.8 depending on the tunnel span.
In the KTD tunnels five predefined support classes denoted as Classes I to V were
used. In order to compare the installed support with the RMR and Q support
predictions, it was thought useful to establish a set of support classes common to all
three. The RMR method also has five support classes, Classes I to V which can be
directly compared with the five support classes used. Although Q74 has 38 support
categories, for the Q value range of 0.2 to 62 and a De value range of 2.3 to 2.8
applicable to the KTD tunnels, only four support categories are relevant: the no
support category and categories 21, 25 and 29. Since the support types and
quantities of Categories 25 and 29 are essentially the same, these two categories were
combined. The resulting three Q74 support categories were then renumbered as Class
I (no support category), Class II (Category 21) and Class III (Categories 25 and 29).
These can now be compared with the actual used and RMR predicted support
classes. The support types in the relevant classes of Q74 and RMR89 and in the actual
support classes used are given in Table 6.51. The percentages of rock mass falling
into each relevant support class of Q and RMR and the actual support classes used
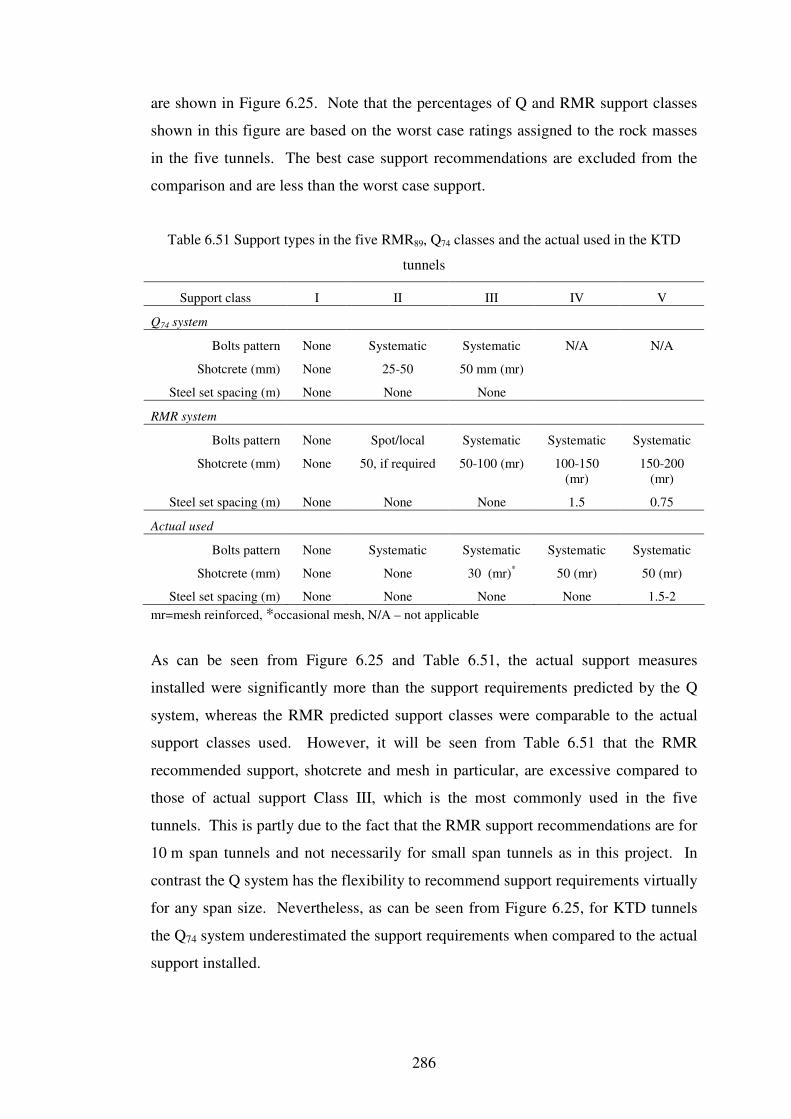
286
are shown in Figure 6.25. Note that the percentages of Q and RMR support classes
shown in this figure are based on the worst case ratings assigned to the rock masses
in the five tunnels. The best case support recommendations are excluded from the
comparison and are less than the worst case support.
Table 6.51 Support types in the five RMR89, Q74 classes and the actual used in the KTD
tunnels
Support class I II III IV V
Q74 system
Bolts pattern None Systematic Systematic N/A N/A
Shotcrete (mm) None 25-50 50 mm (mr)
Steel set spacing (m) None None None
RMR system
Bolts pattern None Spot/local Systematic Systematic Systematic
Shotcrete (mm) None 50, if required 50-100 (mr) 100-150
(mr)
150-200
(mr)
Steel set spacing (m) None None None 1.5 0.75
Actual used
Bolts pattern None Systematic Systematic Systematic Systematic
Shotcrete (mm) None None 30 (mr)*
50 (mr) 50 (mr)
Steel set spacing (m) None None None None 1.5-2
mr=mesh reinforced, *occasional mesh, N/A – not applicable
As can be seen from Figure 6.25 and Table 6.51, the actual support measures
installed were significantly more than the support requirements predicted by the Q
system, whereas the RMR predicted support classes were comparable to the actual
support classes used. However, it will be seen from Table 6.51 that the RMR
recommended support, shotcrete and mesh in particular, are excessive compared to
those of actual support Class III, which is the most commonly used in the five
tunnels. This is partly due to the fact that the RMR support recommendations are for
10 m span tunnels and not necessarily for small span tunnels as in this project. In
contrast the Q system has the flexibility to recommend support requirements virtually
for any span size. Nevertheless, as can be seen from Figure 6.25, for KTD tunnels
the Q74 system underestimated the support requirements when compared to the actual
support installed.
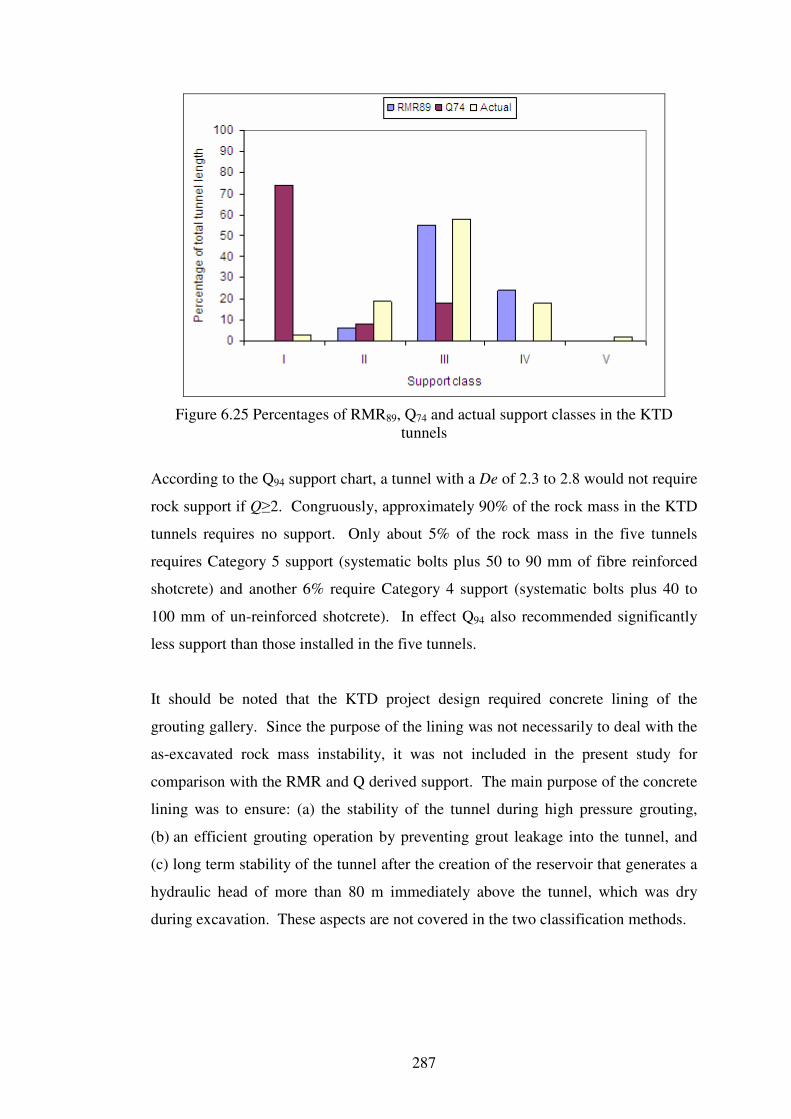
287
Figure 6.25 Percentages of RMR89, Q74 and actual support classes in the KTD
tunnels
According to the Q94 support chart, a tunnel with a De of 2.3 to 2.8 would not require
rock support if Q≥2. Congruously, approximately 90% of the rock mass in the KTD
tunnels requires no support. Only about 5% of the rock mass in the five tunnels
requires Category 5 support (systematic bolts plus 50 to 90 mm of fibre reinforced
shotcrete) and another 6% require Category 4 support (systematic bolts plus 40 to
100 mm of un-reinforced shotcrete). In effect Q94 also recommended significantly
less support than those installed in the five tunnels.
It should be noted that the KTD project design required concrete lining of the
grouting gallery. Since the purpose of the lining was not necessarily to deal with the
as-excavated rock mass instability, it was not included in the present study for
comparison with the RMR and Q derived support. The main purpose of the concrete
lining was to ensure: (a) the stability of the tunnel during high pressure grouting,
(b) an efficient grouting operation by preventing grout leakage into the tunnel, and
(c) long term stability of the tunnel after the creation of the reservoir that generates a
hydraulic head of more than 80 m immediately above the tunnel, which was dry
during excavation. These aspects are not covered in the two classification methods.
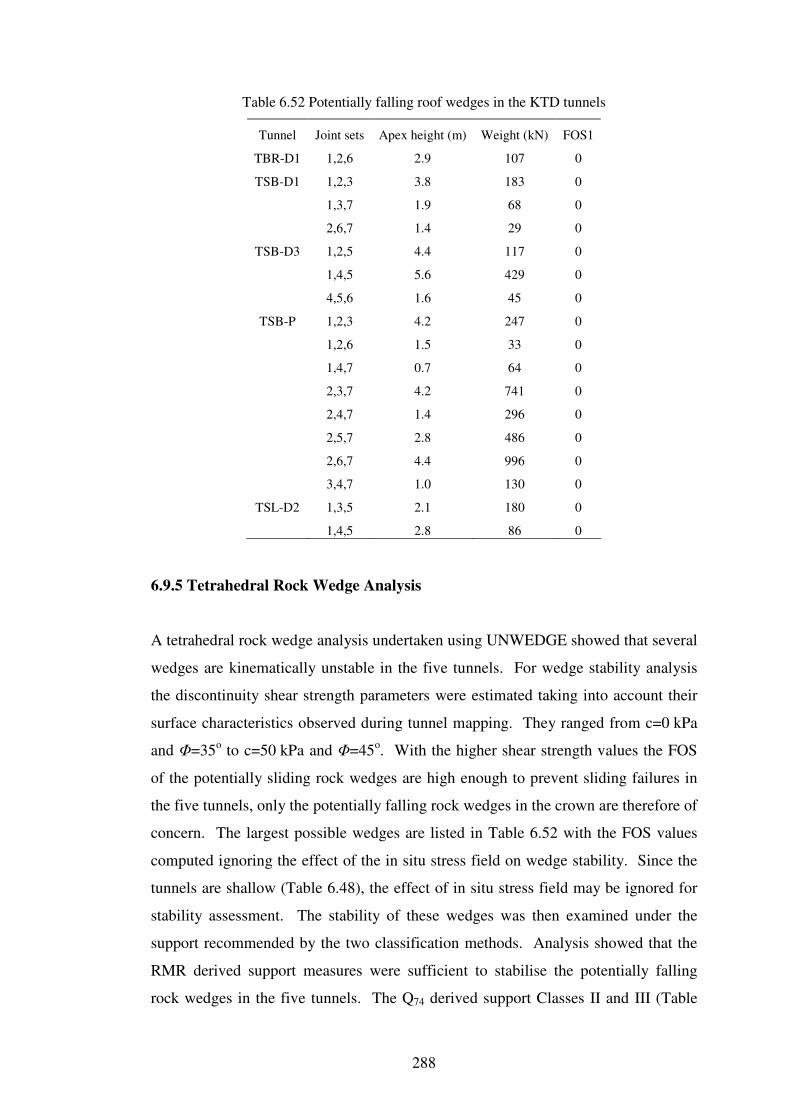
288
Table 6.52 Potentially falling roof wedges in the KTD tunnels
Tunnel Joint sets Apex height (m) Weight (kN) FOS1
TBR-D1 1,2,6 2.9 107 0
TSB-D1 1,2,3 3.8 183 0
1,3,7 1.9 68 0
2,6,7 1.4 29 0
TSB-D3 1,2,5 4.4 117 0
1,4,5 5.6 429 0
4,5,6 1.6 45 0
TSB-P 1,2,3 4.2 247 0
1,2,6 1.5 33 0
1,4,7 0.7 64 0
2,3,7 4.2 741 0
2,4,7 1.4 296 0
2,5,7 2.8 486 0
2,6,7 4.4 996 0
3,4,7 1.0 130 0
TSL-D2 1,3,5 2.1 180 0
1,4,5 2.8 86 0
6.9.5 Tetrahedral Rock Wedge Analysis
A tetrahedral rock wedge analysis undertaken using UNWEDGE showed that several
wedges are kinematically unstable in the five tunnels. For wedge stability analysis
the discontinuity shear strength parameters were estimated taking into account their
surface characteristics observed during tunnel mapping. They ranged from c=0 kPa
and Φ=35o to c=50 kPa and Φ=45
o. With the higher shear strength values the FOS
of the potentially sliding rock wedges are high enough to prevent sliding failures in
the five tunnels, only the potentially falling rock wedges in the crown are therefore of
concern. The largest possible wedges are listed in Table 6.52 with the FOS values
computed ignoring the effect of the in situ stress field on wedge stability. Since the
tunnels are shallow (Table 6.48), the effect of in situ stress field may be ignored for
stability assessment. The stability of these wedges was then examined under the
support recommended by the two classification methods. Analysis showed that the
RMR derived support measures were sufficient to stabilise the potentially falling
rock wedges in the five tunnels. The Q74 derived support Classes II and III (Table
289
6.51) were also sufficient for stabilizing the possible rock wedges. However, Q74
recommended no support for 74% of the tunnel length, where wedge instability was
possible. According to Q94 version 90% of the tunnel required no support.
6.9.6 Comparison of predicted support pressures
Both RMR and Q systems provide empirical formulas for estimating support
pressures required to stabilise the rock mass surrounding an excavation. These
formulas may be used to determine the support pressure required or the rock load
needed to be supported in an excavation with a given RMR or Q value.
On the basis of the work of Unal (1983) on prediction of support pressures using the
RMR system, Bieniawski (1989) provided the following equation:
P = (100 – RMR)γB/100 (4.5)
where, P is the support load in kN, B is the tunnel width in meters and γ is the rock
density in kg/m3. As can be seen from Equation 4.5, the RMR system assumes that
the support pressure not only depends on the rock mass quality (or the RMR value),
but also on the width of the opening. This means that although the RMR
recommended support quantities are primarily aimed at 10 m span tunnels, the RMR
versus support pressure relationship can be applied to any tunnel regardless of its
span. Naturally, as would be expected, according to Equation 4.5 different support
pressures will be required for different tunnel spans in the same rock mass.
With reference to the Q system, Barton et al. (1977) and Grimstad and Barton (1993)
provided the following empirical formula for estimating the permanent radial support
pressures required to stabilise the roof of an excavation:
P = 200Jn1/2
Q-1/3
/3Jr (4.13)
where P is in kPa, Jn and Jr are as defined earlier. From the above equation, it is
clear that the Q system assumes that the support pressure is a function of only the
rock mass quality (Q value, Jn and Jr). The width or span of the excavation is
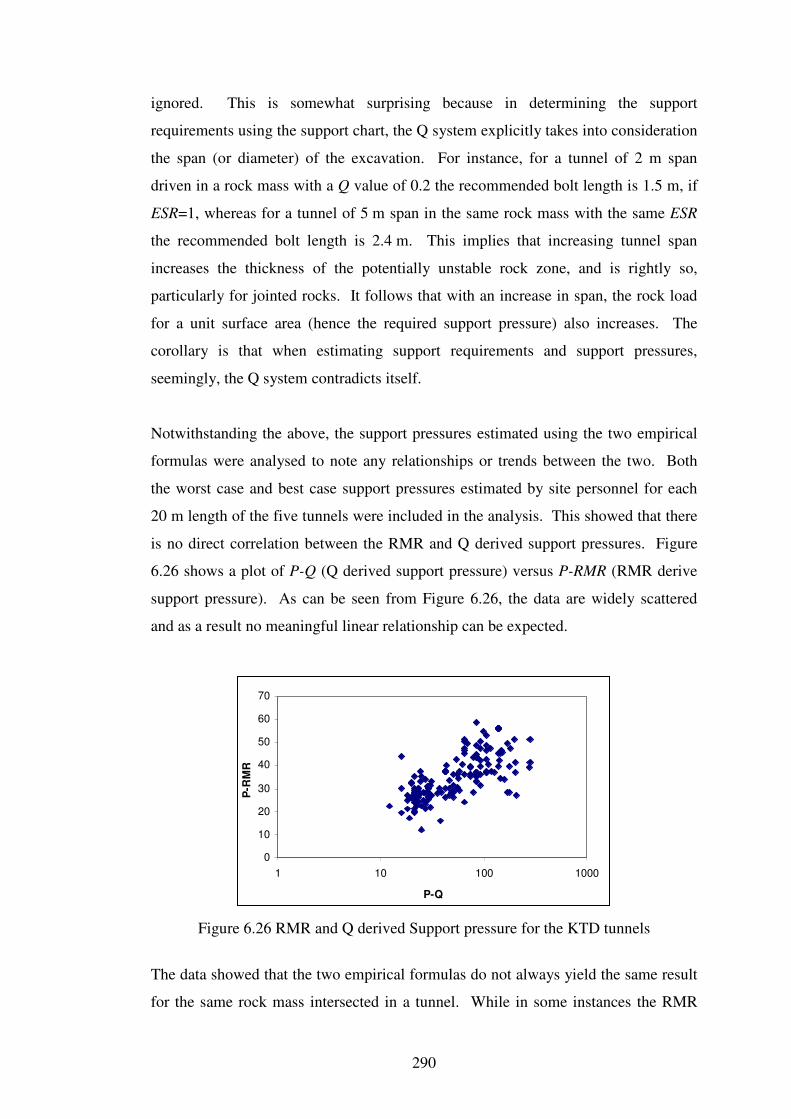
290
ignored. This is somewhat surprising because in determining the support
requirements using the support chart, the Q system explicitly takes into consideration
the span (or diameter) of the excavation. For instance, for a tunnel of 2 m span
driven in a rock mass with a Q value of 0.2 the recommended bolt length is 1.5 m, if
ESR=1, whereas for a tunnel of 5 m span in the same rock mass with the same ESR
the recommended bolt length is 2.4 m. This implies that increasing tunnel span
increases the thickness of the potentially unstable rock zone, and is rightly so,
particularly for jointed rocks. It follows that with an increase in span, the rock load
for a unit surface area (hence the required support pressure) also increases. The
corollary is that when estimating support requirements and support pressures,
seemingly, the Q system contradicts itself.
Notwithstanding the above, the support pressures estimated using the two empirical
formulas were analysed to note any relationships or trends between the two. Both
the worst case and best case support pressures estimated by site personnel for each
20 m length of the five tunnels were included in the analysis. This showed that there
is no direct correlation between the RMR and Q derived support pressures. Figure
6.26 shows a plot of P-Q (Q derived support pressure) versus P-RMR (RMR derive
support pressure). As can be seen from Figure 6.26, the data are widely scattered
and as a result no meaningful linear relationship can be expected.
0
10
20
30
40
50
60
70
1 10 100 1000
P-Q
P-R
MR
Figure 6.26 RMR and Q derived Support pressure for the KTD tunnels
The data showed that the two empirical formulas do not always yield the same result
for the same rock mass intersected in a tunnel. While in some instances the RMR
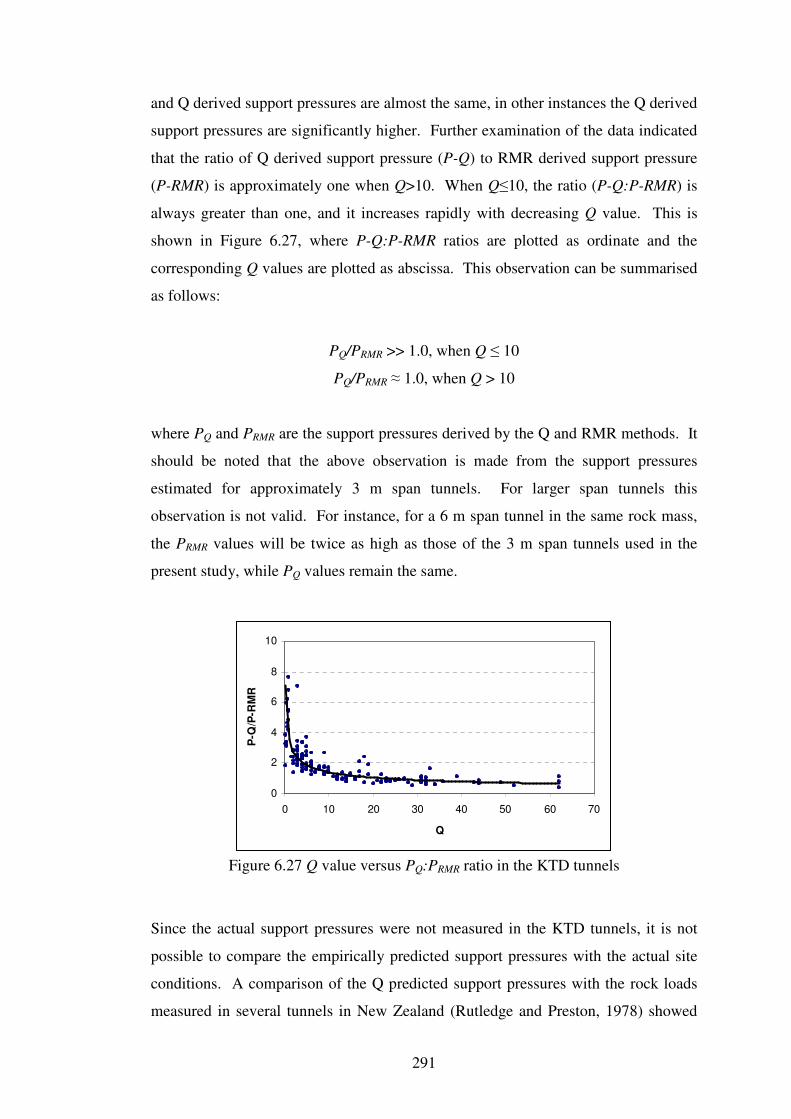
291
and Q derived support pressures are almost the same, in other instances the Q derived
support pressures are significantly higher. Further examination of the data indicated
that the ratio of Q derived support pressure (P-Q) to RMR derived support pressure
(P-RMR) is approximately one when Q>10. When Q≤10, the ratio (P-Q:P-RMR) is
always greater than one, and it increases rapidly with decreasing Q value. This is
shown in Figure 6.27, where P-Q:P-RMR ratios are plotted as ordinate and the
corresponding Q values are plotted as abscissa. This observation can be summarised
as follows:
PQ/PRMR >> 1.0, when Q ≤ 10
PQ/PRMR ≈ 1.0, when Q > 10
where PQ and PRMR are the support pressures derived by the Q and RMR methods. It
should be noted that the above observation is made from the support pressures
estimated for approximately 3 m span tunnels. For larger span tunnels this
observation is not valid. For instance, for a 6 m span tunnel in the same rock mass,
the PRMR values will be twice as high as those of the 3 m span tunnels used in the
present study, while PQ values remain the same.
0
2
4
6
8
10
0 10 20 30 40 50 60 70
Q
P-Q
/P-R
MR
Figure 6.27 Q value versus PQ:PRMR ratio in the KTD tunnels
Since the actual support pressures were not measured in the KTD tunnels, it is not
possible to compare the empirically predicted support pressures with the actual site
conditions. A comparison of the Q predicted support pressures with the rock loads
measured in several tunnels in New Zealand (Rutledge and Preston, 1978) showed
292
that many of the rock pressures predicted by the Q system are greater than the
measured rock loads by an excessively conservative margin. When Q≤10 the
support pressures estimated for the KTD tunnels agree with that observation. The
study conducted by Rutledge and Preston (1978) did not include a comparison of
RMR derived support pressures with the measured values. Based on the available
information, it is not possible to comment whether the RMR system underestimates
PRMR for poor rock mass conditions (i.e. when Q≤10).
An important point that should be mentioned here is that when Q≤10, the Q system
predicts higher support pressures than those predicted by the RMR system, yet it
does not recommend support for the KTD case tunnels if the Q value is more than 2.
This is because, according to the Q support chart, the small span tunnels with a De of
around 2 do not require support if the Q values is greater than 2. While this may be
the case for the case studies included in the database used in developing the Q
system, this is not always the case for other excavation projects as seen from the
KTD tunnels and previously shown by Ranasooriya and Nikraz (2008a and 2008b).
Note that since the KTD tunnels are mostly shallow the RMR versus support
pressure correlation (Equation 4.6) proposed by Goel and Jethwa (1991) for
predicting support pressures in tunnels at depths greater than 50 m was not used.
Even with the 87 m maximum depth of the KTD tunnels this equation would yield
only a negative support pressure and therefore it is not applicable in this case.
Similarly, the Q versus support correlation (Equation 4.14) proposed by Bhasin and
Grimstad (1996) was not used because this equation is for crushed and brecciated
rock masses and not for jointed rock masses as in the case tunnels.
6.9.7 Conclusions
The study showed that for the five tunnels, the Q system under estimated support
requirements, whereas, the RMR system overestimated the same. In the five tunnels
more support was installed than those derived by the Q system.
The predicted support pressures showed that the two empirical formulas do not
always yield the same result for the same rock mass intersected in a tunnel. Further

293
examination of the data indicated that for small diameter (~3 m) tunnels, the ratio of
Q derived support pressure (PQ) to RMR derived support pressure (PRMR) is
approximately one when Q>10. When Q≤10, the ratio (PQ:PRMR) is always greater
than one, and it increases rapidly with a decreasing Q value.
When Q≤10, the Q system predicted higher support pressures than those of the RMR
system, yet did not recommend support for the KTD case tunnels if the Q value is
greater than 2. For these small diameter tunnels the Q system underestimated
support requirements.
294
6.10 CASE STUDY 8:
The Namroud Water Resources Project Diversion (NWRPD) Tunnel, Iran
The Namroud water resources development project is currently being built in Firouz
Kouh, Tehran province, Iran. It comprises a 652 m long 82 m high rock fill
embankment dam with a clay core. The project also comprises a 5.5 m wide 740 m
long horseshoe shaped diversion tunnel constructed for two purposes: (a) to
temporarily divert the Namroud River to facilitate the construction of the dam; and
(b) as a bottom outlet during project operation to provide drinking and irrigation
water for downstream users. The tunnel located in the left abutment has an
overburden of between 30 and 90 m and was driven through weak sedimentary rocks
comprising limestone, marlstone and limy shale.
6.10.1 Project Site Geology
The regional geology of the project area is characterised by sedimentary rock
formations that have been subjected to a series of folding and faulting. Several major
geological structures are present in the general area including the Seleh Bon syncline,
the Nachoostan anticline, the Namroud and the Masha Fasham faults, and the
Barijan, Alborz, Garmsar, Namroud and Firoozkooh thrusts. The site is located on
the southern limb of the Seleh Bon syncline.
To the downstream of the dam axis is a region of several sedimentary rock units
which have been subjected to different tectonic events. Along the dam axis and to
the upstream is a group of soft sedimentary rocks of Karaj Formation. The tectonic
activities in the region caused several splay faults and shears and as a result some of
the rock units along the tunnel alignment are shattered and sheared. In general the
project area is overlain by recent sediments and most of the dam foundation is
located on alluvial deposits. The Namroud riverbed is composed of an alluvium
deposit, therefore the dam includes a cut-off wall to reduce the potential for water
loss through its foundation.
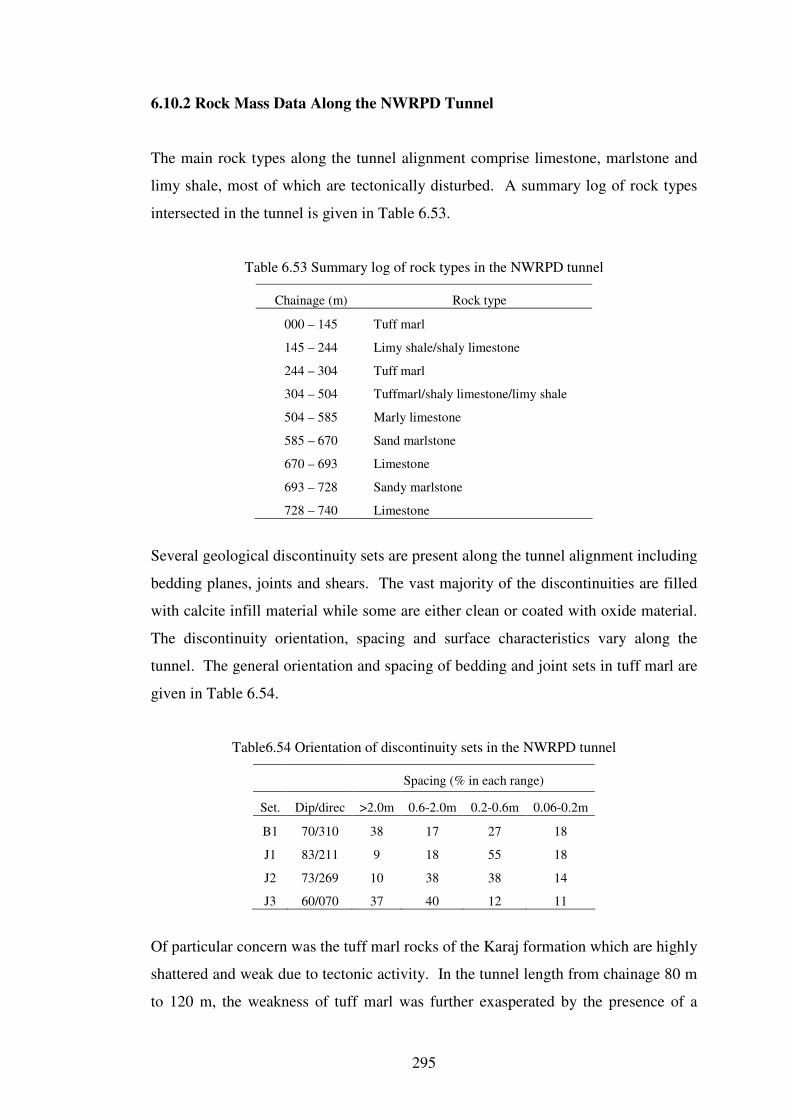
295
6.10.2 Rock Mass Data Along the NWRPD Tunnel
The main rock types along the tunnel alignment comprise limestone, marlstone and
limy shale, most of which are tectonically disturbed. A summary log of rock types
intersected in the tunnel is given in Table 6.53.
Table 6.53 Summary log of rock types in the NWRPD tunnel
Chainage (m) Rock type
000 – 145 Tuff marl
145 – 244 Limy shale/shaly limestone
244 – 304 Tuff marl
304 – 504 Tuffmarl/shaly limestone/limy shale
504 – 585 Marly limestone
585 – 670 Sand marlstone
670 – 693 Limestone
693 – 728 Sandy marlstone
728 – 740 Limestone
Several geological discontinuity sets are present along the tunnel alignment including
bedding planes, joints and shears. The vast majority of the discontinuities are filled
with calcite infill material while some are either clean or coated with oxide material.
The discontinuity orientation, spacing and surface characteristics vary along the
tunnel. The general orientation and spacing of bedding and joint sets in tuff marl are
given in Table 6.54.
Table6.54 Orientation of discontinuity sets in the NWRPD tunnel
Spacing (% in each range)
Set. Dip/direc >2.0m 0.6-2.0m 0.2-0.6m 0.06-0.2m
B1 70/310 38 17 27 18
J1 83/211 9 18 55 18
J2 73/269 10 38 38 14
J3 60/070 37 40 12 11
Of particular concern was the tuff marl rocks of the Karaj formation which are highly
shattered and weak due to tectonic activity. In the tunnel length from chainage 80 m
to 120 m, the weakness of tuff marl was further exasperated by the presence of a
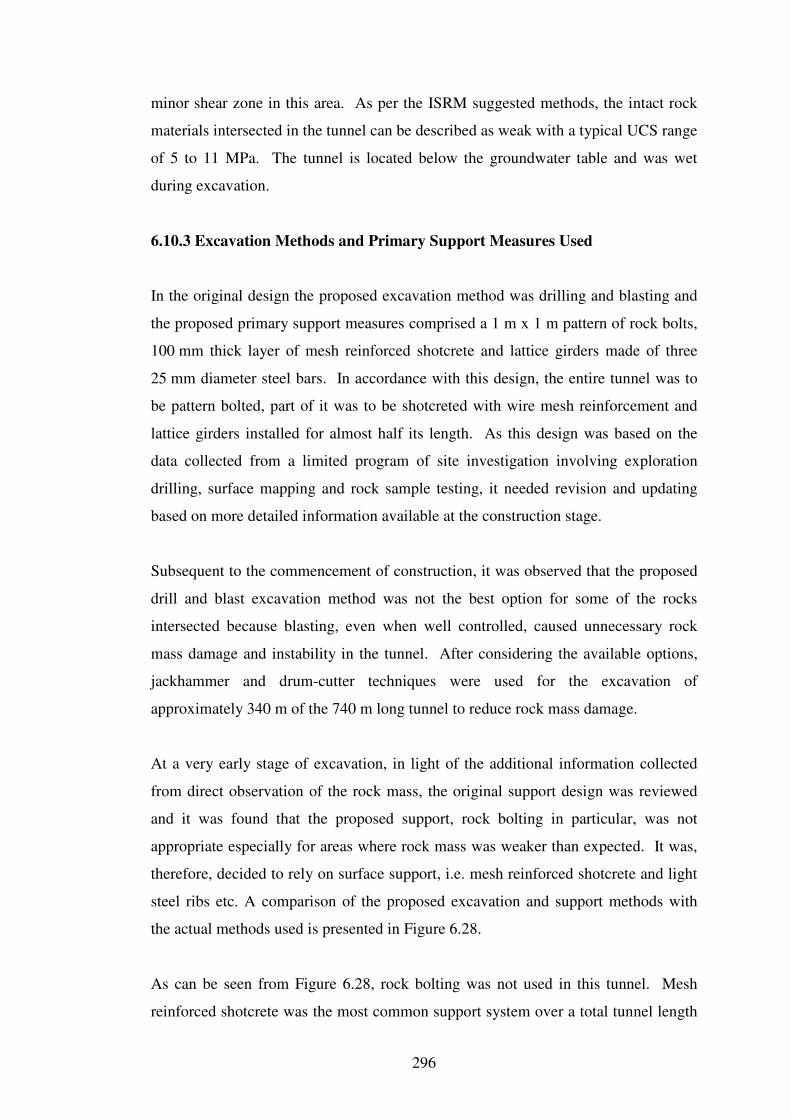
296
minor shear zone in this area. As per the ISRM suggested methods, the intact rock
materials intersected in the tunnel can be described as weak with a typical UCS range
of 5 to 11 MPa. The tunnel is located below the groundwater table and was wet
during excavation.
6.10.3 Excavation Methods and Primary Support Measures Used
In the original design the proposed excavation method was drilling and blasting and
the proposed primary support measures comprised a 1 m x 1 m pattern of rock bolts,
100 mm thick layer of mesh reinforced shotcrete and lattice girders made of three
25 mm diameter steel bars. In accordance with this design, the entire tunnel was to
be pattern bolted, part of it was to be shotcreted with wire mesh reinforcement and
lattice girders installed for almost half its length. As this design was based on the
data collected from a limited program of site investigation involving exploration
drilling, surface mapping and rock sample testing, it needed revision and updating
based on more detailed information available at the construction stage.
Subsequent to the commencement of construction, it was observed that the proposed
drill and blast excavation method was not the best option for some of the rocks
intersected because blasting, even when well controlled, caused unnecessary rock
mass damage and instability in the tunnel. After considering the available options,
jackhammer and drum-cutter techniques were used for the excavation of
approximately 340 m of the 740 m long tunnel to reduce rock mass damage.
At a very early stage of excavation, in light of the additional information collected
from direct observation of the rock mass, the original support design was reviewed
and it was found that the proposed support, rock bolting in particular, was not
appropriate especially for areas where rock mass was weaker than expected. It was,
therefore, decided to rely on surface support, i.e. mesh reinforced shotcrete and light
steel ribs etc. A comparison of the proposed excavation and support methods with
the actual methods used is presented in Figure 6.28.
As can be seen from Figure 6.28, rock bolting was not used in this tunnel. Mesh
reinforced shotcrete was the most common support system over a total tunnel length
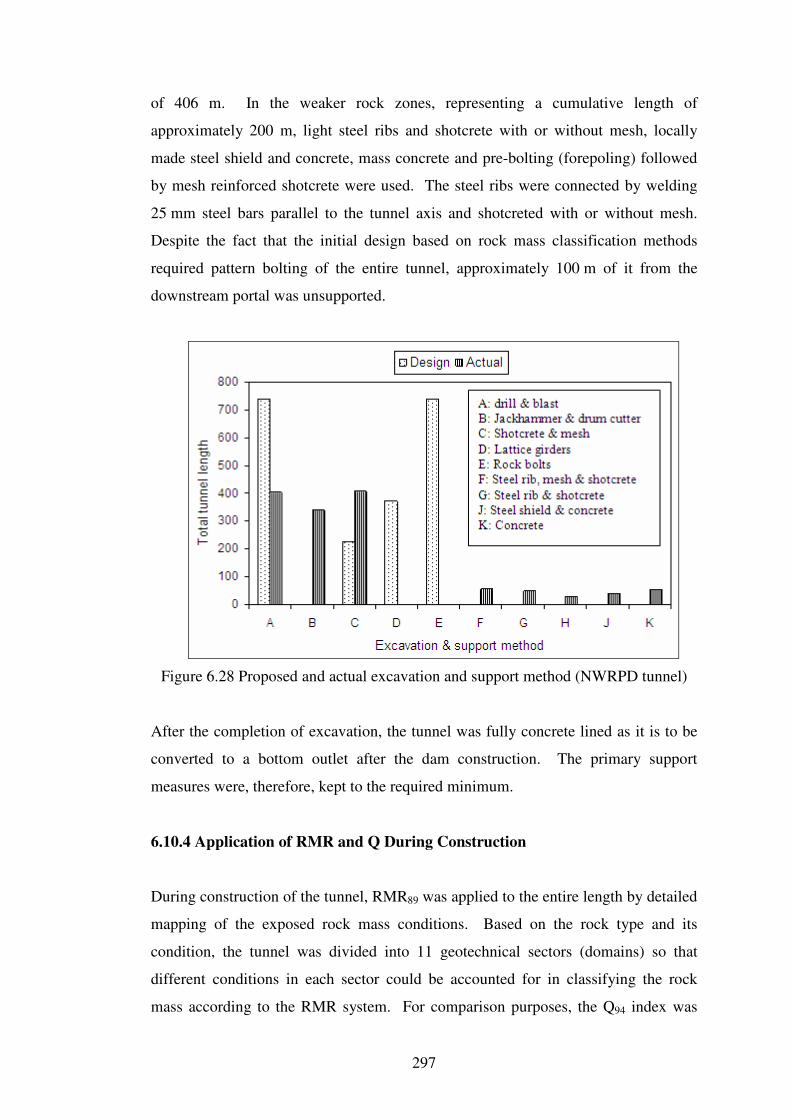
297
of 406 m. In the weaker rock zones, representing a cumulative length of
approximately 200 m, light steel ribs and shotcrete with or without mesh, locally
made steel shield and concrete, mass concrete and pre-bolting (forepoling) followed
by mesh reinforced shotcrete were used. The steel ribs were connected by welding
25 mm steel bars parallel to the tunnel axis and shotcreted with or without mesh.
Despite the fact that the initial design based on rock mass classification methods
required pattern bolting of the entire tunnel, approximately 100 m of it from the
downstream portal was unsupported.
Figure 6.28 Proposed and actual excavation and support method (NWRPD tunnel)
After the completion of excavation, the tunnel was fully concrete lined as it is to be
converted to a bottom outlet after the dam construction. The primary support
measures were, therefore, kept to the required minimum.
6.10.4 Application of RMR and Q During Construction
During construction of the tunnel, RMR89 was applied to the entire length by detailed
mapping of the exposed rock mass conditions. Based on the rock type and its
condition, the tunnel was divided into 11 geotechnical sectors (domains) so that
different conditions in each sector could be accounted for in classifying the rock
mass according to the RMR system. For comparison purposes, the Q94 index was
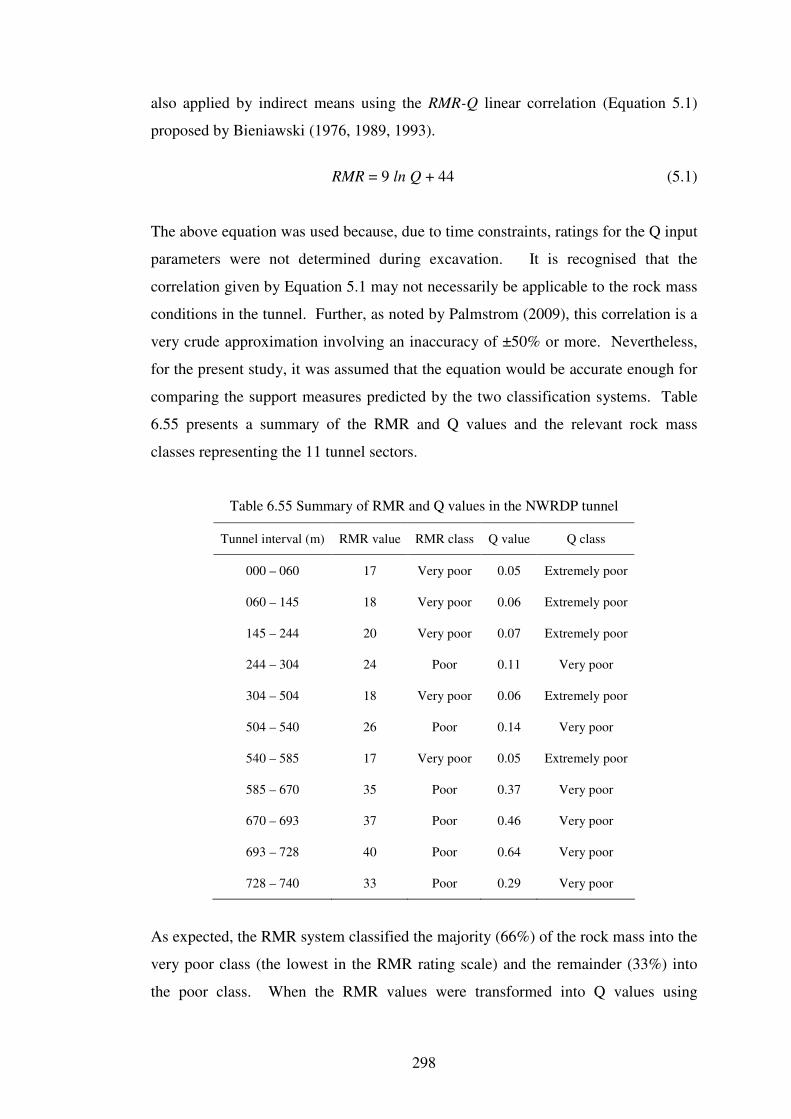
298
also applied by indirect means using the RMR-Q linear correlation (Equation 5.1)
proposed by Bieniawski (1976, 1989, 1993).
RMR = 9 ln Q + 44 (5.1)
The above equation was used because, due to time constraints, ratings for the Q input
parameters were not determined during excavation. It is recognised that the
correlation given by Equation 5.1 may not necessarily be applicable to the rock mass
conditions in the tunnel. Further, as noted by Palmstrom (2009), this correlation is a
very crude approximation involving an inaccuracy of ±50% or more. Nevertheless,
for the present study, it was assumed that the equation would be accurate enough for
comparing the support measures predicted by the two classification systems. Table
6.55 presents a summary of the RMR and Q values and the relevant rock mass
classes representing the 11 tunnel sectors.
Table 6.55 Summary of RMR and Q values in the NWRDP tunnel
Tunnel interval (m) RMR value RMR class Q value Q class
000 – 060 17 Very poor 0.05 Extremely poor
060 – 145 18 Very poor 0.06 Extremely poor
145 – 244 20 Very poor 0.07 Extremely poor
244 – 304 24 Poor 0.11 Very poor
304 – 504 18 Very poor 0.06 Extremely poor
504 – 540 26 Poor 0.14 Very poor
540 – 585 17 Very poor 0.05 Extremely poor
585 – 670 35 Poor 0.37 Very poor
670 – 693 37 Poor 0.46 Very poor
693 – 728 40 Poor 0.64 Very poor
728 – 740 33 Poor 0.29 Very poor
As expected, the RMR system classified the majority (66%) of the rock mass into the
very poor class (the lowest in the RMR rating scale) and the remainder (33%) into
the poor class. When the RMR values were transformed into Q values using
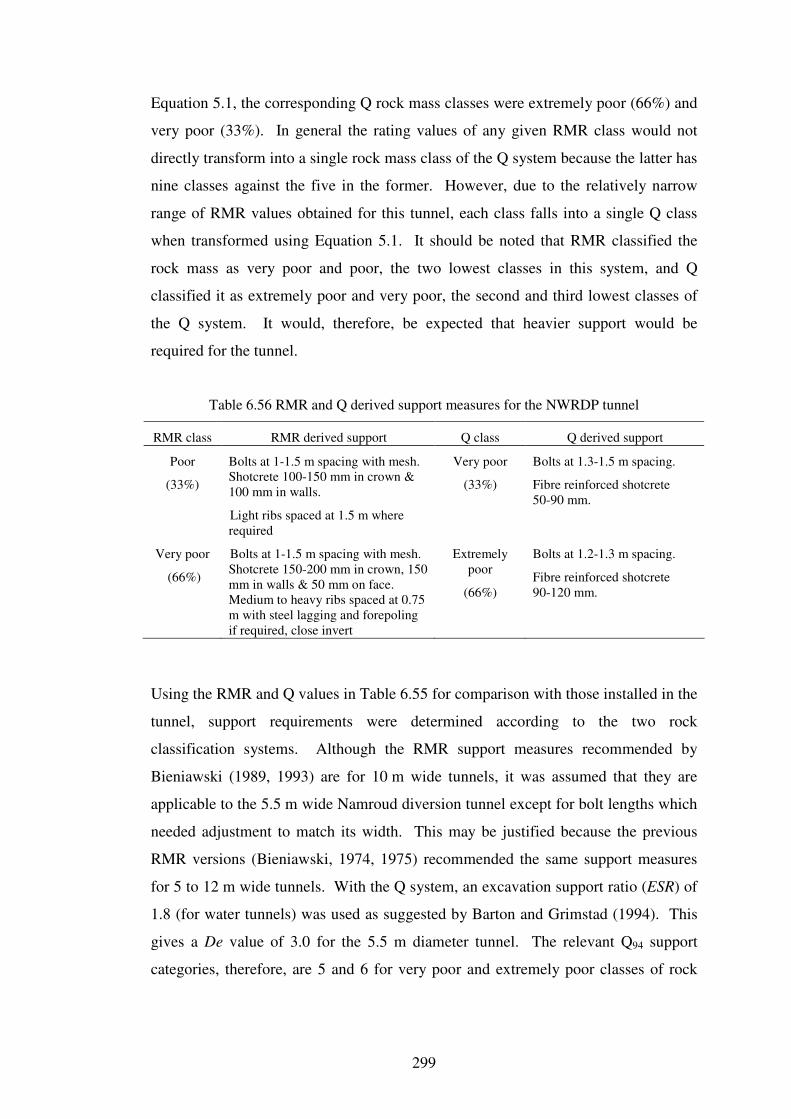
299
Equation 5.1, the corresponding Q rock mass classes were extremely poor (66%) and
very poor (33%). In general the rating values of any given RMR class would not
directly transform into a single rock mass class of the Q system because the latter has
nine classes against the five in the former. However, due to the relatively narrow
range of RMR values obtained for this tunnel, each class falls into a single Q class
when transformed using Equation 5.1. It should be noted that RMR classified the
rock mass as very poor and poor, the two lowest classes in this system, and Q
classified it as extremely poor and very poor, the second and third lowest classes of
the Q system. It would, therefore, be expected that heavier support would be
required for the tunnel.
Table 6.56 RMR and Q derived support measures for the NWRDP tunnel
RMR class RMR derived support Q class Q derived support
Poor
(33%)
Bolts at 1-1.5 m spacing with mesh.
Shotcrete 100-150 mm in crown &
100 mm in walls.
Light ribs spaced at 1.5 m where
required
Very poor
(33%)
Bolts at 1.3-1.5 m spacing.
Fibre reinforced shotcrete
50-90 mm.
Very poor
(66%)
Bolts at 1-1.5 m spacing with mesh.
Shotcrete 150-200 mm in crown, 150
mm in walls & 50 mm on face.
Medium to heavy ribs spaced at 0.75
m with steel lagging and forepoling
if required, close invert
Extremely
poor
(66%)
Bolts at 1.2-1.3 m spacing.
Fibre reinforced shotcrete
90-120 mm.
Using the RMR and Q values in Table 6.55 for comparison with those installed in the
tunnel, support requirements were determined according to the two rock
classification systems. Although the RMR support measures recommended by
Bieniawski (1989, 1993) are for 10 m wide tunnels, it was assumed that they are
applicable to the 5.5 m wide Namroud diversion tunnel except for bolt lengths which
needed adjustment to match its width. This may be justified because the previous
RMR versions (Bieniawski, 1974, 1975) recommended the same support measures
for 5 to 12 m wide tunnels. With the Q system, an excavation support ratio (ESR) of
1.8 (for water tunnels) was used as suggested by Barton and Grimstad (1994). This
gives a De value of 3.0 for the 5.5 m diameter tunnel. The relevant Q94 support
categories, therefore, are 5 and 6 for very poor and extremely poor classes of rock
300
respectively. The relevant RMR and Q support measures are presented in Table
6.56. (Note that these are for permanent support.)
As can be seen from Table 6.56, both RMR and Q recommended rock bolts and
shotcrete with mesh or fibre reinforcement. The RMR system also recommended
steel ribs for the very poor rock class and also for the poor class, if required.
Additionally, it also recommended forepoling (pre-bolting) for the very poor class, if
required. The steel sets and forepoling recommendations comply with some of the
support methods used in the weaker rock zones.
6.10.5 Actual Support Installed
As can be seen from Figure 6.28, rock bolting was not used as in the original design.
Mesh reinforced shotcrete was used for a total tunnel length of 406 m. Weaker rock
zones in a total length of approximately 200 m were supported with light steel ribs
and shotcrete with or without mesh, steel shield and concrete, mass concrete and pre-
bolting. As stated earlier, although some of the primary support measures used in the
weaker zones are comparable to those recommended by the RMR method, they
significantly differ from those recommended by the Q system. For the 100 m
unsupported length of the tunnel (from ~ Ch. 640 to 740 m), the RMR values ranged
from 33 to 40 and the corresponding Q values ranged from 0.29 to 0.64 (Table 6.55).
According to the two methods this length required pattern bolts plus mesh or fibre
reinforced shotcrete.
Since the RMR and Q recommendations are for permanent support, a direct
comparison with the primary support could be open to conjecture. Nevertheless, in
this instance heavier primary support measures were required for 200 m of the tunnel
than the permanent support recommended by the two methods.
6.10.6 Discussion
The rock mass conditions encountered during construction of the 740 m long
Namroud diversion tunnel were different to those predicted based on the data
collected for project design. Due to the weakness of some of the sedimentary rocks
301
intersected in the tunnel, the conventional drilling and blasting excavation method
was found to be problematic for part of the tunnel as blasting caused unnecessary
rock mass damage. Despite the fact that the RMR system suggested drill and blast
excavation methods for the entire tunnel, jackhammer and drum cutter techniques
were adopted for over 300 m thus significantly reducing unnecessary damage to the
rock mass.
During the early stages of excavation, it was observed that instead of the initially
proposed primary support system mainly consisting of pattern bolting, other support
systems could lead to better safety performance in weaker rock zones. Mesh
reinforced shotcrete was the most common support system used over a total tunnel
length of 406 m. In 200 m of weaker rock zones, light steel ribs and shotcrete with
or without mesh, steel shield and concrete, mass concrete and forepoling plus mesh
reinforced shotcrete were used. Approximately 100 m of the tunnel was unsupported
despite the fact that the initial design required pattern bolting of the entire tunnel.
The rock mass conditions exposed in the tunnel were mapped and the RMR system
was applied directly to the as-excavated rock mass conditions. The Q system was
also applied indirectly by converting the RMR values by means of a published
RMR-Q correlation.
6.10.7 Conclusion
Both RMR and Q methods recommended rock bolting and shotcrete with mesh or
fibre reinforcement for permanent support. While mesh reinforced shotcrete was
used, rock bolts were not.
In weaker rock zones, the RMR derived support generally agreed with the installed
heavier support which included light steel ribs and shotcrete with or without mesh,
steel shield and concrete, mass concrete and pre-bolting. The Q derived support
measures for the weaker rock zones differ except for the mesh (or fibre) reinforced
shotcrete, which is only part of the heavier support installed in these zones. The
primary support measures installed in approximately 200 m of the tunnel were
heavier than those recommended by Q for permanent support.

302
For the 100 m unsupported tunnel length, both RMR and Q recommended rock bolts
and wire mesh or fibre reinforced shotcrete.
303
6.11 CASE STUDY 9:
The Boztepe Dam Project Diversion (BDPD) Tunnel, Turkey
The Boztepe project is situated 10 km northwest of Yazihan, which is a township
located to the north of the city of Malatya in eastern Turkey. The Boztepe dam is
built across the Yagca stream to regulate water and irrigate the agricultural areas of
the Yazihan plain. The BDPD tunnel, constructed to facilitate the construction of the
main dam, is 565 m long, has a 5 m diameter circular shape and a maximum
overburden of about 38 m. Its alignment is north-south from the downstream portal
to about 400 m and then gradually turns to 40o west of north.
6.11.1 Project Site Geology
The Boztepe dam site consists of various geological formations ranging from the
Upper Miocene to the Quaternary age. Middle Upper Miocen volcano-sedimentary
rocks, known as Yamadag Volcanics, are exposed in the region and are part of an
extensive Miocene volcanism in the Eastern Anatolian Region. The Yamadag
volcanics are represented in the study area by four different rock units: sandstone-
claystone, tuffite, basalt and agglomerate. The tuffites are well bedded with bed
thickness ranging from 300 to 600 mm in the lower levels and 50 to 200 mm in the
upper levels. Joints within the tuffites are generally altered and filled with clay or
calcite having 20 to 30 mm thickness. Basalts overlying the tuffites are well jointed.
Basalts are mainly pillar lavas in the lower levels and columnar structures in the
upper levels. The agglomerate overlies basalt.
6.11.2 BDPD Tunnel Rock Mass Data
The tunnel cuts through basalt and tuffite. The maximum overburdens of basalts and
tuffites above the tunnel crown are about 38 m and 27 m respectively.
From the data collected by surface mapping and logging of 20 cored bore holes,
Gurocak et al. (2007) prepared an engineering geological map of the dam site and a
geological section along the tunnel alignment. The geological section shows that
approximately the first 100 m of the tunnel was driven through tuffite, and the next
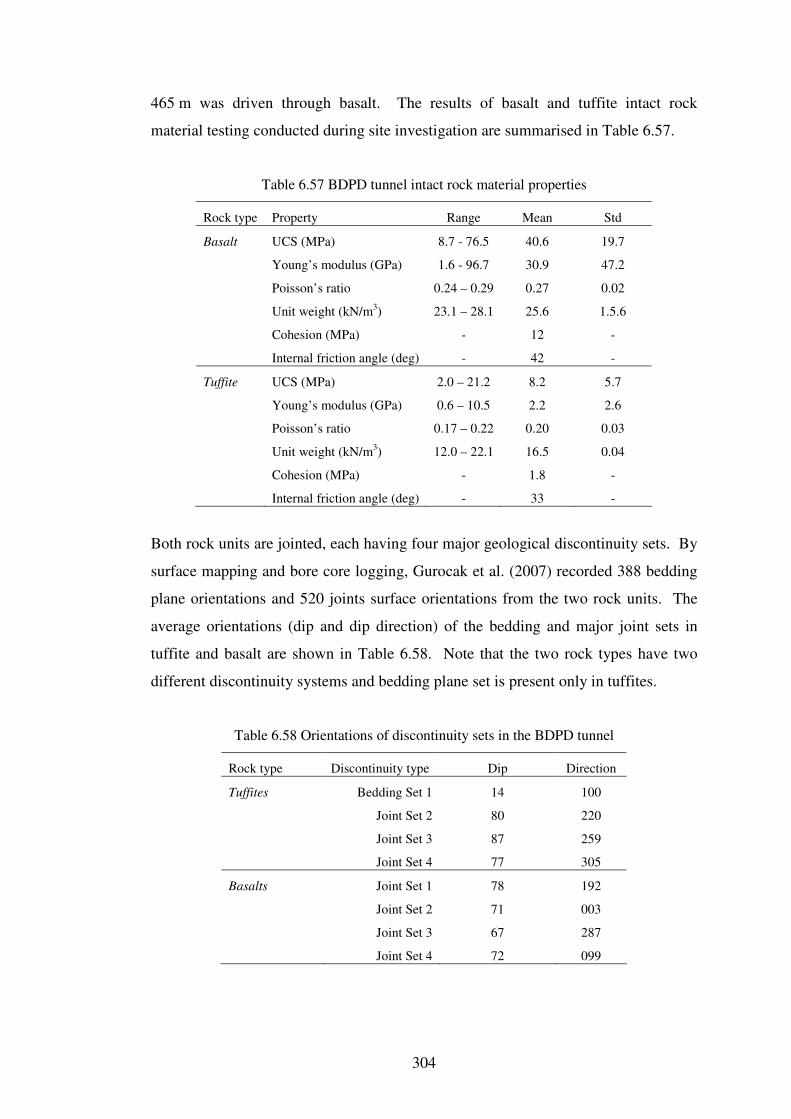
304
465 m was driven through basalt. The results of basalt and tuffite intact rock
material testing conducted during site investigation are summarised in Table 6.57.
Table 6.57 BDPD tunnel intact rock material properties
Rock type Property Range Mean Std
Basalt UCS (MPa) 8.7 - 76.5 40.6 19.7
Young’s modulus (GPa) 1.6 - 96.7 30.9 47.2
Poisson’s ratio 0.24 – 0.29 0.27 0.02
Unit weight (kN/m3) 23.1 – 28.1 25.6 1.5.6
Cohesion (MPa) - 12 -
Internal friction angle (deg) - 42 -
Tuffite UCS (MPa) 2.0 – 21.2 8.2 5.7
Young’s modulus (GPa) 0.6 – 10.5 2.2 2.6
Poisson’s ratio 0.17 – 0.22 0.20 0.03
Unit weight (kN/m3) 12.0 – 22.1 16.5 0.04
Cohesion (MPa) - 1.8 -
Internal friction angle (deg) - 33 -
Both rock units are jointed, each having four major geological discontinuity sets. By
surface mapping and bore core logging, Gurocak et al. (2007) recorded 388 bedding
plane orientations and 520 joints surface orientations from the two rock units. The
average orientations (dip and dip direction) of the bedding and major joint sets in
tuffite and basalt are shown in Table 6.58. Note that the two rock types have two
different discontinuity systems and bedding plane set is present only in tuffites.
Table 6.58 Orientations of discontinuity sets in the BDPD tunnel
Rock type Discontinuity type Dip Direction
Tuffites Bedding Set 1 14 100
Joint Set 2 80 220
Joint Set 3 87 259
Joint Set 4 77 305
Basalts Joint Set 1 78 192
Joint Set 2 71 003
Joint Set 3 67 287
Joint Set 4 72 099

305
The discontinuity properties and their percentage distributions in basalt and tuffite
are presented in Table 6.59. Although the properties vary within both rock types, the
majority of the joints in basalt have close to very close spacing, low persistence,
moderately wide apertures and moderately weathered rough planar surfaces. The
majority of the discontinuities in tuffite have close spacing, medium to high
persistence, moderately wide apertures and weathered rough planar surfaces
(Table 6.59).
Table 6.59 BDPD tunnel joint properties
Property Descriptive class Values range Basalt (%) Tuffite (%)
Spacing (mm) Extremely close <20 5 2
Very close 20-60 33 16
Close 60-200 42 69
Moderate 200-600 20 10
Wide 600-2000 - 3
Persistence (m) Very low <1 33 8
Low 1-3 56 9
Medium 3-10 11 34
High 10-20 - 31
Very high >20 - 14
Aperture (mm) Very tight <0.1 8 12
Tight 0.1-0.25 14 -
Partly open 0.25-0.50 10 2
Open 0.50-2.50 16 20
Moderately wide 2.5-10 48 51
Wide >10 4 15
Roughness Rough undulating IV 11 5
Smooth undulating V 3 7
Slickensided undulating VI 10 -
Rough planar VII 61 88
Smooth planar VIII 6 -
Slickensided planar IX 9 -
Weathering (wc) Fresh/unweathered 22 -
Moderately weathered 67 2
Weathered 11 98
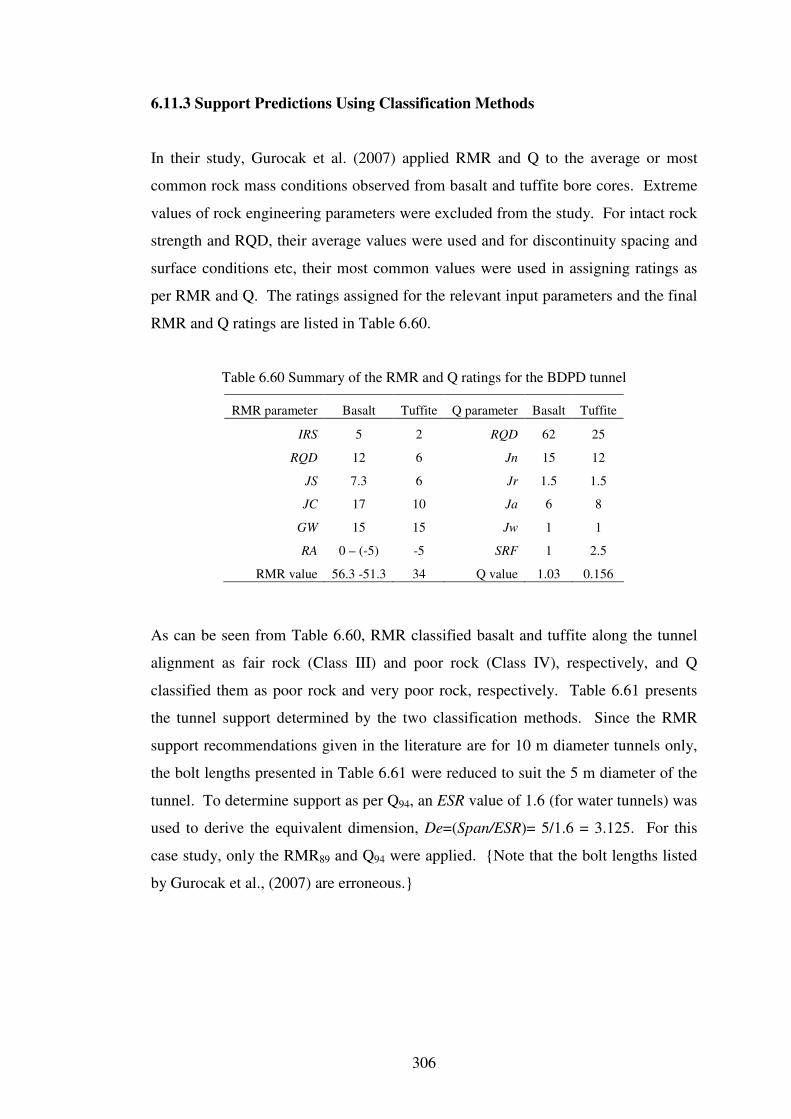
306
6.11.3 Support Predictions Using Classification Methods
In their study, Gurocak et al. (2007) applied RMR and Q to the average or most
common rock mass conditions observed from basalt and tuffite bore cores. Extreme
values of rock engineering parameters were excluded from the study. For intact rock
strength and RQD, their average values were used and for discontinuity spacing and
surface conditions etc, their most common values were used in assigning ratings as
per RMR and Q. The ratings assigned for the relevant input parameters and the final
RMR and Q ratings are listed in Table 6.60.
Table 6.60 Summary of the RMR and Q ratings for the BDPD tunnel
RMR parameter Basalt Tuffite Q parameter Basalt Tuffite
IRS 5 2 RQD 62 25
RQD 12 6 Jn 15 12
JS 7.3 6 Jr 1.5 1.5
JC 17 10 Ja 6 8
GW 15 15 Jw 1 1
RA 0 – (-5) -5 SRF 1 2.5
RMR value 56.3 -51.3 34 Q value 1.03 0.156
As can be seen from Table 6.60, RMR classified basalt and tuffite along the tunnel
alignment as fair rock (Class III) and poor rock (Class IV), respectively, and Q
classified them as poor rock and very poor rock, respectively. Table 6.61 presents
the tunnel support determined by the two classification methods. Since the RMR
support recommendations given in the literature are for 10 m diameter tunnels only,
the bolt lengths presented in Table 6.61 were reduced to suit the 5 m diameter of the
tunnel. To determine support as per Q94, an ESR value of 1.6 (for water tunnels) was
used to derive the equivalent dimension, De=(Span/ESR)= 5/1.6 = 3.125. For this
case study, only the RMR89 and Q94 were applied. {Note that the bolt lengths listed
by Gurocak et al., (2007) are erroneous.}
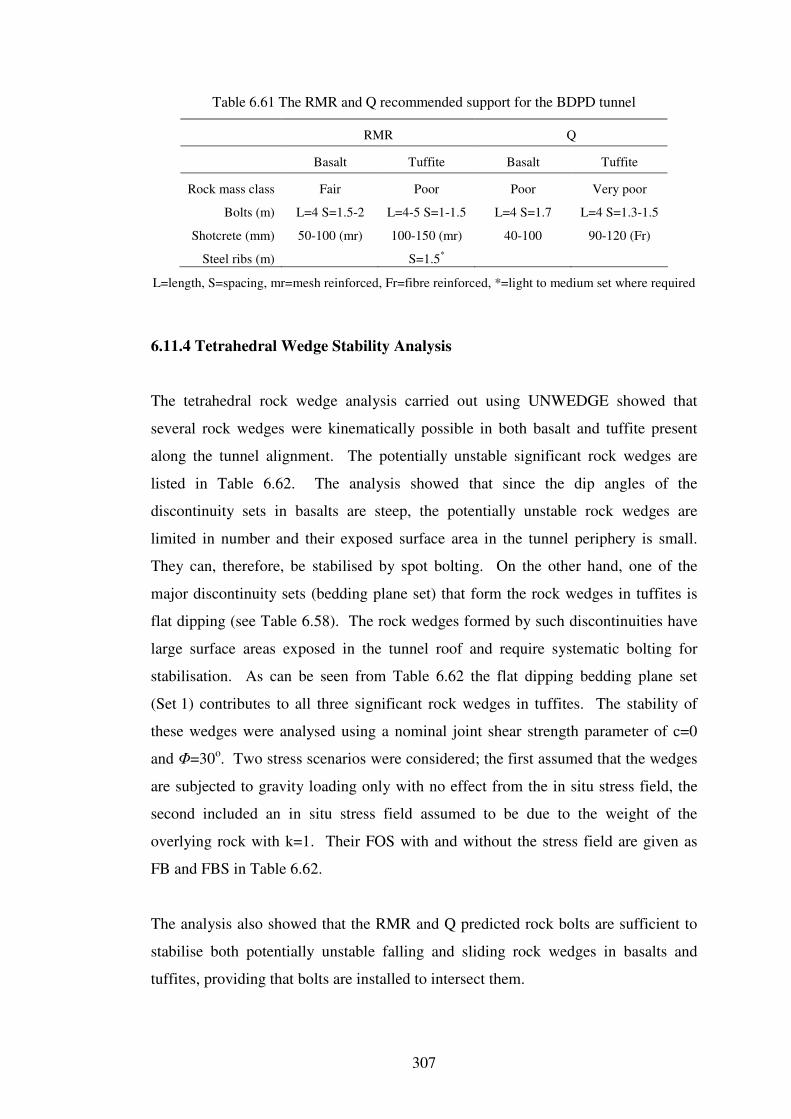
307
Table 6.61 The RMR and Q recommended support for the BDPD tunnel
RMR Q
Basalt Tuffite Basalt Tuffite
Rock mass class Fair Poor Poor Very poor
Bolts (m) L=4 S=1.5-2 L=4-5 S=1-1.5 L=4 S=1.7 L=4 S=1.3-1.5
Shotcrete (mm) 50-100 (mr) 100-150 (mr) 40-100 90-120 (Fr)
Steel ribs (m) S=1.5*
L=length, S=spacing, mr=mesh reinforced, Fr=fibre reinforced, *=light to medium set where required
6.11.4 Tetrahedral Wedge Stability Analysis
The tetrahedral rock wedge analysis carried out using UNWEDGE showed that
several rock wedges were kinematically possible in both basalt and tuffite present
along the tunnel alignment. The potentially unstable significant rock wedges are
listed in Table 6.62. The analysis showed that since the dip angles of the
discontinuity sets in basalts are steep, the potentially unstable rock wedges are
limited in number and their exposed surface area in the tunnel periphery is small.
They can, therefore, be stabilised by spot bolting. On the other hand, one of the
major discontinuity sets (bedding plane set) that form the rock wedges in tuffites is
flat dipping (see Table 6.58). The rock wedges formed by such discontinuities have
large surface areas exposed in the tunnel roof and require systematic bolting for
stabilisation. As can be seen from Table 6.62 the flat dipping bedding plane set
(Set 1) contributes to all three significant rock wedges in tuffites. The stability of
these wedges were analysed using a nominal joint shear strength parameter of c=0
and Φ=30o. Two stress scenarios were considered; the first assumed that the wedges
are subjected to gravity loading only with no effect from the in situ stress field, the
second included an in situ stress field assumed to be due to the weight of the
overlying rock with k=1. Their FOS with and without the stress field are given as
FB and FBS in Table 6.62.
The analysis also showed that the RMR and Q predicted rock bolts are sufficient to
stabilise both potentially unstable falling and sliding rock wedges in basalts and
tuffites, providing that bolts are installed to intersect them.
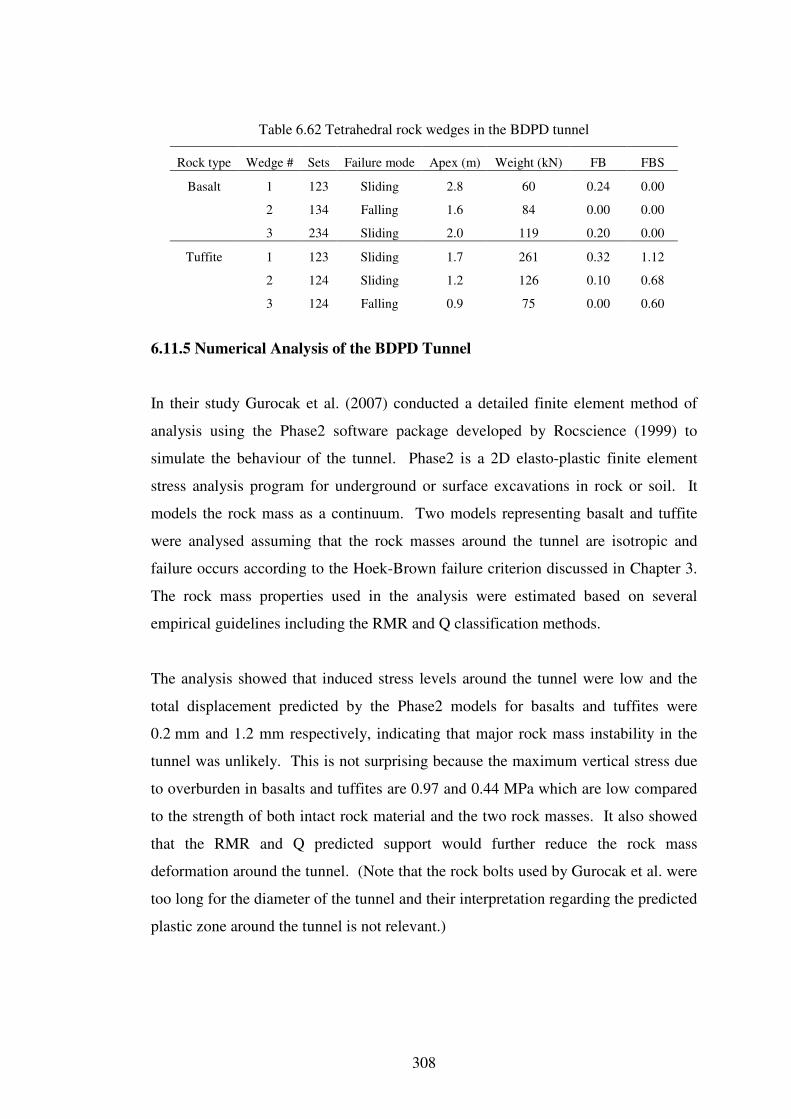
308
Table 6.62 Tetrahedral rock wedges in the BDPD tunnel
Rock type Wedge # Sets Failure mode Apex (m) Weight (kN) FB FBS
Basalt 1 123 Sliding 2.8 60 0.24 0.00
2 134 Falling 1.6 84 0.00 0.00
3 234 Sliding 2.0 119 0.20 0.00
Tuffite 1 123 Sliding 1.7 261 0.32 1.12
2 124 Sliding 1.2 126 0.10 0.68
3 124 Falling 0.9 75 0.00 0.60
6.11.5 Numerical Analysis of the BDPD Tunnel
In their study Gurocak et al. (2007) conducted a detailed finite element method of
analysis using the Phase2 software package developed by Rocscience (1999) to
simulate the behaviour of the tunnel. Phase2 is a 2D elasto-plastic finite element
stress analysis program for underground or surface excavations in rock or soil. It
models the rock mass as a continuum. Two models representing basalt and tuffite
were analysed assuming that the rock masses around the tunnel are isotropic and
failure occurs according to the Hoek-Brown failure criterion discussed in Chapter 3.
The rock mass properties used in the analysis were estimated based on several
empirical guidelines including the RMR and Q classification methods.
The analysis showed that induced stress levels around the tunnel were low and the
total displacement predicted by the Phase2 models for basalts and tuffites were
0.2 mm and 1.2 mm respectively, indicating that major rock mass instability in the
tunnel was unlikely. This is not surprising because the maximum vertical stress due
to overburden in basalts and tuffites are 0.97 and 0.44 MPa which are low compared
to the strength of both intact rock material and the two rock masses. It also showed
that the RMR and Q predicted support would further reduce the rock mass
deformation around the tunnel. (Note that the rock bolts used by Gurocak et al. were
too long for the diameter of the tunnel and their interpretation regarding the predicted
plastic zone around the tunnel is not relevant.)
309
6.11.6 Actual Support Installed
During excavation of the tunnel, Gurocak (2007) found that the actual conditions of
tuffite were slightly better than those predicted using bore core data obtained during
site investigations. Despite the variations in the actual conditions, the support
measures installed in the tuffite rock unit were similar to those determined by the two
empirical methods. The actual conditions of basalts were similar to those anticipated
based on the results of the site investigation and classification of the rock mass
according to RMR and Q. Although systematic rock bolts and shotcrete were
recommended by the two methods for basalt, only local (spot) bolting was used
during construction of the tunnel (Gurocak, 2007).
6.11.7 Discussion
The original support design for the BDPD tunnel was based on the application of the
RMR and Q indices using the rock mass data collected primarily from cored
boreholes drilled along the tunnel alignment. A total length of 1195 m of core was
logged from 20 boreholes and additionally, surface exposures were also mapped
(Gurocak et al., 2007). Based on the bore core data the two empirical methods
predicted some instability problems in basalts. Both recommended rock bolts and
shotcrete for basalts. The two empirical methods indicated that substantial support
would be required for tuffites, the weaker of the two rock types. However, during
construction, the actual conditions of tuffites were slightly better than those predicted
during site investigations. The actual conditions of basalts were similar to those
anticipated based on the application of RMR and Q using bore core data obtained
during the site investigation. Nevertheless, the actual support measures installed in
basalts were less than those recommended by the RMR and Q methods. This
indicates that for this tunnel based on the data obtained primarily from bore core, the
RMR and Q predicted lower rock mass qualities for tuffites than those actually
intersected during excavation, but the support predictions were comparable to those
actually installed. In basalt the predicted rock mass conditions were similar to those
intersected during construction but the predicted support measures exceeded those
actually installed.
310
6.11.8 Conclusion
Both the RMR and Q methods predicted some instability problems in basalts. The
RMR system recommended systematic rock bolting and mesh reinforced shotcrete
for tunnel roof in basalts. The Q system recommended systematic rock bolting and
un-reinforced shotcrete. Although the predicted conditions were similar to those
intersected during excavation only spot bolting was used. Thus the two methods
could be considered overconservative in this case.
The empirical methods indicated that substantial support would be necessary for
tuffites. RMR recommended systematic rock bolting, mesh reinforced shotcrete and
occasional light to medium steel sets for the tunnel in tuffites. Q recommended
systematic rock bolting and fibre reinforced shotcrete. However, during the
construction of the tunnel, the actual conditions of tuffite were slightly better than
those predicted during site investigations. Besides the variations in the actual
conditions the support measures installed in the tuffite rock unit were similar to those
determined by the empirical methods.
The RMR and Q predictions made using data obtained primarily from bore cores,
depending on the rock type and its condition, could either be adequate or
overconservative.
311
6.12 CASE STUDY 10:
The Ramboda Pass Highway (RPH) Tunnel, Sri Lanka
The Ramboda Pass Highway tunnel is part of the Gampola to Nuwara Eliya AA005
highway improvement project in the central highlands of Sri Lanka. The tunnel was
constructed as a double lane alternative for a narrow single lane portion of the
existing highway that traverses around a steep rocky hill slope at the Ramboda Pass.
It is located within a hill and has a slightly curved alignment varying between 142o
and 178o to the north with an overburden of between about 15 m at the upstream
portal and about 50 m at mid length. The horseshoe shaped tunnel is 222 m long and
was excavated by drill and blast methods. The as-excavated diameter of the tunnel
was about 8 m and the finished diameter varies between 7 m at the upstream end and
7.5 m at the downstream end. Its construction was completed in 2007.
6.12.1 Project Site Geology
The project is located on a gently dipping limb of a regional fold dominated by
Pre-Cambrian crystalline basement rocks, mainly charnockitic and garnetiferous
gneisses of the Highland Series rock formation of Sri Lanka. These are high grade
metamorphic rocks with well developed foliation planes. The geological structure
includes minor faults and well developed joint systems, sub-vertical joints being
prominent. In the general area of the project, steep natural rock faces have been
formed along the near vertical joints. The sub-vertical joints also contribute to
differential weathering of the rock mass.
6.12.2 Rock Mass Data
The rock types intersected in the tunnel are charnockitic and garnetiferos gneisses
whose conditions vary along the tunnel alignment. From the downstream end to
about 177 m, the rocks are mostly fresh. In the next 45 m to the upstream end the
rock is weathered. The weathering grade increases from moderately to highly
weathered and at the upstream portal, the rock is highly to completely weathered.
The UCS of unweathered rock materials varies between 60 and 120 MPa. The tunnel
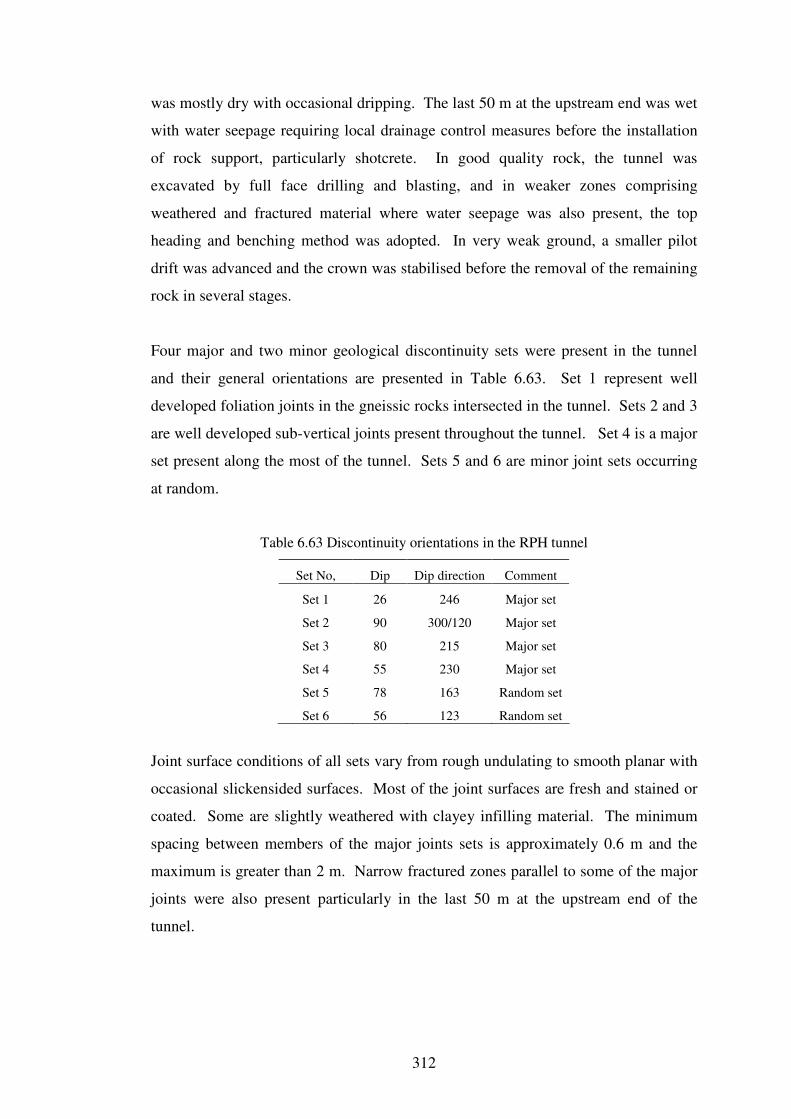
312
was mostly dry with occasional dripping. The last 50 m at the upstream end was wet
with water seepage requiring local drainage control measures before the installation
of rock support, particularly shotcrete. In good quality rock, the tunnel was
excavated by full face drilling and blasting, and in weaker zones comprising
weathered and fractured material where water seepage was also present, the top
heading and benching method was adopted. In very weak ground, a smaller pilot
drift was advanced and the crown was stabilised before the removal of the remaining
rock in several stages.
Four major and two minor geological discontinuity sets were present in the tunnel
and their general orientations are presented in Table 6.63. Set 1 represent well
developed foliation joints in the gneissic rocks intersected in the tunnel. Sets 2 and 3
are well developed sub-vertical joints present throughout the tunnel. Set 4 is a major
set present along the most of the tunnel. Sets 5 and 6 are minor joint sets occurring
at random.
Table 6.63 Discontinuity orientations in the RPH tunnel
Set No, Dip Dip direction Comment
Set 1 26 246 Major set
Set 2 90 300/120 Major set
Set 3 80 215 Major set
Set 4 55 230 Major set
Set 5 78 163 Random set
Set 6 56 123 Random set
Joint surface conditions of all sets vary from rough undulating to smooth planar with
occasional slickensided surfaces. Most of the joint surfaces are fresh and stained or
coated. Some are slightly weathered with clayey infilling material. The minimum
spacing between members of the major joints sets is approximately 0.6 m and the
maximum is greater than 2 m. Narrow fractured zones parallel to some of the major
joints were also present particularly in the last 50 m at the upstream end of the
tunnel.
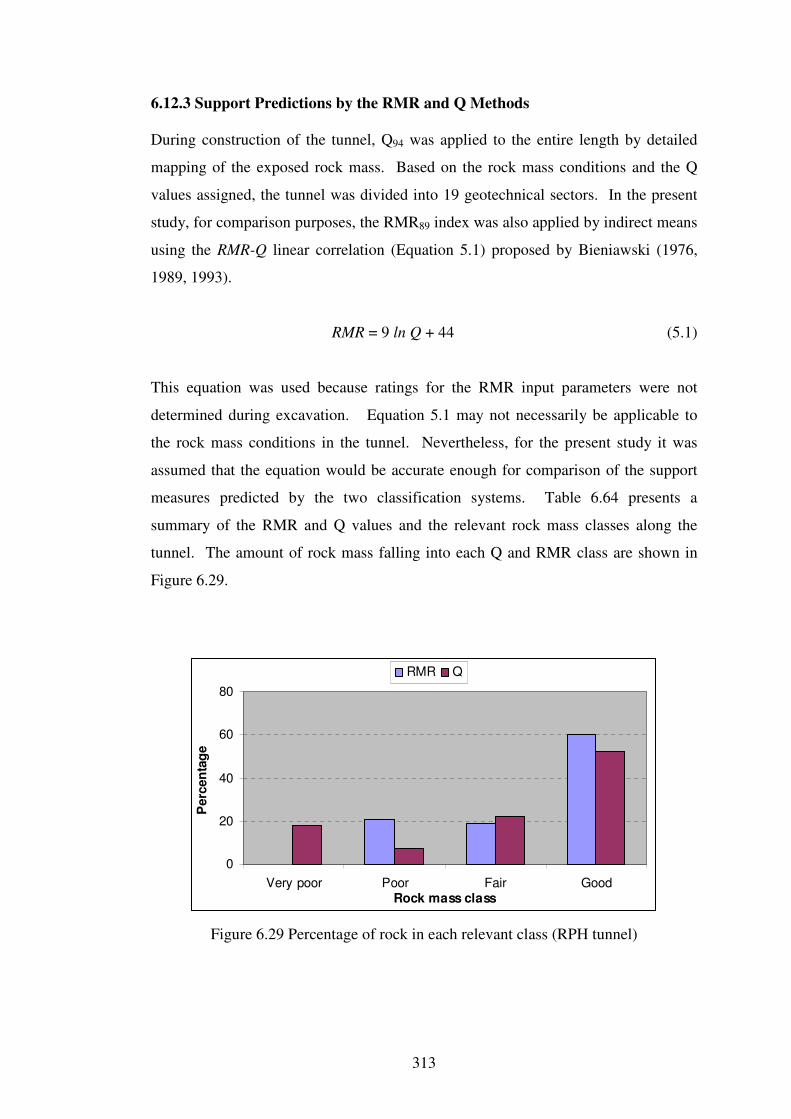
313
6.12.3 Support Predictions by the RMR and Q Methods
During construction of the tunnel, Q94 was applied to the entire length by detailed
mapping of the exposed rock mass. Based on the rock mass conditions and the Q
values assigned, the tunnel was divided into 19 geotechnical sectors. In the present
study, for comparison purposes, the RMR89 index was also applied by indirect means
using the RMR-Q linear correlation (Equation 5.1) proposed by Bieniawski (1976,
1989, 1993).
RMR = 9 ln Q + 44 (5.1)
This equation was used because ratings for the RMR input parameters were not
determined during excavation. Equation 5.1 may not necessarily be applicable to
the rock mass conditions in the tunnel. Nevertheless, for the present study it was
assumed that the equation would be accurate enough for comparison of the support
measures predicted by the two classification systems. Table 6.64 presents a
summary of the RMR and Q values and the relevant rock mass classes along the
tunnel. The amount of rock mass falling into each Q and RMR class are shown in
Figure 6.29.
0
20
40
60
80
Very poor Poor Fair GoodRock mass class
Perc
en
tag
e
RMR Q
Figure 6.29 Percentage of rock in each relevant class (RPH tunnel)
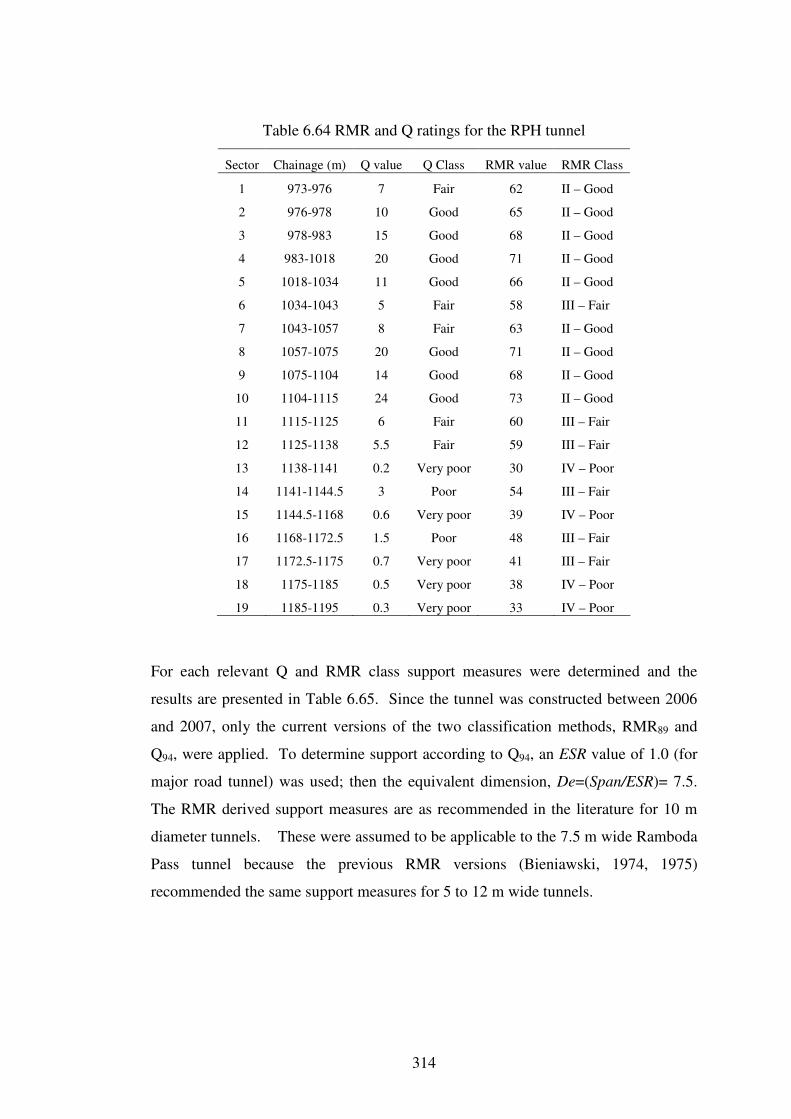
314
Table 6.64 RMR and Q ratings for the RPH tunnel
Sector Chainage (m) Q value Q Class RMR value RMR Class
1 973-976 7 Fair 62 II – Good
2 976-978 10 Good 65 II – Good
3 978-983 15 Good 68 II – Good
4 983-1018 20 Good 71 II – Good
5 1018-1034 11 Good 66 II – Good
6 1034-1043 5 Fair 58 III – Fair
7 1043-1057 8 Fair 63 II – Good
8 1057-1075 20 Good 71 II – Good
9 1075-1104 14 Good 68 II – Good
10 1104-1115 24 Good 73 II – Good
11 1115-1125 6 Fair 60 III – Fair
12 1125-1138 5.5 Fair 59 III – Fair
13 1138-1141 0.2 Very poor 30 IV – Poor
14 1141-1144.5 3 Poor 54 III – Fair
15 1144.5-1168 0.6 Very poor 39 IV – Poor
16 1168-1172.5 1.5 Poor 48 III – Fair
17 1172.5-1175 0.7 Very poor 41 III – Fair
18 1175-1185 0.5 Very poor 38 IV – Poor
19 1185-1195 0.3 Very poor 33 IV – Poor
For each relevant Q and RMR class support measures were determined and the
results are presented in Table 6.65. Since the tunnel was constructed between 2006
and 2007, only the current versions of the two classification methods, RMR89 and
Q94, were applied. To determine support according to Q94, an ESR value of 1.0 (for
major road tunnel) was used; then the equivalent dimension, De=(Span/ESR)= 7.5.
The RMR derived support measures are as recommended in the literature for 10 m
diameter tunnels. These were assumed to be applicable to the 7.5 m wide Ramboda
Pass tunnel because the previous RMR versions (Bieniawski, 1974, 1975)
recommended the same support measures for 5 to 12 m wide tunnels.
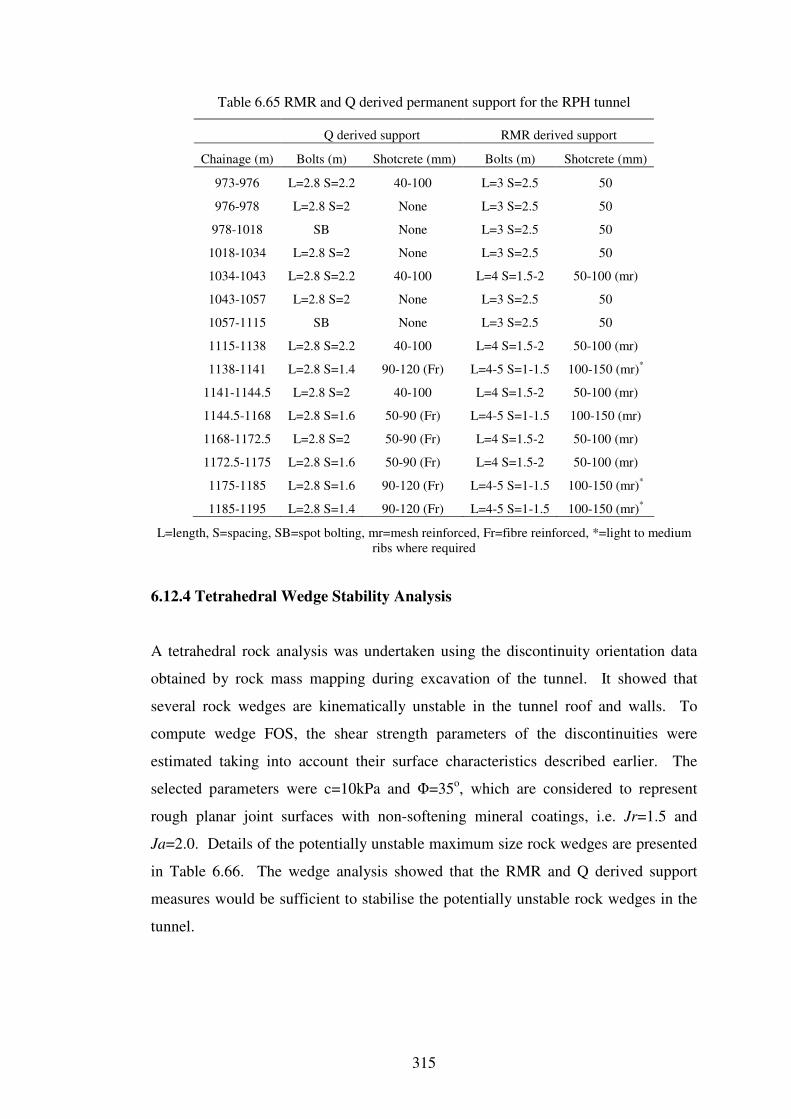
315
Table 6.65 RMR and Q derived permanent support for the RPH tunnel
Q derived support RMR derived support
Chainage (m) Bolts (m) Shotcrete (mm) Bolts (m) Shotcrete (mm)
973-976 L=2.8 S=2.2 40-100 L=3 S=2.5 50
976-978 L=2.8 S=2 None L=3 S=2.5 50
978-1018 SB None L=3 S=2.5 50
1018-1034 L=2.8 S=2 None L=3 S=2.5 50
1034-1043 L=2.8 S=2.2 40-100 L=4 S=1.5-2 50-100 (mr)
1043-1057 L=2.8 S=2 None L=3 S=2.5 50
1057-1115 SB None L=3 S=2.5 50
1115-1138 L=2.8 S=2.2 40-100 L=4 S=1.5-2 50-100 (mr)
1138-1141 L=2.8 S=1.4 90-120 (Fr) L=4-5 S=1-1.5 100-150 (mr)*
1141-1144.5 L=2.8 S=2 40-100 L=4 S=1.5-2 50-100 (mr)
1144.5-1168 L=2.8 S=1.6 50-90 (Fr) L=4-5 S=1-1.5 100-150 (mr)
1168-1172.5 L=2.8 S=2 50-90 (Fr) L=4 S=1.5-2 50-100 (mr)
1172.5-1175 L=2.8 S=1.6 50-90 (Fr) L=4 S=1.5-2 50-100 (mr)
1175-1185 L=2.8 S=1.6 90-120 (Fr) L=4-5 S=1-1.5 100-150 (mr)*
1185-1195 L=2.8 S=1.4 90-120 (Fr) L=4-5 S=1-1.5 100-150 (mr)*
L=length, S=spacing, SB=spot bolting, mr=mesh reinforced, Fr=fibre reinforced, *=light to medium
ribs where required
6.12.4 Tetrahedral Wedge Stability Analysis
A tetrahedral rock analysis was undertaken using the discontinuity orientation data
obtained by rock mass mapping during excavation of the tunnel. It showed that
several rock wedges are kinematically unstable in the tunnel roof and walls. To
compute wedge FOS, the shear strength parameters of the discontinuities were
estimated taking into account their surface characteristics described earlier. The
selected parameters were c=10kPa and Φ=35o, which are considered to represent
rough planar joint surfaces with non-softening mineral coatings, i.e. Jr=1.5 and
Ja=2.0. Details of the potentially unstable maximum size rock wedges are presented
in Table 6.66. The wedge analysis showed that the RMR and Q derived support
measures would be sufficient to stabilise the potentially unstable rock wedges in the
tunnel.
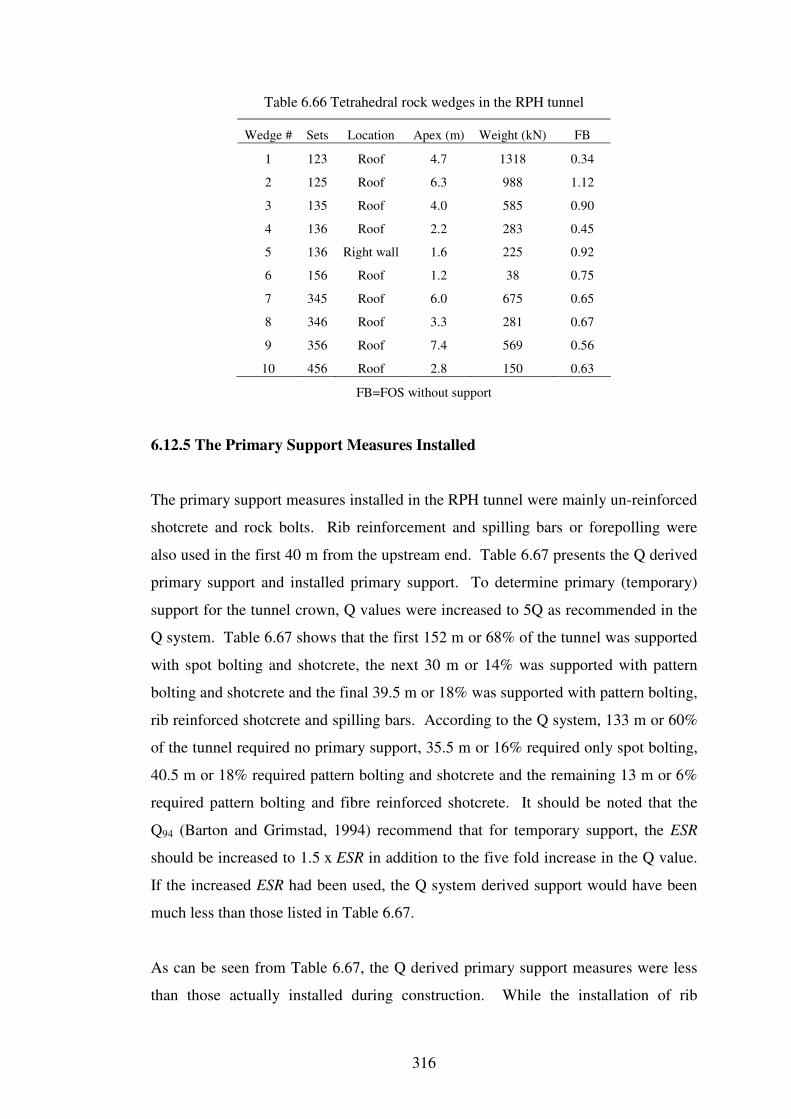
316
Table 6.66 Tetrahedral rock wedges in the RPH tunnel
Wedge # Sets Location Apex (m) Weight (kN) FB
1 123 Roof 4.7 1318 0.34
2 125 Roof 6.3 988 1.12
3 135 Roof 4.0 585 0.90
4 136 Roof 2.2 283 0.45
5 136 Right wall 1.6 225 0.92
6 156 Roof 1.2 38 0.75
7 345 Roof 6.0 675 0.65
8 346 Roof 3.3 281 0.67
9 356 Roof 7.4 569 0.56
10 456 Roof 2.8 150 0.63
FB=FOS without support
6.12.5 The Primary Support Measures Installed
The primary support measures installed in the RPH tunnel were mainly un-reinforced
shotcrete and rock bolts. Rib reinforcement and spilling bars or forepolling were
also used in the first 40 m from the upstream end. Table 6.67 presents the Q derived
primary support and installed primary support. To determine primary (temporary)
support for the tunnel crown, Q values were increased to 5Q as recommended in the
Q system. Table 6.67 shows that the first 152 m or 68% of the tunnel was supported
with spot bolting and shotcrete, the next 30 m or 14% was supported with pattern
bolting and shotcrete and the final 39.5 m or 18% was supported with pattern bolting,
rib reinforced shotcrete and spilling bars. According to the Q system, 133 m or 60%
of the tunnel required no primary support, 35.5 m or 16% required only spot bolting,
40.5 m or 18% required pattern bolting and shotcrete and the remaining 13 m or 6%
required pattern bolting and fibre reinforced shotcrete. It should be noted that the
Q94 (Barton and Grimstad, 1994) recommend that for temporary support, the ESR
should be increased to 1.5 x ESR in addition to the five fold increase in the Q value.
If the increased ESR had been used, the Q system derived support would have been
much less than those listed in Table 6.67.
As can be seen from Table 6.67, the Q derived primary support measures were less
than those actually installed during construction. While the installation of rib
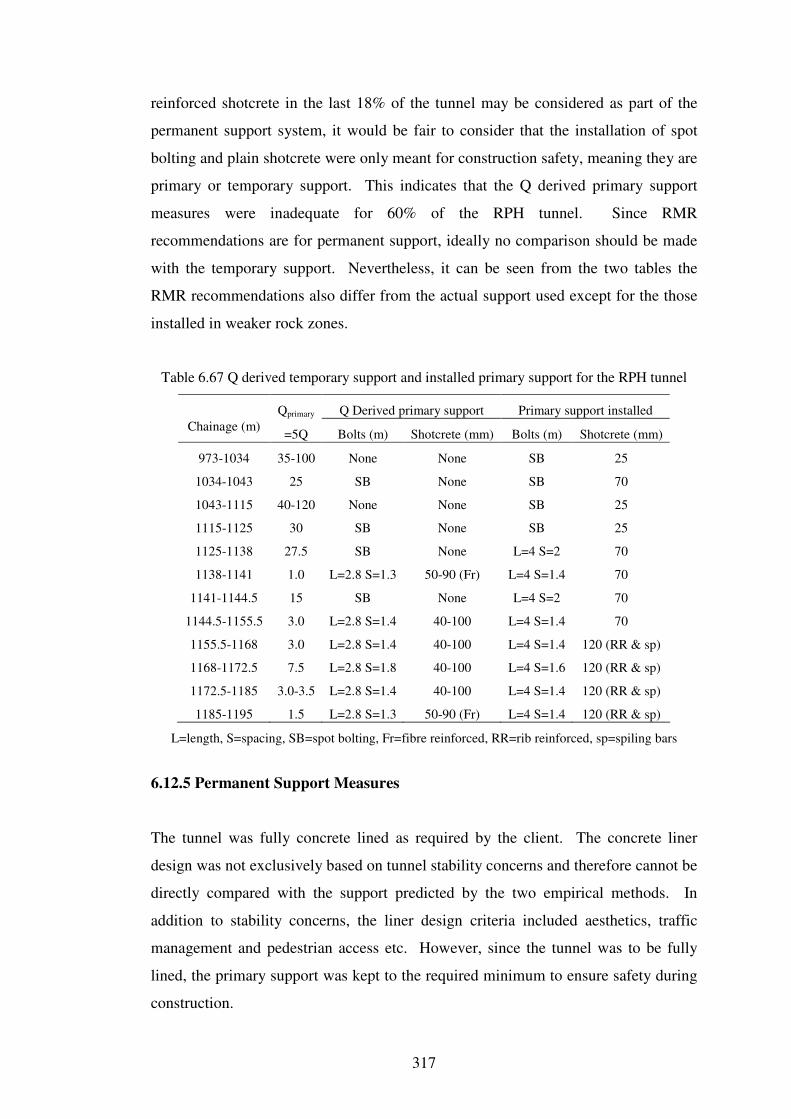
317
reinforced shotcrete in the last 18% of the tunnel may be considered as part of the
permanent support system, it would be fair to consider that the installation of spot
bolting and plain shotcrete were only meant for construction safety, meaning they are
primary or temporary support. This indicates that the Q derived primary support
measures were inadequate for 60% of the RPH tunnel. Since RMR
recommendations are for permanent support, ideally no comparison should be made
with the temporary support. Nevertheless, it can be seen from the two tables the
RMR recommendations also differ from the actual support used except for the those
installed in weaker rock zones.
Table 6.67 Q derived temporary support and installed primary support for the RPH tunnel
Qprimary Q Derived primary support Primary support installed
Chainage (m) =5Q Bolts (m) Shotcrete (mm) Bolts (m) Shotcrete (mm)
973-1034 35-100 None None SB 25
1034-1043 25 SB None SB 70
1043-1115 40-120 None None SB 25
1115-1125 30 SB None SB 25
1125-1138 27.5 SB None L=4 S=2 70
1138-1141 1.0 L=2.8 S=1.3 50-90 (Fr) L=4 S=1.4 70
1141-1144.5 15 SB None L=4 S=2 70
1144.5-1155.5 3.0 L=2.8 S=1.4 40-100 L=4 S=1.4 70
1155.5-1168 3.0 L=2.8 S=1.4 40-100 L=4 S=1.4 120 (RR & sp)
1168-1172.5 7.5 L=2.8 S=1.8 40-100 L=4 S=1.6 120 (RR & sp)
1172.5-1185 3.0-3.5 L=2.8 S=1.4 40-100 L=4 S=1.4 120 (RR & sp)
1185-1195 1.5 L=2.8 S=1.3 50-90 (Fr) L=4 S=1.4 120 (RR & sp)
L=length, S=spacing, SB=spot bolting, Fr=fibre reinforced, RR=rib reinforced, sp=spiling bars
6.12.5 Permanent Support Measures
The tunnel was fully concrete lined as required by the client. The concrete liner
design was not exclusively based on tunnel stability concerns and therefore cannot be
directly compared with the support predicted by the two empirical methods. In
addition to stability concerns, the liner design criteria included aesthetics, traffic
management and pedestrian access etc. However, since the tunnel was to be fully
lined, the primary support was kept to the required minimum to ensure safety during
construction.
318
6.12.6 Discussion
In general, the permanent rock bolting systems recommended by the two
classification methods were comparable, except for two intervals from 978 to 1018 m
and 1057 to 1115 m. For these two intervals representing a total of 98 m or 44% of
the tunnel, the Q system recommended only spot bolting, whereas RMR
recommended pattern bolting plus shotcrete. One major difference in the support
recommendations of the two methods is that the RMR recommended shotcrete for
the entire tunnel while Q did not recommend shotcrete for 130 m or 56% of the
tunnel. For the last 80 m where rock mass conditions were weaker, both
classification methods recommended pattern bolting and mesh or fibre reinforced
shotcrete. The only difference is that RMR also recommended light to medium steel
ribs for the last 20 m. This latter recommendation conforms to the actual support
installed in this length. In contrast, for weaker zones comprising weathered rock the
Q recommended permanent support measures were less than those actually installed.
It should be noted that RMR was not applied directly to the tunnel during
construction and its support estimations were by transforming the Q values into
RMR values using Equation 5.1. Thus the RMR values, and therefore the support
recommendations, depend on the Q values. Despite this the support requirements
predicted by the two methods do not necessarily agree with each other. Further the
RMR recommended support for the weaker rocks in this tunnel compared well with
the support installed while the Q recommended support differs.
6.12.7 Conclusion
The Q derived primary support measures were inadequate for 60% of the RPH
tunnel. In poorer rock conditions in the 40 m length from the upstream portal the
support installed included pattern bolting, spilling bars and rib reinforced shotcrete.
These are comparable to the support recommended by the RMR method. Despite
the fact that the RMR system was applied only indirectly by transforming the Q
values of the tunnel into RMR values, the support requirements predicted by the two
methods did not fully agree with each other.
319
6.13 Correlation of RMR and Q Values
As discussed in Section 5.3, several researchers have correlated the RMR and Q
values obtained from different tunnelling projects with the intention of linking the
two rating systems. Each of these correlations is somewhat different from the next
and it is apparent from the discussions presented in Section 5.3 that different
correlations are possible from the RMR and Q values obtained from different rock
mass conditions. Despite this possibility, there is a tendency among some
practitioners of rock engineering to overly rely on the first correlation published in
1976 (Equation 5.1) and transform ratings between the two systems. This tendency
is injudicious and deserves scrutiny.
This section correlates the RMR and Q values obtained from six of the case studies
representing four projects discussed in the preceding sections. In light of the
correlations obtained from different rock mass conditions encountered in the case
tunnels, it is obvious that there is no sound scientific basis to assume a universally
applicable linear relationship between RMR and Q, as alluded to by some research
publications.
The four projects considered for this purpose are:
o The Chiew Larn Hydropower Project (CLHP) (two tunnels)
o The Huai Saphan Hin Hydropower Project (HSHP) (one tunnel)
o The Lam Ta Khong Pumped Storage Power Project (LTKP) (three tunnels)
o The Klong Tha Dan Irrigation Project (KTDP) (five tunnels)
The CLHP has two tunnels discussed as Case Studies 1 and 2 in Sections 6.3 and 6.4.
A total of 56 RMR79 and Q74 data pairs were derived from the two tunnels and a Q
versus RMR plot is presented in Figure 6.30a. The HSHP has one tunnel referred to
as Case Study 3 in Section 6.5. Fifteen RMR79 and Q74 data pairs were obtained and
a plot of the data is presented as Figure 6.30b. The LTKP has three tunnels
discussed as Case Studies 5 and 6 in Sections 6.7 and 6.8 and a branch tunnel
excavated from the case tunnel discussed in Section 6.8. In all, 114 RMR89 and Q74
data pairs obtained from the LTKP tunnels representing a total length of 2260 m
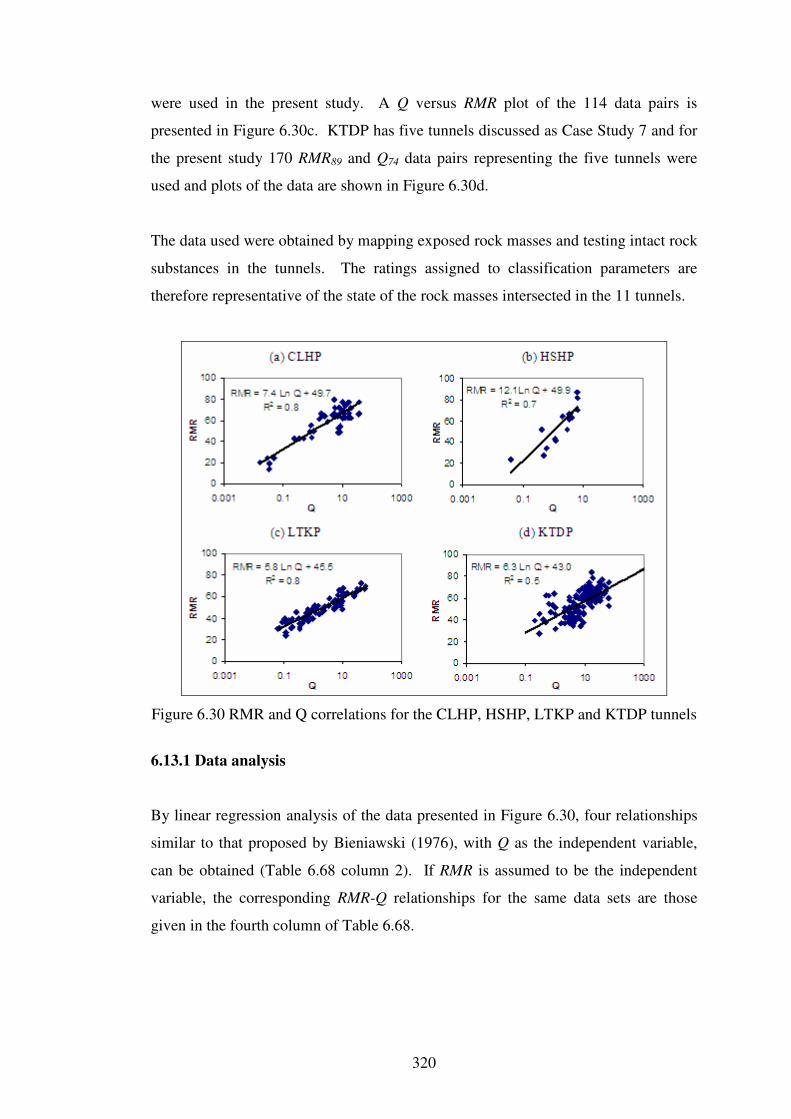
320
were used in the present study. A Q versus RMR plot of the 114 data pairs is
presented in Figure 6.30c. KTDP has five tunnels discussed as Case Study 7 and for
the present study 170 RMR89 and Q74 data pairs representing the five tunnels were
used and plots of the data are shown in Figure 6.30d.
The data used were obtained by mapping exposed rock masses and testing intact rock
substances in the tunnels. The ratings assigned to classification parameters are
therefore representative of the state of the rock masses intersected in the 11 tunnels.
Figure 6.30 RMR and Q correlations for the CLHP, HSHP, LTKP and KTDP tunnels
6.13.1 Data analysis
By linear regression analysis of the data presented in Figure 6.30, four relationships
similar to that proposed by Bieniawski (1976), with Q as the independent variable,
can be obtained (Table 6.68 column 2). If RMR is assumed to be the independent
variable, the corresponding RMR-Q relationships for the same data sets are those
given in the fourth column of Table 6.68.
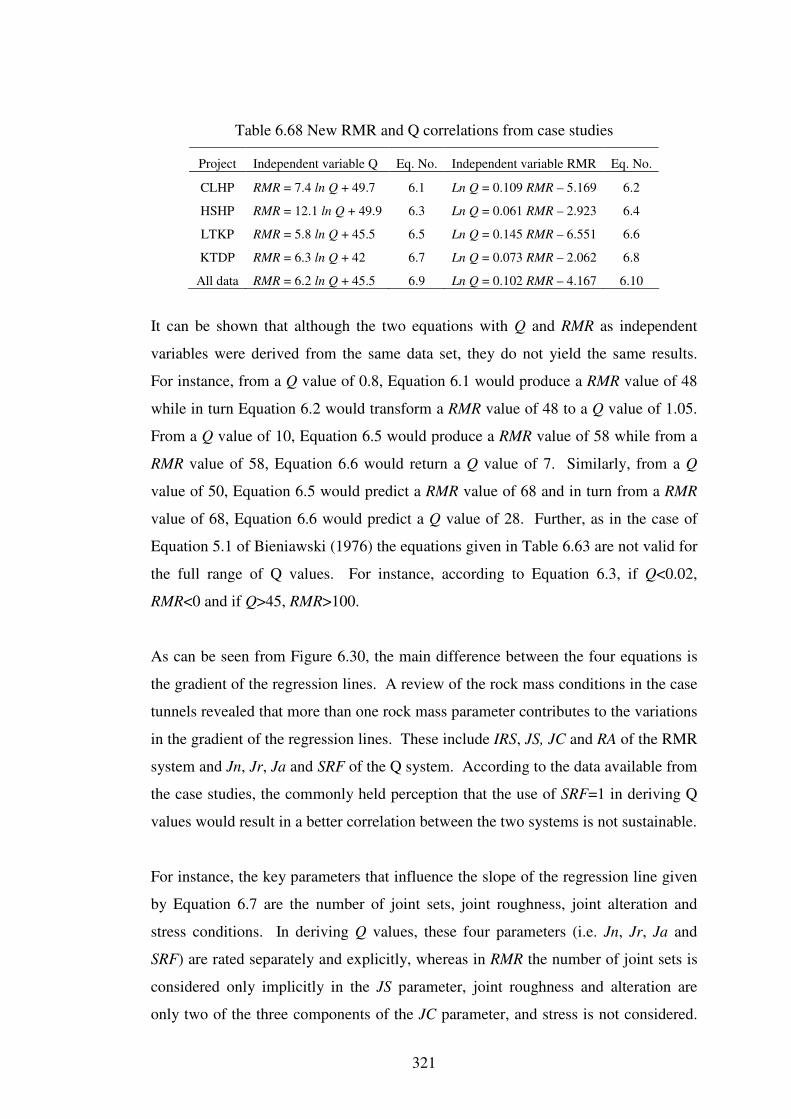
321
Table 6.68 New RMR and Q correlations from case studies
Project Independent variable Q Eq. No. Independent variable RMR Eq. No.
CLHP RMR = 7.4 ln Q + 49.7 6.1 Ln Q = 0.109 RMR – 5.169 6.2
HSHP RMR = 12.1 ln Q + 49.9 6.3 Ln Q = 0.061 RMR – 2.923 6.4
LTKP RMR = 5.8 ln Q + 45.5 6.5 Ln Q = 0.145 RMR – 6.551 6.6
KTDP RMR = 6.3 ln Q + 42 6.7 Ln Q = 0.073 RMR – 2.062 6.8
All data RMR = 6.2 ln Q + 45.5 6.9 Ln Q = 0.102 RMR – 4.167 6.10
It can be shown that although the two equations with Q and RMR as independent
variables were derived from the same data set, they do not yield the same results.
For instance, from a Q value of 0.8, Equation 6.1 would produce a RMR value of 48
while in turn Equation 6.2 would transform a RMR value of 48 to a Q value of 1.05.
From a Q value of 10, Equation 6.5 would produce a RMR value of 58 while from a
RMR value of 58, Equation 6.6 would return a Q value of 7. Similarly, from a Q
value of 50, Equation 6.5 would predict a RMR value of 68 and in turn from a RMR
value of 68, Equation 6.6 would predict a Q value of 28. Further, as in the case of
Equation 5.1 of Bieniawski (1976) the equations given in Table 6.63 are not valid for
the full range of Q values. For instance, according to Equation 6.3, if Q<0.02,
RMR<0 and if Q>45, RMR>100.
As can be seen from Figure 6.30, the main difference between the four equations is
the gradient of the regression lines. A review of the rock mass conditions in the case
tunnels revealed that more than one rock mass parameter contributes to the variations
in the gradient of the regression lines. These include IRS, JS, JC and RA of the RMR
system and Jn, Jr, Ja and SRF of the Q system. According to the data available from
the case studies, the commonly held perception that the use of SRF=1 in deriving Q
values would result in a better correlation between the two systems is not sustainable.
For instance, the key parameters that influence the slope of the regression line given
by Equation 6.7 are the number of joint sets, joint roughness, joint alteration and
stress conditions. In deriving Q values, these four parameters (i.e. Jn, Jr, Ja and
SRF) are rated separately and explicitly, whereas in RMR the number of joint sets is
considered only implicitly in the JS parameter, joint roughness and alteration are
only two of the three components of the JC parameter, and stress is not considered.
322
Consequently, the variations in Jn, Jr, Ja and SRF, without significant variations in
the other key parameters of the RMR system (i.e. IRS, JS and RA) would result in a
flatter regression line as observed in this study. Similarly, the variations in the IRS,
JS and RA parameters, without noticeable variations in the key parameters of the Q
system would result in a steeper regression line. Therefore, it may be concluded that
a linear relationship obtained by regression analysis of the RMR and Q data is
applicable only to that particular rock mass conditions from which the relationship
was obtained. Even for the same rock mass conditions, if the data points in the
RMR-Q plot are widely scattered, such relationships are of very little practical value
and should not be used for transforming the ratings between the two methods.
6.13.2 Conclusions
The linear regression analysis of the case tunnel data from four projects confirmed
that a different relationship can be obtained for each case study and that each is
applicable only to the particular rock mass conditions from which the relationship
was obtained. Even for the same rock mass, if the data used are widely scattered,
such relationships are of very little practical value and their use for transforming the
ratings between the two methods could lead to errors. As observed by Kaiser et al.
(1986), the analysis also showed that the results of correlations depend on the choice
of the dependent variable. From the available information, it is apparent that there is
no sound scientific basis to assume a universally applicable linear relationship
between the two.
When both methods are to be applied to a project, which is desirable, each should
always be applied independent of the other, without attempting to convert the ratings
of one method to that of the other using the relationships published in the literature.
Such relationships, bearing in mind their obvious limitations, may be used as a crude
guide for checking the general accuracy of the ratings derived by the two systems.
323
CHAPTER 7
CONCLUSIONS AND RECOMMENDATIONS
7.1 Introduction
The review of previous studies and the analysis of case studies presented in Chapters
5 and 6, respectively, have resulted in an increased understanding of the RMR and Q
rock mass classification systems and some of the situations where tunnel support
requirements differ from those predicted by the two systems. The present study has
also resulted in several conclusions and identified areas for further research to better
understand the reliability of the two systems. The conclusions drawn from the
review of the previous studies are outlined in Section 5.4 and those from the case
studies are presented in the relevant sections of Chapter 6. In general, these
conclusions can be divided into three broad groups:
(a) those applicable only either to RMR or Q
(b) those common to both RMR and Q
(c) those on the RMR-Q correlations.
These are discussed in the following sections.
7.2 Conclusions on the RMR System
o The application of the RMR system requires only minimal user experience.
After a few applications, a user should be able to easily and confidently
apply it provided that he/she has some experience in underground
excavation design.
o The six parameters used in the RMR system represent true factors of rock
masses. They can be easily determined either during investigations using
bore core information or during construction by direct observation of
excavations.
324
o The stability of excavations in jointed rock is significantly influenced by
joint spacing, orientation and their surface characteristics. These are all
included in the RMR system. Some of the rating allocations, however, are
insensitive to minor variations of the parameters that may a have critical
influence on the behaviour of a rock mass.
o Joint spacing of the rock mass is counted twice, first directly through the JS
parameter and then indirectly through the RQD parameter. This gives an
unnecessary additional weightage to discontinuity spacing.
o The RMR support recommendations are for 10 m wide horseshoe shaped
tunnels only and its application to other opening sizes and shapes is user
dependent.
o The support recommendations are not tailored to the purpose of the
excavations. A one-size-fits-all approach is adopted in recommending
support measures. This clearly is a major limitation because different
support systems and quantities could be warranted for the same rock mass
depending on the purpose of the excavation. This aspect is not considered
in the RMR system.
o The system has not been updated since 1989 therefore modern support types
i.e. fibre reinforced shotcrete are not included in the recommendations.
o In situ stress field is not considered in the classification of a rock mass. Its
support recommendations are for tunnels with less the 25 MPa vertical
stress magnitude. Its applicability to stress induced stability problems is
open to conjecture. The creator of the system did not recommend its use for
such stability problems.
325
7.3 Conclusions on the Q System
o The six parameters used in the Q system represent true factors of rock
masses. They can be determined either during investigation or
construction. The descriptions used to assess the joint conditions are
relatively rigorous, leave less room for subjectivity and are sensitive to
minor variations in properties.
o The Q support recommendations reflect the excavation size and its purpose.
Different support measures are recommended for the roof and walls of an
excavation and also for temporary excavations. The support
recommendations have evolved over time and reflect technological
developments.
o The Q system does not directly account for the discontinuity orientation in
the assessment procedure, although it is included implicitly by classifying
the joint roughness and alteration of only the most unfavourably oriented
joint sets or discontinuities. No guidance is provided on how to decide on
the critical or most unfavourable discontinuity orientation and its selection
is user dependent.
o Discontinuity spacing which is an important parameter for the jointed rock
masses is not considered directly. The strength of rock material is not
considered directly although it is included indirectly in the SRF term only if
the stability of an excavation is governed by the in situ stress field.
o Where relevant the in situ stress field can be taken into account in
classifying a rock mass by selecting a suitable value for the SRF term.
However, for rock stress problems in competent rock, a rating scale of 1 to
400 is given for the SRF term with no guidance on which value to be used.
Its selection, therefore, is largely dependent on the site specific experience.
Thus for new sites with rock stress problems the reliability of the Q system
is yet to be confirmed.
326
o For small diameter (~ 3 m) water tunnels, for which ESR=1.6 to 2.0, the Q
system recommends no support if Q>1 and De≤2. However, support could
be warranted when the Q value is as high as 6. For temporary mine
openings of around 4 m width, for which the recommended ESR=2 to 5, this
limitation could lead to safety implications.
o The assertion that a reduced level of disturbance results in TBM driven
tunnels and less support would be required compared to drill and blast
tunnels is not always tenable. In blocky rock and horizontally bedded rock
with sub-vertical joints or high horizontal stresses, more support would be
required than Q recommendations. For such rock masses the “no support”
boundary in the Q support chart should be shifted to the right. Its shifting
to the left for TBM driven tunnels as recommended by the creator of the
system would lead to under designs compromising safety.
7.4 Conclusions Common to Both the RMR and Q Systems
o The two systems may be applied either at the investigation and design stage
of a project or during construction. However, the predictions made based
on the bore core data obtained for site investigations may not necessarily
reflect the actual conditions encountered during excavation. While in some
cases bore core data would predict higher rock mass ratings than those
derived using in situ observations, in other cases, the opposite could be true.
In some case the predictions based on bore core data are accurate. The
currently available information does not show any reliable trends. To what
extent the bore core data based ratings differ from the in situ data based
ratings appears to depend on the type and condition of rock masses.
o There is not always good agreement between the RMR and Q derived
support for excavations. Despite attempts to link the two systems by linear
correlations they do not always lead to similar conclusions.
o Previous studies as well as the case studies analysed showed examples in
which the RMR and Q predicted support could be either overconservative or
327
optimistic compared to the support installed. In some cases, one system
agreed with the installed support measure while the other was either
overconservative or optimistic.
o In estimating support pressures (which is an indirect method of support
design) the two systems differ in their approaches. The RMR system
considers that support pressure depends on both rock mass quality (the RMR
value) and the width of the opening. In contrast, the Q system assumes that
the support pressure is a function of only the rock mass quality (Q value, Jn
and Jr), the width of the excavation is ignored. On the other hand, the Q
support chart explicitly takes into account the width of the excavation.
When estimating support requirements and support pressures, seemingly,
the Q system contradicts itself.
o The two systems do not always yield the same support pressures for the
same rock mass intersected in a tunnel. For small diameter (~3 m) tunnels,
the ratio of Q derived support pressure (PQ) to RMR derived support
pressure (PRMR) is approximately one when Q>10. When Q ≤ 10, the ratio
(PQ:PRMR) is always greater than one, and it increases rapidly with a
decreasing Q value.
o For shallow water conveyance tunnels with the potential for water loss
through seepage, the support recommendations of RMR and Q could be
inadequate.
o For jointed rock under changing loading conditions, due to an increase or
decrease in the overburden pressure or due to an increase in the groundwater
pressure, the RMR and Q recommended support could be inadequate to deal
with rock block or wedge stability problems.
o In some instances, for moderately jointed rock with the potential for large
scale wedge instability, the RMR and Q predicted support could be
insufficient.
328
o For tunnels in moderately jointed low strength rock masses, Q predicted
support could be insufficient while RMR predictions may be
overconservative.
7.5 Correlations of the RMR and Q Systems
The literature review revealed 25 different RMR-Q correlations obtained by linear
regression analysis of the ratings assigned by the two systems. Each of these
correlations is different from the next and the data used in deriving them are often
widely scattered. The main reasons for this are the differences in the parameters and
the rating methods used, and the manner in which the final RMR and Q values are
computed, i.e. the RMR system is additive and the Q system is multiplicative.
The analysis of the RMR and Q values from four projects further confirmed that a
different relationship can be obtained for each case study and that each relationship is
applicable only to that particular rock mass conditions from which the relationship
was obtained. Even for the same rock mass, if the data used in deriving a
relationship are widely scattered, such relationships are of very little practical value
and their use for transforming the ratings between the two methods could lead to
errors. Further, the analysis also showed that the results of correlations depend on
the choice of the dependent variable. The available information shows no scientific
basis to assume a universally applicable linear relationship between the two.
When both methods are to be applied to a project, which is desirable, each should
always be applied independent of the other, without attempting to convert the ratings
of one method to that of the other using the relationships published in the literature.
Such relationships, bearing in mind their obvious limitations, may be used as a crude
guide for checking the general accuracy of the ratings derived by the two systems.
7.6 Recommendations for Future Research
The results of this study clearly show that further research is necessary to establish a
better understanding of the reliability of the rock mass classifications methods under
a wide range of ground conditions. The following items are recommended:
329
o This study was based on a limited number of case studies. The case study
database needs to be expanded by adding more cases.
o Using the existing data in the present case studies database further analysis
should be carried out for other possible failure mechanisms that have not
been included in the present study.
o The case studies used represent jointed rock masses subject to low to
medium in situ stress conditions. The rock instability in the excavations
created in these rock masses are primarily structurally controlled. The
massive rocks subjected to high in situ stress conditions and weaker rocks
with swelling and squeezing conditions have not been covered in the present
study. These conditions need to be researched.
o Support pressure measurements were not available for any of the case
studies in the present database. Thus the reliability of the support pressures
predicted by RMR and Q could not be assessed, except for the commentary
on their variations. This aspect needs a detailed assessment using in situ
measurements of support pressures.
o More work is required on the reliability of the RMR and Q predictions made
using bore core data alone.
o For stress induced failures in high stress environments the Q system uses a
SRF value of 5 to 400. Selection of an appropriate SRF value from such a
wide range is user dependent and in effect could lead to significant errors in
support predictions. More work is needed to find representative SRF values
for high stress conditions.
o The assessment of the reliability of the RMR system is difficult due to its
one-size-fits-all support recommendations (i.e. for 10 m wide horseshoe
shaped tunnels only). The case study database should be expanded by
adding more 10 m wide tunnels to overcome this limitation.

330
REFERENCES
Abad,J., Celad, B., Chacon, E., Gutierrez, V. and Hidalgo, E. (1983) Application of
Geomechanical classification to predict the convergence of coal mine galleries
and to design their supports. Proc 5th
Int. Congr. Rock Mech., ISRM Melbourne,
Vol. 2, pp. E15-E19.
Adler, L. and Sun, M. (1968) Ground control in bedded formations. Bulletin 28,
Research Division, Virginia Polytechnic Institite.
Al-Harthi, A. A. (1993) Application of CSIR and NGI classification systems along
tunnel no. 3 at Al-Dela Descant, Asir Province, Saudi Arabia. In Proc Eng Geol
of Weak Rock, Balkema, (Eds. Crips, J. C., Coulthard,), pp. 323-328.
Amadei, B. and Goodman, R. E. (1981) Formulation of complete plane strain
problems for regularly jointed rocs. Rock Mech from Theory to Applications.
Proc 22nd
U.S. Sym on Rock Mech, Mass Inst of Tech, Cambridge, pp. 245-251.
Asche, H. R. and Qugley, A. (1999) Tunnelling design on the northside storage
tunnel project. Proc 10th
Aus Tunnel Conf, Melbourne, 21-24 March 1999, pp.
143-154.
Asgari, A. R. (2001) New correlation between Q & RMR and N & RCR. Proc 5th
Iranian Tunnelling Conf 2000, (in Persian) English translation available in
Baczynski, N. R. P. (1983) Application of various rock mass classifications to
unsupported openings at Mount Isa, Queensland: A case study. Proc 3rd
Australia-New Zealand Conference on Geomechanics, Wellington, 12–16 May
1980, Vol. 2, pp. 137–143. New Zealand Institution of Engineers, Wellington.
Bandis, S. C., Lumsden, A. C. and Barton, N. R. (1983) Fundamentals of rock joint
deformation. Int. J Rock Mech Min Sci & Geomech Abstracts, Vol. 20(6), pp.
249-268.
Bandis, S. C. (1990) Mechanical properties of rock joints. Proc Int. Soc. Rock Mech.
Symp. On Rock Joints, Loen, Norway, (eds. N. Barton and O. Stephansson).
Balkema, Rotterdam, pp. 125-140.
331
Barker, R. M. and Hatt, F. (1972) Joints effects in bedded formation roof control.
New Horizons in Rock Mechanics, Proc 14th
U. S. Sym on Rock Mech, University
Park, (eds. H. R. Hardy and R. Stefanko), ASCE New York, pp. 247-261.
Barton, N. (1976) recent experience with the Q System in tunnel support design.
Proc Sym Exploration for Rock Engineering, Johannesburg, Ed. Z. T.
Bieniawski, Vol. 1, pp. 107-115.
Barton, N. (1988) Rock mass classification and tunnel reinforcement selection using
the Q-System. Proc Sym Rock Class for Eng Purposes, ASTM Special
Technical Publication 984, Philadelphia, pp. 59-88.
Barton, N. (1995) The influence of joint properties on in modelling jointed rock
masses. Keynote lecture, 8th
ISRM Congress (Tokyo), Balkema,. Vol. 3, pp.
1023-1032.
Barton, N. (1996) Investigation, design and support of major road tunnels in jointed
rock using NMT principals. Proc IX Australian Tunnelling Conf. Australian
Underground Construction and Tunnelling Assoc, Sydney, pp. 145-159.
Barton, N. (2002) Some new Q-value correlations to assist in site characterisation
and tunnel design. Int. J of Rock Mechanics and Mining Sciences, Vol.39,
pp.185-216.
Barton, N. and Bieniawski, Z. T. (2008) RMR and Q – setting records. Tunnels &
Tunnelling International, February 2008, pp. 26-29.
Barton, N. and Grimstad, E. (1994) The Q-system following 20 years of application
in NMT support selection, in Felsbau 12(6): pp. 428-436.
Barton, N. R. (1987) Predicting the behaviour of underground openings. In Manuel
Rocha Memorial Lecture, Lisbon, Norwegian Geotechnical Institute, Oslo.
Barton, N. R. and Bandis, S. C. (1982) Effect of block size on the shear behaviour of
jointed rock. 23rd
U.S. Sym on Rock Mech, Berkeley, pp. 739-760.
Barton, N. R. and Bandis, S. C. (1990) Review of predictive capabilities of JRC-JCS
model in engineering practice. Rock Joints, Proc Int Symp on Rock Joints, Loen,
Norway, (eds. N. Barton and O. Stephansson), Balkema, Rotterdam, pp. 603-
610.
332
Barton, N. R. and Choubey, V. (1977) The Shear strength of rock joints in theory and
practice. Rock Mechanics, Vol. 10(1-2), pp. 1-54.
Barton, N., By, T. L., Chryssanthakis, P., Thunbridge, L., Kristiansen, J., Loset, F.,
Bhasin, R. K., Westerdahl, H., and Vik, G. (1994) Predicted and measured
performance of the 62 m spqan Norwegian Olympic ice hockey cavern at
Gjovik,, Int J Rock Mech Min Sci & Geomech Abstracts, Vol. 31, No. 6, p. 617-
641.
Barton, N., Lien, R. and Lunde, J. (1974) Engineering classification of rock masses
for the design of rock support. Rock Mech. 6, pp. 189–236.
Barton, N., Lien, R. and Lunde, J. (1977) Estimation of support requirements for
underground excavations. Design Methods in Rock mechanics. Proc 16th
Symp
on Rock Mech, Univ of Minnesota, ASCE 1977, pp. 163-177.
Barton, N., Loset, R., Lien, R. and Lunde, J. (1980) Application of Q-system in
design decisions concerning dimensions and appropriate support for
underground installations. In Subsurface Space 2, 1980 (ed. M Begman),
Pergamon, New York, pp. 553-561.
Beaver, P. (1972) A history of tunnels. Peter Davies, London, 155p.
Beer, G. and Meek, J. L. (1982) Design curves for roofs and hanging walls in bedded
rock based on voussoir beam and plate solutions. Tran Inst of Min Metall,
Vol. 91, pp. A18-22.
Bell, F. G. (1980) Engineering geology and geotechnics. Newnes-Butterworth, 497p.
Benson, R. P. (1989) Design of unlined tunnels. Tunnelling and Underground Space
Technology, Vol. 4(2), pp. 155-170.
Bhasin, R., Barton, N. and Loset, R. (1993) Engineering geological investigations
and application of rock mass classification approach in the construction of
Norway’s underground Olympic stadium. Engineering Geology, Elsevier, Vol
35, 1993, pp. 93-101.
Bhasin, R. and Grimstad, E. (1996) The use of stress strength relationship in the
assessment of tunnel stability. Proc Conf on Recent Advances on Tunnelling
Technology, New Delhi, Vol. 1, pp. 183-196.
333
Bieniawski, Z. T. (1968) The effect of specimen size on compressive strength of
coal. Int. J Rock Mech. Min. Sci. Vol. 5, pp. 325-335.
Bieniawski, Z. T. (1973) Engineering classification of jointed rock masses. Trans. S.
Afr. Inst. Civil Eng. Vol. 15(12), pp. 335–344.
Bieniawski, Z. T. (1974) Geomechanics classification of rock masses and its
application in tunneling. In: Proceedings of the Third International Congress on
Rock Mechanism, ISRM, Denver, pp. 27–32.
Bieniawski, Z. T. (1976) Rock mass classification in rock engineering. Proc Symp
for Exploration for Rock engineering. Z. T. Bieniawski and A.A. Balkema eds,
AA Balkema, Rotterdam. pp. 97-106.
Bieniawski, Z. T. (1978) Determining rock mass deformability, experience from case
histories, Int. J on Rock Mech and Min Sci & Geomech Abstracts, Pergamon,
Vol 15, pp. 237-247.
Bieniawski, Z. T. (1979) The geomechanics classification in rock engineering
applications. 4th
Intnl Conf on Rock Mech, Vol 2, ISRM, Montreux, pp.41-48.
Bieniawski, Z. T. (1984) Rock mechanics design in mining and tunnelling. A. A.
Balkema, Rotterdam/Boston, 272p.
Bieniawski, Z. T. (1989) Engineering rock mass classifications, John Willey & Sons,
New York, 251 p.
Bieniawski, Z. T. (1993) Classification of rock masses for engineering: The RMR
system and future trends, Comprehensive Rock Engineering, Principles, Practice
and Projects, Editor in Chief J. A. Hudson, Pergamon, Vol. 3, pp.553-573.
Bieniawski, Z.T. (1975) Case Studies: Prediction of rock mass behaviour by the
geomechanics classification. 2nd
AusNZ Conf on Geomechanics, Brisbane, 1975,
Inst Eng Australia, pp. 36-41.
Bierbaumer, A. (1913) Die Dimensionerung des Tunnelmauerwerks, Engelmann,
Leipzig (in Steiner and Einstein, 1980).
Brady, B. H. G. and Brown, E. T. (2004) Rock Mechanics for Underground Mining,
First Edition, Allen & Unwin, London.
334
Brady, B. H. G. and Brown, E. T. (2004) Rock Mechanics for Underground Mining,
Third Edition, Kluwer Academic Publishers, 628 p.
Brook, N. and Dharmaratne, P. G. R. (1985) Simplified rock mass rating system for
mine tunnel support. Trans Instn Min Metall (Section A) vol 95, July 1985, pp.
A148-A154.
Brown, E. T. (1999) Rock mechanics and the Snowy Mountain Scheme. The Spirit of
the Snowy Fifty Years. Proc 1999 Invitation Symp., Cooma, Aus Acad Technol
Sci. & Eng, pp. 89-101.
Brown, E. T. (2003) Block caving Geomechanics. Julius Kruttschnitt Mineral
Research Centre, Brisbane.
Cartney, S. A. (1977) The ubiquitous joint method, Cavern Design at Dinorwic
Power Station. Tunnels & tunnelling, May 1997, pp. 54-57.
Cameron-Clarke, L. S. and Budavari, S. (1981) Correlation of rock mass
classification parameters obtained from borecore and in situ observations,
Engineering Geology, Vol. 17, Elsevier, pp.19-53.
CCKV JV (2001) Final report on the completion of tunnel construction on Tha Dan
Dam Project by JV CCKV (unpublished).
Cecil, O. S, (1970) Correlation of rock bolt – shotcrete support and rock quality
parameters in Scandinavian tunnels. PhD Thesis, University of Illinois, 141p.
Cecil, O. S, (1975) Correlation of rock bolt – shotcrete support and rock quality
parameters in Scandinavian tunnels. Proc Swedish Geotechnical Institute, No.
27, 275p.
Celada Tamames, B. (1983) Fourteen years of experience on rock bolting in Spain.
In Proceedings International Symposium on Rock Bolting, Abisko 1983, (ed. O
Stephansson), pp. 295-311.
Choi, S. Y. and Park, H. D. (2002) Comparison among different criteria of RMR and
Q-system for rock mass classification for tunnelling in Korea. Tunnelling and
Underground Space Tech. Pergamon, Vol.17, pp. 391-401.
335
Choquet, P. and Hadjigeorgiou, J. (1993) The design of support for underground
excavations. Comprehensive Rock Engineering, Principles, Practice and
Projects, Editor in Chief J. A. Hudson, Pergamon, Vol. 4, pp. 313-348.
Cording, E. J. and Deere, D. U. ((1972) Rock tunnel support and field measurements.
Proc Rapid Excavation and Tunnelling Conference., AIME, New York, pp. 601-
622.
Cummings, R. A., Kendorski, F. S. and Bieniawski, Z. T. (1982) Caving rock mass
classification and support estimation. U.S. Bureau of Mines Contract Report No.
J0100103. Chicago, Engineers International Inc.
Dcere, D. U. (1964) Technical description of rock cores for engineering purposes.
Rock Mech. Eng. Geol. Vol. 1, pp. 17-22.
Deere, D. U. (1963) Technical description of rock cores for engineering purposes.
Felsmechanik and Ingieneurgeologie, Vol. 1 No. 1, pp. 17-22.
Deere, D. U. (1968) Geological considerations. Rock mechanics in engineering
practice, ed. R. G. Stagg and D. C. Zienkiewicz, Wiley, New York, pp. 1-20.
Deere, D. U., Hendron, A. J., Patton, F. D. and Cording, E. J. (1967) Design of
surface and near surface construction in rock. Failure and Breakage of Rock,
Proc 8th
U.S. Symp on Rock Mech., (Ed. Fairhurst C.), AIME, New York, pp.
237-302.
Deere, D. U., Merritt, A. H. and Cording, E. J. (1974) Engineering geology and
underground construction. General Report. Session VII, 2nd
International
Congress of the International Assoc of Eng Geol, Sao Paulo, Brazil, pp. VII-
GR1-26.
Diederichs, M. S. and Kaiser, P. K. (1999a) Tensile strength and abutment relaxation
as failure control mechanisms in underground excavations. Int. J. Rock Mech.
Min. Sci. & Geomech.Abstr., Vol. 36, pp. 69-96.
Diederichs, M. S. and Kaiser, P. K. (1999b) Stability of large excavations in
laminated hard rock masses: the voussoir analogue revisited. Int. J. Rock Mech.
Min. Sci. & Geomech. Abstr., Vol. 36, pp. 97-117
336
Einstein, H. H., Steiner, W. and Baecher, G. B. (!979) Assessment of empirical
design methods for tunnels in rocks. Proc 4th
RETC, AIME, New York, Vol. 1,
pp. 683-706.
Einstein, H. H., Thompson, D. E., Azzouz, A. S., O’Reilly, K. P., Schultz, M. S. and
Ordun, S. (1983) Comparison of five empirical tunnel classification methods-
Accuracy, effect of subjectivity and available information. Proc 5th
Intnl Cong on
Rock Mech, ISRM, Melbourne, Vol 1, pp. C303-C313.
Elsworth, D. (1986) Wedge stability in the roof of a circular tunnel: plane strain
condition. Technical Note. Intnl Jour Rock Mech & Min Sci & Geomech Abstr,
vol 23, No. 2, pp. 177-181.
Franklin (1975) Safety and economy in tunnelling. Proc 10th
Canadian Rock Mech.
Symp. Queens University, Kingston, Ontario, Vol. 1 pp. 27-53.
Franklin (1976) An observational approach to the selection and control of rock
tunnel liners. Proc Eng Foundation Conf. on Shotcrete for Ground Support,
Easton Md, ASCE, New York and ACI, SP-54, Detrit, pp. 556-596.
Gerrad, C. M. (1982) Elastic models of rock masses having one, two and three sets of
joints. Int. J. Rock Mech. Min. Sci. & Geomech. Abstr., Vol. 19, No. 1, pp. 15-23.
Goel and Jethwa (1991) Prediction of support pressure using RMR classification.
Proc Indian Geotechnical Conf, Surat, India, pp. 203-205.
Goel, R. K., Jethwa, J. L. and Dhar, B. B. (1996) Effect of tunnel size on support
pressure. Tech. Note. Int. J. Rock Mech. Min. Sci. & Geomech. Abstr., Vol. 33,
No. 7, pp. 749-755.
Goel, R. K., Jethwa, J. L. and Paithankar, A. G. (1995) Correlation between Barton’s
Q and Bieniawski’s RMR – a new approach. Technical Note, Int. J of Rock
Mech Min Sci. and Geomech. Abstracts, Vol 33, No. 2, pp. 179-181.
Goel, R. K., Jethwa, J. L. and Paithankar, A. G. (1995) Indian experience with Q and
RMR systems. J Tunnelling and Underground Space Technology, Pergamon,
Vol. 10, No. 1, pp. 97-109.
Gonzalez de Vallejo, L.I. (1983) A new classification system for underground
assessment using surface data. IAEG Symp on Eng Geol and Underground
Construction, Lisboa 2, Balkema Rotterdam, pp. 85-94.
337
Gonzalez de Vallejo, L.I. (1985) Tunnelling evaluation using the surface rock mass
classification system SRC. ISRM Symp. The Role of Rock Mechanics in
Excavation for Mining and Civil Works, Zacatecas, Mexico, vol 1, Soc Mexicana
de Mec de Rocas, Mexico, D.F., pp. 458-466.
Gonzalez de Vallejo, L.I. (2003) SRC rock mass classification of tunnels under high
tectonic stress excavated in week rocks. Engineering Geology, 69, Elsevier: pp.
273-285.
Goodman, R. E. (1976) Methods of geological engineering in discontinuous rocks.
West Publishing Company. 472p.
Goodman, R. E. (1980) Introduction to rock mechanics. John Wiley & Sons, 478p.
Goodman, R. E. (1989) Introduction to rock mechanics. John Wiley & Sons, 562p.
Goodman, R. E. and Shi, G. (1985) Block Theory and Its Application to Rock
Engineering”, Prentice-Hall, London.
Grimstad, E. and Barton, N. (1993) Updating the Q-system for NMT, in Proc Int.
Sym on Sprayed Concrete, Norwegian Concrete Assoc, Oslo. pp. 46-66.
Gurocak, Z., Solanki, P. and Zaman, M. M. (2007) Empirical and numerical analyses
of support requirements for a diversion tunnel at the Boztepe dam site, eastern
Turkey. Engineering Geology, Elsevier, Vol. 91, pp. 194-208.
Gurung, N. and Iwao, Y. (1998) Observations of deformation and engineering
geology in the Lam Ta Khong tunnel, Thailand. Eng. Geology, Vol 51, pp. 55-
63.
Hamersley, J. M. and Handscomb, D. C. (1964) Monte Carlo Methods. Methuen &
Co. Ltd., London, 178p.
Hoek, E (1994) Strength of rock masses. ISRM News J., Vol. 2, No. 2, pp. 4-16.
Hoek, E. (2009) Hoek’s Corner. www.rocscience.com, Toronto, Canada
Hoek, E, Carranza-Torres CT, Corkum B. (2002) Hoek-Brown failure criterion-2002
edition. In: Proceedings of the 5th North American Rock Mechanics Symp,
Toronto, Canada, 2002: Vol. 1, p. 267–73.
Hoek, E and Diederichs, M. (2006). Empirical estimates of rock mass modulus. Int. J
Rock Mech. Min. Sci., Vol. 43, p. 203–215.
338
Hoek, E. (1983) Strength of jointed rock masses, 23rd. Rankine Lecture.
Géotechnique, Vol. 33(3), p. 187-223.
Hoek, E. and Bray, J. W. (1977) Rock slope engineering. Institution of Mining and
Metallurgy, London.
Hoek, E. and Brown, E. T. (1980a) Underground excavation in rock. Institution of
Mining and Metallurgy, London.
Hoek, E. and Brown, E.T. (1980b) Empirical strength criterion for rock masses. J.
Geotech. Engng Div., ASCE Vol. 106(GT9), p. 1013-1035.
Hoek, E. and Brown, E.T. (1988) The Hoek-Brown failure criterion - a 1988 update.
In Rock engineering for underground excavations, proc. 15th Canadian rock
mech. symp., (ed. J.C. Curran), p. 31-38. Toronto: Dept. Civ. Engineering,
University of Toronto.
Hoek, E. and Brown, E.T. (1997) Practical estimates or rock mass strength. Int. J.
Rock Mech. Min.g Sci. & Geomech. Abstr. Vol. 34(8), p. 1165-1186.
Hoek, E. and Diederichs, M.S. Empirical estimation of rock mass modulus,
Int J of Rock Mech and Mining Sciences, Vol 43(2), pp. 203-215.
Hoek, E., Grabinsky, M. W. and Diederichs, M. S. (1991) Numerical modelling for
underground excavation design. Trans Instn Min Metall, Section A, Vol 100,
Jan-Apr 1991, pp. A22-A30.
Hoek, E., Kaiser, P. K. and Bawden, W. F. (1995) Support of underground
excavations in hard rock. A.A.BALKEMA, 215p.
Hoek, E., Marinos, P. and Benissi, M. (1998) Applicability of the Geological
Strength Index (GSI) classification for very weak and sheared rock masses. The
case of the Athens Schist Formation. Bull. Engng. Geol. Env. Vol. 57(2), p. 151-
160.
Hoek, E., Marinos, P., Marinos, V. 2005. Characterization and engineering properties
of tectonically undisturbed but lithologically varied sedimentary rock masses.
Int. J.Rock Mech. Min. Sci., Vol. 42/2, p. 277-285
339
Hoek, E., Wood, D. and Shah, S. (1992) A modified Hoek-Brown criterion for
jointed rock masses. Proc. rock characterization, symp. Int. Soc. Rock Mech.:
Eurock ‘92, (ed. J.A. Hudson), 209-214. London: Brit. Geol. Soc.
Hudson, J. A. and Harrison, J. (1997) Engineering rock mechanics, an introduction to
principles, Pergamon, 444p.
Houghton, D. A. (1976) The role of the rock quality indices in the assessment of rock
masses. Proc. Symp. on Exploration for Rock Engineering, Johannesburg,
Vol. 1, pp. 129-135.
ISRM International Society for Rock Mechanics (1978) Suggested methods for the
quantitative description of discontinuities in rock masses. Int. J. of Rock Mech.
and Min. Sci. & Geomech. Abstracts, Vol. 15, pp. 319-368.
Itasca Consulting Group Inc. (2003a) Fast Lagrangian Analysis of Continua – 2D
Modelling Software (FLAC) User’s Guide, Minneapolis, Minnesota USA.
Itasca Consulting Group Inc. (2003b) Fast Lagrangian Analysis of Continua – 3D
Modelling Software (FLAC-3D) User’s Guide, Minneapolis, Minnesota USA.
Itasca Consulting Group Inc. (2004a) Universal Distinct Element Code – 2D
Modelling Software (UDEC) User’s Guide. Minneapolis, Minnesota USA.
Itasca Consulting Group Inc. (2004b) Three-dimensional Distinct Element Code
(3DEC) User’s Guide, Minneapolis, Minnesota USA.
Jaeger, J. C. (1971)Friction rocks and stability of rock slopes. Geotechnique, Vol. 21,
No. 2, pp. 97-134.
Jaeger, J. C. (1972) Rock mechanics and engineering. Cambridge University Press,
417p.
Jaeger, J. C. and Cook, N. G. W. (1976) Fundamentals of rock mechanics. Chapman
and Hall, London, 585p.
Jakubec, J. and Laubscher, D. H. (2000) The MRMR rock mass rating classification
system in mining practice. Proc MassMin 2000, Brisbane, (Ed. G. Chitombo)
Aus Inst of Min Metall, Melbourne, pp. 413-422.
340
Jethwa, J. L., Dube, A. K., Singh, B. and Mithal, R. S. (1982) Evaluation of methods
for tunnel support design in squeezing rock conditions. Proc 4th
International
Cong of International. Assoc Eng Geol, Delhi, 1982, Vol 5, pp. 125-134.
Jethwa, J. L., Dube, A. K., Singh, B. and Singh, Bhawani (1981) Rock load
estimation for tunnels in squeezing ground conditions. Proc. RETC, San
Francisco, May 3-7, 1981, New York, ASCE/ASME.
Jinye, L. (1993) Moisture sensitive behaviour of sedimentary rock of Phu Kradung
and Phra Wihan formation at Lam Ta Khong pumped storage project. MSc
Thesis, Asian Institute of Technology, Thailand.
Kaiser, P. K., MacKay, C. and Gale, A. D. (1986) Evaluation of rock classification at
B. C. Rail Tumbler Ridge Tunnels. Rock Mechanics and Rock Engineering,
Vol. 19, pp. 205-234.
Kaiser, P. K., Diederichs, M. S., Martin, C. D., Sharp, J. and Steiner, W. (2000)
Underground works in hard rock tunnelling and mining. GeoEng2000,
Technomic Publ. Co., pp. 841-926.
Kendorski, F., Cummings, R. Bieniawski, Z. T. and Skinner, E. (1983) Rock mass
classification for block caving mine drift support. Proc. 5th
Congr. Int. Soc.
Rock Mech., Melbourne, Balkema, Rotterdam, pp. B51-B63.
Kikuchi, K. Saito, K. and Kusunoki, K. (1982) Geotechnically integrated evaluation
on the stability of dam foundation rocks, International Commission on Large
Dams (ICOLD), Rio de Janeiro, Brazil.
Kirsten, (1988a) Discussion on rock mass rating system. Rock Classification for
Engineering Purposes, ASTM Special Technical Publication No. 984, Ed. Louis
Kirkaldie, ASTM Philadelphia, pp.32-34.
Kirsten, (1988b) Discussion on Q-System. Rock Classification for Engineering
Purposes, ASTM Special Technical Publication No. 984, Ed. Louis Kirkaldie,
ASTM Philadelphia, pp.85-88.
Kommerell, O. (1940) Statische Bereehnung von Tunnelmauerwerk, 2nd
Edition W.
Ernst & Sohn, Berlin, 174p.
341
Kumar, N., Samadhiya, N. K. and Anbalagan, R. (2004) Application of rock mass
classification systems for tunnelling in Himalaya, India. SYNOROCK2004
Symposium Paper 3B14, CD-ROM.
Ladanyi, B. and Archambault, G. (1970) Simulation of shear behaviour of rock
masses. Rock Mechanics Theory and Practice, Proc. 11th
U.S. Symp. Rock Mech.
(Berkeley, 1969), New York, AIME, pp. 105-125.
Lang, T. A. (1961) Theory and practice of rock bolting. Trans. Soc. Min. Engrs.
AIME, Vol. 220, pp. 333-348.
Lang, T. A. and Bischoff, J. A. (1982) Stabilisation of rock excavations using rock
reinforcement. Issues in Rock Mechanics, Proc. 23rd
U.S. Symp. Rock Mech.,
Berkeley, (eds. R. E. Goodman and F. E. Heuze), AIME, New York, pp. 935-
943.
Lasao, M.L. (1986) Design of rock support for the Huai Saphan Hin power tunnel,
MSc Thesis, Asian Inst of Tech, Thailand, 136p.
Laubscher, D. H. (1977) Class distinction in rock masses. Coal, Gold, Base Minerals
of South Africa, Vol. 23(6), pp. 37-50.
Laubscher, D. H. (1977) Geomechanics classification of jointed rock masses –
mining applications. Trans. Inst. Min Metallurgy. Vol.86, pp. A1-A8.
Laubscher, D. H. (1984) Design aspects and effectiveness of support systems in
different mining conditions. Trans. Inst. Min Metallurgy. Vol.93, pp. A70-A82.
Laubscher, D. H. (1990) A geomechanics classification system for the rating of rock
mass in mine design. J S African Inst Min Metall, Vol 90, No. 10, pp. 257-273.
Laubscher, D. H. (1993) Planning mass mining operations. Comprehensive Rock
Engineering. (Eds. J. A. Hudson, E. T. Brown, C. Fairhurst and E. Hoek),
Pergamon Press, Oxford, Vol. 2, pp. 547-583.
Laubscher, D. H. (1994) Cave mining – the state of the art. J S African Inst Min
Metall, Vol. 94, No. 10, pp. 279-293.
Laubscher, D. H. (2000) Block caving manual. Prepared for international caving
study. JKMRC and Itasca Consulting Group Inc, Brisbane.
342
Laubscher, D. H. and Jacubec, J. (2001) The MRMR rock mass rating classification
for jointed rock masses. Underground Mining Methods: Engineering
Fundamentals and International Case Studies. (Eds. W. A. Hustrulid and R. L.
Bullock), Soc Min Eng, AIME, New York, pp. 474-481.
Laubscher, D. H. and Page, C. H. (1990) The design of rock support in high stress or
weak rock environments. Proc 92nd
Canadian Inst Min Metal. AGM, Ottawa,
Paper #91.
Laubscher, D. H. and Taylor, H. W. (1976) The importance of geomechanics
classification of jointed rock masses in mining operations. Exploration for rock
engineering, (ed. Bieniawski), Cape Town, Balkema, Vol.1 pp. 119-128.
Lauffer, H. (1958) Gebirgsklassifizierung fur den Stollenbau. Geologie und
Bauwesen, Springer, Vienna, Vol.24, No.1, pp. 46-51.
Lauffer, H. (1960) Die neuere Entwicklung der Stollenbaujechnik. Oesterreichische
Ingenieur Zeitschrift, Vol.3 No.1, pp. 13-24.
Lee, C. F., Wang Sijing and Yang Zhifu (1996) Geotechnical aspects of rock
tunnelling in China. Tunnelling and Underground Space Tech. Vol.11, No. 4,
pp. 445-454.
Lorig, L. J. and Brady, B. H. G. (1983) An improved procedure for excavation
design in stratified rock. Rock Mech.anics Theory Experiment and Practice,
Proc. 24th
U.S. Symp. Rock Mech., College Station, Texas, AEG, New York, pp.
577-585.
Louis, C. (1974a) Reconnaissance des Massifs Rocheux par Sonndages et
Classification Geotechnique des Roches, Annales I.T.B.T.P., No. 319, Juillet-
Aout, pp. 97-122.
Louis, C. (1974b) Technology and utilization of shotcrete. Prepared discussion
during Tunnel Conference, Journees d’Etudes de Nice, Ed. Sepaly, Decines,
France. pp.121-124.
Love, A. E. H. (1927) A treatise on the mathematical theory of elasticity. Dover
Press, New York, 643p.
McMahon, B. K. (1985) Some practical considerations for the estimation of shear
strength of joints and other discontinuities. Pro. Int. Symp. Fundamentals of
343
Rock Joints, (Bjorkliden, September 15-20, 1985) Lulea, Centek Publishers, pp.
475-485.
Mairaing, W., Thongthamchat, C. and Chaisiwamonghol, N. (2007) Performance of
seepage control system in the largest RCC dam in Thailand, published in:
http://www.talsperrenkomitee.de/freising2007/pdf/47_Mairaing.pdf, German
Committee on Large Dams, ICOLD.
Marinos, P. and Hoek, E (2001) GSI: Geologically friendly tool for rock mass
strength estimation. Proc. GeoEng2000, Melbourne, Technomic Publ. Co.,
Lancaster, Vol. 1pp. 1422-40.
Merritt, A. H. (1972) Geologic predictions for underground excavations. Proc 1st
Rapid Excavation and Tunnelling Conf., AIME, New York, pp. 115-132.
Mikula, P. and Lee, M. (2003) Confirmation of Q Classification for use at Mt
Charlotte Mine, Proc First Australasian Ground Control in Mining Conference,
Nov 2003.
Milne, D., Hadjgeorgiou, J and Pakalnis, R. (1998) Rock mass characterization for
underground hard rock mines. Tunnel. Undergr. Space Technl. Vol.13, No. 4,
pp. 383-391.
Moreno Tallon, E. (1982) Comparison and application of geomechanics
classification schemes in tunnel construction. Tunnelling 82, 3rd
Intl. Sym. The
Inst. Min. Met., pp. 241-246.
Nakao, K. and Koyama, S. (1984) Statistical weight analysis on the parameters for
geomechanics classification of tunnelling. Proc Japanese Soc of Civil Eng, No.
346/III-I, Geotechnical Eng May 1984, pp. 107-114.
Nakao, K., Lihoshi, S. and Koyama, S. (1983) Statistical reconsideration on the
parameters for geomechanics classification. Proc 5th
Intnl Congress on Rock
Mech, ISRM, Melbourne, Vol. 1, pp. B13-B16.
Nakao, K., Lihoshi, S., Koyama, S. and Ryoke, K. (1982) Geomechanic
classification for assessing rock mass in Japan. Rock Mechanics: Caverns and
Pressure Shafts. Proc ISRM Sym, Aachen, Vol. 1, pp. 97-104.
Nelson, I, Jr., and Kanji, M. A. (1990) Estimating the shear stiffness of rock joints.
Proc. Intnl. Symp. Rock Joints, Loen, Norway.
344
Nitaramorn, A. (1997) Ground response in the excavations of the Lam Ta Khong
pumped storage project, MSc Thesis, AIT, Thailand.
Nomikos, P. P., Nomikos, P. and Tsoutrelis, C. E. (2002) Symmetric wedge in the
roof of a tunnel excavated in an inclined stress field. Intnl Jour Rock Mech &
Min Sci & Geomech Abstr, Vol 39, pp. 59-67.
Obert, L. and Duvall, W. I. (1966) Rock mechanics and the design of structures in
rock. John Wiley and Sons, Inc., 649p.
Panek, L. A. (1964) Design for bolting stratified rock. Tran. Soc. Min. Engrs. June
1964.
Palmstrom A (1982) The volumetric joint count a useful and simple measure of the
degree of rock jointing. Proc 4th
International Cong International Assoc Eng
Geol, Delhi, 1982, vol 5, pp 221-228.
Palmstrom, A. (1995) RMi – a rock mass characterisation system for rock
engineering purposes. PhD Thesis, University of Oslo, Norway 400p.
Palmstrom, A. (1996) Characterizing rock masses by the RMi for use in practical
rock engineering. Part 1: The development of the Rock Mass Index (RMi),
Tunnel. Underg. Space Technol., Pergamon, Vol. 11, No. 2, pp.175-188.
Palmstrom, A. (1996) Characterizing rock masses by the RMi for use in practical
rock engineering. Part 2: Some practical applications of the Rock Mass Index
(RMi), Tunnel. Underg. Space Technol., Pergamon, Vol. 11, No. 3, pp.287-303.
Palmstrom, A. (2000) Recent developments in rock support estimates by the RMi. J
Rock Mech. & Tunnelling Technology, Vol. 6, No. 1 , pp. 1-19.
Palmstrom, A. (2005) Measurements of and correlations between block size and rock
quality designation (RQD). Tunnel. Underg. Space Technl., Elsevier, Vol. 20,
pp. 362-377.
Palmstrom, A. (2009) Combining the RMR, Q and RMi classification systems.
Tunnel. Underg. Space Technl., Elsevier, Vol. (in press) Technical Note)
Palmstrom, A. and Broch, E. (2006) Use and misuse of rock mass classification
systems with particular reference to the Q-system, Tunnel. Undergr. Space
Technl., Vol. 21, pp. 575-593.
345
Palmstrom, A., Milne, D. and Peck, W. (2000) The reliability of rock mass
classification used in underground excavation and support design. GeoEng2000
Workshop on Classification Systems, ISRM News, Vol. 6, No. 3, 2001, 2p.
Palmstrom, A. and Stille, H. (2007) Ground behaviour and rock engineering tools for
underground excavations. Tunnel. Underg. Space Technol., Elsevier, Vol. 22,
pp. 363-376.
Papaliangas, T. T., Lumsden, A. C. and Hencher, S. R. (1996) Prediction of in situ
shear strength of rock joints. Prediction and Performance in Rock Mechanics
and Rock Engineering, Proc. Eurock ’96 (Torino, Italy, September 2-5, 1996),
Balkema, Rotterdam, Vol. 1, pp. 143-149.
Patton, F. D. (1966) Multiple modes of shear failure in rock. Proc. 1st Congr. ISRM,
Lisbon, Vol. 1, pp. 509-513.
Peck, W. (2000) Determining the stress reduction factor in highly stressed jointed
rock. Australian Geomechanics, June 2000.
Pells, P. J. and Bertuzzi, R (2008) Discussion on article titled “Use and misuse of
rock mass classification systems”, Tunnel Undergr. Space Technl., 23: 340-350.
Pells, P. J. N. (2002) Developments in the design of tunnels and caverns in the
Triasic rocks of the Sydney region. Intnl. J of Rock Mech. & Min. Sci., Vol. 39,
pp. 569-587.
Phienwej, N. (1999) Design and construction of underground powerhouse cavern,
Lam Ta Khong Pumped Storage Project. In Proceedings of the National
Convention of Civil Engineers, 24-26 March 1999, GE11-GE25, Pattaya,
Thailand.
Phienwej, N. and Anwar, S. (2005) Rock mass characterisation for the underground
cavern design of Khiritharn pumped storage scheme. Geotechnical and
Geological Engineering. Springer, 23: 175-197.
Phuntumat, P., 1997. Engineering properties of volcanic rocks at Khlong Tha Dan
dam, Ampoe Muang, Nakon Nayok Province, Thailand, MSc Thesis, Asian
Institute of Technology, Thailand.
Polishook, B. and Flexer, A. (1998) Assessment of chalk rock mass in excavations.
Bull of Eng Geology & Env, Springer Verlag, Vol. 57, pp. 145-150.
346
Prapphal, K. (1993) Evaluation of rock mass properties for the design of
underground excavation of Lam Ta Khong pumped storage project. MSc Thesis,
Asian Institute of Technology, Thailand.
Priest, S. D. (1985) Hemispherical projection methods in rock mechanics, George
Allen & Unwin, London.
Priest, S. D. (1993) Discontinuity analysis for rock engineering. Chapman & Hall.
473p.
Priest, S. D. and Hudson, J. A. (1976) Discontinuity spacing in rock. Intnl. J of Rock
Mech. and Min. Sci. & Geomech. Abstracts, Vol. 13, pp. 135-148.
Rabcewicz, L. V. (1964a) The New Austrian Tunnelling Method, Part I. Water
Power, November 1964, pp. 453-457.
Rabcewicz, L. V. (1964b) The New Austrian Tunnelling Method, Part II. Water
Power, December 1964, pp. 511-515.
Rabcewicz, L. V. (1965) The New Austrian Tunnelling Method, Part III. Water
Power, January 1965, pp. 19-24.
Ran, J. Q., Passaris, E. K. S. and Mottahed, P. (1994) Shear sliding failure of the
jointed roof in laminated rock mass. Rock Mechanics and Rock Engineering,
Vol. 27, No. 4, p. 235-251.
Ranasooriya, J. (1985) Design of rock support for Chiew Larn power tunnel. MSc
Thesis, Asian Institute of Technology, Thailand.
Ranasooriya, J. and Nikraz, H. (2007) Comparison of empirical methods with
analytical methods of underground excavation design. 10th
Aus NZ Conf on
Geomech, Brisbane, Oct 2007, Vol. 2, pp. 436-441.
Ranasooriya, J. and Nikraz, H. (2008a) Tetrahedral rock wedge stability under
empirically derived support. 1st Southern Hemisphere Int. Rock Mech Sym, Sep
2008, Perth, Vol. 1, pp. 619-631.
Ranasooriya, J. and Nikraz, H. (2008b) An evaluation of rock mass classification
methods used for tunnel support design. ARMS5, ISRM Intnl. Sym 2008, Vol. 2,
pp. 819-826.
347
Ratanasatayanont, A. (1984) Rock mass classification for some engineering purposes
along the diversion tunnel at Chiew Larn damsite, Surat Thani. MSc Thesis,
Asian Inst of Tech, Thailand, 147p.
Rawlings, C. G., Barton, N., Smallwood, A. and Davies, N. (1995) Rock mass
characterisation using the Q and RMR systems. 8th
ISRM Congress (Tokyo),
Balkema, Rotterdam. Vol. 1, pp. 29-31.
Rechitskii, V. L. (1998) Evaluation of the stiffness characteristics of rock joints from
data of field observations at water development projects. Hydrotechnical
Construction, Vol. 32, No. 8, pp. 463-469.
Ritter, W. (1879) Die Statik der Tunnelgeowolbe. Springer, Berline.
Rocscience Inc. (1999) Phase2, A 2D finite element program for calculating stress
and estimating support around underground excavations. Geomechanics
Software and Research, www.rocscience.com, Toronto, Canada.
Rocscience Inc. (2003) Unwedge Version 3.0, Underground Wedge Stability
Analysis. www.rocscience.com, Toronto, Canada.
Rocscience Inc. (2008) Personal communications via email during March, April and
May 2008 with Brent Corkum of Rocscience, Toronto, Canada.
Rocscience Inc. (2009a) EXAMINE, a two dimensional computer-aided engineering
analysis package for underground excavations in rock Geomechanics Software
and Research, www.rocscience.com, Toronto, Canada.
Rocscience Inc. (2009b) EXAMINE3D, a three dimensional computer-aided
engineering analysis package for underground excavations in rock,
Geomechanics Software and Research, www.rocscience.com, Toronto, Canada.
Rutledge, J. C. and Preston, R. L. (1978) Experience with engineering classifications
of rock. Proc Intnl Tunnelling Symp, Tokyo, 1978, pp. A3.1-A3.7.
Sandstrom, G. E. (1963) The history of tunnelling. Barrie and Rockliff, London,
427p.
Sari, D, and Pasamehmetoglu, A. G. (2004) Proposed support design, Keletepe
tunnel, Turkey, Engineering Geology, Elsevier, Vol. 72, pp. 201-216.
348
Sen, Z. and Sadagah, B. H. (2003) Modified rock mass classification system by
continuous rating. Engineering Geology, Vol. 67, pp. 269-280.
Serafim, J. I. and Pereira, J. P. (1983) Consideration of the geomechanics
classification of Bieniewski, Intnl. Symp. Eng. Geol and Underground
Construction, LNEC, Lisbon, Vol. 1, pp. II.33-II.42.
Sheorey, P. R. (1993) Experience with the application of modern rock classifications
in coal mine roadways. Comprehensive Rock Engineering, Principles, Practice
and Projects, Editor in Chief J. A. Hudson, Pergamon, Vol. 5, pp.411-431.
Singh, Bhawani and Goel, R. K. (1999) Rock mass classification, a practical
approach in civil engineering. Elsevier, 267p.
Singh, Bhawani, Goel, R. K., Jethwa, J. L. and Dube, A. K. (1997) Support pressure
assessment in arched underground openings through poor rock masses.
Engineering Geology, Elsevier, Vol. 48, pp. 59-81.
Singh, Bhawani, Jethwa, J. L., Dube, A. K. and Singh, B. (1992) Correlation
between observed support pressure and rock mass quality. Tunnel. Undergr.
Space Technl., Vol. 7, No. 1, pp. 59-74.
Sirikaew, U. (1993) Rock mechanics at the Lam Ta Khong pumped storage project.
MSc Thesis, Asian Institute of Technology, Thailand.
Sofianos, A. I. (1986) Stability of wedges in tunnel roofs. Intnl Jour Rock Mech &
Min Sci & Geomech Abstr, vol 23, No. 2, pp. 119-130.
Sofianos, A. I. (1996) Analysis and design of an underground hard rock voussoir
beam roof. Int. J. Rock Mech. Min. Sci. & Geomech. Abstr., Vol. 33, No. 2,
pp. 153–166.
Sofianos, A. I. (1999) Discussion on “Stability of large excavations in laminated hard
rock masses: the voussoir analogue revisited” by M. S. Diederichs and P. K.
Kaiser, Int. J. Rock Mech. Min. Sci. Vol. 36, No. 7, pp. 991-993.
Sofianos, A. I., Nomikos, P. and Tsoutrelis, C. E. (1999) Stability of symmetric
wedge formed in the roof of a circular tunnel: nonhydrostatic natural stress field.
Tech. Note. Intnl J Rock Mech & Min Sci & Geomech Abstr, Vol 36, pp.
687-691.
349
Speers, C.R. (1992) Support of tunnels subjected to changing rock loads: a
comparison of design methods. Tunnel and Undergr. Space Technl, Vol.7, No.1,
pp.25-32.
Sriwisead, W. (1996) Evaluation of the access tunnel of the Lam Ta Khong pumped
storage project. MSc Thesis, Asian Institute of Technology, Thailand.
Steiner, W. and Einstein, H. H. (1980) Improved design of tunnel supports: Volume
5, Empirical method in rock tunnelling – Review and recommendations. Report
No. UMTA-MA-06-0100-80-8, Massachusetts Inst of Tech, Cambridge, USA.
Stillborg, B. (1994) Professional users handbook for rock bolting, Trans Tech
Publications, 145p.
Stille, H. and Palmstrom, A. (2003) Classification as a tool in rock engineering.
Tunnel. Undergr. Space Technol.. Vol.18, pp. 331-345
Stini, J. (1950) Tunnelbaugeologie, Springer, Vienna.
Sterling, R. L. (1980) The Ultimate Load Behaviour of Laterally Constrained Rock
Beams. The State of the Art in Rock Mechanics: Proc. of the 21st U.S.
Symposium on Rock Mechanics, pp. 533–542.
Stille. H. and Palmstrom, A. (2008) Ground behaviour and rock mass composition in
underground excavations. Tunnel. Undergr. Space Technl, Vol.7, No.1,
pp.25-32.
Sunwoo, C. and Hwang S, (2001) Correlation of rock mass classification methods in
Korean rock mass. Frontiers of Rock Mechanics & Sustainable Development in
21st Century, 2
nd ARMS, Proc of the 2001 ISRM Intnl Symp, Beijing, China,
Balkema, pp. 631-633.
Swe, M. M. (2003) Evaluation of support requirements in tunnel excavation at Klong
Tha Dan Dam, Nakhon Nayok, Thailand, MSc Thesis, Asian Institute of
Technology, Thailand.
Tanaka, H. (1964) Introduction of geology to civil engineers, Sankaidou, Japan.
Terzaghi, K. (1946) Rock defects and loads for tunnel supports. In Proctor, R. V. and
White, T. L., Rock Tunnelling with Steel Support, Youngstown, Ohio, pp. 17-
102.
350
Timoshenko, S. P. and Goodier, J. N. (1951) Theory of elasticity. McGraw-Hill,
New York, 506p.
Tran, T.V. (1994) Ground response and support performance in the exploratory
tunnel of the Lam Ta Khong pumped storage project. MSc Thesis, Asian Institute
of Technology, Thailand.
Tugrul, A. (1998) The application of rock mass classification systems to
underground excavation in weak limestone, Ataturk dam, Turkey. Engineering
Geology, Elsevier, Vol. 50, pp. 337-345.
Tzamos, S. and Sofianos, A. I. (2007) A correlation of four rock mass classification
systems through their fabric indices. Int. J. of Rock Mech. and Min Sci.,
Elsevier, Vol. 44, pp.477-495.
Udd, J E. and Wang, H. A. (1985) A comparison of some approaches to the
classification of rock masses for geotechnical purposes. Proc. 25th
U.S. Symp.
Rock Mech., Rapid City, SD, (Ed. E. Ashworth), Balkema, Rotterdam, pp. 69-78.
Unal, E. (1983) Design guidelines and roof control standards for coal mine roofs.
PhD Thesis, Pennsylvania University, University Park, p. 335.
U. S. Corp of Engineers (1980) Engineering and design: rock reinforcement.
Engineer Manual EM 1110-1-2907, 1980, Office of the Chief Engineer,
Washington DC 20314.
Verman, M. K. (1993) Rock mass tunnel support interaction analysis, PhD Thesis,
University of Roorkee, India {in Singh and Goel (1999)}.
Wahlstrom, E. E. (1973) Tunnelling in rock, developments in geotechnical
engineering 3, Elsevier, 250p.
Whitaker, B. N. and Frith, R. C. (1990). Tunnelling; Design, Stability and
Construction. The Inst Min Metall. UK, 460p.
Wickham, G. E. Tiedemann, H. R. and Skinner, E. G. (1972) Support determination
based on geologic predictions. Proc 1st RETC, AIME, New York, pp. 43-64.
Wickham, G. E. Tiedemann, H. R. and Skinner, E. G. (1974) Ground support
prediction model – RSR Concept. Proc 2nd
RETC, AIME, New York, Chapter
49, pp. 691-707.

351
Yoshinaka, R. and Yamabe, T. (1986) Joint stiffness and the deformation behaviour
of discontinuous rock. Int. J. of Rock Mech. and Min Sci & Geomech Abstracts.
Vol. 23.
Yu-Shan, H. (1987) Design and construction aspects of the Central tunnel in Taiwan,
Republic of China. MSc Thesis, Asian Institute of Technology, Thailand.

APPENDIX A
Appendix A contains the publications listed on pages ii and iii of this thesis
1
1. INTRODUCTION
Two empirical rock mass classification systems, RMR [1] and Q-System [2], have gained wide acceptance since their introduction more than three decades ago. Based on the experience gained from the application in underground excavation projects, revised versions of RMR [3, 4, 5, 6] and Q-System [7, 8] were also issued.
Since it is virtually impracticable to determine the exact engineering properties of the entire rock mass involved in an underground excavation project, these classification systems, which describe the rock mass in a qualitative to semi-quantitative manner and prescribe stabilisation measures based on experience in similar ground conditions, are useful tools for underground excavation designers.
Rock mass classification systems, however, have their limitations. First, these systems do not have any scientifically proven means to identify potential failure mechanisms in a rock mass. Second, the rock mass stabilisation measures may be over-designed for the case studies in the database used in developing the classification system, thus the
predictions for new projects may be even more conservative and costly than warranted. Put simply, in some instances, the predictions made using rock mass classification systems may not be reliable.
One approach to assess the reliability of empirical rock mass classification systems (under a given set of conditions) is to compare their predictions with those of analytical methods. Such a comparison will be meaningful only if the ground conditions of the excavation site are well enough understood to apply both empirical and analytical methods with confidence. This can best be done after excavation is complete, so that the actual ground conditions can be closely observed to obtain representative rock mass parameters.
This paper compares the ground support predictions of RMR and Q-System with that of an analytical method, with specific reference to a 13 m diameter hydropower tunnel. The analytical method considered is block theory [9] using UNWEDGE software code [10]. In the light of the support predictions made by the two empirical methods, the design requirements to prevent hydraulic jacking in
COMPARISON OF ROCK MASS CLASSIFICATION SYSTEMS WITH AN ANALYTICAL METHOD OF UNDERGROUND EXCAVATION DESIGN
Ranasooriya, J. Resources Safety, Perth, Australia
Nikraz, H. Curtin University, Perth, Australia
ABSTRACT: Rock mass classification systems are useful tools for underground excavation design. These empirical systems avoid the analysis of failure mechanisms and the forces required to stabilise the potentially unstable rocks, and prescribe stabilisation measures based on past experience in similar ground conditions. There are, however, some limitations in this approach. These systems do not have any scientifically proven means to identify failure mechanisms in a rock mass, thus their predictions can sometimes be erroneous. Further, the rock masses at two sites may appear similar and may be broadly classified into the same class, but their failure mechanisms and volumes can be significantly different, so the stabilisation measures installed at one site may not necessarily be adequate for another. One of the ways to identify the limitations and rectify them where possible is to compare the design predictions of rock mass classification systems with those of other methods for the same excavation. This paper compares the predictions made by two rock mass classification systems with that made using block theory, with specific reference to a 13 m diameter hydropower tunnel.
Keywords: rock mass; classification; tunnel; rock blocks; stability; RMR; Q-System
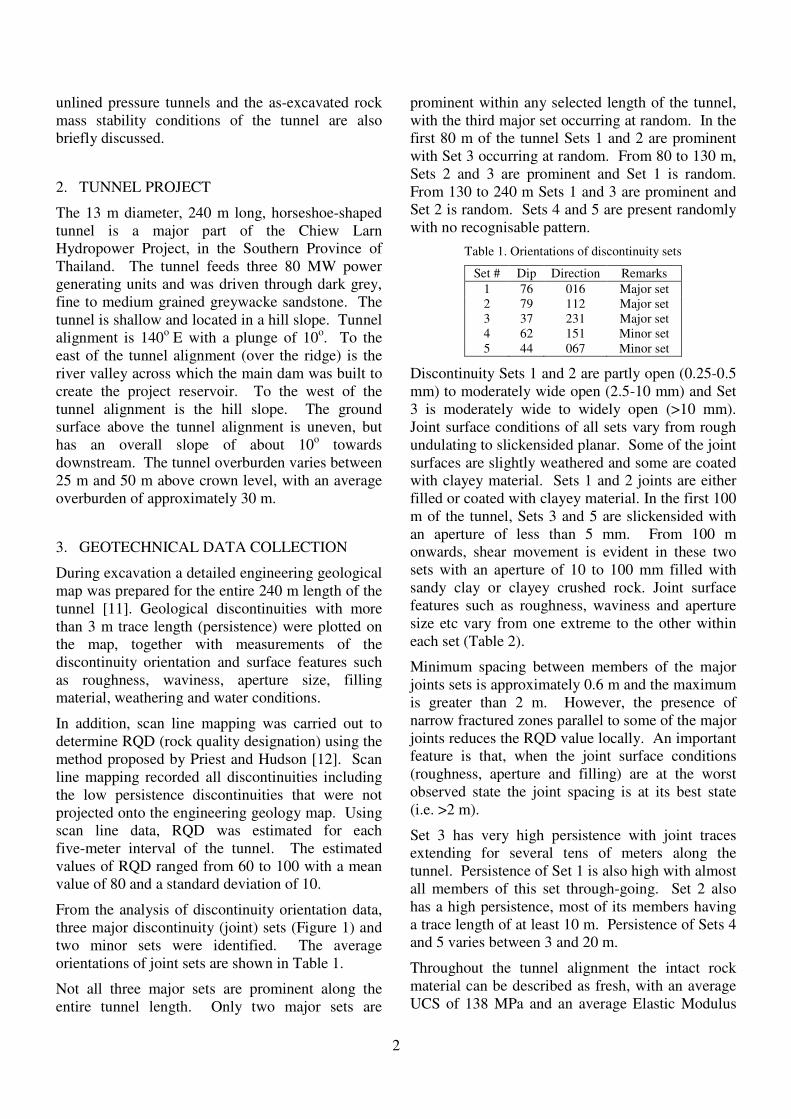
2
unlined pressure tunnels and the as-excavated rock mass stability conditions of the tunnel are also briefly discussed.
2. TUNNEL PROJECT
The 13 m diameter, 240 m long, horseshoe-shaped tunnel is a major part of the Chiew Larn Hydropower Project, in the Southern Province of Thailand. The tunnel feeds three 80 MW power generating units and was driven through dark grey, fine to medium grained greywacke sandstone. The tunnel is shallow and located in a hill slope. Tunnel alignment is 140o E with a plunge of 10o. To the east of the tunnel alignment (over the ridge) is the river valley across which the main dam was built to create the project reservoir. To the west of the tunnel alignment is the hill slope. The ground surface above the tunnel alignment is uneven, but has an overall slope of about 10o towards downstream. The tunnel overburden varies between 25 m and 50 m above crown level, with an average overburden of approximately 30 m.
3. GEOTECHNICAL DATA COLLECTION
During excavation a detailed engineering geological map was prepared for the entire 240 m length of the tunnel [11]. Geological discontinuities with more than 3 m trace length (persistence) were plotted on the map, together with measurements of the discontinuity orientation and surface features such as roughness, waviness, aperture size, filling material, weathering and water conditions.
In addition, scan line mapping was carried out to determine RQD (rock quality designation) using the method proposed by Priest and Hudson [12]. Scan line mapping recorded all discontinuities including the low persistence discontinuities that were not projected onto the engineering geology map. Using scan line data, RQD was estimated for each five-meter interval of the tunnel. The estimated values of RQD ranged from 60 to 100 with a mean value of 80 and a standard deviation of 10.
From the analysis of discontinuity orientation data, three major discontinuity (joint) sets (Figure 1) and two minor sets were identified. The average orientations of joint sets are shown in Table 1.
Not all three major sets are prominent along the entire tunnel length. Only two major sets are
prominent within any selected length of the tunnel, with the third major set occurring at random. In the first 80 m of the tunnel Sets 1 and 2 are prominent with Set 3 occurring at random. From 80 to 130 m, Sets 2 and 3 are prominent and Set 1 is random. From 130 to 240 m Sets 1 and 3 are prominent and Set 2 is random. Sets 4 and 5 are present randomly with no recognisable pattern.
Table 1. Orientations of discontinuity sets
Set # Dip Direction Remarks 1 76 016 Major set 2 79 112 Major set 3 37 231 Major set 4 62 151 Minor set 5 44 067 Minor set
Discontinuity Sets 1 and 2 are partly open (0.25-0.5 mm) to moderately wide open (2.5-10 mm) and Set 3 is moderately wide to widely open (>10 mm). Joint surface conditions of all sets vary from rough undulating to slickensided planar. Some of the joint surfaces are slightly weathered and some are coated with clayey material. Sets 1 and 2 joints are either filled or coated with clayey material. In the first 100 m of the tunnel, Sets 3 and 5 are slickensided with an aperture of less than 5 mm. From 100 m onwards, shear movement is evident in these two sets with an aperture of 10 to 100 mm filled with sandy clay or clayey crushed rock. Joint surface features such as roughness, waviness and aperture size etc vary from one extreme to the other within each set (Table 2).
Minimum spacing between members of the major joints sets is approximately 0.6 m and the maximum is greater than 2 m. However, the presence of narrow fractured zones parallel to some of the major joints reduces the RQD value locally. An important feature is that, when the joint surface conditions (roughness, aperture and filling) are at the worst observed state the joint spacing is at its best state (i.e. >2 m).
Set 3 has very high persistence with joint traces extending for several tens of meters along the tunnel. Persistence of Set 1 is also high with almost all members of this set through-going. Set 2 also has a high persistence, most of its members having a trace length of at least 10 m. Persistence of Sets 4 and 5 varies between 3 and 20 m.
Throughout the tunnel alignment the intact rock material can be described as fresh, with an average UCS of 138 MPa and an average Elastic Modulus
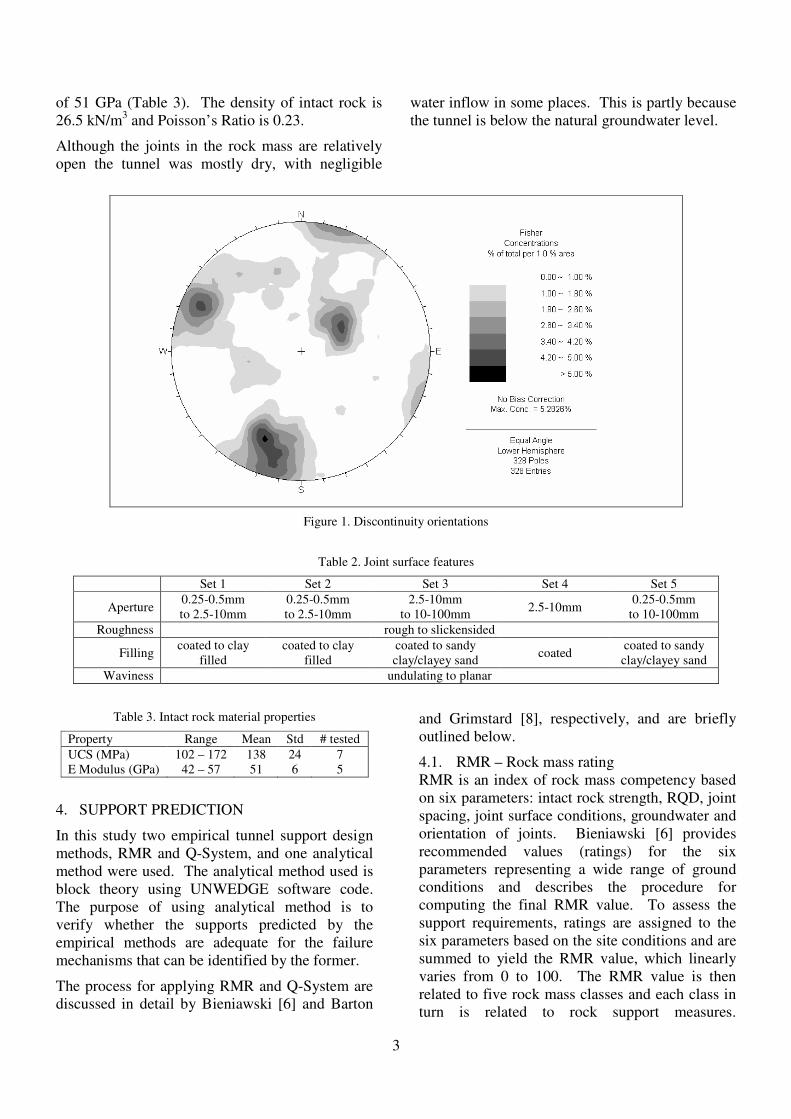
3
of 51 GPa (Table 3). The density of intact rock is 26.5 kN/m3 and Poisson’s Ratio is 0.23.
Although the joints in the rock mass are relatively open the tunnel was mostly dry, with negligible
water inflow in some places. This is partly because the tunnel is below the natural groundwater level.
Figure 1. Discontinuity orientations
Table 2. Joint surface features
Set 1 Set 2 Set 3 Set 4 Set 5
Aperture 0.25-0.5mm to 2.5-10mm
0.25-0.5mm to 2.5-10mm
2.5-10mm to 10-100mm 2.5-10mm
0.25-0.5mm to 10-100mm
Roughness rough to slickensided
Filling coated to clay filled
coated to clay filled
coated to sandy clay/clayey sand coated coated to sandy
clay/clayey sand Waviness undulating to planar
Table 3. Intact rock material properties
Property Range Mean Std # tested UCS (MPa) 102 – 172 138 24 7 E Modulus (GPa) 42 – 57 51 6 5
4. SUPPORT PREDICTION
In this study two empirical tunnel support design methods, RMR and Q-System, and one analytical method were used. The analytical method used is block theory using UNWEDGE software code. The purpose of using analytical method is to verify whether the supports predicted by the empirical methods are adequate for the failure mechanisms that can be identified by the former.
The process for applying RMR and Q-System are discussed in detail by Bieniawski [6] and Barton
and Grimstard [8], respectively, and are briefly outlined below.
4.1. RMR – Rock mass rating RMR is an index of rock mass competency based on six parameters: intact rock strength, RQD, joint spacing, joint surface conditions, groundwater and orientation of joints. Bieniawski [6] provides recommended values (ratings) for the six parameters representing a wide range of ground conditions and describes the procedure for computing the final RMR value. To assess the support requirements, ratings are assigned to the six parameters based on the site conditions and are summed to yield the RMR value, which linearly varies from 0 to 100. The RMR value is then related to five rock mass classes and each class in turn is related to rock support measures.
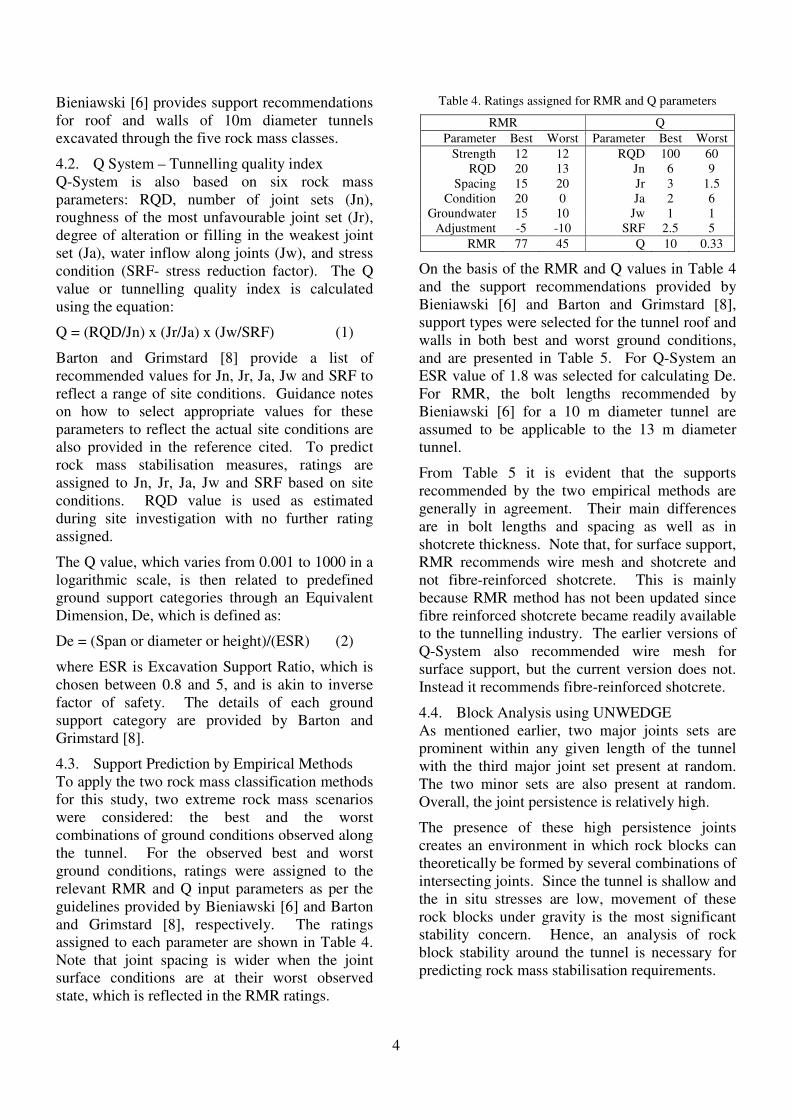
4
Bieniawski [6] provides support recommendations for roof and walls of 10m diameter tunnels excavated through the five rock mass classes.
4.2. Q System – Tunnelling quality index Q-System is also based on six rock mass parameters: RQD, number of joint sets (Jn), roughness of the most unfavourable joint set (Jr), degree of alteration or filling in the weakest joint set (Ja), water inflow along joints (Jw), and stress condition (SRF- stress reduction factor). The Q value or tunnelling quality index is calculated using the equation:
Q = (RQD/Jn) x (Jr/Ja) x (Jw/SRF) (1)
Barton and Grimstard [8] provide a list of recommended values for Jn, Jr, Ja, Jw and SRF to reflect a range of site conditions. Guidance notes on how to select appropriate values for these parameters to reflect the actual site conditions are also provided in the reference cited. To predict rock mass stabilisation measures, ratings are assigned to Jn, Jr, Ja, Jw and SRF based on site conditions. RQD value is used as estimated during site investigation with no further rating assigned.
The Q value, which varies from 0.001 to 1000 in a logarithmic scale, is then related to predefined ground support categories through an Equivalent Dimension, De, which is defined as:
De = (Span or diameter or height)/(ESR) (2)
where ESR is Excavation Support Ratio, which is chosen between 0.8 and 5, and is akin to inverse factor of safety. The details of each ground support category are provided by Barton and Grimstard [8].
4.3. Support Prediction by Empirical Methods To apply the two rock mass classification methods for this study, two extreme rock mass scenarios were considered: the best and the worst combinations of ground conditions observed along the tunnel. For the observed best and worst ground conditions, ratings were assigned to the relevant RMR and Q input parameters as per the guidelines provided by Bieniawski [6] and Barton and Grimstard [8], respectively. The ratings assigned to each parameter are shown in Table 4. Note that joint spacing is wider when the joint surface conditions are at their worst observed state, which is reflected in the RMR ratings.
Table 4. Ratings assigned for RMR and Q parameters
RMR Q Parameter Best Worst Parameter Best Worst
Strength 12 12 RQD 100 60 RQD 20 13 Jn 6 9
Spacing 15 20 Jr 3 1.5 Condition 20 0 Ja 2 6
Groundwater 15 10 Jw 1 1 Adjustment -5 -10 SRF 2.5 5
RMR 77 45 Q 10 0.33
On the basis of the RMR and Q values in Table 4 and the support recommendations provided by Bieniawski [6] and Barton and Grimstard [8], support types were selected for the tunnel roof and walls in both best and worst ground conditions, and are presented in Table 5. For Q-System an ESR value of 1.8 was selected for calculating De. For RMR, the bolt lengths recommended by Bieniawski [6] for a 10 m diameter tunnel are assumed to be applicable to the 13 m diameter tunnel.
From Table 5 it is evident that the supports recommended by the two empirical methods are generally in agreement. Their main differences are in bolt lengths and spacing as well as in shotcrete thickness. Note that, for surface support, RMR recommends wire mesh and shotcrete and not fibre-reinforced shotcrete. This is mainly because RMR method has not been updated since fibre reinforced shotcrete became readily available to the tunnelling industry. The earlier versions of Q-System also recommended wire mesh for surface support, but the current version does not. Instead it recommends fibre-reinforced shotcrete.
4.4. Block Analysis using UNWEDGE As mentioned earlier, two major joints sets are prominent within any given length of the tunnel with the third major joint set present at random. The two minor sets are also present at random. Overall, the joint persistence is relatively high.
The presence of these high persistence joints creates an environment in which rock blocks can theoretically be formed by several combinations of intersecting joints. Since the tunnel is shallow and the in situ stresses are low, movement of these rock blocks under gravity is the most significant stability concern. Hence, an analysis of rock block stability around the tunnel is necessary for predicting rock mass stabilisation requirements.
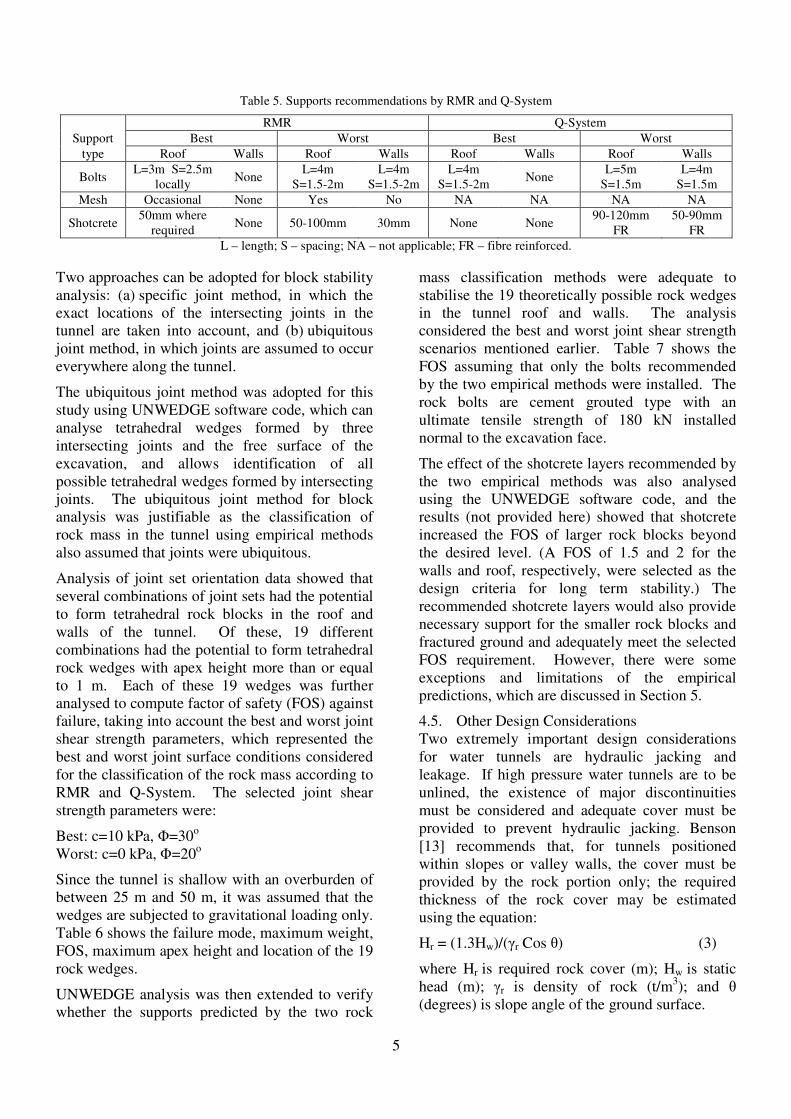
5
Table 5. Supports recommendations by RMR and Q-System
RMR Q-System Support Best Worst Best Worst
type Roof Walls Roof Walls Roof Walls Roof Walls
Bolts L=3m S=2.5m
locally None L=4m
S=1.5-2m L=4m
S=1.5-2m L=4m
S=1.5-2m None L=5m
S=1.5m L=4m
S=1.5m Mesh Occasional None Yes No NA NA NA NA
Shotcrete 50mm where
required None 50-100mm 30mm None None 90-120mm
FR 50-90mm
FR L – length; S – spacing; NA – not applicable; FR – fibre reinforced.
Two approaches can be adopted for block stability analysis: (a) specific joint method, in which the exact locations of the intersecting joints in the tunnel are taken into account, and (b) ubiquitous joint method, in which joints are assumed to occur everywhere along the tunnel.
The ubiquitous joint method was adopted for this study using UNWEDGE software code, which can analyse tetrahedral wedges formed by three intersecting joints and the free surface of the excavation, and allows identification of all possible tetrahedral wedges formed by intersecting joints. The ubiquitous joint method for block analysis was justifiable as the classification of rock mass in the tunnel using empirical methods also assumed that joints were ubiquitous.
Analysis of joint set orientation data showed that several combinations of joint sets had the potential to form tetrahedral rock blocks in the roof and walls of the tunnel. Of these, 19 different combinations had the potential to form tetrahedral rock wedges with apex height more than or equal to 1 m. Each of these 19 wedges was further analysed to compute factor of safety (FOS) against failure, taking into account the best and worst joint shear strength parameters, which represented the best and worst joint surface conditions considered for the classification of the rock mass according to RMR and Q-System. The selected joint shear strength parameters were:
Best: c=10 kPa, �=30o Worst: c=0 kPa, �=20o
Since the tunnel is shallow with an overburden of between 25 m and 50 m, it was assumed that the wedges are subjected to gravitational loading only. Table 6 shows the failure mode, maximum weight, FOS, maximum apex height and location of the 19 rock wedges.
UNWEDGE analysis was then extended to verify whether the supports predicted by the two rock
mass classification methods were adequate to stabilise the 19 theoretically possible rock wedges in the tunnel roof and walls. The analysis considered the best and worst joint shear strength scenarios mentioned earlier. Table 7 shows the FOS assuming that only the bolts recommended by the two empirical methods were installed. The rock bolts are cement grouted type with an ultimate tensile strength of 180 kN installed normal to the excavation face.
The effect of the shotcrete layers recommended by the two empirical methods was also analysed using the UNWEDGE software code, and the results (not provided here) showed that shotcrete increased the FOS of larger rock blocks beyond the desired level. (A FOS of 1.5 and 2 for the walls and roof, respectively, were selected as the design criteria for long term stability.) The recommended shotcrete layers would also provide necessary support for the smaller rock blocks and fractured ground and adequately meet the selected FOS requirement. However, there were some exceptions and limitations of the empirical predictions, which are discussed in Section 5.
4.5. Other Design Considerations Two extremely important design considerations for water tunnels are hydraulic jacking and leakage. If high pressure water tunnels are to be unlined, the existence of major discontinuities must be considered and adequate cover must be provided to prevent hydraulic jacking. Benson [13] recommends that, for tunnels positioned within slopes or valley walls, the cover must be provided by the rock portion only; the required thickness of the rock cover may be estimated using the equation:
Hr = (1.3Hw)/(�r Cos �) (3)
where Hr is required rock cover (m); Hw is static head (m); �r is density of rock (t/m3); and � (degrees) is slope angle of the ground surface.
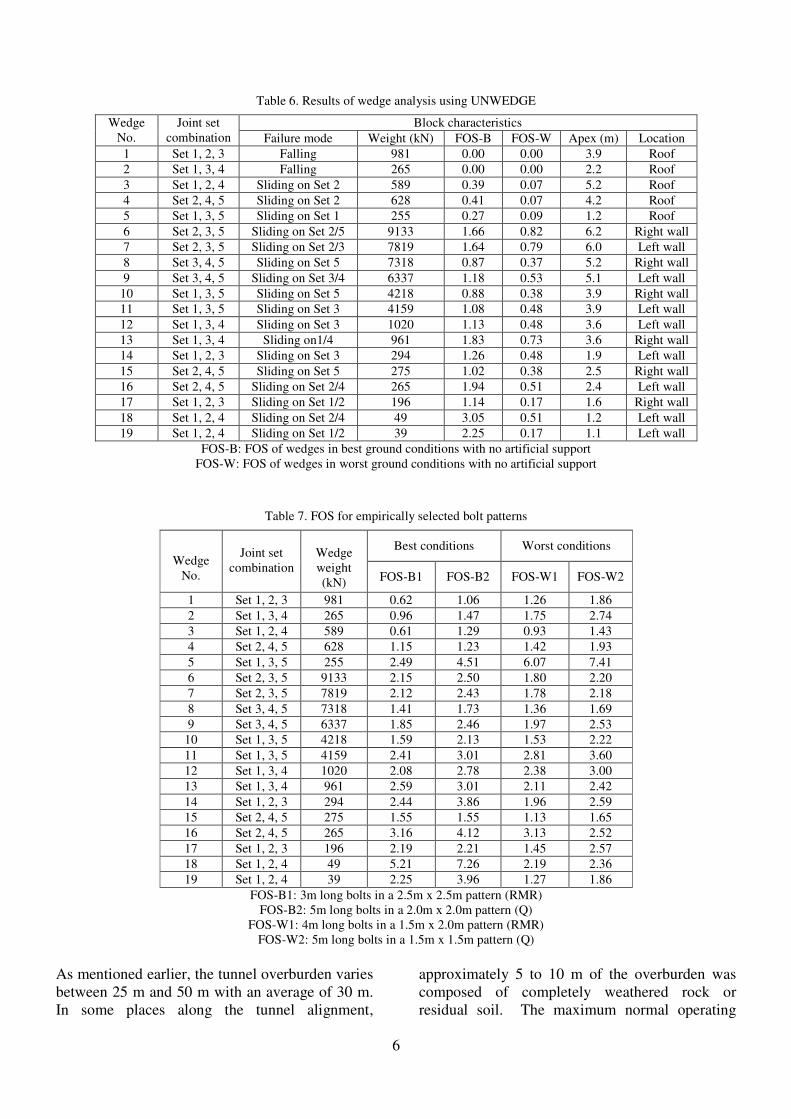
6
Table 6. Results of wedge analysis using UNWEDGE
Block characteristics Wedge No.
Joint set combination Failure mode Weight (kN) FOS-B FOS-W Apex (m) Location
1 Set 1, 2, 3 Falling 981 0.00 0.00 3.9 Roof 2 Set 1, 3, 4 Falling 265 0.00 0.00 2.2 Roof 3 Set 1, 2, 4 Sliding on Set 2 589 0.39 0.07 5.2 Roof 4 Set 2, 4, 5 Sliding on Set 2 628 0.41 0.07 4.2 Roof 5 Set 1, 3, 5 Sliding on Set 1 255 0.27 0.09 1.2 Roof 6 Set 2, 3, 5 Sliding on Set 2/5 9133 1.66 0.82 6.2 Right wall 7 Set 2, 3, 5 Sliding on Set 2/3 7819 1.64 0.79 6.0 Left wall 8 Set 3, 4, 5 Sliding on Set 5 7318 0.87 0.37 5.2 Right wall 9 Set 3, 4, 5 Sliding on Set 3/4 6337 1.18 0.53 5.1 Left wall
10 Set 1, 3, 5 Sliding on Set 5 4218 0.88 0.38 3.9 Right wall 11 Set 1, 3, 5 Sliding on Set 3 4159 1.08 0.48 3.9 Left wall 12 Set 1, 3, 4 Sliding on Set 3 1020 1.13 0.48 3.6 Left wall 13 Set 1, 3, 4 Sliding on1/4 961 1.83 0.73 3.6 Right wall 14 Set 1, 2, 3 Sliding on Set 3 294 1.26 0.48 1.9 Left wall 15 Set 2, 4, 5 Sliding on Set 5 275 1.02 0.38 2.5 Right wall 16 Set 2, 4, 5 Sliding on Set 2/4 265 1.94 0.51 2.4 Left wall 17 Set 1, 2, 3 Sliding on Set 1/2 196 1.14 0.17 1.6 Right wall 18 Set 1, 2, 4 Sliding on Set 2/4 49 3.05 0.51 1.2 Left wall 19 Set 1, 2, 4 Sliding on Set 1/2 39 2.25 0.17 1.1 Left wall
FOS-B: FOS of wedges in best ground conditions with no artificial support FOS-W: FOS of wedges in worst ground conditions with no artificial support
Table 7. FOS for empirically selected bolt patterns
Best conditions Worst conditions Wedge
No.
Joint set
combination
Wedge weight (kN) FOS-B1 FOS-B2 FOS-W1 FOS-W2
1 Set 1, 2, 3 981 0.62 1.06 1.26 1.86 2 Set 1, 3, 4 265 0.96 1.47 1.75 2.74 3 Set 1, 2, 4 589 0.61 1.29 0.93 1.43 4 Set 2, 4, 5 628 1.15 1.23 1.42 1.93 5 Set 1, 3, 5 255 2.49 4.51 6.07 7.41 6 Set 2, 3, 5 9133 2.15 2.50 1.80 2.20 7 Set 2, 3, 5 7819 2.12 2.43 1.78 2.18 8 Set 3, 4, 5 7318 1.41 1.73 1.36 1.69 9 Set 3, 4, 5 6337 1.85 2.46 1.97 2.53
10 Set 1, 3, 5 4218 1.59 2.13 1.53 2.22 11 Set 1, 3, 5 4159 2.41 3.01 2.81 3.60 12 Set 1, 3, 4 1020 2.08 2.78 2.38 3.00 13 Set 1, 3, 4 961 2.59 3.01 2.11 2.42 14 Set 1, 2, 3 294 2.44 3.86 1.96 2.59 15 Set 2, 4, 5 275 1.55 1.55 1.13 1.65 16 Set 2, 4, 5 265 3.16 4.12 3.13 2.52 17 Set 1, 2, 3 196 2.19 2.21 1.45 2.57 18 Set 1, 2, 4 49 5.21 7.26 2.19 2.36 19 Set 1, 2, 4 39 2.25 3.96 1.27 1.86
FOS-B1: 3m long bolts in a 2.5m x 2.5m pattern (RMR) FOS-B2: 5m long bolts in a 2.0m x 2.0m pattern (Q)
FOS-W1: 4m long bolts in a 1.5m x 2.0m pattern (RMR) FOS-W2: 5m long bolts in a 1.5m x 1.5m pattern (Q)
As mentioned earlier, the tunnel overburden varies between 25 m and 50 m with an average of 30 m. In some places along the tunnel alignment,
approximately 5 to 10 m of the overburden was composed of completely weathered rock or residual soil. The maximum normal operating
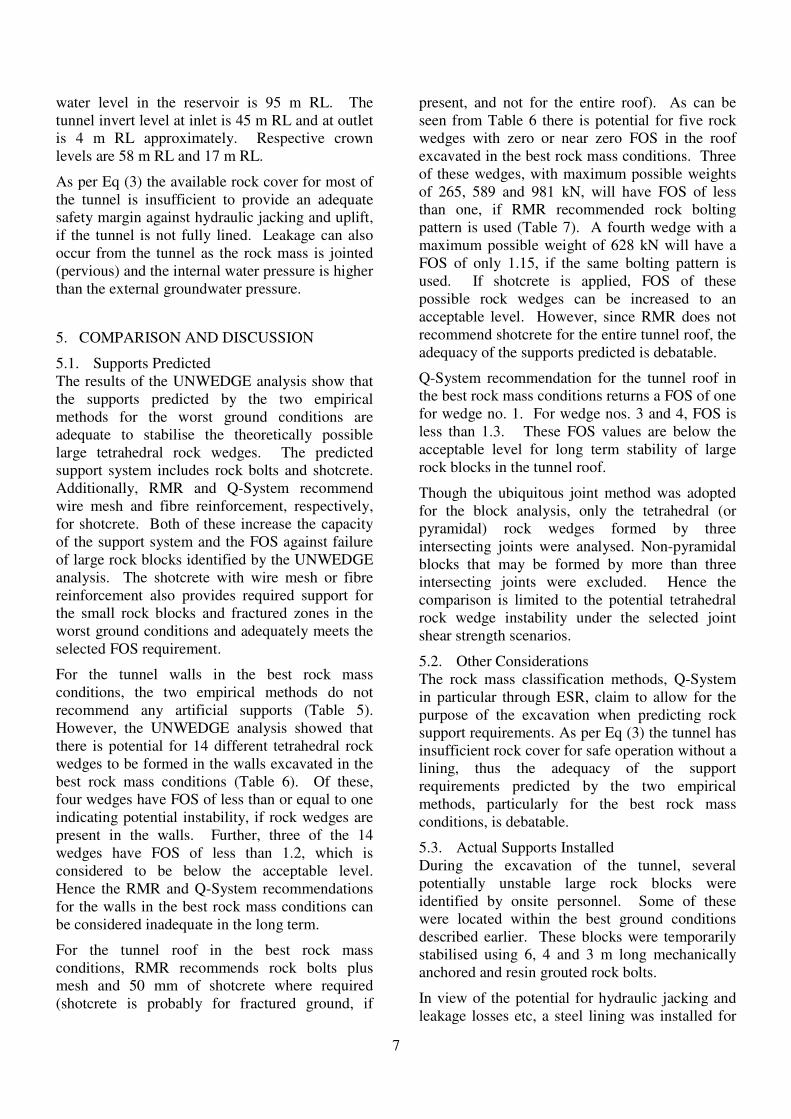
7
water level in the reservoir is 95 m RL. The tunnel invert level at inlet is 45 m RL and at outlet is 4 m RL approximately. Respective crown levels are 58 m RL and 17 m RL.
As per Eq (3) the available rock cover for most of the tunnel is insufficient to provide an adequate safety margin against hydraulic jacking and uplift, if the tunnel is not fully lined. Leakage can also occur from the tunnel as the rock mass is jointed (pervious) and the internal water pressure is higher than the external groundwater pressure.
5. COMPARISON AND DISCUSSION
5.1. Supports Predicted The results of the UNWEDGE analysis show that the supports predicted by the two empirical methods for the worst ground conditions are adequate to stabilise the theoretically possible large tetrahedral rock wedges. The predicted support system includes rock bolts and shotcrete. Additionally, RMR and Q-System recommend wire mesh and fibre reinforcement, respectively, for shotcrete. Both of these increase the capacity of the support system and the FOS against failure of large rock blocks identified by the UNWEDGE analysis. The shotcrete with wire mesh or fibre reinforcement also provides required support for the small rock blocks and fractured zones in the worst ground conditions and adequately meets the selected FOS requirement.
For the tunnel walls in the best rock mass conditions, the two empirical methods do not recommend any artificial supports (Table 5). However, the UNWEDGE analysis showed that there is potential for 14 different tetrahedral rock wedges to be formed in the walls excavated in the best rock mass conditions (Table 6). Of these, four wedges have FOS of less than or equal to one indicating potential instability, if rock wedges are present in the walls. Further, three of the 14 wedges have FOS of less than 1.2, which is considered to be below the acceptable level. Hence the RMR and Q-System recommendations for the walls in the best rock mass conditions can be considered inadequate in the long term.
For the tunnel roof in the best rock mass conditions, RMR recommends rock bolts plus mesh and 50 mm of shotcrete where required (shotcrete is probably for fractured ground, if
present, and not for the entire roof). As can be seen from Table 6 there is potential for five rock wedges with zero or near zero FOS in the roof excavated in the best rock mass conditions. Three of these wedges, with maximum possible weights of 265, 589 and 981 kN, will have FOS of less than one, if RMR recommended rock bolting pattern is used (Table 7). A fourth wedge with a maximum possible weight of 628 kN will have a FOS of only 1.15, if the same bolting pattern is used. If shotcrete is applied, FOS of these possible rock wedges can be increased to an acceptable level. However, since RMR does not recommend shotcrete for the entire tunnel roof, the adequacy of the supports predicted is debatable.
Q-System recommendation for the tunnel roof in the best rock mass conditions returns a FOS of one for wedge no. 1. For wedge nos. 3 and 4, FOS is less than 1.3. These FOS values are below the acceptable level for long term stability of large rock blocks in the tunnel roof.
Though the ubiquitous joint method was adopted for the block analysis, only the tetrahedral (or pyramidal) rock wedges formed by three intersecting joints were analysed. Non-pyramidal blocks that may be formed by more than three intersecting joints were excluded. Hence the comparison is limited to the potential tetrahedral rock wedge instability under the selected joint shear strength scenarios.
5.2. Other Considerations The rock mass classification methods, Q-System in particular through ESR, claim to allow for the purpose of the excavation when predicting rock support requirements. As per Eq (3) the tunnel has insufficient rock cover for safe operation without a lining, thus the adequacy of the support requirements predicted by the two empirical methods, particularly for the best rock mass conditions, is debatable.
5.3. Actual Supports Installed During the excavation of the tunnel, several potentially unstable large rock blocks were identified by onsite personnel. Some of these were located within the best ground conditions described earlier. These blocks were temporarily stabilised using 6, 4 and 3 m long mechanically anchored and resin grouted rock bolts.
In view of the potential for hydraulic jacking and leakage losses etc, a steel lining was installed for
8
the full length of the tunnel. The thickness of the lining varied between 25 mm and 31 mm from upstream to downstream, respectively. The annulus between the as-excavated tunnel and the lining was filled with concrete. Since the tunnel was to be lined with steel and concrete, rock bolting was kept to an absolute minimum and was used only as a temporary rock mass stabilisation measure. The tunnel was thoroughly scaled to ensure safety during construction. No shotcrete was used.
6. CONCLUSIONS
Based on detailed geotechnical mapping, RMR and Q-System were applied to a 13 m diameter hydropower tunnel. Joint orientation data were used to identify potentially unstable tetrahedral rock wedges using UNWEDGE software code. The adequacy of the support requirements predicted by RMR and Q-System was checked by wedge stability analysis considering the best and worst joint shear strength parameters.
For the worst rock mass conditions considered, the stabilisation measures predicted by RMR and Q-System are generally in agreement with the predictions made by wedge stability analysis. The wedge stability analysis showed that the empirical predictions provide adequate safety factors against tetrahedral wedge failure mechanisms identified within the worst rock mass conditions considered.
For walls in the best rock mass conditions, the two empirical methods do not recommend any artificial support. In contrast, the UNWEDGE analysis showed that rock bolts are warranted for walls in the best ground conditions. The analysis also showed that the adequacy of the RMR recommendation for the tunnel roof in the best ground condition is debatable. The Q-System recommendation for the roof in the best rock mass conditions also does not meet the design FOS selected for this study.
During the excavation, potentially unstable rock blocks were observed, and they were temporarily stabilised with mechanically anchored and resin grouted rock bolts. Considering the potential risk of hydraulic jacking and leakage losses, the tunnel was fully steel-lined and the annulus between the as-excavated tunnel and the steel lining was filled with concrete. In effect, the actual supports
installed were significantly different from the supports proposed by RMR and Q-System.
7. ACKNOWLEDGEMENT
The first author thanks the Electricity Generating Authority of Thailand for giving permission to map the tunnel as part of his postgraduate research at the Asian Institute of Technology, Thailand.
8. REFERENCES 1. Bieniawski, Z.T. (1973) Engineering classification of
jointed rock masses. Transaction of the South African Institution of Civil Engineers. 15(12), 335–344.
2. Barton, N., Lien, R. and Lunde, J. (1974) Engineering classification of rock masses for the design of rock support. Rock Mechanics. 6, pp. 189–236.
3. Bieniawski, Z.T. (1974) Geomechanics classification of rock masses and its application in tunnelling. In Proceedings of the Third International Congress on Rock Mechanism, ISRM, Denver, pp. 27–32.
4. Bieniawski, Z.T. (1976) Rock mass classification in rock engineering. In Proceedings of the Symposium on Exploration for Rock engineering, eds Z.T. Bieniawski, 97-106. AA Balkema, Rotterdam.
5. Bieniawski, Z.T. (1979) The geomechanics classification in rock engineering applications. In Proceedings of the 4th International Conference on Rock Mechanics, 2: 41-48. ISRM, Montreux.
6. Bieniawski, Z.T. (1989) Engineering rock mass classifications, John Willey & Sons, New York.
7. Grimstad, E. and Barton, N. (1993) Updating the Q-system for NMT, In Proceedings of the International Symposium on Sprayed Concrete, Norwegian Concrete Assoc, Oslo. 46-66.
8. Barton, N. and Grimstad, E. (1994) The Q-system following 20 years of application in NMT support selection, in Felsbau 12(6): 428-436.
9. Goodman and Shi (1985) Block theory and its application to rock engineering, Prentice-Hall, London.
10. Rocscience Inc. (2003) Unwedge Version 3.0, Underground Wedge Stability Analysis. www.rocscience.com, Toronto.
11. Ranasooriya, J. (1985) Design of rock support for Chiew Larn power tunnel. MSc Thesis, Asian Institute of Technology, Thailand.
12. Priest, S. D. and Hudson, J. A. (1976) Discontinuity spacing in rock, International Journal of Rock Mechanics & Mining Sciences, 13: 135-148.
13. Benson, R. P. (1989) Design of unlined tunnels. Tunnelling and Underground Space Technology, 4(2): 155-170.
����������������� ������������������� ���������������������� �����������
������������������ ������ ���������������������������� �����������������������
� �� ������������������������ ������! ��"�����������������������
��#��$ ��%������ �������������&�������&�����'���&���'�����&��(�&�)* ���� �
������� ��� ������++�����,����� �������������$ �-.�� ����� �����$ ������������$ ����+���������������$ ��� +������� � ����� /�(�� ���� )* ���� 01� � 2��� +��������� $ ���� �� +����� $ ���� ���� ������ �� ��$ ����� ������� �� ���� ���� � �� ������ ���� ������1� � 3�� ��������� �� �� +��� �$ *��� ���������� �������� ����$ ���������4�� ��������������������������$ �����+����������������� ������������������1��2�������������������������������� +�������+���������� �����"�����������+�������������� � ��� ��� '�� ���,����� ��� ��'������� ���� +���������� ����'��� ���� $ ����� ���� ��� +��"���������"����������������������$ �����+����������$ ��������������"���� ���1���� �� �� !" ��� � ��� +������� ���� � �� ������������ � ����� ���� ������ ��� ��� ����������� �4��"����� �������+����������������������������������+�5���1��2����� ������� �*,���������"���������'����������� ��� ���� +�����'�� ���� � �� ��'�������� � ������ '���� �� �4+�������� ������� ���$ ����� ����� ������������������1�� ��������������� ��$ ������������ +�������� ����������(��/6�����$ ����-78.0� ���� )* ���� � /6����� ��� ��1�� -78901� � 2��� �4+�������� ������� �'�,����� �� ���� ��������������������������� ��������'�������������������������"����"��������(��/6�����$ ����-789��-78:��-787�����-7;70�����)* ���� �/� ��� ����<�6������-77.&�����6�����<�� ��� �����-77901����3�� +���� �� ���� ��"����� ����� � ����� ��"�� ��� �������� $ ����� ��"�� '���� ������� '�� �"�����������/ +�����-77=&�� ����<�� �������-778&����� ��� ������1��=>>>&�������=>>>&�(������<�?����=>>.&� ������ <� ���� ��� �� =>>.&� ���� ���� ��� � <� 6����� =>>:01� � @ ��� �++����� �� ��� ������� ������� �� �� +������� � ����� ���� �� ������ �� +�"�� ����� ��� ��������� �� �� �� +���� ������+���������$ ���������������������� ����1��2���+�+����++�����(������)* ���� ���������$ �-.�� ����� ���������+$ ����������������� +���������� +��������� $ ���� ���� � ���� '�� ��� ����������� � ����1� 2��� ����������� � ����� ��������� ��'���� ������ /� �� ��� <� ���� -7;A0� ����� !���B� �� ��$ ���� ���� /��������� 3��1��=>>.01� � 3����������� �� ��� ���� ��+�� �� �++��� ��,������ �� +��"���� ��"���� ������� �� ��������� $ �����+�������� ���� ����� �������� ���� ���������� �� +��� �$ ���� ���������� �������� ����$ �� ���������! ��"�����B ����������� ���� ���/! B� 0�/3����� ��������� ��+�3��1��=>>901� �2������������������ �������� ����������������� +�����$ ���������� +�������������"����++��1��
�#� �" � � $%&��$� � ! ��� � &�2���-.�� ����� ������=9>�� �����������*��+����������������������������������;>�(��+$ ����������������������+���������� ���$ �?����� ���+$ �����5�������2�������1��2����������������$ ������������ �����������+�1� �2������������ ���� ��-9>���$ ������+��������->1� �2�����������������'"������������������"����'���������"�������+�����'���->��$ ��������/�$ ������ 0������'���=>�������$ ��1��2����������"��'������"�����'��$ ����=A�� �����A>�� ��'"����$ ����"����$ ��������"���������++�4�� ������.>�� 1�2��� �������$ �����"��� �����������$ ����� ������1������ ���� ������� ���� ������� ����� �������� ��������$ ��������"������! ���-.;�(�����������"�����������������C���D�(�������A-�� ��1��! ����$ �������� ����������� ��=:1A���E� .��������D������ ��>1=.1� �2������ �5�������������� /5���0�
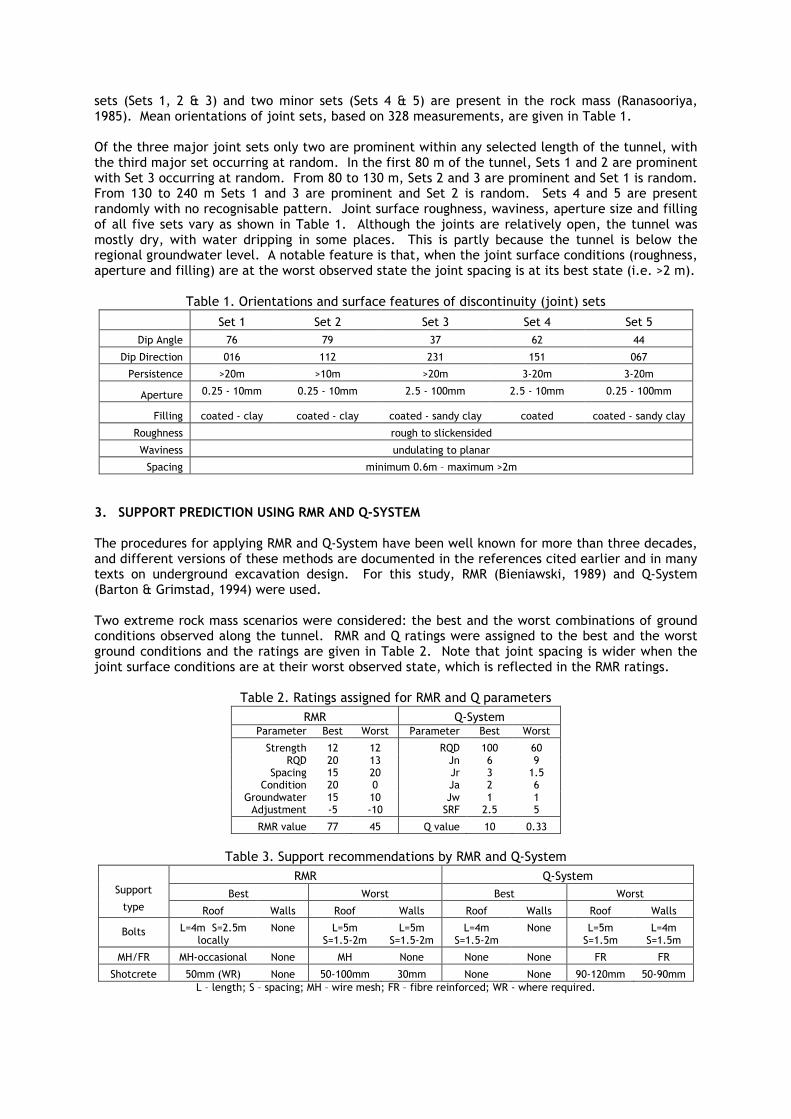
��� / ��� -�� =�<� .0� ���� �$ � � ���� ��� / ��� 9�<� A0� ���� +������ ��� ���� ���� � �� /����������-7;A01��(����������������5��������'������.=;�� ������ �����������"������2�'���-1����@ ������������� �5��5������������$ �����+�� ������$ ���������������������������������������$ ��������������� �5���������������������� 1��3�����������;>�� ��������������� ���-�����=�����+�� ������$ ���� ���.������������������ 1��F�� �;>���-.>�� �� ���=�����.�����+�� ���������� ���-�������� 1��F�� � -.>� �� =9>� � � ��� -� ���� .� ���� +�� ������ ���� ��� =� �� ����� 1� � ��� 9� ���� A� ���� +����������� ���$ �������������'���+������1����������������������$ �"������+�������������������������������"�����"�������$ �� ���2�'���-1� �������������5�������� ������"����+���������������$ ��� ���� ����� $ ���� $ ����� ���++���� ��� � �� +����1� � 2��� �� +������ '������ ���� ������� �� '��$ � �����������������$ �������"��1�������'�������������������$ ��������5�������������������/���������+������������������0������������$ ���'��"������������5����+��������������'��������/�1�1�G=�� 01��
2�'���-1�@ �������������������������������������������/5���0����
� ���-� ���=� ���.� ���9� ���A�
B�+������� 8:� 87� .8� :=� 99�
B �+�B �������� >-:� --=� =.-� -A-� >:8�
���������� G=>� � G->� � G=>� � .*=>� � .*=>� �
�+������� >1=A�*�->� � � >1=A�*�->� � � =1A�*�->>� � � =1A�*�->� � � >1=A�*�->>� � �
F������� ������*������� ������*������� ������*������������ ������ ������*�����������
������� �������������������
��"���� �������������+������
+������ � ���� �� �>1:� �H�� �4�� �� �G=� �
��'� &" (( ��(�$!���� � " &�� ) �* ��� ! + ,&-&�$* �2���+������������++�������(������)* ���� ���"��'����$ ������$ ������ ������������������������������������"������������� ������������� ��������������������������������������������� ������4�� �� ����������� �4��"����� �����1� � F�� ���� ������ �(�� /6�����$ ���� -7;70� ���� )* ���� �/6�����<�� ��� �����-7790�$ �������1���2$ ��4���� ������� ���������$ ������������%�����'�����������$ ����� '�����������������������'��"������������������1���(������)��������$ �����������������'�����������$ ��������������������������������������"������2�'���=1�����������5����+��������$ �����$ ��������5��������������������������������$ ���'��"���������$ �������������������������(��������1��
2�'���=1�������������������(������)�+���� �����
�(�� )* ���� ������ ����� 6��� ���� ����� ����� 6��� ����
�������� -=� -=� �)B� ->>� :>��)B� =>� -.� ��� :� 7�
+������ -A� =>� ��� .� -1A� ������� =>� >� ��� =� :�
� ����$ ����� -A� ->� �$ � -� -���5��� ���� *A� *->� �F� =1A� A�
�(��"����� 88� 9A� )�"����� ->� >1..�
�2�'���.1� �++������� � ��������'���(������)* ���� �
� �(�� )* ���� � �++��� 6��� ���� 6��� ����
��+�� ��� ����� ��� ����� ��� ����� ��� �����
6��� ?I9� �� I=1A� ��������
���� ?IA� �� I-1A*=� �
?IA� � I-1A*=� �
?I9� � I-1A*=� �
���� ?IA� � I-1A� �
?I9� � I-1A� �
(� EF�� (� *�������� ���� (� � ���� ���� ���� F�� F��
�������� A>� � �/��0� ���� A>*->>� � � .>� � � ���� ���� 7>*-=>� � � A>*7>� � �
?�H�������&� �H�+�����&�(� �H�$ ����� ��&�F��H���'������������&����*�$ �������,�����1�
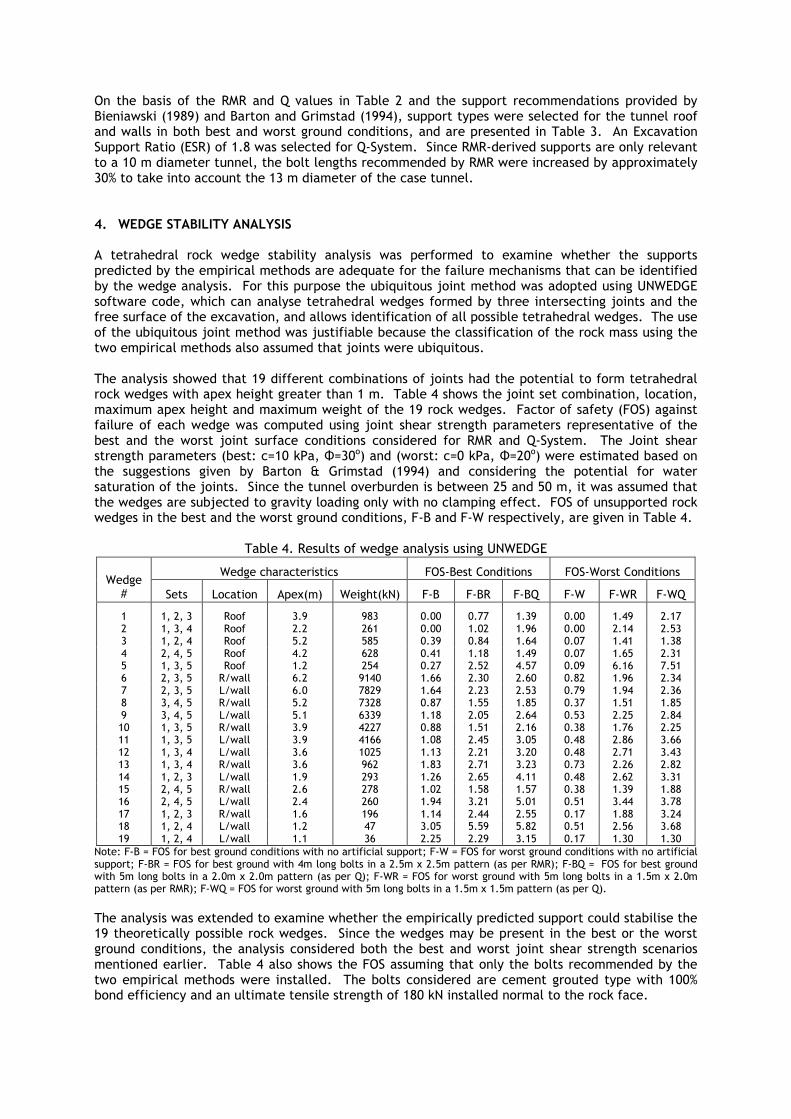
@ �� ���� '��� �� ���� �(�� ����)� "����� ��� 2�'��� =� ���� ���� �++��� ���� � �������� +�"����� '��6�����$ ���/-7;70�����6���������� ��� ����/-7790���++�����+��$ ���������������������������������$ �������'���'�������$ ��������������������������+�����������2�'���.1������4��"����� �++��������/� �0���-1;�$ �������������)* ���� 1�� ������(�*����"����++���������������"��������->�� ����� �����������������'�������������� � ������'���(��$ �������������'���++�4�� ������.>J�����������������������-.�� ����� ���������������������1���.� / $!) $&��0�%��-�� �%-&�&��� ������������ ���� $ ����� ��'������ ������� $ �� +����� ��� �� �4�� ���� $ ������� ���� �++���+���������'�������� +�������� ������������,��������������������� ������� ����������'�������������'������$ �����������1��F������+��+�������'�,�����5����� �����$ ����+���������!���B� ����$ ���������$ ����������������������������$ �������� ���'�������� ������������5�������������������������������4��"�������������$ ���������������������+�'���������������$ ����1��2�������������'�,�����5����� �����$ ��5������'���'��������������������������������� ������������$ ��� +�������� ����������� ��������5����$ �����'�,����1��2�����������$ ��������-7������������� '���������5������������+������������� �����������������$ �����$ �����+�4���������������������-�� 1��2�'���9��$ �����5��������� '����������������� �4�� �� ��+�4������������� �4�� �� �$ ������������-7�����$ ����1��F�������������/F@ 0���������������� �� ����� $ ����� $ �� �� +����� ����� 5���� ����� �������� +���� ����� ��+��������"�� �� ����'��� ���� ���� $ ��� 5���� ������� �������� ��������� ��� �(�� ���� )* ���� 1� � 2��� ����� �������������+���� �����/'��%��I->������K I.>0�����/$ ��%��I>������K I=>0�$ �������� �����'���������� �������� ��"��� '�� 6����� <� � ��� ���� /-7790� ���� ���������� ���� +�������� ��� $ ��������������������5���1�� ����������������"��'��������'��$ ����=A�����A>�� �����$ ����� ������������$ ����������'5�����������"���������������$ ���������� +����������1��F@ ������++���������$ ������������'�����������$ ������������������F*6�����F*����+����"�����������"������2�'���91��
2�'���91���������$ �����������������!���B� ��
�������������������� F@ *6��� ������� F@ *���� �������������
L� ��� ?������ �+�4/� 0� ������/��0� F*6� F*6�� F*6)� F*�� F*��� F*�)�
-� -��=��.� ��� .17� 7;.� >1>>� >188� -1.7� >1>>� -197� =1-8�=� -��.��9� ��� =1=� =:-� >1>>� -1>=� -17:� >1>>� =1-9� =1A.�.� -��=��9� ��� A1=� A;A� >1.7� >1;9� -1:9� >1>8� -19-� -1.;�9� =��9��A� ��� 91=� :=;� >19-� -1-;� -197� >1>8� -1:A� =1.-�A� -��.��A� ��� -1=� =A9� >1=8� =1A=� 91A8� >1>7� :1-:� 81A-�:� =��.��A� �E$ ���� :1=� 7-9>� -1::� =1.>� =1:>� >1;=� -17:� =1.9�8� =��.��A� ?E$ ���� :1>� 8;=7� -1:9� =1=.� =1A.� >187� -179� =1.:�;� .��9��A� �E$ ���� A1=� 8.=;� >1;8� -1AA� -1;A� >1.8� -1A-� -1;A�7� .��9��A� ?E$ ���� A1-� :..7� -1-;� =1>A� =1:9� >1A.� =1=A� =1;9�->� -��.��A� �E$ ���� .17� 9==8� >1;;� -1A-� =1-:� >1.;� -18:� =1=A�--� -��.��A� ?E$ ���� .17� 9-::� -1>;� =19A� .1>A� >19;� =1;:� .1::�-=� -��.��9� ?E$ ���� .1:� ->=A� -1-.� =1=-� .1=>� >19;� =18-� .19.�-.� -��.��9� �E$ ���� .1:� 7:=� -1;.� =18-� .1=.� >18.� =1=:� =1;=�-9� -��=��.� ?E$ ���� -17� =7.� -1=:� =1:A� 91--� >19;� =1:=� .1.-�-A� =��9��A� �E$ ���� =1:� =8;� -1>=� -1A;� -1A8� >1.;� -1.7� -1;;�-:� =��9��A� ?E$ ���� =19� =:>� -179� .1=-� A1>-� >1A-� .199� .18;�-8� -��=��.� �E$ ���� -1:� -7:� -1-9� =199� =1AA� >1-8� -1;;� .1=9�-;� -��=��9� ?E$ ���� -1=� 98� .1>A� A1A7� A1;=� >1A-� =1A:� .1:;�-7� -��=��9� ?E$ ���� -1-� .:� =1=A� =1=7� .1-A� >1-8� -1.>� -1.>�
���%�F*6�I�F@ ����'�����������������$ ������������������++��&�F*��I�F@ ����$ �����������������$ ������������������++��&�F*6��I�F@ ����'���������$ ����9� �����'��������=1A� �4�=1A� �+�������/��+����(�0&�F*6)�I��F@ ����'���������$ ����A� �����'��������=1>� �4�=1>� �+�������/��+���)0&�F*���I�F@ ����$ ���������$ ����A� �����'��������-1A� �4�=1>� �+�������/��+����(�0&�F*�)�I�F@ ����$ ���������$ ����A� �����'��������-1A� �4�-1A� �+�������/��+���)01��2����������$ ���4����������4�� ����$ ������������� +���������+����������++����������'���������-7��������������+�'�������$ ����1� � ���������$ ������ ���'��+�������������'���������$ ������������������ ����������� ���������'��� ����'��� ����$ ��� 5���� ����� �������� �������� ���������������1��2�'���9�����$ �����F@ ���� �����������������'������� � ������'�������$ ��� +������� � ����� $ ���� ��������1� �2��� '��� ������������� ��� ���� ������� ��+��$ ����->>J�'�������������������������� ���������������������-;>���������������� �����������������1��
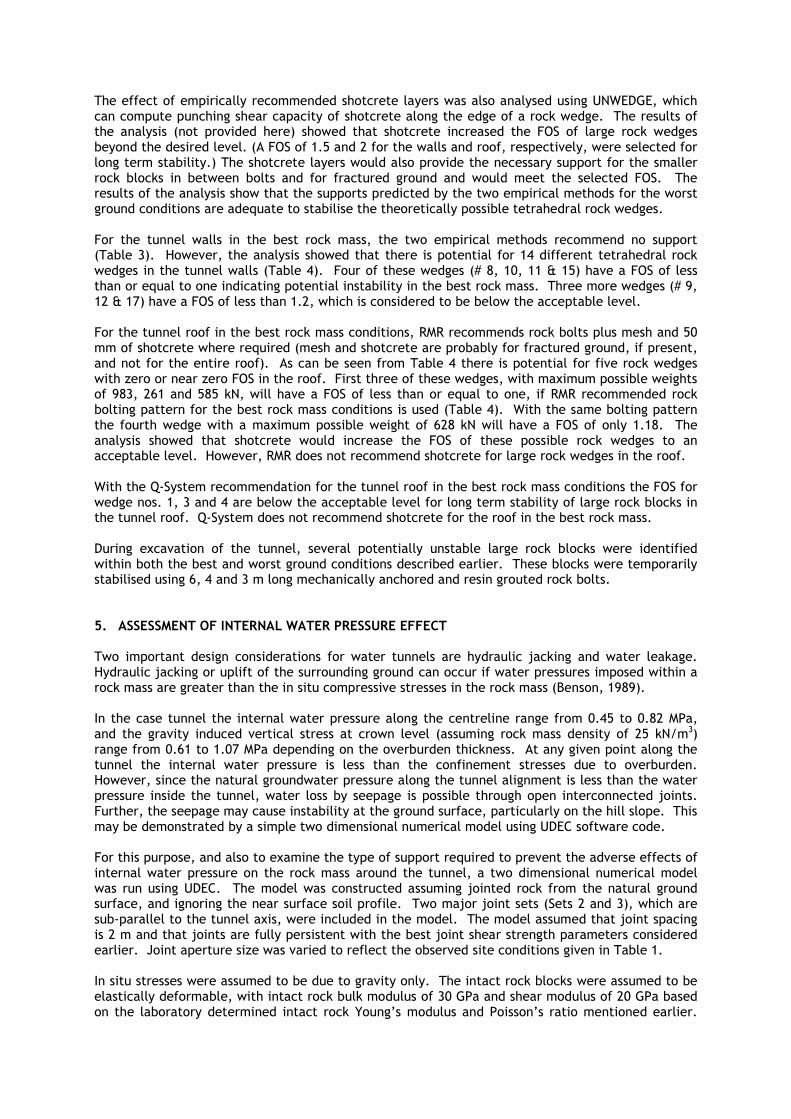
2�������������� +������������� � ��������������������$ ������������������!���B� ���$ ����������� +����+���������������+��������������������������������������$ ����1��2��������������� ������� /��� +�"����� ����0� �$ ��� ����� �������� ��������� ���� F@ � �� ������ ���� $ �����'������������������"��1�/��F@ ���-1A�����=��������$ ��������������+����"�����$ ����������������������� ���'�����10�2�����������������$ �������+�"�����������������++����������� ���������� '���� ��� '��$ ���� '��� ���� ��� ���������� ������ ���� $ ���� � ���� ���� �������� F@ 1� � 2�����������������������$ �����������++���+���������'�������$ ��� +�������� ������������$ ������������������������,���������'����������������������+�'�������������������$ ����1��F�� ���� ������� $ ���� ��� ���� '��� ���� � ��� ���� �$ � �� +������� � ����� ���� � ���� �� �++���/2�'���.01� �� $ �"����������������$ �������������� ��+�����������-9����������� ����������������$ �������������������$ ����/2�'���901��F����������$ �����/L�;��->��--�<�-A0���"����F@ ��������������,��������������������+������������'�������������'�������� �1��2������ ���$ �����/L�7��-=�<�-80���"����F@ �����������-1=��$ ������������������'��'��$ ���������+��'�����"��1����F�����������������������'�������� ������������(������ � ��������'���+���� �������A>�� � �����������$ �������,������/� �������������������+�'�'��������������������������+������������������������������01��������'��������� �2�'���9���������+�������������"������$ �����$ �������������������F@ ����������1��F�����������������$ ������$ ����� �4�� �� �+�'���$ ��������7;.��=:-�����A;A�����$ ������"����F@ ������ ������� �,���� ������ ����(�� ���� � ������ ����'������+��������������'�������� ����������������/2�'���901������������� ��'������+����������� ������ $ ����� $ ���� �� � �4�� �� � +�'��� $ ������ �� :=;� ��� $ ���� ��"�� �� F@ � �� ���� -1-;1� � 2���������� �$ ��� ����� �������� $ ���� �������� ���� F@ � �� ����� +�'��� ���� $ ����� �� �������+��'�����"��1��� $ �"�����(������������ � �������������������������$ ��������������1�������������)* ���� ����� � ��������������������������������'�������� ��������������F@ ����$ ������1�-��.�����9�����'��$ ���������+��'�����"�������������� ���'������������������'��������������������1��)* ���� ����������� � �����������������������������'�������� �1��B������ �4��"����� �� ���� �������� �"����� +���������� ����'��� ������ ���� '���� $ ���� �����������$ ������'�������'�������$ ����������������������'����������1��2����'����$ ������� +���������'�����������:��9�����.�� ������ ����������������������������������������'��1���1� �&&$&&* $� � 2�� �$�� � %/ ��$�(�$&&" �$$22$���2$ � �� +������ ������ ����������� ��� $ ����� ������� ���� ���������� 5������� ���� $ ����� �������1�� ���������5����������+���������������������������������������$ �����+�������� +���$ ������������� �������������������������������� +���"������������������� ��/6�����-7;701����3�� �������� ������� ���� ���������$ ����� +����������� ��������������� ��������� �>19A� ��>1;=�(�������� ���� ���"���� �������� "�������� ���� ��� ��$ �� ��"��� /��� ���� ���� � �� ������� �� =A� ��E� .0���������� �>1:-���-1>8�(�����+�������������"��'�������������1�����������"���+�������������������� ���� ��������� $ ����� +������ �� ��� ����� ���� ������� ���� ����� ���� �� "��'�����1��� $ �"��������������������������$ �����+���������������������������� ������������������$ �����+������ ������ ���� �������� $ ����� �� '�� ��+���� �� +�'��� �������+��� ��������������5���1��F��������������+����� ������������'���������������������������+������������������������+�1��2���� ���'����� ��������'������ +����$ ���� ���������� �������� ���������! B� ���$ �������1��F������+��+�������������4�� ����������+�����++�����,��������+��"����������"���������������������� $ ����� +������ �� ���� ���� � �� ������ ���� �������� �� �$ � ��� ������� ��� ������� � ����$ �� ���� ����� ! B� 1� � 2��� � ���� $ �� ���������� ��� ���� 5������ ���� ��� � ���� �������� ���������������������������������������������+�����1��2$ �� �5��5�������/ ���=�����.0��$ ����������'*+����������������������4���$ ��������������������� ���1��2���� ������� ��������5����+��������=�� ����������5��������������+��������$ ��������'���5�����������������+���� ���������������������1��������+�����������$ ��"��������������������'��"�����������������"������2�'���-1��3�����������$ ������� �����'�����������"�������1��2��������������'����$ ������� �����'������������������ �'����$ ���������������'����� �������.>�� ������������� �������=>�� ���'������ ���� ��'������ ������ ����� ������� ����C���D� � ��������� ���D� ����� � ���������������1��
���� �����5������� �������������������"�������;>>�(��E� �����->>�(��E� ����+����"�����$ ���������'���$ ����"����������"�����������������"����������� ���������������������������������5�����������������$ �������� �4�� �� ���+����� ����������'���1���F��������������������������+�������������������������+�������������������$ ����������$ ������������1� �2$ ����� $ ���� � ���������� ����� �����1� � ���-%� '��� ����������� +��� �� +����������� � ���������������'���������������������������*�������+����$ ����������1�� ���=%����������� +��� ��'�������������������"������������������������+���+����1��2����������� ���-�� ���������$ ����������+����$ ������������������������� ������������������������������"����������5�����+�������$ �������������'��"����$ ���������/>1=A*>1A�� � 01����2��� ��� -� � �������� ��� �$ ��� ������ ����'������ � ��� ����� ��� ���� ������ ������� /�� ���� ������+�0� $ ���� ����"��'������ �������� �� �'���.>�� � /�����"�����01� � 2���+�'��� ��+����+�������+����� ��������"�������"����������$ �����F������-������������$ �����"��'���������������'"����$ ����.=�� �/"��������������>18;�(��0��������������$ �����+��������>1:�(��1��
�F������-1�/�0���'�����$ �+�����/'0�B �+����� ����"������/�0�M�������"�����
� ���.��$ �������� �������$ �������������������+���+�������$ ����������������� "�� �����������������������1��2������ ����������������� +��� ��'�������������,��������+��"������+������� ������������������� ���� �����������������'������������������+���'"������������1����2����� +�������� ������������������������������� ����������+����������++���� ��������+������+��� �������++����������������+�����������������������������+��+���������4��"����1��F�����������)* ���� �/6�����<�� ��� �����-7790����� � �������� ��"�������'��$ ����-1:�����=1>����+���������� �++��� ��,����� ���� ��� ����+$ ��� ������1� � ����� 6�����$ ��� /-7;70� +������ ����4�� +����++�����������(����������$ �$ ������������$ �������"��'��������'��$ ����-A1.�����:-�� ��'"����$ ����"��1��2���"��'������������������������ +���'��������������������������1������� ���������������� ������ +�������� ����� ���� � ������ ����'������� ����������� ����$ ����������������� ����������� ��� ���� ������1� �F�� ����'��� ����� �� ����������� ��� ���� ����������++��������� � �������������$ ������������'����������� � ���������������1�� �������������� +��������� ����"��� �++��� ���� ��������� �� ���� ������ ��+����� $ ����� ����� �"��������� ����� ������'������ ��� ���� ������ ������1� � �++�������� �� �������� ����� ���� ������� ������� +���+���������������������"����������������������� +����������� � ���������������$ ������������������� ��� '�� ��� +���� �� ������ ��+���1� � � $ �"���� ����� �������� �� ��$ �� �� ��"�� ��� ��������+����� ������ ��� ��� '�� ���������� �4+��������� ����� � "�� ���� ����� ��� � ��� ��� �� +����������� ������ ��+���� ���� ���� ���� �� ����'������ ��� ���� ������ ������1� � 3�� $ ���� +����+� ������ ����+�'��� ��������+�������������'������+��$ ��������������������$ �������������������1���� �������������+������������������������������������5�������������������$ �������������������$ ���������������'��$ �������������������������������������$ �����������1������'������$ ����������������� +���������� ����'��������� �����1������������$ �����1��
3� � ��%" &� � &�2���$ �������'��������������$ �����������������++���� ������+���������'���(������)* ���� �+�"�������,������������������������������������$ �������������� ������� ������������$ ����������$ ������������ �����������������������1���
�F�� $ ���� ��� ���� '��� ���� � ��� ���� �$ � �� +������� � ����� �� ��� ���� � ���� ���� ������������++��1��3��������������$ �������������$ ������������'��������'��$ ������������$ �����������'�������� ���������1���� ����������������������$ ����������������������+�����+�����������������������������������5���������������� �1����� �������� ���������$ ���������"���$ ���������$ ���5�����+������������������ �����+����� ���������������������'�������������������������1��2�����+����������������������������$ ��� +�������� ����1��4� �$2$�$��$&�6�������1������ ��� ������1�/-7790�2���)*���� ����$ ����=>���������++������������(2��++���������������F��'���-=/:0��9=;*9.:�
6�������1��?������1�����?�������1�/-7890�������������������������������� �����������������������++��1������� ����:��-;7H=.:�
6������1��1�/-7;70�B���������������������1������ ��������� ���������������������� �����9/=0��-AA*-8>�
6�����$ ����N121�/-78.0���������������������������5����������� ��1�2��������������� ������������3����������� �"������������-A/-=0��..AH.99�
6�����$ ����N121�/-7890�� �� ��������������������������� �����������++��������������������1�3�%������������������������������������� ������������������� �������� ��3 �(��B��"����=8H.=�
6�����$ ����N121�/-78:0������ ��������������������������������1����� �� +�����4+�������������������������1�N121�6�����$ ��������1�1�6����� ���������6����� ����������� ��78*->:�
6�����$ ����N121�/-7870�2������ ����������������������������������������++�������1�9���3����� ���������(�����"��=��3 �(��(�����4��9-*9;�
6�����$ ����N121�/-7;70������������������ ��������������������������<� �����$ �C���
� �� �����1��1����� ����� 1�� 1�/-7;A0�6������������������++�����������������������������������*� �����?����
� ��� ������1�����6�������1�/-77.0�! +�����������)*���� �����(2���������3����� �� +��� +������ ����������$ ������ �����������@ ���9:*::�
3����� ��������� ��+�3��1�/=>>90�! ��"�����B ����������� ���� ���! ��D�� ����1�(�����+���
(��������1�����?����(1�/=>>.0� ����� �������)� ��������������������(�� ��������(�����F���������������� ����� ��������(������ �����������"�=>>.�
���� ��� ���1��(������B1�������������1�/=>>>01�2��������'������������(�� �����������! ������! �����������4��"��������� �++���B����1�� ����=>>>������+��! ��"��������(��'�����
���� ��� ���1�����6������1�/=>>:0�! ������� ����������� ������������������ �$ ����+��������������������������)*���� ��2��������������! ���������� +����2��������
�������1�/=>>>0�B����� ���������������������������������������������5���������1������������ �� ��������������=>>>�
�����������1�/-7;A0�B������������++������ ���$ �?����+$ ���������1��( ��2����������3����������2���������2��������
���������3��1�/=>>.0�� �� ����� �������!"��� �����������# ��������$� ����%�� �����$ $ $ 1��������1�� ��2����
+����� 1��1�/-77=0� �++��������������'5������������������������%����� +�������������� ����1��2��������������! ���������� +����2�������1�M��8���1�-��=A*.=�
�������� 1��������� ��� ���1�/=>>.01� ���������������2��������������������1�2��������������! ���������� +����2�������1�-;�/=>>.0�..-*.9A��
Tetrahedral Rock Wedge Stability Under Empirically Derived Support
J. Ranasooriya Department of Consumer and Employment Protection, Western Australia
H. Nikraz Curtin University of Technology, Western Australia
Abstract The support measures determined by RMR and Q rock mass classification methods were compared with a tetrahedral rock wedge stability analysis of the rock mass around two water conveyance tunnels. The study indicates that the support measures recommended by the two classification methods are generally adequate, but are insufficient to provide an adequate safety margin against some of the possible rock wedge failures under project specific conditions.
1 Introduction A common mode of instability in underground openings created in jointed rock formations is the failure of rock wedges formed by intersecting structural discontinuities in the rock and the free surface of the opening. Each wedge that fails will cause a reduction in the restraint and interlocking of the adjacent rock and this, in turn, will allow other blocks and wedges to unravel.
The design of support for eliminating rock wedge instability in a jointed rock mass may be undertaken by analytical methods such as a limit equilibrium stability analysis of tetrahedral rock wedges. This approach requires detailed information on the rock mass structure and the in situ stress conditions. The steps involved in the analytical approach are:
• Determination of orientation of major discontinuities. • Identification of wedges with kinematic feasibility to move into the opening. • Determination of shear strength of discontinuity surfaces. • Estimation of the stress field around the opening. • Assessment of likelihood of failure of the identified rock wedges. • Determination of support required to reduce the risk of failure to an acceptable level.
Alternatively, an empirical approach using rock mass classification methods such as RMR (Bieniawski, 1979 and 1989) and Q (Barton et al., 1974; Barton and Grimstad, 1994) may be used for the design of support for openings created in jointed rock formations. These methods are sometimes preferred to analytical methods, particularly if detailed information required for analytical methods is lacking. The empirical methods require no analysis of any specific failure mechanisms, yet the support measures thus designed are considered to deal with all possible failure mechanisms in a jointed rock, including tetrahedral wedge failure.
There is, however, some uncertainty in this approach due to the lack of a scientific basis for identifying potential failure mechanisms, such as tetrahedral rock wedges, and to quantify the forces required to stabilise them. One approach to confirm whether the empirically derived support measures are sufficient to stabilise the potentially unstable rock blocks is to compare them with those derived by analytical methods.
This paper presents the results of the application of RMR and Q classification methods to two tunnels driven through jointed rock formations. The two methods were applied during the construction of the tunnel by rock mass mapping and testing of intact rock specimens for engineering parameters. The support measures recommended by the two empirical methods were subsequently compared with the results of a tetrahedral rock wedge analysis undertaken using the UNWEDGE software code (Rocscience, 2003).
2 Background The two tunnels considered in this study are: (a) 493 m long, 11.3 m span horseshoe shaped Chiew Larn diversion (CLD) tunnel of the Chiew Larn hydropower project located in the Southern Province of Thailand,
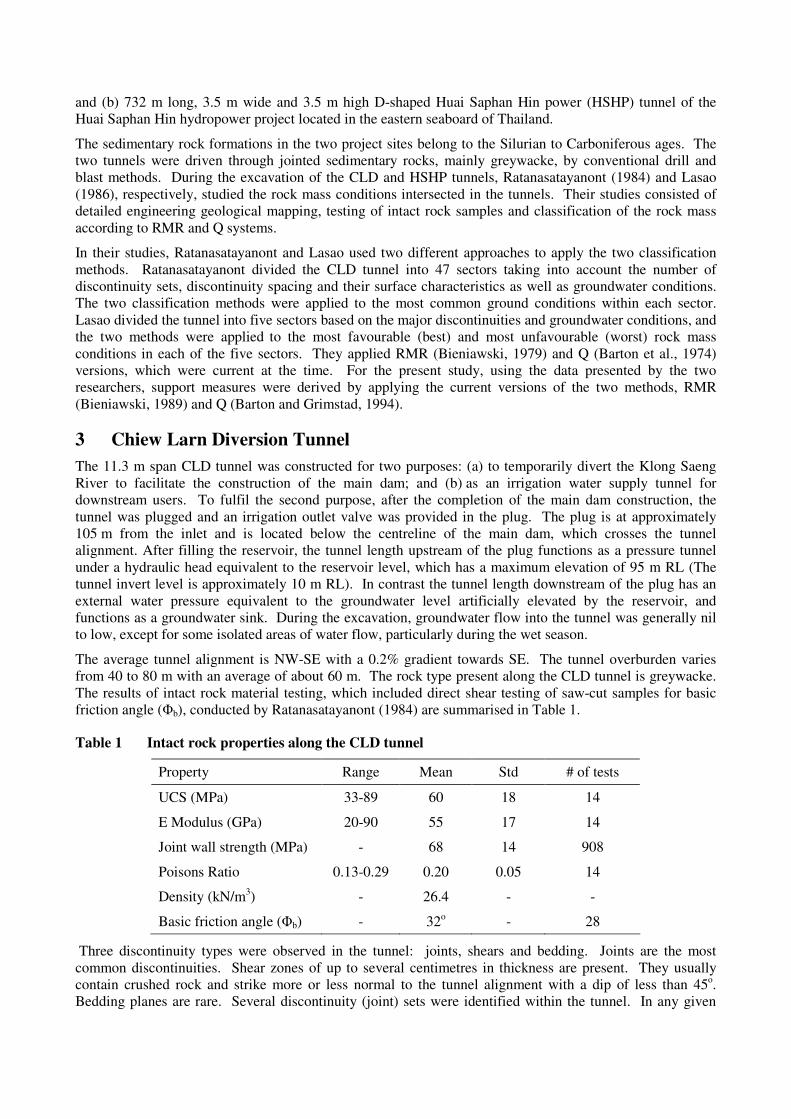
and (b) 732 m long, 3.5 m wide and 3.5 m high D-shaped Huai Saphan Hin power (HSHP) tunnel of the Huai Saphan Hin hydropower project located in the eastern seaboard of Thailand.
The sedimentary rock formations in the two project sites belong to the Silurian to Carboniferous ages. The two tunnels were driven through jointed sedimentary rocks, mainly greywacke, by conventional drill and blast methods. During the excavation of the CLD and HSHP tunnels, Ratanasatayanont (1984) and Lasao (1986), respectively, studied the rock mass conditions intersected in the tunnels. Their studies consisted of detailed engineering geological mapping, testing of intact rock samples and classification of the rock mass according to RMR and Q systems.
In their studies, Ratanasatayanont and Lasao used two different approaches to apply the two classification methods. Ratanasatayanont divided the CLD tunnel into 47 sectors taking into account the number of discontinuity sets, discontinuity spacing and their surface characteristics as well as groundwater conditions. The two classification methods were applied to the most common ground conditions within each sector. Lasao divided the tunnel into five sectors based on the major discontinuities and groundwater conditions, and the two methods were applied to the most favourable (best) and most unfavourable (worst) rock mass conditions in each of the five sectors. They applied RMR (Bieniawski, 1979) and Q (Barton et al., 1974) versions, which were current at the time. For the present study, using the data presented by the two researchers, support measures were derived by applying the current versions of the two methods, RMR (Bieniawski, 1989) and Q (Barton and Grimstad, 1994).
3 Chiew Larn Diversion Tunnel The 11.3 m span CLD tunnel was constructed for two purposes: (a) to temporarily divert the Klong Saeng River to facilitate the construction of the main dam; and (b) as an irrigation water supply tunnel for downstream users. To fulfil the second purpose, after the completion of the main dam construction, the tunnel was plugged and an irrigation outlet valve was provided in the plug. The plug is at approximately 105 m from the inlet and is located below the centreline of the main dam, which crosses the tunnel alignment. After filling the reservoir, the tunnel length upstream of the plug functions as a pressure tunnel under a hydraulic head equivalent to the reservoir level, which has a maximum elevation of 95 m RL (The tunnel invert level is approximately 10 m RL). In contrast the tunnel length downstream of the plug has an external water pressure equivalent to the groundwater level artificially elevated by the reservoir, and functions as a groundwater sink. During the excavation, groundwater flow into the tunnel was generally nil to low, except for some isolated areas of water flow, particularly during the wet season.
The average tunnel alignment is NW-SE with a 0.2% gradient towards SE. The tunnel overburden varies from 40 to 80 m with an average of about 60 m. The rock type present along the CLD tunnel is greywacke. The results of intact rock material testing, which included direct shear testing of saw-cut samples for basic friction angle (�b), conducted by Ratanasatayanont (1984) are summarised in Table 1.
Table 1 Intact rock properties along the CLD tunnel
Property Range Mean Std # of tests
UCS (MPa) 33-89 60 18 14
E Modulus (GPa) 20-90 55 17 14
Joint wall strength (MPa) - 68 14 908
Poisons Ratio 0.13-0.29 0.20 0.05 14
Density (kN/m3) - 26.4 - -
Basic friction angle (�b) - 32o - 28
Three discontinuity types were observed in the tunnel: joints, shears and bedding. Joints are the most common discontinuities. Shear zones of up to several centimetres in thickness are present. They usually contain crushed rock and strike more or less normal to the tunnel alignment with a dip of less than 45o. Bedding planes are rare. Several discontinuity (joint) sets were identified within the tunnel. In any given
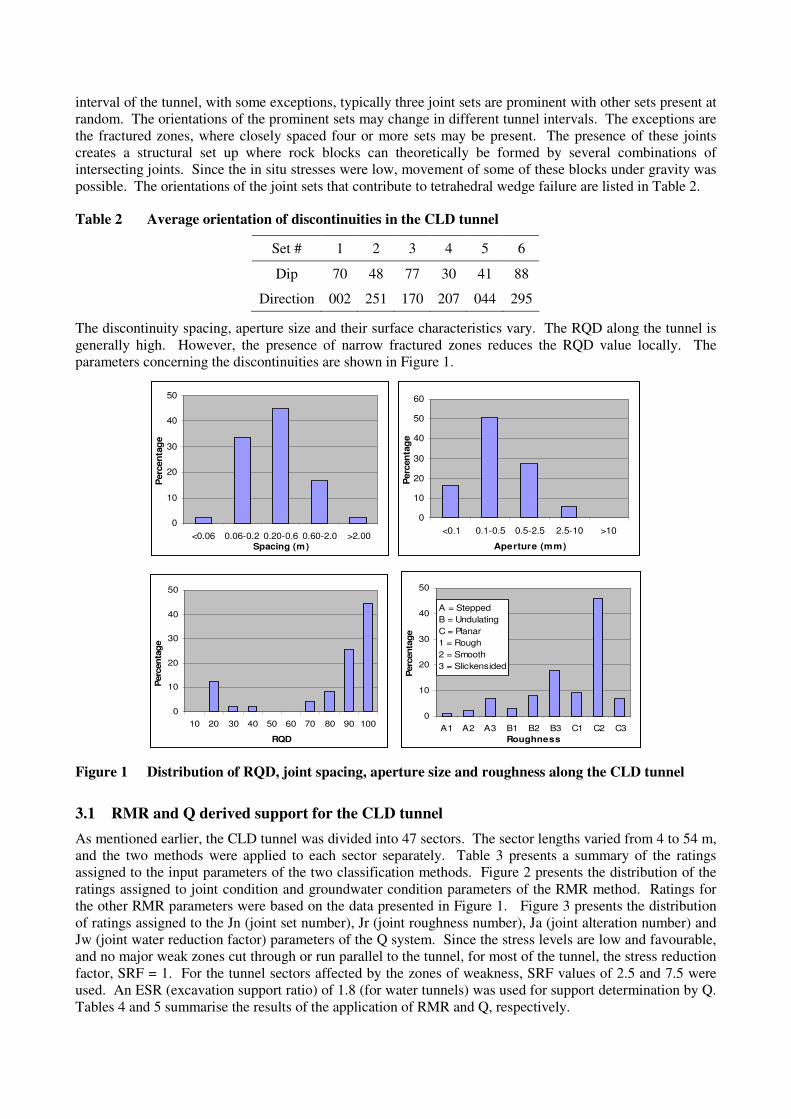
interval of the tunnel, with some exceptions, typically three joint sets are prominent with other sets present at random. The orientations of the prominent sets may change in different tunnel intervals. The exceptions are the fractured zones, where closely spaced four or more sets may be present. The presence of these joints creates a structural set up where rock blocks can theoretically be formed by several combinations of intersecting joints. Since the in situ stresses were low, movement of some of these blocks under gravity was possible. The orientations of the joint sets that contribute to tetrahedral wedge failure are listed in Table 2.
Table 2 Average orientation of discontinuities in the CLD tunnel
Set # 1 2 3 4 5 6
Dip 70 48 77 30 41 88
Direction 002 251 170 207 044 295
The discontinuity spacing, aperture size and their surface characteristics vary. The RQD along the tunnel is generally high. However, the presence of narrow fractured zones reduces the RQD value locally. The parameters concerning the discontinuities are shown in Figure 1.
0
10
20
30
40
50
<0.06 0.06-0.2 0.20-0.6 0.60-2.0 >2.00Spacing (m)
Per
cent
age
0
10
20
30
40
50
60
<0.1 0.1-0.5 0.5-2.5 2.5-10 >10
Aperture (mm)
Per
cen
tag
e
0
10
20
30
40
50
10 20 30 40 50 60 70 80 90 100
RQD
Per
cen
tag
e
A = Stepped B = Undulating C = Planar 1 = Rough 2 = Smooth 3 = Slickensided
0
10
20
30
40
50
A1 A2 A3 B1 B2 B3 C1 C2 C3Roughness
Per
cen
tag
e
Figure 1 Distribution of RQD, joint spacing, aperture size and roughness along the CLD tunnel
3.1 RMR and Q derived support for the CLD tunnel As mentioned earlier, the CLD tunnel was divided into 47 sectors. The sector lengths varied from 4 to 54 m, and the two methods were applied to each sector separately. Table 3 presents a summary of the ratings assigned to the input parameters of the two classification methods. Figure 2 presents the distribution of the ratings assigned to joint condition and groundwater condition parameters of the RMR method. Ratings for the other RMR parameters were based on the data presented in Figure 1. Figure 3 presents the distribution of ratings assigned to the Jn (joint set number), Jr (joint roughness number), Ja (joint alteration number) and Jw (joint water reduction factor) parameters of the Q system. Since the stress levels are low and favourable, and no major weak zones cut through or run parallel to the tunnel, for most of the tunnel, the stress reduction factor, SRF = 1. For the tunnel sectors affected by the zones of weakness, SRF values of 2.5 and 7.5 were used. An ESR (excavation support ratio) of 1.8 (for water tunnels) was used for support determination by Q. Tables 4 and 5 summarise the results of the application of RMR and Q, respectively.
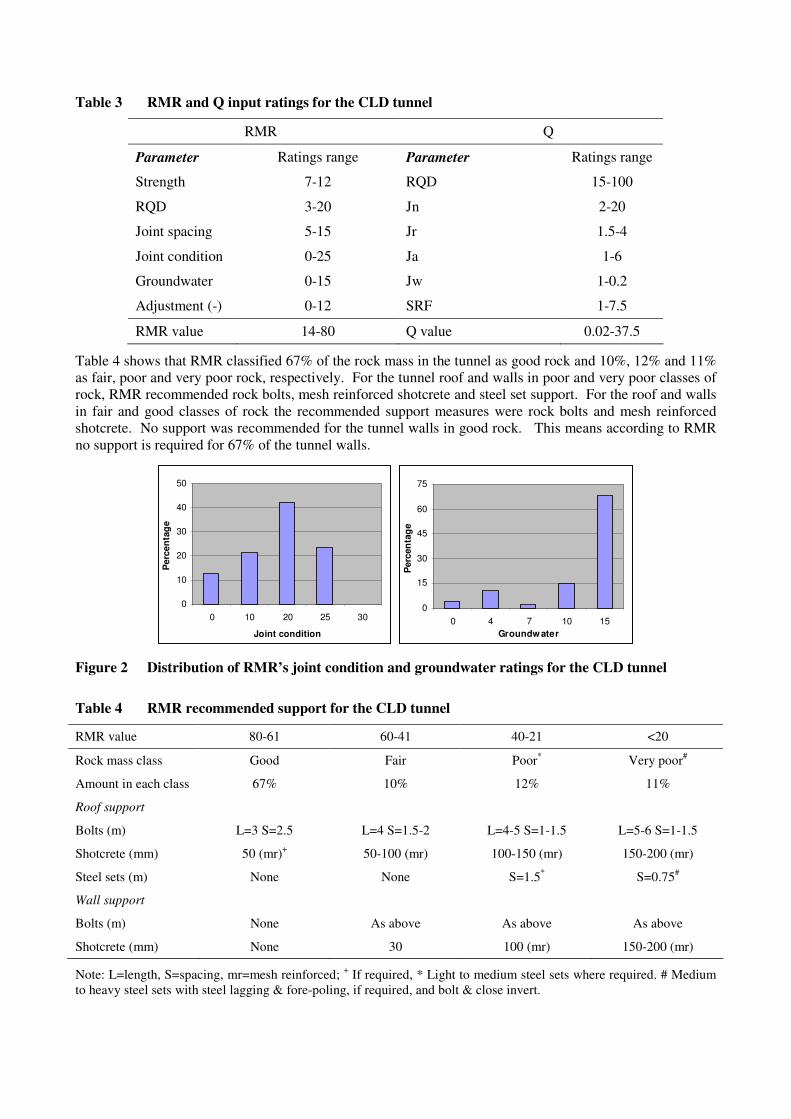
Table 3 RMR and Q input ratings for the CLD tunnel
RMR Q
Parameter Ratings range Parameter Ratings range
Strength 7-12 RQD 15-100
RQD 3-20 Jn 2-20
Joint spacing 5-15 Jr 1.5-4
Joint condition 0-25 Ja 1-6
Groundwater 0-15 Jw 1-0.2
Adjustment (-) 0-12 SRF 1-7.5
RMR value 14-80 Q value 0.02-37.5
Table 4 shows that RMR classified 67% of the rock mass in the tunnel as good rock and 10%, 12% and 11% as fair, poor and very poor rock, respectively. For the tunnel roof and walls in poor and very poor classes of rock, RMR recommended rock bolts, mesh reinforced shotcrete and steel set support. For the roof and walls in fair and good classes of rock the recommended support measures were rock bolts and mesh reinforced shotcrete. No support was recommended for the tunnel walls in good rock. This means according to RMR no support is required for 67% of the tunnel walls.
0
10
20
30
40
50
0 10 20 25 30
Joint condition
Per
cen
tag
e
0
15
30
45
60
75
0 4 7 10 15Groundw ater
Per
cen
tag
e
Figure 2 Distribution of RMR’s joint condition and groundwater ratings for the CLD tunnel
Table 4 RMR recommended support for the CLD tunnel
RMR value 80-61 60-41 40-21 <20
Rock mass class Good Fair Poor* Very poor#
Amount in each class 67% 10% 12% 11%
Roof support
Bolts (m) L=3 S=2.5 L=4 S=1.5-2 L=4-5 S=1-1.5 L=5-6 S=1-1.5
Shotcrete (mm) 50 (mr)+ 50-100 (mr) 100-150 (mr) 150-200 (mr)
Steel sets (m) None None S=1.5* S=0.75#
Wall support
Bolts (m) None As above As above As above
Shotcrete (mm) None 30 100 (mr) 150-200 (mr)
Note: L=length, S=spacing, mr=mesh reinforced; + If required, * Light to medium steel sets where required. # Medium to heavy steel sets with steel lagging & fore-poling, if required, and bolt & close invert.
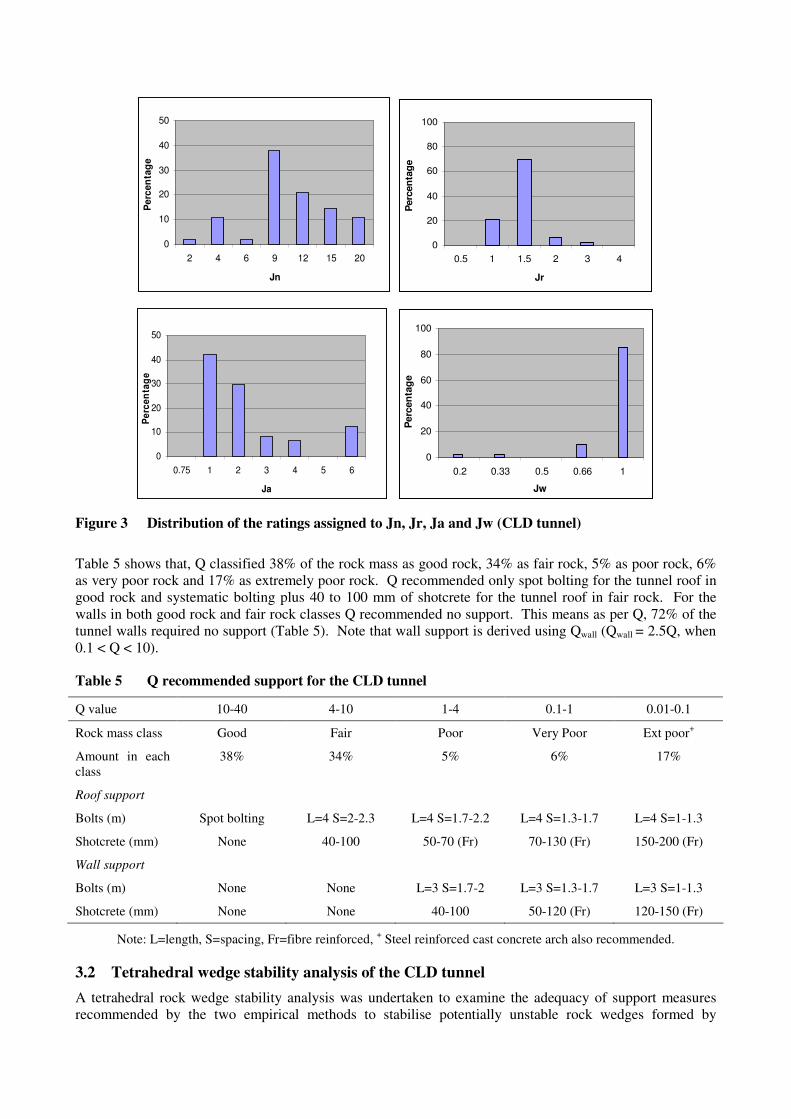
0
10
20
30
40
50
2 4 6 9 12 15 20
Jn
Per
cen
tag
e
0
20
40
60
80
100
0.5 1 1.5 2 3 4
Jr
Per
cen
tag
e
0
10
20
30
40
50
0.75 1 2 3 4 5 6
Ja
Per
cen
tag
e
0
20
40
60
80
100
0.2 0.33 0.5 0.66 1
Jw
Per
cen
tag
e
Figure 3 Distribution of the ratings assigned to Jn, Jr, Ja and Jw (CLD tunnel)
Table 5 shows that, Q classified 38% of the rock mass as good rock, 34% as fair rock, 5% as poor rock, 6% as very poor rock and 17% as extremely poor rock. Q recommended only spot bolting for the tunnel roof in good rock and systematic bolting plus 40 to 100 mm of shotcrete for the tunnel roof in fair rock. For the walls in both good rock and fair rock classes Q recommended no support. This means as per Q, 72% of the tunnel walls required no support (Table 5). Note that wall support is derived using Qwall (Qwall = 2.5Q, when 0.1 < Q < 10).
Table 5 Q recommended support for the CLD tunnel
Q value 10-40 4-10 1-4 0.1-1 0.01-0.1
Rock mass class Good Fair Poor Very Poor Ext poor+
Amount in each class
38% 34% 5% 6% 17%
Roof support
Bolts (m) Spot bolting L=4 S=2-2.3 L=4 S=1.7-2.2 L=4 S=1.3-1.7 L=4 S=1-1.3
Shotcrete (mm) None 40-100 50-70 (Fr) 70-130 (Fr) 150-200 (Fr)
Wall support
Bolts (m) None None L=3 S=1.7-2 L=3 S=1.3-1.7 L=3 S=1-1.3
Shotcrete (mm) None None 40-100 50-120 (Fr) 120-150 (Fr)
Note: L=length, S=spacing, Fr=fibre reinforced, + Steel reinforced cast concrete arch also recommended.
3.2 Tetrahedral wedge stability analysis of the CLD tunnel A tetrahedral rock wedge stability analysis was undertaken to examine the adequacy of support measures recommended by the two empirical methods to stabilise potentially unstable rock wedges formed by
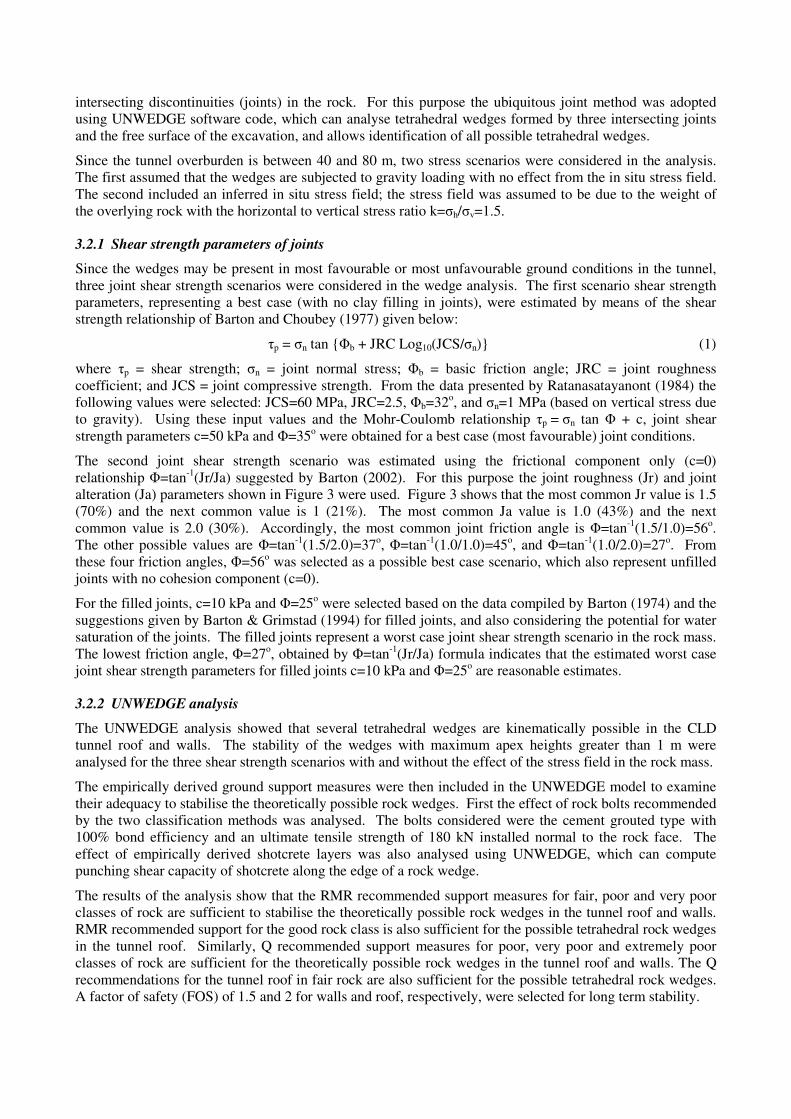
intersecting discontinuities (joints) in the rock. For this purpose the ubiquitous joint method was adopted using UNWEDGE software code, which can analyse tetrahedral wedges formed by three intersecting joints and the free surface of the excavation, and allows identification of all possible tetrahedral wedges.
Since the tunnel overburden is between 40 and 80 m, two stress scenarios were considered in the analysis. The first assumed that the wedges are subjected to gravity loading with no effect from the in situ stress field. The second included an inferred in situ stress field; the stress field was assumed to be due to the weight of the overlying rock with the horizontal to vertical stress ratio k=�h/�v=1.5.
3.2.1 Shear strength parameters of joints
Since the wedges may be present in most favourable or most unfavourable ground conditions in the tunnel, three joint shear strength scenarios were considered in the wedge analysis. The first scenario shear strength parameters, representing a best case (with no clay filling in joints), were estimated by means of the shear strength relationship of Barton and Choubey (1977) given below:
�p = �n tan {�b + JRC Log10(JCS/�n)} (1)
where �p = shear strength; �n = joint normal stress; �b = basic friction angle; JRC = joint roughness coefficient; and JCS = joint compressive strength. From the data presented by Ratanasatayanont (1984) the following values were selected: JCS=60 MPa, JRC=2.5, �b=32o, and �n=1 MPa (based on vertical stress due to gravity). Using these input values and the Mohr-Coulomb relationship �p = �n tan � + c, joint shear strength parameters c=50 kPa and �=35o were obtained for a best case (most favourable) joint conditions.
The second joint shear strength scenario was estimated using the frictional component only (c=0) relationship �=tan-1(Jr/Ja) suggested by Barton (2002). For this purpose the joint roughness (Jr) and joint alteration (Ja) parameters shown in Figure 3 were used. Figure 3 shows that the most common Jr value is 1.5 (70%) and the next common value is 1 (21%). The most common Ja value is 1.0 (43%) and the next common value is 2.0 (30%). Accordingly, the most common joint friction angle is �=tan-1(1.5/1.0)=56o. The other possible values are �=tan-1(1.5/2.0)=37o, �=tan-1(1.0/1.0)=45o, and �=tan-1(1.0/2.0)=27o. From these four friction angles, �=56o was selected as a possible best case scenario, which also represent unfilled joints with no cohesion component (c=0).
For the filled joints, c=10 kPa and �=25o were selected based on the data compiled by Barton (1974) and the suggestions given by Barton & Grimstad (1994) for filled joints, and also considering the potential for water saturation of the joints. The filled joints represent a worst case joint shear strength scenario in the rock mass. The lowest friction angle, �=27o, obtained by �=tan-1(Jr/Ja) formula indicates that the estimated worst case joint shear strength parameters for filled joints c=10 kPa and �=25o are reasonable estimates.
3.2.2 UNWEDGE analysis
The UNWEDGE analysis showed that several tetrahedral wedges are kinematically possible in the CLD tunnel roof and walls. The stability of the wedges with maximum apex heights greater than 1 m were analysed for the three shear strength scenarios with and without the effect of the stress field in the rock mass.
The empirically derived ground support measures were then included in the UNWEDGE model to examine their adequacy to stabilise the theoretically possible rock wedges. First the effect of rock bolts recommended by the two classification methods was analysed. The bolts considered were the cement grouted type with 100% bond efficiency and an ultimate tensile strength of 180 kN installed normal to the rock face. The effect of empirically derived shotcrete layers was also analysed using UNWEDGE, which can compute punching shear capacity of shotcrete along the edge of a rock wedge.
The results of the analysis show that the RMR recommended support measures for fair, poor and very poor classes of rock are sufficient to stabilise the theoretically possible rock wedges in the tunnel roof and walls. RMR recommended support for the good rock class is also sufficient for the possible tetrahedral rock wedges in the tunnel roof. Similarly, Q recommended support measures for poor, very poor and extremely poor classes of rock are sufficient for the theoretically possible rock wedges in the tunnel roof and walls. The Q recommendations for the tunnel roof in fair rock are also sufficient for the possible tetrahedral rock wedges. A factor of safety (FOS) of 1.5 and 2 for walls and roof, respectively, were selected for long term stability.
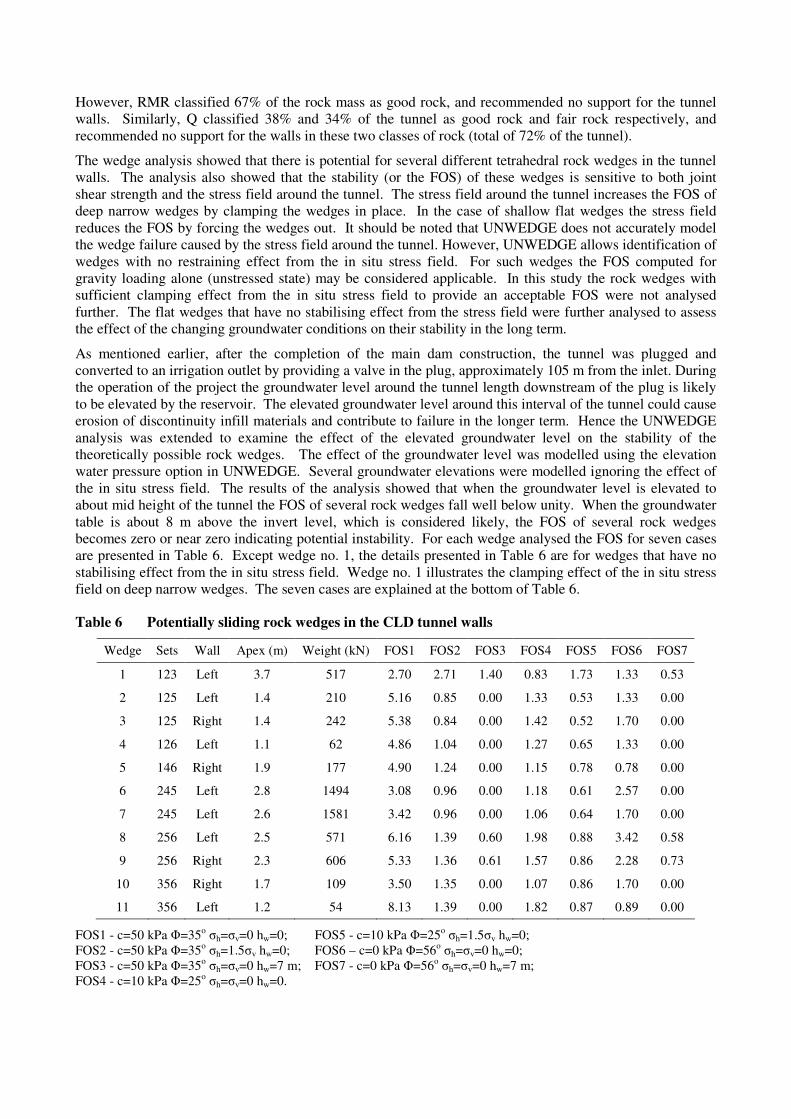
However, RMR classified 67% of the rock mass as good rock, and recommended no support for the tunnel walls. Similarly, Q classified 38% and 34% of the tunnel as good rock and fair rock respectively, and recommended no support for the walls in these two classes of rock (total of 72% of the tunnel).
The wedge analysis showed that there is potential for several different tetrahedral rock wedges in the tunnel walls. The analysis also showed that the stability (or the FOS) of these wedges is sensitive to both joint shear strength and the stress field around the tunnel. The stress field around the tunnel increases the FOS of deep narrow wedges by clamping the wedges in place. In the case of shallow flat wedges the stress field reduces the FOS by forcing the wedges out. It should be noted that UNWEDGE does not accurately model the wedge failure caused by the stress field around the tunnel. However, UNWEDGE allows identification of wedges with no restraining effect from the in situ stress field. For such wedges the FOS computed for gravity loading alone (unstressed state) may be considered applicable. In this study the rock wedges with sufficient clamping effect from the in situ stress field to provide an acceptable FOS were not analysed further. The flat wedges that have no stabilising effect from the stress field were further analysed to assess the effect of the changing groundwater conditions on their stability in the long term.
As mentioned earlier, after the completion of the main dam construction, the tunnel was plugged and converted to an irrigation outlet by providing a valve in the plug, approximately 105 m from the inlet. During the operation of the project the groundwater level around the tunnel length downstream of the plug is likely to be elevated by the reservoir. The elevated groundwater level around this interval of the tunnel could cause erosion of discontinuity infill materials and contribute to failure in the longer term. Hence the UNWEDGE analysis was extended to examine the effect of the elevated groundwater level on the stability of the theoretically possible rock wedges. The effect of the groundwater level was modelled using the elevation water pressure option in UNWEDGE. Several groundwater elevations were modelled ignoring the effect of the in situ stress field. The results of the analysis showed that when the groundwater level is elevated to about mid height of the tunnel the FOS of several rock wedges fall well below unity. When the groundwater table is about 8 m above the invert level, which is considered likely, the FOS of several rock wedges becomes zero or near zero indicating potential instability. For each wedge analysed the FOS for seven cases are presented in Table 6. Except wedge no. 1, the details presented in Table 6 are for wedges that have no stabilising effect from the in situ stress field. Wedge no. 1 illustrates the clamping effect of the in situ stress field on deep narrow wedges. The seven cases are explained at the bottom of Table 6.
Table 6 Potentially sliding rock wedges in the CLD tunnel walls
Wedge Sets Wall Apex (m) Weight (kN) FOS1 FOS2 FOS3 FOS4 FOS5 FOS6 FOS7
1 123 Left 3.7 517 2.70 2.71 1.40 0.83 1.73 1.33 0.53
2 125 Left 1.4 210 5.16 0.85 0.00 1.33 0.53 1.33 0.00
3 125 Right 1.4 242 5.38 0.84 0.00 1.42 0.52 1.70 0.00
4 126 Left 1.1 62 4.86 1.04 0.00 1.27 0.65 1.33 0.00
5 146 Right 1.9 177 4.90 1.24 0.00 1.15 0.78 0.78 0.00
6 245 Left 2.8 1494 3.08 0.96 0.00 1.18 0.61 2.57 0.00
7 245 Left 2.6 1581 3.42 0.96 0.00 1.06 0.64 1.70 0.00
8 256 Left 2.5 571 6.16 1.39 0.60 1.98 0.88 3.42 0.58
9 256 Right 2.3 606 5.33 1.36 0.61 1.57 0.86 2.28 0.73
10 356 Right 1.7 109 3.50 1.35 0.00 1.07 0.86 1.70 0.00
11 356 Left 1.2 54 8.13 1.39 0.00 1.82 0.87 0.89 0.00
FOS1 - c=50 kPa �=35o �h=�v=0 hw=0; FOS5 - c=10 kPa �=25o �h=1.5�v hw=0; FOS2 - c=50 kPa �=35o �h=1.5�v hw=0; FOS6 – c=0 kPa �=56o �h=�v=0 hw=0; FOS3 - c=50 kPa �=35o �h=�v=0 hw=7 m; FOS7 - c=0 kPa �=56o �h=�v=0 hw=7 m; FOS4 - c=10 kPa �=25o �h=�v=0 hw=0.
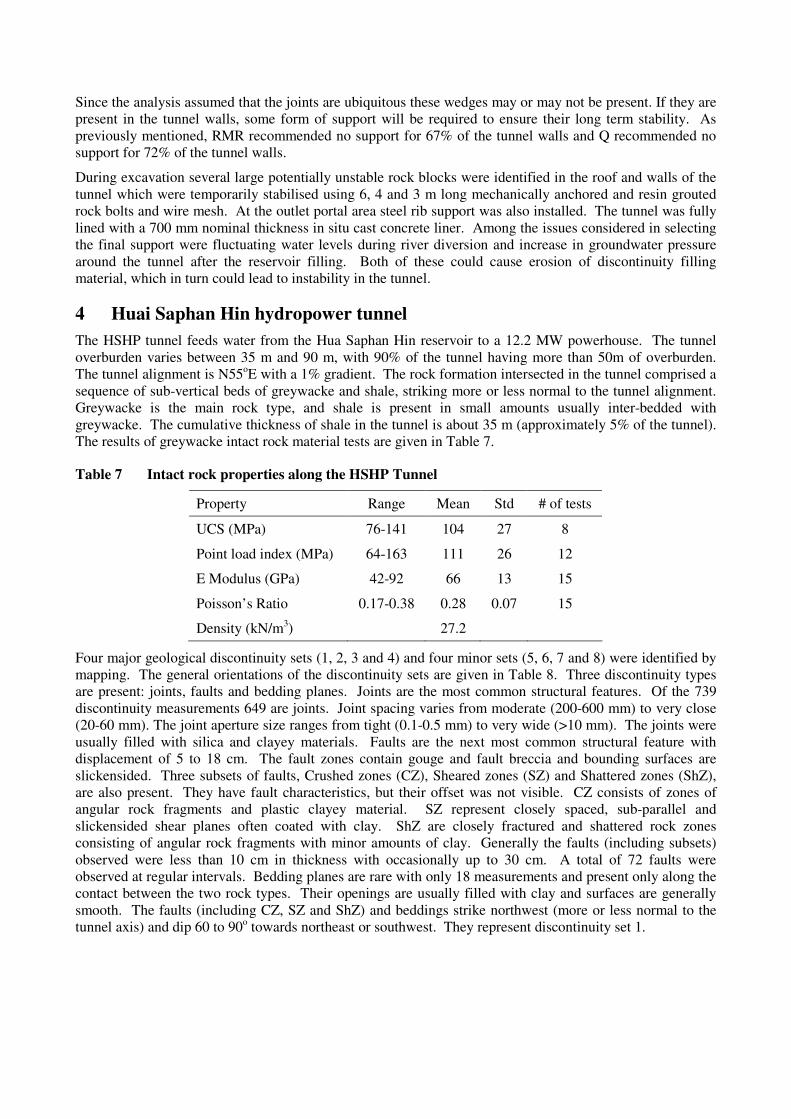
Since the analysis assumed that the joints are ubiquitous these wedges may or may not be present. If they are present in the tunnel walls, some form of support will be required to ensure their long term stability. As previously mentioned, RMR recommended no support for 67% of the tunnel walls and Q recommended no support for 72% of the tunnel walls.
During excavation several large potentially unstable rock blocks were identified in the roof and walls of the tunnel which were temporarily stabilised using 6, 4 and 3 m long mechanically anchored and resin grouted rock bolts and wire mesh. At the outlet portal area steel rib support was also installed. The tunnel was fully lined with a 700 mm nominal thickness in situ cast concrete liner. Among the issues considered in selecting the final support were fluctuating water levels during river diversion and increase in groundwater pressure around the tunnel after the reservoir filling. Both of these could cause erosion of discontinuity filling material, which in turn could lead to instability in the tunnel.
4 Huai Saphan Hin hydropower tunnel The HSHP tunnel feeds water from the Hua Saphan Hin reservoir to a 12.2 MW powerhouse. The tunnel overburden varies between 35 m and 90 m, with 90% of the tunnel having more than 50m of overburden. The tunnel alignment is N55oE with a 1% gradient. The rock formation intersected in the tunnel comprised a sequence of sub-vertical beds of greywacke and shale, striking more or less normal to the tunnel alignment. Greywacke is the main rock type, and shale is present in small amounts usually inter-bedded with greywacke. The cumulative thickness of shale in the tunnel is about 35 m (approximately 5% of the tunnel). The results of greywacke intact rock material tests are given in Table 7.
Table 7 Intact rock properties along the HSHP Tunnel
Property Range Mean Std # of tests
UCS (MPa) 76-141 104 27 8
Point load index (MPa) 64-163 111 26 12
E Modulus (GPa) 42-92 66 13 15
Poisson’s Ratio 0.17-0.38 0.28 0.07 15
Density (kN/m3) 27.2
Four major geological discontinuity sets (1, 2, 3 and 4) and four minor sets (5, 6, 7 and 8) were identified by mapping. The general orientations of the discontinuity sets are given in Table 8. Three discontinuity types are present: joints, faults and bedding planes. Joints are the most common structural features. Of the 739 discontinuity measurements 649 are joints. Joint spacing varies from moderate (200-600 mm) to very close (20-60 mm). The joint aperture size ranges from tight (0.1-0.5 mm) to very wide (>10 mm). The joints were usually filled with silica and clayey materials. Faults are the next most common structural feature with displacement of 5 to 18 cm. The fault zones contain gouge and fault breccia and bounding surfaces are slickensided. Three subsets of faults, Crushed zones (CZ), Sheared zones (SZ) and Shattered zones (ShZ), are also present. They have fault characteristics, but their offset was not visible. CZ consists of zones of angular rock fragments and plastic clayey material. SZ represent closely spaced, sub-parallel and slickensided shear planes often coated with clay. ShZ are closely fractured and shattered rock zones consisting of angular rock fragments with minor amounts of clay. Generally the faults (including subsets) observed were less than 10 cm in thickness with occasionally up to 30 cm. A total of 72 faults were observed at regular intervals. Bedding planes are rare with only 18 measurements and present only along the contact between the two rock types. Their openings are usually filled with clay and surfaces are generally smooth. The faults (including CZ, SZ and ShZ) and beddings strike northwest (more or less normal to the tunnel axis) and dip 60 to 90o towards northeast or southwest. They represent discontinuity set 1.
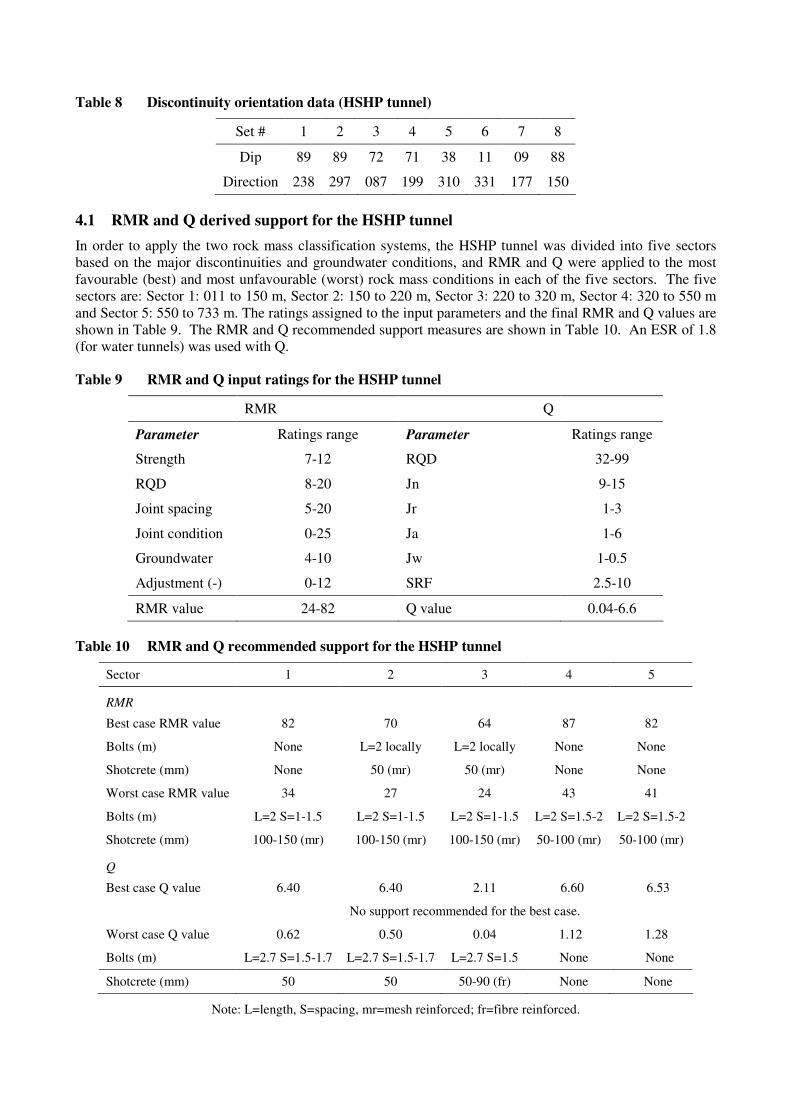
Table 8 Discontinuity orientation data (HSHP tunnel)
Set # 1 2 3 4 5 6 7 8
Dip 89 89 72 71 38 11 09 88
Direction 238 297 087 199 310 331 177 150
4.1 RMR and Q derived support for the HSHP tunnel In order to apply the two rock mass classification systems, the HSHP tunnel was divided into five sectors based on the major discontinuities and groundwater conditions, and RMR and Q were applied to the most favourable (best) and most unfavourable (worst) rock mass conditions in each of the five sectors. The five sectors are: Sector 1: 011 to 150 m, Sector 2: 150 to 220 m, Sector 3: 220 to 320 m, Sector 4: 320 to 550 m and Sector 5: 550 to 733 m. The ratings assigned to the input parameters and the final RMR and Q values are shown in Table 9. The RMR and Q recommended support measures are shown in Table 10. An ESR of 1.8 (for water tunnels) was used with Q.
Table 9 RMR and Q input ratings for the HSHP tunnel
RMR Q
Parameter Ratings range Parameter Ratings range
Strength 7-12 RQD 32-99
RQD 8-20 Jn 9-15
Joint spacing 5-20 Jr 1-3
Joint condition 0-25 Ja 1-6
Groundwater 4-10 Jw 1-0.5
Adjustment (-) 0-12 SRF 2.5-10
RMR value 24-82 Q value 0.04-6.6
Table 10 RMR and Q recommended support for the HSHP tunnel
Sector 1 2 3 4 5
RMR Best case RMR value 82 70 64 87 82
Bolts (m) None L=2 locally L=2 locally None None
Shotcrete (mm) None 50 (mr) 50 (mr) None None
Worst case RMR value 34 27 24 43 41
Bolts (m) L=2 S=1-1.5 L=2 S=1-1.5 L=2 S=1-1.5 L=2 S=1.5-2 L=2 S=1.5-2
Shotcrete (mm) 100-150 (mr) 100-150 (mr) 100-150 (mr) 50-100 (mr) 50-100 (mr)
Q Best case Q value 6.40 6.40 2.11 6.60 6.53
No support recommended for the best case.
Worst case Q value 0.62 0.50 0.04 1.12 1.28
Bolts (m) L=2.7 S=1.5-1.7 L=2.7 S=1.5-1.7 L=2.7 S=1.5 None None
Shotcrete (mm) 50 50 50-90 (fr) None None
Note: L=length, S=spacing, mr=mesh reinforced; fr=fibre reinforced.
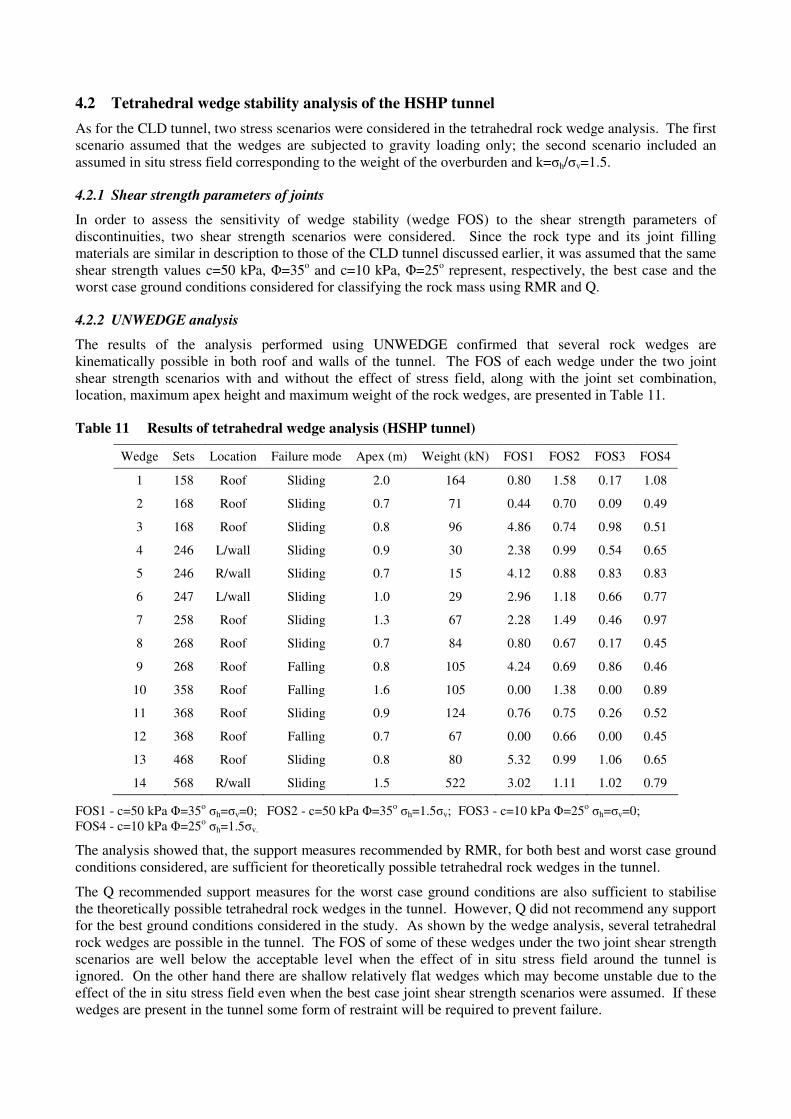
4.2 Tetrahedral wedge stability analysis of the HSHP tunnel As for the CLD tunnel, two stress scenarios were considered in the tetrahedral rock wedge analysis. The first scenario assumed that the wedges are subjected to gravity loading only; the second scenario included an assumed in situ stress field corresponding to the weight of the overburden and k=�h/�v=1.5.
4.2.1 Shear strength parameters of joints
In order to assess the sensitivity of wedge stability (wedge FOS) to the shear strength parameters of discontinuities, two shear strength scenarios were considered. Since the rock type and its joint filling materials are similar in description to those of the CLD tunnel discussed earlier, it was assumed that the same shear strength values c=50 kPa, �=35o and c=10 kPa, �=25o represent, respectively, the best case and the worst case ground conditions considered for classifying the rock mass using RMR and Q.
4.2.2 UNWEDGE analysis
The results of the analysis performed using UNWEDGE confirmed that several rock wedges are kinematically possible in both roof and walls of the tunnel. The FOS of each wedge under the two joint shear strength scenarios with and without the effect of stress field, along with the joint set combination, location, maximum apex height and maximum weight of the rock wedges, are presented in Table 11.
Table 11 Results of tetrahedral wedge analysis (HSHP tunnel)
Wedge Sets Location Failure mode Apex (m) Weight (kN) FOS1 FOS2 FOS3 FOS4
1 158 Roof Sliding 2.0 164 0.80 1.58 0.17 1.08
2 168 Roof Sliding 0.7 71 0.44 0.70 0.09 0.49
3 168 Roof Sliding 0.8 96 4.86 0.74 0.98 0.51
4 246 L/wall Sliding 0.9 30 2.38 0.99 0.54 0.65
5 246 R/wall Sliding 0.7 15 4.12 0.88 0.83 0.83
6 247 L/wall Sliding 1.0 29 2.96 1.18 0.66 0.77
7 258 Roof Sliding 1.3 67 2.28 1.49 0.46 0.97
8 268 Roof Sliding 0.7 84 0.80 0.67 0.17 0.45
9 268 Roof Falling 0.8 105 4.24 0.69 0.86 0.46
10 358 Roof Falling 1.6 105 0.00 1.38 0.00 0.89
11 368 Roof Sliding 0.9 124 0.76 0.75 0.26 0.52
12 368 Roof Falling 0.7 67 0.00 0.66 0.00 0.45
13 468 Roof Sliding 0.8 80 5.32 0.99 1.06 0.65
14 568 R/wall Sliding 1.5 522 3.02 1.11 1.02 0.79
FOS1 - c=50 kPa �=35o �h=�v=0; FOS2 - c=50 kPa �=35o �h=1.5�v; FOS3 - c=10 kPa �=25o �h=�v=0; FOS4 - c=10 kPa �=25o �h=1.5�v.
The analysis showed that, the support measures recommended by RMR, for both best and worst case ground conditions considered, are sufficient for theoretically possible tetrahedral rock wedges in the tunnel.
The Q recommended support measures for the worst case ground conditions are also sufficient to stabilise the theoretically possible tetrahedral rock wedges in the tunnel. However, Q did not recommend any support for the best ground conditions considered in the study. As shown by the wedge analysis, several tetrahedral rock wedges are possible in the tunnel. The FOS of some of these wedges under the two joint shear strength scenarios are well below the acceptable level when the effect of in situ stress field around the tunnel is ignored. On the other hand there are shallow relatively flat wedges which may become unstable due to the effect of the in situ stress field even when the best case joint shear strength scenarios were assumed. If these wedges are present in the tunnel some form of restraint will be required to prevent failure.
During excavation of the HSHP tunnel, Lasao (1986) observed that structurally controlled failures were the main modes of instability, which included wedge failures due to intersecting discontinuities and slab failure from the roof due to flat dipping joints and loosening of the rock mass around weakness zones such as faults, which cut across the tunnel alignment. The results of the wedge analysis agree with these observations.
The actual support installed in the tunnel included steel ribs with steel/timber lagging and invert struts near the portals and at four intervals inside the tunnel in worst ground conditions (a 5 m interval each in Sectors 3 and 4, and a 4 m and an 8 interval in Sector 5). In other areas, rock bolts and wire mesh where necessary to provide safety during construction. After the completion of the excavation the tunnel, a 500 mm thick cast in place concrete lining was constructed, partly for hydraulic reasons. The final support (lining) installed was substantially greater than the support recommended by the two empirical methods.
5 Discussion The wedge analysis assumed that the joints are ubiquitous and that the theoretically possible maximum size wedges would be formed. Therefore the wedge analysis may be considered conservative. However, it should be noted that only the tetrahedral (or pyramidal) wedges were analysed. Non-pyramidal blocks (and slabs) that may be formed by more than three intersecting joints were excluded, and the comparison is limited to the potential tetrahedral rock wedge instability under the selected joint shear strength and stress scenarios. As mentioned before, several potentially unstable rock wedges were identified in the case studies. Some roof failures occurred in the HSHP tunnel before the installation of support. However, both tunnels were supported with rock bolts, and occasional steel ribs in poor rock zones.
The limitations of the rock mass classification methods for tunnels subjected to changing loading conditions have been known and were discussed in detail by Speers (1992). Speers concluded that “the use of empirical support design methods such as the RMR-method and Q-method will lead to under designs …” and consequently recommended analytical approaches for such situations. For mining excavations with changing stress conditions Mikula and Lee (2003) showed that Q can be successfully applied by adjusting the SRF rating to reflect the expected future stress conditions. Similarly, the change in groundwater level subsequent to the construction of a tunnel may be accounted for by adjusting the Jw rating in Q (and ground water rating in RMR) to reflect the anticipated groundwater pressure. However, the artificially elevated groundwater head considered in the analysis of the CLD tunnel is not high enough to down grade the Jw rating. It falls within the minor inflow/pressure range and receives a Jw rating of 1. With RMR the inferred groundwater pressure lowers the overall rating by three. But this does not significantly change the recommended support.
For small diameter (i.e. 3.5 m) water tunnels, for which ESR = 1.6 to 2.0 and De = 1.75 to 2.2, the Q system recommends no support if Q > 1. However, as seen in the HSHP tunnel case tunnel, support could be warranted when the Q value is as high as 6. For temporary mine excavations such as ore development drives with a typical width of no more than 4 m, for which the recommended ESR value is around 2, the Q system would not recommend any support even when the computed Q value is marginally less than 1. Dependent on the site specific conditions this may have safety implications. In such situations, as mentioned by Mikula and Lee (2003), ESR should also be selected based on site specific ground conditions.
With RMR, some difficulties arise when support measures are designed for tunnels with diameters other than 10 m, such as the CLD and HSHP tunnel, because the RMR recommendations are for 10 m diameter tunnels. In this situation, other empirical guidelines should be used for selecting bolt lengths, shotcrete thickness and steel ribs etc.
The study shows that the two empirical methods should not be used on their own for support design without cross checking by means of other design tools.
6 Conclusions Based on detailed geotechnical mapping of the rock mass and testing of intact rock samples, RMR and Q were applied to an 11.3 m diameter tunnel and a 3.5 m diameter tunnel driven by drill and blast methods through sedimentary rock formations, and support requirements were determined. The support recommendations were then compared with the results of a tetrahedral rock wedge stability analysis of the rock mass around the two tunnels. The study shows that while the empirically derived support measures are
adequate for stabilising most of the potentially unstable rock wedges, in some instances, they are insufficient to provide adequate safety margin against some of the potential rock wedge failures, particularly under changing groundwater conditions.
In the case of the 11.3 m diameter diversion tunnel, under the groundwater conditions existed during the construction stage of the project, the empirically derived support measures were sufficient to stabilise the potentially unstable rock wedges identified by the tetrahedral wedge analysis. However, the wedge analysis showed that the subsequent change in groundwater level could cause previously stable rock blocks to become unstable, hence the empirical support recommendations become inadequate.
In the case of the 3.5 m diameter tunnel, the empirically derived support measurers were sufficient to stabilise the potentially unstable tetrahedral rock wedges in the worst case ground conditions. For the best scenario ground conditions, Q did not recommend any support. However, the wedge analysis showed that even under the best case joint shear strength parameters considered tetrahedral rock wedge instability is possible. During construction several structurally controlled failures occurred and the potential failures identified in advance were stabilised using rock bolts. Steel ribs were also used in the poor rock mass conditions, for which RMR recommended steel ribs, rock bolts and shotcrete and Q recommended rock bolts and shotcrete.
Acknowledgements/Disclaimers The authors thank the Department of Consumer and Employment Protection for providing funds to present the paper. The first author thanks the Electricity Generating Authority of Thailand for permitting access to the tunnels during construction while he was at the Asian Institute of Technology, Thailand. The views expressed herein are not necessarily those of the respective employers of the two authors.
References Barton, N. R. (1974) A review of the shear strength of filled discontinuities in rock. Norwegian Geotech Inst. Publ. No.
105, Oslo, Norwegian Geotechnical Institute. Barton, N., Lien, R. and Lunde, J. (1974) Engineering classification of rock masses for the design of rock support. Rock
Mechanics. 6, pp. 189–236. Barton, N. (2002) Some new Q-value correlations to assist in site characterisation and tunnel design. Int. J of Rock
Mechanics and Mining Sciences, 39(2002) 185-216. Barton, N. and Grimstad, E. (1994) The Q-system following 20 years of application in NMT support selection, in
Felsbau 12(6): pp.428-436. Barton, N. R. and Choubey, V. (1977) The shear strength of rock joints in theory and practice. Rock Mech. 10(1-2),
pp.1-54. Bieniawski, Z.T. (1979) The geomechanics classification in rock engineering applications. In Proceedings of the 4th
International Conference on Rock Mechanics, 2: 41-48. ISRM, Montreux. Bieniawski, Z.T. (1989) Engineering rock mass classifications, John Willey & Sons, New York. Lasao, M. L. (1986) Design of rock support for the Huai Saphan Hin power tunnel, MSc Thesis, Asian Institute of
Technology, Thailand. 136p. Mikula, P. and Lee, M. (2003) Confirmation of Q classification for use at Mt Charlot mine. First Australasian ground
control in mining conference, pp. 1-5. Ratanasatayanont, A. (1984) Rock mass classification for some engineering purposes along the diversion tunnel at
Chiew Larn damsite, Surat Thani. MSc Thesis, Asian Institute of Technology, Thailand. 147p. Rocscience Inc. (2003) Unwedge Version 3.0, Underground Wedge Stability Analysis. www.rocscience.com, Toronto. Speers, C.R. (1992) Support of tunnels subjected to changing rock loads: a comparison of design methods. Tunnelling
and Underground Space Technology, vol.7, no.1, pp.25-32.
AN EVALUATION OF ROCK MASS CLASSIFICATION METHODS USED FOR TUNNEL SUPPORT DESIGN
J. RANASOORIYA1 and H. NIKRAZ2 1Resources Safety, Western Australia
(e-mail of corresponding author: [email protected])
2Curtin University of Technology, Western Australia
Abstract RMR and Q derived support measures for three tunnels were compared with those derived by rock wedge analysis. A numerical model was also run to assess the effect of internal water pressure in one of the tunnels. The study showed that although the empirical support recommendations are adequate in general, they do not meet some of the project specific requirements.
Keywords: tunnel; rock mass; RMR; Q; rock wedge.
1. Introduction
The most widely used rock mass classification methods for tunnel support design are RMR [1] and Q [2]. Over the years these methods have been revised to incorporate the experience gained subsequent to their initial introduction, RMR [3] and Q [4]. Notwithstanding the revisions, these methods still have limitations and room for improvements [5, 6, 7, 8, 9]. To identify their limitations and to suggest improvements, where possible, these methods can be evaluated by comparing their support recommendations with the support derived by other applicable methods. This paper applies RMR and Q to three water conveyance tunnels using the data collected during construction. The support measures derived by the two methods are compared with the results of a tetrahedral rock wedge analysis undertaken using UNWEDGE [10]. The effect of internal water pressure on the rock mass around one of the tunnels was also assessed by a numerical analysis using UDEC [11].
2. The Tunnels Studied
The three case tunnels are: (a) 493 m long, 11.3 m span horseshoe-shaped Chiew Larn diversion (CLD) tunnel and (b) 240 m long, 13 m span horseshoe-shaped Chiew Larn power (CLP) tunnel of the Chiew Larn hydropower project in the Southern Province of Thailand, and (c) 732 m
long, 3.5 m wide and 3.5 m high D-shaped Huai Saphan Hin power (HSHP) tunnel located on the eastern seaboard of Thailand. The three tunnels were driven by drill and blast methods. The CLD tunnel, initially a river diversion tunnel for dam construction to create a reservoir, was converted to an irrigation tunnel by plugging it at approximately 105 m from the inlet and providing an outlet valve in the plug. During excavation, the tunnel was mostly dry, except for some isolated areas of water inflow during the wet season. The groundwater level around the tunnel length downstream of the plug was later elevated by the reservoir, which has a maximum elevation of 95 m RL (tunnel invert is at ~10 m RL). The average tunnel alignment is NW-SE with a 0.2% gradient. The tunnel overburden thickness varies from 40 to 80 m with an average of 60 m. The CLP tunnel feeds three 80 MW power units through three steel penstocks. Located in a hill slope, it has an alignment of 140o E and a plunge of 10o. Its overburden thickness varies from 25 to 50 m, with an average of 30 m. The tunnel is above the regional groundwater level and was mostly dry, with water only dripping in some places during the wet season. The HSHP tunnel feeds a 12.2 MW powerhouse. Its overburden varies from 35 to 90 m, with 90% of the overburden greater than 50 m. The tunnel
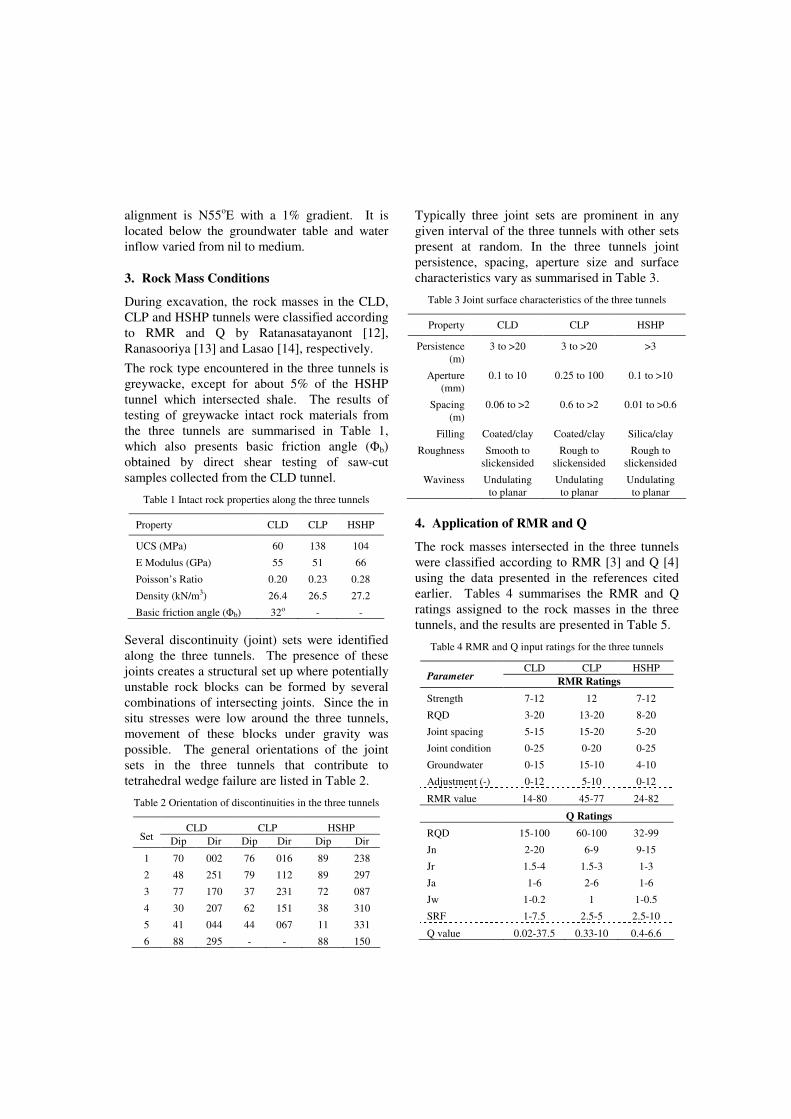
alignment is N55oE with a 1% gradient. It is located below the groundwater table and water inflow varied from nil to medium.
3. Rock Mass Conditions
During excavation, the rock masses in the CLD, CLP and HSHP tunnels were classified according to RMR and Q by Ratanasatayanont [12], Ranasooriya [13] and Lasao [14], respectively. The rock type encountered in the three tunnels is greywacke, except for about 5% of the HSHP tunnel which intersected shale. The results of testing of greywacke intact rock materials from the three tunnels are summarised in Table 1, which also presents basic friction angle (�b) obtained by direct shear testing of saw-cut samples collected from the CLD tunnel.
Table 1 Intact rock properties along the three tunnels
Property CLD CLP HSHP
UCS (MPa) 60 138 104
E Modulus (GPa) 55 51 66
Poisson’s Ratio 0.20 0.23 0.28
Density (kN/m3) 26.4 26.5 27.2
Basic friction angle (�b) 32o - -
Several discontinuity (joint) sets were identified along the three tunnels. The presence of these joints creates a structural set up where potentially unstable rock blocks can be formed by several combinations of intersecting joints. Since the in situ stresses were low around the three tunnels, movement of these blocks under gravity was possible. The general orientations of the joint sets in the three tunnels that contribute to tetrahedral wedge failure are listed in Table 2.
Table 2 Orientation of discontinuities in the three tunnels
CLD CLP HSHP Set Dip Dir Dip Dir Dip Dir
1 70 002 76 016 89 238
2 48 251 79 112 89 297
3 77 170 37 231 72 087
4 30 207 62 151 38 310
5 41 044 44 067 11 331
6 88 295 - - 88 150
Typically three joint sets are prominent in any given interval of the three tunnels with other sets present at random. In the three tunnels joint persistence, spacing, aperture size and surface characteristics vary as summarised in Table 3.
Table 3 Joint surface characteristics of the three tunnels
Property CLD CLP HSHP
Persistence (m)
3 to >20 3 to >20 >3
Aperture (mm)
0.1 to 10 0.25 to 100 0.1 to >10
Spacing (m)
0.06 to >2 0.6 to >2 0.01 to >0.6
Filling Coated/clay Coated/clay Silica/clay
Roughness Smooth to slickensided
Rough to slickensided
Rough to slickensided
Waviness Undulating to planar
Undulating to planar
Undulating to planar
4. Application of RMR and Q
The rock masses intersected in the three tunnels were classified according to RMR [3] and Q [4] using the data presented in the references cited earlier. Tables 4 summarises the RMR and Q ratings assigned to the rock masses in the three tunnels, and the results are presented in Table 5.
Table 4 RMR and Q input ratings for the three tunnels
CLD CLP HSHP Parameter RMR Ratings
Strength 7-12 12 7-12
RQD 3-20 13-20 8-20
Joint spacing 5-15 15-20 5-20
Joint condition 0-25 0-20 0-25
Groundwater 0-15 15-10 4-10
Adjustment (-) 0-12 5-10 0-12
RMR value 14-80 45-77 24-82
Q Ratings
RQD 15-100 60-100 32-99
Jn 2-20 6-9 9-15
Jr 1.5-4 1.5-3 1-3
Ja 1-6 2-6 1-6
Jw 1-0.2 1 1-0.5
SRF 1-7.5 2.5-5 2.5-10
Q value 0.02-37.5 0.33-10 0.4-6.6
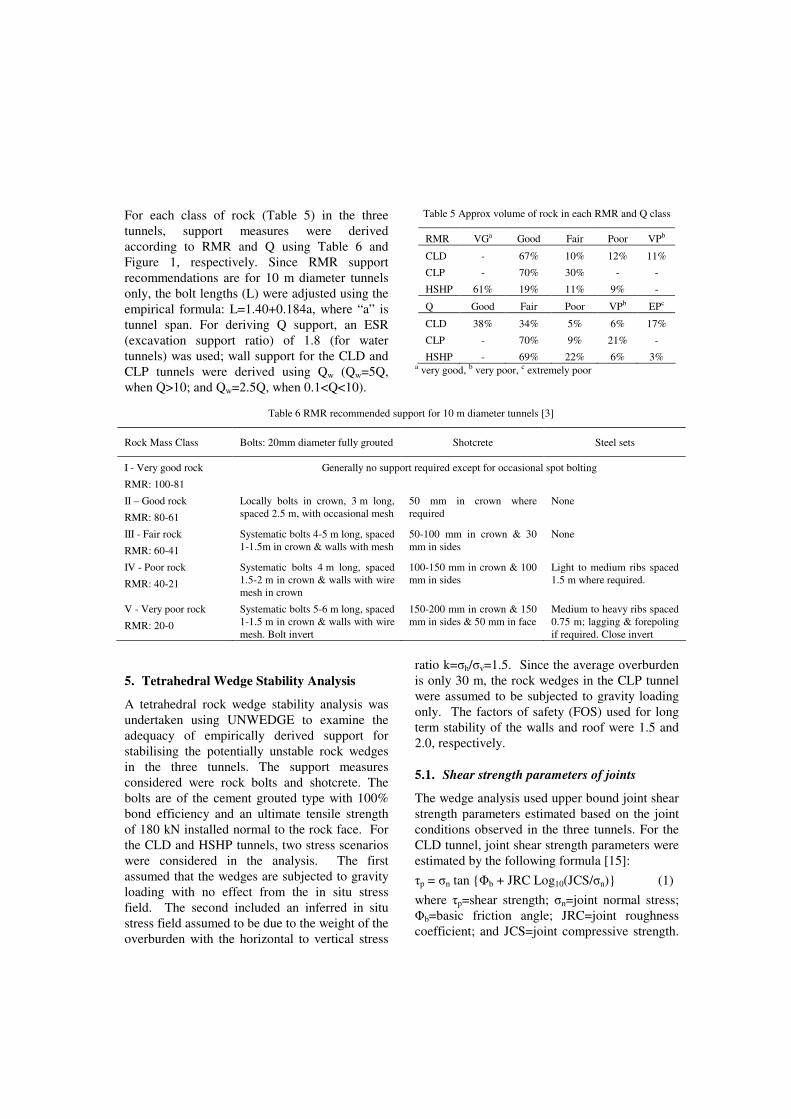
For each class of rock (Table 5) in the three tunnels, support measures were derived according to RMR and Q using Table 6 and Figure 1, respectively. Since RMR support recommendations are for 10 m diameter tunnels only, the bolt lengths (L) were adjusted using the empirical formula: L=1.40+0.184a, where “a” is tunnel span. For deriving Q support, an ESR (excavation support ratio) of 1.8 (for water tunnels) was used; wall support for the CLD and CLP tunnels were derived using Qw (Qw=5Q, when Q>10; and Qw=2.5Q, when 0.1<Q<10).
Table 5 Approx volume of rock in each RMR and Q class
RMR VGa Good Fair Poor VPb
CLD - 67% 10% 12% 11%
CLP - 70% 30% - -
HSHP 61% 19% 11% 9% -
Q Good Fair Poor VPb EPc
CLD 38% 34% 5% 6% 17%
CLP - 70% 9% 21% -
HSHP - 69% 22% 6% 3% a very good, b very poor, c extremely poor
Table 6 RMR recommended support for 10 m diameter tunnels [3]
Rock Mass Class Bolts: 20mm diameter fully grouted Shotcrete Steel sets
I - Very good rock
RMR: 100-81
Generally no support required except for occasional spot bolting
II – Good rock
RMR: 80-61
Locally bolts in crown, 3 m long, spaced 2.5 m, with occasional mesh
50 mm in crown where required
None
III - Fair rock
RMR: 60-41
Systematic bolts 4-5 m long, spaced 1-1.5m in crown & walls with mesh
50-100 mm in crown & 30 mm in sides
None
IV - Poor rock
RMR: 40-21
Systematic bolts 4 m long, spaced 1.5-2 m in crown & walls with wire mesh in crown
100-150 mm in crown & 100 mm in sides
Light to medium ribs spaced 1.5 m where required.
V - Very poor rock
RMR: 20-0
Systematic bolts 5-6 m long, spaced 1-1.5 m in crown & walls with wire mesh. Bolt invert
150-200 mm in crown & 150 mm in sides & 50 mm in face
Medium to heavy ribs spaced 0.75 m; lagging & forepoling if required. Close invert
5. Tetrahedral Wedge Stability Analysis
A tetrahedral rock wedge stability analysis was undertaken using UNWEDGE to examine the adequacy of empirically derived support for stabilising the potentially unstable rock wedges in the three tunnels. The support measures considered were rock bolts and shotcrete. The bolts are of the cement grouted type with 100% bond efficiency and an ultimate tensile strength of 180 kN installed normal to the rock face. For the CLD and HSHP tunnels, two stress scenarios were considered in the analysis. The first assumed that the wedges are subjected to gravity loading with no effect from the in situ stress field. The second included an inferred in situ stress field assumed to be due to the weight of the overburden with the horizontal to vertical stress
ratio k=�h/�v=1.5. Since the average overburden is only 30 m, the rock wedges in the CLP tunnel were assumed to be subjected to gravity loading only. The factors of safety (FOS) used for long term stability of the walls and roof were 1.5 and 2.0, respectively.
5.1. Shear strength parameters of joints
The wedge analysis used upper bound joint shear strength parameters estimated based on the joint conditions observed in the three tunnels. For the CLD tunnel, joint shear strength parameters were estimated by the following formula [15]: �p = �n tan {�b + JRC Log10(JCS/�n)} (1) where �p=shear strength; �n=joint normal stress; �b=basic friction angle; JRC=joint roughness coefficient; and JCS=joint compressive strength.
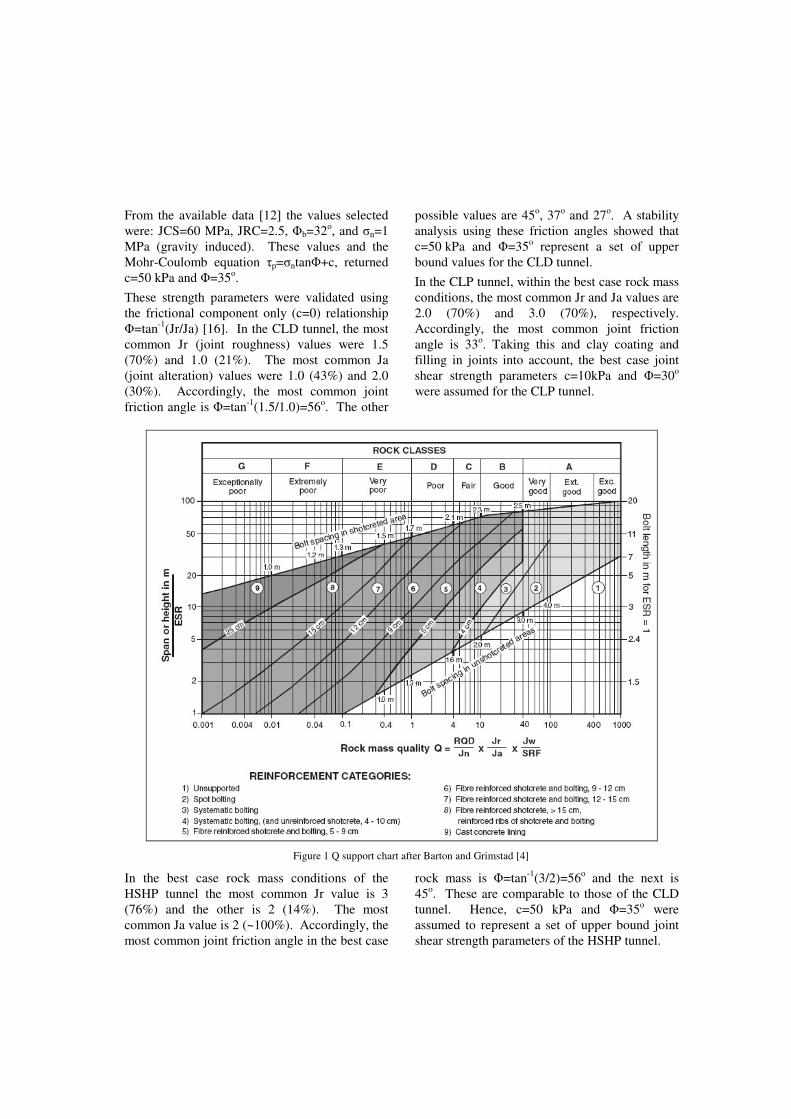
From the available data [12] the values selected were: JCS=60 MPa, JRC=2.5, �b=32o, and �n=1 MPa (gravity induced). These values and the Mohr-Coulomb equation �p=�ntan�+c, returned c=50 kPa and �=35o. These strength parameters were validated using the frictional component only (c=0) relationship �=tan-1(Jr/Ja) [16]. In the CLD tunnel, the most common Jr (joint roughness) values were 1.5 (70%) and 1.0 (21%). The most common Ja (joint alteration) values were 1.0 (43%) and 2.0 (30%). Accordingly, the most common joint friction angle is �=tan-1(1.5/1.0)=56o. The other
possible values are 45o, 37o and 27o. A stability analysis using these friction angles showed that c=50 kPa and �=35o represent a set of upper bound values for the CLD tunnel. In the CLP tunnel, within the best case rock mass conditions, the most common Jr and Ja values are 2.0 (70%) and 3.0 (70%), respectively. Accordingly, the most common joint friction angle is 33o. Taking this and clay coating and filling in joints into account, the best case joint shear strength parameters c=10kPa and �=30o were assumed for the CLP tunnel.
Figure 1 Q support chart after Barton and Grimstad [4]
In the best case rock mass conditions of the HSHP tunnel the most common Jr value is 3 (76%) and the other is 2 (14%). The most common Ja value is 2 (~100%). Accordingly, the most common joint friction angle in the best case
rock mass is �=tan-1(3/2)=56o and the next is 45o. These are comparable to those of the CLD tunnel. Hence, c=50 kPa and �=35o were assumed to represent a set of upper bound joint shear strength parameters of the HSHP tunnel.
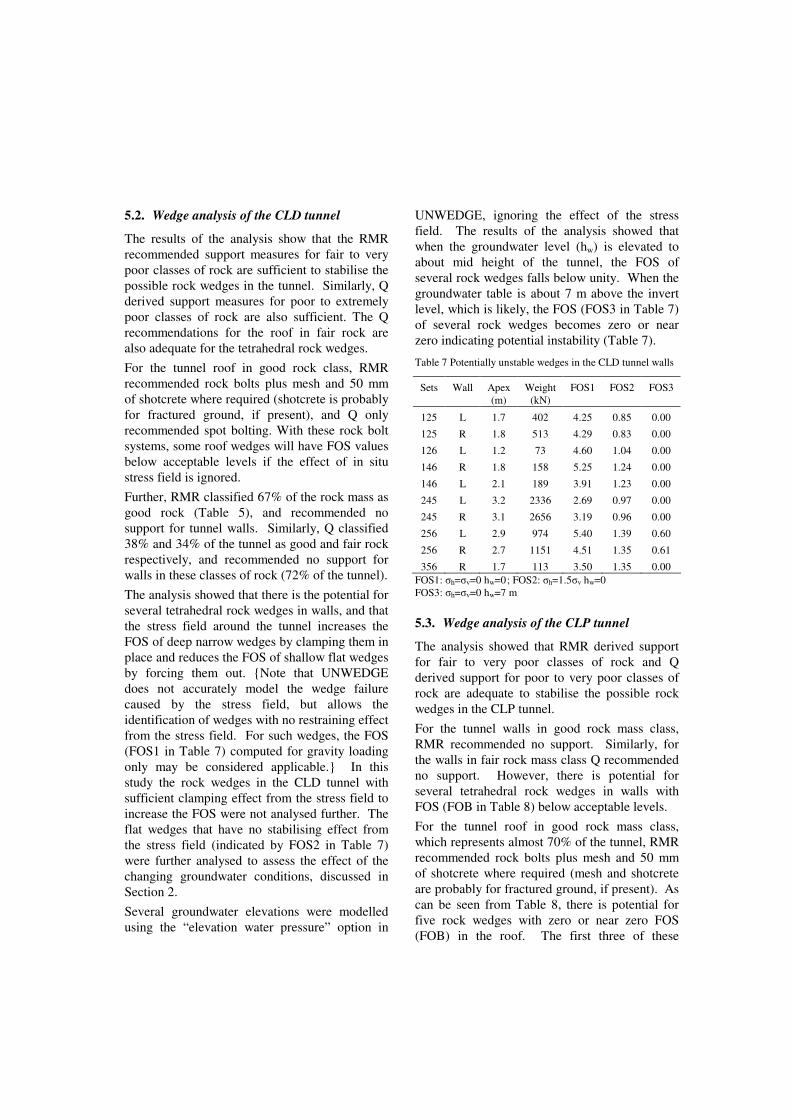
5.2. Wedge analysis of the CLD tunnel
The results of the analysis show that the RMR recommended support measures for fair to very poor classes of rock are sufficient to stabilise the possible rock wedges in the tunnel. Similarly, Q derived support measures for poor to extremely poor classes of rock are also sufficient. The Q recommendations for the roof in fair rock are also adequate for the tetrahedral rock wedges. For the tunnel roof in good rock class, RMR recommended rock bolts plus mesh and 50 mm of shotcrete where required (shotcrete is probably for fractured ground, if present), and Q only recommended spot bolting. With these rock bolt systems, some roof wedges will have FOS values below acceptable levels if the effect of in situ stress field is ignored. Further, RMR classified 67% of the rock mass as good rock (Table 5), and recommended no support for tunnel walls. Similarly, Q classified 38% and 34% of the tunnel as good and fair rock respectively, and recommended no support for walls in these classes of rock (72% of the tunnel). The analysis showed that there is the potential for several tetrahedral rock wedges in walls, and that the stress field around the tunnel increases the FOS of deep narrow wedges by clamping them in place and reduces the FOS of shallow flat wedges by forcing them out. {Note that UNWEDGE does not accurately model the wedge failure caused by the stress field, but allows the identification of wedges with no restraining effect from the stress field. For such wedges, the FOS (FOS1 in Table 7) computed for gravity loading only may be considered applicable.} In this study the rock wedges in the CLD tunnel with sufficient clamping effect from the stress field to increase the FOS were not analysed further. The flat wedges that have no stabilising effect from the stress field (indicated by FOS2 in Table 7) were further analysed to assess the effect of the changing groundwater conditions, discussed in Section 2. Several groundwater elevations were modelled using the “elevation water pressure” option in
UNWEDGE, ignoring the effect of the stress field. The results of the analysis showed that when the groundwater level (hw) is elevated to about mid height of the tunnel, the FOS of several rock wedges falls below unity. When the groundwater table is about 7 m above the invert level, which is likely, the FOS (FOS3 in Table 7) of several rock wedges becomes zero or near zero indicating potential instability (Table 7).
Table 7 Potentially unstable wedges in the CLD tunnel walls
Sets Wall Apex (m)
Weight (kN)
FOS1 FOS2 FOS3
125 L 1.7 402 4.25 0.85 0.00
125 R 1.8 513 4.29 0.83 0.00
126 L 1.2 73 4.60 1.04 0.00
146 R 1.8 158 5.25 1.24 0.00
146 L 2.1 189 3.91 1.23 0.00
245 L 3.2 2336 2.69 0.97 0.00
245 R 3.1 2656 3.19 0.96 0.00
256 L 2.9 974 5.40 1.39 0.60
256 R 2.7 1151 4.51 1.35 0.61
356 R 1.7 113 3.50 1.35 0.00 FOS1: �h=�v=0 hw=0 ; FOS2: �h=1.5�v hw=0 FOS3: �h=�v=0 hw=7 m
5.3. Wedge analysis of the CLP tunnel
The analysis showed that RMR derived support for fair to very poor classes of rock and Q derived support for poor to very poor classes of rock are adequate to stabilise the possible rock wedges in the CLP tunnel. For the tunnel walls in good rock mass class, RMR recommended no support. Similarly, for the walls in fair rock mass class Q recommended no support. However, there is potential for several tetrahedral rock wedges in walls with FOS (FOB in Table 8) below acceptable levels. For the tunnel roof in good rock mass class, which represents almost 70% of the tunnel, RMR recommended rock bolts plus mesh and 50 mm of shotcrete where required (mesh and shotcrete are probably for fractured ground, if present). As can be seen from Table 8, there is potential for five rock wedges with zero or near zero FOS (FOB) in the roof. The first three of these
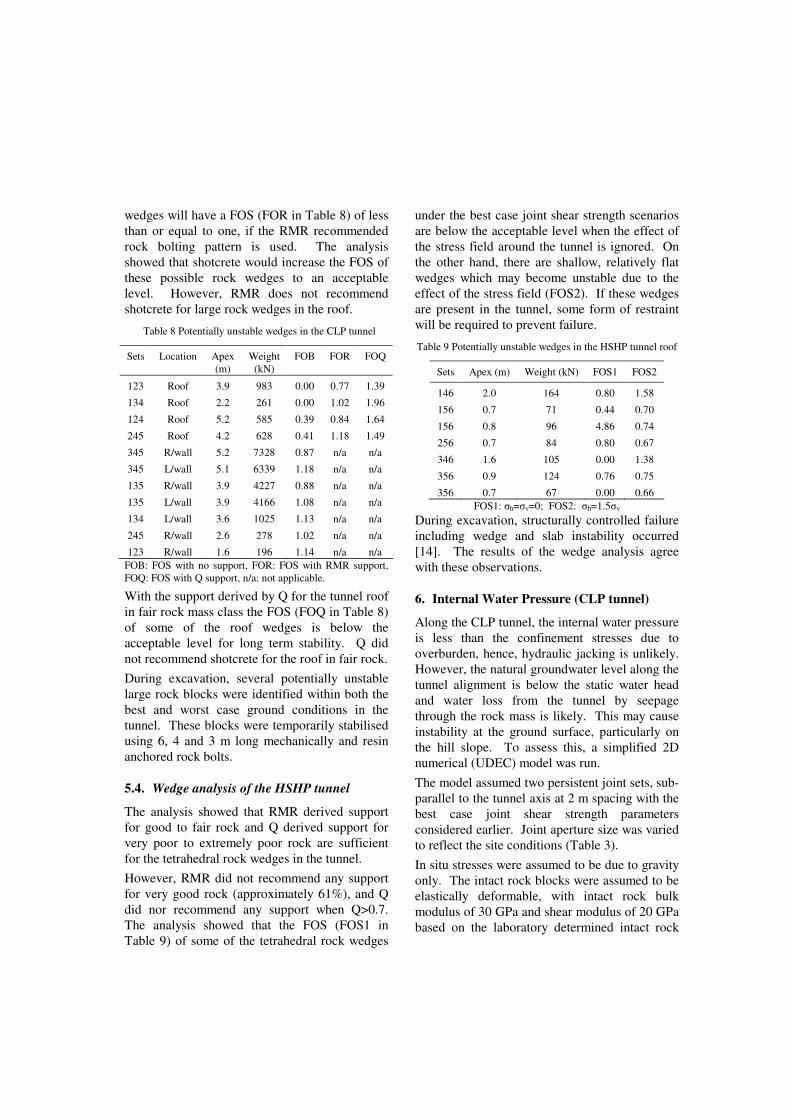
wedges will have a FOS (FOR in Table 8) of less than or equal to one, if the RMR recommended rock bolting pattern is used. The analysis showed that shotcrete would increase the FOS of these possible rock wedges to an acceptable level. However, RMR does not recommend shotcrete for large rock wedges in the roof.
Table 8 Potentially unstable wedges in the CLP tunnel
Sets Location Apex (m)
Weight (kN)
FOB FOR FOQ
123 Roof 3.9 983 0.00 0.77 1.39
134 Roof 2.2 261 0.00 1.02 1.96
124 Roof 5.2 585 0.39 0.84 1.64
245 Roof 4.2 628 0.41 1.18 1.49
345 R/wall 5.2 7328 0.87 n/a n/a 345 L/wall 5.1 6339 1.18 n/a n/a 135 R/wall 3.9 4227 0.88 n/a n/a 135 L/wall 3.9 4166 1.08 n/a n/a 134 L/wall 3.6 1025 1.13 n/a n/a 245 R/wall 2.6 278 1.02 n/a n/a 123 R/wall 1.6 196 1.14 n/a n/a
FOB: FOS with no support, FOR: FOS with RMR support, FOQ: FOS with Q support, n/a: not applicable.
With the support derived by Q for the tunnel roof in fair rock mass class the FOS (FOQ in Table 8) of some of the roof wedges is below the acceptable level for long term stability. Q did not recommend shotcrete for the roof in fair rock. During excavation, several potentially unstable large rock blocks were identified within both the best and worst case ground conditions in the tunnel. These blocks were temporarily stabilised using 6, 4 and 3 m long mechanically and resin anchored rock bolts.
5.4. Wedge analysis of the HSHP tunnel
The analysis showed that RMR derived support for good to fair rock and Q derived support for very poor to extremely poor rock are sufficient for the tetrahedral rock wedges in the tunnel. However, RMR did not recommend any support for very good rock (approximately 61%), and Q did nor recommend any support when Q>0.7. The analysis showed that the FOS (FOS1 in Table 9) of some of the tetrahedral rock wedges
under the best case joint shear strength scenarios are below the acceptable level when the effect of the stress field around the tunnel is ignored. On the other hand, there are shallow, relatively flat wedges which may become unstable due to the effect of the stress field (FOS2). If these wedges are present in the tunnel, some form of restraint will be required to prevent failure.
Table 9 Potentially unstable wedges in the HSHP tunnel roof
Sets Apex (m) Weight (kN) FOS1 FOS2
146 2.0 164 0.80 1.58
156 0.7 71 0.44 0.70
156 0.8 96 4.86 0.74
256 0.7 84 0.80 0.67
346 1.6 105 0.00 1.38
356 0.9 124 0.76 0.75
356 0.7 67 0.00 0.66 FOS1: �h=�v=0; FOS2: �h=1.5�v
During excavation, structurally controlled failure including wedge and slab instability occurred [14]. The results of the wedge analysis agree with these observations.
6. Internal Water Pressure (CLP tunnel)
Along the CLP tunnel, the internal water pressure is less than the confinement stresses due to overburden, hence, hydraulic jacking is unlikely. However, the natural groundwater level along the tunnel alignment is below the static water head and water loss from the tunnel by seepage through the rock mass is likely. This may cause instability at the ground surface, particularly on the hill slope. To assess this, a simplified 2D numerical (UDEC) model was run. The model assumed two persistent joint sets, sub-parallel to the tunnel axis at 2 m spacing with the best case joint shear strength parameters considered earlier. Joint aperture size was varied to reflect the site conditions (Table 3). In situ stresses were assumed to be due to gravity only. The intact rock blocks were assumed to be elastically deformable, with intact rock bulk modulus of 30 GPa and shear modulus of 20 GPa based on the laboratory determined intact rock
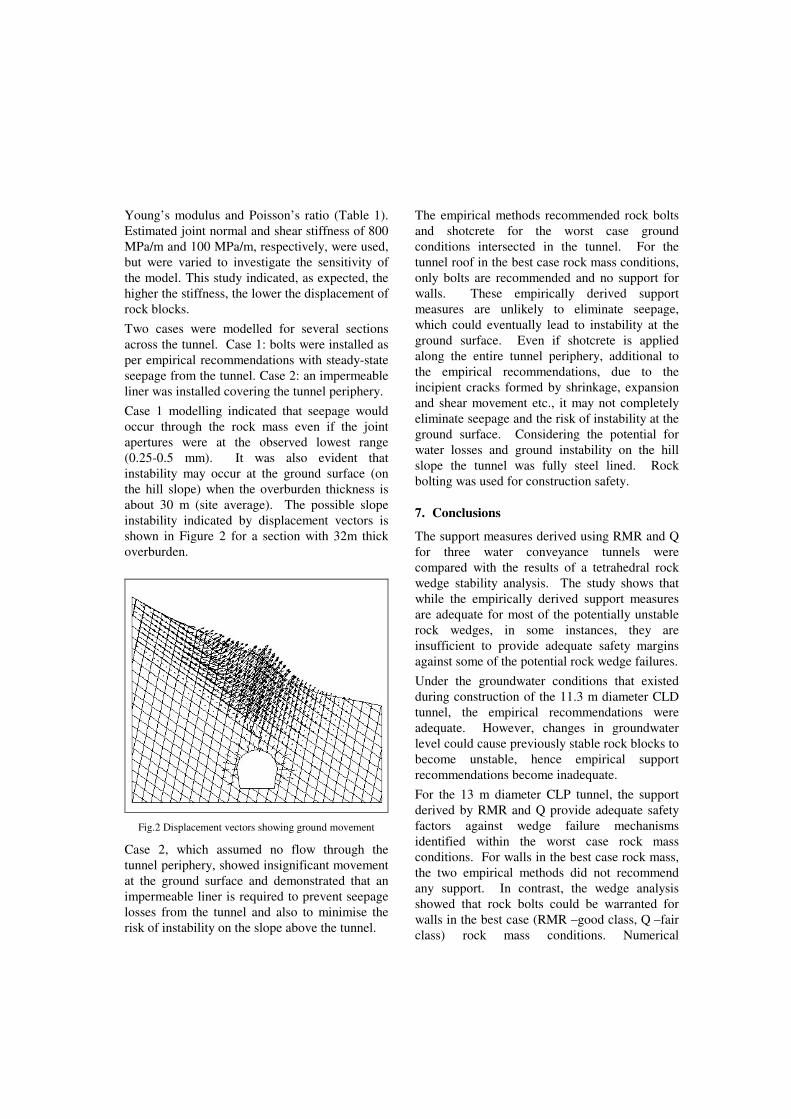
Young’s modulus and Poisson’s ratio (Table 1). Estimated joint normal and shear stiffness of 800 MPa/m and 100 MPa/m, respectively, were used, but were varied to investigate the sensitivity of the model. This study indicated, as expected, the higher the stiffness, the lower the displacement of rock blocks. Two cases were modelled for several sections across the tunnel. Case 1: bolts were installed as per empirical recommendations with steady-state seepage from the tunnel. Case 2: an impermeable liner was installed covering the tunnel periphery. Case 1 modelling indicated that seepage would occur through the rock mass even if the joint apertures were at the observed lowest range (0.25-0.5 mm). It was also evident that instability may occur at the ground surface (on the hill slope) when the overburden thickness is about 30 m (site average). The possible slope instability indicated by displacement vectors is shown in Figure 2 for a section with 32m thick overburden.
Fig.2 Displacement vectors showing ground movement
Case 2, which assumed no flow through the tunnel periphery, showed insignificant movement at the ground surface and demonstrated that an impermeable liner is required to prevent seepage losses from the tunnel and also to minimise the risk of instability on the slope above the tunnel.
The empirical methods recommended rock bolts and shotcrete for the worst case ground conditions intersected in the tunnel. For the tunnel roof in the best case rock mass conditions, only bolts are recommended and no support for walls. These empirically derived support measures are unlikely to eliminate seepage, which could eventually lead to instability at the ground surface. Even if shotcrete is applied along the entire tunnel periphery, additional to the empirical recommendations, due to the incipient cracks formed by shrinkage, expansion and shear movement etc., it may not completely eliminate seepage and the risk of instability at the ground surface. Considering the potential for water losses and ground instability on the hill slope the tunnel was fully steel lined. Rock bolting was used for construction safety.
7. Conclusions
The support measures derived using RMR and Q for three water conveyance tunnels were compared with the results of a tetrahedral rock wedge stability analysis. The study shows that while the empirically derived support measures are adequate for most of the potentially unstable rock wedges, in some instances, they are insufficient to provide adequate safety margins against some of the potential rock wedge failures. Under the groundwater conditions that existed during construction of the 11.3 m diameter CLD tunnel, the empirical recommendations were adequate. However, changes in groundwater level could cause previously stable rock blocks to become unstable, hence empirical support recommendations become inadequate. For the 13 m diameter CLP tunnel, the support derived by RMR and Q provide adequate safety factors against wedge failure mechanisms identified within the worst case rock mass conditions. For walls in the best case rock mass, the two empirical methods did not recommend any support. In contrast, the wedge analysis showed that rock bolts could be warranted for walls in the best case (RMR –good class, Q –fair class) rock mass conditions. Numerical
modelling showed that, since the tunnel is shallow and located on a hill slope, seepage may occur from the tunnel and cause instability at the ground surface. These aspects are not considered in the two empirical methods. In the 3.5 m diameter HSHP tunnel, the empirically derived support measures were sufficient for the potentially unstable rock wedges in the worst case ground conditions. For the best scenario (RMR – very good class, Q – good class) ground conditions, both RMR and Q did not recommend any support. The analysis showed that wedge instability is possible in the best case ground conditions. During construction, wedge failures occurred and the potential failures identified in advance were stabilised using rock bolts.
References
1. Bieniawski, Z. T., 1973. Engineering classification of jointed rock masses. Trans South African Inst of Civil Eng. Vol.15, pp.335-334. 2. Barton, N., R. Lien and J. Lunde, 1974. Eng classification of rock masses for the design of rock support. Rock Mech. Vol.6, pp. 189-236. 3. Bieniawski, Z. T., 1989. Eng rock mass classifications, John Wiley & Sons, New York. 4. Barton, N. and E. Grimstad, 1994. The Q-system following 20 years of application in NMT support selection, in Felsbau Vol.12, No.6, pp.428-436. 5. Speers, C.R., 1992. Support of tunnels subjected to changing rock loads: a comparison of design methods. Tunnelling and Underground Space Technology, Vol.7, No.1, pp.25-32. 6. Milne, D., J. Hadjigeorgiou and R. Pakalnis,
1998. Rock mass characterization for underground hard rock mines, Tunnel and Underg Space Tech, Vol.13, No.4, pp.383-391. 7. Stille, H. and A. Palmstrom, 2003. Classification as a tool in rock engineering. Tunnelling and Underground Space Technology. Vol.18, pp. 331-345. 7. Palmstrom, A. and E. Broch, 2006., Use and misuse of rock mass classification systems with particular reference to the Q-system, Tunnel and Underground Space Tec, Vol. 21, 3, pp.575-593. 9. Pells, P. N. and R. Bertuzzi, 2008. Discussion on article titled “Use and misuse of rock mass classification systems” Tunnel and Underground Space Technology, Vol. 23, pp.340-350. 10. Rocscience, 2003. Unwedge Version 3.0, www.rocscience.com, Toronto. 11. Itasca Consulting, 2004. Universal Distinct Element Code User’s Guide. Minneapolis 12. Ratanasatayanont, A., 1984. Rock mass classification for some engineering purposes along the diversion tunnel at Chiew Larn damsite, Surat Thani. MSc Thesis, Asian Inst of Tech, Thailand, 147p. 13. Ranasooriya, J., 1985. Design of rock support for the Chiew Larn power tunnel. MSc Thesis, Asian Inst of Tech, Thailand, 133p. 14. Lasao, M.L., 1986. Design of rock support for the Huai Saphan Hin power tunnel, MSc Thesis, Asian Inst of Tech, Thailand, 136p. 15. Barton, N.R. and V. Choubey, 1977, The shear strength of rock joints in theory and practice. Rock Mech. Vol.10(1-2), pp.1-54. 16. Barton, N., 2002. Some new Q-value correlations to assist in site characterisation and tunnel design. Int. J of Rock Mechanics and Mining Sciences, Vol.39, pp.185-216.
1
1. INTRODUCTION
Design of support for preventing instability in underground openings created in jointed rock formations can be undertaken by limit equilibrium analysis, numerical simulation or rock mass classification methods. The classification methods such as RMR [1] and Q [2] are sometimes preferred to other methods for the ease of their application at any stage of a project, even if detailed information on the rock mass is lacking. However, as with any other design tool, the rock mass classification methods also have limitations and, in some instances, the support designed by these methods may not be reliable [3, 4].
Under a given set of conditions, the reliability of support designed by classification methods may be assessed by comparing them with those derived by other applicable methods and also with the actual support installed. Such an assessment can be carried out efficiently during excavation of an underground opening by close observation and monitoring of the intersected ground conditions.
This paper presents an assessment of the support derived by RMR and Q for a tunnel driven through a jointed sedimentary rock formation. The two methods were applied during construction of the tunnel by project site personnel [5]. The support
measures derived by the two methods were subsequently assessed by limit equilibrium analyses of rock block stability and numerical simulation of the rock mass behaviour around the tunnel. Further, the support measures derived by the classification methods were compared with the support installed.
2. THE CASE TUNNEL
The tunnel considered in this study is part of the Lam Ta Khong pumped storage project situated some 200 km northeast of Bangkok, Thailand. It is the main access route to the underground power station constructed between 1992 and 1997. The D-shape tunnel has a span of 6.8 m and a length of 1390 m. Its alignment is approximately 107o with a downward slope of 1:12 (V:H) towards the power station. The tunnel overburden varies from about 15 m at the entrance portal to approximately 350 m at the powerhouse end. The tunnel was driven by conventional drill and blast methods and instrumented for convergence monitoring [5].
The project consisting of several major tunnels was designed by the Electric Power Development Co Ltd (EPDC) of Japan for the Electricity Generating Authority of Thailand [5]. Throughout the project, standard tunnel support systems comprising rock bolt, shotcrete, welded wire mesh and steel sets
AN ASSESSMENT OF ROCK MASS CLASSIFICATION METHODS USED FOR TUNNEL SUPPORT DESIGN
Ranasooriya, J. Resources Safety, Perth, Australia
Nikraz, H. Curtin University, Perth, Australia
ABSTRACT: The support measures determined by RMR and Q rock mass classification methods for an access tunnel driven through jointed sedimentary rocks were compared with the support derived by limit equilibrium analyses of rock block stability and numerical simulation of the rock mass. The study indicates that the support measures recommended by the two classification methods are generally adequate, but under some of the conditions encountered in the tunnel, they do not necessarily meet the stability requirements.
Keywords: Rock mass; Classification; Tunnel; Support; Design
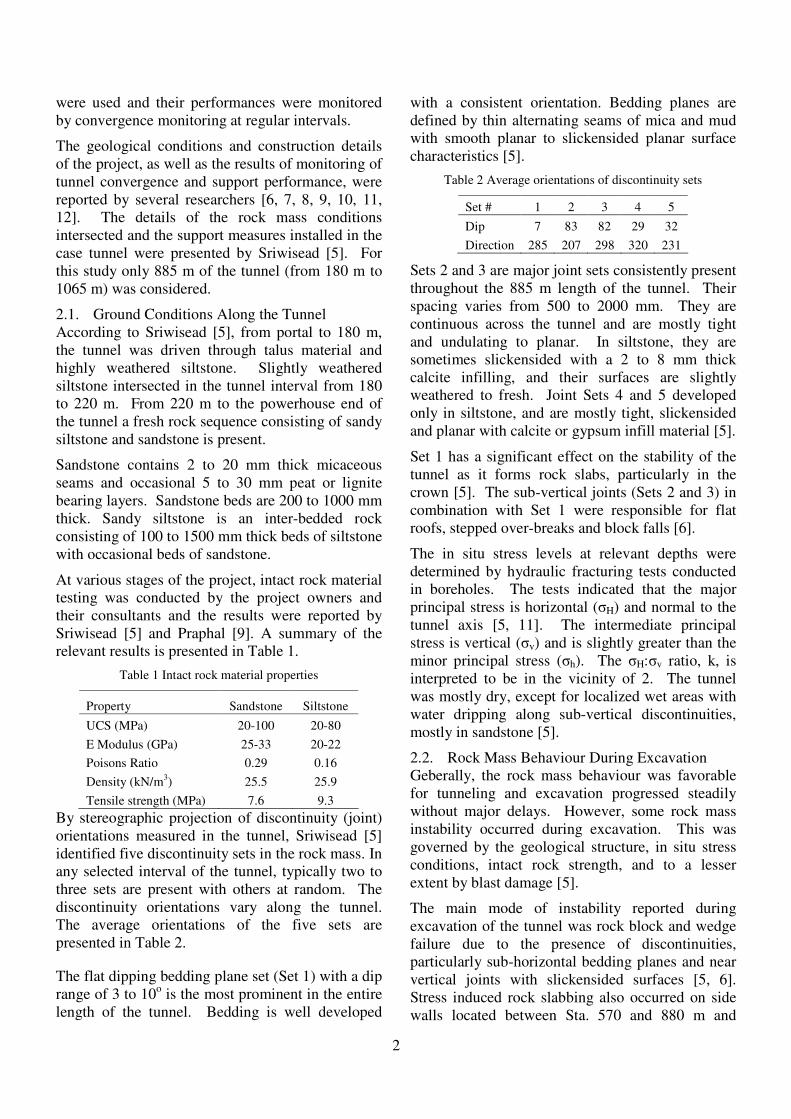
2
were used and their performances were monitored by convergence monitoring at regular intervals.
The geological conditions and construction details of the project, as well as the results of monitoring of tunnel convergence and support performance, were reported by several researchers [6, 7, 8, 9, 10, 11, 12]. The details of the rock mass conditions intersected and the support measures installed in the case tunnel were presented by Sriwisead [5]. For this study only 885 m of the tunnel (from 180 m to 1065 m) was considered.
2.1. Ground Conditions Along the Tunnel According to Sriwisead [5], from portal to 180 m, the tunnel was driven through talus material and highly weathered siltstone. Slightly weathered siltstone intersected in the tunnel interval from 180 to 220 m. From 220 m to the powerhouse end of the tunnel a fresh rock sequence consisting of sandy siltstone and sandstone is present.
Sandstone contains 2 to 20 mm thick micaceous seams and occasional 5 to 30 mm peat or lignite bearing layers. Sandstone beds are 200 to 1000 mm thick. Sandy siltstone is an inter-bedded rock consisting of 100 to 1500 mm thick beds of siltstone with occasional beds of sandstone.
At various stages of the project, intact rock material testing was conducted by the project owners and their consultants and the results were reported by Sriwisead [5] and Praphal [9]. A summary of the relevant results is presented in Table 1.
Table 1 Intact rock material properties
Property Sandstone Siltstone
UCS (MPa) 20-100 20-80
E Modulus (GPa) 25-33 20-22 Poisons Ratio 0.29 0.16 Density (kN/m3) 25.5 25.9 Tensile strength (MPa) 7.6 9.3
By stereographic projection of discontinuity (joint) orientations measured in the tunnel, Sriwisead [5] identified five discontinuity sets in the rock mass. In any selected interval of the tunnel, typically two to three sets are present with others at random. The discontinuity orientations vary along the tunnel. The average orientations of the five sets are presented in Table 2.
The flat dipping bedding plane set (Set 1) with a dip range of 3 to 10o is the most prominent in the entire length of the tunnel. Bedding is well developed
with a consistent orientation. Bedding planes are defined by thin alternating seams of mica and mud with smooth planar to slickensided planar surface characteristics [5].
Table 2 Average orientations of discontinuity sets
Set # 1 2 3 4 5 Dip 7 83 82 29 32 Direction 285 207 298 320 231
Sets 2 and 3 are major joint sets consistently present throughout the 885 m length of the tunnel. Their spacing varies from 500 to 2000 mm. They are continuous across the tunnel and are mostly tight and undulating to planar. In siltstone, they are sometimes slickensided with a 2 to 8 mm thick calcite infilling, and their surfaces are slightly weathered to fresh. Joint Sets 4 and 5 developed only in siltstone, and are mostly tight, slickensided and planar with calcite or gypsum infill material [5].
Set 1 has a significant effect on the stability of the tunnel as it forms rock slabs, particularly in the crown [5]. The sub-vertical joints (Sets 2 and 3) in combination with Set 1 were responsible for flat roofs, stepped over-breaks and block falls [6].
The in situ stress levels at relevant depths were determined by hydraulic fracturing tests conducted in boreholes. The tests indicated that the major principal stress is horizontal (�H) and normal to the tunnel axis [5, 11]. The intermediate principal stress is vertical (�v) and is slightly greater than the minor principal stress (�h). The �H:�v ratio, k, is interpreted to be in the vicinity of 2. The tunnel was mostly dry, except for localized wet areas with water dripping along sub-vertical discontinuities, mostly in sandstone [5].
2.2. Rock Mass Behaviour During Excavation Geberally, the rock mass behaviour was favorable for tunneling and excavation progressed steadily without major delays. However, some rock mass instability occurred during excavation. This was governed by the geological structure, in situ stress conditions, intact rock strength, and to a lesser extent by blast damage [5].
The main mode of instability reported during excavation of the tunnel was rock block and wedge failure due to the presence of discontinuities, particularly sub-horizontal bedding planes and near vertical joints with slickensided surfaces [5, 6]. Stress induced rock slabbing also occurred on side walls located between Sta. 570 and 880 m and
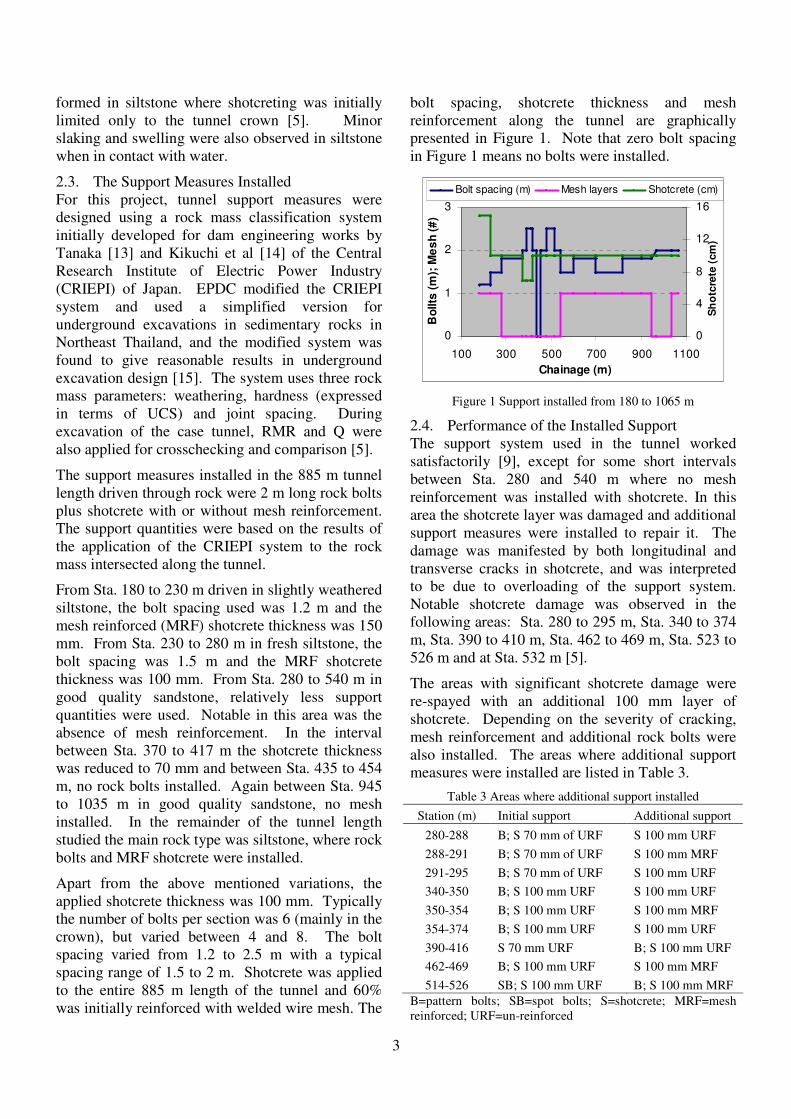
3
formed in siltstone where shotcreting was initially limited only to the tunnel crown [5]. Minor slaking and swelling were also observed in siltstone when in contact with water.
2.3. The Support Measures Installed For this project, tunnel support measures were designed using a rock mass classification system initially developed for dam engineering works by Tanaka [13] and Kikuchi et al [14] of the Central Research Institute of Electric Power Industry (CRIEPI) of Japan. EPDC modified the CRIEPI system and used a simplified version for underground excavations in sedimentary rocks in Northeast Thailand, and the modified system was found to give reasonable results in underground excavation design [15]. The system uses three rock mass parameters: weathering, hardness (expressed in terms of UCS) and joint spacing. During excavation of the case tunnel, RMR and Q were also applied for crosschecking and comparison [5].
The support measures installed in the 885 m tunnel length driven through rock were 2 m long rock bolts plus shotcrete with or without mesh reinforcement. The support quantities were based on the results of the application of the CRIEPI system to the rock mass intersected along the tunnel.
From Sta. 180 to 230 m driven in slightly weathered siltstone, the bolt spacing used was 1.2 m and the mesh reinforced (MRF) shotcrete thickness was 150 mm. From Sta. 230 to 280 m in fresh siltstone, the bolt spacing was 1.5 m and the MRF shotcrete thickness was 100 mm. From Sta. 280 to 540 m in good quality sandstone, relatively less support quantities were used. Notable in this area was the absence of mesh reinforcement. In the interval between Sta. 370 to 417 m the shotcrete thickness was reduced to 70 mm and between Sta. 435 to 454 m, no rock bolts installed. Again between Sta. 945 to 1035 m in good quality sandstone, no mesh installed. In the remainder of the tunnel length studied the main rock type was siltstone, where rock bolts and MRF shotcrete were installed.
Apart from the above mentioned variations, the applied shotcrete thickness was 100 mm. Typically the number of bolts per section was 6 (mainly in the crown), but varied between 4 and 8. The bolt spacing varied from 1.2 to 2.5 m with a typical spacing range of 1.5 to 2 m. Shotcrete was applied to the entire 885 m length of the tunnel and 60% was initially reinforced with welded wire mesh. The
bolt spacing, shotcrete thickness and mesh reinforcement along the tunnel are graphically presented in Figure 1. Note that zero bolt spacing in Figure 1 means no bolts were installed.
0
1
2
3
100 300 500 700 900 1100Chainage (m)
Bol
lts (m
); M
esh
(#)
0
4
8
12
16
Sh
otc
rete
(cm
)
Bolt spacing (m) Mesh layers Shotcrete (cm)
Figure 1 Support installed from 180 to 1065 m
2.4. Performance of the Installed Support The support system used in the tunnel worked satisfactorily [9], except for some short intervals between Sta. 280 and 540 m where no mesh reinforcement was installed with shotcrete. In this area the shotcrete layer was damaged and additional support measures were installed to repair it. The damage was manifested by both longitudinal and transverse cracks in shotcrete, and was interpreted to be due to overloading of the support system. Notable shotcrete damage was observed in the following areas: Sta. 280 to 295 m, Sta. 340 to 374 m, Sta. 390 to 410 m, Sta. 462 to 469 m, Sta. 523 to 526 m and at Sta. 532 m [5].
The areas with significant shotcrete damage were re-spayed with an additional 100 mm layer of shotcrete. Depending on the severity of cracking, mesh reinforcement and additional rock bolts were also installed. The areas where additional support measures were installed are listed in Table 3.
Table 3 Areas where additional support installed Station (m) Initial support Additional support
280-288 B; S 70 mm of URF S 100 mm URF 288-291 B; S 70 mm of URF S 100 mm MRF 291-295 B; S 70 mm of URF S 100 mm URF 340-350 B; S 100 mm URF S 100 mm URF 350-354 B; S 100 mm URF S 100 mm MRF 354-374 B; S 100 mm URF S 100 mm URF 390-416 S 70 mm URF B; S 100 mm URF 462-469 B; S 100 mm URF S 100 mm MRF 514-526 SB; S 100 mm URF B; S 100 mm MRF
B=pattern bolts; SB=spot bolts; S=shotcrete; MRF=mesh reinforced; URF=un-reinforced
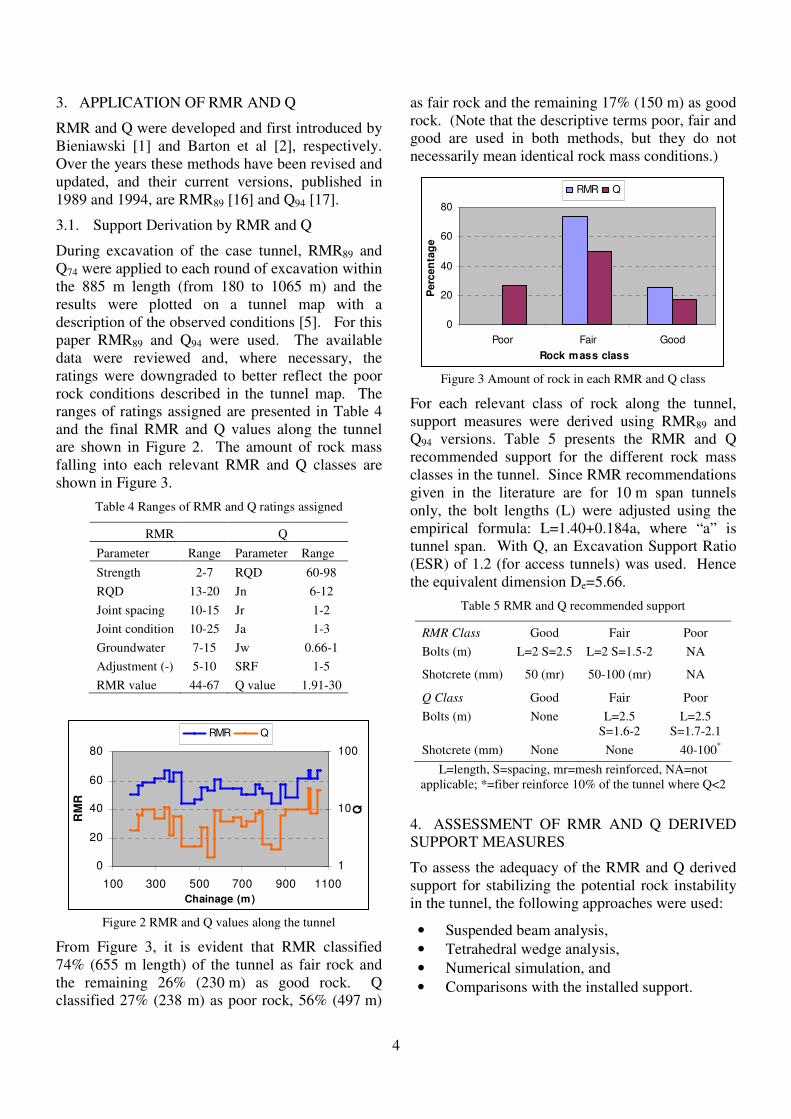
4
3. APPLICATION OF RMR AND Q
RMR and Q were developed and first introduced by Bieniawski [1] and Barton et al [2], respectively. Over the years these methods have been revised and updated, and their current versions, published in 1989 and 1994, are RMR89 [16] and Q94 [17].
3.1. Support Derivation by RMR and Q
During excavation of the case tunnel, RMR89 and Q74 were applied to each round of excavation within the 885 m length (from 180 to 1065 m) and the results were plotted on a tunnel map with a description of the observed conditions [5]. For this paper RMR89 and Q94 were used. The available data were reviewed and, where necessary, the ratings were downgraded to better reflect the poor rock conditions described in the tunnel map. The ranges of ratings assigned are presented in Table 4 and the final RMR and Q values along the tunnel are shown in Figure 2. The amount of rock mass falling into each relevant RMR and Q classes are shown in Figure 3.
Table 4 Ranges of RMR and Q ratings assigned
RMR Q Parameter Range Parameter Range Strength 2-7 RQD 60-98 RQD 13-20 Jn 6-12 Joint spacing 10-15 Jr 1-2 Joint condition 10-25 Ja 1-3 Groundwater 7-15 Jw 0.66-1 Adjustment (-) 5-10 SRF 1-5 RMR value 44-67 Q value 1.91-30
0
20
40
60
80
100 300 500 700 900 1100Chainage (m)
RM
R
1
10
100
Q
RMR Q
Figure 2 RMR and Q values along the tunnel
From Figure 3, it is evident that RMR classified 74% (655 m length) of the tunnel as fair rock and the remaining 26% (230 m) as good rock. Q classified 27% (238 m) as poor rock, 56% (497 m)
as fair rock and the remaining 17% (150 m) as good rock. (Note that the descriptive terms poor, fair and good are used in both methods, but they do not necessarily mean identical rock mass conditions.)
0
20
40
60
80
Poor Fair GoodRock mass class
Per
cen
tag
e
RMR Q
Figure 3 Amount of rock in each RMR and Q class
For each relevant class of rock along the tunnel, support measures were derived using RMR89 and Q94 versions. Table 5 presents the RMR and Q recommended support for the different rock mass classes in the tunnel. Since RMR recommendations given in the literature are for 10 m span tunnels only, the bolt lengths (L) were adjusted using the empirical formula: L=1.40+0.184a, where “a” is tunnel span. With Q, an Excavation Support Ratio (ESR) of 1.2 (for access tunnels) was used. Hence the equivalent dimension De=5.66.
Table 5 RMR and Q recommended support
RMR Class Good Fair Poor Bolts (m) L=2 S=2.5 L=2 S=1.5-2 NA
Shotcrete (mm) 50 (mr) 50-100 (mr) NA
Q Class Good Fair Poor Bolts (m) None L=2.5
S=1.6-2 L=2.5
S=1.7-2.1 Shotcrete (mm) None None 40-100*
L=length, S=spacing, mr=mesh reinforced, NA=not applicable; *=fiber reinforce 10% of the tunnel where Q<2
4. ASSESSMENT OF RMR AND Q DERIVED SUPPORT MEASURES
To assess the adequacy of the RMR and Q derived support for stabilizing the potential rock instability in the tunnel, the following approaches were used:
• Suspended beam analysis, • Tetrahedral wedge analysis, • Numerical simulation, and • Comparisons with the installed support.
5
4.1. Suspended Beam Analysis The presence of sub-horizontal bedding planes and near vertical joints parallel to and normal to the tunnel axis creates a structural setup for rock beams to be formed in the roof. The support required for stabilizing the potentially unstable rock beams was determined by a conservative analysis using the suspended beam concept. The analysis assumed that the weight of the rock in the unstable zone is supported entirely by the force developed in the rock bolts anchored in the overlying solid rock. Ignoring the effect of shear and flexural strengths of the strata and the in situ stress field around the tunnel, the required bolt spacing was determined by
S = (T/� D F)1/2 (1)
Where S = rock bolt spacing on both longitudinal and transverse directions, T = ultimate load capacity per rock bolt, D = thickness of unstable rock beam, � = unit weight of the rock, and F = required factor of safety against failure for long term roof stability, which is assumed to be 2.0 for this study.
As mentioned in Section 2.1, sandstone and sandy siltstone beds are up to 1 m and 1.5 m in thickness, respectively. Their respective unit weights are 25.5 and 25.9 kN/m3. If 100% bond efficiency cement grouted bolts with an ultimate tensile strength of 180 kN were to be installed normal to the rock face, the required bolt spacing for 1.5 m thick sandy siltstone beds is 1.5 m and that for 1 m thick sandstone beds is 1.8 m.
It can be seen from Table 5 that the bolt spacing recommended by RMR for fair rock class and that by Q for fair and poor rock classes are comparable to the range of bolt spacing (1.5 to 1.8 m for the maximum bed thicknesses) determined by the beam analysis. For good rock RMR recommended a bolt spacing of 2.5 m. Since RMR also recommended 50 mm of mesh reinforced shotcrete, the combined support system is likely to be sufficient to control beam instability. In the case of Q, although beam instability is possible in good rock class, no support was recommended.
4.2. Tetrahedral Rock Wedge Stability Analysis A tetrahedral rock wedge stability analysis was undertaken using UNWEDGE software code [18].
To compute wedge factors of safety (F) the shear strength parameters of the discontinuities were estimated considering their surface characteristics described earlier. The selected parameters were
c=20kPa and �=30o. Two stress scenarios were considered. First the analysis assumed that the wedges are subjected to gravity loading only with no effect from the in situ stress field. It then included an in situ stress field assumed to be due to the weight of the overlying rock with k=2.
The analysis showed that several rock wedges are kinematically possible and most of them are stable under the joint shear strength and in situ stress conditions considered. The details of three roof wedges that have no significant stabilizing effect from the in situ stress field are listed in Table 4. The wedge factors of safety without and with the effect of the stress field are given as F1 and F2, respectively, when the overburden thickness is about 100 m.
Table 6 Kinematically possible rock wedges in roof
Sets Apex (m) Weight (kN) F1 F2
123 1.1 73 0.63 0.80 234 1.3 53 0.98 1.09 235 0.6 13 1.32 0.83
The stability of these wedges was then examined under the support recommended by the two classification methods. The analysis showed that, RMR derived support for the entire 885 m length of the tunnel and Q derived support for poor and fair classes of rock are sufficient for stabilizing the possible rock wedges. However, Q recommended no support for good rock class, which represents approximately 17% of the tunnel length studied, where wedge instability was possible.
It should be noted that the analysis considered only the maximum size rock wedges that can be formed. The actual wedges may be smaller and may fall between the rock bolts installed in a standard pattern. To address this possibility, spot bolting and/or shotcreting may be required. However, the Q recommendation for fair rock is pattern bolting only and that for good rock class is no support. These two classes represent 73% of the tunnel.
4.3. Numerical Modeling For jointed rock formations with Q values between 0.1 and 100, UDEC [19] is considered suitable for two dimensional simulations of the behaviour of rock mass around an underground opening [20]. In the case tunnel, the Q values ranged between 1.9 and 30, hence UDEC (Version 4.0) could be used for verifying the adequacy of the support derived by the two classification methods.
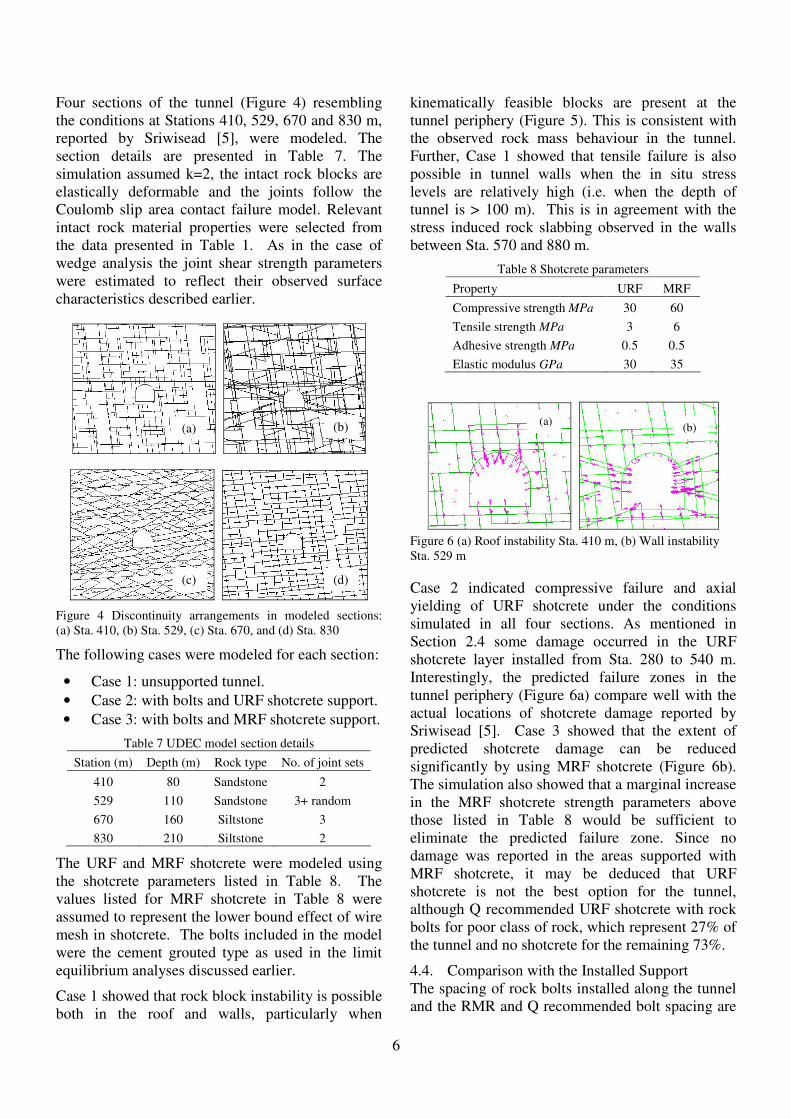
6
Four sections of the tunnel (Figure 4) resembling the conditions at Stations 410, 529, 670 and 830 m, reported by Sriwisead [5], were modeled. The section details are presented in Table 7. The simulation assumed k=2, the intact rock blocks are elastically deformable and the joints follow the Coulomb slip area contact failure model. Relevant intact rock material properties were selected from the data presented in Table 1. As in the case of wedge analysis the joint shear strength parameters were estimated to reflect their observed surface characteristics described earlier.
Figure 4 Discontinuity arrangements in modeled sections: (a) Sta. 410, (b) Sta. 529, (c) Sta. 670, and (d) Sta. 830
The following cases were modeled for each section:
• Case 1: unsupported tunnel. • Case 2: with bolts and URF shotcrete support. • Case 3: with bolts and MRF shotcrete support.
Table 7 UDEC model section details Station (m) Depth (m) Rock type No. of joint sets
410 80 Sandstone 2 529 110 Sandstone 3+ random 670 160 Siltstone 3 830 210 Siltstone 2
The URF and MRF shotcrete were modeled using the shotcrete parameters listed in Table 8. The values listed for MRF shotcrete in Table 8 were assumed to represent the lower bound effect of wire mesh in shotcrete. The bolts included in the model were the cement grouted type as used in the limit equilibrium analyses discussed earlier.
Case 1 showed that rock block instability is possible both in the roof and walls, particularly when
kinematically feasible blocks are present at the tunnel periphery (Figure 5). This is consistent with the observed rock mass behaviour in the tunnel. Further, Case 1 showed that tensile failure is also possible in tunnel walls when the in situ stress levels are relatively high (i.e. when the depth of tunnel is > 100 m). This is in agreement with the stress induced rock slabbing observed in the walls between Sta. 570 and 880 m.
Table 8 Shotcrete parameters
Property URF MRF Compressive strength MPa 30 60 Tensile strength MPa 3 6 Adhesive strength MPa 0.5 0.5 Elastic modulus GPa 30 35
Figure 6 (a) Roof instability Sta. 410 m, (b) Wall instability Sta. 529 m
Case 2 indicated compressive failure and axial yielding of URF shotcrete under the conditions simulated in all four sections. As mentioned in Section 2.4 some damage occurred in the URF shotcrete layer installed from Sta. 280 to 540 m. Interestingly, the predicted failure zones in the tunnel periphery (Figure 6a) compare well with the actual locations of shotcrete damage reported by Sriwisead [5]. Case 3 showed that the extent of predicted shotcrete damage can be reduced significantly by using MRF shotcrete (Figure 6b). The simulation also showed that a marginal increase in the MRF shotcrete strength parameters above those listed in Table 8 would be sufficient to eliminate the predicted failure zone. Since no damage was reported in the areas supported with MRF shotcrete, it may be deduced that URF shotcrete is not the best option for the tunnel, although Q recommended URF shotcrete with rock bolts for poor class of rock, which represent 27% of the tunnel and no shotcrete for the remaining 73%.
4.4. Comparison with the Installed Support The spacing of rock bolts installed along the tunnel and the RMR and Q recommended bolt spacing are
(d)
(a) (b)
(c)
(a) (b)
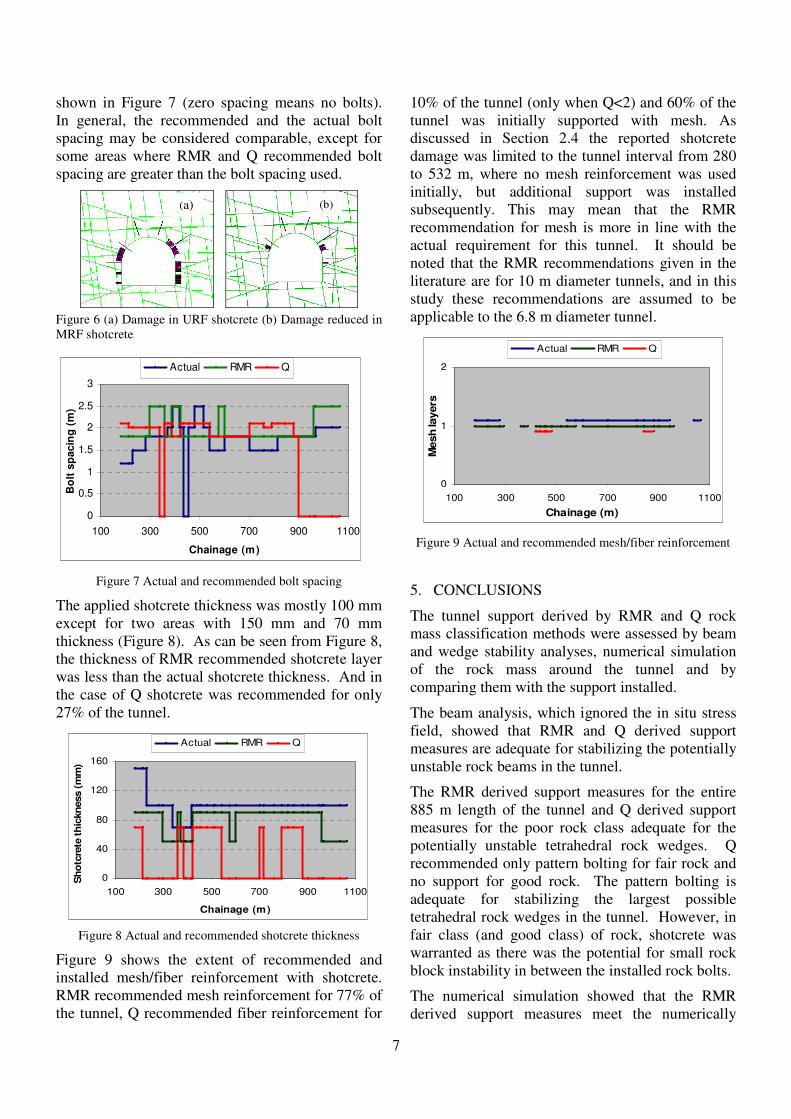
7
shown in Figure 7 (zero spacing means no bolts). In general, the recommended and the actual bolt spacing may be considered comparable, except for some areas where RMR and Q recommended bolt spacing are greater than the bolt spacing used.
Figure 6 (a) Damage in URF shotcrete (b) Damage reduced in MRF shotcrete
0
0.5
1
1.5
2
2.5
3
100 300 500 700 900 1100
Chainage (m)
Bol
t spa
cin
g (m
)
Actual RMR Q
Figure 7 Actual and recommended bolt spacing
The applied shotcrete thickness was mostly 100 mm except for two areas with 150 mm and 70 mm thickness (Figure 8). As can be seen from Figure 8, the thickness of RMR recommended shotcrete layer was less than the actual shotcrete thickness. And in the case of Q shotcrete was recommended for only 27% of the tunnel.
0
40
80
120
160
100 300 500 700 900 1100
Chainage (m)
Sh
otc
rete
th
ickn
ess
(mm
)
Actual RMR Q
Figure 8 Actual and recommended shotcrete thickness
Figure 9 shows the extent of recommended and installed mesh/fiber reinforcement with shotcrete. RMR recommended mesh reinforcement for 77% of the tunnel, Q recommended fiber reinforcement for
10% of the tunnel (only when Q<2) and 60% of the tunnel was initially supported with mesh. As discussed in Section 2.4 the reported shotcrete damage was limited to the tunnel interval from 280 to 532 m, where no mesh reinforcement was used initially, but additional support was installed subsequently. This may mean that the RMR recommendation for mesh is more in line with the actual requirement for this tunnel. It should be noted that the RMR recommendations given in the literature are for 10 m diameter tunnels, and in this study these recommendations are assumed to be applicable to the 6.8 m diameter tunnel.
0
1
2
100 300 500 700 900 1100
Chainage (m)
Mes
h la
yers
Actual RMR Q
Figure 9 Actual and recommended mesh/fiber reinforcement
5. CONCLUSIONS
The tunnel support derived by RMR and Q rock mass classification methods were assessed by beam and wedge stability analyses, numerical simulation of the rock mass around the tunnel and by comparing them with the support installed.
The beam analysis, which ignored the in situ stress field, showed that RMR and Q derived support measures are adequate for stabilizing the potentially unstable rock beams in the tunnel.
The RMR derived support measures for the entire 885 m length of the tunnel and Q derived support measures for the poor rock class adequate for the potentially unstable tetrahedral rock wedges. Q recommended only pattern bolting for fair rock and no support for good rock. The pattern bolting is adequate for stabilizing the largest possible tetrahedral rock wedges in the tunnel. However, in fair class (and good class) of rock, shotcrete was warranted as there was the potential for small rock block instability in between the installed rock bolts.
The numerical simulation showed that the RMR derived support measures meet the numerically
(a) (b)
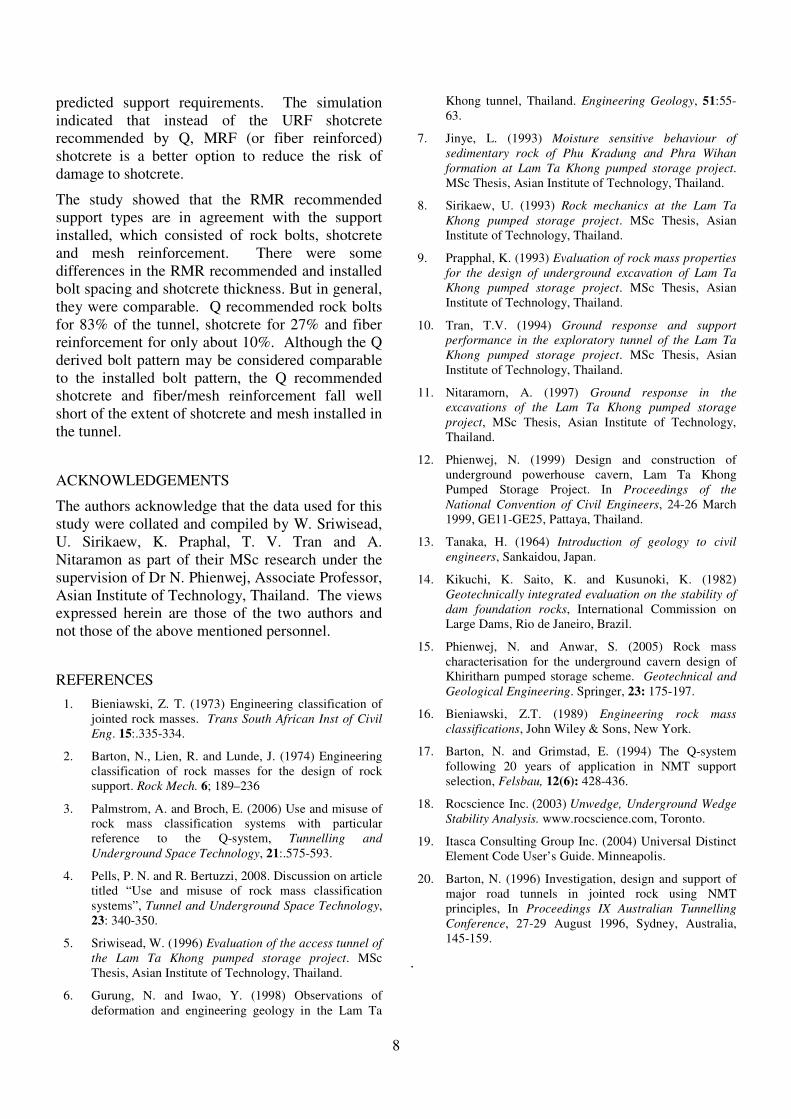
8
predicted support requirements. The simulation indicated that instead of the URF shotcrete recommended by Q, MRF (or fiber reinforced) shotcrete is a better option to reduce the risk of damage to shotcrete.
The study showed that the RMR recommended support types are in agreement with the support installed, which consisted of rock bolts, shotcrete and mesh reinforcement. There were some differences in the RMR recommended and installed bolt spacing and shotcrete thickness. But in general, they were comparable. Q recommended rock bolts for 83% of the tunnel, shotcrete for 27% and fiber reinforcement for only about 10%. Although the Q derived bolt pattern may be considered comparable to the installed bolt pattern, the Q recommended shotcrete and fiber/mesh reinforcement fall well short of the extent of shotcrete and mesh installed in the tunnel.
ACKNOWLEDGEMENTS
The authors acknowledge that the data used for this study were collated and compiled by W. Sriwisead, U. Sirikaew, K. Praphal, T. V. Tran and A. Nitaramon as part of their MSc research under the supervision of Dr N. Phienwej, Associate Professor, Asian Institute of Technology, Thailand. The views expressed herein are those of the two authors and not those of the above mentioned personnel.
REFERENCES 1. Bieniawski, Z. T. (1973) Engineering classification of
jointed rock masses. Trans South African Inst of Civil Eng. 15:.335-334.
2. Barton, N., Lien, R. and Lunde, J. (1974) Engineering classification of rock masses for the design of rock support. Rock Mech. 6; 189–236
3. Palmstrom, A. and Broch, E. (2006) Use and misuse of rock mass classification systems with particular reference to the Q-system, Tunnelling and Underground Space Technology, 21:.575-593.
4. Pells, P. N. and R. Bertuzzi, 2008. Discussion on article titled “Use and misuse of rock mass classification systems”, Tunnel and Underground Space Technology, 23: 340-350.
5. Sriwisead, W. (1996) Evaluation of the access tunnel of the Lam Ta Khong pumped storage project. MSc Thesis, Asian Institute of Technology, Thailand.
6. Gurung, N. and Iwao, Y. (1998) Observations of deformation and engineering geology in the Lam Ta
Khong tunnel, Thailand. Engineering Geology, 51:55-63.
7. Jinye, L. (1993) Moisture sensitive behaviour of sedimentary rock of Phu Kradung and Phra Wihan formation at Lam Ta Khong pumped storage project. MSc Thesis, Asian Institute of Technology, Thailand.
8. Sirikaew, U. (1993) Rock mechanics at the Lam Ta Khong pumped storage project. MSc Thesis, Asian Institute of Technology, Thailand.
9. Prapphal, K. (1993) Evaluation of rock mass properties for the design of underground excavation of Lam Ta Khong pumped storage project. MSc Thesis, Asian Institute of Technology, Thailand.
10. Tran, T.V. (1994) Ground response and support performance in the exploratory tunnel of the Lam Ta Khong pumped storage project. MSc Thesis, Asian Institute of Technology, Thailand.
11. Nitaramorn, A. (1997) Ground response in the excavations of the Lam Ta Khong pumped storage project, MSc Thesis, Asian Institute of Technology, Thailand.
12. Phienwej, N. (1999) Design and construction of underground powerhouse cavern, Lam Ta Khong Pumped Storage Project. In Proceedings of the National Convention of Civil Engineers, 24-26 March 1999, GE11-GE25, Pattaya, Thailand.
13. Tanaka, H. (1964) Introduction of geology to civil engineers, Sankaidou, Japan.
14. Kikuchi, K. Saito, K. and Kusunoki, K. (1982) Geotechnically integrated evaluation on the stability of dam foundation rocks, International Commission on Large Dams, Rio de Janeiro, Brazil.
15. Phienwej, N. and Anwar, S. (2005) Rock mass characterisation for the underground cavern design of Khiritharn pumped storage scheme. Geotechnical and Geological Engineering. Springer, 23: 175-197.
16. Bieniawski, Z.T. (1989) Engineering rock mass classifications, John Wiley & Sons, New York.
17. Barton, N. and Grimstad, E. (1994) The Q-system following 20 years of application in NMT support selection, Felsbau, 12(6): 428-436.
18. Rocscience Inc. (2003) Unwedge, Underground Wedge Stability Analysis. www.rocscience.com, Toronto.
19. Itasca Consulting Group Inc. (2004) Universal Distinct Element Code User’s Guide. Minneapolis.
20. Barton, N. (1996) Investigation, design and support of major road tunnels in jointed rock using NMT principles, In Proceedings IX Australian Tunnelling Conference, 27-29 August 1996, Sydney, Australia, 145-159.
.
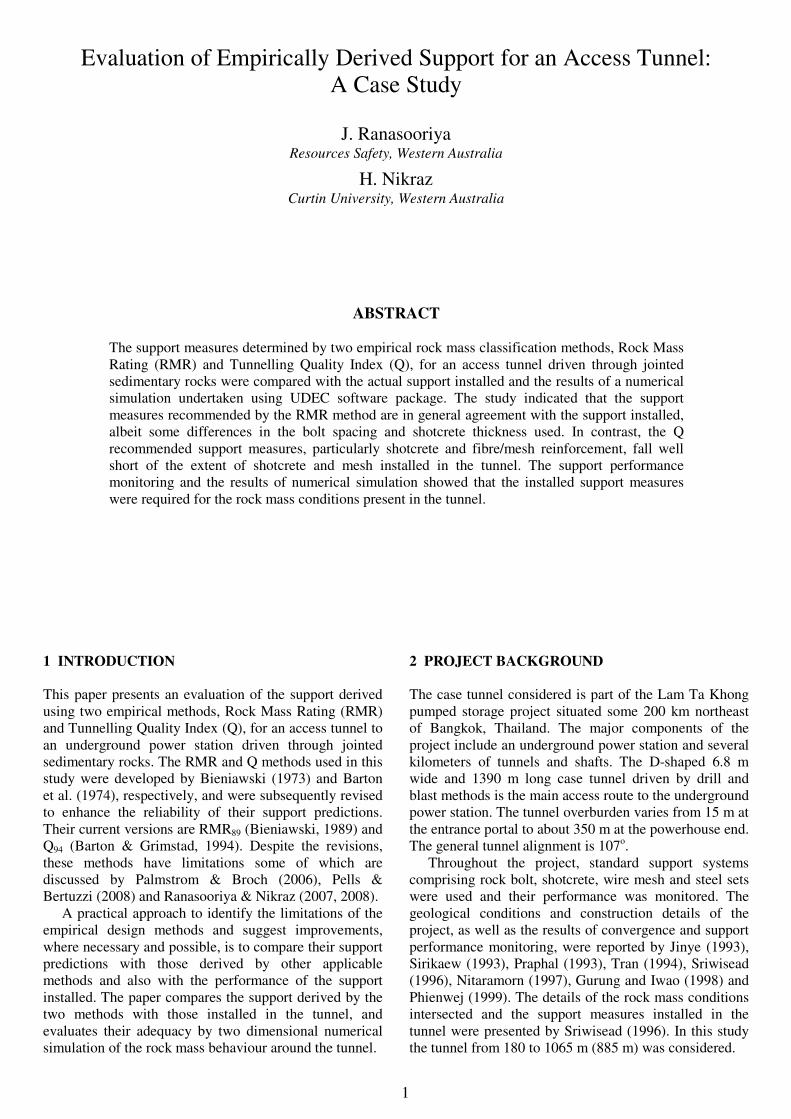
1
1 INTRODUCTION This paper presents an evaluation of the support derived using two empirical methods, Rock Mass Rating (RMR) and Tunnelling Quality Index (Q), for an access tunnel to an underground power station driven through jointed sedimentary rocks. The RMR and Q methods used in this study were developed by Bieniawski (1973) and Barton et al. (1974), respectively, and were subsequently revised to enhance the reliability of their support predictions. Their current versions are RMR89 (Bieniawski, 1989) and Q94 (Barton & Grimstad, 1994). Despite the revisions, these methods have limitations some of which are discussed by Palmstrom & Broch (2006), Pells & Bertuzzi (2008) and Ranasooriya & Nikraz (2007, 2008).
A practical approach to identify the limitations of the empirical design methods and suggest improvements, where necessary and possible, is to compare their support predictions with those derived by other applicable methods and also with the performance of the support installed. The paper compares the support derived by the two methods with those installed in the tunnel, and evaluates their adequacy by two dimensional numerical simulation of the rock mass behaviour around the tunnel.
2 PROJECT BACKGROUND The case tunnel considered is part of the Lam Ta Khong pumped storage project situated some 200 km northeast of Bangkok, Thailand. The major components of the project include an underground power station and several kilometers of tunnels and shafts. The D-shaped 6.8 m wide and 1390 m long case tunnel driven by drill and blast methods is the main access route to the underground power station. The tunnel overburden varies from 15 m at the entrance portal to about 350 m at the powerhouse end. The general tunnel alignment is 107o.
Throughout the project, standard support systems comprising rock bolt, shotcrete, wire mesh and steel sets were used and their performance was monitored. The geological conditions and construction details of the project, as well as the results of convergence and support performance monitoring, were reported by Jinye (1993), Sirikaew (1993), Praphal (1993), Tran (1994), Sriwisead (1996), Nitaramorn (1997), Gurung and Iwao (1998) and Phienwej (1999). The details of the rock mass conditions intersected and the support measures installed in the tunnel were presented by Sriwisead (1996). In this study the tunnel from 180 to 1065 m (885 m) was considered.
ABSTRACT
The support measures determined by two empirical rock mass classification methods, Rock Mass Rating (RMR) and Tunnelling Quality Index (Q), for an access tunnel driven through jointed sedimentary rocks were compared with the actual support installed and the results of a numerical simulation undertaken using UDEC software package. The study indicated that the support measures recommended by the RMR method are in general agreement with the support installed, albeit some differences in the bolt spacing and shotcrete thickness used. In contrast, the Q recommended support measures, particularly shotcrete and fibre/mesh reinforcement, fall well short of the extent of shotcrete and mesh installed in the tunnel. The support performance monitoring and the results of numerical simulation showed that the installed support measures were required for the rock mass conditions present in the tunnel.
Evaluation of Empirically Derived Support for an Access Tunnel: A Case Study
J. Ranasooriya Resources Safety, Western Australia
H. Nikraz Curtin University, Western Australia
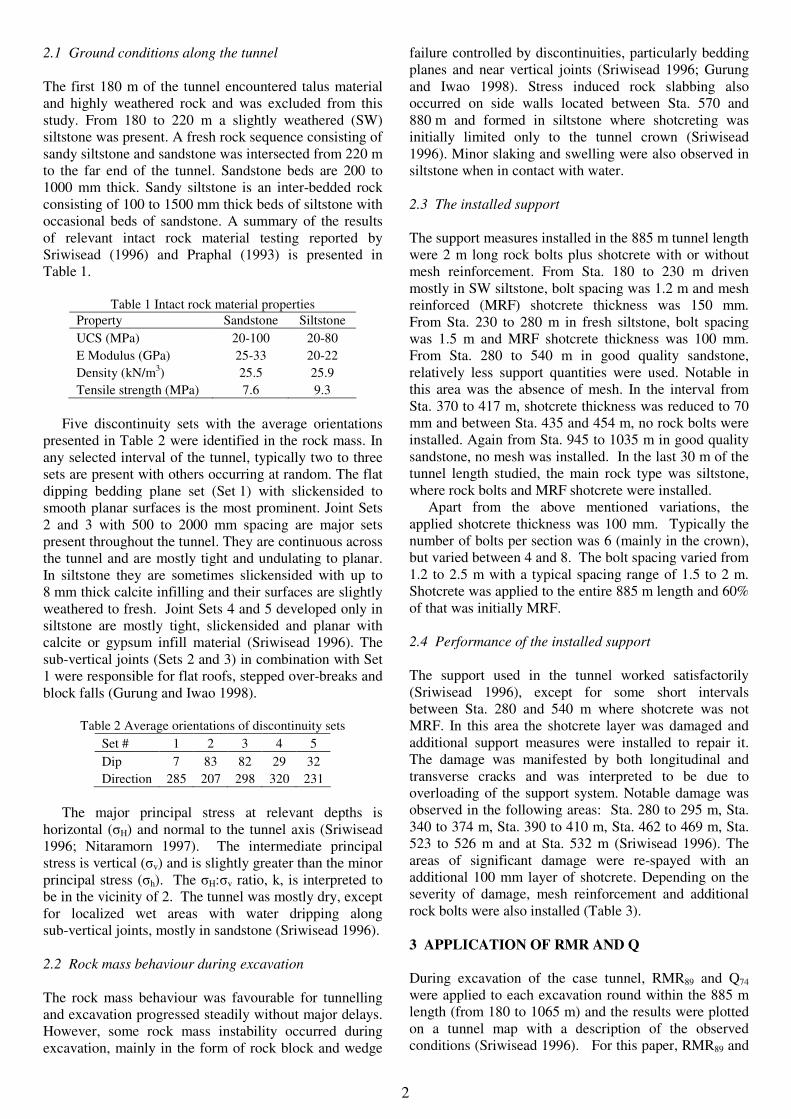
2
2.1 Ground conditions along the tunnel The first 180 m of the tunnel encountered talus material and highly weathered rock and was excluded from this study. From 180 to 220 m a slightly weathered (SW) siltstone was present. A fresh rock sequence consisting of sandy siltstone and sandstone was intersected from 220 m to the far end of the tunnel. Sandstone beds are 200 to 1000 mm thick. Sandy siltstone is an inter-bedded rock consisting of 100 to 1500 mm thick beds of siltstone with occasional beds of sandstone. A summary of the results of relevant intact rock material testing reported by Sriwisead (1996) and Praphal (1993) is presented in Table 1.
Table 1 Intact rock material properties
Property Sandstone Siltstone UCS (MPa) 20-100 20-80
E Modulus (GPa) 25-33 20-22 Density (kN/m3) 25.5 25.9 Tensile strength (MPa) 7.6 9.3
Five discontinuity sets with the average orientations
presented in Table 2 were identified in the rock mass. In any selected interval of the tunnel, typically two to three sets are present with others occurring at random. The flat dipping bedding plane set (Set 1) with slickensided to smooth planar surfaces is the most prominent. Joint Sets 2 and 3 with 500 to 2000 mm spacing are major sets present throughout the tunnel. They are continuous across the tunnel and are mostly tight and undulating to planar. In siltstone they are sometimes slickensided with up to 8 mm thick calcite infilling and their surfaces are slightly weathered to fresh. Joint Sets 4 and 5 developed only in siltstone are mostly tight, slickensided and planar with calcite or gypsum infill material (Sriwisead 1996). The sub-vertical joints (Sets 2 and 3) in combination with Set 1 were responsible for flat roofs, stepped over-breaks and block falls (Gurung and Iwao 1998).
Table 2 Average orientations of discontinuity sets
Set # 1 2 3 4 5 Dip 7 83 82 29 32 Direction 285 207 298 320 231
The major principal stress at relevant depths is
horizontal (�H) and normal to the tunnel axis (Sriwisead 1996; Nitaramorn 1997). The intermediate principal stress is vertical (�v) and is slightly greater than the minor principal stress (�h). The �H:�v ratio, k, is interpreted to be in the vicinity of 2. The tunnel was mostly dry, except for localized wet areas with water dripping along sub-vertical joints, mostly in sandstone (Sriwisead 1996). 2.2 Rock mass behaviour during excavation The rock mass behaviour was favourable for tunnelling and excavation progressed steadily without major delays. However, some rock mass instability occurred during excavation, mainly in the form of rock block and wedge
failure controlled by discontinuities, particularly bedding planes and near vertical joints (Sriwisead 1996; Gurung and Iwao 1998). Stress induced rock slabbing also occurred on side walls located between Sta. 570 and 880 m and formed in siltstone where shotcreting was initially limited only to the tunnel crown (Sriwisead 1996). Minor slaking and swelling were also observed in siltstone when in contact with water. 2.3 The installed support The support measures installed in the 885 m tunnel length were 2 m long rock bolts plus shotcrete with or without mesh reinforcement. From Sta. 180 to 230 m driven mostly in SW siltstone, bolt spacing was 1.2 m and mesh reinforced (MRF) shotcrete thickness was 150 mm. From Sta. 230 to 280 m in fresh siltstone, bolt spacing was 1.5 m and MRF shotcrete thickness was 100 mm. From Sta. 280 to 540 m in good quality sandstone, relatively less support quantities were used. Notable in this area was the absence of mesh. In the interval from Sta. 370 to 417 m, shotcrete thickness was reduced to 70 mm and between Sta. 435 and 454 m, no rock bolts were installed. Again from Sta. 945 to 1035 m in good quality sandstone, no mesh was installed. In the last 30 m of the tunnel length studied, the main rock type was siltstone, where rock bolts and MRF shotcrete were installed.
Apart from the above mentioned variations, the applied shotcrete thickness was 100 mm. Typically the number of bolts per section was 6 (mainly in the crown), but varied between 4 and 8. The bolt spacing varied from 1.2 to 2.5 m with a typical spacing range of 1.5 to 2 m. Shotcrete was applied to the entire 885 m length and 60% of that was initially MRF.
2.4 Performance of the installed support The support used in the tunnel worked satisfactorily (Sriwisead 1996), except for some short intervals between Sta. 280 and 540 m where shotcrete was not MRF. In this area the shotcrete layer was damaged and additional support measures were installed to repair it. The damage was manifested by both longitudinal and transverse cracks and was interpreted to be due to overloading of the support system. Notable damage was observed in the following areas: Sta. 280 to 295 m, Sta. 340 to 374 m, Sta. 390 to 410 m, Sta. 462 to 469 m, Sta. 523 to 526 m and at Sta. 532 m (Sriwisead 1996). The areas of significant damage were re-spayed with an additional 100 mm layer of shotcrete. Depending on the severity of damage, mesh reinforcement and additional rock bolts were also installed (Table 3). 3 APPLICATION OF RMR AND Q During excavation of the case tunnel, RMR89 and Q74 were applied to each excavation round within the 885 m length (from 180 to 1065 m) and the results were plotted on a tunnel map with a description of the observed conditions (Sriwisead 1996). For this paper, RMR89 and
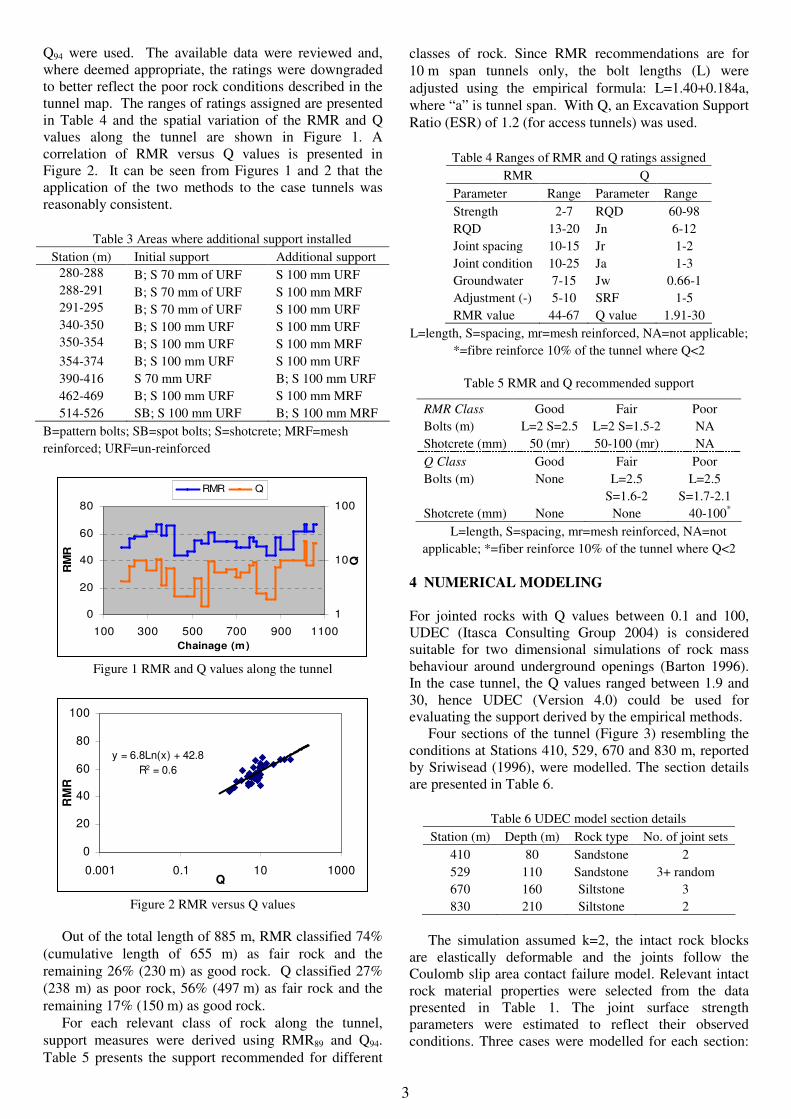
3
Q94 were used. The available data were reviewed and, where deemed appropriate, the ratings were downgraded to better reflect the poor rock conditions described in the tunnel map. The ranges of ratings assigned are presented in Table 4 and the spatial variation of the RMR and Q values along the tunnel are shown in Figure 1. A correlation of RMR versus Q values is presented in Figure 2. It can be seen from Figures 1 and 2 that the application of the two methods to the case tunnels was reasonably consistent.
Table 3 Areas where additional support installed Station (m) Initial support Additional support
280-288 B; S 70 mm of URF S 100 mm URF 288-291 B; S 70 mm of URF S 100 mm MRF 291-295 B; S 70 mm of URF S 100 mm URF 340-350 B; S 100 mm URF S 100 mm URF 350-354 B; S 100 mm URF S 100 mm MRF 354-374 B; S 100 mm URF S 100 mm URF 390-416 S 70 mm URF B; S 100 mm URF 462-469 B; S 100 mm URF S 100 mm MRF 514-526 SB; S 100 mm URF B; S 100 mm MRF
B=pattern bolts; SB=spot bolts; S=shotcrete; MRF=mesh reinforced; URF=un-reinforced
0
20
40
60
80
100 300 500 700 900 1100Chainage (m)
RM
R
1
10
100
Q
RMR Q
Figure 1 RMR and Q values along the tunnel
y = 6.8Ln(x) + 42.8R2 = 0.6
0
20
40
60
80
100
0.001 0.1 10 1000Q
RM
R
Figure 2 RMR versus Q values
Out of the total length of 885 m, RMR classified 74%
(cumulative length of 655 m) as fair rock and the remaining 26% (230 m) as good rock. Q classified 27% (238 m) as poor rock, 56% (497 m) as fair rock and the remaining 17% (150 m) as good rock.
For each relevant class of rock along the tunnel, support measures were derived using RMR89 and Q94. Table 5 presents the support recommended for different
classes of rock. Since RMR recommendations are for 10 m span tunnels only, the bolt lengths (L) were adjusted using the empirical formula: L=1.40+0.184a, where “a” is tunnel span. With Q, an Excavation Support Ratio (ESR) of 1.2 (for access tunnels) was used.
Table 4 Ranges of RMR and Q ratings assigned
RMR Q Parameter Range Parameter Range Strength 2-7 RQD 60-98 RQD 13-20 Jn 6-12 Joint spacing 10-15 Jr 1-2 Joint condition 10-25 Ja 1-3 Groundwater 7-15 Jw 0.66-1 Adjustment (-) 5-10 SRF 1-5 RMR value 44-67 Q value 1.91-30
L=length, S=spacing, mr=mesh reinforced, NA=not applicable; *=fibre reinforce 10% of the tunnel where Q<2
Table 5 RMR and Q recommended support
RMR Class Good Fair Poor Bolts (m) L=2 S=2.5 L=2 S=1.5-2 NA Shotcrete (mm) 50 (mr) 50-100 (mr) NA Q Class Good Fair Poor Bolts (m) None L=2.5
S=1.6-2 L=2.5
S=1.7-2.1 Shotcrete (mm) None None 40-100*
L=length, S=spacing, mr=mesh reinforced, NA=not applicable; *=fiber reinforce 10% of the tunnel where Q<2
4 NUMERICAL MODELING For jointed rocks with Q values between 0.1 and 100, UDEC (Itasca Consulting Group 2004) is considered suitable for two dimensional simulations of rock mass behaviour around underground openings (Barton 1996). In the case tunnel, the Q values ranged between 1.9 and 30, hence UDEC (Version 4.0) could be used for evaluating the support derived by the empirical methods.
Four sections of the tunnel (Figure 3) resembling the conditions at Stations 410, 529, 670 and 830 m, reported by Sriwisead (1996), were modelled. The section details are presented in Table 6.
Table 6 UDEC model section details
Station (m) Depth (m) Rock type No. of joint sets 410 80 Sandstone 2 529 110 Sandstone 3+ random 670 160 Siltstone 3 830 210 Siltstone 2
The simulation assumed k=2, the intact rock blocks
are elastically deformable and the joints follow the Coulomb slip area contact failure model. Relevant intact rock material properties were selected from the data presented in Table 1. The joint surface strength parameters were estimated to reflect their observed conditions. Three cases were modelled for each section:
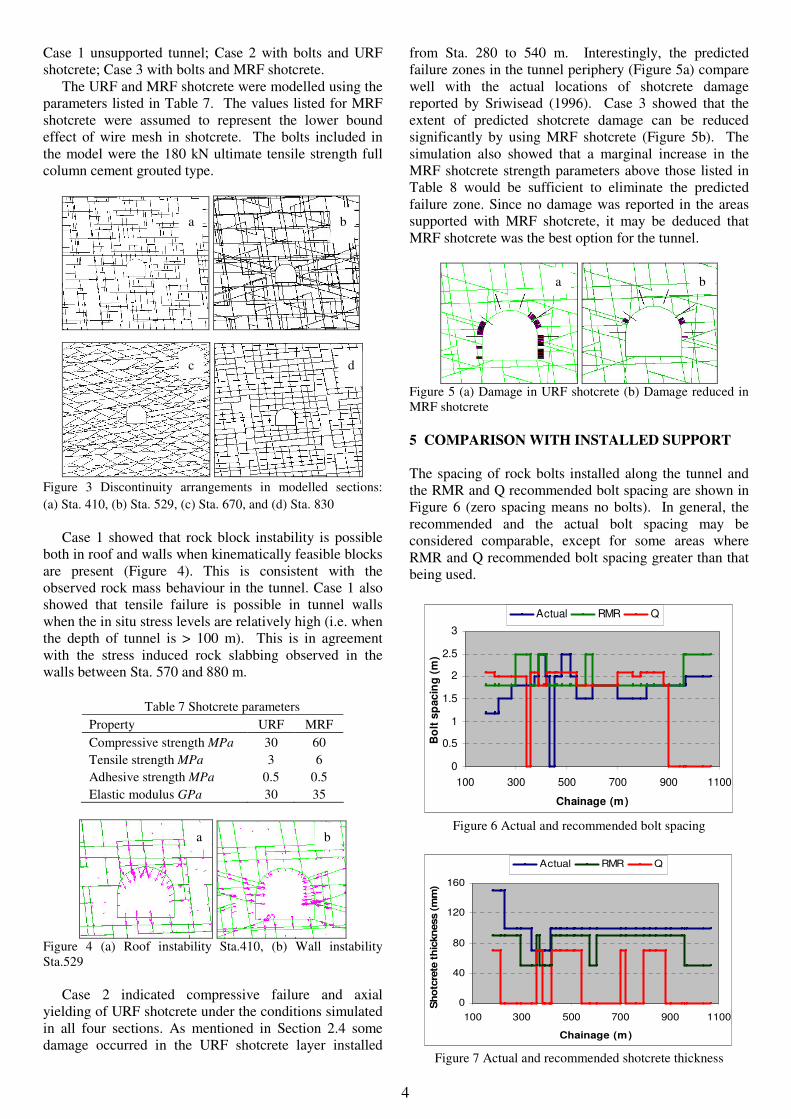
4
Case 1 unsupported tunnel; Case 2 with bolts and URF shotcrete; Case 3 with bolts and MRF shotcrete.
The URF and MRF shotcrete were modelled using the parameters listed in Table 7. The values listed for MRF shotcrete were assumed to represent the lower bound effect of wire mesh in shotcrete. The bolts included in the model were the 180 kN ultimate tensile strength full column cement grouted type.
Figure 3 Discontinuity arrangements in modelled sections: (a) Sta. 410, (b) Sta. 529, (c) Sta. 670, and (d) Sta. 830
Case 1 showed that rock block instability is possible
both in roof and walls when kinematically feasible blocks are present (Figure 4). This is consistent with the observed rock mass behaviour in the tunnel. Case 1 also showed that tensile failure is possible in tunnel walls when the in situ stress levels are relatively high (i.e. when the depth of tunnel is > 100 m). This is in agreement with the stress induced rock slabbing observed in the walls between Sta. 570 and 880 m.
Table 7 Shotcrete parameters
Property URF MRF Compressive strength MPa 30 60 Tensile strength MPa 3 6 Adhesive strength MPa 0.5 0.5 Elastic modulus GPa 30 35
Figure 4 (a) Roof instability Sta.410, (b) Wall instability Sta.529
Case 2 indicated compressive failure and axial
yielding of URF shotcrete under the conditions simulated in all four sections. As mentioned in Section 2.4 some damage occurred in the URF shotcrete layer installed
from Sta. 280 to 540 m. Interestingly, the predicted failure zones in the tunnel periphery (Figure 5a) compare well with the actual locations of shotcrete damage reported by Sriwisead (1996). Case 3 showed that the extent of predicted shotcrete damage can be reduced significantly by using MRF shotcrete (Figure 5b). The simulation also showed that a marginal increase in the MRF shotcrete strength parameters above those listed in Table 8 would be sufficient to eliminate the predicted failure zone. Since no damage was reported in the areas supported with MRF shotcrete, it may be deduced that MRF shotcrete was the best option for the tunnel.
Figure 5 (a) Damage in URF shotcrete (b) Damage reduced in MRF shotcrete
5 COMPARISON WITH INSTALLED SUPPORT The spacing of rock bolts installed along the tunnel and the RMR and Q recommended bolt spacing are shown in Figure 6 (zero spacing means no bolts). In general, the recommended and the actual bolt spacing may be considered comparable, except for some areas where RMR and Q recommended bolt spacing greater than that being used.
0
0.5
1
1.5
2
2.5
3
100 300 500 700 900 1100
Chainage (m)
Bo
lt s
pac
ing
(m)
Actual RMR Q
Figure 6 Actual and recommended bolt spacing
0
40
80
120
160
100 300 500 700 900 1100
Chainage (m)
Sho
tcre
te t
hic
knes
s (m
m)
Actual RMR Q
Figure 7 Actual and recommended shotcrete thickness
b a
c d
a b
a b
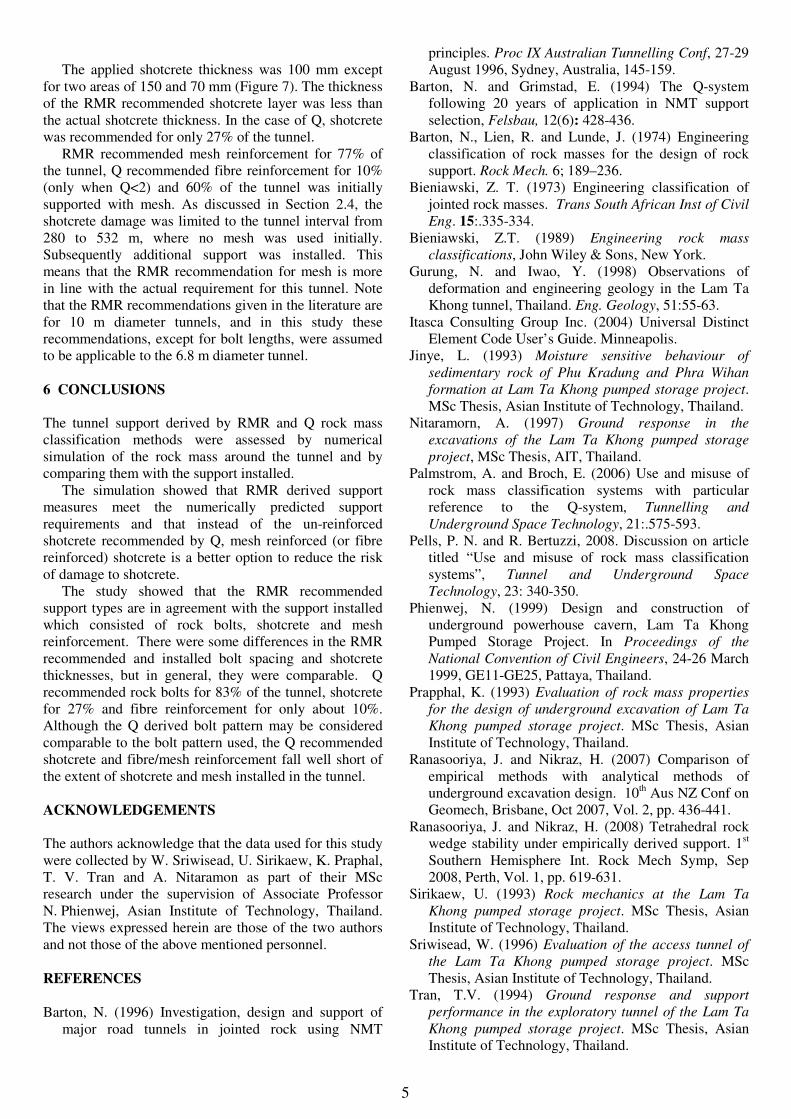
5
The applied shotcrete thickness was 100 mm except
for two areas of 150 and 70 mm (Figure 7). The thickness of the RMR recommended shotcrete layer was less than the actual shotcrete thickness. In the case of Q, shotcrete was recommended for only 27% of the tunnel.
RMR recommended mesh reinforcement for 77% of the tunnel, Q recommended fibre reinforcement for 10% (only when Q<2) and 60% of the tunnel was initially supported with mesh. As discussed in Section 2.4, the shotcrete damage was limited to the tunnel interval from 280 to 532 m, where no mesh was used initially. Subsequently additional support was installed. This means that the RMR recommendation for mesh is more in line with the actual requirement for this tunnel. Note that the RMR recommendations given in the literature are for 10 m diameter tunnels, and in this study these recommendations, except for bolt lengths, were assumed to be applicable to the 6.8 m diameter tunnel.
6 CONCLUSIONS The tunnel support derived by RMR and Q rock mass classification methods were assessed by numerical simulation of the rock mass around the tunnel and by comparing them with the support installed.
The simulation showed that RMR derived support measures meet the numerically predicted support requirements and that instead of the un-reinforced shotcrete recommended by Q, mesh reinforced (or fibre reinforced) shotcrete is a better option to reduce the risk of damage to shotcrete.
The study showed that the RMR recommended support types are in agreement with the support installed which consisted of rock bolts, shotcrete and mesh reinforcement. There were some differences in the RMR recommended and installed bolt spacing and shotcrete thicknesses, but in general, they were comparable. Q recommended rock bolts for 83% of the tunnel, shotcrete for 27% and fibre reinforcement for only about 10%. Although the Q derived bolt pattern may be considered comparable to the bolt pattern used, the Q recommended shotcrete and fibre/mesh reinforcement fall well short of the extent of shotcrete and mesh installed in the tunnel. ACKNOWLEDGEMENTS The authors acknowledge that the data used for this study were collected by W. Sriwisead, U. Sirikaew, K. Praphal, T. V. Tran and A. Nitaramon as part of their MSc research under the supervision of Associate Professor N. Phienwej, Asian Institute of Technology, Thailand. The views expressed herein are those of the two authors and not those of the above mentioned personnel. REFERENCES
Barton, N. (1996) Investigation, design and support of
major road tunnels in jointed rock using NMT
principles. Proc IX Australian Tunnelling Conf, 27-29 August 1996, Sydney, Australia, 145-159.
Barton, N. and Grimstad, E. (1994) The Q-system following 20 years of application in NMT support selection, Felsbau, 12(6): 428-436.
Barton, N., Lien, R. and Lunde, J. (1974) Engineering classification of rock masses for the design of rock support. Rock Mech. 6; 189–236.
Bieniawski, Z. T. (1973) Engineering classification of jointed rock masses. Trans South African Inst of Civil Eng. 15:.335-334.
Bieniawski, Z.T. (1989) Engineering rock mass classifications, John Wiley & Sons, New York.
Gurung, N. and Iwao, Y. (1998) Observations of deformation and engineering geology in the Lam Ta Khong tunnel, Thailand. Eng. Geology, 51:55-63.
Itasca Consulting Group Inc. (2004) Universal Distinct Element Code User’s Guide. Minneapolis.
Jinye, L. (1993) Moisture sensitive behaviour of sedimentary rock of Phu Kradung and Phra Wihan formation at Lam Ta Khong pumped storage project. MSc Thesis, Asian Institute of Technology, Thailand.
Nitaramorn, A. (1997) Ground response in the excavations of the Lam Ta Khong pumped storage project, MSc Thesis, AIT, Thailand.
Palmstrom, A. and Broch, E. (2006) Use and misuse of rock mass classification systems with particular reference to the Q-system, Tunnelling and Underground Space Technology, 21:.575-593.
Pells, P. N. and R. Bertuzzi, 2008. Discussion on article titled “Use and misuse of rock mass classification systems”, Tunnel and Underground Space Technology, 23: 340-350.
Phienwej, N. (1999) Design and construction of underground powerhouse cavern, Lam Ta Khong Pumped Storage Project. In Proceedings of the National Convention of Civil Engineers, 24-26 March 1999, GE11-GE25, Pattaya, Thailand.
Prapphal, K. (1993) Evaluation of rock mass properties for the design of underground excavation of Lam Ta Khong pumped storage project. MSc Thesis, Asian Institute of Technology, Thailand.
Ranasooriya, J. and Nikraz, H. (2007) Comparison of empirical methods with analytical methods of underground excavation design. 10th Aus NZ Conf on Geomech, Brisbane, Oct 2007, Vol. 2, pp. 436-441.
Ranasooriya, J. and Nikraz, H. (2008) Tetrahedral rock wedge stability under empirically derived support. 1st Southern Hemisphere Int. Rock Mech Symp, Sep 2008, Perth, Vol. 1, pp. 619-631.
Sirikaew, U. (1993) Rock mechanics at the Lam Ta Khong pumped storage project. MSc Thesis, Asian Institute of Technology, Thailand.
Sriwisead, W. (1996) Evaluation of the access tunnel of the Lam Ta Khong pumped storage project. MSc Thesis, Asian Institute of Technology, Thailand.
Tran, T.V. (1994) Ground response and support performance in the exploratory tunnel of the Lam Ta Khong pumped storage project. MSc Thesis, Asian Institute of Technology, Thailand.
1 INTRODUCTION The Namroud water resources development project is currently being built in Firouz Kouh, Tehran prov-ince, Iran. The project comprises a rock fill em-bankment dam with a clay core. The dam has a crest length of 652 m, a maximum height of 82 m and a crest width of 12 m. The project also comprises a 5.5 m diameter 740 m long horseshoe shaped diversion tunnel constructed for two purposes: (a) to temporar-ily divert the Namroud River to facilitate the con-struction of the dam; and (b) as a bottom outlet dur-ing operation of the project to provide drinking and irrigation water for downstream users. The tunnel located in the left abutment has an overburden of between 30 and 90 m and was driven through weak sedimentary rocks comprising limestone, marlstone and limy shale.
At the design stage of the project, based on the data collected by a program of site investigation mainly involving exploration drilling and logging, the primary tunnel support requirements and excava-tion methods were determined empirically by apply-ing one of the most widely used rock mass classifi-cation methods, Tunnelling Quality Index (Q) of Barton et al. (1974) and Barton & Grimstad (1994). During excavation of the tunnel the rock mass con-ditions encountered were different to those predicted at the design stage, and as a result the excavation methods and the tunnel support systems had to be changed. Despite the changes made the tunnel was constructed on time and within budget. This paper
presents (a) the predictions made at the design stage, (b) the results of the classification of rock mass en-countered during construction, and (c) the actual ex-cavation methods and the support systems used.
2 SITE GEOLOGY AND GEOTECHNICAL CONDITIONS
The regional geology of the project area is character-ised by sedimentary rock formations that have been subjected to a series of folding and faulting. Several major geological structures are present in the general area of the project including the Seleh Bon syncline, the Nachoostan anticline, the Namroud and the Masha Fasham faults, and the Barijan, Alborz, Garmsar, Namroud and Firoozkooh thrusts. The site is located on the southern limb of the Seleh Bon syncline.
To the downstream of the dam axis is a region of several sedimentary rock units which have been sub-jected to different tectonic events. Along the dam axis and to the upstream is a group of soft sedimen-tary rocks of Karaj Formation. The tectonic activi-ties in the region caused several splay faults and shears and as a result some of the rock units along the tunnel alignment are shattered and sheared. In general the project area is overlain by recent sedi-ments and most of the dam foundation is located on alluvial deposits. The Namroud riverbed is com-posed of an alluvium deposit and therefore the dam
Predicted and actual conditions of the Namroud project diversion tunnel
D. Bahadorbeygi Culham Construction Co, Tehran, Iran
J. Ranasooriya & H. Nikraz Curtin University, Perth, Australia
ABSTRACT: The 5.5 m wide 740 m long Namroud project diversion tunnel located in the Tehran province of Iran was driven through sedimentary rocks comprising limestone, marlstone and limy shale. The initial design of primary support for the tunnel was based on the data collected from a limited program of site investigation and the application of rock mass classification approach. During excavation the rock mass conditions encoun-tered were different to those predicted at the project design stage, and as a result the excavation methods and the tunnel support systems had to be changed. Despite the changes the tunnel was constructed on time and within budget. This paper presents (a) the predictions made at the design stage, (b) the results of the classifi-cation of rock mass intersected during construction, and (c) the actual excavation and the support methods used.
included a foundation cut-off wall to reduce the po-tential for water loss through the foundation.
The main rock types along the tunnel alignment
comprise limestone, marlstone and limy shale, most
of which are tectonically disturbed. A summary log
of rock types intersected in the tunnel is given in
Table 1.
Several geological discontinuity sets are present
along the tunnel alignment. These include bedding
planes, joints and some shears. The vast majority of
the discontinuities are filled with calcite infill mate-
rial while some are either clean or coated with oxide
material. The discontinuity orientation, spacing and
surface characteristics vary along the tunnel. The
general orientation and spacing of bedding and joint
sets in tuff marl are given in Table 2.
Of particular concern was tuff marl rocks of
Karaj formation which are highly shattered and
weak due to tectonic activity. In the tunnel length
from chainage 80 m to 120 m, the weakness of tuff
marl was further exasperated by the presence of a
minor shear zone in this area.
As per the ISRM suggested methods, the intact
rock materials intersected in the tunnel can be de-
scribed as weak with a typical UCS range of 5 to 11
MPa. The tunnel is located below the groundwater
table and was wet during excavation.
Table 1. Summary log of rock types in the tunnel.
Chainage (m) Rock type
000 – 145 Tuff marl
145 – 244 Limy shale/shaly limestone
244 – 304 Tuff marl
304 – 504 Tuffmarl/shaly limestone/limy shale
504 – 585 Marly limestone
585 – 670 Sand marlstone
670 – 693 Limestone
693 – 728 Sandy marlstone
728 – 740 Limestone
3 EXCAVATION METHODS AND PRIMARY SUPPORT MEASURES USED
In the original design the proposed excavation method was drilling and blasting and the proposed primary support measures comprised a 1 m x 1 m pattern of rock bolts, 100 mm of mesh reinforced shotcrete and lattice girders made of three 25 mm diameter steel bars. In accordance with this design the entire tunnel was to be pattern bolted, part of it tunnel was to be shotcreted with wire mesh rein-forcement, and lattice girders installed for almost half its length. As this design was based on the data
collected from a limited program of site investiga-tion involving exploration drilling, surface mapping and rock sample testing, it needed revision and up-dating based on more detailed information available at the construction stage. Table 2. Orientation of discontinuity sets.
Spacing (% in each range)
Set. Dip/direc >2.0m 0.6-2.0m 0.2-0.6m 0.06-0.2m
B1 70/310 38 17 27 18
J1 83/211 9 18 55 18
J2 73/269 10 38 38 14
J3 60/070 37 40 12 11
Subsequent to the commencement of construction
it was observed that the proposed drill and blast ex-cavation method was not the best option for some of the rocks intersected because blasting, even when well controlled, caused unnecessary rock mass dam-age and instability in the tunnel. After considering the available options, jackhammer and drum-cutter techniques were used for the excavation of approxi-mately 340 m of the 740 m long tunnel. These tech-niques reduced the rock mass damage.
At a very early stage of excavation, in light of the
additional information collected from direct observa-
tion of the rock mass, the original support design
was reviewed and it was found that the proposed
support, rock bolting in particular, was not appropri-
ate especially for areas where rock mass was weaker
than expected. It was therefore decided to rely on
surface support, i.e. mesh reinforced shotcrete and
light steel ribs etc. A comparison of the proposed
excavation and support methods with the actual
methods used is presented in Figure 1.
As can be seen from Figure 1, rock bolting was
not used in this tunnel. Mesh reinforced shotcrete
was the most common support system over a total
tunnel length of 406 m. In the weaker rock zones, a
total length of approximately 200 m, light steel ribs
and shotcrete with or without mesh, locally made
steel shield and concrete, mass concrete and
pre-bolting (forepoling) followed by mesh rein-
forced shotcrete were used. The steel ribs were con-
nected by welding 25 mm steel bars parallel to the
tunnel axis and shotcreted with or without mesh.
Despite the fact that the initial design required pat-
tern bolting of the entire tunnel, approximately
100 m of the tunnel from the downstream portal was
unsupported.
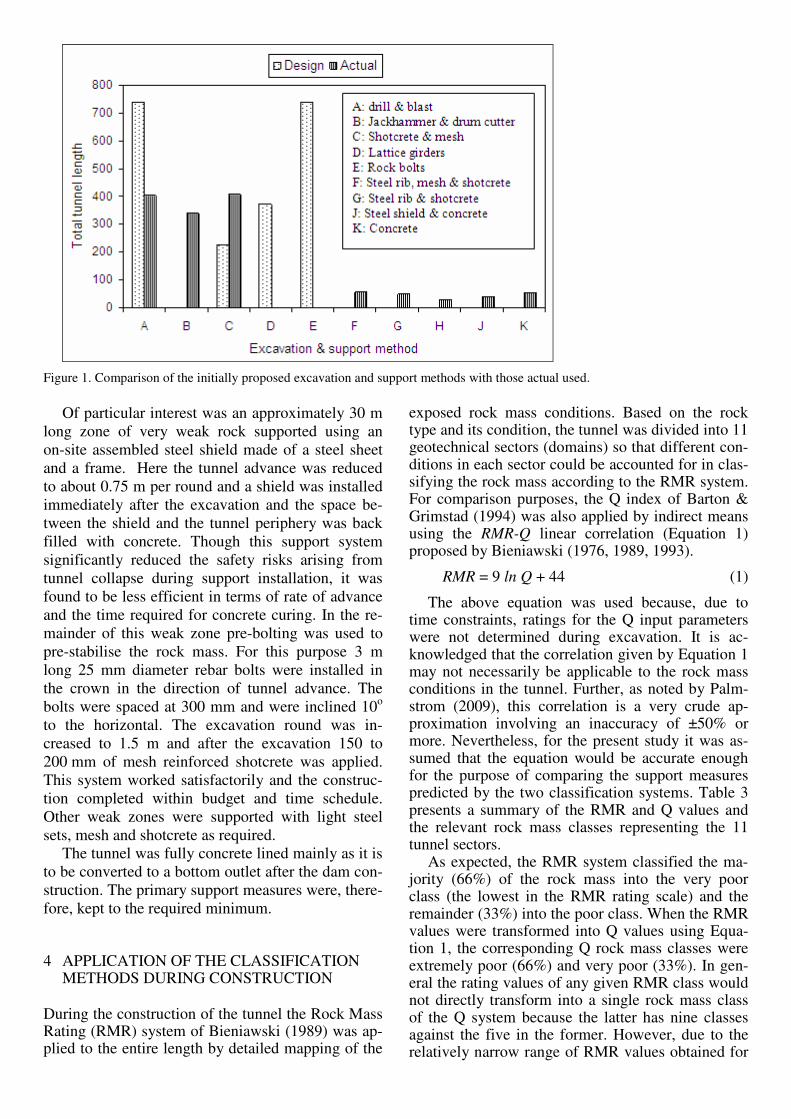
Figure 1. Comparison of the initially proposed excavation and support methods with those actual used.
Of particular interest was an approximately 30 m
long zone of very weak rock supported using an
on-site assembled steel shield made of a steel sheet
and a frame. Here the tunnel advance was reduced
to about 0.75 m per round and a shield was installed
immediately after the excavation and the space be-
tween the shield and the tunnel periphery was back
filled with concrete. Though this support system
significantly reduced the safety risks arising from
tunnel collapse during support installation, it was
found to be less efficient in terms of rate of advance
and the time required for concrete curing. In the re-
mainder of this weak zone pre-bolting was used to
pre-stabilise the rock mass. For this purpose 3 m
long 25 mm diameter rebar bolts were installed in
the crown in the direction of tunnel advance. The
bolts were spaced at 300 mm and were inclined 10o
to the horizontal. The excavation round was in-
creased to 1.5 m and after the excavation 150 to
200 mm of mesh reinforced shotcrete was applied.
This system worked satisfactorily and the construc-
tion completed within budget and time schedule.
Other weak zones were supported with light steel
sets, mesh and shotcrete as required.
The tunnel was fully concrete lined mainly as it is
to be converted to a bottom outlet after the dam con-
struction. The primary support measures were, there-
fore, kept to the required minimum.
4 APPLICATION OF THE CLASSIFICATION METHODS DURING CONSTRUCTION
During the construction of the tunnel the Rock Mass Rating (RMR) system of Bieniawski (1989) was ap-plied to the entire length by detailed mapping of the
exposed rock mass conditions. Based on the rock type and its condition, the tunnel was divided into 11 geotechnical sectors (domains) so that different con-ditions in each sector could be accounted for in clas-sifying the rock mass according to the RMR system. For comparison purposes, the Q index of Barton & Grimstad (1994) was also applied by indirect means using the RMR-Q linear correlation (Equation 1) proposed by Bieniawski (1976, 1989, 1993).
RMR = 9 ln Q + 44 (1)
The above equation was used because, due to time constraints, ratings for the Q input parameters were not determined during excavation. It is ac-knowledged that the correlation given by Equation 1 may not necessarily be applicable to the rock mass conditions in the tunnel. Further, as noted by Palm-strom (2009), this correlation is a very crude ap-proximation involving an inaccuracy of ±50% or more. Nevertheless, for the present study it was as-sumed that the equation would be accurate enough for the purpose of comparing the support measures predicted by the two classification systems. Table 3 presents a summary of the RMR and Q values and the relevant rock mass classes representing the 11 tunnel sectors.
As expected, the RMR system classified the ma-jority (66%) of the rock mass into the very poor class (the lowest in the RMR rating scale) and the remainder (33%) into the poor class. When the RMR values were transformed into Q values using Equa-tion 1, the corresponding Q rock mass classes were extremely poor (66%) and very poor (33%). In gen-eral the rating values of any given RMR class would not directly transform into a single rock mass class of the Q system because the latter has nine classes against the five in the former. However, due to the relatively narrow range of RMR values obtained for
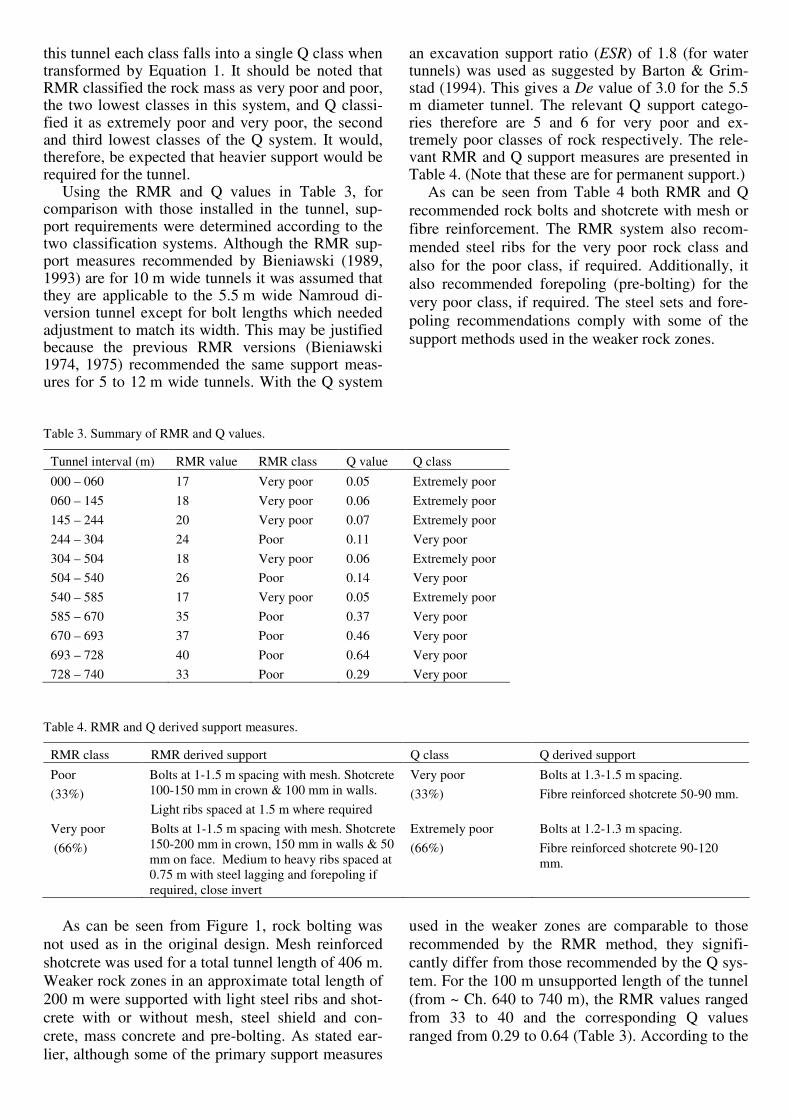
this tunnel each class falls into a single Q class when transformed by Equation 1. It should be noted that RMR classified the rock mass as very poor and poor, the two lowest classes in this system, and Q classi-fied it as extremely poor and very poor, the second and third lowest classes of the Q system. It would, therefore, be expected that heavier support would be required for the tunnel.
Using the RMR and Q values in Table 3, for comparison with those installed in the tunnel, sup-port requirements were determined according to the two classification systems. Although the RMR sup-port measures recommended by Bieniawski (1989, 1993) are for 10 m wide tunnels it was assumed that they are applicable to the 5.5 m wide Namroud di-version tunnel except for bolt lengths which needed adjustment to match its width. This may be justified because the previous RMR versions (Bieniawski 1974, 1975) recommended the same support meas-ures for 5 to 12 m wide tunnels. With the Q system
an excavation support ratio (ESR) of 1.8 (for water tunnels) was used as suggested by Barton & Grim-stad (1994). This gives a De value of 3.0 for the 5.5 m diameter tunnel. The relevant Q support catego-ries therefore are 5 and 6 for very poor and ex-tremely poor classes of rock respectively. The rele-vant RMR and Q support measures are presented in Table 4. (Note that these are for permanent support.)
As can be seen from Table 4 both RMR and Q
recommended rock bolts and shotcrete with mesh or
fibre reinforcement. The RMR system also recom-
mended steel ribs for the very poor rock class and
also for the poor class, if required. Additionally, it
also recommended forepoling (pre-bolting) for the
very poor class, if required. The steel sets and fore-
poling recommendations comply with some of the
support methods used in the weaker rock zones.
Table 3. Summary of RMR and Q values.
Tunnel interval (m) RMR value RMR class Q value Q class
000 – 060 17 Very poor 0.05 Extremely poor
060 – 145 18 Very poor 0.06 Extremely poor
145 – 244 20 Very poor 0.07 Extremely poor
244 – 304 24 Poor 0.11 Very poor
304 – 504 18 Very poor 0.06 Extremely poor
504 – 540 26 Poor 0.14 Very poor
540 – 585 17 Very poor 0.05 Extremely poor
585 – 670 35 Poor 0.37 Very poor
670 – 693 37 Poor 0.46 Very poor
693 – 728 40 Poor 0.64 Very poor
728 – 740 33 Poor 0.29 Very poor
Table 4. RMR and Q derived support measures.
RMR class RMR derived support Q class Q derived support
Poor
(33%)
Bolts at 1-1.5 m spacing with mesh. Shotcrete
100-150 mm in crown & 100 mm in walls.
Light ribs spaced at 1.5 m where required
Very poor
(33%)
Bolts at 1.3-1.5 m spacing.
Fibre reinforced shotcrete 50-90 mm.
Very poor
(66%)
Bolts at 1-1.5 m spacing with mesh. Shotcrete
150-200 mm in crown, 150 mm in walls & 50
mm on face. Medium to heavy ribs spaced at
0.75 m with steel lagging and forepoling if
required, close invert
Extremely poor
(66%)
Bolts at 1.2-1.3 m spacing.
Fibre reinforced shotcrete 90-120
mm.
As can be seen from Figure 1, rock bolting was
not used as in the original design. Mesh reinforced
shotcrete was used for a total tunnel length of 406 m.
Weaker rock zones in an approximate total length of
200 m were supported with light steel ribs and shot-
crete with or without mesh, steel shield and con-
crete, mass concrete and pre-bolting. As stated ear-
lier, although some of the primary support measures
used in the weaker zones are comparable to those
recommended by the RMR method, they signifi-
cantly differ from those recommended by the Q sys-
tem. For the 100 m unsupported length of the tunnel
(from ~ Ch. 640 to 740 m), the RMR values ranged
from 33 to 40 and the corresponding Q values
ranged from 0.29 to 0.64 (Table 3). According to the
two methods this length required pattern bolts plus
mesh or fibre reinforced shotcrete.
Since the RMR and Q recommendations are for
permanent support, direct comparison with the pri-
mary support could be open to conjecture. Neverthe-
less, in this instance heavier primary support meas-
ures were required for 200 m of the tunnel than
those recommended by the two methods.
5 CONCLUSIONS
The rock mass conditions encountered during con-
struction of the 740 m long Namroud diversion tun-
nel were different to those predicted based on the
data collected for project design. Due to the weak-
ness of some of the sedimentary rocks intersected in
the tunnel, the conventional drilling and blasting ex-
cavation method was found to be problematic for
part of the tunnel as blasting caused unnecessary
rock mass damage. Jackhammer and drum cutter
techniques were adopted for just over 300 m thus
significantly reducing unnecessary damage to the
rock mass. During the early stages of excavation, it was ob-
served that instead of the initially proposed primary support system mainly consisting of pattern bolting, other support systems could lead to better safety per-formance in weaker rock zones. Mesh reinforced shotcrete was the most common support system used with a total tunnel length of 406 m. In 200 m of weaker rock zones light steel ribs and shotcrete with or without mesh, steel shield and concrete, mass concrete and pre-bolting plus mesh reinforced shot-crete were used. Approximately 100 m of the tunnel was unsupported despite the fact that the initial de-sign required pattern bolting of the entire tunnel.
The rock mass conditions exposed in the tunnel were mapped and the RMR system was applied di-rectly to the as-excavated rock mass conditions. The Q system was also applied indirectly by converting the RMR values by means of a published RMR-Q
correlation. Both methods recommended rock bolt-ing and shotcrete with mesh or fibre reinforcement for permanent support. While mesh reinforced shot-crete was used, rock bolts were not. In weaker rock zones the RMR derived support generally agreed with the installed heavier support. The Q derived support measures differ except for the mesh (or fi-bre) reinforced shotcrete, which is only part of the heavier support installed in the weaker rock zones. The primary support measures installed in approxi-mately 200 m of the tunnel were heavier than those recommended by Q for permanent support.
For the 100 m unsupported tunnel length both RMR and Q recommended rock bolts and mesh or fibre reinforced shotcrete.
REFERENCES
Barton, N., Lien, R. and Lunde, J. (1974) Engineering classifi-cation of rock masses for the design of rock support. Rock Mech. 6, 189–236.
Barton, N. and Grimstad, E. (1994) The Q-system following 20 years of application in NMT support selection, in Felsbau 12(6): 428-436.
Bieniawski, Z.T. (1974) Geomechanics classification of rock masses and its application in tunneling. In: Proc Third In-ternational Cong on Rock Mech, ISRM, Denver, pp. 27–32.
Bieniawski, Z.T. (1975) Case Studies: Prediction of rock mass behaviour by the geomechanics classification. 2
nd AusNZ
Conf on Geomechanics, Brisbane, 1975, Inst Eng Australia, 36-41.
Bieniawski, Z.T. (1976) Rock mass classification in rock engi-neering. Proc Symp for Exploration for Rock engineering. Z.T. Bieniawski and.A.A. Balkema eds, AA Balkema, Rot-terdam. pp. 97-106.
Bieniawski, Z.T. (1989) Engineering rock mass classifications, John Wiley & Sons, New York.
Bieniawski, Z.T. (1993) Classification of rock masses for engi-neering: The RMR system and future trends, Comprehen-sive Rock Engineering, Principles, Practice and Projects, Editor in Chief J. A. Hudson, Pergamon, Vol. 3, 553-573.
Palmstrom, A. (2009) Combining the RMR, Q and RMi classi-fication systems. Tunnelling & Underground Space Tech-nology, Elsevier, Vol. (in press).
1
RELIABILITY OF THE LINEAR CORRELATION OF ROCK MASS
RATING (RMR) AND TUNNELLING QUALITY INDEX (Q)
J. Ranasooriya
Senior Geotechnical Engineer, Department of Mines and Petroleum, Western Australia
H. Nikraz
Professor, Department of Civil Engineering, Curtin University, Western Australia
ABSTRACT
With the advent of the RMR and Q classification methods for underground excavation support design, a linear
correlation between the two methods was suggested by linear regression analysis of the data obtained from several case
studies. The data used in deriving the relationship was widely scattered and the range of values covered by the 90%
confidence limits demonstrated that the relationship had very little practical value. In subsequent publications, the 90%
confidence limits were omitted when referring to the relationship. Consequently, some practitioners in the field of rock
engineering assumed that this relationship, expressed as a semi logarithmic equation, is universally applicable for
transforming the ratings assigned by one system to the ratings of the other. This assumption is erroneous and deserves
scrutiny. This paper reviews some of the relevant published information and illustrates that there is no sound scientific
basis to assume a universally applicable linear relationship between the two.
1 INTRODUCTION
Of the several rock mass classification methods developed for underground excavation support design applications,
only RMR and Q, introduced by Bieniawski (1973) and Barton et al. (1974), respectively, have stood out. Over the
years, these methods have been revised and updated, and the current versions are RMR89 (Bieniawski, 1989) and Q94
(Barton and Grimstad, 1994). Their main applications are in the prediction of support requirements, stable unsupported
spans and stand-up times of underground excavations, particularly during the planning stage of projects. Others include
estimations of modulus of rock mass deformation and rock mass strength, which are input parameters for elegant design
tools such as numerical modelling.
Both RMR and Q methods are based on six parameters considered to represent the behaviour of rock masses. The
primary aim of these classification systems is to divide the rock mass into distinct classes of similar characteristics that
are easily identified by visual observation or by simple tests. Since both methods aim at the same objective, a
correlation may be expected between the two. If a true correlation exists, then it should be possible to obtain ratings for
one system by transforming the ratings determined for the other. This would save time and effort if both systems are to
be applied for the design of an excavation project.
A correlation based on linear regression analysis of RMR and Q values was first presented by Bieniawski (1976). Since
then several other researchers have also presented somewhat different correlations based on regression analysis of RMR
and Q values obtained from tunnelling and mining projects in different parts of the world. While these correlations may
be valid for the rock mass conditions from which they were derived, they may not necessarily be applicable to other
rock mass conditions. Despite the fact that different correlations can be obtained from different rock mass conditions,
there is a tendency among some practitioners of rock engineering to overly rely on the first correlation published in
1976 and transform ratings between the two systems. In recent years this injudicious tendency has found its way into
the underground mining sector in Western Australia where RMR and Q methods are often used for excavation support
design.
This paper presents a brief overview of the evolution of the RMR and Q methods and their existing correlations, and a
discussion on the differences of the two. In light of the existing correlations and the scattering of the data used in
deriving them, the paper illustrates that there is no sound scientific basis to assume a universally applicable linear
relationship between RMR and Q, as alluded to by some publications.
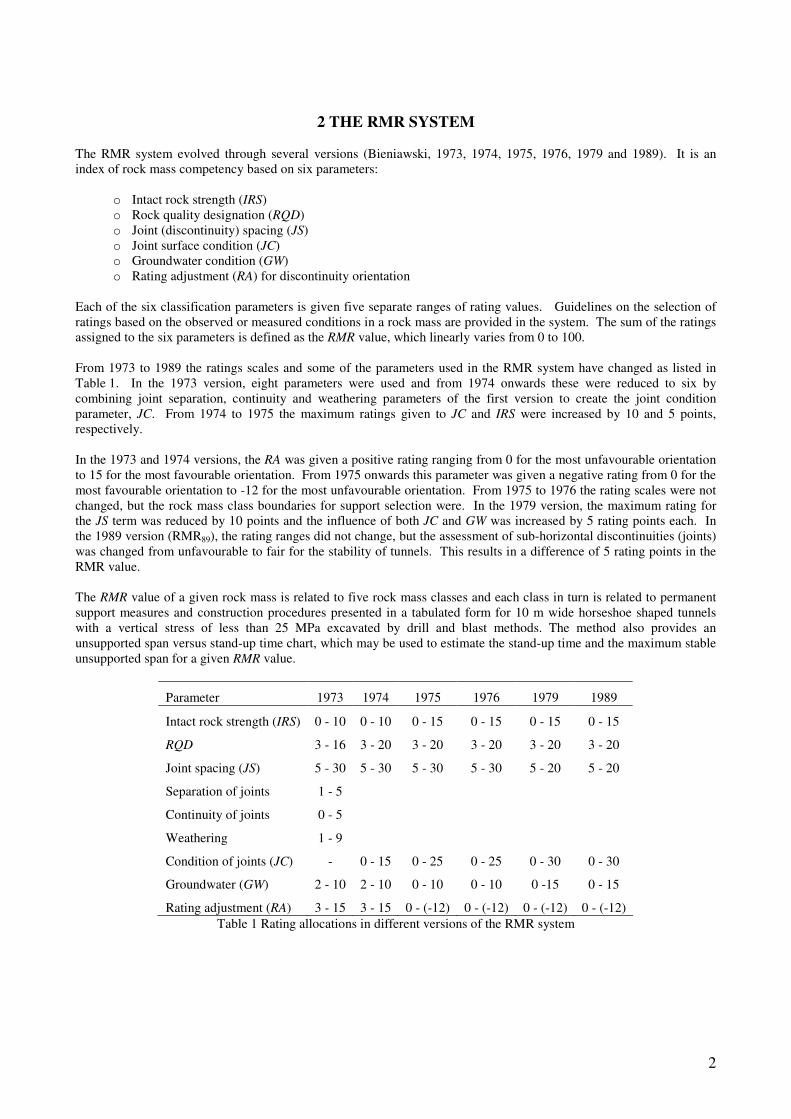
2
2 THE RMR SYSTEM
The RMR system evolved through several versions (Bieniawski, 1973, 1974, 1975, 1976, 1979 and 1989). It is an
index of rock mass competency based on six parameters:
o Intact rock strength (IRS)
o Rock quality designation (RQD)
o Joint (discontinuity) spacing (JS)
o Joint surface condition (JC)
o Groundwater condition (GW)
o Rating adjustment (RA) for discontinuity orientation
Each of the six classification parameters is given five separate ranges of rating values. Guidelines on the selection of
ratings based on the observed or measured conditions in a rock mass are provided in the system. The sum of the ratings
assigned to the six parameters is defined as the RMR value, which linearly varies from 0 to 100.
From 1973 to 1989 the ratings scales and some of the parameters used in the RMR system have changed as listed in
Table 1. In the 1973 version, eight parameters were used and from 1974 onwards these were reduced to six by
combining joint separation, continuity and weathering parameters of the first version to create the joint condition
parameter, JC. From 1974 to 1975 the maximum ratings given to JC and IRS were increased by 10 and 5 points,
respectively.
In the 1973 and 1974 versions, the RA was given a positive rating ranging from 0 for the most unfavourable orientation
to 15 for the most favourable orientation. From 1975 onwards this parameter was given a negative rating from 0 for the
most favourable orientation to -12 for the most unfavourable orientation. From 1975 to 1976 the rating scales were not
changed, but the rock mass class boundaries for support selection were. In the 1979 version, the maximum rating for
the JS term was reduced by 10 points and the influence of both JC and GW was increased by 5 rating points each. In
the 1989 version (RMR89), the rating ranges did not change, but the assessment of sub-horizontal discontinuities (joints)
was changed from unfavourable to fair for the stability of tunnels. This results in a difference of 5 rating points in the
RMR value.
The RMR value of a given rock mass is related to five rock mass classes and each class in turn is related to permanent
support measures and construction procedures presented in a tabulated form for 10 m wide horseshoe shaped tunnels
with a vertical stress of less than 25 MPa excavated by drill and blast methods. The method also provides an
unsupported span versus stand-up time chart, which may be used to estimate the stand-up time and the maximum stable
unsupported span for a given RMR value.
Parameter 1973 1974 1975 1976 1979 1989
Intact rock strength (IRS) 0 - 10 0 - 10 0 - 15 0 - 15 0 - 15 0 - 15
RQD 3 - 16 3 - 20 3 - 20 3 - 20 3 - 20 3 - 20
Joint spacing (JS) 5 - 30 5 - 30 5 - 30 5 - 30 5 - 20 5 - 20
Separation of joints 1 - 5
Continuity of joints 0 - 5
Weathering 1 - 9
Condition of joints (JC) - 0 - 15 0 - 25 0 - 25 0 - 30 0 - 30
Groundwater (GW) 2 - 10 2 - 10 0 - 10 0 - 10 0 -15 0 - 15
Rating adjustment (RA) 3 - 15 3 - 15 0 - (-12) 0 - (-12) 0 - (-12) 0 - (-12)
Table 1 Rating allocations in different versions of the RMR system
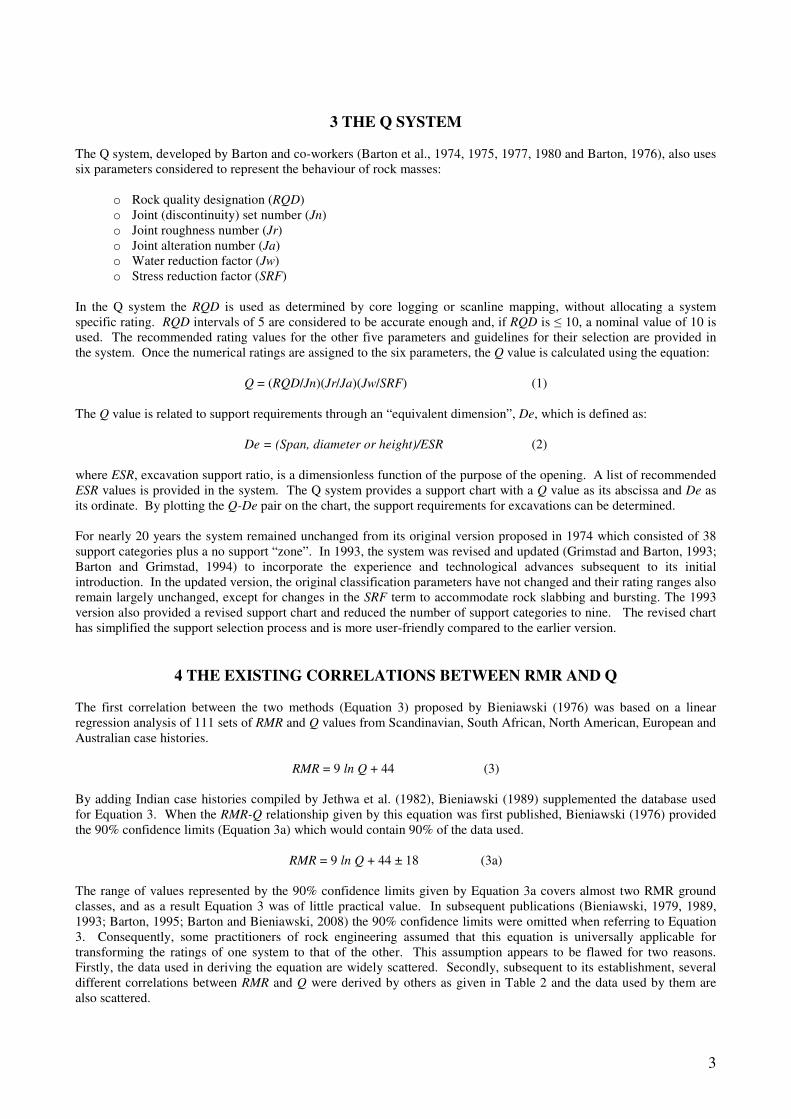
3
3 THE Q SYSTEM
The Q system, developed by Barton and co-workers (Barton et al., 1974, 1975, 1977, 1980 and Barton, 1976), also uses
six parameters considered to represent the behaviour of rock masses:
o Rock quality designation (RQD)
o Joint (discontinuity) set number (Jn)
o Joint roughness number (Jr)
o Joint alteration number (Ja)
o Water reduction factor (Jw)
o Stress reduction factor (SRF)
In the Q system the RQD is used as determined by core logging or scanline mapping, without allocating a system
specific rating. RQD intervals of 5 are considered to be accurate enough and, if RQD is ≤ 10, a nominal value of 10 is
used. The recommended rating values for the other five parameters and guidelines for their selection are provided in
the system. Once the numerical ratings are assigned to the six parameters, the Q value is calculated using the equation:
Q = (RQD/Jn)(Jr/Ja)(Jw/SRF) (1)
The Q value is related to support requirements through an “equivalent dimension”, De, which is defined as:
De = (Span, diameter or height)/ESR (2)
where ESR, excavation support ratio, is a dimensionless function of the purpose of the opening. A list of recommended
ESR values is provided in the system. The Q system provides a support chart with a Q value as its abscissa and De as
its ordinate. By plotting the Q-De pair on the chart, the support requirements for excavations can be determined.
For nearly 20 years the system remained unchanged from its original version proposed in 1974 which consisted of 38
support categories plus a no support “zone”. In 1993, the system was revised and updated (Grimstad and Barton, 1993;
Barton and Grimstad, 1994) to incorporate the experience and technological advances subsequent to its initial
introduction. In the updated version, the original classification parameters have not changed and their rating ranges also
remain largely unchanged, except for changes in the SRF term to accommodate rock slabbing and bursting. The 1993
version also provided a revised support chart and reduced the number of support categories to nine. The revised chart
has simplified the support selection process and is more user-friendly compared to the earlier version.
4 THE EXISTING CORRELATIONS BETWEEN RMR AND Q
The first correlation between the two methods (Equation 3) proposed by Bieniawski (1976) was based on a linear
regression analysis of 111 sets of RMR and Q values from Scandinavian, South African, North American, European and
Australian case histories.
RMR = 9 ln Q + 44 (3)
By adding Indian case histories compiled by Jethwa et al. (1982), Bieniawski (1989) supplemented the database used
for Equation 3. When the RMR-Q relationship given by this equation was first published, Bieniawski (1976) provided
the 90% confidence limits (Equation 3a) which would contain 90% of the data used.
RMR = 9 ln Q + 44 ± 18 (3a)
The range of values represented by the 90% confidence limits given by Equation 3a covers almost two RMR ground
classes, and as a result Equation 3 was of little practical value. In subsequent publications (Bieniawski, 1979, 1989,
1993; Barton, 1995; Barton and Bieniawski, 2008) the 90% confidence limits were omitted when referring to Equation
3. Consequently, some practitioners of rock engineering assumed that this equation is universally applicable for
transforming the ratings of one system to that of the other. This assumption appears to be flawed for two reasons.
Firstly, the data used in deriving the equation are widely scattered. Secondly, subsequent to its establishment, several
different correlations between RMR and Q were derived by others as given in Table 2 and the data used by them are
also scattered.
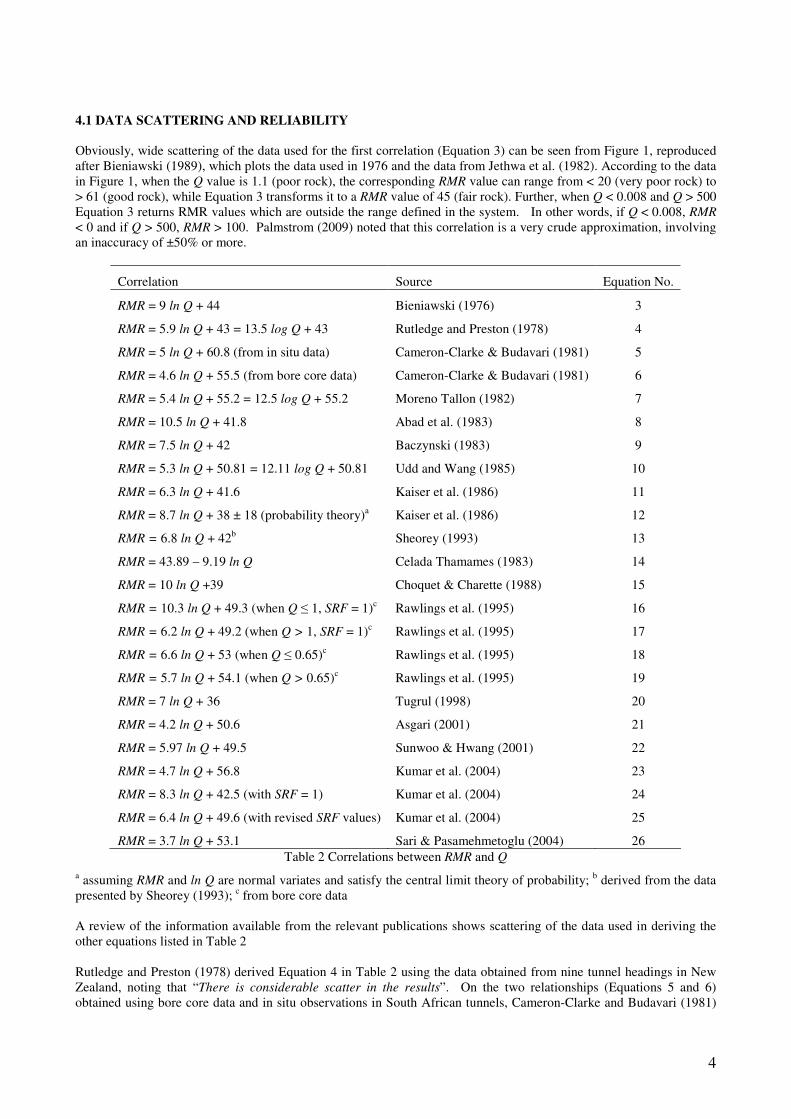
4
4.1 DATA SCATTERING AND RELIABILITY
Obviously, wide scattering of the data used for the first correlation (Equation 3) can be seen from Figure 1, reproduced
after Bieniawski (1989), which plots the data used in 1976 and the data from Jethwa et al. (1982). According to the data
in Figure 1, when the Q value is 1.1 (poor rock), the corresponding RMR value can range from < 20 (very poor rock) to
> 61 (good rock), while Equation 3 transforms it to a RMR value of 45 (fair rock). Further, when Q < 0.008 and Q > 500
Equation 3 returns RMR values which are outside the range defined in the system. In other words, if Q < 0.008, RMR
< 0 and if Q > 500, RMR > 100. Palmstrom (2009) noted that this correlation is a very crude approximation, involving
an inaccuracy of ±50% or more.
Correlation Source Equation No.
RMR = 9 ln Q + 44 Bieniawski (1976) 3
RMR = 5.9 ln Q + 43 = 13.5 log Q + 43 Rutledge and Preston (1978) 4
RMR = 5 ln Q + 60.8 (from in situ data) Cameron-Clarke & Budavari (1981) 5
RMR = 4.6 ln Q + 55.5 (from bore core data) Cameron-Clarke & Budavari (1981) 6
RMR = 5.4 ln Q + 55.2 = 12.5 log Q + 55.2 Moreno Tallon (1982) 7
RMR = 10.5 ln Q + 41.8 Abad et al. (1983) 8
RMR = 7.5 ln Q + 42 Baczynski (1983) 9
RMR = 5.3 ln Q + 50.81 = 12.11 log Q + 50.81 Udd and Wang (1985) 10
RMR = 6.3 ln Q + 41.6 Kaiser et al. (1986) 11
RMR = 8.7 ln Q + 38 ± 18 (probability theory)a
Kaiser et al. (1986) 12
RMR = 6.8 ln Q + 42b Sheorey (1993) 13
RMR = 43.89 – 9.19 ln Q Celada Thamames (1983) 14
RMR = 10 ln Q +39 Choquet & Charette (1988) 15
RMR = 10.3 ln Q + 49.3 (when Q ≤ 1, SRF = 1)c Rawlings et al. (1995) 16
RMR = 6.2 ln Q + 49.2 (when Q > 1, SRF = 1)c
Rawlings et al. (1995) 17
RMR = 6.6 ln Q + 53 (when Q ≤ 0.65)c
Rawlings et al. (1995) 18
RMR = 5.7 ln Q + 54.1 (when Q > 0.65)c
Rawlings et al. (1995) 19
RMR = 7 ln Q + 36 Tugrul (1998) 20
RMR = 4.2 ln Q + 50.6 Asgari (2001) 21
RMR = 5.97 ln Q + 49.5 Sunwoo & Hwang (2001) 22
RMR = 4.7 ln Q + 56.8 Kumar et al. (2004) 23
RMR = 8.3 ln Q + 42.5 (with SRF = 1) Kumar et al. (2004) 24
RMR = 6.4 ln Q + 49.6 (with revised SRF values) Kumar et al. (2004) 25
RMR = 3.7 ln Q + 53.1 Sari & Pasamehmetoglu (2004) 26
Table 2 Correlations between RMR and Q
a assuming RMR and ln Q are normal variates and satisfy the central limit theory of probability;
b derived from the data
presented by Sheorey (1993); c from bore core data
A review of the information available from the relevant publications shows scattering of the data used in deriving the
other equations listed in Table 2
Rutledge and Preston (1978) derived Equation 4 in Table 2 using the data obtained from nine tunnel headings in New
Zealand, noting that “There is considerable scatter in the results”. On the two relationships (Equations 5 and 6)
obtained using bore core data and in situ observations in South African tunnels, Cameron-Clarke and Budavari (1981)
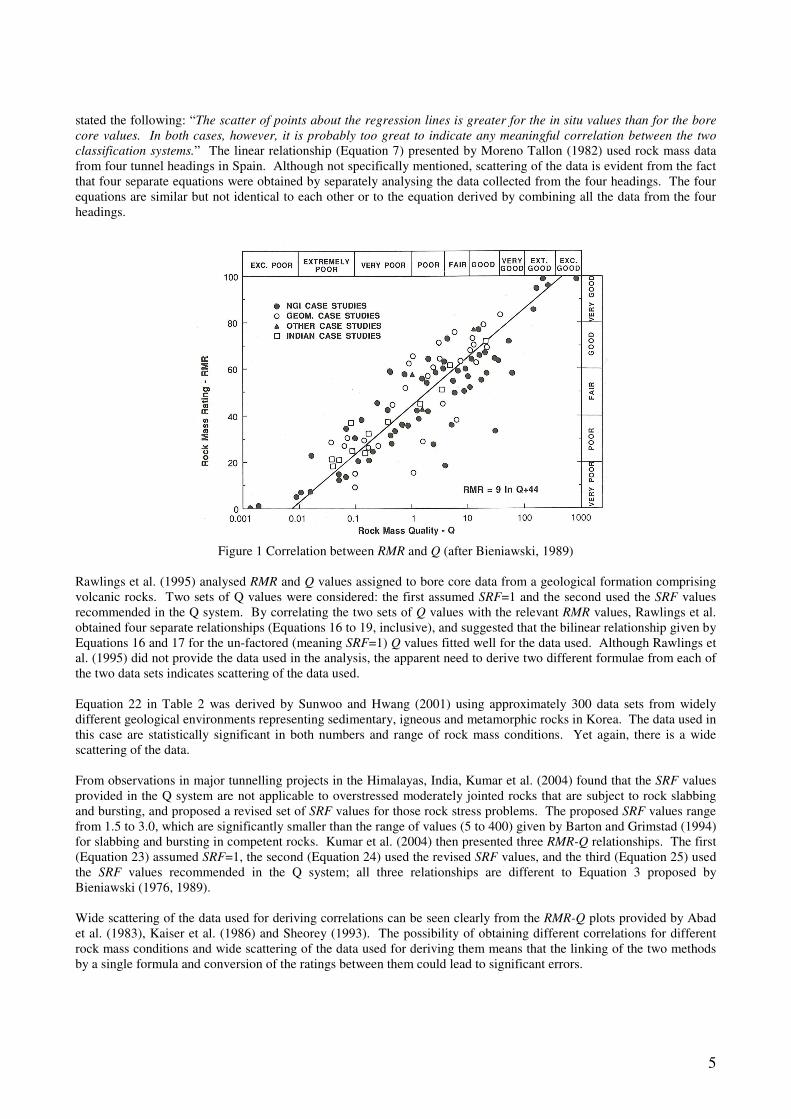
5
stated the following: “The scatter of points about the regression lines is greater for the in situ values than for the bore
core values. In both cases, however, it is probably too great to indicate any meaningful correlation between the two
classification systems.” The linear relationship (Equation 7) presented by Moreno Tallon (1982) used rock mass data
from four tunnel headings in Spain. Although not specifically mentioned, scattering of the data is evident from the fact
that four separate equations were obtained by separately analysing the data collected from the four headings. The four
equations are similar but not identical to each other or to the equation derived by combining all the data from the four
headings.
Figure 1 Correlation between RMR and Q (after Bieniawski, 1989)
Rawlings et al. (1995) analysed RMR and Q values assigned to bore core data from a geological formation comprising
volcanic rocks. Two sets of Q values were considered: the first assumed SRF=1 and the second used the SRF values
recommended in the Q system. By correlating the two sets of Q values with the relevant RMR values, Rawlings et al.
obtained four separate relationships (Equations 16 to 19, inclusive), and suggested that the bilinear relationship given by
Equations 16 and 17 for the un-factored (meaning SRF=1) Q values fitted well for the data used. Although Rawlings et
al. (1995) did not provide the data used in the analysis, the apparent need to derive two different formulae from each of
the two data sets indicates scattering of the data used.
Equation 22 in Table 2 was derived by Sunwoo and Hwang (2001) using approximately 300 data sets from widely
different geological environments representing sedimentary, igneous and metamorphic rocks in Korea. The data used in
this case are statistically significant in both numbers and range of rock mass conditions. Yet again, there is a wide
scattering of the data.
From observations in major tunnelling projects in the Himalayas, India, Kumar et al. (2004) found that the SRF values
provided in the Q system are not applicable to overstressed moderately jointed rocks that are subject to rock slabbing
and bursting, and proposed a revised set of SRF values for those rock stress problems. The proposed SRF values range
from 1.5 to 3.0, which are significantly smaller than the range of values (5 to 400) given by Barton and Grimstad (1994)
for slabbing and bursting in competent rocks. Kumar et al. (2004) then presented three RMR-Q relationships. The first
(Equation 23) assumed SRF=1, the second (Equation 24) used the revised SRF values, and the third (Equation 25) used
the SRF values recommended in the Q system; all three relationships are different to Equation 3 proposed by
Bieniawski (1976, 1989).
Wide scattering of the data used for deriving correlations can be seen clearly from the RMR-Q plots provided by Abad
et al. (1983), Kaiser et al. (1986) and Sheorey (1993). The possibility of obtaining different correlations for different
rock mass conditions and wide scattering of the data used for deriving them means that the linking of the two methods
by a single formula and conversion of the ratings between them could lead to significant errors.
6
4.2 CHOICE OF THE INDEPENDENT VARIABLE AND METHOD OF ANALYSIS
The relationships listed in Table 2 are based on least square linear regression analysis of RMR and Q values with Q as
the independent variable (abscissa of the RMR-Q plot as in Figure 1). Kaiser et al. (1986) pointed out that the
correlations developed using linear regression analysis should be viewed with caution because the results depend on the
choice of the dependent variable. From the linear regression analysis of the data collected from the Wolverine West
Tunnel in Canada, they derived two relationships; the first (Equation 11) used Q as the independent variable, and the
second (Equation 27) used RMR as the independent variable.
RMR = 6.3 ln Q + 41.6 (11)
ln Q = 0.087 RMR – 2.28 (27)
Kaiser et al. demonstrated that despite the fact that the two relationships were derived using the same data set, they do
not lead to the same result. For example, the first equation would predict an RMR value of 40 from a Q value of 0.8,
while in turn the second equation would predict a Q value of 3.35 from a RMR value of 40. This clearly demonstrates
the weakness of the conventional least square linear regression analysis. To overcome this weakness, Kaiser et al.
(1986) used a probabilistic approach to determine a unique relationship, assuming that RMR and ln Q are normal
variants and satisfy the central limit theorem of probability theory. Despite the use of a probabilistic approach, Kaiser
et al. (1986) observed wide scattering of the data and therefore proposed two equations representing 90% confidence
limits within which 90% of the data used for their study fall. However, Kaiser et al. noted that the range of values
represented by the two equations is of little practical value as the range covers almost two RMR ground classes, as in
the case of 90% confidence limits of Bieniawski (1976).
5 DIFFERENCES IN THE TWO RATING SYSTEMS
The presence of several different correlations and wide scattering of the data used in deriving them may be attributed to
the fact that, the two methods have significantly different assessments of some of the rock mass parameters as discussed
below:
o Intact rock strength (IRS) is a factor in the SRF term of the Q system, only if the excavation stability is
affected by the in situ stress field. In contrast IRS is always included in the RMR value. If IRS changes while
all the other parameters remain virtually the same, several RMR values are possible for a single Q value.
o In situ stress field is not accounted for in the RMR system in classifying a rock mass. In the Q system it is a
factor in the SRF term if excavation instability is stress driven. Thus for a rock mass with a given RMR
value, several different Q values are possible depending on the SRF value used. As pointed out by Baczynski
(1983), the RMR versus Q correlations are stress-dependent. The relationship will be significantly altered if
different SRF values are assumed in the determination of the Q rating.
o Joint spacing (JS) is a key parameter in the RMR system; the closer the JS the lower the RMR value and the
wider the JS the higher the RMR value. This is not so in the Q system. As pointed out by Milne et al. (1998),
if three or more joint sets are present and the joints are widely spaced, it is difficult to get the Q system to
reflect the competent nature of a rock mass. For widely spaced jointing, Jn in the Q system appears to
unduly reduce the resulting Q value (Milne et al., 1998). Thus for a single Q value several RMR values are
possible depending on JS.
o RQD is used in both methods, and is a function of joint spacing JS, albeit it does not fully represent its true
nature. In addition to RQD, as mentioned above, JS is also a key parameter in the RMR method. In the Q
system, although the number of joint sets is taken into account, their spacing is not considered directly. This
means the joint spacing is counted twice in the RMR method, while Q system uses it indirectly only once.
o In the RMR method joint orientation is accounted for directly through RA by allocating a rating between 0
and -12. In the Q system this is considered implicitly, but what is meant by adversely oriented
discontinuities is not defined and the selection of the most critical discontinuity set is user dependent. In any
case no rating is given to RA in the Q system. Thus for a given Q value different RMR values are possible
depending on the orientation of the excavation relative to the discontinuity set orientation.
o Rating scale: The rating scales in the RMR method have been changed several times as shown in Table 1,
while Q remained unchanged for nearly 20 years until 1993. For a rock mass with a given Q value, different
RMR values can be obtained depending on the RMR version used. Since 1993, the SRF parameter of the Q
system has been given a rating scale of 1 to 400 for competent rock with rock stress problems. As mentioned
earlier, depending on the SRF value used, different Q values can be obtained for a rock mass with a given
7
RMR value. With the 1 to 400 range of SRF values, the difference in the Q value can be more than two
orders of magnitude. By setting the SRF value to 1 in deriving the Q values, this problem may be overcome
if the SRF term represents only stress. But, it is not strictly a stress factor. It also represents weakness zones,
which are rock mass parameters.
From the foregoing it is clear that there is unlikely to be a universally applicable single formula for linking RMR and Q
values. Any relationship will be specific to the rock mass from which the data were obtained, the potential failure mode
assumed in deriving the Q values and the orientation of the excavation considered for the RMR values. It is also
noteworthy that the data used for deriving the RMR and Q correlations listed in Table 2 were obtained by applying
different versions of the RMR system. For instance, the correlation given in Equation 3 was obtained using the pre
1976 version(s) of RMR, while the subsequent correlations may be based on either pre or post 1976 versions. Since
different versions of the RMR method use somewhat different ranges of ratings, it is important to state which version is
being used when correlating the RMR and Q values. The lumping of the ratings assigned using different RMR versions
to compare and correlate them with the Q values has a very limited scientific basis.
Sheorey (1993), Goel et al. (1996) and Kumar et al. (2004) attempted to reduce data scattering and obtain better
correlations using truncated versions of the RMR and Q methods. They defined RMRmod (also called RCR – rock
condition rating) as RMR without IRS and RA and Qmod (also denoted as N) as Q with SRF=1. By regression analysis of
the truncated versions of the two methods, Sheorey (1993), Goel et al. (1996) and Kumar et al. (2004) obtained the
relationships given by Equations 28, 29 and 30, respectively.
RCR = 9.5 ln N + 31 (28)
RCR = 8.0 ln N + 30 (29)
RCR = 8.0 ln N + 42.7 (30)
Despite the relatively high correlation coefficients (r2=0.87, 0.92 and 0.88, respectively) of these equations, the relevant
data plots show that the data are still scattered around the regression lines of the three equations. For instance,
according to the data provided by Goel et al. (1996) when N is 3, the corresponding RCR can be between 25 and 45.
Further, Sari and Pasamehmetoglu (2004) found that regression analysis of RCR and N values does not always yield
high correlation coefficients. Their RMR-Q correlation (Equation 26) with r2=0.86 is better than their RCR-N correlation
given as Equation 31 with r2=0.65, showing a distinction from the three equations given above.
RCR = 1.7 ln N + 51.5 (31)
Based on their analysis, Sari and Pasamehmetoglu stated that the correlation between RCR and N cannot be generalised.
7 CONCLUSIONS
The rock mass classification systems, such as RMR and Q, despite their limitations, will continue to be used for
underground excavation support design, particularly in the early stages of projects as they provide a useful means of
transferring previous experience to new projects. Since both methods have limitations, it is advisable to apply both
simultaneously if they are to be used as a design tool. However, it is not implied that by applying both methods all
possible rock mass problems can be adequately dealt with.
The review of the published RMR and Q correlations showed that everyone is different and the data used in deriving
them are often widely scattered. The main reasons for this are the differences in the parameters and the rating methods
used, and the manner in which the final RMR and Q values are computed.
It is clear from the available information that a different relationship can be obtained for each case study and that each
relationship is applicable only to that particular rock mass and project conditions from which the relationship was
obtained. Even for the same rock mass, if the data used are widely scattered, such relationships are of very little
practical value and their use for transforming the ratings between the two methods could lead to errors. Further, Kaiser
et al. (1986) showed that the results of correlations depend on the choice of the dependent variable. From the foregoing,
it is apparent that there is no sound scientific basis to assume a universally applicable linear relationship between the
two systems.
8
When both methods are to be applied to a project, which is desirable, each should always be applied independent of the
other, without attempting to convert the ratings of one method to that of the other using the relationships published in
the literature. Such relationships, bearing in mind their obvious limitations, may be used as a crude guide for checking
the general accuracy of the ratings derived by the two systems.
8 DISCLAIMER
The views expressed in this paper are those of the two authors and not necessarily of their respective employers.
9 REFERENCES
Abad,J., Celad, B., Chacon, E., Gutierrez, V. and Hidalgo, E. (1983) Application of geomechanical classification to
predict the convergence of coal mine galleries and to design their supports. Proc 5th
Int. Congr. Rock Mech.,
ISRM Melbourne, Vol. 2, pp. E15-E19.
Asgari, A. R. (2001) New correlation between “Q & RMR” and “N & RCR”. Proc 5th
Iranian Tunnelling Conference,
Tehran (in Persian), English abstract is available on http://www.civilica.com/EnPaper-ITC05-
003_0871148829.html.
Baczynski, N. R. P. (1983) Application of various rock mass classifications to unsupported openings at Mount Isa,
Queensland: A case study. Proc 3rd Aus-NZ Conf on Geomech, Wellington, 12–16 May 1980, Vol. 2, pp. 137–
143. New Zealand Inst Eng, Wellington.
Barton, N. (1976) recent experience with the Q System in tunnel support design. Proc Sym Exploration for Rock
Engineering, Johannesburg, Ed. Z.T. Bieniawski, Vol. 1, pp. 107-115.
Barton, N. (1995) The influence of joint properties on in modelling jointed rock masses. Keynote lecture, 8th
ISRM
Congress (Tokyo), Balkema, Rotterdam.
Barton, N. and Bieniawski, Z. T. (2008) RMR and Q – setting records. Tunnels & Tunnelling International, February
2008, pp. 26-29.
Barton, N., Lien, R. and Lunde, J. (1974) Engineering classification of rock masses for the design of rock support. Rock
Mechanics. 6, pp. 189–236.
Barton, N., Lien, R. and Lunde, J. (1977) Estimation of support requirements for underground excavations. Design
Methods in Rock mechanics. Proc 16th
Symp on Rock Mech, Univ of Minnesota, ASCE 1977, pp. 163-177.
Barton, N., Loset, R., Lien, R. and Lunde, J. (1980) Application of Q-system in design decisions concerning dimensions
and appropriate support for underground installations. In Subsurface Space 2, 1980 (ed. M Begman), Pergamon,
New York, pp. 553-561.
Bieniawski, Z. T., 1973. Engineering classification of jointed rock masses. Trans South African Inst of Civil Eng.
Vol.15, pp.335-334.
Bieniawski, Z.T. (1974) Geomechanics classification of rock masses and its application in tunneling. In: Proceedings of
the Third International Congress on Rock Mechanism, ISRM, Denver, pp. 27–32.
Bieniawski, Z.T. (1975) Case Studies: Prediction of rock mass behaviour by the geomechanics classification. 2nd
AusNZ Conf on Geomech, Brisbane, 1975, Inst Eng Australia, pp. 36-41.
Bieniawski, Z.T. (1976) Rock mass classification in rock engineering. Proc Symp for Exploration for Rock engineering.
Z.T. Bieniawski and.A.A. Balkema eds, AA Balkema, Rotterdam. pp. 97-106.
Bieniawski, Z.T. (1979) The geomechanics classification in rock engineering applications. 4th
Intnl Conf on Rock
Mech, vol 2, ISRM, Montreux, pp.41-48.
Bieniawski, Z.T. (1989) Engineering rock mass classifications, John Wiley & Sons, New York, 251 p.
Bieniawski, Z.T. (1993) Classification of rock masses for engineering: The RMR system and future trends,
Comprehensive Rock Engineering, Principles, Practice and Projects, Editor in Chief J. A. Hudson, Pergamon,
Vol. 3, pp.553-573.
9
Cameron-Clarke, L. S. and Budavari, S. (1981) Correlation of rock mass classification parameters obtained from
borecore and in situ observations, Engineering Geology, Elsevier, Vol. 17, pp.19-53.
Celada Tamames, B. (1983) Fourteen years of experience on rock bolting in Spain. In Proceedings International
Symposium on Rock Bolting, Abisko 1983, (ed. O Stephansson), pp. 295-311.
Choquet, P. and Hadjigeorgiou, J. (1993) The design of support for underground excavations. Comprehensive Rock
Engineering, Principles, Practice and Projects, Editor in Chief J. A. Hudson, Pergamon, Vol. 4, pp. 313-348.
Grimstad, E. and Barton, N. (1993) Updating the Q-system for NMT, in Proc Int. Sym on Sprayed Concrete, Norwegian
Concrete Assoc, Oslo. pp. 46-66.
Jethwa, J. L., Dube, A. K., Singh, B. and Mithal, R. S. (1982) Evaluation of methods for tunnel support design in
squeezing rock conditions. Proc 4th
International Cong of International. Assoc Eng Geol, Delhi, 1982, Vol 5, pp.
125-134.
Kaiser, P. K., MacKay, C. and Gale, A. D. (1986) Evaluation of rock classification at B. C. Rail Tumbler Ridge
Tunnels. Rock Mech and Rock Eng, Vol. 19, pp. 205-234.
Kumar, N., Samadhiya, N. K. and Anbalagan, R. (2004) Application of rock mass classification systems for tunnelling
in Himalaya, India. SYNOROCK2004 Symposium Paper 3B14, Int. J Rock Mech. Min. Sci. Vol. 41, No. 3,
CD-ROM.
Milne, D., Hadjgeorgiou, J and Pakalnis, R. (1998) Rock mass characterization for underground hard rock mines.
Tunnelling and Underground Space Tech. Vol.13, No. 4, pp. 383-391.
Moreno Tallon, E. (1982) Comparison and application of geomechanics classification schemes in tunnel construction.
Tunnelling 82, 3rd
Intl. Sym. The Inst. Min. Met., pp. 241-246.
Palmstrom, A. (2009) Combining the RMR, Q and RMi classification systems. Tunnelling & Underground Space
Technology, Elsevier, Vol. (in press).
Rawlings, C. G., Barton, N., Smallwood, A. and Davies, N. (1995) Rock mass characterisation using the Q and RMR
systems. 8th
ISRM Congress (Tokyo), Balkema, Rotterdam. Vol. 1, pp. 29-31.
Rutledge, J. C. and Preston, R. L. (1978) Experience with engineering classifications of rock. Proc Intnl Tunnelling
Symp, Tokyo, 1978, pp. A3.1-A3.7.
Sari, D, and Pasamehmetoglu, A. G. (2004) Proposed support design, Keletepe tunnel, Turkey, Engineering Geology,
Elsevier, Vol. 72, pp. 201-216.
Sheorey, P. R. (1993) Experience with the application of modern rock classifications in coal mine roadways.
Comprehensive Rock Engineering, Principles, Practice and Projects, Editor in Chief J. A. Hudson, Pergamon,
Vol. 5, pp.411-431.
Sunwoo, C. and Hwang S, (2001) Correlation of rock mass classification methods in Korean rock mass. Frontiers of
Rock Mechanics & Sustainable Development in 21st Century, 2
nd ARMS, Proc of the 2001 ISRM Intnl Symp,
Beijing, China, Balkema, pp. 631-633.
Tugrul, A. (1998) The application of rock mass classification systems to underground excavation in weak limestone,
Ataturk dam, Turkey. Engineering Geology, Elsevier, Vol. 50, pp. 337-345.
Udd, J E. and Wang, H. A. (1985) A comparison of some approaches to the classification of rock masses for
geotechnical purposes. In Proceedings 25th
U.S. Symposium on Rock Mechanics, Rapid City, SD, (Ed. E.
Ashworth), Balkema, Rotterdam, pp. 69-78.

B1
APPENDIX B
UDEC Analysis of CLH tunnel
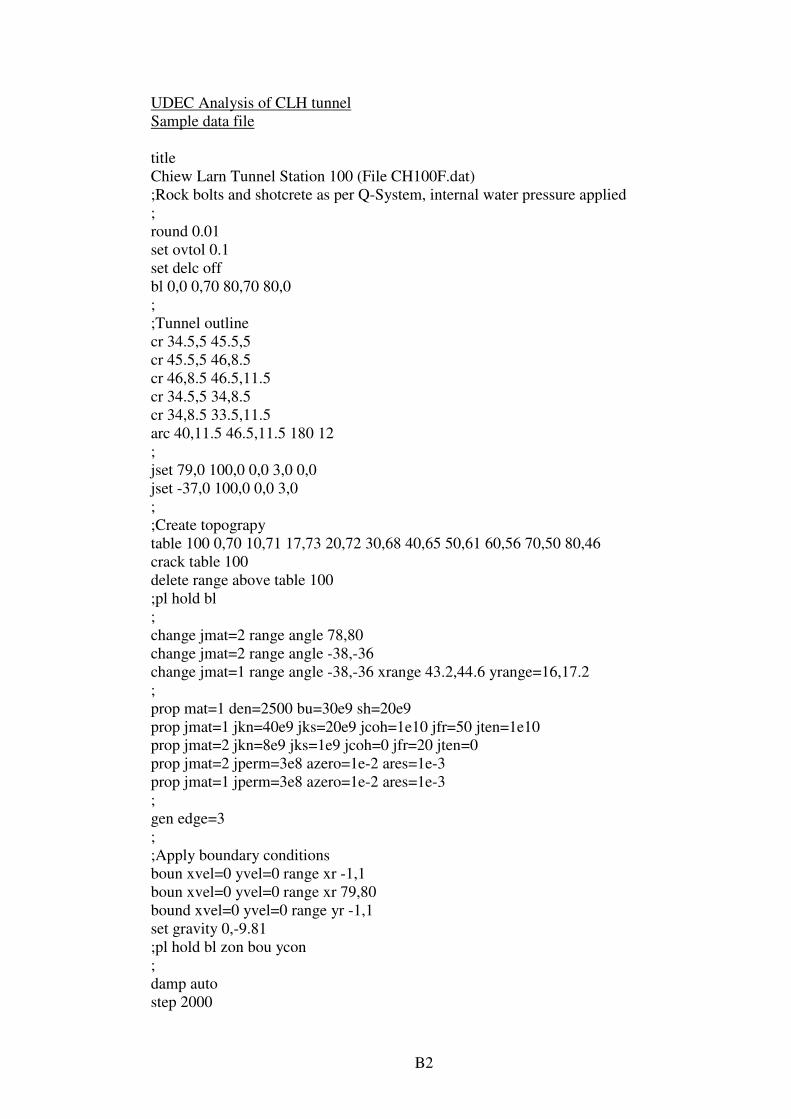
B2
UDEC Analysis of CLH tunnel
Sample data file
title
Chiew Larn Tunnel Station 100 (File CH100F.dat)
;Rock bolts and shotcrete as per Q-System, internal water pressure applied
;
round 0.01
set ovtol 0.1
set delc off
bl 0,0 0,70 80,70 80,0
;
;Tunnel outline
cr 34.5,5 45.5,5
cr 45.5,5 46,8.5
cr 46,8.5 46.5,11.5
cr 34.5,5 34,8.5
cr 34,8.5 33.5,11.5
arc 40,11.5 46.5,11.5 180 12
;
jset 79,0 100,0 0,0 3,0 0,0
jset -37,0 100,0 0,0 3,0
;
;Create topograpy
table 100 0,70 10,71 17,73 20,72 30,68 40,65 50,61 60,56 70,50 80,46
crack table 100
delete range above table 100
;pl hold bl
;
change jmat=2 range angle 78,80
change jmat=2 range angle -38,-36
change jmat=1 range angle -38,-36 xrange 43.2,44.6 yrange=16,17.2
;
prop mat=1 den=2500 bu=30e9 sh=20e9
prop jmat=1 jkn=40e9 jks=20e9 jcoh=1e10 jfr=50 jten=1e10
prop jmat=2 jkn=8e9 jks=1e9 jcoh=0 jfr=20 jten=0
prop jmat=2 jperm=3e8 azero=1e-2 ares=1e-3
prop jmat=1 jperm=3e8 azero=1e-2 ares=1e-3
;
gen edge=3
;
;Apply boundary conditions
boun xvel=0 yvel=0 range xr -1,1
boun xvel=0 yvel=0 range xr 79,80
bound xvel=0 yvel=0 range yr -1,1
set gravity 0,-9.81
;pl hold bl zon bou ycon
;
damp auto
step 2000
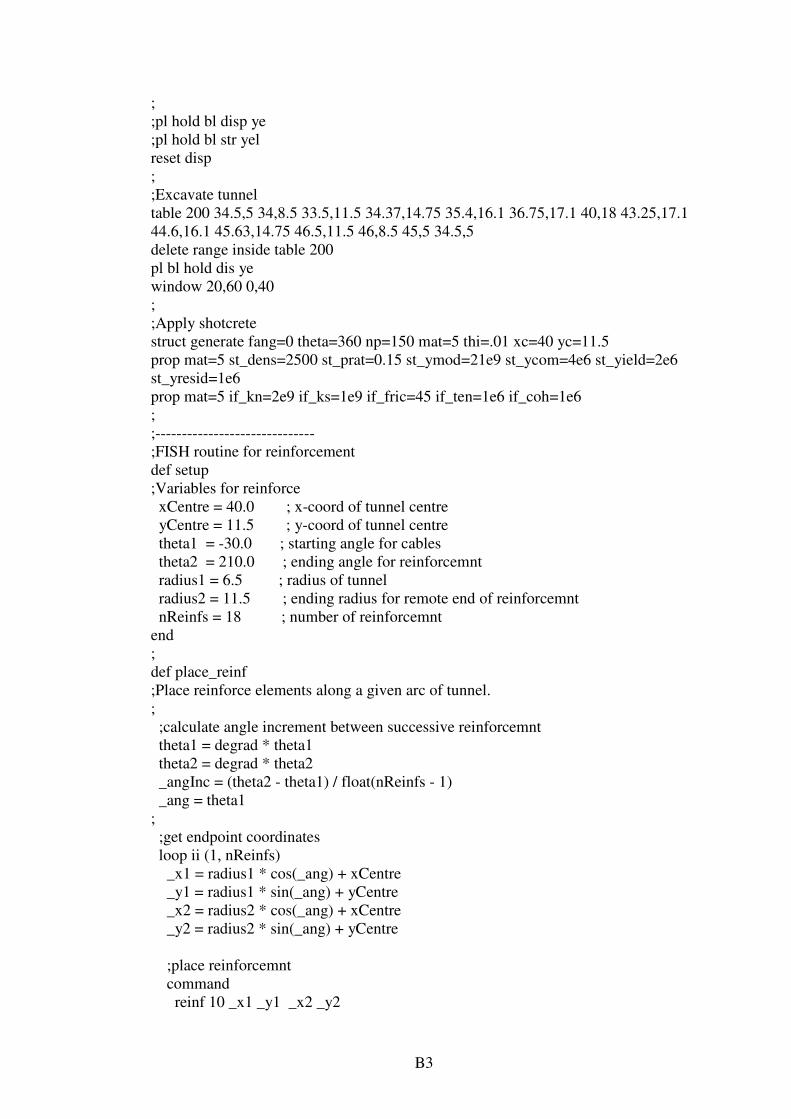
B3
;
;pl hold bl disp ye
;pl hold bl str yel
reset disp
;
;Excavate tunnel
table 200 34.5,5 34,8.5 33.5,11.5 34.37,14.75 35.4,16.1 36.75,17.1 40,18 43.25,17.1
44.6,16.1 45.63,14.75 46.5,11.5 46,8.5 45,5 34.5,5
delete range inside table 200
pl bl hold dis ye
window 20,60 0,40
;
;Apply shotcrete
struct generate fang=0 theta=360 np=150 mat=5 thi=.01 xc=40 yc=11.5
prop mat=5 st_dens=2500 st_prat=0.15 st_ymod=21e9 st_ycom=4e6 st_yield=2e6
st_yresid=1e6
prop mat=5 if_kn=2e9 if_ks=1e9 if_fric=45 if_ten=1e6 if_coh=1e6
;
;------------------------------
;FISH routine for reinforcement
def setup
;Variables for reinforce
xCentre = 40.0 ; x-coord of tunnel centre
yCentre = 11.5 ; y-coord of tunnel centre
theta1 = -30.0 ; starting angle for cables
theta2 = 210.0 ; ending angle for reinforcemnt
radius1 = 6.5 ; radius of tunnel
radius2 = 11.5 ; ending radius for remote end of reinforcemnt
nReinfs = 18 ; number of reinforcemnt
end
;
def place_reinf
;Place reinforce elements along a given arc of tunnel.
;
;calculate angle increment between successive reinforcemnt
theta1 = degrad * theta1
theta2 = degrad * theta2
_angInc = (theta2 - theta1) / float(nReinfs - 1)
_ang = theta1
;
;get endpoint coordinates
loop ii (1, nReinfs)
_x1 = radius1 * cos(_ang) + xCentre
_y1 = radius1 * sin(_ang) + yCentre
_x2 = radius2 * cos(_ang) + xCentre
_y2 = radius2 * sin(_ang) + yCentre
;place reinforcemnt
command
reinf 10 _x1 _y1 _x2 _y2
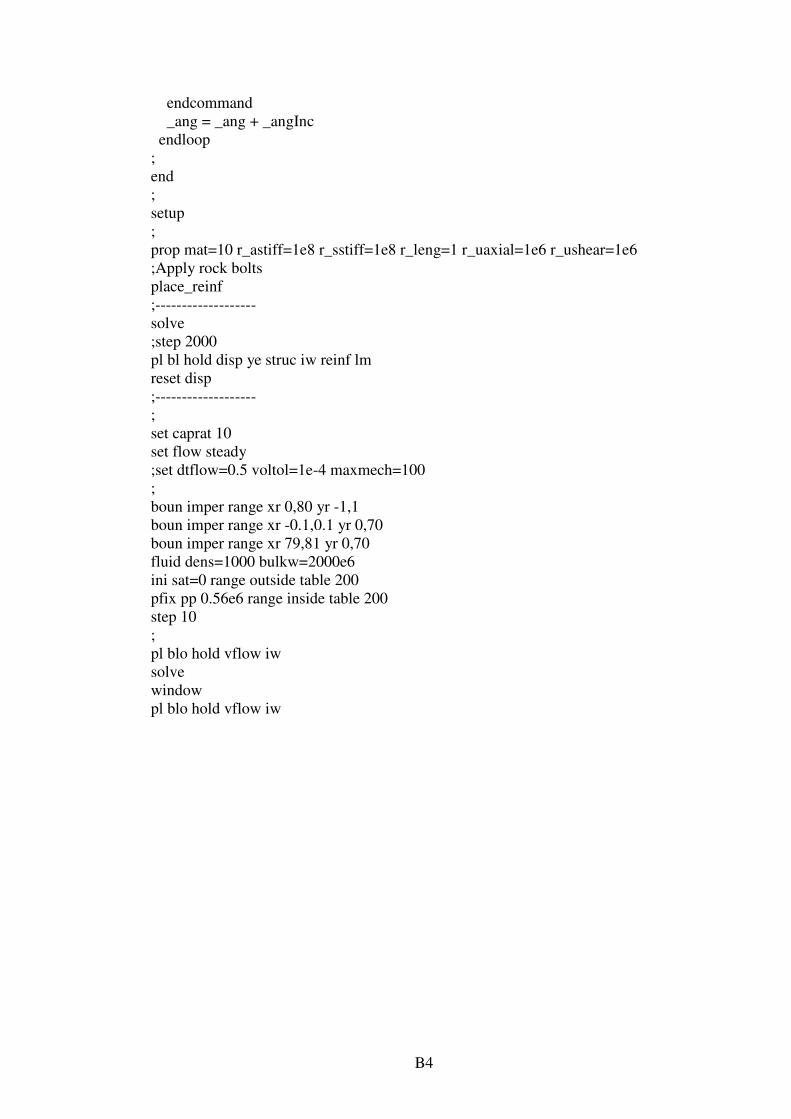
B4
endcommand
_ang = _ang + _angInc
endloop
;
end
;
setup
;
prop mat=10 r_astiff=1e8 r_sstiff=1e8 r_leng=1 r_uaxial=1e6 r_ushear=1e6
;Apply rock bolts
place_reinf
;-------------------
solve
;step 2000
pl bl hold disp ye struc iw reinf lm
reset disp
;-------------------
;
set caprat 10
set flow steady
;set dtflow=0.5 voltol=1e-4 maxmech=100
;
boun imper range xr 0,80 yr -1,1
boun imper range xr -0.1,0.1 yr 0,70
boun imper range xr 79,81 yr 0,70
fluid dens=1000 bulkw=2000e6
ini sat=0 range outside table 200
pfix pp 0.56e6 range inside table 200
step 10
;
pl blo hold vflow iw
solve
window
pl blo hold vflow iw
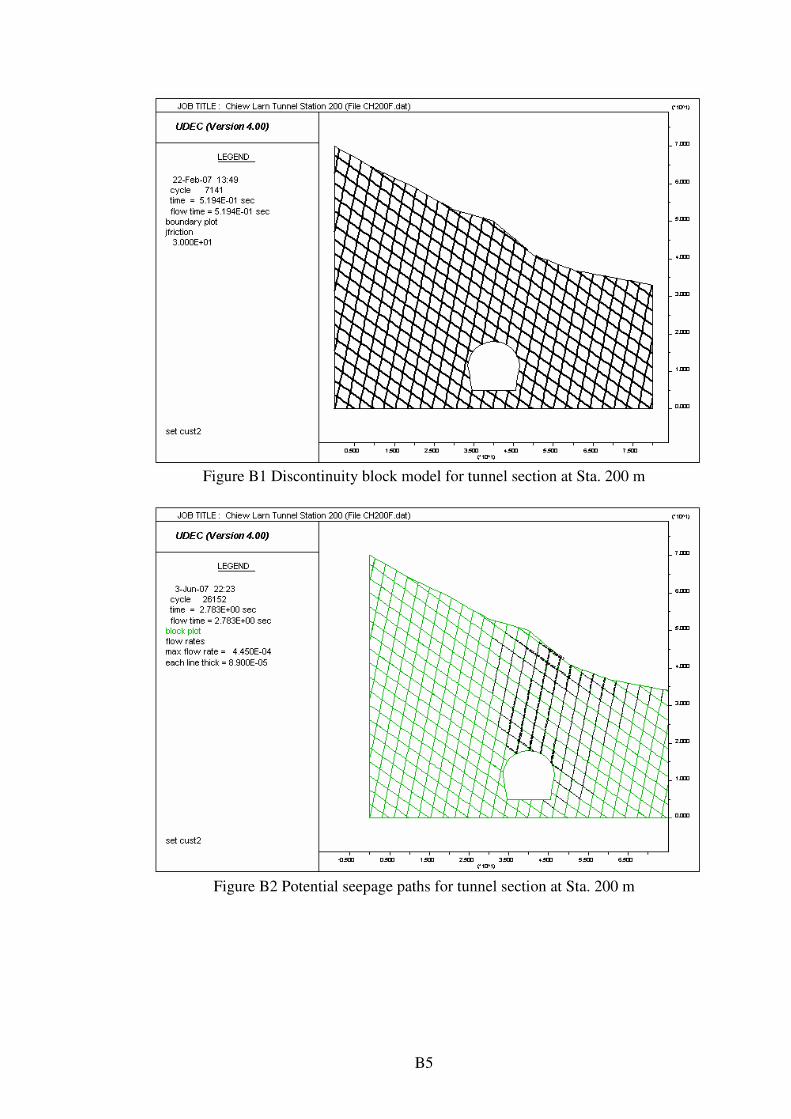
B5
Figure B1 Discontinuity block model for tunnel section at Sta. 200 m
Figure B2 Potential seepage paths for tunnel section at Sta. 200 m
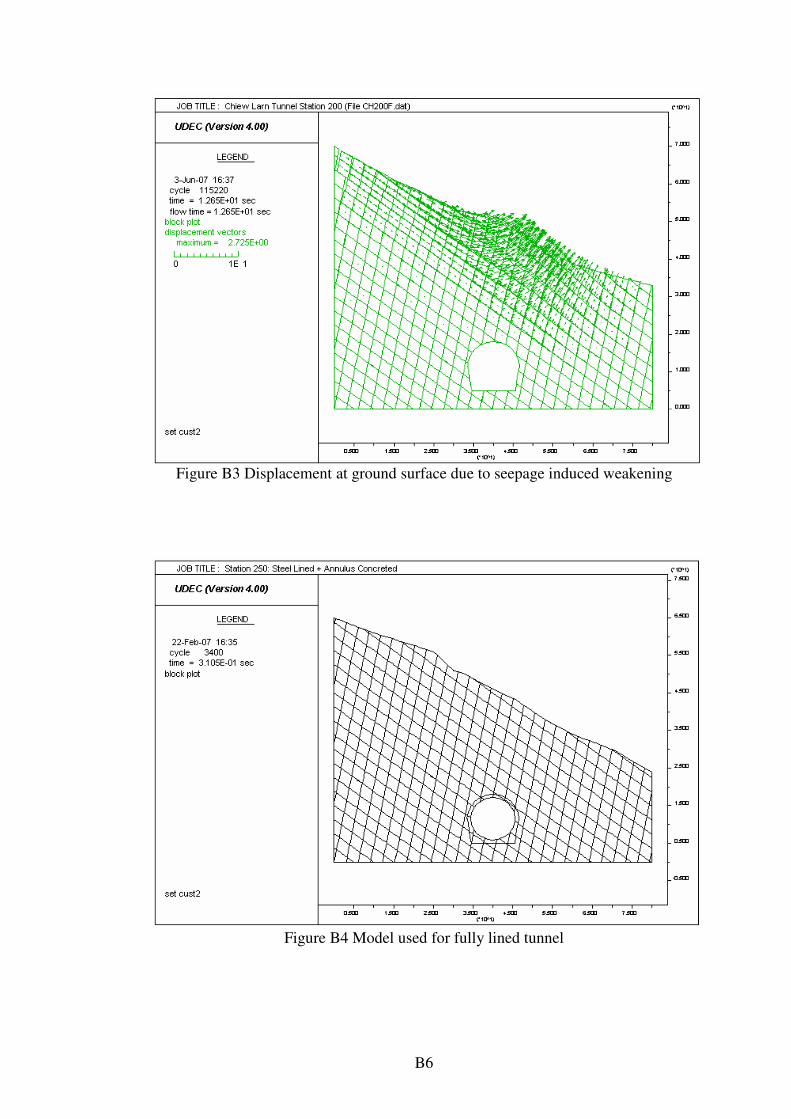
B6
Figure B3 Displacement at ground surface due to seepage induced weakening
Figure B4 Model used for fully lined tunnel

C1
APPENDIX C
UDEC analysis for LTKPA tunnel
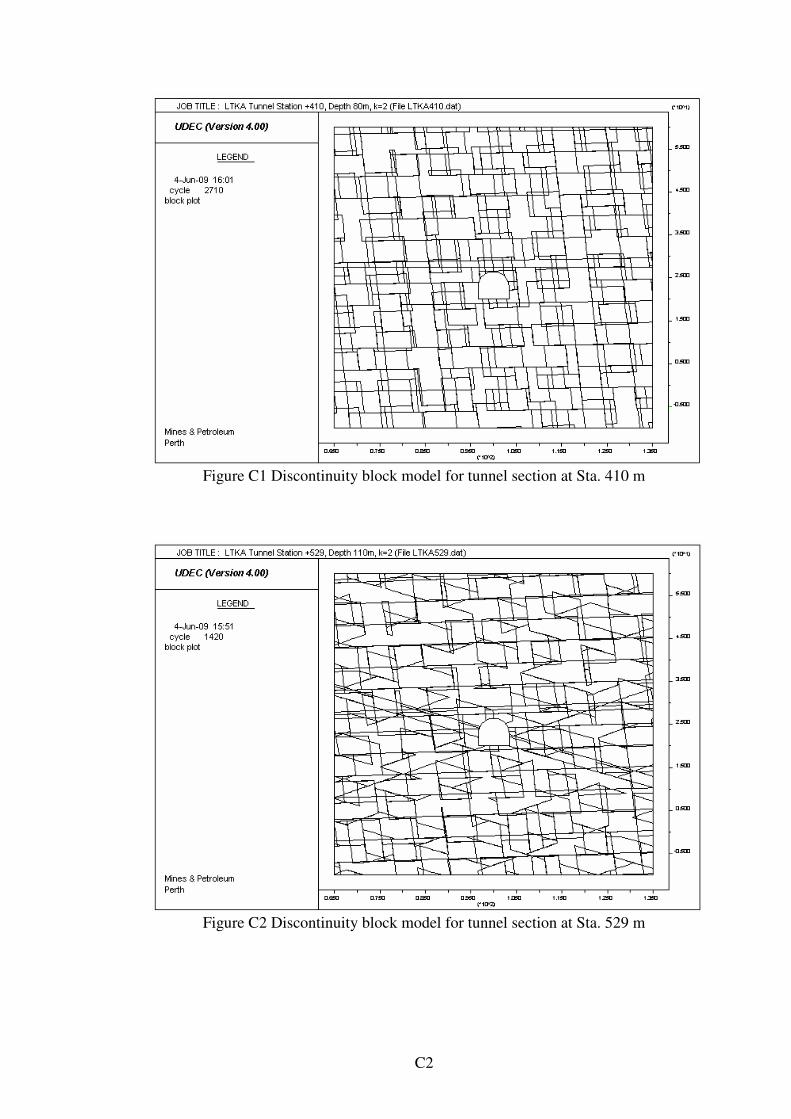
C2
Figure C1 Discontinuity block model for tunnel section at Sta. 410 m
Figure C2 Discontinuity block model for tunnel section at Sta. 529 m
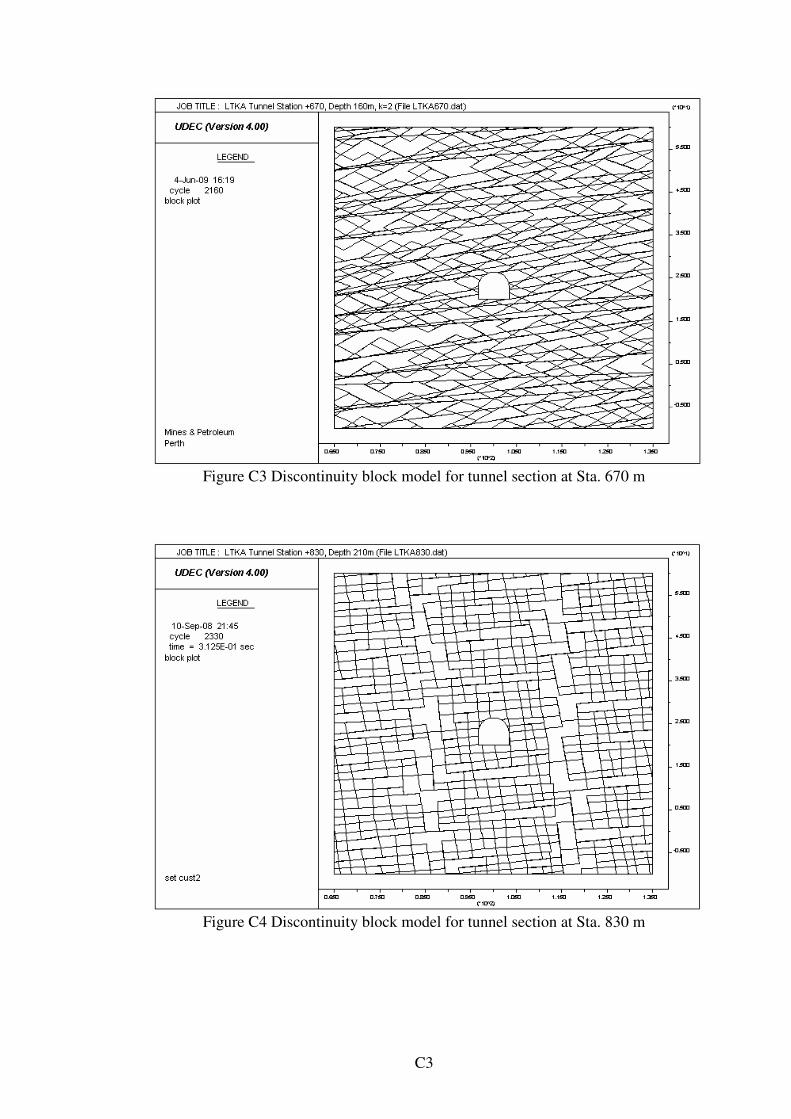
C3
Figure C3 Discontinuity block model for tunnel section at Sta. 670 m
Figure C4 Discontinuity block model for tunnel section at Sta. 830 m
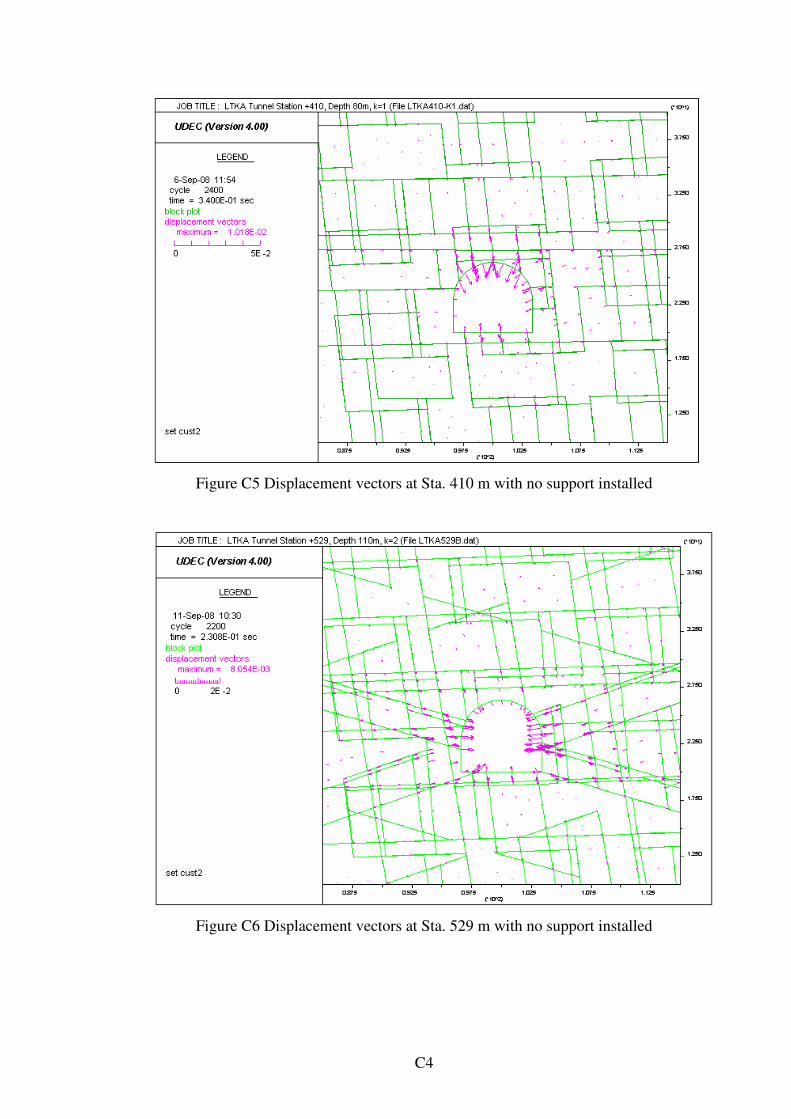
C4
Figure C5 Displacement vectors at Sta. 410 m with no support installed
Figure C6 Displacement vectors at Sta. 529 m with no support installed
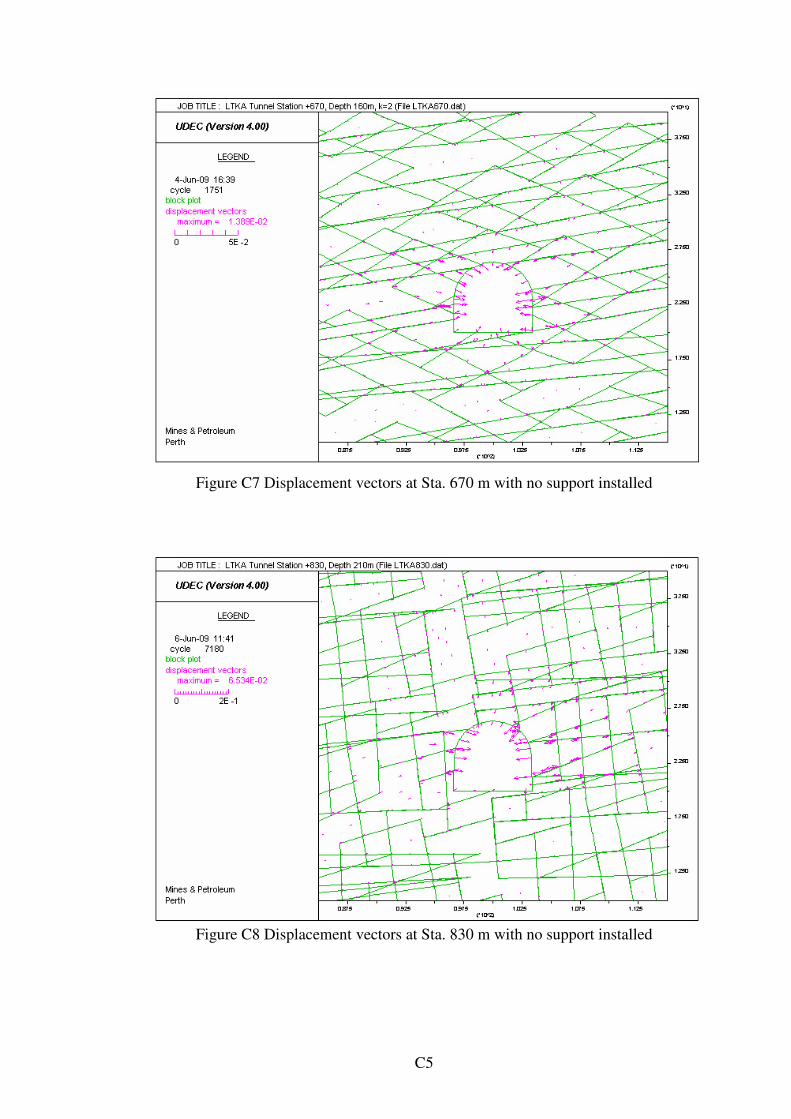
C5
Figure C7 Displacement vectors at Sta. 670 m with no support installed
Figure C8 Displacement vectors at Sta. 830 m with no support installed
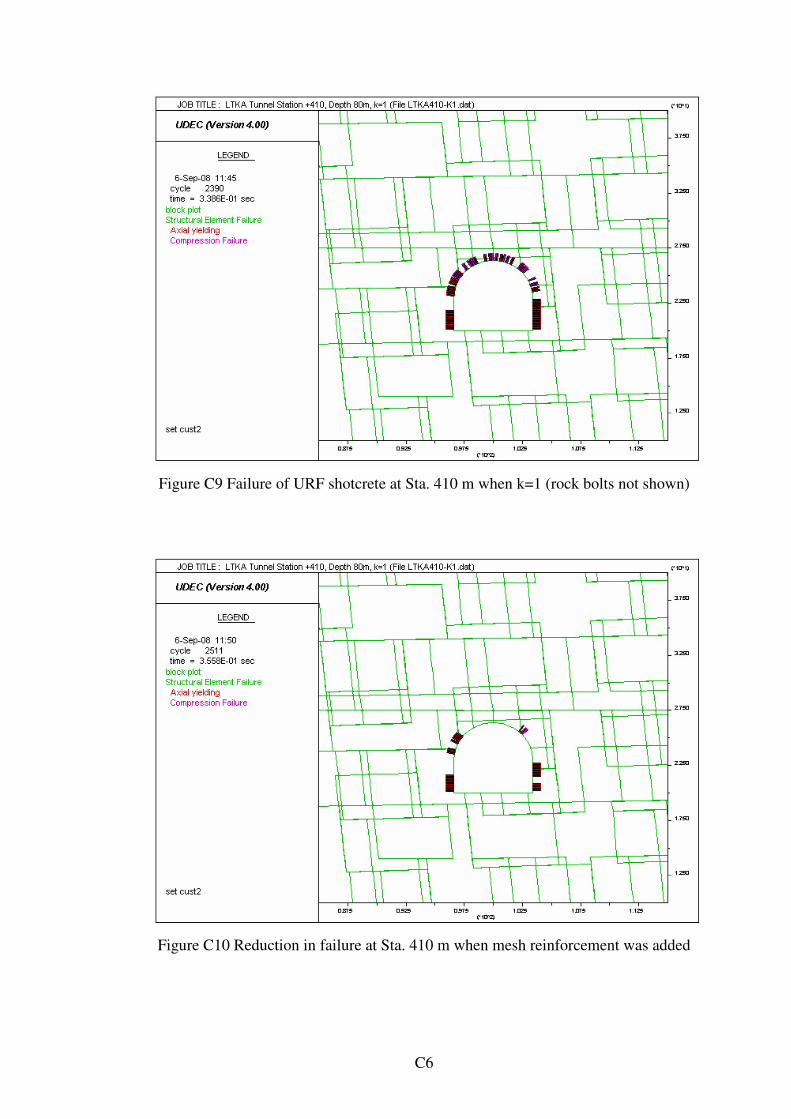
C6
Figure C9 Failure of URF shotcrete at Sta. 410 m when k=1 (rock bolts not shown)
Figure C10 Reduction in failure at Sta. 410 m when mesh reinforcement was added
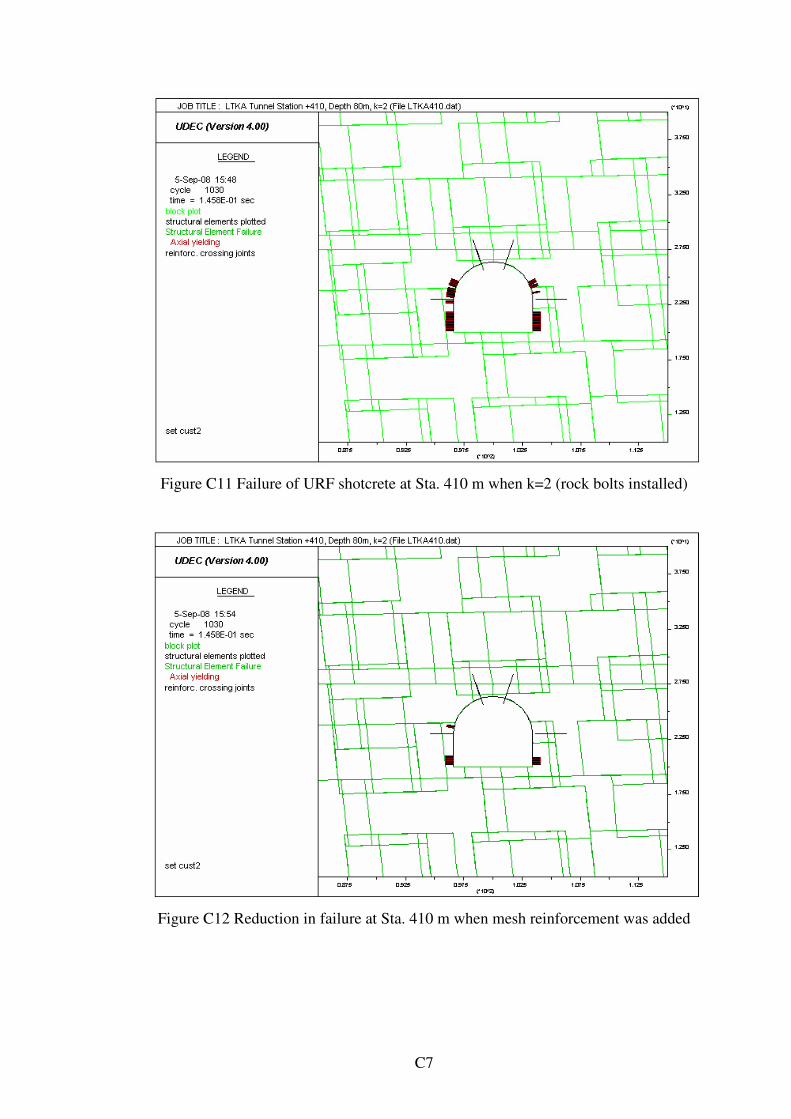
C7
Figure C11 Failure of URF shotcrete at Sta. 410 m when k=2 (rock bolts installed)
Figure C12 Reduction in failure at Sta. 410 m when mesh reinforcement was added
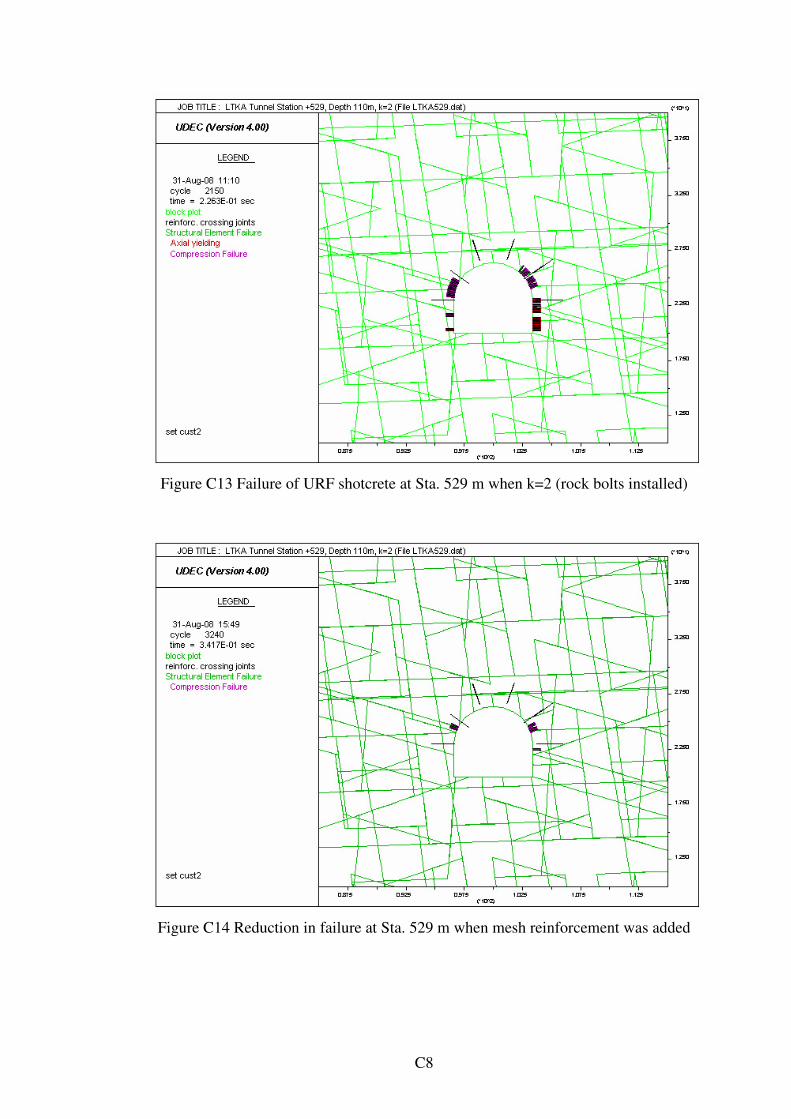
C8
Figure C13 Failure of URF shotcrete at Sta. 529 m when k=2 (rock bolts installed)
Figure C14 Reduction in failure at Sta. 529 m when mesh reinforcement was added
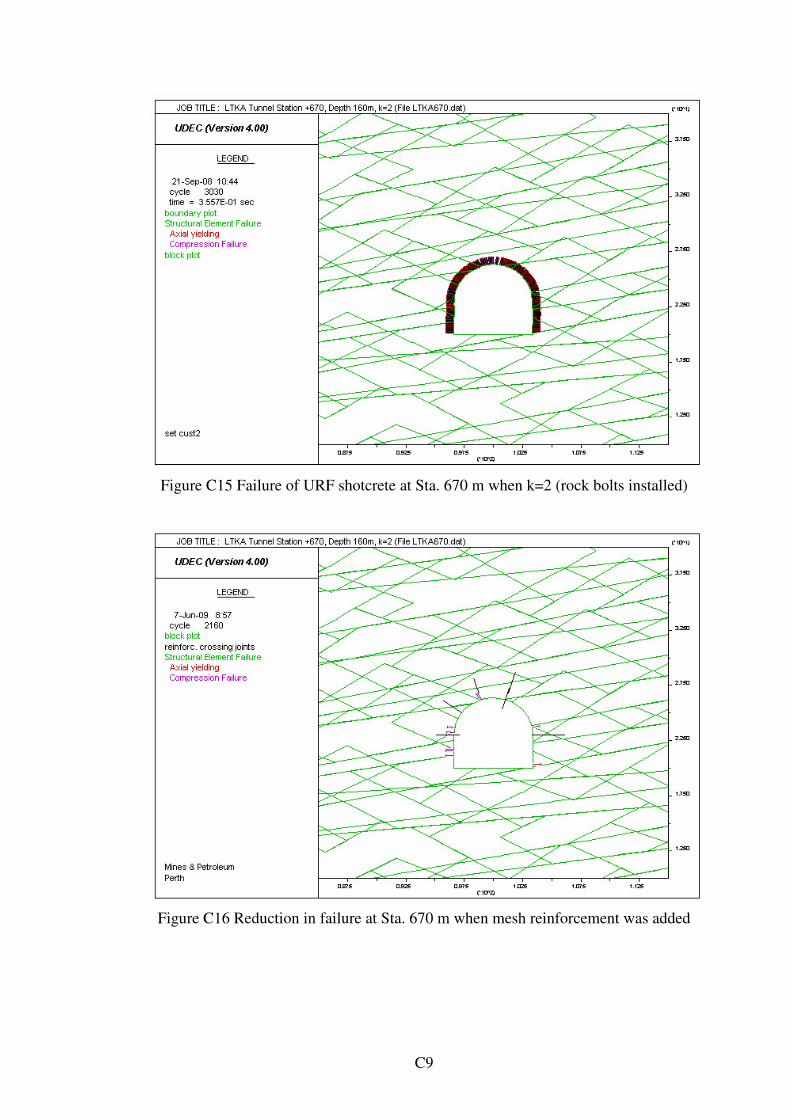
C9
Figure C15 Failure of URF shotcrete at Sta. 670 m when k=2 (rock bolts installed)
Figure C16 Reduction in failure at Sta. 670 m when mesh reinforcement was added
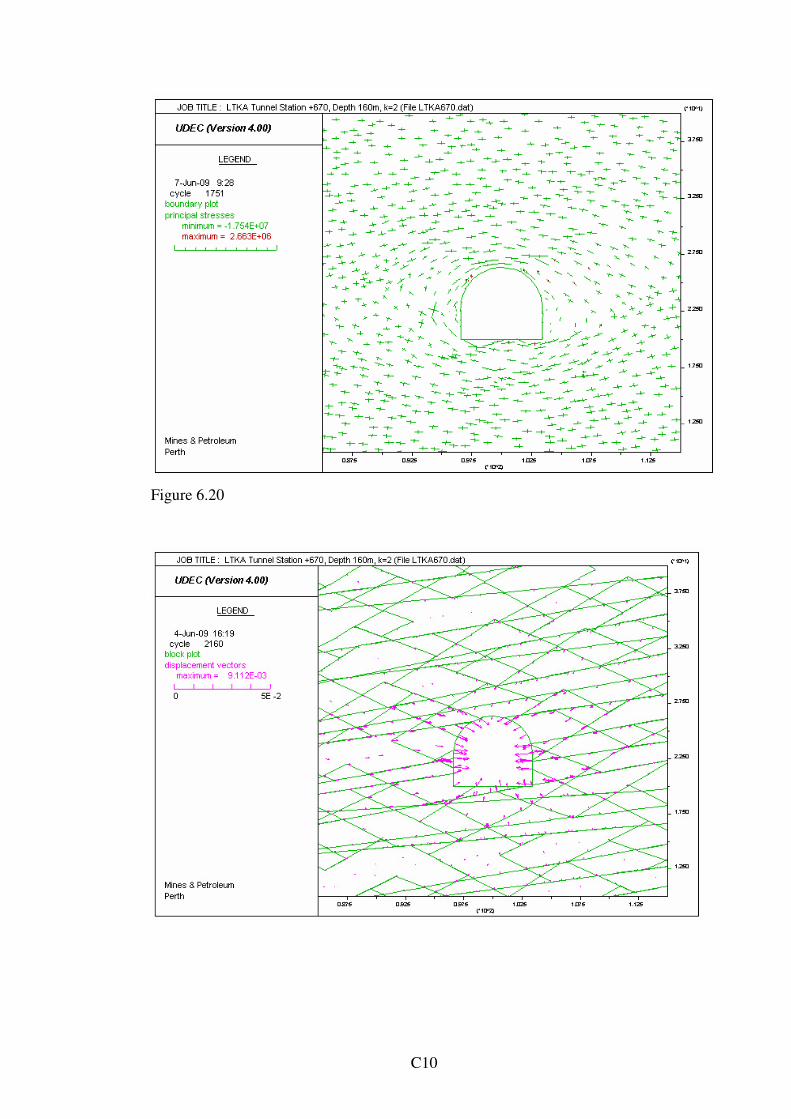
C10
Figure 6.20
C11
UDEC analysis for LTKPA tunnel
Sample data file
title
LTKA Tunnel Station +670, Depth 160m, k=2 (File LTKA670.dat)
set random
;
;Rock Density 2600
;
round 0.05
;set edge 0.003
;set ovtol 0.05
;set delc off
bl 65,-10 65,60 135,60 135,-10
;
;pl bl hold
;Tunnel outline
cr 96.6,20 103.4,20
cr 103.4,20 103.4,23
cr 96.6,23 96.6,20
arc 100,23 103.4,23 180 12
;pl bl hold
;
jset 7,5 100,0 0,0 2,0.5 65,-10
jset -25,5 10,2 0,0 3,1
jset 30,5 10,2 0,0 3,1
;
jdel
;
change jmat=2
;
prop mat=1 den=2600 bu=9.8e9 sh=8.6e9
prop jmat=1 jkn=40e9 jks=20e9 jcoh=1e10 jfr=50 jten=1e10
prop jmat=2 jkn=8e9 jks=1e9 jcoh=20e3 jfr=30 jten=10
;
gen edge=3
;
; Apply in situ stress
set gravity 0, -9.81
insitu stress -9.69e6 0 -4.846e6 ygrad 5.5e4 0 2.5e4 szz -4.846e6 zgrad 0 5.5e4
;
;Apply boundary conditions
bound stress -9.69e6 0 -4.846e6 ygrad 5.5e4 0 2.5e4 range 64,66 -10,60
bound stress -9.69e6 0 -4.846e6 ygrad 5.5e4 0 2.5e4 range 134,136 -10,60
bound stress 0 0 -3.06e6 range 65,135 59,61
boun xvel=0 yvel=0 range xr 64,66
boun xvel=0 yvel=0 range xr 134,136
bound xvel=0 yvel=0 range yr -11,-9
;
;
C12
damp auto
solve elastic
reset disp
;
table 10 96.6,20 96.6,23 96.715,23.88 97.055,24.7 97.595,25.4 98.3,25.94
99.12,26.28 100,26.4 100.879,26.28 101.7,25.94 102.404,25.4 102.944,24.7
103.284,23.88 103.4,23 103.4,20 96.6,20
;
delete range inside table 10
;
;------------------------------
;Apply shotcrete
struct generate fang=-40 theta=260 np=150 mat=5 thi=0.1 xc=100 yc=23
prop mat=5 st_dens=2500 st_prat=0.15 st_ymod=35e9 st_ycom=60e6 st_yield=40e6
st_yresid=20e6
prop mat=5 if_kn=2e9 if_ks=1e9 if_fric=45 if_ten=1e6 if_coh=1e6
;
;------------------------------
;FISH routine for reinforcement
def setup
;Variables for reinforce
xCentre = 100.0 ; x-coord of tunnel centre
yCentre = 23.0 ; y-coord of tunnel centre
theta1 = 0 ; starting angle for cables
theta2 = 180.0 ; ending angle for reinforcemnt
radius1 = 3.4 ; radius of tunnel
radius2 = 5.4 ; ending radius for remote end of reinforcemnt
nReinfs = 6 ; number of reinforcemnt
end
;
def place_reinf
;Place reinforce elements along a given arc of tunnel.
;
;calculate angle increment between successive reinforcemnt
theta1 = degrad * theta1
theta2 = degrad * theta2
_angInc = (theta2 - theta1) / float(nReinfs - 1)
_ang = theta1
;
;get endpoint coordinates
loop ii (1, nReinfs)
_x1 = radius1 * cos(_ang) + xCentre
_y1 = radius1 * sin(_ang) + yCentre
_x2 = radius2 * cos(_ang) + xCentre
_y2 = radius2 * sin(_ang) + yCentre
;place reinforcemnt
command
reinf 10 _x1 _y1 _x2 _y2
endcommand
C13
_ang = _ang + _angInc
endloop
;
end
;
setup
;
;Apply rock bolts
prop mat=10 r_astiff=1e8 r_sstiff=1e8 r_leng=1 r_uaxial=1e6 r_ushear=1e6
place_reinf
;-------------------
;
;pl bl hold reinf iw
hist ydis 100,26.5
hist xdis 103.5,23
hist xdis 96.5,23
;
solve
pl his 1 2 3 hold
pl bl hold disp ye
;
win 85,115 10,40
pl hold bou reinf iw stru afail
ret
;
Related Documents