POSIVA OY Olkiluoto FIN-27160 EURAJOKI, FINLAND Phone (02) 8372 31 (nat.), (+358-2-) 8372 31 (int.) Fax (02) 8372 3809 (nat.), (+358-2-) 8372 3809 (int.) POSIVA 2012-24 Rock Suitability Classification RSC 2012 December 2012 Tim McEwen (ed.) Susanna Aro, Paula Kosunen Jussi Mattila, Tuomas Pere Asko Käpyaho Pirjo Hellä

Welcome message from author
This document is posted to help you gain knowledge. Please leave a comment to let me know what you think about it! Share it to your friends and learn new things together.
Transcript

POSIVA OY
Olki luoto
FIN-27160 EURAJOKI, F INLAND
Phone (02) 8372 31 (nat. ) , (+358-2-) 8372 31 ( int. )
Fax (02) 8372 3809 (nat. ) , (+358-2-) 8372 3809 ( int. )
POSIVA 2012-24
Rock Suitability Classifi cationRSC 2012
December 2012
Tim McEwen (ed.)
Susanna Aro, Paula Kosunen
Jussi Matti la, Tuomas Pere
Asko Käpyaho
Pir jo Hel lä

POSIVA 2012-24
December 2012
POSIVA OY
Olki luoto
FI-27160 EURAJOKI, F INLAND
Phone (02) 8372 31 (nat. ) , (+358-2-) 8372 31 ( int. )
Fax (02) 8372 3809 (nat. ) , (+358-2-) 8372 3809 ( int. )
Tim McEwen (ed.)
McEwen Consult ing
Susanna Aro, Paula Kosunen,
Jussi Matti la, Tuomas Pere
Posiva Oy
Asko Käpyaho
Geological Survey of F inland
Pir jo Hel lä
Saanio & Riekkola Oy
Rock Suitability ClassificationRSC 2012

ISBN 978-951-652-205-3ISSN 1239-3096

Tekijä(t) – Author(s)
Tim McEwen (ed.), McEwen Consulting Susanna Aro, Paula Kosunen, Jussi Mattila, Tuomas Pere, Posiva Oy Asko Käpyaho, Geological Survey of Finland Pirjo Hellä, Saanio & Riekkola Oy and the RSC working group
Toimeksiantaja(t) – Commissioned by
Posiva Oy
Nimeke – Title
ROCK SUITABILITY CLASSIFICATION - RSC 2012
Tiivistelmä – Abstract
This report presents Posiva’s Rock Suitability Classification (RSC) system, developed for locating suitable rock volumes for repository design and construction. The RSC system comprises both the revised rock suitability criteria and the procedure for the suitability classification during the construction of the repository. The aim of the classification is to avoid such features of the host rock that may be detrimental to the favourable conditions within the repository, either initially or in the long term. This report also discusses the implications of applying the RSC system for the fulfilment of the regulatory requirements concerning the host rock as a natural barrier and the site’s overall suitability for hosting a final repository of spent nuclear fuel.
The RSC criteria are derived from target properties, which set the general long-term safety-related requirements for the host rock. The criteria are measurable or observable parameters, which the host rock must possess in order to enable long-term fulfilment of the target properties. The criteria consider hydraulic properties and mechanical stability of the host rock, as well as geochemical properties of groundwater. A testing and development programme was carried out in order to further develop the interim RSC-I criteria. This report summarises the RSC-related practical testing and development activities carried out in ONKALO, Posiva's underground research facility, and presents the resulting RSC-II criteria.
The rock suitability classification is carried out at different scales, which coincide with different stages of repository design and construction, proceeding from the layout design of the whole repository to the more detailed design and construction of panels, deposition tunnels and, finally, deposition holes. This report describes the practical implementation of the RSC system as part of the repository construction procedure, including defining volumes of rock suitable for hosting the repository panels, assessing the suitability of deposition tunnels for locating deposition holes, and accepting deposition holes for use. The implementation of the RSC system has been demonstrated in ONKALO during the construction of a demonstration facility, where by the time of the writing of this report, two demonstration tunnels and four experimental deposition holes have been constructed and classified according to the RSC system. A description of the RSC demonstration activities performed to date is provided in this report.
The main outcome of the RSC demonstration activities indicates that the RSC-II criteria are applicable in practise, and that the stepwise research, suitability classification, design, construction and decision-making process can be carried out successfully. However, need for further development of some of the criteria and for further streamlining of the flow of the various activities was also identified.
Geological properties of the bedrock at Olkiluoto at the proposed disposal depth and the site’s overall suitability from the perspective of the requirements set by the Government Decision and STUK-YVL D.5 are also summarised in this report. The subject is discussed in relation to stable and intact rock around disposal canisters, low groundwater flow around waste emplacement tunnels, retardation of dissolved substances in the geosphere and the protection provided against natural phenomena and human actions.
This report confirms the interim conclusions about the overall suitability of the geological environment at Olkiluoto: (i) at the repository level, the rock conditions are favourable for the geological disposal of the spent fuel, and (ii) no factors indicating unsuitability of the site have been found. Further, the RSC system provides a structured method for locating the repository, such that the less favourable volumes of rock, e.g. deformation zones and hydraulically active features are avoided. Avainsanat - Keywords
Crystalline bedrock, nuclear waste disposal, KBS-3V, long-term safety, constructability.
ISBN
ISBN 978-951-652-205-3 ISSN
ISSN 1239-3096 Sivumäärä – Number of pages
220 Kieli – Language
English
Posiva-raportti – Posiva Report Posiva Oy Olkiluoto FI-27160 EURAJOKI, FINLAND Puh. 02-8372 (31) – Int. Tel. +358 2 8372 (31)
Raportin tunnus – Report code
POSIVA 2012-24
Julkaisuaika – Date
December 2012


Tekijä(t) – Author(s)
Tim McEwen (ed.), McEwen Consulting Susanna Aro, Paula Kosunen, Jussi Mattila, Tuomas Pere, Posiva Oy Asko Käpyaho, Geologian Tutkimuskeskus Pirjo Hellä, Saanio & Riekkola Oy and the RSC working group
Toimeksiantaja(t) – Commissioned by
Posiva Oy
Nimeke – Title
KALLION SOVELTUVUUSLUOKITTELU - RSC 2012 Tiivistelmä – Abstract
Tämä raportti kuvaa Posivan kallion soveltuvuusluokittelujärjestelmän (Rock Suitability Classification - RSC), joka on kehitetty loppusijoituslaitoksen suunnitteluun ja rakentamiseen soveltuvien kalliotilavuuksien paikantamiseksi. Luokit-telujärjestelmä sisältää sekä päivitetyt kallion soveltuvuuskriteerit että menettelyn soveltuvuusluokittelun tekemiseksi loppusijoitustilojen rakentamisen yhteydessä. RSC:n tarkoituksena on välttää sellaisia kallioperän piirteitä, jotka voivat heikentää kallion loppusijoitukselle suotuisia ominaisuuksia lyhyellä tai pitkällä aikavälillä. Raportissa käsitellään myös RSC-järjestelmän soveltamisen vaikutusta kalliota luonnollisena vapautumisesteenä koskevien viranomaisomaisvaatimusten täyttymiseen, sekä paikan yleistä soveltuvuutta käytetyn ydinpolttoaineen loppusijoituslaitoksen sijaintipaikaksi.
RSC-kriteerit on johdettu kallion tavoiteominaisuuksista, jotka ovat pitkäaikaisturvallisuuden takaamiseksi kalliolta vaadittavia ominaisuuksia. Kallion soveltuvuuskriteerit ovat mitattavissa tai havaittavissa olevia ominaisuuksia, jotka loppusijoitustiloja ympäröivällä kalliolla tulee olla, jotta tavoiteominaisuudet täyttyvät pitkällä aikavälillä.. Kriteerit koskevat pohjaveden geokemiallisia ominaisuuksia sekä kallion hydraulisia ominaisuuksia ja mekaanista stabiiliutta. Alustavien RSC-I kriteereiden kehittämiseksi toteutettiin testaus- ja kehitysohjelma. Tässä raportissa esitetään yhteenveto RSC:hen liittyvästä käytännön testaus- ja kehitystyöstä, jota on tehty tutkimustunneli ONKALOssa, sekä esitetään päivitetyt, RSC-II, kriteerit.
Kallion soveltuvuutta arvioidaan eri mittakaavoissa, jotka ovat yhteydessä loppusijoituslaitoksen suunnittelun ja rakentamisen eri vaiheisiin, alkaen koko maanalaisen loppusijoituslaitoksen asemoinnista ja edeten paneeleiden ja loppusijoitustunneleiden yksityiskohtaisen suunnittelun ja rakentamisen kautta loppusijoitusreikien rakentamiseen. Tässä raportissa kuvataan RSC-järjestelmän käytännön soveltaminen osana loppusijoituslaitoksen rakentamisprosessia, sisältäen mm. paneeleille soveltuvien kalliotilavuuksien tunnistamisen, loppusijoitustunneleiden soveltuvuuden arvioimisen loppusijoitusreikien paikkojen määrittämiseksi ja sijoitusreikien hyväksymisen loppusijoituskäyttöön. RSC-järjestelmän soveltamista on demonstroitu ns. demonstraatiotilojen rakentamisen yhteydessä ONKALOssa, jonne on tämän raportin kirjoittamiseen mennessä rakennettu kaksi demonstraatiotunnelia ja neljä kokeellista loppusijoitusreikää. Raportti sisältää kuvauksen RSC-demonstraation suoritetuista vaiheista.
Demonstraatiokokemukset ovat osoittaneet, että kehitetyt kriteerit ovat käytäntöön sovellettavissa ja että vaiheittainen, tutkimuksista, soveltuvuusluokittelusta, suunnittelusta, rakentamisesta ja päätöksenteosta koostuva prosessi voidaan menestyksekkäästi toteuttaa myös käytännössä. Työn aikana havaittiin kuitenkin myös tarve kriteereiden, tutkimuskäytäntöjen ja päätöksentekoprosessien sekä näihin liittyvän dokumentaation jatkokehitykseen menettelyn tehostamiseksi.
Tämä raportti sisältää myös yhteenvedon kallion geologisia ominaisuuksista loppusijoitussyvyydellä, sekä kuvauksen paikan yleisestä soveltuvuudesta loppusijoitukseen hallituksen tekemän periaatepäätöksen sekä STUK:n YVL D.5 -ohjeen asettamien vaatimusten näkökulmasta. Aihepiiriä käsitellään keskittyen loppusijoituskapseleita ympäröivän kallion vakauteen ja eheyteen kuten myös pohjaveden alhaiseen virtaukseen loppusijoitustunneleiden ympäristössä sekä liuenneiden ainesten pidättymiseen geosfäärissä ja kallion tarjoamaan suojaan luonnonilmiöitä ja ihmisen toimintaa vastaan.
Raportti näyttää toteen alustavat johtopäätökset Olkiluodon geologisen ympäristön soveltuvuudesta: (i) geologiset olosuhteet loppusijoitussyvyydellä ovat suotuisia käytetyn polttoaineen geologiselle loppusijoitukselle, eikä (ii) tekijöitä jotka osoittaisivat paikan soveltumattomuutta ole löydetty. Lisäksi, RSC-järjestelmä tarjoaa jäsentyneen menetelmän loppusijoitustilojen asemoimiseksi siten, että vähemmän suotuisat kalliotilavuudet, kuten deformaatiovyöhykkeet tai hydrogeologiset vyöhykkeet, vältetään.
Avainsanat - Keywords
Kiteinen kallio, ydinjätteen loppusijoitus, KBS-3V, pitkäaikaisturvallisuus, rakennettavuus. ISBN
ISBN 978-951-652-205-3 ISSN
ISSN 1239-3096 Sivumäärä – Number of pages
220 Kieli – Language
Englanti
Posiva-raportti – Posiva Report Posiva Oy Olkiluoto FI-27160 EURAJOKI, FINLAND Puh. 02-8372 (31) – Int. Tel. +358 2 8372 (31)
Raportin tunnus – Report code
POSIVA 2012-24
Julkaisuaika – Date
Joulukuu 2012


1
TABLE OF CONTENTS
ABSTRACT
TIIVISTELMÄ
1 INTRODUCTION ..................................................................................................... 7
2 REGULATORY REQUIREMENTS ........................................................................ 11
3 SAFETY FUNCTIONS AND TARGET PROPERTIES .......................................... 15
3.1 Safety functions and target properties ............................................................ 15 3.2 The rock suitability criteria, design requirements and specifications .............. 21
4 TESTING THE RSC-I CRITERIA AND METHOD DEVELOPMENT ..................... 25
4.1 The RSC-I criteria ........................................................................................... 26 4.2 The suitability classes and the classification procedure ................................. 28 4.3 Test 1: Tunnel scale classification of pilot hole ONK-PH10 and the .................. corresponding section of the ONKALO access tunnel .................................... 31 4.3.1 Test purpose .......................................................................................... 31 4.3.2 Test procedure and data ....................................................................... 31 4.3.3 Test results ............................................................................................ 37 4.3.4 Test conclusions .................................................................................... 40 4.4 Test 2: Evaluating the effect of the FPI criterion by using data from the ........... ONKALO access tunnel chainages 3922-4053 m and 4092-4216 m (pilot ....... holes ONK-PH11 and ONK-PH12) ................................................................. 41 4.4.1 Test purpose .......................................................................................... 41 4.4.2 Test methodology and data ................................................................... 41 4.4.3 Test Results ........................................................................................... 42 4.4.4 Discussion ............................................................................................. 44 4.4.5 Test conclusions .................................................................................... 47 4.5 Test 3: Suitability classification of the ONKALO access tunnel, chainage 3900- 4600 m ............................................................................................................ 47 4.5.1 Test purpose .......................................................................................... 47 4.5.2 Test procedure and data ....................................................................... 48 4.5.3 Test results ............................................................................................ 48 4.5.4 Test conclusions .................................................................................... 51 4.6 Test 4: Suitability classification of the POSE niche and the experimental holes ............................................................................................................... 52 4.6.1 Test purpose .......................................................................................... 52 4.6.2 Test procedure and data ....................................................................... 53 4.6.3 Test results ............................................................................................ 61 4.6.4 Test conclusions .................................................................................... 63 4.7 Test 4: Method development for measuring fracture-specific tunnel inflow .... 64 4.7.1 Test purpose .......................................................................................... 64 4.7.2 Test procedure and data ....................................................................... 65 4.7.3 Test results ............................................................................................ 66 4.7.4 Test conclusions .................................................................................... 68 4.8 Test 5: SKB cooperation project on large fracture issues ............................... 68 4.8.1 Test purpose .......................................................................................... 68
2
4.8.2 Test procedure and data ....................................................................... 69 4.8.3 Test results ............................................................................................ 70 4.8.4 Test conclusions .................................................................................... 74
5 RSC-II CRITERIA .................................................................................................. 75
5.1 Introduction ..................................................................................................... 75 5.2 Revised rock suitability criteria ....................................................................... 76 5.2.1 Criteria related to geochemical stability ................................................. 76 5.2.2 Criteria related to hydraulic properties ................................................... 78 5.2.3 Criteria related to the mechanical properties of the rock ....................... 80 5.3 Layout Determining Features (LDFs) their influence zones and respect ........... distances at Olkiluoto ...................................................................................... 84 5.3.1 Introduction ............................................................................................ 84 5.3.2 Definitions .............................................................................................. 85 5.3.3 Layout determining features (LDFs) ...................................................... 87 5.3.4 Influence zones ..................................................................................... 89 5.3.5 Respect volume ..................................................................................... 95 5.3.6 Results from Olkiluoto ........................................................................... 96
6 IMPLEMENTATION OF THE RSC SYSTEM ........................................................ 99
6.1 Repository stage ............................................................................................. 99 6.1.1 Classification of the features of the Olkiluoto bedrock ........................... 99 6.1.2 Tentative suitability classification of a planned panel volume ............. 100 6.2 Panel stage ................................................................................................... 100 6.2.1 Preliminary suitability classification of a repository panel .................... 102 6.2.2 Suitability classification of a repository panel ...................................... 102 6.3 Tunnel stage ................................................................................................. 103 6.3.1 Preliminary suitability classification of a deposition tunnel .................. 103 6.3.2 Suitability classification of a deposition tunnel ..................................... 106 6.4 Hole stage ..................................................................................................... 107 6.4.1 Preliminary suitability classification of a deposition hole ..................... 107 6.4.2 Suitability classification of a deposition hole ........................................ 109
7 DEMONSTRATION ............................................................................................. 111
7.1 Overview and objectives ............................................................................... 111 7.2 Repository stage ........................................................................................... 114 7.2.1 Investigations and modelling ............................................................... 114 7.2.2 The 1st suitability classification (demonstration area) - May 2010 ...... 115 7.3 Panel stage ................................................................................................... 119 7.3.1 Investigations and detailed-scale modelling ........................................ 120 7.3.2 The 2nd suitability classification (DT1 and DT2) - October 2010 ........ 122 7.4 Tunnel stage, part 1 ...................................................................................... 124 7.4.1 Pilot hole investigations and detailed-scale model update .................. 125 7.4.2 The 3rd suitability classification (DT1 and DT2) - February 2011 ....... 138 7.4.3 Tunnel investigations (DT1) and detailed-scale model update ............ 145 7.4.4 The 4th suitability classification (DT1) - August 2011 .......................... 153 7.5 Hole stage, part 1 ......................................................................................... 159 7.5.1 Investigations and detailed-scale model update .................................. 159 7.5.2 The 5th suitability classification (DT1) - October 2011 ........................ 166 7.6 Tunnel stage, part 2 ...................................................................................... 168

3
7.6.1 Investigations and detailed-scale model update .................................. 168 7.6.2 The 6th suitability classification (DT2) - May 2012 .............................. 173 7.6.3 Tunnel investigations and detailed-scale model update ...................... 176 7.6.4 The 7th suitability classification (DT2) - August 2012 .......................... 181 7.7 Hole stage, part 2 ......................................................................................... 186 7.7.1 Hole investigations (DT1) and detailed-scale model update ............... 186 7.7.2 The 8th suitability classification (DT1) - November 2012 .................... 192 7.8 Conclusions .................................................................................................. 197
8 HOST ROCK SUITABILITY ................................................................................. 199
8.1 Stable and intact rock around disposal canisters ......................................... 199 8.2 Low groundwater flow around waste emplacement tunnels ......................... 202 8.3 Retardation of dissolved substances in the geosphere ................................ 203 8.4 Protection provided against natural phenomena and human actions ........... 204 8.4.1 Natural phenomena ............................................................................. 204 8.4.2 Proximity of natural resources ............................................................. 204 8.5 Favourable location of the repository, favourable groundwater chemistry ......... around waste emplacement rooms and disposal depth ............................... 206
9 DISCUSSION ...................................................................................................... 209
9.1 Status of the RSC system ............................................................................. 209 9.2 How the regulatory requirements related to the host rock as a natural barrier .. are handled in the RSC system .................................................................... 211
REFERENCES ........................................................................................................... 215

4

5
PREFACE The writing of this report required contributions from several experts and the following people have participated in the work. The main authors are listed below: Chapter 1 & 2: Pirjo Hellä, Paula Kosunen, Asko Käpyaho, Tim McEwen Chapter 3: Susanna Aro, Pirjo Hellä, Jussi Mattila Chapter 4: Susanna Aro, Paula Kosunen, Asko Käpyaho Chapter 5: Susanna Aro, Jussi Mattila, Tuomas Pere Chapter 6: Paula Kosunen, Asko Käpyaho Chapter 7: Paula Kosunen Chapter 8: Pirjo Hellä, Asko Käpyaho Tim McEwen edited the report. In addition to the aforementioned authors, the RSC working group also includes other experts who have produced background materials for this report, or otherwise contributed to the RSC work. These people include: Ismo Aaltonen, Henry Ahokas, Johan Andersson, Antti Joutsen, Heini Laine, Nicklas Nordbäck, Sonja Sireni, Eero Heikkinen, Pekka Kantia, Petteri Pitkänen, Paul Smith, Tiina Vaittinen, Juhani Vira, Petteri Vuorio and Liisa Wikström. The report has been peer-reviewed by the following experts: Ph.D. Annika Hagros, Prof. Alan Hooper, Ph.D. Jan-Olof Selroos and M.Sc. Anders Winberg. The reviewers are acknowledged for their valuable comments.

6
7
1 INTRODUCTION
On assignment by its owners, Teollisuuden Voima Oyj and Fortum Power & Heat Oy, Posiva will take care of the disposal of spent fuel from the Loviisa and Olkiluoto nuclear power plants. At Loviisa, two pressurised water reactors (VVER-440) are in operation (LO1, LO2); at Olkiluoto, two boiling water reactors are operating (OL1, OL2) and one pressurised water reactor (OL3) is under construction. Plans also exist for a fourth nuclear power unit at Olkiluoto (OL4). According to the three Decisions-in-Principle (DiPs) endorsed by the Finnish Parliament in 2001, 2002 and 2010, the spent fuel from these reactors (up to 9000 tU) will be disposed of in a geological repository at Olkiluoto; and the site has been investigated for this purpose for a period of over twenty years. Posiva is currently preparing to submit a construction licence application for the Olkiluoto disposal facility by the end of 2012.
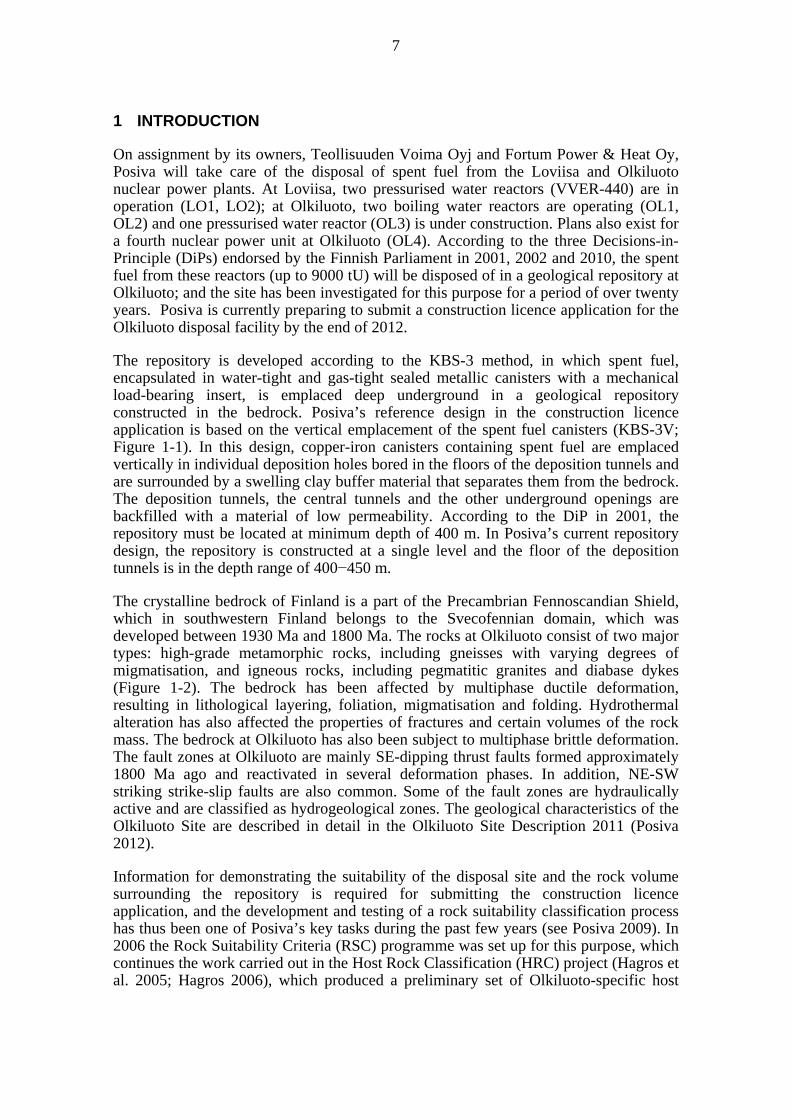
The repository is developed according to the KBS-3 method, in which spent fuel, encapsulated in water-tight and gas-tight sealed metallic canisters with a mechanical load-bearing insert, is emplaced deep underground in a geological repository constructed in the bedrock. Posiva’s reference design in the construction licence application is based on the vertical emplacement of the spent fuel canisters (KBS-3V; Figure 1-1). In this design, copper-iron canisters containing spent fuel are emplaced vertically in individual deposition holes bored in the floors of the deposition tunnels and are surrounded by a swelling clay buffer material that separates them from the bedrock. The deposition tunnels, the central tunnels and the other underground openings are backfilled with a material of low permeability. According to the DiP in 2001, the repository must be located at minimum depth of 400 m. In Posiva’s current repository design, the repository is constructed at a single level and the floor of the deposition tunnels is in the depth range of 400−450 m.
The crystalline bedrock of Finland is a part of the Precambrian Fennoscandian Shield, which in southwestern Finland belongs to the Svecofennian domain, which was developed between 1930 Ma and 1800 Ma. The rocks at Olkiluoto consist of two major types: high-grade metamorphic rocks, including gneisses with varying degrees of migmatisation, and igneous rocks, including pegmatitic granites and diabase dykes (Figure 1-2). The bedrock has been affected by multiphase ductile deformation, resulting in lithological layering, foliation, migmatisation and folding. Hydrothermal alteration has also affected the properties of fractures and certain volumes of the rock mass. The bedrock at Olkiluoto has also been subject to multiphase brittle deformation. The fault zones at Olkiluoto are mainly SE-dipping thrust faults formed approximately 1800 Ma ago and reactivated in several deformation phases. In addition, NE-SW striking strike-slip faults are also common. Some of the fault zones are hydraulically active and are classified as hydrogeological zones. The geological characteristics of the Olkiluoto Site are described in detail in the Olkiluoto Site Description 2011 (Posiva 2012).
Information for demonstrating the suitability of the disposal site and the rock volume surrounding the repository is required for submitting the construction licence application, and the development and testing of a rock suitability classification process has thus been one of Posiva’s key tasks during the past few years (see Posiva 2009). In 2006 the Rock Suitability Criteria (RSC) programme was set up for this purpose, which continues the work carried out in the Host Rock Classification (HRC) project (Hagros et al. 2005; Hagros 2006), which produced a preliminary set of Olkiluoto-specific host
8
rock suitability criteria. The intermediate results of the RSC programme are presented in Hellä et al. (2009) and are summarised, together with the plans for the next phase, in Posiva (2009).
Figure 1-1. Schematic presentation of the KBS-3V design.
The aim of the RSC programme was, and is, to develop a classification scheme to be applied as a guideline for repository design and construction. This scheme includes criteria for defining volumes of rock suitable for the repository panels, the assessment of whether deposition tunnels or tunnel sections are suitable for locating deposition holes, and the acceptance of a deposition hole for disposal, based on the rock properties. The criteria developed for use in the classification scheme need to be based on observable and measurable properties of the host rock. Together with the interpretation, modelling and general understanding of the site properties, these so-called rock suitability criteria (initially referred to as RSC) are to be used to show that the requirements set on the host rock, the target properties, can be fulfilled. The aim is to avoid features of the host rock that may be detrimental for the long-term safety of the repository.
The application of the rock suitability criteria will define the potential range of initial conditions for the host rock and hence will also form the basis for the assessment of the conditions in the canister near-field during evolution of the repository and the site. The RSC programme has focussed on defining long-term safety-related and engineering requirements, as well as on defining volumes of rock suitable for locating panels of several deposition tunnels (the so-called repository scale). However, as the long-term safety of the repository depends mainly on the properties of the near-field of the deposition holes, and the long-term safety-related requirements mainly consider these properties, preliminary criteria at the deposition tunnel and deposition hole scales were also a part of RSC Phase I (RSC-I; Hellä et al. 2009). In 2010, a process-based

9
management system was established in Posiva, and the RSC process was initiated. The focus over the period 2010 to 2012 has been on the further development of the tunnel-scale and deposition hole-scale criteria (referred to as RSC-II), as well as on testing and demonstrating the use of the criteria in the ONKALO underground research facility (Posiva 2009). Revision of the target properties, as well as assessing their fulfilment over the long term, has been carried out as part of the safety case development and is presented in Posiva (2012c, d and e). In addition to criteria development, the RSC-II programme has concentrated on the development of a classification procedure for host rock suitability assessment and on its practical application. Therefore, to emphasise the nature of the RSC as a classification system, which includes the rock suitability criteria themselves, together with the procedure for rock suitability assessment, the acronym RSC is henceforth defined as Rock Suitability Classification and its use is thus to be referred to as the RSC system, with the criteria themselves being referred to as rock suitability criteria.
The objective of this report is to present the current status of the RSC programme. The report starts with the presentation of the relevant regulatory requirements in Chapter 2. Chapter 3 explains the current safety functions and the target properties for the host rock, which form the basis for the RSC criteria. Testing related to the development of the preliminary RSC-I criteria (Hellä et al. 2009), thereby leading to the development of the RSC-II criteria, is summarized in Chapter 4. The RSC-II criteria are presented in Chapter 5. The implementation procedure of the RSC system, as well as its application to the construction of demonstration facilities in the ONKALO, are described in Chapters 6 and 7, respectively. The contribution of the RSC system to the fulfilment of the regulatory requirements is discussed in Chapter 8. The current status and further development needs of the RSC programme are discussed and concluding remarks presented in Chapter 9.

10
Figure 1-2. A geological map of Olkiluoto Island showing the lithology and the brittle fault zones (BFZ) defined as layout determining features (LDFs), i.e. features that impose restrictions on the repository layout.
11
2 REGULATORY REQUIREMENTS
Regulatory requirements related to the host rock are presented in STUK’s Guide YVL D.5 which is currently in Draft 4 in Finnish but in Draft 3 in its English translation (dated 23.02.2011). The paragraphs in these two drafts of the Guide which relate to the RSC are identical and the text below, which is taken from the Draft 3 English version, has been checked against the Finnish Draft 4 version (17.3.2011)1.
According to Government Decree 736/2008 “The long-term safety of disposal shall be based on safety functions achieved through mutually complementary barriers so that a deficiency of an individual safety function or a predictable geological change will not jeopardise the long-term safety.” (see also YVL D.5 paragraph 404). According to the YVL Guide the bedrock of the disposal site shall be such that it adequately acts as a natural barrier and is discussed with reference to natural barriers and safety functions:
”Natural barriers and their safety functions may consist of:
stable and intact rock with low groundwater flow rate around disposal canisters
rock around waste emplacement rooms where low groundwater flow, reducing and also otherwise favourable groundwater chemistry and retardation of dissolved substances in rock limit the mobility of radionuclides
protection provided by the host rock against natural phenomena and human actions.” (YVL D.5 paragraph 406).
“Targets based on high quality scientific knowledge and expert judgement shall be specified for the performance of each safety function. In doing so, the potential changes and events affecting the disposal conditions during each assessment period shall be taken into account. In an assessment period extending up to several thousands of years, one can assume that the bedrock of the site remains in its current state, taking however account of the changes due to predictable processes, such as land uplift and those due to excavations and disposed waste.” (YVL D.5 paragraph 407).
“The design of the safety functions shall aim to provide a disposal concept that is not sensitive to changes in the bedrock. Another design objective shall be that the characteristics of waste packages or the disposal environment will not evolve with time in a way that may affect adversely the safety functions.” (YVL D.5 paragraph 409).
The Guide requires that the host rock characteristics are such that the host rock acts as a natural barrier and that the characteristics of the host rock are favourable with respect to the long-term performance of the engineered barriers: “The characteristics of the host rock shall be favourable regarding the long-term performance of engineered barriers. Such conditions in the bedrock as are of importance to long-term safety, shall be stable or predictable up to at least several thousands of years. The range of geological changes which occur thereafter, particularly due to the large scale climate changes, shall be estimable and be considered in specifying the performance targets for the
1 The wording of the draft English version of these regulations is quoted verbatim here.
12
safety functions.” (YVL D.5 paragraph 411). “Features indicating unsuitability of the site may include at least:
proximity of exploitable natural resources
abnormally high rock stresses with regard to the strength of the rock
predictable anomalously high seismic or tectonic activity
exceptionally adverse groundwater characteristics, such as lack of reducing buffering capacity and high concentrations of substances which might substantially impair the safety functions.” (410).
The YVL guide continues with requirements for the location and depth of the repository: “The location of the repository shall be favourable with respect to the groundwater flow regime at the disposal site. The disposal depth shall be selected giving priority to long-term safety, taking into account the geological structures of the bedrock as well as the trends with depth in hydraulic conductivity, groundwater chemistry and rock stress - strength ratio. The repository for spent fuel shall be located at the depth of several hundreds of metres in order to mitigate adequately the impacts from aboveground natural phenomena, such as glaciation, and human actions. The repositories for other long-lived wastes and those for short-lived wastes shall be located at the depth of some tens of metres as a minimum.” (YVL D.5 paragraph 412).
In relation to the structures and other characteristics of the host rock: “Such structures and other characteristics of rock surrounding the waste emplacement rooms which may have importance regarding groundwater flow, rock movements or other factors affecting long-term safety, shall be defined and classified. Modifications of the layout of the underground openings shall be provided for in case that the quality of rock surrounding the designed excavations proves to be significantly inferior to the design basis.” (YVL D.5 paragraph 511).
Section 5.2 of the Guide is entitled “Design of structures, systems and practices” and states: “Systems, structures and components of a disposal facility shall be classified according to their functional and structural importance to safety.”(YVL D.5 paragraph 507). YVL D.5 paragraph 509 states: “Regarding the long-term safety of disposal, the classification shall be based on structures and functions which have considerable impact on the safety functions referred to in paragraphs 405 and 406 or which may have such adverse impacts on long-term safety as referred to in paragraphs 512. Structures and functions of importance are notably waste packages with surrounding buffer materials and containment structures, and the disposition, excavation and injection of the underground openings in the disposal facility.”
The Guide also includes requirements which influence the development of the scheme for rock classification and the evaluation of its suitability in use:
In relation to monitoring: “During the construction and operation of the disposal facility, an investigation, testing and monitoring programme shall be executed to ensure the suitability for disposal of the rock to be excavated, to determine safety-relevant characteristics of the host rock and to ensure long-term performance of barriers. This programme shall include at least
13
characterisation of the rock volumes intended to be excavated
monitoring of rock stresses, movements and deformations in rock surrounding the waste emplacement rooms
hydrogeological monitoring of rock surrounding the waste emplacement rooms
monitoring of groundwater chemistry at the disposal site
monitoring of the behaviour of engineered barriers.” (YVL D.5 paragraph 510).
In relation to maintaining the rock characteristics important for long-term safety: “The construction, operation and closure of the waste emplacement rooms and other underground openings shall aim at maintaining the rock characteristics important to long-term safety. For this purpose, particularly in case of the implementation of spent fuel disposal,
such rock construction methods shall be used that limit the excavation disturbances in rock around waste emplacement rooms
reinforcement and injection of host rock shall be done so that no significant amounts of substances detrimental to the performance of barriers enter the waste emplacement rooms” (YVL D.5 paragraph 512).
In relation to the production of the documentation for quality assurance of the canister emplacement: “In case of spent fuel disposal, the holder of the operating licence shall make an inspection related to the emplacement of each disposal canister, for reviewing the quality control documentation in order to confirm that the emplacement of the canister and the installation of surrounding buffer material have been performed in acceptable manner.” (YVL D.5 paragraph 606) and “Transfer of a spent fuel canister into its emplacement position can be done after STUK has verified that the characteristics of the rock surrounding the canister’s emplacement position are acceptable. STUK witnesses the inspections referred to in paragraph 606 to verify whether the emplacement of each disposal canister and installation of the buffer material has carried out in an acceptable manner.” (YVL D.5 paragraph 811).
In relation to the construction of the repository: “Construction of the various units of the disposal facility shall be implemented stepwise so that the investigations of the rock volume intended to be excavated and the classification referred to in paragraph 511 have been completed prior to the start of each construction stage. In addition, the construction must not be started before STUK has approved the modified or specified plan in accordance with the procedure described in paragraph 604.” (YVL D.5 paragraph 809).
These points were not explicitly considered in the development of the RSC-I criteria; however, they are being taken into account in the current development phase.

14

15
3 SAFETY FUNCTIONS AND TARGET PROPERTIES
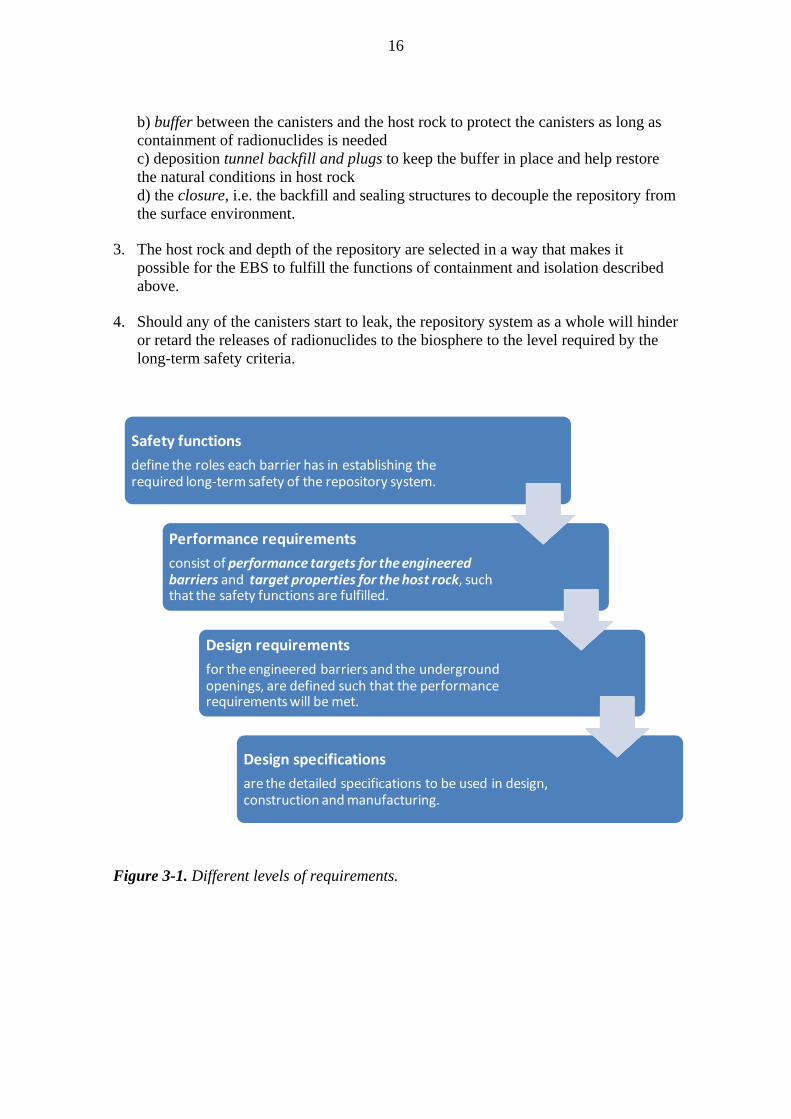
Posiva (2012e) discusses the different levels of requirements for the disposal facility that are relevant to long-term safety. The requirements are managed through a formal requirements management system (VAHA). This provides a rigorous, traceable method of translating safety principles and the safety concept into a set of safety functions, performance requirements, design requirements and design specifications for the various barriers, i.e. a specification for realisation of the disposal concept at the Olkiluoto site (see Figure 3-1). The VAHA sets out:
At Level 1, stakeholder requirements that come from laws, decisions-in-principle, regulatory requirements, and other stakeholder requirements.
At Level 2, the long-term safety principles, which lead to the definition of the safety concept and safety functions;
At Level 3, the performance requirements, consisting of performance targets for the engineered barriers and target properties for the host rock, such that the safety functions are fulfilled;
At Level 4, the design requirements for the engineered barriers and the underground openings, such that the performance requirements will be met.
Level 5 presents the Design specifications. These are the detailed specifications to be used in design, construction and manufacturing.
This Chapter presents the current safety functions of the barriers and the target properties for the host rock, which form the basis for the RSC-II criteria (These criteria belong to design requirements and design specifications (see Section 3.2). A data freeze of the requirements management system for the construction licence application is presented in Posiva (2012e).
The requirements, including the rock suitability criteria and the target properties, are developed in an iterative manner. Changes may be required, based on practical testing of the criteria, on evaluation of the application of the criteria to layout design and on the results of the safety case, as well as on enhanced knowledge on the performance of the engineered barriers and the site.
3.1 Safety functions and target properties
Safety functions
The long-term safety principles of Posiva’s planned repository system are described on Level 2 of VAHA as follows:
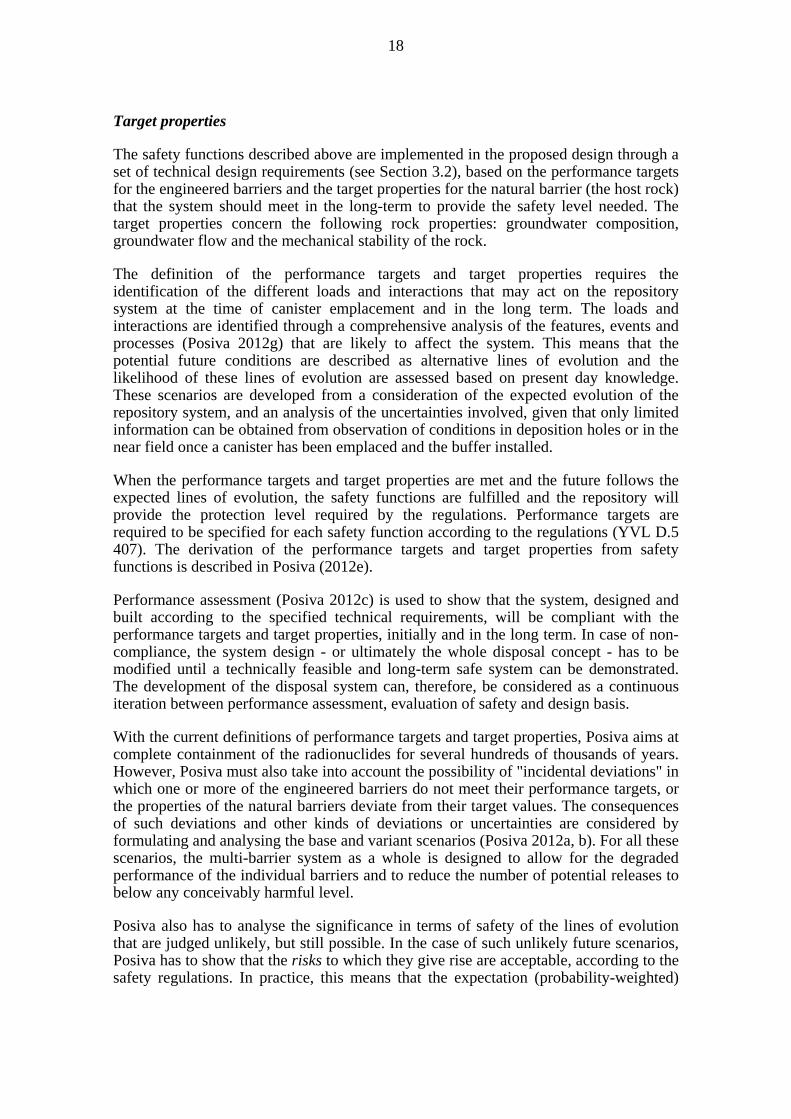
1. The spent fuel elements are disposed of in a repository located deep in the Olkiluoto bedrock. The release of radionuclides is prevented with a multi-barrier disposal system, consisting of a system of engineered barriers (EBS) and host rock, such that the system effectively isolates the radionuclides from the living environment.
2. The engineered barrier system consists of: a) canister to contain the radionuclides as long as these could cause significant harm to the environment
16
b) buffer between the canisters and the host rock to protect the canisters as long as containment of radionuclides is needed c) deposition tunnel backfill and plugs to keep the buffer in place and help restore the natural conditions in host rock d) the closure, i.e. the backfill and sealing structures to decouple the repository from the surface environment.
3. The host rock and depth of the repository are selected in a way that makes it
possible for the EBS to fulfill the functions of containment and isolation described above.
4. Should any of the canisters start to leak, the repository system as a whole will hinder
or retard the releases of radionuclides to the biosphere to the level required by the long-term safety criteria.
Figure 3-1. Different levels of requirements.
Safety functions
define the roles each barrier has in establishing the required long‐term safety of the repository system.
Performance requirements
consist of performance targets for the engineered barriers and target properties for the host rock, such that the safety functions are fulfilled.
Design requirements
for the engineered barriers and the underground openings, are defined such that the performance requirements will be met.
Design specifications
are the detailed specifications to be used in design, construction and manufacturing.

17
The KBS-3 method provides long-term isolation and containment of spent fuel by a system of multiple barriers, both engineered and natural, and by ensuring a sufficient depth of disposal (Figure 1-1). The engineered barriers consist of a canister, the buffer surrounding the canisters, the deposition tunnel backfill and the closure components. The closure components include: backfill of underground openings, including the central tunnels, access tunnel, shafts, and other excavations, as well as drillhole plugs, mechanical plugs, long-term hydraulic plugs at different depths and plugs near the surface. The repository host rock acts as a natural barrier. All of the barriers have their roles in establishing the required long-term safety of the repository system. These roles constitute the safety functions of the barriers and are summarised in Table 3-1.
Table 3-1. Summary of the safety functions assigned to the barriers (EBS components and host rock) of Posiva’s repository concept (from Posiva 2012e).
Barrier Safety functions
Canister Ensure a prolonged period of containment of the spent fuel. This safety function rests first and foremost on the mechanical strength of the canister’s cast iron insert and the corrosion resistance of the copper surrounding it.
Buffer Contribute to mechanical, geochemical and hydrogeological conditions that are predictable and favourable to the canister,
Protect canisters from external processes that could compromise the safety function of complete containment of the spent nuclear fuel and associated radionuclides,
Limit and retard radionuclide releases in the event of canister failure.
Deposition tunnel backfill
Contribute to favourable and predictable mechanical, geochemical and hydrogeological conditions for the buffer and canisters,
Limit and retard radionuclide releases in the possible event of canister failure,
Contribute to the mechanical stability of the rock adjacent to the deposition tunnels.
Host rock Isolate the spent nuclear fuel repository from the surface environment and normal habitats for humans, plants and animals and limit the possibility of human intrusion, and isolate the repository from changing conditions at the ground surface,
Provide favourable and predictable mechanical, geochemical and hydrogeological conditions for the engineered barriers,
Limit the transport and retard the migration of harmful substances that could be released from the repository.
Closure Prevent the underground openings from compromising the long-term isolation of the repository from the surface environment and normal habitats for humans, plants and animals,
Contribute to favourable and predictable geochemical and hydrogeological conditions for the other engineered barriers by preventing the formation of significant water conductive flow paths through the openings,
Limit and retard inflow to and release of harmful substances from the repository.
18
Target properties
The safety functions described above are implemented in the proposed design through a set of technical design requirements (see Section 3.2), based on the performance targets for the engineered barriers and the target properties for the natural barrier (the host rock) that the system should meet in the long-term to provide the safety level needed. The target properties concern the following rock properties: groundwater composition, groundwater flow and the mechanical stability of the rock.
The definition of the performance targets and target properties requires the identification of the different loads and interactions that may act on the repository system at the time of canister emplacement and in the long term. The loads and interactions are identified through a comprehensive analysis of the features, events and processes (Posiva 2012g) that are likely to affect the system. This means that the potential future conditions are described as alternative lines of evolution and the likelihood of these lines of evolution are assessed based on present day knowledge. These scenarios are developed from a consideration of the expected evolution of the repository system, and an analysis of the uncertainties involved, given that only limited information can be obtained from observation of conditions in deposition holes or in the near field once a canister has been emplaced and the buffer installed.
When the performance targets and target properties are met and the future follows the expected lines of evolution, the safety functions are fulfilled and the repository will provide the protection level required by the regulations. Performance targets are required to be specified for each safety function according to the regulations (YVL D.5 407). The derivation of the performance targets and target properties from safety functions is described in Posiva (2012e).
Performance assessment (Posiva 2012c) is used to show that the system, designed and built according to the specified technical requirements, will be compliant with the performance targets and target properties, initially and in the long term. In case of non-compliance, the system design - or ultimately the whole disposal concept - has to be modified until a technically feasible and long-term safe system can be demonstrated. The development of the disposal system can, therefore, be considered as a continuous iteration between performance assessment, evaluation of safety and design basis.
With the current definitions of performance targets and target properties, Posiva aims at complete containment of the radionuclides for several hundreds of thousands of years. However, Posiva must also take into account the possibility of "incidental deviations" in which one or more of the engineered barriers do not meet their performance targets, or the properties of the natural barriers deviate from their target values. The consequences of such deviations and other kinds of deviations or uncertainties are considered by formulating and analysing the base and variant scenarios (Posiva 2012a, b). For all these scenarios, the multi-barrier system as a whole is designed to allow for the degraded performance of the individual barriers and to reduce the number of potential releases to below any conceivably harmful level.
Posiva also has to analyse the significance in terms of safety of the lines of evolution that are judged unlikely, but still possible. In the case of such unlikely future scenarios, Posiva has to show that the risks to which they give rise are acceptable, according to the safety regulations. In practice, this means that the expectation (probability-weighted)

19
value of the consequences has to be less than the limits given for the deterministically-assessed consequences.
The target properties define the host rock properties that contribute to the fulfilment of the safety functions for the host rock. The target properties outline the conditions that are considered to be favourable for the performance of the engineered barriers, as well as for limiting the transport and retarding the migration of harmful substances that could be released from the repository. Therefore, the current reference design of the engineered barriers, as well as the understanding of their performance under different conditions, has been taken into account when defining the performance targets.
Posiva (2012e) gives a thorough discussion of the target properties, their rationale and the features, events and processes that may affect the target properties. The target properties and the main rationale for them are summarised in Table 3-2.
Table 3-2. Target properties for the rock and their main rationale (after Posiva 2012e).
ID Target property Main rationale
L3-ROC-1 1 Definition and objectives
L3-ROC-2 Host rock is the rock surrounding the deposition holes and other excavated rooms that shall provide such favourable and predictable conditions that the EBS can fulfill its functions of containment and isolation and ensure that the transport of radionuclides is limited in the case of release.
L3-ROC-3 Host rock shall, with the exception of incidental deviations, retain its favourable properties over hundreds of thousands of years.
L3-ROC-4 2 General requirements
L3-ROC-5 The repository shall be located at minimum depth of 400 m. According to DiP 2001
L3-ROC-8 3 Target properties
L3-ROC-9 3.1 Chemical composition of the groundwater
L3-ROC-25 3.1.1 Canister corrosion
L3-ROC-10 To avoid canister corrosion, groundwater at the repository level shall be anoxic except during the initial period until the time when the oxygen entrapped in the near-field has been consumed.
Therefore, no dissolved oxygen shall be present after the initially entrapped oxygen in the near field has been consumed.
Anoxic conditions are needed to limit the corrosion rate of copper to ensure containment of spent fuel.
L3-ROC-11 Groundwater at the repository level shall have a high enough pH and a low enough chloride concentration to avoid chloride corrosion of the canisters.
Therefore, pH shall be higher than 4 and chloride concentration [Cl-] < 2M.
High pH and Cl- concentration increases the risk of copper corrosion.
L3-ROC-12 Concentration of canister-corroding agents (HS-, NO2-, NO3
- and NH4
-, acetate) shall be limited in the groundwater at the repository level.
The concentrations of corroding agents shall be low enough to ensure containment of spent fuel.

20
L3-ROC-13 Groundwater at the repository level shall have low organic matter, H2 and Stot and methane contents to limit microbial activity, especially that of sulphate reducing bacteria.
Microbial activity may produce compounds such as sulphide, which may corrode copper.
L3-ROC-28 3.1.2 Buffer and backfill performance
L3-ROC-14 Groundwater at the repository level shall initially have sufficiently high ionic strength to reduce the likelihood of chemical erosion of the buffer or backfill. Therefore, total charge equivalent of cations, Σq[Mq+]* , shall initially be higher than 4 mM.
* [Mq+] = molar concentration of cations , q = charge number of ion
Buffer mass could potentially be lost due to erosion if the cation concentration of the groundwater is not high enough.
L3-ROC-15 Groundwater at the repository level shall have limited salinity, so that the buffer and backfill will maintain a high enough swelling pressure.
Therefore, groundwater salinity (TDS, total dissolved solids) at the repository level shall, in general, be below 35 g/L but local or temporal variations up to 70 g/L can be allowed.
Required buffer and backfill swelling pressures can be reached and retained in salinities up to the target value.
L3-ROC-16 pH of the groundwater at the repository level shall be within a range where the buffer and backfill remain stable (no montmorillonite dissolution).
Therefore, the pH shall be in the range of 5- 10, but initially a higher pH (up to 11) is allowed locally. The acceptable level also depends on silica and calcium concentrations.
High pH may dissolve montmorillonite and result in a loss of buffer swelling pressure.
L3-ROC-17 Concentration of solutes that can have a detrimental effect on the stability of the buffer and backfill (K+, Fetot) shall be limited in the groundwater at the repository level.
High concentration of K+ causes illitisation and Fetot
causes chloritisation of buffer and backfill.
L3-ROC-27 3.1.3 Radionuclide release and transport
L3-ROC-29 Groundwater conditions shall be reducing, in order to have a stable fuel matrix and low solubility of the radionuclides.
The solubility of the fuel matrix, and thus also the release of other radionucli-des, is limited in reducing groundwater conditions.
L3-ROC-30 To ascertain the data for sorption parameters, the pH shall be in the range of 6−10 after the initial period when a higher pH of up to 11 is allowed.
Sorption of the radionuclides is dependent on the pH.
L3-ROC-31 In the vicinity of the deposition holes, natural groundwater shall have a low colloid and organic content to limit radionuclide transport.
Colloidal transport and com-plexation with organic mate-rials potentially enhance transport of radionuclides.
L3-ROC-18 3.2 Groundwater flow and solute transport
L3-ROC-19 Under saturated conditions the groundwater flow in any fracture in the vicinity of a deposition hole shall be low to limit mass transfer to and from EBS.
Therefore, the flow rate in such a fracture shall be in the order of one litre of flow per one meter of intercepting fracture width in a year (l/(m*year)) at the most. In case of more than one fracture, the sum of flow rates is applied.
Low groundwater flow is needed to limit erosion of buffer and limit the mass transfer from the buffer to the fracture, e.g. in case of release of radionuclides.
21
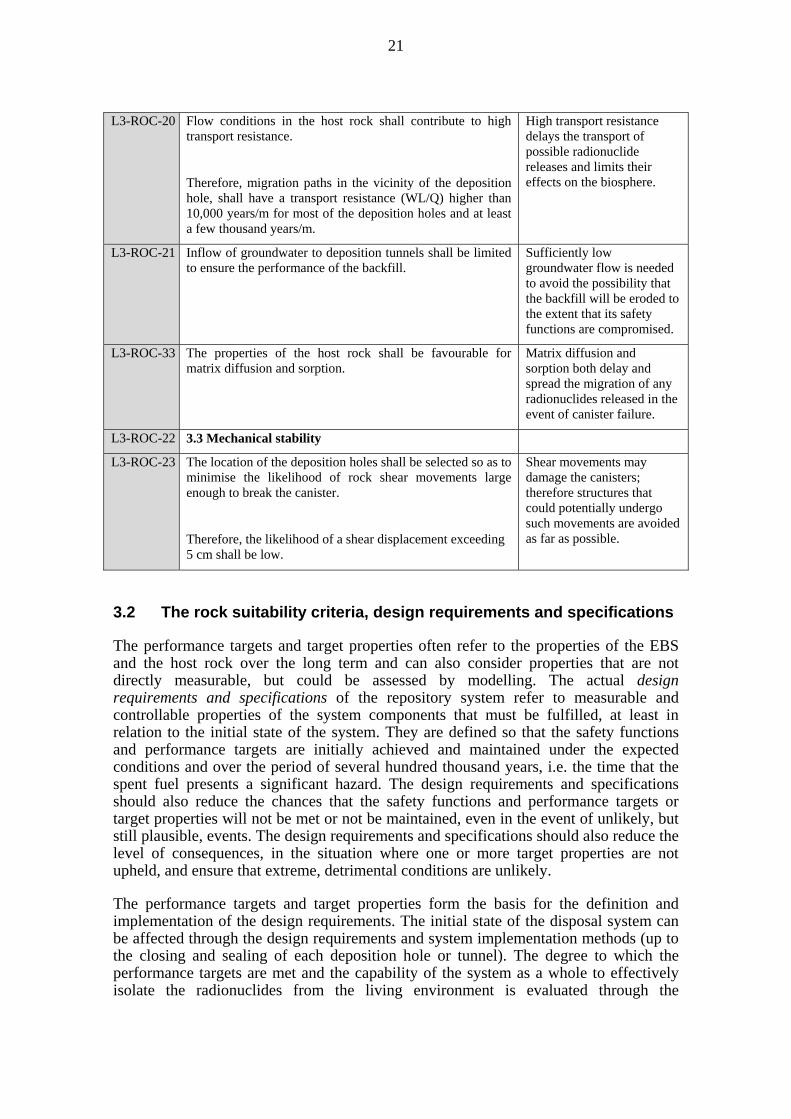
L3-ROC-20 Flow conditions in the host rock shall contribute to high transport resistance.
Therefore, migration paths in the vicinity of the deposition hole, shall have a transport resistance (WL/Q) higher than 10,000 years/m for most of the deposition holes and at least a few thousand years/m.
High transport resistance delays the transport of possible radionuclide releases and limits their effects on the biosphere.
L3-ROC-21 Inflow of groundwater to deposition tunnels shall be limited to ensure the performance of the backfill.
Sufficiently low groundwater flow is needed to avoid the possibility that the backfill will be eroded to the extent that its safety functions are compromised.
L3-ROC-33 The properties of the host rock shall be favourable for matrix diffusion and sorption.
Matrix diffusion and sorption both delay and spread the migration of any radionuclides released in the event of canister failure.
L3-ROC-22 3.3 Mechanical stability
L3-ROC-23 The location of the deposition holes shall be selected so as to minimise the likelihood of rock shear movements large enough to break the canister.
Therefore, the likelihood of a shear displacement exceeding 5 cm shall be low.
Shear movements may damage the canisters; therefore structures that could potentially undergo such movements are avoided as far as possible.
3.2 The rock suitability criteria, design requirements and specifications
The performance targets and target properties often refer to the properties of the EBS and the host rock over the long term and can also consider properties that are not directly measurable, but could be assessed by modelling. The actual design requirements and specifications of the repository system refer to measurable and controllable properties of the system components that must be fulfilled, at least in relation to the initial state of the system. They are defined so that the safety functions and performance targets are initially achieved and maintained under the expected conditions and over the period of several hundred thousand years, i.e. the time that the spent fuel presents a significant hazard. The design requirements and specifications should also reduce the chances that the safety functions and performance targets or target properties will not be met or not be maintained, even in the event of unlikely, but still plausible, events. The design requirements and specifications should also reduce the level of consequences, in the situation where one or more target properties are not upheld, and ensure that extreme, detrimental conditions are unlikely.
The performance targets and target properties form the basis for the definition and implementation of the design requirements. The initial state of the disposal system can be affected through the design requirements and system implementation methods (up to the closing and sealing of each deposition hole or tunnel). The degree to which the performance targets are met and the capability of the system as a whole to effectively isolate the radionuclides from the living environment is evaluated through the
22
assessment of the evolution of the disposal system. Whilst the performance targets and target properties focus on long-term safety aspects, in defining the design requirements and design specifications practical issues related to the construction and operation of the repository also need to be taken into account. Also, each target property is not defined as a strict requirement in relation to, for example, each deposition hole, but rather that each deposition hole should have a high likelihood of meeting the target property. These target properties thus differ from the rock suitability criteria, which need to be met for each deposition hole, at least initially.
With regard to the host rock, rock suitability criteria constrain the rock volumes and locations suitable for hosting deposition tunnels and deposition holes. The aim of the rock suitability criteria is to avoid features of the host rock that may be detrimental to the safety of the repository, either during the initial state or in long term. The target properties presented in the previous Section outline the conditions that are considered to be favourable. Accepting the constraints imposed by the application of these rock suitability criteria on the layout of the repository, on the location and orientation of deposition tunnels and on the positions of deposition holes, will greatly increase the likelihood that the target properties will be maintained over the long term. The rock suitability criteria relate to the observable and measurable properties of the host rock. Their fulfilment needs to be demonstrated for each deposition tunnel and deposition hole before emplacement of the canister, the buffer and the backfill. Other design requirements and design specifications related to, for example, the dimensions of the excavated rooms, the acceptability of the materials and the technical quality of the excavation are also defined for the underground openings (Posiva 2012e).
The RSC process is carried out at different scales, including repository, panel, tunnel and deposition hole, and applied at different stages of the investigation and excavation work (for details see Chapters 5 and 6). Classification at the repository scale aims at defining the rock volumes to be used for repository layout planning. Consequently, so-called LDFs (Layout Determining Features) and their respect volumes that are to be avoided when locating deposition tunnels and holes, are defined (see discussion and definition of LDFs in Section 5.3). Bedrock structures defined as LDFs are either large fault zones, which are potentially mechanically unstable in the current or future stress field, and/or are major groundwater flow routes, which are important for the transport of solutes and for affecting the chemical stability of the site. Classification at the panel scale aims at defining suitable areas for the tunnels within a certain panel and at assessing the degree of utilisation2 of the panel area for the detailed design of the panel. The classification is carried out based on the more detailed data on brittle fault zones and hydraulically-conductive zones that become available during the construction of the central tunnels for the panel in question. The tunnel-scale classification aims at defining suitable tunnel sections for the deposition holes, so that the LDFs and smaller, local brittle fault zones and their respect volumes, large fractures and high inflows to the deposition holes are avoided. At the deposition hole scale, the fulfilment of the rock
2 The degree of utilisation is determined by the number of suitable deposition holes with respect to the theoretical maximum number and is related to whether the volume of rock is being used in an economical and effective manner. The suitability of a deposition tunnel can also be described by the term suitability ratio, which is used as a measure of the ratio of suitable tunnel sections to total tunnel length.

23
suitability criteria is checked as part of the acceptance procedure of the deposition hole. Section 5.3 discusses the linkage between the target properties and the criteria in detail.
The rock suitability criteria are presented in Chapter 5, whereas the other design requirements and specifications for the underground openings, as well as other repository components, are presented in Posiva (2012e). The RSC system is discussed in Chapter 6. The fulfilment of the design requirements and design specifications concerning the underground openings at the initial state, i.e. the state in which a given component has been emplaced according to its design and the state in which it remains after intentional engineering measures have been completed, is discussed in the Underground Openings Production Line report (Posiva 2012f). The fulfilment of the target properties during the evolution of the repository and the site is discussed in the Performance Assessment report (Posiva 2012c), which considers cases when the RSC system is applied, but also what the consequences would be if the RSC system were not applied.

24
25
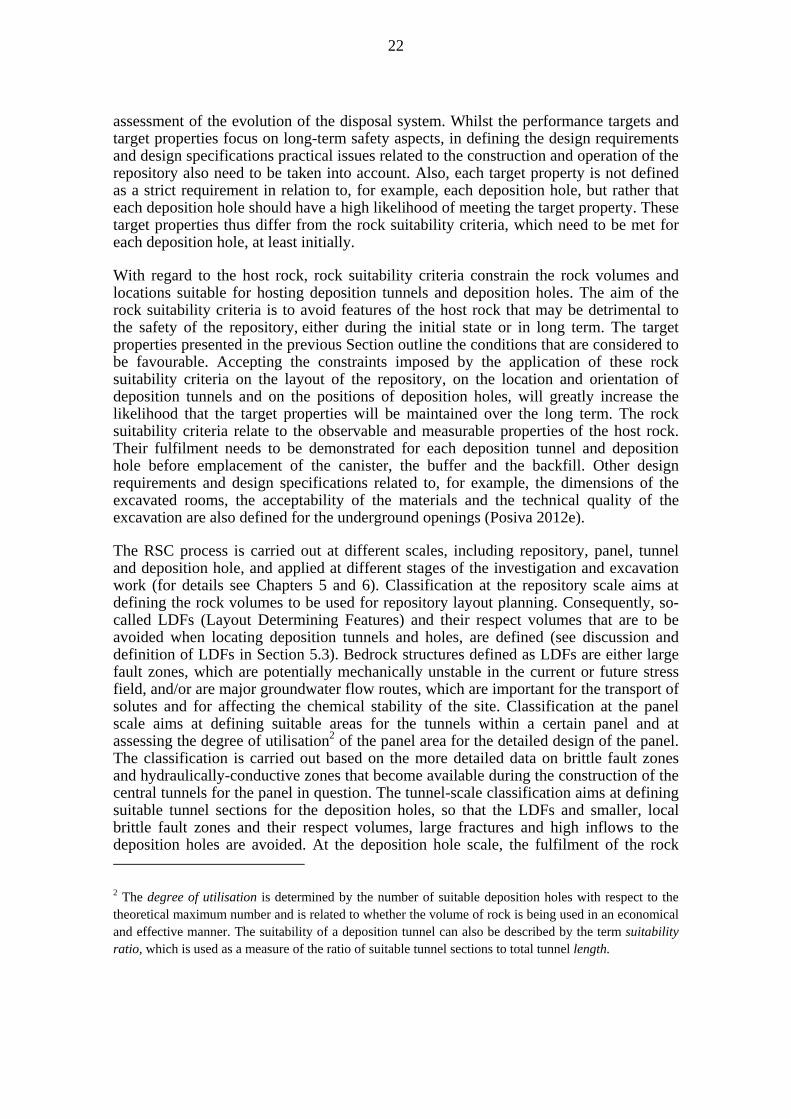
4 TESTING THE RSC-I CRITERIA AND METHOD DEVELOPMENT
Revising the earlier HRC (Host Rock Classification) system based on an existing understanding of the bedrock and the requirements on long-term safety was one of the aims of the RSC programme. In order to determine the revisions required, the HRC procedure was tested using data from the ONKALO in 2007 (Lampinen 2008). This testing concerned the practical application of the system, rather than its adequacy with respect to repository performance. The test was performed by executing the tunnel-scale procedure described in the HRC, using data from ONKALO pilot holes ONK-PH2 to ONK-PH5 (reaching a maximum depth of 130 m below the surface) and their respective tunnel sections. The results were evaluated, together with new information from recent site investigations, and were taken into account in the development of the RSC-I.
Following the development of the RSC-I, as described in the RSC Interim Report of Hellä et al. (2009), it was decided to test these criteria. Section 7.3 of Hellä et al. (2009) sets out the proposed next steps in the RSC programme, which include the testing of these criteria in the ONKALO tunnel and in the proposed investigation and experimental niches. The results and the experience gained in applying the criteria would be utilised in the further development of the RSC criteria and the classification process during the next phase (RSC-II) of the programme.
This Chapter summarises the RSC-I related testing carried out in the ONKALO, including tests of the preliminary criteria and their practical application, as well as testing and development of various research methods for providing the data needed by the RSC process:
Test 1: Tunnel scale classification of pilot hole ONK-PH10 and the respective section of the ONKALO access tunnel (chainages 3459-3639 m) (Section 4.3)
Test 2: Evaluating the effect of the FPI3 criterion by using data from the ONKALO access tunnel chainages 3922-4053 m and 4092-4216 m (pilot holes ONK-PH11 and ONK-PH12) (Section 4.4)
Test 3: Suitability classification of the ONKALO access tunnel, chainage 3900-4600 m (Section 4.5)
Test 4: Suitability classification of the POSE niche and the experimental holes (Section 4.6)
Test 5: Method development for measuring fracture-specific tunnel inflow (Section 4.7)
Test 6: SKB cooperation project on large fracture issues (Section 4.8) The first two Sections, however, summarise the RSC-I criteria and the considerations regarding their practical application, as reported by Hellä et al. (2009), to provide the background for the test descriptions; it is worth noting, however, that the RSC-I criteria
3 The term FPI refers to a full perimeter intersection fracture, one that is visible on all the walls of a tunnel. The term was first introduced by Munier (2006).

26
are as such no longer valid, but have been revised into RSC-II criteria, presented in Chapter 5 of this report.
4.1 The RSC-I criteria
The preliminary criteria and their relationship with the established geosphere target properties4 and site characteristics relevant to long-term safety are discussed in detail in the RSC Interim Report (Hellä et al. 2009). A summary of the preliminary criteria as presented in that report is given in Table 4-1, with a short discussion provided below.
In a similar manner to the HRC, the RSC-I system was designed to evaluate the suitability of the Olkiluoto site at three scales: repository scale, deposition tunnel scale and deposition hole scale. The target properties set for the repository site were considered at all three scales and deal with the hydrogeological, hydrogeochemical and rock mechanics properties of the site (see Hellä et al. 2009, for details). The target properties form the basis for the practical suitability criteria, which deal only with the hydrogeological (hydraulic) and mechanical properties of the rock (Table 4-1).
The preliminary criteria concentrate on the repository scale, which considers large-scale characteristics of the rock mass, and are intended to define suitable volumes for the repository and the deposition panels. At the repository scale, the suggested criteria pertain to large, so-called site-scale, hydrogeological zones (HZ) and brittle fault zones (BFZ), also collectively called Layout Determining Features (LDF) (Hellä et al. 2009) (see Section 5.3 of this report for definition and discussion). Zones defined as LDFs are potentially mechanically unstable in the current stress field or in anticipated future stress fields, or they act as the potential main groundwater flow paths, and are thus important for the transport of solutes and in determining the chemical stability at the site; they may thus affect the long-term safety of the repository. Consequently, the LDFs and their influence zones5 are to be avoided when locating deposition panels, so that. For the site-scale BFZs, the minimum respect distance from the core of a zone should be equal to the thickness of the influence zone (Table 4-1), and. Ffor the site-scale HZs, a standard respect distance of 20 m (measured perpendicular to the core of the zone) is suggested (see Section 5.3.3 in Hellä et al. 2009).
Hellä et al. (2009) does not contain specific criteria at the tunnel scale (Table 4-1). It is noted that the need to limit the inflow of groundwater into deposition tunnels is mainly related to the desired performance of the backfill and that a specific tunnel-scale criterion will be implemented in the RSC scheme, as the backfill testing continues and the requirements regarding the maximum acceptable level of inflow into a tunnel will be defined on a firmer basis (Hellä et al. 2009, Section 5.3.3). Also, no additional criteria
4 In Hellä et al. (2009), the geosphere target properties are referred to as geosphere "performance targets". Here, the expression "target property" is adopted to avoid contradiction between this Section and the rest of the report.
5 An influence zone is a volume of rock (in section a separation distance or respect distance) around a deformation zone (fault) that has a higher fracture density than the rock mass outside the influence zone and also has a higher hydraulic conductivity and is more likely to exhibit alteration. This term is used, as it includes additional features to what is commonly termed a damage zone or perhaps a transition zone in structural geology. See also Section 5.5 of this report.
27
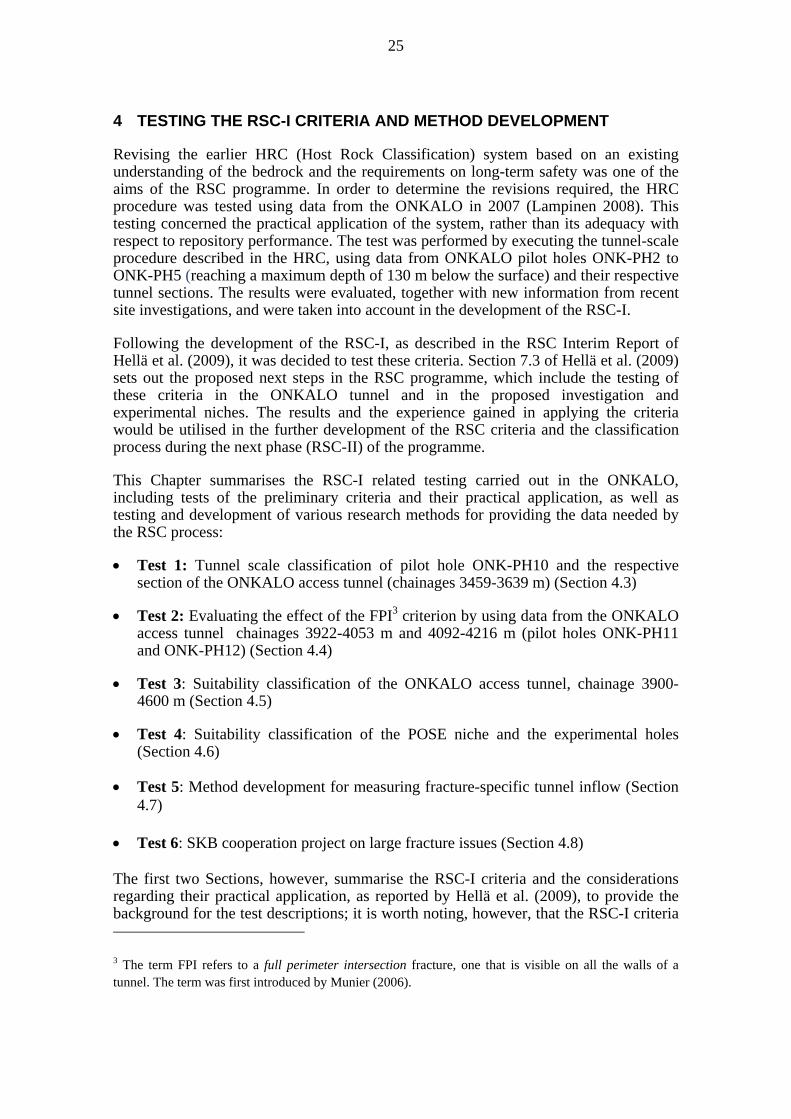
related to the mechanical properties of the rock are defined for the tunnel scale, but it is stated that the criterion suggested for the so-called FPI fractures6 at the deposition hole scale needs to be taken into account when planning the locations of the deposition holes, estimating the degree of utilisation7 for each possible tunnel and assessing the economic efficiency of excavation (Table 4-1; Hellä et al. 2009, Sections 5.3.4 and 5.3.5).
Table 4-1. Summary of the preliminary rock suitability criteria suggested for use at Olkiluoto in the RSC-I phase (from Table 5-9 in Hellä et al. 2009)8.
Target properties Scale Criteria
Inflow to deposition holes <0.1 L/min
Low flow rate around a deposition hole in saturated conditions (in the order of 1 L/year)
Transport resistance in the order of few thousands of years per metre in the vicinity of a deposition hole
Repository Avoid the influence zones of the site-scale hydrogeological zones. In general, 20 m is considered as an adequate distance
Tunnel No additional criteria
Deposition hole Deposition hole cannot be positioned within the influence zone of a hydrogeological structure (a zone or a fracture)
Maximum allowed inflow to a deposition hole is 0.1 L/min
Limited mechanical disturbances
Rock shear in deposition hole <10 cm
Repository Avoid the influence zones of the site-scale brittle deformation zones
Tunnel No additional criteria (however, FPIs need to be taken into account in the degree of utilisation)
Deposition hole Deposition hole must not intersect an FPI fracture; a preliminary respect distance of 0.5 m is suggested
Deposition hole cannot intersect minor9 brittle deformation zones and the influence zones of these must be avoided
The deposition hole scale aims to evaluate the suitability of individual deposition holes for long-term disposal. If a hydrogeological feature (a water-conducting BFZ or
6 See footnote 1.
7 See footnote 2.
8 In the rock suitability criteria, the more general expression brittle deformation zone is used rather than the more specific brittle fault zone. The site-scale hydrogeological zones and site-scale brittle deformation zones refer to the layout-determining features (LDF).
9 The term minor refers to all brittle deformation zones smaller than site-scale LDFs.
28
fracture) is observed in the excavated deposition tunnel, adjacent deposition holes need to be positioned to avoid the intersection of this feature. No specific respect distance is defined for such features, but the hydrogeological influence zone of such features need to be avoided (Table 4-1). It is noted, however, that, at this stage, there is no proper definition of the hydrogeological influence zone at this scale (Hellä et al. Section 5.3.3). The general idea is to identify individual rock volumes that are affected by the hydrogeological features and to avoid such volumes. On the basis of experience gained from the ONKALO, these volumes can in many cases be identified once the tunnel is excavated. However, identification of sub-horizontal features below the tunnel floor is difficult, until vertical pilot holes are drilled to characterise deposition hole positions. It is thus suggested that if a sub-horizontal hydrogeological feature is found to crosscut a canister position, the position needs to be rejected. Also, if the measured inflow to a hole exceeds 0.1 L/min, the position needs to be rejected (Hellä et al. 2009, Section 5.3.3).
A performance target set for the mechanical properties of the rock dictates that no deposition hole be intersected by a fracture that may experience lateral slip of >10 cm. The maximum slip possible on a fracture is dependent on its length and its distance from potentially earthquake-hosting fault zones. As it is, in practice, extremely difficult, if not impossible, to determine the size of a fracture with certainty, it is suggested that a deposition hole should not intersect a so-called FPI fracture (Table 4-1) – a fracture that intersects the compete perimeter of a deposition tunnel or deposition hole – as such fractures may be long enough to slip more than 10 cm. A respect distance of 0.5 m needs to be used for any FPI fracture (see Hellä et al. 2009 and Section 5.3.4 for details). Another requirement is that influence zones of minor (i.e. not layout determining) BFZs need to be avoided in order to maintain the integrity of the canisters. It is suggested that the scaling laws of Scholz (2002) can be used to obtain rough estimates of the thicknesses of the influence zones of minor brittle deformation zones, but that the actual width of an influence zone should be defined individually for each zone, once intersected by a tunnel or pilot hole (Hellä et al. 2009, Section 5.3.4).
4.2 The suitability classes and the classification procedure
This Section summarises the preliminary considerations regarding the practical application of the rock suitability criteria, as presented on a scale-by-scale basis in Section 5.3.4 of Hellä et al. (2009).
Suitability classes used in the rock suitability classification with respect to different scales and investigation phases are shown in Table 4-2. The classification system consists of three suitability classes that relate to specific scales and phases of the suitability investigations:
Suitable (sub-index s)
Possibly suitable (sub-index ps)
Not suitable (sub-index ns)
Each suitability class is applicable to either the entire rock volume being investigated or to parts of it, so that a rock volume may consist of sub-volumes with different suitability classifications. In addition, each suitability class is defined specifically for each scale: repository (REP), deposition tunnel (TUN) and deposition hole (CAN) (Table 4-2).
29
Class “Suitable (s)” is self-explanatory, corresponding to a situation where, before moving on to the next investigation scale, all criteria are met and the investigated volume is considered suitable for the specific scale under assessment (e.g. REPs, TUNs, CANs). Suitability classification during the last investigation phase (the deposition hole scale) will finally determine whether or not the hole being investigated is suitable for disposal purposes.
Class “Not suitable (ns)” refers to volumes unable to fulfil the criteria (e.g. REPns, TUNns, CANns); consequently, these volumes must be discarded.
“Possibly suitable (ps)” refers to a situation, where preliminary investigations of a specific volume indicate suitability, but the suitability can only be confirmed after excavation of the volume or by further studies. This case corresponds to the investigations carried out within the deposition tunnel or deposition hole volumes (TUNps, CANps), especially with respect to the data gained from pilot holes. Pilot hole data, complemented by other data, may indicate a suitable volume, but suitability can only be confirmed by detailed investigations after excavation of the tunnel section or boring of the deposition hole represented by the pilot hole. In addition, this class is used if, for example, engineering measures are allowed to improve the bedrock quality, in order to maintain constructional stability of the tunnel or limit inflow into deeper parts of the tunnel.
Overall, it is emphasised that, ultimately, suitable deposition hole locations (CANs) define the final suitability of a specific volume of rock for waste disposal, whereas suitable repository volumes (REPs) and deposition tunnel sections (TUNs) are only indicators of suitable volumes of rock for disposal purposes.
At the repository scale, the main focus is on locating the LDFs, which, by definition, are hundreds or thousands of metres in length. Geological models of the site (e.g. the GSM of Aaltonen et al. 2010) tend to focus on the description of the site-scale structures and properties of the bedrock, and their resolution is sufficient for the purposes of defining suitable repository volumes and for planning deposition tunnel panels. Such models are primarily based on direct data from deep drillholes, but indirect data sources, such as geophysical data and their interpretations, are also made use of. Prior to the application of the RSC process at the repository scale, it is necessary to update the site models with newly acquired data and, if necessary, to re-assess the LDFs based on the updated models. In order to estimate suitable repository volumes, the influence zones and respect distances are determined for each LDF and for each hydrogeological zone. These modelled features can be treated separately, taking into account the restrictions of each model; in the case of overlapping respect distances, the most conservative should be applied.
Statistical estimates of the loss of deposition holes, based on deposition hole-scale criteria, should be employed at the repository scale to define volumes of rock with a low degree of utilisation. Although a specific degree of utilisation is not a long-term safety requirement, these volumes may need to be avoided due to economical considerations.

30
Table 4-2 Suitability classes suggested for the classification of rock volumes in the RSC-I phase (adapted from Table 5-10 in Hellä et al. 2009).
Investigation scale Investigation phase Suitability class
Repository REPs REPns
Deposition tunnel
Before tunnel excavation (pilot hole data)
TUNps TUNns
After tunnel excavation TUNs TUNns
Deposition hole Before hole boring (pilot hole data)
CANps CANns
After hole boring CANs CANns
Deposition tunnels should be planned within volumes defined suitable at the repository scale. After the preliminary decision concerning where a deposition tunnel could be positioned, a pilot hole would be drilled within the planned tunnel profile, and standard geological, hydrogeological and geophysical measurements and observations carried out in the hole. In RSC-I, there are currently no specific criteria related to the tunnel scale, but any observed FPI fractures would be taken into account for planning purposes, as they are not allowed to crosscut deposition holes, and they thus affect the degree of utilisation of the tunnel. If, having carried out all these observations, a large enough part of the tunnel seems potentially suitable, excavation can commence. If, on the other hand, the pilot hole intersects, for example, a LDF, the acquired data will need to be re-analysed and the repository-scale classification re-assessed for the volume of rock in question.
In addition to the pilot hole, probe hole data can be used to better assess heterogeneity in hydraulic properties of an individual fracture/zone and to estimate possible inflows to the tunnel. After excavation, a detailed characterisation of the tunnel would be carried out and its suitability determined. Tunnel mapping should take place during excavation and the suitability of the tunnel should be continuously evaluated against the suitability criteria and the degree of utilisation. A tunnel or tunnel section may also be classified as not suitable if the tunnel, after detailed characterisation, has a very low degree of deposition-hole utilisation, for example due to the high density of FPI fractures. It may therefore be feasible to estimate the number of suitable deposition hole locations at an early stage. For suitable tunnels or tunnel sections with an adequate degree of utilisation, a preliminary positioning of deposition holes can then be carried out.
Deposition holes may be initially positioned in locations determined as being suitable at the deposition tunnel scale. Each chosen location needs to be investigated by a pilot hole. A location is thereafter classified as being possibly suitable or not suitable for final disposal, if data acquired from the pilot hole indicate that the suitability criteria are or are not met. The classification not suitable requires the definite rejection of the planned deposition hole. At the possibly suitable locations, boring of the deposition holes can then take place, and their final suitability is determined by a detailed characterisation of the bored deposition hole with respect to the criteria. The bored holes are then classified either as being not suitable, or as suitable, and can then be used for disposal purposes.
31
At all scales, the most conservative criterion must be used in situations where proposed criteria are overlapping. As an example, if an FPI fracture is associated with inflowing groundwater, the respect distance to be applied is determined either by the hydrogeological or the mechanical criteria, depending on which is more prescriptive (i.e. more conservative).
4.3 Test 1: Tunnel scale classification of pilot hole ONK-PH10 and the corresponding section of the ONKALO access tunnel
4.3.1 Test purpose
The preliminary RSC-I criteria proposed by Hellä et al. (2009) were tested using pilot hole ONK-PH10 and the respective section of the ONKALO access tunnel (chainage 3459-3639 m). The purpose of the test was to evaluate the practicality of the criteria and the proposed tunnel-scale classification procedure, and also to assess whether the available data would be sufficient for the suitability classification. The pilot hole ONK-PH10 was chosen as the test location because it was the deepest pilot hole in the access tunnel at the time the test was started. Also, the tunnel section was known to intersect structures relevant from the RSC point of view and hence to provide, in principle, the necessary data for testing. Kosunen et al. (2012) describe the test in detail; a summary is presented in the following sections.
4.3.2 Test procedure and data
The general procedure used for testing the preliminary RSC-I is illustrated in the flow chart presented in Figure 4-1. The test comprised three phases, where increasingly accurate and more comprehensive data on the relevant bedrock features were used to carry out the suitability classification of the tunnel: geological prediction, pilot hole data and tunnel data (Kosunen et al. 2012). These phases could be seen to represent the following steps in the actual deposition process: i) the selection of potential locations for individual deposition tunnels prior to the drilling of pilot holes, ii) the drilling of pilot holes in the chosen potential tunnel locations and the assessment of their suitability before making a decision on tunnel excavation and iii) the final acceptance of a tunnel for deposition use, with the classification results used for selecting potential locations for individual deposition holes.
In each phase, the tunnel was classified into possibly suitable (TUNps) and not suitable (TUNns) sections on the basis of the preliminary suitability criteria (Table 4-1). To do this, information provided by the data was used to model the relevant bedrock features - LDFs, BFZs, FPIs and water conductive features - and their influence zones in 3D, paying particular attention to their continuation below the tunnel floor, after which a graphical method was used for assessing the suitability of the tunnel. The limits of the "possibly suitable" tunnel areas (TUNps) and "not suitable" tunnel areas (TUNns) were defined in the 3D environment by moving a cylindrical deposition hole below the tunnel floor, along the central line of the tunnel. If any part of the deposition hole were crosscut by the respect volume of the modelled brittle fault zones, the corresponding tunnel section was classified as TUNns. Areas where the deposition holes were not crosscut by the modelled structures were classified as TUNps (Figure 4-2) (Kosunen et al. 2012). For the deposition hole, the size of the planned OL3 deposition holes (reference dimensions: depth 8.25 m, radius 1.75 m) was used, as those are the largest and therefore provided the most conservative estimate of the tunnel’s suitability.
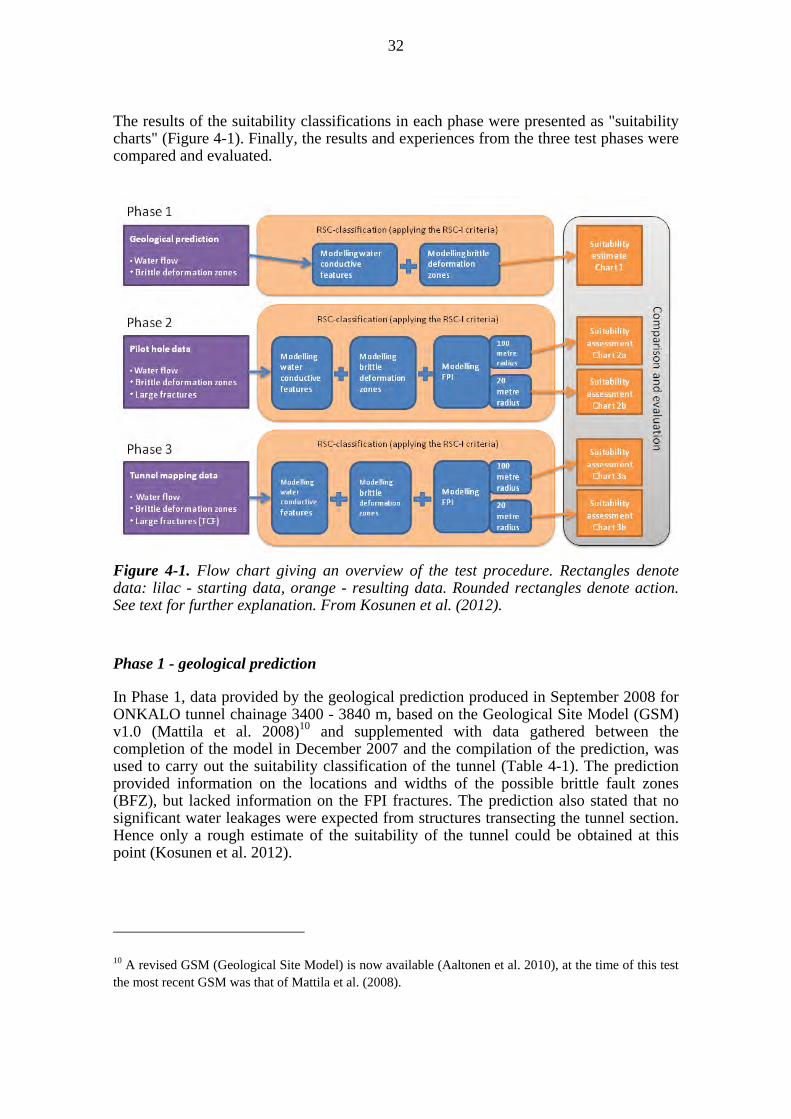
32
The results of the suitability classifications in each phase were presented as "suitability charts" (Figure 4-1). Finally, the results and experiences from the three test phases were compared and evaluated.
Figure 4-1. Flow chart giving an overview of the test procedure. Rectangles denote data: lilac - starting data, orange - resulting data. Rounded rectangles denote action. See text for further explanation. From Kosunen et al. (2012).
Phase 1 - geological prediction
In Phase 1, data provided by the geological prediction produced in September 2008 for ONKALO tunnel chainage 3400 - 3840 m, based on the Geological Site Model (GSM) v1.0 (Mattila et al. 2008)10 and supplemented with data gathered between the completion of the model in December 2007 and the compilation of the prediction, was used to carry out the suitability classification of the tunnel (Table 4-1). The prediction provided information on the locations and widths of the possible brittle fault zones (BFZ), but lacked information on the FPI fractures. The prediction also stated that no significant water leakages were expected from structures transecting the tunnel section. Hence only a rough estimate of the suitability of the tunnel could be obtained at this point (Kosunen et al. 2012).
10 A revised GSM (Geological Site Model) is now available (Aaltonen et al. 2010), at the time of this test the most recent GSM was that of Mattila et al. (2008).
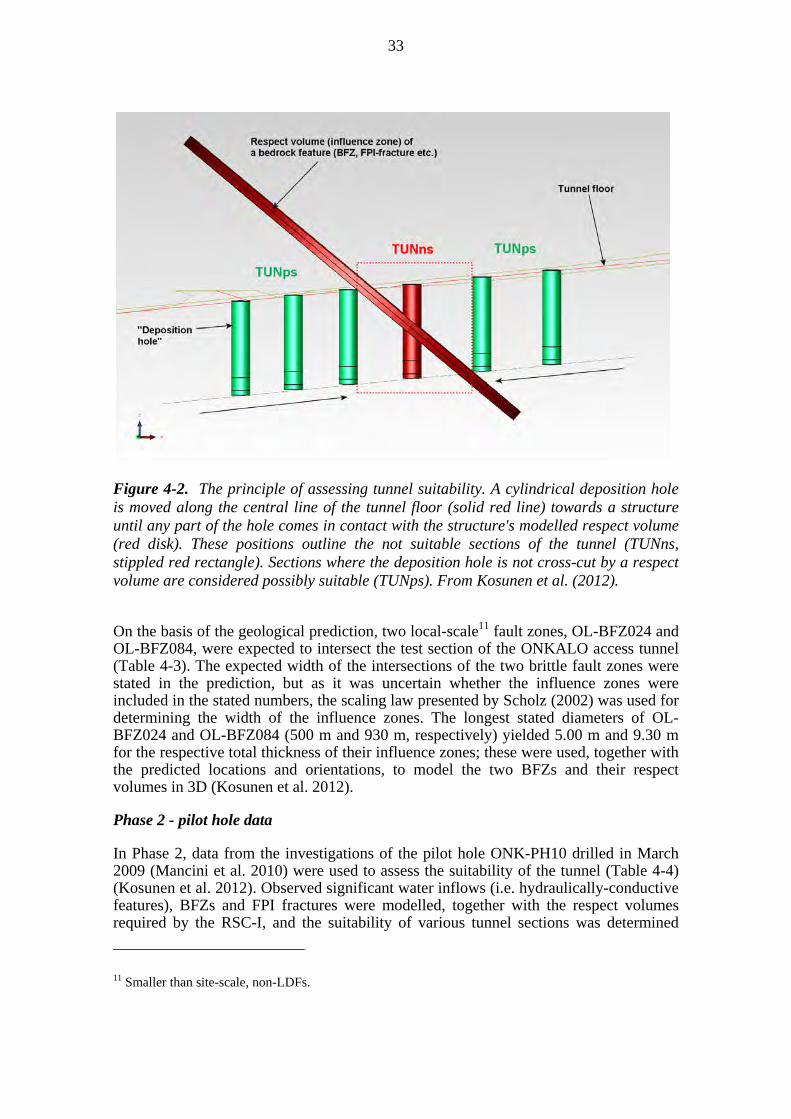
33
Figure 4-2. The principle of assessing tunnel suitability. A cylindrical deposition hole is moved along the central line of the tunnel floor (solid red line) towards a structure until any part of the hole comes in contact with the structure's modelled respect volume (red disk). These positions outline the not suitable sections of the tunnel (TUNns, stippled red rectangle). Sections where the deposition hole is not cross-cut by a respect volume are considered possibly suitable (TUNps). From Kosunen et al. (2012).
On the basis of the geological prediction, two local-scale11 fault zones, OL-BFZ024 and OL-BFZ084, were expected to intersect the test section of the ONKALO access tunnel (Table 4-3). The expected width of the intersections of the two brittle fault zones were stated in the prediction, but as it was uncertain whether the influence zones were included in the stated numbers, the scaling law presented by Scholz (2002) was used for determining the width of the influence zones. The longest stated diameters of OL-BFZ024 and OL-BFZ084 (500 m and 930 m, respectively) yielded 5.00 m and 9.30 m for the respective total thickness of their influence zones; these were used, together with the predicted locations and orientations, to model the two BFZs and their respect volumes in 3D (Kosunen et al. 2012).
Phase 2 - pilot hole data
In Phase 2, data from the investigations of the pilot hole ONK-PH10 drilled in March 2009 (Mancini et al. 2010) were used to assess the suitability of the tunnel (Table 4-4) (Kosunen et al. 2012). Observed significant water inflows (i.e. hydraulically-conductive features), BFZs and FPI fractures were modelled, together with the respect volumes required by the RSC-I, and the suitability of various tunnel sections was determined
11 Smaller than site-scale, non-LDFs.

34
(TUNps or TUNns). The large set of geophysical data routinely collected from each pilot hole was not used in this test, due to time limitations and the need for further insight in the interpretation of these data.
Table 4-3. Predicted properties of the brittle fault zones OL-BFZ024 and OL-BFZ084, used to model the BFZs in 3D in Phase 1 (from Kosunen et al. 2012).
BFZ Size Confidence Orientation Expected average tunnel chainage
Expected average pilot hole depth (m)
Ol-BFZ024 500 x 500 m Low 139º/47º 3522.5 63.5
OL-BFZ084 930 x 660 m Medium 182º/60º 3557.5 98.5
Table 4-4. Parameters used to model the observed brittle fault zone OL-BFZ084 in Test Phase 2 (from Kosunen et al. 2012).
Location (m pilot hole depth)
Respect volume thickness (m)
Orientation (dip direction/dip)
Radius (m)
Value 83.1 3.41 182/50 465
Source pilot hole pilot hole pilot hole Site model
A brittle fault zone intersection observed at 81.39 to 84.80 m pilot hole depth was interpreted to most likely represent the predicted brittle fault zone OLBFZ084, due to the close match of the predicted and observed locations (Kosunen et al. 2012); the 3.41 m thick intersection was used to model the OL-BFZ084 in Test Phase 2. The width of the influence zone was determined on the basis of the observations made from the drill core, as it is stated in the RSC-I that: "the actual width of an influence zone should be defined individually for each zone once intersected by the tunnel or a pilot hole" (Hellä et al. 2009, page 87), and the respect volume for the zone was modelled accordingly (Table 4-4). Orientations measured from the pilot hole for fractures within the zone core12 were used to calculate a mean orientation, which was used to model the whole zone. No intersection of the predicted OL-BFZ024 was observed in the pilot hole.
During the time of the test, no specific method existed for distinguishing the FPI fractures from all other, insignificant fractures on the basis of pilot hole data. Thus, a simple working hypothesis was used for carrying out the RSC classification on the pilot hole data: fractures with features indicative of movement were considered to be FPIs (Kosunen et al. 2012). Consequently, fractures designated as "slickensided" or "grain-
12 A widely accepted conceptual model for brittle fault zone architecture includes a fault core, representing the localisation of strain during slip events, and an associated damage zone mechanically related to the growth of the fault, surrounded by relatively undeformed host rock. Fault zones may consist of a single discrete core or of multiple anastomosing core strands, separating lenses of damaged host rock. Subsidiary fault cores may branch out of the main fault plane. For a more detailed description, see Aaltonen et al. (2010), Section 9.3.4.
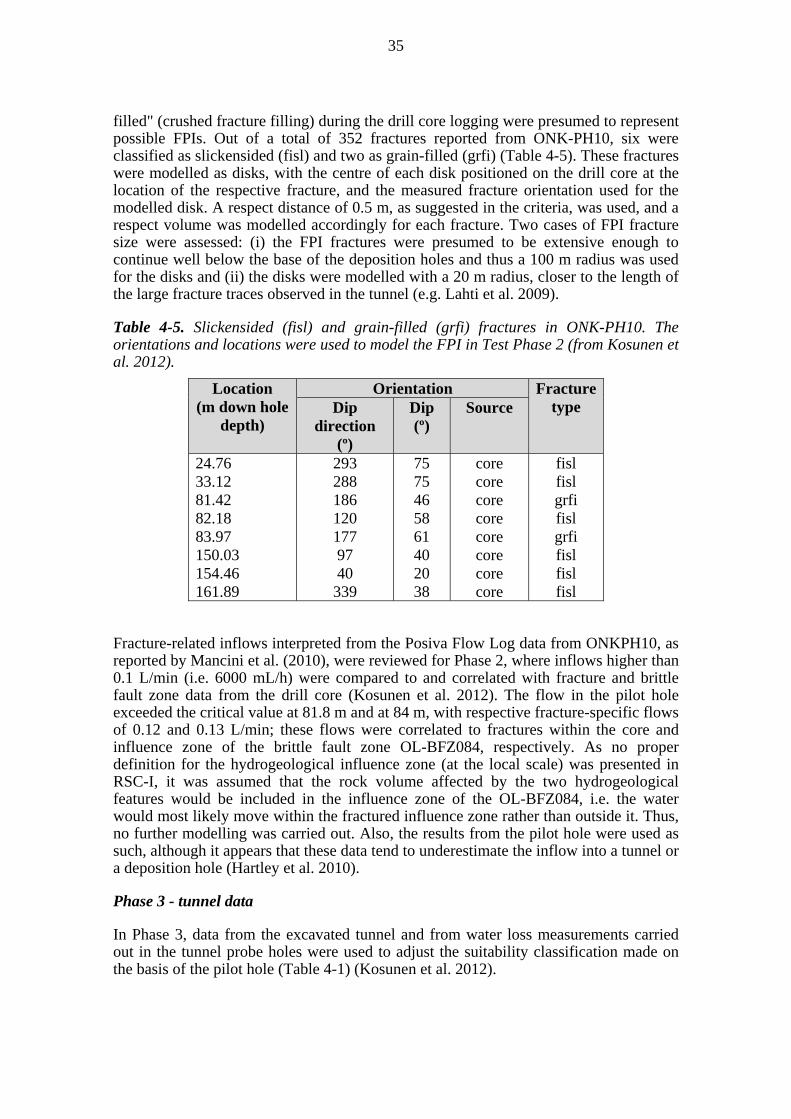
35
filled" (crushed fracture filling) during the drill core logging were presumed to represent possible FPIs. Out of a total of 352 fractures reported from ONK-PH10, six were classified as slickensided (fisl) and two as grain-filled (grfi) (Table 4-5). These fractures were modelled as disks, with the centre of each disk positioned on the drill core at the location of the respective fracture, and the measured fracture orientation used for the modelled disk. A respect distance of 0.5 m, as suggested in the criteria, was used, and a respect volume was modelled accordingly for each fracture. Two cases of FPI fracture size were assessed: (i) the FPI fractures were presumed to be extensive enough to continue well below the base of the deposition holes and thus a 100 m radius was used for the disks and (ii) the disks were modelled with a 20 m radius, closer to the length of the large fracture traces observed in the tunnel (e.g. Lahti et al. 2009).
Table 4-5. Slickensided (fisl) and grain-filled (grfi) fractures in ONK-PH10. The orientations and locations were used to model the FPI in Test Phase 2 (from Kosunen et al. 2012).
Location (m down hole
depth)
Orientation Fracture type Dip
direction (º)
Dip (º)
Source
24.76 33.12 81.42 82.18 83.97 150.03 154.46 161.89
293 288 186 120 177 97 40 339
75 75 46 58 61 40 20 38
core core core core core core core core
fisl fisl grfi fisl grfi fisl fisl fisl
Fracture-related inflows interpreted from the Posiva Flow Log data from ONKPH10, as reported by Mancini et al. (2010), were reviewed for Phase 2, where inflows higher than 0.1 L/min (i.e. 6000 mL/h) were compared to and correlated with fracture and brittle fault zone data from the drill core (Kosunen et al. 2012). The flow in the pilot hole exceeded the critical value at 81.8 m and at 84 m, with respective fracture-specific flows of 0.12 and 0.13 L/min; these flows were correlated to fractures within the core and influence zone of the brittle fault zone OL-BFZ084, respectively. As no proper definition for the hydrogeological influence zone (at the local scale) was presented in RSC-I, it was assumed that the rock volume affected by the two hydrogeological features would be included in the influence zone of the OL-BFZ084, i.e. the water would most likely move within the fractured influence zone rather than outside it. Thus, no further modelling was carried out. Also, the results from the pilot hole were used as such, although it appears that these data tend to underestimate the inflow into a tunnel or a deposition hole (Hartley et al. 2010).
Phase 3 - tunnel data
In Phase 3, data from the excavated tunnel and from water loss measurements carried out in the tunnel probe holes were used to adjust the suitability classification made on the basis of the pilot hole (Table 4-1) (Kosunen et al. 2012).
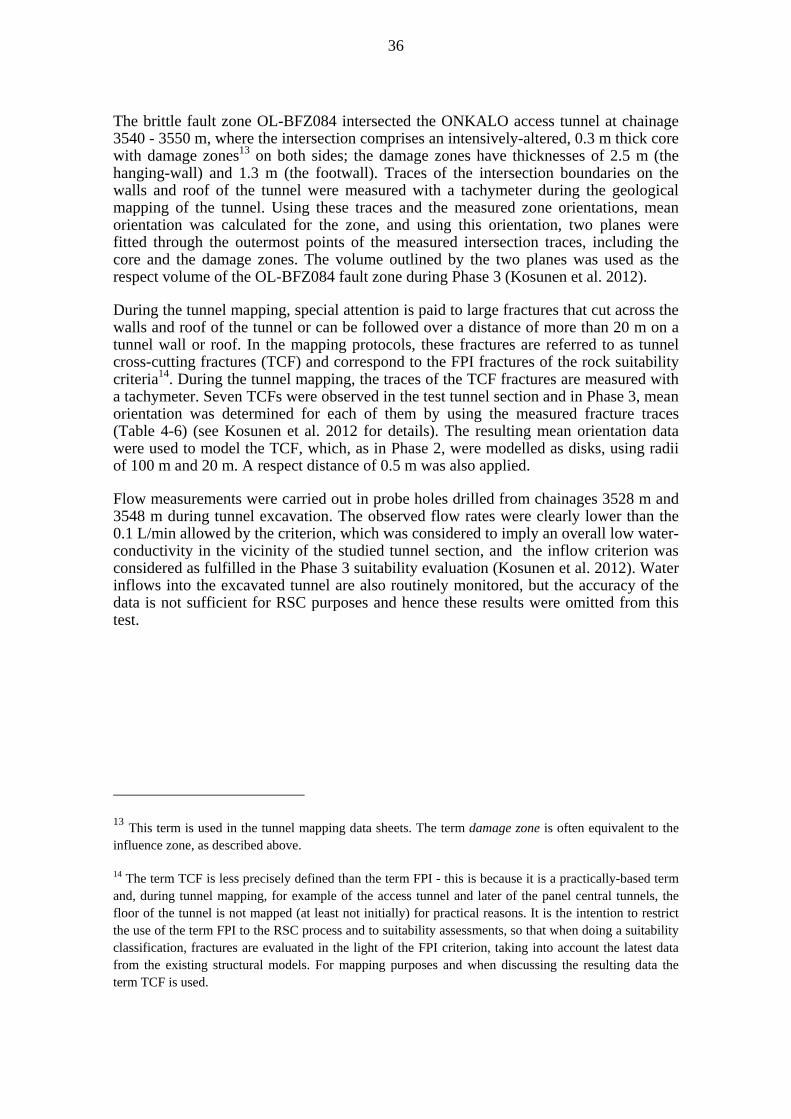
36
The brittle fault zone OL-BFZ084 intersected the ONKALO access tunnel at chainage 3540 - 3550 m, where the intersection comprises an intensively-altered, 0.3 m thick core with damage zones13 on both sides; the damage zones have thicknesses of 2.5 m (the hanging-wall) and 1.3 m (the footwall). Traces of the intersection boundaries on the walls and roof of the tunnel were measured with a tachymeter during the geological mapping of the tunnel. Using these traces and the measured zone orientations, mean orientation was calculated for the zone, and using this orientation, two planes were fitted through the outermost points of the measured intersection traces, including the core and the damage zones. The volume outlined by the two planes was used as the respect volume of the OL-BFZ084 fault zone during Phase 3 (Kosunen et al. 2012).
During the tunnel mapping, special attention is paid to large fractures that cut across the walls and roof of the tunnel or can be followed over a distance of more than 20 m on a tunnel wall or roof. In the mapping protocols, these fractures are referred to as tunnel cross-cutting fractures (TCF) and correspond to the FPI fractures of the rock suitability criteria14. During the tunnel mapping, the traces of the TCF fractures are measured with a tachymeter. Seven TCFs were observed in the test tunnel section and in Phase 3, mean orientation was determined for each of them by using the measured fracture traces (Table 4-6) (see Kosunen et al. 2012 for details). The resulting mean orientation data were used to model the TCF, which, as in Phase 2, were modelled as disks, using radii of 100 m and 20 m. A respect distance of 0.5 m was also applied.
Flow measurements were carried out in probe holes drilled from chainages 3528 m and 3548 m during tunnel excavation. The observed flow rates were clearly lower than the 0.1 L/min allowed by the criterion, which was considered to imply an overall low water-conductivity in the vicinity of the studied tunnel section, and the inflow criterion was considered as fulfilled in the Phase 3 suitability evaluation (Kosunen et al. 2012). Water inflows into the excavated tunnel are also routinely monitored, but the accuracy of the data is not sufficient for RSC purposes and hence these results were omitted from this test.
13 This term is used in the tunnel mapping data sheets. The term damage zone is often equivalent to the influence zone, as described above.
14 The term TCF is less precisely defined than the term FPI - this is because it is a practically-based term and, during tunnel mapping, for example of the access tunnel and later of the panel central tunnels, the floor of the tunnel is not mapped (at least not initially) for practical reasons. It is the intention to restrict the use of the term FPI to the RSC process and to suitability assessments, so that when doing a suitability classification, fractures are evaluated in the light of the FPI criterion, taking into account the latest data from the existing structural models. For mapping purposes and when discussing the resulting data the term TCF is used.

37
Table 4-6 Tunnel cross-cutting fractures (TCF) in the ONKALO access tunnel chainage 3459-3639 m. Pilot hole depth is determined graphically by using the measured fracture traces. Modified from Kosunen et al. (2012).
TCF number
Location Mean orientation
Chainage (m)
Pilot hole depth (m)
Dip direction (°)
Dip (°)
P346 3468 11.15 257 68
P347 3484 24.75 286 81
P348 3492 33.1 287 79
P349 3498 39.2 286 83
P350 3510 53.6 151 53
P351 3540 81.4 180 51
P352 3560 105 108 25
4.3.3 Test results
This Section summarises the results of the suitability classifications and the related discussion by Kosunen et al. (2012).
The most optimistic estimate of the amount of usable tunnel length is gained in Phase 1, where 72.4% of the studied tunnel length is classified as possibly suitable for placing deposition holes (Table 4-7). This is not surprising, as the estimate was carried out by using the geological prediction based on the GSM v1.0, which only contained information on the large-scale bedrock features, thus lacking a large part of the relevant data (Figure 4-3) (Kosunen et al. 2012).
According to the pilot hole data (Phase 2), either 37.9 or 61.7% of the studied tunnel section was classified as possibly suitable, depending on the size (disk radius) selected for the FPI fractures (100 m and 20 m, respectively; Table 4-7). The notable difference between the two cases is due to a single, gently dipping FPI, which makes a large part of the tunnel section not suitable when the 100 m radius is used (Chart 2a in Figure 4-3. According to Kosunen et al. (2012), this clearly illustrates the importance of defining a reasonable size for modelling the FPI fractures of unknown dimensions in the context of RSC: if the FPIs are modelled as far more extensive than most of them probably are - so as to be conservative (the 100 m radius used in this test) - it is very probable that space will be lost unnecessarily, especially as in the case of gently dipping, nearly horizontal fractures. It would, of course, be ideal if the dimensions of an FPI could be constrained, but in many cases it may not be possible.
Comparing the results from Phase 3 with those of Phase 2 (Figure 4-3) it is quite evident that the simple approach taken to selecting possible FPIs from the pilot hole data is inadequate: out of the eight fractures presumed to be FPIs, only three actually turned out to be such (TCF) on the basis of tunnel mapping data (Table 4-8; Kosunen et al. 2012). In addition to incorrectly predicting five FPI fractures, four TCF were not picked from the pilot hole data, as they were neither slickensided nor grain-filled.

38
Because of this, the distribution of the possibly suitable tunnel sections predicted in Phase 2 differs clearly from their distribution in Phase 3 (Figure 4-3). The larger features do not pose a similar problem - according to the pilot hole data, brittle fault zone OL-BFZ024 does not continue into the studied rock volume, whereas OL-BFZ084 is found close to its predicted location, and both of these facts are confirmed by the tunnel observations. Thus there is consistency between the suitability estimates regarding the large features (Figure 4-3).
Table 4-7. Total length (in metres) of the possibly suitable (TUNps, Phases 1 and 2) or suitable (TUNs, Phase 3) and not suitable (TUNns) tunnel sections, and percentage of the possibly suitable tunnel sections of the total length of the test tunnel section. From Kosunen et al. (2012).
Therefore, Kosunen et al. (2012) conclude that the suitability estimate based on a pilot hole, prior to tunnel excavation, is reliable with regard to the large bedrock features, such as brittle fault zones, but significant uncertainties exist with regard to the FPI. This is a potential problem, as the decision to excavate a specific deposition tunnel will largely depend on the suitability assessment made on the basis of pilot hole data, and the FPI can have a notable effect on the degree of utilisation of the tunnel. For example, without the FPIs, about 90.6 % of the length of the tested tunnel section would be classified as possibly suitable on the basis of the tunnel data, whereas, in reality, the percentage is much lower, around 65 to 70 % (see Table 4-7). This highlights the need to improve the interpretation of pilot hole data and, also, the need to develop a more detailed geological structure model to support data interpretation and suitability assessment (Kosunen et al. 2012).
TUNps / TUNs (m)
TUNns (m) TUNps / TUNs (%)
Phase 1 130.3 49.7 72.4
Phase 2
FPI 100 m 68.3 117.7 37.9
FPI 20 m 111.1 68.9 61.7
Phase 3
FPI 100 m 117.7 62.3 65.4
FPI 20 m 125.1 54.9 69.5
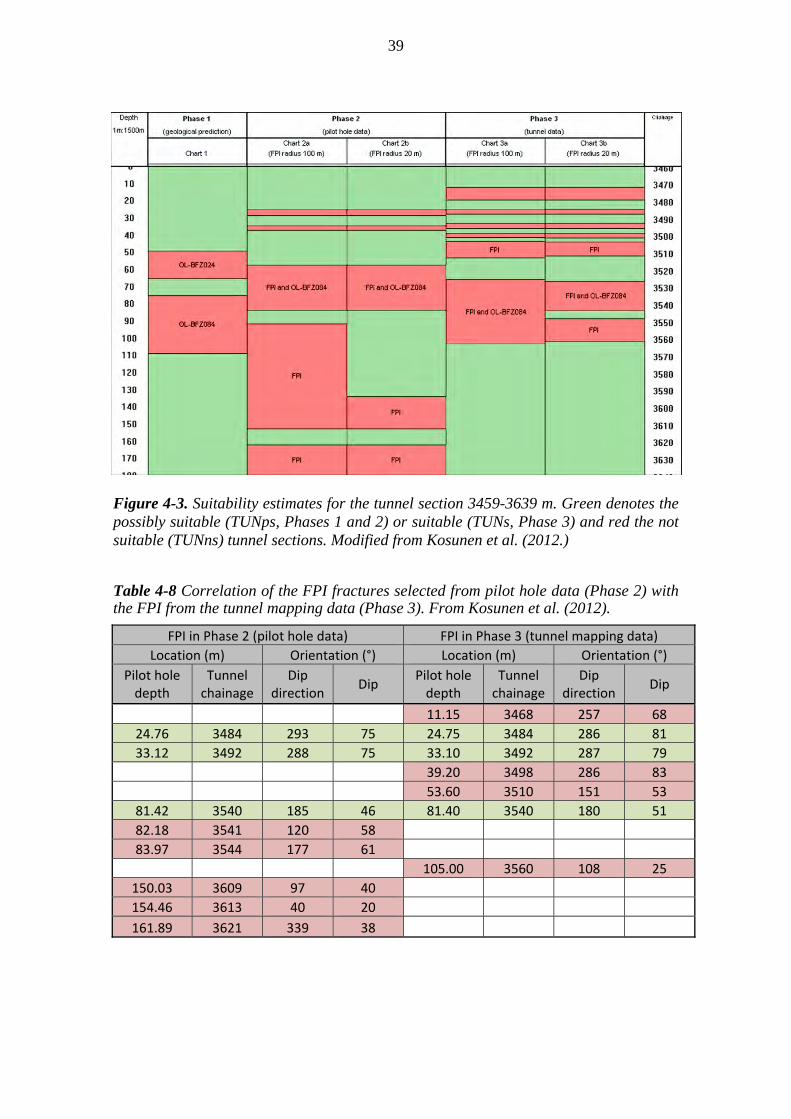
39
Figure 4-3. Suitability estimates for the tunnel section 3459-3639 m. Green denotes the possibly suitable (TUNps, Phases 1 and 2) or suitable (TUNs, Phase 3) and red the not suitable (TUNns) tunnel sections. Modified from Kosunen et al. (2012.)
Table 4-8 Correlation of the FPI fractures selected from pilot hole data (Phase 2) with the FPI from the tunnel mapping data (Phase 3). From Kosunen et al. (2012).
FPI in Phase 2 (pilot hole data) FPI in Phase 3 (tunnel mapping data)
Location (m) Orientation (°) Location (m) Orientation (°)
Pilot hole depth
Tunnel chainage
Dip direction
Dip Pilot hole depth
Tunnel chainage
Dip direction
Dip
11.15 3468 257 68
24.76 3484 293 75 24.75 3484 286 81
33.12 3492 288 75 33.10 3492 287 79
39.20 3498 286 83
53.60 3510 151 53
81.42 3540 185 46 81.40 3540 180 51
82.18 3541 120 58
83.97 3544 177 61
105.00 3560 108 25
150.03 3609 97 40
154.46 3613 40 20
161.89 3621 339 38

40
Kosunen et al. (2012) suggest that the class tunnel not suitable (TUNns) be replaced with a class tunnel possibly not suitable, TUNpns, to be used in classifications carried out prior to the excavation of a tunnel. This would accentuate the preliminary nature of those suitability assessments and the fact that a tunnel section classified as not suitable, for example after pilot hole drilling, could prove to be suitable after the tunnel has been excavated.
Kosunen et al. (2012) also discuss the following aspects of the preliminary (RSC-I) criteria and their application, as well as the data used and the methodology employed in the test:
discrepancies in the formulation of the RSC-I preliminary criteria and in the ideas of their practical application presented in Hellä et al. (2009),
correlation of flow results from pilot and probe holes with water inflows to an excavated tunnel and
the need for investigation method development.
4.3.4 Test conclusions
Kosunen et al. (2012) made the following conclusions and recommendations for further development of the RSC:
The criteria need to be formulated so that they are unambiguous, with no room left for misinterpretation.
At the tunnel scale, all deposition hole scale criteria should be taken into account, not just the FPIs. It is suggested that a statement along the lines of: “However, deposition hole scale criteria need to be taken into account in the determination of the degree of utilisation and in locating tunnel sections suitable for deposition hole placement” be included in the tunnel scale criteria.
More detailed instructions on the practical application of the criteria need to be developed; an important issue is the definition of the geological and hydrogeological influence zones and their determination in practice.
In the future, structure (zone or fracture) -specific inflows need to be measured in the excavated tunnels, where rock suitability classification is required. This will likely require method development.
A computer program with a practical user interface will have to be developed for calculating tunnel suitability on the basis of the RSC-relevant parameters.
In order to decide on the placement of the individual deposition tunnels and deposition holes, the resolution of the geological site model (GSM v1.0) proved to be inadequate, and a more detailed geological structure model is needed for that purpose. The model should provide information on at least those bedrock features that are relevant in the practical application of the rock suitability criteria: brittle fault zones, large fractures (FPI) and hydraulically-conductive features.
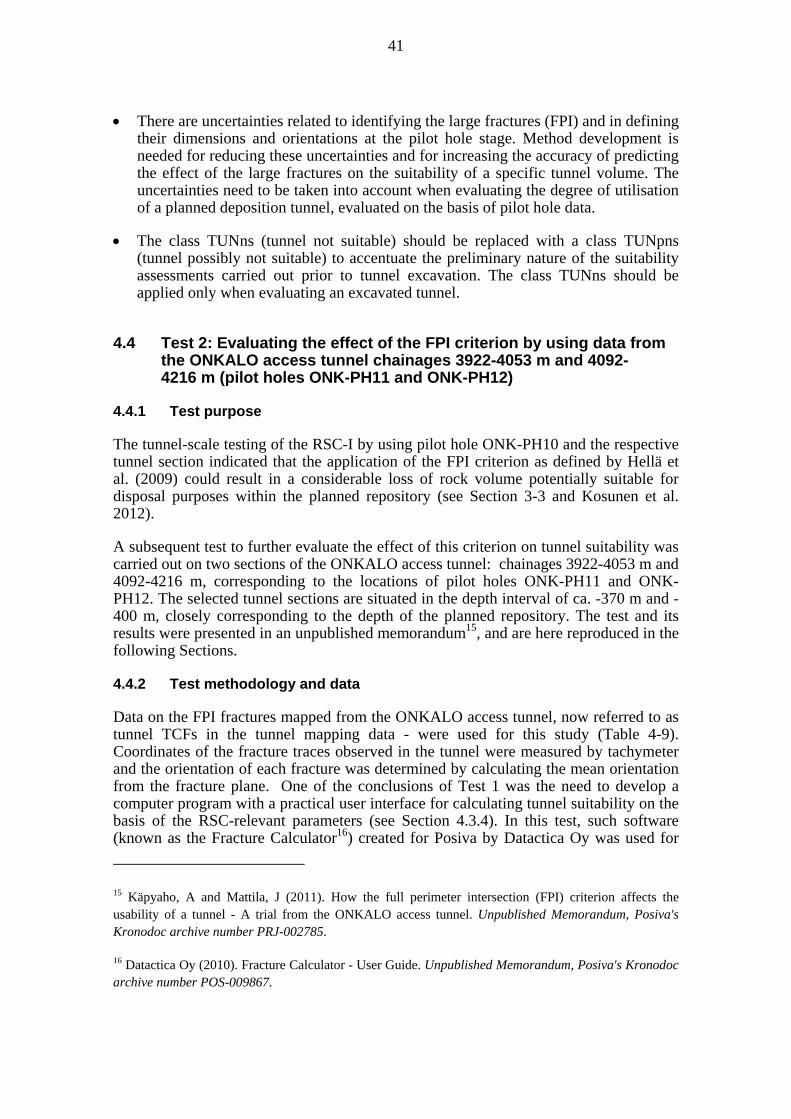
41
There are uncertainties related to identifying the large fractures (FPI) and in defining their dimensions and orientations at the pilot hole stage. Method development is needed for reducing these uncertainties and for increasing the accuracy of predicting the effect of the large fractures on the suitability of a specific tunnel volume. The uncertainties need to be taken into account when evaluating the degree of utilisation of a planned deposition tunnel, evaluated on the basis of pilot hole data.
The class TUNns (tunnel not suitable) should be replaced with a class TUNpns (tunnel possibly not suitable) to accentuate the preliminary nature of the suitability assessments carried out prior to tunnel excavation. The class TUNns should be applied only when evaluating an excavated tunnel.
4.4 Test 2: Evaluating the effect of the FPI criterion by using data from the ONKALO access tunnel chainages 3922-4053 m and 4092- 4216 m (pilot holes ONK-PH11 and ONK-PH12)
4.4.1 Test purpose
The tunnel-scale testing of the RSC-I by using pilot hole ONK-PH10 and the respective tunnel section indicated that the application of the FPI criterion as defined by Hellä et al. (2009) could result in a considerable loss of rock volume potentially suitable for disposal purposes within the planned repository (see Section 3-3 and Kosunen et al. 2012).
A subsequent test to further evaluate the effect of this criterion on tunnel suitability was carried out on two sections of the ONKALO access tunnel: chainages 3922-4053 m and 4092-4216 m, corresponding to the locations of pilot holes ONK-PH11 and ONK-PH12. The selected tunnel sections are situated in the depth interval of ca. -370 m and -400 m, closely corresponding to the depth of the planned repository. The test and its results were presented in an unpublished memorandum15, and are here reproduced in the following Sections.
4.4.2 Test methodology and data
Data on the FPI fractures mapped from the ONKALO access tunnel, now referred to as tunnel TCFs in the tunnel mapping data - were used for this study (Table 4-9). Coordinates of the fracture traces observed in the tunnel were measured by tachymeter and the orientation of each fracture was determined by calculating the mean orientation from the fracture plane. One of the conclusions of Test 1 was the need to develop a computer program with a practical user interface for calculating tunnel suitability on the basis of the RSC-relevant parameters (see Section 4.3.4). In this test, such software (known as the Fracture Calculator16) created for Posiva by Datactica Oy was used for
15 Käpyaho, A and Mattila, J (2011). How the full perimeter intersection (FPI) criterion affects the usability of a tunnel - A trial from the ONKALO access tunnel. Unpublished Memorandum, Posiva's Kronodoc archive number PRJ-002785.
16 Datactica Oy (2010). Fracture Calculator - User Guide. Unpublished Memorandum, Posiva's Kronodoc archive number POS-009867.
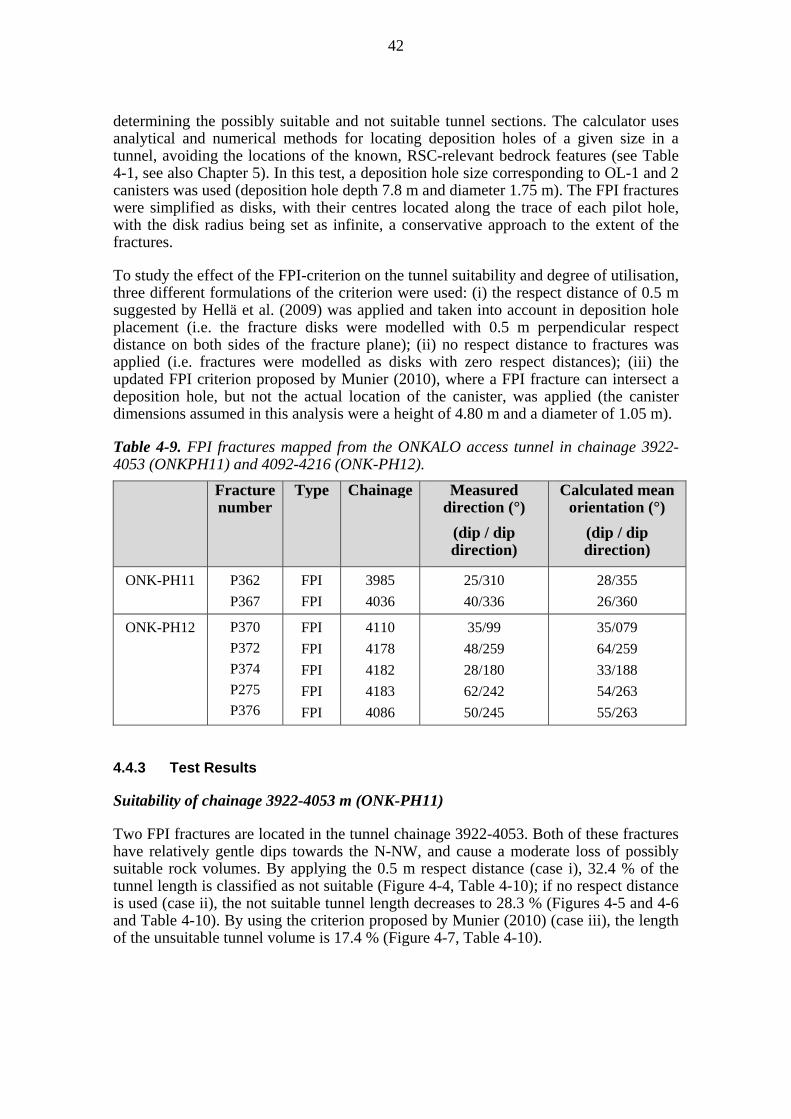
42
determining the possibly suitable and not suitable tunnel sections. The calculator uses analytical and numerical methods for locating deposition holes of a given size in a tunnel, avoiding the locations of the known, RSC-relevant bedrock features (see Table 4-1, see also Chapter 5). In this test, a deposition hole size corresponding to OL-1 and 2 canisters was used (deposition hole depth 7.8 m and diameter 1.75 m). The FPI fractures were simplified as disks, with their centres located along the trace of each pilot hole, with the disk radius being set as infinite, a conservative approach to the extent of the fractures.
To study the effect of the FPI-criterion on the tunnel suitability and degree of utilisation, three different formulations of the criterion were used: (i) the respect distance of 0.5 m suggested by Hellä et al. (2009) was applied and taken into account in deposition hole placement (i.e. the fracture disks were modelled with 0.5 m perpendicular respect distance on both sides of the fracture plane); (ii) no respect distance to fractures was applied (i.e. fractures were modelled as disks with zero respect distances); (iii) the updated FPI criterion proposed by Munier (2010), where a FPI fracture can intersect a deposition hole, but not the actual location of the canister, was applied (the canister dimensions assumed in this analysis were a height of 4.80 m and a diameter of 1.05 m).
Table 4-9. FPI fractures mapped from the ONKALO access tunnel in chainage 3922-4053 (ONKPH11) and 4092-4216 (ONK-PH12).
Fracture number
Type Chainage Measured direction (°)
(dip / dip direction)
Calculated mean orientation (°)
(dip / dip direction)
ONK-PH11 P362
P367
FPI
FPI
3985
4036
25/310
40/336
28/355
26/360
ONK-PH12 P370
P372
P374
P275
P376
FPI
FPI
FPI
FPI
FPI
4110
4178
4182
4183
4086
35/99
48/259
28/180
62/242
50/245
35/079
64/259
33/188
54/263
55/263
4.4.3 Test Results
Suitability of chainage 3922-4053 m (ONK-PH11)
Two FPI fractures are located in the tunnel chainage 3922-4053. Both of these fractures have relatively gentle dips towards the N-NW, and cause a moderate loss of possibly suitable rock volumes. By applying the 0.5 m respect distance (case i), 32.4 % of the tunnel length is classified as not suitable (Figure 4-4, Table 4-10); if no respect distance is used (case ii), the not suitable tunnel length decreases to 28.3 % (Figures 4-5 and 4-6 and Table 4-10). By using the criterion proposed by Munier (2010) (case iii), the length of the unsuitable tunnel volume is 17.4 % (Figure 4-7, Table 4-10).
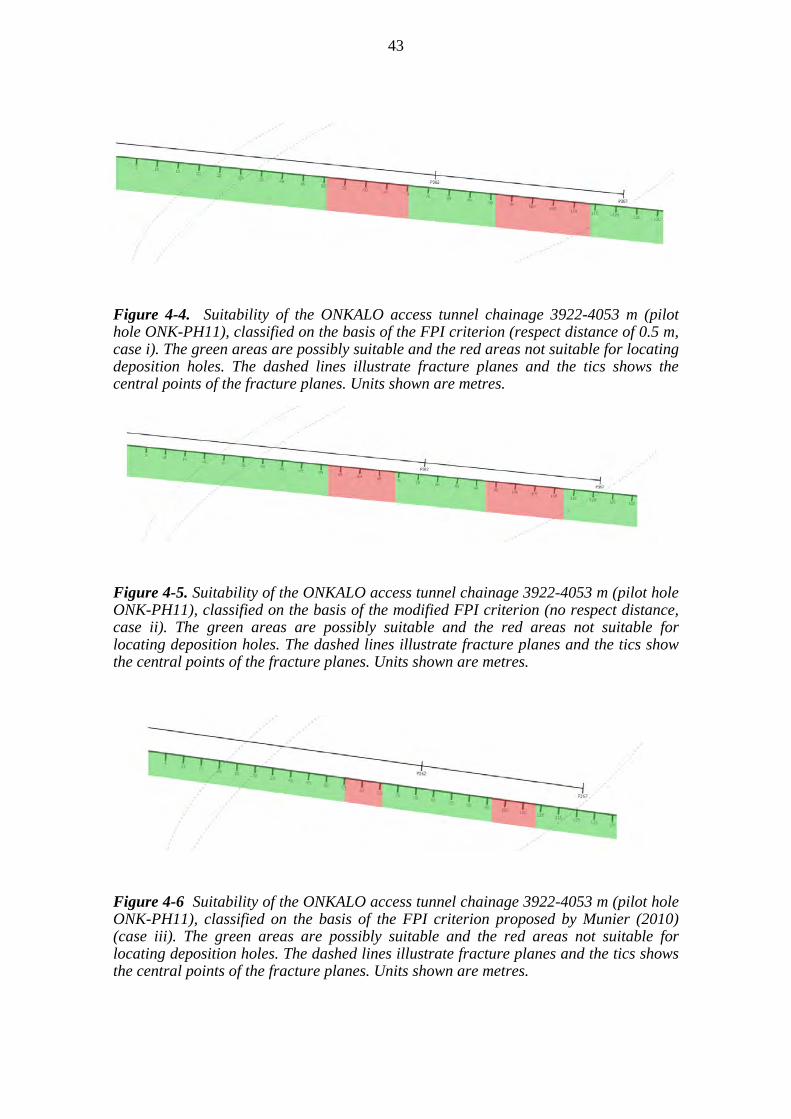
43
Figure 4-4. Suitability of the ONKALO access tunnel chainage 3922-4053 m (pilot hole ONK-PH11), classified on the basis of the FPI criterion (respect distance of 0.5 m, case i). The green areas are possibly suitable and the red areas not suitable for locating deposition holes. The dashed lines illustrate fracture planes and the tics shows the central points of the fracture planes. Units shown are metres.
Figure 4-5. Suitability of the ONKALO access tunnel chainage 3922-4053 m (pilot hole ONK-PH11), classified on the basis of the modified FPI criterion (no respect distance, case ii). The green areas are possibly suitable and the red areas not suitable for locating deposition holes. The dashed lines illustrate fracture planes and the tics show the central points of the fracture planes. Units shown are metres.
Figure 4-6 Suitability of the ONKALO access tunnel chainage 3922-4053 m (pilot hole ONK-PH11), classified on the basis of the FPI criterion proposed by Munier (2010) (case iii). The green areas are possibly suitable and the red areas not suitable for locating deposition holes. The dashed lines illustrate fracture planes and the tics shows the central points of the fracture planes. Units shown are metres.
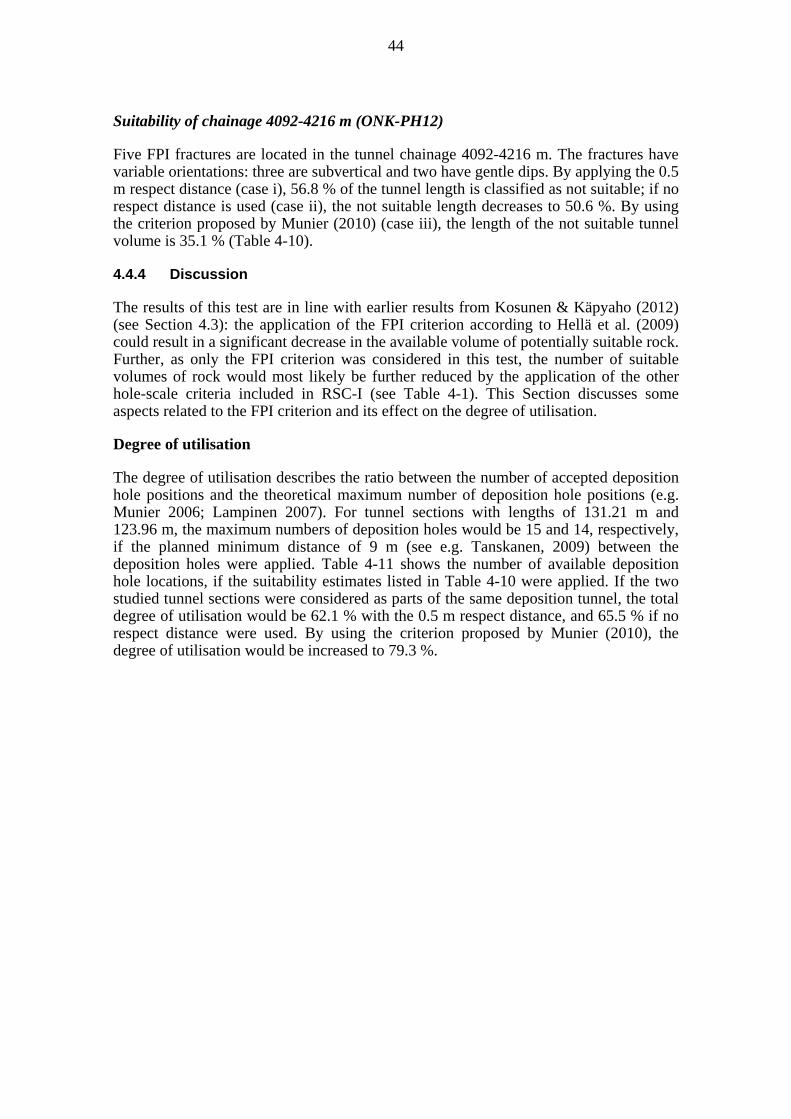
44
Suitability of chainage 4092-4216 m (ONK-PH12)
Five FPI fractures are located in the tunnel chainage 4092-4216 m. The fractures have variable orientations: three are subvertical and two have gentle dips. By applying the 0.5 m respect distance (case i), 56.8 % of the tunnel length is classified as not suitable; if no respect distance is used (case ii), the not suitable length decreases to 50.6 %. By using the criterion proposed by Munier (2010) (case iii), the length of the not suitable tunnel volume is 35.1 % (Table 4-10).
4.4.4 Discussion
The results of this test are in line with earlier results from Kosunen & Käpyaho (2012) (see Section 4.3): the application of the FPI criterion according to Hellä et al. (2009) could result in a significant decrease in the available volume of potentially suitable rock. Further, as only the FPI criterion was considered in this test, the number of suitable volumes of rock would most likely be further reduced by the application of the other hole-scale criteria included in RSC-I (see Table 4-1). This Section discusses some aspects related to the FPI criterion and its effect on the degree of utilisation.
Degree of utilisation
The degree of utilisation describes the ratio between the number of accepted deposition hole positions and the theoretical maximum number of deposition hole positions (e.g. Munier 2006; Lampinen 2007). For tunnel sections with lengths of 131.21 m and 123.96 m, the maximum numbers of deposition holes would be 15 and 14, respectively, if the planned minimum distance of 9 m (see e.g. Tanskanen, 2009) between the deposition holes were applied. Table 4-11 shows the number of available deposition hole locations, if the suitability estimates listed in Table 4-10 were applied. If the two studied tunnel sections were considered as parts of the same deposition tunnel, the total degree of utilisation would be 62.1 % with the 0.5 m respect distance, and 65.5 % if no respect distance were used. By using the criterion proposed by Munier (2010), the degree of utilisation would be increased to 79.3 %.

45
Table 4-10. Suitability of the ONKALO tunnel chainages 3922-4053 and 4092-4216 m, corresponding to pilot holes ONK-PH11 and ONK-PH12, respectively.
0.00 - 50.46 (ps) ps - 88.76 m (67.6%)50.46 - 70.14 (ns) ns - 42.45 m (32.4%)70.14 - 91.01 (ps)91.01 - 113.78 (ns)113.78 - 131.21 (ps)0.00 - 51.70 (ps) ps - 94.02 m (71.7%)51.70 - 68.91 (ns) ns - 37.19 m (28.3%)68.91 - 92.41 (ps)92.41 - 112.39 (ns)112.39 - 131.21 (ps)0.00 - 55.01 (ps) ps - 108.33 m (82.6%)55.01 - 65.60 (ns) ns - 22.88 m (17.4%)65.60 - 96.25 (ps)96.25 - 108.54 (ns)108.54 - 131.21 (ps)0.00 - 39.06 (ps) ps - 53.56 m (43.2%)39.06 - 65.98 (ns) ns - 70.4 m (56.8%)65.98 - 78.41 (ps)78.41 - 94.09 (ns)94.09 - 96.16 (ps)96.16 - 123.96 (ns)0.00 - 40.77 (ps) ps - 61.22 m (49.4%)40.77 - 64.27 (ns) ns - 62.74 m (50.6%)64.27 - 79.20 (ps)79.20 - 93.30 (ns)93.30 - 98.82 (ps)98.82 - 123.96 (ns)0.00 - 45.41 (ps) ps - 80.5 m (64.9%)45.41 - 59.85 (ns) ns - 43.46 m (35.1%)59.85 - 80.37 (ps)80.37 - 91.80 (ns) 91.80 - 106.37 (ps)106.37 - 123.96 (ns)
Length of tunnel (m) Possibly suitable (ps) Not suitable (ns)
3922-4053 m (ONK-PH11)
Respect distance 0.5 m (case i)
No respect distance (case ii)
Munier (2010) (case iii)
Respect distance 0.5 m (case i)
No respect distance (case ii)
4092-4216 m (ONK-PH12)
Munier (2010) (case iii)
Chainage CriterionLocation in tunnel (m) Possibly suitable (ps) Not suitable (ns)
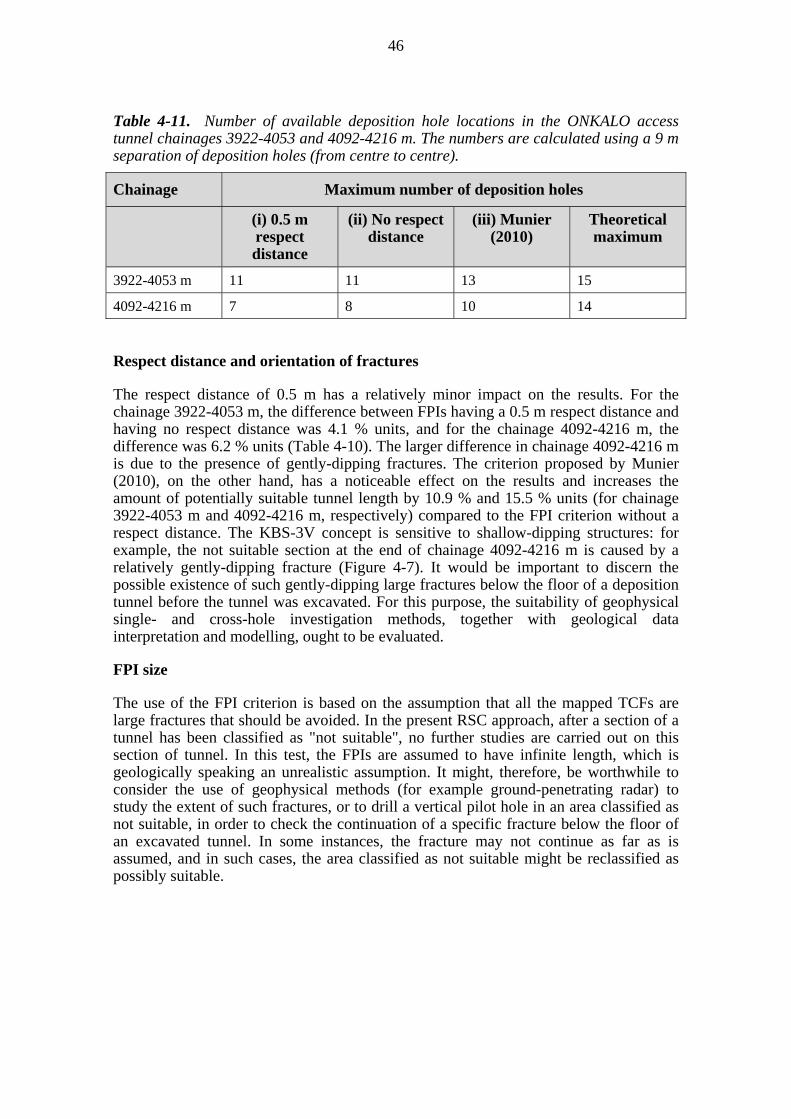
46
Table 4-11. Number of available deposition hole locations in the ONKALO access tunnel chainages 3922-4053 and 4092-4216 m. The numbers are calculated using a 9 m separation of deposition holes (from centre to centre).
Chainage Maximum number of deposition holes
(i) 0.5 m respect distance
(ii) No respect distance
(iii) Munier (2010)
Theoretical maximum
3922-4053 m 11 11 13 15
4092-4216 m 7 8 10 14
Respect distance and orientation of fractures
The respect distance of 0.5 m has a relatively minor impact on the results. For the chainage 3922-4053 m, the difference between FPIs having a 0.5 m respect distance and having no respect distance was 4.1 % units, and for the chainage 4092-4216 m, the difference was 6.2 % units (Table 4-10). The larger difference in chainage 4092-4216 m is due to the presence of gently-dipping fractures. The criterion proposed by Munier (2010), on the other hand, has a noticeable effect on the results and increases the amount of potentially suitable tunnel length by 10.9 % and 15.5 % units (for chainage 3922-4053 m and 4092-4216 m, respectively) compared to the FPI criterion without a respect distance. The KBS-3V concept is sensitive to shallow-dipping structures: for example, the not suitable section at the end of chainage 4092-4216 m is caused by a relatively gently-dipping fracture (Figure 4-7). It would be important to discern the possible existence of such gently-dipping large fractures below the floor of a deposition tunnel before the tunnel was excavated. For this purpose, the suitability of geophysical single- and cross-hole investigation methods, together with geological data interpretation and modelling, ought to be evaluated.
FPI size
The use of the FPI criterion is based on the assumption that all the mapped TCFs are large fractures that should be avoided. In the present RSC approach, after a section of a tunnel has been classified as "not suitable", no further studies are carried out on this section of tunnel. In this test, the FPIs are assumed to have infinite length, which is geologically speaking an unrealistic assumption. It might, therefore, be worthwhile to consider the use of geophysical methods (for example ground-penetrating radar) to study the extent of such fractures, or to drill a vertical pilot hole in an area classified as not suitable, in order to check the continuation of a specific fracture below the floor of an excavated tunnel. In some instances, the fracture may not continue as far as is assumed, and in such cases, the area classified as not suitable might be reclassified as possibly suitable.
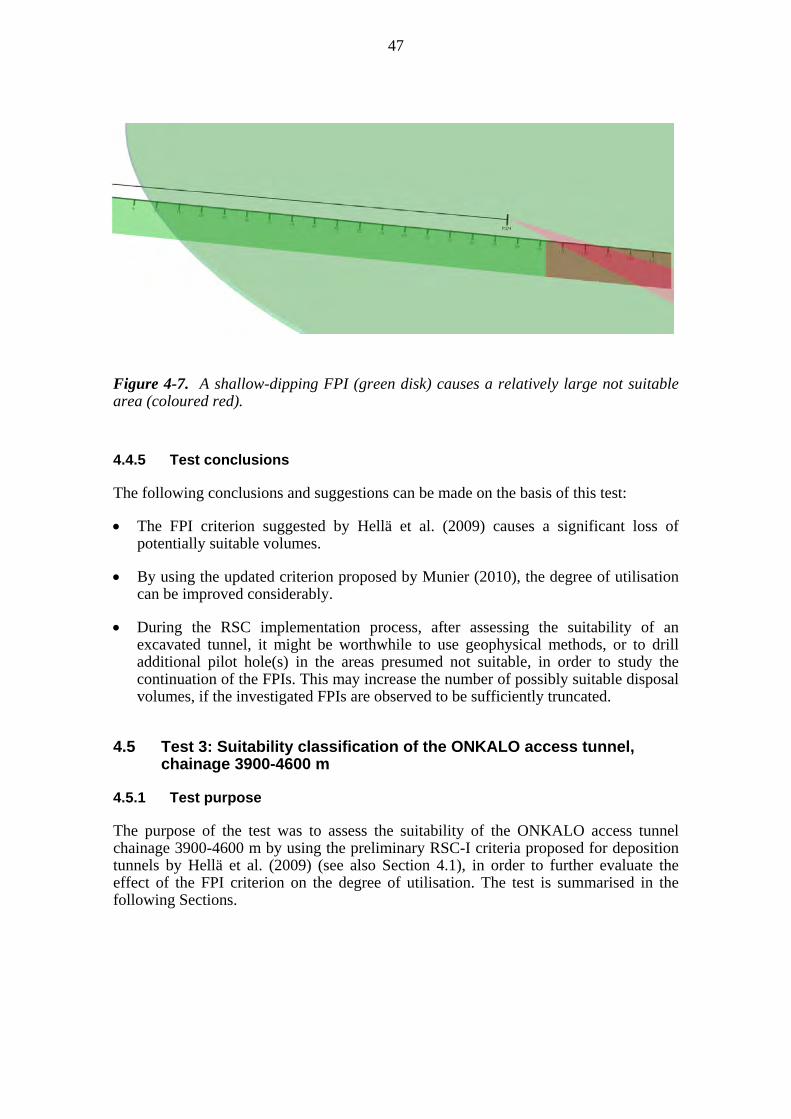
47
Figure 4-7. A shallow-dipping FPI (green disk) causes a relatively large not suitable area (coloured red).
4.4.5 Test conclusions
The following conclusions and suggestions can be made on the basis of this test:
The FPI criterion suggested by Hellä et al. (2009) causes a significant loss of potentially suitable volumes.
By using the updated criterion proposed by Munier (2010), the degree of utilisation can be improved considerably.
During the RSC implementation process, after assessing the suitability of an excavated tunnel, it might be worthwhile to use geophysical methods, or to drill additional pilot hole(s) in the areas presumed not suitable, in order to study the continuation of the FPIs. This may increase the number of possibly suitable disposal volumes, if the investigated FPIs are observed to be sufficiently truncated.
4.5 Test 3: Suitability classification of the ONKALO access tunnel, chainage 3900-4600 m
4.5.1 Test purpose
The purpose of the test was to assess the suitability of the ONKALO access tunnel chainage 3900-4600 m by using the preliminary RSC-I criteria proposed for deposition tunnels by Hellä et al. (2009) (see also Section 4.1), in order to further evaluate the effect of the FPI criterion on the degree of utilisation. The test is summarised in the following Sections.

48
4.5.2 Test procedure and data
In the test, each tunnel section was classified either as possibly suitable or not suitable, based on the available data, which included mapping data from the specific access tunnel section and the pilot holes ONK-PH11-15. The study focused on the "excavated tunnel" phase classification and, hence, did not proceed according to the full classification procedure, as described in Hellä et al. (2009). The pilot hole data were used to estimate inflows into the tunnel, whereas tunnel data were used to locate brittle fault zones and large fractures (FPI in RSC-I criteria; TCF in tunnel mapping) at the studied tunnel section. In the suitability classification, possibly suitable tunnel sections were defined with the aid of Posiva's Fracture Calculator software tool (see Section 4.4.2 footnote 14). The software uses numerical methods to rule out such locations within tunnel sections that are unsuitable for the boring of deposition holes, when given the location and sizes of fractures as an input. Output of the results is presented both as diagrams and in numerical form.
The pilot hole data flow logs from the investigated tunnel section did not indicate any potential inflows over 0.1 L/min and, consequently, only brittle deformation zones and large fractures needed to be considered in the classification. Large fractures located inside the influence zone of a brittle deformation zone could also be disregarded, as the deformation zones are taken into account in the classification procedure as a whole. A total of 4 deformation zones and 13 TCFs (outside deformation zones) intersect chainage 3900-4600 m and these are listed in Table 4-12. The chainage value given in the table is the location where the feature in question cut an imaginary pilot hole at the centre of the tunnel floor. The orientation of each fracture was determined by calculating the mean orientation from the fracture trace measured from the tunnel. For the sizes of the brittle deformation zones, the maximal radius given in the geological site model is used, but for features with unknown radius, such as a large fracture, a standard 25 m radius was applied. The influence zone was used as the respect distance for the deformation zones. A respect distance of 0.5 m is additionally applied to the large fractures, as suggested by Hellä et al. (2009).
4.5.3 Test results
Due to limitations of the Fracture Calculator program, the effect of brittle deformation zones and FPI fractures was analysed separately, and their combined effect on the suitability ratio of the investigated tunnel section was calculated from the results. Due to the presence of brittle fault zones, 227.2 m of the studied 700 m long tunnel section, or 32.5 % of the tunnel length was classified as not suitable for deposition hole placement. Taking into account only the large fractures, 105.4 m (15.1 %) of the tunnel was determined as not suitable. When the two results were combined, a total of 233.0 m of the tunnel was classified as not suitable, resulting in 66.7% tunnel suitability, due to clustering of the large fractures and overlap of the unsuitable tunnel sections caused by the brittle fault zones and the TCFs.
As a general rule, the deposition holes need to be placed with a minimum of spacing of 9 m and, therefore, short sections classified as not suitable will not have effect on the total deposition hole capacity of a tunnel, if located in the required spaces between the deposition holes. The theoretical maximum deposition hole capacity of a 700 m tunnel section is 78. The test in chainage 3900-4600 m resulted in a capacity of 58 deposition holes, which is 70.5 % of the theoretical maximum. The results of the test are listed in Table 4-13 and visualised in Figure 4-8.
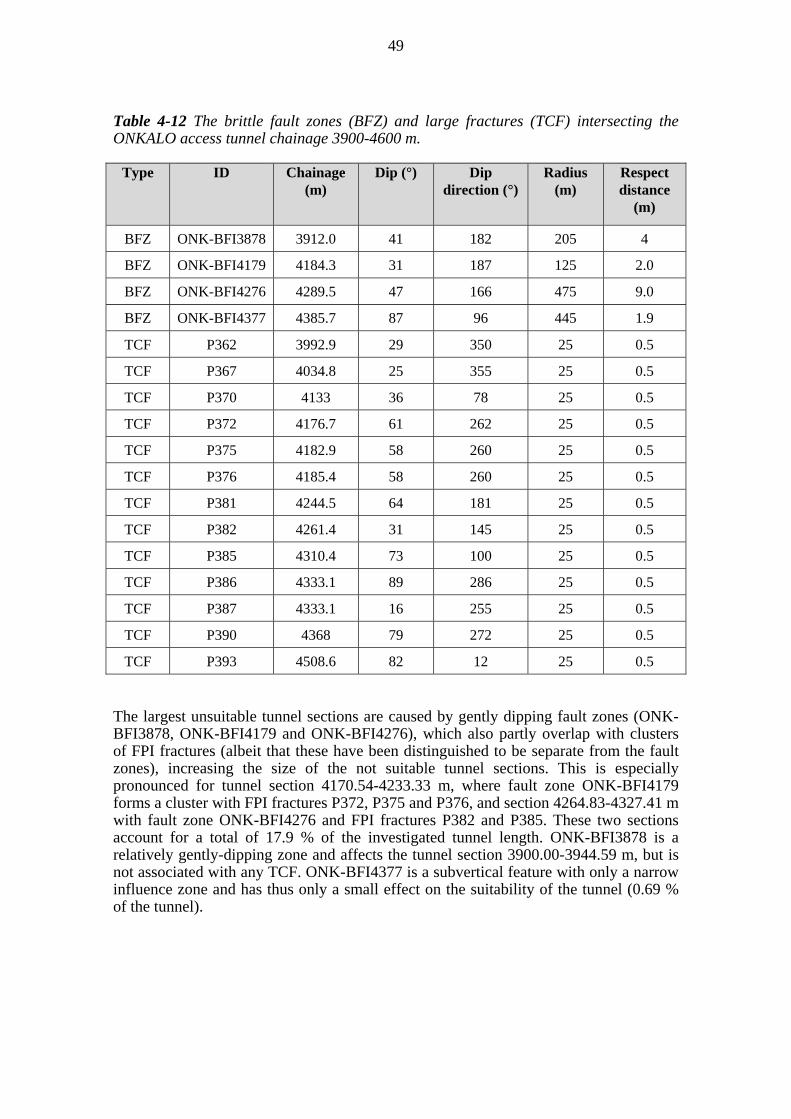
49
Table 4-12 The brittle fault zones (BFZ) and large fractures (TCF) intersecting the ONKALO access tunnel chainage 3900-4600 m.
Type ID Chainage (m)
Dip (°) Dip direction (°)
Radius (m)
Respect distance
(m)
BFZ ONK-BFI3878 3912.0 41 182 205 4
BFZ ONK-BFI4179 4184.3 31 187 125 2.0
BFZ ONK-BFI4276 4289.5 47 166 475 9.0
BFZ ONK-BFI4377 4385.7 87 96 445 1.9
TCF P362 3992.9 29 350 25 0.5
TCF P367 4034.8 25 355 25 0.5
TCF P370 4133 36 78 25 0.5
TCF P372 4176.7 61 262 25 0.5
TCF P375 4182.9 58 260 25 0.5
TCF P376 4185.4 58 260 25 0.5
TCF P381 4244.5 64 181 25 0.5
TCF P382 4261.4 31 145 25 0.5
TCF P385 4310.4 73 100 25 0.5
TCF P386 4333.1 89 286 25 0.5
TCF P387 4333.1 16 255 25 0.5
TCF P390 4368 79 272 25 0.5
TCF P393 4508.6 82 12 25 0.5
The largest unsuitable tunnel sections are caused by gently dipping fault zones (ONK-BFI3878, ONK-BFI4179 and ONK-BFI4276), which also partly overlap with clusters of FPI fractures (albeit that these have been distinguished to be separate from the fault zones), increasing the size of the not suitable tunnel sections. This is especially pronounced for tunnel section 4170.54-4233.33 m, where fault zone ONK-BFI4179 forms a cluster with FPI fractures P372, P375 and P376, and section 4264.83-4327.41 m with fault zone ONK-BFI4276 and FPI fractures P382 and P385. These two sections account for a total of 17.9 % of the investigated tunnel length. ONK-BFI3878 is a relatively gently-dipping zone and affects the tunnel section 3900.00-3944.59 m, but is not associated with any TCF. ONK-BFI4377 is a subvertical feature with only a narrow influence zone and has thus only a small effect on the suitability of the tunnel (0.69 % of the tunnel).
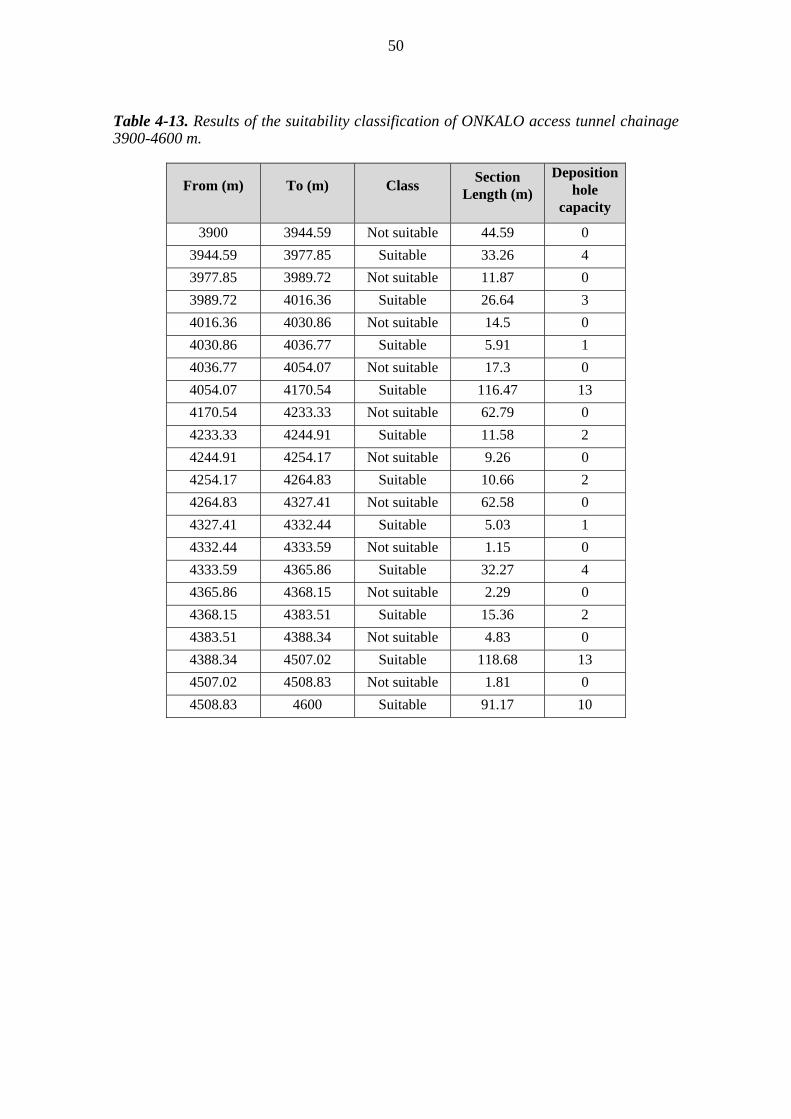
50
Table 4-13. Results of the suitability classification of ONKALO access tunnel chainage 3900-4600 m.
From (m) To (m) Class Section
Length (m)
Deposition hole
capacity
3900 3944.59 Not suitable 44.59 0
3944.59 3977.85 Suitable 33.26 4
3977.85 3989.72 Not suitable 11.87 0
3989.72 4016.36 Suitable 26.64 3
4016.36 4030.86 Not suitable 14.5 0
4030.86 4036.77 Suitable 5.91 1
4036.77 4054.07 Not suitable 17.3 0
4054.07 4170.54 Suitable 116.47 13
4170.54 4233.33 Not suitable 62.79 0
4233.33 4244.91 Suitable 11.58 2
4244.91 4254.17 Not suitable 9.26 0
4254.17 4264.83 Suitable 10.66 2
4264.83 4327.41 Not suitable 62.58 0
4327.41 4332.44 Suitable 5.03 1
4332.44 4333.59 Not suitable 1.15 0
4333.59 4365.86 Suitable 32.27 4
4365.86 4368.15 Not suitable 2.29 0
4368.15 4383.51 Suitable 15.36 2
4383.51 4388.34 Not suitable 4.83 0
4388.34 4507.02 Suitable 118.68 13
4507.02 4508.83 Not suitable 1.81 0
4508.83 4600 Suitable 91.17 10
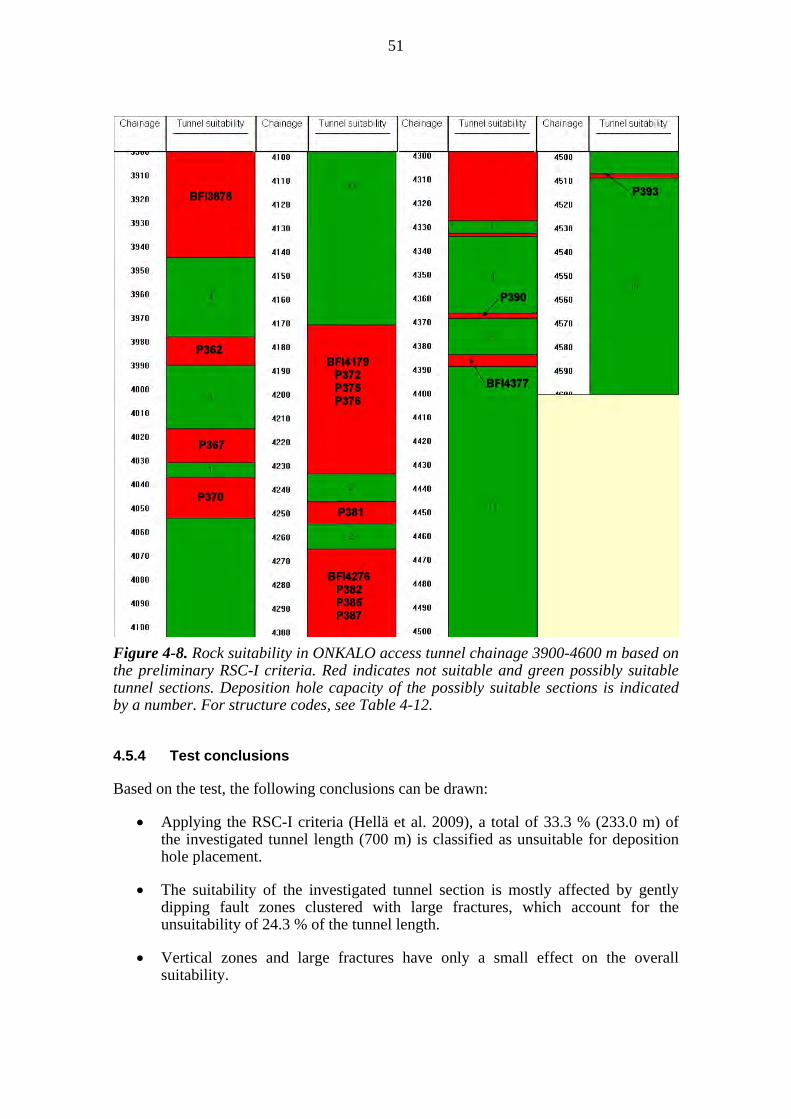
51
Figure 4-8. Rock suitability in ONKALO access tunnel chainage 3900-4600 m based on the preliminary RSC-I criteria. Red indicates not suitable and green possibly suitable tunnel sections. Deposition hole capacity of the possibly suitable sections is indicated by a number. For structure codes, see Table 4-12.
4.5.4 Test conclusions
Based on the test, the following conclusions can be drawn:
Applying the RSC-I criteria (Hellä et al. 2009), a total of 33.3 % (233.0 m) of the investigated tunnel length (700 m) is classified as unsuitable for deposition hole placement.
The suitability of the investigated tunnel section is mostly affected by gently dipping fault zones clustered with large fractures, which account for the unsuitability of 24.3 % of the tunnel length.
Vertical zones and large fractures have only a small effect on the overall suitability.
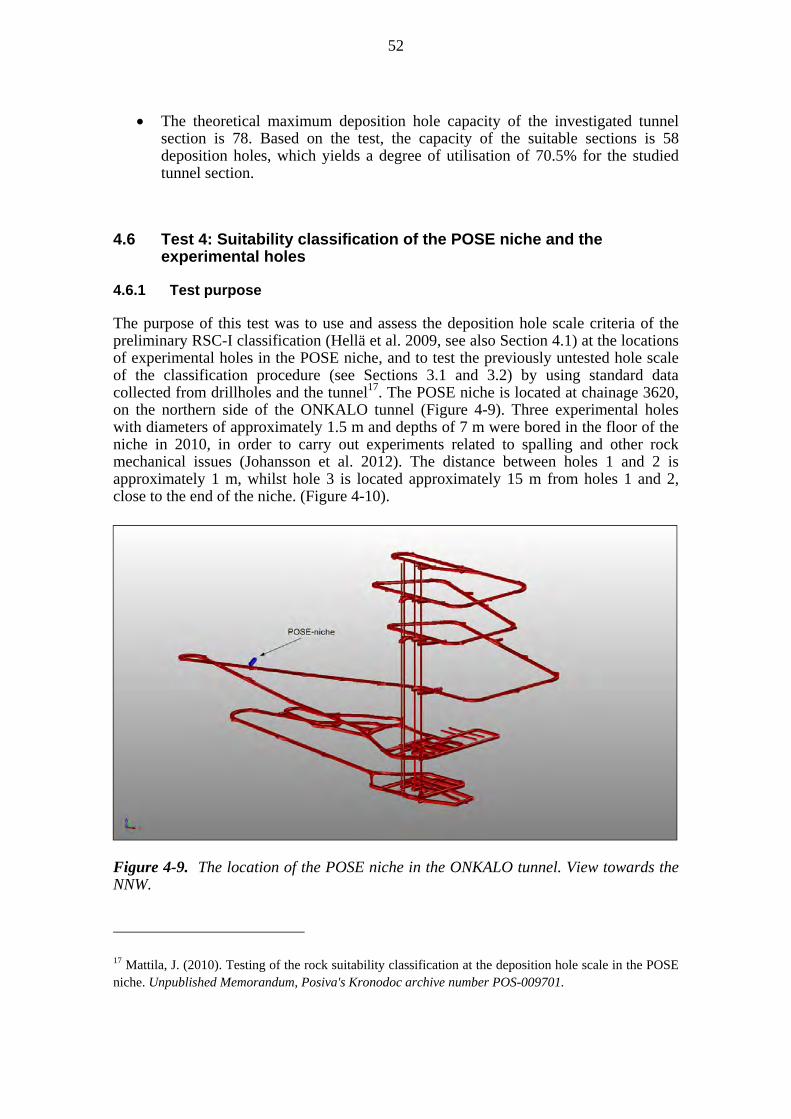
52
The theoretical maximum deposition hole capacity of the investigated tunnel section is 78. Based on the test, the capacity of the suitable sections is 58 deposition holes, which yields a degree of utilisation of 70.5% for the studied tunnel section.
4.6 Test 4: Suitability classification of the POSE niche and the experimental holes
4.6.1 Test purpose
The purpose of this test was to use and assess the deposition hole scale criteria of the preliminary RSC-I classification (Hellä et al. 2009, see also Section 4.1) at the locations of experimental holes in the POSE niche, and to test the previously untested hole scale of the classification procedure (see Sections 3.1 and 3.2) by using standard data collected from drillholes and the tunnel17. The POSE niche is located at chainage 3620, on the northern side of the ONKALO tunnel (Figure 4-9). Three experimental holes with diameters of approximately 1.5 m and depths of 7 m were bored in the floor of the niche in 2010, in order to carry out experiments related to spalling and other rock mechanical issues (Johansson et al. 2012). The distance between holes 1 and 2 is approximately 1 m, whilst hole 3 is located approximately 15 m from holes 1 and 2, close to the end of the niche. (Figure 4-10).
Figure 4-9. The location of the POSE niche in the ONKALO tunnel. View towards the NNW.
17 Mattila, J. (2010). Testing of the rock suitability classification at the deposition hole scale in the POSE niche. Unpublished Memorandum, Posiva's Kronodoc archive number POS-009701.

53
Figure 4-10. The POSE niche and the locations of the experimental holes. View towards the NW. 4.6.2 Test procedure and data
The test comprised three different steps, which were: i) compilation and assessment of available data from the investigated volume, ii) correlation between fracture data from pilot holes and the experimental holes and iii) classification of the experimental holes based on deposition hole scale RSC-I criteria. The first two steps are described below and the classification procedure (step 3) in Section 4.6.3. It needs be noted that the experimental holes were originally planned for rock mechanical tests and the investigations carried out in the niche and in the holes do not fully conform to the requirements of the RSC classification.
Step 1 - Compilation and assessment of available data
Point cloud data
The experimental holes and the POSE niche have been scanned with a terrestrial laser scanner, producing intensity-based, grey-scaled point clouds (Figure 4-11). The point cloud data can be visualised and analysed using various software and can be used, for example, to trace bedrock features such as lithological contacts in 3D.
Geological data from the POSE niche
The geology of the walls and floor of the POSE niche have been mapped in detail and the geometries of the mapped features have been digitised in 3D (Figure 4-13). The attributes of the features (e.g. fracture, lithology, foliation) have been collected in Excel files and can be linked to the 3D file, with a unique ID code specified for each feature.

54
Figure 4-11. Grey-scaled point cloud image of experimental hole 2 obtained by laser scanning.
Figure 4-12. Geological mapping data reproduced in 3D – black lines correspond to fractures, green and red lines to lithological contacts.
The attribute and 3D files of the mapped features are provided separately for the walls and the floor of the niche, as these were mapped on separate occasions. However, the geological features from the walls and the floor, which were mapped separately, have
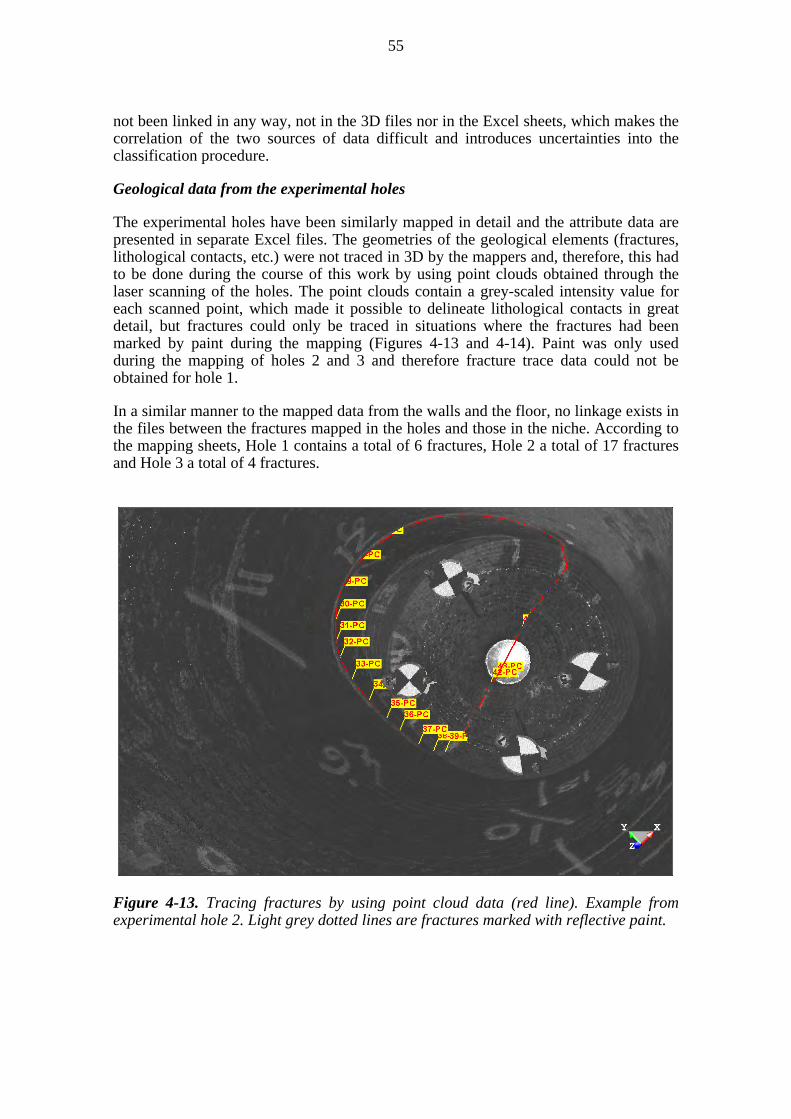
55
not been linked in any way, not in the 3D files nor in the Excel sheets, which makes the correlation of the two sources of data difficult and introduces uncertainties into the classification procedure.
Geological data from the experimental holes
The experimental holes have been similarly mapped in detail and the attribute data are presented in separate Excel files. The geometries of the geological elements (fractures, lithological contacts, etc.) were not traced in 3D by the mappers and, therefore, this had to be done during the course of this work by using point clouds obtained through the laser scanning of the holes. The point clouds contain a grey-scaled intensity value for each scanned point, which made it possible to delineate lithological contacts in great detail, but fractures could only be traced in situations where the fractures had been marked by paint during the mapping (Figures 4-13 and 4-14). Paint was only used during the mapping of holes 2 and 3 and therefore fracture trace data could not be obtained for hole 1.
In a similar manner to the mapped data from the walls and the floor, no linkage exists in the files between the fractures mapped in the holes and those in the niche. According to the mapping sheets, Hole 1 contains a total of 6 fractures, Hole 2 a total of 17 fractures and Hole 3 a total of 4 fractures.
Figure 4-13. Tracing fractures by using point cloud data (red line). Example from experimental hole 2. Light grey dotted lines are fractures marked with reflective paint.
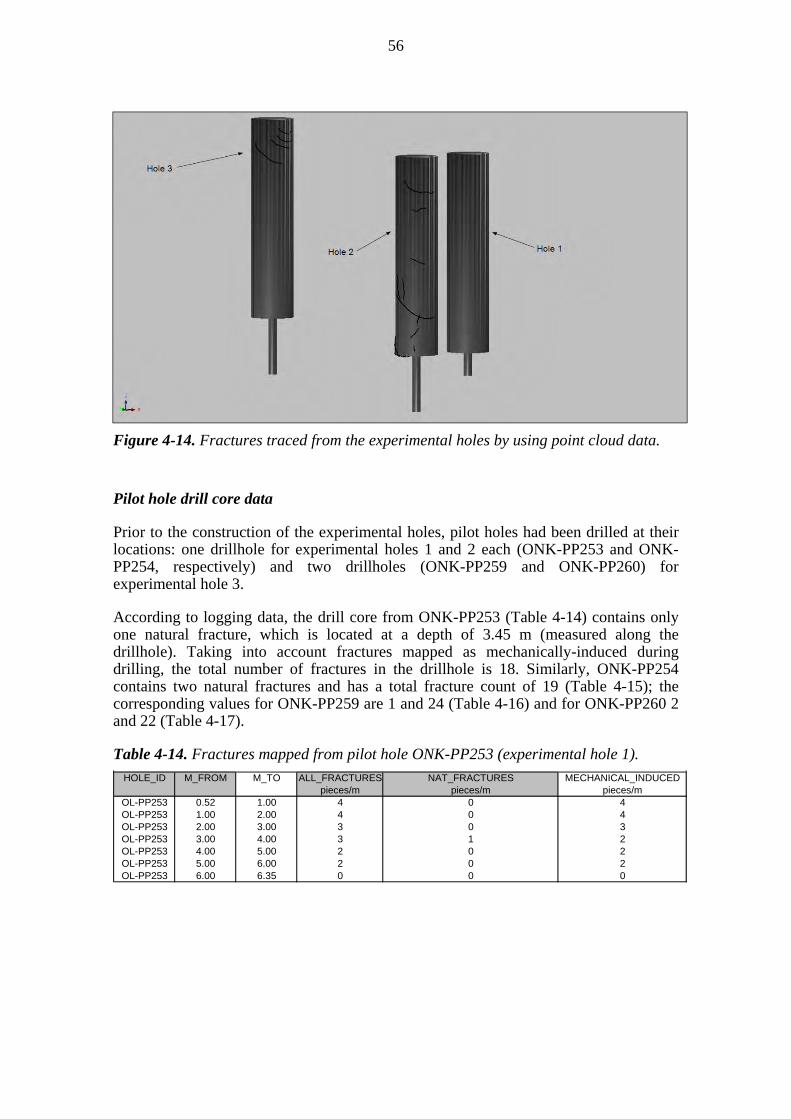
56
Figure 4-14. Fractures traced from the experimental holes by using point cloud data.
Pilot hole drill core data
Prior to the construction of the experimental holes, pilot holes had been drilled at their locations: one drillhole for experimental holes 1 and 2 each (ONK-PP253 and ONK-PP254, respectively) and two drillholes (ONK-PP259 and ONK-PP260) for experimental hole 3.
According to logging data, the drill core from ONK-PP253 (Table 4-14) contains only one natural fracture, which is located at a depth of 3.45 m (measured along the drillhole). Taking into account fractures mapped as mechanically-induced during drilling, the total number of fractures in the drillhole is 18. Similarly, ONK-PP254 contains two natural fractures and has a total fracture count of 19 (Table 4-15); the corresponding values for ONK-PP259 are 1 and 24 (Table 4-16) and for ONK-PP260 2 and 22 (Table 4-17).
Table 4-14. Fractures mapped from pilot hole ONK-PP253 (experimental hole 1).
HOLE_ID M_FROM M_TO ALL_FRACTURES NAT_FRACTURES MECHANICAL_INDUCEDpieces/m pieces/m pieces/m
OL-PP253 0.52 1.00 4 0 4OL-PP253 1.00 2.00 4 0 4OL-PP253 2.00 3.00 3 0 3OL-PP253 3.00 4.00 3 1 2OL-PP253 4.00 5.00 2 0 2OL-PP253 5.00 6.00 2 0 2OL-PP253 6.00 6.35 0 0 0
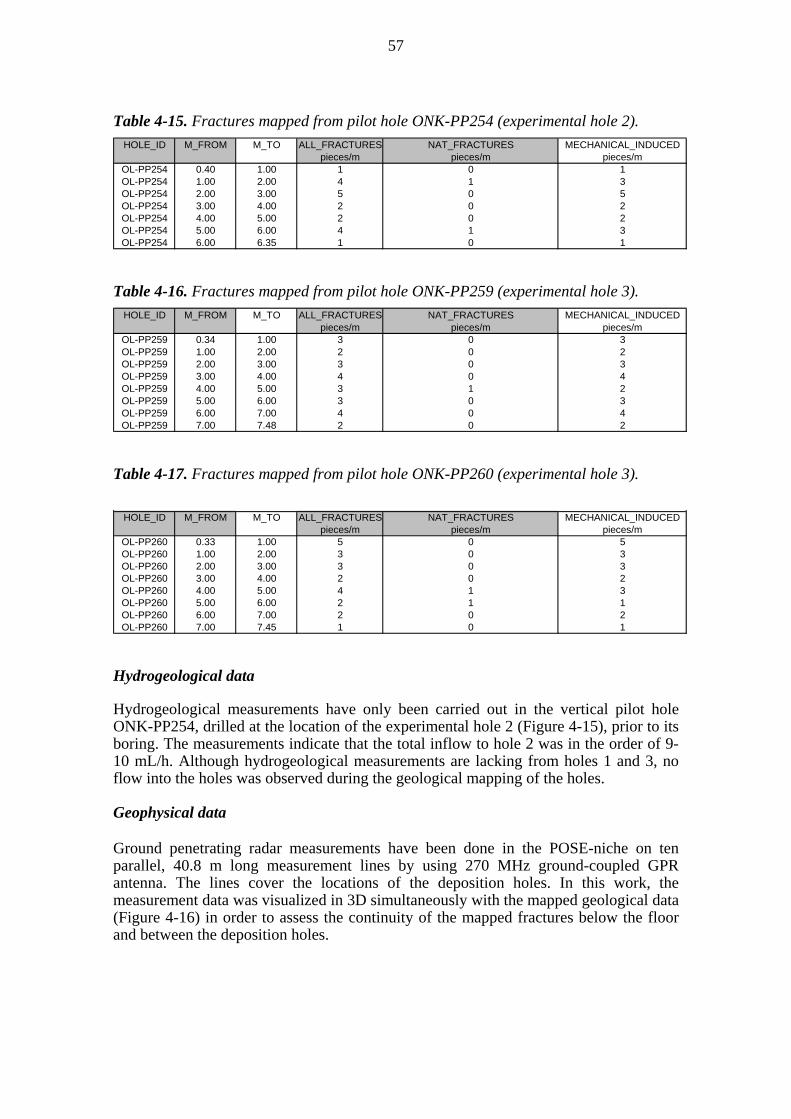
57
Table 4-15. Fractures mapped from pilot hole ONK-PP254 (experimental hole 2).
Table 4-16. Fractures mapped from pilot hole ONK-PP259 (experimental hole 3).
Table 4-17. Fractures mapped from pilot hole ONK-PP260 (experimental hole 3).
Hydrogeological data
Hydrogeological measurements have only been carried out in the vertical pilot hole ONK-PP254, drilled at the location of the experimental hole 2 (Figure 4-15), prior to its boring. The measurements indicate that the total inflow to hole 2 was in the order of 9-10 mL/h. Although hydrogeological measurements are lacking from holes 1 and 3, no flow into the holes was observed during the geological mapping of the holes.
Geophysical data Ground penetrating radar measurements have been done in the POSE-niche on ten parallel, 40.8 m long measurement lines by using 270 MHz ground-coupled GPR antenna. The lines cover the locations of the deposition holes. In this work, the measurement data was visualized in 3D simultaneously with the mapped geological data (Figure 4-16) in order to assess the continuity of the mapped fractures below the floor and between the deposition holes.
HOLE_ID M_FROM M_TO ALL_FRACTURES NAT_FRACTURES MECHANICAL_INDUCEDpieces/m pieces/m pieces/m
OL-PP254 0.40 1.00 1 0 1OL-PP254 1.00 2.00 4 1 3OL-PP254 2.00 3.00 5 0 5OL-PP254 3.00 4.00 2 0 2OL-PP254 4.00 5.00 2 0 2OL-PP254 5.00 6.00 4 1 3OL-PP254 6.00 6.35 1 0 1
HOLE_ID M_FROM M_TO ALL_FRACTURES NAT_FRACTURES MECHANICAL_INDUCEDpieces/m pieces/m pieces/m
OL-PP259 0.34 1.00 3 0 3OL-PP259 1.00 2.00 2 0 2OL-PP259 2.00 3.00 3 0 3OL-PP259 3.00 4.00 4 0 4OL-PP259 4.00 5.00 3 1 2OL-PP259 5.00 6.00 3 0 3OL-PP259 6.00 7.00 4 0 4OL-PP259 7.00 7.48 2 0 2
HOLE_ID M_FROM M_TO ALL_FRACTURES NAT_FRACTURES MECHANICAL_INDUCEDpieces/m pieces/m pieces/m
OL-PP260 0.33 1.00 5 0 5OL-PP260 1.00 2.00 3 0 3OL-PP260 2.00 3.00 3 0 3OL-PP260 3.00 4.00 2 0 2OL-PP260 4.00 5.00 4 1 3OL-PP260 5.00 6.00 2 1 1OL-PP260 6.00 7.00 2 0 2OL-PP260 7.00 7.45 1 0 1
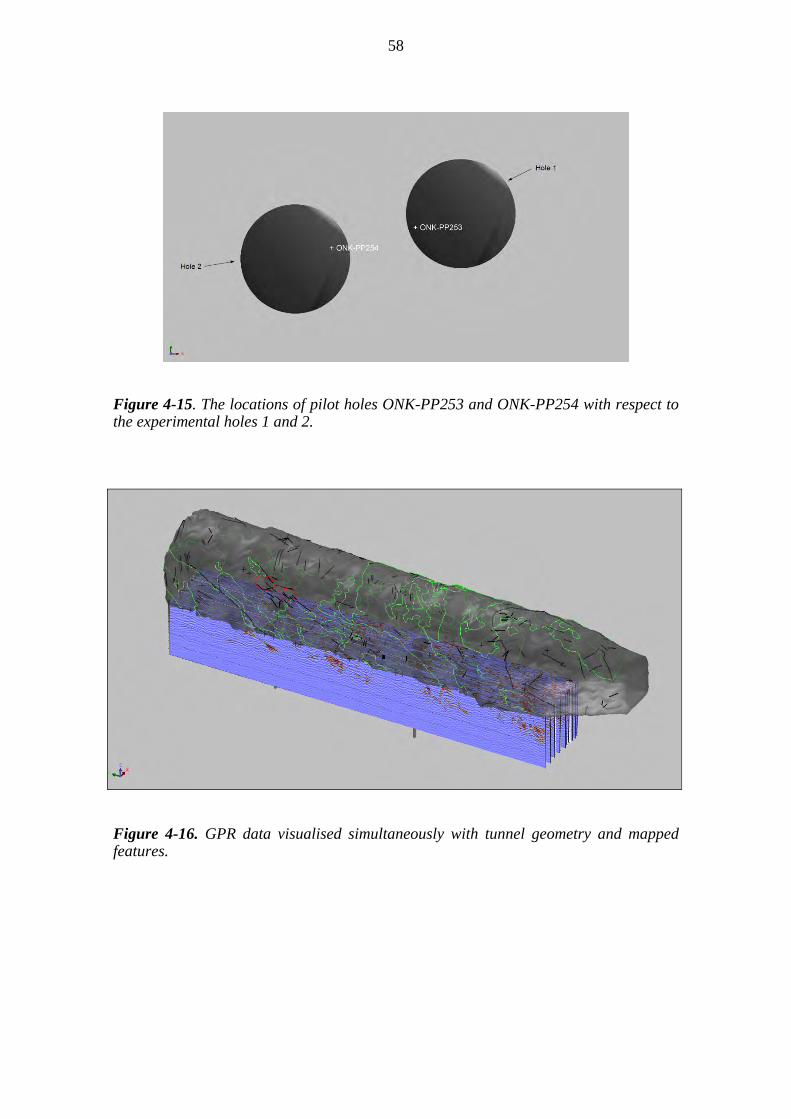
58
Figure 4-15. The locations of pilot holes ONK-PP253 and ONK-PP254 with respect to the experimental holes 1 and 2.
Figure 4-16. GPR data visualised simultaneously with tunnel geometry and mapped features.
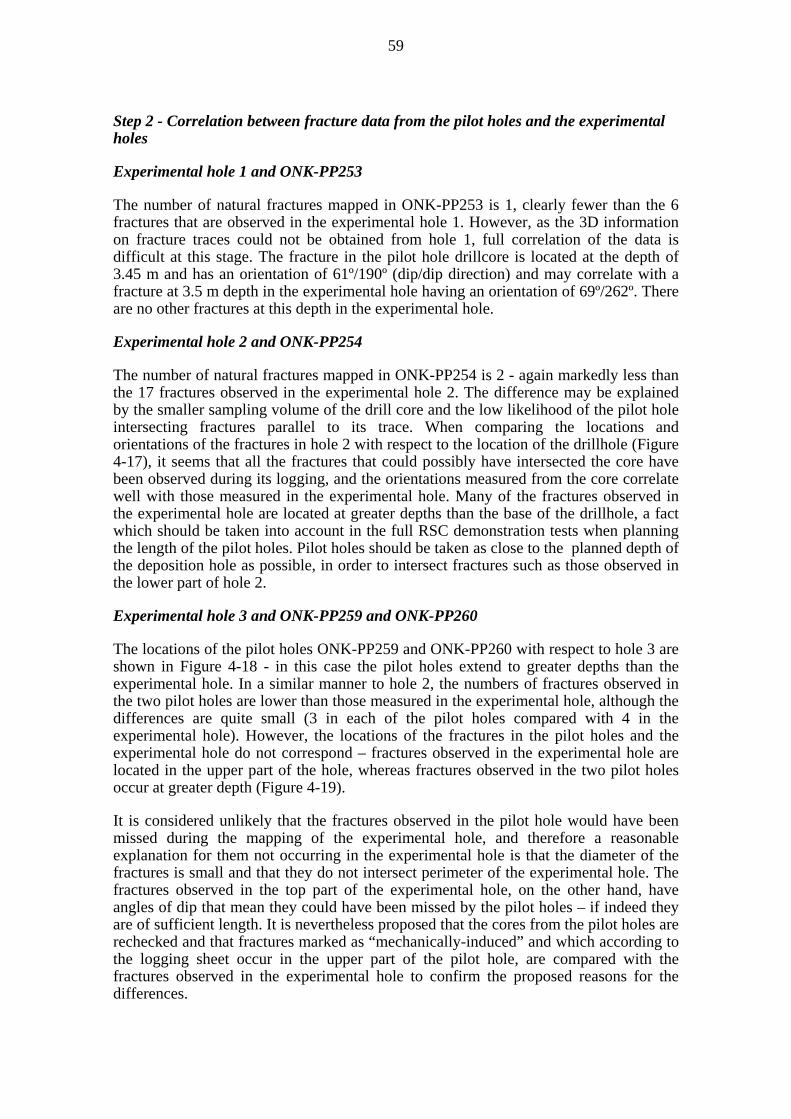
59
Step 2 - Correlation between fracture data from the pilot holes and the experimental holes
Experimental hole 1 and ONK-PP253
The number of natural fractures mapped in ONK-PP253 is 1, clearly fewer than the 6 fractures that are observed in the experimental hole 1. However, as the 3D information on fracture traces could not be obtained from hole 1, full correlation of the data is difficult at this stage. The fracture in the pilot hole drillcore is located at the depth of 3.45 m and has an orientation of 61º/190º (dip/dip direction) and may correlate with a fracture at 3.5 m depth in the experimental hole having an orientation of 69º/262º. There are no other fractures at this depth in the experimental hole.
Experimental hole 2 and ONK-PP254
The number of natural fractures mapped in ONK-PP254 is 2 - again markedly less than the 17 fractures observed in the experimental hole 2. The difference may be explained by the smaller sampling volume of the drill core and the low likelihood of the pilot hole intersecting fractures parallel to its trace. When comparing the locations and orientations of the fractures in hole 2 with respect to the location of the drillhole (Figure 4-17), it seems that all the fractures that could possibly have intersected the core have been observed during its logging, and the orientations measured from the core correlate well with those measured in the experimental hole. Many of the fractures observed in the experimental hole are located at greater depths than the base of the drillhole, a fact which should be taken into account in the full RSC demonstration tests when planning the length of the pilot holes. Pilot holes should be taken as close to the planned depth of the deposition hole as possible, in order to intersect fractures such as those observed in the lower part of hole 2.
Experimental hole 3 and ONK-PP259 and ONK-PP260
The locations of the pilot holes ONK-PP259 and ONK-PP260 with respect to hole 3 are shown in Figure 4-18 - in this case the pilot holes extend to greater depths than the experimental hole. In a similar manner to hole 2, the numbers of fractures observed in the two pilot holes are lower than those measured in the experimental hole, although the differences are quite small (3 in each of the pilot holes compared with 4 in the experimental hole). However, the locations of the fractures in the pilot holes and the experimental hole do not correspond – fractures observed in the experimental hole are located in the upper part of the hole, whereas fractures observed in the two pilot holes occur at greater depth (Figure 4-19).
It is considered unlikely that the fractures observed in the pilot hole would have been missed during the mapping of the experimental hole, and therefore a reasonable explanation for them not occurring in the experimental hole is that the diameter of the fractures is small and that they do not intersect perimeter of the experimental hole. The fractures observed in the top part of the experimental hole, on the other hand, have angles of dip that mean they could have been missed by the pilot holes – if indeed they are of sufficient length. It is nevertheless proposed that the cores from the pilot holes are rechecked and that fractures marked as “mechanically-induced” and which according to the logging sheet occur in the upper part of the pilot hole, are compared with the fractures observed in the experimental hole to confirm the proposed reasons for the differences.
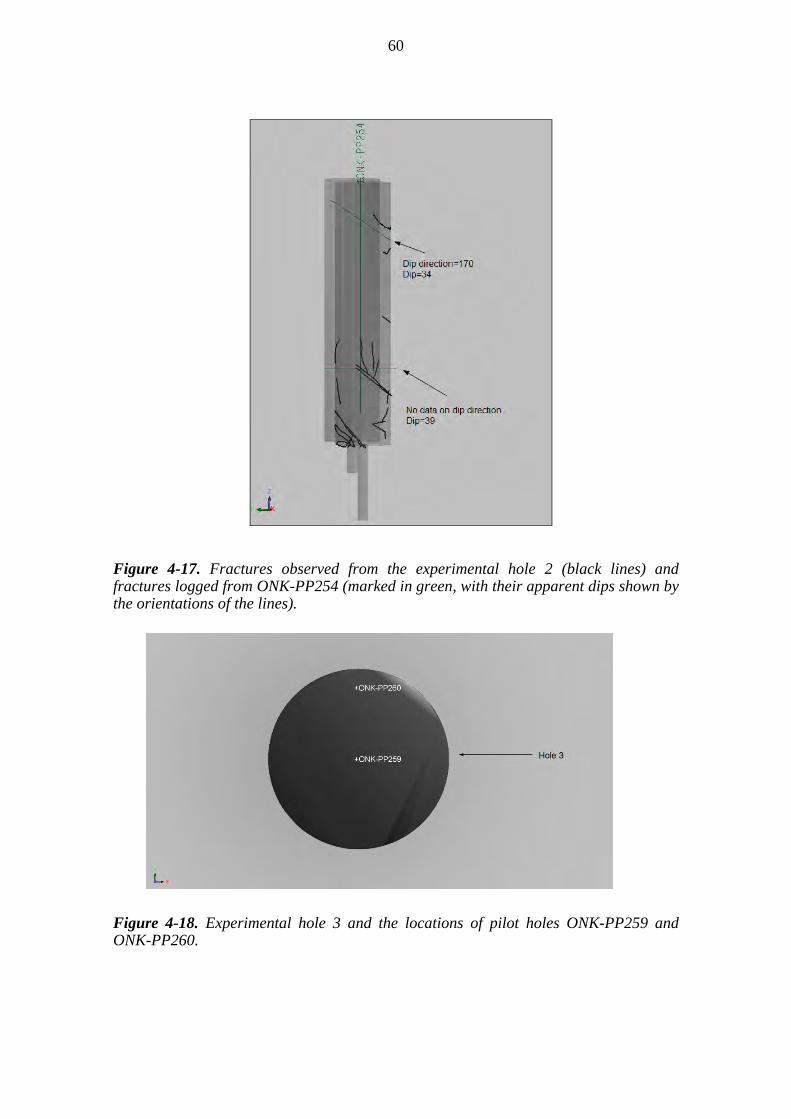
60
Figure 4-17. Fractures observed from the experimental hole 2 (black lines) and fractures logged from ONK-PP254 (marked in green, with their apparent dips shown by the orientations of the lines).
Figure 4-18. Experimental hole 3 and the locations of pilot holes ONK-PP259 and ONK-PP260.
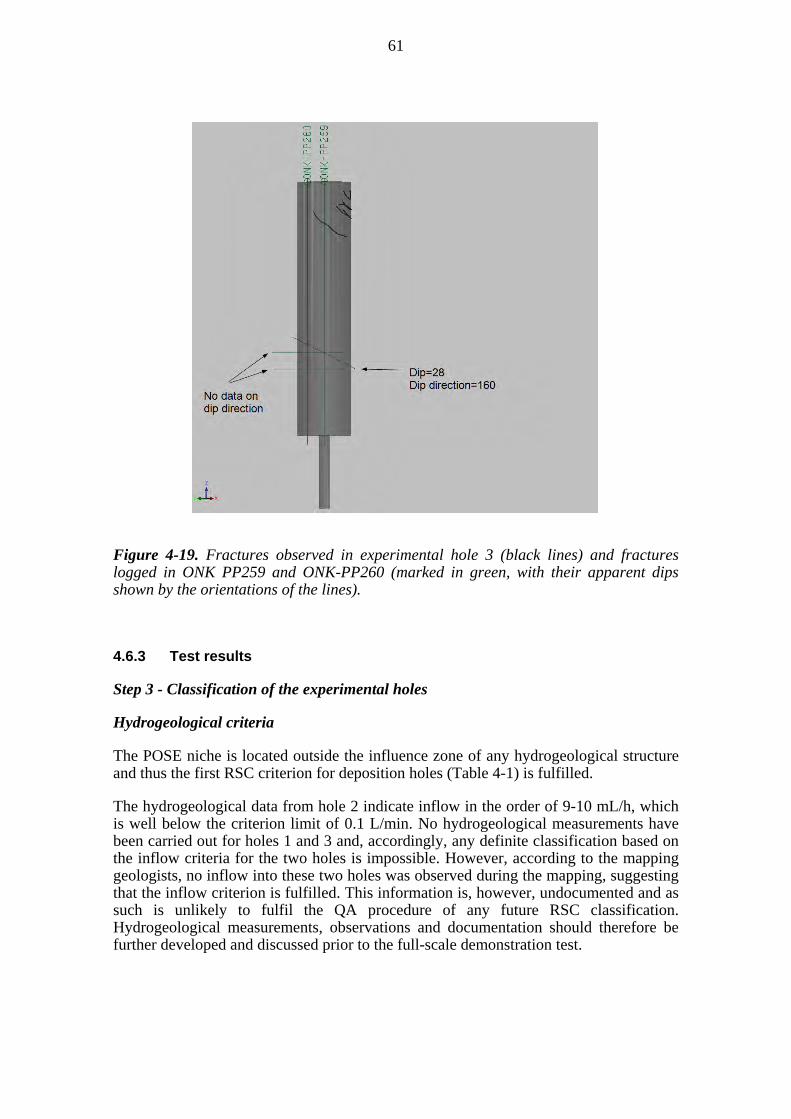
61
Figure 4-19. Fractures observed in experimental hole 3 (black lines) and fractures logged in ONK PP259 and ONK-PP260 (marked in green, with their apparent dips shown by the orientations of the lines).
4.6.3 Test results
Step 3 - Classification of the experimental holes
Hydrogeological criteria
The POSE niche is located outside the influence zone of any hydrogeological structure and thus the first RSC criterion for deposition holes (Table 4-1) is fulfilled.
The hydrogeological data from hole 2 indicate inflow in the order of 9-10 mL/h, which is well below the criterion limit of 0.1 L/min. No hydrogeological measurements have been carried out for holes 1 and 3 and, accordingly, any definite classification based on the inflow criteria for the two holes is impossible. However, according to the mapping geologists, no inflow into these two holes was observed during the mapping, suggesting that the inflow criterion is fulfilled. This information is, however, undocumented and as such is unlikely to fulfil the QA procedure of any future RSC classification. Hydrogeological measurements, observations and documentation should therefore be further developed and discussed prior to the full-scale demonstration test.
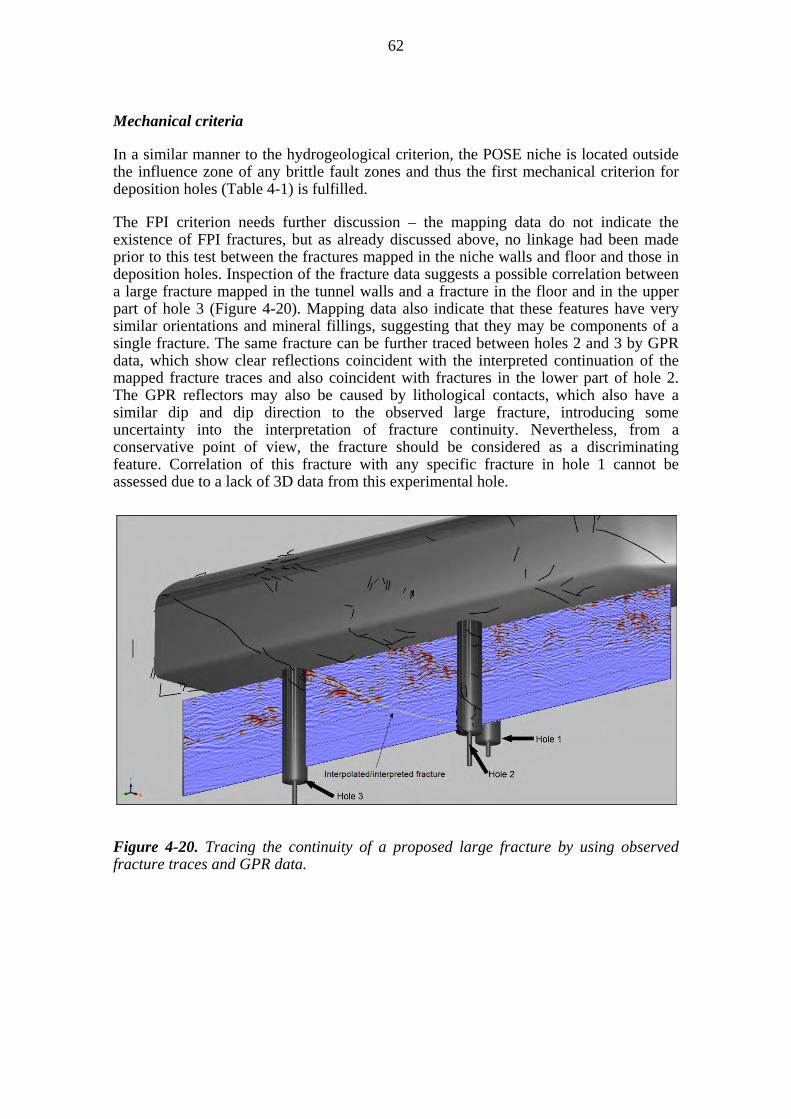
62
Mechanical criteria
In a similar manner to the hydrogeological criterion, the POSE niche is located outside the influence zone of any brittle fault zones and thus the first mechanical criterion for deposition holes (Table 4-1) is fulfilled.
The FPI criterion needs further discussion – the mapping data do not indicate the existence of FPI fractures, but as already discussed above, no linkage had been made prior to this test between the fractures mapped in the niche walls and floor and those in deposition holes. Inspection of the fracture data suggests a possible correlation between a large fracture mapped in the tunnel walls and a fracture in the floor and in the upper part of hole 3 (Figure 4-20). Mapping data also indicate that these features have very similar orientations and mineral fillings, suggesting that they may be components of a single fracture. The same fracture can be further traced between holes 2 and 3 by GPR data, which show clear reflections coincident with the interpreted continuation of the mapped fracture traces and also coincident with fractures in the lower part of hole 2. The GPR reflectors may also be caused by lithological contacts, which also have a similar dip and dip direction to the observed large fracture, introducing some uncertainty into the interpretation of fracture continuity. Nevertheless, from a conservative point of view, the fracture should be considered as a discriminating feature. Correlation of this fracture with any specific fracture in hole 1 cannot be assessed due to a lack of 3D data from this experimental hole.
Figure 4-20. Tracing the continuity of a proposed large fracture by using observed fracture traces and GPR data.

63
4.6.4 Test conclusions
A wealth of data has been collected from the POSE niche and from the experimental holes, enabling a preliminary RSC-I classification of the holes. However, the data provided are not in a processed, standardised format, which makes the classification procedure difficult and also, non-transparent from a reviewer’s point of view. The following recommendations are presented:
Geological data from tunnel walls and floor should be combined and processed into coherent files in which the continuation of each geological entity from one file to another is uniquely marked. This was not the case for the data files used at the time of the test. Preferably, the 3D files should only contain processed data, showing the true geometry and extent of the features, especially when considering fractures.
Fracture traces from the deposition holes should be measured carefully (e.g. total station, tachymeter) during the mapping phase, and reproduced in 3D after the mapping. Based on the experience from this work, grey-scaled point cloud data cannot always be used to trace fractures, unless they have been specifically marked with paint or another reflective material, as the fractures are not distinguishable from other potential features. For example, fracture traces from hole 1 could not be obtained, as these were marked using a black marker pen, which did not allow them to be distinguished in the point cloud data.
Fracture traces from the deposition holes should be linked to fractures in the tunnel by the geologist working on the site and having access to the location for crosschecking the results – afterwards any such linkage may be difficult, especially for anyone not directly involved in the mapping. This process is closely linked to the development of a detailed-scale model of the deposition tunnel, as envisaged by Hellä et al. (2009) and Kosunen et al. (2012; summed in Section 4.3 of this report), where all available data are combined into a small-scale model, taking into account the continuity of the fractures. The model is then applied as input into the RSC process. This approach is strongly supported by the experience gained during this work.
Pilot holes should be drilled in the locations of the deposition holes, as already planned, and should preferably extend to the depth of the deposition hole itself, in order to intersect inclined fractures located at and close to the base of the deposition hole. Differences observed between natural fractures mapped in the experimental holes and fractures mapped from the pilot hole drill cores are mainly caused by the geometry and sizes of the fractures. In the case of hole 3, it is however proposed the fractures marked as “mechanically-induced” are rechecked to corroborate the conclusions given above.
Hydrogeological information did not exist for holes 1 and 3, although according to the mapping geologists the holes were dry during the mapping process. This is however undocumented information and, from a QA perspective, it is unlikely that information of this type could be made use of in a full-scale RSC test. Proper hydrogeological measurements were carried out in relation to hole 2 and a similar approach should be a standard method for every planned deposition hole location.
Based on the available data, each of the three experimental hole locations fulfils the hydrogeological criterion whereas, if a conservative approach were taken, the FPI

64
criterion would not be fulfilled, as holes 2 and 3 are intersected by a putative large fracture, whose true extent is unknown. As the fracture’s extent cannot be verified, these experimental hole positions should be rejected, unless further investigation were conducted to prove that the fracture is in fact discontinuous.
The assumed large fracture intersects the upper part of hole 3 and the lower part of hole 2, but is in a position where it would not intersect the positions of canisters within the holes. The (assumed infinite) extrapolation of an FPI fracture (see discussion in Section 4.3) is used to represent a fracture of unknown size. According to RSC-I (Hellä et al. 2009), any deposition hole intersected by such an extrapolated fracture is rejected, regardless of the true fracture size. In Munier (2006), a position was regarded potentially critical if the extrapolation of the FPI fracture intersected any part of the planned deposition hole. This criterion has since been judged, by SKB, to be overly conservative and has therefore been slightly modified to the following: “A position is regarded as potentially critical if the extrapolation of the FPI fracture intersects any portion of the planned canister position” (Munier, 2010). It is suggested that this approach could also be adopted in the update of the RSC-I criteria.
4.7 Test 4: Method development for measuring fracture-specific tunnel inflow
4.7.1 Test purpose
Measuring the inflows from isolated fractures is an important part of the RSC process in order to assess the fulfilment of the hydrogeological criteria. The purpose of this work was to test the flow measurement methodology on single, isolated fracture and to develop guidelines to be used in the rock suitability classification. The test was conducted in a tunnel section close to the demonstration tunnel facilities, as shown in Figure 4-21. At the location, one full-perimeter fracture with inflows was observed during tunnel mapping.
Figure 4-21. Location of the inflow measurement tests.
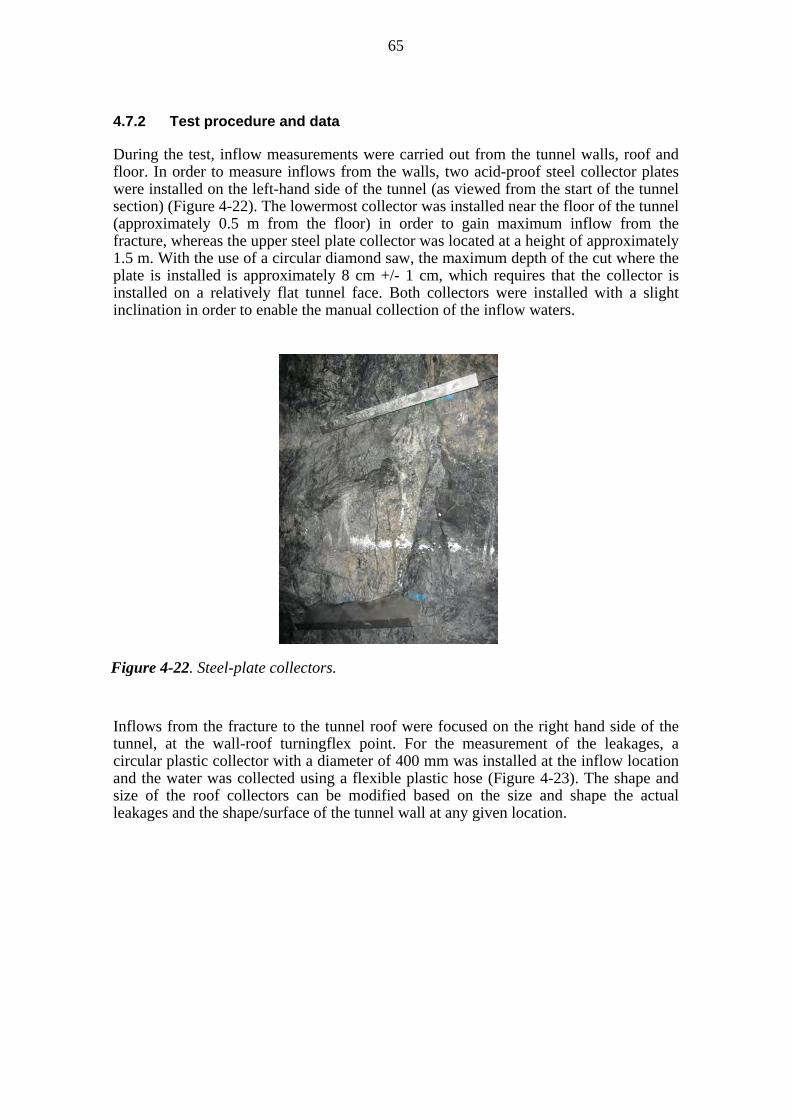
65
4.7.2 Test procedure and data
During the test, inflow measurements were carried out from the tunnel walls, roof and floor. In order to measure inflows from the walls, two acid-proof steel collector plates were installed on the left-hand side of the tunnel (as viewed from the start of the tunnel section) (Figure 4-22). The lowermost collector was installed near the floor of the tunnel (approximately 0.5 m from the floor) in order to gain maximum inflow from the fracture, whereas the upper steel plate collector was located at a height of approximately 1.5 m. With the use of a circular diamond saw, the maximum depth of the cut where the plate is installed is approximately 8 cm +/- 1 cm, which requires that the collector is installed on a relatively flat tunnel face. Both collectors were installed with a slight inclination in order to enable the manual collection of the inflow waters.
Inflows from the fracture to the tunnel roof were focused on the right hand side of the tunnel, at the wall-roof turningflex point. For the measurement of the leakages, a circular plastic collector with a diameter of 400 mm was installed at the inflow location and the water was collected using a flexible plastic hose (Figure 4-23). The shape and size of the roof collectors can be modified based on the size and shape the actual leakages and the shape/surface of the tunnel wall at any given location.
Figure 4-22. Steel-plate collectors.
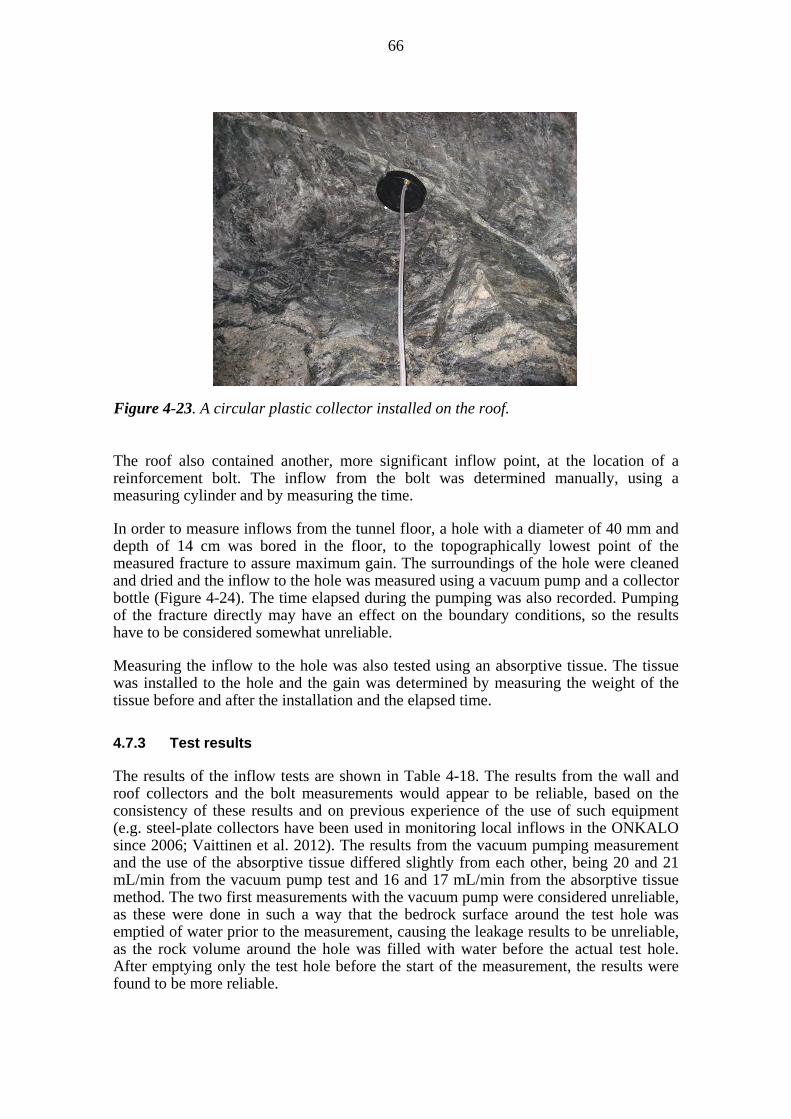
66
The roof also contained another, more significant inflow point, at the location of a reinforcement bolt. The inflow from the bolt was determined manually, using a measuring cylinder and by measuring the time.
In order to measure inflows from the tunnel floor, a hole with a diameter of 40 mm and depth of 14 cm was bored in the floor, to the topographically lowest point of the measured fracture to assure maximum gain. The surroundings of the hole were cleaned and dried and the inflow to the hole was measured using a vacuum pump and a collector bottle (Figure 4-24). The time elapsed during the pumping was also recorded. Pumping of the fracture directly may have an effect on the boundary conditions, so the results have to be considered somewhat unreliable.
Measuring the inflow to the hole was also tested using an absorptive tissue. The tissue was installed to the hole and the gain was determined by measuring the weight of the tissue before and after the installation and the elapsed time.
4.7.3 Test results
The results of the inflow tests are shown in Table 4-18. The results from the wall and roof collectors and the bolt measurements would appear to be reliable, based on the consistency of these results and on previous experience of the use of such equipment (e.g. steel-plate collectors have been used in monitoring local inflows in the ONKALO since 2006; Vaittinen et al. 2012). The results from the vacuum pumping measurement and the use of the absorptive tissue differed slightly from each other, being 20 and 21 mL/min from the vacuum pump test and 16 and 17 mL/min from the absorptive tissue method. The two first measurements with the vacuum pump were considered unreliable, as these were done in such a way that the bedrock surface around the test hole was emptied of water prior to the measurement, causing the leakage results to be unreliable, as the rock volume around the hole was filled with water before the actual test hole. After emptying only the test hole before the start of the measurement, the results were found to be more reliable.
Figure 4-23. A circular plastic collector installed on the roof.

67
The vacuum pump method seemed to be more reliable than the absorptive tissue method, as the method enabled fast and more reliable draining of the hole. When applying the absorptive tissue method, evaporation is considered to cause possibly notable uncertainties to the results. The use of the tissue would also require a more absorbent tissue with a better capacity to store the absorbed water than that used in the current test. However, the method also requires the use of highly accurate scales (especially for minor inflows), which are, on the other hand, more vulnerable to the tunnel conditions and consequently susceptible to errors. Based on the test, the tissue method could be applied in the measurement of local inflows from low-transmissivity fractures, its use is not recommended for systematic use.
Figure 4-24. Inflow measurement from a hole bored to the floor of thetunnel by the use of vacuum pump.

68
Table 4-18. Results from the inflow measurement tests.
Single‐fracture inflow tests
Date Target Method Volume of water (mL)
Elapsed time (min)
Inflow (mL/min) Remarks
15.3.2011 Wall (Upper collector) Use of collector 10 1 10
18.3.2011 Wall (Upper collector) Use of collector 10 1 10 Second measurement
15.3.2011 Wall (Lower collector) Use of collector 18 1 18
18.3.2011 Wall (Lower collector) Use of collector 19 1 19 Second measurement
15.3.2011 Ceiling (Bolt) Measuring cylinder (from the floor) 600 100 6 Unreliable
15.3.2011 Ceiling (Bolt) Measuring cylinder (From the ceiling) 22 3 7 Reliable
18.3.2011 Ceiling (Collector) Use of collector 6 5 1.2
15.3.2011 Floor Vacuum pump 115 10 12 Unreliable
15.3.2011 Floor Vacuum pump 31 4 8 Unreliable
15.3.2011 Floor Vacuum pump 105 5 21 Reliable
15.3.2011 Floor Vacuum pump 102 5 20 Reliable
15.3.2011 Floor Absorptive tissue 39.1 2.3 17 Measurement by weighing
15.3.2011 Floor Absorptive tissue 48.8 3 16 Measurement by weighing
4.7.4 Test conclusions
The tunnel inflow from a single full perimeter fracture can be measured by using the methods presented in the test. However, the location and geometry of the inflow points in the tunnels differ, depending on the character of the leaking fracture, making each measurement more or less unique. The measurements and methods need to be modified according to the prevailing conditions to ensure the best possible results. In addition to the work presented here, in order for the measurements to be valid, it is necessary for the inflow into the whole demonstration or deposition tunnel to be measured by using a measurement weir at the mouth of the tunnel. This would enable a comparison to be made of the inflow measured from a single fracture with that of the total inflow from the tunnel.
The testing of the different measurement methods is continuing as the demonstrations proceed; for example, different methods for measuring inflows into demonstration holes are being examined.
4.8 Test 5: SKB cooperation project on large fracture issues
4.8.1 Test purpose
The ability to predict and identify the occurrence of single large fractures that are able to slip more than 5 cm18 is of great importance for the application of the RSC process.
18 See Table 3-2 and Section 5.2.3.
69
In order to develop techniques for this purpose, Posiva and SKB established a co-operation project called "Rock Suitability Criteria – strategies and methodology", which had two main objectives in relation to the RSC. The first objective was to develop and assess geological and geophysical investigation methods for the identification of the brittle fault zones and, especially, the large fractures. This was to be carried out by analysing and correlating existing geological and geophysical data acquired from pilot holes drilled in the ONKALO access tunnel and from investigations carried out in the excavated tunnel. The second objective was to develop strategy and methodology for creating a detailed-scale model of the rock conditions relevant to the RSC process, including, for example, brittle deformation zones and large fractures. The second objective is not within the scope of this Chapter but is discussed in Chapter 6.
The first objective consisted of four different activities, which were:
1. The use of geological data from pilot holes for predicting large fractures (Joutsen 2012)
2. The use of geophysical data from pilot holes for predicting large fractures (Heikkinen et al. 2011)
3. The application of seismic methods for locating large fractures, brittle fault zones and hydrogeological structures (Sireni 2011, Sireni et al. 2011).
4. The suitability of ground penetrating radar for locating large fractures (Heikkinen & Kantia 2011)
In the following sections a summary of the tests is given, but for details the reader is referred to the corresponding reports (Joutsen 2012, Heikkinen et al. 2011, Sireni 2011, Sireni et al. 2011 and Heikkinen & Kantia 2011).
4.8.2 Test procedure and data
The Activities 1 to 4 dealt with data acquisition and interpretation methodologies. Pilot holes drilled into the planned tunnel perimeter are the first direct source of detailed data from a specific tunnel volume and are, thus, of importance in locating the geological structures affecting rock suitability. Identifying single potentially large fractures from a pilot hole drill core is however problematic. Therefore, Activities 1 and 2 focused on the analysis of pilot hole data and the identification of large fractures. More specifically, in Activity 1, data from the geological logging of several pilot holes from the ONKALO access tunnel were evaluated against tunnel mapping data of corresponding tunnel sections. The purpose was to correlate tunnel crosscutting fractures (TCF)19 with pilot hole fracture data and to assess if these have common geological characteristics. It is noteworthy that most of the TCFs are probably not large fractures, but they are considered as proxies for potentially large features. Activity 2 concentrated on the interpretation of geophysical data obtained from pilot holes and on creating a method for using the data to predict the occurrence of large fractures. During the study, a technique was developed so that the results from geophysical logging could be used to produce for each fracture a score representing its significance as a potential large
19 See footnote 12 and the related text in Section 4.3.2.
70
fracture. Tunnel data on the observed TCF fractures were used to evaluate this technique.
In Activities 3 and 4, two different geophysical methods were evaluated against the requirements of the RSC. Activity 3 comprised the interpretation, geological correlation and evaluation of data obtained from a seismic investigation carried out in the ONKALO access tunnel, with the purpose of testing the suitability of seismic investigation methods for locating local-scale geological structures, including large fractures. In Activity 4, interpretation, geological correlation and evaluation of data from ground penetrating radar investigations carried out in a research niche in the ONKALO were carried out for the same purpose.
4.8.3 Test results
Activity 1: The use of geological data from pilot holes for predicting large fractures
Based on the results of Activity 1, the correlation of the tunnel TCFs with the pilot hole fractures was relatively straightforward, although, in some cases the correlation of certain fractures was rather complex due to many variables and uncertainties. There were two factors that affected the correlation process. Firstly, the differences in fracture surface area between the TCFs and the pilot hole fractures can complicate the correlation, as the characteristics of the small fracture surface area intersected by a pilot hole are not necessarily representative of the general characteristics of the TCF. Secondly, the geometry of the TCFs can affect the correlation; steeply-dipping TCFs with low levels of undulation are easier to correlate than gently-dipping and strongly undulating ones.
The 39 TCFs investigated during this study had specific geological characteristics. There are two typical orientations for the TCFs. One is N-S trending and steeply W or E dipping and the other is gently SE dipping and more or less parallel to the general foliation of the Olkiluoto bedrock. A majority of the TCFs are undulating and/or slickensided fractures.
67 % of the TCFs have a Ja number (Joint alteration number) of 3 or higher, indicating that many have clearly altered fracture surfaces. TCFs associated with brittle fault zones are more altered than single ones. Calcite, pyrite, kaolinite and chlorite are the most typical filling minerals found in TCFs, and if clearly altered, some combination of epidote, illite, clay minerals and graphite is usually present. Thick quartz fillings can also be associated with the TCFs. Fracture filling thicknesses vary from 0.4 mm to 200 mm, and have an average thickness of 18 mm and a median thickness of 2 mm. For comparison, the average thickness and the median of fracture fillings in fractures not associated with the TCFs in the studied pilot holes are 0.4 mm and 0.2 mm, respectively.
According to the fracture-correlated pilot hole flow log data, 33 % of TCFs are either transmissive fractures or are within ± 1 m from another transmissive fracture. Their flow rate values ranged from 107 mL/h to 195 L/h.
There were some differences between the TCF properties and the properties of the pilot hole fractures where the correlations were addressed. Fractures representing the TCFs in the pilot holes had a wider range of fracture surface profiles than the observed TCFs. They are slightly less altered and 44 % of these fractures have a Ja number of 3 or
71
greater. Typical filling minerals for these fractures are calcite, pyrite, kaolinite, chlorite and, in the more altered fractures, illite, clay minerals and in some cases graphite. Fracture filling thicknesses are usually less than in the TCFs.
According to this study there are certain geological properties in pilot hole fractures that can indicate the presence of a TCF, and should be taken into account when making predictions of potentially large fractures from pilot holes. These properties are:
a N-S trending sub-vertical or approximately SE dipping sub-horizontal fracture orientation
an undulating and/or slickensided fracture surface
in addition to the most common filling minerals (calcite, pyrite, kaolinite and chlorite), illite, clay minerals, epidote, quartz and graphite are also present
Joint alteration number (Ja) is ≥ 3.
the fracture filling is thicker than normally seen.
However, because of the many uncertainties related to TCF predictions, it is almost impossible to decide with a high degree of certainty whether a particular fracture in a pilot hole is or is not a TCF. In other words, a fracture in a pilot hole which displays strong TCF indications does not necessarily imply that it is actually a TCF and vice versa.
Activity 2: The use of geophysical data from pilot holes for predicting large fractures
This task assessed the possibility of being able to detect and classify potentially large fractures from the standard geophysical data collected from a pilot hole, drilled within the tunnel perimeter prior to its excavation. In the work, data from the pilot holes ONK-PH08…PH14 and ONK-PH16...PH17 were used to study the geophysical response caused by fracturing. Geophysical anomaly values and corresponding local background values were picked from the geophysical logging profile at each fracture location, together with the average and standard deviation, and a gradient computed. The standard deviation was used as a threshold value in the selection, and the gradient in the rejection of anomalies related to features of the rock mass other than a fracture.
Anomaly values were normalised within each method to a range of 0 – 100 % and the contributions from several logging methods were combined. The applicability of different methods and their combinations in the detection and classification were assessed by examining the match between the anomalies and TCFs (i.e. potentially large fractures) mapped from the tunnel and projected onto the investigated drillcore.
Only some of the fractures reported from the core were associated with geophysical anomalies, and the applied geophysical logging methods differed in their capacity to detect the TCFs. Borehole radar did not provide encouraging results in this type of small-scale study, and Wenner resistivity was left entirely out of the final contemplation of the results, because of the noisy and smoothed-out fracture anomalies. The results based on electrical conductivity and full waveform sonic data matched the examined TCFs fairly well, and some TCFs were associated with prominent anomalies in density or susceptibility. For some TCFs, no anomalies were observed with any of the methods.
72
As a general rule, a summary index of the observed anomalies seemed to discern the TCFs better than the indices calculated from single methods, although noticeable anomalies were also assiciated with some of the less significant fractures. In the calculation of the summary indices, the different logging methods were not balanced using any weighting factors. It would, however, be possible to give a higher weight for the methods providing higher potential for TCF detection, which could, perhaps, increase the accuracy of the detection.
The developed anomaly picking method, which is based on windowing, threshold values and normalisation, can be performed immediately after the drill core logging, when the fracture locations are available and geophysical data have been depth adjusted. The technique will allow all fractures within the investigated drillhole to be assessed on the basis of the results. The test suggests that the anomaly index method gives tentative information on the locations of potentially large fractures, and thus serves as a supplementary tool for geological logging. Activity 3: The application of seismic methods for locating large fractures, brittle fault zones and hydrogeological structures
Posiva has carried out two phases of reflection seismic surveys in the ONKALO, with the aim of examining the suitability of seismic investigations for the detailed characterisation of Olkiluoto bedrock, for example in detecting large fractures.
In 2007, one of the reflection seismic surveys was conducted on the wall of the access tunnel at a depth of approximately 170 m (tunnel length from 1720 m to 1820 m). The target of the survey was to develop field acquisition and processing techniques and to demonstrate the method's capability of detecting brittle deformation zones and large fractures in different parts of the rock mass. The seismic source used was the Vibsist-20, the receivers used were 2-component geophones and the digital seismograph had 100 channels. The reflection data were processed as a standard 2D seismic line.
In the second campaign in 2009, the survey line was over 240 m long at a depth of about 350 m (tunnel length from 3325 m to 3585 m). The seismic source used was the Vibsist-250, the receivers were 3-component geophones and the seismograph had 240 channels. 3D Image Point migration (Cosma et al. 2010) algorithms were used to create 3D oriented, migrated sections.
The 2007 survey concluded that it would be feasible to carry out seismic surveying in the tunnels, specifically with 3D-geophones, a longer measuring profile and the application of more source positions. According to the comparison of the seismic data with known geological, geophysical and hydrogeological features observed in the tunnel, seismic techniques would be able to locate features from the site scale (e.g. brittle fault zones) to the tunnel scale (e.g. large fractures) The results also correlated with the hydraulically conductive zones.
Reflectors from the 2009 survey data were digitised and triangulated into digital terrain models. The interpretation was carried out by correlating the reflectors with known geological, geophysical and hydrogeological features mapped in the tunnel, logged from the drill cores and measured in the pilot holes. The approach used in the interpretation included geometrical correlation and detailed studying of properties that possibly explained the seismic reflectivity.

73
It is concluded from the results of the two investigations that reflection seismic surveys are applicable to the detailed characterisation of crystalline bedrock, but that the interpretation of the results could be laborious. Integrated analysis and modelling of geological, hydrogeological and geophysical data is needed in the interpretation of seismic reflection data, in order to enable assessment of the origins of the reflectors (a lithological contact or a deformation zone, for example) and of their possible correlation with the known features. Relatively small-scale features, even single fractures, can demonstrably be detected, when they are accompanied by changes in the physical properties of the surrounding rock. On the other hand, the detection of some distinctive large-scale features can be uncertain, for example due to structure geometry.
Activity 4: Suitability of ground penetrating radar for locating large fractures
In this task, the suitability of the ground penetrating radar (GPR) method for locating large fractures was assessed. The assessment used data measured with 100 MHz and 270 MHz radar tools in the ONKALO access tunnel, on the right-hand wall of the tunnel (as viewed down the tunnel), at chainage 3344 – 3578 and on the floor of the TKU-3 niche at chainage 15 – 55 and 25 – 67 m.
The GPR images were processed to enhance reflections and to suppress interference and diffraction effects. The images were placed on measurement position with 3D presentation software and geological mapping data from the tunnel were presented together with the GPR images. A review of the observed GPR reflections and an assessment of the visibility of large fractures was drawn on the basis of an examination of the 3D images.
The GPR tool can detect reflections from cleaned and dry tunnel floors and walls and the depth of penetration is 8-12 m for the 270 MHz antenna, which also has a high resolution. Coupling to the rock surface is good, which suppresses ringing and interference. Penetration is 20-24 m for 100 MHz antenna, which has a trade-off in a greater level of interference due to weaker contact with the surface because of the large antenna.
Different kinds of reflecting surfaces and diffractors can be observed in the images, such as lithological contacts and high grade shearing and also fractures. The correct procedure in applying the method is to use both raw and processed images during geological mapping to confirm the origin of reflections. Reflections deemed to be caused by fractures are useful in the compilation of 3D model objects. The orientation of the observed reflection traces (hyperbola) form apparent angles with the tunnel axis, which can be interpreted as the intersection (alpha) angle of the fracture plane with the tunnel axis. Great care is needed in computing the orientation of the reflector correctly.
Migration of the data will move the reflection to its correct location, if the intersection is perpendicular. Migration is suppressed, however, for vertical reflectors. In general, the GPR method is suitable for the detection of reflectors in the rock mass from the tunnel surfaces and these reflectors can be correlated to actual geological features by using mapping data and modelling. The GPR method is time and cost efficient to apply and can provide imaging of reflectors up to distances of 8-20 m from tunnel surface. Reflectors, which are confirmed as being large fractures, can also be traced for their visible length, depending on their geometry with respect to the tunnel axis.
74
4.8.4 Test conclusions
According to the results from Activity 1, there are certain geological properties of fractures that can indicate the presence of a a potentially large fracture, and should be taken into account when large fractures are predicted from pilot holes in the future. These properties are:
a N-S trending sub-vertical or approximately SE dipping sub-horizontal fracture orientation
an undulating and/or slickensided fracture surface profile
in addition to the most common filling minerals (calcite, pyrite, kaolinite and chlorite), illite, clay minerals, epidote, quartz and graphite are also present
the Joint alteration number (Ja) is ≥ 3
the fracture filling is thicker than in general.
However, due to many uncertainties related to predictions of potentially large fractures, it is almost impossible to suggest with a high degree of certainty that a specific fracture in a pilot hole is or is not large. In other words, a fracture in a pilot hole with strong large fracture indications does not necessarily mean that it is actually a large fracture and vice versa. There is thus an inherent uncertainty associated with large fracture predictions based on geological properties, and other methods should be used in support.
Results from Activity 2 suggest that using a summary index of the observed geophysical anomalies from fractures seems to give the best correlation with TCFs (i.e. potentially large fractures) - the correlation is poorer for indices calculated from single methods. However, anomalies can also be found for fractures which are not significant based on actual observations, thus suggesting that the method should be used as a complementary tool in combination with other methods in large fracture detection.
The results from Activity 3 suggest that reflection seismic surveys are applicable to the detailed characterisation of crystalline bedrock, but that the interpretation of the results could be laborious. Geological, hydrogeological and geophysical verification is required to relate the reflectors to known features and to estimate the existence of unknown features. If the results from seismic reflection surveys are examined independently, it is difficult to explain the origins of reflectors and to predict their geological significance. However, the method demonstrably detects small-sized features, even when it is physically improbable, but on the other hand, the detection of some large-scale distinctive features can be uncertain.
In general, the results from Activity 4 suggest that the GPR method is suitable for the detection of reflectors in the rock mass from tunnel surfaces. The picked reflectors can be further correlated to actual geological features by using available mapping data and complementary modelling. The GPR method is time and cost efficient to apply and can provide imaging of reflectors up to distances of 8-20 m from tunnel surface. Reflectors, which are confirmed as being large fractures, can be traced for their visible length, depending on their geometry with respect to the tunnel axis.
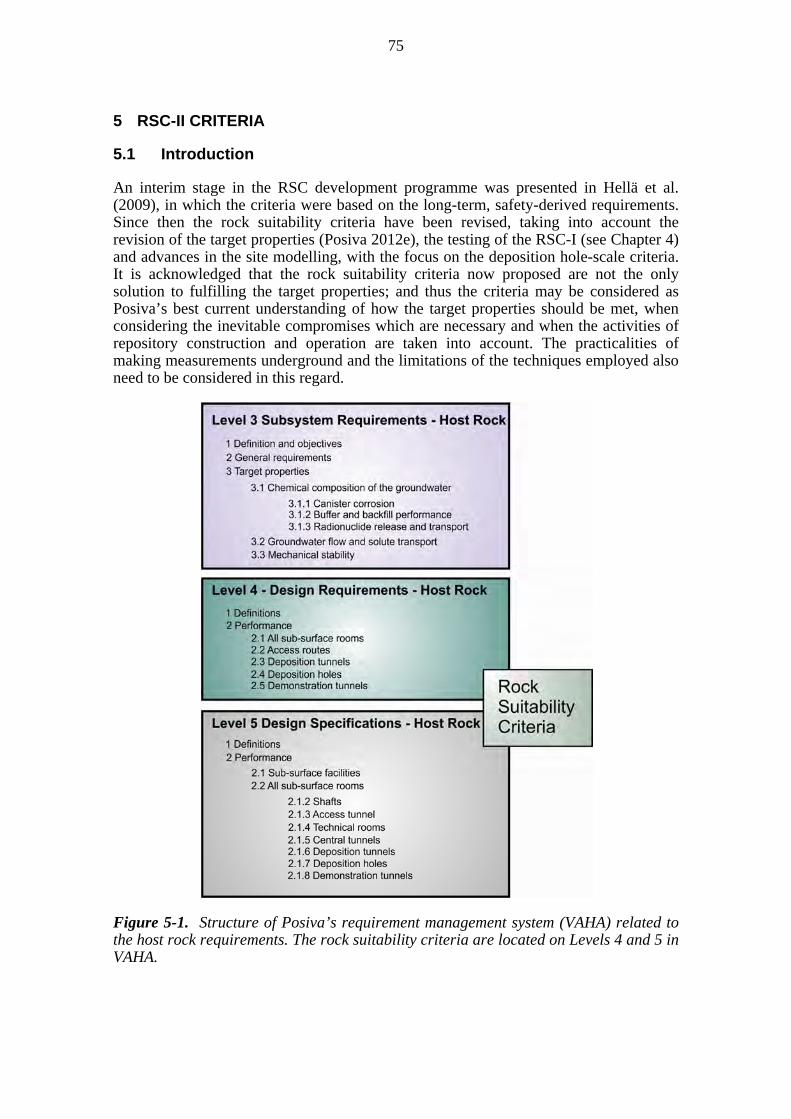
75
5 RSC-II CRITERIA
5.1 Introduction
An interim stage in the RSC development programme was presented in Hellä et al. (2009), in which the criteria were based on the long-term, safety-derived requirements. Since then the rock suitability criteria have been revised, taking into account the revision of the target properties (Posiva 2012e), the testing of the RSC-I (see Chapter 4) and advances in the site modelling, with the focus on the deposition hole-scale criteria. It is acknowledged that the rock suitability criteria now proposed are not the only solution to fulfilling the target properties; and thus the criteria may be considered as Posiva’s best current understanding of how the target properties should be met, when considering the inevitable compromises which are necessary and when the activities of repository construction and operation are taken into account. The practicalities of making measurements underground and the limitations of the techniques employed also need to be considered in this regard.
Figure 5-1. Structure of Posiva’s requirement management system (VAHA) related to the host rock requirements. The rock suitability criteria are located on Levels 4 and 5 in VAHA.
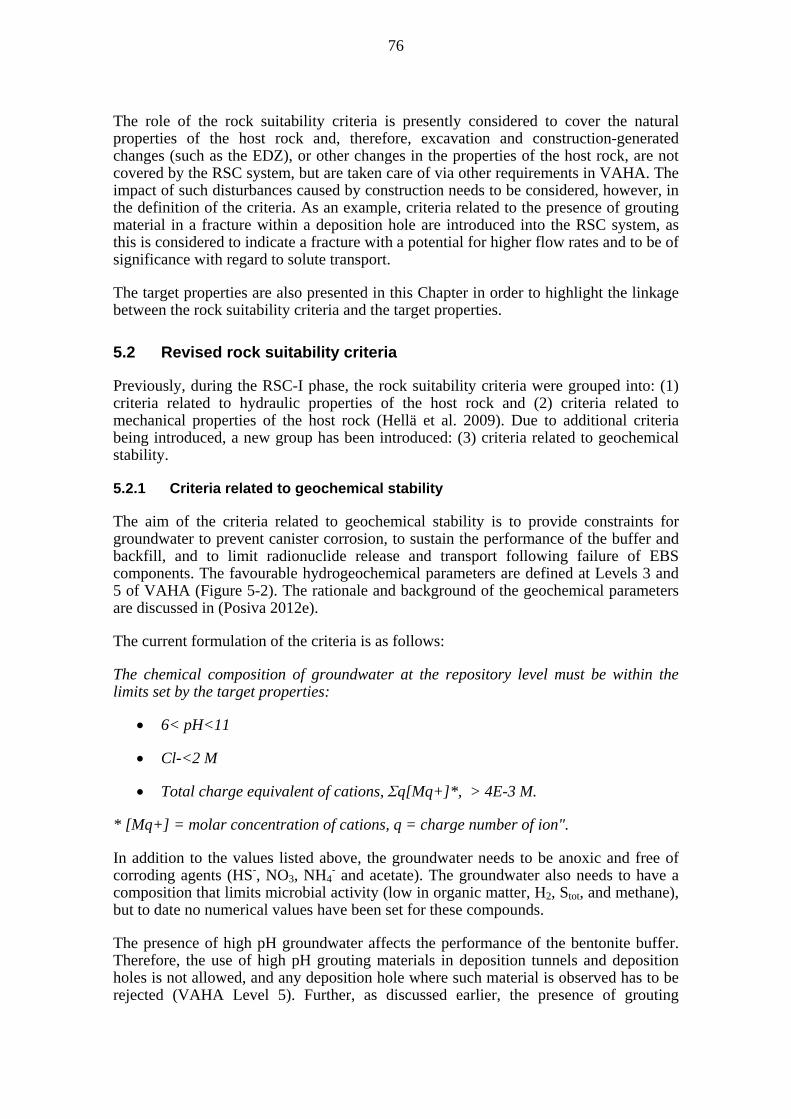
76
The role of the rock suitability criteria is presently considered to cover the natural properties of the host rock and, therefore, excavation and construction-generated changes (such as the EDZ), or other changes in the properties of the host rock, are not covered by the RSC system, but are taken care of via other requirements in VAHA. The impact of such disturbances caused by construction needs to be considered, however, in the definition of the criteria. As an example, criteria related to the presence of grouting material in a fracture within a deposition hole are introduced into the RSC system, as this is considered to indicate a fracture with a potential for higher flow rates and to be of significance with regard to solute transport.
The target properties are also presented in this Chapter in order to highlight the linkage between the rock suitability criteria and the target properties.
5.2 Revised rock suitability criteria
Previously, during the RSC-I phase, the rock suitability criteria were grouped into: (1) criteria related to hydraulic properties of the host rock and (2) criteria related to mechanical properties of the host rock (Hellä et al. 2009). Due to additional criteria being introduced, a new group has been introduced: (3) criteria related to geochemical stability.
5.2.1 Criteria related to geochemical stability
The aim of the criteria related to geochemical stability is to provide constraints for groundwater to prevent canister corrosion, to sustain the performance of the buffer and backfill, and to limit radionuclide release and transport following failure of EBS components. The favourable hydrogeochemical parameters are defined at Levels 3 and 5 of VAHA (Figure 5-2). The rationale and background of the geochemical parameters are discussed in (Posiva 2012e).
The current formulation of the criteria is as follows:
The chemical composition of groundwater at the repository level must be within the limits set by the target properties:
6< pH<11
Cl-<2 M
Total charge equivalent of cations, Σq[Mq+]*, > 4E-3 M.
* [Mq+] = molar concentration of cations, q = charge number of ion".
In addition to the values listed above, the groundwater needs to be anoxic and free of corroding agents (HS-, NO3, NH4
- and acetate). The groundwater also needs to have a composition that limits microbial activity (low in organic matter, H2, Stot, and methane), but to date no numerical values have been set for these compounds.
The presence of high pH groundwater affects the performance of the bentonite buffer. Therefore, the use of high pH grouting materials in deposition tunnels and deposition holes is not allowed, and any deposition hole where such material is observed has to be rejected (VAHA Level 5). Further, as discussed earlier, the presence of grouting
77
material in a deposition hole is an indication that there is a connection via the fracture network from the grouted area and, thus, the hole needs to be rejected in order to provide sufficient transport resistance.
Figure 5-2. Target properties and the RSC-related chemical stability of the host rock.
78
5.2.2 Criteria related to hydraulic properties
Rock suitability criteria related to hydraulic properties originate from four target properties, shown in Figure 5-3 and are situated at Levels 4 and 5 in VAHA. They contribute to locating deposition holes in places having favourable properties with regard to the long-term behaviour of the EBS from a safety perspective. The criteria also contribute to locating the deposition holes within those parts of the host rock having favourable radionuclide retention properties. These requirements are considered to be achieved by avoiding existing hydraulically-conductive parts of the rock mass. In addition, respect distances between canister locations and large fractures are set in order to avoid possible future hydraulic paths20.
Rock suitability criteria related to hydraulic properties were introduced at the repository and deposition hole scales in the first phase of the RSC work (Hellä et al. 2009). According to the RSC-I, the site-scale hydrogeological zones were to be avoided and a 20 m respect distance was considered adequate for these zones. As discussed in Hellä et al. (2009), universally applicable respect distances for hydrogeological zones are difficult to set, but existing data suggest that the transmissivity decreases outwards from the core of such zones, and at the distance of 10 m their influence on the transmissivity of the rock mass is minimal (see Section 5.3.4).
For the RSC-II, all the site-scale hydrogeological zones are included as LDFs and their respect distances are to be studied separately. However, a 20 m respect distance from the fault core is still considered valid in general.
During the development of the RSC-I it was concluded that a criterion to limit the inflow into a deposition tunnel would also be needed. The value is derived from testing of the current backfill; according to present understanding, flowing features with inflows of more than 0.25 L/min may lead to an unsatisfactory quality of the backfill (e.g. Dixon et al. 2008a,b,c; Dixon et al. 2011; Hansen et al. 2010; for detailed discussion see Posiva 2012e). Therefore, it is currently tentatively assumed that observations of a single fracture with an inflow ≥0.25 L/min would lead to the rejection of a tunnel section. However, this criterion will be dependent on the further development of the backfilling concept and is therefore subject to future review. Details on the practical measurement system are given in Section 4.7.2.
The inflow limit (0.1 L/min) into a deposition hole has remained unchanged since the publication of the RSC-I Interim Report (Hellä et al. 2009). As an additional prerequisite, a buffer layer of 0.5 m has been considered to be necessary between the canister and any fracture susceptible of being large enough to allow it to slip an amount greater than the buffer-canister system can tolerate (Posiva 2012e). This is based on the assumption that the fracture may become hydraulically-conductive after any slip has taken place (see Section 5.2.3 and Figure 5-8).
20 See Figure 5-5 and accompanying discussion of the large fracture criterion, which is significant from both a hydrogeological and a mechanical standpoint.

79
Figure 5-3. Target properties and the RSC-related hydraulic properties of the host rock. Only RSC-relevant requirements are shown in the figure.
80
There is uncertainty in the effects of rock shear on the hydraulic properties of fractures undergoing shear displacements, i.e. possible in a seismic event. It is possible that such shear displacements may lead to an increase in the transmissivity of the fractures and thereby increase the flow rate around the deposition holes, provided there is a connection to the flow-connected network of fractures; or disturb the buffer, or perhaps both. To limit transport also in these cases and to ensure that no direct contact between the canister and the rock is formed, a buffer layer is to be left between the canister and a large fracture. It is suggested that this buffer layer is 50 cm, as the diffusional mass transfer in terms of the equivalent flow rate through 50 cm of buffer, from the canister to the perturbed layer caused by a sheared fracture, is the same order of magnitude as the diffusional mass transfer from the canister to a fracture intersecting a deposition hole (a distance of 35 cm) – see discussion below in Section 5.2.3 and Figure 5-5.
Furthermore, a new criterion related to grouting material has been introduced: "No fracture in which grouting material has been observed or in which there are indications of grouting material is allowed in a deposition hole." This is due to the fact that the presence of grouting material indicates that the fracture in question has a connection to an existing hydrogeological feature21. 5.2.3 Criteria related to the mechanical properties of the rock
Rock suitability criteria related to the mechanical properties of the rock are related to minimising the likelihood of canister failure in the case of an earthquake. In VAHA the Level 3 requirement related to mechanical stability is formulated as follows (Figure 5-4):
"The location of the deposition holes shall be selected so as to minimize the likelihood of rock shear movements large enough to break the canister. Therefore, the likelihood of a shear displacement exceeding 5 cm in fractures intersecting a canister shall be low."
Theoretically, the larger the existing fracture or fault zone, the larger any earthquake-induced slip could be (e.g. Kim and Sanderson 2005). Although the application of such a linear scaling law might lead to oversimplification, it seems, despite the heterogeneous data sets, that a general, approximately linear relationship exists between the maximum displacement and the fault length (Kim and Sanderson 2005). The approach in the development of the rock suitability criteria has been based on the principle that keeping the deposition holes away from existing brittle fault zones, and their surrounding influence zones, and also away from single fractures which are large enough to slip significantly, limits the probability of canister failure in the case of an earthquake.
Fracture growth may also take place in repeated seismic events and Cowie and Scholz (1992) have suggested that growth may vary from 0.025 % to 2.5 % of the fault size. It is, however, generally recognized that, theoretically, the maximum displacement would take place in the central part of the fault, whereas the displacement should be zero in the tip area (e.g. Kim & Sanderson 2005; Barnet et al. 1987). In this regard, several repeated seismic events are likely to be needed to induce a single fracture, which
21 This the same criterion (L5-ROC-65) mentioned above in relation to chemical criteria. The presence of grouting material has both a chemical and a hydrogeological significance.

81
originally is outside the deposition hole, to propagate and to host a shear displacement of >5 cm (for detailed discussion see SKB 2011). In line with the discussion above, the RSC approach is to concentrate only on existing fractures, and their propagation is not taken into account.
Figure 5-4. Target properties and the RSC-related mechanical stability of the host rock.
The LDFs and their respect distance volumes are to be avoided in locating deposition tunnels and deposition holes (Hellä et al. 2009). This criterion has remained the same since the RSC-I report, but has been rephrased. A separate report dealing with the LDFs of the Olkiluoto area has been published (Pere et al. 2012) and a more concise terminology is defined in that report (Section 5.3 below summarises this report). As already discussed in the RSC-I report, the size of a fault is an important factor in the evaluation of its associated potential earthquake magnitude. Wells and Coppersmith (1994) have shown that a good correlation exists between earthquake magnitude, the surface rupture length of the fault, the subsurface rupture length and the rupture area. In
82
Posiva’s approach, the modelled brittle fault zones that have any dimension more than about 3 km are presently considered as an LDF that would theoretically be capable of hosting M 5.1 earthquakes (M=4.38+1.49*log(RDL)), where RDL is the subsurface rupture length; Donald et al. 1994).
Because of the difficulty of constraining the actual size of a fracture, the so-called FPI criterion was introduced by Munier (2006). This methodology was modified for the RSC-I (see Hellä et al. 2009) so that fractures that were traceable over the full perimeter of the deposition tunnel or an individual deposition hole were termed as FPI. The results of testing by Posiva (Kosunen et al. 2012; Käpyaho & Mattila 2011; see Chapter 4) and by SKB (Munier 2010) have identified that the degree of utilisation is sensitive to the respect distance between the canister and any FPI.
Since the RSC-I, the target property value set for the maximum shear displacement of the canister-buffer system has been decreased from 10 cm to 5 cm. This would mean, subject to the scaling law also being applicable at a small scale, that smaller fractures should also be avoided. Recent site-specific modelling results have indicated that fractures adjacent to three brittle fault zones (BFZ100, BFZ214, and BFZ099/021), but not intersecting these faults and having radii of less than 75 m, would be associated with only very modest shear displacements in the case of an earthquake (Fälth and Hökmark 2011). In the modelling, the earthquake hypocenter was focused on the three fault zones at Olkiluoto, which have variable sizes and orientations, and the slips induced in the three separate fractures sets surrounding the faults were studied. The displacement was more than 5 cm only by way of exception, even at distances as small as 100 m from the faults. In the cases of fault-intersecting fractures the maximum slip was ca. 25 mm. It is, however, noteworthy that uncertainties related to the necessary simplifications of the form of the fractures and faults need to be taken into account when interpreting the results.
Considering the variation in the orientation of the known brittle fault zones, it is unclear how representative the modelling results are for all the brittle fault zones in the Olkiluoto area. Also, if the brittle fault zones have much larger (depth) extents the rupture areas become larger, which could result in larger displacements on the fractures. On the other hand, the fractures and faults were modelled as planar features, which allows them to slip more easily than the fractures at the site, which are known to undulate. Despite these simplifications, the authors considered the results as "realistic-conservative" and thus, at least in the modelled case, the fractures with radii of less than 75 m would be acceptable from an earthquake perspective. It remains unclear, however, how applicable the results are for the whole of Olkiluoto, and, hence, studies are continuing. For the RSC demonstration the limiting fracture radius is set to 50 m, but at the moment this value is set only for demonstration purposes and will be re-evaluated when more data become available (see Chapter 7).
At the canister scale, no large fracture is allowed to intersect the canister position. As already discussed in Section 4.1, a sufficient layer of buffer between the canister and the fracture intersecting the deposition hole has to be left to provide sufficient transport resistance, in the situation where the fracture becomes hydraulically-conductive in the future. The thickness of this buffer layer is set to 0.5 m, (for background information see Posiva 2012e), thus meaning that FPI fractures are allowed to crosscut the deposition hole only above the canister (see Figure 5-5d). For the RSC-II phase, the large fracture criterion was modified in the following manner:
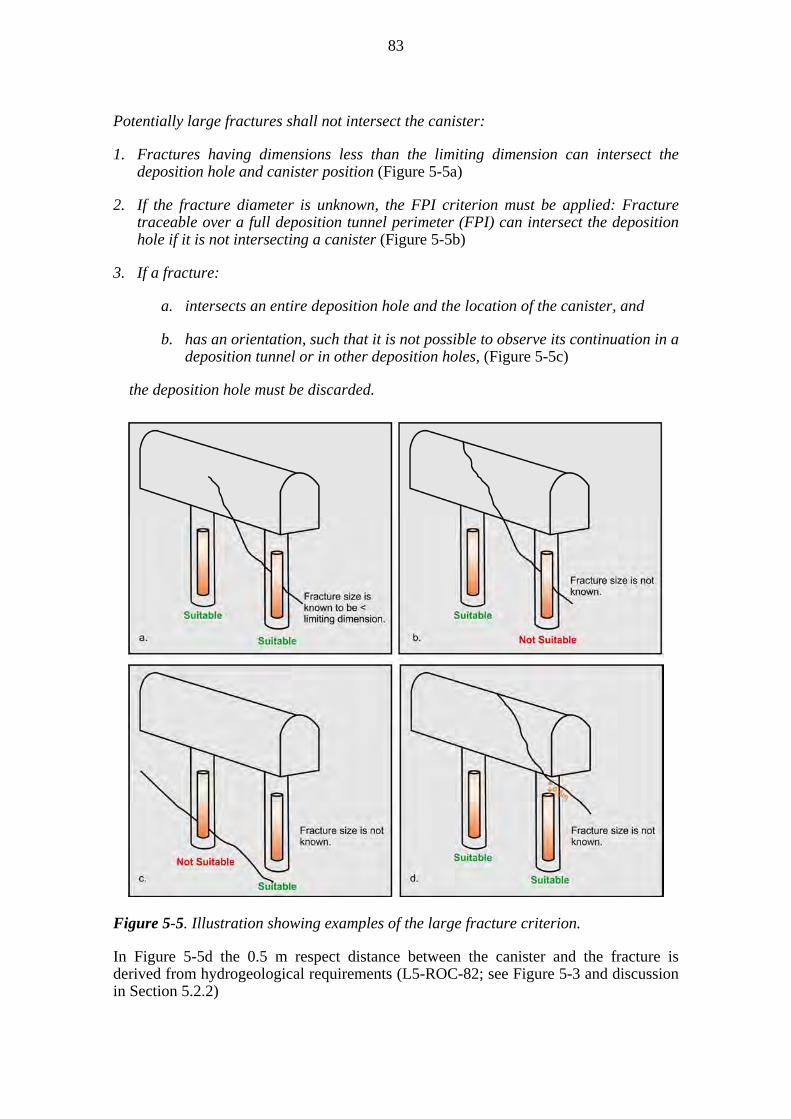
83
Potentially large fractures shall not intersect the canister:
1. Fractures having dimensions less than the limiting dimension can intersect the deposition hole and canister position (Figure 5-5a)
2. If the fracture diameter is unknown, the FPI criterion must be applied: Fracture traceable over a full deposition tunnel perimeter (FPI) can intersect the deposition hole if it is not intersecting a canister (Figure 5-5b)
3. If a fracture:
a. intersects an entire deposition hole and the location of the canister, and
b. has an orientation, such that it is not possible to observe its continuation in a deposition tunnel or in other deposition holes, (Figure 5-5c)
the deposition hole must be discarded.
Figure 5-5. Illustration showing examples of the large fracture criterion.
In Figure 5-5d the 0.5 m respect distance between the canister and the fracture is derived from hydrogeological requirements (L5-ROC-82; see Figure 5-3 and discussion in Section 5.2.2)
84
Discussion on the application of the large fracture criterion
According to the present understanding of the fracture characteristics at Olkiluoto, the application of the "large fracture criterion" will be the RSC criterion that has the greatest influence on the degree of utilisation. The situation in which it is possible to demonstrate, with a high level of confidence, that the dimensions of an individual fracture are sufficiently limited does not often exist. It is, however, considered that by combining observations from adjacent deposition tunnels (the tunnel separation is 25 m) with the results of geophysical surveys, such as GRP or reflection seismic, it may be possible to define the size of potentially large fractures more precisely. However, uncertainty in the dimension of the z-axis (depth) is likely to remain and, for this reason, the cases shown in Figure 5-5 are the most likely cases to be met in reality. The vertical deposition holes of the KBS-3V concept are sensitive to the presence of sub-horizontal fractures, and in areas where sub-horizontal fractures prevail, the degree of utilisation is likely to be relatively low.
The overall requirement of the Level 3 target properties related to mechanical stability (Figure 5-4), and thus to earthquake likelihood, and it is therefore essential to evaluate the use of the FPI criterion in the light of the future earthquake potential in the area, especially under postglacial conditions, when the largest earthquakes are possible.
5.3 Layout Determining Features (LDFs) their influence zones and respect distances at Olkiluoto
5.3.1 Introduction
Major fault structures located at the site of a planned repository may pose a risk to the repository by acting as mechanical discontinuities, with the possibility of their being reactivated during the present day or future stress fields, or by providing possible flow paths important for the transport of solutes, which could affect the chemical stability of the repository. It is, therefore, important to identify such structures, defined as LDFs, to assess their influence on the surrounding host rock and to determine a respect volume for the structures, which is designed to mitigate their possible harmful effects on the repository. This is also in accordance with YVL Guide D.5, which sets specific requirements for such geological structures:
“Such structures and other characteristics of rock surrounding the waste emplacement rooms which may have importance regarding groundwater flow, rock movements or other factors affecting long-term safety, shall be defined and classified. Modifications of the layout of the underground openings shall be provided for in case that the quality of rock surrounding the designed excavations proves to be significantly inferior to the design basis.”
This Section provides a summary of the definitions for LDFs, respect volumes and the components that make up a fault zone structure. The requirements set by STUK are further elaborated from the perspective of long-term safety and are discussed in the context of the RSC programme. In addition, the methodology for defining influence zones and respect distances for the LDFs is also described and the results from Olkiluoto are presented. More detailed descriptions of these are provided in Pere et al. (2012).
85
5.3.2 Definitions
Before providing a description of LDFs and their respect volumes in the following Sections, it is necessary to introduce the basic concepts associated with the fault zone structures, in order to clarify the character of the LDFs. A short review of the modern understanding of fault zone architecture is presented below, with brief explanations of the terms fault core, damage zone, influence zone, respect distance and respect volume.
Fault zone structure
A widely-accepted conceptual model of the architecture of brittle fault zones includes a fault core, representing the localisation of strain during slip events, and an associated damage zone, mechanically related to the growth of the fault, surrounded by relatively undeformed host rock (Figure 5-6) (e.g. Caine et al. 1996, Kim et al. 2004, Faulkner et al. 2010). Fault zones may consist of a single, discrete slip surface (Caine et al. 1996; Chester & Logan 1986) or of non-cohesive, clay-rich gouge or brecciated zones, with multiple, anastomosing core strands, separating lenses of damaged host rock (Faulkner et al. 2003). Subsidiary fault cores may branch out of the main fault plane.
On both sides of the fault core, fault zones are represented by transitional damage zones between the fault core and the undeformed host rock (Sibson 1977, Chester & Logan 1986, Caine et al. 1996). The damage zones are typically characterised by shear fractures, increased fracturing compared with the averagely fractured surrounding rock mass, en echelon zones of tension gashes and other brittle structures. Damage zones contain fractures ranging from microfractures to larger fractures that may show signs of shear and cataclastic deformation.
In crystalline rocks fault zones and single joints have the potential to act as preferential water-conducting structures, depending on their properties (Brace 1980, Barton et al. 1995, Evans et al. 1997, Caine & Forster 1999). The fault zone structure and the deformation history of the fault zones also have significant implications for the hydraulic properties of the faults. The permeability of fault cores is mainly controlled by the grain-scale permeability of fault rocks - fault rocks with high proportions of small grain sizes or mineral precipitations generally have lower permeabilities than fault cores with higher grain sizes or intense fracturing (Chester & Logan 1986, Antonelli & Aydin 1994, Caine et al. 1996). The permeability of damage zones, on the other hand, is controlled by the hydraulic properties of the fracture network and by any subsidiary structures; and in old crystalline rocks with long deformation histories, grain size comminution within fault cores has typically progressed quite far and therefore damage zones tend to be more permeable than their phyllosilicate-rich fault core counterparts (Evans et al. 1997, Faulkner & Rutter 2001).
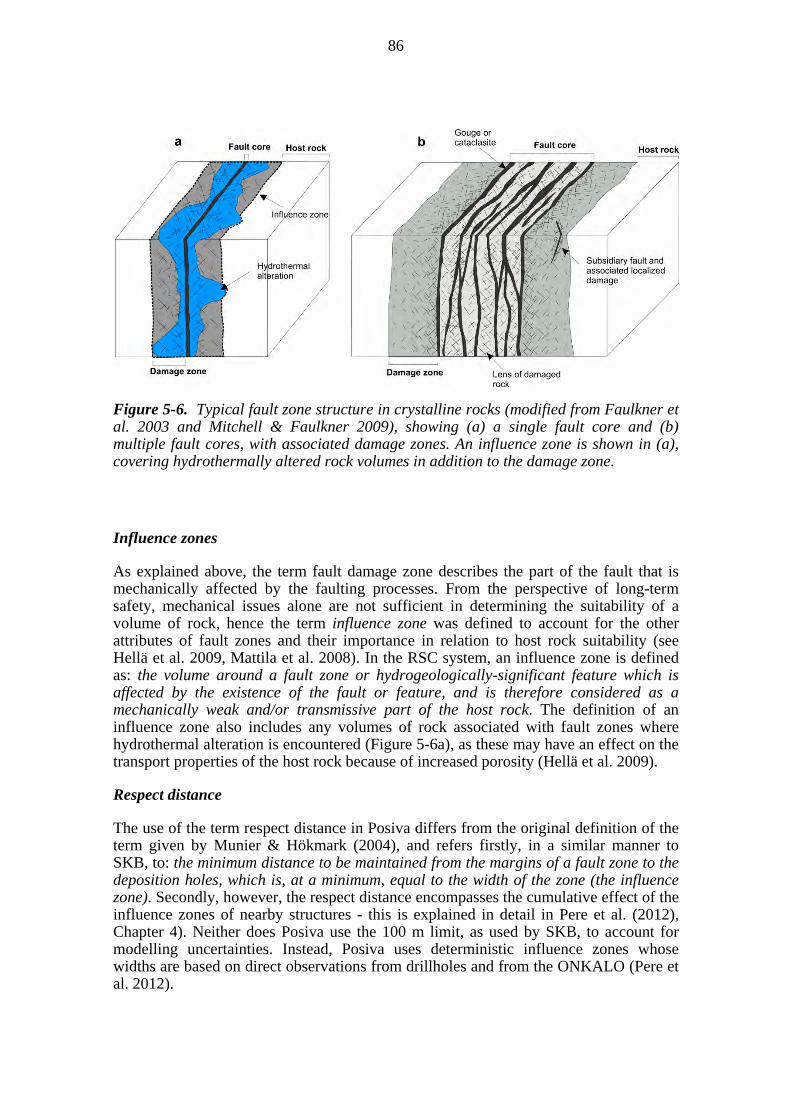
86
Figure 5-6. Typical fault zone structure in crystalline rocks (modified from Faulkner et al. 2003 and Mitchell & Faulkner 2009), showing (a) a single fault core and (b) multiple fault cores, with associated damage zones. An influence zone is shown in (a), covering hydrothermally altered rock volumes in addition to the damage zone.
Influence zones
As explained above, the term fault damage zone describes the part of the fault that is mechanically affected by the faulting processes. From the perspective of long-term safety, mechanical issues alone are not sufficient in determining the suitability of a volume of rock, hence the term influence zone was defined to account for the other attributes of fault zones and their importance in relation to host rock suitability (see Hellä et al. 2009, Mattila et al. 2008). In the RSC system, an influence zone is defined as: the volume around a fault zone or hydrogeologically-significant feature which is affected by the existence of the fault or feature, and is therefore considered as a mechanically weak and/or transmissive part of the host rock. The definition of an influence zone also includes any volumes of rock associated with fault zones where hydrothermal alteration is encountered (Figure 5-6a), as these may have an effect on the transport properties of the host rock because of increased porosity (Hellä et al. 2009).
Respect distance
The use of the term respect distance in Posiva differs from the original definition of the term given by Munier & Hökmark (2004), and refers firstly, in a similar manner to SKB, to: the minimum distance to be maintained from the margins of a fault zone to the deposition holes, which is, at a minimum, equal to the width of the zone (the influence zone). Secondly, however, the respect distance encompasses the cumulative effect of the influence zones of nearby structures - this is explained in detail in Pere et al. (2012), Chapter 4). Neither does Posiva use the 100 m limit, as used by SKB, to account for modelling uncertainties. Instead, Posiva uses deterministic influence zones whose widths are based on direct observations from drillholes and from the ONKALO (Pere et al. 2012).
87
In the original definition used by SKB, the respect distance (e.g. Munier et al. 1997, Appendix 1; Munier & Hökmark 2004) has been defined as the minimum distance to be kept from the margins of a potentially earthquake-hosting fault zone to the deposition holes, being equal to the width of the zone, but no less than 100 m. The margin, as referred to in the definition, is equal to the margin of the damage zone. Respect volume
The respect volume refers to: the volume of rock, which needs to be avoided by deposition holes and tunnels and is the 3D equivalent of the respect distance.
5.3.3 Layout determining features (LDFs)
The term LDF is used to describe a major geological or hydrogeological feature in the bedrock which may affect the long-term safety of the repository, and should therefore be avoided by deposition tunnels and deposition holes. Central tunnels and the access tunnel may, however, intersect these features. An overview is provided below of the methodology for defining these LDFs – for a more thorough review, the reader is referred to Pere et al. 2012.
Layout determining features due to earthquake potential
During future deglaciations, the relatively sudden changes in the stress state of the bedrock due to the removal of the load from the ice cap may promote the reactivation of fault zones and increase the possibility for large post-glacial earthquakes (Johnston 1987, Talbot & Slunga 1989). During such an event, displacements may also take place on fractures located outside the actual rupturing fault zone, which are induced by the stress changes caused by the earthquake (Bödvarsson et al. 2006, Fälth & Hökmark 2006). The amount of induced displacement that can take place on an isolated fracture is dependent on the size of the fracture, the distance of the fracture from the main rupture zone and the magnitude of the earthquake. Fälth & Hökmark. (2011) concluded that faults with a trace length less than 3 km cannot host earthquakes that would cause induced displacements larger than 5 cm, suggesting that this is also a valid lower limit for the size of layout-determining fault zones, if only the mechanical aspects are considered. It is noted that in this study new fractures were not anticipated to form or old fractures to propagate outside the damage zone during the rupture (Fälth & Hökmark 2011). The magnitude of an earthquake capable of producing induced displacements >5 cm is in the range of 5.5 or larger (Fälth & Hökmark 2011). Based on these analyses, a size of 3 km is set as a limit for defining whether or not a fault zone is a LDF – features having trace lengths close to or larger than this are defined as LDFs from a mechanical point of view.
Layout determining features due to transport potential
Posiva has defined target properties for the host rock, taking into account geochemical, flow and transport properties, as well as the mechanical stability of the host rock (see Chapter 4). More specifically, the following target properties have been defined in relation to flow and transport around the deposition holes:
Under saturated conditions the groundwater flow in any fracture in the vicinity of a deposition hole shall be low to limit mass transfer to and from the EBS.
88
Therefore, the flow rate in such a fracture shall be in the order of one litre of flow per one metre of intercepting fracture width in a year (l/(m*year)), at the most. In case of more than one fracture, the sum of the flow rates is applied.
Flow conditions in the host rock shall contribute to providing a high transport resistance. Therefore, migration paths in the vicinity of the deposition hole shall have a transport resistance (WL/Q) higher than 10,000 years/m for the majority of the deposition holes and, at a minimum, a few thousand years/m.
Around the deposition tunnels, groundwater flow shall be limited to ensure the performance of the backfilling.
The extensive site characterisation activities (see e.g. Posiva 2012) at Olkiluoto have shown that groundwater flow at the site is concentrated in the large-scale hydrogeological zones and is of limited extent in fractures outside these zones. The high flows associated with hydrogeological structures with high transmissivities may have an effect on the performance of the EBS. Also, the possibility of water flowing into the tunnels may affect the groundwater chemistry, by causing the upconing of saline groundwater, the intrusion of dilute surface waters and other possible changes, due to increased rates of flows and changes in flow conditions and directions. The hydrogeological zones may also provide fast transport pathways for any radionuclides released from the spent fuel. Thus, to be able to meet the target properties, and thereby the requirements set out in Guide YVL D.5, the most significant hydrogeological zones are defined as LDFs and are not allowed to intersect the deposition tunnels.
Hydrogeological features with high transmissivities (T ≥10-6 m2/s, geometric mean of measured T at the zone intersections) and large dimensions (assumed lateral extension of several hundred of metres) have been defined as LDFs. The transmissivity criteria (T ≥10-6 m2/s) is based on the possible implications discussed above, but also on the high flow rates and low WL/Q related to zones with such a high T (see e.g. Löfman & Poteri 2008, Figure 4-21; p. 86). Also, well-known, large-scale features with lower transmissivity are included as LDFs, based on expert judgment, using the following rationale:
a high level of confidence in the modelled structure (number of drillhole intersections, pressure/flow responses etc.),
the corresponding feature exists in the geological model (as a BFZ) and
the scale and significance of the structure for groundwater flow at the site (site scale vs. local scale).
According to the current hydrogeological structure model (Vaittinen et. al. 2011) the zones HZ19C, HZ20A, HZ20B, HZ039 and HZ146 are defined as LDFs, as their transmissivities are ≥10-6 m2/s and their extensions are at least several hundred of metres. The zones HZ21, HZ21B and HZ099 are defined as LDFs, based on expert judgement, even though their transmissivity is below the given limit. It is noted that hydrogeological zone HZ19C does not extend to the disposal depth of 420 m but, based on the high level of confidence in the structure, its high transmissivity (5.0·10-6 m2/s) and the continuation of the corresponding BFZ structure to the repository level, this zone has been included as an LDF.

89
Results from Olkiluoto
In the following table (Table 5-1) all the features at Olkiluoto which are classified as LDFs are listed, together with the defining criteria.
Table 5-1. The layout determining features at Olkiluoto.
Layout determining feature
Defining criteria
BFZ020a Size approximately or over 3 km
BFZ020b Size approximately or over 3 km
BFZ021 Size approximately or over 3 km
BFZ099 Size approximately or over 3 km
BFZ146 Size approximately or over 3 km
BFZ148 Size approximately or over 3 km
BFZ159 Size approximately or over 3 km
BFZ214 Size approximately or over 3 km
BFZ262 Size approximately or over 3 km
LINKED0112 Size approximately or over 3 km
LINKED0320_0166 Size approximately or over 3 km
LINKED0477 Size approximately or over 3 km
HZ19C Significant hydrogeological zone; T ≥10-6 m2/s
HZ20A Significant hydrogeological zone; T ≥10-6 m2/s
HZ20B Significant hydrogeological zone; T ≥10-6 m2/s
HZ21 Significant hydrogeological zone
HZ21B Significant hydrogeological zone
HZ039 Significant hydrogeological zone; T ≥10-6 m2/s
HZ099 Significant hydrogeological zone
HZ146 Significant hydrogeological zone; T ≥10-6 m2/s
5.3.4 Influence zones
In this Section a summary is presented of the methodology used for defining the influence zones for the layout determining brittle fault zones at Olkiluoto. Even though the discussion here focuses only on LDFs, the applicability of the methodology to all brittle fault zones in the Olkiluoto area and also elsewhere is also considered.
Defining the influence zone for brittle fault zones with direct observations
Defining the influence zone for brittle fault zones based on fracturing
The definition of the influence zone based on the density and type of fracturing is synonymous with the term "damage zone". The approach is to estimate visually the

90
limit where fault-related fracturing decreases to the level of normal background fracturing, or to assess whether there is a significant change in fracture types with increasing distance from the fault core. In unclear cases, where it is difficult to define a clear borderline between fault-related fracturing and intense background fracturing, the occurrence and orientation of slickenside fractures, or the degree of fracture surface alteration, can be used as a suggestive indicator for the extent of the influence zone. Pere (2009) has reported fracture surface and wall rock alteration related to fault zones at Olkiluoto. Slickensided fractures are typical fault-related fractures, in which movement on the fault has produced striations (indicators of movements) on the fracture planes, and it is also often possible to determine the shear sense from the morphology of the striations (Petit 1987, Doblas 1998). Defining the influence zone for brittle fault zones based on their hydrogeological properties
When the influence zone for a brittle fault zone is determined by using its hydrogeological properties, the main parameters used are fracture transmissivity, hydraulic conductivity and flow rate (for the definitions of these parameters, see Vaittinen et al. 2011). These parameters can be used to define the boundaries of an influence zone of a BFZ in cases where a distinguishable set of transmissive fractures can be seen to extend further from the fault core than the fault-related fracturing, eventually disappearing as the distance from the fault core increases. This procedure is carried out by visually estimating the extent of fault-related, hydrogeological parameters (mainly hydraulic conductivity) and by comparing the recognized anomaly with the local background levels. Defining an influence zone for a brittle fault zone observed in the tunnel
When a brittle fault zone is observed to intersect a section of the tunnel, the influence zone is delineated by visually estimating which fractures are related to the fault zone and by assessing their distribution on each side of the fault core. The fracture properties typically indicating association with the fault zone are: direct contact with the fault, a similar orientation to that of the fault, properties caused by faulting (e.g. slickensides), a high degree of alteration or possessing a fracture filling similar to that shown by the fault. The leakage of water from fractures close to a fault zone may also be considered to be related to the fault. In some cases, visible hydrothermal alteration in the host rock itself can also indicate the influence of the fault, due to the flow of hydrothermal fluids through microfractures.
Defining the influence zone for brittle fault zones and lineaments with no direct observations
Most of the fault zones at Olkiluoto have been investigated in detail, using observations from drillholes or from the ONKALO tunnel; however, some of the modelled fault zones are based solely on geophysical interpretations and are not intersected by any drillholes (for example the so-called bounding lineaments). Indirect measures are therefore required to define preliminary influence zones, until such features are investigated using direct methods. One approach is to use scaling laws, which describe the relationship between the dimensions of fault zone, such as length, displacement and fault core, and the widths of damage zones. Such scaling laws have been investigated for example by Scholz (2002) and Kim & Sanderson (2005) - the main principle behind
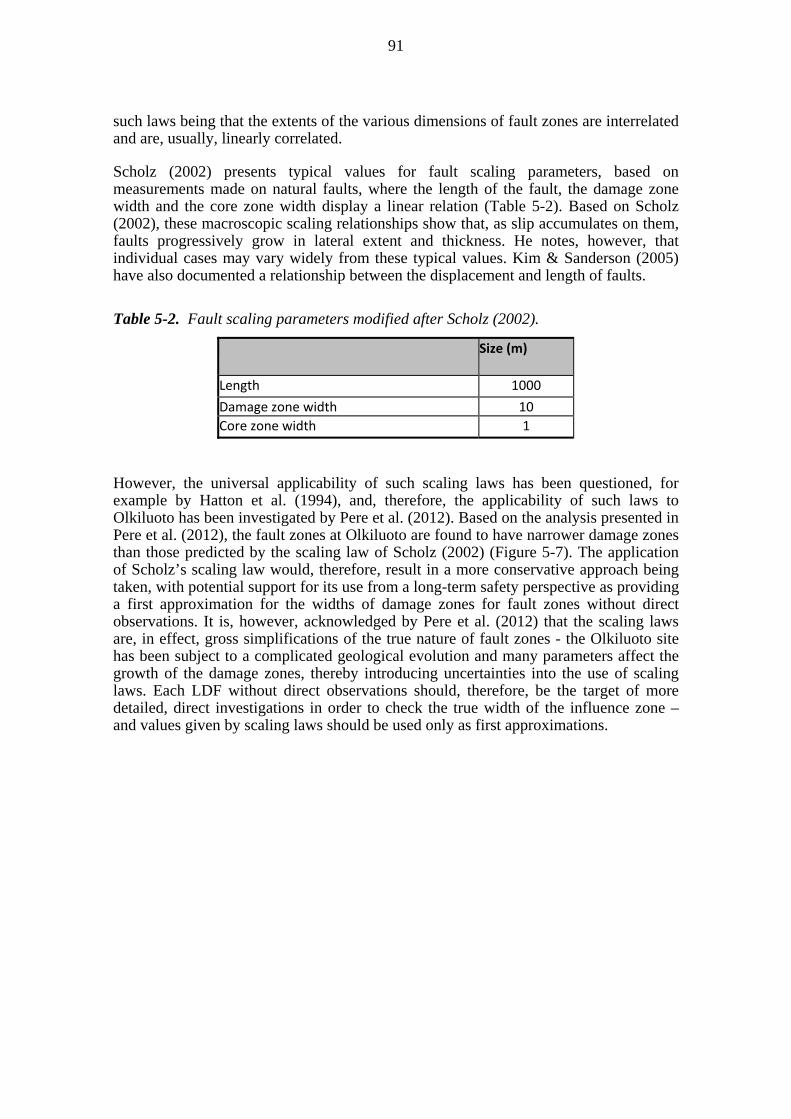
91
such laws being that the extents of the various dimensions of fault zones are interrelated and are, usually, linearly correlated.
Scholz (2002) presents typical values for fault scaling parameters, based on measurements made on natural faults, where the length of the fault, the damage zone width and the core zone width display a linear relation (Table 5-2). Based on Scholz (2002), these macroscopic scaling relationships show that, as slip accumulates on them, faults progressively grow in lateral extent and thickness. He notes, however, that individual cases may vary widely from these typical values. Kim & Sanderson (2005) have also documented a relationship between the displacement and length of faults.
Table 5-2. Fault scaling parameters modified after Scholz (2002).
Size (m)
Length 1000
Damage zone width 10
Core zone width 1
However, the universal applicability of such scaling laws has been questioned, for example by Hatton et al. (1994), and, therefore, the applicability of such laws to Olkiluoto has been investigated by Pere et al. (2012). Based on the analysis presented in Pere et al. (2012), the fault zones at Olkiluoto are found to have narrower damage zones than those predicted by the scaling law of Scholz (2002) (Figure 5-7). The application of Scholz’s scaling law would, therefore, result in a more conservative approach being taken, with potential support for its use from a long-term safety perspective as providing a first approximation for the widths of damage zones for fault zones without direct observations. It is, however, acknowledged by Pere et al. (2012) that the scaling laws are, in effect, gross simplifications of the true nature of fault zones - the Olkiluoto site has been subject to a complicated geological evolution and many parameters affect the growth of the damage zones, thereby introducing uncertainties into the use of scaling laws. Each LDF without direct observations should, therefore, be the target of more detailed, direct investigations in order to check the true width of the influence zone – and values given by scaling laws should be used only as first approximations.
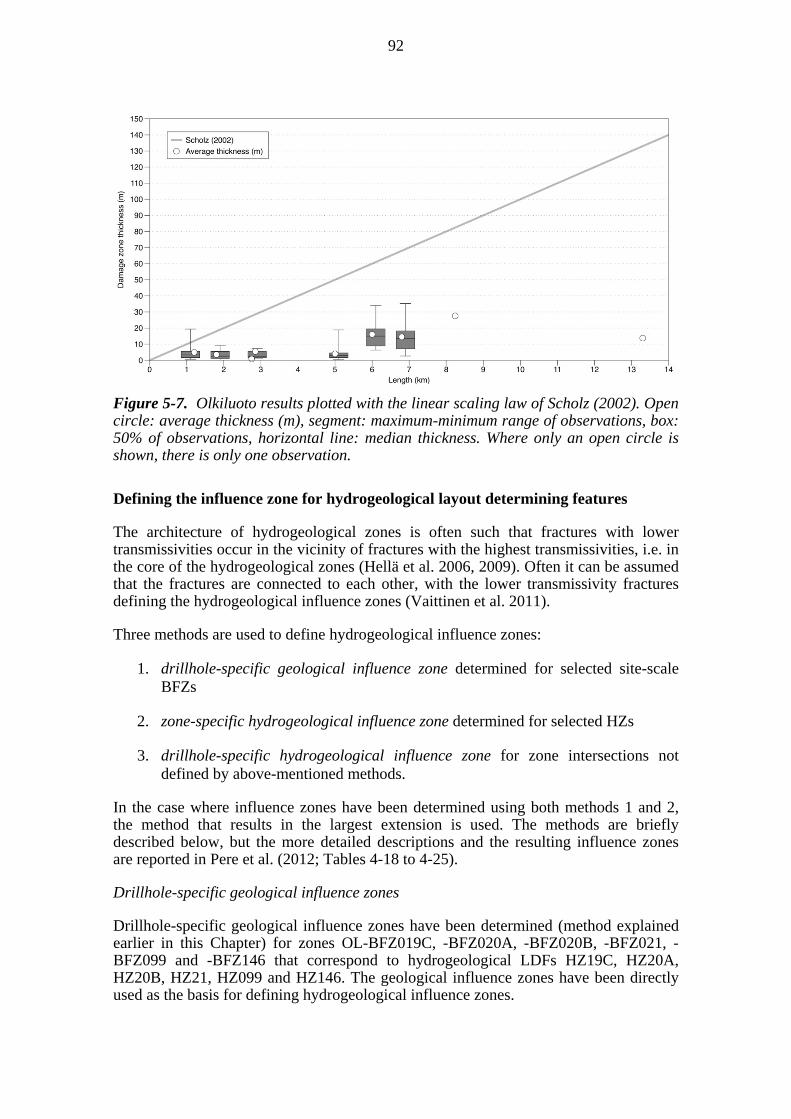
92
Figure 5-7. Olkiluoto results plotted with the linear scaling law of Scholz (2002). Open circle: average thickness (m), segment: maximum-minimum range of observations, box: 50% of observations, horizontal line: median thickness. Where only an open circle is shown, there is only one observation.
Defining the influence zone for hydrogeological layout determining features
The architecture of hydrogeological zones is often such that fractures with lower transmissivities occur in the vicinity of fractures with the highest transmissivities, i.e. in the core of the hydrogeological zones (Hellä et al. 2006, 2009). Often it can be assumed that the fractures are connected to each other, with the lower transmissivity fractures defining the hydrogeological influence zones (Vaittinen et al. 2011).
Three methods are used to define hydrogeological influence zones:
1. drillhole-specific geological influence zone determined for selected site-scale BFZs
2. zone-specific hydrogeological influence zone determined for selected HZs
3. drillhole-specific hydrogeological influence zone for zone intersections not defined by above-mentioned methods.
In the case where influence zones have been determined using both methods 1 and 2, the method that results in the largest extension is used. The methods are briefly described below, but the more detailed descriptions and the resulting influence zones are reported in Pere et al. (2012; Tables 4-18 to 4-25).
Drillhole-specific geological influence zones
Drillhole-specific geological influence zones have been determined (method explained earlier in this Chapter) for zones OL-BFZ019C, -BFZ020A, -BFZ020B, -BFZ021, -BFZ099 and -BFZ146 that correspond to hydrogeological LDFs HZ19C, HZ20A, HZ20B, HZ21, HZ099 and HZ146. The geological influence zones have been directly used as the basis for defining hydrogeological influence zones.
93
Zone-specific hydrogeological influence zones
The determination of zone-specific hydrogeological influence zones is based mainly on the analysis of flow logging (PFL) data (up to drillhole OL-KR48; Pöllänen 2009) but also on HTU (Hydraulic Testing Unit) data (up to drillhole OL-KR39; Hämäläinen 2007). The main reason to use HTU data was to analyse lower transmissivities above and below zones HZ20A, HZ20B, HZ21, HZ21B, and HZ099. In the analysis, measured transmissivities and hydraulic conductivities were visualized as cumulative plots as a function of distance, beginning from the core of a zone. Distances from the core were divided into classes 0−5 m, 5−10 m, 10−15 m, etc.
Some hydrogeological zones display several sections of high transmissivities and the study was carried out in both directions from the "core fracture" of the hydrogeological zones (i.e. in the hanging wall and footwall of a fault). According to the study, there appears to be a decreasing trend between transmissivity (log T) versus distance. The most transmissive sections were observed at a distance of 5−10 m from the core, which indicates that the average width of the hydrogeological influence zone for all the PFL data used in the study is in the order of 10 m from the core (Figure 5-8). A more detailed analysis of all different data sets is presented in Pere et al. (2012).
An analysis using all the HTU data suggests an influence zone of 10−15 m for the HZ20 zones. As a result of the analyses of the data around the HZ21 zones, a maximum value of 20 m for a hydrogeological influence zone on each side of the zone was defined (Table 5-3). These suggested values for the widths of influence zones are in agreement with both groups of data (PFL and HTU) and also incorporate the uncertainties remaining in the results of this preliminary study. The analysis carried out for the determination of the zone-specific influence zones are described in more detail in Pere et al. (2012).
Drillhole-specific hydrogeological influence zones
If neither a drillhole-specific geological nor a zone-specific hydrogeological influence zone is available, a drillhole-specific hydrogeological influence zone was applied. To determine the influence zone, a 10 m drillhole section, both upwards and downwards from the investigated drillhole intersection, was checked for fractures with transmissivity values one order of magnitude lower than the limit values for anomalous fracture transmissivities in the corresponding depth ranges (Table 4-17 in Pere et al. 2012). If such a fracture were found, the influence zone boundary was set at 10 m from that specific fracture. It was decided to assume a 10 m value, based on the analysis of the zone-specific hydrogeological influence zones that shows a clear decrease in transmissivities after 10 m distance from the fault core (Pere et al. 2012).
Results from Olkiluoto - brittle fault zones and bounding lineaments
Using the methodologies described above, Pere et al. (2012) have defined influence zones for all LDFs at Olkiluoto, with the results indicating that there is a considerable variation in the thicknesses of influence zones between different faults and also within each fault. The results also indicate that the influence zones are typically asymmetrically distributed around the fault core; however, the actual widths of the influence zone are generally narrower than indicated by the scaling laws of Scholz (2002).
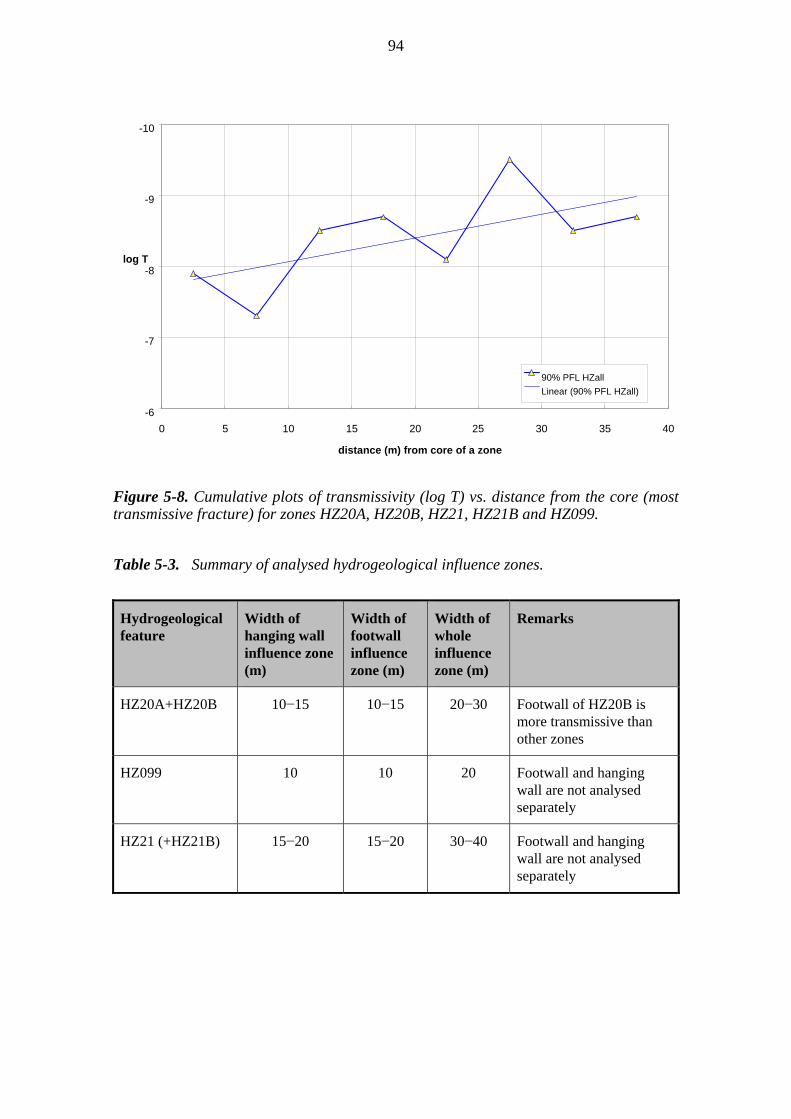
94
Figure 5-8. Cumulative plots of transmissivity (log T) vs. distance from the core (most transmissive fracture) for zones HZ20A, HZ20B, HZ21, HZ21B and HZ099.
Table 5-3. Summary of analysed hydrogeological influence zones.
Hydrogeological feature
Width of hanging wall influence zone (m)
Width of footwall influence zone (m)
Width of whole influence zone (m)
Remarks
HZ20A+HZ20B 10−15 10−15 20−30 Footwall of HZ20B is more transmissive than other zones
HZ099 10 10 20 Footwall and hanging wall are not analysed separately
HZ21 (+HZ21B) 15−20 15−20 30−40 Footwall and hanging wall are not analysed separately
-10
-9
-8
-7
-6
0 5 10 15 20 25 30 35 40
distance (m) from core of a zone
log T
90% PFL HZall
Linear (90% PFL HZall)
95
5.3.5 Respect volume
Methodology of defining respect volumes
SKB has investigated the subject of respect distance in relation to the magnitude of possible future earthquakes, the size of fractures hosting an induced secondary slip and observation of fractures in the Äspö tunnel, and also included a sensitivity analysis of these in Fälth & Hökmark (2006, 2011), Munier (2006, 2007, 2010), Bödvarsson et al. (2006) and Munier & Hökmark (2004). Munier & Hökmark (2004) defined the term respect distance as follows:
“The respect distance is the perpendicular distance from a deformation zone that defines the volume within which deposition of canisters is prohibited, due to anticipated, future seismic effects on canister integrity.”
According to Munier & Hökmark (2004), the seismic influence of faults and fractures dominates the definition of respect distance, in comparison with thermal and hydraulic aspects. Although the references given above set the baseline for the current project, in Posiva’s programme the major hydrogeological zones are also considered as LDFs, due to their higher permeabilities and the fact that such features provide possible transport routes for radionuclides and could result in future changes in groundwater chemistry (Hagros et al. 2005, Hellä et al. 2009). The hydrogeological influence zone is defined as a volume with a larger number of transmissive fractures than in the average host rock and with increased fracture connectivity. By avoiding the influence zone, the inflows to the deposition tunnels and holes are limited under open conditions and a greater transport resistance is provided under saturated conditions.
Based on the rationale given above, the respect distance is defined in Pere et al. (2012) as follows (modified after Hellä et al. 2009):
“The respect distance is the perpendicular distance from a deformation zone that defines the volume which shall be avoided by deposition tunnels and deposition holes, due to potential seismic effects on canister integrity, and further to create a high transport resistance for radionuclides.”
The respect volume is the volume resulting from the application of a respect distance to a 3D feature, describing the volume which needs to be avoided by deposition tunnels and holes. Typically, the respect volume is equal to the volume defined by the influence zone of a fault, composed of either of the mechanical damage zone or hydrogeological influence zone surrounding the fault, or a combination of both. However, a situation could arise where the influence zones of two or more fault zones or hydrogeological features coincide, but have slight differences in their extent, or where such influence zones partially overlap or are situated very close to each other, thereby creating volumes of rock between the influence zones which, although theoretically suitable for deposition purposes, are too small to be used in layout planning. In such cases, the influence zones of separate zones are combined into a single respect volume.
In addition to encompassing the influence zones of LDFs, or a combination of these, the respect volume may also be applied to cover the volumes of rock lying between fault splays, i.e. volumes of rock lying between divergent branches of a fault or faults, or volumes of rock considered as being associated with too much uncertainty in the structural model to be included in the suitable category. This is not, however, a strict

96
criterion, the definition of these specific volumes requires a certain degree of expert judgment and relates to the uncertainty of the applied structural model. At Olkiluoto this case has only been applied to brittle fault zones BFZ099 and BFZ021, which are considered to be two splays diverging from one fault plane at depth.
Several different cases arise for the determination of respect volumes, depending on the type of LDF and the methodology used to define influence zones. These cases are considered below.
Brittle fault zones and hydrogeological zones
For brittle fault zones and hydrogeological zones, the respect volume is exactly the same as the size of the influence zone. By definition, features identified as brittle deformation zones have been intersected by drillholes or a tunnel, and the size of the influence zone can be determined by direct observations.
Lineaments
The lineaments that bound Olkiluoto Island match the general case, where the respect volume is exactly the same as the lineament’s influence zone. For lineaments, direct observations of the influence zone are lacking, as there are no intersecting drillholes, and scaling laws or observations from similar fault zones are applied as a first approximation for the size of the influence zone before any direct observations.
Layout determining features with coincident or partly overlapping influence zones
LDFs located close to each other may have coincident or partly overlapping influence zones, in which case the respect volume is defined by the combination of the influence zones, and the resulting enveloping surface forms the outermost boundary of the respect volume.
5.3.6 Results from Olkiluoto
The respect volumes defined according to the guidelines described above are given in Table 5-4 and shown for the associated LDFs in Figure 5-9, for the -420 m level.

97
Table 5-4. Definition of respect volumes for LDFs.
Layout determining feature Definition of respect volume
HZ19C HZ19C envelope
BFZ020a HZ20 envelope
BFZ020b HZ20 envelope
HZ20A HZ20 envelope
HZ20B HZ20 envelope
BFZ021 HZ21 envelope
BFZ099 HZ21 envelope
HZ21 HZ21 envelope
HZ21b HZ21 envelope
HZ099 HZ21 envelope
BFZ146 HZ146 envelope
HZ146 HZ146 envelope
BFZ148 Influence zone, scaling laws
BFZ159 Influence zone, direct observations
BFZ214 Influence zone, direct observations
BFZ262 Influence zone, direct observations
LINKED0112 Influence zone, scaling laws
LINKED0320 Influence zone, scaling laws
LINKED0477 Influence zone, scaling laws
HZ039 Influence zone, direct observations

98
Fig
ure
5-9
. T
he la
yout
det
erm
inin
g fe
atur
es fo
r th
e O
lkil
uoto
are
a at
a d
epth
of 4
20 m
.
99
6 IMPLEMENTATION OF THE RSC SYSTEM
This Chapter describes the practical implementation of the RSC system as part of the repository construction process; its efficient implementation will necessitate its seamless integration with design, construction and research activities.
The implementation of the RSC system is carried out at different scales, including repository, panel, tunnel and deposition hole, which coincide with different stages of repository design and construction, proceeding from the design of the whole repository to the more detailed design and construction of panels, tunnels and, finally, deposition holes. It should be noted that this is, of course, a somewhat artificial division, and that the starting point for each stage could be defined in several different ways. Therefore, a decision has been made to consider the commencement of pilot hole drilling as the starting point for each consecutive stage.
This Chapter describes the interaction between the RSC system and other activities, such as layout design, detailed design, construction and investigations during the four stages, and outlines the suitability classifications in the respective scales. Sections 6.2, 6.3 and 6.4 describe the application of the RSC system for a single panel central tunnel, a deposition tunnel and a deposition hole, respectively. During the construction of the repository, it is likely that the implementation of the RSC system will also need to take into account the possible simultaneous construction of several deposition tunnels and holes.
6.1 Repository stage
The main function taking place at the repository stage is the layout design of the repository within the fixed host rock volume, including the overall design of the repository panels, as well as the access routes and other subsurface rooms needed for the operation of the repository.
With respect to the RSC system, the repository stage comprises two parts: classification of the known features of the Olkiluoto bedrock at the scale of the entire repository, and a preliminary classification of the rock volumes planned to host the single repository panels.
6.1.1 Classification of the features of the Olkiluoto bedrock
The classification carried out at the repository scale comprises classification of the known features of the Olkiluoto bedrock into LDFs and "non-LDFs", based on the latest site-scale models and other available site investigation data. The LDFs and their respect volumes, also defined by the RSC team, must be avoided in the design of the repository panels to ensure the long-term safety of the repository.
The current understanding of the LDFs, their properties and their respect volumes is discussed in Pere et al. 2012, with the main outcomes being summarised in Section 5.3 of this report. The layout design team has produced the latest repository layout according to these constraints22, and the degree of utilisation of the repository has been
22 Kirkkomäki, T. (2011). Loppusijoitustilojen layout 2011 (Repository layout 2011). Unpublished memorandum (in Finnish). Posiva's Kronodoc archive number POS-010807.

100
consequently estimated by the RSC team23, using the information provided by the latest version of the geological site model and the discrete fracture network (DFN) model (Aaltonen et al. 2010, Fox et al. 2011).
As new information becomes available from future site investigations and investigations carried out during repository construction, the bedrock features will be re-evaluated and the LDFs updated, as necessary. This is likely to lead to a re-evaluation and possibly an updating of the repository layout, or portions of it, by the layout design team.
6.1.2 Tentative suitability classification of a planned panel volume
Prior to starting focused investigations or the construction of a repository panel, the site investigation team will carry out preliminary modelling of the rock volume allocated for the panel in the repository layout. The model, called the detailed-scale model (DSM) from here on, will be compiled using data from the existing site models and from additional site investigation data, and will concentrate on depicting the RSC-relevant bedrock features, such as brittle fault zones, hydraulically-conductive features and large fractures, with as much detail as possible.
Based on the preliminary DSM, the RSC team will carry out a tentative suitability classification of the planned panel volume, as the focus shifts from the entire repository volume towards the scale of a single panel. The main purpose of this classification is to evaluate the plan presented for the panel in the repository layout and to determine possible needs for updates, especially considering the location of the central tunnels. It should be noted that, although no specific criteria have been defined for the central tunnels, the criterion pertaining to all subsurface rooms for avoiding LDFs and their respect volumes, as far as possible, needs to be taken into account. Other than that, the main factor affecting the positioning of the central tunnels is the optimal use of the available space, and in that respect, the criteria affecting the positioning of deposition tunnels, and to some extent also the deposition holes, are considered as far as possible.
6.2 Panel stage
The panel stage comprises the construction of the two parallel central tunnels of a repository panel and the detailed design of the panel layout. At the panel stage, the aim of the RSC system is to verify, firstly, the overall suitability of the selected rock volume for hosting a repository panel and, secondly, the suitability of the central tunnels. The RSC system will also produce a preliminary estimate of the panel’s degree of utilisation, and will provide information for the detailed design of the panel layout. The suitability of the planned panel volume will be assessed twice during the panel stage: after drilling of pilot holes for the panel central tunnels and after excavation of the central tunnels. Interaction between design, construction, investigations, modelling and RSC activities during the panel stage is illustrated by the flow chart given in Figure 6-1; the numbers in the following paragraphs refer to the numbered boxes in the chart.
23 Aaltonen, I. (2011). Estimation of degree of utilisation based on geological brittle fault zone model v.2.0 and GeoDFN v.2.0. Unpublished memorandum. Posiva's Kronodoc archive number POS-010028.
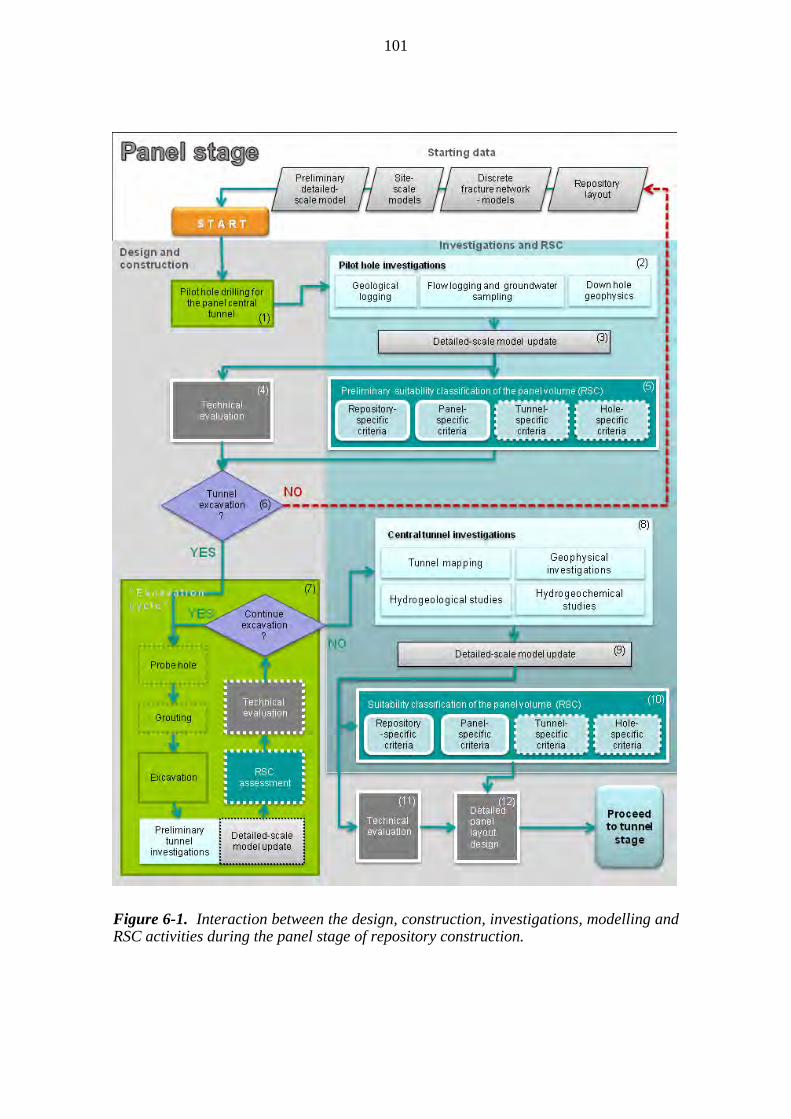
101
Figure 6-1. Interaction between the design, construction, investigations, modelling and RSC activities during the panel stage of repository construction.
102
6.2.1 Preliminary suitability classification of a repository panel
Once the preliminary design of a central tunnel has been carried out on the basis of the tentative suitability classification of the panel area (Section 6.1.2), the panel stage commences with the drilling of a pilot hole within the planned tunnel profile. After a series of investigations carried out in the pilot hole and on the drill core (2), the preliminary DSM of the panel area is updated with the new information (3). The standard pilot hole investigations comprise geological logging of the drill core, hydrogeological measurements (flow logging), groundwater sampling (if flowing fractures are found) and a large set of geophysical measurements, including optical and acoustic imaging of the holes. The site investigation team will produce a synthesis of the data produced by the investigations. This synthesis, known as the single hole interpretation24, will contain information on the locations and orientations of possible brittle fault zones, hydraulically-conductive features and large fractures, and will be used by the modellers to update the DSM.
Based on the updated DSM, the preliminary suitability classification of the panel rock volume will be carried out by the RSC team (5). The main aim of this assessment is to approve the selected central tunnel location, and to verify the fulfilment of the "repository- and panel-scale" criteria (i.e. the absence of LDFs, acceptable groundwater geochemical properties, etc.) within the panel volume. In addition to its use for the RSC assessment, the DSM and its associated data will also be used by the detailed design team to carry out a technical evaluation covering, for example, the need for grouting and rock support during the excavation of the central tunnel (4). Based on the RSC assessment and the technical evaluation, a decision on whether to excavate the central tunnel is made (6). At this point, for example the discovery of an LDF might require the revision of the existing panel layout; similarly, observed unfavourable hydrogeochemical conditions prevailing in the panel area might result in rejection of a part of or even the entire panel volume, and lead to an updating of the repository layout.
6.2.2 Suitability classification of a repository panel
Once excavation of the central tunnel has commenced (7), major bedrock features are mapped and measured after each excavated round (known as preliminary tunnel investigations). These data are evaluated and compared with the DSM, which at this point is updated only if the outcome significantly deviates from the predictions of the model. In such circumstances, the excavation is paused, and the situation is reassessed by the RSC team.
When the central tunnel reaches its designed length (or it is decided that construction should cease), investigations start in the tunnel (8). The investigations include detailed mapping of the walls and roof of the tunnel, measurements of possible structure-specific inflows and groundwater sampling (if considered necessary), as well as measurements
24 Once data from the various hole investigations has been processed and is ready for further use, representatives from the various disciplines (geology, geophysics, hydrogeology) get together and carry out a so-called "single hole interpretation". During the single hole interpretation, a synthesis of the various data is prepared, and bedrock features, such as the locations and widths of deformation zone cores and influence zones and possibly large fractures are determined. See Aalto et al. (2011) for an example.
103
of in situ stress and rock strength; in addition, tunnel seismic methods can be used to further characterise the rock volume.
The resulting data are used to update the DSM (9), which provides the basis for the second assessment of the suitability of the panel volume (10). Again, the aim of this classification is to verify the fulfilment of the repository- and panel-scale criteria, but in addition, the criteria pertaining to deposition tunnels and holes (see Section 5.2) are used to evaluate the influence of known features on the planned placement of deposition tunnels and holes, in order to estimate the panel’s degree of utilisation. Additional supporting information on the probable fracture density is provided by discrete fracture network (DFN) models.
It is acknowledged, however, that at this point the reliability of both the DSM and the suitability classification reduce with increasing distance from the central tunnel, and that they provide at best only a rough estimate of the conditions at a distance of 300 m, the planned maximum length of deposition tunnels. As earlier in the process, the DSM and its associated data are also used by the detailed design team to carry out a technical evaluation including, at this point, for example the evaluation of possible pre-grouting actions (11). Based on the technical evaluation and the RSC suitability assessment, the detailed design team can carry out the detailed design of the panel layout, choosing, for example, the exact locations and orientation of the deposition tunnels (12), so that the layout will be optimised in relation to any known undesirable host rock features. Following this, the RSC system proceeds to the tunnel stage.
6.3 Tunnel stage
The tunnel stage comprises the construction of deposition tunnels within a repository panel and culminates in selecting locations for deposition holes within the tunnels. The aim of the suitability classifications carried out at this stage is to verify, firstly, the overall suitability of the selected tunnel locations, i.e. to verify the fulfilment of the repository-, panel- and tunnel-specific criteria (see Section 5.2). Secondly, the aim is to apply the hole-specific criteria (see Section 5.2) in order to classify the rock volume below the tunnels and to divide the tunnels into sections that are possibly suitable or possibly not suitable for locating deposition holes. In addition, an estimate of the degree of utilisation for each tunnel is produced. The suitability classification is carried out twice during the tunnel stage. As during the panel stage, the first, preliminary suitability classification is carried out after the drilling of pilot holes, one within each planned deposition tunnel profile, and the second after the excavation of the tunnels. The interaction between design, construction, investigations, modelling and RSC activities during the tunnel stage is illustrated by the flow chart given in Figure 6-2; the numbers in the following paragraphs refer to the numbered boxes in the figure.
6.3.1 Preliminary suitability classification of a deposition tunnel
The tunnel stage commences with the drilling of a pilot hole (1) for a deposition tunnel location determined by the panel layout design, updated at the end of the panel stage (see Section 6.2.2). After a series of investigations have been carried out in the pilot hole and on the drill core (geological logging of the drill core, hydrogeological measurements, groundwater sampling and a large set of geophysical measurements) (2), the DSM is updated (3). It should be noted that, during repository construction, pilot holes are likely to be drilled for several tunnel locations before carrying out the investigations. The maturity of the DSM is largely dependent on the number of
104
available investigation data, and therefore several parallel pilot holes, which enable the use of cross-hole investigation methods, in addition to the standard set of investigations, are very likely to increase the reliability of the model. Cross-hole investigation methods to be used include mise-à-la-masse and hydraulic interference tests, which provide information on the extent and connectivity of structures. The investigations and the following model update are carried out by the site investigation team.
On the basis of this information, a preliminary suitability classification of the tunnel volume is carried out by the RSC team (4). The preliminary suitability classification aims, firstly, at further verification of the suitability of the selected tunnel location, i.e. the fulfilment of the repository- and panel-specific criteria (see Section 5.2). The identification of an LDF within the planned tunnel volume or the observation of unfavourable groundwater geochemical conditions, for example, could lead to outright rejection of the selected location and to updating of the panel layout.
Secondly, the preliminary suitability classification aims at producing a preliminary estimate of the degree of utilisation for the tunnel and to do this, the tunnel and deposition hole-specific criteria (see Section 5.2) are applied. In addition to the LDFs, the tunnel suitability is affected by smaller-scale hydrogeological structures and brittle deformation zones, as well as by large fractures, which affect deposition hole placement and, therefore, the tunnel’s degree of utilisation. These features, if present in the tunnel volume, are taken into account in the preliminary suitability classification, and the tunnel is divided into possibly suitable and possibly not suitable sections (the "Preliminary suitability chart") (4).
The information from the pilot hole, the DSM and the preliminary suitability classification is used by the detailed design team to carry out a technical evaluation of the planned tunnel volume (5). If the available data and the suitability classification imply that the fracture-specific tunnel inflow criterion (see Section 8.2) might not be fulfilled, once the tunnel is excavated, an evaluation of the possibility of reducing the flow to an acceptable level by pre-grouting would have to be carried out at this stage. It is important to note that if grouting were used, it might have an effect on the placement of deposition holes (see Sections 5.1, 5.2.1 and 5.2.2), but this effect could only be evaluated in subsequent suitability assessments.
The results from the preliminary suitability classification and from the technical evaluation are then used to make a decision on tunnel excavation (7). The detection of an LDF in the tunnel volume might lead to the rejection of the entire tunnel location, to the shortening of the tunnel in question, or to an update of the panel or repository layout design, depending on the feature's location and orientation. Also, if the technical evaluation were unfavourable (it may, for example, be concluded that the tunnel inflow criterion is likely to be exceeded, in spite of grouting); shortening of the tunnel or the rejection of its location could also be considered. In addition, the preliminary degree of utilisation of the tunnel would be taken into account in estimating the viability of its excavation.
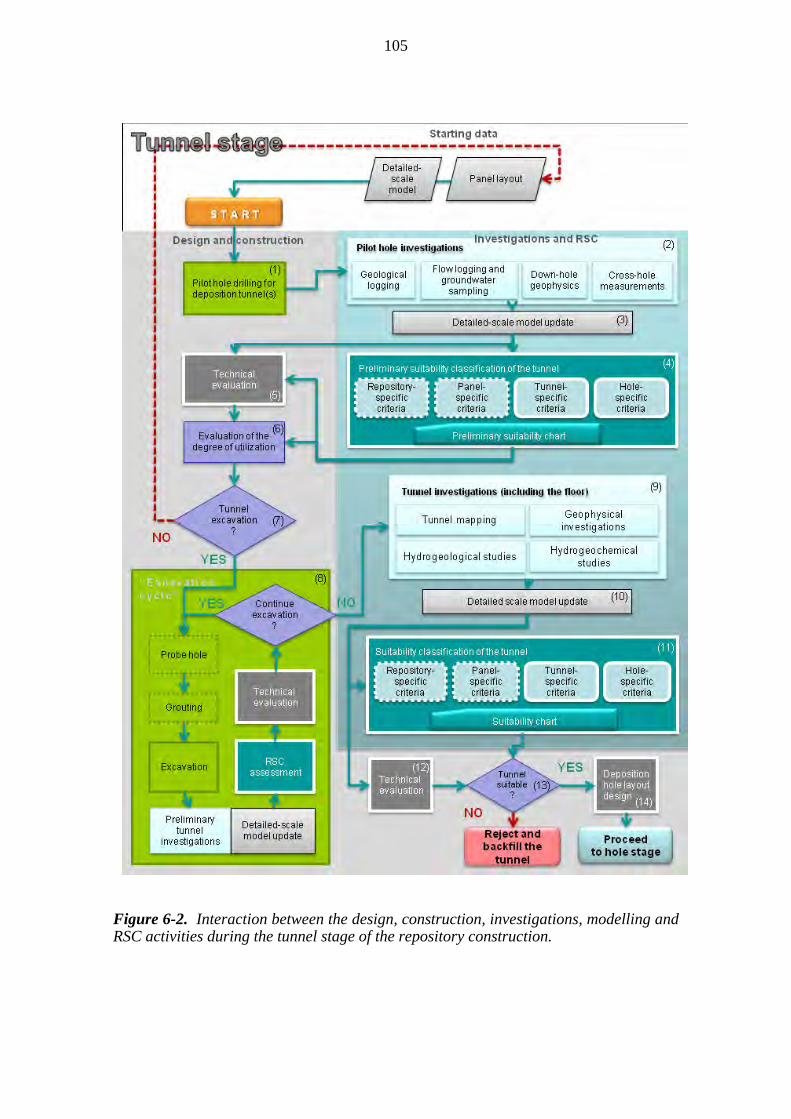
105
Figure 6-2. Interaction between the design, construction, investigations, modelling and RSC activities during the tunnel stage of the repository construction.

106
6.3.2 Suitability classification of a deposition tunnel
Once the decision on tunnel excavation has been made, excavation commences (8). Major bedrock features are mapped and measured after each excavated round (preliminary tunnel investigations) and the resulting data are evaluated and compared with the DSM, which at this point would be updated only if the outcome significantly deviated from the model’s predictions. In this case, the excavation would pause and the situation be reassessed by the RSC team.
When the tunnel has reached its designed length (or it is decided that construction should cease prematurely), investigations in the tunnel start and the resulting data are used to update the DSM (9, 10). These activities are, again, similar to the ones carried out in the central tunnel at the panel stage and are carried out by the site investigation team. The updated model provides the basis for the second suitability classification of the tunnel (11). In this assessment, the overall tunnel suitability is assessed again, paying particular attention to the fracture-specific tunnel inflow criterion. If the tunnel inflow limit, as defined by the criterion, were exceeded, technical solutions to reduce the inflow, or counteract its influence, should be considered as part of the technical evaluation of the tunnel (12).
Figure 6-3. Assessment of the fracture-specific tunnel inflow criterion in an excavated deposition tunnel.
For example, post-grouting may be considered as an option to reduce the inflow to an acceptable level (Figure 6-3). If post-grouting were to prove ineffective, or if it were
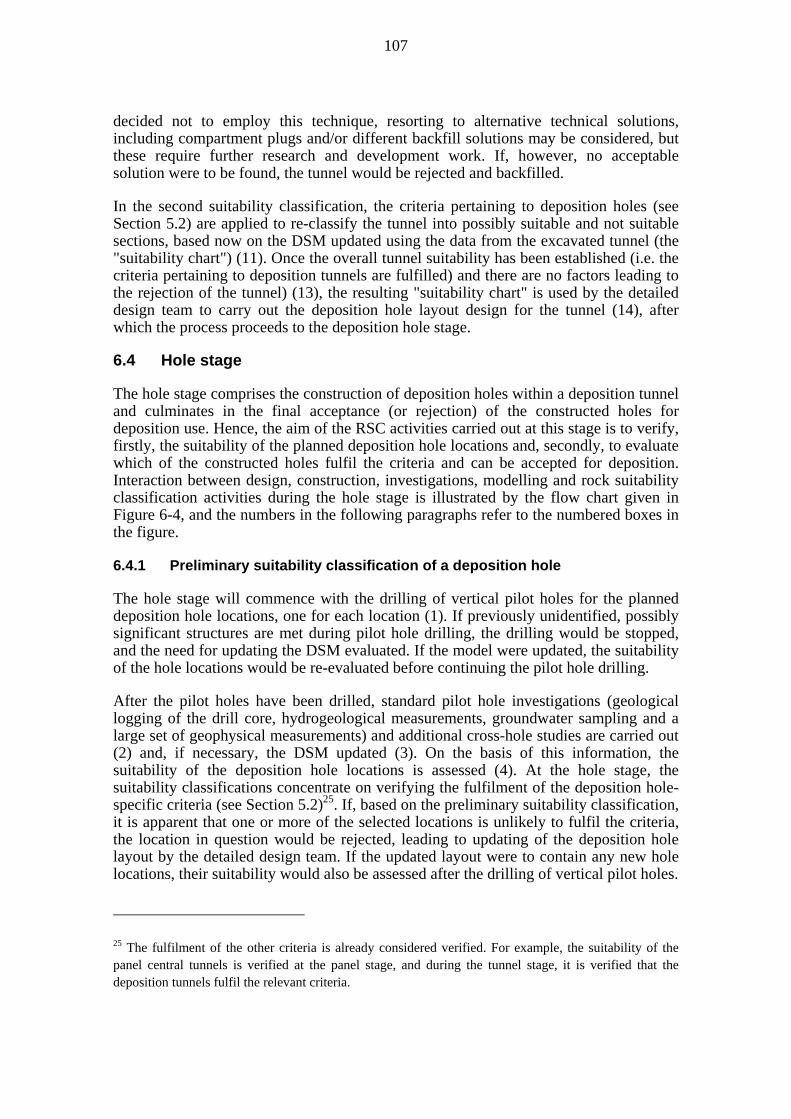
107
decided not to employ this technique, resorting to alternative technical solutions, including compartment plugs and/or different backfill solutions may be considered, but these require further research and development work. If, however, no acceptable solution were to be found, the tunnel would be rejected and backfilled.
In the second suitability classification, the criteria pertaining to deposition holes (see Section 5.2) are applied to re-classify the tunnel into possibly suitable and not suitable sections, based now on the DSM updated using the data from the excavated tunnel (the "suitability chart") (11). Once the overall tunnel suitability has been established (i.e. the criteria pertaining to deposition tunnels are fulfilled) and there are no factors leading to the rejection of the tunnel) (13), the resulting "suitability chart" is used by the detailed design team to carry out the deposition hole layout design for the tunnel (14), after which the process proceeds to the deposition hole stage.
6.4 Hole stage
The hole stage comprises the construction of deposition holes within a deposition tunnel and culminates in the final acceptance (or rejection) of the constructed holes for deposition use. Hence, the aim of the RSC activities carried out at this stage is to verify, firstly, the suitability of the planned deposition hole locations and, secondly, to evaluate which of the constructed holes fulfil the criteria and can be accepted for deposition. Interaction between design, construction, investigations, modelling and rock suitability classification activities during the hole stage is illustrated by the flow chart given in Figure 6-4, and the numbers in the following paragraphs refer to the numbered boxes in the figure.
6.4.1 Preliminary suitability classification of a deposition hole
The hole stage will commence with the drilling of vertical pilot holes for the planned deposition hole locations, one for each location (1). If previously unidentified, possibly significant structures are met during pilot hole drilling, the drilling would be stopped, and the need for updating the DSM evaluated. If the model were updated, the suitability of the hole locations would be re-evaluated before continuing the pilot hole drilling.
After the pilot holes have been drilled, standard pilot hole investigations (geological logging of the drill core, hydrogeological measurements, groundwater sampling and a large set of geophysical measurements) and additional cross-hole studies are carried out (2) and, if necessary, the DSM updated (3). On the basis of this information, the suitability of the deposition hole locations is assessed (4). At the hole stage, the suitability classifications concentrate on verifying the fulfilment of the deposition hole-specific criteria (see Section 5.2)25. If, based on the preliminary suitability classification, it is apparent that one or more of the selected locations is unlikely to fulfil the criteria, the location in question would be rejected, leading to updating of the deposition hole layout by the detailed design team. If the updated layout were to contain any new hole locations, their suitability would also be assessed after the drilling of vertical pilot holes.
25 The fulfilment of the other criteria is already considered verified. For example, the suitability of the panel central tunnels is verified at the panel stage, and during the tunnel stage, it is verified that the deposition tunnels fulfil the relevant criteria.
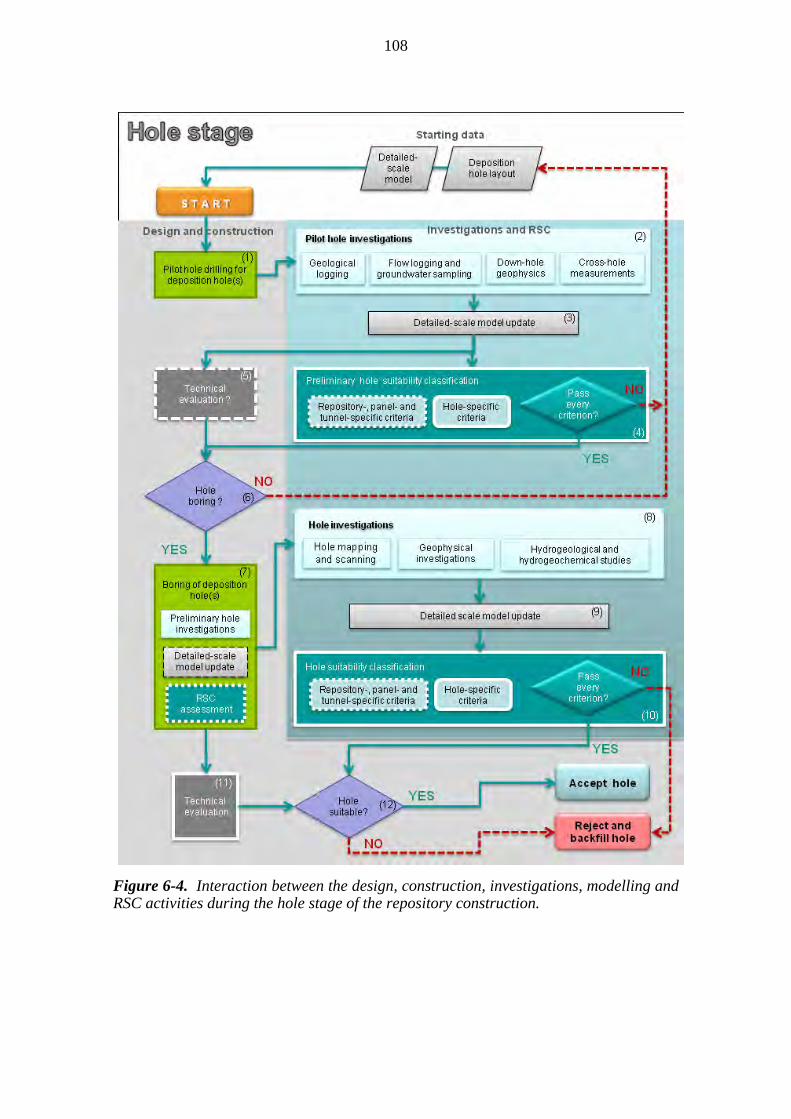
108
Figure 6-4. Interaction between the design, construction, investigations, modelling and RSC activities during the hole stage of the repository construction.

109
6.4.2 Suitability classification of a deposition hole
Once all selected deposition hole locations have passed the preliminary suitability classification, and a technical evaluation has been carried out using the latest available data (5), a decision on the boring of the holes is made (6) and the boring of the holes commences (7). If previously unidentified, possibly significant structures are met during the boring process, the construction would cease, and the need for updating the DSM evaluated. If the model is updated, the suitability of the remaining (unbored) hole locations would be re-evaluated before continuing with construction.
Several investigations will take place in each bored deposition hole, including scanning, geological mapping and various geophysical and hydrogeological studies (if possible, also hydrogeochemical studies) (8). Once again, the DSM is updated using the newly acquired data (9). The second suitability assessment at the hole stage, the final assessment of the suitability of each deposition hole, is carried out at this point by the RSC team using all available data (10).
For a deposition hole to be classified as suitable, every hole-specific criterion (see Section 5.2) must be fulfilled. If that proves not to be the case, the hole in question would be classified as unsuitable, thus leading to its rejection and backfilling. In addition, a technical evaluation, assessing the fulfilment of design requirements, for example the straightness of the hole, would be carried out by the detailed design team (11). If the design requirements were not fulfilled, repair actions could take place before the final acceptance or rejection of the hole (12).

110
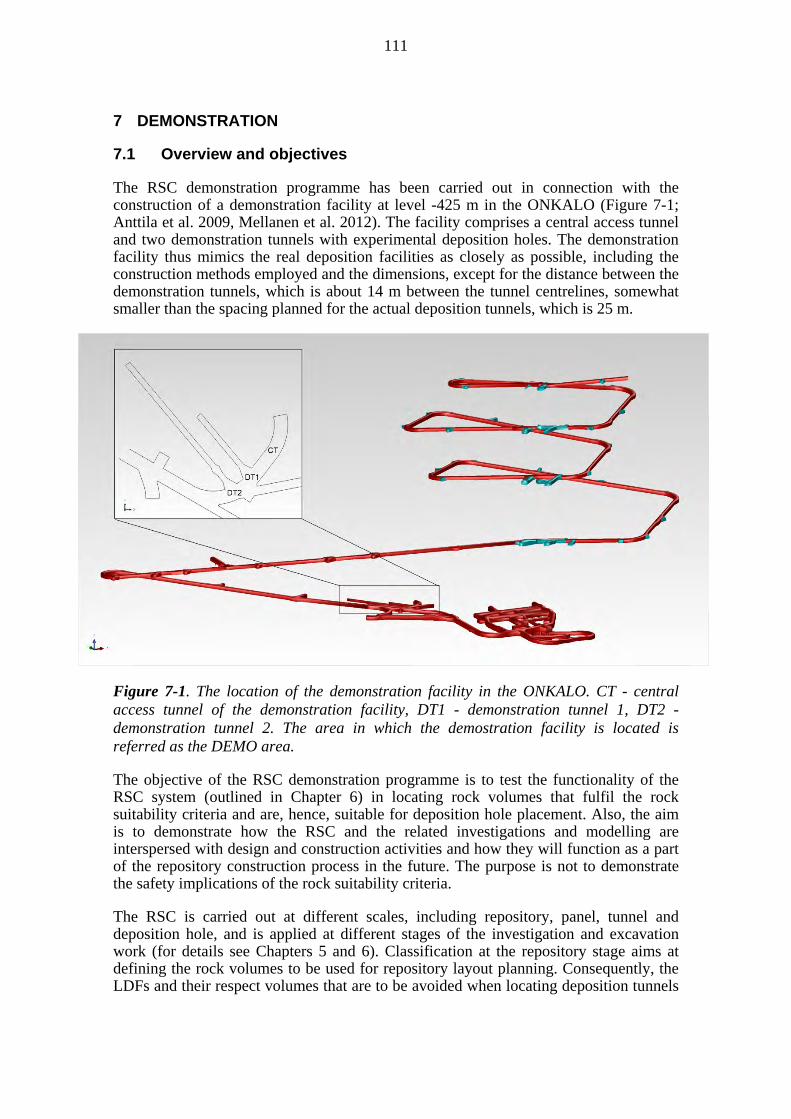
111
7 DEMONSTRATION
7.1 Overview and objectives
The RSC demonstration programme has been carried out in connection with the construction of a demonstration facility at level -425 m in the ONKALO (Figure 7-1; Anttila et al. 2009, Mellanen et al. 2012). The facility comprises a central access tunnel and two demonstration tunnels with experimental deposition holes. The demonstration facility thus mimics the real deposition facilities as closely as possible, including the construction methods employed and the dimensions, except for the distance between the demonstration tunnels, which is about 14 m between the tunnel centrelines, somewhat smaller than the spacing planned for the actual deposition tunnels, which is 25 m.
Figure 7-1. The location of the demonstration facility in the ONKALO. CT - central access tunnel of the demonstration facility, DT1 - demonstration tunnel 1, DT2 - demonstration tunnel 2. The area in which the demostration facility is located is referred as the DEMO area.
The objective of the RSC demonstration programme is to test the functionality of the RSC system (outlined in Chapter 6) in locating rock volumes that fulfil the rock suitability criteria and are, hence, suitable for deposition hole placement. Also, the aim is to demonstrate how the RSC and the related investigations and modelling are interspersed with design and construction activities and how they will function as a part of the repository construction process in the future. The purpose is not to demonstrate the safety implications of the rock suitability criteria.
The RSC is carried out at different scales, including repository, panel, tunnel and deposition hole, and is applied at different stages of the investigation and excavation work (for details see Chapters 5 and 6). Classification at the repository stage aims at defining the rock volumes to be used for repository layout planning. Consequently, the LDFs and their respect volumes that are to be avoided when locating deposition tunnels

112
and deposition holes are defined (see discussion and definition of LDFs in Section 5.3). The repository stage also comprises preliminary studies and suitability classifications of the rock volumes designated for the panels in the repository layout, for the purpose of selecting locations of the panel central tunnels. Classification at the panel stage aims at verifying the suitability of the selected central tunnel locations, at defining suitable areas for the tunnels within a certain panel and at assessing the utilisation ratio of the panel area for the detailed design of the panel. The classification is carried out based on the more detailed data on brittle deformation zones26 and hydraulically-conductive zones that become available during the construction of the central tunnels for the panel in question. The tunnel-stage classification aims at verifying the suitability of the selected tunnel locations and at defining suitable tunnel sections for the deposition holes, so that the LDFs and smaller, local brittle fault zones and their respect volumes, large fractures and high inflows to the deposition holes are avoided. At the deposition hole-stage, the fulfilment of the rock suitability criteria is checked as part of the acceptance procedure of the deposition holes. A general outline of the repository construction process and the flow of investigation, modelling, the RSC and the design and construction activities are illustrated in Figure 7-2.
The RSC system was applied to the construction of the demonstration facility, with the following exceptions: no pilot hole was drilled for the demonstration area central tunnel, due to the curvature of the tunnel axis, and the first version of a detailed-scale model ("preliminary DS model" in Figure 7-2) was constructed after the central tunnel had been partially excavated. Therefore, the suitability classification of the demonstration facility area was carried out only once during the panel stage of the construction of the demonstration facility.
The construction of the demonstration facility is, at the time writing this report, still continuing and, hence, the RSC demonstration programme has not yet been completed. This Chapter describes the RSC demonstration programme up to October 2012 (demonstration tunnel 1 (DT1) completed, demonstration tunnel 2 (DT2) tunnel stage completed), with eight suitability assessments having been carried out, either for the demonstration facility area, demonstration tunnels or experimental deposition holes (Table 7-1). These suitability assessments are described in the following Sections, in chronological order, together with short descriptions of the preceding investigation and detailed-scale modelling steps on which the assessments were based; although investigations and modelling as such are not part of the RSC system. The detailed-scale modelling of the demonstration area will be reported later in more detail, after completion of the RSC acivities in DT2. During the hole stage of DT2, two more suitability assessments will be carried out (Table 7-1); these will be reported separately in 2013. It should be noted that the design and construction aspects of the demonstration facility are not within the scope of the RSC process, but are described elsewhere by Mellanen et al. (2012). Also, control of the excavation damaged zone (EDZ), as well as the dimensions and verticality of the deposition holes are not included in the RSC
26 As explained in relation to Table 3-1 and Figure 5-4, the term ‘brittle deformation zone’ is still used in the RSC-II criteria (see Section 5.2.3), although strictly speaking the term used should be ‘brittle fault zone’. The term ‘brittle deformation zone’ is thus used occasionally in this Chapter when referring to some of the RSC-II criteria, even though the zones are referenced using the acronym BFZ (brittle fault zone). See footnote number 57.

113
system, but are carried out as part of the excavation quality assurance and quality control procedures (Mellanen et al. 2012).
Figure 7-2. A general outline of the repository construction process and the flow of investigation, modelling, RSC system, design and construction activities. The red diamonds represent main decision-making points preceding the construction of new repository rooms, and the red arrows indicate return to the previous design step (the selection of a new location for a tunnel or hole) in the case of a negative decision. DFN = Discrete Fracture Network, LDF = Layout Determining Feature, DS = Detailed-scale.

114
Table 7-1. Summary of the RSC suitability assessments carried out during the construction of the demonstration facility in the ONKALO. Suitability assessments 1-8 were carried out before the writing of this report; assessments 9 and 10 (in red) will complete the RSC demonstration in the future.
Suitability
assessmentTime Stage Assessed Based on Used for
1June
2010Repository
Demonstration
area (DT1 and
DT2)
Site investigations
Site modelDemonstration facility layout design,
especially determining needed tunnel length
2October
2010Panel DT1 and DT2
Central tunnel investigations
Detailed‐scale model v1
Assessing the need for layout update,
especially in regard of the planned tunnel length
3February
2011Tunnel DT1 and DT2
Pilot hole (tunnels) investigations
Detailed‐scale model v2
Assessing the need for layout update,
making desicion on tunnel excavation
4August
2011Tunnel DT1
Tunnel investigations
Detailed‐scale model v3Selecting locations for the test deposition holes
5October
2011Hole DT1
Pilot hole (holes) investigations
Detailed‐scale model v4
Acceptance of the selected test deposition hole
locations, making desicion on hole boring
6May
2012Tunnel DT2
Pilot hole (tunnel) investigations
Detailed‐scale model v5
Assessing the need for layout update,
making desicion on tunnel excavation
7August
2012Tunnel DT2
Tunnel investigations
Detailed‐scale model v6Selecting locations for the test deposition holes
8September
2012Hole DT1
Hole investigations
Detailed‐scale model v7Final acceptance of the test deposition holes
9December
2012?Hole DT2
Pilot hole (holes) investigations
Detailed‐scale model v8
Acceptance of the selected test deposition hole
locations, making desicion on hole boring
10 2013 Hole DT2Hole investigations
Detailed‐scale model v9Final acceptance of the test deposition holes
7.2 Repository stage
During repository construction, the first task is to identify potential rock volumes for hosting panels, which consist of several deposition tunnels (see Section 6.2). To do this, the geological and hydrogeological data and the respective models of the Olkiluoto site are used to determine the LDFs and their respect volumes, which according to the RSC-II criteria have to be avoided during the placement of deposition tunnels and deposition holes and thus directly affect the repository layout design (Figure 7-2, for details see Sections 5.2 and 5.3). Before the construction of a panel can commence, a tentative suitability classification, based on preliminary investigations, is carried out for the hosting rock volume to further verify the absence of LDFs and to enable the selection of locations for the central tunnels of the panel.
In the demonstration programme, selecting the location for the demonstration facility can be seen to represent the "repository stage". It should be noted, however, that a major factor in the selection of the location for the demonstration facility was practicality, and that the first RSC suitability assessment was carried out after the location and the overall layout of the facility, including the location of the central tunnel, had been decided upon (see Mellanen et al. 2012 for details on the selection of the location). The first suitability assessment concentrated on verifying the absence of LDFs and on providing information about the required lengths of the demonstration tunnels (Table 7-1).
7.2.1 Investigations and modelling
The first rough, preliminary suitability assessment carried out for the rock volume hosting the demonstration facility was carried out on the basis of the geological model
115
of the Olkiluoto site v2.0 (GSM v2.0) (Aaltonen et al. 2010) and the 2008 update of the hydrogeological structure model of the Olkiluoto site (Vaittinen et al. 2009). According to the models, one local brittle fault zone (OL-BFZ045_2) was expected to intersect the rock volume and five more (OL-BFZ039, OL-BFZ084, OL-BFZ135, OL-BFZ136 and OL-BFZ216) were expected in the immediate vicinity (Figure 7-3). No site-scale hydrogeological zones were expected in the demonstration area27.
No additional investigations were carried out at this stage.
7.2.2 The 1st suitability classification (demonstration area) - May 2010
Once a location and an overall layout for the demonstration facility had been selected and approved (see Mellanen et al. 2012), the suitability of the area was assessed to determine the required lengths of the demonstration tunnels. In addition to the preliminary layout (Figure 7-3), the following assumptions were used to carry out the assessment:
four experimental deposition holes of OL1-2 type (diameter 1.75 m, depth 7.80 m; Tanskanen 2009) should be constructed in each demonstration tunnel for future tests and demonstrations
the minimum distance between the centre points of two deposition holes should be 9.00 m
space should be reserved in one of the tunnels for a plug structure (23 m of acceptable tunnel length, including the distance to the first deposition hole).
The suitability classification was carried out on the basis of the preliminary rock suitability criteria, as reported by Hellä et al. (2009)28:
Criterion 1: avoid the influence zones of the site-scale hydrogeological zones and brittle fault zones (i.e. LDFs) Criterion 2: a deposition hole cannot be positioned within the influence zone of a hydrogeological structure (a zone or a fracture) Criterion 3: a deposition hole cannot intersect minor brittle fault zones and the influence zones of these must be avoided
Criterion 4: a deposition hole must not intersect an FPI fracture; a preliminary respect distance of 0.5 m is suggested.
27 "Demonstration area" refers to the rock volume enclosing the demonstration facility.
28 During the demonstration, the latest available version of the RSC criteria was always applied to carry out the suitability classifications. Thus, the criteria change during the demonstration programme, reflecting the development from the preliminary RSC-I to the current RSC-II criteria.
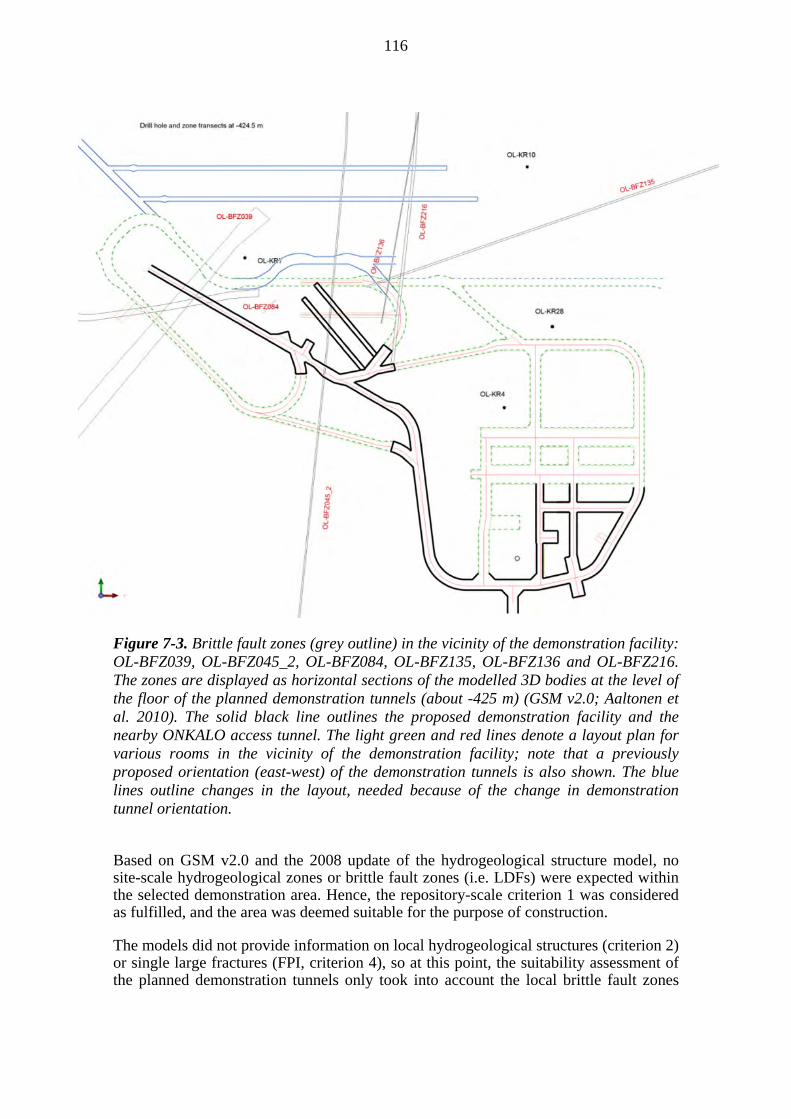
116
Figure 7-3. Brittle fault zones (grey outline) in the vicinity of the demonstration facility: OL-BFZ039, OL-BFZ045_2, OL-BFZ084, OL-BFZ135, OL-BFZ136 and OL-BFZ216. The zones are displayed as horizontal sections of the modelled 3D bodies at the level of the floor of the planned demonstration tunnels (about -425 m) (GSM v2.0; Aaltonen et al. 2010). The solid black line outlines the proposed demonstration facility and the nearby ONKALO access tunnel. The light green and red lines denote a layout plan for various rooms in the vicinity of the demonstration facility; note that a previously proposed orientation (east-west) of the demonstration tunnels is also shown. The blue lines outline changes in the layout, needed because of the change in demonstration tunnel orientation.
Based on GSM v2.0 and the 2008 update of the hydrogeological structure model, no site-scale hydrogeological zones or brittle fault zones (i.e. LDFs) were expected within the selected demonstration area. Hence, the repository-scale criterion 1 was considered as fulfilled, and the area was deemed suitable for the purpose of construction.
The models did not provide information on local hydrogeological structures (criterion 2) or single large fractures (FPI, criterion 4), so at this point, the suitability assessment of the planned demonstration tunnels only took into account the local brittle fault zones

117
(criterion 3), and provided a rough estimate on the possible suitability of the rock mass for the demonstration facility.
Of the six brittle fault zones found in the vicinity of the planned demonstration facility (Figure 7-3), only zone OL-BFZ045_2 transected the planned demonstration tunnels and influenced their suitability. However, based on their locations and modelled orientations, the possible extensions of zones OL-BFZ135 and OL-BFZ136 could have influenced the suitability of the planned tunnels (Figure 7-4); with the result that these were also taken into account in order to make the assessment conservative. Extension of zone OL-BFZ084 towards the east was considered unlikely and was, therefore, not taken into account in the assessment. Zone OL-BFZ039 did not affect the suitability of the tunnels, because of its relatively steep dip.
The locations of the zone (or zone extension) intersections in each planned demonstration tunnel were estimated from the planar image, as no 3D model of the demonstration tunnels was available at the time. Influence zones were calculated for each zone from their modelled dimensions by using the scaling law from Scholz (2002). These influence zones, together with the intersection locations and modelled zone orientations, were used to assess the suitability of the planned demonstration tunnels (for a detailed description of the suitability assessment method see Section 4.3 and Kosunen et al. 2012).
The length of each demonstration tunnel in the proposed layout plan (solid black line in Figure 7-4) was 75 m, and this tunnel length was evaluated in the suitability assessment (Figure 7-5). According to the results, sections ca. 1 - 43 m and 59 - 75 m in DT1 and sections ca. 0 - 34 m, 49 - 57 m, and 68 -75 m in DT2 were possibly suitable for experimental deposition holes (and the plug) (Figure 7-5). Taking into account the required spacing of the holes (9.00 m between hole centres) and the space requirements of the plug (a 23 m length of tunnel), DT1 could have hosted the plug and four experimental deposition holes, whereas in DT2, only three holes could have been placed in addition to the plug (Figure 7-5).
The possibility of the presence of local brittle fault zones, minor hydrogeological features or single large fractures, which were not included in the Site models, was taken into account, as these could have had a notable effect on the suitability of the planned tunnels and reduced the possible suitable tunnel length, by 20-30 %, based on the observed frequency of such structures in the ONKALO access tunnel. In addition, although considered unlikely and not taken into account in the suitability assessment (Figure 7-5), the possibility that zone OL-BFZ084 could extend further east than modelled (Figure 7-4) was also considered. If this extension were to exist, it would result in the loss of possibly suitable volumes at the end of both tunnels. It was therefore concluded that to take these factors into account, at least 10 m should be added to the length of each planned demonstration tunnel, resulting in tunnel lengths of 85 m.
The suggested change was made to the demonstration facility layout plan (Mellanen et al. 2012).

118
Figure 7-4. Brittle fault zones (red line) and their possible extensions (red dashed line) affecting the suitability of the planned demonstration tunnels (black line, numbered). The zones are displayed as horizontal sections of the modelled 3D bodies at the level of the floor of the planned demonstration tunnels (about -425 m) (GSM v2.0; Aaltonen et al. 2010).
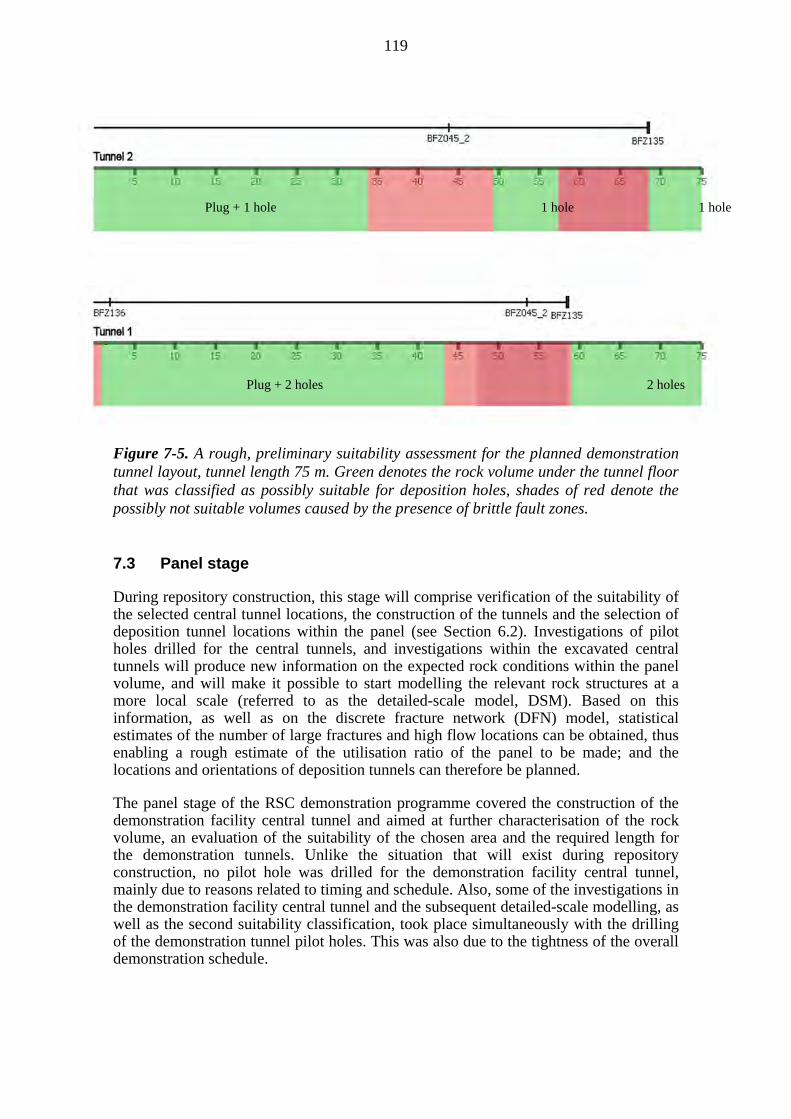
119
Figure 7-5. A rough, preliminary suitability assessment for the planned demonstration tunnel layout, tunnel length 75 m. Green denotes the rock volume under the tunnel floor that was classified as possibly suitable for deposition holes, shades of red denote the possibly not suitable volumes caused by the presence of brittle fault zones. 7.3 Panel stage
During repository construction, this stage will comprise verification of the suitability of the selected central tunnel locations, the construction of the tunnels and the selection of deposition tunnel locations within the panel (see Section 6.2). Investigations of pilot holes drilled for the central tunnels, and investigations within the excavated central tunnels will produce new information on the expected rock conditions within the panel volume, and will make it possible to start modelling the relevant rock structures at a more local scale (referred to as the detailed-scale model, DSM). Based on this information, as well as on the discrete fracture network (DFN) model, statistical estimates of the number of large fractures and high flow locations can be obtained, thus enabling a rough estimate of the utilisation ratio of the panel to be made; and the locations and orientations of deposition tunnels can therefore be planned.
The panel stage of the RSC demonstration programme covered the construction of the demonstration facility central tunnel and aimed at further characterisation of the rock volume, an evaluation of the suitability of the chosen area and the required length for the demonstration tunnels. Unlike the situation that will exist during repository construction, no pilot hole was drilled for the demonstration facility central tunnel, mainly due to reasons related to timing and schedule. Also, some of the investigations in the demonstration facility central tunnel and the subsequent detailed-scale modelling, as well as the second suitability classification, took place simultaneously with the drilling of the demonstration tunnel pilot holes. This was also due to the tightness of the overall demonstration schedule.
Plug + 2 holes 2 holes
Plug + 1 hole 1 hole 1 hole

120
The following sections describe the key points and results of the panel stage of the RSC demonstration programme.
7.3.1 Investigations and detailed-scale modelling
No pilot hole was drilled for the central tunnel of the demonstration facility, and by September, 2010, the tunnel excavation had proceeded past the planned demonstration tunnel locations, to chainage 50 m (Mellanen et al. 2012). Geological investigations carried out during and after excavation of the tunnel provided the first direct observations, and data from the actual volume of rock of the demonstration facility were used, together with data obtained from the nearby sections of the ONKALO access tunnel, to construct the first version of a DSM for the rock volume hosting the demonstration facility.
Figure 7.6 shows the layout of the demonstration facility and a horizontal cross-section of DSM v.1; a summary of the structures included in the model is given in Table 7-2. The modelling was carried out at a two-day workshop held from September 30th - October 1st, 2010, and commenced with a re-evaluation of the brittle fault zones predicted by the GSM v2.0 (Figure 7-3). Based on new observations made in the ONKALO access tunnel, zone OL-BFZ039 was omitted from the DSM as being clearly outside the relevant rock volume. Brittle fault zones OL-BFZ045_2 (by now re-named OL-BFZ045B) and OL-BFZ084 were re-modelled to match the new observations made in the ONKALO access tunnel. At this point, the total widths (including the cores and the influence zones) and the orientations of the faults were determined from the intersection of each fault nearest to the demonstration area. The mean orientations of the fault cores were calculated from the laser-measured fault planes, and used to model the zones (Table 7-2). Brittle fault zones OL-BFZ135, OL-BFZ136 and OL-BFZ216 were retained in the model, as no new information on them was available.
In addition to the fault zones, two possibly large fractures (named 4365_1 and demo_keskt) were extrapolated to the demonstration tunnel area on the basis of tunnel crosscutting fractures (TCF) observed in the ONKALO access tunnel and the central tunnel of the demonstration facility (Figure 7-6). As with the brittle fault zones, mean orientations were calculated for the fractures from the laser-measured fracture traces (Table 7-2) and the fractures were modelled as simple planes.
Based on GSM v2, water leakages were expected from brittle fault zones OL-BFZ045b and OL-BFZ084, with the highest transmissivity values measured from the zones being 4.4 10-8 m2/s and 2.3 10-9 m2/s, respectively.
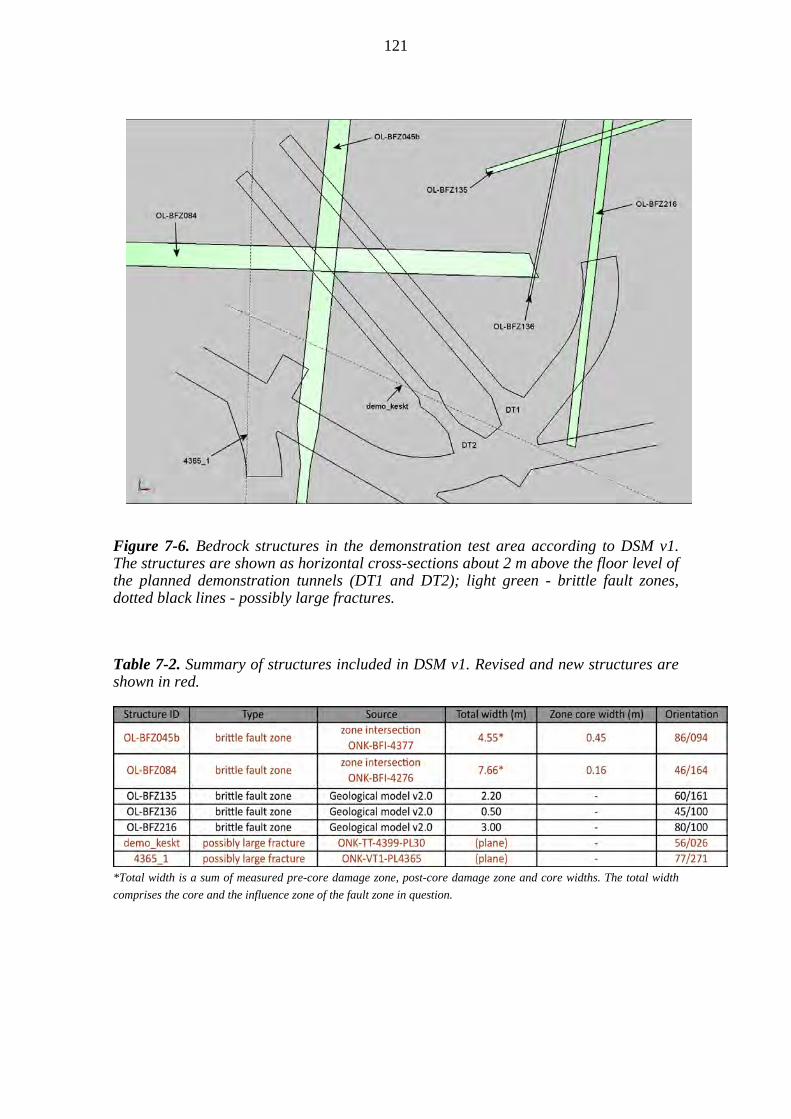
121
Figure 7-6. Bedrock structures in the demonstration test area according to DSM v1. The structures are shown as horizontal cross-sections about 2 m above the floor level of the planned demonstration tunnels (DT1 and DT2); light green - brittle fault zones, dotted black lines - possibly large fractures.
Table 7-2. Summary of structures included in DSM v1. Revised and new structures are shown in red.
*Total width is a sum of measured pre-core damage zone, post-core damage zone and core widths. The total width
comprises the core and the influence zone of the fault zone in question.
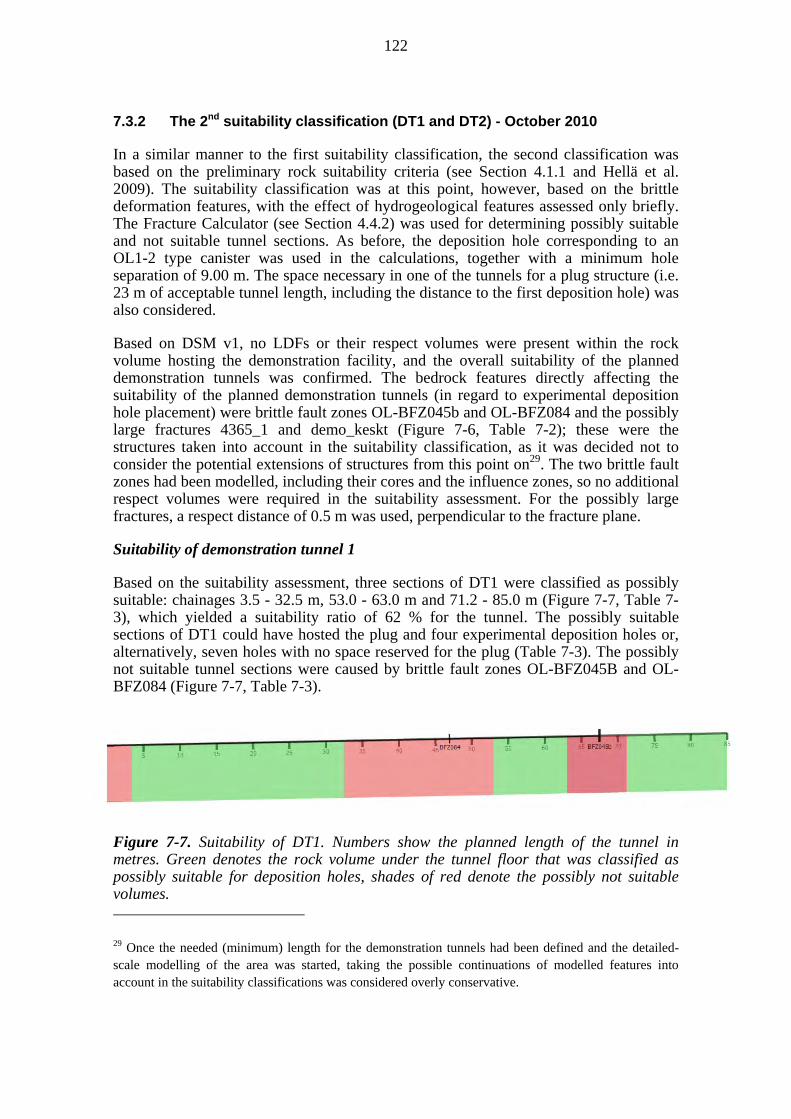
122
7.3.2 The 2nd suitability classification (DT1 and DT2) - October 2010
In a similar manner to the first suitability classification, the second classification was based on the preliminary rock suitability criteria (see Section 4.1.1 and Hellä et al. 2009). The suitability classification was at this point, however, based on the brittle deformation features, with the effect of hydrogeological features assessed only briefly. The Fracture Calculator (see Section 4.4.2) was used for determining possibly suitable and not suitable tunnel sections. As before, the deposition hole corresponding to an OL1-2 type canister was used in the calculations, together with a minimum hole separation of 9.00 m. The space necessary in one of the tunnels for a plug structure (i.e. 23 m of acceptable tunnel length, including the distance to the first deposition hole) was also considered.
Based on DSM v1, no LDFs or their respect volumes were present within the rock volume hosting the demonstration facility, and the overall suitability of the planned demonstration tunnels was confirmed. The bedrock features directly affecting the suitability of the planned demonstration tunnels (in regard to experimental deposition hole placement) were brittle fault zones OL-BFZ045b and OL-BFZ084 and the possibly large fractures 4365_1 and demo_keskt (Figure 7-6, Table 7-2); these were the structures taken into account in the suitability classification, as it was decided not to consider the potential extensions of structures from this point on29. The two brittle fault zones had been modelled, including their cores and the influence zones, so no additional respect volumes were required in the suitability assessment. For the possibly large fractures, a respect distance of 0.5 m was used, perpendicular to the fracture plane.
Suitability of demonstration tunnel 1
Based on the suitability assessment, three sections of DT1 were classified as possibly suitable: chainages 3.5 - 32.5 m, 53.0 - 63.0 m and 71.2 - 85.0 m (Figure 7-7, Table 7-3), which yielded a suitability ratio of 62 % for the tunnel. The possibly suitable sections of DT1 could have hosted the plug and four experimental deposition holes or, alternatively, seven holes with no space reserved for the plug (Table 7-3). The possibly not suitable tunnel sections were caused by brittle fault zones OL-BFZ045B and OL-BFZ084 (Figure 7-7, Table 7-3).
Figure 7-7. Suitability of DT1. Numbers show the planned length of the tunnel in metres. Green denotes the rock volume under the tunnel floor that was classified as possibly suitable for deposition holes, shades of red denote the possibly not suitable volumes.
29 Once the needed (minimum) length for the demonstration tunnels had been defined and the detailed-scale modelling of the area was started, taking the possible continuations of modelled features into account in the suitability classifications was considered overly conservative.
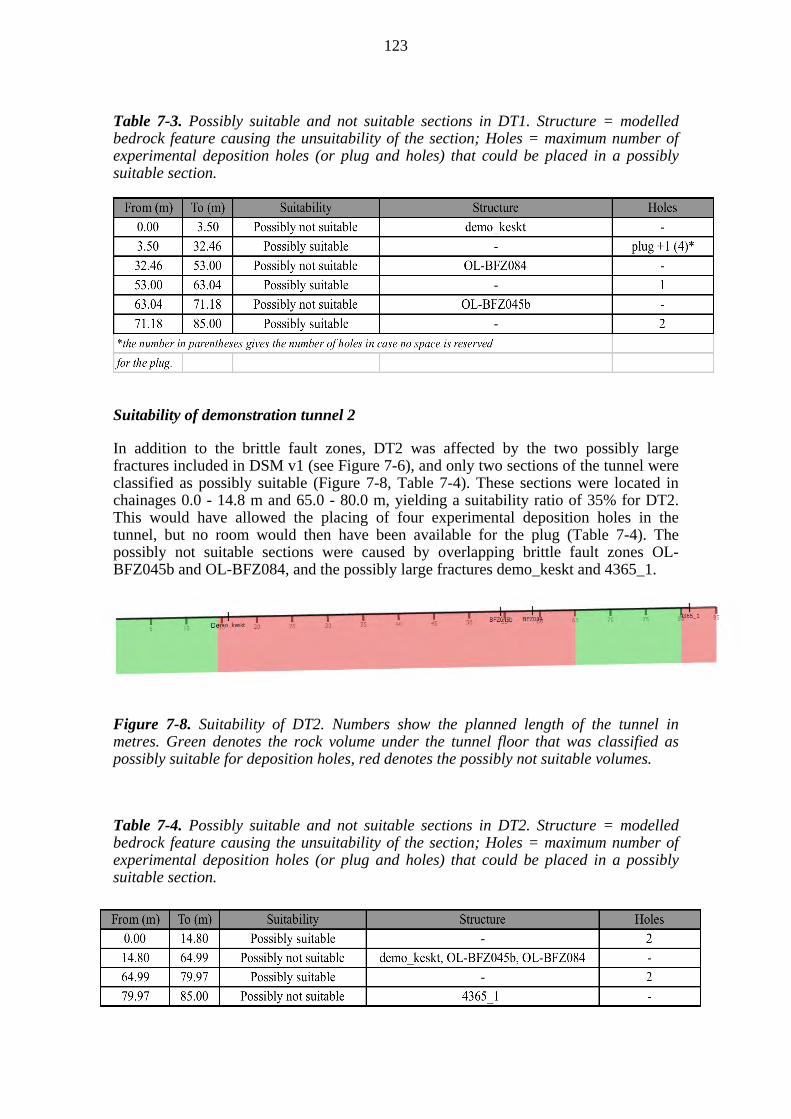
123
Table 7-3. Possibly suitable and not suitable sections in DT1. Structure = modelled bedrock feature causing the unsuitability of the section; Holes = maximum number of experimental deposition holes (or plug and holes) that could be placed in a possibly suitable section.
Suitability of demonstration tunnel 2
In addition to the brittle fault zones, DT2 was affected by the two possibly large fractures included in DSM v1 (see Figure 7-6), and only two sections of the tunnel were classified as possibly suitable (Figure 7-8, Table 7-4). These sections were located in chainages 0.0 - 14.8 m and 65.0 - 80.0 m, yielding a suitability ratio of 35% for DT2. This would have allowed the placing of four experimental deposition holes in the tunnel, but no room would then have been available for the plug (Table 7-4). The possibly not suitable sections were caused by overlapping brittle fault zones OL-BFZ045b and OL-BFZ084, and the possibly large fractures demo_keskt and 4365_1.
Figure 7-8. Suitability of DT2. Numbers show the planned length of the tunnel in metres. Green denotes the rock volume under the tunnel floor that was classified as possibly suitable for deposition holes, red denotes the possibly not suitable volumes.
Table 7-4. Possibly suitable and not suitable sections in DT2. Structure = modelled bedrock feature causing the unsuitability of the section; Holes = maximum number of experimental deposition holes (or plug and holes) that could be placed in a possibly suitable section.

124
A large section of DT2 (chainage 0.00 - 44.45 m) was classified as possibly not suitable due to the sub-horizontal fracture demo_keskt. In DSM v1, however, the fracture was extrapolated from only one intersection observed in the DEMO area central tunnel, and its continuation into DT2 was uncertain. Omitting demo_keskt from the suitability assessment (Figure 7.9, Table 7-5) resulted in a suitability ratio of 67 % for DT2, with room for the plug and 4 holes or, alternatively, seven holes, if no room were reserved for the plug. Omitting the fracture 4365_1 (extent also uncertain) would have resulted in a further increase in the possibly suitable tunnel volume (suitability ratio 76 %, and one additional hole location).
Figure 7-9. Suitability of DT2 without the fracture demo_keskt. Numbers show the planned length of the tunnel in metres. Green denotes the rock volume under the tunnel floor that was classified as possibly suitable for deposition holes, red denotes the possibly not suitable volumes.
Table 7-5. Possibly suitable and not suitable sections in DT2 without the fracture demo_keskt. Structure = modelled bedrock feature causing the unsuitability of the section; Holes = maximum number of experimental deposition holes (or plug and holes) that could be placed in a possibly suitable section.
Based on the suitability assessment, a decision was made to keep the planned length (85 m) for both demonstration tunnels, despite the uncertainties related to the presence of possibly large fractures (see Mellanen et al. 2012).
7.4 Tunnel stage, part 1
The tunnel stage aims, firstly, at confirming the suitability of the locations selected during the panel stage for deposition tunnels and, secondly, at determining the suitability of various tunnel sections for deposition hole placement (see Section 6.3). The suitability of the selected deposition tunnel locations will be confirmed by drilling pilot holes at the selected locations and carrying out a set of investigations, followed by an update of the DSM and an RSC assessment (see Figure 7.2). At this point, it would be possible to decide not to excavate a tunnel, or part of it, at a selected location if it appeared, for example, that the utilisation ratio of the tunnel could be low and the
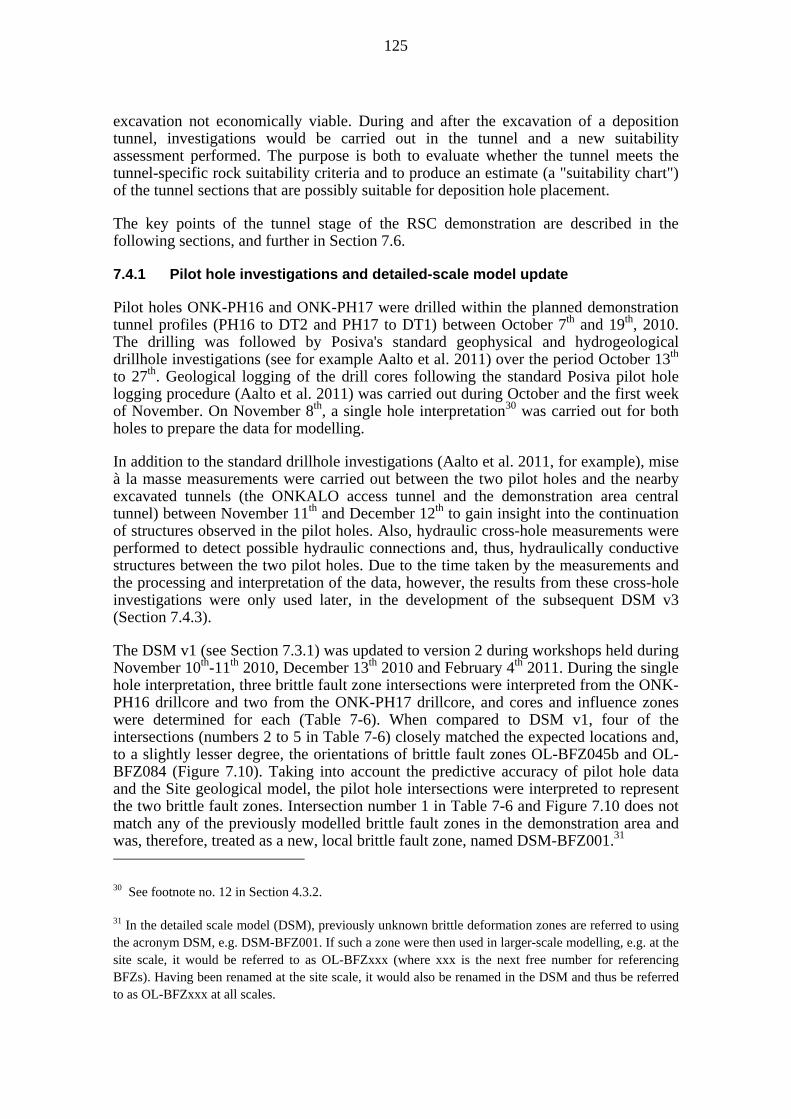
125
excavation not economically viable. During and after the excavation of a deposition tunnel, investigations would be carried out in the tunnel and a new suitability assessment performed. The purpose is both to evaluate whether the tunnel meets the tunnel-specific rock suitability criteria and to produce an estimate (a "suitability chart") of the tunnel sections that are possibly suitable for deposition hole placement.
The key points of the tunnel stage of the RSC demonstration are described in the following sections, and further in Section 7.6.
7.4.1 Pilot hole investigations and detailed-scale model update
Pilot holes ONK-PH16 and ONK-PH17 were drilled within the planned demonstration tunnel profiles (PH16 to DT2 and PH17 to DT1) between October 7th and 19th, 2010. The drilling was followed by Posiva's standard geophysical and hydrogeological drillhole investigations (see for example Aalto et al. 2011) over the period October 13th to 27th. Geological logging of the drill cores following the standard Posiva pilot hole logging procedure (Aalto et al. 2011) was carried out during October and the first week of November. On November 8th, a single hole interpretation30 was carried out for both holes to prepare the data for modelling.
In addition to the standard drillhole investigations (Aalto et al. 2011, for example), mise à la masse measurements were carried out between the two pilot holes and the nearby excavated tunnels (the ONKALO access tunnel and the demonstration area central tunnel) between November 11th and December 12th to gain insight into the continuation of structures observed in the pilot holes. Also, hydraulic cross-hole measurements were performed to detect possible hydraulic connections and, thus, hydraulically conductive structures between the two pilot holes. Due to the time taken by the measurements and the processing and interpretation of the data, however, the results from these cross-hole investigations were only used later, in the development of the subsequent DSM v3 (Section 7.4.3).
The DSM v1 (see Section 7.3.1) was updated to version 2 during workshops held during November 10th-11th 2010, December 13th 2010 and February 4th 2011. During the single hole interpretation, three brittle fault zone intersections were interpreted from the ONK-PH16 drillcore and two from the ONK-PH17 drillcore, and cores and influence zones were determined for each (Table 7-6). When compared to DSM v1, four of the intersections (numbers 2 to 5 in Table 7-6) closely matched the expected locations and, to a slightly lesser degree, the orientations of brittle fault zones OL-BFZ045b and OL-BFZ084 (Figure 7.10). Taking into account the predictive accuracy of pilot hole data and the Site geological model, the pilot hole intersections were interpreted to represent the two brittle fault zones. Intersection number 1 in Table 7-6 and Figure 7.10 does not match any of the previously modelled brittle fault zones in the demonstration area and was, therefore, treated as a new, local brittle fault zone, named DSM-BFZ001.31
30 See footnote no. 12 in Section 4.3.2.
31 In the detailed scale model (DSM), previously unknown brittle deformation zones are referred to using the acronym DSM, e.g. DSM-BFZ001. If such a zone were then used in larger-scale modelling, e.g. at the site scale, it would be referred to as OL-BFZxxx (where xxx is the next free number for referencing BFZs). Having been renamed at the site scale, it would also be renamed in the DSM and thus be referred to as OL-BFZxxx at all scales.

126
Parts of OL-BFZ045b and OL-BFZ084 were re-modelled in the demonstration area by combining the pilot hole intersection data with the observations from the ONKALO access tunnel, where intersections of the two zones had been encountered earlier. 3D solids were created from the measured traces of the fault zone cores and influence zones on the tunnel walls, and were then connected with the solids modelled on the basis of pilot hole data to form continuous features. From the two cores interpreted for the intersection of OL-BFZ084 in pilot hole ONK-PH16, core 2 (see Table 7-6) was used in the re-modelling. The cores and influence zones were modelled as separate bodies, using orientations determined for the cores. A vertical extent of 60 m was selected for the modelled bodies, to visualise better their continuation in relation to each other, the large fractures and the demonstration facility (Figure 7-11).
Table 7-6. Brittle fault zone intersections in pilot holes ONK-PH16 (DT2) and ONK-PH17 (DT1).
No new information was obtained on brittle deformation zones OL-BFZ135, OL-BFZ136 and OL-BFZ216, so these were retained in DSM v2, as modelled in DSM v1 (see Figure 7.6).
The single hole interpretations for pilot holes ONK-PH16 and ONK-PH17 contained predictions on the possibly large fractures, made on the basis of four different investigation methods: core logging, flow logging, geophysical drillhole investigation methods and drillhole radar. In total, 103 fractures in ONK-PH16 and 55 in ONK-PH17 were suggested as possibly large by at least one investigation method. For comparison, the total number of logged natural fractures in ONK-PH16 was 191 and in ONK-PH17, 332. As the numbers of suggested possibly large fractures were quite large, further selection was carried out to pick the most likely candidates for modelling: fractures suggested as possibly large by two or more investigation methods were selected, together with those that were given a high probability of being large on a geological or geophysical basis. Fractures within the interpreted brittle fault zones were ignored, unless their orientations differed clearly from that of the zone core, in which case they were selected according to the above criteria. The most likely candidates - 24 fractures from ONK-PH16 and 5 from ONK-PH17 - were modelled as 10 x 10 m squares, using orientations determined from the drillcores or, preferably, from drillhole images. Each

127
of these modelled fractures was then subjected to geometric inspection, where their location and orientation were compared to each other and to brittle features in DSM v1, as well as to features mapped from nearby tunnels. If no possible continuation were found where expected, the fracture would be considered relatively small and would be discarded. On this basis, five fractures from ONK-PH16 and three fractures from ONK-PH17 were considered as possibly large and were taken into account in further modelling (Table 7-7, Figure 7-12).
Figure 7-10. Comparison of the brittle fault zone intersection cores (brown rectangles) in pilot holes ONK-PH16 and ONK-PH17 with brittle fault zones OL-BFZ045b and OL-BFZ084, as modelled in DSM v1. The numbers refer to brittle deformation zone intersections in Table 7-6. View from above.
DT1DT2
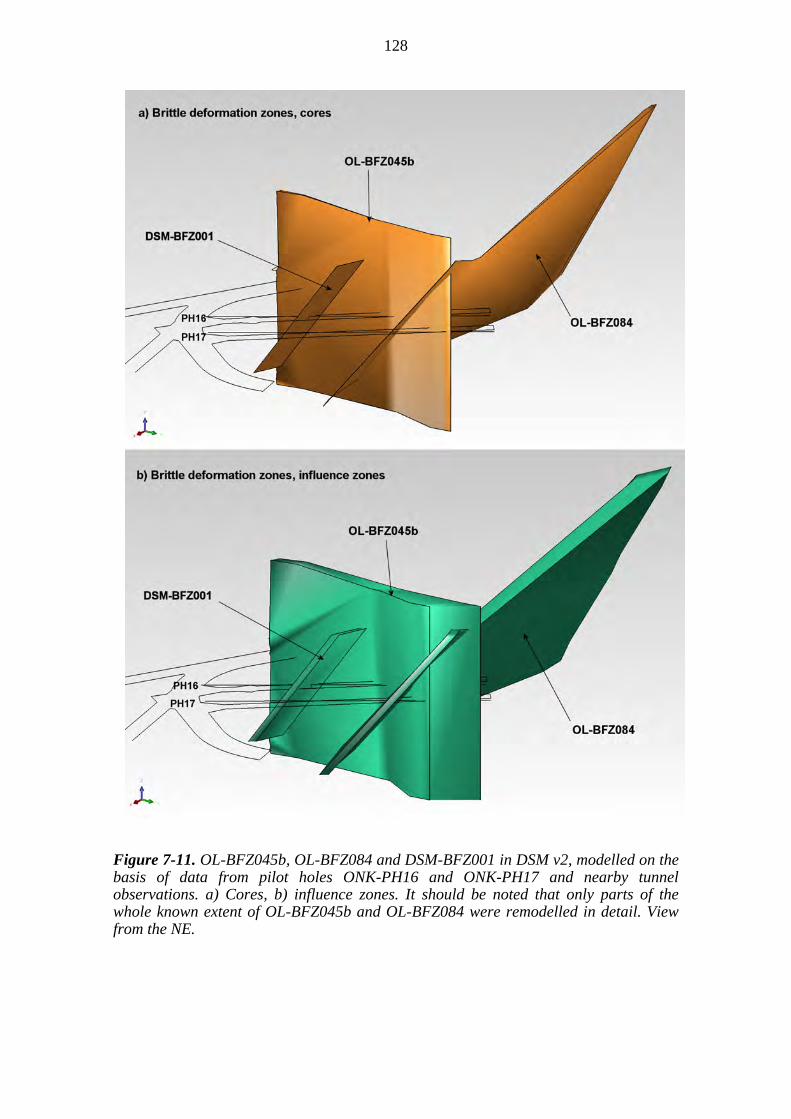
128
Figure 7-11. OL-BFZ045b, OL-BFZ084 and DSM-BFZ001 in DSM v2, modelled on the basis of data from pilot holes ONK-PH16 and ONK-PH17 and nearby tunnel observations. a) Cores, b) influence zones. It should be noted that only parts of the whole known extent of OL-BFZ045b and OL-BFZ084 were remodelled in detail. View from the NE.

129
Table 7-7. Possibly large fractures in ONK-PH16 and ONK-PH17 and their geometric correlation with other known brittle features.
Figure 7-12. Possibly large fractures selected for further modelling. View from above.
The orientation and location of fracture ONK-PH16-31.48 matched the predicted continuation of the large fracture demo_keskt mapped from the demonstration area central tunnel, and fracture ONK-PH16-75.13 could be correlated with fracture 4365_1 mapped from the ONKALO access tunnel (Table 7-7), thus providing further confirmation of the assumptions made in the first version of the model (see Figures 7-6 and 7-12). Although somewhat different in orientation, it was considered possible that fracture ONK-PH17-20.30 represented an extension of the new brittle fault zone DSM-BFZ001 (see Figures 7-11 and 7-12), and the fracture was therefore included in the model. As no indication of the existence of an influence zone was observed in ONK-PH17, however, it was decided to model the fracture separately from the zone at this point. Fractures ONK-PH16-71.00 and ONK-PH16-74.64 could be correlated with fractures ONK-PH17-61.58 and ONK-PH17-64.81, respectively (Figure 7-12). The
130
fracture ONK-PH16-73.62 could not be correlated with other known features, but was included in the model, as it was indicated as having a high probability of being potentially large both by geological and geophysical (and also possibly hydrogeological) data.
Figure 7-13. The possibly large fractures in DSM v2: 1) LF1 (demo_keskt to ONK-PH16-31.48); 2) LF2 (ONK-PH17-20.30); 3) LF3 (ONK-PH16-74.64 to ONK-PH17-64.81); 4) LF4 (ONK-PH16-71.00 to ONK-PH17-61.58); 5) LF5 (ONK-PH16-75.13 to 4365_1); 6) LF6 (ONK-PH16-73.62). View from above.
The selected eight fractures were remodelled as disks with 25 m radius32, using orientations given in Table 7-7. Disks were also created from the measured tunnel traces of the fractures demo_keskt and 4365_1; the disks interpreted to represent the same fracture were then combined and digitised as a surface. Thus, a total of six potentially large fractures (LF1...LF6)33 were modelled in DSM v2 (Figure 7.- 3).
32 It was decided that a radius of 25 m would be used to model possibly large fractures of unknown size. This was considered as a reasonable approximation, yielding a diameter of 50 m for the modelled fractures, as only 13 out of 392 TCFs observed in the ONKALO at the time had a trace length of 40 m or longer.
33 The acronym LF, with an accompnying number, is from here on used to name the modelled large fractures, i.e. LF1, LF2, and so on. If a large fracture is at some point removed from the model, the name (specifically, the number) is not re-used. A similar approach is taken to the naming of modelled minor, hydraulically-conductive fractures using the acronym HF (see for example Figure 7-15).
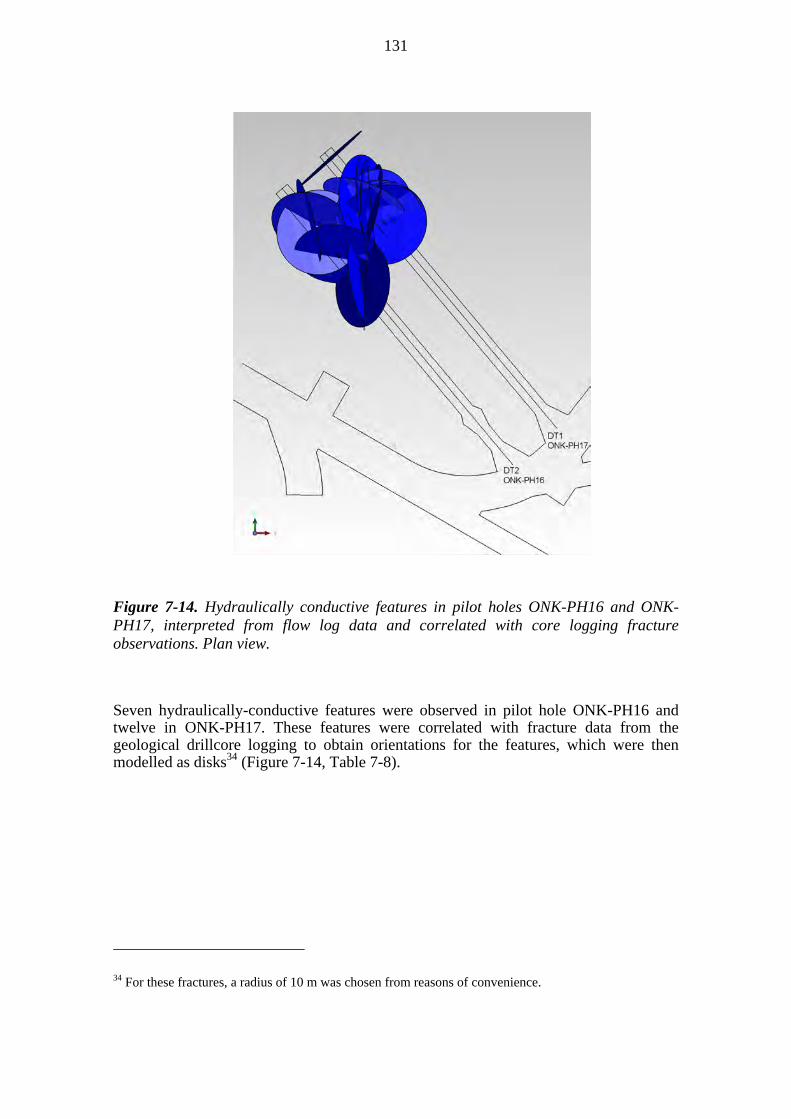
131
Figure 7-14. Hydraulically conductive features in pilot holes ONK-PH16 and ONK-PH17, interpreted from flow log data and correlated with core logging fracture observations. Plan view.
Seven hydraulically-conductive features were observed in pilot hole ONK-PH16 and twelve in ONK-PH17. These features were correlated with fracture data from the geological drillcore logging to obtain orientations for the features, which were then modelled as disks34 (Figure 7-14, Table 7-8).
34 For these fractures, a radius of 10 m was chosen from reasons of convenience.
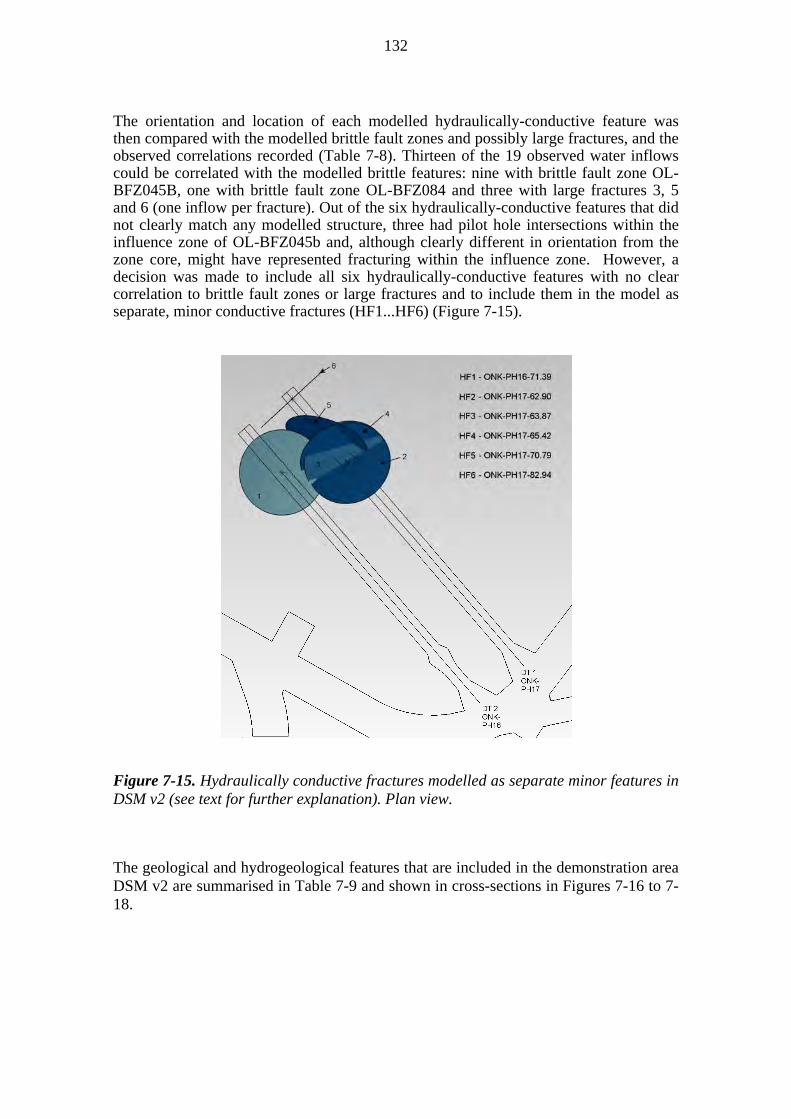
132
The orientation and location of each modelled hydraulically-conductive feature was then compared with the modelled brittle fault zones and possibly large fractures, and the observed correlations recorded (Table 7-8). Thirteen of the 19 observed water inflows could be correlated with the modelled brittle features: nine with brittle fault zone OL-BFZ045B, one with brittle fault zone OL-BFZ084 and three with large fractures 3, 5 and 6 (one inflow per fracture). Out of the six hydraulically-conductive features that did not clearly match any modelled structure, three had pilot hole intersections within the influence zone of OL-BFZ045b and, although clearly different in orientation from the zone core, might have represented fracturing within the influence zone. However, a decision was made to include all six hydraulically-conductive features with no clear correlation to brittle fault zones or large fractures and to include them in the model as separate, minor conductive fractures (HF1...HF6) (Figure 7-15).
Figure 7-15. Hydraulically conductive fractures modelled as separate minor features in DSM v2 (see text for further explanation). Plan view.
The geological and hydrogeological features that are included in the demonstration area DSM v2 are summarised in Table 7-9 and shown in cross-sections in Figures 7-16 to 7-18.
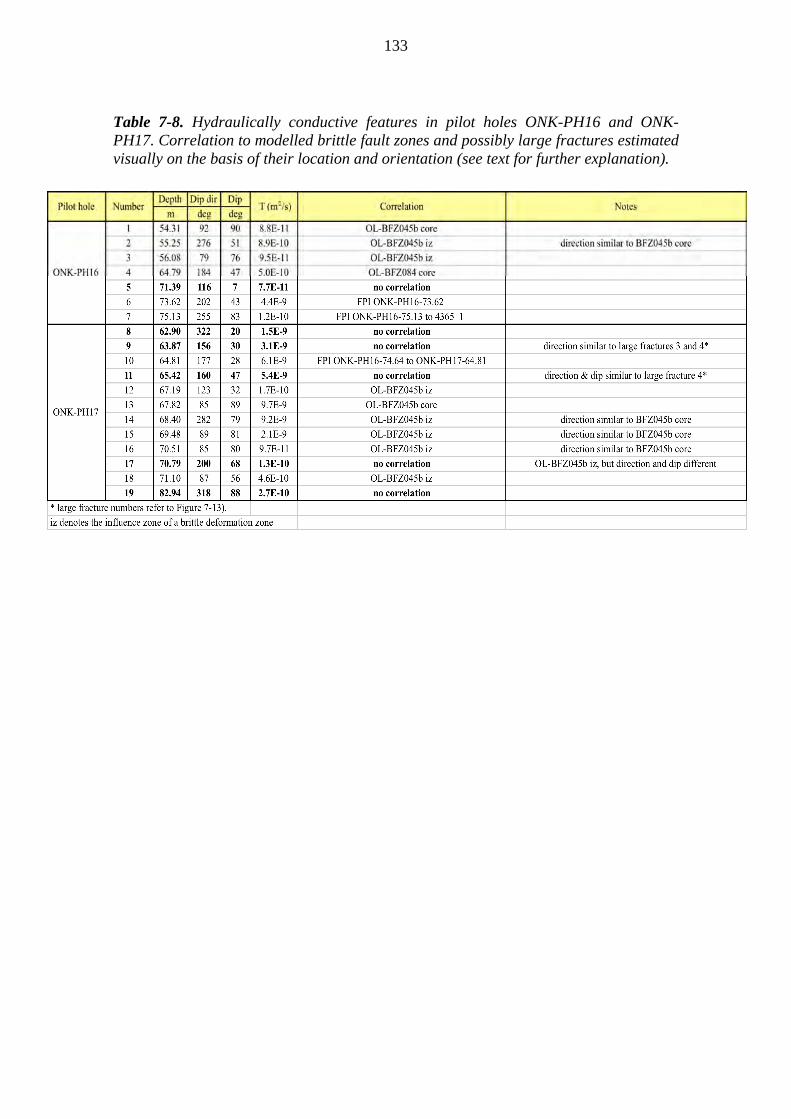
133
Table 7-8. Hydraulically conductive features in pilot holes ONK-PH16 and ONK-PH17. Correlation to modelled brittle fault zones and possibly large fractures estimated visually on the basis of their location and orientation (see text for further explanation).
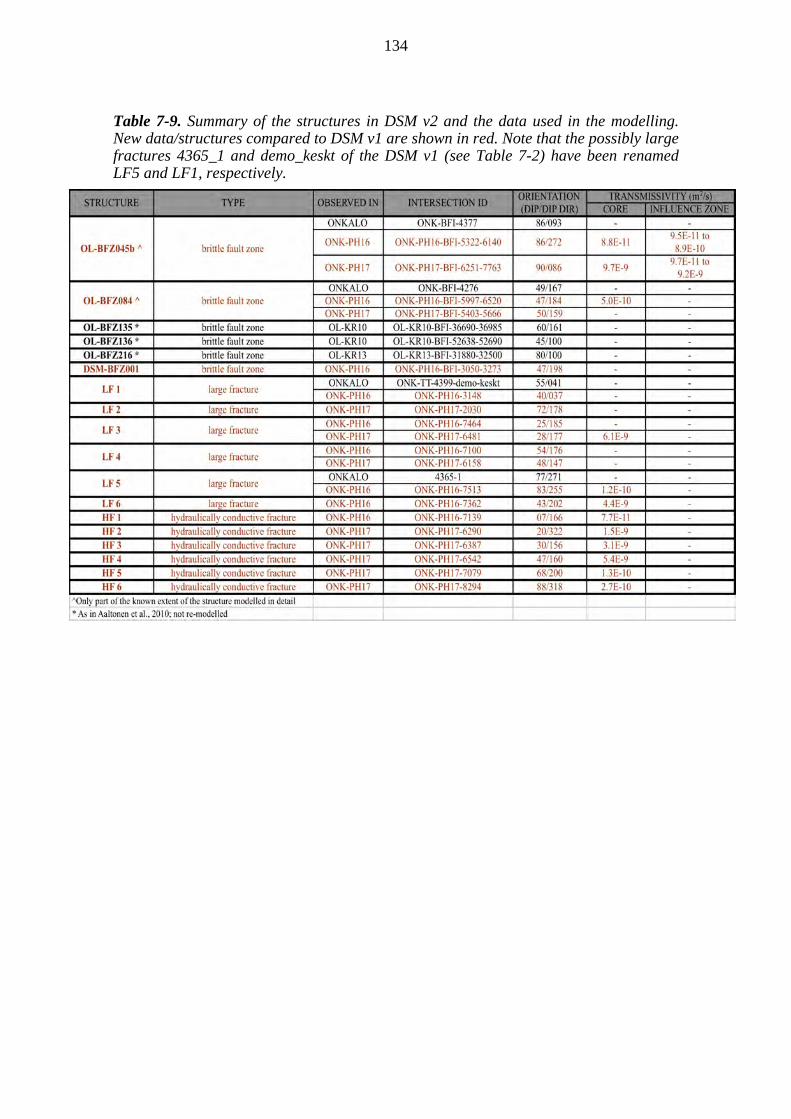
134
Table 7-9. Summary of the structures in DSM v2 and the data used in the modelling. New data/structures compared to DSM v1 are shown in red. Note that the possibly large fractures 4365_1 and demo_keskt of the DSM v1 (see Table 7-2) have been renamed LF5 and LF1, respectively.
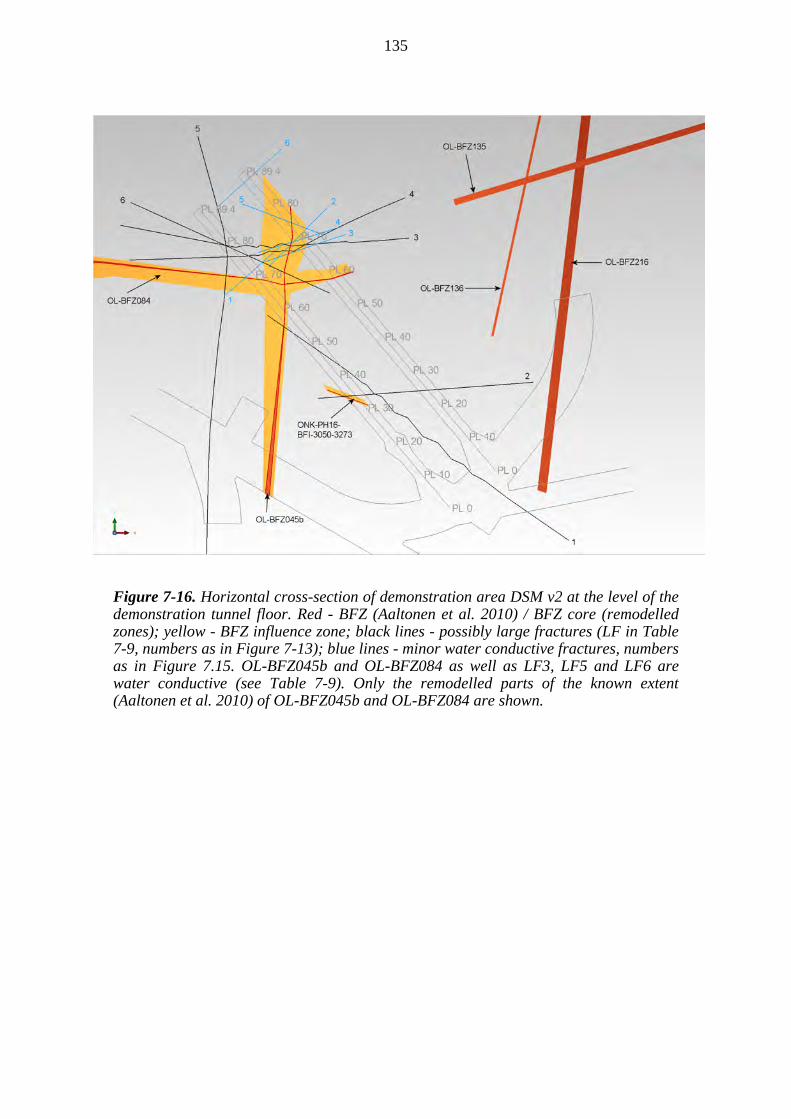
135
Figure 7-16. Horizontal cross-section of demonstration area DSM v2 at the level of the demonstration tunnel floor. Red - BFZ (Aaltonen et al. 2010) / BFZ core (remodelled zones); yellow - BFZ influence zone; black lines - possibly large fractures (LF in Table 7-9, numbers as in Figure 7-13); blue lines - minor water conductive fractures, numbers as in Figure 7.15. OL-BFZ045b and OL-BFZ084 as well as LF3, LF5 and LF6 are water conductive (see Table 7-9). Only the remodelled parts of the known extent (Aaltonen et al. 2010) of OL-BFZ045b and OL-BFZ084 are shown.
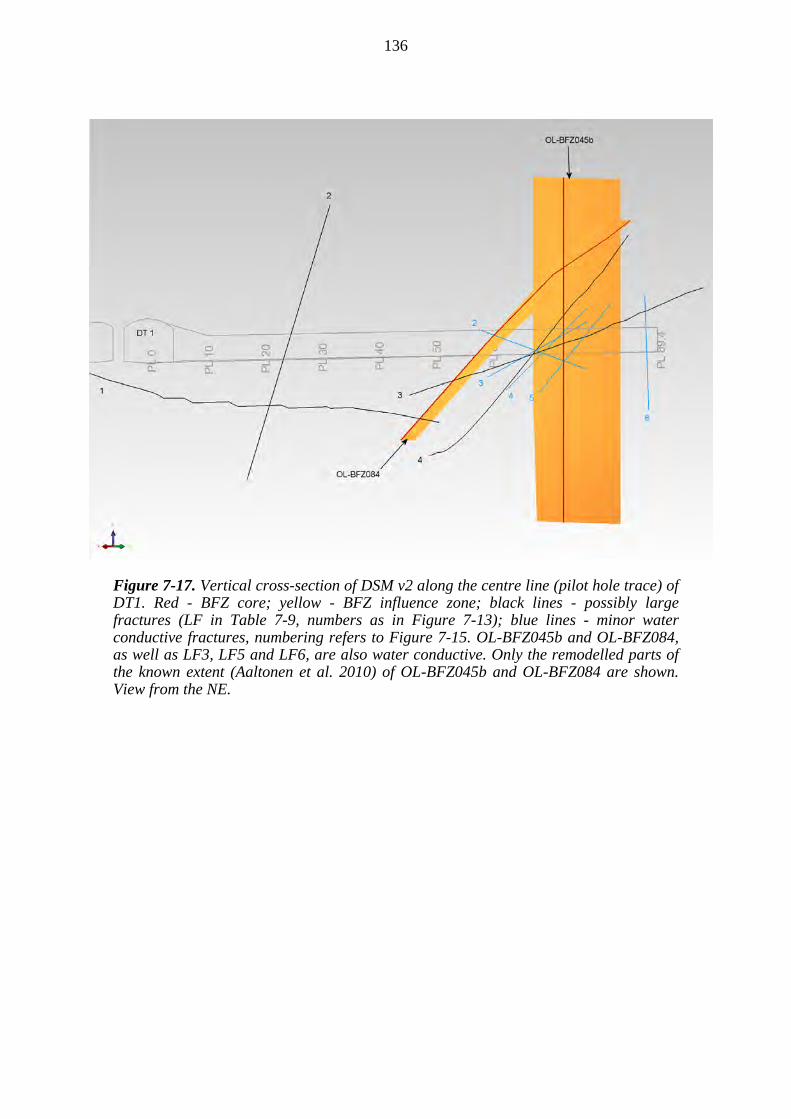
136
Figure 7-17. Vertical cross-section of DSM v2 along the centre line (pilot hole trace) of DT1. Red - BFZ core; yellow - BFZ influence zone; black lines - possibly large fractures (LF in Table 7-9, numbers as in Figure 7-13); blue lines - minor water conductive fractures, numbering refers to Figure 7-15. OL-BFZ045b and OL-BFZ084, as well as LF3, LF5 and LF6, are also water conductive. Only the remodelled parts of the known extent (Aaltonen et al. 2010) of OL-BFZ045b and OL-BFZ084 are shown. View from the NE.

137
Figure 7-18. Vertical cross-section of the DSM v2 along the centre line (pilot hole trace) of DT2. Red - BFZ core; yellow - BFZ influence zone; black lines - possibly large fractures (LF in Table 7-9, numbers as in Figure 7-13); blue lines - minor water conductive fractures, numbering refers to Figure 7-15. OL-BFZ045b and OL-BFZ084, as well as LF3, LF5 and LF6, are also water conductive. Only the remodelled parts of the known extent (Aaltonen et al. 2010) of OL-BFZ045b and OL-BFZ084 are shown. View from the NE.
Uncertainties in this version of the DSM are mostly related to the large fractures. Based on the observations of the tunnel cross-cutting fractures (TCF) from the ONKALO access tunnel, the large fractures at Olkiluoto are heterogeneous: the geological properties (type of fracture surface, composition and amount of fracture fillings, for example) vary between fractures and also within a single fracture. It is, therefore, difficult to identify large fractures from a pilot hole drillcore; the uncertainties of the method used here to select the possibly large fractures from the pilot hole data still need to be quantified. A large proportion of the fractures are more or less undulating, especially over scales of more than a few metres, thus, an orientation determined for a fracture from a pilot hole drillcore or from a drill hole image is likely to represent a very local orientation of the fracture plane, and might not represent the actual overall orientation of the structure. In addition, the heterogeneity of the fractures and the uncertainty of their orientations also complicate the correlation of fractures between various observation points. These uncertainties need also be quantified to obtain estimates of the reliability of the modelled large fractures. However, once the fractures
138
are observed from an excavated tunnel, they can be modelled with a much higher degree of confidence.
Experiences from the ONKALO access tunnel and the site-scale modelling have shown that pilot hole observations of brittle fault zones are quite reliable as far as the existence and location of the zones are concerned. Some uncertainty is present in the orientations and in the widths of the zone cores and influence zones, also due to the very local nature of the pilot hole data.
7.4.2 The 3rd suitability classification (DT1 and DT2) - February 2011
Following the pilot hole investigations and the update of the DSM, an evaluation of the suitability of the selected tunnel locations was carried out for the purpose of assessing the adequacy of the planned tunnel lengths and for making final decisions regarding the process of tunnel excavation. The suitability classification was based on the preliminary rock suitability criteria defined in Hellä et al. (2009) (see Section 4.1.1), but due to the expected updating of the criteria, two versions of the large fracture criterion were assessed:
According to Hellä et al. (2009) (RSC-I): "A deposition hole must not intersect an FPI fracture; a preliminary respect distance of 0.5 m is suggested", whereby areas below the tunnel floor where a deposition hole would intersect a modelled fracture plane were classified as possibly unsuitable. Dimensions corresponding to the size of OL-1 and 2 deposition hole were used (hole depth: 7.8 m, hole diameter 1.75 m).
Proposed new criterion (under development at the time of the test)35: "An FPI fracture must not intersect a canister, whereby areas below the tunnel floor where a modelled large fracture would intersect the volume of a canister within a deposition hole were classified as unsuitable. Dimensions corresponding to the size of OL-1 and 2 canister were used (canister length 4.8 m, canister diameter 1.05 m, top 2.2 m below the tunnel floor).
Thus, three cases were considered in the suitability classification:
first, tunnel suitability was assessed in relation to the brittle fault zones and hydrogeological features;
second, the additional effect of the possibly large fractures was taken into account by applying the RSC-I large fracture criterion (Table 5-9 in Hellä et al. 2009); and
third, the proposed new large fracture criterion was applied instead of the RSC-I criterion.
The Fracture Calculator software was used for determining the possibly suitable and not suitable tunnel sections.
35 For comparison, see the RSC-II criterion in Section 5.2.3.
139
In estimating the number of deposition holes that could be placed within the possibly suitable tunnel sections, the following guidelines and dimensions were used:
The centre of the first hole in a tunnel is located 10 m from the tunnel mouth. This is due to the length of the hole boring machine (11 m) (Mellanen et al. 2012.
The centre of the last hole in a tunnel must be at least 3 m from the tunnel end. This is also related to the use of the hole boring machine.
The distance between two deposition holes must be at least 9 m (centre to centre).
The diameter of a deposition hole is 1.75 m.
No reservation for a plug is taken into account at this stage.
Based on DSM v2, the brittle features affecting the suitability of DT1 were brittle fault zones OL-BFZ045b and OL-BFZ084, and the possibly large fractures 1 to 4 (Figure 7-17). The suitability of DT2 was affected by brittle fault zones OL-BFZ045b, OL-BFZ084 and DSM-BFZ001, as well as by the possibly large fractures 1 to 6 (Figure 7-18).
The total outflow measured from pilot holes ONK-PH16 and ONK-PH17 was 200 mL/h and 1100 mL/h, respectively. Based on DSM v2, the majority of the water inflows were associated with brittle fault zones OL-BFZ045B and OL-BFZ084, where they occurred either in the zone cores or within their influence zones (Table 7-8). Water inflows were also associated with three of the possibly large fractures (Table 7-8). As these brittle features were taken into account in the suitability classification on the basis of mechanical criteria, the associated water inflows did not have any further effect on the suitability of the tunnels.
Six conductive fractures could not be clearly correlated with any of the brittle fault zones or possibly large fractures, but were modelled as minor, hydraulically-conductive fractures (Table 7-8). The transmissivities of fractures HF1, HF2, HF4 and HF6 (from 7.7E-11 to 1.5E-9, see Table 7-9) indicated conductivity below the limits set by the rock suitability criteria (Section 4.1; see also Table 5-9 in Hellä et al. 2009). Fractures HF3 and HF4 were slightly more conductive, with respective transmissivities of 3.1E-9 and 5.4E-9, exceeding the limit set for the maximum inflow into a deposition hole. Hovever, these fractures affect the rock volume that would be avoided because of brittle fault zone OL-BFZ045b and large fractures 3 and 4 (Figure 7-17). Thus, the minor conductive fractures had no further effect on tunnel suitability.
Suitability of demonstration tunnel 1 (DT1)
Considering only the brittle fault zones, DT1 contained three sections classified as possibly suitable. These sections were located at tunnel chainages 4.25 - 49.80 m, 59.71 - 66.41 m and 82.82 - 89.25 m, and yielded a suitability ratio of 69% (Table 7-10, Figure 7-19a). Based on the results, the tunnel could have housed a total of 6 deposition holes (Table 7-10). In an ideal case (no sections classified as not suitable), the total number of holes in a tunnel of identical length would have been 9, which yielded a degree of utilisation of 67% for the tunnel.

140
Table 7-10. Suitability of DT1, based on the brittle fault zones. Pilot hole down-hole depth 0 m = tunnel chainage 4.25 m.
When also the possibly large fractures were taken into account and the large fracture criterion according to Hellä et al. (2009) was applied, only two narrow sections of DT1 were classified as possibly suitable. These sections were located at tunnel chainages 35.55 - 39.95 m and 82.82 - 89.25 m, and they yielded a low suitability ratio of 13 % (Table 7-11, Figure 7-19b). Based on the results, only 2 deposition holes could have been placed in the tunnel (Table 7-11), producing a degree of utilisation of 22 %.
Table 7-11. Suitability of DT1, based on the brittle fault zones and deposition hole-intersecting possibly large fractures. Pilot hole down-hole depth 0 m = tunnel chainage 4.25 m.
Taking into account the brittle fault zones, as well as the possibly large fractures intersecting the canister within a deposition hole (the proposed new criterion), five sections of DT1 were classified as possibly suitable. These sections were located at tunnel chainages 15.05 - 20.68 m, 23.66 - 42.50 m, 63.46 - 66.66 m and 82.57 - 89.25 m (Table 7-12, Figure 7-19c), and corresponded to a suitability ratio of 40 %, which was 27 % units higher than the suitability ratio obtained by using the criterion of Hellä et al. (2009) (which was 13 %). In this case, a total of 5 deposition holes could have been placed in the tunnel (Table 7-12), resulting in a degree of utilisation of 56 %.
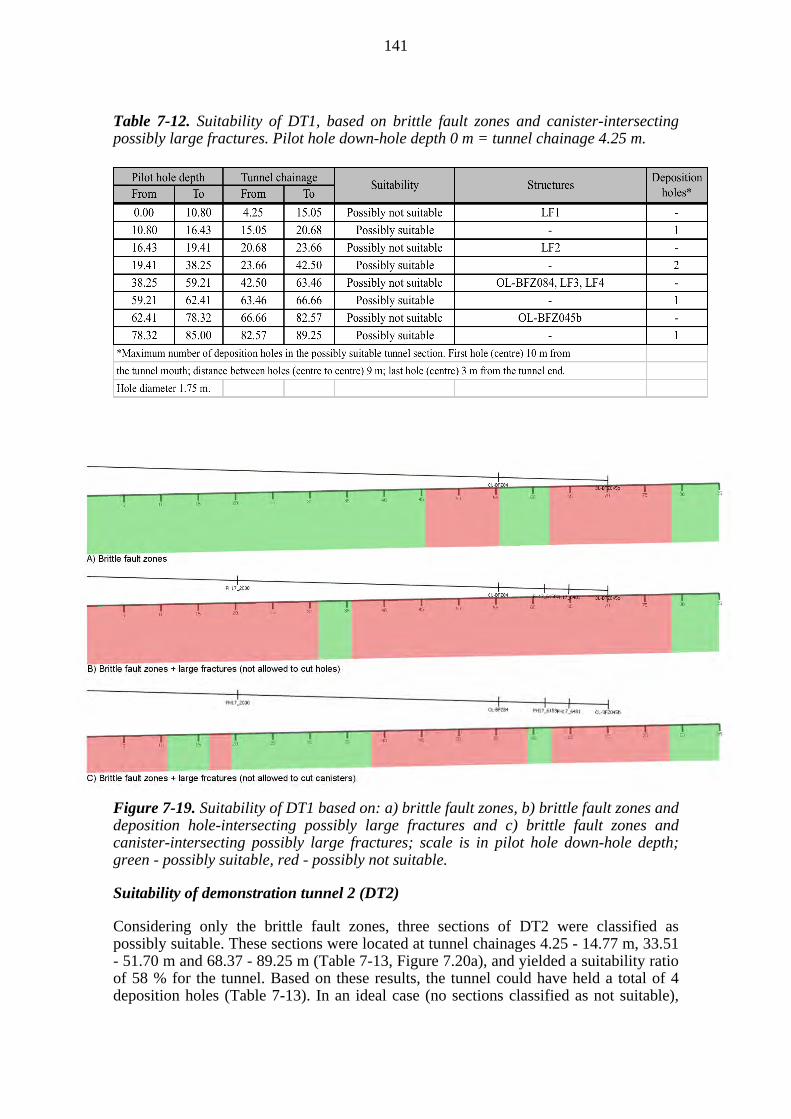
141
Table 7-12. Suitability of DT1, based on brittle fault zones and canister-intersecting possibly large fractures. Pilot hole down-hole depth 0 m = tunnel chainage 4.25 m.
Figure 7-19. Suitability of DT1 based on: a) brittle fault zones, b) brittle fault zones and deposition hole-intersecting possibly large fractures and c) brittle fault zones and canister-intersecting possibly large fractures; scale is in pilot hole down-hole depth; green - possibly suitable, red - possibly not suitable.
Suitability of demonstration tunnel 2 (DT2)
Considering only the brittle fault zones, three sections of DT2 were classified as possibly suitable. These sections were located at tunnel chainages 4.25 - 14.77 m, 33.51 - 51.70 m and 68.37 - 89.25 m (Table 7-13, Figure 7.20a), and yielded a suitability ratio of 58 % for the tunnel. Based on these results, the tunnel could have held a total of 4 deposition holes (Table 7-13). In an ideal case (no sections classified as not suitable),
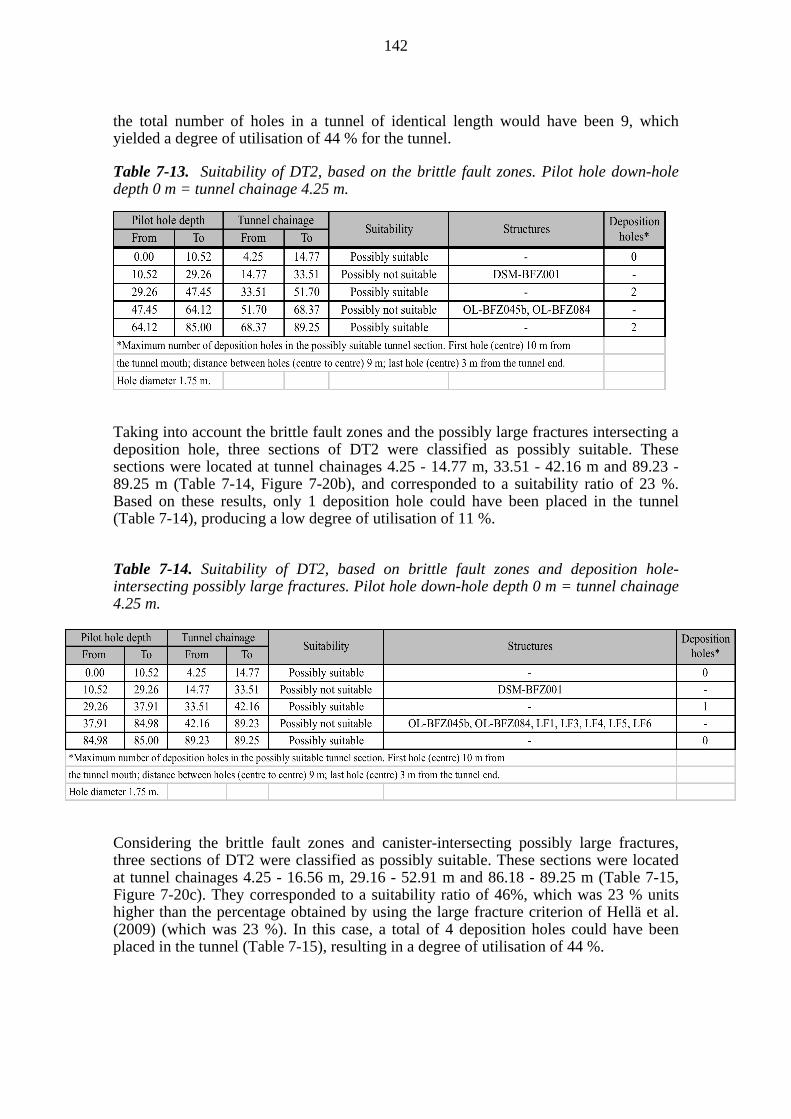
142
the total number of holes in a tunnel of identical length would have been 9, which yielded a degree of utilisation of 44 % for the tunnel.
Table 7-13. Suitability of DT2, based on the brittle fault zones. Pilot hole down-hole depth 0 m = tunnel chainage 4.25 m.
Taking into account the brittle fault zones and the possibly large fractures intersecting a deposition hole, three sections of DT2 were classified as possibly suitable. These sections were located at tunnel chainages 4.25 - 14.77 m, 33.51 - 42.16 m and 89.23 - 89.25 m (Table 7-14, Figure 7-20b), and corresponded to a suitability ratio of 23 %. Based on these results, only 1 deposition hole could have been placed in the tunnel (Table 7-14), producing a low degree of utilisation of 11 %.
Table 7-14. Suitability of DT2, based on brittle fault zones and deposition hole-intersecting possibly large fractures. Pilot hole down-hole depth 0 m = tunnel chainage 4.25 m.
Considering the brittle fault zones and canister-intersecting possibly large fractures, three sections of DT2 were classified as possibly suitable. These sections were located at tunnel chainages 4.25 - 16.56 m, 29.16 - 52.91 m and 86.18 - 89.25 m (Table 7-15, Figure 7-20c). They corresponded to a suitability ratio of 46%, which was 23 % units higher than the percentage obtained by using the large fracture criterion of Hellä et al. (2009) (which was 23 %). In this case, a total of 4 deposition holes could have been placed in the tunnel (Table 7-15), resulting in a degree of utilisation of 44 %.
143
Table 7-15. Suitability of DT2, based on brittle fault zones and canister-intersecting possibly large fractures. Pilot hole down-hole depth 0 m = tunnel chainage 4.25 m.
Figure 7-20. Suitability of DT2 based on: a) brittle fault zones, b) brittle fault zones and deposition hole-intersecting possibly large fractures and c) brittle fault zones and canister-intersecting possibly large fractures; scale is in pilot hole down-hole depth; green - possibly suitable, red - possibly not suitable.
Implications for design and construction
Based on DSM v2 and a preliminary estimate of the suitability of the tunnel, it had been decided that to avoid the need for pre-grouting, DT1 would not be excavated through the hydraulically-conductive zones (Mellanen et al. 2012). In the suitability assessment it was noted that:
144
on the basis of PFL measurements in pilot hole ONK-PH17, the inflow took place between 62.82 m and 71.12 m dhd36, mostly within the interpreted influence zone of OL-BFZ045b (see Table 7-8).
although within the influence zone of OL-BFZ045b in the pilot hole, some of the observed inflows seem to be related to modelled FPI fractures 3 and 4 (see Table 7-8) and that due to their orientation, inflows might be expected also outside the influence zone of OL-BFZ045b (Figure 7-17).
one of the minor hydraulically-conductive fractures (conductive fracture 2 in Table 7-8 and Figure 7-17) might be met in the tunnel before the influence zone of OL-BFZ045b because of its interpreted orientation (Figure 7-21).
the intersection of OL-BFZ084 in ONK-PH17 at 54.03-56.66 m dhd is dry, but slightly enhanced conductivity is associated with the feature in ONK-PH16 (Table 7-9) and it is reasonable to expect that some hydraulic connections might exist also in DT1.
Based on these observations, it was concluded that to avoid major hydraulically-conductive features, the excavation of DT1 ought to be stopped before reaching the influence zone of OL-BFZ045B, which was expected at about tunnel chainage 66 m. As some slightly conductive features related to OL-BFZ084 might, however, have been met in the tunnel from about chainage 57 m onwards, it was suggested that, taking into account a 5 m excavation-related safety margin, the excavation should be stopped before tunnel chainage 52 m.
36 down-hole depth
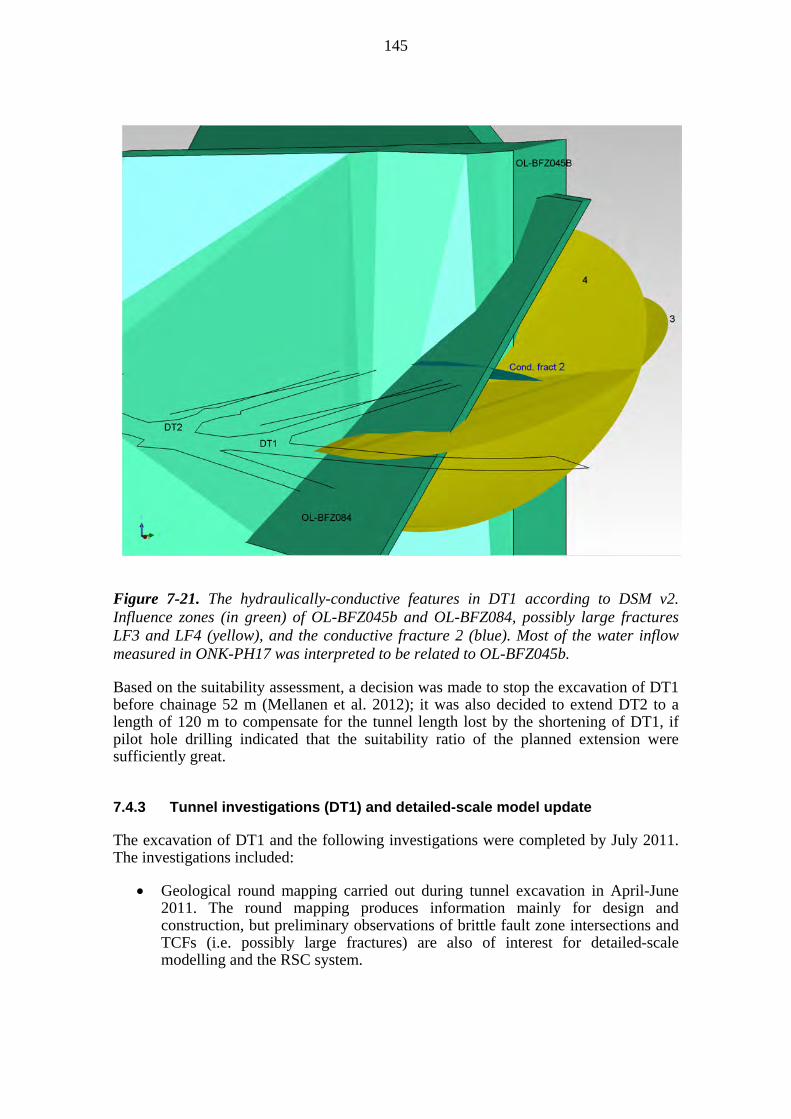
145
Figure 7-21. The hydraulically-conductive features in DT1 according to DSM v2. Influence zones (in green) of OL-BFZ045b and OL-BFZ084, possibly large fractures LF3 and LF4 (yellow), and the conductive fracture 2 (blue). Most of the water inflow measured in ONK-PH17 was interpreted to be related to OL-BFZ045b.
Based on the suitability assessment, a decision was made to stop the excavation of DT1 before chainage 52 m (Mellanen et al. 2012); it was also decided to extend DT2 to a length of 120 m to compensate for the tunnel length lost by the shortening of DT1, if pilot hole drilling indicated that the suitability ratio of the planned extension were sufficiently great.
7.4.3 Tunnel investigations (DT1) and detailed-scale model update
The excavation of DT1 and the following investigations were completed by July 2011. The investigations included:
Geological round mapping carried out during tunnel excavation in April-June 2011. The round mapping produces information mainly for design and construction, but preliminary observations of brittle fault zone intersections and TCFs (i.e. possibly large fractures) are also of interest for detailed-scale modelling and the RSC system.

146
Flow-measurements (PFL) in probe holes37 during tunnel excavation, providing information on the hydraulic conditions and groundwater flow.
Geological mapping of the excavated tunnel, including the cleaned floor of the tunnel carried out during June and July, 2011. All natural fractures with fracture traces longer than 25 cm, as well as brittle fault zone intersections, were mapped and, in the case of the demonstration tunnels, measured by a tachymeter to obtain their exact locations in 3D space. The most relevant observations for detailed-scale modelling are the locations and descriptions of brittle fault zones and TCFs.
Hydrogeological investigations which provided information on inflows in the excavated tunnel (observations of possible leakages, measuring structure-specific inflows, performed in mid-June 2011; information on the measurement method is presented in Section 4.7.2).
GPR investigations, comprising several measured profiles on the tunnel floor and walls to study the extent of the observed structures and to characterise the rock volume below the tunnel, carried out over the period June 28-30th 2011.
In addition to the data obtained from the excavated DT1, tunnel mapping and probe hole data from chainage 50 - 70 m of the demonstration facility central tunnel (see Figure 7-6), which was excavated before the excavation of DT1, were used at this point, together with data from the mise à la masse and hydraulic cross-hole measurements carried out in pilot holes ONK-PH16 and ONK-PH17 (see Section 7.4.1).
DSM v2 (see Section 7.4.1) was updated to version 3 over the period July 25th- August 2nd 2011, using data from the investigations listed above.
Two brittle fault zone intersections were observed during the mapping of the demonstration area central tunnel and DT1 (Figure 7-22). Based on their locations and orientations, the intersections were interpreted as representing the continuation of local brittle fault zone DSM-BFZ001 towards the east; and this was further supported by the mise à la masse data. The observations coincided with large fracture 2 of DSM v2, which was reinterpreted to be part of this brittle fault zone. Zone DSM-BFZ001 was remodelled on the basis of these new data, and large fracture 2 was removed from the model. The mise à la masse data further suggested an extension of the zone towards the west, but as it was not observed at the expected location in the ONKALO access tunnel, it was truncated against brittle fault zone OL-BFZ045b (Figure 7-23). Water inflows were observed from both of the zone intersections; in DT1, the flow was measured from the excavated tunnel by using a collector, which obtained a value of 4.8 mL/min.
37 Probe holes are ca. 20 – 26 m long holes bored during excavation within the profile of a tunnel to further characterise the volume to be excavated. The probe holes are bored in sets of four (one in each "corner" of the tunnel, with no drill core obtained, and are mainly used to assess hydraulic conditions.
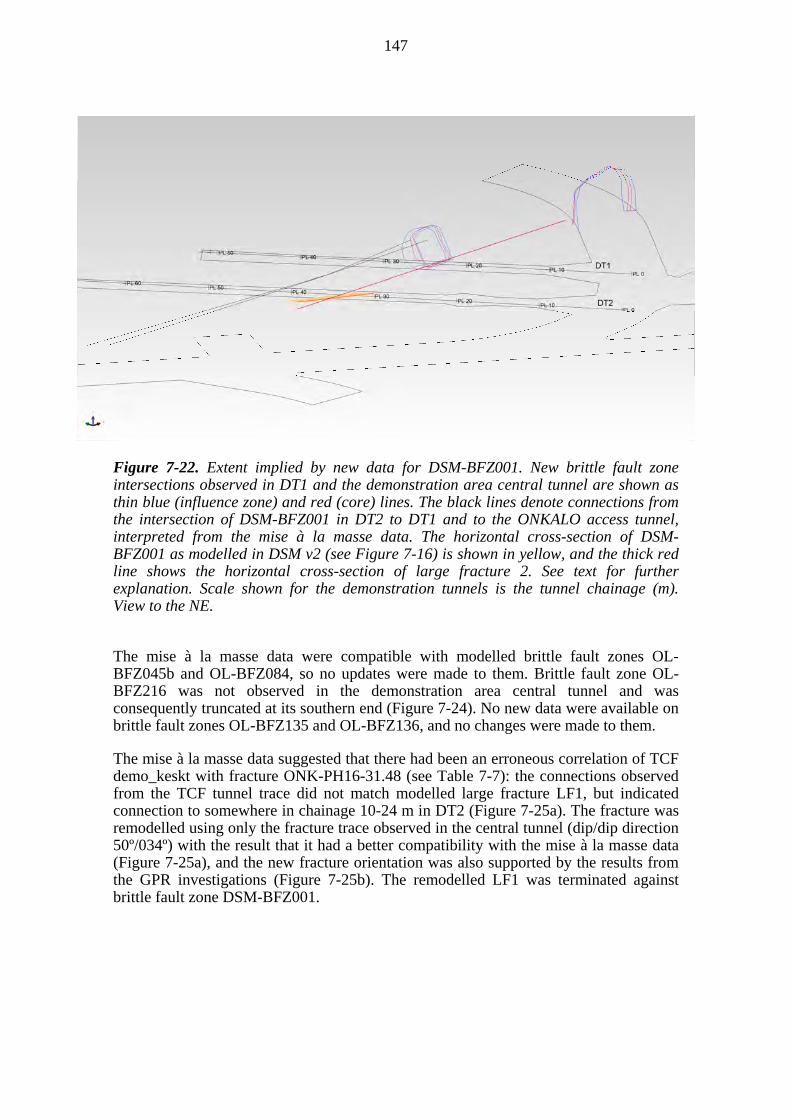
147
Figure 7-22. Extent implied by new data for DSM-BFZ001. New brittle fault zone intersections observed in DT1 and the demonstration area central tunnel are shown as thin blue (influence zone) and red (core) lines. The black lines denote connections from the intersection of DSM-BFZ001 in DT2 to DT1 and to the ONKALO access tunnel, interpreted from the mise à la masse data. The horizontal cross-section of DSM-BFZ001 as modelled in DSM v2 (see Figure 7-16) is shown in yellow, and the thick red line shows the horizontal cross-section of large fracture 2. See text for further explanation. Scale shown for the demonstration tunnels is the tunnel chainage (m). View to the NE.
The mise à la masse data were compatible with modelled brittle fault zones OL-BFZ045b and OL-BFZ084, so no updates were made to them. Brittle fault zone OL-BFZ216 was not observed in the demonstration area central tunnel and was consequently truncated at its southern end (Figure 7-24). No new data were available on brittle fault zones OL-BFZ135 and OL-BFZ136, and no changes were made to them.
The mise à la masse data suggested that there had been an erroneous correlation of TCF demo_keskt with fracture ONK-PH16-31.48 (see Table 7-7): the connections observed from the TCF tunnel trace did not match modelled large fracture LF1, but indicated connection to somewhere in chainage 10-24 m in DT2 (Figure 7-25a). The fracture was remodelled using only the fracture trace observed in the central tunnel (dip/dip direction 50º/034º) with the result that it had a better compatibility with the mise à la masse data (Figure 7-25a), and the new fracture orientation was also supported by the results from the GPR investigations (Figure 7-25b). The remodelled LF1 was terminated against brittle fault zone DSM-BFZ001.
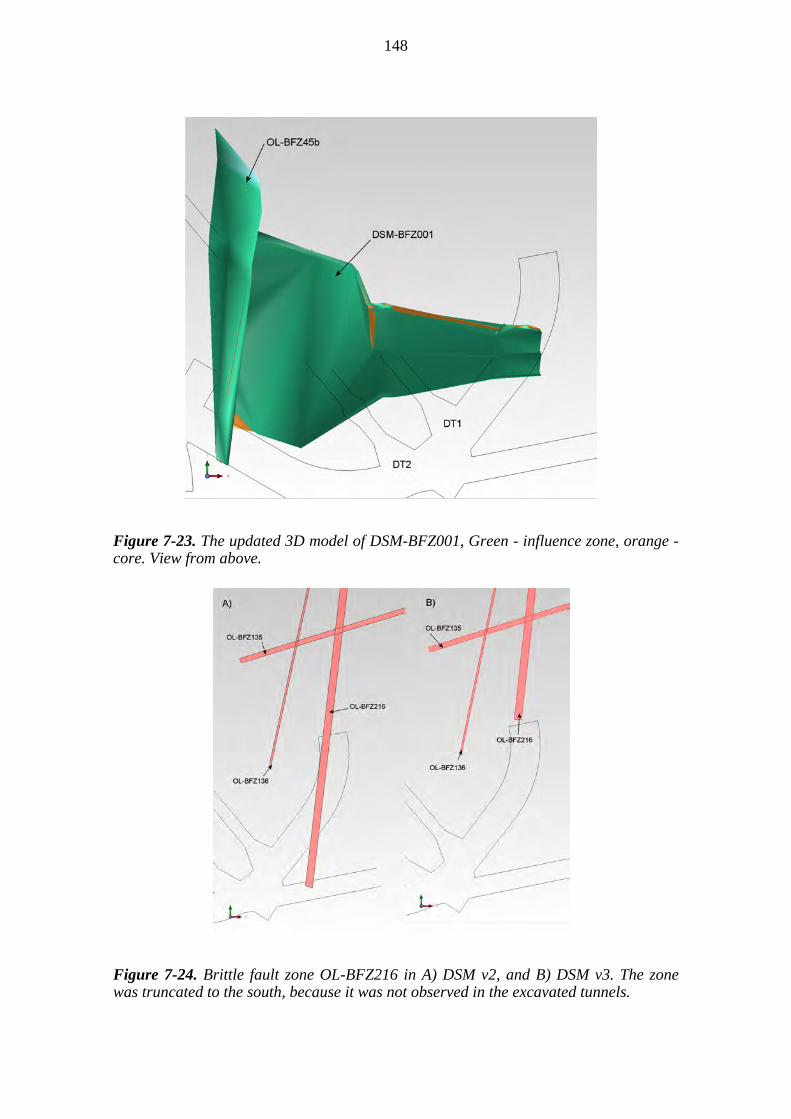
148
Figure 7-23. The updated 3D model of DSM-BFZ001, Green - influence zone, orange - core. View from above.
Figure 7-24. Brittle fault zone OL-BFZ216 in A) DSM v2, and B) DSM v3. The zone was truncated to the south, because it was not observed in the excavated tunnels.
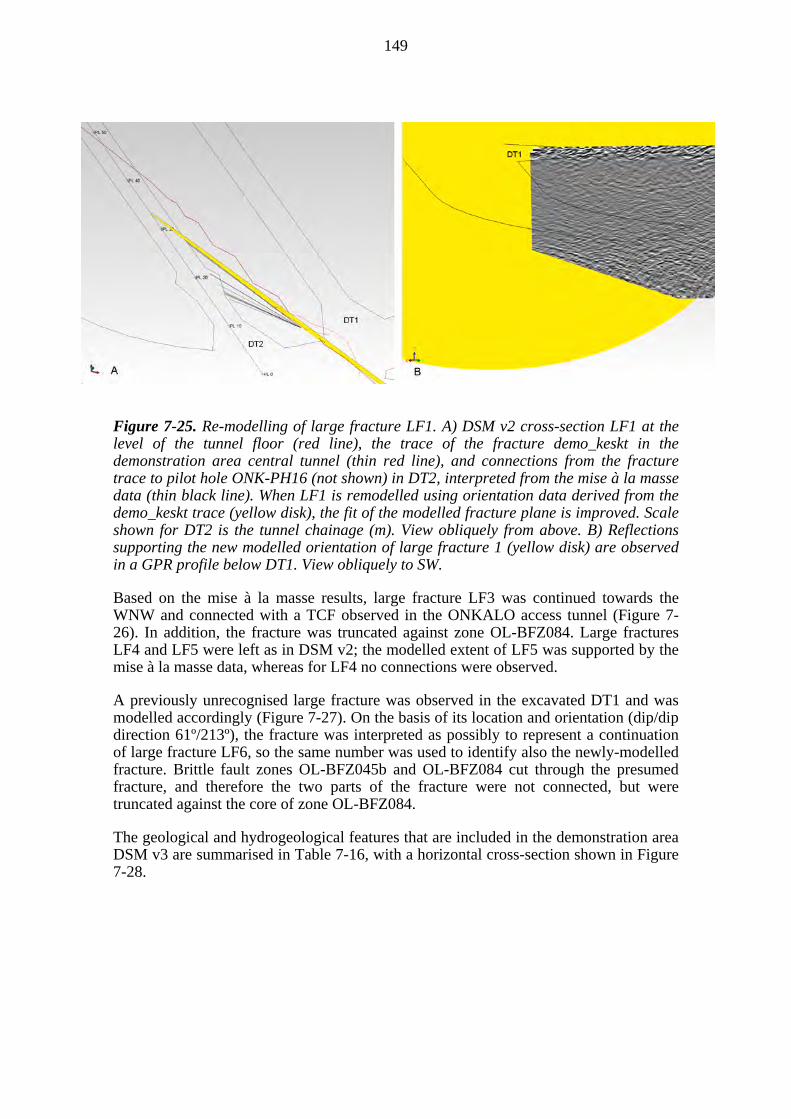
149
Figure 7-25. Re-modelling of large fracture LF1. A) DSM v2 cross-section LF1 at the level of the tunnel floor (red line), the trace of the fracture demo_keskt in the demonstration area central tunnel (thin red line), and connections from the fracture trace to pilot hole ONK-PH16 (not shown) in DT2, interpreted from the mise à la masse data (thin black line). When LF1 is remodelled using orientation data derived from the demo_keskt trace (yellow disk), the fit of the modelled fracture plane is improved. Scale shown for DT2 is the tunnel chainage (m). View obliquely from above. B) Reflections supporting the new modelled orientation of large fracture 1 (yellow disk) are observed in a GPR profile below DT1. View obliquely to SW.
Based on the mise à la masse results, large fracture LF3 was continued towards the WNW and connected with a TCF observed in the ONKALO access tunnel (Figure 7-26). In addition, the fracture was truncated against zone OL-BFZ084. Large fractures LF4 and LF5 were left as in DSM v2; the modelled extent of LF5 was supported by the mise à la masse data, whereas for LF4 no connections were observed.
A previously unrecognised large fracture was observed in the excavated DT1 and was modelled accordingly (Figure 7-27). On the basis of its location and orientation (dip/dip direction 61º/213º), the fracture was interpreted as possibly to represent a continuation of large fracture LF6, so the same number was used to identify also the newly-modelled fracture. Brittle fault zones OL-BFZ045b and OL-BFZ084 cut through the presumed fracture, and therefore the two parts of the fracture were not connected, but were truncated against the core of zone OL-BFZ084.
The geological and hydrogeological features that are included in the demonstration area DSM v3 are summarised in Table 7-16, with a horizontal cross-section shown in Figure 7-28.
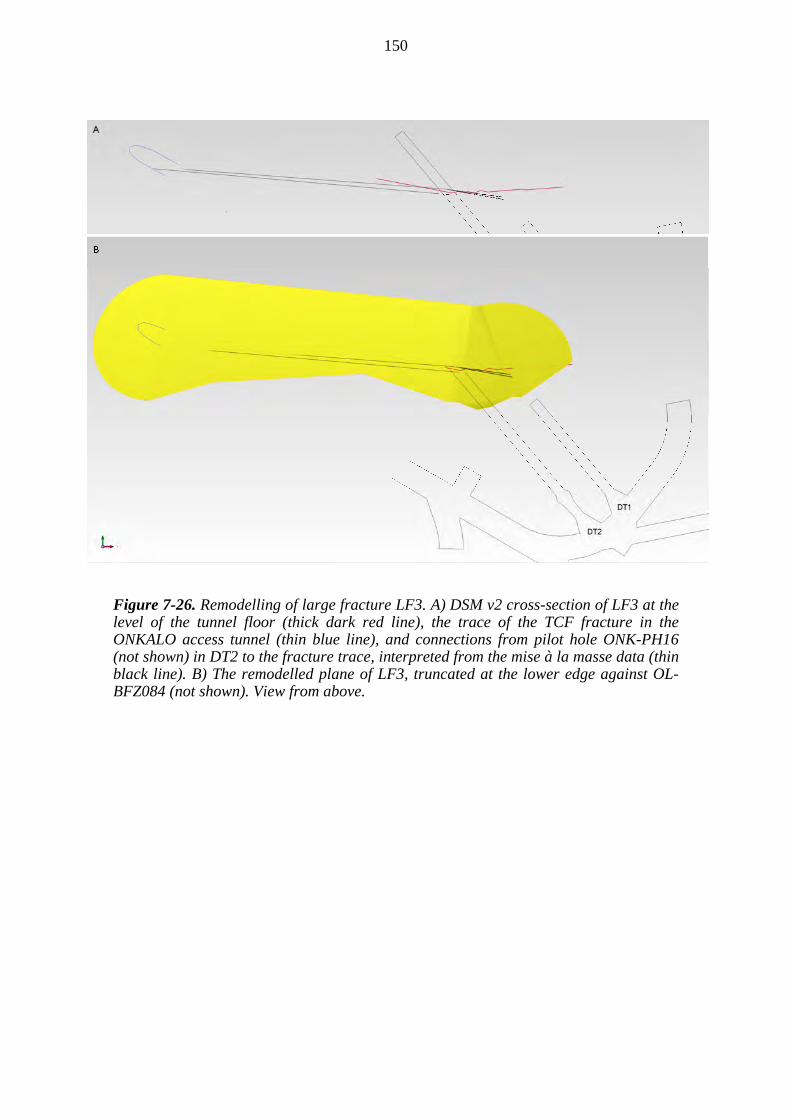
150
Figure 7-26. Remodelling of large fracture LF3. A) DSM v2 cross-section of LF3 at the level of the tunnel floor (thick dark red line), the trace of the TCF fracture in the ONKALO access tunnel (thin blue line), and connections from pilot hole ONK-PH16 (not shown) in DT2 to the fracture trace, interpreted from the mise à la masse data (thin black line). B) The remodelled plane of LF3, truncated at the lower edge against OL-BFZ084 (not shown). View from above.
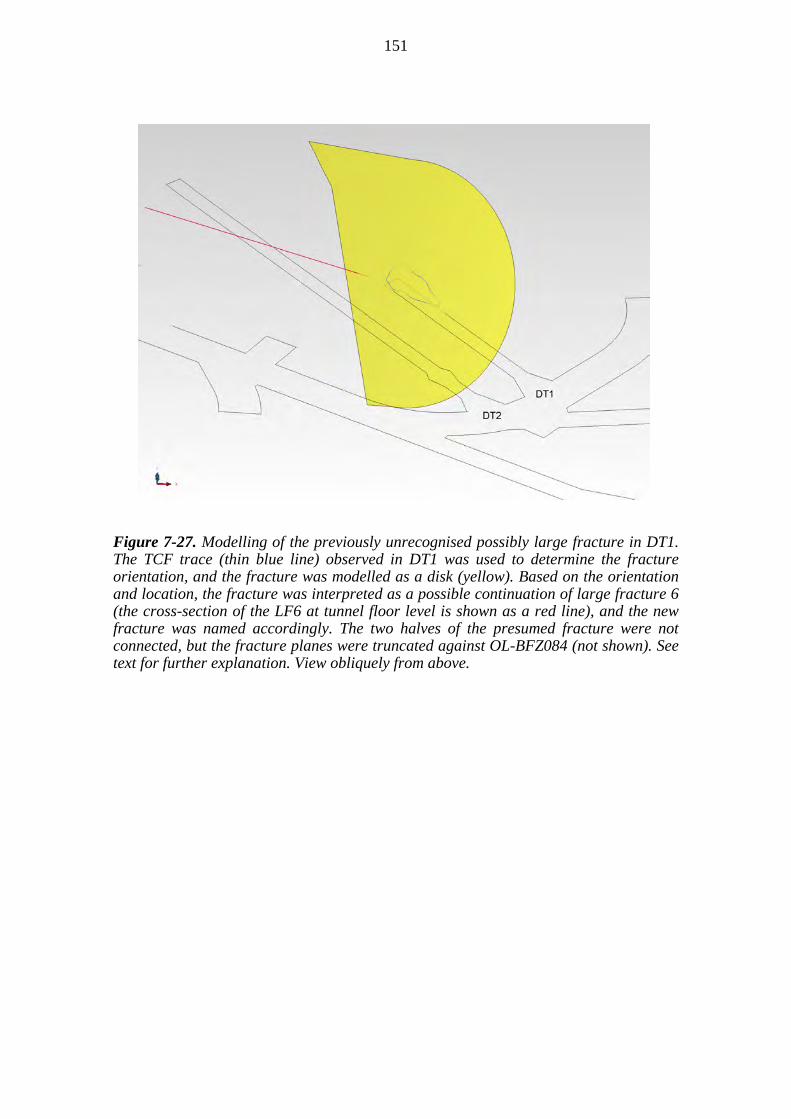
151
Figure 7-27. Modelling of the previously unrecognised possibly large fracture in DT1. The TCF trace (thin blue line) observed in DT1 was used to determine the fracture orientation, and the fracture was modelled as a disk (yellow). Based on the orientation and location, the fracture was interpreted as a possible continuation of large fracture 6 (the cross-section of the LF6 at tunnel floor level is shown as a red line), and the new fracture was named accordingly. The two halves of the presumed fracture were not connected, but the fracture planes were truncated against OL-BFZ084 (not shown). See text for further explanation. View obliquely from above.

152
Table 7-16. Summary of the structures in DSM v3 and the data used in the modelling. New data and new/updated structures compared to DSM v2 are shown in red; obsolete data and removed structures are denoted by grey background.

153
Figure 7-28. Horizontal cross-section of the demonstration area DSM v3 at the level of the demonstration tunnel floor. Red - BFZ (Aaltonen et al. 2010)/ BFZ core (remodelled zones); yellow - BFZ influence zone; black lines - possibly large fractures (LF); blue lines - minor water conductive fractures (HF). OL-BFZ045b, OL-BFZ084 and DSM-BFZ001, as well as LF3, LF5 and LF6, are hydraulically-conductive (see Table 7-16). Only the remodelled parts of the known extent (Aaltonen et al. 2010) of OL-BFZ045b and OL-BFZ084 are shown.
7.4.4 The 4th suitability classification (DT1) - August 2011
The fourth suitability classification was carried out only for DT1, as due to delays in the tunnel construction and the tightness of the RSC demonstration schedule, it was deemed necessary to proceed with the construction of DT1 without waiting for the excavation of DT2 (Mellanen et al. 2012). The results of the classification were used to select locations for experimental deposition holes in DT1.
The suitability classification was carried out by applying the then newly defined RSC-II criteria (see Section 5.2):
Deposition tunnels shall not intersect the respect volumes of the LDFs.
154
Maximum local (fracture-related) inflow into a deposition tunnel is 0.25 L/min at the time of backfill installation.
Deposition holes shall not intersect the respect volumes of the LDFs.
Deposition holes shall not be positioned within the respect volume of a hydrogeological zone.
Deposition holes shall not intersect the respect volumes of brittle fault zones.
The maximum allowable inflow into a deposition hole is 0.1 L/min.
0.5 m of buffer shall be left between a large fracture and a canister.
Potentially large fractures shall not intersect the canister:
o Fractures having dimension less than the limiting dimension can intersect the deposition hole and canister position.
o If the fracture diameter is unknown, the FPI criterion must be applied: A fracture traceable over a full deposition tunnel perimeter (FPI) can intersect the deposition hole if it is not intersecting a canister.
o If a fracture intersects an entire deposition hole and the location of the canister, and has an orientation that makes it impossible to observe its continuation in a tunnel or other deposition holes, the deposition hole must be discarded.
Grouting material is not allowed in a deposition hole.
As before, dimensions corresponding to the size of an OL-1 and 2 canister and deposition hole were used in the classification process: canister length 4.8 m, canister diameter 1.05 m, hole depth 7.8 m, hole diameter 1.75 m, top of the canister 2.2 m below the tunnel floor.
Bedrock features affecting the suitability of DT1
None of the brittle features found in the demonstration area were classified as LDFs, but the brittle features affected the placement of the experimental deposition holes. Based on the present understanding, the brittle features affecting the suitability of DT1 were brittle fault zones DSM-BFZ001 and OL-BFZ084 and large fractures 1 and 6 (Figures 7.28 and 7.29). These four features were considered in the suitability evaluation.
Zone DSM-BFZ001, which transected the DT1 at chainage 23 to 24.5 m, was known to be hydraulically-conductive with a flow of 4.8 mL/min (Table 7-16). Zone OL-BFZ084, which dipped below the end of the tunnel (Figure 7-29) was not hydraulically-conductive in the DT1 pilot hole (ONK-PH17), but minor transmissivity was associated with it in the DT2 pilot hole (ONK-PH16; Table 7-16). The flows related to these two zones were, however, clearly below the demands set by the criteria, and as the features and their respect volumes (influence zones) had already been avoided, due to the criterion related to the presence of brittle deformation zones, no further action was required.

155
No flow related to large fracture 6 is observed in DT1, although an enhanced transmissivity was associated with the presumed continuation of the feature in the DT2 pilot hole (ONK-PH16, Table 7-16). As this fracture had already been taken into account due to the large fracture criterion, no further action was required due to it being possibly hydraulically-conductive.
Figure 7-29. Vertical cross-section of DSM v3 along the centre line of DT1. Red - BFZ core; yellow - BFZ influence zone; black lines - possibly large fractures (LF); blue lines - minor hydraulically-conductive fractures (HF). DSM-BFZ001, OL-BFZ045b and OL-BFZ084, as well as large fractures LF3 and LF6, are also hydraulically-conductive. Only the remodelled parts of the known extent (Aaltonen et al. 2010) of OL-BFZ045b and OL-BFZ084 is shown. View from the NE.
Suitability assessment methodology
The possibly suitable and not suitable tunnel sections were determined graphically by using the Surpac software; the Fracture Calculator software was not used because of its limitations in calculating the effect of structures not directly intersecting the studied tunnel volume.

156
The RSC-II criteria state that: "deposition holes shall not intersect the respect volumes of brittle deformation zones". Therefore, to estimate the tunnel suitability in relation to brittle fault zones DSM-BFZ001 and OL-BFZ084, a 3D representation of a deposition hole with OL1-2 hole dimensions was moved along the centre line of the floor of DT1. Tunnel sections where the hole was not intersected by the influence zones (respect volumes) of the brittle deformation zones were classified as 'possibly suitable' for deposition hole placement (TUNps), and sections where intersection occurred, were classified as 'not suitable' (TUNns) (Figure 7-30a).
Figure 7-30. The principle of graphical suitability assessment. A) To assess tunnel suitability in relation to brittle fault zones, a 3D deposition hole is moved along the tunnel floor centre line. Tunnel sections where the hole intersects the influence zone (respect volume) of a brittle deformation zone are classified as 'not suitable', whilst the rest of the tunnel is 'possibly suitable'. B) To assess tunnel suitability in relation to large fractures (TCF), canister dimensions with an additional respect volume (0.5 m top and bottom, 0.35 m latearlly, see text for further details) are used instead of a deposition hole.
157
With regard to large fractures, the criteria state that: "if the fracture diameter is unknown, the FPI criterion must be applied: a fracture traceable over a full deposition tunnel perimeter (FPI) can intersect the deposition hole if it is not intersecting a canister" and further that: "0.5 m of buffer shall be left between a large fracture and a canister". Therefore, to determine tunnel suitability in relation to large fractures 1 and 6, a 3D object was created using the dimensions of an OL1-2 canister, with a further 0.5 m added to the top and bottom of the ‘canister’, representing the required layer of buffer (Figure 7.30b). Around the canister, however, only 0.35 m was added (i.e. the difference between the radius of the canister and the radius of the deposition hole, corresponding to the thickness of the layer of buffer around the canister), and it was noted that the criterion requiring 0.5 m of buffer between a large fracture and the canister needed further clarification in that regard.
Finally, the results from the structure-specific assessments were combined to obtain the overall tunnel suitability (see Figure 7-31, Table 7-17). In estimating the number of deposition holes that could have been placed within the possibly suitable tunnel sections, the following guidelines and dimensions were used:
The centre of the first hole in a tunnel is located 10 m from the tunnel mouth. This is due to the length of the hole boring machine (11 m).
The centre of the last hole in a tunnel must be at least 3.75 m from the tunnel end (revised from 3.0 m used earlier). This is to enable instalment of the canister into the hole.
The distance between two deposition holes must be at least 9.1 m (centre to centre; revised from 9.0 m used earlier)38
The diameter of a deposition hole is 1.75 m.
No length of tunnel reserved for a plug was taken into account at this stage.
Suitability of the demonstration tunnel 1 (DT1)
Based on the suitability classification, the DT1 contained three sections classified as possibly suitable (Figure 7-31, Table 7-17). These sections were located at tunnel chainages 13.60 - 19.75 m, 24.85 - 25.85 m and 42.10 - 50.15 m, and corresponded to 29 % of the tunnel length (suitability ratio). Based on these results, 2 deposition holes could have been placed in the tunnel (Table 7-17); for comparison, in an ideal case with no sections classified as not suitable, the total number of holes in a tunnel of identical length would have been 5, yielding a degree of utilisation of 40 % for DT1.
38 The changes in this distance are due to new information on the thermal conductivity of the buffer bentonite and pellet materials; more recently, the distance has been revised back to be 9.0 m (see Ikonen & Raiko 2012).
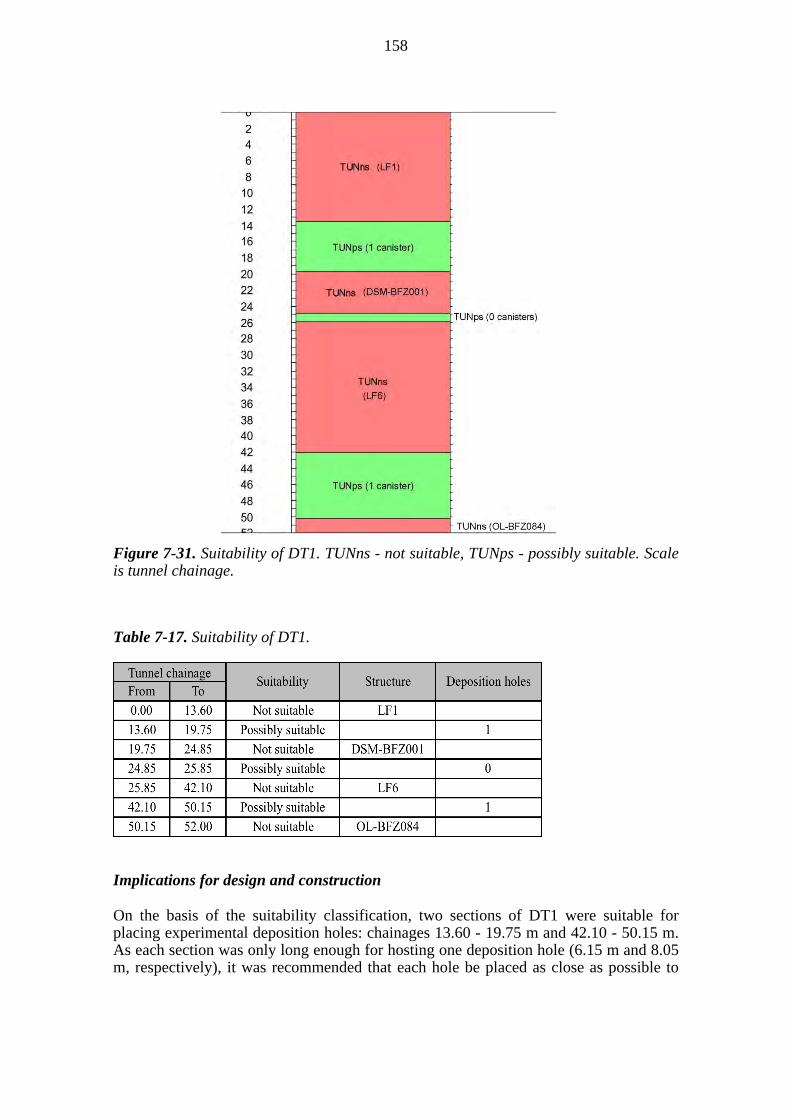
158
Figure 7-31. Suitability of DT1. TUNns - not suitable, TUNps - possibly suitable. Scale is tunnel chainage.
Table 7-17. Suitability of DT1.
Implications for design and construction On the basis of the suitability classification, two sections of DT1 were suitable for placing experimental deposition holes: chainages 13.60 - 19.75 m and 42.10 - 50.15 m. As each section was only long enough for hosting one deposition hole (6.15 m and 8.05 m, respectively), it was recommended that each hole be placed as close as possible to

159
the centres of each of the acceptable tunnel sections, to minimise the effect of uncertainties in modelling and the graphical suitability assessment method.
Based on the results of the suitability classification, locations were selected for the two proposed experimental deposition holes. In addition, two more experimental hole locations were selected from tunnel sections classified as not suitable, for the purpose of testing the prototype hole boring rig (Mellanen et al. 2012). Information from these holes would also provide additional information on the validity of the classification method, i.e. on whether the classification would be confirmed by the hole stage results.
7.5 Hole stage, part 1
During the hole stage, the suitability of the deposition hole locations selected on the basis of the tunnel suitability classification are assessed by drilling pilot holes at the selected locations and carrying out a new suitability assessment (see Figure 7-32 and Chapter 6). Deposition holes are bored at the approved locations and, following investigations carried out in the holes, the criteria are applied a second time to finally approve (or reject) each hole for deposition (Figure 7-2).
At the time of writing this report, the hole stage had been carried out in DT1, but had not yet commenced in DT2. The hole stage of DT1 is described in the sections below and further in Section 7.7.
7.5.1 Investigations and detailed-scale model update
Following the selection of locations for the planned experimental holes (ONK-EH6...ONK-EH9 at chainages 15 m, 25 m, 35 m and 45 m, respectively; see Mellanen et al. 2012), vertical 7.8 m long pilot holes39 were drilled at the selected locations over the period August 23rd - 25th, 2011. In addition to the "possibly suitable" experimental deposition hole locations (ONK-EH6 and ONK-EH9 at chainages 15 m and 45 m, respectively), a pilot hole was also drilled for one of the "not suitable" experimental holes (ONK-EH8 at chainage 35 m), in order to try to locate the possibly large fracture 6, which was expected to intersect the hole location (Figure 7-32). The pilot hole locations were slightly displaced along the tunnel centre line from the planned centres of the experimental holes, in order to prevent disturbance to the boring rig guide holes40.
After drilling, a set of investigations was carried out in the pilot holes, including geological logging of the pilot hole drill cores, the standard set of geophysical drillhole measurements (see for example Aalto et al. 2011), and hydrogeological difference flow logging. In addition, vertical radar profiling was tested as a new, non-standard
39 Equal to the length of the deposition hole, so as not to complicate the possible future backfilling of the holes.
40 At the start of the construction of the experimental holes, the boring rig first bores a guide hole (31 cm in diameter) at the centre of a planned experimental hole. This hole will then act as a guide for the large bit used to down-ream the actual experimental hole (1.75 m in diameter). For further explanation, see Mellanen et al. (2012).
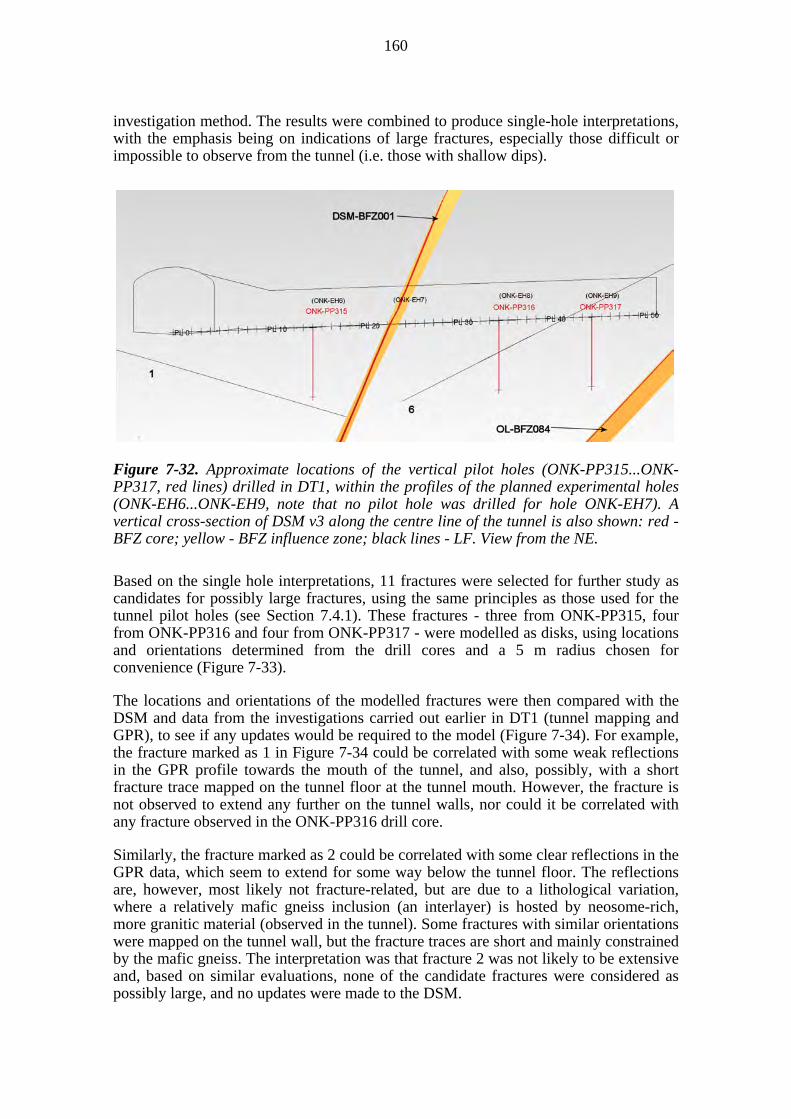
160
investigation method. The results were combined to produce single-hole interpretations, with the emphasis being on indications of large fractures, especially those difficult or impossible to observe from the tunnel (i.e. those with shallow dips).
Figure 7-32. Approximate locations of the vertical pilot holes (ONK-PP315...ONK-PP317, red lines) drilled in DT1, within the profiles of the planned experimental holes (ONK-EH6...ONK-EH9, note that no pilot hole was drilled for hole ONK-EH7). A vertical cross-section of DSM v3 along the centre line of the tunnel is also shown: red - BFZ core; yellow - BFZ influence zone; black lines - LF. View from the NE.
Based on the single hole interpretations, 11 fractures were selected for further study as candidates for possibly large fractures, using the same principles as those used for the tunnel pilot holes (see Section 7.4.1). These fractures - three from ONK-PP315, four from ONK-PP316 and four from ONK-PP317 - were modelled as disks, using locations and orientations determined from the drill cores and a 5 m radius chosen for convenience (Figure 7-33).
The locations and orientations of the modelled fractures were then compared with the DSM and data from the investigations carried out earlier in DT1 (tunnel mapping and GPR), to see if any updates would be required to the model (Figure 7-34). For example, the fracture marked as 1 in Figure 7-34 could be correlated with some weak reflections in the GPR profile towards the mouth of the tunnel, and also, possibly, with a short fracture trace mapped on the tunnel floor at the tunnel mouth. However, the fracture is not observed to extend any further on the tunnel walls, nor could it be correlated with any fracture observed in the ONK-PP316 drill core.
Similarly, the fracture marked as 2 could be correlated with some clear reflections in the GPR data, which seem to extend for some way below the tunnel floor. The reflections are, however, most likely not fracture-related, but are due to a lithological variation, where a relatively mafic gneiss inclusion (an interlayer) is hosted by neosome-rich, more granitic material (observed in the tunnel). Some fractures with similar orientations were mapped on the tunnel wall, but the fracture traces are short and mainly constrained by the mafic gneiss. The interpretation was that fracture 2 was not likely to be extensive and, based on similar evaluations, none of the candidate fractures were considered as possibly large, and no updates were made to the DSM.
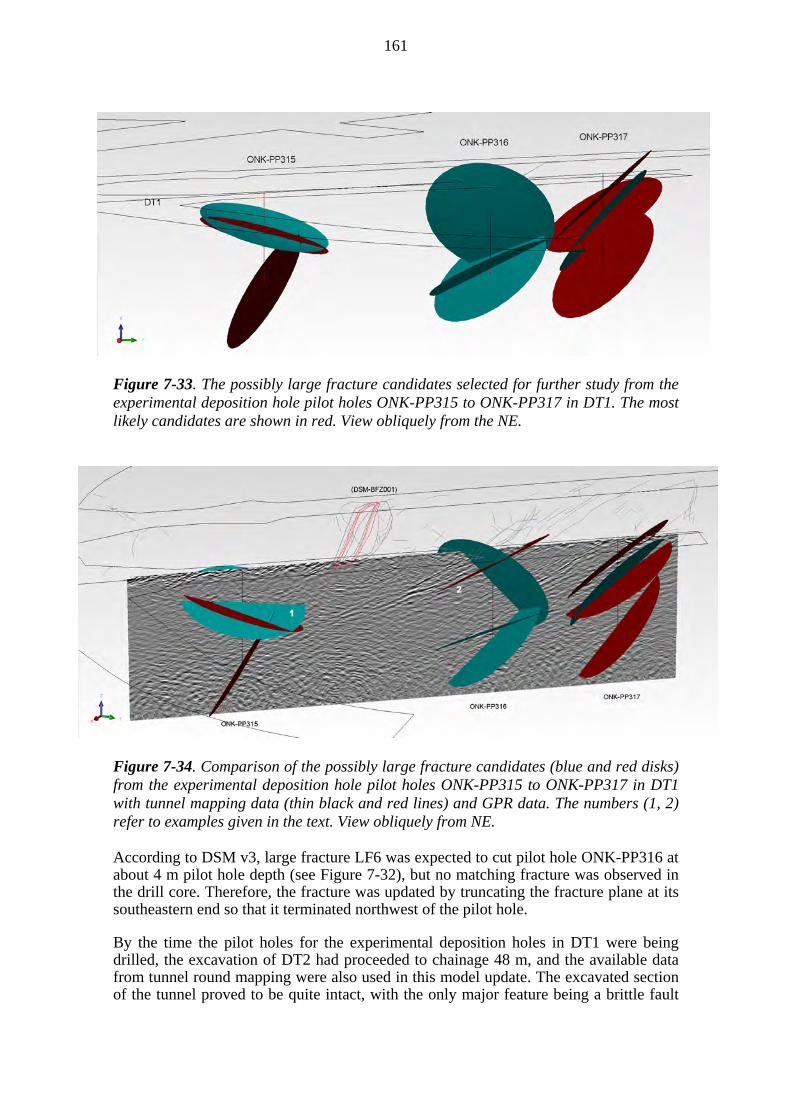
161
Figure 7-33. The possibly large fracture candidates selected for further study from the experimental deposition hole pilot holes ONK-PP315 to ONK-PP317 in DT1. The most likely candidates are shown in red. View obliquely from the NE.
Figure 7-34. Comparison of the possibly large fracture candidates (blue and red disks) from the experimental deposition hole pilot holes ONK-PP315 to ONK-PP317 in DT1 with tunnel mapping data (thin black and red lines) and GPR data. The numbers (1, 2) refer to examples given in the text. View obliquely from NE. According to DSM v3, large fracture LF6 was expected to cut pilot hole ONK-PP316 at about 4 m pilot hole depth (see Figure 7-32), but no matching fracture was observed in the drill core. Therefore, the fracture was updated by truncating the fracture plane at its southeastern end so that it terminated northwest of the pilot hole.
By the time the pilot holes for the experimental deposition holes in DT1 were being drilled, the excavation of DT2 had proceeded to chainage 48 m, and the available data from tunnel round mapping were also used in this model update. The excavated section of the tunnel proved to be quite intact, with the only major feature being a brittle fault

162
zone intersection at about chainage 33-34 m, the expected location of the modelled brittle fault zone DSM-BFZ001 (Figure 7-35). The observed orientation of the zone intersection (dip/dip direction of the core 54º/186º) differed slightly from that determined from the ONK-PH16 drill core (47º/198º; see Section 7.4.1), so the western part of the zone was updated to fit the new observations. Large fracture 1 was not observed in the excavated part of DT2, supporting the change made in DSM v3 (see Figures 7-16 and 7-28, for example) and the extent of the fracture on its northwestern boundary was updated, so as not to intersect the tunnel.
Figure 7-35. Traces of brittle fault zone DSM-BFZ001 measured in the demonstration area central tunnel and in DT1, and the new zone intersection trace measured in DT2. Red line - influence zone, blue line - core. View obliquely from SW. In addition to the tunnel mapping data from DT2, data from two probe holes drilled from chainage 49 m to chainage 70 m, to gain additional information on the hydraulically-conductive brittle fault zones OL-BFZ045b and OL-BFZ084 (see Mellanen et al. 2012), were examined in this model update. Results from the standard flow log and water loss measurements were compared with fracture data obtained from optical drillhole images, and ten of the total of 18 measured flows were successfully correlated to an observed fracture or a set of fractures (Table 7-18).
When modelled in 3D and compared to DSM v3, all but one of the interpreted hydraulically-conductive fractures (i.e. those with successfully correlated flows) were found to be compatible with modelled brittle fault zones OL-BFZ045b and OL-BFZ084, already known to be hydraulically-conductive (Figure 7-36). The probe hole data indicated that the locations of the cores of these zones, especially the core of OL-BFZ085, might not be located exactly where modelled, but the overall compatibility of the data and the model was considered good enough and the zones were not updated at this stage. It was also decided to omit the one hydraulically-conductive fracture not compatible with the two zones or with other modelled features (fracture at a depth of 23.04 m in probe hole A3, Table 7-18; Figure 7-36) from the model.

163
Table 7-18. Summary of results from flow measurements in probe holes ONK-TDT4399-30-49-A3 and -A4 in DT2, and their correlation to fractures logged from optical drillhole images. Uncertain or non-existent correlation is indicated by a grey background. Relation of successfully correlated features to structures in DSM v3 is noted in the comments.
Fracture depth
Dip Dip dir Comments
A3 9.2 62 4.0E-11 * Uncertain correlation, no clear fracture in image
A3 11.7 2630 1.7E-9 11.52 78 265 OL‐BFZ045b core, several fractures
A3 12.1 472 3.1E-10 * Uncertain correlation
A3 12.4 400 2.6E-10 * 12.42 69 287 OL.BFZ045b
A3 15.4 17 1.1E-11 * Uncertain correlation, partially filled fracture
A3 19.9 488 3.2E-10 19.89 44 166 OL‐BFZ084, several fractures
A3 20.5 65 4.2E-11 20.44 51 185 OL‐BFZ084
A3 21.3 24 1.6E-11 * 20.98 36 164 OL‐BFZ084, several fractures
A3 23.3 32 2.1E-11 23.04 87 170 Not in the detailed‐scale model
A4 4.1 32 2.1E-11 * Uncertain correlation, no clear fracture in image
A4 5.5 48 3.1E-11 * Uncertain correlation, no clear fracture in image
A4 6.3 69 4.5E-11 * Uncertain correlation, filled fracture
A4 7 68 4.4E-11 * Uncertain correlation, partially filled fracture
A4 9.2 1740 Manual Uncertain correlation, no clear fracture in image
A4 11.2 2548 Manual 11.12 83 101 OL‐BFZ045b
A4 12.2 144 9.4E-11 11.92 85 76 OL‐BFZ‐045b, several fractures
A4 19 132 8.6E-11 18.67 57 168 OL‐BFZ084, several fractures
A4 20.1 76 4.9E-11 19.67 52 177 OL‐BFZ084
* Uncertain fracture. The flow rate is less than 30 mL/h or the flow anomalies are overlapping or they are unclear because of noise.
Borehole: ONK‐
TDT4399‐30‐49‐Depth of fracture
along the borehole (m) Flow (mL/h) T (m2/s) Comments
Correlation to fracture log from borehole images
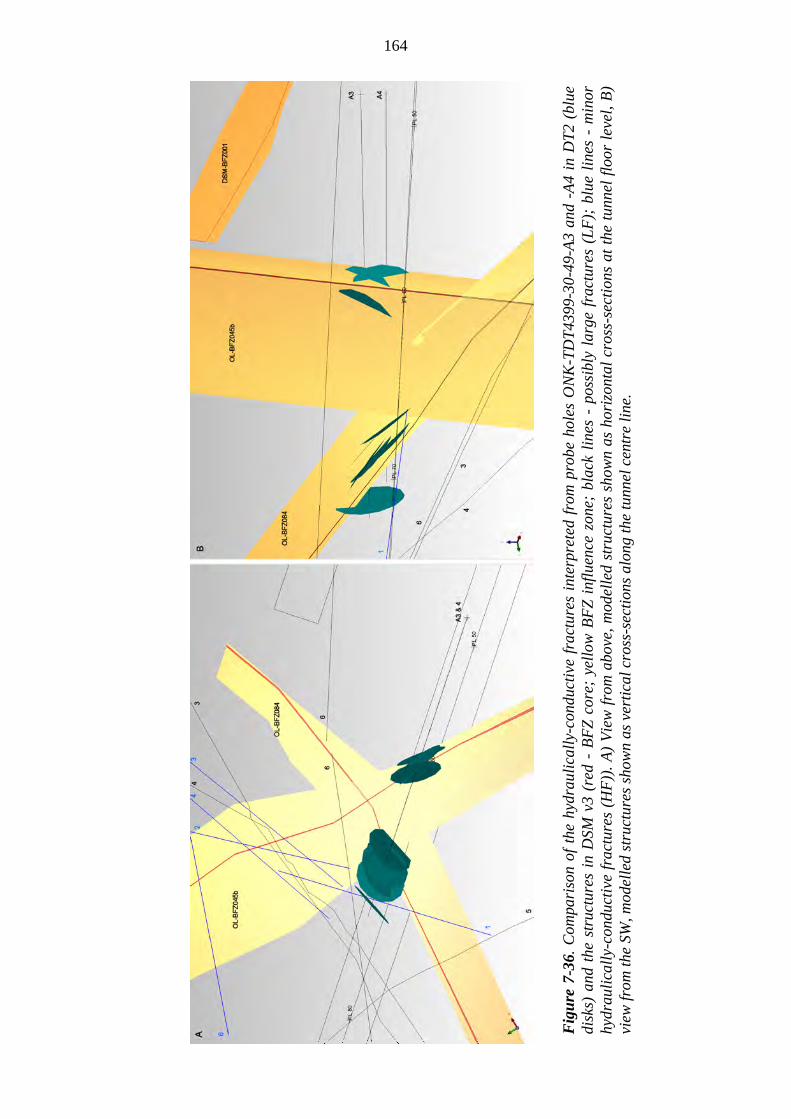
164
Fig
ure
7-3
6. C
ompa
riso
n of
the
hyd
raul
ical
ly-c
ondu
ctiv
e fr
actu
res
inte
rpre
ted
from
pro
be h
oles
ON
K-T
DT
4399
-30-
49-A
3 an
d -A
4 in
DT
2 (b
lue
disk
s) a
nd t
he s
truc
ture
s in
DSM
v3
(red
- B
FZ
cor
e; y
ello
w B
FZ
inf
luen
ce z
one;
bla
ck l
ines
- p
ossi
bly
larg
e fr
actu
res
(LF
); b
lue
line
s -
min
or
hydr
auli
call
y-co
nduc
tive
fra
ctur
es (
HF
)). A
) V
iew
fro
m a
bove
, mod
elle
d st
ruct
ures
sho
wn
as h
oriz
onta
l cr
oss-
sect
ions
at
the
tunn
el f
loor
lev
el, B
) vi
ew fr
om th
e SW
, mod
elle
d st
ruct
ures
sho
wn
as v
erti
cal c
ross
-sec
tions
alo
ng th
e tu
nnel
cen
tre
line
.

165
A summary of DSM v4 is given in Table 7-19, with a horizontal cross-section of the structures shown in Figure 7-37.
Table 7-19. Summary of the structures in DSM v4 and the data used in the modelling. New data and new/updated structures compared to DSM v3 are shown in red; obsolete data and deleted structures are denoted by a grey background. Data and structures that became obsolete during previous updates of the model have been removed from the table (see Table 7-16).

166
Figure 7-37. Horizontal cross-section of the demonstration area DSM v4 at the level of the demonstration tunnel floor. Red - BFZ (Aaltonen et al. 2010) / BFZ core (remodelled zones); yellow - BFZ influence zone; black lines - possibly large fractures (LF); blue lines - minor hydraulically-conductive fractures (HF). OL-BFZ045b, OL-BFZ084 and DSM-BFZ001, as well as LF3, LF5 and LF6, are hydraulically-conductive (see Table 7-19). Only the remodelled parts of the known extent (Aaltonen et al. 2010) of OL-BFZ045b and OL-BFZ084 are shown.
7.5.2 The 5th suitability classification (DT1) - October 2011
Following the updating of the DSM to v4, the fifth suitability classification was carried out. The classification considered only DT1 and was aimed at further assessing the suitability of the locations of the selected experimental deposition holes. Both the two hole locations selected from the tunnel sections, previously classified as possibly suitable, and the two additional holes located in not suitable tunnel sections, to provide more experience in the use of the hole boring rig, were taken into account. The RSC-II criteria used in the previous suitability classification (see Section 7.4.4) were still valid and were applied in carrying out the classification.

167
Brittle deformation features
According to the RSC-II criteria, the deposition tunnels and holes must not intersect the respect volumes of LDFs. In addition, the deposition holes could not be placed within the respect volumes of brittle deformation zones, and the canister locations within the holes could not be intersected by large fractures of unknown diameter (see Section 7.4.4).
No new brittle fault zones were observed in the experimental deposition hole pilot holes or in the excavated part of DT2. The only update made to the previously known brittle deformation zones in DSM v4 was a slight modification to the location and orientation of the western part of DSM-BFZ001, based on the zone intersection observations in DT2 (see Figures 7-28 and 7-37, for example). This update had no effect on the eastern part of the zone, and caused no change in the suitability of DT1 or in the selected hole locations.
No indication of the presence of new possibly large fractures was discerned in the experimental deposition hole pilot holes. Thus, in the light of the new data and DSM v4, the locations selected for holes ONK-EH6 and ONK-EH9 (see Figure 7-32) were still deemed possibly suitable in this respect.
Large fracture 6, which had been expected to intersect the location chosen for hole ONK-EH8, was not observed in pilot hole ONK-PP316 (see Figure 7-32), and was thus remodelled so as to be less extensive. The result of this revision implied that the location chosen for ONK-EH8 could now fulfil the rock suitability criteria and thus be suitable, contrary to the previous suitability assessment. This fracture, however, lies parallel to the foliation and in places is difficult to observe, even in the tunnel. It was concluded that as it might not be clearly observable in the pilot hole, the location would instead retain its classification as not suitable.
No new possibly large fractures were observed in the excavated part of DT2, nor were any indicated by the probe hole data, where observed significant brittle deformation could be correlated with already modelled features. The update of large fracture LF1 (see Table 7-19 and Figure 7-37) had no effect on the suitability of DT1 or on the selected locations for the experimental deposition holes.
Hydraulically-conductive features
The criteria pertaining to hydrogeological conditions in the host rock state that the maximum allowable, local (fracture-related) inflow into a deposition tunnel is 0.25 L/min, at the time of backfill installation, and that the maximum allowed inflow into a deposition hole is 0.1 L/min. The criteria further state that a deposition hole cannot be located within the respect volume of a hydrogeological zone.
Hydrogeological measurements were carried out in the three deposition hole pilot holes in DT1 and in probe holes in DT2 (see Figures 7-32 and 7-36). No inflow was observed in any of the three experimental deposition hole pilot holes, and the hydraulically-conductive features interpreted from the probe holes in DT2 were correlated with zones OL-BFZ045b and OL-BFZ084. These were not transected by DT1 and had already been taken into account in the previous suitability classification and in the selecting of the experimental deposition hole locations. Thus, these hydraulically-conductive features had no further effect on the suitability of DT1 or on the selected hole locations.

168
Implications for design and construction The new data and the minor modifications made to the DSM, as described above, were found not to affect the suitability of DT1 or the selected experimental deposition hole locations. It was noted, however, that according to DSM v4, large fracture 6 was likely to be smaller than originally anticipated and that the presumably not suitable location for ONK-EH8 at chainage 35 m, selected for the purpose of testing the hole boring rig, could in the end turn out to be suitable. It was concluded that the two experimental deposition hole locations selected within the tunnel sections classified as possibly suitable (ONK-EH6 and ONK-EH9 at chainages 15 m and 45 m, respectively) remained possibly suitable.
Thus, the design and construction work of all planned four experimental holes could proceed as planned at the selected locations (see Mellanen et al. 2012).
7.6 Tunnel stage, part 2
From the RSC point of view, the tunnel stage continued for DT2 in February, 2012, when the tunnel excavation had reached the originally planned length of 85 m. Based on suitability classification 3, it had been decided to extend the length of DT2 from 85 m to 120 m, to compensate for the loss of tunnel length caused by the decision to stop the excavation of DT1 at 52 m (see Section 7.4.2).
7.6.1 Investigations and detailed-scale model update
Pilot hole ONK-PH16 only covered the originally planned 85 m length of DT2, so an additional pilot hole, ONK-PH20, was drilled in February 20th - 22nd, 2012, from DT2 chainage 85 m to 120 m to gain preliminary information on the volume for detailed-scale modelling and suitability classification (Figure 7-38). The drilling was again followed by Posiva's standard geophysical and hydrogeological drillhole investigations and by geological logging of the drill core, which were completed by February 29th. In addition to data from pilot hole ONK-PH20, data from an investigation hole drilled earlier from the ONKALO access tunnel towards the demonstration facility (ONK-KR13, Figure 7-38) were used at this stage to update the DSM. Data from the preliminary geological mapping ("round mapping") of the walls and roof of the excavated 85 m of DT2 were also assessed.
The DSM was updated to v5 during April, 2012. Brittle fault zone DSM-BFZ001 had already been updated using the tunnel mapping data in DSM v4, and no changes were made to the zone in the demonstration area. However, since the previous DSM update, this zone had been included in the geological Site model and been renamed ONK-BFZ297; at the same time, it had also been extended further east, based on an interpreted correlation with a zone intersection in deep drillhole ONK-KR4. The changed name for the zone was incorporated into DSM v5, and the zone was extended further east in concert with the Site model. Similarly, brittle fault zone ONK-BFZ045b had been renamed ONK-BFZ045 in the geological Site model, and the change was made also in the DSM. No other updates were made to OL-BFZ045, as both the location and orientation of the core observed in the tunnel were in perfect agreement with the modelled core (Figure 7-39). The influence zone of OL-BFZ045 observed in the tunnel was slightly narrower than that modelled, but it was decided to re-evaluate the need for potentially updating this zone during the next model update, after the tunnel
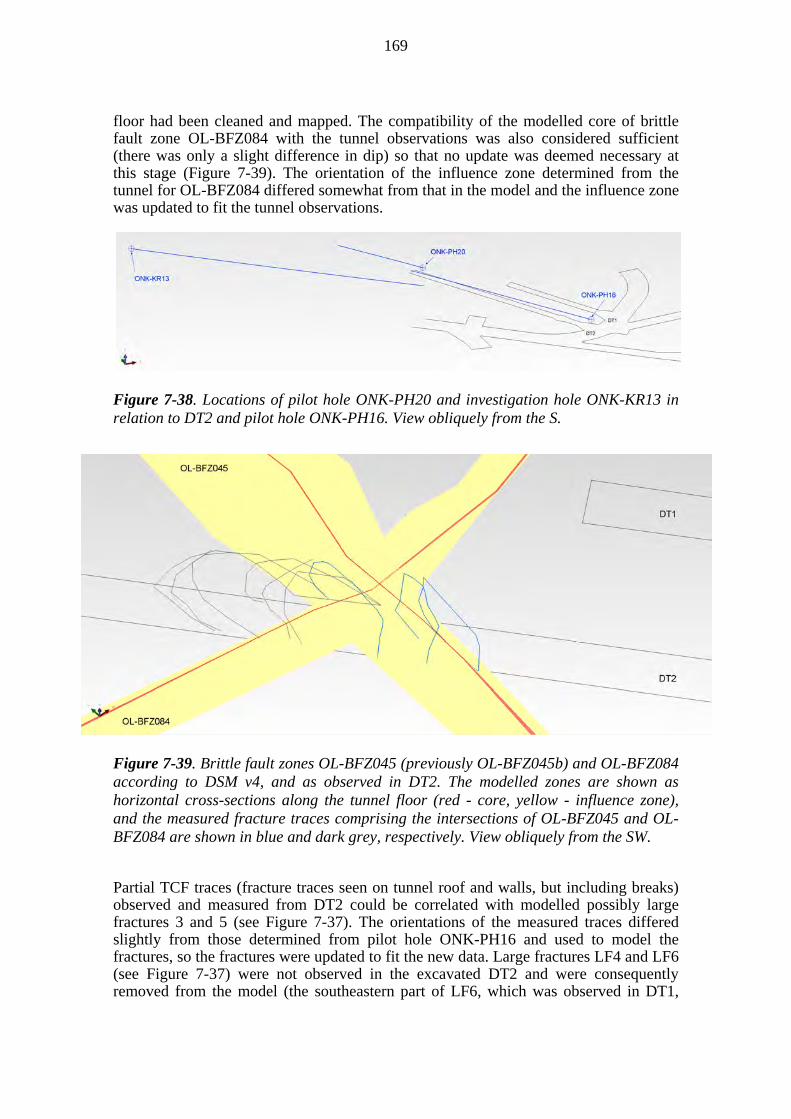
169
floor had been cleaned and mapped. The compatibility of the modelled core of brittle fault zone OL-BFZ084 with the tunnel observations was also considered sufficient (there was only a slight difference in dip) so that no update was deemed necessary at this stage (Figure 7-39). The orientation of the influence zone determined from the tunnel for OL-BFZ084 differed somewhat from that in the model and the influence zone was updated to fit the tunnel observations.
Figure 7-38. Locations of pilot hole ONK-PH20 and investigation hole ONK-KR13 in relation to DT2 and pilot hole ONK-PH16. View obliquely from the S.
Figure 7-39. Brittle fault zones OL-BFZ045 (previously OL-BFZ045b) and OL-BFZ084 according to DSM v4, and as observed in DT2. The modelled zones are shown as horizontal cross-sections along the tunnel floor (red - core, yellow - influence zone), and the measured fracture traces comprising the intersections of OL-BFZ045 and OL-BFZ084 are shown in blue and dark grey, respectively. View obliquely from the SW.
Partial TCF traces (fracture traces seen on tunnel roof and walls, but including breaks) observed and measured from DT2 could be correlated with modelled possibly large fractures 3 and 5 (see Figure 7-37). The orientations of the measured traces differed slightly from those determined from pilot hole ONK-PH16 and used to model the fractures, so the fractures were updated to fit the new data. Large fractures LF4 and LF6 (see Figure 7-37) were not observed in the excavated DT2 and were consequently removed from the model (the southeastern part of LF6, which was observed in DT1,
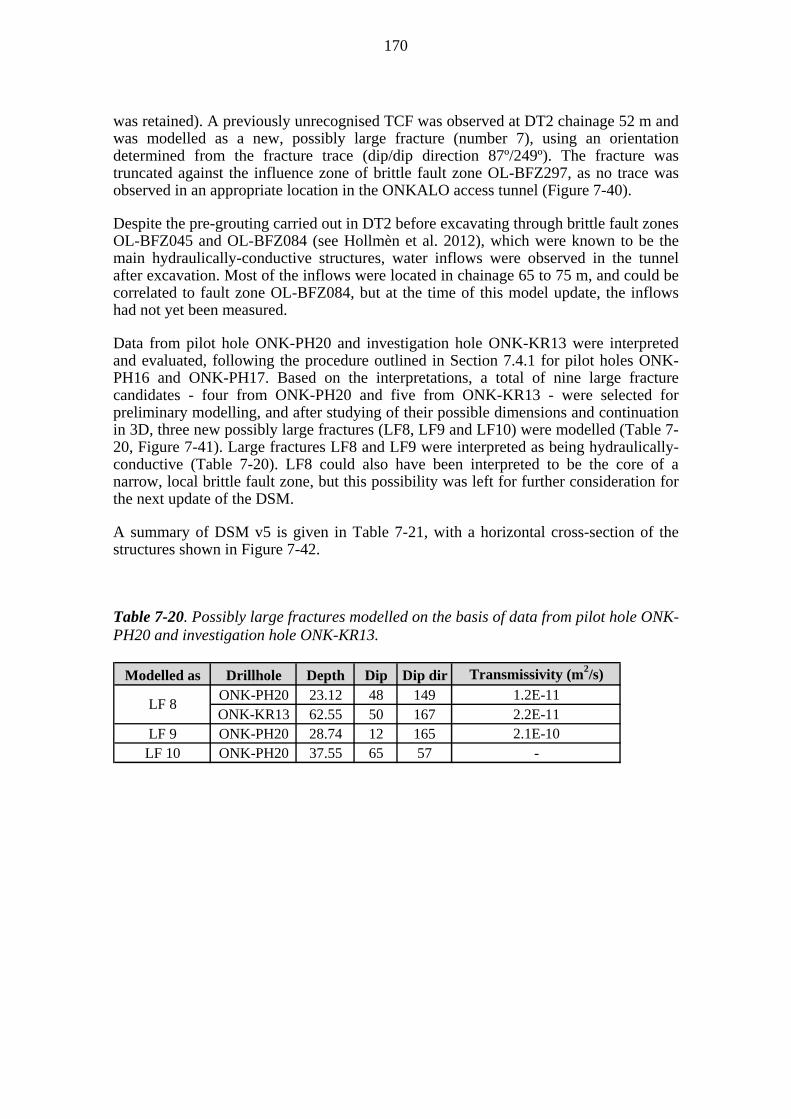
170
was retained). A previously unrecognised TCF was observed at DT2 chainage 52 m and was modelled as a new, possibly large fracture (number 7), using an orientation determined from the fracture trace (dip/dip direction 87º/249º). The fracture was truncated against the influence zone of brittle fault zone OL-BFZ297, as no trace was observed in an appropriate location in the ONKALO access tunnel (Figure 7-40).
Despite the pre-grouting carried out in DT2 before excavating through brittle fault zones OL-BFZ045 and OL-BFZ084 (see Hollmèn et al. 2012), which were known to be the main hydraulically-conductive structures, water inflows were observed in the tunnel after excavation. Most of the inflows were located in chainage 65 to 75 m, and could be correlated to fault zone OL-BFZ084, but at the time of this model update, the inflows had not yet been measured.
Data from pilot hole ONK-PH20 and investigation hole ONK-KR13 were interpreted and evaluated, following the procedure outlined in Section 7.4.1 for pilot holes ONK-PH16 and ONK-PH17. Based on the interpretations, a total of nine large fracture candidates - four from ONK-PH20 and five from ONK-KR13 - were selected for preliminary modelling, and after studying of their possible dimensions and continuation in 3D, three new possibly large fractures (LF8, LF9 and LF10) were modelled (Table 7-20, Figure 7-41). Large fractures LF8 and LF9 were interpreted as being hydraulically-conductive (Table 7-20). LF8 could also have been interpreted to be the core of a narrow, local brittle fault zone, but this possibility was left for further consideration for the next update of the DSM.
A summary of DSM v5 is given in Table 7-21, with a horizontal cross-section of the structures shown in Figure 7-42.
Table 7-20. Possibly large fractures modelled on the basis of data from pilot hole ONK-PH20 and investigation hole ONK-KR13.
Modelled as Drillhole Depth Dip Dip dir Transmissivity (m2/s)
ONK-PH20 23.12 48 149 1.2E-11ONK-KR13 62.55 50 167 2.2E-11
LF 9 ONK-PH20 28.74 12 165 2.1E-10LF 10 ONK-PH20 37.55 65 57 -
LF 8

171
Figure 7-40. Possibly large fracture LF7 (yellow disk) and its fracture trace observed in the tunnel (red line). The fracture was truncated against the influence zone of OL-BFZ297 (in green; previously DSM-BFZ001), as no evidence of its continuation was observed in the ONKALO access tunnel (expected approximate location of the possible extension of the fracture is shown by the dashed black line). OL-BFZ045 and OL-BFZ084 are shown as horizontal cross-sections along the tunnel floor (red - core, brown - influence zone). View obliquely from the W.
Figure 7-41. Possibly large fractures modelled on the basis of data from pilot hole ONK-PH20 and investigation hole ONK-KR13. View from above.

172
Table 7-21. Summary of the structures in DSM v5 and the data used in the modelling. New data and new/updated structures compared to DSM v4 are shown in red; obsolete data and deleted structures are denoted by grey background. Data and structures that became obsolete during previous updates have been removed from the table (see Table 7-19). Please note that the new data available from DT2 at this stage, and shown in the table, was from the preliminary (round) mapping of the tunnel.
ORIENTATION
(DIP/DIR) CORE INFLUENCE ZONEONKALO ONK-BFI-4377 86/093 - -
ONK-PH16 ONK-PH16-BFI-5322-6140 86/272 8.8E-119.5E-11 to
8.9E-10
ONK-PH17 ONK-PH17-BFI-6251-7763 90/086 9.7E-99.7E-11 to
9.2E-9mise a la masse mam-PH16-31 - - -
DT2 probe holes ONK-TDT4399-30-49-A3 - max 1.7E-9 max 2.6E-10DT2 ONK-TDT-4399-30-56.8-BFI (round) not calculated not measured not measured
ONKALO ONK-BFI-4276 49/167 - -ONK-PH16 ONK-PH16-BFI-5997-6520 47/184 5.0E-10 -ONK-PH17 ONK-PH17-BFI-5403-5666 50/159 - -
mise a la masse mam-PH16-64 - - -DT2 probe holes ONK-TDT4399-30-49-A3 - max 3.2E-10 -
DT2 ONK-TDT-4399-30-68.4-BFI (round) not calculated not measured not measuredDemo CT ONK-TT-4399-BFI-62.6 81/181 not measured not measured
DT1 ONK-TDT-4399-44-BFI-22.3 72/175 4.8 ml/min -DT2 ONK-TDT-4399-30-BFI-34.5 54/186 - -
mise a la masse mam-PH16-31 - - -OL-BFZ135 * brittle fault zone OL-KR10 OL-KR10-BFI-36690-36985 60/161 - -OL-BFZ136 * brittle fault zone OL-KR10 OL-KR10-BFI-52638-52690 45/100 - -
OL-KR13 OL-KR13-BFI-31880-32500 80/100 - -Demo CT not observed where expected - - -Demo CT ONK-TT-4399-demo-keskt 55/041 - -
mise a la masse tunnel-earthing-8 - - -DT2 not observed where expected - - -
ONK-PH16 ONK-PH16-7464 25/185 - -ONK-PH17 ONK-PH17-6481 28/177 6.1E-9 -ONKALO P382 31/148 - -
mise a la masse mam-PH16-54 - - -DT2 ONK-TDT-4399-30-87.9-M1 (round) 19/159 - -
ONK-PH16 ONK-PH16-7100 54/176 - -ONK-PH17 ONK-PH17-6158 48/147 - -ONKALO 4365-1 77/271 - -
ONK-PH16 ONK-PH16-7513 83/255 1.2E-10 -mise a la masse mam-PH16-75 - - -
DT2 ONK-TDT-4399-30-78-M7(5) (round) 80/111 - -ONK-PH16 ONK-PH16-7362 43/202 4.4E-9 -
DT1 ONK-TDT-4399-44-35-3 61/213 - -ONK-PP316 not observed where expected - - -
LF 7 large fracture DT2 ONK-TDT-4399-30-48.3-7 (round) 87/249 - -ONK-PH20 ONK-PH20-2312 48/149 1.2E-11 -ONK-KR13 ONK-KR13-6255 50/167 2.2E-11 -
LF 9 large fracture ONK-PH20 ONK-PH20-2874 12/165 2.1E-10 -LF 10 large fracture ONK-PH20 ONK-PH20-3755 65/057 - -HF 1 hydraulically conductive fracture ONK-PH16 ONK-PH16-7139 07/166 7.7E-11 -HF 2 hydraulically conductive fracture ONK-PH17 ONK-PH17-6290 20/322 1.5E-9 -HF 3 hydraulically conductive fracture ONK-PH17 ONK-PH17-6387 30/156 3.1E-9 -HF 4 hydraulically conductive fracture ONK-PH17 ONK-PH17-6542 47/160 5.4E-9 -HF 5 hydraulically conductive fracture ONK-PH17 ONK-PH17-7079 68/200 1.3E-10 -HF 6 hydraulically conductive fracture ONK-PH17 ONK-PH17-8294 88/318 2.7E-10 -
^Only part of the known extent of the structure modelled in detail* As in Aaltonen et al., 2010; not re-modelled
LF 4 large fracture
LF 8 large fracture
LF 5 large fracture
LF 6 large fracture
brittle fault zone
OL-BFZ216 brittle fault zone
LF 1 large fracture
LF 3 large fracture
STRUCTURE TYPE OBSERVED IN INTERSECTION ID TRANSMISSIVITY (m2/s)/
INFLOW
OL-BFZ297 ^(DSM-BFZ001)
brittle fault zone
OL-BFZ045 ^ (OL-BFZ045b)
brittle fault zone
OL-BFZ084 ^
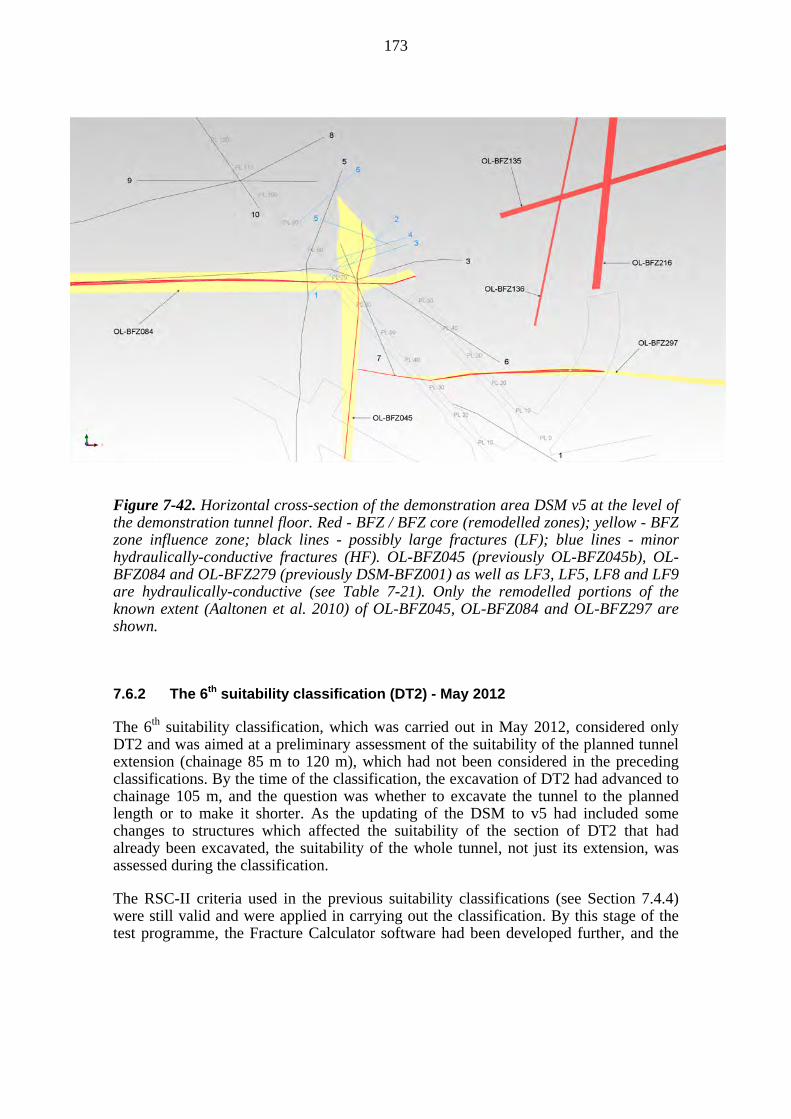
173
Figure 7-42. Horizontal cross-section of the demonstration area DSM v5 at the level of the demonstration tunnel floor. Red - BFZ / BFZ core (remodelled zones); yellow - BFZ zone influence zone; black lines - possibly large fractures (LF); blue lines - minor hydraulically-conductive fractures (HF). OL-BFZ045 (previously OL-BFZ045b), OL-BFZ084 and OL-BFZ279 (previously DSM-BFZ001) as well as LF3, LF5, LF8 and LF9 are hydraulically-conductive (see Table 7-21). Only the remodelled portions of the known extent (Aaltonen et al. 2010) of OL-BFZ045, OL-BFZ084 and OL-BFZ297 are shown.
7.6.2 The 6th suitability classification (DT2) - May 2012
The 6th suitability classification, which was carried out in May 2012, considered only DT2 and was aimed at a preliminary assessment of the suitability of the planned tunnel extension (chainage 85 m to 120 m), which had not been considered in the preceding classifications. By the time of the classification, the excavation of DT2 had advanced to chainage 105 m, and the question was whether to excavate the tunnel to the planned length or to make it shorter. As the updating of the DSM to v5 had included some changes to structures which affected the suitability of the section of DT2 that had already been excavated, the suitability of the whole tunnel, not just its extension, was assessed during the classification.
The RSC-II criteria used in the previous suitability classifications (see Section 7.4.4) were still valid and were applied in carrying out the classification. By this stage of the test programme, the Fracture Calculator software had been developed further, and the
174
new Panel Calculator41 tool was used for determining the possibly suitable and not suitable tunnel sections.
Significant bedrock features
Based on DSM v5 and the rock suitability criteria, the brittle features affecting the suitability of DT2 (the planned length of 120 m) were brittle fault zones OL-BFZ297, OL-BFZ045 and OL-BFZ084 and large fractures LF3, LF5, and LF7...LF10 (see Table 7-21 and Figure 7-42). These nine features were considered in the suitability evaluation.
Water inflows related to fault zone OL-BFZ084 (and possibly also to LF3) were observed in the excavated tunnel at chainage 65 to 75 m, but the inflow has not yet been measured. No significant leakages related to OL-BFZ045 were observed in the tunnel. Based on the drillhole data, large fractures 8 and 9 were interpreted as being slightly hydraulically-conductive, with transmissivities of 2.2E-11 and 2.1E-10, respectively (see Table 7-21 and Figure 7-42).
Suitability of demonstration tunnel 2 (DT2)
None of the features found in the demonstration area were defined as layout-determining, and thus the tunnel was considered to be generally suitable. As stated in the rock suitability criteria, the maximum allowed local (fracture-related) inflow into a deposition tunnel is 0.25 L/min (see Section 7.4.4). At the time of this classification, however, the observed inflow into the tunnel had not yet been measured, so the overall suitability of the tunnel was not evaluated in this respect. The hydrogeological criteria pertaining to deposition holes were taken into account in the suitability classification.
The suitability of DT2 is given in Table 7-22 and shown in Figure 7-43. In assessing the number of experimental deposition holes that could be placed in the possibly suitable tunnel sections (Table 7-22), chainage 0 - 14 m was omitted to exclude the wide profile at the mouth of the tunnel; this would also compensate for the space required by the prototype hole boring machine (11 m) for the boring of the first hole within a tunnel. Also, it was noted that the centre of the last hole in a tunnel must be at least 5.5 m from the end of the tunnel to enable the canister to be installed in the hole.
Based on the suitability classification, DT2 contained five sections classified as possibly suitable (Table 7-22, Figure 7-43). These sections were located at tunnel chainages 0.00 - 25.10 m, 34.20 - 50.70 m, 71.40 - 74.25 m, 78.45 - 88.60 m and 116.50 - 120.00 m, and corresponded to about 48% of the tunnel length (the suitability ratio). Based on these results, 7 deposition holes could have been be placed in the tunnel (Table 7-22); for comparison, in an ideal case with no sections classified as not suitable, the total number of holes in a tunnel of identical length would have been 11, yielding a degree of utilisation of 64 % for DT2.
The not yet excavated tunnel section (chainage 105 - 120 m) was classified as possibly not suitable from chainage 105 m to chainage 116.5 m, due to three possibly large
41 Datactica Oy 2012. Panel Calculator August 2012 user guide. Unpublished memorandum. Posiva's Kronodoc archive number POS-014450. This version includes some updates to the original May 2012 version.
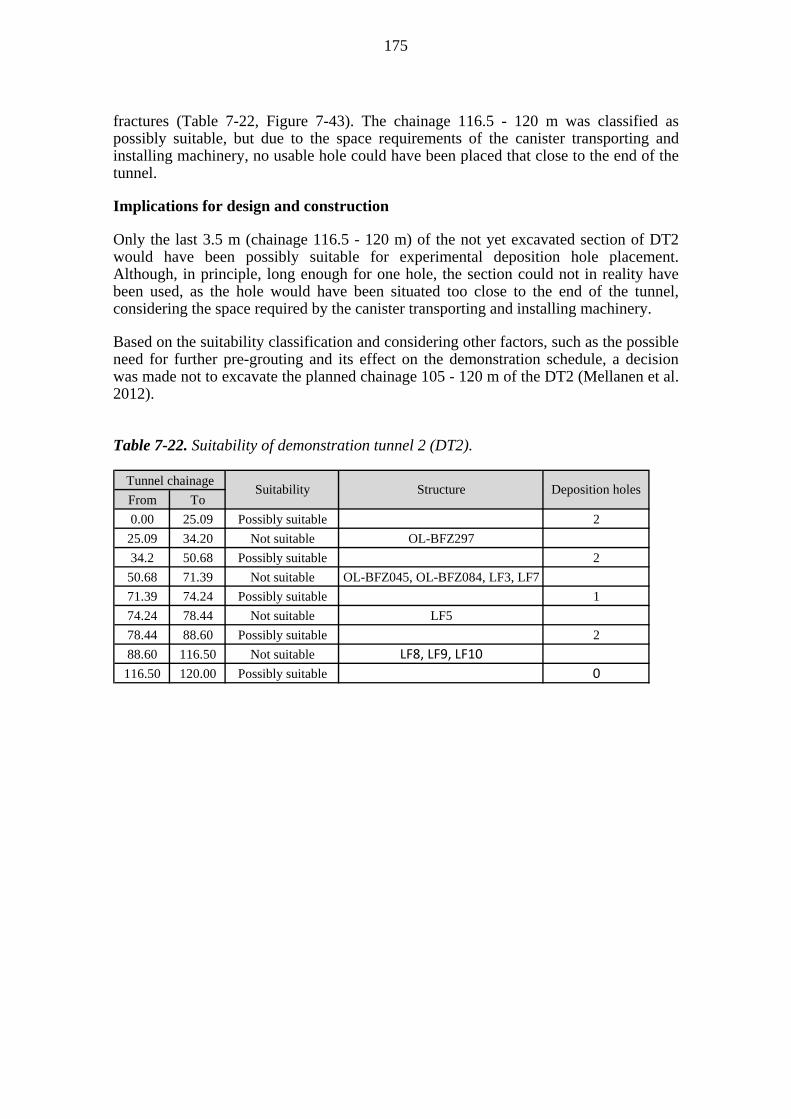
175
fractures (Table 7-22, Figure 7-43). The chainage 116.5 - 120 m was classified as possibly suitable, but due to the space requirements of the canister transporting and installing machinery, no usable hole could have been placed that close to the end of the tunnel.
Implications for design and construction
Only the last 3.5 m (chainage 116.5 - 120 m) of the not yet excavated section of DT2 would have been possibly suitable for experimental deposition hole placement. Although, in principle, long enough for one hole, the section could not in reality have been used, as the hole would have been situated too close to the end of the tunnel, considering the space required by the canister transporting and installing machinery.
Based on the suitability classification and considering other factors, such as the possible need for further pre-grouting and its effect on the demonstration schedule, a decision was made not to excavate the planned chainage 105 - 120 m of the DT2 (Mellanen et al. 2012).
Table 7-22. Suitability of demonstration tunnel 2 (DT2).
From To
0.00 25.09 Possibly suitable 2
25.09 34.20 Not suitable OL-BFZ297
34.2 50.68 Possibly suitable 2
50.68 71.39 Not suitable OL-BFZ045, OL-BFZ084, LF3, LF7
71.39 74.24 Possibly suitable 1
74.24 78.44 Not suitable LF5
78.44 88.60 Possibly suitable 2
88.60 116.50 Not suitable LF8, LF9, LF10
116.50 120.00 Possibly suitable 0
Tunnel chainageSuitability Structure Deposition holes

176
Figure 7-43. Suitability of DT2 (red - not suitable, green - possibly suitable; for corresponding tunnel chainages, see Table 7-22).
7.6.3 Tunnel investigations and detailed-scale model update
Following the decision to stop the excavation of the DT2 at chainage 105 m, the final tunnel investigations were carried out during June and July 2012. These investigations included:
Geological mapping of the excavated tunnel, including its cleaned floor, during which all natural fractures with fracture traces longer than 25 cm, as well as deformation zone intersections, were mapped and measured by a tachymeter to obtain their exact locations in 3D.
A GPR investigation comprising several measured profiles on the tunnel floor and walls to study the extent of observed structures and to characterise the rock volume below the floor of the tunnel.
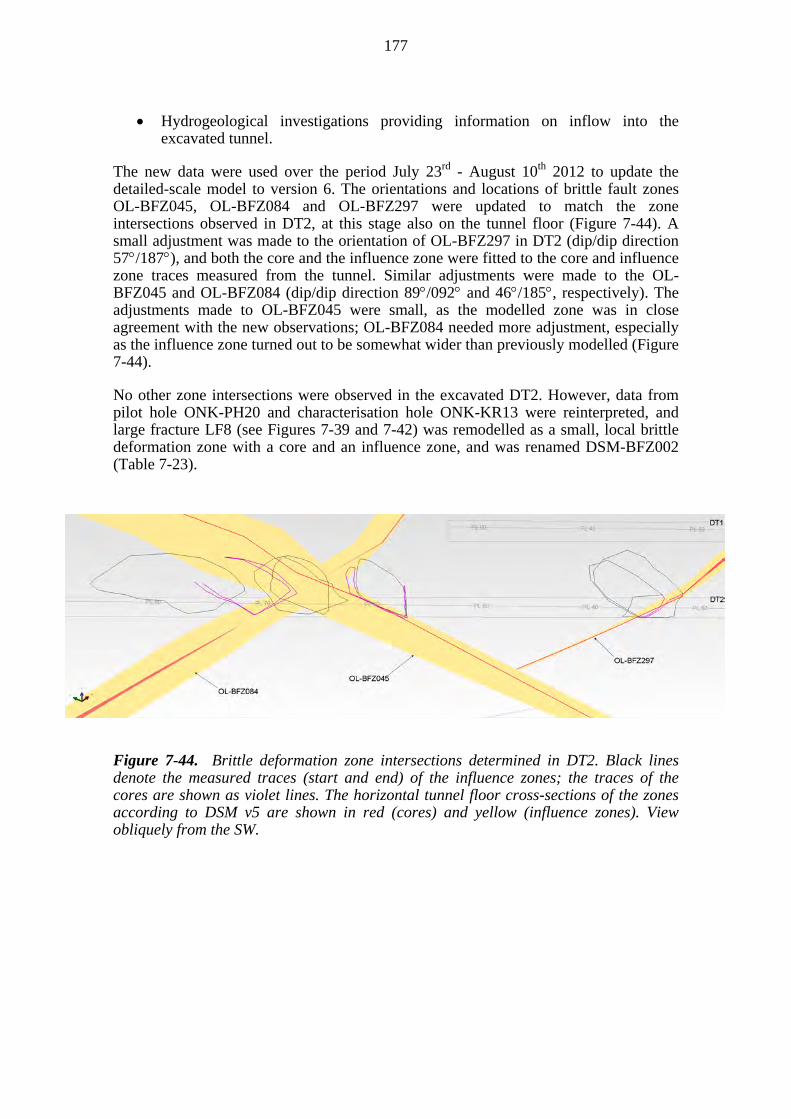
177
Hydrogeological investigations providing information on inflow into the excavated tunnel.
The new data were used over the period July 23rd - August 10th 2012 to update the detailed-scale model to version 6. The orientations and locations of brittle fault zones OL-BFZ045, OL-BFZ084 and OL-BFZ297 were updated to match the zone intersections observed in DT2, at this stage also on the tunnel floor (Figure 7-44). A small adjustment was made to the orientation of OL-BFZ297 in DT2 (dip/dip direction 57/187), and both the core and the influence zone were fitted to the core and influence zone traces measured from the tunnel. Similar adjustments were made to the OL-BFZ045 and OL-BFZ084 (dip/dip direction 89/092 and 46/185, respectively). The adjustments made to OL-BFZ045 were small, as the modelled zone was in close agreement with the new observations; OL-BFZ084 needed more adjustment, especially as the influence zone turned out to be somewhat wider than previously modelled (Figure 7-44).
No other zone intersections were observed in the excavated DT2. However, data from pilot hole ONK-PH20 and characterisation hole ONK-KR13 were reinterpreted, and large fracture LF8 (see Figures 7-39 and 7-42) was remodelled as a small, local brittle deformation zone with a core and an influence zone, and was renamed DSM-BFZ002 (Table 7-23).
Figure 7-44. Brittle deformation zone intersections determined in DT2. Black lines denote the measured traces (start and end) of the influence zones; the traces of the cores are shown as violet lines. The horizontal tunnel floor cross-sections of the zones according to DSM v5 are shown in red (cores) and yellow (influence zones). View obliquely from the SW.
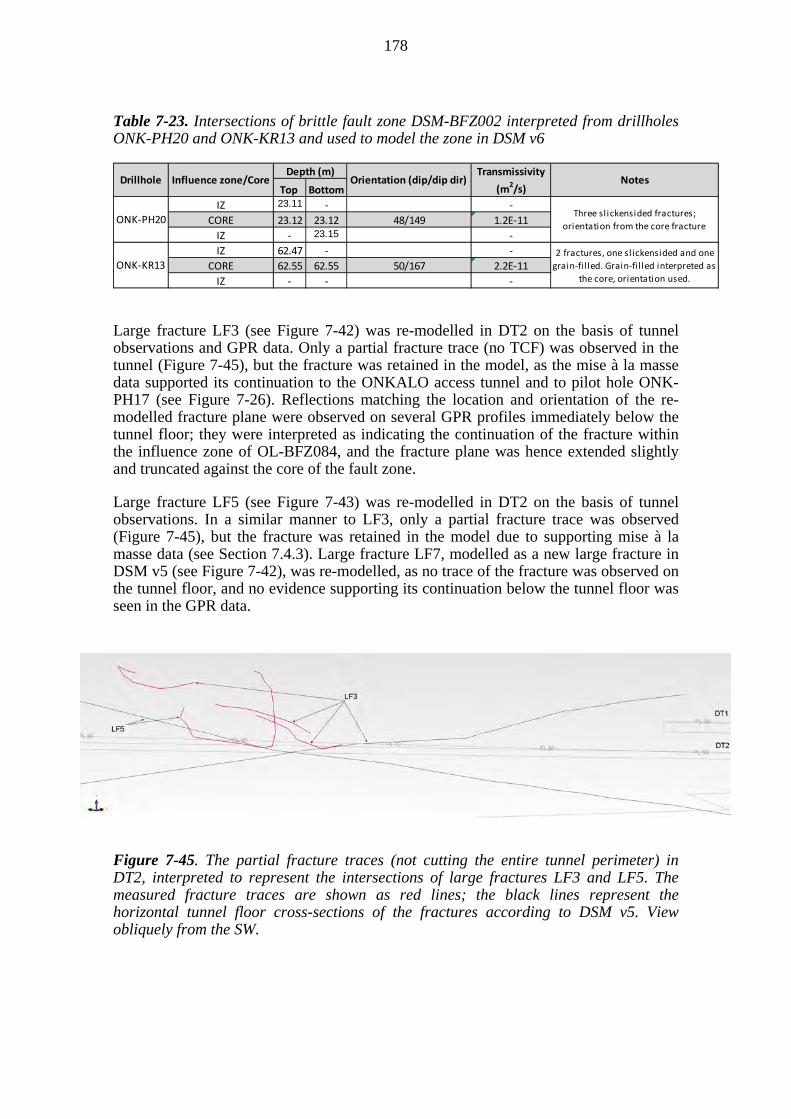
178
Table 7-23. Intersections of brittle fault zone DSM-BFZ002 interpreted from drillholes ONK-PH20 and ONK-KR13 and used to model the zone in DSM v6
Large fracture LF3 (see Figure 7-42) was re-modelled in DT2 on the basis of tunnel observations and GPR data. Only a partial fracture trace (no TCF) was observed in the tunnel (Figure 7-45), but the fracture was retained in the model, as the mise à la masse data supported its continuation to the ONKALO access tunnel and to pilot hole ONK-PH17 (see Figure 7-26). Reflections matching the location and orientation of the re-modelled fracture plane were observed on several GPR profiles immediately below the tunnel floor; they were interpreted as indicating the continuation of the fracture within the influence zone of OL-BFZ084, and the fracture plane was hence extended slightly and truncated against the core of the fault zone.
Large fracture LF5 (see Figure 7-43) was re-modelled in DT2 on the basis of tunnel observations. In a similar manner to LF3, only a partial fracture trace was observed (Figure 7-45), but the fracture was retained in the model due to supporting mise à la masse data (see Section 7.4.3). Large fracture LF7, modelled as a new large fracture in DSM v5 (see Figure 7-42), was re-modelled, as no trace of the fracture was observed on the tunnel floor, and no evidence supporting its continuation below the tunnel floor was seen in the GPR data.
Figure 7-45. The partial fracture traces (not cutting the entire tunnel perimeter) in DT2, interpreted to represent the intersections of large fractures LF3 and LF5. The measured fracture traces are shown as red lines; the black lines represent the horizontal tunnel floor cross-sections of the fractures according to DSM v5. View obliquely from the SW.
Top Bottom
IZ 23.11 ‐ ‐
CORE 23.12 23.12 48/149 1.2E‐11
IZ ‐ 23.15 ‐
IZ 62.47 ‐ ‐
CORE 62.55 62.55 50/167 2.2E‐11
IZ ‐ ‐ ‐
Transmissivity
(m2/s)
ONK‐PH20
ONK‐KR13
Depth (m)Orientation (dip/dip dir) Notes
Three slickensided fractures;
orientation from the core fracture
2 fractures, one slickensided and one
grain‐fil led. Grain‐fi l led interpreted as
the core, orientation used.
Drillhole Influence zone/Core

179
Large fractures LF9 and LF10, modelled on the basis of the data from pilot hole ONK-PH20 (see Figure 7-43), could not be properly observed in the excavated DT2 because of their orientations. Reflections supporting the modelled fracture orientations and locations below the tunnel floor were, however, observed in the GPR data (Figure 7-46), which also indicated a possible continuation of the fractures further below the tunnel floor than that modelled. In regard to LF9, the indications were considered ambiguous and the fracture was not re-modelled; LF10, for which the indications were interpreted to be more reliable, was slightly extended (Figure 7-46). No new possibly large fractures were added to the model.
Figure 7-46. Comparison of the modelled planes of possibly large fractures LF9 and LF10 with the GPR in DT2. The displayed GPR profile was measured along the centre line of the tunnel and is one of seven profiles measured along the tunnel floor. The yellow disks are the planes of the possibly large fractures, according to DSM v5. The yellow dashed line denotes the distance LF10 was extended on the basis of the GPR data. View obliquely from the SW.
Water inflows were observed in the excavated DT2. Most of the inflows were concentrated in chainage 65 - 75 m, where dripping fractures and bolt holes were observed in several locations. In addition, a few inflows were found towards the end of the tunnel, in chainage 80 - 95 m, and damp to wet rock was observed locally around chainage 60 m. The inflows in chainage 65 - 75 m correlated with the influence zone of OL-BFZ084, and the smaller inflows observed at chainage 60 m were related to brittle fault zone OL-BFZ045. Inflows in chainage 80 - 95 m were associated with large fractures LF3 and LF5. The total inflow from the observed inflows, measured by pumping from chainage 62, m amounted to 0.4 L/min, which was considered to represent mainly inflow from OL-BFZ084. By the time of the writing of this report, more hydrogeological measurements were being planned for measuring inflows from OL-BFZ045 and the large fractures. The accuracy of the observations on the inflows was not sufficient for modelling single, minor hydraulically-conductive fractures, so those were not considered in this model update.
A summary of DSM v6 is given in Table 7-24, with a horizontal cross-section of the structures shown in Figure 7-47.
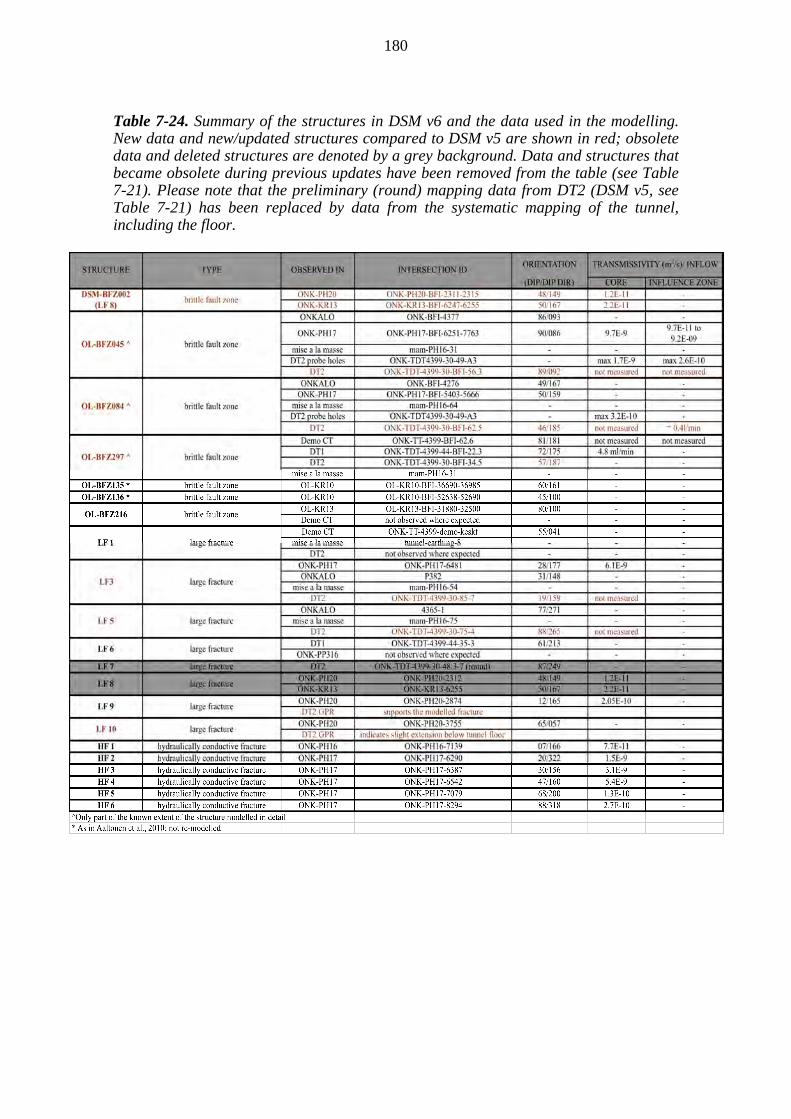
180
Table 7-24. Summary of the structures in DSM v6 and the data used in the modelling. New data and new/updated structures compared to DSM v5 are shown in red; obsolete data and deleted structures are denoted by a grey background. Data and structures that became obsolete during previous updates have been removed from the table (see Table 7-21). Please note that the preliminary (round) mapping data from DT2 (DSM v5, see Table 7-21) has been replaced by data from the systematic mapping of the tunnel, including the floor.
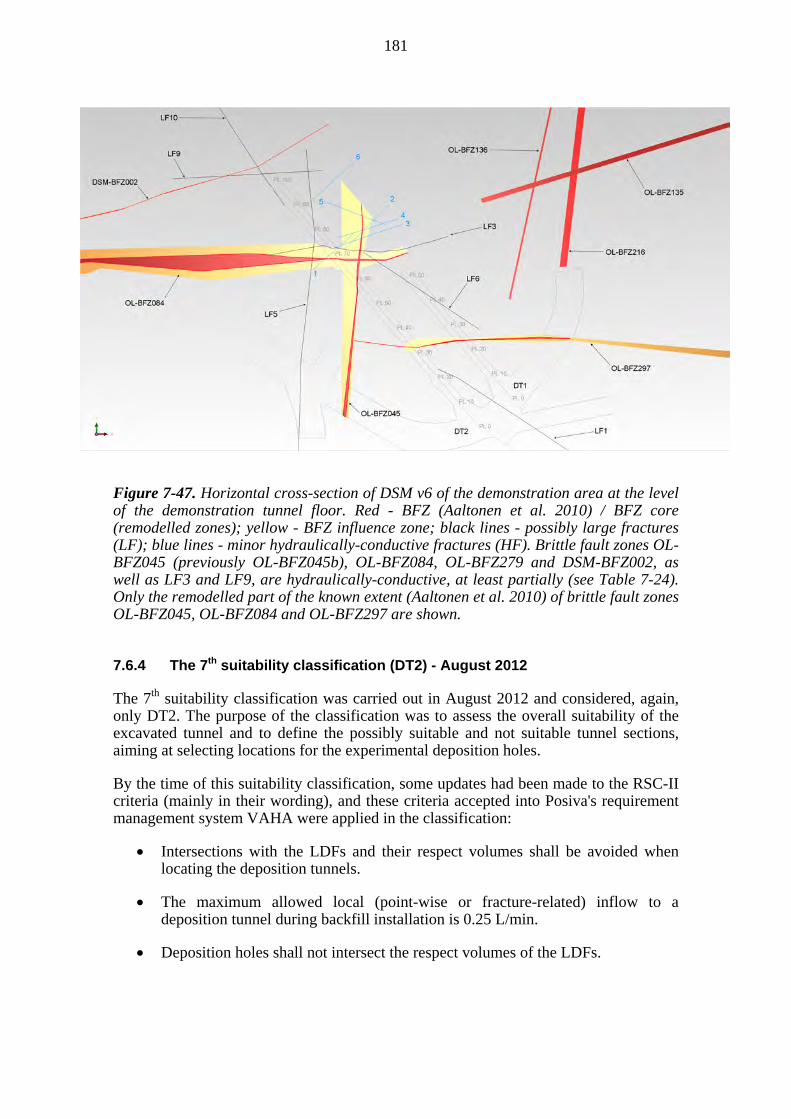
181
Figure 7-47. Horizontal cross-section of DSM v6 of the demonstration area at the level of the demonstration tunnel floor. Red - BFZ (Aaltonen et al. 2010) / BFZ core (remodelled zones); yellow - BFZ influence zone; black lines - possibly large fractures (LF); blue lines - minor hydraulically-conductive fractures (HF). Brittle fault zones OL-BFZ045 (previously OL-BFZ045b), OL-BFZ084, OL-BFZ279 and DSM-BFZ002, as well as LF3 and LF9, are hydraulically-conductive, at least partially (see Table 7-24). Only the remodelled part of the known extent (Aaltonen et al. 2010) of brittle fault zones OL-BFZ045, OL-BFZ084 and OL-BFZ297 are shown.
7.6.4 The 7th suitability classification (DT2) - August 2012
The 7th suitability classification was carried out in August 2012 and considered, again, only DT2. The purpose of the classification was to assess the overall suitability of the excavated tunnel and to define the possibly suitable and not suitable tunnel sections, aiming at selecting locations for the experimental deposition holes.
By the time of this suitability classification, some updates had been made to the RSC-II criteria (mainly in their wording), and these criteria accepted into Posiva's requirement management system VAHA were applied in the classification:
Intersections with the LDFs and their respect volumes shall be avoided when locating the deposition tunnels.
The maximum allowed local (point-wise or fracture-related) inflow to a deposition tunnel during backfill installation is 0.25 L/min.
Deposition holes shall not intersect the respect volumes of the LDFs.
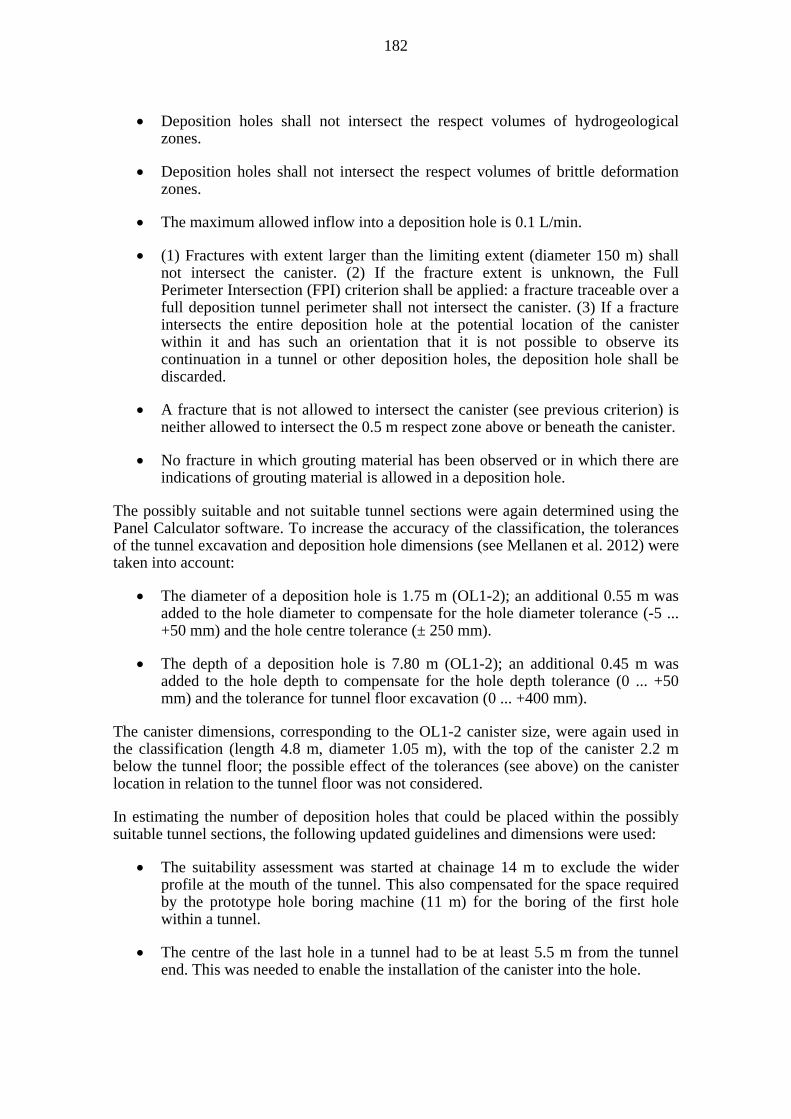
182
Deposition holes shall not intersect the respect volumes of hydrogeological zones.
Deposition holes shall not intersect the respect volumes of brittle deformation zones.
The maximum allowed inflow into a deposition hole is 0.1 L/min.
(1) Fractures with extent larger than the limiting extent (diameter 150 m) shall not intersect the canister. (2) If the fracture extent is unknown, the Full Perimeter Intersection (FPI) criterion shall be applied: a fracture traceable over a full deposition tunnel perimeter shall not intersect the canister. (3) If a fracture intersects the entire deposition hole at the potential location of the canister within it and has such an orientation that it is not possible to observe its continuation in a tunnel or other deposition holes, the deposition hole shall be discarded.
A fracture that is not allowed to intersect the canister (see previous criterion) is neither allowed to intersect the 0.5 m respect zone above or beneath the canister.
No fracture in which grouting material has been observed or in which there are indications of grouting material is allowed in a deposition hole.
The possibly suitable and not suitable tunnel sections were again determined using the Panel Calculator software. To increase the accuracy of the classification, the tolerances of the tunnel excavation and deposition hole dimensions (see Mellanen et al. 2012) were taken into account:
The diameter of a deposition hole is 1.75 m (OL1-2); an additional 0.55 m was added to the hole diameter to compensate for the hole diameter tolerance (-5 ... +50 mm) and the hole centre tolerance (± 250 mm).
The depth of a deposition hole is 7.80 m (OL1-2); an additional 0.45 m was added to the hole depth to compensate for the hole depth tolerance (0 ... +50 mm) and the tolerance for tunnel floor excavation (0 ... +400 mm).
The canister dimensions, corresponding to the OL1-2 canister size, were again used in the classification (length 4.8 m, diameter 1.05 m), with the top of the canister 2.2 m below the tunnel floor; the possible effect of the tolerances (see above) on the canister location in relation to the tunnel floor was not considered.
In estimating the number of deposition holes that could be placed within the possibly suitable tunnel sections, the following updated guidelines and dimensions were used:
The suitability assessment was started at chainage 14 m to exclude the wider profile at the mouth of the tunnel. This also compensated for the space required by the prototype hole boring machine (11 m) for the boring of the first hole within a tunnel.
The centre of the last hole in a tunnel had to be at least 5.5 m from the tunnel end. This was needed to enable the installation of the canister into the hole.
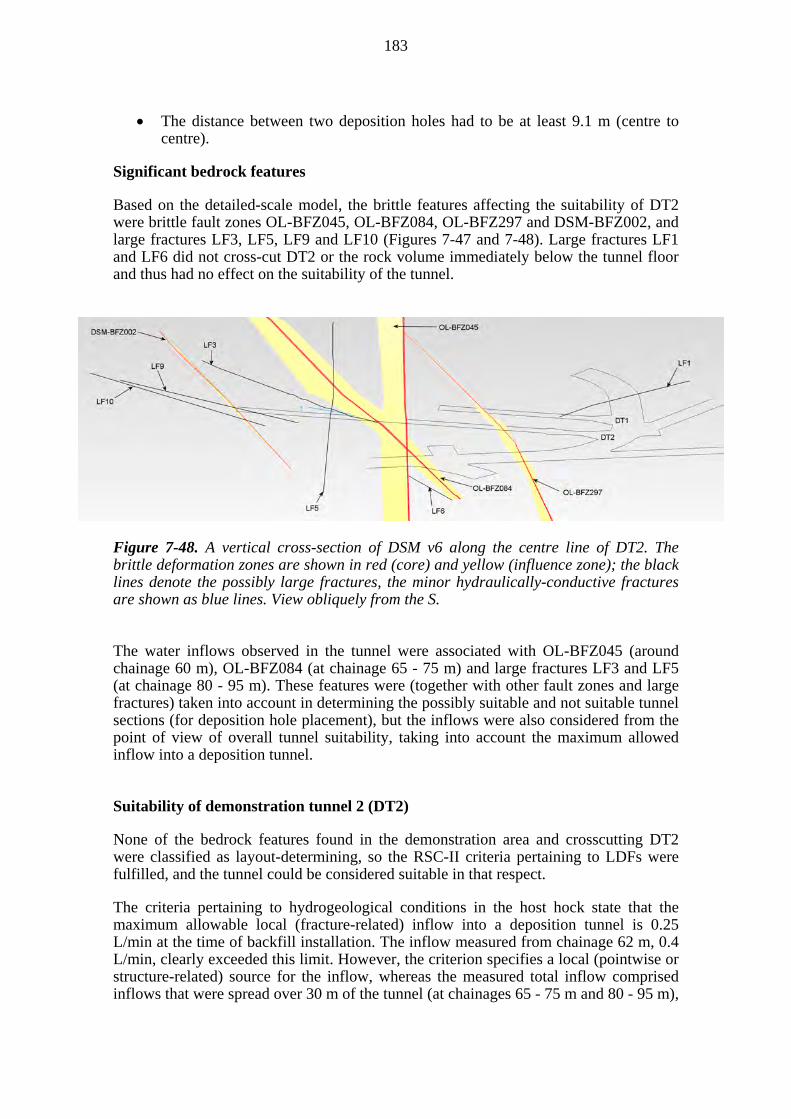
183
The distance between two deposition holes had to be at least 9.1 m (centre to centre).
Significant bedrock features
Based on the detailed-scale model, the brittle features affecting the suitability of DT2 were brittle fault zones OL-BFZ045, OL-BFZ084, OL-BFZ297 and DSM-BFZ002, and large fractures LF3, LF5, LF9 and LF10 (Figures 7-47 and 7-48). Large fractures LF1 and LF6 did not cross-cut DT2 or the rock volume immediately below the tunnel floor and thus had no effect on the suitability of the tunnel.
Figure 7-48. A vertical cross-section of DSM v6 along the centre line of DT2. The brittle deformation zones are shown in red (core) and yellow (influence zone); the black lines denote the possibly large fractures, the minor hydraulically-conductive fractures are shown as blue lines. View obliquely from the S.
The water inflows observed in the tunnel were associated with OL-BFZ045 (around chainage 60 m), OL-BFZ084 (at chainage 65 - 75 m) and large fractures LF3 and LF5 (at chainage 80 - 95 m). These features were (together with other fault zones and large fractures) taken into account in determining the possibly suitable and not suitable tunnel sections (for deposition hole placement), but the inflows were also considered from the point of view of overall tunnel suitability, taking into account the maximum allowed inflow into a deposition tunnel.
Suitability of demonstration tunnel 2 (DT2)
None of the bedrock features found in the demonstration area and crosscutting DT2 were classified as layout-determining, so the RSC-II criteria pertaining to LDFs were fulfilled, and the tunnel could be considered suitable in that respect.
The criteria pertaining to hydrogeological conditions in the host hock state that the maximum allowable local (fracture-related) inflow into a deposition tunnel is 0.25 L/min at the time of backfill installation. The inflow measured from chainage 62 m, 0.4 L/min, clearly exceeded this limit. However, the criterion specifies a local (pointwise or structure-related) source for the inflow, whereas the measured total inflow comprised inflows that were spread over 30 m of the tunnel (at chainages 65 - 75 m and 80 - 95 m),
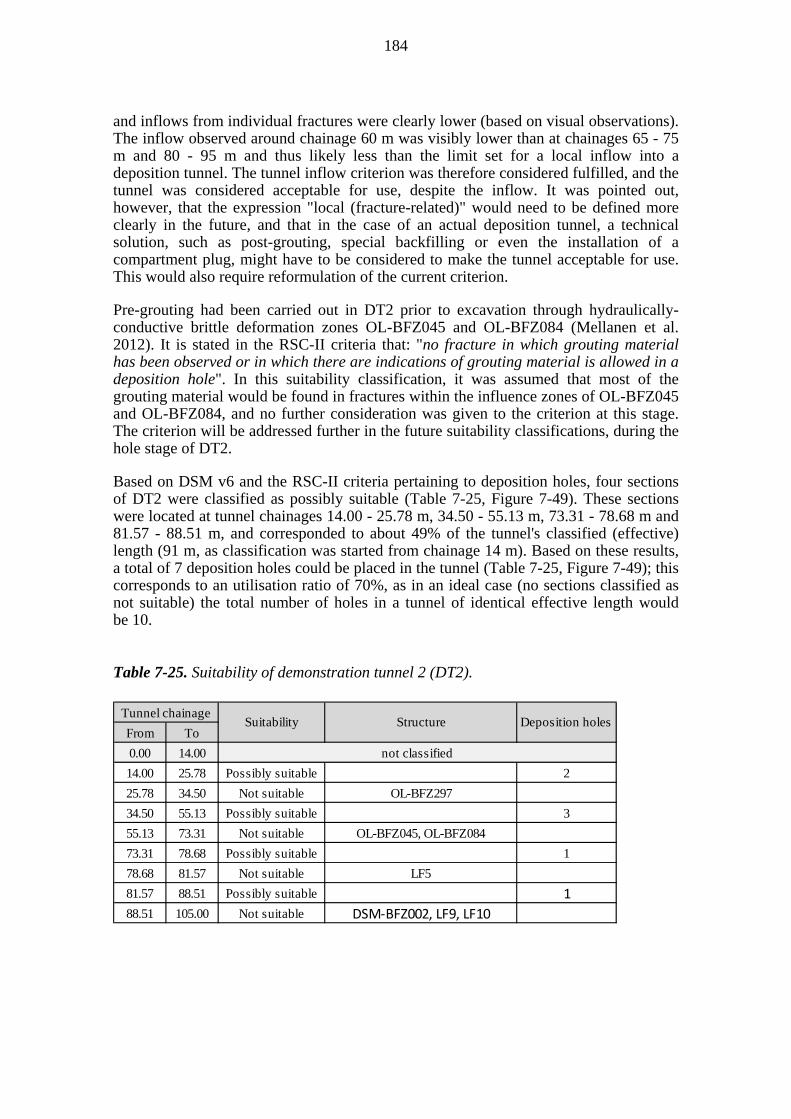
184
and inflows from individual fractures were clearly lower (based on visual observations). The inflow observed around chainage 60 m was visibly lower than at chainages 65 - 75 m and 80 - 95 m and thus likely less than the limit set for a local inflow into a deposition tunnel. The tunnel inflow criterion was therefore considered fulfilled, and the tunnel was considered acceptable for use, despite the inflow. It was pointed out, however, that the expression "local (fracture-related)" would need to be defined more clearly in the future, and that in the case of an actual deposition tunnel, a technical solution, such as post-grouting, special backfilling or even the installation of a compartment plug, might have to be considered to make the tunnel acceptable for use. This would also require reformulation of the current criterion.
Pre-grouting had been carried out in DT2 prior to excavation through hydraulically-conductive brittle deformation zones OL-BFZ045 and OL-BFZ084 (Mellanen et al. 2012). It is stated in the RSC-II criteria that: "no fracture in which grouting material has been observed or in which there are indications of grouting material is allowed in a deposition hole". In this suitability classification, it was assumed that most of the grouting material would be found in fractures within the influence zones of OL-BFZ045 and OL-BFZ084, and no further consideration was given to the criterion at this stage. The criterion will be addressed further in the future suitability classifications, during the hole stage of DT2.
Based on DSM v6 and the RSC-II criteria pertaining to deposition holes, four sections of DT2 were classified as possibly suitable (Table 7-25, Figure 7-49). These sections were located at tunnel chainages 14.00 - 25.78 m, 34.50 - 55.13 m, 73.31 - 78.68 m and 81.57 - 88.51 m, and corresponded to about 49% of the tunnel's classified (effective) length (91 m, as classification was started from chainage 14 m). Based on these results, a total of 7 deposition holes could be placed in the tunnel (Table 7-25, Figure 7-49); this corresponds to an utilisation ratio of 70%, as in an ideal case (no sections classified as not suitable) the total number of holes in a tunnel of identical effective length would be 10.
Table 7-25. Suitability of demonstration tunnel 2 (DT2).
From To
0.00 14.00
14.00 25.78 Possibly suitable 2
25.78 34.50 Not suitable OL-BFZ297
34.50 55.13 Possibly suitable 3
55.13 73.31 Not suitable OL-BFZ045, OL-BFZ084
73.31 78.68 Possibly suitable 1
78.68 81.57 Not suitable LF5
81.57 88.51 Possibly suitable 1
88.51 105.00 Not suitable DSM‐BFZ002, LF9, LF10
Tunnel chainageSuitability Structure Deposition holes
not classified
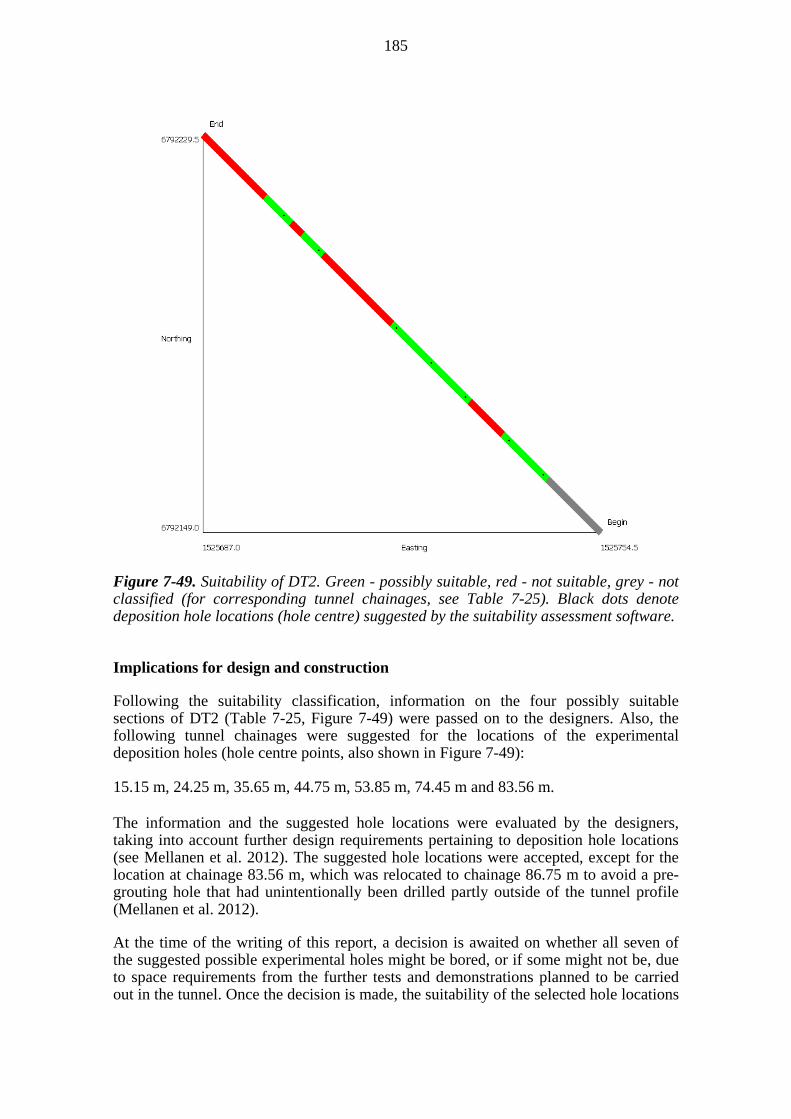
185
Figure 7-49. Suitability of DT2. Green - possibly suitable, red - not suitable, grey - not classified (for corresponding tunnel chainages, see Table 7-25). Black dots denote deposition hole locations (hole centre) suggested by the suitability assessment software.
Implications for design and construction
Following the suitability classification, information on the four possibly suitable sections of DT2 (Table 7-25, Figure 7-49) were passed on to the designers. Also, the following tunnel chainages were suggested for the locations of the experimental deposition holes (hole centre points, also shown in Figure 7-49):
15.15 m, 24.25 m, 35.65 m, 44.75 m, 53.85 m, 74.45 m and 83.56 m. The information and the suggested hole locations were evaluated by the designers, taking into account further design requirements pertaining to deposition hole locations (see Mellanen et al. 2012). The suggested hole locations were accepted, except for the location at chainage 83.56 m, which was relocated to chainage 86.75 m to avoid a pre-grouting hole that had unintentionally been drilled partly outside of the tunnel profile (Mellanen et al. 2012).
At the time of the writing of this report, a decision is awaited on whether all seven of the suggested possible experimental holes might be bored, or if some might not be, due to space requirements from the further tests and demonstrations planned to be carried out in the tunnel. Once the decision is made, the suitability of the selected hole locations
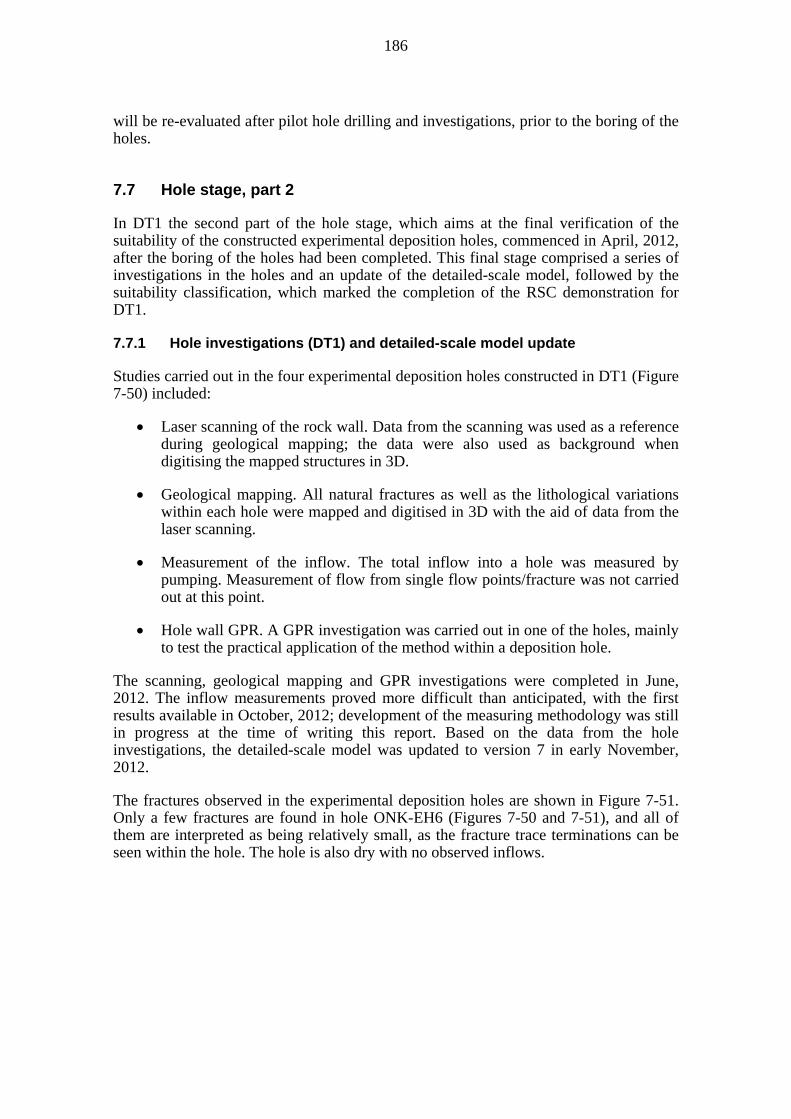
186
will be re-evaluated after pilot hole drilling and investigations, prior to the boring of the holes.
7.7 Hole stage, part 2
In DT1 the second part of the hole stage, which aims at the final verification of the suitability of the constructed experimental deposition holes, commenced in April, 2012, after the boring of the holes had been completed. This final stage comprised a series of investigations in the holes and an update of the detailed-scale model, followed by the suitability classification, which marked the completion of the RSC demonstration for DT1.
7.7.1 Hole investigations (DT1) and detailed-scale model update
Studies carried out in the four experimental deposition holes constructed in DT1 (Figure 7-50) included:
Laser scanning of the rock wall. Data from the scanning was used as a reference during geological mapping; the data were also used as background when digitising the mapped structures in 3D.
Geological mapping. All natural fractures as well as the lithological variations within each hole were mapped and digitised in 3D with the aid of data from the laser scanning.
Measurement of the inflow. The total inflow into a hole was measured by pumping. Measurement of flow from single flow points/fracture was not carried out at this point.
Hole wall GPR. A GPR investigation was carried out in one of the holes, mainly to test the practical application of the method within a deposition hole.
The scanning, geological mapping and GPR investigations were completed in June, 2012. The inflow measurements proved more difficult than anticipated, with the first results available in October, 2012; development of the measuring methodology was still in progress at the time of writing this report. Based on the data from the hole investigations, the detailed-scale model was updated to version 7 in early November, 2012.
The fractures observed in the experimental deposition holes are shown in Figure 7-51. Only a few fractures are found in hole ONK-EH6 (Figures 7-50 and 7-51), and all of them are interpreted as being relatively small, as the fracture trace terminations can be seen within the hole. The hole is also dry with no observed inflows.
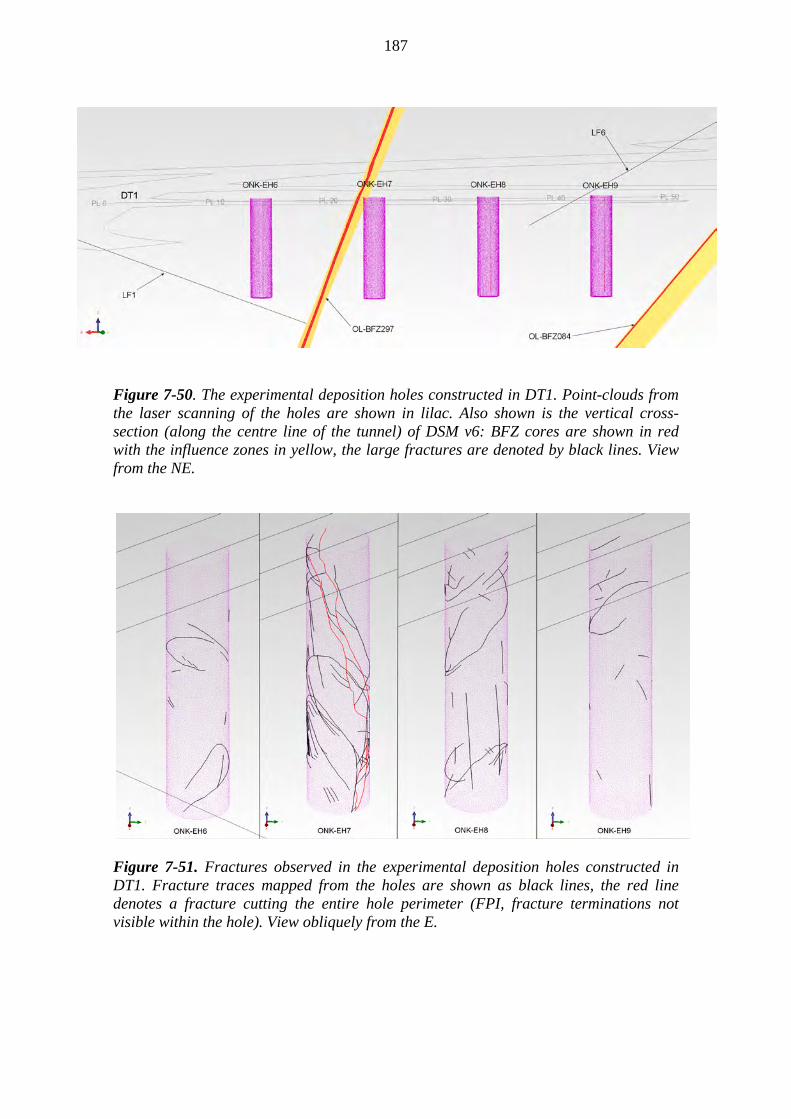
187
Figure 7-50. The experimental deposition holes constructed in DT1. Point-clouds from the laser scanning of the holes are shown in lilac. Also shown is the vertical cross-section (along the centre line of the tunnel) of DSM v6: BFZ cores are shown in red with the influence zones in yellow, the large fractures are denoted by black lines. View from the NE.
Figure 7-51. Fractures observed in the experimental deposition holes constructed in DT1. Fracture traces mapped from the holes are shown as black lines, the red line denotes a fracture cutting the entire hole perimeter (FPI, fracture terminations not visible within the hole). View obliquely from the E.
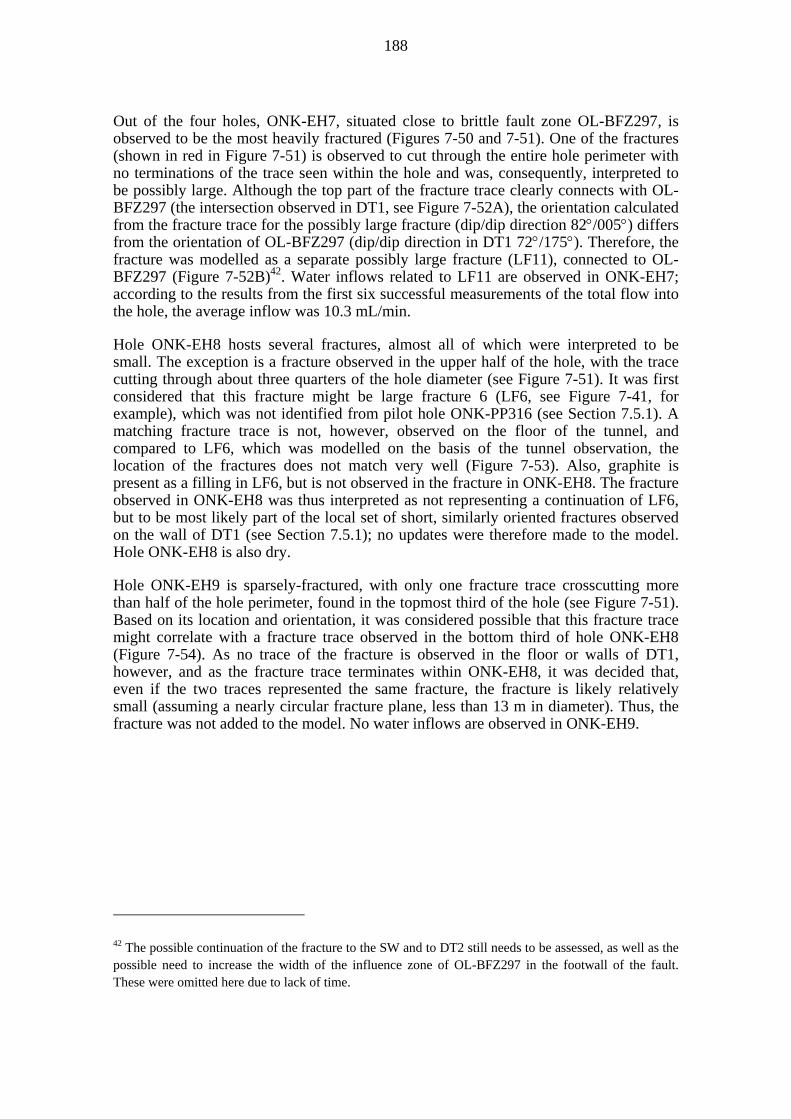
188
Out of the four holes, ONK-EH7, situated close to brittle fault zone OL-BFZ297, is observed to be the most heavily fractured (Figures 7-50 and 7-51). One of the fractures (shown in red in Figure 7-51) is observed to cut through the entire hole perimeter with no terminations of the trace seen within the hole and was, consequently, interpreted to be possibly large. Although the top part of the fracture trace clearly connects with OL-BFZ297 (the intersection observed in DT1, see Figure 7-52A), the orientation calculated from the fracture trace for the possibly large fracture (dip/dip direction 82/005) differs from the orientation of OL-BFZ297 (dip/dip direction in DT1 72/175). Therefore, the fracture was modelled as a separate possibly large fracture (LF11), connected to OL-BFZ297 (Figure 7-52B)42. Water inflows related to LF11 are observed in ONK-EH7; according to the results from the first six successful measurements of the total flow into the hole, the average inflow was 10.3 mL/min.
Hole ONK-EH8 hosts several fractures, almost all of which were interpreted to be small. The exception is a fracture observed in the upper half of the hole, with the trace cutting through about three quarters of the hole diameter (see Figure 7-51). It was first considered that this fracture might be large fracture 6 (LF6, see Figure 7-41, for example), which was not identified from pilot hole ONK-PP316 (see Section 7.5.1). A matching fracture trace is not, however, observed on the floor of the tunnel, and compared to LF6, which was modelled on the basis of the tunnel observation, the location of the fractures does not match very well (Figure 7-53). Also, graphite is present as a filling in LF6, but is not observed in the fracture in ONK-EH8. The fracture observed in ONK-EH8 was thus interpreted as not representing a continuation of LF6, but to be most likely part of the local set of short, similarly oriented fractures observed on the wall of DT1 (see Section 7.5.1); no updates were therefore made to the model. Hole ONK-EH8 is also dry.
Hole ONK-EH9 is sparsely-fractured, with only one fracture trace crosscutting more than half of the hole perimeter, found in the topmost third of the hole (see Figure 7-51). Based on its location and orientation, it was considered possible that this fracture trace might correlate with a fracture trace observed in the bottom third of hole ONK-EH8 (Figure 7-54). As no trace of the fracture is observed in the floor or walls of DT1, however, and as the fracture trace terminates within ONK-EH8, it was decided that, even if the two traces represented the same fracture, the fracture is likely relatively small (assuming a nearly circular fracture plane, less than 13 m in diameter). Thus, the fracture was not added to the model. No water inflows are observed in ONK-EH9.
42 The possible continuation of the fracture to the SW and to DT2 still needs to be assessed, as well as the possible need to increase the width of the influence zone of OL-BFZ297 in the footwall of the fault. These were omitted here due to lack of time.

189
Figure 7-52. A) Fractures observed in experimental deposition hole ONK-EH7 compared to brittle fault zone OL-BFZ297 and the fractures mapped from the tunnel. Fracture traces mapped from the hole are shown as thick black lines, the thick red line denotes a fracture cutting the entire hole perimeter (fracture terminations not visible within the hole). Fractures mapped from DT1 are shown as thin black lines, with the core of OL-BFZ297 outlined in red and the influence zone in black. Orange denotes the vertical cross-section of the OL-BFZ297 influence zone along the tunnel centre, according to DSM v6. View obliquely from the E. B) The modelled possibly large fracture (LF11, yellow). The influence zone of OL-BFZ297 is shown in dark orange. View obliquely from the NE.

190
Figure 7-53. Comparison of fractures observed in experimental deposition hole ONK-EH8 with the trace of modelled large fracture 6 (LF6; according to DSM v6, projected to ONK-EH8). View obliquely from the E. See text for further explanation.
Figure 7-54. A possible correlation of a fracture trace observed in experimental deposition hole ONK-EH9 with a fracture trace in ONK-EH8. View obliquely from the E. See text for further explanation.

191
A summary of DSM v7 is given in Table 7-26, with a horizontal cross-section of the structures shown in Figure 7-55.
Table 7-26. Summary of the structures in DSM v7 and the data used in the modelling. New data and new/updated structures compared to DSM v6 are shown in red; obsolete data and deleted structures are denoted by a grey background. Data and structures that became obsolete during previous updates have been removed from the table (see Table 7-24).
ORIENTATION
(DIP/DIP DIR) CORE INFLUENCE ZONEONK-PH20 ONK-PH20-BFI-2311-2315 48/149 1.2E-11 -ONK-KR13 ONK-KR13-BFI-6247-6255 50/167 2.2E-11 -ONKALO ONK-BFI-4377 86/093 - -
ONK-PH17 ONK-PH17-BFI-6251-7763 90/086 9.7E-99.7E-11 to
9.2E-9mise a la masse mam-PH16-31 - - -
DT2 probe holes ONK-TDT4399-30-49-A3 - max 1.7E-9 max 2.6E-10DT2 ONK-TDT-4399-30-BFI-56.3 89/092 not measured not measured
ONKALO ONK-BFI-4276 49/167 - -ONK-PH17 ONK-PH17-BFI-5403-5666 50/159 - -
mise a la masse mam-PH16-64 - - -DT2 probe holes ONK-TDT4399-30-49-A3 - max 3.2E-10 -
DT2 ONK-TDT-4399-30-BFI-62.5 46/185 not measured ~ 0.4l/minDemo CT ONK-TT-4399-BFI-62.6 81/181 not measured not measured
DT1 ONK-TDT-4399-44-BFI-22.3 72/175 4.8 ml/min -DT2 ONK-TDT-4399-30-BFI-34.5 57/187 - -
mise a la masse mam-PH16-31 - - -OL-BFZ135 * brittle fault zone OL-KR10 OL-KR10-BFI-36690-36985 60/161 - -OL-BFZ136 * brittle fault zone OL-KR10 OL-KR10-BFI-52638-52690 45/100 - -
OL-KR13 OL-KR13-BFI-31880-32500 80/100 - -Demo CT not observed where expected - - -Demo CT ONK-TT-4399-demo-keskt 55/041 - -
mise a la masse tunnel-earthing-8 - - -DT2 not observed where expected - - -
ONK-PH17 ONK-PH17-6481 28/177 6.1E-9 -ONKALO P382 31/148 - -
mise a la masse mam-PH16-54 - - -DT2 ONK-TDT-4399-30-85-7 19/159 not measured -
ONKALO 4365-1 77/271 - -mise a la masse mam-PH16-75 - - -
DT2 ONK-TDT-4399-30-75-4 88/265 not measured -DT1 ONK-TDT-4399-44-35-3 61/213 - -
ONK-PP316 not observed where expected - - -ONK-PH20 ONK-PH20-2874 12/165 2.1E-10 -DT2 GPR supports the modelled fracture
ONK-PH20 ONK-PH20-3755 65/057 - -
DT2 GPRindicates slight extension below tunnel
floorLF 11 large fracture ONK-EH7 ONK-EH7-1 82/005 10.3 ml/min -HF 1 hydraulically conductive fracture ONK-PH16 ONK-PH16-7139 07/166 7.7E-11 -HF 2 hydraulically conductive fracture ONK-PH17 ONK-PH17-6290 20/322 1.5E-9 -HF 3 hydraulically conductive fracture ONK-PH17 ONK-PH17-6387 30/156 3.1E-9 -HF 4 hydraulically conductive fracture ONK-PH17 ONK-PH17-6542 47/160 5.4E-9 -HF 5 hydraulically conductive fracture ONK-PH17 ONK-PH17-7079 68/200 1.3E-10 -HF 6 hydraulically conductive fracture ONK-PH17 ONK-PH17-8294 88/318 2.7E-10 -
^Only part of the known extent of the structure modelled in detail* As in Aaltonen et al., 2010; not re-modelled
large fracture
LF3 large fracture
LF 5 large fracture
LF 6 large fracture
STRUCTURE TYPE OBSERVED IN INTERSECTION ID TRANSMISSIVITY (m2/s)/
INFLOW
OL-BFZ297 ^ brittle fault zone
OL-BFZ045 ^ brittle fault zone
OL-BFZ084 ^
DSM-BFZ002(LF 8)
brittle fault zone
LF 9 large fracture
LF 10 large fracture
brittle fault zone
OL-BFZ216 brittle fault zone
LF 1
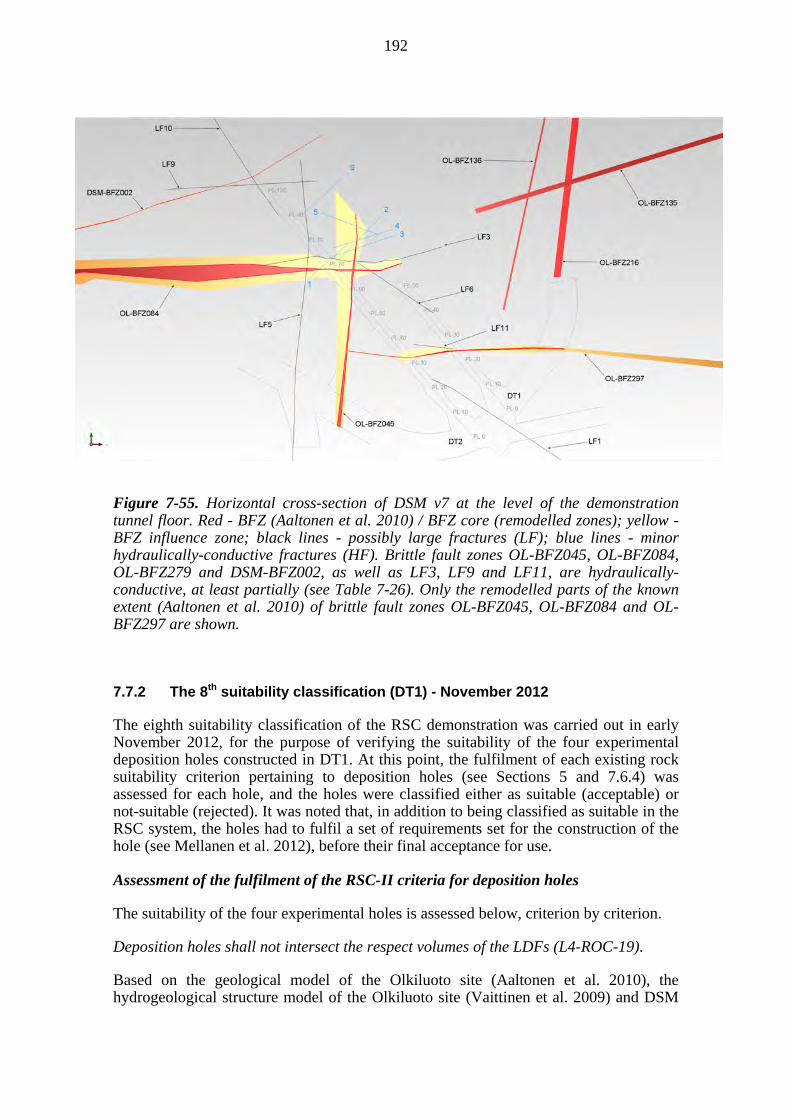
192
Figure 7-55. Horizontal cross-section of DSM v7 at the level of the demonstration tunnel floor. Red - BFZ (Aaltonen et al. 2010) / BFZ core (remodelled zones); yellow - BFZ influence zone; black lines - possibly large fractures (LF); blue lines - minor hydraulically-conductive fractures (HF). Brittle fault zones OL-BFZ045, OL-BFZ084, OL-BFZ279 and DSM-BFZ002, as well as LF3, LF9 and LF11, are hydraulically-conductive, at least partially (see Table 7-26). Only the remodelled parts of the known extent (Aaltonen et al. 2010) of brittle fault zones OL-BFZ045, OL-BFZ084 and OL-BFZ297 are shown.
7.7.2 The 8th suitability classification (DT1) - November 2012
The eighth suitability classification of the RSC demonstration was carried out in early November 2012, for the purpose of verifying the suitability of the four experimental deposition holes constructed in DT1. At this point, the fulfilment of each existing rock suitability criterion pertaining to deposition holes (see Sections 5 and 7.6.4) was assessed for each hole, and the holes were classified either as suitable (acceptable) or not-suitable (rejected). It was noted that, in addition to being classified as suitable in the RSC system, the holes had to fulfil a set of requirements set for the construction of the hole (see Mellanen et al. 2012), before their final acceptance for use.
Assessment of the fulfilment of the RSC-II criteria for deposition holes
The suitability of the four experimental holes is assessed below, criterion by criterion.
Deposition holes shall not intersect the respect volumes of the LDFs (L4-ROC-19).
Based on the geological model of the Olkiluoto site (Aaltonen et al. 2010), the hydrogeological structure model of the Olkiluoto site (Vaittinen et al. 2009) and DSM
193
v7, no features classified as layout-determining are present in the demonstration area and none of the four experimental holes intersect respect volumes of LDFs. Thus, all four holes meet the criterion.
Deposition holes shall not intersect the respect volumes of hydrogeological zones (L4-ROC-14).
Deposition holes shall not intersect the respect volumes of brittle deformation zones (L4-ROC-16)43.
In the detailed-scale model, the potential for enhanced hydraulic conductivity is considered as a feature of brittle structures (deformation zones or fractures) and, if present, is taken into account in the determination of the structure's influence zone. Thus, in practice, a "hydrogeological zone" is always also a "brittle deformation zone" and their influence zones, which in the RSC process are considered equal to the "respect volumes", are the same, and these two criteria are considered at the same time.
As expected, hole ONK-EH7, one of the holes constructed in a "not-suitable" section of the tunnel to test the boring rig, does not meet either of these criteria: the influence zone of brittle fault zone OL-BFZ297 intersects the top of the hole (see Figure 7-50, for example). This zone is also known to be slightly hydraulically-conductive, at least in DT1 and in the demonstration area central tunnel (see Table 7-26). It is also worth noting that the fracturing observed in the hole is rather dense (see Figure 7-50), which might indicate that the influence zone in the footwall of OL-BFZ297 is wider than that modelled, and would, in that case, intersect a much greater portion of ONK-EH7. The other three experimental holes do not intersect the influence zones (respect volumes) of any brittle deformation (or hydrogeological) zones (see Figure 7-50), and do, thus, meet the two criteria.
The maximum allowed inflow into a deposition hole is 0.1 L/min (L5-ROC-62).
Holes ONK-EH6, ONK-EH8 and ONK-EH9 are dry and the criterion is fulfilled. Water inflows are observed in hole ONK-EH7, but the measured total inflow, 10.3 mL/min (see Table 7-26) is clearly below the limit stated in the criterion. Therefore, ONK-EH7 also meets the criterion.
(1) Fractures with extent larger than the limiting extent (diameter 150 m) shall not intersect the canister. (2) If the fracture extent is unknown, the Full Perimeter Intersection (FPI) criterion shall be applied: a fracture traceable over a full deposition tunnel perimeter shall not intersect the canister. (3) If a fracture intersects the entire deposition hole at the potential location of the canister in it and has such an orientation that it is not possible to observe its continuation in a tunnel or other deposition holes, the deposition hole shall be discarded (L5-ROC-64; known as the ‘large fracture criterion’).
43 As explained in footnote number 40, term ‘brittle deformation zone’ is thus used here when discussing this particular RSC-II criterion (L4-ROC-16) – see Figure 5-4.

194
A fracture that is not allowed to intersect the canister according to L5-ROC-64 is neither allowed to intersect the 0.5 m respect zone above or beneath the canister (L5-ROC-82).
Based on DSM v7, no fractures with a known extent greater than 150 m intersect hole ONK-EH6, nor do any FPI fractures of unknown extent (see Figure 7-50). In addition, no fractures intersecting the entire hole are observed (see Figure 7-51), the large fracture criterion is thus fulfilled.
The entire perimeter of hole ONK-EH7 is intersected by a possibly large fracture of unknown dimensions, also at the potential location of the canister. In addition, the fracture in question is in direct contact with FPI fractures in DT1, within the influence zone of OL-BFZ297. Therefore, hole ONK-EH7 does not meet the large fracture criterion.
The location of hole ONK-EH8 was originally classified as not suitable, because according to DSM v3, possibly large fracture LF6 transected the rock volume (see Sections 7.4.3 and 7.4.4). The hole was located within the not suitable tunnel section for the purpose of testing the hole-boring rig. LF6 was not, however, observed at the expected location in the pilot hole drilled at the location, and in DSM v4, the fracture was shortened and it was suggested that the location might indeed be suitable (see Sections 7.5.1 and 7.5.2). A fracture observed in ONK-EH8 was considered as a possible continuation for LF6, but was interpreted to be a different fracture during the latest update of the detailed-scale model (DSM v7). Thus, point (2) of the large fracture criterion would thus be fulfilled.
In case the interpretation made during the DSM update was incorrect, the possibility that the fracture observed in ONK-EH8 might be LF6 needs to be considered. LF6 was not observed in DT2 and in DSM v5 the fracture was terminated against brittle fault zone OL-BFZ045 (Figure 7-56; see also Section 7.6.1). If the fracture were to continue through ONK-EH8 and extend further into the rock mass, it should be visible also in the central tunnel of the demonstration area (Figure 7-56); however, there is no evidence of the fracture at the expected location. It is, therefore, reasonable to presume that the fracture terminates against zone OL-BFZ297 (Figure 7-56). This would limit LF6 to lie between the two fault zones, and would result in a maximum diameter of about 50 m for the fracture plane, assuming a near circular geometry. Thus the extent of the fracture would be clearly smaller than the limiting extent (diameter 150 m), and it could be allowed to intersect the hole and the potential location of the canister, fulfilling point (1) of the large fracture criterion.
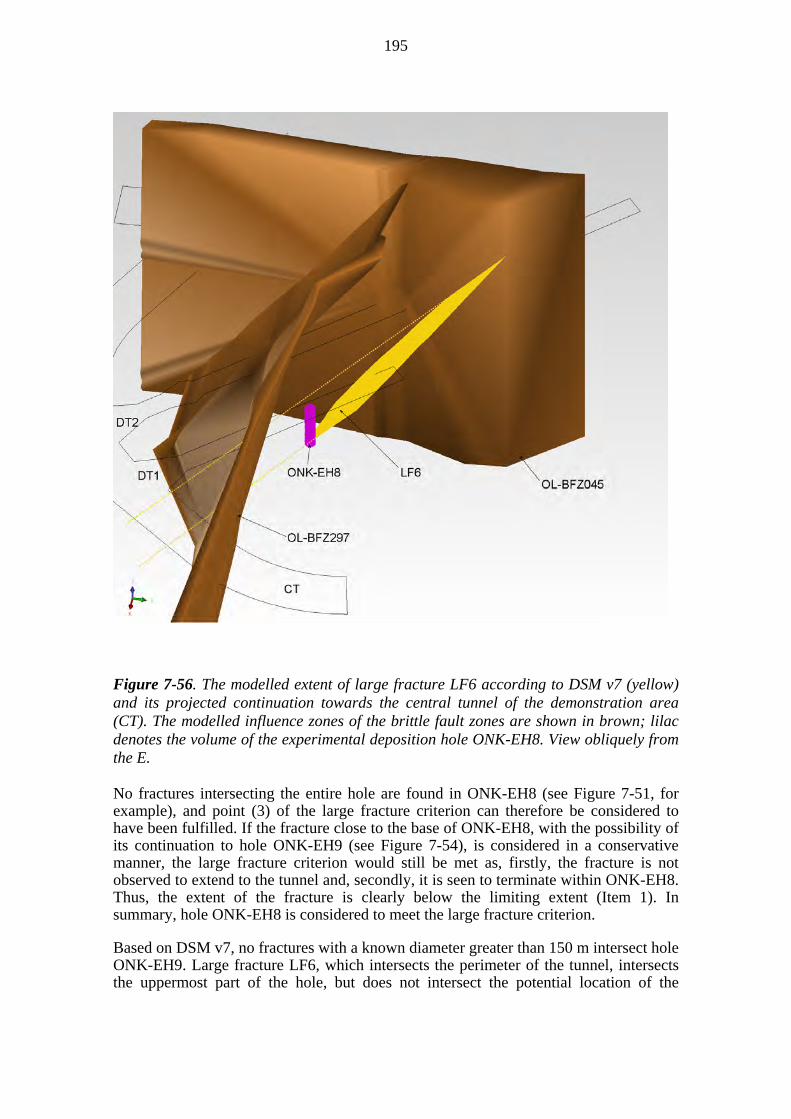
195
Figure 7-56. The modelled extent of large fracture LF6 according to DSM v7 (yellow) and its projected continuation towards the central tunnel of the demonstration area (CT). The modelled influence zones of the brittle fault zones are shown in brown; lilac denotes the volume of the experimental deposition hole ONK-EH8. View obliquely from the E. No fractures intersecting the entire hole are found in ONK-EH8 (see Figure 7-51, for example), and point (3) of the large fracture criterion can therefore be considered to have been fulfilled. If the fracture close to the base of ONK-EH8, with the possibility of its continuation to hole ONK-EH9 (see Figure 7-54), is considered in a conservative manner, the large fracture criterion would still be met as, firstly, the fracture is not observed to extend to the tunnel and, secondly, it is seen to terminate within ONK-EH8. Thus, the extent of the fracture is clearly below the limiting extent (Item 1). In summary, hole ONK-EH8 is considered to meet the large fracture criterion.
Based on DSM v7, no fractures with a known diameter greater than 150 m intersect hole ONK-EH9. Large fracture LF6, which intersects the perimeter of the tunnel, intersects the uppermost part of the hole, but does not intersect the potential location of the

196
canister, nor the 0.5 m respect zone above the canister (Figure 7-56). Also, as mentioned in relation to hole ONK-EH8, the extent of the fracture is well below the limiting extent (diameter 150 m), and therefore the criterion would be fulfilled, even if it intersected the potential location of the canister.
Figure 7-57. Large fracture LF6 (yellow) crosscutting experimental deposition hole ONK-EH9. The approximate location of the canister in a 7.8 m deep deposition hole is denoted by the copper-coloured cylinder; cylinder dimensions as for a canister for OL1-2 -type fuel (diameter 1.05 m, length 4.8 m). The outline of the tunnel (floor) is shown in grey. View obliquely from the E. No fractures intersecting the entire hole are observed in the ONK-EH9 (see Figure 7-52). As discussed in relation to ONK-EH8, a fracture observed in the hole might continue to ONK-EH9 (see Figure 7-55), but as the fracture is not observed to continue to the tunnel and is seen to terminate within ONK-EH8, the extent of the fracture is clearly below the limiting extent. Thus, hole ONK-EH9 also meets the large fracture criterion.
No fracture in which grouting material has been observed or in which there are indications of grouting material is allowed in a deposition hole (L5-ROC-65).
No grouting material was observed in fractures in any of the four experimental deposition holes, nor were any fractures with indications of grouting material present in them. Thus, all four holes meet this criterion.

197
The final suitability of the experimental deposition holes ONK-EH6, ONK-EH7, ONK-EH8 and ONK-EH9.
The fulfilment of the RSC-II criteria by each of the four experimental deposition holes constructed in DT1 is summarised in Table 7-27. Based on the assessment of each of the criteria pertaining to deposition holes, experimental holes ONK-EH6, ONK-EH8 and ONK-EH9 are classified as suitable. Hole ONK-EH7 is classified as not suitable, and is thus rejected, because the hole is intersected by a hydraulically-conductive brittle deformation zone, and because it does not fulfil the large fracture criterion.
Table 7-27. Suitability of the experimental deposition holes constructed in DT1. For the complete wording of the criteria, see text and Section 5.2.
ONK‐EH6 ONK‐EH7 ONK‐EH8 ONK‐EH9
No intersection with LDFs V V V V
No intersection with HZs V X V V
No intersection with BFZs V X V V
Inflow ≤ 0.1 l/min V V V V
No large fractures V X V V
No grouting material V V V V
Classification Suitable Not suitable Suitable Suitable
V ‐ criterion fulfilled X ‐ criterion not fulfilled
Experimental deposition holes in DT1Criterion
7.8 Conclusions
At the time of writing this report, the construction of the demonstration facilities is still continuing and, consequently, the hole-stage of the RSC process has not yet been carried out in DT2. A few conclusions can, however, be drawn from the experience gained so far:
Applying the RSC system outlined in Chapter 6 in practice is possible and the information produced by the rock suitability classifications carried out during the different stages of the system can be used as guidelines for facility design and as a basis for decision-making.
Deposition hole locations which fulfil the rock suitability criteria can be located by using the RSC system. It needs to be noted, however, that this statement is based on a very small number of completed experimental deposition holes (the four holes in DT1), and can be verified further only when more holes have been constructed.
An up-to-date DSM of the relevant bedrock features is essential for carrying out the suitability classifications and should always be used to provide context for possible further interpretation of the data. Further improvement and development of investigation methods, especially in relation to detection and

198
identification of large fractures, should be carried out to increase the quality and reliability of the DSM.
The demonstration has been carried out in parallel to the development of the criteria, starting with the RSC-I criteria used in the first classifications and proceeding through various revisions to the current RSC-II criteria (Chapter 5) used in the latest classification. Observations made during the demonstration programme have affected the criteria development, but in general, it has been found that the RSC-II criteria are well capable in practice of being applied in carrying out the classification. The tunnel-specific inflow criterion is, however, still somewhat ambiguous and requires a better description and definition. This would need to include a better definition of the meaning of the term "local inflow” as well as the possible consequences (and solutions) if and when the criterion is not met.
Further streamlining the flow of investigations - modelling - RSC - design - construction and the associated decision-making and documentation process - is still required, in preparation for repository construction.
199
8 HOST ROCK SUITABILITY
This Chapter discusses the geological properties of the bedrock at Olkiluoto at the proposed disposal depth and the site’s overall suitability from the perspective of the requirements set by the Government Decision (25.3.1999/478) and also STUK-YVL D.5. These issues have previously been discussed in the Olkiluoto Site Description 2011 (Section 10.9; Posiva 2012), where it was concluded that: (i) at the repository level the rock conditions are favourable for geological disposal of the spent fuel, and (ii) no factors indicating unsuitability of the site have been found.
This Chapter discusses the implications of applying the RSC system to the fulfilment of the regulatory requirements concerning the host rock as a natural barrier and also the site’s suitability. This Chapter also provides supplementary and supporting information to the conclusions on the suitability of the site and the selected repository depth presented in Posiva (2012). The following discussion focuses on the current bedrock properties. The evolution of the site and the host rock properties during construction and operation of the repository and under the variable climatic conditions within a future glacial cycle are discussed in more detail in the Performance Assessment Report (Posiva 2012c), which also assesses whether the target properties are met over the long term.
The bedrock is considered as a natural barrier and, under Posiva’s approach, the RSC system is employed in determining the locations of deposition tunnels and deposition holes, to ensure favourable properties regarding the long-term performance of the engineered barriers and retardation of the possibly released radionuclides.
In this Chapter the fulfilment of the regulatory requirements of STUK-YVL D.5, paragraphs 406, 410, 412 and 511 (see Chapter 2) are discussed.
8.1 Stable and intact rock around disposal canisters
Olkiluoto is situated in southwestern Finland, which is a part of the Svecofennian crustal domain belonging to the Precambrian Fennoscandian Shield. The Precambrian part of the Fennoscandian Shield is considered as a stable intraplate area, but with a variation in the distribution of historical earthquakes (Hyvönen 2008; Figure 8-1). Both historically-documented and instrumentally-monitored earthquakes from the FENCAT database reveal clustering of earthquakes in certain areas; in southern Finland, however, the number of earthquakes is generally less than in surrounding areas (Figure 8-1).
In southern Finland, Saari (2012, 2008, 1998) has defined two separate, active seismic zones that are associated with increased earthquake activity (Figure 8-2). These are: the Bothnian Sea towards Ladoga zone (B-L zone) and the southern Paldis to Pskov zone (Å-P-P zone), with Olkiluoto being situated between these two zones. On the basis of recent analysis (Saari 2012), together with earlier studies (Saari 1998, 2000), it is concluded that Olkiluoto is located in a region where earthquakes are sparse and small (M< 5.0).
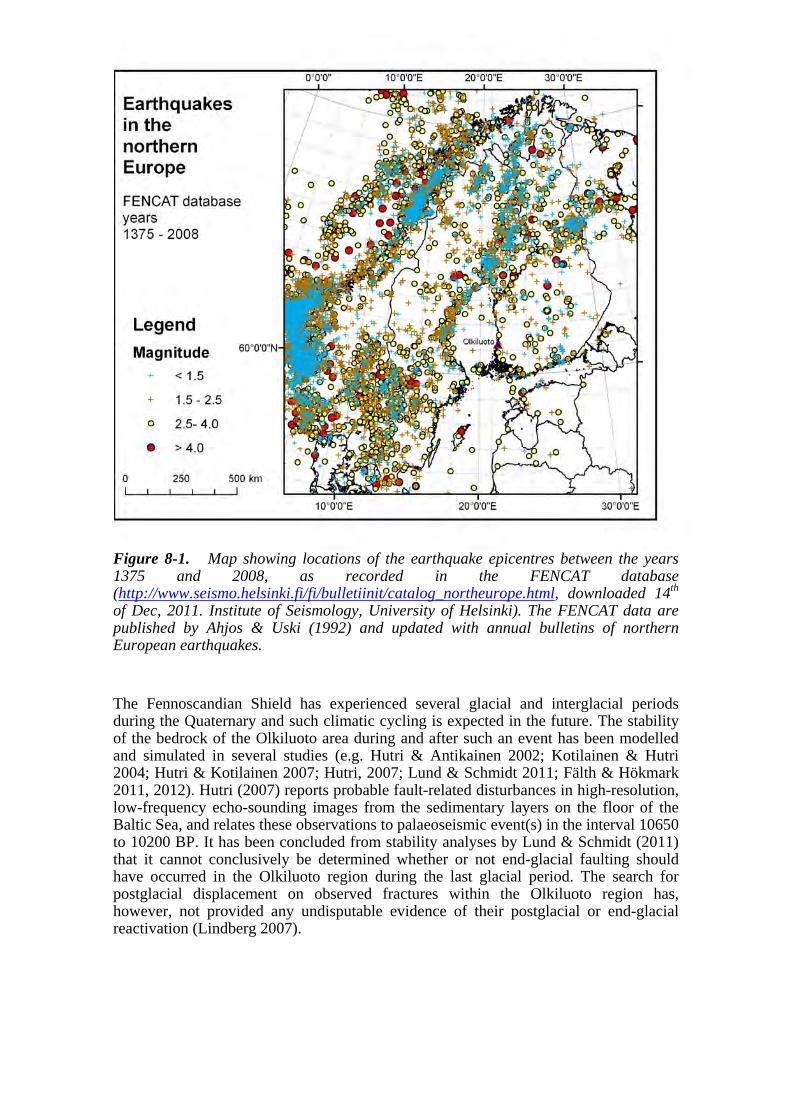
200
Figure 8-1. Map showing locations of the earthquake epicentres between the years 1375 and 2008, as recorded in the FENCAT database (http://www.seismo.helsinki.fi/fi/bulletiinit/catalog_northeurope.html, downloaded 14th of Dec, 2011. Institute of Seismology, University of Helsinki). The FENCAT data are published by Ahjos & Uski (1992) and updated with annual bulletins of northern European earthquakes.
The Fennoscandian Shield has experienced several glacial and interglacial periods during the Quaternary and such climatic cycling is expected in the future. The stability of the bedrock of the Olkiluoto area during and after such an event has been modelled and simulated in several studies (e.g. Hutri & Antikainen 2002; Kotilainen & Hutri 2004; Hutri & Kotilainen 2007; Hutri, 2007; Lund & Schmidt 2011; Fälth & Hökmark 2011, 2012). Hutri (2007) reports probable fault-related disturbances in high-resolution, low-frequency echo-sounding images from the sedimentary layers on the floor of the Baltic Sea, and relates these observations to palaeoseismic event(s) in the interval 10650 to 10200 BP. It has been concluded from stability analyses by Lund & Schmidt (2011) that it cannot conclusively be determined whether or not end-glacial faulting should have occurred in the Olkiluoto region during the last glacial period. The search for postglacial displacement on observed fractures within the Olkiluoto region has, however, not provided any undisputable evidence of their postglacial or end-glacial reactivation (Lindberg 2007).

201
Figure 8-2. Belts of higher seismic activity (shaded areas). Historical events (1375-1964) with magnitude M 3.5 and instrumentally-located (1965-2010) events with magnitude M 3.0 are shown by light and dark blue circles, respectively. Crosses denote earthquakes during the period 1920-1941. The alternative interpretation of an active zone in central Finland, not enclosing the earthquakes occurring between 1920 -1941, is outlined by a dashed line. For details see Saari (2012). CFAZ = Central Finland Active Zone; SFQZ = Southern Finland Quiet Zone. Figure from Saari (2012).
To minimise the risk of potentially harmful earthquake-induced effects on a KBS-3 repository system, the principle of avoiding existing known brittle geological features has been followed since the early phases of site selection in Finland (Salmi et al. 1985, McEwen & Äikäs 2001). Under Posiva’s current approach, the largest brittle fault zones (generally >3 km in length) are classified as LDFs, and these and their respect volumes are avoided by deposition panels and tunnels (see Chapter 5) (STUK YVL D.5, par. 511). In addition, other brittle fault zones, as well as single large fractures that have the potential to experience slip, are also avoided when deciding on the locations for disposal canisters (see Section 5.3). By applying the rock suitability criteria, all deposition holes are to be located within the part of the rock mass that is as stable as possible.
202
In the light of these historical earthquake data (Hyvönen 2008; Saari 2012), it can be concluded that Olkiluoto is located within a stable area with no predictable, anomalously high seismic or tectonic activity (cf. STUK-YVL D.5, par. 406 and 410), as already concluded in the Olkiluoto Site Description 2011 (Posiva 2012). In addition, the possible earthquake-related risks to a KBS-3 repository system are minimised by applying the RSC system, as described in Section 5.2.3, and as demonstrated in Chapter 7.
8.2 Low groundwater flow around waste emplacement tunnels
In the crystalline bedrock at Olkiluoto, groundwater flow takes place in hydraulically-conductive zones (hydrogeological zones) and fractures. The larger-scale hydrogeological zones, which are related to brittle deformation zones, carry most of the volumetric water flow in the deep bedrock; and there is a general decrease of transmissivity of both fractures and the hydrogeological zones, as well as the frequency of hydraulically-conductive fractures with depth. Under natural conditions, groundwater flow at Olkiluoto occurs mainly as a response to freshwater infiltration, which is dependent on the topography, although salinity (density) variation-driven flow also takes place to a lesser extent. The porewater within the rock matrix is stagnant, but exchanges solutes by diffusion with the flowing groundwater in the fractures. The groundwater flow at Olkiluoto is discussed in detail in Posiva (2012). The report concludes that the rock at repository depths is associated with low groundwater flows and that the groundwater flow is confined to a limited set of hydrogeological zones (HZs) and to a sparse fracture network between these HZs. Deposition holes can be selected so as to avoid locations with unacceptably high flow.
The principle of avoiding the significant hydrogeological features has been applied in current and earlier layouts for the Olkiluoto site (e.g. Pere et al. 2012; Hellä et al. 2009; Kirkkomäki 2006). According to the current RSC approach, hydrogeological structures that have both high transmissivity values (T ≥ 10-6 m2/s) and large dimensions (at least several hundred metres) are considered as LDFs (Pere et al. 2012). Such LDFs are not allowed to intersect deposition tunnels and the zone-specific respect distances (actually volumes), that are defined perpendicular to each of the zones, must also be avoided (VAHA; L4-ROC-8). Transmissivities have been shown to decrease with increasing distance from such hydrogeological zones (Pere et al. 2012); therefore, avoiding their respect volumes during the placement of deposition tunnels minimises the possibility of hydraulic connections between a canister position and a hydrogeological zone. By applying the stepwise RSC approach, deposition tunnels will, therefore, be constructed in bedrock volumes where no large and highly conductive hydrogeological zones exist.
The fracture-specific tunnel inflow criterion 0.25 L/min at the time of backfill installation (VAHA; L5-ROC-54) limits the flow in the tunnel and the deposition holes and thus contributes to the performance of the backfill and the buffer. This criterion is determined by the current understanding of the magnitude of local inflows that the backfill can accommodate without significant erosion; and could be modified based on the results of further testing of the backfill concept. As noted in Chapter 7, a more specific definition of the criterion would be beneficial for its practical application.
The respect volumes of the hydrogeological zones or brittle fault zones, in which fracturing is often more intense compared to the surrounding rock, are also avoided in the placement of the deposition holes (VAHA L4-ROC-14 and L4-ROC-16). In addition, no inflow higher than 0.1 L/min is allowed to a deposition hole. Leaving 0.5
203
m of buffer between the canister and a large fracture limits mass transfer in the case where shear displacement has taken place on the fracture, leading potentially to increased fracture transmissivity (VAHA L5-ROC-63).
Therefore, by applying these criteria it is concluded that canister positions can be selected within a volume of rock where groundwater flow is low (cf. STUK-YVL D.5, paragraph 406).
8.3 Retardation of dissolved substances in the geosphere
The main retardation processes in the geosphere considered in the safety assessments are matrix diffusion and sorption. Retardation attenuates geosphere releases due to the radioactive decay that occurs during slow transport. Matrix diffusion and sorption also give rise to spreading of geosphere releases in time, reducing the peak release rates of radionuclides released from the near field as relatively short duration pulses. Matrix diffusion is dependent on the properties (porosity and diffusivity) of the rock matrix adjacent to the migration path. Sorption of the radionuclides on the mineral surfaces of the rock matrix and on the fracture coatings takes place mainly by cation exchange or by surface complexation. Thus, the mineral composition, cation exchange capacity and surface area, as well as the chemical conditions, affect the degree of sorption. The cation exchange capacities for the relevant rock types at Olkiluoto have been shown to depend mainly on the biotite content in the rock (Hakanen et al. 2012, see also Kyllönen et al. 2008, Huitti et al. 1998 and Pinnioja et al. 1984). The chemical composition of the groundwater also affects the speciation of the radionuclides.
The recent analyses of radionuclide release and transport (see Posiva 2012, Chapter 8) have shown that, where the engineered barrier system is not disturbed and is able to provide retention capacity, the impact of geosphere transport on the peak release rates for many of the radionuclides that dominate near-field releases is limited. This is, in part, because failed canisters are generally assumed to be located in deposition holes with relatively unfavourable flow-related properties, including a relatively low geosphere transport resistance, WL/Q. Theoretical considerations, as well as the results of radionuclide transport sensitivity analyses, have also shown that WL/Q is the dominating flow-related factor for geosphere transport. Furthermore, releases tend to be dominated by radionuclides, such as I-129, Cl-36 and C-14, that are non-sorbing or weakly sorbing in both the near field and the geosphere. Sorbing radionuclides, which are strongly retarded during geosphere transport, are also generally effectively retained within the near field, limiting their release rates to the geosphere. However, especially in scenarios where the near field performs more poorly than expected, spreading in time, together with radioactive decay during geosphere transport, is able to reduce release rates associated with the relatively fast releases from the IRF (instant release fraction), the zirconium alloy and other metal parts, as well as the much slower releases from the fuel matrix.
Migmatitic gneisses are the dominant rock types at Olkiluoto and this rock type has typically a relatively high biotite content (about 20%, see e.g Kärki & Paulamäki 2006), which contributes to sorption. Typical fracture coating minerals at Olkiluoto are clays, sulphides and calcites. The microstructure, porosity and mineralogy adjacent to fractures forming typical migration paths in the vicinity of the deposition holes have been studied (see e.g. Kuva et al. 2012 and Posiva 2012, Chapter 8). It has been observed that there is a notable variation of these properties, even between fractures of a

204
certain type. The porosity of the altered rock adjacent to the fractures can be as high as about 5%, or in some cases even more, but typically the porosity of the unaltered rock is around 0.5% or less (Posiva 2012, Chapter 8). The increased porosity in a layer of variable thickness adjacent to fractures is most probably caused by hydrothermal alteration of the rock (Aaltonen et al. 2010). The effective difffusivity is typically in the order of 10-14 - 10-13 m2/s, but is higher, for example, in the clay and calcite coatings of the fractures and in the thin layer of altered rock which frequently occurrs adjacent to fractures (see Posiva 2012, Chapter 8).
As discussed above, the fracture coatings and the rock adjacent to fractures are porous to varying degrees and enable matrix diffusion to take place. In crystalline rocks, the preference for sorption on mica and clay minerals is due to the high cation exchange capacity (CEC) and high surface area of these minerals compared to the low CEC and low surface area of the feldspar minerals and quartz. Mica and clay minerals are abundant in Olkiluoto rocks. It can be concluded, therefore, that in addition to the slow transport in geosphere, the host rock at Olkiluoto provides retardation that limits the mobility of the radionuclides, which is especially important in scenarios where the near field is degraded. There is a notable variation in the mineralogy and porosity adjacent to and along the migration paths, and thereby in the retardation properties. This variation does not, however, show a spatial pattern or a clear distinction between different fractures that, based on the retardation properties, would allow useful criteria to be defined. Rather, at the repository depth the rock properties are generally favourable for retardation (L3-ROC-33). Furthermore, in terms of the retention capacity of the host rock, it is more important to locate the deposition holes in such a way that the groundwater flow around them is limited (see Section 8.2).
8.4 Protection provided against natural phenomena and human actions
8.4.1 Natural phenomena
One aim of the host rock is to provide stable and predictable conditions for the spent fuel. Exogenic processes such as, for example, weathering and erosion, under climatic conditions that can be very variable cause changes in conditions at and close to the surface, and therefore the shield provided by the bedrock is needed. The processes due to climate change, such as permafrost and dilute water intrusion, may also pose a risk for the safe disposal of the spent fuel. These issues are discussed in detail in Posiva (2012i; the Complementary Consideration report) and are, therefore, not discussed here.
YVL D.5, par. 412 requires that the repository shall be located: "at the depth of several hundreds of metres in order to mitigate adequately the impacts from aboveground natural phenomena". The intact rock volume above the spent fuel acts as a buffer against surface phenomena and the constraints imposed on the depth of the repository are summarised in Section 8.5.
8.4.2 Proximity of natural resources
Possible future exploitation of natural resources close to the repository could pose a risk of inadvertent human intrusion.
The metallogenic zones shown by Eilu et al. 2012 are defined by empirical observations on the distribution of ore deposits in Finland. Olkiluoto is not situated within any of the

205
metallogenic zones (Figure 8-3). The closest defined metallogenic zone (the Pori-Vammala-Kylmäkoski Ni-Cu zone; Eilu et al. 2012) is situated ca. 30-40 km northeast of Olkiluoto and there are currently no active claims or claim reservations in the vicinity (within 30 km) of the Olkiluoto area (Figure 8-3).
In Eurajoki, exploration for Rapakivi-related tin (±Zn) ca. 10 km southeast of Olkiluoto took place over the years 1967-1972. These studies were focused on greisen type Sn-W-Be-Zn mineralisations known within the Eurajoki rapakivi granite stock (GTK 1973; Haapala 1997). GTK, however, relinquished their claims, as no economically exploitable mineralisation was found (GTK 1973). Some of the hydrothermal veins associated with faults have also been reported from the ONKALO (Pere 2009). The main minerals in these hydrothermal fault fillings are quartz, chlorite, calcite, sphalerite, chalcopyrite, galena and pyrite, with cassiterite, xenotime, stannite, petrukite, sulphotellurides, silver and bismuth as accessory minerals (Pere 2009). The occurrence of these fault fillings found at Olkiluoto is, however, far too insignificant to be economically attractive to mine - and is thus not currently exploitable (Posiva 2012).
It can thus be concluded that currently no exploitable natural resources are known to exist in the proximity of the Olkiluoto site (cf. STUK-YVL D.5, par. 410.). The possibility of future exploration activities, including drilling into a canister and other inadvertent human intrusion, is discussed in more detail in the Formulation of Radionuclide Release Scenarios report (Posiva 2012a). This subject is also discussed in Chapter 10 of Site Description 2011 (Posiva 2012) under the title of Suitable factors and factors indicating unsuitability, where other factors, such as in situ stresses and seismicity, are also discussed.
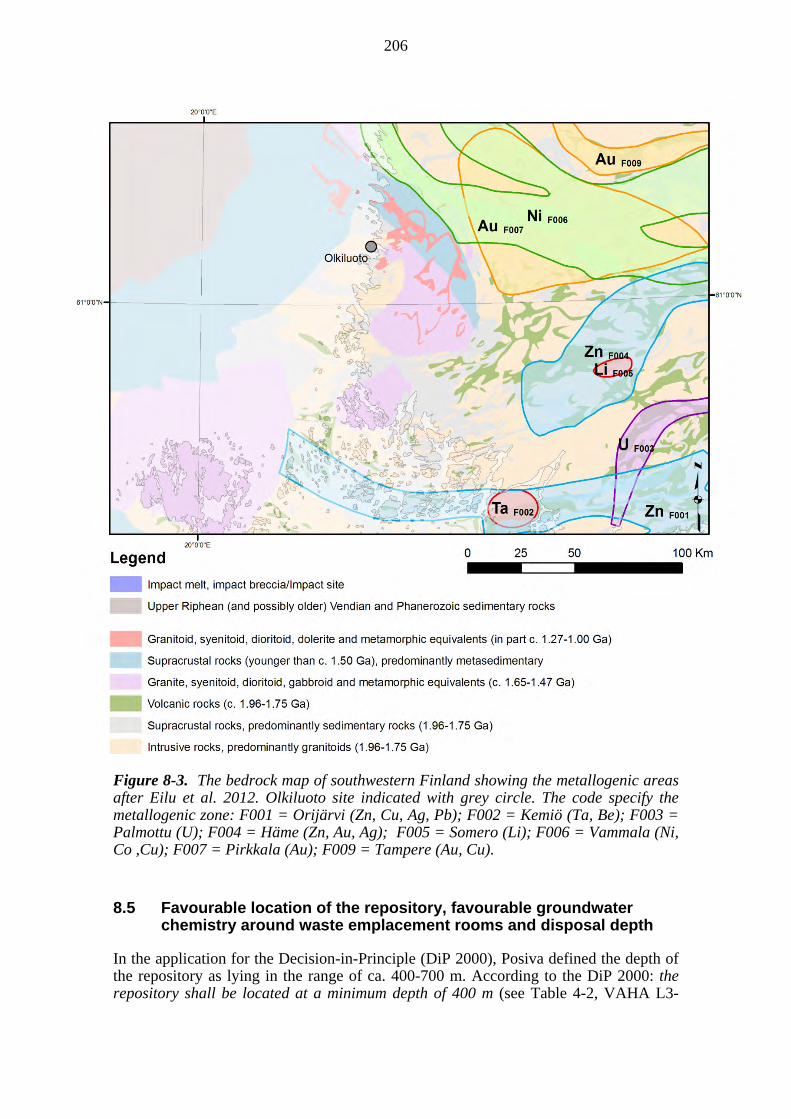
206
Figure 8-3. The bedrock map of southwestern Finland showing the metallogenic areas after Eilu et al. 2012. Olkiluoto site indicated with grey circle. The code specify the metallogenic zone: F001 = Orijärvi (Zn, Cu, Ag, Pb); F002 = Kemiö (Ta, Be); F003 = Palmottu (U); F004 = Häme (Zn, Au, Ag); F005 = Somero (Li); F006 = Vammala (Ni, Co ,Cu); F007 = Pirkkala (Au); F009 = Tampere (Au, Cu).
8.5 Favourable location of the repository, favourable groundwater chemistry around waste emplacement rooms and disposal depth
In the application for the Decision-in-Principle (DiP 2000), Posiva defined the depth of the repository as lying in the range of ca. 400-700 m. According to the DiP 2000: the repository shall be located at a minimum depth of 400 m (see Table 4-2, VAHA L3-

207
ROC-5). Subsequent to this decision and based on information obtained during the site characterisation programme and the construction of the ONKALO, the current layout of the repository is planned to lie in the depth interval of 400 to 450 m. The bedrock properties relevant to the selection of the disposal depth are summarised below and are based on those presented in Site Description report (Posiva 2012 and references therein). The following summary of the bedrock characteristics are given in the perspective of YVL D.5, paragraph 412.
Hydraulic conductivity and groundwater chemistry at the selected depth
From a hydrogeological point of view, the repository is favourably located at the selected repository depth for the following reasons: o As the main hydrogeological zones, HZ19, HZ20 and HZ21, are classified as
LDFs (Pere et al. 2012), no deposition tunnels are allowed to be constructed within the respect volumes of these features (L4-ROC-8 in VAHA). In addition, the intersection of these zones shall be avoided as far as possible during the construction of any repository rooms (L4-ROC-42 in VAHA). There are very few highly-transmissive features outside the hydrogeological zones (Posiva 2012).
o The hydraulic conductivity generally decreases with increasing depth (Posiva 2012, Chapter 6).
o The favourable location of deposition tunnels and actual canister positions are confirmed by applying the stepwise RSC methodology described in Chapter 6.
In terms of the limits set by the target properties, it can be concluded that the groundwater chemistry is currently favourable at the selected repository depth: o The measured pH is between ca. 7 - 8 (Figure 7-57 in Posiva 2012).
According to present understanding, recharge from the surface to depths in excess of about 300 m is limited (Sections 7.3.3 and 7.3.9 in Posiva 2012).
o The salinity generally increases with increasing depth. The brackish groundwater (TDS up to 10 g/L) dominates between depths of 30 m and 400 m, whereas saline groundwater (TDS >10 g/L) dominates below 400 m depth. Considering this, the salinity being from 10 to 20 g/L in the selected depth is favourable in terms of long-term safety, as the target property value of TDS is 35 g/L, with local or temporal variations allowable up to 70 g/L (Section 7.3.6 in Posiva 2012).
o The observed content of dissolved organic carbon, other than CH4, is interpreted as being low at the repository level, but uncertainty related to measurement techniques exists (Section 7.4.1: Dissolved organic carbon in Posiva 2012).
o Dissolved sulphide concentrations are generally low in saline groundwater, less than 0.3 mg/L below 400 m depth (Figure 7-41 in Posiva 2012).
o Methane concentrations are significant in saline groundwater 100 to 400 mL/L at 400 – 500 m depth (Figure 7-41 in Posiva 2012). Although high methane concentration in general is considered as an unfavourable property of the groundwater, methane and other hydrocarbons in groundwaters are capable of buffering the redox conditions, which do not favour the diffusion of SO4 (or other oxidants) to depths into the CH4-rich groundwater system
208
and hence prevent sulphide formation in the CH4-rich groundwater system (Posiva 2012, Section 11.4.3).
o Hydrogen concentrations are very low in groundwater, less than 1 ml/L at 400 to 500 m depth and mostly only at the µL/L level (Pitkänen & Partamies 2007).
Rock stress - strength ratio
At the selected repository depth the stresses are not abnormally high with regard to the strength of rock. This finding is based on observations from the ONKALO, which has already reached the planned repository depth and where only very limited spalling has been observed. No rock bursts or such phenomena to indicate abnormally high rock stresses with regard to the strength of rock have been observed (see Posiva 2012, Chapter 5 for considerable discussions on spalling). Preliminary observations in the POSE experiment (Section 4.6) suggest that the stress-related failures are very limited and controlled by the opening and shearing of anisotropic mica layers and lithological boundaries. The POSE experiment is still running and it may be possible to arrive at more definite conclusions when it has been completed. All these data suggest that the repository can be constructed without any major stability concerns at the chosen repository depth.
The successful excavation of the ONKALO and the experience from the POSE experiment (Section 4.6) and the demonstration tunnels shows that the magnitudes of the in situ stresses in relation to the strength of the rock are sufficiently low to allow for the excavation and operation of underground facilities at the suggested repository depth.
During the selection of the disposal depth, priority has been given to long-term safety (YVL D.5, paragraph 412). Considering the factors mentioned above, it is concluded that the selected repository depth (400-450 m) is favourable with respect to groundwater flow regime and chemistry, as well as to the rock stress - strength ratio. The hydrogeological conditions deeper in the bedrock are even more favourable than at the selected depth, as groundwater flow generally decreases with depth and thus changes in groundwater chemistry in the long-term would also be reduced. However, locating the repository deeper in the rock would increase the risk of saline water upconing. Although, it is possible to go deeper from a construction point of view, the increasing stresses with depth are likely to result in an increase in stress-induced damage and the rock construction would in general become more demanding. By applying the RSC methodology, bedrock volumes containing features that could be detrimental to the long-term safety of the repository at the selected disposal depth are excluded.
209
9 DISCUSSION
9.1 Status of the RSC system
Since the interim stage of the development of the rock suitability criteria (Hellä et al. 2009) the programme has concentrated on criteria testing, on further development of the rok suitability criteria and on a stepwise implementation process. The testing results are summarised in Chapter 4 in this report and the implementation process is described in Chapter 6. The main outcome of the testing phase has been the significant effect that ensues from the application of criteria related to mechanical stability, e.g. the "large fracture criterion" (L5-ROC-64), especially in those parts of the rock mass where horizontal or subhorizontal fractures with unknown dimensions prevail. The testing results have shown that this criterion can have a significant effect on the bedrock volume considered suitable for canister placement. Some canister locations can be unnecessarily discarded, in cases where a fracture is assumed to be larger than is actually the case, due to a lack of data on the true size of a facture. More work is needed to further evaluate the level of conservatism of this criterion, if such conservatism actually exists, and to assess the effect of its possible reformulation on the long-term safety of the repository.
The demonstration programme has been shown to be an efficient method of evaluating the practical use of the criteria and for identifying specific areas for improvement in the RSC system. Currently, the RSC demonstration programme is still in progress and the final results from this programme are to be evaluated separately. However, on the basis of the experience from Demonstration Tunnel 1, it can already be concluded that the stepwise research, construction and decision-making protocol, as described in Chapters 6 and 7 of this report, can be applied successfully in practice and that the RSC-II criteria can also be applied in practice to carry out the classification. During the demonstration, it was also discovered that the tunnel-specific inflow criterion (L5-ROC-54) requires a better description and definition, in order avoid a case-by-case interpretation of its precise meaning. In particular, there is a need for a better definition of the term "local inflow” as well as a description of the possible consequences (and solutions), if and when the criterion is not met. A need for further streamlining the flow of investigations and the associated decision-making and documentation process was also identified.
After completing the RSC activities in the two Demonstration Tunnels, the demonstration will continue in adjacent areas. These testing and demonstration activities are expected to provide information that can be further used for improving the practical use of the rock suitability criteria and for applying the methodology to the repository operational phase. The effect of applying rock suitability criteria on rock properties around the repository in the long term (e.g. flow conditions) is discussed in Posiva (2012c, Performance Assessment report). The findings of the Performance Assesment report (2012c) are also taken into account in the further development of the rock suitability criteria. An overview of future RSC-related activities is given in the YJH-2012 report (Posiva 2012h).
The suitability of the Olkiluoto rok mass for hosting a disposal facility for spent nuclear repository with respect to the regulatory requirements is discussed in Chapter 8. A detailed presentation of how each of the relevant regulatory requirements is handled in the RSC system is given in Section 9.2 The discussion presented in Chapter 8 essentially confirms the interim conclusions about the suitability of the site presented in (Posiva 2012, Section 10.9), where it was concluded that: (i) at the repository level the

210
rock conditions are favourable for geological disposal of the spent fuel, and (ii) no factors indicating unsuitability of the site have been found. The RSC system provides a structured method of locating the disposal facility, so that the less favourable volumes of rock, e.g. brittle fault zones and hydraulically-conductive features, are avoided.

9.2
Ho
w t
he
reg
ula
tory
req
uir
emen
ts r
elat
ed t
o t
he
ho
st r
ock
as
a n
atu
ral b
arri
er a
re h
and
led
in t
he
RS
C s
yste
m
The
reg
ulat
ory
requ
irem
ents
in S
TU
K’s
YV
L G
uide
D.5
rel
ated
to th
e ho
st r
ock
as a
nat
ural
bar
rier
are
list
ed in
Tab
le 9
.1, a
s is
how
the
se
requ
irem
ents
are
han
dled
in th
e R
SC s
yste
m, t
oget
her
wit
h th
e re
leva
nt r
efer
ence
s.
Tab
le 9
.1 S
umm
ary
tabl
e as
to h
ow th
e re
gula
tory
req
uire
men
ts a
re h
andl
ed in
the
RSC
sys
tem
.
Requirem
ent in YVL Guide D.5
How
handled in the RSC system
Reference
(406
) N
atur
al b
arri
ers
and
thei
r sa
fety
fun
ctio
ns m
ay c
onsi
st o
f:
• st
able
and
inta
ct r
ock
wit
h lo
w g
roun
dwat
er f
low
rat
es a
roun
d di
spos
al
cani
ster
s
• ro
ck a
roun
d w
aste
em
plac
emen
t roo
ms
whe
re lo
w g
roun
dwat
er f
low
,
redu
cing
and
als
o ot
herw
ise
favo
urab
le g
roun
dwat
er c
hem
istr
y an
d
reta
rdat
ion
of d
isso
lved
sub
stan
ces
in r
ock
lim
it th
e m
obil
ity o
f
radi
onuc
lide
s
• pr
otec
tion
pro
vide
d by
the
host
roc
k ag
ains
t nat
ural
phe
nom
ena
and
hum
an a
ctio
ns.
The
targ
et p
rope
rtie
s ba
sed
on th
e sa
fety
fun
ctio
ns a
re d
efin
ed a
nd
they
def
ine
the
cond
itio
ns w
here
the
safe
ty f
unct
ions
are
like
ly to
be
met
, tak
ing
into
acc
ount
the
desi
gn s
olut
ion,
the
site
pro
pert
ies
and
proc
esse
s an
d ev
ents
dur
ing
the
evol
utio
n of
the
site
and
the
repo
sito
ry. T
he ta
rget
pro
pert
ies
are
rela
ted
to g
roun
dwat
er
chem
istr
y, g
roun
dwat
er f
low
and
tran
spor
t and
mec
hani
cal s
tabi
lity.
The
roc
k su
itab
ility
cri
teri
a at
dif
fere
nt s
cale
s ar
e de
rive
d fr
om th
e
targ
et p
rope
rtie
s an
d ar
e us
ed f
or lo
cati
ng s
uita
ble
rock
vol
umes
.
The
sel
ecti
on p
roce
dure
car
ried
out
by
appl
ying
the
crit
eria
cont
ribu
tes
to th
e se
lect
ion
of f
avou
rabl
e ho
st r
ock
volu
mes
in
term
s of
thei
r m
echa
nica
l sta
bili
ty, g
roun
dwat
er f
low
and
grou
ndw
ater
che
mis
try.
Saf
ety
func
tion
s an
d ta
rget
pro
pert
ies:
Des
ign
Bas
is
Rep
ort (
Pos
iva
2012
e). A
bri
ef s
umm
ary
is g
iven
in
Sec
tion
4.1
of
this
rep
ort.
Roc
k su
itabi
lity
crite
ria:
see
Cha
pter
5 o
f th
is r
epor
t.
(407
) T
arge
ts b
ased
on
high
qua
lity
sci
enti
fic
know
ledg
e an
d ex
pert
judg
emen
t sha
ll b
e sp
ecif
ied
for
the
perf
orm
ance
of
each
saf
ety
func
tion
.
In d
oing
so,
the
pote
ntia
l cha
nges
and
eve
nts
affe
ctin
g th
e di
spos
al
cond
itio
ns d
urin
g ea
ch a
sses
smen
t per
iod
shal
l be
take
n in
to a
ccou
nt. I
n
an a
sses
smen
t per
iod
exte
ndin
g up
to s
ever
al th
ousa
nds
of y
ears
, one
can
assu
me
that
the
bedr
ock
of th
e si
te r
emai
ns in
its
curr
ent s
tate
, tak
ing
how
ever
acc
ount
of
the
chan
ges
due
to p
redi
ctab
le p
roce
sses
, suc
h as
land
upl
ift a
nd th
ose
due
to e
xcav
atio
ns a
nd d
ispo
sed
was
te.
Tar
get p
rope
rtie
s ar
e de
fine
d ba
sed
on th
e sa
fety
fun
ctio
ns.
Def
init
ion
of th
e ta
rget
pro
pert
ies
cons
ider
s th
e m
utua
l
com
pati
bili
ty o
f th
e ba
rrie
rs a
nd a
lso
the
even
ts a
nd p
roce
sses
duri
ng th
e si
te e
volu
tion
that
wil
l cha
nge
thes
e co
ndit
ions
.
For
saf
ety
func
tion
s an
d ta
rget
pro
pert
ies
see
Des
ign
Bas
is r
epor
t (P
osiv
a 20
12e)
. A b
rief
sum
mar
y is
give
n in
Sec
tion
4.1
of
this
rep
ort.
211
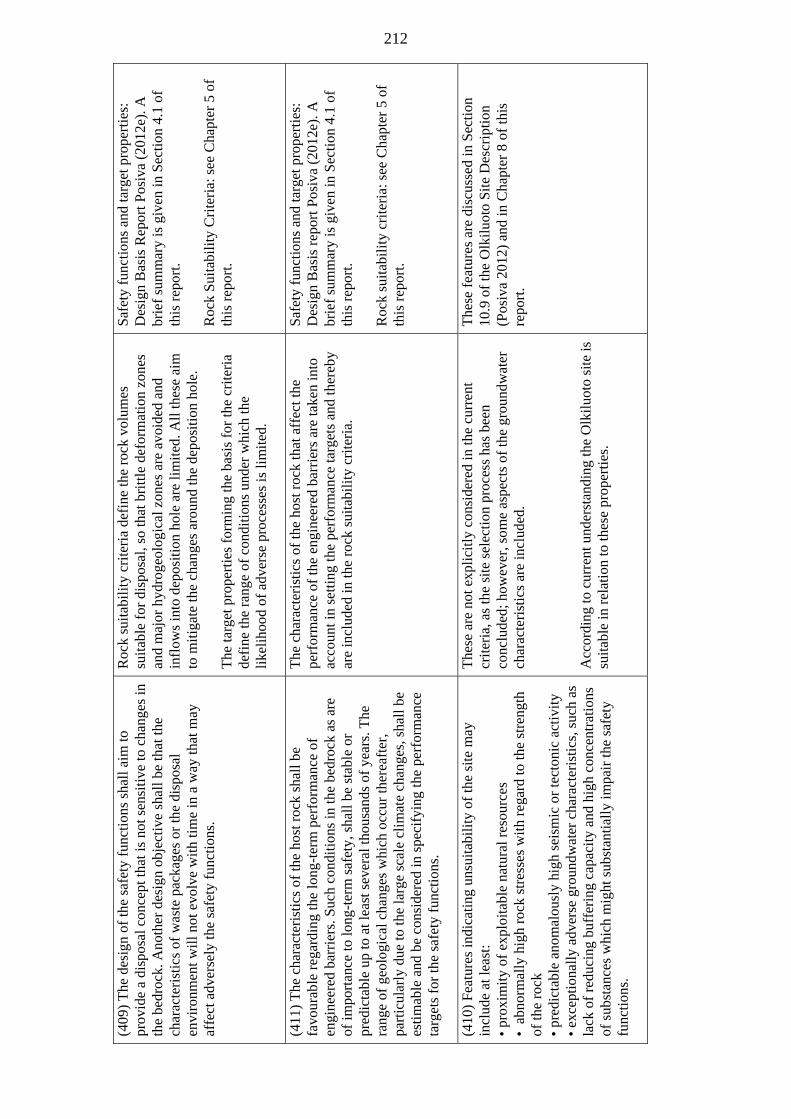
(409
) T
he d
esig
n of
the
safe
ty f
unct
ions
sha
ll a
im to
pr
ovid
e a
disp
osal
con
cept
that
is n
ot s
ensi
tive
to c
hang
es in
th
e be
droc
k. A
noth
er d
esig
n ob
ject
ive
shal
l be
that
the
char
acte
rist
ics
of w
aste
pac
kage
s or
the
disp
osal
en
viro
nmen
t wil
l not
evo
lve
wit
h ti
me
in a
way
that
may
af
fect
adv
erse
ly th
e sa
fety
fun
ctio
ns.
Roc
k su
itab
ilit
y cr
iter
ia d
efin
e th
e ro
ck v
olum
es
suit
able
for
dis
posa
l, so
that
bri
ttle
def
orm
atio
n zo
nes
and
maj
or h
ydro
geol
ogic
al z
ones
are
avo
ided
and
in
flow
s in
to d
epos
itio
n ho
le a
re li
mit
ed. A
ll th
ese
aim
to
mit
igat
e th
e ch
ange
s ar
ound
the
depo
siti
on h
ole.
T
he ta
rget
pro
pert
ies
form
ing
the
basi
s fo
r th
e cr
iter
ia
defi
ne th
e ra
nge
of c
ondi
tions
und
er w
hich
the
like
liho
od o
f ad
vers
e pr
oces
ses
is li
mit
ed.
Saf
ety
func
tions
and
targ
et p
rope
rtie
s:
Des
ign
Bas
is R
epor
t Pos
iva
(201
2e).
A
brie
f su
mm
ary
is g
iven
in S
ecti
on 4
.1 o
f th
is r
epor
t. R
ock
Sui
tabi
lity
Cri
teri
a: s
ee C
hapt
er 5
of
this
rep
ort.
(411
) T
he c
hara
cter
isti
cs o
f th
e ho
st r
ock
shal
l be
favo
urab
le r
egar
ding
the
long
-ter
m p
erfo
rman
ce o
f en
gine
ered
bar
rier
s. S
uch
cond
itio
ns in
the
bedr
ock
as a
re
of im
port
ance
to lo
ng-t
erm
saf
ety,
sha
ll b
e st
able
or
pred
icta
ble
up to
at l
east
sev
eral
thou
sand
s of
yea
rs. T
he
rang
e of
geo
logi
cal c
hang
es w
hich
occ
ur th
erea
fter
, pa
rtic
ular
ly d
ue to
the
larg
e sc
ale
clim
ate
chan
ges,
sha
ll b
e es
tim
able
and
be
cons
ider
ed in
spe
cify
ing
the
perf
orm
ance
ta
rget
s fo
r th
e sa
fety
fun
ctio
ns.
The
cha
ract
eris
tics
of
the
host
roc
k th
at a
ffec
t the
pe
rfor
man
ce o
f th
e en
gine
ered
bar
rier
s ar
e ta
ken
into
ac
coun
t in
sett
ing
the
perf
orm
ance
targ
ets
and
ther
eby
are
incl
uded
in th
e ro
ck s
uita
bili
ty c
rite
ria.
Saf
ety
func
tions
and
targ
et p
rope
rtie
s:
Des
ign
Bas
is r
epor
t Pos
iva
(201
2e).
A
brie
f su
mm
ary
is g
iven
in S
ecti
on 4
.1 o
f th
is r
epor
t. R
ock
suit
abil
ity
crit
eria
: see
Cha
pter
5 o
f th
is r
epor
t.
(410
) F
eatu
res
indi
cati
ng u
nsui
tabi
lity
of
the
site
may
in
clud
e at
leas
t:
• pr
oxim
ity
of e
xplo
itab
le n
atur
al r
esou
rces
•
abn
orm
ally
hig
h ro
ck s
tres
ses
wit
h re
gard
to th
e st
reng
th
of th
e ro
ck
• pr
edic
tabl
e an
omal
ousl
y hi
gh s
eism
ic o
r te
cton
ic a
ctiv
ity
• ex
cept
iona
lly
adve
rse
grou
ndw
ater
cha
ract
eris
tics
, suc
h as
la
ck o
f re
duci
ng b
uffe
ring
cap
acit
y an
d hi
gh c
once
ntra
tion
s of
sub
stan
ces
whi
ch m
ight
sub
stan
tial
ly im
pair
the
safe
ty
func
tion
s.
The
se a
re n
ot e
xpli
citl
y co
nsid
ered
in th
e cu
rren
t cr
iter
ia, a
s th
e si
te s
elec
tion
pro
cess
has
bee
n co
nclu
ded;
how
ever
, som
e as
pect
s of
the
grou
ndw
ater
ch
arac
teri
stic
s ar
e in
clud
ed.
Acc
ordi
ng to
cur
rent
und
erst
andi
ng th
e O
lkil
uoto
sit
e is
su
itab
le in
rel
atio
n to
thes
e pr
oper
ties
.
The
se f
eatu
res
are
disc
usse
d in
Sec
tion
10
.9 o
f th
e O
lkil
uoto
Sit
e D
escr
ipti
on
(Pos
iva
2012
) an
d in
Cha
pter
8 o
f th
is
repo
rt.
212
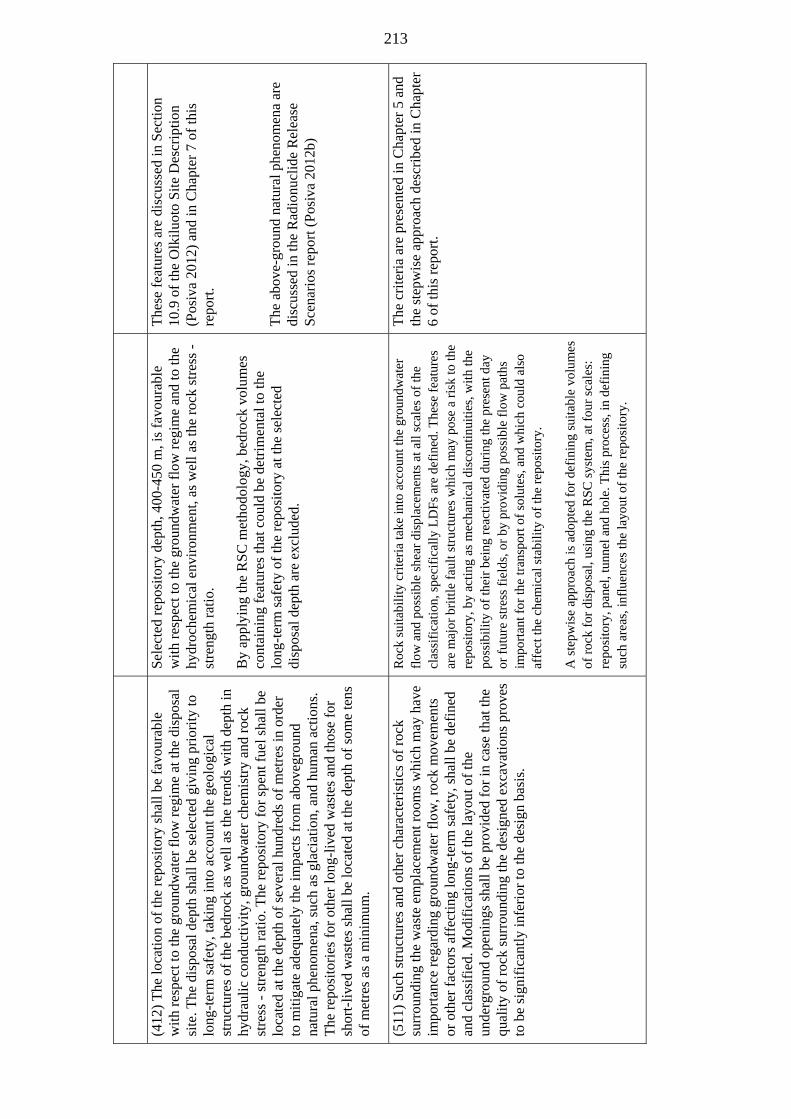
(412
) T
he lo
cati
on o
f th
e re
posi
tory
sha
ll be
fav
oura
ble
wit
h re
spec
t to
the
grou
ndw
ater
flo
w r
egim
e at
the
disp
osal
si
te. T
he d
ispo
sal d
epth
sha
ll b
e se
lect
ed g
ivin
g pr
iori
ty to
lo
ng-t
erm
saf
ety,
taki
ng in
to a
ccou
nt th
e ge
olog
ical
st
ruct
ures
of
the
bedr
ock
as w
ell a
s th
e tr
ends
wit
h de
pth
in
hydr
auli
c co
nduc
tivi
ty, g
roun
dwat
er c
hem
istr
y an
d ro
ck
stre
ss -
str
engt
h ra
tio.
The
rep
osit
ory
for
spen
t fue
l sha
ll b
e lo
cate
d at
the
dept
h of
sev
eral
hun
dred
s of
met
res
in o
rder
to
mit
igat
e ad
equa
tely
the
impa
cts
from
abo
vegr
ound
na
tura
l phe
nom
ena,
suc
h as
gla
ciat
ion,
and
hum
an a
ctio
ns.
The
rep
osit
orie
s fo
r ot
her
long
-liv
ed w
aste
s an
d th
ose
for
shor
t-li
ved
was
tes
shal
l be
loca
ted
at th
e de
pth
of s
ome
tens
of
met
res
as a
min
imum
.
Sel
ecte
d re
posi
tory
dep
th, 4
00-4
50 m
, is
favo
urab
le
wit
h re
spec
t to
the
grou
ndw
ater
flo
w r
egim
e an
d to
the
hydr
oche
mic
al e
nvir
onm
ent,
as w
ell a
s th
e ro
ck s
tres
s -
stre
ngth
rat
io.
By
appl
ying
the
RS
C m
etho
dolo
gy, b
edro
ck v
olum
es
cont
aini
ng f
eatu
res
that
cou
ld b
e de
trim
enta
l to
the
long
-ter
m s
afet
y of
the
repo
sito
ry a
t the
sel
ecte
d di
spos
al d
epth
are
exc
lude
d.
The
se f
eatu
res
are
disc
usse
d in
Sec
tion
10
.9 o
f th
e O
lkil
uoto
Sit
e D
escr
ipti
on
(Pos
iva
2012
) an
d in
Cha
pter
7 o
f th
is
repo
rt.
The
abo
ve-g
roun
d na
tura
l phe
nom
ena
are
disc
usse
d in
the
Rad
ionu
clid
e R
elea
se
Sce
nari
os r
epor
t (P
osiv
a 20
12b)
(511
) S
uch
stru
ctur
es a
nd o
ther
cha
ract
eris
tics
of
rock
su
rrou
ndin
g th
e w
aste
em
plac
emen
t roo
ms
whi
ch m
ay h
ave
impo
rtan
ce r
egar
ding
gro
undw
ater
flo
w, r
ock
mov
emen
ts
or o
ther
fac
tors
aff
ecti
ng lo
ng-t
erm
saf
ety,
sha
ll b
e de
fine
d an
d cl
assi
fied
. Mod
ific
atio
ns o
f th
e la
yout
of
the
unde
rgro
und
open
ings
sha
ll be
pro
vide
d fo
r in
cas
e th
at th
e qu
ality
of
rock
sur
roun
ding
the
desi
gned
exc
avat
ions
pro
ves
to b
e si
gnif
ican
tly
infe
rior
to th
e de
sign
bas
is.
Roc
k su
itabi
lity
crite
ria
take
into
acc
ount
the
grou
ndw
ater
fl
ow a
nd p
ossi
ble
shea
r di
spla
cem
ents
at a
ll s
cale
s of
the
clas
sifi
cati
on, s
peci
fica
lly
LD
Fs
are
defi
ned.
The
se f
eatu
res
are
maj
or b
ritt
le f
ault
str
uctu
res
whi
ch m
ay p
ose
a ri
sk to
the
repo
sito
ry, b
y ac
ting
as
mec
hani
cal d
isco
ntin
uiti
es, w
ith
the
poss
ibili
ty o
f th
eir
bein
g re
activ
ated
dur
ing
the
pres
ent d
ay
or f
utur
e st
ress
fie
lds,
or
by p
rovi
ding
pos
sibl
e fl
ow p
aths
im
port
ant f
or th
e tr
ansp
ort o
f so
lute
s, a
nd w
hich
cou
ld a
lso
affe
ct th
e ch
emic
al s
tabi
lity
of th
e re
posi
tory
.
A s
tepw
ise
appr
oach
is a
dopt
ed f
or d
efin
ing
suita
ble
volu
mes
of
roc
k fo
r di
spos
al, u
sing
the
RS
C s
yste
m, a
t fou
r sc
ales
: re
posi
tory
, pan
el, t
unne
l and
hol
e. T
his
proc
ess,
in d
efin
ing
such
are
as, i
nflu
ence
s th
e la
yout
of
the
repo
sito
ry.
The
cri
teri
a ar
e pr
esen
ted
in C
hapt
er 5
and
th
e st
epw
ise
appr
oach
des
crib
ed in
Cha
pter
6
of th
is r
epor
t.
213

214
215
REFERENCES
Aalto, P. (ed.), Lahti, M., Kosunen, P., Pere, T., Toropainen, V., Tarvainen, A-M., Pekkanen, J., Pöllänen, J. & Lamminmäki, T. 2011. Drilling and associated drillhole measurements of the pilot hole ONK-PH14. Posiva Working Report 2011-64. Eurajoki, Finland: Posiva Oy. 178 p.
Aaltonen, I. (ed.), Lahti, M., Engström, J., Mattila, J., Paananen, M., Paulamäki, S., Gehör, S., Kärki, A., Ahokas, T., Torvela, T. & Front, K. 2010. Geological Model of the Olkiluoto Site Version 2.0. Posiva Working Report 2010-70. Eurajoki, Finland: Posiva Oy. 580 p.
Anttila, P., Arenius, M., Haapala, K., Hansen, J., Hellä, P., Jalonen, T., Lahdenperä J., Lyytinen, T., Mellanen, S., Vuorio, P. & Äikäs, T. 2009. Testing and demonstrations in ONKALO - Aims and needs. Posiva Working Report 2009-24. Eurajoki, Finland: Posiva Oy. 107 p.
Antonelli, M. & Aydin, M. 1994. Effect of faulting on fluid flow in porous sandstones: petrophysical properties. Bulletin of the American Association of Petroleum Geologists. Vol. 78, p. 355–377.
Barnett, J. A. M., Mortimer, J., Rippon, J. H., Walsh, J. J. & Watterson, J. 1987. Displacement geometry in the volume containing a single normal fault. Bulletin of the American Association of Petroleum Geologists. Vol. 71, p. 925-937.
Barton, C. A., Zoback, M. D. & Moos, D., 1995. Fluid flow along potentially active faults in crystalline rock. Geology. Vol. 23, p. 683-686.
Bödvarsson, R., Lund, B., Roberts, R. & Slunga. R. 2006. Earthquake activity in Sweden. Study in connection with a proposed nuclear waste repository in Forsmark or Oskarshamn. SKB Report R-06-67. Stockholm, Sweden: Swedish Nuclear Fuel and Waste Management Co (SKB). 40 p.
Brace, W. F. 1980. Permeability of crystalline and argillaceous rocks. International Journal of Rock Mechanics and Mining Sciences. Vol. 17, p. 241–251.
Caine, J. S. & Forster, C. B. 1999. Fault zone architecture and fluid flow: Insights from field data and numerical modeling. In: Haneberg, W. C., Mozley, P. S., Moore, J. C. & Goodwin, L. B. (eds.). Faults and sub-surface fluid flow in the shallow crust. AGU Geophysical Monograph. Vol. 113, p. 101-127.
Caine, J. S., Evans, J. P. & Forster, C. B. 1996. Fault zone architecture and permeability structure. Geology. Vol. 24, p. 1025-1028.
Chester, F. M. & Logan, F. M. 1986. Implications for mechanical properties of brittle faults from observations of the Punchbowl fault, California. Pure and Applied Geophysics. Vol. 124, p. 79-106.
Cowie, P. A. & Scholz, C. H. 1992. Growth of faults by accumulation of seismic slip. Journal of Geophysical Research - Solid Earth. Vol. 97, p. 11085-11095.
216
Dixon, D., Keto, P., Sandén, T., Gunnarsson, D., Hansen, J. & Anttila, S. 2008a. Studies to quantify effects of water inflow rate on backfill behaviour. In: Steps Toward Reality for Safe Disposal. Proceedings of the 12th International High-Level Radiaoctive Waste Management Conference (IHLRWM), September 7-11, 2008, Las Vegas, Nevada. American Nuclear Society.
Dixon, D., Anttila, S., Viitanen, M. & Keto, P. 2008b. Tests to determine water uptake behaviour of tunnel backfill. SKB Report R-08-134. Stockholm, Sweden: Swedish Nuclear Fuel and Waste Management Co (SKB). 75 p.
Dixon, D., Lundin, C., Örtendahl, E., Hedin, M. & Ramqvist, G. 2008c. Deep repository – Engineered barrier system. Half scale tests to examine water uptake by bentonite pellets in a block-pellet backfill system. SKB Report R-08-132. Stockholm, Sweden: Swedish Nuclear Fuel and Waste Management Co (SKB). 73 p.
Dixon, D., Jonsson, E., Hansen, J., Hedin, M., Ramqvist, G. 2011. Effects of localized water uptake on backfill hydration and water movement within a backfilled tunnel. Half-scale tests at Äspö bentonite laboratory. SKB Report R-11-27. Stockholm, Sweden: Swedish Nuclear Fuel and Waste Management Co (SKB). 52 p.
Doblas, M. 1998. Slickenside kinematic indicators. Tectonophysics. Vol. 295, p. 187-197.
Engström, J. & Kemppainen, K. 2008. Evaluation of the geological and geotechnical mapping procedures in use in the ONKALO access tunnel. Posiva Working Report 2008-77. Eurajoki, Finland: Posiva Oy. 62 p.
Fälth, B., Hökmark, H. & Munier, R. 2010. Effects of large earthquakes on a KBS-3 repository. Evaluation of modelling results and their implications for layout and design. Updated 2011-10. SKB Technical Report TR-08-11. Stockholm, Sweden: Swedish Nuclear Fuel and Waste Management Co (SKB). 149 p.
Eilu, P., Ahtola, T., Äikäs, O., Halkoaho, T., Heikura, P., Hulkki, H., Iljina, M., Juopperi, H., Karinen, T., Kärkkäinen, N., Konnunaho, J., Kontinen, A., Kontoniemi, O., Korkiakoski, E., Korsakova, M., Kuivasaari, T., Kyläkoski, M., Makkonen, H., Niiranen, T., Nikander, J., Nykänen, V., Perdahl, J.-A., Pohjolainen, E., Räsänen, J., Sorjonen-Ward, P., Tiainen, M., Tontti, M., Torppa, A. & Västi, K. 2012. Metallogenic areas in Finland. Special Paper No. 53. Geological Survey of Finland, Espoo, Finland. P. 207-342.
Evans, J. P., Forster, G. B. & Goddard, J. V. 1997. Permeability of fault-related rocks, and implications for hydraulic structure of fault zones. Journal of Structural Geology. Vol. 19, No. 11, p. 1393-1404.
Fälth, B. & Hökmark, H. 2006. Seismically induced slip on rock fractures. Results from dynamic discrete fracture modeling. SKB Report R-06-48. Stockholm, Sweden: Swedish Nuclear Fuel and Waste Management Co (SKB). 50 p.
Fälth, B. & Hökmark, H. 2011. Modelling end-glacial earthquakes at Olkiluoto. Posiva Working Report 2011-13. Eurajoki, Finland: Posiva Oy. 74 p.
217
Faulkner, D. R, Lewis, E. H. & Lewis, A. C. 2003. On the internal structure and mechanics of large strike-slip fault zones: field observations of the Carboneras fault in southeastern Spain. Tectonophysics. Vol. 367, p. 235-251.
Faulkner, D. R. & Rutter, E. H. 2001. Can the maintenance of overpressured fluids in large strike-slip fault zones explain their apparent weakness? Geology. Vol. 29, p. 503-506.
Faulkner, D. R., Jackson, C. A. L., Lunn, R. J., Schlische, R. W., Shipton, Z. K., Wibberley, C. A. J. & Withjack, M. O. 2010. A review of recent developments concerning the structure, mechanics and fluid flow properties of fault zones. Journal of Structural Geology. Vol. 32, p. 1557-1575.
Fox, A., Forchhammer, K., Pettersson, A., La Pointe, P. & Lim, D.-H. 2012. Geological discrete fracture network model for the Olkiluoto site, Eurajoki, Finland, Version 2.0. Posiva Working Report 2012-27. Eurajoki, Finland: Posiva Oy. 346 p.
Hagros, A. 2006. Host Rock Classification (HRC) system for nuclear waste disposal in crystalline bedrock. Publications of the Department of Geology D8, University of Helsinki, Finland. 252 p.
Hagros, A., McEwen, T., Anttila, P. & Äikäs, K. 2005. Host Rock Classification phase 3: proposed classification system (HRC-system). Working Report 2005-07. Eurajoki, Finland: Posiva Oy. 180 p.
Hakanen, M., Ervanne, H. & Puukko, E. 2012. Far-field geochemical database for the Olkiluoto site. Radionuclide solubility limits and migration parameters. Posiva Report 2012-41. Eurajoki, Finland: Posiva Oy. (In prep.)
Hämäläinen, H. 2007. Hydraulic conductivity measurements with HTU at Eurajoki, Olkiluoto, Drillholes OL-KR28 and OL-KR39 in 2006. Posiva Working Report 2007-37. Eurajoki, Finland: Posiva Oy. 60 p.
Hansen, J., Korkiala-Tanttu, L., Keski-Kuha, E. & Keto, P. 2010. Deposition tunnel backfill design for a KBS-3V repository. Posiva Working Report 2009-129. Eurajoki, Finland: Posiva Oy. 108 p.
Hartley, L., Hoek, J., Swan, D. & Roberts, D. 2010. Hydrogeological discrete fracture network modelling of groundwater flow under open repository conditions. Posiva Working Report 2010-51. Eurajoki, Finland: Posiva Oy. 102 p.
Hatton, C. G., Main, I. G. & Meredith, P. G, 1994. Non-universal scaling of fracture length and opening displacement. Nature. Vol. 367, p. 160–162.
Heikkinen, E., Heinonen, S. & Ravimo, I. 2011. Semi-automated fracture classification procedure based on geophysical drillhole logging data. Posiva Working Report 2011-88. Eurajoki, Finland: Posiva Oy. 120 p.
Heikkinen, E. & Kantia, P. 2011. Suitability of ground penetrating radar for locating large fractures. Posiva Working Report 2011-92. Eurajoki, Finland: Posiva Oy. 64 p.
218
Hellä, P., Ahokas, H., Palmén, J. & Tammisto, E. 2006. Analysis of geohydrological data for design of KBS-3H repository layout. Posiva Working Report 2006-16. Eurajoki, Finland: Posiva Oy. 34 p. Hellä, P. (ed.), Ikonen, A., Mattila, J., Torvela, T. & Wikström, L. 2009. RSC-programme - Interim report. Approach and basis for RSC development, layout determining features and preliminary criteria for tunnel and deposition hole scale. Posiva Working Report 2009-29. Eurajoki, Finland: Posiva Oy. 118 p.
Hollmèn, K., Sievänen, U., Funehag, J., Granberg, N., Lyytinen, T., Syrjänen, P. & Säippä, J. 2012. Colloidal silica-grouting in demonstration tunnel 2 in ONKALO. Posiva Working Report 2012-84. Eurajoki, Finland: Posiva Oy. (In prep.).
Huitti, T., Hakanen, M. & Lindberg, A. 1998. Sorption of Cesium on Olkiluoto mica gneiss and granite. Posiva Report 1998-11. Eurajoki, Finland: Posiva Oy. 62 p.
Ikonen, K. & Raiko, H. 2012. Thermal dimensioning of Olkiluoto repository for spent fuel. Posiva Working Report 2012-56. Eurajoki, Finland: Posiva Oy. (In prep.).
Johnston, A. C. 1987. Suppression of earthquakes by large continental ice sheets. Nature. Vol 303, p 467–469.
Joutsen, A. 2012. The use of geological data from pilot holes for predicting FPI (full perimeter intersection) fractures. Posiva Working Report 2012-12. Eurajoki, Finland: Posiva Oy. 52 p.
Kärki, A. & Paulamäki, S. 2006. Petrology of Olkiluoto. Posiva Report 2006-02. Eurajoki, Finland: Posiva Oy. 77 p.
Kim, Y.-S., Peacock, D. C. P. & Sanderson, D. J., 2004. Fault damage zones. Journal of Structural Geology. Vol. 26, p. 503-517.
Kim, Y.-S., Sanderson, D. J. 2005 The relationship between displacement and length of faults: a review. Earth-Science Reviews. Vol. 68, p. 317–334.
Kirkkomäki, T. 2006. Design and stepwise implementation of the final repository (in Finnish). Posiva Working Report 2006-92. Eurajoki, Finland: Posiva Oy. 57 p.
Kosunen, P., Käpyaho, A. & Pere, T. 2012. Test use of the RSC-I criteria - Application to pilot hole ONK-PH10 and the respective section of the ONKALO access tunnel (chainage 3459-3639). Posiva Working Report 2012-19. Eurajoki, Finland: Posiva Oy. 54 p.
Kuva, J. (ed.), Myllys, M., Timonen, J., Kelokaski, M., Ikonen, J., Siitari-Kauppi, M., Lindberg, A. & Aaltonen, I. 2012. Microstructure, porosity and mineralogy around fractures in Olkiluoto bedrock. Posiva Report 2012-02. Eurajoki, Finland: Posiva Oy. 114 p.
Kyllönen, J., Hakanen, M. & Lindberg, A. 2008. Sorption of cesium on Olkiluoto mica gneiss and granodiorite in saline groundwater: Retardation of cesium transport in rock fracture columns. Posiva Working Report 2008-62. Eurajoki, Finland: Posiva Oy. 47 p.
219
Lahti, M. (ed.), Ahokas, T., Nordbäck, N., Paananen, M., Paulamäki, S. & Vaittinen, T. 2009. The ONKALO area model vs. 1.1. Posiva Working Report 2009-113. Eurajoki, Finland: Posiva Oy. 130 p.
Lampinen, H. 2007. Terminology Report. Respect Distance. The use of the term Respect Distance in Posiva and SKB. Posiva Working Report 2007-69. Eurajoki, Finland: Posiva Oy. 83 p.
Lampinen, H. 2008. Test use of the Host Rock Classification (HRC) in the tunnel scale: performed in the ONKALO access tunnel sections covered by pilot holes ONK-PH2, ONK-PH3, ONK-PH4 and ONK-PH5. Posiva Working Report 2008-15. Eurajoki, Finland: Posiva Oy. 106 p.
Löfman, J. & Poteri, A., 2008. Groundwater flow and transport simulations in support of RNT-2008 analysis. Posiva Working Report 2008-52. Eurajoki, Finland: Posiva Oy. 100p.
Mancini, P., Karttunen, P., Lokkila, M. (eds.), Lamminmäki, T., Pekkanen, J., Pöllänen, J., Tarvainen, A-M., Toropainen, V., Kosunen, P. & Pere, T. 2010. Drilling and associated drillhole measurements of the pilot hole ONK-PH10. Posiva Working Report 2010-21. Eurajoki, Finland: Posiva Oy. 176 p.
Mattila, J. (ed.), Aaltonen, I., Kemppainen, K., Wikström, L., Paananen, M., Paulamäki, S., Front, K., Gehör, S., Kärki, A. & Ahokas, T. 2008. Geological Model of the Olkiluoto Site, Version 1.0. Posiva Working Report 2007-92. Eurajoki, Finland: Posiva Oy. 510 p.
McEwen, T. J. & Äikäs, T. 2000. The site selection processes for a spent fuel repository in Finland – Summary Report. Posiva Report 2000-15. Eurajoki, Finland: Posiva Oy. 231 p.
Mellanen, S. (ed.), Aro, S., Gerlander, J., Hollmén, K., Joutsen, A., Kosunen, P., Mustonen, S. 2012. Underground Openings Line demonstrations Stage 1, 2012. Posiva Report 2012-33. Eurajoki, Finland: Posiva Oy. (In prep.).
Mitchell, T. M. & Faulkner, D. R., 2009. The nature and origin of off-fault damage surrounding strike-slip fault zones over a wide range of scales: A field study from the Atacama fault zone, northern Chile. Journal of Structural Geology. Vol. 31, No.8, p. 802-816.
Munier, R. 2006. Using observations in deposition tunnels to avoid intersections with critical fractures in deposition holes. SKB Report R-06-54. Stockholm, Sweden: Swedish Nuclear Fuel and Waste Management Co (SKB). 39 p.
Munier, R. 2007. Demonstrating the efficiency of the EFPC criterion by means of Sensitivity analyses. SKB Report R-06-115. Stockholm, Sweden: Swedish Nuclear Fuel and Waste Management Co (SKB). 27 p.
Munier, R. 2010. Full perimeter intersection criteria. Definitions and implementations in SR-Site. SKB Technical Report TR-10-21. Stockholm, Sweden: Swedish Nuclear Fuel and Waste Management Co (SKB). 89 p.
220
Munier, R. & Hökmark, H. 2004. Respect distances. Rationale and means of computation. SKB Report R-04-17. Stockholm, Sweden: Swedish Nuclear Fuel and Waste Management Co (SKB). 60 p.
Munier, R, Sandstedt, H & Niland, L. 1997. Förslag till principiella utformningar av förvar enligt KBS-3 för Aberg, Beberg och Ceberg. (in Swedish). SKB Report R-97-09. Stockholm, Sweden: Swedish Nuclear Fuel and Waste Management Co (SKB). 74 p.
Nykyri, M., Nordman, H., Marcos, N., Löfman, J., Poteri, A. & Hautojärvi, A. 2008. Radionuclide release and transport – RNT-2008. Posiva Report 2008-06. Eurajoki, Finland: Posiva Oy. 170 p.
Pere, T. 2009. Fault-related local phenomena in the bedrock of Olkiluoto, with particular reference to fault zone OL-BFZ100. Posiva Working Report 2009-125. Eurajoki, Finland: Posiva Oy. 98 p.
Pere, T. (ed), Ahokas, H., Aro, S., Mattila, J., Vaittinen, T., Wikström, L. 2012. Layout determining features, their influence zones and respect distances at the Olkiluoto site. Posiva Report 2012-21. Eurajoki, Finland: Posiva Oy. 128 p.
Petit J. P. 1987. Criteria for the sense of movement on fault surfaces in brittle rocks. Journal of Structural Geology. Vol. 9, No 5-6, p. 597–608.
Pinnioja, S., Jaakkola, T., Kämäräinen, E.-L., Koskinen, A., Lindberg, A. 1984. Sorption of carbon, cobalt, nickel, strontium, iodine, cesium, americium and neptunium in rocks and minerals. Report YJT-84-19. Nuclear Waste Commission of Finnish Power Companies, Helsinki, Finland. 31 p.
Pöllänen, J. 2009. Difference flow and electrical conductivity measurements at the Olkiluoto Site in Eurajoki, drillholes OL-KR44, OL-KR44B, OL-KR45, OL-KR45B, OL-KR46, OL-KR47 and OL-KR48. Posiva Working Report 2009-81. Eurajoki, Finland: Posiva Oy. 366 p.
Posiva 2009. TKS-2009. Nuclear waste management of the Olkiluoto and Loviisa power plants – Programme for research, development and technical design for 2010 - 2012. Report TKS-2009. Eurajoki, Finland: Posiva Oy. 532 p.
Posiva 2012. Olkiluoto site description 2011. Posiva Report 2011-01. Eurajoki, Finland: Posiva Oy. (In prep.).
Posiva 2012a. Safety case for the disposal of spent nuclear fuel at Olkiluoto - Formulation of Radionuclide Release Scenarios 2012. Posiva Report 2012-08. Eurajoki, Finland: Posiva Oy. (In prep.).
Posiva 2012b. Safety case for the disposal of spent nuclear fuel at Olkiluoto - Assessment of Radionuclide Release Scenarios for the Repository System 2012. Posiva Report 2012-09. Eurajoki, Finland: Posiva Oy. (In prep.).
Posiva 2012c. Safety case for the disposal of spent nuclear fuel at Olkiluoto - Performance Assessment 2012. Posiva Report 2012-04. Eurajoki, Finland: Posiva Oy. (In prep.).

221
Posiva 2012d. Safety case for the disposal of spent nuclear fuel at Olkiluoto - Description of the Disposal System 2012. Posiva Report 2012-05. Eurajoki, Finland: Posiva Oy. (In prep.).
Posiva 2012e. Safety case for the disposal of spent nuclear fuel at Olkiluoto - Design Basis 2012. Posiva Report 2012-03. Eurajoki, Finland: Posiva Oy. (In prep.).
Posiva 2012f. Underground Openings Production Line 2012 - Design, production and initial state of the underground openings. Posiva Report 2012-22. Eurajoki, Finland: Posiva Oy. (In prep.).
Posiva 2012g. Safety case for the disposal of spent nuclear fuel at Olkiluoto - Features, Events and Processes 2012. Posiva Report 2012-07. Eurajoki, Finland: Posiva Oy. (In prep.).
Posiva 2012h. YJH-2012 - Nuclear waste management at Olkiluoto and Loviisa power plants: Review of current status and future plans for 2013-2015 (in Finnish). Eurajoki, Finland: Posiva Oy. 368 p.
Posiva 2012i. Safety case for the disposal of spent nuclear fuel at Olkiluoto - Complementary considerations 2012. Posiva Report 2012-11. Eurajoki, Finland: Posiva Oy. (In prep.).
Saari, J., 1998. Regional and local seismotectonic characteristics of the area surrounding Loviisa nuclear power plant in SE Finland. Report 1998. Institute of Seismology, University of Helsinki, Helsinki, Finland. 248 p.
Saari, J. 2008. Seismicity in the Olkiluoto Area. Posiva Report 2008-04. Eurajoki, Finland: Posiva Oy. 55 p.
Saari, J. 2012. Seismic activity parameters of the Olkiluoto Site. Posiva Report 2012-34. Eurajoki, Finland: Posiva Oy. (In prep.).
Scholz, C. H. 2002. The mechanics of earthquakes and faulting. Cambrige, United Kingdom: Cambridge University Press. 471 p.
Sibson, R. H. 1977. Fault rocks and fault mechanisms. Journal of the Geological Society. Vol. 133, p. 191-213.
Sireni, S. 2011. Applicability of reflection seismic measurements in detailed characterisation of crystalline bedrock. Posiva Working Report 2011-24. Eurajoki, Finland: Posiva Oy. 127 p.
Sireni, S. (ed.), Ahokas, T. & Paananen, M. 2011. Suitability of seismic investigations for detailed characterisation of Olkiluoto bedrock. Posiva Working Report 2011-91. Eurajoki, Finland: Posiva Oy. 210 p.
SKB, 2011. Long-term safety for the final repository for spent nuclear fuel at Forsmark. Main report of the SR-Site project. SKB Technical Report TR-11-1. Stockholm, Sweden: Swedish Nuclear Fuel and Waste Management Co (SKB). 870 p.

222
Talbot, C. J. & Slunga, R. 1989. Patterns of active shear in Fennoscandia. In: Gregersen, S. & Basham, P.W. (eds.). Earthquakes at North-Atlantic passive margins: Neotectonics and postglacial rebound. Amsterdam, Netherlands: Kluer Academic Publishers. P. 441 - 466.
Tanskanen, J. 2007. Facility Description 2006. Posiva Working Report 2007-21. Eurajoki, Finland: Posiva Oy. 147 p.
Tanskanen, J., 2009. Laitoskuvaus 2009, loppusijoitussuunnitelmien yhteenvetoraportti (in Finnish). Posiva Working Report 2009-123. Eurajoki, Finland: Posiva Oy. 164 p.
Vaittinen, T., Ahokas, H. & Nummela, J. 2009. Hydrogeological structure model of the Olkiluoto Site – update in 2008. Posiva Working Report 2009-15. Eurajoki, Finland: Posiva Oy. 276 p.
Vaittinen, T., Ahokas, H., Nummela, J. & Paulamäki, S. 2011. Hydrogeological Structure Model of the Olkiluoto Site - Update in 2010. Posiva Working Report 2011-65. Eurajoki, Finland: Posiva Oy. 330 p.
Wells, D. L. & Coppersmith, K. J. 1994. New empirical relationships among magnitude, rupture length, rupture width, rupture are, and surface displacement. Bulletin of the Seismological Society of America. Vol. 84, p. 974-1002.
LIST OF REPORTS
POSIVA-REPORTS 2012
_______________________________________________________________________________________
POSIVA 2012-01 Monitoring at Olkiluoto – a Programme for the Period Before Repository Operation Posiva Oy ISBN 978-951-652-182-7 POSIVA 2012-02 Microstructure, Porosity and Mineralogy Around Fractures in Olkiluoto
Bedrock Jukka Kuva (ed.), Markko Myllys, Jussi Timonen, University of Jyväskylä Maarit Kelokaski, Marja Siitari-Kauppi, Jussi Ikonen, University of Helsinki Antero Lindberg, Geological Survey of Finland Ismo Aaltonen, Posiva Oy ISBN 978-951-652-183-4
POSIVA 2012-03 Safety Case for the Disposal of Spent Nuclear Fuel at Olkiluoto - Design Basis 2012 ISBN 978-951-652-184-1 POSIVA 2012-04 Safety Case for the Disposal of Spent Nuclear Fuel at Olkiluoto - Performance Assessment 2012 ISBN 978-951-652-185-8 POSIVA 2012-05 Safety Case for the Disposal of Spent Nuclear Fuel at Olkiluoto - Description of the Disposal System 2012 ISBN 978-951-652-186-5 POSIVA 2012-06 Olkiluoto Biosphere Description 2012 ISBN 978-951-652-187-2 POSIVA 2012-07 Safety Case for the Disposal of Spent Nuclear Fuel at Olkiluoto - Features, Events and Processes 2012 ISBN 978-951-652-188-9 POSIVA 2012-08 Safety Case for the Disposal of Spent Nuclear Fuel at Olkiluoto - Formulation of Radionuclide Release Scenarios 2012 ISBN 978-951-652-189-6 POSIVA 2012-09 Safety Case for the Disposal of Spent Nuclear Fuel at Olkiluoto - Assessment of Radionuclide Release Scenarios for the Repository System 2012 ISBN 978-951-652-190-2

POSIVA 2012-10 Safety case for the Spent Nuclear Fuel Disposal at Olkiluoto - Biosphere Assessment BSA-2012 ISBN 978-951-652-191-9 POSIVA 2012-11 Safety Case for the Disposal of Spent Nuclear Fuel at Olkiluoto - Complementary Considerations 2012 Posiva Oy ISBN 978-951-652-192-6 POSIVA 2012-12 Safety Case for the Disposal of Spent Nuclear Fuel at Olkiluoto - Synthesis 2012 ISBN 978-951-652-193-3 POSIVA 2012-13 Canister Design 2012 Heikki Raiko, VTT ISBN 978-951-652-194-0 POSIVA 2012-14 Buffer Design 2012 Markku Juvankoski ISBN 978-951-652-195-7 POSIVA 2012-15 Backfill Design 2012 ISBN 978-951-652-196-4 POSIVA 2012-16 Canister Production Line 2012 – Design, Production and Initial State of the Canister Heikki Raiko (ed.), VTT Barbara Pastina, Saanio & Riekkola Oy Tiina Jalonen, Leena Nolvi, Jorma Pitkänen & Timo Salonen, Posiva Oy ISBN 978-951-652-197-1 POSIVA 2012-17 Buffer Production Line 2012 – Design, Production, and Initial State of the Buffer Markku Juvankoski, Kari Ikonen, VTT Tiina Jalonen, Posiva Oy ISBN 978-951-652-198-8 POSIVA 2012-18 Backfill Production Line 2012 - Design, Production and Initial State of the Deposition Tunnel Backfill and Plug ISBN 978-951-652-199-5 POSIVA 2012-19 Closure Production Line 2012 - Design, Production and Initial State of Underground Disposal Facility Closure ISBN 978-951-652-200-8

POSIVA 2012-20 Representing Solute Transport Through the Multi-Barrier Disposal System by Simplified Concepts Antti Poteri. Henrik Nordman, Veli-Matti Pulkkanen, VTT Aimo Hautojärvi, Posiva Oy Pekka Kekäläinen, University of Jyväskylä, Deparment of Physics ISBN 978-951-652-201-5 POSIVA 2012-21 Layout Determining Features, their Influence Zones and Respect Distances at the Olkiluoto Site Tuomas Pere (ed.), Susanna Aro, Jussi Mattila, Posiva Oy Henry Ahokas & Tiina Vaittinen, Pöyry Finland Oy Liisa Wikström, Svensk Kärnbränslehantering AB ISBN 978-951-652-202-2 POSIVA 2012-22 Underground Openings Production Line 2012- Design, Production and Initial State of the Underground Openings ISBN 978-951-652-203-9 POSIVA 2012-23 Site Engineering Report ISBN 978-951-652-204-6 POSIVA 2012-24 Rock Suitability Classification, RSC-2012 Tim McEwen (ed.), McEwen Consulting Susanna Aro, Paula Kosunen, Jussi Mattila, Tuomas Pere, Posiva Oy Asko Käpyaho, Geological Survey of Finland Pirjo Hellä, Saanio & Riekkola Oy ISBN 978-951-652-205-3
Related Documents