THE RELATION BETWEEN THE BHATIA PATTERNS TEST, PORTEUS MAZE TEST, GRADE SCORES AND A GROUP MEASURE OF ACHIEVEMENT by RONALD EDWIN FROST B.A., University of British Columbia, 1957 A THESIS SUBMITTED IN PARTIAL FULFILMENT OF THE REQUIREMENTS FOR THE DEGREE OF Master of Arts in the Department of Psychology We accept this thesis as conforming to the required standard THE UNIVERSITY OF BRITISH COLUMBIA April, 1959

Welcome message from author
This document is posted to help you gain knowledge. Please leave a comment to let me know what you think about it! Share it to your friends and learn new things together.
Transcript
THE RELATION BETWEEN THE BHATIA PATTERNS TEST, PORTEUS MAZE TEST, GRADE SCORES AND
A GROUP MEASURE OF ACHIEVEMENT by
RONALD EDWIN FROST B.A., University of British Columbia, 1957
A THESIS SUBMITTED IN PARTIAL FULFILMENT OF THE REQUIREMENTS FOR THE DEGREE OF
Master of Arts i n the Department
of Psychology
We accept this thesis as conforming to the required standard
THE UNIVERSITY OF BRITISH COLUMBIA A p r i l , 1959
i i i THE RELATION BETWEEN THE BHATIA PATTERNS TEST,
PORTEUS MAZE TEST, GRADE SCORES AND A GROUP MEASURE OF ACHIEVEMENT
Abstract
The purpose of this study was to explore some of the pos s i b i l i t i e s of a promising new culture-free, i n dividual performance test of intelligence. This test, the Bhatia Patterns Test, was originally designed for a test battery that was used on Indian school children. The problem of this study was to determine i f the Patterns Test had any value i n a North American setting. One hundred and sixty-five pupils were tested with the Bhatia Patterns Test and the Porteus Maze Test. In addition, the I.Q. scores of the California Short Form Test of Mental Maturity, the scores of the Stanford Achievement Intermediate Battery (Form K) and the grade scores of the pupils were collected. More specifically, this study wished to ascertain whether there were any differences between sexes with the Patterns Test, whether the Patterns Test and the Maze Test correlated significantly, whether the Patterns Test was related to a standardized group achievement measure, and whether the Patterns Test was related to the pupils* grade scores.
One hundred and sixty-five school pupils were chosen at random from grades four, five and six from five
iv
Vancouver elementary schools. The subjects were given the Patterns Test and the Maze Test in a counterbalanced design to determine whether either of the tests had an effect upon each other. The counterbalanced design was analyzed by a two by two l a t i n square. In addition, a l l the scores were correlated with each other to determine what relationships existed between the various measures.
It was concluded that there were no sex d i f ferences among the scores of the subjects. The Bhatia Patterns Test and the Porteus Maze Test did not correlate significantly. The Patterns Test correlated higher with a standardized achievement test than did a group measure of intelligence. The Patterns Test did not correlate significantly with the pupils 1 grade scores.
In p r e s e n t i n g t h i s t h e s i s i n p a r t i a l f u l f i l m e n t o f
the requirements f o r an advanced degree at the U n i v e r s i t y
o f B r i t i s h Columbia, I agree t h a t the L i b r a r y s h a l l make
i t f r e e l y a v a i l a b l e f o r r e f e r e n c e and study. I f u r t h e r
agree t h a t permission f o r e xtensive copying of t h i s t h e s i s
f o r s c h o l a r l y purposes may be granted by the Head o f my
Department or by h i s r e p r e s e n t a t i v e s . I t i s understood
t h a t copying or p u b l i c a t i o n of t h i s t h e s i s f o r f i n a n c i a l
g a i n s h a l l not be allowed without my w r i t t e n p e r m i s s i o n .
Department of Psychology
The U n i v e r s i t y of B r i t i s h Columbia, Vancouver 8, Canada.
Date April 13, 1959
i i
A CKNOWLED GEMENT
The writer wishes to express his indebtedness to Dr. R.F. Sharp, Superintendent of Schools, Dr. S.A. Mil l e r , Director of Research and Special Services and Dr. E.N. E l l i s , Assistant i n Research and Testing in arranging for the av a i l a b i l i t y of schools and subjects in the Vancouver School D i s t r i c t . Profound thanks are due to the principals and staffs of the schools for their sincere ec—operation toward this study. Finall y , the writer is extremely grateful to his advisor, Dr. D.T. Kenny, for his helpful criticism and general guidance throughout the course of this thesis.
V
CONTENTS
Chapter page
Abstract i i i I Introduction and the Statement of the
Problem 1
II Procedure 8
III The Results and Their S t a t i s t i c a l Treatment 11
IV Discussion 16
V Summary and Conclusions 20
References 23
Appendix A 24 Instructions for the Bhatia Patterns Test
Appendix B 2? The Eight Patterns of the Bhatia Patterns Test
Appendix C 32
Means and Standard Deviations of the Bhatia Patterns Test and the Porteus Maze Test for Schools and Sex
Appendix D 35
Two By Two Latin Square Analysis of Variance for the Patterns Test and the Maze Test
vi
TABLES
Table
1
Appendix Table
2
3
Product-Moment Correlations Between the Bhatia Test, Porteus Test, CSFTMM, SAIB and Grade Scores
Means and Standard Deviations of the Bhatia Patterns Test for Schools and Sex
Means and Standard Deviations of the Porteus Maze Test for Schools and Sex
Two by Two L a t i n Square Analysis of Variance for the Patterns Test and the Maze Test
page
1 3
3 3
3 *
3 6
CHAPTER I INTRODUCTION AND THE STATEMENT OF THE PROBLEM
While the need for performance scales as a measure of intelligence has long been recognized and though their application to c l i n i c a l cases has been extensive, comparatively l i t t l e exploratory research has been conducted on the development and evaluation of new performance tasks. The major research trend with performance tests has been to combine existing single tests into a battery and to standardize the battery on a new sample. As Cronbach (1949»p.l6l) has so cogently expressed, "a limited number of tasks have been used repeatedly i n different scales, with or without adaptation."
CM. Bhatia (1955) devised a new test to serve as part of a test battery for testing school children i n India. This new test, the Pattern-Drawing Test or Patterns Test, appeared to show some promise in the f i e l d of mental measurement. Bhatia (1955) suggested that the Patterns Test could be u t i l i z e d as a culture-free test since only the verbal instructions (see Appendix A) needed to be translated into the parent language of the subject.
The Bhatia Patterns Test i s an individual test where the subject i s shown a pattern (see Appendix B) on a card. The subject Is then asked to draw the pattern on a blank sheet of paper without l i f t i n g his pencil from
2 the paper and without repeating any l i n e he has. drawn.
The patterns are given to the subject i n an order of i n
creasing d i f f i c u l t y . The test i s scored on a time basis
with a time l i m i t which varies with the d i f f e r e n t patterns.
The test i s stopped when any two patterns are f a i l e d i n
succession.
The desirable features of the Patterns Test are
many. I t involves l i t t l e i n the way of s p e c i a l equipment
and i t i s e a s i l y administered and scored. Construction
of a comparable form would pose l i t t l e d i f f i c u l t y and the
test can be e a s i l y extended to more d i f f i c u l t l e v e l s . A
p a r t i c u l a r l y strong point i s the l a t t e r . In addition, the
Patterns Test should prove useful to the c l i n i c i a n since
i t i s I n d i v i d u a l l y administered and i t allows the subject
to be observed while the subject i s attempting to produce
a pattern.
The problem i n t h i s present study was to explore
some of the p o s s i b i l i t i e s of the Bhatia Patterns Test.
Bhatia devised his Patterns Test for use on school children
and he suggested that the test was a culture-free t e s t .
Therefore, a number of elementary school children were
tested with the Patterns Test and the r e s u l t s were re l a t e d
to various other measures to determine whether the Bhatia
test had any value i n a North American s e t t i n g .
Bhatia rs examiners found they had to exercise
caution when children were tested i n India. The inhabitants
3
of the villages were reluctant to allow a child to be tested by some stranger. The examiners usually tested the subjects outdoors i n such a position that every move was viewed by the elders. In this way the examiners showed the villagers that no harm came to the child. As a result of the extreme conditions under which the Indian examiners gathered their data, i t was Impossible to collect Patterns Test scores upon other than male subjects. No data have been forthcoming upon the use of the Patterns Test with female subjects. In this present study 87 male and 78 female subjects were chosen to determine i f there were any sex differences within the test. Therefore, the f i r s t hypothesis of this study was? the Bhatia Patterns Test w i l l be equally satisfactory for female subjects as for male subjects.
The Patterns Test showed a high factor loading on a general factor of intelligence (.65) that Bhatia obtained in a factor analysis of a battery of intelligence measures. The Stanford-Binet (Form L) also correlated highly (.61) with this f i r s t order factor. The correlation between the Stanford-Binet (Form L) mental age and the Patterns Test was ,k6 when the effects of chronological age were held constant by partial correlation.
The Indian test battery was entirely devised by Bhatia with the exception of two of the subtests, the Alexander Passalong Test and the Kohs Block Design Test. These two subtests were used in a slightly modified form.
The Patterns Test correlated well (r = .53) with the Block Design Test. The co r r e l a t i o n between the Patterns Test and the Passalong Test was s l i g h t l y lower (r = .43).
Bhatia stated (1955»p.24) that his test contained a s p a t i a l factor or k component. Al s o , the Patterns Test appeared to require some planning a b i l i t y i n order to be completed s a t i s f a c t o r i l y . Porteus (1950)
purported to measure planning a b i l i t y with his Maze Test and the Maze Test appeared to contain a s p a t i a l f a c t o r . In a d d i t i o n , Porteus stated that his Maze Test could be cal l e d a test of i n t e l l i g e n c e (1950,p.12). He ci t e d numerous studies that have found a re l a t i o n s h i p between the Maze Test and other measures of i n t e l l i g e n c e . l o u t -t i t and Stackman (1936) summarized many previous studies to show a substantial r e l a t i o n s h i p between the Maze Test and the Binet Test. In t h i s present study a number of subjects were given both the Patterns Test and the Maze Test to determine i f there was a common element within the two t e s t s . Therefore, the second hypothesis i n t h i s study was: the Bhatia Patterns Test w i l l correlate s i g n i f i c a n t l y with the Porteus Maze Test*
The Porteus Maze Test i s an i n d i v i d u a l test where the subject i s shown a maze on a paper. The subject i s then asked to take a p e n c i l and trace h i s way out of the maze without l i f t i n g his p e n c i l from the paper and
without crossing any l i n e of the maze. The mazes are
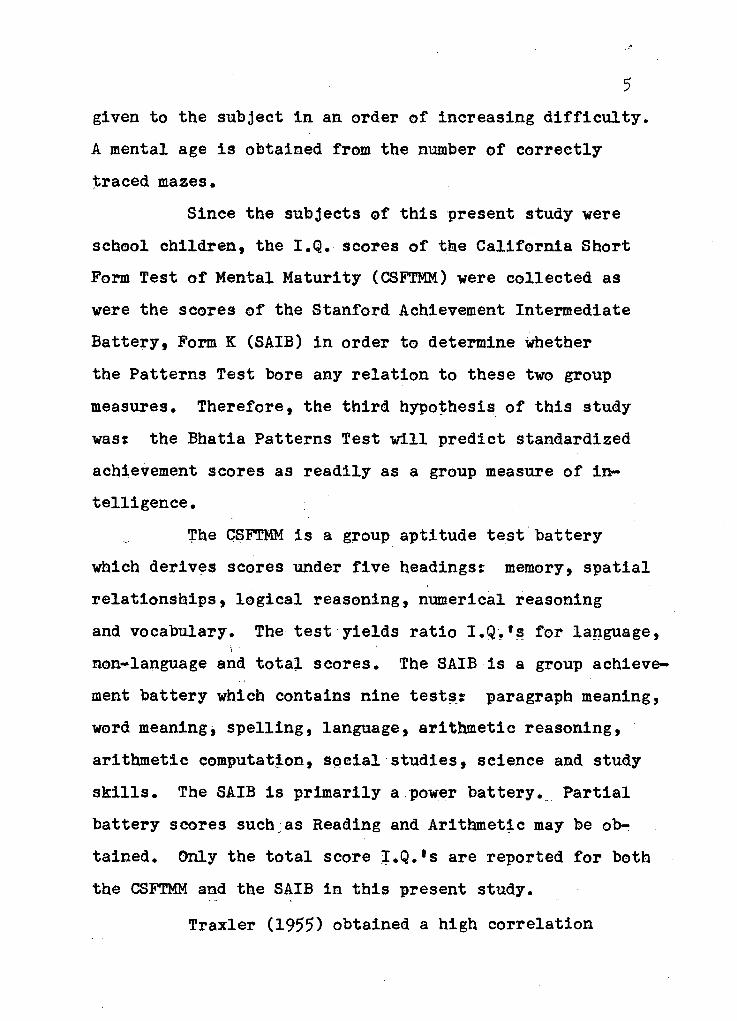
5 given to the subject i n an order of increasing d i f f i c u l t y . A mental age is obtained from the number of correctly traced mazes.
Since the subjects of this present study were school children, the I.Q. scores of the California Short Form Test of Mental Maturity (CSFTMM) were collected as were the scores of the Stanford Achievement Intermediate Battery, Form K (SAIB) i n order to determine whether the Patterns Test bore any relation to these two group measures. Therefore, the third hypothesis of this study wass the Bhatia Patterns Test w i l l predict standardized achievement scores as readily as a group measure of in telligence.
The CSFTMM i s a group aptitude test battery which derives scores under five headingst memory, spatial relationships, logical reasoning, numerical reasoning and vocabulary. The test yields ratio I.Q. 's for language, non-language and total scores. The SAIB is a group achievement battery which contains nine tests* paragraph meaning, word meaning, spelling, language, arithmetic reasoning, arithmetic computation, social studies, science and study s k i l l s . The SAIB is primarily a power battery. Partial battery scores such as Reading and Arithmetic may be obtained. Only the total score I.Q.'s are reported for both the CSFTMM and the SAIB in this present study.
Traxler (1955) obtained a high correlation
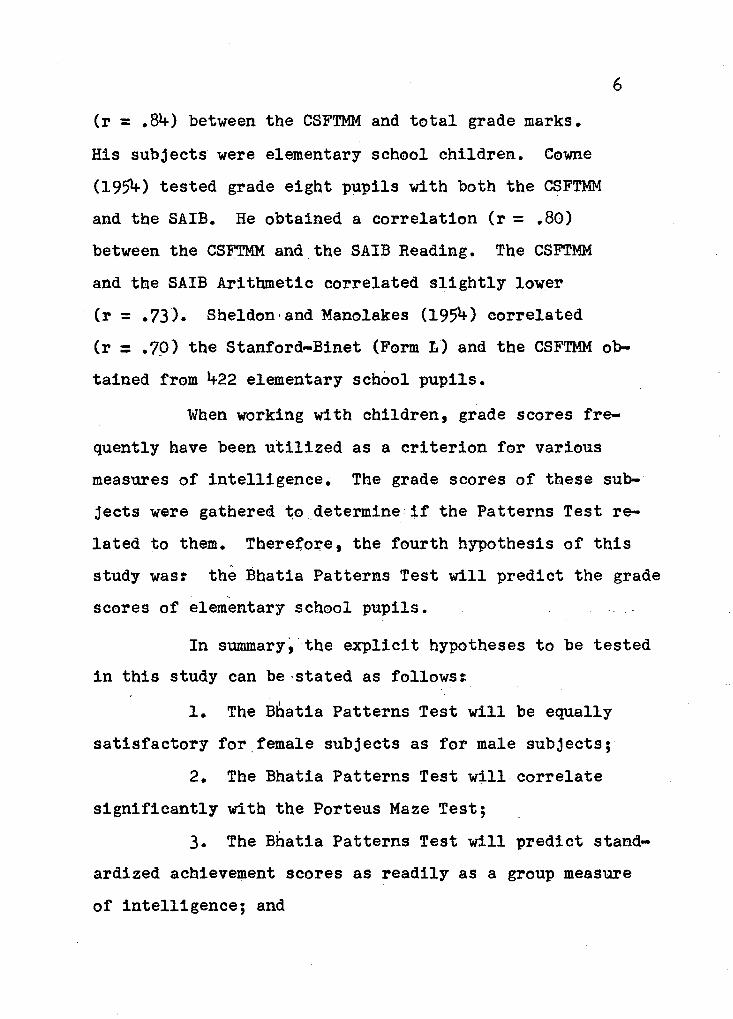
6 (r = .84) between the CSFTMM and t o t a l grade marks.
His subjects were elementary school children. Cowne
(1954) tested grade eight pupils with both the CSFTMM
and the SAIB. He obtained a c o r r e l a t i o n (r = .80)
between the CSFTMM and the SAIB Reading. The CSFTMM
and the SAIB Arithmetic correlated s l i g h t l y lower
(r = . 7 3 ) . Sheldon'and Manolakes (1954) correlated
(r = . 7 0 ) the Stanford-Binet (Form L) and the CSFTMM ob
tained from 422 elementary school p u p i l s .
When working with children, grade scores f r e
quently have been u t i l i z e d as a c r i t e r i o n for various
measures of i n t e l l i g e n c e . The grade scores of these sub
jects were gathered to determine i f the Patterns Test re
la t e d to them. Therefore, the fourth hypothesis of t h i s
study wast the Bhatia Patterns Test w i l l predict the grade
scores of elementary school pupils.
In summary, the e x p l i c i t hypotheses to be tested
i n t h i s study can be stated as follows?
1. The Bhatia Patterns Test w i l l be equally
s a t i s f a c t o r y for female subjects as for male subjects;
2. The Bhatia Patterns Test w i l l correlate
s i g n i f i c a n t l y with the Porteus Maze Test;
3 . The Bhatia Patterns Test w i l l predict stand
ardized achievement scores as r e a d i l y as a group measure
of i n t e l l i g e n c e ; and
7
h. The B h a t i a P a t t e r n s T e s t w i l l p r e d i c t t h e
grade s c o r e s o f e lementary s c h o o l p u p i l s .
8
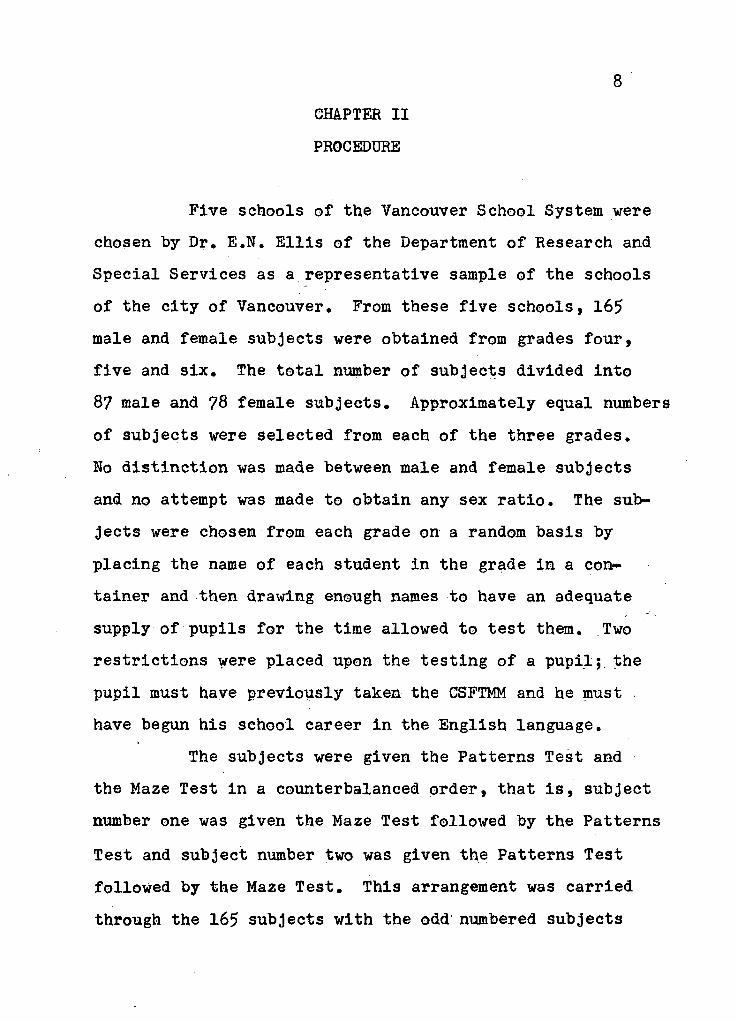
CHAPTER II PROCEDURE
Five schools of the Vancouver School System were chosen by Dr. E.N. E l l i s of the Department of Research and Special Services as a representative sample of the schools of the city of Vancouver. From these five schools, 165
male and female subjects were obtained from grades four, five and six. The total number of subjects divided into 87 male and 78 female subjects. Approximately equal numbers of subjects were selected from each of the three grades. No distinction was made between male and female subjects and no attempt was made to obtain any sex ratio. The subjects were chosen from each grade on a random basis by placing the name of each student in the grade in a container and then drawing enough names to have an adequate supply of pupils for the time allowed to test them. Two restrictions were placed upon the testing of a pupil; the pupil must have previously taken the CSFTMM and he must have begun his school career i n the English language.
The subjects were given the Patterns Test and the Maze Test in a counterbalanced order, that i s , subjeet number one was given the Maze Test followed by the Patterns Test and subject number two was given the Patterns Test followed by the Maze Test. This arrangement was carried through the 165 subjects with the odd numbered subjects
9
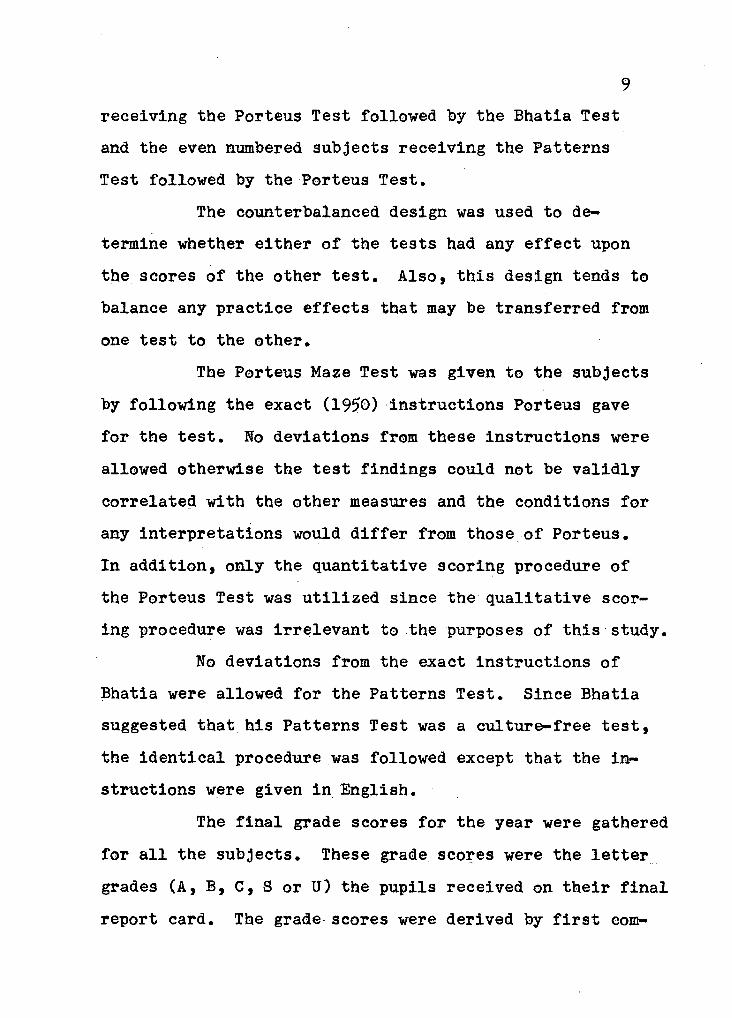
receiving the Porteus Test followed by the Bhatia Test and the even numbered subjects receiving the Patterns Test followed by the Porteus Test.
The counterbalanced design was used to determine whether either of the tests had any effect upon the scores of the other test. Also, this design tends to balance any practice effects that may be transferred from one test to the other.
The Porteus Maze Test was given to the subjects by following the exact (1950) instructions Porteus gave for the test. No deviations from these instructions were allowed otherwise the test findings could not be validly correlated with the other measures and the conditions for any interpretations would differ from those of Porteus. In addition, only the quantitative scoring procedure of the Porteus Test was u t i l i z e d since the qualitative scoring procedure was irrelevant to the purposes of this study.
No deviations from the exact instructions of Bhatia were allowed for the Patterns Test. Since Bhatia suggested that his Patterns Test was a culture-free test, the identical procedure was followed except that the i n structions were given i n English.
The f i n a l grade scores for the year were gathered for a l l the subjects. These grade scores were the letter grades (A, B, C, S or U) the pupils received on their f i n a l report card. The grade scores were derived by f i r s t com-
1 0
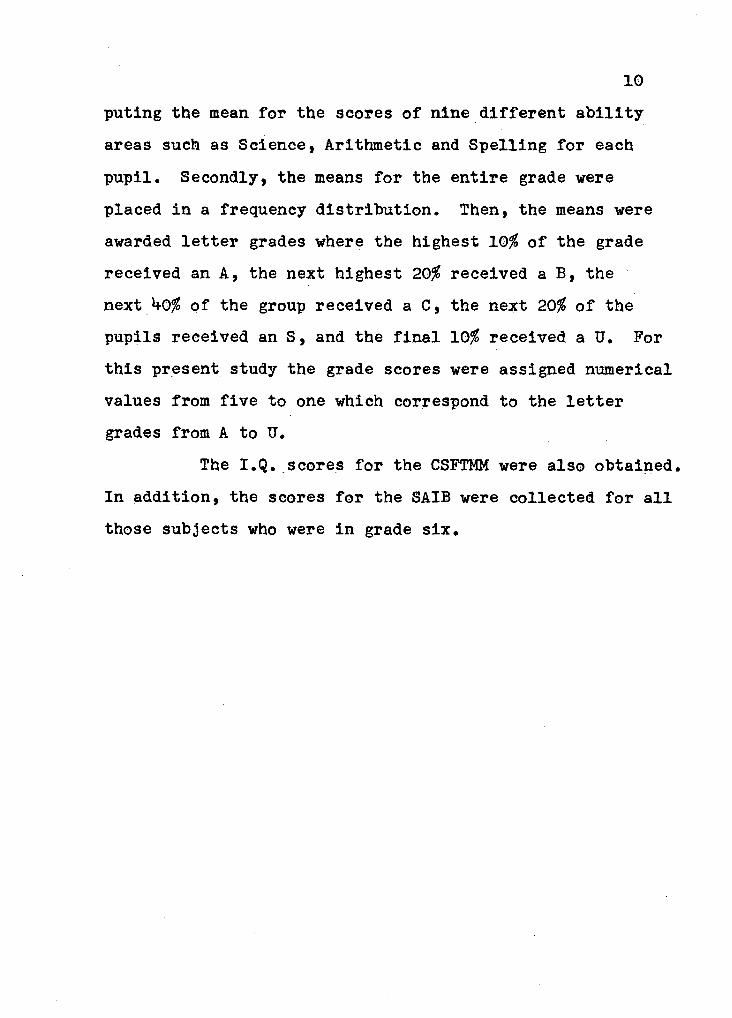
puting the mean for the scores of nine different ability-areas such as Science, Arithmetic and Spelling for each pupil. Secondly, the means for the entire grade were placed i n a frequency distribution. Then, the means were awarded letter grades where the highest 1 0 $ of the grade received an A, the next highest 20% received a B, the next h0% of the group received a C, the next 20% of the pupils received an S, and the f i n a l 10% received a U. For this present study the grade scores were assigned numerical values from five to one which correspond to the letter grades from A to U.
The I.Q. scores for the CSFTMM were also obtained. In addition, the scores for the SAIB were collected for a l l those subjects who were i n grade six.
11
CHAPTER III THE RESULTS AND THEIR STATISTICAL TREATMENT
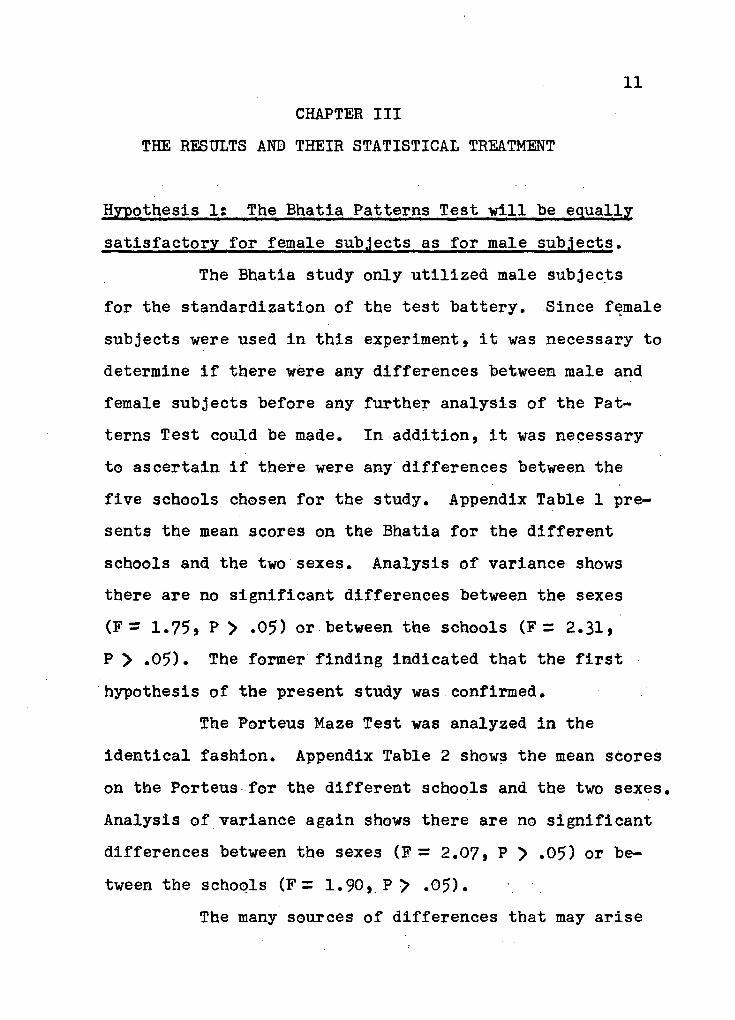
Hypothesis Is The Bhatia Patterns Test w i l l be equally satisfactory for female subjects as for male subjects.
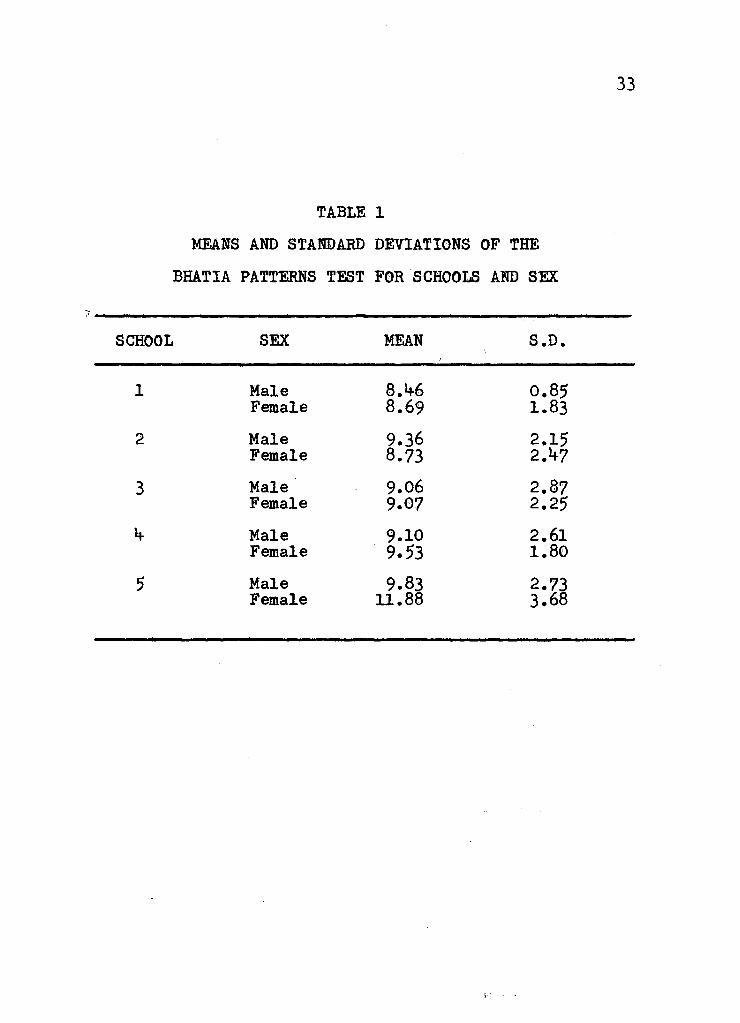
The Bhatia study only u t i l i z e d male subjects for the standardization of the test battery. Since female subjects were used i n this experiment, i t was necessary to determine i f there were any differences between male and female subjects before any further analysis of the Patterns Test could be made. In addition, i t was necessary to ascertain i f there were any differences between the five schools chosen for the study. Appendix Table 1 presents the mean scores on the Bhatia for the different schools and the two sexes. Analysis of variance shows there are no significant differences between the sexes (F - 1.75, P > .05) or between the schools (F = 2.31>
P > . 0 5 ) . The former finding indicated that the f i r s t hypothesis of the present study was confirmed.
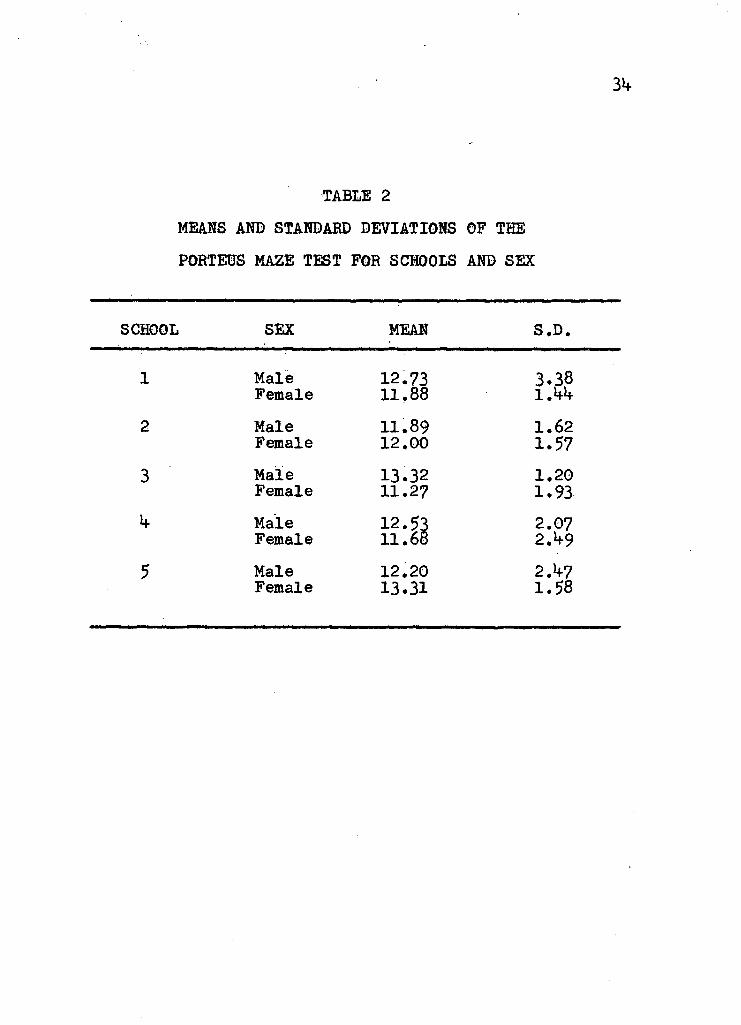
The Porteus Maze Test was analyzed i n the identical fashion. Appendix Table 2 shows the mean scores on the Porteus for the different schools and the two sexes. Analysis of variance again shows there are no significant differences between the sexes (F = 2 .07, P > .05) or between the schools (F = 1 .90, P > . 0 5 ) .
The many sources of differences that may arise
12
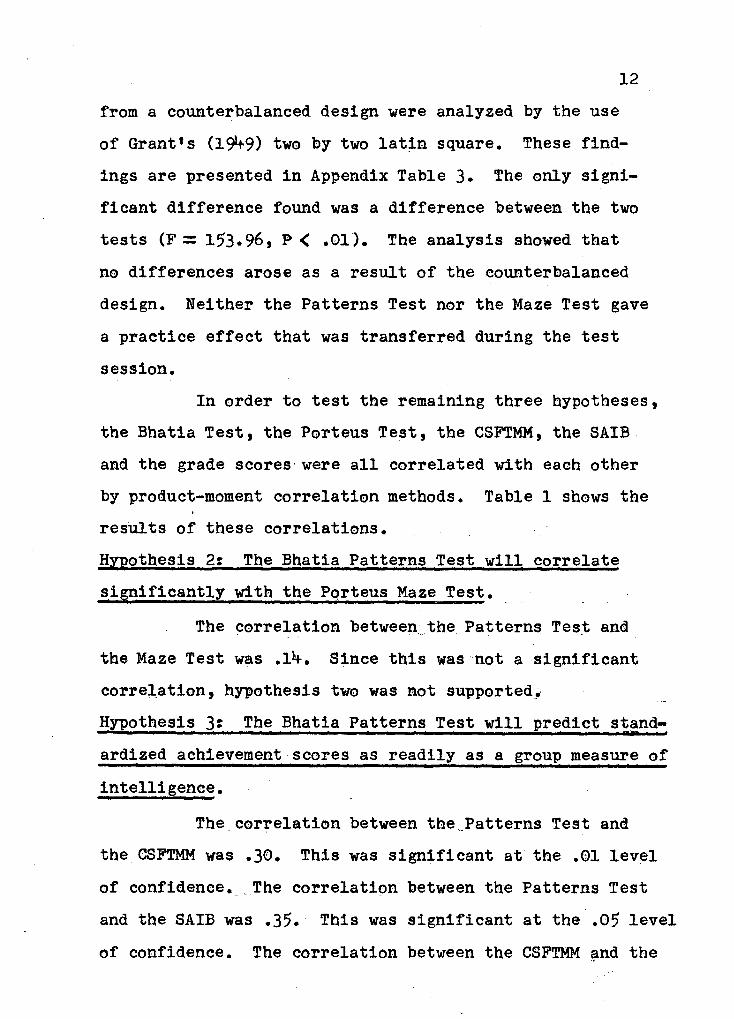
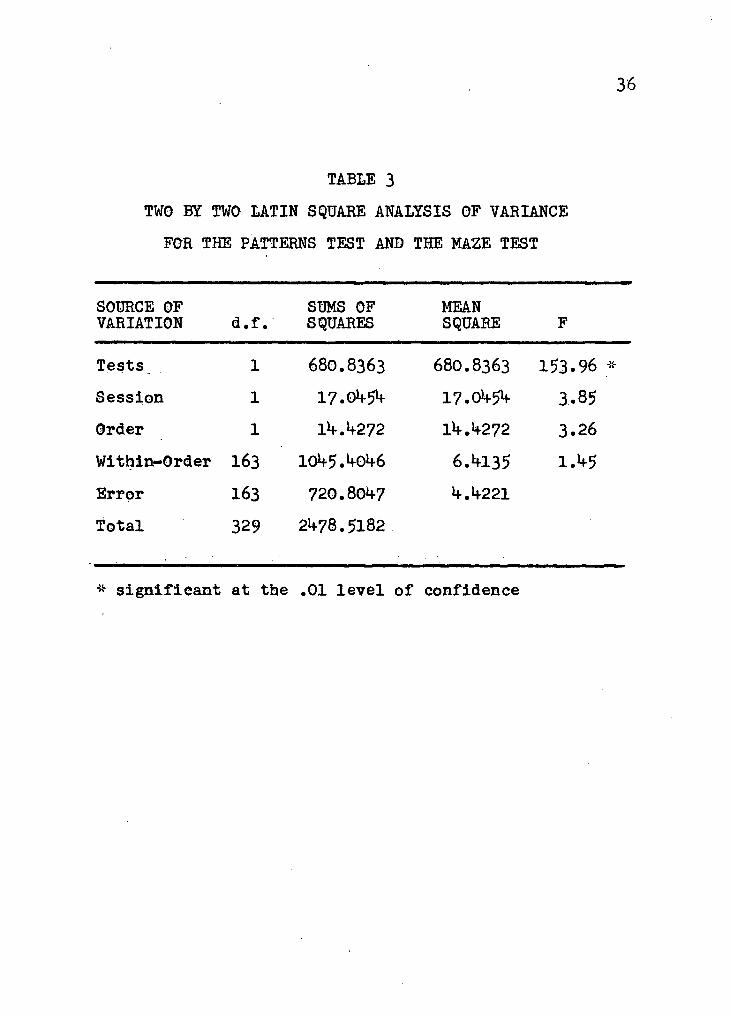
from a counterbalanced design were analyzed by the use of Grant's (19^9) two by two l a t i n square. These findings are presented in Appendix Table 3 . The only significant difference found was a difference between the two tests (F = 153.96, P< . 0 1 ) . The analysis showed that no differences arose as a result of the counterbalanced design. Neither the Patterns Test nor the Maze Test gave a practice effect that was transferred during the test session.
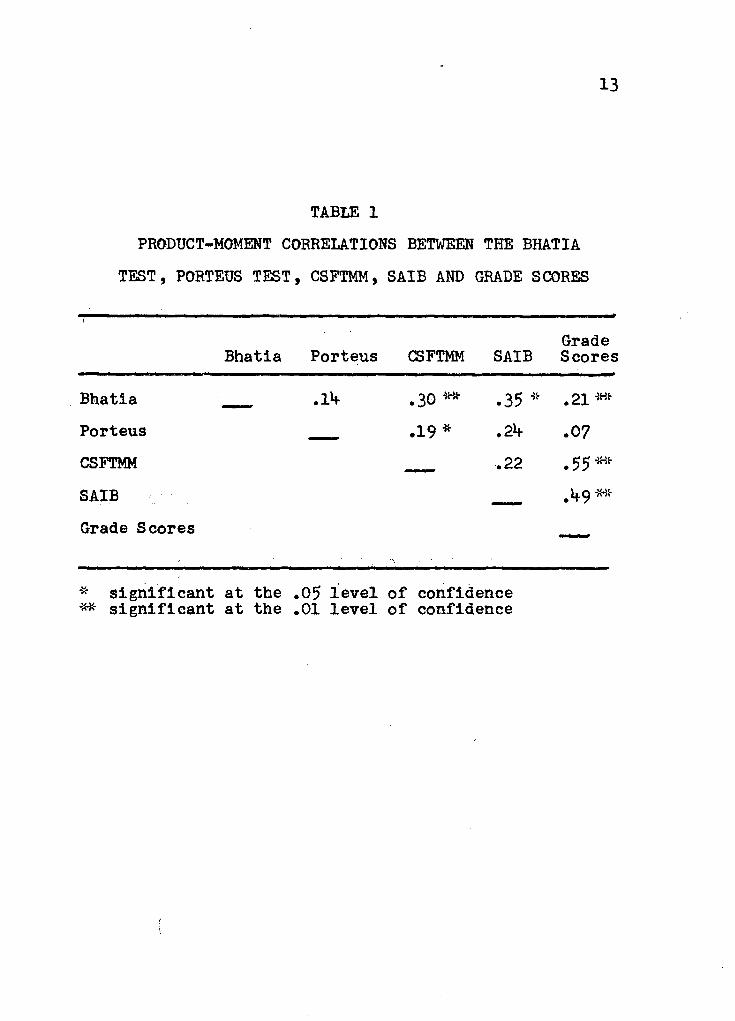
In order to test the remaining three hypotheses, the Bhatia Test, the Porteus Test, the CSFTMM, the SAIB and the grade scores were a l l correlated with each other by product-moment correlation methods. Table 1 shows the results of these correlations. Hypothesis 2x The Bhatia Patterns Test w i l l correlate significantly with the Porteus Maze Test.
The correlation between the Patterns Test and the Maze Test was .14. Since this was not a significant correlation, hypothesis two was not supported. Hypothesis 3? The Bhatia Patterns Test w i l l predict stand ardized achievement scores as readily as a group measure of intelligence.
The correlation between the^Patterns Test and the CSFTMM was . 3 0 . This was significant at the .01 level of confidence. The correlation between the Patterns Test and the SAIB was .35. This was significant at the .05 level of confidence. The correlation between the CSFTMM and the
13
TABLE 1 PRODUCT-MOMENT CORRELATIONS BETWEEN THE BHATIA
TEST, PORTEUS TEST, CSFTMM, SAIB AND GRADE SCORES
I - "'• •*
Grade Bhatia Porteus CSFTMM SAIB Scores
Bhatia .14 .30 ** .35 * .21** Porteus .19 * .24 .07
CSFTMM .22 .55**
SAIB .49 ** Grade Scores
* significant at the .05 level of confidence ** significant at the .01 level of confidence
14
SAIB was . 2 2 . This was not a significant correlation. While the present results did not support the third hypothesis, they actually indicated that the Bhatia was a better predictor of achievement than was a group test of intelligence. Hypothesis 4g The Bhatia Patterns Test w i l l predict the grade scores of elementary school pupils.
The correlation between the Patterns Test and the grade scores was . 2 1 . Since this correlation was significant at the .01 level of confidence, the fourth hypothesis of this study was upheld.
The data of this study also yielded some additional interesting information on how the various variables inter-correlated and how they combined when placed i n a multiple correlation formula. The correlation between the Maze Test and the CSFTMM was . 1 9 . This was significant at the . 0 5
level of confidence; The correlation between the Maze Test and the SAIB was .24 and the correlation between the Maze Test and grade scores was . 0 7 . Neither of these correlations were significant. The correlation between the CSFTMM and grade scores was .55 which was significant at the .01
level of confidence. The correlation between the SAIB and grade scores was .49 which also was significant at the .01
level of confidence.
Since the Bhatia Patterns Test had been devised for and used i n a test battery, i t appeared that multiple correlation procedures may have been of some value to this
15
exploratory study. The Patterns Test and the CSFTMM were combined in an attempt to predict the SAIB. The resulting multiple correlation coefficient was .37.
The multiple correlation coefficient was .49 between grade scores and a combination of the Patterns Test and the SAIB. When the CSFTMM and the Patterns Test were combined to predict grade scores, the multiple correlation coefficient yielded .55 and the combination of the CSFTMM and the SAIB produced a multiple correlation coefficient of .67 in an attempt to predict grade scores. A four-fold multiple correlation between grade scores and a combination of the CSFTMM, the SAIB and the Patterns Test resulted i n a multiple correlation coefficient of .67. A l l the reported multiple correlations were significant at the .01 level of confidence.
16
CHAPTER IV DISCUSSION
Because of the extreme d i f f i c u l t y of testing female subjects under local Indian conditions, Bhatia confined his study to male subjects between the ages of 11 and 16 years. Therefore, he has made no comment on whether there may or may not be differences between the sexes with the Patterns Test. Since 78 of the 165 subjects within this present study were females, i t was necessary to determine i f sex was a factor with the Patterns Test. The s t a t i s t i c a l analysis showed there were no differences between the male and the female Patterns Test scores. Therefore, sex of the subject does not appear to be an influencing factor. Such a finding supports the f i r s t hypothesis of this study.
The Patterns Test appeared to require some planning a b i l i t y which Porteus purported to measure with the Maze Test. The analysis of the two tests, however, showed there was not a significant correlation (r = .14) between the two tests. Therefore, the second hypothesis of the study was not confirmed.
Bhatia obtained a high factor loading on a general factor of intelligence (.65) i n a factor analysis of a battery of intelligence measures. The Stanford-Binet (Form L) also correlated highly (.61) with this f i r s t order factor.
17 The correlation between the Stanford-Binet (Form L) mental age and the Patterns Test was . 4 6 . However, i n this study the correlation between the Patterns Test and the CSFTMM (r = . 3 0 ) was not high although i t might be increased by a greater number of patterns within the Patterns Test. The correlation between the Patterns Test and the SAIB was . 3 5 . Neither the CSFTMM nor the SAIB correlation with the Patterns Test showed the relationship that Bhatia obtained correlating the Patterns Test with the Stanford-Binet (r = . 4 6 ) which indicated that the Patterns Test was not as satisfactory a predictor with these two group measures as i t was with the individual Stanford-Binet. However, the Patterns Test, on the basis of the correlation with the SAIB, appeared to be testing some factor or factors i n common with the group achievement test. Also, the Patterns Test, on the basis of i t s correlation with the CSFTMM, appeared to be measuring some common factors with the group intelligence test. Therefore, since the Patterns Test correlated significantly with each of these group measures and since each of the correlations was higher than the correlation between the two group measures (r = . 2 2 ) , the Patterns Test may have some value i f i t i s used as one of a number of tests within a test battery just as Bhatia used i t . The third hypothesis was not supported by the results of these correlations but the correlations actually indicated that the Patterns Test was a better predictor of the achievement test than was the group test of intelligence.
18
The Porteus Maze Test has also been u t i l i z e d as a measure of intelligence. It showed less of a relationship with the two group measures than the Bhatia Test showed. The correlation between the Maze Test and the CSFTMM was just significant (r = . 1 9 ) while the correlation between the Maze Test and the SAIB was not significantly different from zero which indicated that the Maze Test had less of a predictor value with the two group measures than did the Patterns Test. However, one factor that may have been operating on the Maze Test was the amount of practice effect or test sophistication displayed by a majority of the pupils examined. Many of the comic books that these children read had a "puzzle page". This puzzle page usually contained a maze of varying degrees of d i f f i c u l t y but very similar i n form to a Porteus Maze.
The relationship between the various tests and the grade scores of the subjects was a c r i t i c a l factor because grade scores are frequently u t i l i z e d as a test criterion. Both of the group measures correlated satisfactorily with the grade scores. The Maze Test showed no relationship with the grade scores since the correlational figure did not differ significantly from zero/(r = . 0 7 ) .
The Patterns Test showed a slight relationship with the grade scores (r = . 2 1 ) but again this correlation was not sufficient to claim any great predictive value for the Patterns Test. Such a finding does, however, lend support to
19 the fourth hypothesis.
None of the three-fold multiple correlations gave a contribution except the correlation between the grade scores, the SAIB and the CSFTMM which correlated .67. When the Patterns Test was included with the three previous variables to form a four-fold multiple correla-tion, the correlation remained the same (r = .67). This suggested that the Patterns Test contributed nothing to this group relationship although, as previously stated, the Patterns Test may have some value as a test within a test battery since i t correlated higher with each of the group measures than the group measures correlated with each other.
20
CHAPTER V SUMMARY AND CONCLUSIONS
The Bhatia Patterns Test has been given to a number of subjects in order to explore some of the poss i b i l i t i e s of the test in the area of mental measurements. Since the Patterns Test appeared that i t might be measuring a common factor with the Porteus Maze Test, the Maze Test was also given to the subjects by a counterbalanced design. Bhatia 1s Patterns Test results were reported for male subjects only. This present study used female as well as male subjects to determine i f there were any d i f ferences due to the sex of the subjects. The CSFTMM, the SAIB, the grade scores and the age of the subjects were collected as criterion measures.
More e x p l i c i t l y , the hypotheses to be tested i n this present study were as followsr
1. The Bhatia Patterns Test w i l l be equally satisfactory for female subjects as for male subjects;
2. The Bhatia Patterns Test w i l l correlate significantly with the Porteus Maze Test;
3 . The Bhatia Patterns Test w i l l predict standardized achievement scores as readily as a group measure of intelligence; and
k. The Bhatia Patterns Test will'predict the
grade scores of elementary school pupils.
21
It was concluded that there were no sex dif ferences among the scores of the subjects for the Patterns Test. On the basis of this finding, the f i r s t hypothesis was validated.
Although the Patterns Test appeared to need some planning a b i l i t y which Porteus purported to measure with his Maze Test, there was no evidence of any common factor between these two measures. Thus, the second hypothesis was vitiated.
The correlation reported by Bhatia between the Patterns Test and the Stanford-Binet was not duplicated when a group measure of intelligence was used as a criterion. The correlations between the Patterns Test and each of the group measures were higher than the correlation between the two group measures. On this basis the Patterns Test showed that i t may have some value as one of a series of measures within a test battery. These results showed the third hypothesis was not supported. However, the results indicated that the Patterns Test was a better predictor of the achievement test than was the group test of intelligence.
The correlation between the Bhatia and the grade scores was significant. Thus, the fourth hypothesis was confirmed. However, the correlation was too low for any practical purposes of prediction. On the other hand, i t s correlation with a standardized achievement test did i n dicate that i t may be of some limited value in predicting
achievement test scores of pupils, particularly those scoring either extremely high or extremely low on i t .
23
References
Bhatia, CM. Performance tests of intelligence under Indian conditions. London? Oxford University Press, 1955.
Cowne, L. A study of the California Short Form Test of Mental Maturity. Educ. Rec. B u l l . . 1954, No. 62, 67-75.
Cronbach, L.J. Essentials of psychological testing. New York? Harper, 1949.
Grant, D.A. The s t a t i s t i c a l analysis of a frequent experimental design. Amer. J . of Psychol.. 1949, 62, 119-122.
Louttit, CM., and Stackman, H. The relationship between Porteus maze and Binet test performance. J., EducT
Psychol.. 1936, 27, 18-25.
Porteus, S.D. The Porteus maze test and intelligence. Palo Altos Pacific Books, 1 9 5 0 . '
Sheldon, W.D., and Manolakes, G. A comparison of the Stanford-Binet, Revised Form L, and the California Test of Mental Maturity (S-form). J . Educ. Psychol.. 1954, 4 5 , 499-504.
Traxler, A.E. Comparative value of certain mental a b i l i t y tests for predicting school marks i n two in dependent schools. Educ. Rec. B u l l . . 1955, No. 65, 65-75.
APPENDIX A
INSTRUCTIONS FOR THE BHATIA PATTERNS TEST
25
INSTRUCTIONS FOR THE BHATIA PATTERNS TEST
1. There are eight patterns of increasing d i f f i c u l t y from the 1st to 8 t h .
2. Give the following instructions to the subjects 'Here is paper and a pencil. I shall show a figure to you.* Place a card before the subject. Let the card be so displayed that the number of the card appears at the top before the subject. 'Now make a figure l i k e this without repeating your lines and without l i f t i n g your pencil when once you have started drawing.' The card should remain in f u l l view of the subject throughout.
3. Let the subject try successive patterns. Stop when failure i s recorded twice i n succession.
h. Provide a plain white sheet of paper to the subject on which to draw the patterns. Successive patterns may be drawn on the same sheet as long as there i s room.
5. Allow a maximum of two minutes for each of the f i r s t four patterns. Allow a maximum of three minutes for patterns Nos. 5 to 8. The subject may make as many attempts on the paper as he likes within the time l i m i t .
6. Demonstrate the f i r s t pattern, i f necessary. It i s only meant to give the subject confidence and f a c i l i t y i n drawing.
26
7. When a failure occurs i n one of the patterns, demonstrate this, but do not l e t the subject try this pattern again. Pass on to the next. Stop when failure i s recorded i n two successive designs.
8 . Watch the subject while he i s drawing. If he repeats a line or l i f t s his pencil, remind him of the conditions. Ask him to commence after proper thought. If he makes a drawing wrong, cross i t out and ask him to start afresh. Encourage him to try as many times as he likes within the time limit before you record a failure i n a particular pattern.
APPENDIX B
THE EIGHT PATTERNS OF THE BHATIA PATTERNS TEST
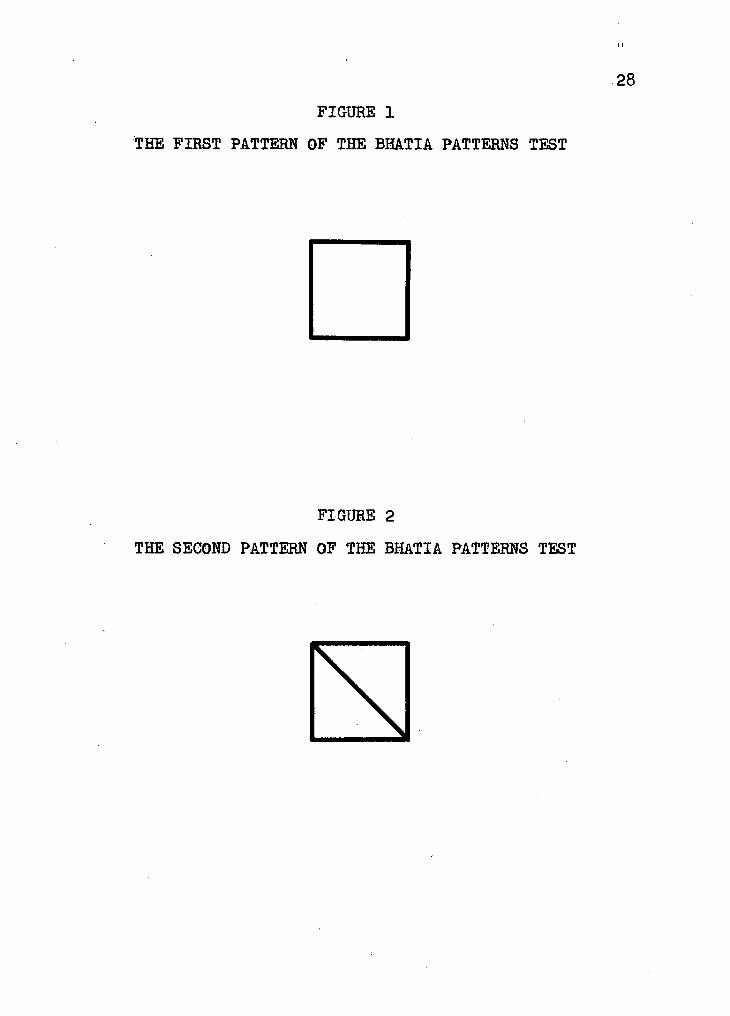
FIGURE 1 THE FIRST PATTERN OF THE BHATIA PATTERNS TEST
11
28
FIGURE 2
THE SECOND PATTERN OF THE BHATIA PATTERNS TEST
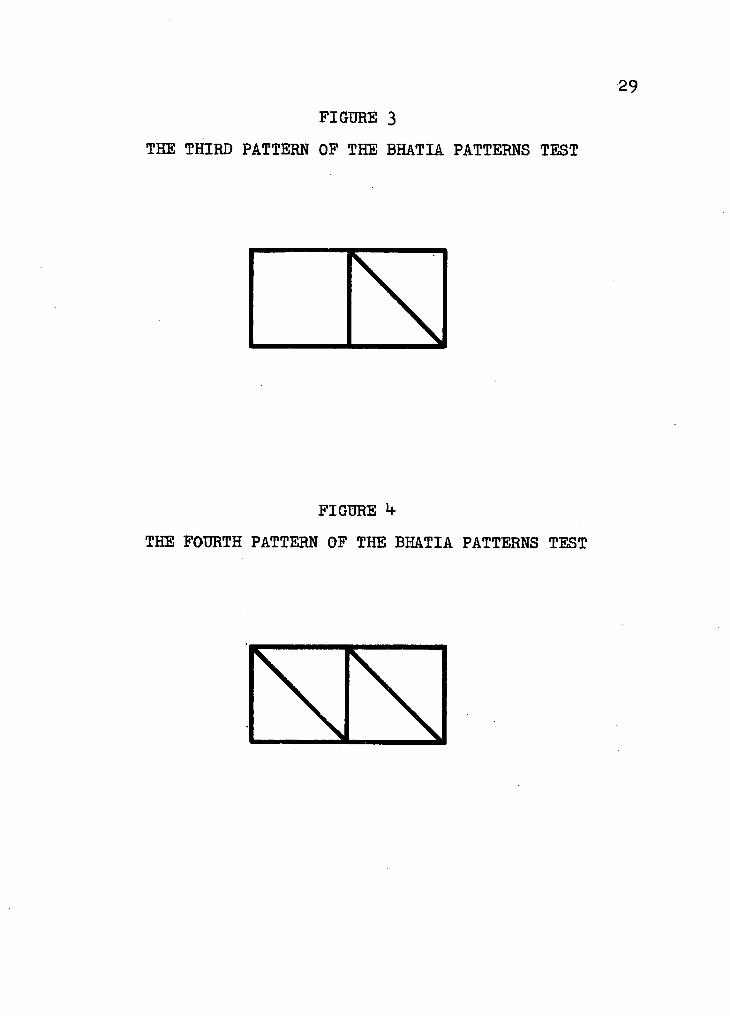
FIGURE 3 THE THIRD PATTERN OF THE BHATIA PATTERNS TEST
29
FIGURE h
THE FOURTH PATTERN OF THE BHATIA PATTERNS TEST
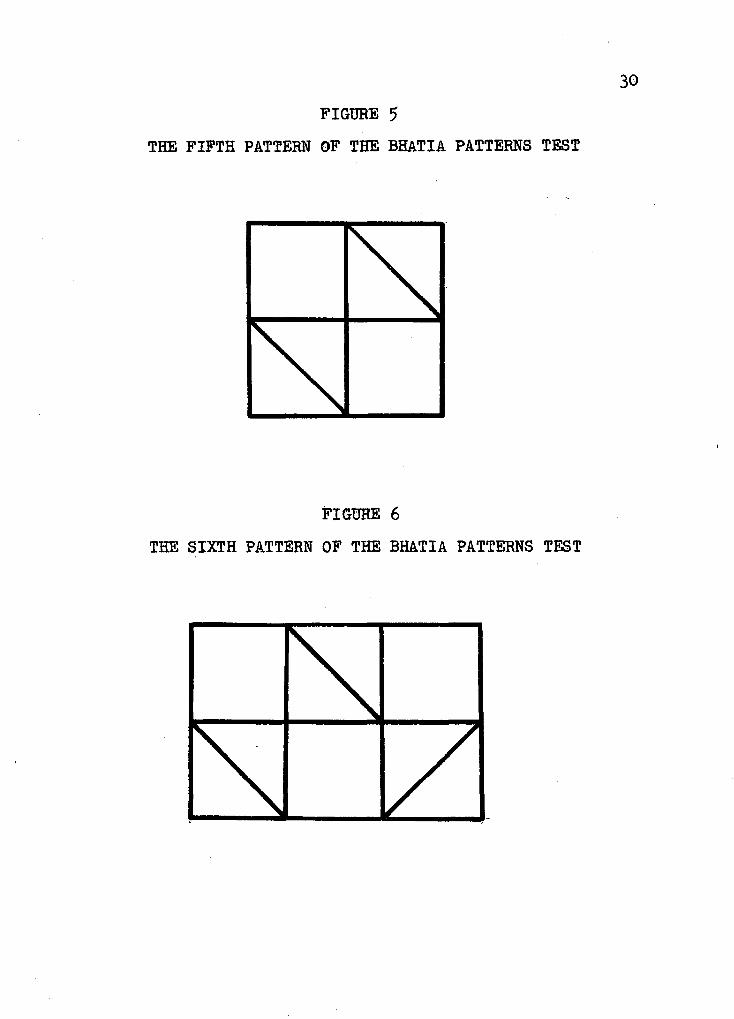
30 FIGURE 5
THE FIFTH PATTERN OF THE BHATIA PATTERNS TEST
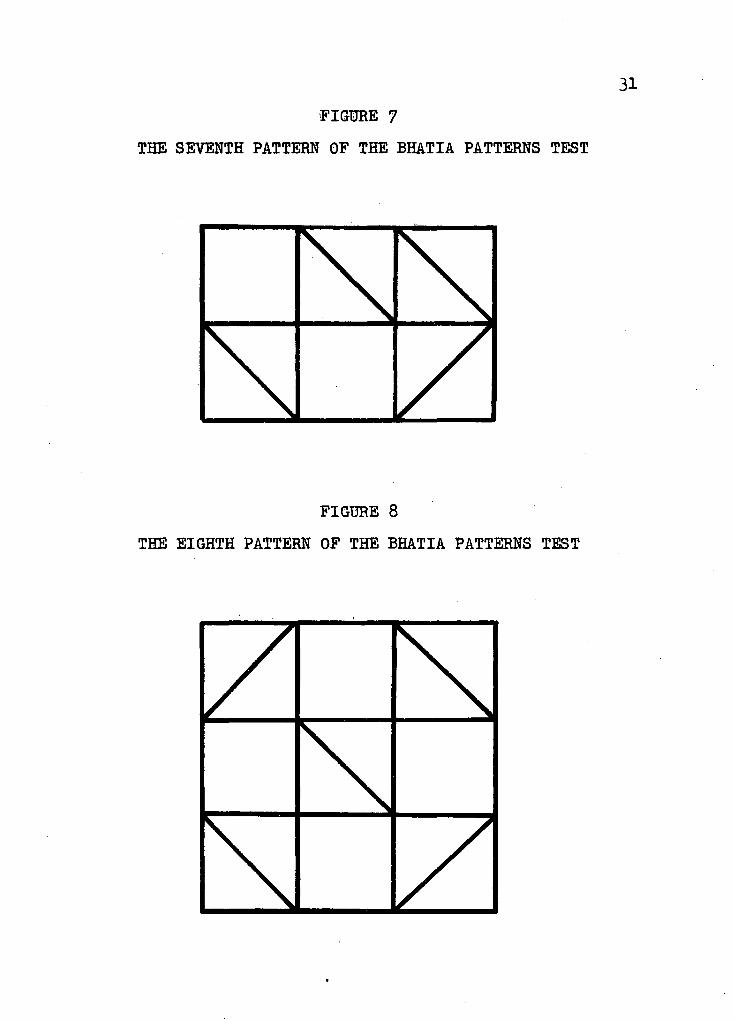
31 FIGURE 7
THE SEVENTH PATTERN OF THE BHATIA PATTERNS TEST
APPENDIX C
MEANS AND STANDARD DEVIATIONS OP THE BHATIA PATTERNS TEST AND THE PORTEUS
MAZE TEST FOR SCHOOLS AND SEX
33
TABLE 1
MEANS AND STANDARD DEVIATIONS OF THE BHATIA PATTERNS TEST FOR SCHOOLS AND SEX
SCHOOL SEX MEAN S.D.
1 Male 8A6 0.85 Female 8.69 1.83
2 Male 9.36 2.15 Female 8.73 2.47
3 Male 9.06 2.87 Female 9.07 2.25
h Male 9.10 2.61 Female 9.53 1.80
5 Male 9.83 2.73 Female 11.88 3.68
34
TABLE 2
MEANS AND STANDARD DEVIATIONS OF THE PORTEWS MAZE TEST FOR SCHOOLS AND SEX
SCHOOL SEX MEAN S.D.
1 Male 12.73 3.38 Female 11.88 1.44
2 Male 11.89 1.62 Female 12.00 1.57
3 Male 13.32 1.20 Female 11.27 1.93
if Male 12.53 2.07 Female 11.68 2.49
5 Male 12.20 2.47 Female 13.31 1.58
APPENDIX D
TWO BY TWO LATIN SQUARE ANALYSIS OF VARIANCE FOR THE PATTERNS TEST AND THE MAZE TEST
36
TABLE 3
TWO BY TWO LATIN SQUARE ANALYSIS OF VARIANCE FOR THE PATTERNS TEST AND THE MAZE TEST
SOURCE OF SUMS OF MEAN VARIATION d.f. SQUARES SQUARE F
Tests, 1 680.8363 680.8363 153.96 *
Session 1 17.0454 17.0454 3,85
Order 1 llf.4272 14.4272 3.26
Within-Order 163 1045.4046 6A135 1.45
Error 163 720.8047 4.4221 Total 329 2478.5182
# significant at the .01 level of confidence
Related Documents