electronic reprint Acta Crystallographica Section D Biological Crystallography ISSN 0907-4449 The refined atomic structure of carbonic anhydrase II at 1.05 ˚ A resolution: implications of chemical rescue of proton transfer David Duda, Lakshmanan Govindasamy, Mavis Agbandje-McKenna, Chingkuang Tu, David N. Silverman and Robert McKenna Copyright © International Union of Crystallography Author(s) of this paper may load this reprint on their own web site provided that this cover page is retained. Republication of this article or its storage in electronic databases or the like is not permitted without prior permission in writing from the IUCr. Acta Cryst. (2003). D59, 93–104 Duda et al. Carbonic anhydrase II

Welcome message from author
This document is posted to help you gain knowledge. Please leave a comment to let me know what you think about it! Share it to your friends and learn new things together.
Transcript
electronic reprint
Acta Crystallographica Section D
BiologicalCrystallography
ISSN 0907-4449
The refined atomic structure of carbonic anhydrase II at 1.05 Aresolution: implications of chemical rescue of proton transfer
David Duda, Lakshmanan Govindasamy, Mavis Agbandje-McKenna, ChingkuangTu, David N. Silverman and Robert McKenna
Copyright © International Union of Crystallography
Author(s) of this paper may load this reprint on their own web site provided that this cover page is retained. Republication of this article or itsstorage in electronic databases or the like is not permitted without prior permission in writing from the IUCr.
Acta Cryst. (2003). D59, 93–104 Duda et al. � Carbonic anhydrase II

Acta Cryst. (2003). D59, 93±104 Duda et al. � Carbonic anhydrase II 93
research papers
Acta Crystallographica Section D
BiologicalCrystallography
ISSN 0907-4449
The refined atomic structure of carbonic anhydraseII at 1.05 AÊ resolution: implications of chemicalrescue of proton transfer
David Duda,a Lakshmanan
Govindasamy,a Mavis Agbandje-
McKenna,a Chingkuang Tu,b
David N. Silvermanb and Robert
McKennaa*
aDepartment of Biochemistry and Molecular
Biology, University of Florida, Gainesville,
FL 32610, USA, and bDepartment of
Pharmacology and Therapeutics, University of
Florida, Gainesville, FL 32610, USA
Correspondence e-mail: [email protected]
# 2003 International Union of Crystallography
Printed in Denmark ± all rights reserved
Using synchrotron radiation and a CCD detector, X-ray data
have been collected at 100 K for the His64Ala mutant of
human carbonic anhydrase II complexed with 4-methyl-
imidazole (4-MI) to a maximal 1.05 AÊ resolution, allowing
full anisotropic least-squares re®nement. The re®ned model
has a conventional R factor of 15.7% for all re¯ections. The C�
coordinates of the model presented here have an r.m.s.
deviation of 0.10 AÊ relative to the previously determined
structure at 1.6 AÊ resolution. Several amino-acid residues (six
of the 255 observed) have been identi®ed with multiple
rotamer side-chain conformations. C, N and O atoms can be
differentiated with selective electron-density map contouring.
The estimated standard deviations for all main-chain non-H
atom bond lengths and angles are 0.013 and 0.030 AÊ ,
respectively, based on unrestrained full-matrix least-squares
re®nement. This structure gives detailed information about
the tetrahedrally arranged zinc ion coordinated by three
histidine N atoms (His94 N"2, His96 N"2 and His119 N�1) and a
water/hydroxide, the multiple binding sites of the proton
chemical rescue molecule 4-MI and the solvent networks
linking the zinc-bound water/hydroxide and 4-MI molecules.
This structure presents the highest resolution structure of a
carbonic anhydrase isozyme so far determined and adds to the
understanding of proton-transfer processes.
Received 29 July 2002
Accepted 22 October 2002
PDB Reference: carbonic
anhydrase II, 1moo, r1moosf.
1. Introduction
There are three broad classes of carbonic anhydrases (CAs);
all are zinc-metalloenzymes, but there is no amino-acid
homology between the classes (Hewett-Emmett & Tashian,
1996). The �-class includes the animal and human carbonic
anhydrases (HCAs), the �-class includes the plant and many
bacterial CAs and the -class includes archaeal CAs. The
�-class CAs (�-CAs) are monomeric, generally have a mole-
cular mass near 30 kDa and contain one zinc ion per molecule.
There have been at least 14 �-CA isozymes identi®ed (Park-
kila, 2000).
The most intensely studied of the �-CA isozymes is the
human CA isozyme II (HCA II), which consists of 261 amino
acids. HCA II is found in erythrocytes, where it mediates
respiration by interconverting CO2 and HCOÿ3 and, through
its interaction with hemoglobin, facilitates oxygen release to
the tissues. HCA II represents a substantial amount of the
protein mass of erythrocytes, with 2 mg gÿ1 hemoglobin. HCA
II is also the most ef®cient isozyme of the �-CAs, with a
catalytic turnover number of 106 sÿ1 (Hewett-Emmett &
Tashian, 1996).
The central structural motif of HCA II can be described as a
ten-stranded (�A±�J) twisted �-sheet, which is ¯anked by
electronic reprint

research papers
94 Duda et al. � Carbonic anhydrase II Acta Cryst. (2003). D59, 93±104
seven �-helices (�A±�G). The catalytic active site is char-
acterized by a conical cleft that is approximately 15 AÊ deep
with a zinc ion residing deep in the interior (Fig. 1). The zinc
ion is tetrahedrally coordinated by three histidine N atoms
(His94, His96 and His119) and a water/hydroxide molecule,
which are all positioned on one side of the �-sheet (Eriksson et
al., 1988).
HCA II catalyzes the reversible hydration of CO2 in two
distinct half-reactions (Lindskog, 1997; Christianson & Fierke,
1996). The ®rst step of the reaction involves the trapping of
the CO2 substrate within a hydrophobic pocket consisting of
residues Val121, Val143, Leu198, Val207 and Trp209 in the
active site (Silverman & Lindskog, 2000). The CO2 displaces
the deep water in the active site by associating with the amide
N atom of Thr199 in a hydrogen-bonding interaction prior to
nucleophilic attack on the substrate C atom to form bicarb-
onate. The bicarbonate is then displaced from the zinc ion
by an active-site water molecule, concluding the ®rst half-
reaction (1).
CO2 � EZnOHÿ !EZnHCOÿ3 !H2O
EZnH2O�HCOÿ3 :
�1�
EZnH2O� B !EZnOHÿ � BH�: �2�The second half reaction involves the transfer of a proton from
the zinc-bound water molecule to residue His64 through a
chain of hydrogen-bonded water molecules (Christianson &
Fierke, 1996; Eriksson et al., 1988). This intramolecular proton
transfer is followed by an intermolecular proton transfer from
His64 to buffer B in solution. This second step regenerates the
zinc-bound hydroxyl group, allowing another round of cata-
lysis to proceed (2).
It has been proposed by Cox et al. (2000) that there is a
hierarchy of zinc ligands in the active site (that function as
distinct shells of residues to stabilize the zinc ion). The ®rst-
shell, or direct, zinc ligands are the three histidine residues
His94, His96 and His119. The second-shell, or indirect, ligands
stabilize the direct ligands and help position them for zinc
coordination. Residue Gln92 stabilizes His94, Glu117 stabi-
lizes His119 and the backbone carbonyl O atom of Asp244
stabilizes His96, while residue Thr199 hydrogen bonds with
the zinc-bound hydroxyl ion. Finally, a third shell of stabili-
zation was proposed to be a cluster of aromatic residues
(Phe93, Phe95 and Trp97) that anchor the �-strand �F that
contains His94 and His96. The second-shell residue Thr199
also plays an important role in catalysis. The zinc-bound
hydroxyl ion donates a hydrogen bond to the hydroxyl side
chain of Thr199, which in turn donates a hydrogen bond to the
carboxyl side chain of Glu106. This interaction with Thr199
serves to orient the zinc-bound hydroxyl ion for optimal
nucleophilic attack on the CO2. Thr199 also serves to stabilize
the transition state of the reaction through a hydrogen bond
and serves to destabilize the bicarbonate ion product (Chris-
tianson & Cox, 1999). Thr199 is said to have a `gatekeeper
function' in the catalytic reaction by selecting only protonated
molecules to interact with the zinc ion. The hydrogen-bond
accepting ability of the Thr199 hydroxyl side chain enables this
selection.
The role of residue His64 as the proton shuttle in the second
half of the reaction (2) was established with the observation
that the site-speci®c mutant of HCA II in which His64 is
replaced by Ala (H64A HCA II) showed a 10±50-fold
reduction in catalytic turnover, kcat, for CO2 hydration (Tu et
al., 1989).
The crystal structure of wild-type HCA II solved by
Eriksson et al. (1988) revealed that residue His64 lies 7.5 AÊ
away from the zinc ion. This distance is too great for a direct
proton transfer. A solvent network was visible in this structure
culminating in three water molecules that were approximately
3.5 AÊ from the side chain of His64. This was the ®rst structural
evidence for a hydrogen-bonded solvent network in the active
site of HCA II.
It has further been shown that the decrease in catalysis of
H64A HCA II can be rescued in a saturable manner by the
addition of exogenous proton donors in solution, such as
imidazole and its methylated derivatives. The level of chemical
rescue exhibited by these compounds on the kinetic mutant
H64A HCA II is substantial, with the measured rate of cata-
lysis at saturation levels of these compounds approaching that
of wild-type HCA II (Tu et al., 1989; Duda, Tu, Qian et al.,
2001).
An X-ray crystal structure of H64A HCA II complexed
with the proton-transfer chemical rescuer 4-methylimidazole
(4-MI) at 1.6 AÊ resolution was determined and the binding site
for 4-methylimidazole identi®ed (Duda, Tu, Qian et al., 2001;
Duda, Tu, Silverman et al., 2001). It was shown that 4-MI
�-stacks with Trp5, a residue that extends into the active-site
cavity. In this position, 4-MI is near to the `out conformation'
of His64 in the wild-type HCA II (Nair & Christianson, 1991).
Figure 1Structure of HCA II. Ribbon diagram showing the tertiary structure ofHCA II; the color coding of the secondary elements is as follows:�-strands (red), �-helices (blue) and coil (gray). The relative positions ofthe zinc ion (black sphere) and the N- and C-termini are indicated. Figurecreated using BOBSCRIPT (Esnouf, 1997) and Raster3D (Merritt &Bacon, 1997).
electronic reprint

The availability of well ordered highly diffracting crystals of
HCA II H64A and a suitable cryoprotectant has now made it
possible to collect data to 1.05 AÊ resolution using a synchro-
tron-radiation source. It has now been established that atomic
resolution structures, determined when crystals diffract
greater than 1.2 AÊ (Sheldrick, 1990), can reveal features that
are not clearly predictable with lower resolution structures
(Ferraroni et al., 1999; Freitag et al., 1999). High-resolution
structural information is also becoming essential for better
interpretation of structural disorder or residues exhibiting
multiple conformations and this information can aid in the
understanding of the ®ne details of the mechanism of action of
an active site (Esposito et al., 2000). In practical terms, an
atomic resolution structure offers the possibility of a more
meaningful statistical analysis of the re®ned model with less
bias from the standard applied restraints (Dauter et al., 1997;
Longhi et al., 1998; Ridder et al., 1999).
In this paper, we present a complete anisotropic re®nement
of H64A HCA II complexed with 4-MI to 1.05 AÊ resolution.
This has revealed detailed structural information about the
tetrahedrally arranged zinc ion coordinated to three histidine
N atoms (His94 N"2, His96 N"2 and His119 N�1) and a water/
hydroxide, reveals multiple binding sites of the proton-
transfer chemical rescuer 4-MI, the binding site of the mercury
ion and a detailed multiple solvent network linking the zinc-
bound water/hydroxide with the 4-MI molecules. This atomic
resolution structural view gives a plausible concept of multiple
binding sites for chemical rescue of the CA proton shuttle as
proposed by An et al. (2002).
2. Materials and methods
2.1. Purification
H64A HCA II was prepared and expressed in Escherichia
coli as described previously (Tu et al., 1989; Tanhauser et al.,
1992) and was puri®ed by af®nity chromatography (Khalifah
et al., 1977). The sequence of the enzymes was con®rmed by
sequencing the DNA of the entire coding region for carbonic
anhydrase in the expression vector. The concentration of
human carbonic anhydrase was determined from the molar
absorptivity at 280 nm (5.5 � 104 Mÿ1 cmÿ1).
2.2. Crystallization and X-ray data collection
Crystals of H64A HCA II were obtained by the hanging-
drop method and soaked with 4-MI as described previously
(Duda, Tu, Silverman et al., 2001). Crystals were cryoprotected
by quick immersion in a solution of 30% glycerol and 3 M
(NH4)2SO4 in 50 mM Tris pH 7.8 and were ¯ash-cooled in
nylon-®ber loops in a 100 K nitrogen-gas stream provided by
an Oxford cryosystem prior to data collection.
High-resolution X-ray diffraction intensity data were
collected at the Cornell High Energy Synchrotron Source
(CHESS) F1 station using a wavelength of 0.938 AÊ , a 0.3 mm
collimator and a Quantum 4 CCD detector system. Additional
`in-house' medium-resolution X-ray diffraction data were
collected using a Rigaku HU-H3R CU rotating-anode
generator, Osmic mirrors, a 0.3 mm collimator and a R-AXIS
IV++ image-plate system.
A total of 160� of images were collected at CHESS from two
H64A HCA II crystals of dimensions 0.1 � 0.1 � 0.2 mm with
a crystal-to-detector distance of 90 mm using a 1.0� oscillation
angle with an exposure time of 30 s per image, resulting in the
collection of a total of 466 929 re¯ections measured to a
maximum resolution of 1.05 AÊ . The data set was merged to a
set of 112 535 independent re¯ections (83.7% complete) with
DENZO and scaled with SCALEPACK (Otwinowski &
Minor, 2001), resulting in an Rsym of 0.124. The ratio of
intensity to background [I/�(I)] was 6.3, with 59% of the
re¯ection intensities greater than 3�.
An additional 330� of data were collected in-house from a
single crystal of similar dimensions to those used at CHESS.
The in-house data were collected with a crystal-to-detector
distance of 100 mm using a 1.0� oscillation angle with an
exposure time of 300 s per image. A total of 468 251 re¯ections
were measured to a maximum resolution of 1.6 AÊ . The data set
was merged to a set of 32 030 independent re¯ections (88.8%
complete) with DENZO and scaled with SCALEPACK
(Otwinowski & Minor, 2000), with an Rsym of 0.047. The ratio
of intensity to background [I/�(I)] was 33.5, with 90% of the
re¯ection intensities greater than 3�.
The combined data sets of 935 501 re¯ections were scaled in
SCALEPACK (Otwinowski & Minor, 2001) to a maximum
resolution of 1.05 AÊ . The crystals were shown to belong to the
monoclinic space group P21, with unit-cell parameters a = 42.1,
b = 41.4, c = 72.0 AÊ , � = 104.3�. The reduced data set resulted
in a Rsym of 0.106 (0.316 for the outer resolution shell) for
92 527 independent re¯ections measured (a completeness of
83.1% and of 40.6% in the outer resolution shell). The ratio of
intensity to background [I/�(I)] for the combined data set was
12.6, with 58% of the re¯ection intensities greater than 3�.
Data-processing parameters are summarized in Table 1.
2.3. Refinement protocol
Re®nement procedures were initiated using the software
package CNS version 1.0 (BruÈ nger et al., 1998). 5% (4554
re¯ections) of all the independently measured re¯ections were
randomly selected to be used for the calculation of Rfree
Acta Cryst. (2003). D59, 93±104 Duda et al. � Carbonic anhydrase II 95
research papers
Table 1Re¯ection statistics for data used in the re®nement.
Resolutionshells (AÊ )
No. uniquere¯ections
Completeness(%)
Linear Rfactor
20.0±2.26 11173 97.2 0.0992.26±1.80 10995 97.4 0.1051.80±1.57 10772 95.7 0.1461.57±1.42 10368 92.1 0.1501.42±1.32 10380 92.6 0.1801.32±1.24 10337 92.1 0.2041.24±1.18 9875 88.2 0.2331.18±1.13 8520 75.8 0.2591.13±1.09 6560 58.9 0.2961.09±1.05 4547 40.6 0.316
Total 93527 83.1 0.106
electronic reprint
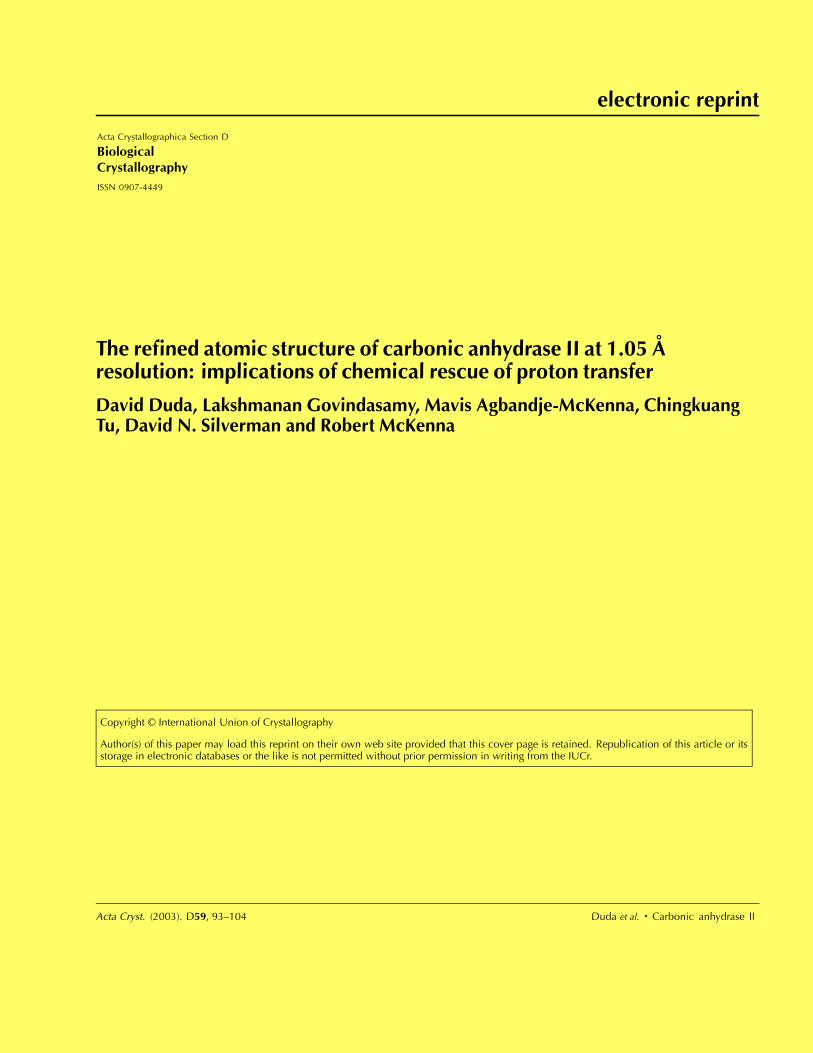
research papers
96 Duda et al. � Carbonic anhydrase II Acta Cryst. (2003). D59, 93±104
(Kleywegt & BruÈ nger, 1996; Kleywegt, 2000). The previously
determined structure of H64A HCA II (Duda, Tu, Qian et al.,
2001; PDB code 1g0f), with all water molecules and ions
removed, was used for the initial phasing of the data set.
Rigid-body re®nement was initiated at 20.0±2.0 AÊ resolution.
The data were extended to 1.05 AÊ resolution and geometry-
restrained positional re®nement and temperature-factor
re®nement were performed. The (2|Fo| ÿ |Fc|) Fourier maps
clearly showed the location of the mercury and zinc ions,
which were added to the model using the interactive graphics
program O version 7 (Jones et al., 1991). Prior to assignment of
the ions, Rwork and Rfree were 32.06 and 32.17%, respectively.
The ions were assigned to the model, which was then further
simulated, annealed and re®ned by heating to 3000 K and
gradual cooling with CNS (BruÈ nger et al., 1998). Simulated
annealing in the presence of the ions resulted in an Rwork and
Rfree of 26.89 and 27.64%, respectively. Re®nement continued
as an iterative process involving energy minimization,
temperature-factor re®nement, automatic water divining and
computer-graphics molecular modeling. At this stage of
re®nement, 76 water molecules had been incorporated into
the model. Appropriate density for the primary binding site of
4-MI (Duda, Tu, Qian et al., 2001) was clearly visible after two
iterative cycles of re®nement. 4-MI was placed into the model
using coordinates and restraints from a previously solved
structure of HCA II in complex with 4-MI (Duda, Tu, Qian et
al., 2001; PDB accession number 1g0e). Convergence was
deemed to be when no new water molecules could be placed in
the model when examining a (2|Fo|ÿ |Fc|) and (|Fo|ÿ |Fc|) map
contoured at the 1.5� and 2.5� levels, respectively. Atomic
displacement factors were re®ned isotropically. The details of
the isotropic model re®nement are summarized in Table 2.
The PDB coordinate ®le obtained from the ®nal cycle of
CNS (BruÈ nger et al., 1998) re®nement was used to generate
the fractional coordinates and equivalent isotropic thermal
parameters for further re®nement using SHELXL and
SHELXPRO (Sheldrick, 1997; Sheldrick & Schneider, 1997).
All water molecules, as well as the zinc and mercury ions
and 4-MI, were again removed from the model prior to input
into SHELXL (Sheldrick, 1997; Sheldrick & Schneider, 1997)
re®nement. This was performed to ensure that there was no
phase bias from the model and to allow a direct comparison
between water placement with SHELXL (Sheldrick, 1997;
Sheldrick & Schneider, 1997) and CNS (BruÈ nger et al.,
1998). The initial cycle of re®nement consisted of 15 cycles
of restrained conjugate-gradient least-squares re®nement
(CGLS) using the full resolution range (20.0±1.05 AÊ ). The ®rst
cycle of re®nement resulted in an initial Rwork of 24.76%
and an Rfree of 23.89%. (2|Fo| ÿ |Fc|) electron-density maps
contoured at a maximal level of �50� and (|Fo| ÿ |Fc|)
electron-density maps contoured at a maximal level of �10�clearly indicated the positions of both the zinc and mercury
ions. The ions were placed into the model, followed by a
further ten cycles of restrained CGLS re®nement, resulting in
an Rwork of 21.20% and an Rfree of 21.05%. 154 solvent
molecules were predicted with a � level of 4; this was followed
by a further cycle of re®nement. (|Fo| ÿ |Fc|) electron density
with a `doughnut-shaped' appearance and located approxi-
mately 4 AÊ from the indole ring of Trp5 was interpreted and
built as the primary binding site of the 4-MI as previously
observed (Duda, Tu, Qian et al., 2001). A secondary region of
unassigned (|Fo| ÿ |Fc|) electron density was identi®ed on the
opposite side of the active-site cavity between the side chains
Table 2Steps in re®nement.
Re®nementcycle
Re®nementtype
Resolution(AÊ ) Step
Rwork
(%)Rfree
(%)
CNS re®nement1 Rigid body 20.00±2.00 Ions placed 32.06 32.17
Annealing 26.89 27.64Minimize 20.00±1.05 26.64 27.36
2 B individual 25.50 26.36Water pick 39 HOH added 24.03 24.65Minimize 23.63 24.34
3 B individual 23.18 24.22Water pick 37 HOH added,
4-MI added23.00 23.81
Minimize 22.96 23.704 B individual 22.81 23.60
Water pick 75 HOH added 22.28 23.23Minimize 22.13 23.12
5 B individual 22.13 22.98Water pick 53 HOH added 21.79 22.68
SHELXL re®nement1 CGLS 15 20.00±1.05 Initial re®nement 24.76 23.892 CGLS 10 Ions placed 21.20 21.053 CGLS 10 154 HOH placed 21.14 21.094 CGLS 10 Both 4-MI placed 20.18 20.435 CGLS 10 101 HOH placed 20.12 20.196 CGLS 10 Full anisotropic 16.80 18.547 CGLS 10 63 HOH placed,
S50, D175, C206occupancy re®nement
16.64 18.65
8 CGLS 10 K112, Q136, S220occupancy re®nement
16.49 18.46
9 CGLS 10 Hg ion and second4-MI occupancyre®nement
16.40 18.33
10 CGLS 10 Riding H atoms added 15.82 17.7911 CGLS 5 Final adjustments 15.78 17.82
Table 3Re®nement statistics.
Rcryst² 0.157Rfree² 0.177Residue Nos. 5±261No. of protein atoms 2081No. of heteroatoms 17No. of H2O molecules 308R.m.s.d. for bond lengths (AÊ ) 0.013R.m.s.d. for angles (�) 0.03Ramachandran statistics (%)
Most favoured regions 88.40Allowed regions 11.60Generously allowed 0.00Disallowed regions 0.00
B factors (AÊ 2)Average, main-chain atoms 11.07Average, side-chain atoms 13.41Solvent 29.61
² Rcryst =P��jFoj ÿ jFcj
��=P jFobsj; Rfree is identical to Rcryst for data omitted from
re®nement (5% of re¯ections for H64A HCA II in complex with 4-methylimidazole).
electronic reprint
of Glu69 and Ile91. This density was assigned as a `newly
found' secondary binding site for the 4-MI molecule. The
bond-distance and bond-angle restraints (DFIX and DANG)
were generated from the PDB coordinates of 4-MI using
SHELXPRO (Sheldrick, 1997) and placed into the model. Ten
cycles of restrained CGLS re®nement resulted in an Rwork and
Rfree of 20.18 and 20.43%, respectively. An additional 101
water molecules were placed in the model followed by a
detailed analysis of the conformations each amino acid using
the interactive graphics software O version 7 (Jones et al.,
1991). This revealed ®ve amino acids (three Gln and two Asn)
with incorrect amide-group conformations, which were
modeled correctly and re®ned. Full anisotropic re®nement of
the model proceeded from this point given the high resolution
(1.05 AÊ ) and high data-to-parameter ratio (5:1) and yielded an
Rwork and Rfree of 16.80 and 18.54%, respectively. Careful
visual inspection of the model against a (2m|Fo| ÿ D|Fc|)
electron-density map contoured at 2� and an (|Fo| ÿ |Fc|)
electron-density map contoured at 3� and ÿ3� revealed
several side chains, as well as the mercury ion and the
secondary binding position of 4-MI, with alternate confor-
mations. These residues were Ser50, Lys112, Gln136, Asp175,
Cys206 and Ser220. Alternate conformations for the three
clearest side chains (Ser50, Asp175 and Cys206) were gener-
ated in the graphics program O version 7 (Jones et al., 1991).
The improved phases from a further cycle of re®nement
resulted in a stronger indication of alternate conformations for
the remaining side chains (Lys112, Gln136 and Ser220) in the
(2m|Fo| ÿ D|Fc|) and (|Fo ÿ Fc|) maps. The alternate confor-
mations were modeled and re®ned, followed by an additional
cycle to re®ne the occupancy of the 4-MI molecule in the
secondary binding position as well as
the mercury ion. The Rwork and Rfree
after the re®nement of occupancy for
all side chains and the mercury ion
were 16.40 and 18.33%, respectively.
The ®nal stage of the re®nement
involved the generation of 1941 H
atoms according to the riding H-atom
model, resulting in a crystallographic
R factor of 15.73% and an Rfree of
17.73%.
3. Results and discussion
3.1. Model comparison
H64A HCA II complexed with two
4-MI molecules was re®ned to 1.05 AÊ
resolution with a crystallographic
Rfactor of 15.73% and an Rfree of
17.73% calculated on 5% of the
observed data. The re®ned model had
good overall geometry, with r.m.s.
deviations for bond lengths and angle
distances of 0.013 and 0.03 AÊ ,
respectively (Table 3). The Rama-
chandran statistics were determined
using the program PROCHECK
(Laskowski et al., 1993). 88.4% of the
Acta Cryst. (2003). D59, 93±104 Duda et al. � Carbonic anhydrase II 97
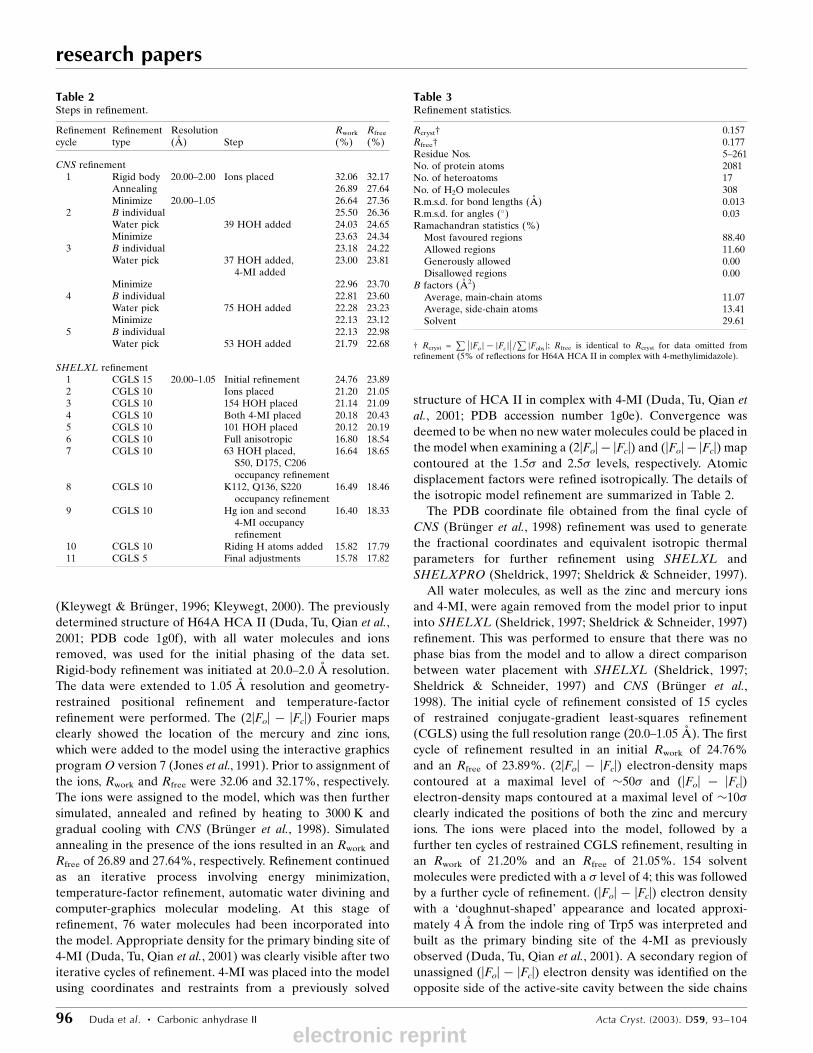
research papers
Figure 2Ramachandran diagram. A, B, C, most favoured regions; a, b, l, p,additional allowed regions; ~a, ~b, ~l, ~p, generously allowed regions.Plot created using PROCHECK (Laskowski et al., 1993).
Figure 3Thermal parameter plots. (a) Plot of the main-chain average B values versus residue number. Thesecondary-structural elements are color coded: red, �-strands; blue, �-helices; green, coil. (b) Plot ofthe residue-averaged B values versus residue number. The amino-acid residue type is color coded:yellow, Cys and Met; green, Phe, Tyr, Trp and His; cyan, Gly, Ala, Leu, Ile, Val and Pro; red, Glu andAsp; blue, Arg and Lys; purple, Gln and Asn; gray, Ser and Thr. (a) and (b) were created usingSHELXPRO (Sheldrick, 1997; Sheldrick & Schneider, 1997).
electronic reprint
research papers
98 Duda et al. � Carbonic anhydrase II Acta Cryst. (2003). D59, 93±104
dihedral angles were found to be in the most favored region,
with all others in the allowed region (Fig. 2). The average B
values for the main-chain and side-chain atoms were 11.1 and
13.4 AÊ 2, respectively (Table 3, Figs. 3a and 3b). 308 water
molecules were included in the ®nal model, with an average
isotropic B value of 29.6 AÊ 2 (Table 3).
A least-squares rigid-body superimposition of the current
high-resolution structure and the previously reported struc-
ture of H64A HCA II with (PDB code 1g0e) and without
(PDB code 1g0f) 4-MI was conducted using the program O
version 7 (Jones et al., 1991). The r.m.s. deviations for C� atoms
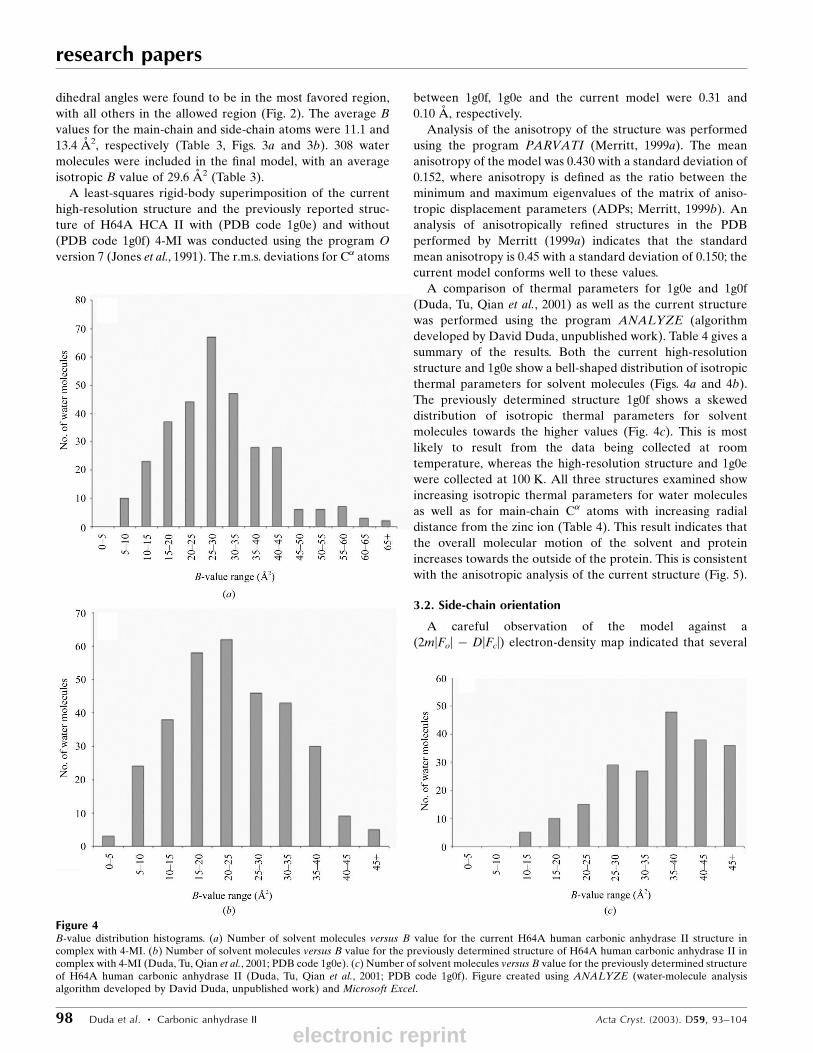
Figure 4B-value distribution histograms. (a) Number of solvent molecules versus B value for the current H64A human carbonic anhydrase II structure incomplex with 4-MI. (b) Number of solvent molecules versus B value for the previously determined structure of H64A human carbonic anhydrase II incomplex with 4-MI (Duda, Tu, Qian et al., 2001; PDB code 1g0e). (c) Number of solvent molecules versus B value for the previously determined structureof H64A human carbonic anhydrase II (Duda, Tu, Qian et al., 2001; PDB code 1g0f). Figure created using ANALYZE (water-molecule analysisalgorithm developed by David Duda, unpublished work) and Microsoft Excel.
between 1g0f, 1g0e and the current model were 0.31 and
0.10 AÊ , respectively.
Analysis of the anisotropy of the structure was performed
using the program PARVATI (Merritt, 1999a). The mean
anisotropy of the model was 0.430 with a standard deviation of
0.152, where anisotropy is de®ned as the ratio between the
minimum and maximum eigenvalues of the matrix of aniso-
tropic displacement parameters (ADPs; Merritt, 1999b). An
analysis of anisotropically re®ned structures in the PDB
performed by Merritt (1999a) indicates that the standard
mean anisotropy is 0.45 with a standard deviation of 0.150; the
current model conforms well to these values.
A comparison of thermal parameters for 1g0e and 1g0f
(Duda, Tu, Qian et al., 2001) as well as the current structure
was performed using the program ANALYZE (algorithm
developed by David Duda, unpublished work). Table 4 gives a
summary of the results. Both the current high-resolution
structure and 1g0e show a bell-shaped distribution of isotropic
thermal parameters for solvent molecules (Figs. 4a and 4b).
The previously determined structure 1g0f shows a skewed
distribution of isotropic thermal parameters for solvent
molecules towards the higher values (Fig. 4c). This is most
likely to result from the data being collected at room
temperature, whereas the high-resolution structure and 1g0e
were collected at 100 K. All three structures examined show
increasing isotropic thermal parameters for water molecules
as well as for main-chain C� atoms with increasing radial
distance from the zinc ion (Table 4). This result indicates that
the overall molecular motion of the solvent and protein
increases towards the outside of the protein. This is consistent
with the anisotropic analysis of the current structure (Fig. 5).
3.2. Side-chain orientation
A careful observation of the model against a
(2m|Fo| ÿ D|Fc|) electron-density map indicated that several
electronic reprint

amino-acid side chains were built incorrectly in 1g0e owing to
the ambiguity of the available resolution. The highest reso-
lution terms available for the assignment of side-chain orien-
tation in the previous structure were at 1.6 AÊ . The current
model represents an increase in resolution of 0.55 AÊ , which
allows a much better assignment of side-chain orientation and
atom type. Speci®cally, when contouring a (2m|Fo| ÿ D|Fc|)
electron-density map against the side chain of an Asn or Gln
residue, the identity of the position of the N and O atoms in
the amide group can be determined by the amount of electron
density at both positions, when contoured at an arbitrary but
equal level, provided that the density is well ordered. When
contouring the map the position of the O atom should contain
more electron density, owing to its larger scattering factor,
than the N-atom position. Using this criterion, three Gln side
chains (74, 103 and 137) and two Asn side chains (67 and 178)
were determined to be in the wrong orientation.
3.3. Alternate conformations of side chains
High-resolution structural information allows better inter-
pretation of structural disorder, including amino-acid side
chains that exhibit alternate conformations (Esposito et al.,
2000). Careful analysis of the structure revealed several
surface amino-acid side chains in alternate (A/B) conforma-
tions, including Ser50, Lys112, Gln136, Asp175, Cys206 and
Ser220 (Fig. 6). No interactions were observed for either
conformation of Ser50 (Fig. 6a). The NZ atom of Lys112 was
found to hydrogen bond with the carbonyl O atom of Lys113
with an NÐHÐO distance of 2.8 AÊ in the A conformation. No
interactions were seen for Lys112 in the B conformation
(Fig. 6b). No interactions were observed for Gln136 (Fig. 6c).
Asp175 has no interactions in the A conformation; however, in
the B conformation O�1 is 2.9 AÊ from Thr177 O 1 and most
likely forms a hydrogen bond (Fig. 6d). In the A conformation
Cys206 S lies 2.3 AÊ from and interacts with the mercury ion.
No interactions were observed for the B conformation of
Cys206 (Fig. 6e). Ser220 O is in a position 2.9 and 2.8 AÊ from
water molecules 577 and 382, respectively, in the A confor-
mation and O is 3.0 AÊ from of Glu221 O"1 in the B confor-
mation (Fig. 6f). Table 5 gives a complete listing of dihedral
Acta Cryst. (2003). D59, 93±104 Duda et al. � Carbonic anhydrase II 99
research papers
Table 4B-value distributions for solvent molecules and C� atoms.
(a) B-value distribution of solvent molecules by distance from zinc ion.
4-MI, current study 1g0e 1g0f
Distancebins (AÊ )
No.inbin
AverageB value(AÊ 2)
Averagedistance(AÊ )
No.inbin
AverageB value(AÊ 2)
Averagedistance(AÊ )
No.inbin
AverageB value(AÊ 2)
Averagedistance(AÊ )
0±5 5 24.63 3.46 5 18.69 3.79 3 32.96 3.485±10 11 26.95 7.2 9 17.92 6.92 8 29.91 7.0710±15 19 26.14 13.1 23 21.64 13.09 15 28.93 13.0315±20 100 26.29 17.67 97 20.16 17.7 60 32.88 17.8120±25 142 29.87 22.22 147 24.43 22.34 99 37.69 22.4225+ 31 37.2 26.49 37 30.64 26.79 27 42.44 27.58
(b) B-value distribution of solvent molecules.
4-MI, current study 1g0e 1g0f
B-valuebins(AÊ 2)
No. inbin
Average Bvalue (AÊ 2)
No. inbin
Average Bvalue (AÊ 2)
No. inbin
Average Bvalue (AÊ 2)
0±5 0 0.00 3 3.29 0 0.005±10 10 8.80 24 7.86 0 0.0010±15 23 12.92 38 13.03 5 13.0415±20 37 17.69 58 17.44 10 18.0220±25 44 22.33 62 22.26 15 22.5025±30 67 27.38 46 26.95 29 27.4430±35 47 32.21 43 32.12 27 32.8635±40 28 37.28 30 37.15 48 37.7240±45 28 42.42 9 41.92 38 42.5845±50 6 48.07 5 46.78 36 47.3550±55 6 52.12 055±60 7 57.58 060±65 3 62.83 065+ 2 72.77 0
(c) B-value distribution of C� atoms by distance from zinc ion.
4-MI, current study 1g0e 1g0f
B-valuebins (AÊ 2)
No. inbin
Average Bvalue (AÊ 2)
No. inbin
Average Bvalue (AÊ 2)
No. inbin
Average Bvalue (AÊ 2)
0±5 0 0.00 0 0.00 0 0.005±10 26 6.55 25 3.71 26 10.1710±15 56 7.87 58 5.16 55 12.5615±20 108 10.57 109 8.73 109 16.7920±25 59 14.75 60 12.66 59 21.1125+ 7 23.39 6 17.83 9 30.63
Figure 5ORTEP thermal ellipsoid diagram representing the overall anisotropy ofhuman carbonic anhydrase II H64A in complex with 4-methylimidazole.C, O and N atoms are colored gray, red and blue, respectively. Figurecreated using RASTEP (Merritt, 1999a) and rendered with Raster3D(Merritt & Bacon, 1997).
electronic reprint

research papers
100 Duda et al. � Carbonic anhydrase II Acta Cryst. (2003). D59, 93±104
angles between the A and B conformations and re®ned
occupancies.
3.4. Mercury-binding site
Crystallization of HCA II in the presence of organomercury
compounds has been shown to enhance crystal quality
(Tilander et al., 1965). The binding site of the mercury ion on
the surface of HCA II has been previously reported (Duda,
Tu, Qian et al., 2001). The primary interaction was indicated
between the mercury ion and Cys206 S at a distance of 2.3 AÊ ,
with additional ligand interactions donated from the carbonyl
O atoms of Gln137 (at a distance of 2.9 AÊ ), Glu205 (at a
distance of 3.2 AÊ ) and water molecule 271, which is 2.4 AÊ away
from the mercury ion. In the current model, inspection of the
(2m|Fo| ÿ D|Fc|) and (|Fo| ÿ |Fc|) maps indicated that the
mercury ion was occupying two spatial positions with respect
to Cys206 S , which also was clearly seen with two distinct
positions in the (2m|Fo| ÿ D|Fc|) and (|Fo| ÿ |Fc|) maps
(Fig. 6e). Both Cys206 and the mercury ion were assigned
separate free variables (FVAR) in SHELXL (Sheldrick, 1997;
Sheldrick & Schneider, 1997) and their occupancies in both
positions were re®ned. The mercury ion had occupancies of
0.74 and 0.26 for positions A and B, respectively (Table 5). The
side chain of Cys206 had occupancies of 0.72 and 0.28 for
positions A and B, respectively (Table 5). The signi®cantly
higher occupancy values seen for position A indicates a
tendency toward the bound state between the mercury ion and
Cys206. It is interesting to note the similarity in occupancy
values between the mercury ion and
Cys206 indicating a correlation between
the bound and unbound states of the
mercury ion and its ligand Cys206.
In the bound-state interaction (posi-
tion A for both the mercury ion and
Cys206) the coordination of the mercury
ion is very similar to that reported by
Duda, Tu, Qian et al. (2001). The primary
ligand interaction is between Cys206 S
at a distance of 2.3 AÊ . The carbonyl O
atoms of Glu137 and Gln205 as well as
water molecule 421 contribute additional
electrostatic interactions at distances of
2.9, 3.2 and 2.4 AÊ , respectively (Fig. 7). In
the unbound state (position B for both
the mercury ion and Cys206) the side
chain of Cys206 undergoes a 90� rotation
about �1 away from the mercury ion
(Table 5) and no longer serves as a
ligand. The interactions seen between
the carbonyl O atoms of Gln137 and
Glu205 are also absent in the unbound
state. The mercury ion does however
remain bound to water molecule 421,
although at a greater distance (3.0 AÊ )
than seen in the bound state, and gains a
hydrogen-bond interaction with water
Figure 6Alternate conformations modeled for (a) Ser50, (b) Lys112, (c) Gln136, (d) Asp175, (e) Cys206and the mercury ion, (f) Ser220. Conformation A is represented in all panels by a blue stickdiagram and conformation B is represented by a orange stick diagram. Relevant interactions areindicated by an orange dashed line. (2|Fo| ÿ |Fc|) electron density (grey mesh) contoured at 1.5�shows the quality of the maps used to model the alternate conformations.
Table 5Occupancy re®nement of side-chain alternate conformations.
Residue ConformerOccupancy(AÊ 2)
'(�)
(�)
�1
(�)�2
(�)�3
(�)�4
(�)
Ser50 A 0.78 ÿ113 93 ÿ57 Ð Ð ÐB 0.22 ÿ113 93 172 Ð Ð Ð
Lys112 A 0.45 ÿ70 125 177 ÿ169 172 ÿ19B 0.55 ÿ70 125 177 ÿ169 172 78
Gln136 A 0.49 ÿ99 9 ÿ71 174 87 ÐB 0.51 ÿ99 9 ÿ56 172 12 Ð
Asp175 A 0.63 ÿ59 137 ÿ53 ÿ64 Ð ÐB 0.37 ÿ59 137 ÿ176 ÿ78 Ð Ð
Cys206 A 0.72 ÿ135 4 ÿ37 Ð Ð ÐB 0.28 ÿ135 4 54 Ð Ð Ð
Ser220 A 0.65 ÿ57 ÿ40 172 Ð Ð ÐB 0.35 ÿ57 ÿ40 48 Ð Ð Ð
Hg2+ A 0.74 Ð Ð Ð Ð Ð ÐB 0.26 Ð Ð Ð Ð Ð Ð
Table 6Active-site geometry around the zinc ion.
Active-site angles (�)His119 N�2ÐZnÐHis96 N"2 97.53His119 N�2ÐZnÐHis94 N"2 108.04His119 N�2Ð ZnÐWat556 125.35His96 N"2ÐZnÐWat556 127.78His96 N"2ÐZnÐHis94 N"2 97.24His94 N"2ÐZnÐWat556 95.98
Active-site distances (AÊ )His119 N�2ÐZn 2.10His96 N"2ÐZn 2.08His94 N"2ÐZn 2.15Wat556ÐZn 1.80
electronic reprint
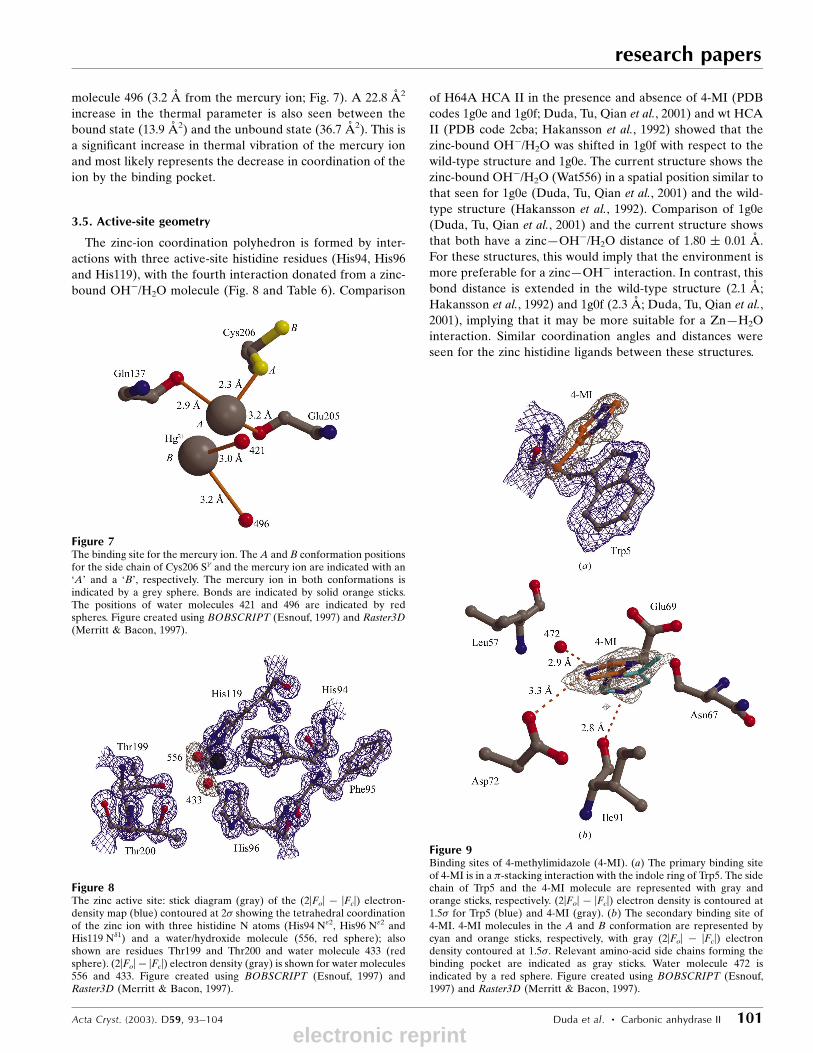
molecule 496 (3.2 AÊ from the mercury ion; Fig. 7). A 22.8 AÊ 2
increase in the thermal parameter is also seen between the
bound state (13.9 AÊ 2) and the unbound state (36.7 AÊ 2). This is
a signi®cant increase in thermal vibration of the mercury ion
and most likely represents the decrease in coordination of the
ion by the binding pocket.
3.5. Active-site geometry
The zinc-ion coordination polyhedron is formed by inter-
actions with three active-site histidine residues (His94, His96
and His119), with the fourth interaction donated from a zinc-
bound OHÿ/H2O molecule (Fig. 8 and Table 6). Comparison
of H64A HCA II in the presence and absence of 4-MI (PDB
codes 1g0e and 1g0f; Duda, Tu, Qian et al., 2001) and wt HCA
II (PDB code 2cba; Hakansson et al., 1992) showed that the
zinc-bound OHÿ/H2O was shifted in 1g0f with respect to the
wild-type structure and 1g0e. The current structure shows the
zinc-bound OHÿ/H2O (Wat556) in a spatial position similar to
that seen for 1g0e (Duda, Tu, Qian et al., 2001) and the wild-
type structure (Hakansson et al., 1992). Comparison of 1g0e
(Duda, Tu, Qian et al., 2001) and the current structure shows
that both have a zincÐOHÿ/H2O distance of 1.80 � 0.01 AÊ .
For these structures, this would imply that the environment is
more preferable for a zincÐOHÿ interaction. In contrast, this
bond distance is extended in the wild-type structure (2.1 AÊ ;
Hakansson et al., 1992) and 1g0f (2.3 AÊ ; Duda, Tu, Qian et al.,
2001), implying that it may be more suitable for a ZnÐH2O
interaction. Similar coordination angles and distances were
seen for the zinc histidine ligands between these structures.
Acta Cryst. (2003). D59, 93±104 Duda et al. � Carbonic anhydrase II 101
research papers
Figure 8The zinc active site: stick diagram (gray) of the (2|Fo| ÿ |Fc|) electron-density map (blue) contoured at 2� showing the tetrahedral coordinationof the zinc ion with three histidine N atoms (His94 N"2, His96 N"2 andHis119 N�1) and a water/hydroxide molecule (556, red sphere); alsoshown are residues Thr199 and Thr200 and water molecule 433 (redsphere). (2|Fo|ÿ |Fc|) electron density (gray) is shown for water molecules556 and 433. Figure created using BOBSCRIPT (Esnouf, 1997) andRaster3D (Merritt & Bacon, 1997).
Figure 9Binding sites of 4-methylimidazole (4-MI). (a) The primary binding siteof 4-MI is in a �-stacking interaction with the indole ring of Trp5. The sidechain of Trp5 and the 4-MI molecule are represented with gray andorange sticks, respectively. (2|Fo| ÿ |Fc|) electron density is contoured at1.5� for Trp5 (blue) and 4-MI (gray). (b) The secondary binding site of4-MI. 4-MI molecules in the A and B conformation are represented bycyan and orange sticks, respectively, with gray (2|Fo| ÿ |Fc|) electrondensity contoured at 1.5�. Relevant amino-acid side chains forming thebinding pocket are indicated as gray sticks. Water molecule 472 isindicated by a red sphere. Figure created using BOBSCRIPT (Esnouf,1997) and Raster3D (Merritt & Bacon, 1997).
Figure 7The binding site for the mercury ion. The A and B conformation positionsfor the side chain of Cys206 S and the mercury ion are indicated with an`A' and a `B', respectively. The mercury ion in both conformations isindicated by a grey sphere. Bonds are indicated by solid orange sticks.The positions of water molecules 421 and 496 are indicated by redspheres. Figure created using BOBSCRIPT (Esnouf, 1997) and Raster3D(Merritt & Bacon, 1997).
electronic reprint

research papers
102 Duda et al. � Carbonic anhydrase II Acta Cryst. (2003). D59, 93±104
3.6. 4-MI binding sites
Previous crystallographic analysis of HCA II in complex
with 4-MI showed that the primary binding site for 4-MI
occupied a position approximately 4 AÊ from the indole ring of
Trp5 and was stabilized through a �-stacking interaction
(Duda, Tu, Qian et al., 2001). The same primary binding site
for 4-MI near the indole ring of Trp5 was identi®ed in the
current high-resolution structural study (Fig. 9a). It was found
that the positions of the 4-MI N�1 and N"2 atoms were 12.3 and
13.5 AÊ from the zinc ion, which is very similar to the previous
structure which placed the 4-MI N�1 and N"2 atoms 12.0 and
13.4 AÊ from the zinc ion, respectively. The isotropic thermal
parameter for 4-MI in the primary position is 25.4 AÊ 2, which is
4.2 AÊ 2 less than the average solvent B factor of 29.6 AÊ 2 and
indicates the stability of the molecule at this position.
A second binding site for 4-MI was also identi®ed on the
opposite side of the active-site cavity from the primary posi-
tion near Trp5. In this position the 4-MI molecule was
modeled in two distinct conformations, with occupancies of
0.36 and 0.64 for the A and B positions, respectively. In this
position the 4-MI molecule is bound in a pocket formed by the
side chains of Glu69, Ile91, Asp72 and, to a lesser extent,
Leu57 and Asn67 (Fig. 9b). In the binding pocket the A
conformation of the 4-MI molecule is stacked in a linear
fashion between the side chains of Glu69 (3.9 AÊ between 4-MI
N"2 and Glu69 C�) and Ile91 (3.7 AÊ between 4-MI C and
Ile91 C 1). A weak hydrogen bond is also seen between 4-MI
N"2 and Asp72 O�1 with a distance of 3.3 AÊ between them in
the A conformation. Additional weak stacking interactions are
seen between 4-MI C"1 and Leu57 C at a distance of 6.8 AÊ
and between 4-MI C�2 and Asn67 C at a distance of 6.6 AÊ for
the A conformation of 4-MI. Similar interactions in the
binding pocket were seen for 4-MI in the B conformation
(Fig. 8b). The linear stacking interaction between Glu69, 4-MI
and Ile91 was preserved with a distance between 4-MI C and
Glu69 C� of 4.9 AÊ and a distance between 4-MI C and Ile C 1
of 3.7 AÊ . The hydrogen-bond interaction seen between
4-MI N"2 and Asp72 O�1 is slightly more stable at a distance of
3.2 AÊ . Leu57 and Asn67 are further away, at distances of 7.1
and 8.6 AÊ , respectively. Additional interactions within the
binding pocket are also seen in the B conformation that are
not present in the A conformation. A strong hydrogen bond at
a distance of 2.8 AÊ is seen between 4-MI N"2 and the carbonyl
O atom of Ile91, as well as a hydrogen bond between 4-MI N�1
and water molecule 472 (2.9 AÊ ). Water molecule 472 also
shares a hydrogen bond with the carbonyl O atom of Phe70
(2.7 AÊ ) and water molecule 441 (2.8 AÊ ) in the active site.
The 4-MI N�1 and N"2 atoms are slightly further from the
zinc ion in the secondary binding position. In the A confor-
mation N�1 and N"2 are 15.0 and 13.3 AÊ from the zinc ion,
respectively. In the B conformation N�1 and N"2 are further
from the zinc ion, with respective distances of 15.2 and 16.6 AÊ .
The 4-MI molecule seems to be vibrating between the side
chains of Glu69 and Ile91 and shifting preferentially toward
Asp72 as well as making additional interactions with the
carbonyl O atom of Ile91 and water molecule 472 as it
undergoes transition from the A conformation to the B
conformation. The higher occupancy seen for the B confor-
mation indicates a more stable interaction with the binding
pocket derived from these additional contacts. The isotropic B
values for the A and B conformation of 4-MI in the secondary
binding site were 25.1 and 27.5 AÊ 2, respectively. Both confor-
mations have B values less than the solvent average of 29.6 AÊ 2,
indicating the stability of the 4-MI molecules at this position.
Table 7Bond distances and angles in the active-site solvent channel.
Solvent-channel angles (�) Solvent-channel distances (AÊ )
ZnÐ556ÐThr199 O 1 87.47 556Ð611 2.48ZnÐ556Ð611 107.02 556Ð424 2.47ZnÐ556Ð424 165.05 556ÐThr199 O 1 3.16ZnÐ556Ð433 109.25 556Ð433 2.41556Ð424ÐThr199 N 127.59 424ÐThr199 N 3.17556Ð433ÐThr200 O 1 116.74 433Ð375 2.82556Ð433Ð345 127.76 433ÐThr200 O 1 3.04556Ð433Ð375 110.55 433Ð345 2.45433Ð375ÐGln92 N"2 141.61 375ÐGln92 N"2 3.13433Ð375Ð314 86.59 375Ð314 2.92433Ð345Ð314 98.34 314ÐAsn67 N�2 2.70433Ð345Ð320 126.96 314ÐAsn62 N�2 3.00375Ð314ÐAsn67 N�2 103.52 314Ð523 4.13375Ð314ÐAsn62 N�2 114.40 345Ð314 2.73375Ð314Ð523 75.42 345Ð320 2.84375Ð314Ð345 83.87 320ÐAla64 O 2.91314Ð523Ð512 99.74 320ÐTyr7 OH 2.78314Ð345Ð320 134.69 523Ð512 2.29523Ð512Ð4-MI N�1 105.12 512Ð4-MI N�1 4.10345Ð320ÐAla64 O 111.24345Ð320ÐTyr7 OH 118.35
Figure 10Active-site solvent network. The zinc ion and water molecules areindicated by black and red spheres, respectively. An omit map (blue)contoured at 3.0� indicates the quality of the electron density used todetermine the positions of the water molecules in the active site. Severalimportant active-site amino-acid side chains are indicated as gray sticks.The positions of the 4-methylimidazole (4-MI) molecules (orange sticks)in relation to Trp5 in the primary binding site as well as to Ile91 and Glu69in the secondary binding site are indicated. Interactions between solventmolecules and non-protein atoms (other solvent and 4-MI molecules) areindicated by solid orange sticks. Interactions between solvent moleculesand protein atoms are indicated by solid blue sticks. Figure created usingBOBSCRIPT (Esnouf, 1997) and Raster3D (Merritt & Bacon, 1997).
electronic reprint
The transition between the A and B conformations may
reveal an important feature of proton transfer in HCA II. In
the more stable B state, the 4-MI N�1 and N"2 atoms are
involved in stabilizing interactions within the binding pocket
and would not be capable of donating/accepting protons to/
from the active-site solvent network. In the less stable A state,
however, the N atoms are more free to participate in the
proton-transfer process.
3.7. Active-site solvent network
The high resolution of this X-ray structure has allowed the
direct observation of 308 water molecules in the model and
allows a more extensive description of the active solvent
network of HCA II to be made (Fig. 10 and Table 7).
The zinc-bound OHÿ/H2O (water molecule 556) lies 3.2 AÊ
from Thr199 O 1, forming a hydrogen bond, and has three
other potential interactions with water molecules 611, 424 and
433, which are located 2.5, 2.5 and 2.4 AÊ away, respectively.
Water molecule 424 serves as the `deep water' and hydrogen
bonds to the backbone N atom of Thr199 (Lindskog, 1997).
Water molecule 611 shares no other interactions within the
active site. It is interesting to note that water 611 is in a
position 3.3 AÊ from the zinc ion and shares continuous
(2m|Fo| ÿ D|Fc|) electron density with the zinc-bound OHÿ/
H2O (556). It is possible that what is observed is the transition
from a zinc-bound OHÿ to a zinc-bound H2O group. Water
molecule 433 hydrogen bonds to Thr200 O 1, with further
interactions with waters 345 and 375 at distances of 2.5 and
2.8 AÊ , respectively. Water molecule 320 is hydrogen bonded to
water 345 (2.8 AÊ ), with further interactions with the carbonyl
O atom of Ala64 and OHÿ of Tyr7. This proton wire consisting
of 556±433±345±320 is similar to that observed by Eriksson et
al. (1988).
Water molecule 375 interacts with the side-chain N"2 of
Gln92 and shares an additional hydrogen bond with water 314
(2.9 AÊ ). Water 314 interacts with the side-chain N�2 atom of
Asn62 and with Asn67 O�1. Water molecules 523 and 512
extend out from the position of water 314 to bridge the
remaining distance to the N�1 atom of 4-MI in its primary
binding site near the indole ring of Trp5 (Figs. 8a and 9). The
distance between water 314 and 523 as well as between water
512 and 4-MI N�1 is 4.1 AÊ . This distance is too great for a
hydrogen-bond interaction to occur, but might serve as a weak
electrostatic interaction that pulls the proton from water 512
to 4-MI N�1 when the proton wire is functional.
Water molecule 372 hydrogen bonds to both the side-chain
N�2 atom of Asn67 and to Glu69 O"2 (interacting distances of
2.9 and 2.5 AÊ , respectively). The coordination of water 372
between the side chains of Asn67 and Glu69 could serve to
stabilize their positions in the active site. Water molecule 441
hydrogen bonds to Glu69 O"1 (2.8 AÊ ) and interacts with water
472 and 488 (2.8 and 3.0 AÊ , respectively). Water molecule 472
is stabilized by a hydrogen bond to the backbone carbonyl O
atom of Phe70 (2.7 AÊ ) and interacts with 4-MI N�1 in the A
conformation of the secondary binding site (Figs. 9b and 10).
4. Conclusions
We report here the structure of H64A HCA II complexed with
4-MI at 1.05 AÊ resolution, representing the highest resolved
structure of CA reported to date. The atomic resolution model
has been fully anisotropically re®ned and allowed the identi-
®cation and correction of several amino-acid side chains in
incorrect orientations. Amino acids with alternate side-chain
conformations were also identi®ed and fully re®ned.
A mercury ion was found to occupy two distinct spatial
positions relative to residue Cys206 (the primary ligand).
Residue Cys206 was also observed in alternate conformations
which coincided with the positions of the mercury ion.
The high-resolution model has also allowed the complete
mapping and re®nement of water molecules in the active site
of H64A HCA II. The accuracy of the positions of the active-
site water molecules has allowed a more in-depth analysis of
the protein±water molecule interactions as well as the water±
water interactions. The extensive water pathways leading `out'
from the zinc ion give reason to suspect there is more than just
a `primary' proton wire linking the zinc-bound H2O and His64
(Eriksson et al., 1988). This has been shown by the mutant
His64Ala, which has a reduction in proton-transfer activity
(kcat) from 1 � 106 sÿ1 in wild-type HCA II to 1 � 103 sÿ1 (Tu
et al., 1989). This reduction in activity is at the level observed
for wild-type human carbonic anhydrase III, indicating a
signi®cant level of proton-transfer activity remaining in H64A
HCA II (Silverman & Lindskog, 1988). This base level of
activity for H64A HCA II (kcat of 1� 103 sÿ1) is most likely to
be a consequence of the extensive water network in the active
site forming `secondary' proton wires.
The structure therefore gives insight into proton transfer as
well as chemical rescue through the identi®cation of a second
binding site for 4-MI in the active-site cavity. This is the ®rst
reported observation of multiple binding sites for proton-
transfer chemical rescue molecules in HCA II and indicates
the possibility of a more complex nature for the proton-
transfer process. Also, the discovery of a secondary hydrogen-
bonded proton wire to 4-MI in an alternate site involving
several amino-acid side chains (Asn67 and Glu69) may give
validity to the possibility of the existence of secondary proton
wires.
The authors thank the staff at the Cornell High Energy
Synchrotron Source (CHESS) for their help and support at the
F1 station during X-ray data collection. We also thank Philip
Laipis (University of Florida) and Minzhang Quian (Univer-
sity of Florida) for preparation of the H64A HCA II expres-
sion system and Joseph Gilboa (Weizmann Institute, Israel
and Visiting Professor at the University of Florida) for critical
discussions. This work was supported by grants from the
National Institutes of Health GM25154 (DNS) and the
Thomas H. Maren Foundation (RM).
References
An, H., Tu, C., Duda, D., Montanez-Clemente, I., Math, K., Laipis,P. J., McKenna, R. & Silverman, D. N. (2002). Biochemistry, 41,3235±3242.
Acta Cryst. (2003). D59, 93±104 Duda et al. � Carbonic anhydrase II 103
research papers
electronic reprint
research papers
104 Duda et al. � Carbonic anhydrase II Acta Cryst. (2003). D59, 93±104
BruÈ nger, A. T., Adams, P. D., Clore, G. M., DeLano, W. L., Gros, P.,Grosse-Kunstleve, R. W., Jiang, J. S., Kuszewski, J., Nilges, M.,Pannu, N. S., Read, R. J., Rice, L. M., Simonson, T. & Warren, G. L.(1998). Acta Cryst. D54, 905±921.
Christianson, D. W. & Cox, J. D. (1999). Annu. Rev. Biochem. 68, 33±57.
Christianson, D. W. & Fierke, C. A. (1996). Acc. Chem. Res. 29, 331±339.
Cox, J. D., Hunt, J. A., Compher, K. M., Fierke, C. A. & Christianson,D. W. (2000). Biochemistry, 39, 13687±13694.
Dauter, Z., Lamzin, V. S. & Wilson, K. S. (1997). Curr. Opin. Struct.Biol. 7, 681±688.
Duda, D., Tu, C. K., Qian, M., Laipis, P., Agbandje-Mckenna, M.,Silverman, D. N. & Mckenna, R. (2001). Biochemistry, 40, 1741±1748.
Duda, D., Tu, C. K., Silverman, D. N., Kalb (Gilboa), A. J., McKenna,M. A. & McKenna, R. (2001). Protein Pept. Lett. 8, 63±67.
Eriksson, A. E., Jones, T. A. & Liljas, A. (1988). Proteins Struct.Funct. Genet. 4, 274±282.
Esnouf, R. M. (1997). J. Mol. Graph. 15, 132±134.Esposito, L., Vitagliano, L., Sica, F., Sorrentino, G., Zagari, A. &
Mazzarella, L. (2000). J. Mol. Biol. 297, 713±732.Ferraroni, M., Rypniewski, W., Wilson, K. S., Viezzoli, M. S., Banci,
L., Bertini, I. & Mangani, S. (1999). J. Mol. Biol. 285, 413±426.Freitag, S., Le Trong, I., Klumb, L. A., Stayton, P. S. & Stenkamp, R. E.
(1999). Acta Cryst. D55, 1118±1126.Hewett-Emmett, D. & Tashian, R. E. (1996). Mol. Phylogenet. Evol.5, 50±77.
Hakansson, K., Carlsson, M., Svensson, L. A. & Liljas, A. (1992). J.Mol. Biol. 227, 1192±1204.
Jones, T. A., Zou, J. Y., Cowan, S. W. & Kjeldgaard, M. (1991). ActaCryst. A47, 110±119.
Khalifah, R. G., Strader, D. J., Bryant, S. H. & Gibson, S. M. (1977).Biochemistry, 16, 2241±2247.
Kleywegt, G. J. (2000). Acta Cryst. D56, 249±265.
Kleywegt, G. J. & BruÈ nger, A. T. (1996). Structure, 4, 897±904.Laskowski, R. A., MacArthur, M. W., Moss, D. S. & Thornton, J. M.
(1993). J. Appl. Cryst. 26, 283±291.Lindskog, S. (1997). Pharmacol. Ther. 74, 1±20.Longhi, S., Czjzek, M. & Cambillau, C. (1998). Curr. Opin. Struct.Biol. 8, 730±738.
Merritt, E. A. (1999a). Acta Cryst. D55, 1109±1117.Merritt, E. A. (1999b). Acta Cryst. D55, 1997±2004.Merritt, E. A. & Bacon, D. J. (1997). Methods Enzymol. 277, 505±
524.Nair, S. K. & Christianson, D. W. (1991). J. Am. Chem. Soc. 113, 9455±
9458.Otwinowski, Z. & Minor, W. (2001). International Tables forCrystallography, Vol. F, edited by M. G. Rossmann & E. Arnold,pp. 226±235. Dordrecht: Kluwer Academic Publishers.
Parkkila, S. (2000). The Carbonic Anhydrases: New Horizons, editedby W. R. Chegwidden, N. D. Carter & Y. H. Edwards, pp. 79±94.Berlin: Birkhauser Verlag.
Ridder, I. S., Rozeboom, H. J. & Dijkstra, B. W. (1999). Acta Cryst.D55, 1273±1290.
Sheldrick, G. M. (1990). Acta Cryst. A46, 467±473.Sheldrick, G. M. (1997). The SHELX97 Manual, University of
GoÈ ttingen, GoÈ ttingen, Germany.Sheldrick, G. M. & Schneider, T. R (1997). Methods Enzymol. 227,
319±343.Silverman, D. N. & Lindskog, S. (1988). Acc. Chem. Res. 21, 30±36.Silverman, D. N. & Lindskog, S. (2000). The Carbonic Anhydrases:New Horizons, edited by W. R. Chegwidden, N. D. Carter & Y. H.Edwards, pp. 175±195. Berlin: Birkhauser Verlag.
Tanhauser, S. M., Jewell, D. A., Tu, C. K., Silverman, D. N. & Laipis,P. J. (1992). Gene, 117, 113±117.
Tilander, B., Strandeberg, B. & Fridborg, K. (1965). J. Mol. Biol. 12,740±760.
Tu, C. K., Silverman, D. N., Forsman, C., Jonsson, B. H. & Lindskog, S.(1989). Biochemistry, 28, 7913±7918.
electronic reprint
Related Documents