The Real Effects of Modern Information Technologies * Itay Goldstein a , Shijie Yang b , Luo Zuo c a Wharton School, University of Pennsylvania b School of Management and Economics, Chinese University of Hong Kong, Shenzhen c Samuel Curtis Johnson Graduate School of Management, Cornell University December 2020 Abstract Using the staggered implementation of the EDGAR system from 1993 to 1996 as a shock to information dissemination technologies, we examine the potential benefits and costs of modern information technologies on the real economy. On the one hand, we document results confirming the conventional wisdom that broader information dissemination leads to an increase in the level of equity financing and corporate investment. On the other hand, we provide evidence that greater dissemination of corporate disclosures crowds out private information acquisition and reduces managerial learning from stock prices. This crowding- out effect, while often overlooked, is particularly pronounced in high-growth firms. Our findings suggest that it is important to consider this tradeoff between improved equity financing and reduced managerial learning when evaluating the economic effects of modern information technologies. Our evidence suggests that the former effect dominates in value firms while the latter effect dominates in high-growth firms. Keywords: Corporate Investment, Information Technologies, EDGAR, Equity Financing, Managerial Learning. JEL Classification: G12, G14, G31, M41. * We gratefully acknowledge helpful comments from John Core, Andrew Leone, Chen Lin, K. Ramesh, Sugata Roychowdhury, Eric So, Sri Sridhar, Rodrigo Verdi, and Joseph Weber, as well as seminar participants at Cornell University, the Massachusetts Institute of Technology, Northwestern University, Wuhan University, and the 2020 Virtual Conference of Accounting Society of China.

Welcome message from author
This document is posted to help you gain knowledge. Please leave a comment to let me know what you think about it! Share it to your friends and learn new things together.
Transcript
The Real Effects of Modern Information Technologies*
Itay Goldstein a, Shijie Yang b, Luo Zuo c
a Wharton School, University of Pennsylvania
b School of Management and Economics, Chinese University of Hong Kong, Shenzhen c Samuel Curtis Johnson Graduate School of Management, Cornell University
December 2020
Abstract
Using the staggered implementation of the EDGAR system from 1993 to 1996 as a shock
to information dissemination technologies, we examine the potential benefits and costs of
modern information technologies on the real economy. On the one hand, we document
results confirming the conventional wisdom that broader information dissemination leads
to an increase in the level of equity financing and corporate investment. On the other hand,
we provide evidence that greater dissemination of corporate disclosures crowds out private
information acquisition and reduces managerial learning from stock prices. This crowding-
out effect, while often overlooked, is particularly pronounced in high-growth firms. Our
findings suggest that it is important to consider this tradeoff between improved equity
financing and reduced managerial learning when evaluating the economic effects of
modern information technologies. Our evidence suggests that the former effect dominates
in value firms while the latter effect dominates in high-growth firms.
Keywords: Corporate Investment, Information Technologies, EDGAR, Equity Financing,
Managerial Learning.
JEL Classification: G12, G14, G31, M41.
* We gratefully acknowledge helpful comments from John Core, Andrew Leone, Chen Lin, K. Ramesh, Sugata
Roychowdhury, Eric So, Sri Sridhar, Rodrigo Verdi, and Joseph Weber, as well as seminar participants at Cornell
University, the Massachusetts Institute of Technology, Northwestern University, Wuhan University, and the 2020
Virtual Conference of Accounting Society of China.
1
1. Introduction
A fundamental question in financial economics is whether and how information disclosure
in financial markets affects the real economy (Goldstein and Yang 2017). To understand this
question, a large literature in accounting and finance has developed to examine the effects of
financial reporting and disclosure on corporate investment (Roychowdhury, Shroff, and Verdi
2019). Prior research on the real effects of corporate disclosures often assumes that accounting
information, once disclosed by a firm, is costlessly disseminated and equally available to the
investing public. However, a different line of research shows that the costs of monitoring for,
acquiring, and analyzing firm disclosures can be substantial (Lee and So 2015; Blankespoor,
deHaan, and Marinovic 2020). In this paper, we examine whether and how investors’ costs of
accessing firm disclosures affect corporate investment by exploiting the emergence of modern
information technologies that reduce these costs.
Modern information technologies have greatly facilitated timely dissemination of
information to a broad base of investors at low costs (Gao and Huang 2020). With technological
advances, the U.S. Securities and Exchange Commission (SEC) has implemented a series of
regulatory changes to improve the public’s accessibility of firm disclosures. For example, in 1993
the SEC began to mandate electronic submission of corporate filings through the Electronic Data
Gathering, Analysis, and Retrieval (EDGAR) system, and in 2013 the SEC allowed companies to
use social media outlets (e.g., Facebook and Twitter) to announce key information. The rationale
of these regulatory reforms often follows the conventional wisdom: greater and broader
information dissemination can lead to an increase in the amount of total information in the
marketplace, which improves the functioning of the financial market and firms’ access to external

2
capital, thereby allowing firms to tap into new investment opportunities (e.g., Bernanke and Gertler
1989; Kiyotaki and Moore 1997).
While intuitive, this line of reasoning is incomplete because it misses an important feature
of real-world financial markets: most trading occurs in secondary markets where securities are
traded among investors without capital flowing to firms. Bond, Edmans, and Goldstein (2012) note
that secondary market prices can significantly affect the real economy because these prices convey
useful information to corporate managers. Hence, to evaluate the economic effects of modern
information technologies on firms, we need to consider how these technologies affect not only the
extent to which prices reflect all available information (i.e., forecasting price efficiency) but also
the extent to which prices reveal new information to managers (i.e., revelatory price efficiency).
These two types of price efficiency are often different from each other, and the latter is manifested
in managerial actions. In this paper, we investigate the potential benefits and costs of modern
information technologies on firms by considering both types of price efficiency. Importantly, we
assess whether and when the benefits exceed the costs and vice versa.
Traditional models predict that a decline in information acquisition costs leads to an
increase in forecasting price efficiency (Verrecchia 1982; Diamond 1985). Gao and Huang (2020)
provide evidence supporting this prediction. Thus, the benefits of modern information technologies
are relatively straightforward. However, we argue that modern information technologies can also
entail costs on firms (besides the initial implementation costs). Under the managerial learning
perspective, whether information technologies enhance or impede real efficiency depends on its
net effect on revelatory price efficiency, which can move in an opposite direction from forecasting
price efficiency (Bond, Edmans, and Goldstein 2012). The notion of revelatory price efficiency
3
builds on the idea that prices are a useful source of information (Hayek 1945).1 Stock prices can
reveal traders’ private information that is otherwise not available to managers (Grossman and
Stiglitz 1980; Glosten and Milgrom 1985; Kyle 1985; Easley and O’Hara 1987), and hence can
affect managers’ forecasts about their own firms’ fundamentals (Zuo 2016; Jayaraman and Wu
2020) and their investment decisions (Dye and Sridhar 2002; Luo 2005; Chen, Goldstein, and Jiang
2007).2
By definition, the extent of revelatory price efficiency is manifested in changes in
managerial behavior.3 There is no direct measure of revelatory price efficiency, and prior research
largely relies on the investment-to-price sensitivity framework to draw inferences on managerial
learning (e.g., Chen, Goldstein, and Jiang 2007; Bakke and Whited 2010; Foucault and Frésard
2012, 2014; Bai, Philippon, and Savov 2016; Edmans, Jayaraman, and Schneemeier 2017;
Dessaint, Foucault, Frésard, and Matray 2019; Jayaraman and Wu 2019; Lin, Liu, and Sun 2019).
The intuition is that the sensitivity of investment to price will be stronger when movements in the
price are more likely to originate from information that is new to the manager than from
information that was already known to her. We develop a stylized model in Section 4 to illustrate
the basic mechanism underlying this general prediction.
1 Fama and Miller (1972, p. 335) note: “(An efficient market) has a very desirable feature. In particular, at any point
in time market prices of securities provide accurate signals for resource allocation; that is, firms can make production-
investment decisions …” Rappaport (1987) further note: “(Managers) can learn a lot if they analyze what the stock
price tells them about the market’s expectations for their company’s performance.” George Soros (a prominent trader)
calls this feature “reflexivity” and state: “Stock prices are not merely passive reflections; they are active ingredients
in the process in which both stock prices and the fortunes of companies whose stocks are traded are determined”
(Soros 1994, p. 49). 2 As a recent anecdote of managerial learning from the market, Intercontinental Exchange (ICE, the parent company
of the New York Stock Exchange) quickly abandoned its pursuit of eBay after the news of its interest in a deal triggered
a 10.5% drop in its stock price. See “NYSE Owner Abandons Potential eBay Deal” by the Wall Street Journal
(February 6, 2020). 3 While revelatory price efficiency is necessary for managerial learning, it is not sufficient. The extent to which
managers incorporate price information in their decision making depends on their willingness and ability to learn,
which is ultimately an empirical question.
4
Theories predict two opposite effects of modern information technologies on revelatory
price efficiency and managerial learning. On the one hand, greater and broader dissemination of
corporate disclosures naturally leads to more aggressive trading on this information, which can
reduce uncertainty in trading on other fundamental information and encourage more acquisition
and trading of information potentially unknown to managers, resulting in a crowding-in effect
(Goldstein and Yang 2015). On the other hand, a decline in the cost of accessing corporate
disclosures can reduce the equilibrium demand for more precise fundamental signals obtained with
a deeper analysis (Dugast and Foucault 2018). This crowding-out effect happens because it takes
time to develop high precision signals and the trading profits based on these signals are reduced
when low precision signals have already been reflected in prices. Given these theoretical tensions,
how modern information technologies affect managerial learning and real efficiency is therefore
an empirical question.
To evaluate the benefits and costs of modern information technologies, we exploit the
staggered implementation of the EDGAR system from 1993 to 1996 as a shock to information
dissemination technologies that alter the timeliness and costs of accessing firm disclosures (Gao
and Huang 2020; Chang, Ljungqvist, and Tseng 2020). On February 23, 1993, the SEC specified
a phase-in schedule for registered firms to start filing on EDGAR in ten discrete groups (SEC
Release No. 33-6977). Firms in the first and last groups became EDGAR filers in April 1993 and
May 1996, respectively. This staggered mandatory implementation of the EDGAR system reduces
potential endogeneity concerns caused by unobserved firm-, industry-, or market-level shocks or
reverse causality (Leuz and Wysocki 2016). For an omitted variable to confound our findings, it
needs to affect different groups of firms at discrete points in time as specified in the phase-in
schedule.
5
Using a staggered difference-in-differences (diff-in-diff) research design, we find that the
EDGAR implementation leads to a 10% increase in the level of corporate investment but a 20%
decrease in the investment-to-price sensitivity. A standard dynamic test shows no difference in
pre-trends in investment behavior between the treatment and control groups, supporting the
parallel-trends assumption. The observed increase in the level of corporate investment follows the
conventional wisdom: EDGAR inclusion improves firms’ information environments, access to
equity capital, and their ability to undertake investment projects. Using a path analysis design (e.g.,
Landsman, Maydew, and Thornock 2012), we provide evidence supporting this equity financing
channel.
The observed decrease in the investment-to-price sensitivity suggests reduced managerial
learning from the market after EDGAR inclusion.4 We argue that this reduction in learning
happens because greater dissemination of corporate disclosures levels the playing field,
discourages private information acquisition, and crowds out some information that is new to
managers. While there is no direct measure of revelatory price efficiency, we conduct three sets of
analyses to support the managerial learning channel. First, we show that, after a firm becomes an
EDGAR filer, it experiences a decrease in ownership by institutional investors, especially those
who are more likely to actively acquire and trade on information. This result suggests that the
EDGAR implementation provides greater benefits to less-sophisticated retail investors and
discourages private information acquisition by more-sophisticated institutional investors.
Second, we use two measures based on structural market microstructure models to assess
the equilibrium level of private information in prices. The first measure is the probability of
4 Greater financing and stronger governance after the EDAGR implementation can lead to an increase in the
investment-to-price sensitivity. Thus, the observed decrease in the investment-to-price sensitivity is unlikely to be
driven by these alternative channels.
6
informed trading based on the Generalized PIN model recently developed in Duarte, Hu, and
Young (2020), and the second measure is the adverse selection component of the bid-ask spread
(Madhavan, Richardson, and Roomans 1997; Armstrong, Core, Taylor, and Verrecchia 2011).
These two measures are complementary as the former relies on order flows to identify private
information arrival while the latter directly measures the extent to which prices are affected by
unexpected order flows. We show that the EDGAR implementation leads to a decrease in both
measures of private information.
Third, we explore cross-sectional differences between firms to provide a tighter link
between investors’ private information and managerial learning. The condition for managerial
learning is that investors collectively possess some information that managers do not have.
Learning models commonly assume that investors’ information advantage lies in evaluating
growth options, which requires analyzing market trends, industry competition, and consumer
demand, as well as making comparisons with other firms; investors are unlikely to possess new
information about a firm’s assets in place since managers are the ones who put those assets there
(e.g., Gao and Liang 2013; Bai, Philippon, and Savov 2016; Edmans, Jayaraman, and Schneemeier
2017; Goldstein and Yang 2019). 5 Thus, the EDGAR implementation is likely to reduce
managerial learning to a greater extent in growth firms than in value firms. Consistent with this
cross-sectional prediction, we find that growth firms experience a greater reduction in institutional
ownership, privately informed trading, and the investment-to-price sensitivity after the EDGAR
shock than value firms.
As a final step, we examine the overall effect of the EDGAR implementation on ex post
firm performance. On the one hand, greater dissemination of corporate disclosures and improved
5 The argument is not that the manager is less informed than investors, but only that the manager does not have perfect
information about every decision-relevant factor that is related to the firm’s growth opportunities.

7
stock market liquidity can better incentivize managers (who are the agents of the shareholders) to
take value-maximizing actions. On the other hand, reduced managerial learning, especially in
growth firms, can hurt firm performance (despite managers’ best intentions). Empirically, we find
that, on average, the EDGAR implementation leads to an increase in firm profitability and sales
growth in value firms but hurts performance in high-growth firms where managerial learning from
the market is particularly important.
It is worth noting that increased timeliness and reduced costs of accessing firm disclosures
might alter managers’ reporting incentives (by enhancing investor monitoring and/or increasing
capital market pressure) and affect firms’ disclosure quality. Thus, we do not claim that the
EDGAR implementation represents a clean shock to information dissemination while holding
constant the information being disclosed. This possibility adds nuance to the interpretation of our
results but does not change our inferences that the documented real effects of the EDGAR shock
are due to a reduction in investors’ costs of accessing corporate filings.
The remainder of the paper is organized as follows. Section 2 reviews related literature and
discusses our paper’s contributions. Section 3 lays out the institutional setting and describes our
sample and empirical specification. Section 4 develops a stylized model that illustrates the
theoretical underpinnings of the investment-to-price sensitivity framework. Section 5 presents the
main analysis on corporate investment. Section 6 delves into the underlying mechanisms that
explain the main results. Section 7 provides some additional analyses. Section 8 concludes and
discusses some directions for future research.
2. Related Literature
Modern information technologies have fundamentally changed the way that the investing
public monitors for, acquires, and analyzes firm disclosures. A natural question that arises is
8
whether and how these technologies affect capital markets and firms. Gao and Huang (2020) first
exploit the staggered timing of the EDGAR implementation and provide plausibly causal evidence
that EDGAR inclusion leads to an increase in information production by individual investors and
sell-side analysts, and a higher stock pricing efficiency.6 Their results are based on the amount of
total information in individual trades, analyst forecasts, and prices, and suggest that the EDGAR
implementation improves forecasting price efficiency. We follow the empirical methodology of
Gao and Huang (2020), highlight the opposite effects of EDGAR inclusion on the two types of
price efficiency (i.e., forecasting price efficiency versus revelatory price efficiency), and
demonstrate the dual effects of modern information technologies on the real economy.
Specifically, our results show that broader information dissemination leads to an increase
in stock liquidity, a decrease in return volatility, and an increase in the level of equity financing
and corporate investment. These outcomes directly follow Gao and Huang (2020) and are
consistent with the conventional wisdom that guides regulators in promoting broader and more
timely information dissemination. More importantly, we argue and find that this analysis is
incomplete as greater dissemination of corporate disclosures crowds out private information
acquisition and reduces managerial learning from prices. This crowding-out effect, while often
overlooked, is particularly pronounced in high-growth firms. Our findings provide evidence that
investors’ costs of accessing firm disclosures have different implications for forecasting price
efficiency and revelatory price efficiency, both of which significantly affect the real economy.
As evidence of the importance of this line of research, several concurrent studies also
exploit the staggered timing of the EDGAR implementation and examine different outcome
6 Earlier studies treat the implementation of the EDGAR system as a one-time shock (e.g., Asthana, Balsam, and
Sankaraguruswamy 2004). Griffin (2003) and Li and Ramesh (2009) document significant stock price reactions
surrounding 10-K and 10-Q filings in the EDGAR era.

9
variables, including analyst forecasts (Chang, Ljungqvist, and Tseng 2020), investor disagreement
(Chang, Hsiao, Ljungqvist, and Tseng 2020), information asymmetry (Gomez 2020), earnings
management (Liu 2019), and stock price crash risk (Guo, Lisic, Stuart, and Wang 2019). In contrast
to our work, these studies do not consider the notion of revelatory price efficiency since their focus
is not on how EDGAR affects the real economy. More related to our work are three studies that
also examine the real effects of EDGAR: Li and Qi (2020) and Lai, Lin, and Ma (2020) focus on
the benefits of EDGAR and show that EDGAR inclusion leads to lower information asymmetry,
lower cost of equity capital, and higher capital investment. Bird, Karolyi, Ruchti, and Truong
(2020) focus on the costs of EDGAR and show that EDGAR inclusion leads to a lower investment-
to-price sensitivity. Compared with these concurrent studies, our paper provides a more
comprehensive picture of the relations at play by considering both types of price efficiency and by
assessing whether and when the benefits exceed the costs and vice versa. Our findings highlight
that it is important to consider the tradeoff between improved equity financing and reduced
managerial learning when evaluating the economic effects of modern information technologies.
Our evidence suggests that the former effect dominates in value firms while the latter effect
dominates in high-growth firms.
Our paper makes contributions to three strands of literature.7 First, it contributes to the
literature on the effects of financial reporting and disclosure on corporate investment (see reviews
in Kanodia and Sapra (2016), Leuz and Wysocki (2016), and Roychowdhury, Shroff, and Verdi
(2019)). Prior research in this literature often assumes that investors’ costs of acquiring and
analyzing corporate disclosures are negligible and focuses on whether and how disclosure content,
quantity, quality, or timing affects managerial actions. Our findings highlight the importance of
7 Several concurrent studies also touch some of the issues we examine but our study is much more comprehensive as
discussed above.
10
considering information dissemination beyond information production when examining the real
effects of corporate disclosures.
Second, our paper contributes to the literature assessing how the costs of monitoring for,
acquiring, and analyzing corporate disclosures affect investor information choices, trades, and
market outcomes (see reviews in Lee and So (2015), Kothari, So, and Verdi (2016), and
Blankespoor, deHaan, and Marinovic (2020)). Prior research in this area often focuses on how
disclosure processing costs affect the amount of total information in individual trades, analyst
forecasts, or prices (i.e., forecasting price efficiency). We develop a stylized model based on the
investment-to-price sensitivity framework and provide evidence suggesting that the EDGAR
implementation decreases the amount of information in prices that is new to managers (i.e.,
revelatory price efficiency) despite its positive effect on forecasting price efficiency.
Third, our paper extends the literature on the real effects of the financial markets (see
reviews in Bond, Edmans, and Goldstein (2012) and Goldstein and Yang (2017)). Most related to
our work is Jayaraman and Wu (2019) who find a reduction in a firm’s investment-to-price
sensitivity after the firm increases segment disclosures. Their results present evidence of reduced
managerial learning after an increase in the level of disclosures. A fundamental difference between
their work and ours is that they abstract away from investors’ costs of accessing disclosures. In
contrast, we provide direct evidence on the implications of these costs on corporate investment
decisions.
3. Institutional Setting, Sample, and Empirical Specification
3.1.Institutional Setting
Before the implementation of the EDGAR system in 1993, SEC-registered firms were
required to submit multiple paper copies of filings to the SEC. These paper copies of filings were
11
stored in the SEC’s public reference rooms located in three locations (i.e., Washington D.C., New
York, and Chicago), and typically one or two paper copies of the same filing were available for
access in each location. As vividly noted in a New York Times (1982) article, “[t]he place can be a
zoo” and “files are often misplaced or even stolen.”8 To view these corporate filings, investors
could either physically visit one of the reference rooms or subscribe to commercial data vendors
for a nontrivial fee.9 Data aggregators such as Standard & Poor’s were only able to disseminate
SEC filings to its commercial customers with a significant production lag (D’Souza, Ramesh, and
Shen 2010).10 This restricted and delayed access to firm disclosures likely creates information
asymmetries among investors even though these SEC filings are deemed to be “public.”
To facilitate the timely dissemination of corporate filings through the internet, the SEC
developed the EDGAR system which enabled registered firms to file electronically. On February
23, 1993, the SEC released the phase-in schedule for the mandatory implementation of the
EDGAR system (SEC Release No. 33-6977). In this schedule, all SEC-registered firms were
divided into ten groups, and each group was required to submit corporate filings electronically
through the EDGAR system after the respective implementation date. The assignments of firms
into the ten phase-in groups were solely based on firm size, where larger firms were required to
start filing electronically earlier than smaller firms (SEC Release No. 33-6944).11 According to the
8 See “S.E.C. Data: Difficult Hunt” by the New York Times (May 19, 1982). 9 Chang, Ljungqvist, and Tseng (2020) note that Mead Data Central charged “a fee of $125 per month, plus a connect
charge of $39 an hour, plus a charge of 2.5 cents per line of data plus search charges which range from $6 to $51 per
search.” Dialog charged “$84 per hour plus $1 per page.” See http://www.bio.net/bionet/mm/ag-forst/1992-
January/000187.html. 10 D’Souza, Ramesh, and Shen (2010) show that EDGAR decreased the Compustat’s median collection lag by 50
percent (i.e., from 22 weekdays to 11 weekdays). 11 Chang, Ljungqvist, and Tseng (2020, p. 2) note: “In private correspondence, Scott Bauguess, then Acting Chief
Economist of the SEC, informed us that the wave assignments were determined solely on the basis of firm size.” Gao
and Huang (2020) further note that very few firms (3% of sample firms) deviated from the SEC’s phase-in schedule.
Thus, the prespecified timing is a strong instrument for the actual timing of the EDGAR implementation and has the
advantage of not being contaminated by firms’ endogenous decisions.

12
schedule, firms in the first group (i.e., Group CF-01) were required to start filing through the
EDGAR system in April 1993, while firms in the last group (i.e., Group CF-10) were required to
do so in May 1996.12 The detailed implementation dates for the ten groups are tabulated in
Appendix A.
3.2.Sample
To construct the sample for our analysis, we obtain the list of firms in these ten groups
from the SEC Release No. 33-6977. This list contains each firm’s Central Index Key (CIK), which
we use to match these firms to Compustat. Our sample period starts in the second quarter of 1991
(i.e., two years before the implementation date of the first phase-in group) and ends in the second
quarter of 1998 (i.e., two years after the implementation date of the last phase-in group). We obtain
financial statement data from Compustat, stock price and return data from the Center for Research
in Security Prices (CRSP), intraday transaction data from NYSE Trade and Quote (TAQ), and data
on institutional ownership from Thomson Reuters. Following prior research (e.g., Chen, Goldstein,
and Jiang 2007), we exclude firms in the financial and utility industries as well as firms with total
assets less than $10 million in 1992 (i.e., the last year prior to the EDGAR implementation). Our
final sample consists of 3,020 firms and 66,628 firm-quarter observations.
3.3.Empirical Specification
Our baseline equation for testing the effect of the EDGAR implementation on the level of
corporate investment is as follows:
𝐼𝑁𝑉𝐸𝑆𝑇𝑀𝐸𝑁𝑇𝑖,𝑡+1 = 𝛼𝑡 + 𝜂𝑖 + 𝛾1𝐸𝐷𝐺𝐴𝑅𝑖,𝑡 + 𝛾2𝑄𝑖,𝑡 + 𝛾3𝐶𝐹𝑖,𝑡 + 𝛾4𝑆𝐼𝑍𝐸𝑖,𝑡 + 𝜀𝑖,𝑡+1 (1)
12 After completing the phase-in of the first four groups in December 1993, the SEC refrained from further phase-in
of EDGAR filers over the first half of 1994 while evaluating EDGAR’s performance. On December 19, 1994, the
SEC issued Release No. 33-7122, which revised the phase-in dates for Group CF-05 and Group CF-06 (from August
and November 1994 as in Release No. 33-6977 to January and March 1995, respectively) and confirmed the phase-in
dates for the remaining four groups. Our analysis is based on the finalized implementation dates.
13
where 𝐼𝑁𝑉𝐸𝑆𝑇𝑀𝐸𝑁𝑇𝑖,𝑡+1 is firm i’s investment in quarter t+1, and 𝛼𝑡 and 𝜂𝑖 represent year-
quarter and firm fixed effects, respectively. Specifically, 𝐼𝑁𝑉𝐸𝑆𝑇𝑀𝐸𝑁𝑇𝑖,𝑡+1 is defined as firm i’s
capital expenditure in quarter t+1 scaled by its net property, plant, and equipment at the end of
quarter t. 𝐸𝐷𝐺𝐴𝑅𝑖,𝑡 is an indicator variable that equals one if firm i is a mandatory EDGAR filer
in quarter t, and zero otherwise. Following prior research (Foucault and Frésard 2012, 2014), we
control for three variables known to correlate with a firm’s investment decisions: 𝑄𝑖,𝑡 is Tobin’s
Q of firm i measured at the end of quarter t. 𝐶𝐹𝑖,𝑡 is the operating cash flow of firm i in quarter t,
scaled by lagged book assets. 𝑆𝐼𝑍𝐸𝑖,𝑡 is the natural logarithm of the book value of total assets of
firm i measured at the end of quarter t.13
𝛾1 is the diff-in-diff estimator and captures the effect of the EDGAR implementation on
the level of corporate investment. We predict a positive 𝛾1 due to improved equity financing for at
least three reasons. First, more timely and extensive dissemination of firm disclosures can reduce
adverse selection problems resulting from information asymmetry between the firm and new
investors in the primary market (Myers and Majluf 1984). Second, broad information
dissemination levels the playing field, mitigates information asymmetry among investors, attracts
liquidity to the secondary market, and eventually results in a lower cost of capital in the primary
market (Merton 1987; Diamond and Verrecchia 1991). Third, a firm’s commitment for timely
dissemination of information regarding managers’ actions after equity issuance alleviates investors’
ex ante concern about ex post moral hazard costs and increases their willingness to provide
financing to firms (Jensen and Meckling 1976; Holmström 1979; Watts and Zimmerman 1986).14
13 Our inferences are unchanged when we use the natural logarithm of the market capitalization at the end of quarter t
to proxy for firm size (see Table A1 of the online appendix). Since we are interested in the investment-to-price
sensitivity where Tobin’s Q is the (normalized) price measure, we avoid using another price-based measure of firm
size in our main analysis. 14 For example, Shroff (2020) provides evidence on the value of the Public Company Accounting Oversight Board
inspections in mitigating financing frictions for non-U.S. companies.
14
While it is difficult to empirically separate these different explanations, they point to the same
prediction that reduced costs of accessing firm disclosures lead to an increased level of equity
financing and investment.
Two things are worth noting. First, the assignments of firms into the ten phase-in groups
were solely based on a snapshot of pre-EDGAR market capitalization (Chang, Ljungqvist, and
Tseng 2020). Equation (1) does not include a control for pre-EDGAR market capitalization
because it is subsumed by firm fixed effects. Second, the time-varying firm characteristics (i.e.,
𝑄𝑖,𝑡, 𝐶𝐹𝑖,𝑡, and 𝑆𝐼𝑍𝐸𝑖,𝑡) are likely affected by the EDGAR implementation and controlling for them
might confound the estimate of the effect of the EDGAR implementation on investment (Angrist
and Pischke 2009; Gao and Huang 2020).15 Hence, we run all our regressions without and with
controlling for time-varying firm characteristics. We cluster standard errors by firm given multiple
quarterly observations for each firm (Petersen 2009).
To examine how the EDGAR implementation affects the investment-to-price sensitivity,
we augment Equation (1) by interacting 𝐸𝐷𝐺𝐴𝑅𝑖,𝑡 with 𝑄𝑖,𝑡, 𝐶𝐹𝑖,𝑡, and 𝑆𝐼𝑍𝐸𝑖,𝑡 as follows:
𝐼𝑁𝑉𝐸𝑆𝑇𝑀𝐸𝑁𝑇𝑖,𝑡+1
= 𝛼𝑡 + 𝜂𝑖 + 𝛾1𝐸𝐷𝐺𝐴𝑅𝑖,𝑡 + 𝛾2𝑄𝑖,𝑡 + 𝛾3𝐶𝐹𝑖,𝑡 + 𝛾4𝑆𝐼𝑍𝐸𝑖,𝑡 + 𝛾5𝑄𝑖,𝑡 × 𝐸𝐷𝐺𝐴𝑅𝑖,𝑡
+ 𝛾6𝐶𝐹𝑖,𝑡 × 𝐸𝐷𝐺𝐴𝑅𝑖,𝑡 + 𝛾7𝑆𝐼𝑍𝐸𝑖,𝑡 × 𝐸𝐷𝐺𝐴𝑅𝑖,𝑡 + 𝜀𝑖,𝑡+1
(2)
where 𝛾5 captures the effect of the EDGAR implementation on the investment-to-price sensitivity.
We do not have a signed prediction for 𝛾5 because it depends on how the EDGAR implementation
affects revelatory price efficiency, which is ex ante unclear. To clarify this idea, we develop a
stylized model in the next section to highlight the basic mechanism.
15 Gormley and Matsa (2016) illustrate the importance of excluding endogenous controls (e.g., firm size) when
examining the effects of business combination laws. They note: “For example, prior studies of how BC laws affect
firms’ acquisition activity have included a time-varying control for firm size. But, presumably, if passage of the BC
law affects acquisitions, it also affects firm size, making firm size an invalid control” (p. 443).

15
4. Theoretical Framework for Managerial Learning
Let a representative firm’s value be given by 𝜃𝐾 −1
2𝐾2, where 𝐾 is the total capital, and
𝜃 is the random variable that captures the level of productivity of the firm’s capital. 𝜃 can be
interpreted as the firm’s fundamentals. Suppose that 𝜃 is normally distributed with mean 0 and
variance 1
𝜇𝜃. Given the firm’s value function, it is easy to see that the firm manager’s optimal
capital level at time t equals the expected level of 𝜃, i.e., 𝐾𝑡 = 𝐸(𝜃|Manager′s Information at 𝑡).
Changes from 𝐾𝑡 to 𝐾𝑡+1 take the form of investment during period 𝑡 + 1. Here, the value function
is assumed to be concave in total capital 𝐾 , and for simplicity, we implicitly assume that
adjustments to 𝐾 are costless. Introducing some adjustment costs will not affect the results
qualitatively.
For simplicity and without loss of generality, we focus on a model of two periods: 0 and 1.
At 𝑡 = 0, the price of the firm’s stock reflects the prior belief about the firm’s fundamental 𝜃.
The manager of the firm privately observes a signal about 𝜃, denoted as 𝑀, where 𝑀 = 𝜃 + 𝜀𝑀,
and 𝜀𝑀 ∼ 𝑁 (0,1
𝜇𝑀). Given her information and using Bayesian updating, the firm’s manager will
optimally set the level of capital 𝐾0 at: 𝐾0 = 𝐸(𝜃|𝑝𝑟𝑖𝑜𝑟, 𝑀) =𝜇𝑀
𝜇𝜃+𝜇𝑀𝑀.
At 𝑡 = 1 , there are two pieces of information in the marketplace. The first piece of
information is a noisy signal about the manager’s private information 𝑀. We denote this signal as
𝑀′ , where 𝑀′ = 𝑀 + 𝜀𝑀′ , and 𝜀𝑀′ ∼ 𝑁 (0,1
𝜇𝑀′) . The second piece of information is an
independent signal about the fundamentals 𝜃. We denote this signal as 𝑁, where 𝑁 = 𝜃 + 𝜀𝑁, and
𝜀𝑁 ∼ 𝑁 (0,1
𝜇𝑁). These two signals reflect the different types of information markets can have. One
is information that is already known to the manager (i.e., a signal about the manager’s information),

16
and the other is information that is new to the manager (i.e., an independent signal about the
fundamentals). Both types of signals can be observed by the market maker in various ways. The
most common ways are via the order flows of traders, and via public releases of information. Here
we assume for concreteness that both signals are observed by the market maker, who then sets the
price to equal the expected level of 𝜃, i.e., 𝑃𝑡 = 𝐸 (𝜃|Market Maker’s Information at 𝑡).16 More
specifically, 𝑃1 = 𝐸(𝜃|𝑝𝑟𝑖𝑜𝑟, 𝑀′, 𝑁) =𝜇𝑁
𝜇𝜃+𝜇𝑁+𝜇𝑀∙𝜇
𝑀′
𝜇𝑀+𝜇𝑀′
𝑁 +
𝜇𝑀∙𝜇𝑀′
𝜇𝑀+𝜇𝑀′
𝜇𝜃+𝜇𝑁+𝜇𝑀∙𝜇
𝑀′
𝜇𝑀+𝜇𝑀′
𝑀′.
The manager observes the price (𝑃1) and the information in the market about her own signal
(𝑀′), hence she can infer from price the independent signal in the market about the fundamentals
(𝑁). She then optimally sets 𝐾1 at: 𝐾1 = 𝐸(𝜃|𝑝𝑟𝑖𝑜𝑟, 𝑀, 𝑁) =𝜇𝑁
𝜇𝜃+𝜇𝑁+𝜇𝑀𝑁 +
𝜇𝑀
𝜇𝜃+𝜇𝑁+𝜇𝑀𝑀. Then,
investment during period 𝑡 = 1 (𝐼1) is the difference between total capital at 𝑡 = 1 (𝐾1) and total
capital at 𝑡 = 0 (𝐾0) . Hence: 𝐼1 =𝜇𝑁
𝜇𝜃+𝜇𝑁+𝜇𝑀𝑁 +
𝜇𝑀
𝜇𝜃+𝜇𝑁+𝜇𝑀𝑀 −
𝜇𝑀
𝜇𝜃+𝜇𝑀𝑀 =
𝜇𝑁
𝜇𝜃+𝜇𝑁+𝜇𝑀(𝑁 −
𝜇𝑀
𝜇𝜃+𝜇𝑀𝑀).
We are interested in the sensitivity of 𝐼1 to 𝑃1 ( 𝑑𝐼1
𝑑𝑃1 ). As econometricians, we observe 𝐼1
and 𝑃1, but not 𝑁 or 𝑀. To derive the sensitivity of 𝐼1 to 𝑃1, we can write 𝑁 and 𝑀 as the products
of the following latent linear projections on 𝑃1: 𝑀 = 𝛾𝑀𝑃1 + 𝑒𝑀, and 𝑁 = 𝛾𝑁𝑃1 + 𝑒𝑁. Then,
we get: 𝑑𝐼1
𝑑𝑃1=
𝜇𝑁
𝜇𝜃+𝜇𝑁+𝜇𝑀(
𝑑𝑁
𝑑𝑃1−
𝜇𝑀
𝜇𝜃+𝜇𝑀
𝑑𝑀
𝑑𝑃1) =
𝜇𝑁
𝜇𝜃+𝜇𝑁+𝜇𝑀(𝛾𝑁 −
𝜇𝑀
𝜇𝜃+𝜇𝑀𝛾𝑀).
By rule of linear projections, 𝛾𝑁 =𝐶𝑜𝑣(𝑃1,𝑁)
𝑉𝑎𝑟(𝑃1) and 𝛾𝑀 =
𝐶𝑜𝑣(𝑃1,𝑀)
𝑉𝑎𝑟(𝑃1). Thus, our model predicts:
𝑑𝐼1
𝑑𝑃1=
1
𝑉𝑎𝑟(𝑃1)
𝜇𝑁
𝜇𝜃+𝜇𝑁+𝜇𝑀(𝐶𝑜𝑣(𝑃1, 𝑁) −
𝜇𝑀
𝜇𝜃+𝜇𝑀𝐶𝑜𝑣(𝑃1, 𝑀)). Given the model structure, we can
16 In this simple model, the price the market maker sets does not take into account its feedback effect on manager’s
action. For models that consider this feedback loop, see Goldstein and Guembel (2008) and Edmans, Jiang, and
Goldstein (2015).
17
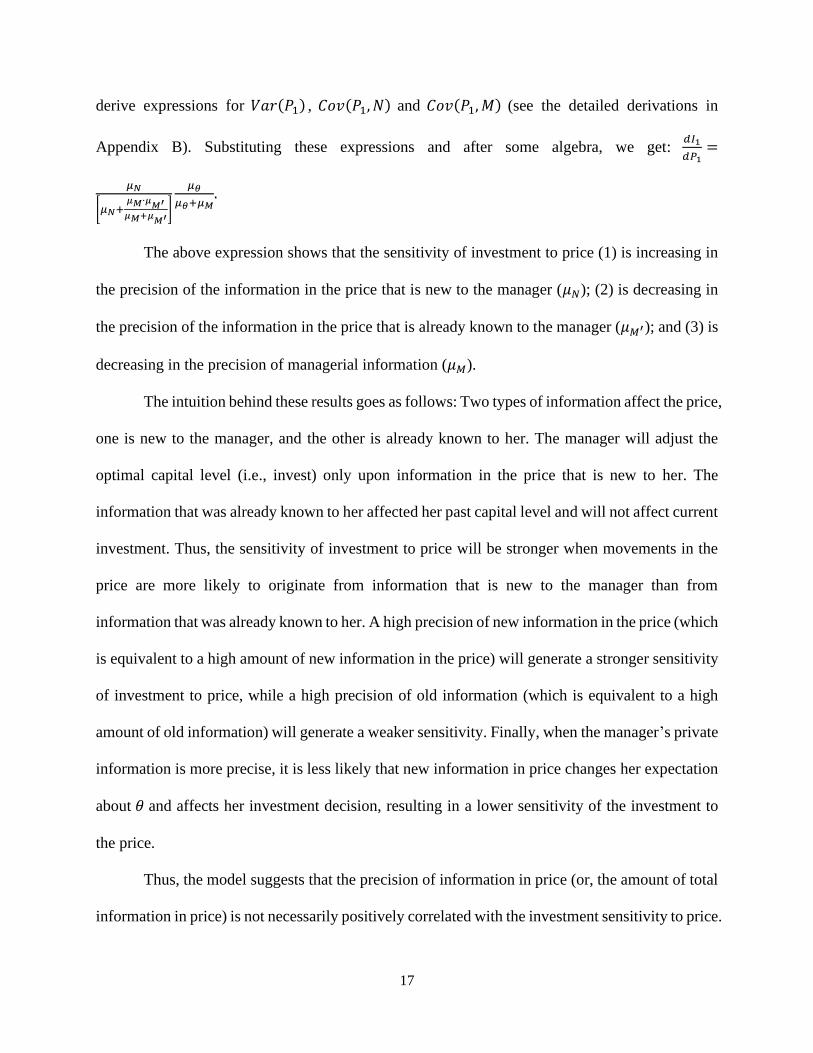
derive expressions for 𝑉𝑎𝑟(𝑃1) , 𝐶𝑜𝑣(𝑃1, 𝑁) and 𝐶𝑜𝑣(𝑃1, 𝑀) (see the detailed derivations in
Appendix B). Substituting these expressions and after some algebra, we get: 𝑑𝐼1
𝑑𝑃1=
𝜇𝑁
[𝜇𝑁+𝜇𝑀∙𝜇
𝑀′
𝜇𝑀+𝜇𝑀′
]
𝜇𝜃
𝜇𝜃+𝜇𝑀.
The above expression shows that the sensitivity of investment to price (1) is increasing in
the precision of the information in the price that is new to the manager (𝜇𝑁); (2) is decreasing in
the precision of the information in the price that is already known to the manager (𝜇𝑀′); and (3) is
decreasing in the precision of managerial information (𝜇𝑀).
The intuition behind these results goes as follows: Two types of information affect the price,
one is new to the manager, and the other is already known to her. The manager will adjust the
optimal capital level (i.e., invest) only upon information in the price that is new to her. The
information that was already known to her affected her past capital level and will not affect current
investment. Thus, the sensitivity of investment to price will be stronger when movements in the
price are more likely to originate from information that is new to the manager than from
information that was already known to her. A high precision of new information in the price (which
is equivalent to a high amount of new information in the price) will generate a stronger sensitivity
of investment to price, while a high precision of old information (which is equivalent to a high
amount of old information) will generate a weaker sensitivity. Finally, when the manager’s private
information is more precise, it is less likely that new information in price changes her expectation
about 𝜃 and affects her investment decision, resulting in a lower sensitivity of the investment to
the price.
Thus, the model suggests that the precision of information in price (or, the amount of total
information in price) is not necessarily positively correlated with the investment sensitivity to price.
18
The type of information matters a lot. Overall, we believe the insight is more general than the
specific formulation of this model. The distinction between information that is new to managers
and information that managers already had is critical. The incorporation of more information of
the first type (𝑁 in the model) into the price will increase the sensitivity of investment to price,
while the incorporation of more information of the second type (𝑀′ in the model) will decrease
this sensitivity.
In the empirical setting of the EDGAR implementation, prior research finds that analyst
forecast accuracy and stock pricing efficiency increase significantly after a firm becomes an
EDGAR filer (Gao and Huang 2020). This result suggests that the precision of information in the
marketplace (or, the amount of total information in the marketplace) increases after the EDGAR
shock. However, this increase in total information can be entirely driven by the piece of
information that is already known to the manager (i.e., 𝑀′ in the model).17 Hence, this result does
not speak to how the EDGAR shock would affect the amount of information that is new to the
manager (𝑁 in the model), which is the focus of our empirical analysis.
Another implication from the model is that the extent to which the manager can learn from
the market depends on the precision of her private information (𝑀 in the model). When 𝑀 is very
precise, it is less likely that the EDGAR implementation will affect her investment decisions
through the learning channel. We expect the precision of 𝑀 to be relatively high for assets in place
and relatively low for growth options. Therefore, if the EDGAR implementation affects the
investment-to-price sensitivity through the managerial learning channel, we should observe a
stronger effect in growth firms than in value firms.
17 As noted in the Introduction, increased information dissemination after the EDGAR shock is likely the primary, but
not necessarily the only, reason for the change in 𝑀′ in the marketplace.
19
5. Main Analysis
5.1.Descriptive Statistics
Table 1 reports the descriptive statistics for the variables used in our main analysis. All
continuous variables are winsorized at the top and bottom one percent to mitigate the influence of
extreme values. Panel A presents the summary statistics for the sample. INVESTMENT exhibits
reasonable variations in the sample; and its mean, median, and standard deviation are 7.1%, 4.9%,
and 7.6%, respectively. We have a roughly equal number of firm-quarter observations before and
after the EDGAR implementation (50.6% versus 49.4%). The average and median Tobin’s Q are
1.8 and 1.4, respectively. Panel B presents the Pearson (above diagonal) and Spearman (below
diagonal) correlations for the variables used in our empirical analysis. We observe a strong positive
correlation between INVESTMENT and Tobin’s Q (Pearson correlation of 0.28 and Spearman
correlation of 0.33).
5.2.Main Results on Corporate Investment
We analyze the effect of the EDGAR implementation on corporate investment by
estimating Equations (1) and (2). Table 2 reports the main regression results. In column 1, we only
include EDGAR as the independent variable, along with firm and year-quarter fixed effects. The
coefficient on EDGAR is 0.613 (p-value<0.01), which represents a 9% increase relative to the
sample mean of INVESTMENT. In column 2, we control for Tobin’s Q (Q), cash flows (CF), and
firm size (SIZE), and the coefficient on EDGAR remains significantly positive (p-value<0.01).
These results confirm the conventional wisdom that the EDGAR implementation reduces adverse
selection and moral hazard problems and leads to an increase in the level of corporate investment.
In column 3 of Table 2, we report the results of the regression model in Equation (2). The
coefficient on Q measures the investment-to-price sensitivity prior to the EDGAR implementation
20
and is 1.908 (p-value<0.01). The coefficient on Q×EDGAR measures the change in the sensitivity
of investment to price after the EDGAR shock and is -0.392 (p-value<0.01). Comparing these two
coefficients suggests that the EDGAR implementation leads to a 20% decline in the investment-
to-price sensitivity. This observed decrease in the investment-to-price sensitivity cannot be
explained by reduced adverse selection or moral hazard after the EDGAR implementation because
these channels should make firms more responsive to their investment opportunities. Instead, this
result suggests that EDGAR inclusion leads to a crowding-out effect and reduces managerial
learning from prices.
Interestingly, the coefficients on CF and CF×EDGAR are both significantly positive. Since
a firm’s cash flows are informative about its performance and investment opportunities (Alti 2003;
Heitzman and Huang 2019), these results suggest that managers increase their reliance on internal
profit signals (i.e., CF) and decrease their reliance on external price signals (i.e., Q) after the
EDGAR implementation.
5.3.Parallel Trends
The diff-in-diff approach does not require ex ante firm characteristics (e.g., firm size) to be
identical between the treatment and control groups as any systematic difference between them will
be eliminated in the estimation (through firm fixed effects). In Table A2 of the online appendix,
we further augment Equation (2) by interacting Q with firm fixed effects to allow the investment-
to-price sensitivity to vary across firms. The coefficient on Q×EDGAR remains significantly
negative (p-value<0.05).
One important identifying assumption for the diff-in-diff estimates is that the treatment and
control groups follow parallel trends in the absence of the EDGAR treatment. A common way to
assess the plausibility of this parallel-trends assumption is to check whether the treatment and

21
control groups share similar trends prior to the treatment. Following Foucault and Frésard (2012),
we plot the dynamic diff-in-diff estimates (along with the 95% confidence intervals) of the effects
of the EDGAR implementation on the investment level and the investment-to-price sensitivity in
Figures 1 and 2, respectively. Figure 1 shows that the level of investment is not statistically
different between the treatment and control groups in the two quarters before the EDGAR
implementation. Figure 2 shows a similar pattern of no differential pre-trends for the investment-
to-price sensitivity. The estimates in these two figures provide support for the parallel-trends
assumption. Moreover, Figure 1 and Figure 2 show that both treatment effects are rather persistent
and do not exhibit any reversal in the quarters after the EDGAR shock.
Overall, the evidence in Table 2 and Figures 1 and 2 suggests that EDGAR inclusion results
in an increase in the level of investment and a decline in the investment-to-price sensitivity. To
provide further evidence on the underlying mechanisms, we examine the equity financing channel
and the managerial learning channel in the next section.
6. Analysis of Mechanisms
6.1.Equity Financing Channel
We analyze the equity financing channel through which the EDGAR implementation
affects the level of corporate investment. We estimate the regression model in Equation (3):
𝐷𝐸𝑃𝑉𝐴𝑅𝑖,𝑡 = 𝛼𝑡 + 𝜂𝑖 + 𝛽1𝐸𝐷𝐺𝐴𝑅𝑖,𝑡 + 𝛽2𝑆𝐼𝑍𝐸𝑖,𝑡−1 + 𝛽3𝑃𝑅𝐶_𝐼𝑁𝑉𝑖,𝑡−1 + 𝜀𝑖,𝑡 (3)
where 𝐷𝐸𝑃𝑉𝐴𝑅𝑖,𝑡 represents the bid-ask spread estimator (ILLIQUID) derived from daily high
and low prices following Corwin and Schultz (2012), idiosyncratic return volatility (IVOL) based
on the market model, and the amount of equity issuance (EQUITY).
22
The high-low spread estimator (ILLIQUID) captures transitory volatility at the daily level
and closely approximates the cost of immediacy.18 A higher ILLIQUID indicates a higher level of
stock illiquidity. Corwin and Schultz (2012) show that it generally outperforms other low-
frequency estimators and works particularly well in the 1993–1996 period when the minimum tick
was one-eighth. The idiosyncratic return volatility (IVOL) reflects information asymmetry
between firm managers and the market in a framework in which the total uncertainty about a firm
is decomposed into market-wide and firm-specific components (Dierkens 1991; Moeller,
Schlingermann, and Stulz 2007; Kim, Li, Pan, and Zuo 2013).19
Following Jayaraman and Wu (2019), we include two basic controls. 𝑆𝐼𝑍𝐸𝑖,𝑡−1 is the
lagged firm size (the natural logarithm of total assets), and 𝑃𝑅𝐶_𝐼𝑁𝑉𝑖,𝑡−1 is the inverse of stock
price measured at the end of quarter t–1. Year-quarter fixed effects (𝛼𝑡) and firm fixed effects (𝜂𝑖)
are included. We run our regressions without and with controlling for time-varying firm
characteristics, and the specification without these endogenous controls is our preferred one.
Panel A of Table 3 reports the regression results. We include only EDGAR as the
independent variable in the odd columns and add firm size (SIZE) and the inverse of stock price
(PRC_INV) as controls in the even columns. In columns 1 and 2 of Panel A, the coefficient on
EDGAR is significantly negative at the 1% level, suggesting an improvement in a firm’s stock
liquidity after the EDGAR shock. The coefficient of -0.278 in column 1 translates into a 16%
reduction (relative to the sample mean) in illiquidity on average. In columns 3 and 4 of Panel A,
the coefficient on EDGAR is significantly negative at the 1% level. The coefficient in column 3
suggests that a firm’s idiosyncratic return volatility decreases by 0.128 percentage points after it
18 The cost (or price) of immediacy is the return that dealers must expect to earn in order to provide liquidity promptly
and sufficiently (e.g., Dick-Nielsen and Rossi 2019). 19 Our inferences remain unchanged with alternative measures of illiquidity (e.g., Amihud 2002) or return volatility
(e.g., total return volatility or idiosyncratic return volatility based on the Fama-French (1993) three-factor model).

23
becomes an EDGAR filer. In columns 5 and 6 of Panel A, the dependent variable is the amount of
equity financing (EQUITY). The coefficient on EDGAR is significantly positive (p-value<0.01) in
both columns. The magnitude is also economically meaningful. The coefficient of 0.294 in column
5 suggests an increase in equity financing by 0.294% of total assets each quarter on average.
Panel B of Table 3 links these results in Panel A with a path analysis design (e.g., Landsman,
Maydew, and Thornock 2012). A path analysis aims to provide estimates of the direct and indirect
effects of the source variable (i.e., EDGAR) on the outcome variable (i.e., EQUITY). It is best
explained by considering a path diagram (see Figure 3). The indirect effect is the product of the
direct path coefficients leading to and from the mediating variable, and its significance is based on
the Sobel (1982) test.20 In column 1 of Panel B, we find that the indirect effect of EDGAR on
EQUITY is significant through the mediating variable ILLIQUID. The product coefficient is 0.063
and statistically significant at the 1% level. In column 2 of Panel B, we repeat the same path
analysis for IVOL.21 The product coefficient is 0.009 and statistically significant at the 1% level.
We note that, while the effect of EDGAR on ILLIQUID, IVOL, or EQUITY is plausibly causal, the
effect of ILLIQUID or IVOL on EQUITY in the path analysis is subject to endogeneity concerns
(e.g., measurement error, omitted variable bias or reverse causality).
Panel C of Table 3 links the EDGAR implementation to investment with a path analysis
design, and the corresponding path diagram is plotted as Figure 4. We find that the indirect effect
of EDGAR on INVESTMENT is significant through the mediating variable ILLIQUID, IVOL, or
EQUITY. The product coefficient is 0.105 in column 1, 0.044 in column 2, and 0.016 in column 3.
All these coefficients are statistically significant at the 5% level or better. We again note that the
20 We use the Stata command sem to estimate a structural equation model (SEM). 21 We conduct two separate path analyses for ILLIQUID and IVOL because these two variables are strongly correlated
(see Panel B of Table 1) and likely to capture the same underlying construct.

24
relation between INVESTMENT and ILLIQUID, IVOL, or EQUITY is subject to endogeneity
concerns, and, thus, these product coefficients should be interpreted with caution.
Collectively, Table 3 provides evidence supporting the equity financing channel: the
EDGAR shock leads to an increase in stock market liquidity, a reduction in stock return volatility,
and an increase in equity financing and corporate investment.
Our previous analysis focuses on the effect of EDGAR inclusion on equity financing
instead of debt financing because the former is more likely to be negatively affected by information
asymmetry (Myers and Majluf 1984). Even though the EDGAR implementation reduces the
information asymmetry between firms and investors, firms are still likely to follow the pecking
order of financing, i.e., using internal funds first, then issuing debt, and lastly raising equity. Thus,
the observed increase in equity financing after the EDGAR implementation is unlikely to reflect a
substitution of equity for debt. Consistent with this prediction, we find no evidence that the
EDGAR implementation affects the amount of debt financing (see Table A3 of the online
appendix).
6.2.Managerial Learning Channel
6.2.1. Institutional Ownership
Gao and Huang (2020) find that trades by retail investors, especially those with access to
the internet, become more informative about future stock returns after the EDGAR implementation.
This result suggests that retail investors extract useful information from EDGAR filings for their
trading purpose. However, we do not expect this information to be new to managers. Further, the
EDGAR implementation likely provides greater benefits to retail investors who often lack the
resources and skills to acquire information than to institutional investors. Thus, we expect a decline

25
in a firm’s institutional ownership (as a percentage of total shares outstanding) after it is included
in the EDGAR system.
In Panel A of Table 4, we analyze the effect of the EDGAR shock on institutional
ownership. The coefficient on EDGAR in column 1 is significantly negative at the 5% level and
translates into a reduction of 0.72 percentage points in institutional ownership (INSTOWN). This
result is consistent with our expectation that a firm’s inclusion into the EDGAR system reduces
the information advantage of some institutional investors and makes its stock relatively more
attractive to retail investors.
Not all institutional investors actively trade on information. Prior research on informed
trading commonly uses the institutional investor classification developed by Bushee (1998) and
focuses on transient institutional investors (who hold small stakes in many firms and trade
frequently in and out of stocks) as privately-informed investors (e.g., Ke and Petroni 2004; Ke and
Ramalingegowda 2005; Akins, Ng and Verdi 2012). Thus, in columns 3 and 4, we analyze the
effect of the EDGAR shock on transient institutional investor ownership (INSTOWN_TRA). The
coefficient on EDGAR in column 3 is significantly negative at the 5% level and translates into a
reduction of 0.38 percentage points in transient institutional investor ownership.
In addition, we repeat the regression for the other two types of institutional investors: quasi-
indexers (who use indexing or buy-and-hold strategies characterized by high diversification and
low portfolio turnover) and dedicated institutional investors (who have large, long-term holdings
concentrated in only a few firms). These two types of institutional investors do not actively trade
on information as transient institutional investors do, and they are unlikely to affect the extent of
revelatory price efficiency. In Table A4 of the online appendix, we show that EDGAR inclusion
leads to a decrease in quasi-indexer ownership but an increase in dedicated institutional investor
26
ownership. The reduced ownership by quasi-indexers is consistent with the idea that EDGAR
benefits retail investors more and leads to a disproportionate increase in retail investor ownership.
The increased ownership by dedicated institutional investors suggests that EDGAR inclusion
potentially reduces monitoring costs to these investors and leads to an increased demand from
them.22
Together, the results in Panel A of Table 4 and Gao and Huang (2020) suggest that a firm’s
inclusion into the EDGAR system levels the playing field and makes its stock relatively more
attractive to retail investors than to institutional investors who tend to actively trade on information.
By making a firm’s disclosures more readily available to retail investors, the EDGAR system
improves retail investors’ information production but potentially discourages institutional
investors’ private information acquisition. To assess the equilibrium level of private information
in prices, we rely on two measures based on structural market microstructure models in the next
section.
6.2.2. Privately Informed Trading
We use two measures of private information based on structural market microstructure
models. While there are no direct measures of revelatory price efficiency, these two measures of
private information are likely to be positively correlated with the extent of revelatory price
efficiency (Bond, Edmans, and Goldstein 2012). Our first measure is the probability of informed
trading (GPIN) based on the Generalized PIN model recently developed in Duarte, Hu, and Young
(2020). In the traditional PIN model (Easley, Kiefer, O’Hara, and Paperman 1996), private-
information arrival is the only cause for increase in expected daily turnover. The GPIN model
22 Increased monitoring by investors post EDGAR is likely to lead to an increase in the investment-to-price sensitivity.
The observed decrease in the investment-to-price sensitivity suggests that this net effect is likely driven by reduced
managerial learning (instead of increased investor monitoring).
27
extends the PIN model by allowing expected daily turnover from noise trading to be random.
Duarte, Hu, and Young (2020) show that the GPIN model matches the variability of noise trade in
the data and identifies private-information arrival much better than other variants of the PIN model.
Our second measure is the adverse selection component of the bid-ask spread (LAMBDA).
It represents the magnitude of the revision in the market-maker’s beliefs concerning the stock’s
value induced by order flows, and is estimated as the extent to which stock prices are affected by
unexpected order flows (Madhavan, Richardson, and Roomans 1997; Armstrong, Core, Taylor,
and Verrecchia 2011). These two measures of private information are complementary as the GPIN
measure is entirely based on order flows while the LAMBDA measure relates unexpected order
flows to stock price changes.
The results are reported in Panel B of Table 4. The sample size is reduced for these two
measures because both rely on intraday transaction data from the NYSE Trade and Quote (TAQ)
database whose coverage starts in 1993. Further, the GPIN measure is only computed for NYSE
stocks in Duarte, Hu, and Young (2020).23 In columns 1 and 2 where the dependent variable is the
probability of informed trading (GPIN), the coefficient on EDGAR is significantly negative at the
5% level. The coefficient of -2.833 in column 1 translates into an 11% reduction (relative to its
sample mean) in GPIN. In columns 3 and 4, we replace the dependent variable with the adverse
selection component of the bid-ask spread (LAMBDA). Similarly, the coefficient on EDGAR is
significantly negative at the 1% (5%) level in column 3 (column 4). The coefficient of -0.009 in
column 3 translates into a 6% reduction (relative to its sample mean) in LAMBDA. The results in
Panel B suggest a reduction in privately informed trading after the EDGAR implementation.
23 We thank Edwin Hu and Daniel Taylor for providing us with the GPIN and LAMBDA measures, respectively.

28
Prior research also uses price non-synchronicity as a measure of the amount of private
information in prices in equilibrium (Chen, Goldstein, and Jiang 2007). We note that the degree
of price non-synchronicity is likely driven by the total amount of firm-specific information in
prices (from both public and private sources). The result of increased price non-synchronicity after
the EDGAR implementation documented in Gao and Huang (2020) suggests that the total amount
of firm-specific information increases: the increase in public information dominates the decrease
in private information.
6.2.3. Growth Firms versus Value Firms
To provide further evidence to support the managerial learning channel, we perform a
cross-sectional analysis. To the extent that investors’ information advantage lies in evaluating
growth options, we expect that EDGAR inclusion is likely to reduce managerial learning to a
greater extent in growth firms than in value firms. To perform this test, we divide the full sample
of firms into these two types of firms based on the market-to-book ratios in 1992 (i.e., the last year
prior to the EDGAR implementation). GROWTH_FIRM (VALUE_FIRM) is an indicator that
equals one if a firm’s market-to-book ratio in 1992 is above (below) the median, and zero otherwise.
In Panel A of Table 5, we replace EDGAR in Equation (3) with its interactions with the
two firm-type indicators. The coefficient on the interaction term EDGAR×GROWTH_FIRM is
significantly negative at the 5% level or better in all columns. In contrast, the coefficient on the
interaction term EDGAR×VALUE_FIRM is statistically insignificant across the board. Further, the
difference between the coefficients on these two interaction terms is significant at 10% level or
better in all columns. Thus, the results in Panel A suggest that the negative effects of the EDGAR
shock on institutional ownership and privately informed trading are concentrated in growth firms.24
24 Our inferences are unchanged when we include the (endogenous) firm-level controls as in Table 4.
29
In Panel B of Table 5, we repeat the regression on the investment-to-price sensitivity as
specified in Equation (2) by replacing Q×EDGAR with its interactions with GROWTH_FIRM and
VALUE_FIRM. In column 1, we repeat our previous analysis in Table 2 for this restricted sample
(requiring the availability of the market-to-book ratio in 1992) and the coefficient on Q×EDGAR
remains significantly negative at the 1% level. In column 2, the coefficient on the interaction term
Q×EDGAR×GROWTH_FIRM is significantly negative at the 1% level, while the coefficient on
Q×EDGAR×VALUE_FIRM is statistically insignificant. The difference between these two
coefficients is significant at the 1% level. Overall, the observed decline in the investment-to-price
sensitivity after the EDGAR shock is concentrated in growth firms, in which managerial learning
is expected to be more important.
In Panel C of Table 5, we repeat the analysis on the equity financing channel and the level
of investment by replacing EDGAR with its interactions with GROWTH_FIRM and VALUE_FIRM.
We find that the observed EDGAR effects on stock liquidity, return volatility, equity financing,
and corporate investment are concentrated in value firms. We view these results as descriptive and
consistent with the Myers and Majluf (1984) framework in which information asymmetry about
assets in place (not growth options) causes adverse selection problems.
7. Additional Analysis
7.1.Firm Performance
In this section, we investigate the effects of the EDGAR implementation on ex post firm
performance. We perform two sets of tests as follows. First, in Panel A of Table 6, we rerun the
regression model in Equation (3) by replacing the dependent variable with the return on equity
(ROE), return on assets (ROA), and sales growth (ΔSALES). We report the regression results
without and with control variables in the odd and even columns, respectively. The coefficient on

30
EDGAR is significantly positive at the 5% level or better in all six columns, suggesting that the
EDGAR shock has a positive effect on firm profitability and sales growth. In terms of economic
significance, the coefficients in columns 1, 3, and 5 (i.e., 0.388, 0.198, and 2.878) translate into an
increase of 9% in ROE, 12% in ROA, and 20% in ΔSALES (relative to their sample means),
respectively. We plot the dynamic diff-in-diff estimates (along with the 95% confidence intervals)
of the effects of the EDGAR implementation on firm performance in Figures A1 to A3 of the
online appendix. We observe no difference in pre-trends in firm performance between the
treatment and control groups, supporting the parallel-trends assumption. The figures also show
that the treatment effects become statistically significant only after a few quarters post the EDGAR
shock.
Second, we rerun the same regression but replace EDGAR with EDGAR×GROWTH_FIRM
and EDGAR×VALUE_FIRM in Panel B of Table 6. The coefficient on EDGAR×VALUE_FIRM is
significantly positive at the 1% level, while the coefficient on EDGAR×GROWTH_FIRM is
negative and statistically insignificant in all columns. The difference between the coefficients on
these two interaction terms is significant at the 1% level in all columns. These results show that
the observed improvement in firm profitability and sales growth is concentrated in value firms.25
Third, we further divide growth firms into high-growth and low-growth firms and include
EDGAR×HIGH_GROWTH_FIRM and EDGAR×LOW_GROWTH_FIRM in the regression models
in Panel C of Table 6. The coefficient on EDGAR×HIGH_GROWTH_FIRM is significantly
negative in all columns, while the coefficient on EDGAR×LOW_GROWTH_FIRM is positive and
largely statistically insignificant. The difference between the coefficients on these two interaction
terms is significant at the 5% level or better in all columns. This significant decline in firm
25 In terms of economic significance, the coefficients on EDGAR×VALUE_FIRM in columns 1, 3, and 5 translate into
an increase of 25% in ROE, 32% in ROA, and 45% in ΔSALES (relative to their sample means), respectively.

31
profitability and sales growth in high-growth firms suggests that the negative performance effect
of reduced managerial learning dominates the positive performance effect of the EDGAR
implementation for these firms.26
Collectively, the results in Table 6 reflect the dual effects of greater and broader
information dissemination facilitated by modern information technologies. On the one hand, it can
better incentivize managers to take value-maximizing actions and improve firm performance. On
the other hand, it can hurt firm performance by discouraging privately informed trading and
reducing managerial learning from the market. Our evidence suggests that the former effect
dominates in value firms while the latter effect dominates in high-growth firms.
7.2.Robustness Checks
We conduct two additional analyses to ensure the robustness of our results. First, we repeat
our analysis after excluding firms assigned to Group CF-01 as this group contains “transitional”
filers that volunteered to file electronically prior to the mandatory phase-in of the EDGAR system
in April 1993 (SEC Release No. 33-6977).27 Table 7 reports the results for this analysis. Both the
magnitude and statistical significance of the coefficients on Q and EDGAR×Q are quite similar to
those reported in Table 2.
Second, we repeat our analysis after redefining the EDGAR indicator for the first four
groups to take the value of one if the firm-quarter is after January 17, 1994 (when all electronic
EDGAR filings became freely available online via a National Science Foundation grant to New
York University) and zero otherwise. Prior to January 17, 1994, electronic EDGAR filings were
26 We also repeat our analysis in Table 5 for high-growth and low-growth firms and do not find evidence that the
EDGAR implementation differentially reduces privately informed trading or the investment-to-price sensitivity for
these two types of growth firms. These results suggest that the same degree of reduced managerial learning can be
more detrimental to high-growth firms than to low-growth firms. 27 The SEC started developing an electronic disclosure system in 1983. A pilot system was opened for volunteers
filing with the SEC by the fall of 1984. On July 15, 1992, the operational EDGAR system was made available to those
filers. See the regulatory overview of electronic filing at: https://www.sec.gov/info/edgar/regoverview.htm.

32
available through Mead Data Central (a commercial data vendor) for a fee.28 Table 8 presents the
results and our inferences remain largely unchanged.
8. Conclusions
Modern information technologies have greatly facilitated timely dissemination of
information to a broad base of investors at low costs. In this paper, we exploit the staggered
mandatory implementation of the EDGAR system from 1993 to 1996 as a shock to information
dissemination technologies. We find that the EDGAR implementation leads to a 10% increase in
the level of corporate investment but a 20% decrease in the investment-to-price sensitivity. The
increased level of investment is consistent with the conventional wisdom that broader information
dissemination leads to an increase in stock liquidity, a decrease in return volatility, and an increase
in the level of equity financing. The decreased investment-to-price sensitivity suggests that greater
dissemination of corporate disclosures can crowd out private information acquisition and reduce
managerial learning from prices. We provide evidence of improved equity financing and reduced
managerial learning after the EDGAR implementation. Further, we show that the EDGAR
implementation leads to an improvement in performance in value firms but a decline in
performance in high-growth firms where learning from the market is particularly important.
Overall, our findings suggest that it is important to consider the tradeoff between financing
and learning from prices when evaluating the real effects of modern information technologies.
With the rise of FinTech innovation through big data or machine learning techniques, the investing
public can now obtain a huge amount of data at relatively low costs (Goldstein, Jiang, and Karolyi
2019). We might reasonably expect the decline in the cost of accessing information to increase
forecasting price efficiency. However, our findings suggest that the effect of FinTech innovation
28 See “Plan Opens More Data to Public” by the New York Times (October 22, 1993).

33
on real efficiency is more nuanced as it might dampen investors’ incentives to engage in private
information acquisition and reduce managerial learning from prices. Moreover, greater
information production and dissemination brought by modern technologies may not necessarily
enhance the welfare of investors as they can lead to a reduction in risk-sharing and trading
opportunities among investors (Hirshleifer 1971; Kurlat and Veldkamp 2015) and an overweight
on public signals due to beauty-contest incentives (Morris and Shin 2002). Evaluating these
various tradeoffs brought by FinTech developments is an interesting avenue for future research.
34
References
Akins, B.K., Ng, J., Verdi, R.S., 2012. Investor competition over information and the pricing of information
asymmetry. The Accounting Review 87 (1), 35–58.
Alti, A., 2003. How sensitive is investment to cash flow when financing is frictionless? Journal of Finance 58
(2), 707–722.
Amihud, Y., 2002. Illiquidity and stock returns: Cross-section and time-series effects. Journal of Financial
Markets 5 (1), 31–56.
Angrist, J.D., Pischke, J.S., 2009. Mostly Harmless Econometrics: An Empiricist’s Companion. Princeton
University Press.
Armstrong, C.S., Core, J.E., Taylor, D.J., Verrecchia, R.E., 2011. When does information asymmetry affect the
cost of capital? Journal of Accounting Research 49 (1), 1–40.
Asthana, S., Balsam, S., Sankaraguruswamy, S., 2004. Differential response of small versus large investors to
10‐K filings on EDGAR. The Accounting Review 79 (3), 571–589.
Bai, J., Philippon, T., Savov, A., 2016. Have financial markets become more informative? Journal of Financial
Economics 122 (3), 625–654.
Bakke, T.E., Whited, T.M., 2010. Which firms follow the market? An analysis of corporate investment decisions.
Review of Financial Studies 23 (5), 1941–1980.
Bernanke, B., Gertler, M., 1990. Financial fragility and economic performance. Quarterly Journal of Economics
105 (1), 87–114.
Bird, A., Karolyi, S.A., Ruchti, T., Truong, P., 2020. More is less: Publicizing information and market feedback.
Working Paper. Available at SSRN: https://ssrn.com/abstract=3641837.
Blankespoor, E., deHaan, E., Marinovic, I., 2020. Disclosure processing costs, investors’ information choice,
and equity market outcomes: A review. Journal of Accounting and Economics, Forthcoming.
Bond, P., Edmans, A., Goldstein, I., 2012. The real effects of financial markets. Annual Review of Financial
Economics 4, 339–360.
Bushee, B. 1998. The influence of institutional investors on myopic R&D investment behavior. The Accounting
Review 73 (3), 305–333.
Chang, Y.C., Hsiao, P.J., Ljungqvist, A., Tseng, K., 2020. Testing disagreement models. CEPR Discussion
Paper No. DP14677. Available at SSRN: https://ssrn.com/abstract=3489666.
Chang, Y.C., Ljungqvist, A., Tseng, K., 2020. Do corporate disclosures constrain strategic analyst behavior?
CEPR Discussion Paper No. DP14678. Available at SSRN: https://ssrn.com/abstract=3594311.
Chen, Q., Goldstein, I., Jiang, W., 2007. Price informativeness and investment sensitivity to stock price. Review
of Financial Studies 20 (3), 619–650.
Corwin, S.A., Schultz, P., 2012. A simple way to estimate bid‐ask spreads from daily high and low prices.
Journal of Finance 67 (2), 719–760.
Dessaint, O., Foucault, T., Frésard, L., Matray, A., 2019. Noisy stock prices and corporate investment. Review
of Financial Studies 32 (7), 2625–2672.
Diamond, D.W., 1985. Optimal release of information by firms. Journal of Finance 40 (4), 1071–1094.
Diamond, D.W., Verrecchia, R.E., 1991. Disclosure, liquidity, and the cost of capital. Journal of Finance 46 (4),
1325–1359.

35
Dick-Nielsen, J., Rossi, M., 2019. The cost of immediacy for corporate bonds. Review of Financial Studies 32
(1), 1–41.
Dierkens, N., 1991. Information asymmetry and equity issues. Journal of Financial and Quantitative Analysis
26 (2), 181–200.
D’Souza, J.M., Ramesh, K., Shen, M., 2010. The interdependence between institutional ownership and
information dissemination by data aggregators. The Accounting Review 85 (1), 159–193.
Duarte, J., Hu, E., Young, L., 2020. A comparison of some structural models of private information arrival.
Journal of Financial Economics 135 (3), 795–815.
Dugast, J., Foucault, T., 2018. Data abundance and asset price informativeness. Journal of Financial Economics
130 (2), 367–391.
Dye, R.A., Sridhar S.S., 2002. Resource allocation effects of price reactions to disclosures. Contemporary
Accounting Research 19 (3), 385–410.
Easley, D., Kiefer, N.M., O’Hara, M., Paperman, J.B., 1996. Liquidity, information, and infrequently traded
stocks. Journal of Finance 51(4), 1405–1436.
Easley, D., O’Hara, M., 1987. Price, trade size, and information in securities markets. Journal of Financial
Economics 19 (1), 69–90.
Edmans, A., Goldstein, I., Jiang, W., 2015. Feedback effects, asymmetric trading, and the limits to arbitrage.
American Economic Review 105 (12), 3766–3797.
Edmans, A., Jayaraman, S., Schneemeier, J., 2017. The source of information in prices and investment-price
sensitivity. Journal of Financial Economics 126 (1), 74–96.
Fama, E.F., French, K.R., 1993. Common risk factors in the returns on stocks and bonds. Journal of Financial
Economics 33 (1), 3–56.
Fama, E.F., Miller, M.H., 1972. The Theory of Finance. New York: Holt, Rinehart, and Winston.
Foucault, T., Frésard, L., 2012. Cross-listing, investment sensitivity to stock price, and the learning hypothesis.
Review of Financial Studies 25 (11), 3305–3350.
Foucault, T., Frésard, L., 2014. Learning from peers’ stock prices and corporate investment. Journal of Financial
Economics 111 (3), 554–577.
Gao, M., Huang, J., 2020. Informing the market: The effect of modern information technologies on information
production. Review of Financial Studies 33 (4), 1367–1411.
Gao, P., Liang, P.J., 2013. Informational feedback, adverse selection, and optimal disclosure policy. Journal of
Accounting Research 51 (5), 1133–1158.
Glosten, L.R., Milgrom, P.R., 1985. Bid, ask and transaction prices in a specialist market with heterogeneously
informed traders. Journal of Financial Economics 14 (1), 71–100.
Goldstein, I., Guembel, A., 2008. Manipulation and the allocational role of prices. Review of Economic Studies
75 (1), 133–164.
Goldstein, I., Jiang, W., Karolyi, G.A., 2019. To FinTech and beyond. Review of Financial Studies 32 (5), 1647–
1661.
Goldstein, I., Yang, L., 2015. Information diversity and complementarities in trading and information
acquisition. Journal of Finance 70 (4), 1723–1765.
36
Goldstein, I., Yang, L., 2017. Information disclosure in financial markets. Annual Review of Financial
Economics 9, 101–125.
Goldstein, I., Yang, L., 2019. Good disclosure, bad disclosure. Journal of Financial Economics 131 (1), 118-
138.
Gomez, E., 2020. The effect of mandatory disclosure dissemination on information asymmetry: Evidence from
the implementation of the EDGAR System. Working Paper. Available at SSRN: https://papers.ssrn.com/abstract_id=3577162.
Gormley, T.A., Matsa, D.A., 2016. Playing it safe? Managerial preferences, risk, and agency conflicts. Journal
of Financial Economics 122 (3), 431–455.
Griffin, P.A., 2003. Got information? Investor response to form 10-K and form 10-Q EDGAR filings. Review of
Accounting Studies 8 (4), 433–460.
Grossman, S.J., Stiglitz, J.E., 1980. On the impossibility of informationally efficient markets. American
Economic Review 70 (3), 393–408.
Guo, F., Lisic, L. L., Stuart, M. D., Wang, C., 2019. The impact of information technology on stock price crash
risk: Evidence from the EDGAR implementation. Working Paper. Available at SSRN: https://papers.ssrn.com/abstract_id=3223521.
Hayek, F.A., 1945. The use of knowledge in society. American Economic Review 35 (4), 519–530.
Heitzman, S., Huang, M., 2019. Internal information quality and the sensitivity of investment to market prices
and accounting profits. Contemporary Accounting Research 36 (3), 1699–1723.
Hirshleifer, J., 1971. The private and social value of information and the reward to inventive activity. American
Economic Review 61 (4), 561–574.
Holmström, B., 1979. Moral hazard and observability. Bell Journal of Economics 10 (1), 74–91.
Jayaraman, S., Wu, J.S., 2019. Is silence golden? Real effects of mandatory disclosure. Review of Financial
Studies 32 (6), 2225–2259.
Jayaraman, S., Wu, J.S., 2020. Should I stay or should I grow? Using voluntary disclosure to elicit market
feedback. Review of Financial Studies 33 (8), 3854–3888.
Jensen, M., Meckling, W.H., 1976. Theory of the firm: Managerial behavior, agency costs and ownership
structure. Journal of Financial Economics 3 (4), 305–360.
Kanodia, C., Sapra, H., 2016. A real effects perspective to accounting measurement and disclosure: Implications
and insights for future research. Journal of Accounting Research 54 (2), 623–676.
Ke, B., Petroni, K., 2004. How informed are actively trading institutional investors? Evidence from their trading
behavior before a break in a string of consecutive earnings increases. Journal of Accounting Research
42 (5), 895–927.
Ke, B., Ramalingegowda, S., 2005. Do institutional investors exploit the post-earnings announcement drift?
Journal of Accounting and Economics 39 (1), 25–53.
Kim, Y., Li, S., Pan, C., Zuo, L., 2013. The role of accounting conservatism in the equity market: Evidence from
seasoned equity offerings. The Accounting Review 88 (4), 1327–1356.
Kiyotaki, N., Moore, J., 1997. Credit cycles. Journal of Political Economy 105 (2), 211–248.
Kothari, S., So, E.C., Verdi, R., 2016. Analysts’ forecasts and asset pricing: A survey. Annual Review of
Financial Economics 8, 197–219.
37
Kurlat, P., Veldkamp, L., 2015. Should we regulate financial information? Journal of Economic Theory 158 (B),
697–720.
Kyle, A.S., 1985. Continuous auctions and insider trading. Econometrica 53 (6), 1315–1335.
Lai, S., Lin, C., Ma, X., 2020. RegTech adoption and the cost of capital. Working Paper. Available at SSRN: https://papers.ssrn.com/abstract_id=3683046.
Lee, C.M., So, E.C., 2015. Alphanomics: The informational underpinnings of market efficiency. Foundations
and Trends® in Accounting 9 (2–3), 59–258.
Leuz, C., Wysocki, P.D., 2016. The economics of disclosure and financial reporting regulation: Evidence and
suggestions for future research. Journal of Accounting Research 54 (2), 525–622.
Li, E.X., Ramesh, K., 2009. Market reaction surrounding the filing of periodic SEC reports. The Accounting
Review 84 (4), 1171–1208.
Li, W., Qi, Q., 2020. The impact of information technology: information asymmetry, cost of capital and
corporate policy. Working Paper. Available at SSRN: https://papers.ssrn.com/abstract_id=3613460.
Lin, T., Liu, Q., Sun, B., 2019. Contractual managerial incentives with stock price feedback. American Economic
Review 109 (7), 2446–2468.
Liu, Y., 2019. Information acquisition costs and misreporting: Evidence from the implementation of EDGAR.
Working Paper. Available at: https://scholarspace.manoa.hawaii.edu/handle/10125/64860.
Luo, Y., 2005. Do insiders learn from outsiders? Evidence from mergers and acquisitions. Journal of Finance
60 (4), 1951–1982.
Madhavan, A., Richardson, M., Roomans, M., 1997. Why do security prices change? A transaction-level analysis
of NYSE stocks. Review of Financial Studies 10 (4), 1035–1064.
Merton, R.C., 1987. A simple model of capital market equilibrium with incomplete information. Journal of
Finance 42 (3), 483–510.
Moeller, S.B., Schlingermann, F.P., Stulz, R.M., 2007. How do diversity of opinion and information asymmetry
affect acquirer returns? Review of Financial Studies 20 (6), 2047–2078.
Morris, S., Shin, H.S., 2002. Social value of public information. American Economic Review 92 (5), 1521–1534.
Myers, S.C., Majluf, N.S., 1984. Corporate financing and investment decisions when firms have information
that investors do not have. Journal of Financial Economics 13 (2), 187–221.
Petersen, M.A., 2009. Estimating standard errors in finance panel data sets: Comparing approaches. Review of
Financial Studies 22 (1), 435–480.
Rappaport, A., 1987. Stock market signals to managers. Harvard Business Review. Available at:
https://hbr.org/1987/11/stock-market-signals-to-managers.
Roychowdhury, S., Shroff, N., Verdi, R.S., 2019. The effects of financial reporting and disclosure on corporate
investment: A review. Journal of Accounting and Economics 68 (2–3), 101246.
Shroff, N., 2020. Real effects of PCAOB international inspections. The Accounting Review 95 (5), 399-433.
Sobel, M.E., 1982. Asymptotic intervals for indirect effects in structural equations models. In: Leinhart, S. (Ed.),
Sociological Methodology. Jossey-Bass, San Francisco, 290–312.
Soros, G., 1994. The Alchemy of Finance: Reading the Mind of the Market. New York: John Wiley & Sons.

38
Verrecchia, R.E., 1982. Information acquisition in a noisy rational expectations economy. Econometrica 50 (6),
1415–1430.
Watts, R.L., Zimmerman, J.L., 1986. Positive Accounting Theory. New Jersey: Prentice-Hall Inc.
Zuo, L., 2016. The informational feedback effect of stock prices on management forecasts. Journal of
Accounting and Economics 61 (2–3), 391–413.
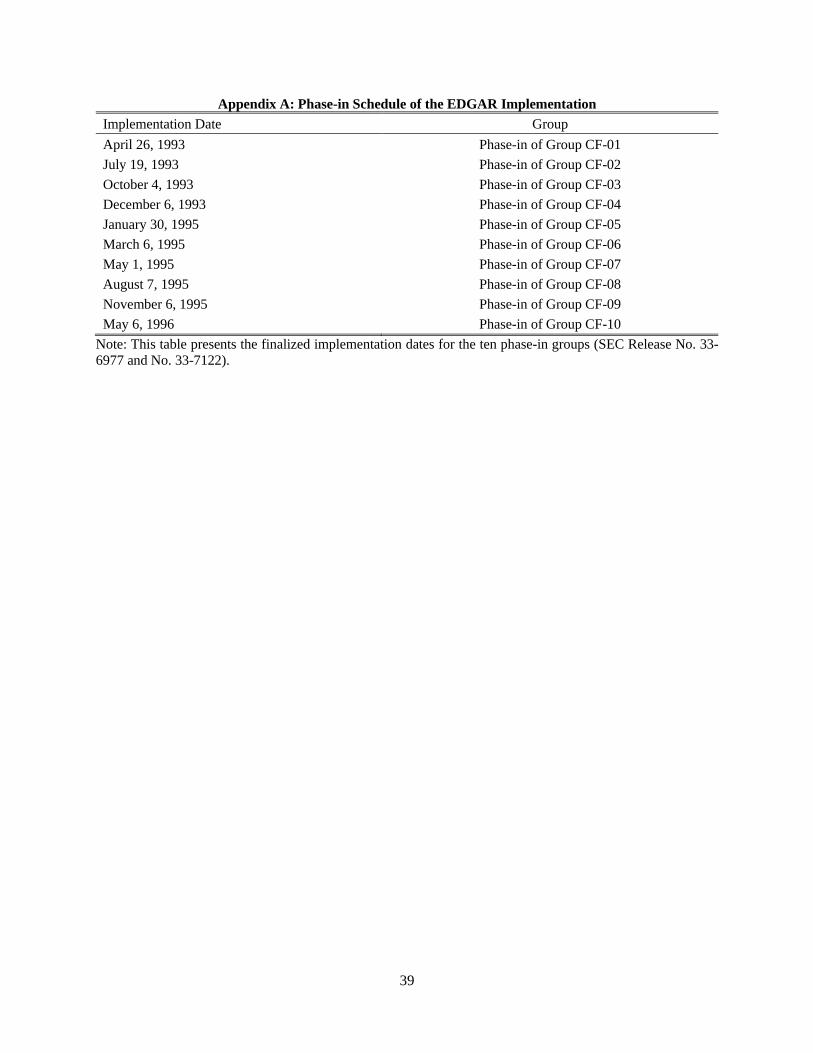
39
Appendix A: Phase-in Schedule of the EDGAR Implementation
Implementation Date Group
April 26, 1993 Phase-in of Group CF-01
July 19, 1993 Phase-in of Group CF-02
October 4, 1993 Phase-in of Group CF-03
December 6, 1993 Phase-in of Group CF-04
January 30, 1995 Phase-in of Group CF-05
March 6, 1995 Phase-in of Group CF-06
May 1, 1995 Phase-in of Group CF-07
August 7, 1995 Phase-in of Group CF-08
November 6, 1995 Phase-in of Group CF-09
May 6, 1996 Phase-in of Group CF-10
Note: This table presents the finalized implementation dates for the ten phase-in groups (SEC Release No. 33-
6977 and No. 33-7122).
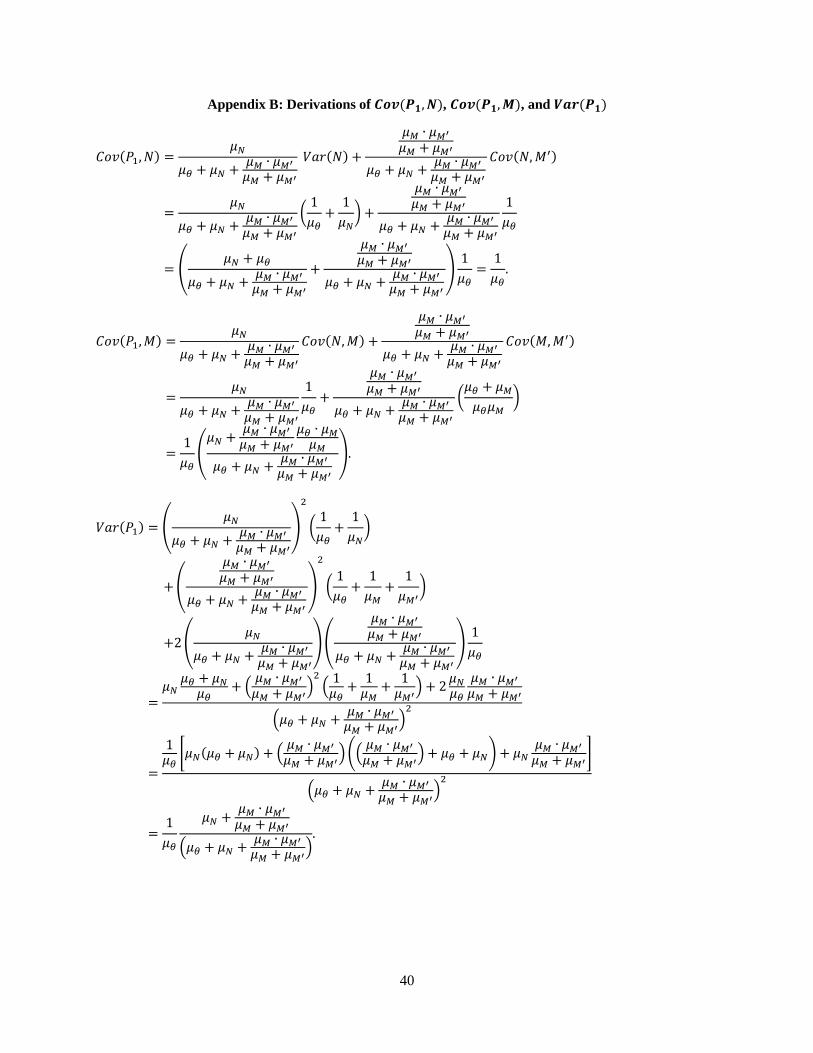
40
Appendix B: Derivations of 𝑪𝒐𝒗(𝑷𝟏, 𝑵), 𝑪𝒐𝒗(𝑷𝟏, 𝑴), and 𝑽𝒂𝒓(𝑷𝟏)
𝐶𝑜𝑣(𝑃1, 𝑁) =𝜇𝑁
𝜇𝜃 + 𝜇𝑁 +𝜇𝑀 ∙ 𝜇𝑀′
𝜇𝑀 + 𝜇𝑀′
𝑉𝑎𝑟(𝑁) +
𝜇𝑀 ∙ 𝜇𝑀′
𝜇𝑀 + 𝜇𝑀′
𝜇𝜃 + 𝜇𝑁 +𝜇𝑀 ∙ 𝜇𝑀′
𝜇𝑀 + 𝜇𝑀′
𝐶𝑜𝑣(𝑁, 𝑀′)
=𝜇𝑁
𝜇𝜃 + 𝜇𝑁 +𝜇𝑀 ∙ 𝜇𝑀′
𝜇𝑀 + 𝜇𝑀′
(1
𝜇𝜃+
1
𝜇𝑁) +
𝜇𝑀 ∙ 𝜇𝑀′
𝜇𝑀 + 𝜇𝑀′
𝜇𝜃 + 𝜇𝑁 +𝜇𝑀 ∙ 𝜇𝑀′
𝜇𝑀 + 𝜇𝑀′
1
𝜇𝜃
= (𝜇𝑁 + 𝜇𝜃
𝜇𝜃 + 𝜇𝑁 +𝜇𝑀 ∙ 𝜇𝑀′
𝜇𝑀 + 𝜇𝑀′
+
𝜇𝑀 ∙ 𝜇𝑀′
𝜇𝑀 + 𝜇𝑀′
𝜇𝜃 + 𝜇𝑁 +𝜇𝑀 ∙ 𝜇𝑀′
𝜇𝑀 + 𝜇𝑀′
)1
𝜇𝜃=
1
𝜇𝜃.
𝐶𝑜𝑣(𝑃1, 𝑀) =𝜇𝑁
𝜇𝜃 + 𝜇𝑁 +𝜇𝑀 ∙ 𝜇𝑀′
𝜇𝑀 + 𝜇𝑀′
𝐶𝑜𝑣(𝑁, 𝑀) +
𝜇𝑀 ∙ 𝜇𝑀′
𝜇𝑀 + 𝜇𝑀′
𝜇𝜃 + 𝜇𝑁 +𝜇𝑀 ∙ 𝜇𝑀′
𝜇𝑀 + 𝜇𝑀′
𝐶𝑜𝑣(𝑀, 𝑀′)
=𝜇𝑁
𝜇𝜃 + 𝜇𝑁 +𝜇𝑀 ∙ 𝜇𝑀′
𝜇𝑀 + 𝜇𝑀′
1
𝜇𝜃+
𝜇𝑀 ∙ 𝜇𝑀′
𝜇𝑀 + 𝜇𝑀′
𝜇𝜃 + 𝜇𝑁 +𝜇𝑀 ∙ 𝜇𝑀′
𝜇𝑀 + 𝜇𝑀′
(𝜇𝜃 + 𝜇𝑀
𝜇𝜃𝜇𝑀)
=1
𝜇𝜃(
𝜇𝑁 +𝜇𝑀 ∙ 𝜇𝑀′
𝜇𝑀 + 𝜇𝑀′
𝜇𝜃 ∙ 𝜇𝑀𝜇𝑀
𝜇𝜃 + 𝜇𝑁 +𝜇𝑀 ∙ 𝜇𝑀′
𝜇𝑀 + 𝜇𝑀′
).
𝑉𝑎𝑟(𝑃1) = (𝜇𝑁
𝜇𝜃 + 𝜇𝑁 +𝜇𝑀 ∙ 𝜇𝑀′
𝜇𝑀 + 𝜇𝑀′
)
2
(1
𝜇𝜃+
1
𝜇𝑁)
+ (
𝜇𝑀 ∙ 𝜇𝑀′
𝜇𝑀 + 𝜇𝑀′
𝜇𝜃 + 𝜇𝑁 +𝜇𝑀 ∙ 𝜇𝑀′
𝜇𝑀 + 𝜇𝑀′
)
2
(1
𝜇𝜃+
1
𝜇𝑀+
1
𝜇𝑀′)
+2 (𝜇𝑁
𝜇𝜃 + 𝜇𝑁 +𝜇𝑀 ∙ 𝜇𝑀′
𝜇𝑀 + 𝜇𝑀′
) (
𝜇𝑀 ∙ 𝜇𝑀′
𝜇𝑀 + 𝜇𝑀′
𝜇𝜃 + 𝜇𝑁 +𝜇𝑀 ∙ 𝜇𝑀′
𝜇𝑀 + 𝜇𝑀′
)1
𝜇𝜃
=𝜇𝑁
𝜇𝜃 + 𝜇𝑁𝜇𝜃
+ (𝜇𝑀 ∙ 𝜇𝑀′
𝜇𝑀 + 𝜇𝑀′)
2(
1𝜇𝜃
+1
𝜇𝑀+
1𝜇𝑀′
) + 2𝜇𝑁𝜇𝜃
𝜇𝑀 ∙ 𝜇𝑀′
𝜇𝑀 + 𝜇𝑀′
(𝜇𝜃 + 𝜇𝑁 +𝜇𝑀 ∙ 𝜇𝑀′
𝜇𝑀 + 𝜇𝑀′)
2
=
1𝜇𝜃
[𝜇𝑁(𝜇𝜃 + 𝜇𝑁) + (𝜇𝑀 ∙ 𝜇𝑀′
𝜇𝑀 + 𝜇𝑀′) ((
𝜇𝑀 ∙ 𝜇𝑀′
𝜇𝑀 + 𝜇𝑀′) + 𝜇𝜃 + 𝜇𝑁) + 𝜇𝑁
𝜇𝑀 ∙ 𝜇𝑀′
𝜇𝑀 + 𝜇𝑀′]
(𝜇𝜃 + 𝜇𝑁 +𝜇𝑀 ∙ 𝜇𝑀′
𝜇𝑀 + 𝜇𝑀′)
2
=1
𝜇𝜃
𝜇𝑁 +𝜇𝑀 ∙ 𝜇𝑀′
𝜇𝑀 + 𝜇𝑀′
(𝜇𝜃 + 𝜇𝑁 +𝜇𝑀 ∙ 𝜇𝑀′
𝜇𝑀 + 𝜇𝑀′)
.

41
Appendix C: Variable Definitions
Variable Definition
EDGAR = An indicator that equals one after a firm becomes a mandatory EDGAR filer,
and zero otherwise.
INVESTMENT = Capital expenditure scaled by lagged net property, plant, and equipment
(PPENTQ). Compustat quarterly data provide year-to-date net capital
expenditure (CAPXY). We therefore set quarterly capital expenditure to be
CAPXY (in the first fiscal quarter) or the change in CAPXY (in the second,
third, and fourth fiscal quarters). It is expressed in percentage points.
Q = The book value of total assets (ATQ) minus the book value of equity (CEQQ)
plus the market value of equity (CSHOQ×PRCCQ), scaled by the book value
of total assets (ATQ).
SIZE = The natural logarithm of the book value of total assets (ATQ).
CF = Operating cash flows (IBQ+DPQ) scaled by lagged total assets (ATQ). It is
expressed in percentage points.
PRC_INV = The inverse of the stock price (PRCCQ) at the fiscal quarter end.
ILLIQUID = The bid-ask spread estimated from daily high and low prices following Corwin
and Schultz (2012). Specifically, it is the estimate of a stock’s bid-ask spread
as a function of the high-to-low price ratio for a single two-day period and the
high-to-low ratios for two consecutive single days. It is expressed in
percentage points.
IVOL = The standard deviation of the residuals of the market model estimated using
the daily stock returns over the quarter. It is expressed in percentage points.
EQUITY = Equity issuance (SSTKQ) scaled by lagged total assets (ATQ). It is expressed
in percentage points.
INSTOWN = Percentage of shares held by institutional investors at the quarter end.
INSTOWN_TRA = Percentage of shares held by transient institutional investors at the quarter end.
The classification of transient institutional investors is obtained from the
institutional investor database developed by Bushee (1998).
GPIN = The quarterly average of the conditional probability of private information
arrival on a given day estimated in the Generalized PIN model by Duarte, Hu,
and Young (2020). It is expressed in percentage points.
LAMBDA = The quarterly average of the adverse selection component of the bid-ask spread
estimated in Armstrong, Core, Taylor, and Verrecchia (2011) and expressed in
percentage points.
GROWTH_FIRM = An indicator that equals one if a firm’s market-to-book ratio in 1992 is above
the sample median, and zero otherwise. Market-to-book ratio is defined as the
ratio of the market value of a firm’s common stock (CSHO×PRCC) to its book
value (CEQ). It is set to missing if CEQ is negative.
VALUE_FIRM = An indicator that equals one if a firm’s market-to-book ratio in 1992 is below
the sample median, and zero otherwise.
ROE = The ratio of operating income before depreciation (OIBDPQ) to lagged book
value of equity (CEQQ), expressed in percentage points. It is set to missing if
the lagged CEQQ is negative.
ROA = The ratio of operating income before depreciation (OIBDPQ) to lagged book
value of total assets (ATQ), expressed in percentage points.
ΔSALES = Growth rate in sales (SALEQ) from the same quarter in the previous year to
the current quarter, expressed in percentage points.
HIGH_GROWTH_FIRM = An indicator that equals one if a growth firm’s market-to-book ratio in 1992 is
above the median of growth firms, and zero otherwise.
LOW_GROWTH_FIRM = An indicator that equals one if a growth firm’s market-to-book ratio in 1992 is below the median of growth firms, and zero otherwise.
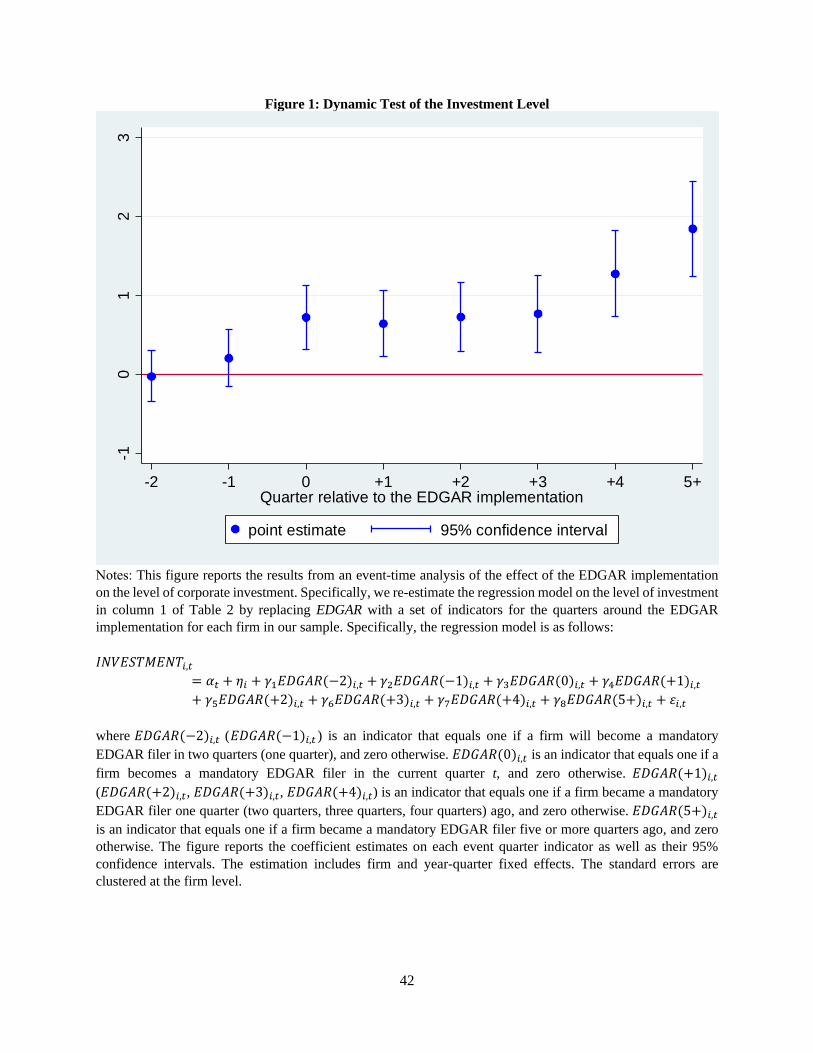
42
Figure 1: Dynamic Test of the Investment Level
Notes: This figure reports the results from an event-time analysis of the effect of the EDGAR implementation
on the level of corporate investment. Specifically, we re-estimate the regression model on the level of investment
in column 1 of Table 2 by replacing EDGAR with a set of indicators for the quarters around the EDGAR
implementation for each firm in our sample. Specifically, the regression model is as follows:
𝐼𝑁𝑉𝐸𝑆𝑇𝑀𝐸𝑁𝑇𝑖,𝑡
= 𝛼𝑡 + 𝜂𝑖 + 𝛾1𝐸𝐷𝐺𝐴𝑅(−2)𝑖,𝑡 + 𝛾2𝐸𝐷𝐺𝐴𝑅(−1)𝑖,𝑡 + 𝛾3𝐸𝐷𝐺𝐴𝑅(0)𝑖,𝑡 + 𝛾4𝐸𝐷𝐺𝐴𝑅(+1)𝑖,𝑡
+ 𝛾5𝐸𝐷𝐺𝐴𝑅(+2)𝑖,𝑡 + 𝛾6𝐸𝐷𝐺𝐴𝑅(+3)𝑖,𝑡 + 𝛾7𝐸𝐷𝐺𝐴𝑅(+4)𝑖,𝑡 + 𝛾8𝐸𝐷𝐺𝐴𝑅(5+)𝑖,𝑡 + 𝜀𝑖,𝑡
where 𝐸𝐷𝐺𝐴𝑅(−2)𝑖,𝑡 (𝐸𝐷𝐺𝐴𝑅(−1)𝑖,𝑡 ) is an indicator that equals one if a firm will become a mandatory
EDGAR filer in two quarters (one quarter), and zero otherwise. 𝐸𝐷𝐺𝐴𝑅(0)𝑖,𝑡 is an indicator that equals one if a
firm becomes a mandatory EDGAR filer in the current quarter t, and zero otherwise. 𝐸𝐷𝐺𝐴𝑅(+1)𝑖,𝑡
(𝐸𝐷𝐺𝐴𝑅(+2)𝑖,𝑡, 𝐸𝐷𝐺𝐴𝑅(+3)𝑖,𝑡, 𝐸𝐷𝐺𝐴𝑅(+4)𝑖,𝑡) is an indicator that equals one if a firm became a mandatory
EDGAR filer one quarter (two quarters, three quarters, four quarters) ago, and zero otherwise. 𝐸𝐷𝐺𝐴𝑅(5+)𝑖,𝑡
is an indicator that equals one if a firm became a mandatory EDGAR filer five or more quarters ago, and zero
otherwise. The figure reports the coefficient estimates on each event quarter indicator as well as their 95%
confidence intervals. The estimation includes firm and year-quarter fixed effects. The standard errors are
clustered at the firm level.
-10
12
3
-2 -1 0 +1 +2 +3 +4 5+Quarter relative to the EDGAR implementation
point estimate 95% confidence interval
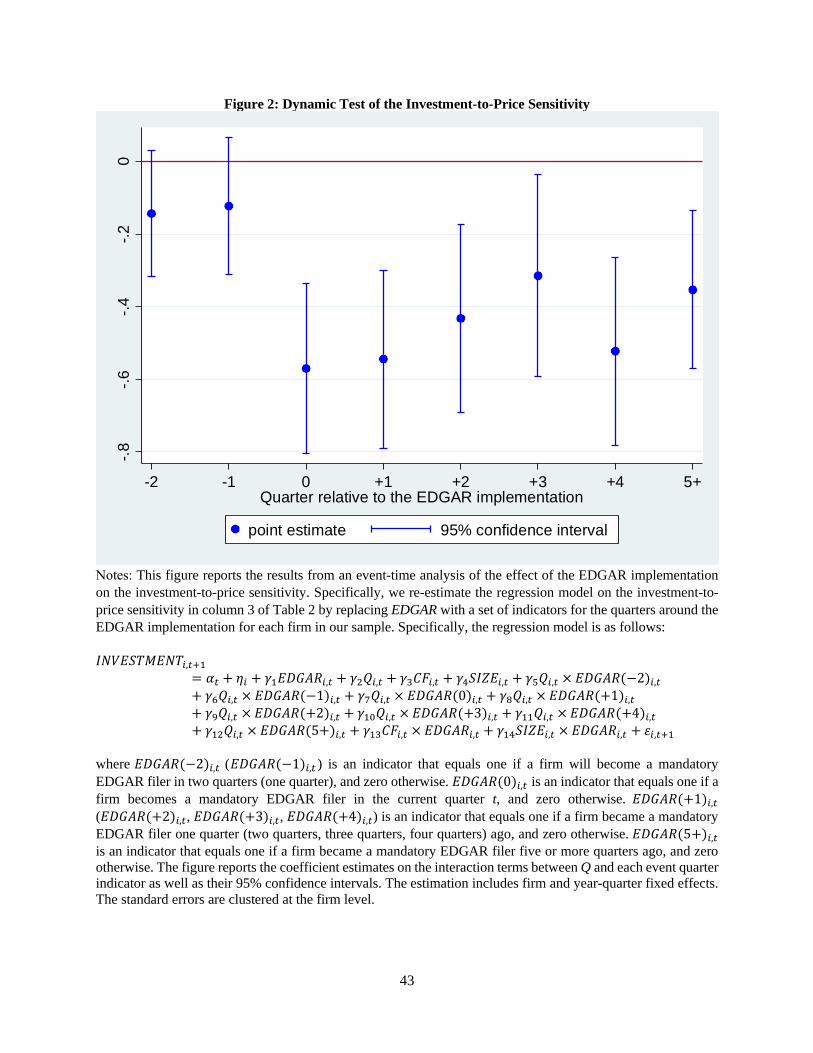
43
Figure 2: Dynamic Test of the Investment-to-Price Sensitivity
Notes: This figure reports the results from an event-time analysis of the effect of the EDGAR implementation
on the investment-to-price sensitivity. Specifically, we re-estimate the regression model on the investment-to-
price sensitivity in column 3 of Table 2 by replacing EDGAR with a set of indicators for the quarters around the
EDGAR implementation for each firm in our sample. Specifically, the regression model is as follows:
𝐼𝑁𝑉𝐸𝑆𝑇𝑀𝐸𝑁𝑇𝑖,𝑡+1
= 𝛼𝑡 + 𝜂𝑖 + 𝛾1𝐸𝐷𝐺𝐴𝑅𝑖,𝑡 + 𝛾2𝑄𝑖,𝑡 + 𝛾3𝐶𝐹𝑖,𝑡 + 𝛾4𝑆𝐼𝑍𝐸𝑖,𝑡 + 𝛾5𝑄𝑖,𝑡 × 𝐸𝐷𝐺𝐴𝑅(−2)𝑖,𝑡
+ 𝛾6𝑄𝑖,𝑡 × 𝐸𝐷𝐺𝐴𝑅(−1)𝑖,𝑡 + 𝛾7𝑄𝑖,𝑡 × 𝐸𝐷𝐺𝐴𝑅(0)𝑖,𝑡 + 𝛾8𝑄𝑖,𝑡 × 𝐸𝐷𝐺𝐴𝑅(+1)𝑖,𝑡
+ 𝛾9𝑄𝑖,𝑡 × 𝐸𝐷𝐺𝐴𝑅(+2)𝑖,𝑡 + 𝛾10𝑄𝑖,𝑡 × 𝐸𝐷𝐺𝐴𝑅(+3)𝑖,𝑡 + 𝛾11𝑄𝑖,𝑡 × 𝐸𝐷𝐺𝐴𝑅(+4)𝑖,𝑡
+ 𝛾12𝑄𝑖,𝑡 × 𝐸𝐷𝐺𝐴𝑅(5+)𝑖,𝑡 + 𝛾13𝐶𝐹𝑖,𝑡 × 𝐸𝐷𝐺𝐴𝑅𝑖,𝑡 + 𝛾14𝑆𝐼𝑍𝐸𝑖,𝑡 × 𝐸𝐷𝐺𝐴𝑅𝑖,𝑡 + 𝜀𝑖,𝑡+1
where 𝐸𝐷𝐺𝐴𝑅(−2)𝑖,𝑡 (𝐸𝐷𝐺𝐴𝑅(−1)𝑖,𝑡 ) is an indicator that equals one if a firm will become a mandatory
EDGAR filer in two quarters (one quarter), and zero otherwise. 𝐸𝐷𝐺𝐴𝑅(0)𝑖,𝑡 is an indicator that equals one if a
firm becomes a mandatory EDGAR filer in the current quarter t, and zero otherwise. 𝐸𝐷𝐺𝐴𝑅(+1)𝑖,𝑡
(𝐸𝐷𝐺𝐴𝑅(+2)𝑖,𝑡, 𝐸𝐷𝐺𝐴𝑅(+3)𝑖,𝑡, 𝐸𝐷𝐺𝐴𝑅(+4)𝑖,𝑡) is an indicator that equals one if a firm became a mandatory
EDGAR filer one quarter (two quarters, three quarters, four quarters) ago, and zero otherwise. 𝐸𝐷𝐺𝐴𝑅(5+)𝑖,𝑡
is an indicator that equals one if a firm became a mandatory EDGAR filer five or more quarters ago, and zero
otherwise. The figure reports the coefficient estimates on the interaction terms between Q and each event quarter
indicator as well as their 95% confidence intervals. The estimation includes firm and year-quarter fixed effects.
The standard errors are clustered at the firm level.
-.8
-.6
-.4
-.2
0
-2 -1 0 +1 +2 +3 +4 5+Quarter relative to the EDGAR implementation
point estimate 95% confidence interval
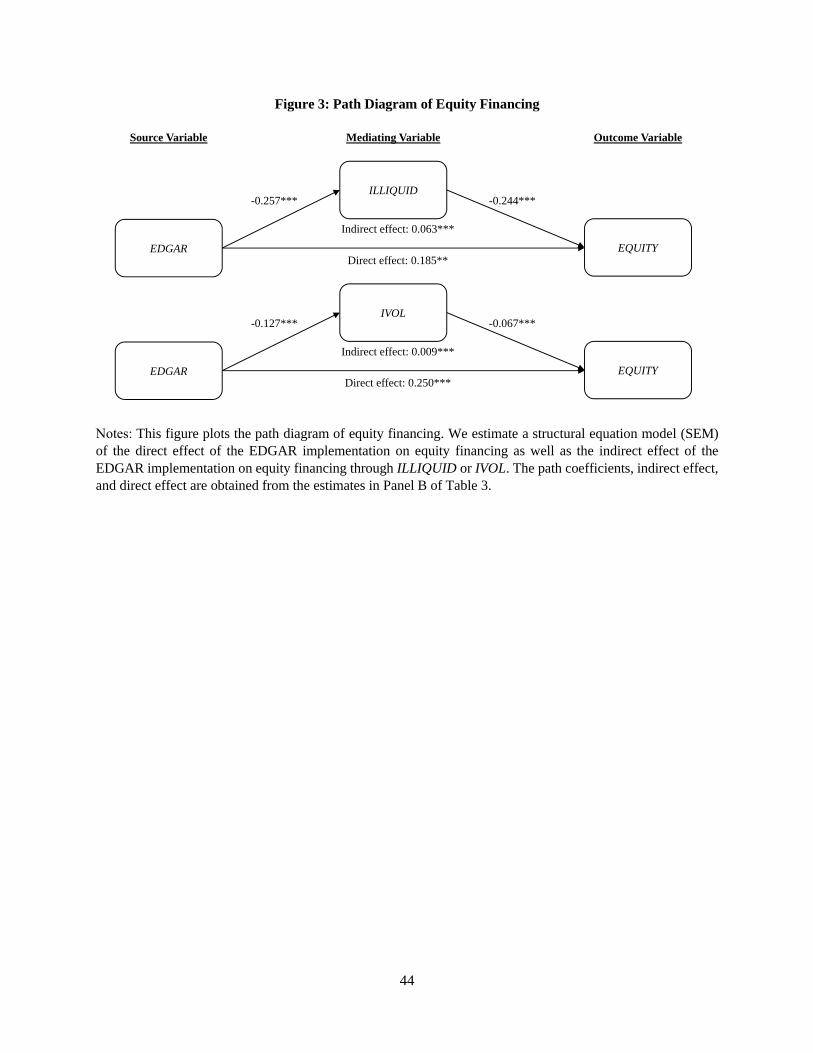
44
Figure 3: Path Diagram of Equity Financing
Notes: This figure plots the path diagram of equity financing. We estimate a structural equation model (SEM)
of the direct effect of the EDGAR implementation on equity financing as well as the indirect effect of the
EDGAR implementation on equity financing through ILLIQUID or IVOL. The path coefficients, indirect effect,
and direct effect are obtained from the estimates in Panel B of Table 3.
EDGAR
Source Variable Mediating Variable Outcome Variable
EQUITY
IVOL-0.127***
Direct effect: 0.250***
-0.067***
EDGAR EQUITY
ILLIQUID-0.257***
Direct effect: 0.185**
-0.244***
Indirect effect: 0.063***
Indirect effect: 0.009***
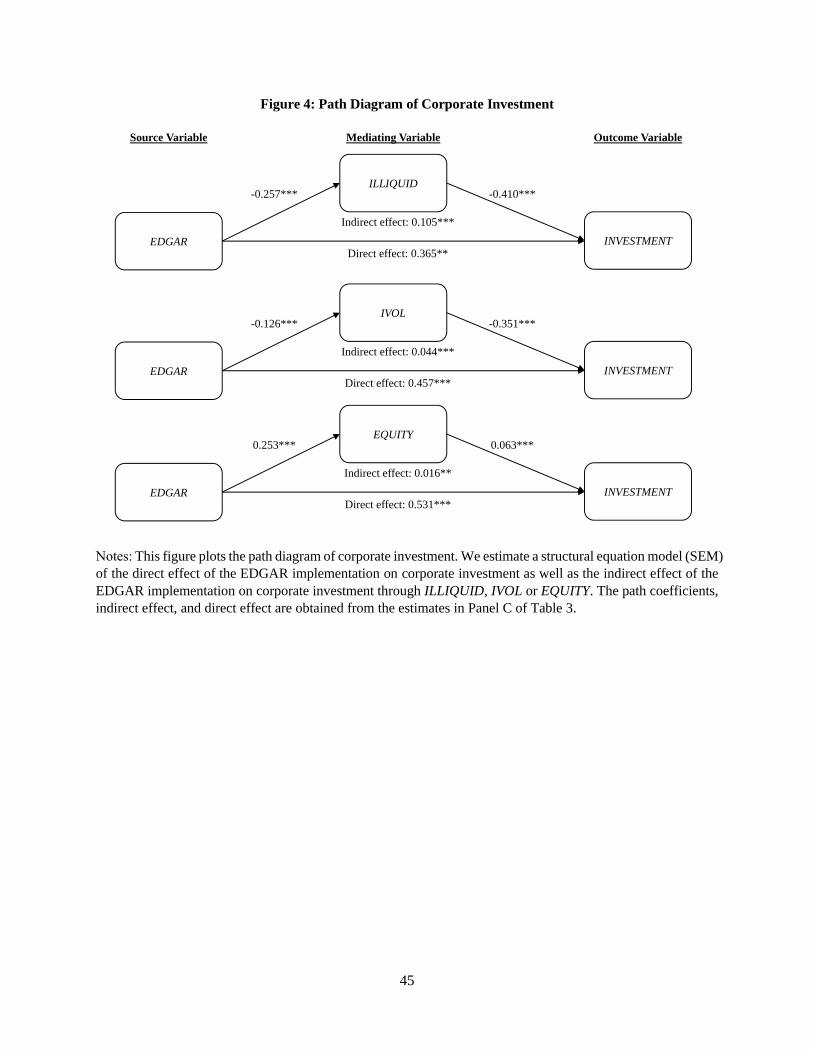
45
Figure 4: Path Diagram of Corporate Investment
Notes: This figure plots the path diagram of corporate investment. We estimate a structural equation model (SEM)
of the direct effect of the EDGAR implementation on corporate investment as well as the indirect effect of the
EDGAR implementation on corporate investment through ILLIQUID, IVOL or EQUITY. The path coefficients,
indirect effect, and direct effect are obtained from the estimates in Panel C of Table 3.
EDGAR
Source Variable Mediating Variable Outcome Variable
INVESTMENT
ILLIQUID-0.257***
Direct effect: 0.365**
-0.410***
EDGAR INVESTMENT
IVOL-0.126***
Direct effect: 0.457***
-0.351***
Indirect effect: 0.044***
Indirect effect: 0.105***
EDGAR INVESTMENT
EQUITY0.253***
Direct effect: 0.531***
0.063***
Indirect effect: 0.016**
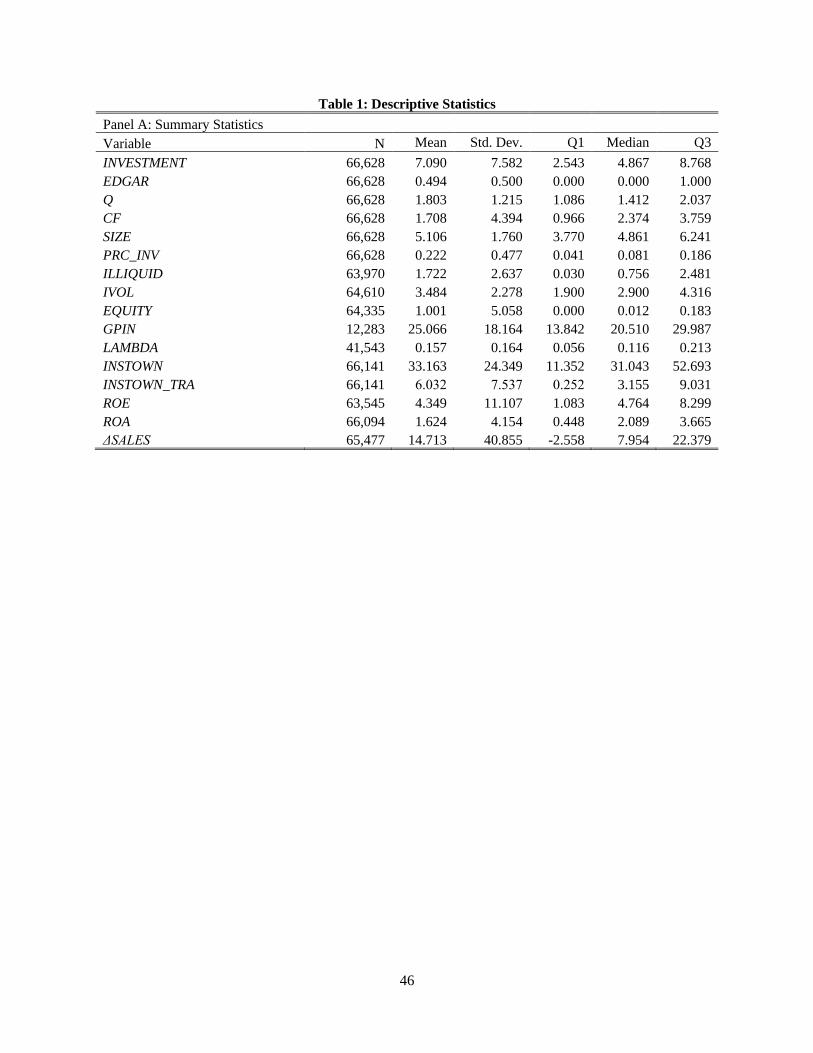
46
Table 1: Descriptive Statistics
Panel A: Summary Statistics
Variable N Mean Std. Dev. Q1 Median Q3
INVESTMENT 66,628 7.090 7.582 2.543 4.867 8.768
EDGAR 66,628 0.494 0.500 0.000 0.000 1.000
Q 66,628 1.803 1.215 1.086 1.412 2.037
CF 66,628 1.708 4.394 0.966 2.374 3.759
SIZE 66,628 5.106 1.760 3.770 4.861 6.241
PRC_INV 66,628 0.222 0.477 0.041 0.081 0.186
ILLIQUID 63,970 1.722 2.637 0.030 0.756 2.481
IVOL 64,610 3.484 2.278 1.900 2.900 4.316
EQUITY 64,335 1.001 5.058 0.000 0.012 0.183
GPIN 12,283 25.066 18.164 13.842 20.510 29.987
LAMBDA 41,543 0.157 0.164 0.056 0.116 0.213
INSTOWN 66,141 33.163 24.349 11.352 31.043 52.693
INSTOWN_TRA 66,141 6.032 7.537 0.252 3.155 9.031
ROE 63,545 4.349 11.107 1.083 4.764 8.299
ROA 66,094 1.624 4.154 0.448 2.089 3.665
ΔSALES 65,477 14.713 40.855 -2.558 7.954 22.379
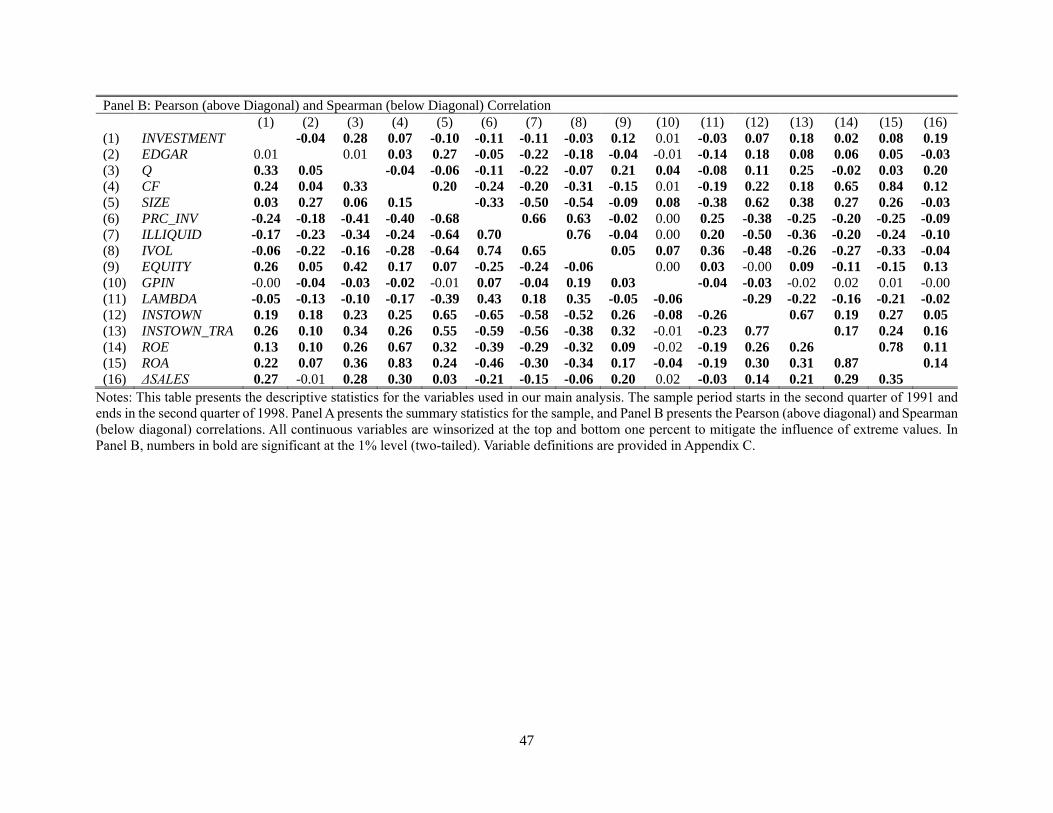
47
Panel B: Pearson (above Diagonal) and Spearman (below Diagonal) Correlation
(1) (2) (3) (4) (5) (6) (7) (8) (9) (10) (11) (12) (13) (14) (15) (16)
(1) INVESTMENT -0.04 0.28 0.07 -0.10 -0.11 -0.11 -0.03 0.12 0.01 -0.03 0.07 0.18 0.02 0.08 0.19
(2) EDGAR 0.01 0.01 0.03 0.27 -0.05 -0.22 -0.18 -0.04 -0.01 -0.14 0.18 0.08 0.06 0.05 -0.03
(3) Q 0.33 0.05 -0.04 -0.06 -0.11 -0.22 -0.07 0.21 0.04 -0.08 0.11 0.25 -0.02 0.03 0.20
(4) CF 0.24 0.04 0.33 0.20 -0.24 -0.20 -0.31 -0.15 0.01 -0.19 0.22 0.18 0.65 0.84 0.12
(5) SIZE 0.03 0.27 0.06 0.15 -0.33 -0.50 -0.54 -0.09 0.08 -0.38 0.62 0.38 0.27 0.26 -0.03
(6) PRC_INV -0.24 -0.18 -0.41 -0.40 -0.68 0.66 0.63 -0.02 0.00 0.25 -0.38 -0.25 -0.20 -0.25 -0.09
(7) ILLIQUID -0.17 -0.23 -0.34 -0.24 -0.64 0.70 0.76 -0.04 0.00 0.20 -0.50 -0.36 -0.20 -0.24 -0.10
(8) IVOL -0.06 -0.22 -0.16 -0.28 -0.64 0.74 0.65 0.05 0.07 0.36 -0.48 -0.26 -0.27 -0.33 -0.04
(9) EQUITY 0.26 0.05 0.42 0.17 0.07 -0.25 -0.24 -0.06 0.00 0.03 -0.00 0.09 -0.11 -0.15 0.13
(10) GPIN -0.00 -0.04 -0.03 -0.02 -0.01 0.07 -0.04 0.19 0.03 -0.04 -0.03 -0.02 0.02 0.01 -0.00
(11) LAMBDA -0.05 -0.13 -0.10 -0.17 -0.39 0.43 0.18 0.35 -0.05 -0.06 -0.29 -0.22 -0.16 -0.21 -0.02
(12) INSTOWN 0.19 0.18 0.23 0.25 0.65 -0.65 -0.58 -0.52 0.26 -0.08 -0.26 0.67 0.19 0.27 0.05
(13) INSTOWN_TRA 0.26 0.10 0.34 0.26 0.55 -0.59 -0.56 -0.38 0.32 -0.01 -0.23 0.77 0.17 0.24 0.16
(14) ROE 0.13 0.10 0.26 0.67 0.32 -0.39 -0.29 -0.32 0.09 -0.02 -0.19 0.26 0.26 0.78 0.11
(15) ROA 0.22 0.07 0.36 0.83 0.24 -0.46 -0.30 -0.34 0.17 -0.04 -0.19 0.30 0.31 0.87 0.14
(16) ΔSALES 0.27 -0.01 0.28 0.30 0.03 -0.21 -0.15 -0.06 0.20 0.02 -0.03 0.14 0.21 0.29 0.35
Notes: This table presents the descriptive statistics for the variables used in our main analysis. The sample period starts in the second quarter of 1991 and
ends in the second quarter of 1998. Panel A presents the summary statistics for the sample, and Panel B presents the Pearson (above diagonal) and Spearman
(below diagonal) correlations. All continuous variables are winsorized at the top and bottom one percent to mitigate the influence of extreme values. In
Panel B, numbers in bold are significant at the 1% level (two-tailed). Variable definitions are provided in Appendix C.
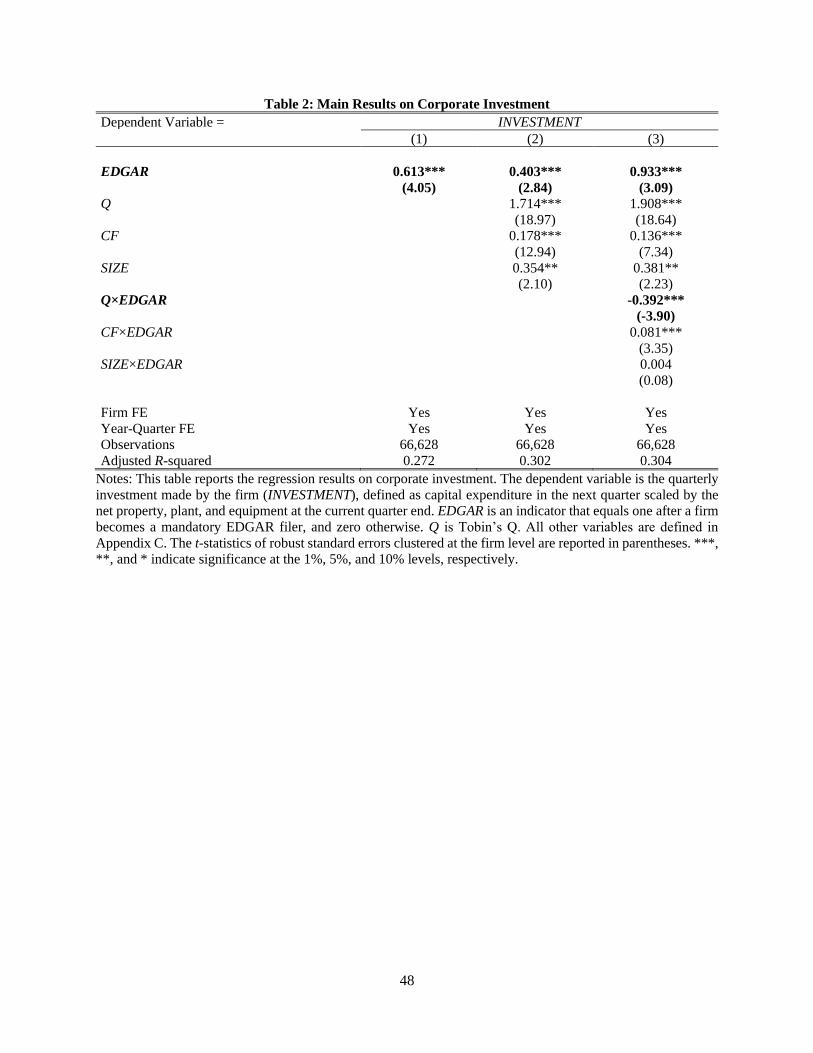
48
Table 2: Main Results on Corporate Investment
Dependent Variable = INVESTMENT
(1) (2) (3)
EDGAR 0.613*** 0.403*** 0.933***
(4.05) (2.84) (3.09)
Q 1.714*** 1.908***
(18.97) (18.64)
CF 0.178*** 0.136***
(12.94) (7.34)
SIZE 0.354** 0.381**
(2.10) (2.23)
Q×EDGAR -0.392***
(-3.90)
CF×EDGAR 0.081***
(3.35)
SIZE×EDGAR 0.004
(0.08)
Firm FE Yes Yes Yes
Year-Quarter FE Yes Yes Yes
Observations 66,628 66,628 66,628
Adjusted R-squared 0.272 0.302 0.304
Notes: This table reports the regression results on corporate investment. The dependent variable is the quarterly
investment made by the firm (INVESTMENT), defined as capital expenditure in the next quarter scaled by the
net property, plant, and equipment at the current quarter end. EDGAR is an indicator that equals one after a firm
becomes a mandatory EDGAR filer, and zero otherwise. Q is Tobin’s Q. All other variables are defined in
Appendix C. The t-statistics of robust standard errors clustered at the firm level are reported in parentheses. ***,
**, and * indicate significance at the 1%, 5%, and 10% levels, respectively.
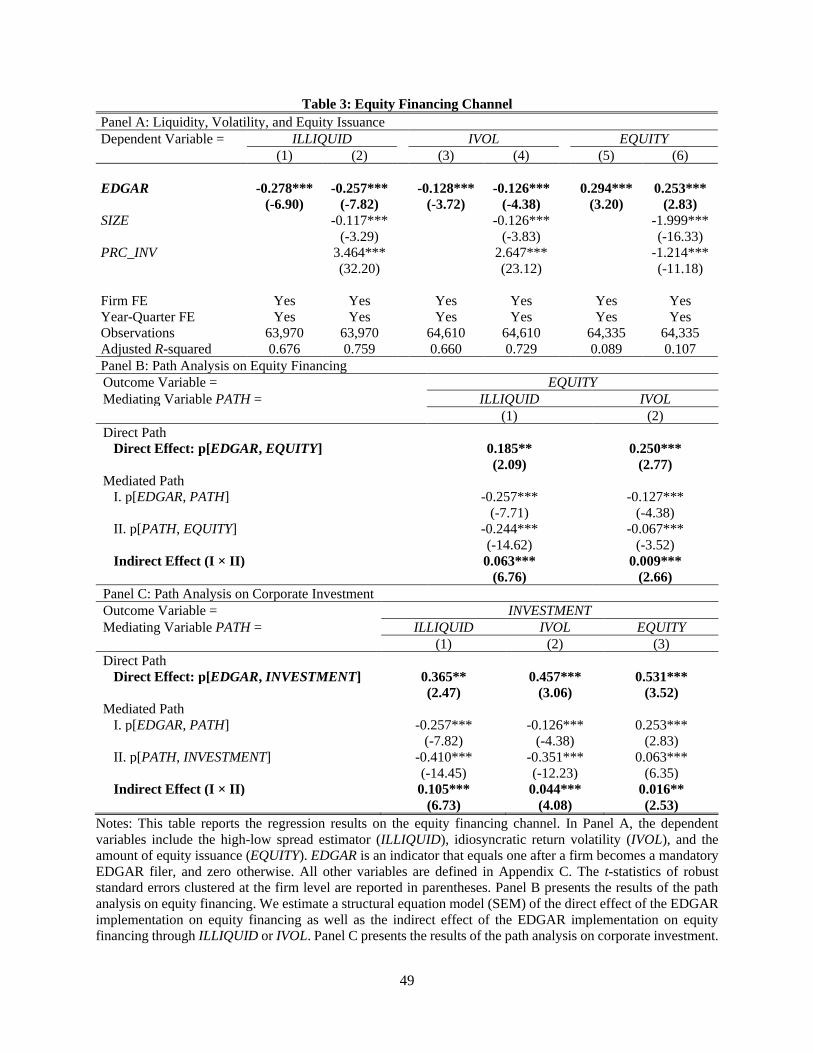
49
Table 3: Equity Financing Channel
Panel A: Liquidity, Volatility, and Equity Issuance
Dependent Variable = ILLIQUID IVOL EQUITY
(1) (2) (3) (4) (5) (6)
EDGAR -0.278*** -0.257*** -0.128*** -0.126*** 0.294*** 0.253***
(-6.90) (-7.82) (-3.72) (-4.38) (3.20) (2.83)
SIZE -0.117*** -0.126*** -1.999***
(-3.29) (-3.83) (-16.33)
PRC_INV 3.464*** 2.647*** -1.214***
(32.20) (23.12) (-11.18)
Firm FE Yes Yes Yes Yes Yes Yes
Year-Quarter FE Yes Yes Yes Yes Yes Yes
Observations 63,970 63,970 64,610 64,610 64,335 64,335
Adjusted R-squared 0.676 0.759 0.660 0.729 0.089 0.107
Panel B: Path Analysis on Equity Financing
Outcome Variable = EQUITY
Mediating Variable PATH = ILLIQUID IVOL
(1) (2)
Direct Path
Direct Effect: p[EDGAR, EQUITY] 0.185** 0.250***
(2.09) (2.77)
Mediated Path
I. p[EDGAR, PATH] -0.257*** -0.127***
(-7.71) (-4.38)
II. p[PATH, EQUITY] -0.244*** -0.067***
(-14.62) (-3.52)
Indirect Effect (I × II) 0.063*** 0.009***
(6.76) (2.66)
Panel C: Path Analysis on Corporate Investment
Outcome Variable = INVESTMENT
Mediating Variable PATH = ILLIQUID IVOL EQUITY
(1) (2) (3)
Direct Path
Direct Effect: p[EDGAR, INVESTMENT] 0.365** 0.457*** 0.531***
(2.47) (3.06) (3.52)
Mediated Path
I. p[EDGAR, PATH] -0.257*** -0.126*** 0.253***
(-7.82) (-4.38) (2.83)
II. p[PATH, INVESTMENT] -0.410*** -0.351*** 0.063***
(-14.45) (-12.23) (6.35)
Indirect Effect (I × II) 0.105*** 0.044*** 0.016**
(6.73) (4.08) (2.53)
Notes: This table reports the regression results on the equity financing channel. In Panel A, the dependent
variables include the high-low spread estimator (ILLIQUID), idiosyncratic return volatility (IVOL), and the
amount of equity issuance (EQUITY). EDGAR is an indicator that equals one after a firm becomes a mandatory
EDGAR filer, and zero otherwise. All other variables are defined in Appendix C. The t-statistics of robust
standard errors clustered at the firm level are reported in parentheses. Panel B presents the results of the path
analysis on equity financing. We estimate a structural equation model (SEM) of the direct effect of the EDGAR
implementation on equity financing as well as the indirect effect of the EDGAR implementation on equity
financing through ILLIQUID or IVOL. Panel C presents the results of the path analysis on corporate investment.

50
We estimate a structural equation model (SEM) of the direct effect of the EDGAR implementation on corporate
investment as well as the indirect effect of the EDGAR implementation on corporate investment through
ILLIQUID, IVOL or EQUITY. In Panels B and C, the path coefficient is labeled p[.]; control variables, firm fixed
effects, and year-quarter fixed effects are included in each of the SEM equations; the z-statistics of robust
standard errors clustered at the firm level are reported in parentheses. *, **, and *** denote significance at the
10%, 5%, and 1% levels, respectively.
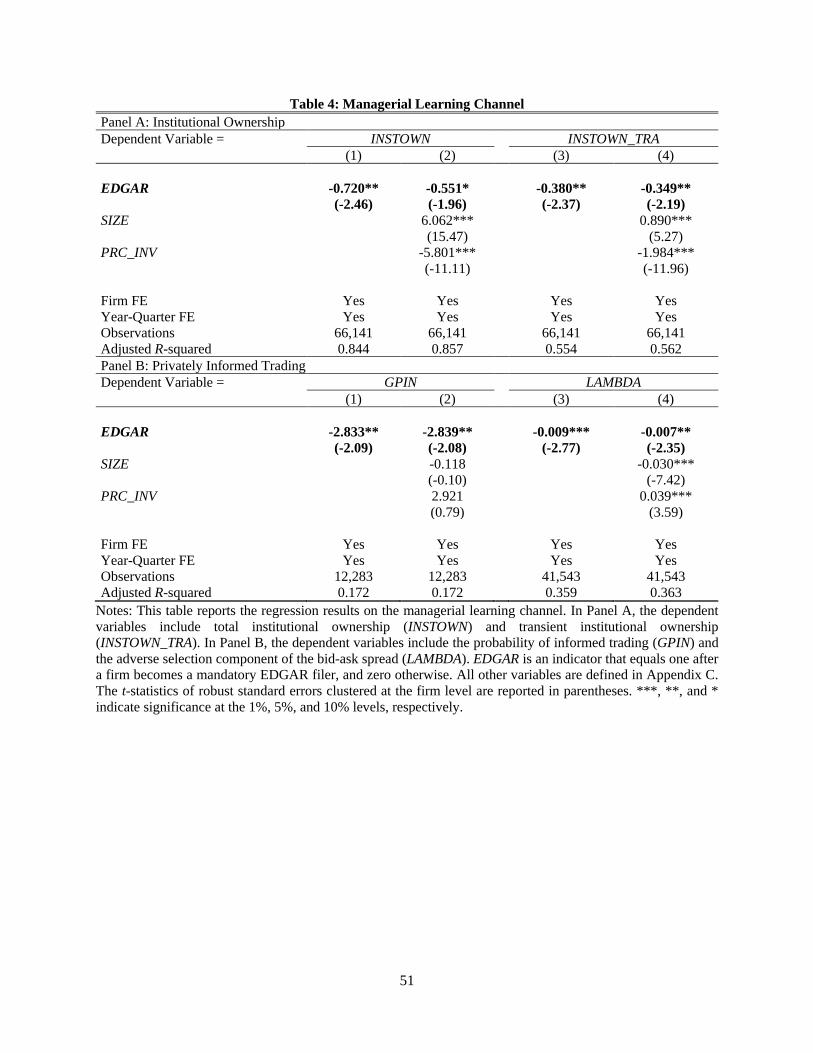
51
Table 4: Managerial Learning Channel
Panel A: Institutional Ownership
Dependent Variable = INSTOWN INSTOWN_TRA
(1) (2) (3) (4)
EDGAR -0.720** -0.551* -0.380** -0.349**
(-2.46) (-1.96) (-2.37) (-2.19)
SIZE 6.062*** 0.890***
(15.47) (5.27)
PRC_INV -5.801*** -1.984***
(-11.11) (-11.96)
Firm FE Yes Yes Yes Yes
Year-Quarter FE Yes Yes Yes Yes
Observations 66,141 66,141 66,141 66,141
Adjusted R-squared 0.844 0.857 0.554 0.562
Panel B: Privately Informed Trading
Dependent Variable = GPIN LAMBDA
(1) (2) (3) (4)
EDGAR -2.833** -2.839** -0.009*** -0.007**
(-2.09) (-2.08) (-2.77) (-2.35)
SIZE -0.118 -0.030***
(-0.10) (-7.42)
PRC_INV 2.921 0.039***
(0.79) (3.59)
Firm FE Yes Yes Yes Yes
Year-Quarter FE Yes Yes Yes Yes
Observations 12,283 12,283 41,543 41,543
Adjusted R-squared 0.172 0.172 0.359 0.363
Notes: This table reports the regression results on the managerial learning channel. In Panel A, the dependent
variables include total institutional ownership (INSTOWN) and transient institutional ownership
(INSTOWN_TRA). In Panel B, the dependent variables include the probability of informed trading (GPIN) and
the adverse selection component of the bid-ask spread (LAMBDA). EDGAR is an indicator that equals one after
a firm becomes a mandatory EDGAR filer, and zero otherwise. All other variables are defined in Appendix C.
The t-statistics of robust standard errors clustered at the firm level are reported in parentheses. ***, **, and *
indicate significance at the 1%, 5%, and 10% levels, respectively.
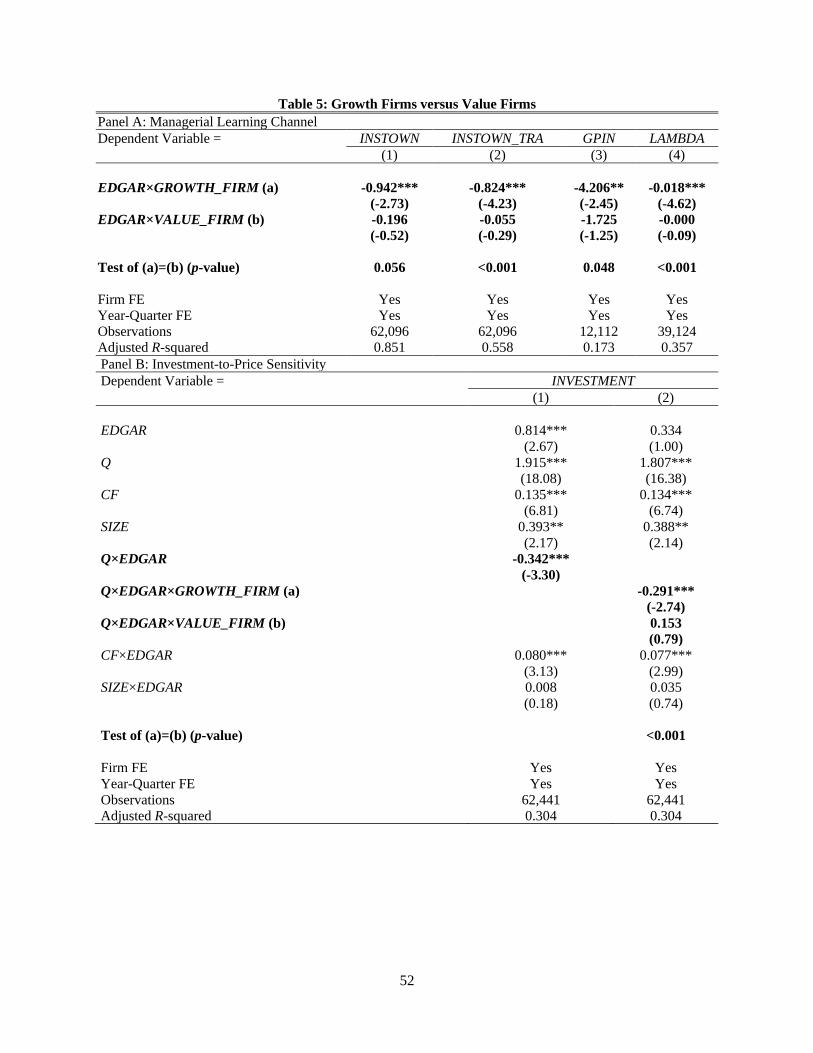
52
Table 5: Growth Firms versus Value Firms
Panel A: Managerial Learning Channel
Dependent Variable = INSTOWN INSTOWN_TRA GPIN LAMBDA
(1) (2) (3) (4)
EDGAR×GROWTH_FIRM (a) -0.942*** -0.824*** -4.206** -0.018***
(-2.73) (-4.23) (-2.45) (-4.62)
EDGAR×VALUE_FIRM (b) -0.196 -0.055 -1.725 -0.000
(-0.52) (-0.29) (-1.25) (-0.09)
Test of (a)=(b) (p-value) 0.056 <0.001 0.048 <0.001
Firm FE Yes Yes Yes Yes
Year-Quarter FE Yes Yes Yes Yes
Observations 62,096 62,096 12,112 39,124
Adjusted R-squared 0.851 0.558 0.173 0.357
Panel B: Investment-to-Price Sensitivity
Dependent Variable = INVESTMENT
(1) (2)
EDGAR 0.814*** 0.334
(2.67) (1.00)
Q 1.915*** 1.807***
(18.08) (16.38)
CF 0.135*** 0.134***
(6.81) (6.74)
SIZE 0.393** 0.388**
(2.17) (2.14)
Q×EDGAR -0.342***
(-3.30)
Q×EDGAR×GROWTH_FIRM (a) -0.291***
(-2.74)
Q×EDGAR×VALUE_FIRM (b) 0.153
(0.79)
CF×EDGAR 0.080*** 0.077***
(3.13) (2.99)
SIZE×EDGAR 0.008 0.035
(0.18) (0.74)
Test of (a)=(b) (p-value) <0.001
Firm FE Yes Yes
Year-Quarter FE Yes Yes
Observations 62,441 62,441
Adjusted R-squared 0.304 0.304
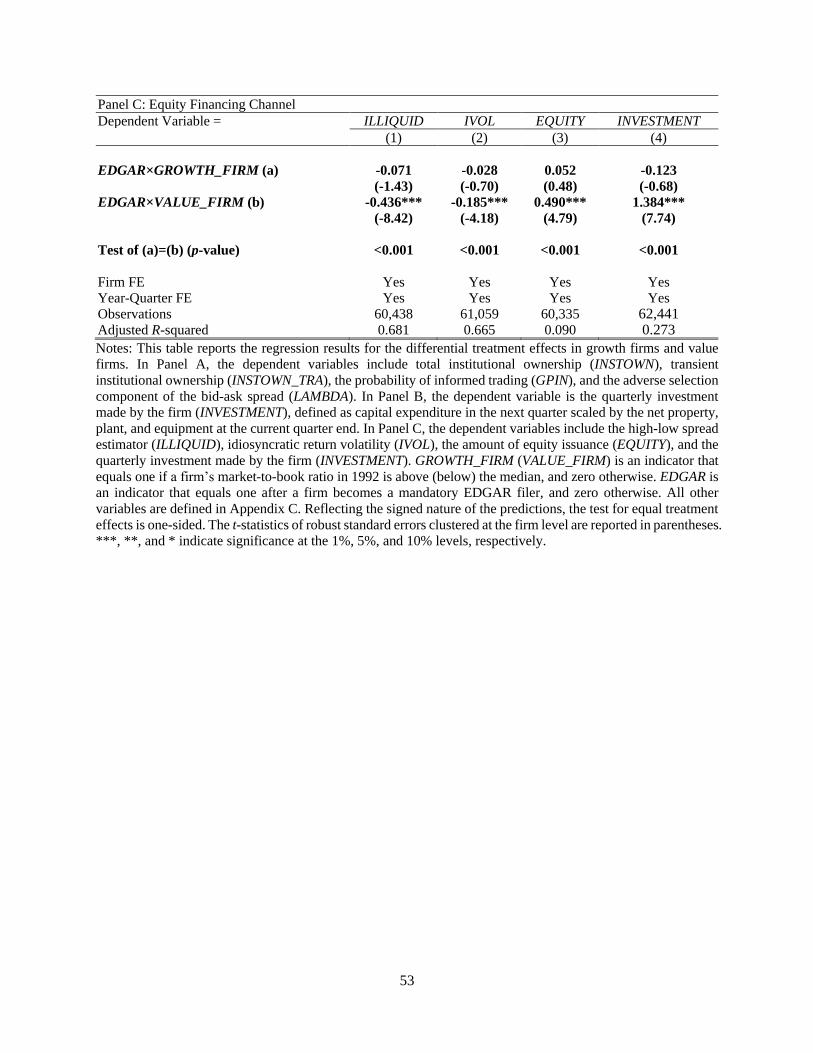
53
Panel C: Equity Financing Channel
Dependent Variable = ILLIQUID IVOL EQUITY INVESTMENT
(1) (2) (3) (4)
EDGAR×GROWTH_FIRM (a) -0.071 -0.028 0.052 -0.123
(-1.43) (-0.70) (0.48) (-0.68)
EDGAR×VALUE_FIRM (b) -0.436*** -0.185*** 0.490*** 1.384***
(-8.42) (-4.18) (4.79) (7.74)
Test of (a)=(b) (p-value) <0.001 <0.001 <0.001 <0.001
Firm FE Yes Yes Yes Yes
Year-Quarter FE Yes Yes Yes Yes
Observations 60,438 61,059 60,335 62,441
Adjusted R-squared 0.681 0.665 0.090 0.273
Notes: This table reports the regression results for the differential treatment effects in growth firms and value
firms. In Panel A, the dependent variables include total institutional ownership (INSTOWN), transient
institutional ownership (INSTOWN_TRA), the probability of informed trading (GPIN), and the adverse selection
component of the bid-ask spread (LAMBDA). In Panel B, the dependent variable is the quarterly investment
made by the firm (INVESTMENT), defined as capital expenditure in the next quarter scaled by the net property,
plant, and equipment at the current quarter end. In Panel C, the dependent variables include the high-low spread
estimator (ILLIQUID), idiosyncratic return volatility (IVOL), the amount of equity issuance (EQUITY), and the
quarterly investment made by the firm (INVESTMENT). GROWTH_FIRM (VALUE_FIRM) is an indicator that
equals one if a firm’s market-to-book ratio in 1992 is above (below) the median, and zero otherwise. EDGAR is
an indicator that equals one after a firm becomes a mandatory EDGAR filer, and zero otherwise. All other
variables are defined in Appendix C. Reflecting the signed nature of the predictions, the test for equal treatment
effects is one-sided. The t-statistics of robust standard errors clustered at the firm level are reported in parentheses.
***, **, and * indicate significance at the 1%, 5%, and 10% levels, respectively.
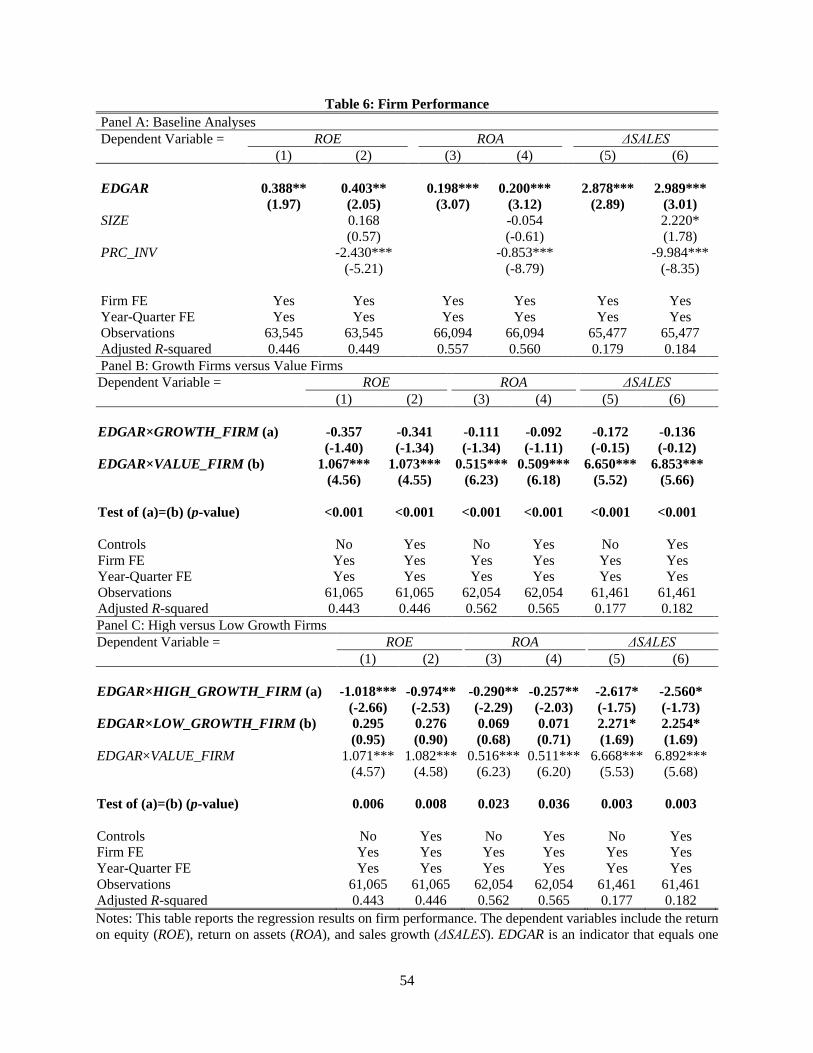
54
Table 6: Firm Performance
Panel A: Baseline Analyses
Dependent Variable = ROE ROA ΔSALES
(1) (2) (3) (4) (5) (6)
EDGAR 0.388** 0.403** 0.198*** 0.200*** 2.878*** 2.989***
(1.97) (2.05) (3.07) (3.12) (2.89) (3.01)
SIZE 0.168 -0.054 2.220*
(0.57) (-0.61) (1.78)
PRC_INV -2.430*** -0.853*** -9.984***
(-5.21) (-8.79) (-8.35)
Firm FE Yes Yes Yes Yes Yes Yes
Year-Quarter FE Yes Yes Yes Yes Yes Yes
Observations 63,545 63,545 66,094 66,094 65,477 65,477
Adjusted R-squared 0.446 0.449 0.557 0.560 0.179 0.184
Panel B: Growth Firms versus Value Firms
Dependent Variable = ROE ROA ΔSALES
(1) (2) (3) (4) (5) (6)
EDGAR×GROWTH_FIRM (a) -0.357 -0.341 -0.111 -0.092 -0.172 -0.136
(-1.40) (-1.34) (-1.34) (-1.11) (-0.15) (-0.12)
EDGAR×VALUE_FIRM (b) 1.067*** 1.073*** 0.515*** 0.509*** 6.650*** 6.853***
(4.56) (4.55) (6.23) (6.18) (5.52) (5.66)
Test of (a)=(b) (p-value) <0.001 <0.001 <0.001 <0.001 <0.001 <0.001
Controls No Yes No Yes No Yes
Firm FE Yes Yes Yes Yes Yes Yes
Year-Quarter FE Yes Yes Yes Yes Yes Yes
Observations 61,065 61,065 62,054 62,054 61,461 61,461
Adjusted R-squared 0.443 0.446 0.562 0.565 0.177 0.182
Panel C: High versus Low Growth Firms
Dependent Variable = ROE ROA ΔSALES
(1) (2) (3) (4) (5) (6)
EDGAR×HIGH_GROWTH_FIRM (a) -1.018*** -0.974** -0.290** -0.257** -2.617* -2.560*
(-2.66) (-2.53) (-2.29) (-2.03) (-1.75) (-1.73)
EDGAR×LOW_GROWTH_FIRM (b) 0.295 0.276 0.069 0.071 2.271* 2.254*
(0.95) (0.90) (0.68) (0.71) (1.69) (1.69)
EDGAR×VALUE_FIRM 1.071*** 1.082*** 0.516*** 0.511*** 6.668*** 6.892***
(4.57) (4.58) (6.23) (6.20) (5.53) (5.68)
Test of (a)=(b) (p-value) 0.006 0.008 0.023 0.036 0.003 0.003
Controls No Yes No Yes No Yes
Firm FE Yes Yes Yes Yes Yes Yes
Year-Quarter FE Yes Yes Yes Yes Yes Yes
Observations 61,065 61,065 62,054 62,054 61,461 61,461
Adjusted R-squared 0.443 0.446 0.562 0.565 0.177 0.182
Notes: This table reports the regression results on firm performance. The dependent variables include the return
on equity (ROE), return on assets (ROA), and sales growth (ΔSALES). EDGAR is an indicator that equals one

55
after a firm becomes a mandatory EDGAR filer, and zero otherwise. GROWTH_FIRM (VALUE_FIRM) is an
indicator that equals one if a firm’s market-to-book ratio in 1992 is above (below) the median, and zero otherwise.
HIGH_GROWTH_FIRM (LOW_GROWTH_FIRM) is an indicator that equals one if a growth firm’s market-to-
book ratio in 1992 is above (below) the median of growth firms, and zero otherwise. All other variables are
defined in Appendix C. The t-statistics of robust standard errors clustered at the firm level are reported in
parentheses. ***, **, and * indicate significance at the 1%, 5%, and 10% levels, respectively.
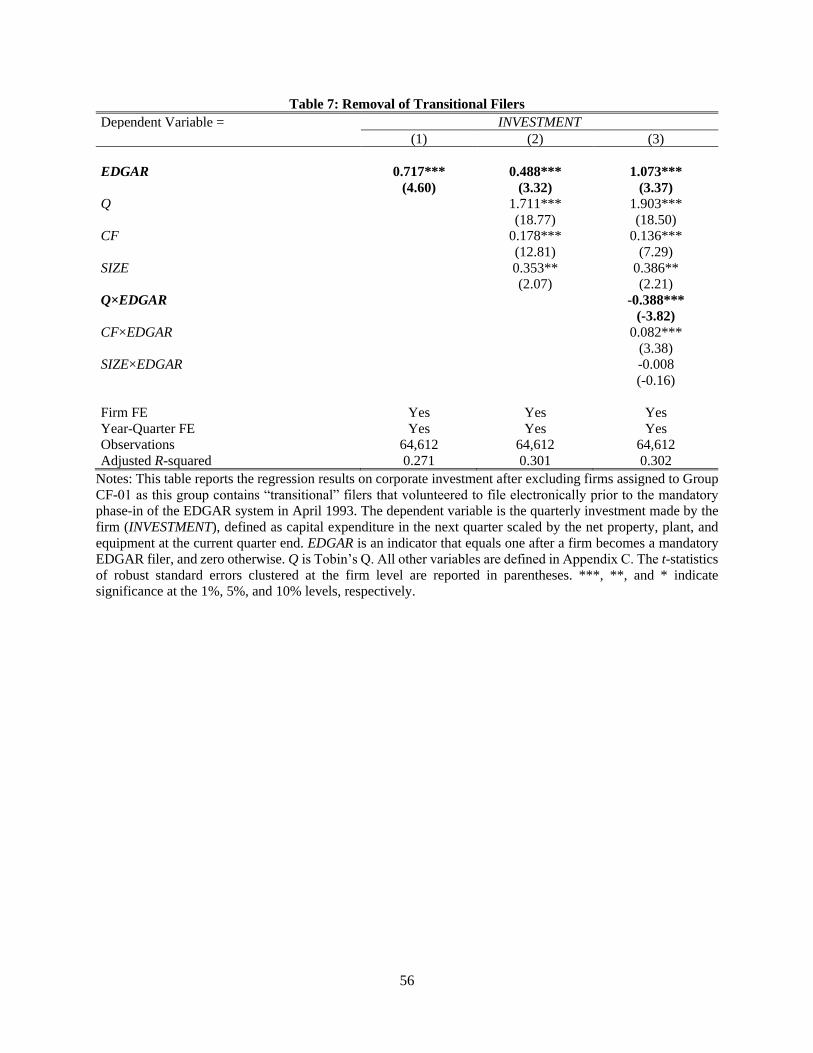
56
Table 7: Removal of Transitional Filers
Dependent Variable = INVESTMENT
(1) (2) (3)
EDGAR 0.717*** 0.488*** 1.073***
(4.60) (3.32) (3.37)
Q 1.711*** 1.903***
(18.77) (18.50)
CF 0.178*** 0.136***
(12.81) (7.29)
SIZE 0.353** 0.386**
(2.07) (2.21)
Q×EDGAR -0.388***
(-3.82)
CF×EDGAR 0.082***
(3.38)
SIZE×EDGAR -0.008
(-0.16)
Firm FE Yes Yes Yes
Year-Quarter FE Yes Yes Yes
Observations 64,612 64,612 64,612
Adjusted R-squared 0.271 0.301 0.302
Notes: This table reports the regression results on corporate investment after excluding firms assigned to Group
CF-01 as this group contains “transitional” filers that volunteered to file electronically prior to the mandatory
phase-in of the EDGAR system in April 1993. The dependent variable is the quarterly investment made by the
firm (INVESTMENT), defined as capital expenditure in the next quarter scaled by the net property, plant, and
equipment at the current quarter end. EDGAR is an indicator that equals one after a firm becomes a mandatory
EDGAR filer, and zero otherwise. Q is Tobin’s Q. All other variables are defined in Appendix C. The t-statistics
of robust standard errors clustered at the firm level are reported in parentheses. ***, **, and * indicate
significance at the 1%, 5%, and 10% levels, respectively.
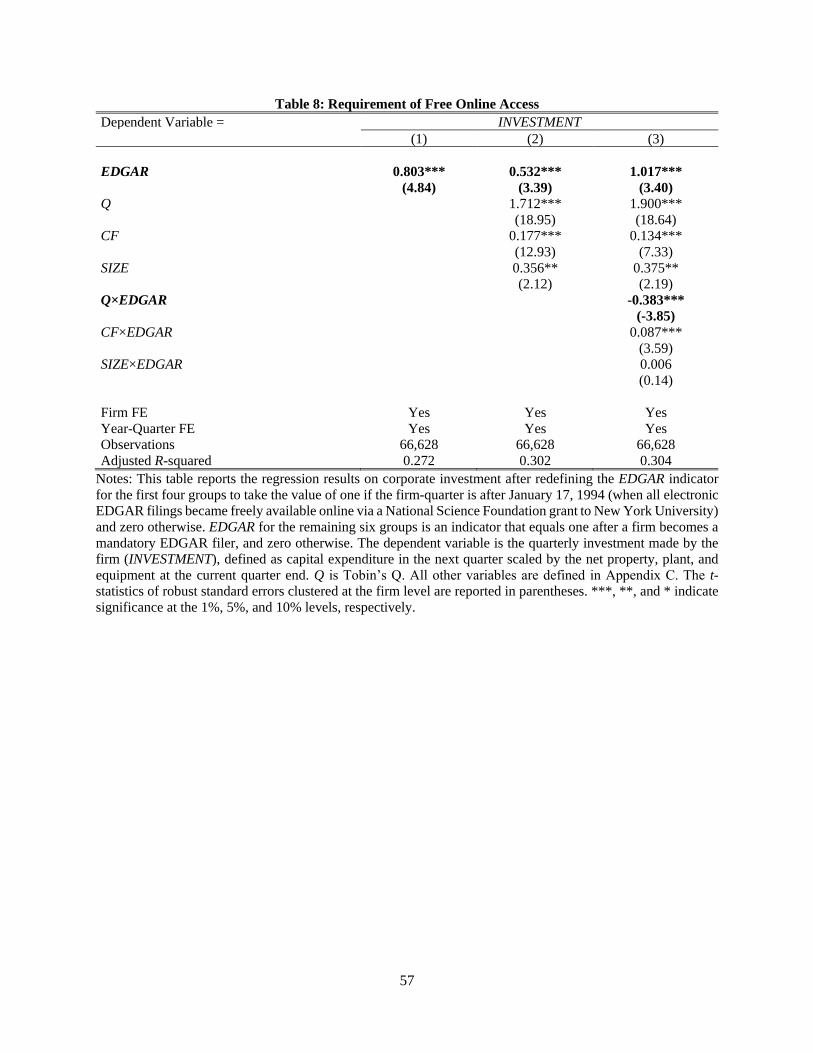
57
Table 8: Requirement of Free Online Access
Dependent Variable = INVESTMENT
(1) (2) (3)
EDGAR 0.803*** 0.532*** 1.017***
(4.84) (3.39) (3.40)
Q 1.712*** 1.900***
(18.95) (18.64)
CF 0.177*** 0.134***
(12.93) (7.33)
SIZE 0.356** 0.375**
(2.12) (2.19)
Q×EDGAR -0.383***
(-3.85)
CF×EDGAR 0.087***
(3.59)
SIZE×EDGAR 0.006
(0.14)
Firm FE Yes Yes Yes
Year-Quarter FE Yes Yes Yes
Observations 66,628 66,628 66,628
Adjusted R-squared 0.272 0.302 0.304
Notes: This table reports the regression results on corporate investment after redefining the EDGAR indicator
for the first four groups to take the value of one if the firm-quarter is after January 17, 1994 (when all electronic
EDGAR filings became freely available online via a National Science Foundation grant to New York University)
and zero otherwise. EDGAR for the remaining six groups is an indicator that equals one after a firm becomes a
mandatory EDGAR filer, and zero otherwise. The dependent variable is the quarterly investment made by the
firm (INVESTMENT), defined as capital expenditure in the next quarter scaled by the net property, plant, and
equipment at the current quarter end. Q is Tobin’s Q. All other variables are defined in Appendix C. The t-statistics of robust standard errors clustered at the firm level are reported in parentheses. ***, **, and * indicate
significance at the 1%, 5%, and 10% levels, respectively.

58
Online Appendix for
The Real Effects of Modern Information Technologies
Itay Goldstein a, Shijie Yang b, Luo Zuo c
a Wharton School, University of Pennsylvania
b School of Management and Economics, Chinese University of Hong Kong, Shenzhen c Samuel Curtis Johnson Graduate School of Management, Cornell University

59
Table A1: An Alternative Proxy for Firm Size
Dependent Variable = INVESTMENT
(1) (2) (3)
EDGAR 0.613*** 0.406*** 1.520***
(4.05) (2.90) (6.14)
Q 1.118*** 1.305***
(10.59) (11.27)
CF 0.136*** 0.109***
(10.17) (6.04)
MVE 1.538*** 1.618***
(13.96) (14.69)
Q×EDGAR -0.425***
(-4.07)
CF×EDGAR 0.048**
(2.03)
MVE×EDGAR -0.093**
(-2.16)
Firm FE Yes Yes Yes
Year-Quarter FE Yes Yes Yes
Observations 66,628 66,628 66,628
Adjusted R-squared 0.272 0.311 0.312
Notes: This table reports the regression results on corporate investment with an alternative proxy for firm size
i.e., the natural logarithm of market capitalization (MVE). The dependent variable is the quarterly investment
made by the firm (INVESTMENT), defined as capital expenditure in the next quarter scaled by the net property,
plant, and equipment at the current quarter end. EDGAR is an indicator that equals one after a firm becomes a
mandatory EDGAR filer, and zero otherwise. Q is Tobin’s Q. All other variables are defined in Appendix C.
The t-statistics of robust standard errors clustered at the firm level are reported in parentheses. ***, **, and *
indicate significance at the 1%, 5%, and 10% levels, respectively.
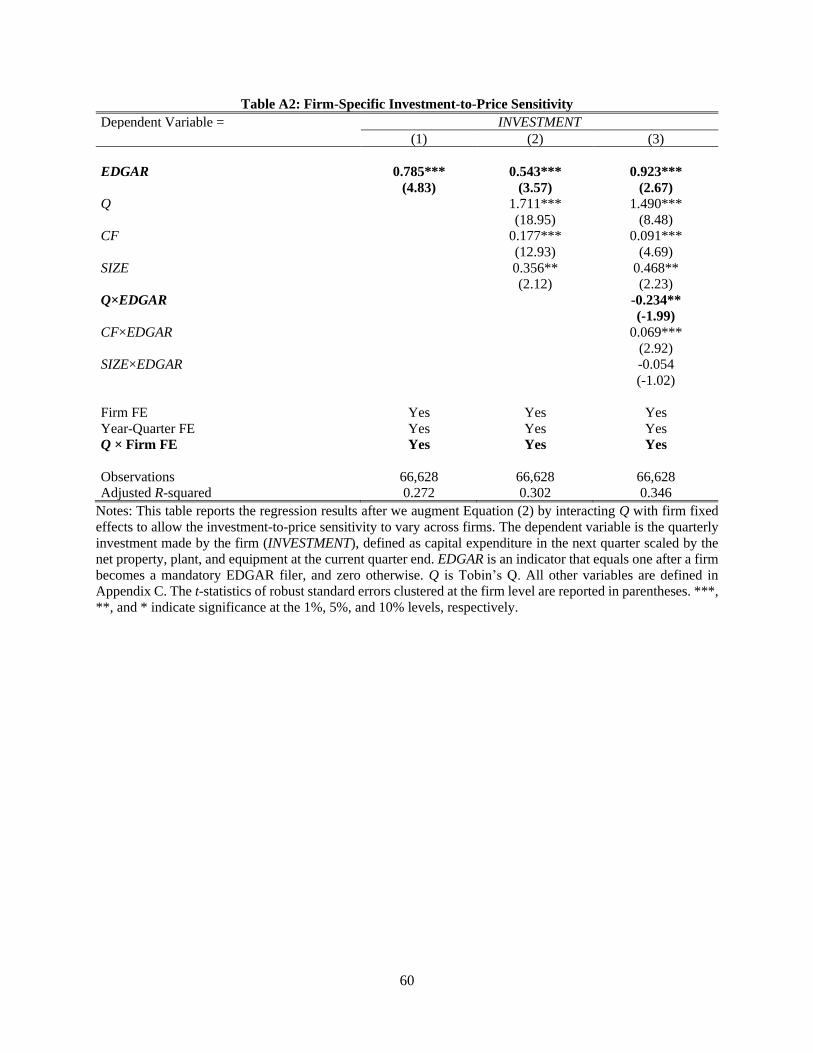
60
Table A2: Firm-Specific Investment-to-Price Sensitivity
Dependent Variable = INVESTMENT
(1) (2) (3)
EDGAR 0.785*** 0.543*** 0.923***
(4.83) (3.57) (2.67)
Q 1.711*** 1.490***
(18.95) (8.48)
CF 0.177*** 0.091***
(12.93) (4.69)
SIZE 0.356** 0.468**
(2.12) (2.23)
Q×EDGAR -0.234**
(-1.99)
CF×EDGAR 0.069***
(2.92)
SIZE×EDGAR -0.054
(-1.02)
Firm FE Yes Yes Yes
Year-Quarter FE Yes Yes Yes
Q × Firm FE Yes Yes Yes
Observations 66,628 66,628 66,628
Adjusted R-squared 0.272 0.302 0.346
Notes: This table reports the regression results after we augment Equation (2) by interacting Q with firm fixed
effects to allow the investment-to-price sensitivity to vary across firms. The dependent variable is the quarterly
investment made by the firm (INVESTMENT), defined as capital expenditure in the next quarter scaled by the
net property, plant, and equipment at the current quarter end. EDGAR is an indicator that equals one after a firm
becomes a mandatory EDGAR filer, and zero otherwise. Q is Tobin’s Q. All other variables are defined in
Appendix C. The t-statistics of robust standard errors clustered at the firm level are reported in parentheses. ***,
**, and * indicate significance at the 1%, 5%, and 10% levels, respectively.
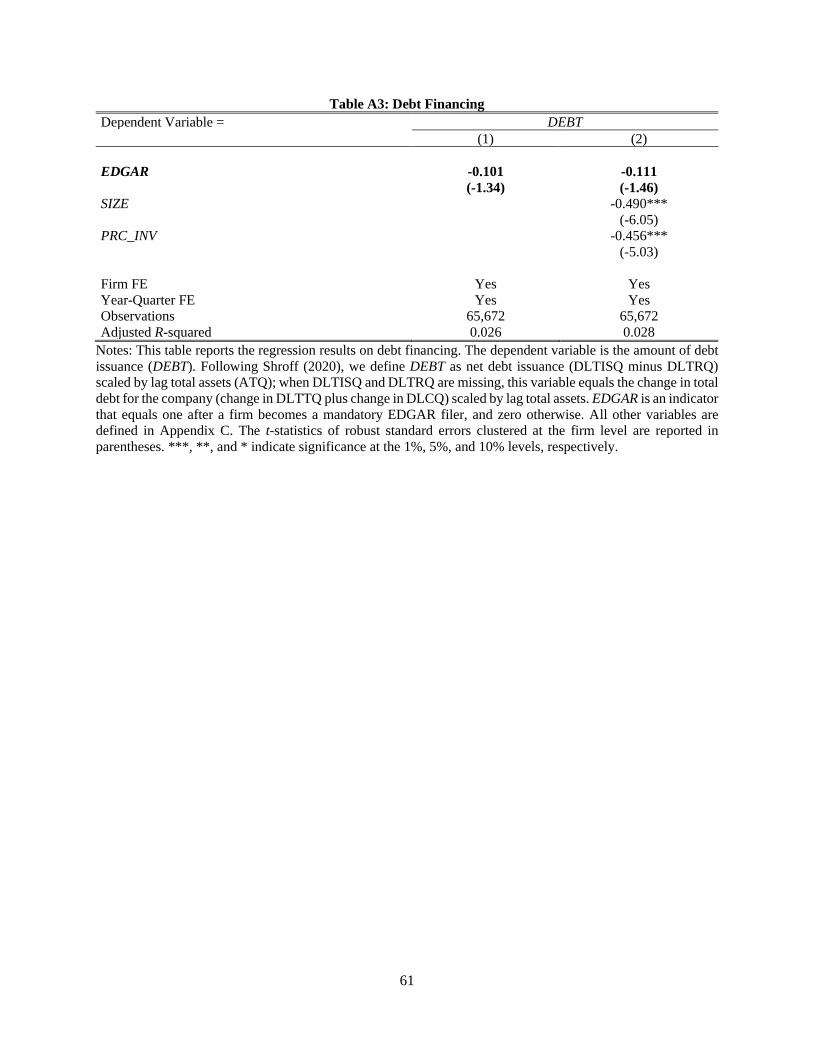
61
Table A3: Debt Financing
Dependent Variable = DEBT
(1) (2)
EDGAR -0.101 -0.111
(-1.34) (-1.46)
SIZE -0.490***
(-6.05)
PRC_INV -0.456***
(-5.03)
Firm FE Yes Yes
Year-Quarter FE Yes Yes
Observations 65,672 65,672
Adjusted R-squared 0.026 0.028
Notes: This table reports the regression results on debt financing. The dependent variable is the amount of debt
issuance (DEBT). Following Shroff (2020), we define DEBT as net debt issuance (DLTISQ minus DLTRQ)
scaled by lag total assets (ATQ); when DLTISQ and DLTRQ are missing, this variable equals the change in total
debt for the company (change in DLTTQ plus change in DLCQ) scaled by lag total assets. EDGAR is an indicator
that equals one after a firm becomes a mandatory EDGAR filer, and zero otherwise. All other variables are
defined in Appendix C. The t-statistics of robust standard errors clustered at the firm level are reported in
parentheses. ***, **, and * indicate significance at the 1%, 5%, and 10% levels, respectively.
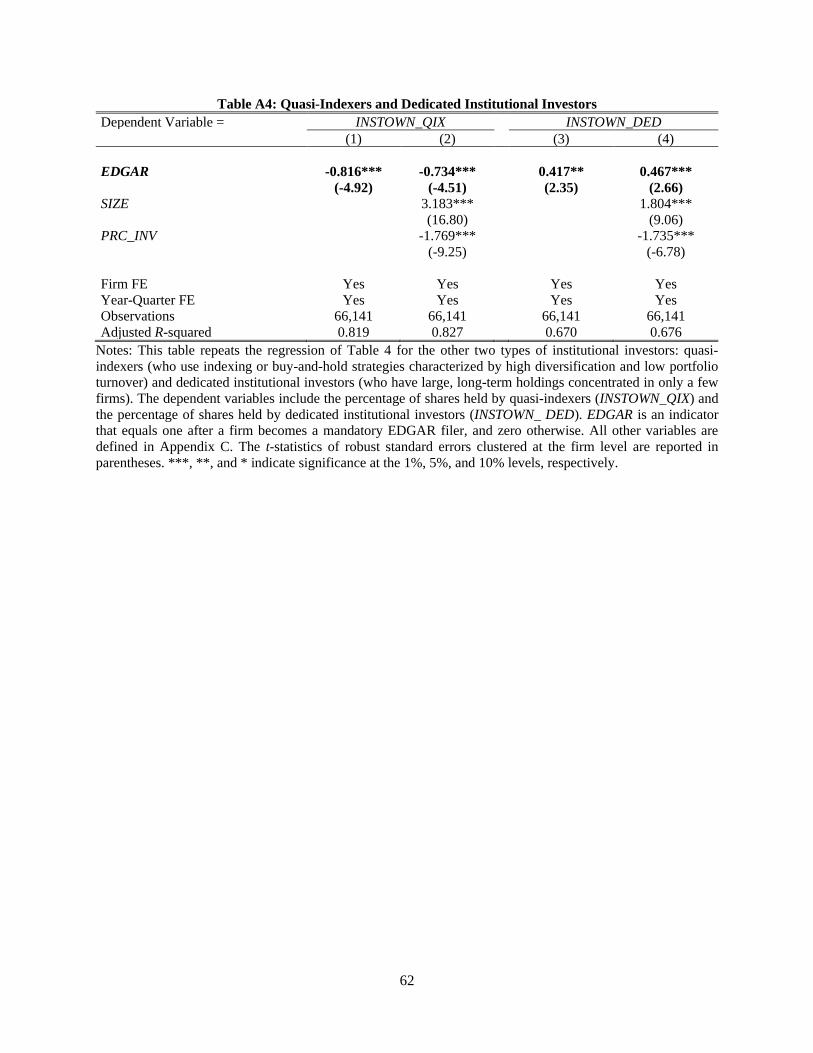
62
Table A4: Quasi-Indexers and Dedicated Institutional Investors
Dependent Variable = INSTOWN_QIX INSTOWN_DED
(1) (2) (3) (4)
EDGAR -0.816*** -0.734*** 0.417** 0.467***
(-4.92) (-4.51) (2.35) (2.66)
SIZE 3.183*** 1.804***
(16.80) (9.06)
PRC_INV -1.769*** -1.735***
(-9.25) (-6.78)
Firm FE Yes Yes Yes Yes
Year-Quarter FE Yes Yes Yes Yes
Observations 66,141 66,141 66,141 66,141
Adjusted R-squared 0.819 0.827 0.670 0.676
Notes: This table repeats the regression of Table 4 for the other two types of institutional investors: quasi-
indexers (who use indexing or buy-and-hold strategies characterized by high diversification and low portfolio
turnover) and dedicated institutional investors (who have large, long-term holdings concentrated in only a few
firms). The dependent variables include the percentage of shares held by quasi-indexers (INSTOWN_QIX) and
the percentage of shares held by dedicated institutional investors (INSTOWN_ DED). EDGAR is an indicator
that equals one after a firm becomes a mandatory EDGAR filer, and zero otherwise. All other variables are
defined in Appendix C. The t-statistics of robust standard errors clustered at the firm level are reported in
parentheses. ***, **, and * indicate significance at the 1%, 5%, and 10% levels, respectively.
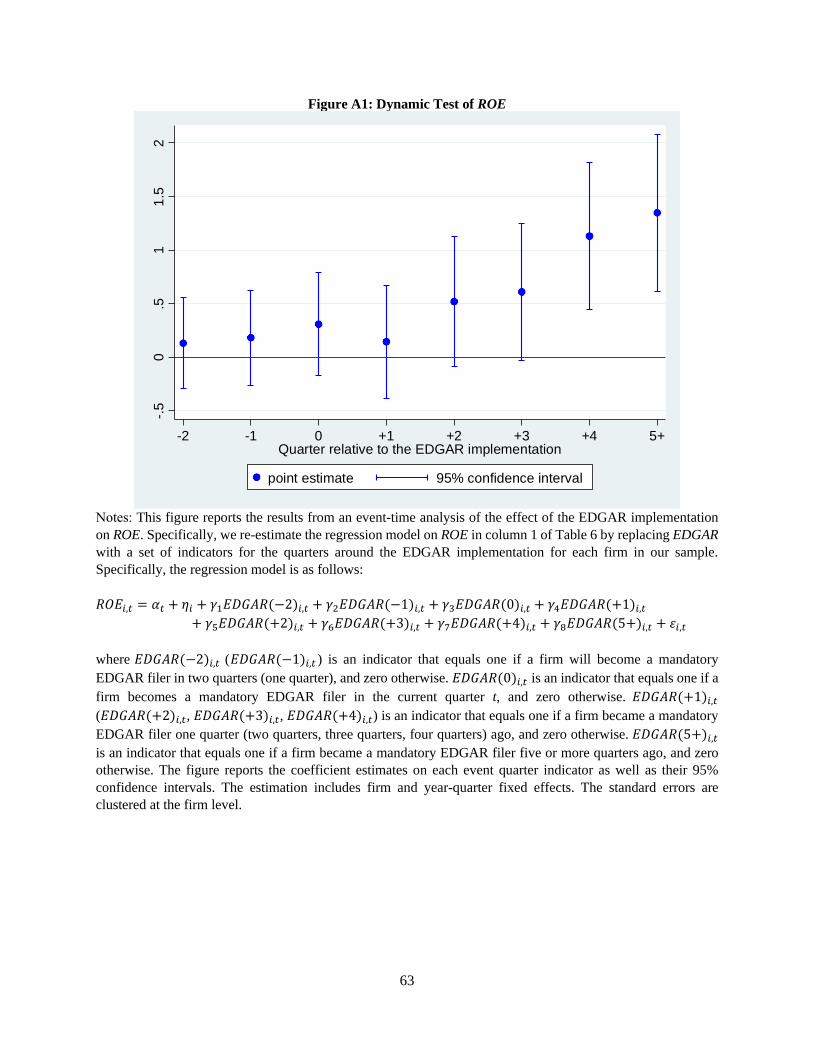
63
Figure A1: Dynamic Test of ROE
Notes: This figure reports the results from an event-time analysis of the effect of the EDGAR implementation
on ROE. Specifically, we re-estimate the regression model on ROE in column 1 of Table 6 by replacing EDGAR
with a set of indicators for the quarters around the EDGAR implementation for each firm in our sample.
Specifically, the regression model is as follows:
𝑅𝑂𝐸𝑖,𝑡 = 𝛼𝑡 + 𝜂𝑖 + 𝛾1𝐸𝐷𝐺𝐴𝑅(−2)𝑖,𝑡 + 𝛾2𝐸𝐷𝐺𝐴𝑅(−1)𝑖,𝑡 + 𝛾3𝐸𝐷𝐺𝐴𝑅(0)𝑖,𝑡 + 𝛾4𝐸𝐷𝐺𝐴𝑅(+1)𝑖,𝑡
+ 𝛾5𝐸𝐷𝐺𝐴𝑅(+2)𝑖,𝑡 + 𝛾6𝐸𝐷𝐺𝐴𝑅(+3)𝑖,𝑡 + 𝛾7𝐸𝐷𝐺𝐴𝑅(+4)𝑖,𝑡 + 𝛾8𝐸𝐷𝐺𝐴𝑅(5+)𝑖,𝑡 + 𝜀𝑖,𝑡
where 𝐸𝐷𝐺𝐴𝑅(−2)𝑖,𝑡 (𝐸𝐷𝐺𝐴𝑅(−1)𝑖,𝑡 ) is an indicator that equals one if a firm will become a mandatory
EDGAR filer in two quarters (one quarter), and zero otherwise. 𝐸𝐷𝐺𝐴𝑅(0)𝑖,𝑡 is an indicator that equals one if a
firm becomes a mandatory EDGAR filer in the current quarter t, and zero otherwise. 𝐸𝐷𝐺𝐴𝑅(+1)𝑖,𝑡
(𝐸𝐷𝐺𝐴𝑅(+2)𝑖,𝑡, 𝐸𝐷𝐺𝐴𝑅(+3)𝑖,𝑡, 𝐸𝐷𝐺𝐴𝑅(+4)𝑖,𝑡) is an indicator that equals one if a firm became a mandatory
EDGAR filer one quarter (two quarters, three quarters, four quarters) ago, and zero otherwise. 𝐸𝐷𝐺𝐴𝑅(5+)𝑖,𝑡
is an indicator that equals one if a firm became a mandatory EDGAR filer five or more quarters ago, and zero
otherwise. The figure reports the coefficient estimates on each event quarter indicator as well as their 95%
confidence intervals. The estimation includes firm and year-quarter fixed effects. The standard errors are
clustered at the firm level.
-.5
0.5
11
.52
-2 -1 0 +1 +2 +3 +4 5+Quarter relative to the EDGAR implementation
point estimate 95% confidence interval
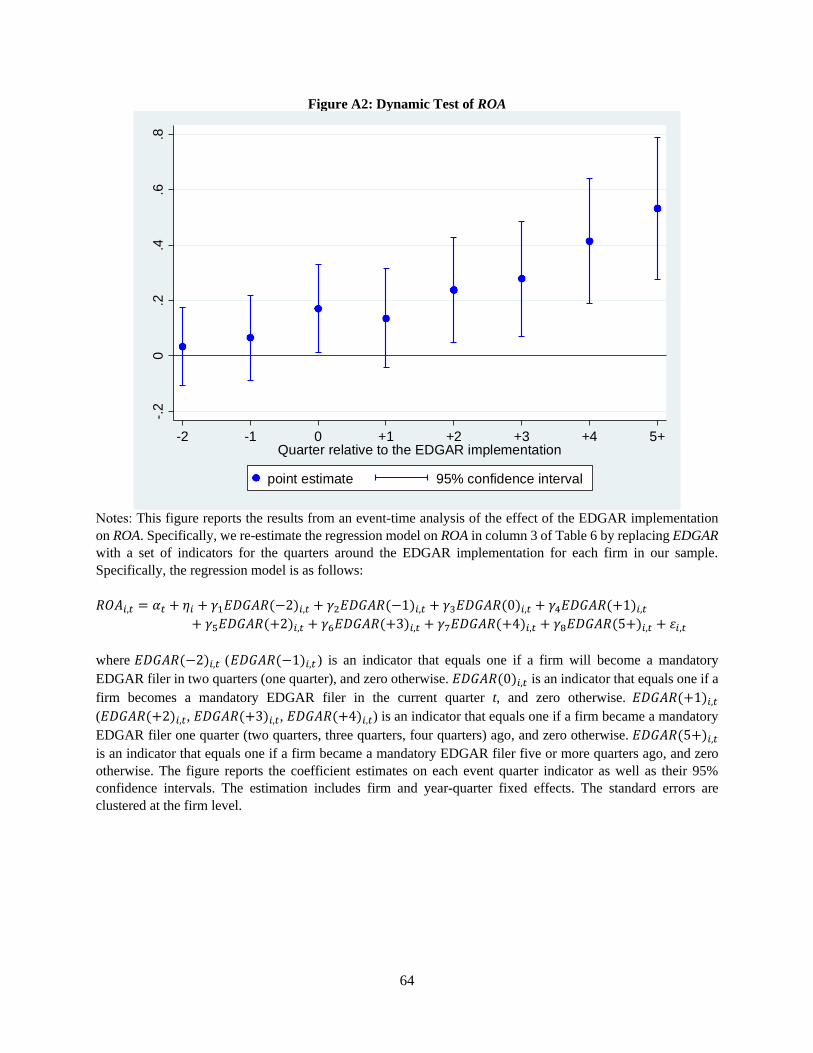
64
Figure A2: Dynamic Test of ROA
Notes: This figure reports the results from an event-time analysis of the effect of the EDGAR implementation
on ROA. Specifically, we re-estimate the regression model on ROA in column 3 of Table 6 by replacing EDGAR
with a set of indicators for the quarters around the EDGAR implementation for each firm in our sample.
Specifically, the regression model is as follows:
𝑅𝑂𝐴𝑖,𝑡 = 𝛼𝑡 + 𝜂𝑖 + 𝛾1𝐸𝐷𝐺𝐴𝑅(−2)𝑖,𝑡 + 𝛾2𝐸𝐷𝐺𝐴𝑅(−1)𝑖,𝑡 + 𝛾3𝐸𝐷𝐺𝐴𝑅(0)𝑖,𝑡 + 𝛾4𝐸𝐷𝐺𝐴𝑅(+1)𝑖,𝑡
+ 𝛾5𝐸𝐷𝐺𝐴𝑅(+2)𝑖,𝑡 + 𝛾6𝐸𝐷𝐺𝐴𝑅(+3)𝑖,𝑡 + 𝛾7𝐸𝐷𝐺𝐴𝑅(+4)𝑖,𝑡 + 𝛾8𝐸𝐷𝐺𝐴𝑅(5+)𝑖,𝑡 + 𝜀𝑖,𝑡
where 𝐸𝐷𝐺𝐴𝑅(−2)𝑖,𝑡 (𝐸𝐷𝐺𝐴𝑅(−1)𝑖,𝑡 ) is an indicator that equals one if a firm will become a mandatory
EDGAR filer in two quarters (one quarter), and zero otherwise. 𝐸𝐷𝐺𝐴𝑅(0)𝑖,𝑡 is an indicator that equals one if a
firm becomes a mandatory EDGAR filer in the current quarter t, and zero otherwise. 𝐸𝐷𝐺𝐴𝑅(+1)𝑖,𝑡
(𝐸𝐷𝐺𝐴𝑅(+2)𝑖,𝑡, 𝐸𝐷𝐺𝐴𝑅(+3)𝑖,𝑡, 𝐸𝐷𝐺𝐴𝑅(+4)𝑖,𝑡) is an indicator that equals one if a firm became a mandatory
EDGAR filer one quarter (two quarters, three quarters, four quarters) ago, and zero otherwise. 𝐸𝐷𝐺𝐴𝑅(5+)𝑖,𝑡
is an indicator that equals one if a firm became a mandatory EDGAR filer five or more quarters ago, and zero
otherwise. The figure reports the coefficient estimates on each event quarter indicator as well as their 95%
confidence intervals. The estimation includes firm and year-quarter fixed effects. The standard errors are
clustered at the firm level.
-.2
0.2
.4.6
.8
-2 -1 0 +1 +2 +3 +4 5+Quarter relative to the EDGAR implementation
point estimate 95% confidence interval
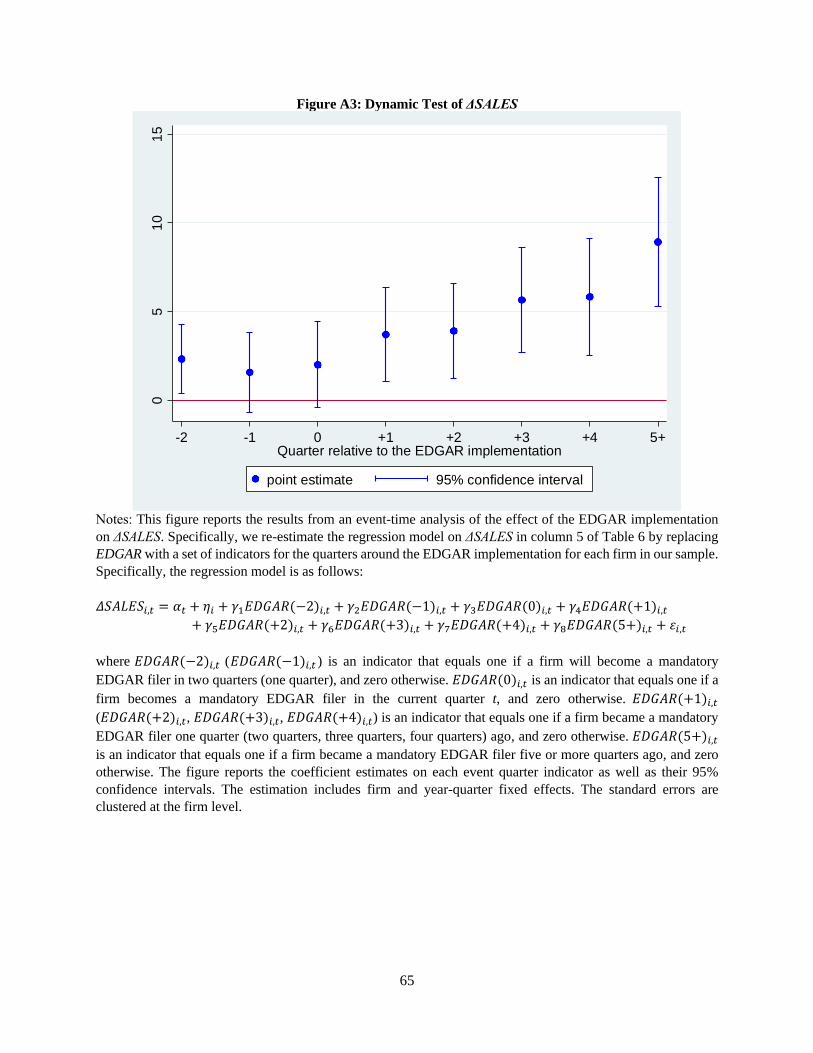
65
Figure A3: Dynamic Test of ΔSALES
Notes: This figure reports the results from an event-time analysis of the effect of the EDGAR implementation
on ΔSALES. Specifically, we re-estimate the regression model on ΔSALES in column 5 of Table 6 by replacing
EDGAR with a set of indicators for the quarters around the EDGAR implementation for each firm in our sample.
Specifically, the regression model is as follows:
𝛥𝑆𝐴𝐿𝐸𝑆𝑖,𝑡 = 𝛼𝑡 + 𝜂𝑖 + 𝛾1𝐸𝐷𝐺𝐴𝑅(−2)𝑖,𝑡 + 𝛾2𝐸𝐷𝐺𝐴𝑅(−1)𝑖,𝑡 + 𝛾3𝐸𝐷𝐺𝐴𝑅(0)𝑖,𝑡 + 𝛾4𝐸𝐷𝐺𝐴𝑅(+1)𝑖,𝑡
+ 𝛾5𝐸𝐷𝐺𝐴𝑅(+2)𝑖,𝑡 + 𝛾6𝐸𝐷𝐺𝐴𝑅(+3)𝑖,𝑡 + 𝛾7𝐸𝐷𝐺𝐴𝑅(+4)𝑖,𝑡 + 𝛾8𝐸𝐷𝐺𝐴𝑅(5+)𝑖,𝑡 + 𝜀𝑖,𝑡
where 𝐸𝐷𝐺𝐴𝑅(−2)𝑖,𝑡 (𝐸𝐷𝐺𝐴𝑅(−1)𝑖,𝑡 ) is an indicator that equals one if a firm will become a mandatory
EDGAR filer in two quarters (one quarter), and zero otherwise. 𝐸𝐷𝐺𝐴𝑅(0)𝑖,𝑡 is an indicator that equals one if a
firm becomes a mandatory EDGAR filer in the current quarter t, and zero otherwise. 𝐸𝐷𝐺𝐴𝑅(+1)𝑖,𝑡
(𝐸𝐷𝐺𝐴𝑅(+2)𝑖,𝑡, 𝐸𝐷𝐺𝐴𝑅(+3)𝑖,𝑡, 𝐸𝐷𝐺𝐴𝑅(+4)𝑖,𝑡) is an indicator that equals one if a firm became a mandatory
EDGAR filer one quarter (two quarters, three quarters, four quarters) ago, and zero otherwise. 𝐸𝐷𝐺𝐴𝑅(5+)𝑖,𝑡
is an indicator that equals one if a firm became a mandatory EDGAR filer five or more quarters ago, and zero
otherwise. The figure reports the coefficient estimates on each event quarter indicator as well as their 95%
confidence intervals. The estimation includes firm and year-quarter fixed effects. The standard errors are
clustered at the firm level.
05
10
15
-2 -1 0 +1 +2 +3 +4 5+Quarter relative to the EDGAR implementation
point estimate 95% confidence interval
Related Documents