The project delivery specialists Modelling of Sedawgyi Irrigation Network with RIBASIM Internship assignment Sebastiaan Quirijns 1

The project delivery specialists Modelling of Sedawgyi Irrigation Network with RIBASIM Internship assignment Sebastiaan Quirijns 1.
Jan 01, 2016
Welcome message from author
This document is posted to help you gain knowledge. Please leave a comment to let me know what you think about it! Share it to your friends and learn new things together.
Transcript

The project delivery specialists
Modelling of Sedawgyi Irrigation Network with RIBASIMInternship assignment Sebastiaan Quirijns
1
Welcome
Thank you all for contributing to my study,
by sharing all of your resources
2
Contents
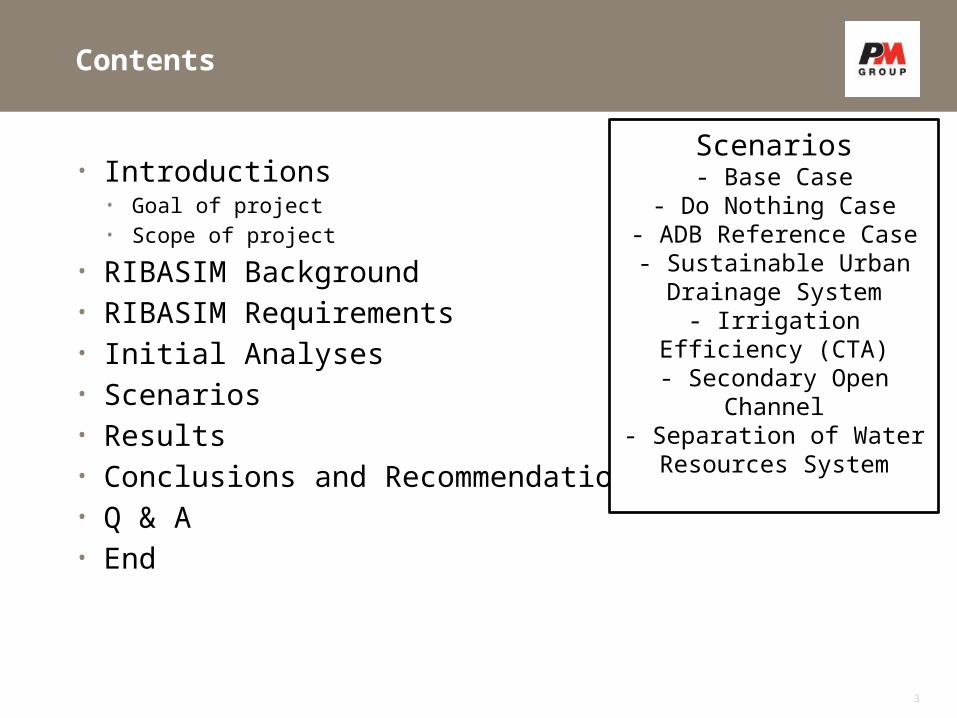
• Introductions• Goal of project• Scope of project
• RIBASIM Background• RIBASIM Requirements• Initial Analyses• Scenarios• Results• Conclusions and Recommendations• Q & A• End
3
Scenarios- Base Case
- Do Nothing Case- ADB Reference Case
- Sustainable Urban Drainage System
- Irrigation Efficiency (CTA)- Secondary Open Channel
- Separation of Water Resources System

Introductions
• Introduction speaker:• Netherlands
• Delft• Technical University of Delft• Hydraulic Engineering• Graduating in July 2015• Internship for Peter Kerssens of
Haarlem Hydraulics
4

Introductions
Current issues of the Sedawgyi Irrigation Network• No clear distinction of the main function of the Sedawgyi dam• Too high shortage of water for irrigational purposes• Too much water which is spilled during rainy season
The main goal of the study is:
“Modelling of the water resources in the Mandalay Region in order to increase the water usage efficiency”
5

Introductions
Scope of the study• Four natural boundary limits
• North Sedawgyi reservoir• East Shan Hills• South Dokhthawaddy• West Ayeyarwaddy
• RIBASIM applications• Modelling of water resources for rivers and basins
• Depth of study• Mandalay is simplified into two subjects
• Public Water Supply• Moat flow
• Sedawgyi Dam controls inflow into basin• No groundwater flow included in the model
6

Introductions
Four natural boundary limits• North Sedawgyi reservoir and
mountains• East Shan Hills• South Dokhthawaddy• West Ayeyarwaddy
7
RIBASIM Background
RIBASIM (RIver BAsin SImulation Model)• Generic model package for analysing the behaviour of river basins under
various hydrological conditions, developed by Deltares (the Netherlands)• Simulation of water allocation in a water resources model
• Main classification of the nodes are Demand, Control and Layout.• Time step size is daily, weekly, half monthly or monthly basis• Demand nodes determine flow in the links
• Basin performances• Water allocation• Water shortages• River basin water volumes • Flow composition• Crop production• Flood control• Water supply reliability• Etc.
8

RIBASIM Background
Important aspects for
Agriculture in RIBASIM• irrigation water distribution• topography and lay-out of the irrigation
area• crop and soil characteristics• crop plan• expected and actual rainfall• reference evapotranspiration• agriculture practice• operation and irrigation water
management• actual field water balance• crop survival fraction• potential crop yield and production costs
9
RIBASIM Background
Typical applications• long term basin planning - time horizon of 20 to 25 yrs.• short term water allocation - time horizon 0,5 to 1 yrs.
scheduling• In season operation - during the season based on the
scheduling actual situation in the field• flow forecasting system - any time at various locations
10

RIBASIM Requirements
Primary data required for modelling with RIBASIM• Time series
• Rainfall• Five locations
• Dependable rainfall• Five locations
• Water balance of Sedawgyi reservoir• Inflow• Evaporation
• Reference evapotranspiration
• Fixed data• Catchment areas• Reservoir volume• Cultivated areas• Crop data
11

Initial Analyses
Sedawgyi Irrigation Network Map• Sedawgyi Reservoir• Mandalay (±1,2 million
inhabitants in 2014) • Madaya (±30000 inhabitants in
2014)• Three rivers and/or canals
connected to Sedaw Weir• Mandalay Main canal• Yenatha canal• Chaungmagyi
• Many agriculture• Many distributaries
12
Initial Analyses
Non Revenue Water
Mandalay 63%• Physical losses
• Leakages• Overflow
• Commercial losses• Under counting• Illegal connections• Unbilled consumption
Mandalay’s demand• 101 l/capita/day• 15 % supplied by surface water• 15 l/capita/day
Note: Mandalay does not get water from Sedawgyi Water Resources System. It is assumed this way, because of modelling’s sake.
13
Saying in modelling
“Prove from the absurd”

Initial Analyses
Index DY’sLength [m]
Depth [m]
Q[m3/s]
Summer paddy [ha]
1Shwetha-Chaung 3810,0 1.0 56,6 5608,4
2 Thamok-So 10363,2 1,4 54,1 1827,6
3 Nandar 5852,2 1,1 34.0 1633,2
4 Alebon 6370,3 0,9 29,2 1594,4
5 Htanpingon 6446,5 0,9 22,4 1276,8
14
• 5 Largest cultivated areas (of total 20) connected by distributaries (DY’s) to the Mandalay Main canal

Initial Analyses
Agriculture in Sedawgyi Irrigation Network
Crops Total Area [ha] percentageSummer Paddy 29883 64%Winter Paddy 29883 64%Sesame 593 1%Sunflower 0 0%Pulses 3236 7%Corn 2929 6%Ground nut 446 1%Garlic 0 0%Wheat 4059 9%Soybean 229 0%Banana 3655 8%Sugarcane 5279 11%Vegetables 286 1%Cattle 684 1%Total 46939 100%
15

Initial Analyses
16
• Primary canals• Mandalay Main
Canal• Yenatha• Chaungmagyi
• Secondary canals
• All DY’s

Initial Analyses
Climate Change effects
Forecasted changes at Mandalay (Dry Zone)• Slight increase of Annual Rainfall (10% in 2040)• More drought in the pre- and post-monsoon periods (May,
June & October: 35% lower rainfall)• Decrease in monsoon duration• Increase in intensity of rainfall (25%) during monsoon period
17

Initial Analyses
Season Period Average temperature (°C)
Expected increase in temperature in 2020 (°C)
Average temperature in 2040 (°C)
Change in periods
Climate change factor for rainfall
Winter November to February
16 to 30 +1.2 +2.2October to februari
98.35%
Summer March to April 21.5 to 37 +1.0 +2March to June
98.35%
Monsoon May to October 25 to 34 +0.6 +1.6July to September
100.37%
18
Climate Change effects

Initial Analyses
Sedawgyi Dam key values• Length of dam 1256 m• Top of dam 131,4 m• Max water level 130 m• Full Reservoir level 128 m• Dead capacity level 111 m• Catchment area 342500 ha• Hydropower cap. 25 MW
19

Initial Analyses
Water spread/Capacity curve for the Sedawgyi Reservoir
20
0.06.212.337.086.3103.6154.2283.7678.4
0.0 6.2 12.3 37.0 86.3 103.6 154.2 283.7 678.4
0.00
20.00
40.00
60.00
80.00
100.00
120.00
140.00
160.00
Reservoir Capacity
Waterspread
Reservoir capacity [ 106 m3]
Water level [m]
Water spread [ha]

Scenarios
The scenarios for long term modelling have to be included with some effects:• Long term effects
• Population growth of Mandalay to 2,3 million• Urbanization of Mandalay
• Increase in paved open areas• Madaya is connected to Sedawgyi Resources System• Climate Change
21
Scenarios
Design Criteria
Hard design criteria Direct results, easily measurable • Reservoir volume• Reservoir spillage• Net flow in and out of reservoir• Generation of hydropower• Actual cultivation areas• Supply/demand ratios for cultivations• Irrigation efficiency• Supply/shortage for PWS• Continuous flow in the moat canal
Soft Design Criteria Indirect results, difficult to measure• Quality of life, food security, food diversification, environment, ‘Green cities’,
sustainable development, etc…
22
Scenarios
23
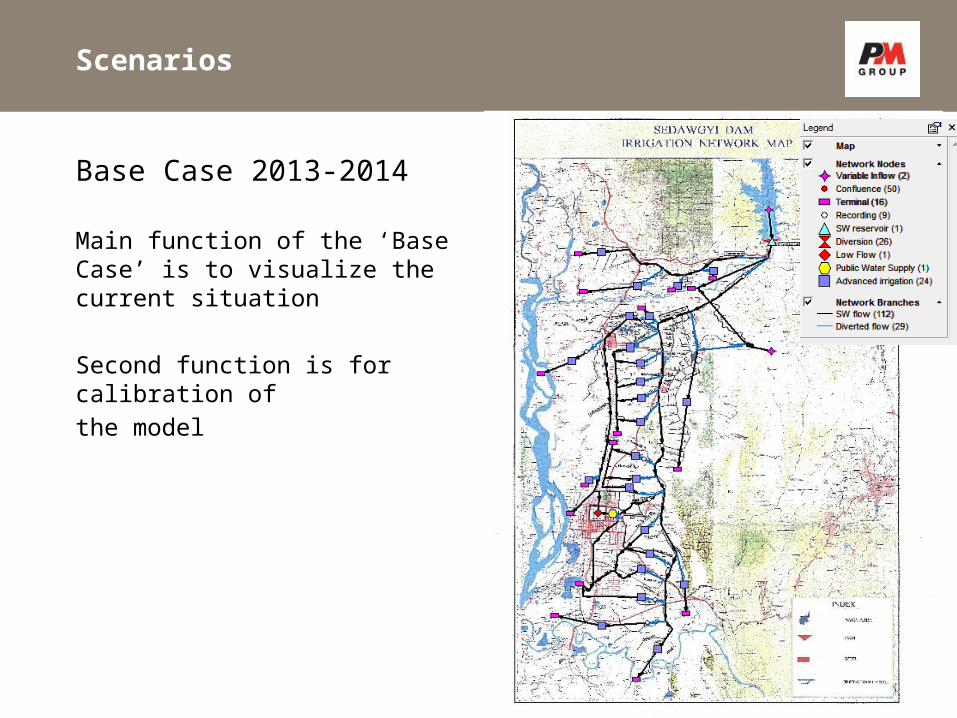
Base Case 2013-2014
Main function of the ‘Base Case’ is to visualize the current situation
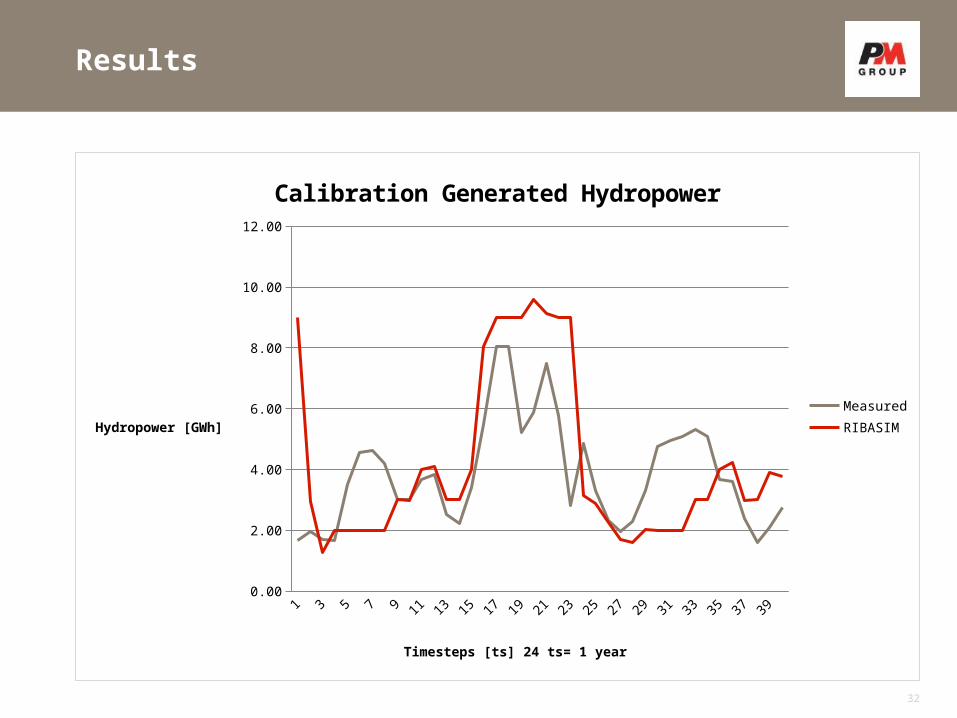
Second function is for calibration of
the model
Scenarios
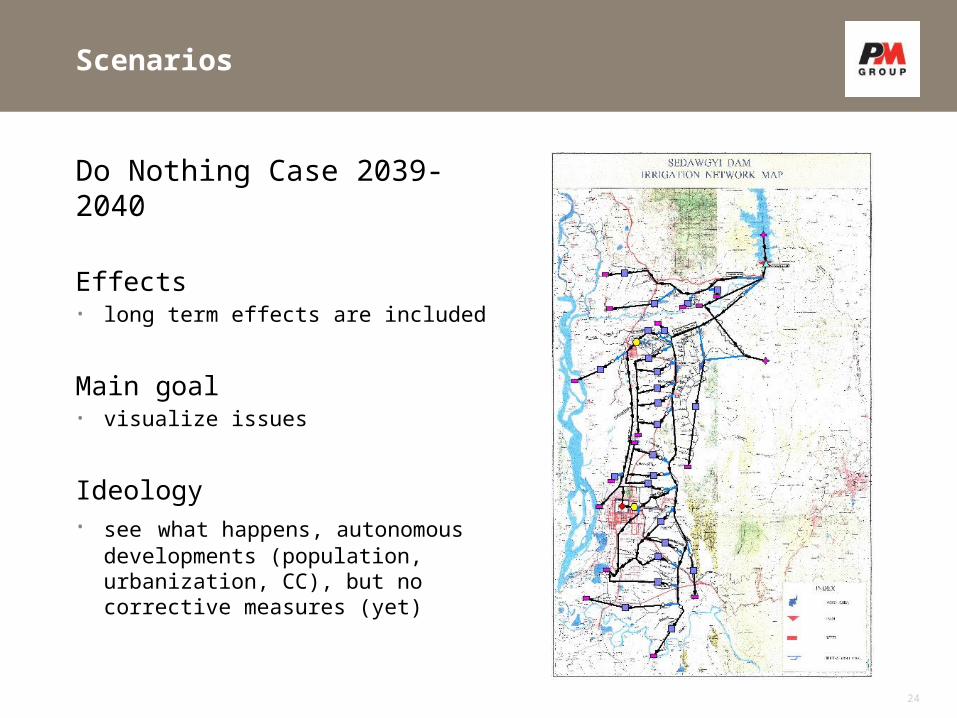
Do Nothing Case 2039-2040
Effects• long term effects are included
Main goal• visualize issues
Ideology• see what happens, autonomous
developments (population, urbanization, CC), but no corrective measures (yet)
24

Scenarios
ADB Reference Case 2039-2040
Effects• Network Coverage is increased to 95% (2,2
million people)• Surface water dependency is increased to
47% (68 liter/capita/day)• NRW is reduced to 10%
Main goal• Increase welfare in Mandalay• Increasing demand of Mandalay• Reduce losses
Ideology• Since most of these plans have a large
probability of being executed. This case serves as reference case.
25

Scenarios
Sustainable Urban Drainage Systems 2039-2040 (SUDS)
Effects• Increasing soil permeability→runoff via
groundwater → return flow to the surface water
• ADB reference plan
Main goal• Reduce flooding in the city• Beautification of Mandalay
Ideology• By achieving the main goals the ‘Qualitiy
of life’ will increase in Mandalay
26

Scenarios
Irrigation Efficiency 2039-2040 (via Capacity Training Agriculture)
Effects• Increasing field irrigation Efficiency to 90%• ADB Reference Plan
Main goals• Increase yields/production• Save water• higher supply/demand ratios for
Agriculture
Ideology• If the efficiency of irrigation is increased,
by supplying new technology and training, this will lead to an high effective supply, and result in more water available for PWS purposes.
27

Scenarios
Secondary Open Channel
2039-2040 (SOC)Effects• A collector drain is connected to Mandalay
Main Canal• Flood flow from Shan Hills is redirected and
redistributed in the Southern Irrigation Network System
• ADB Reference Plan
Main goals• Increase safety of Mandalay• More efficient use of flood flow
IdeologyIf the the water from the flood flow is redisitributed, this should lead to a lower demand to Sedawgyi in the southern area.
Thus an increase in supply in the northern area.
28

Scenarios
29
Catchment area: DetailedCatchment area: Simplified

Scenarios
Separation of Water Resources System 2039-2040 (SWRS)
Effects• Removing Mandalay Nodes for PWS and
Moat• ADB Reference Plan
Main goal• Increased water availability for irrigation
purposes and PWS of Madaya
Ideology• Mandalay’s water supply will come from
any other sources, except Sedawgyi Water Resource System
30

Results
31
1 4 7 10 13 16 19 22 25 28 31 34 37 40
-2.00E+02
-1.00E+02
0.00E+00
1.00E+02
2.00E+02
3.00E+02
4.00E+02
5.00E+02
6.00E+02
Calibration Sedawgyi Reservoir 2013-2014
Measured Data
Simulated Data
Difference
Timesteps [ts], 1 year = 24 ts
Rsv Volume [Mm3]
Results
32
1 3 5 7 9 11 13 15 17 19 21 23 25 27 29 31 33 35 37 390.00
2.00
4.00
6.00
8.00
10.00
12.00
Calibration Generated Hydropower
Measured
RIBASIM
Timesteps [ts] 24 ts= 1 year
Hydropower [GWh]
Results
33
1 3 5 7 9 11 13 15 17 19 21 23 25 27 29 31 33 35 37 39 41 43 45 47 490.00
50.00
100.00
150.00
200.00
250.00
300.00
350.00
400.00
450.00
500.00
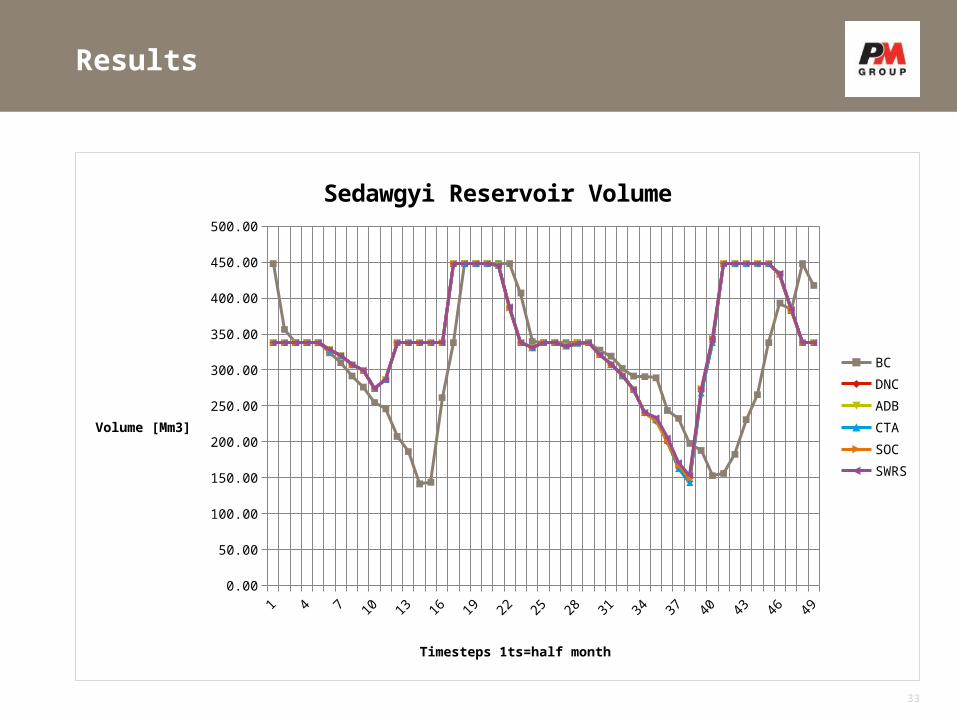
Sedawgyi Reservoir Volume
BC
DNC
ADB
CTA
SOC
SWRS
Timesteps 1ts=half month
Volume [Mm3]

Results
34
1 3 5 7 9 11 13 15 17 19 21 23 25 27 29 31 33 35 37 39 41 43 45 47 490.00
50.00
100.00
150.00
200.00
250.00
300.00
350.00
400.00
Sedawgyi Reservoir Spilling per scenario
BC
DNC
ADB
SUDS
SOC
SWRS
Timesteps
Flow Spilled [m3/s]

Results
35
0 3 6 9 12 15 18 21 24 27 30 33 36 39 42 45 48
-400.00
-300.00
-200.00
-100.00
0.00
100.00
200.00
300.00
400.00
500.00
Net flow Sedawgyi Reservoir
Base Case 2013-2014
DNC 2039-2040
ADB 2039-2040
SUDS 2039-2040
CTA 2039-2040
SOC 2039-2040
SWRS 2039-2040
Timesteps
Netflow [m3/s]
Results
36
0.00
3.00
6.00
9.00
12.0
015
.00
18.0
021
.00
24.0
027
.00
30.0
033
.00
36.0
039
.00
42.0
045
.00
48.0
00.00
2.00
4.00
6.00
8.00
10.00
12.00
14.00
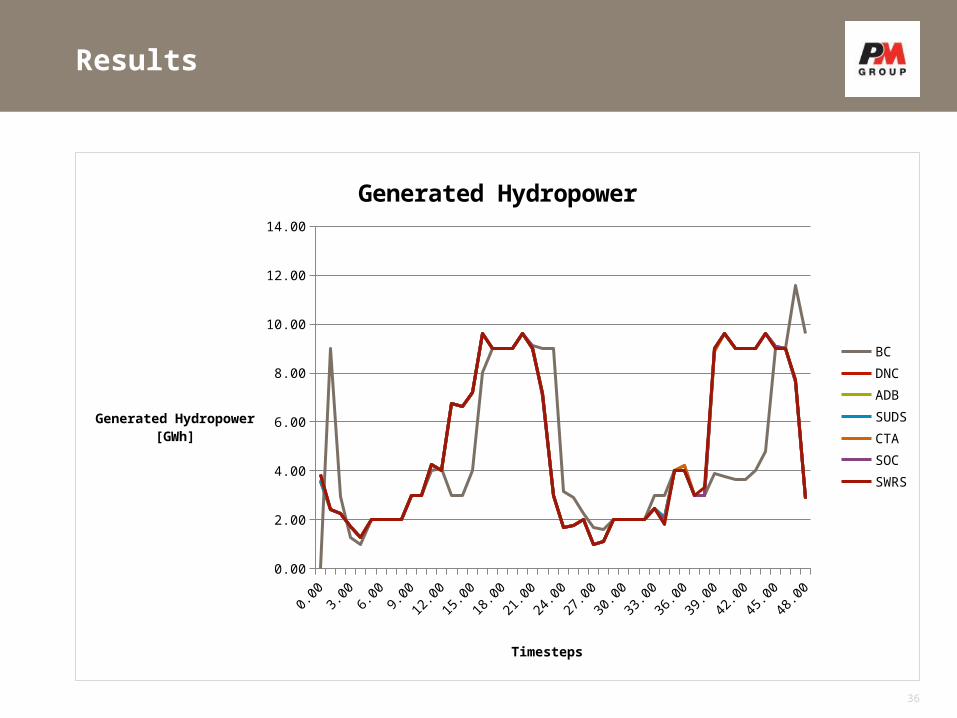
Generated Hydropower
BC
DNC
ADB
SUDS
CTA
SOC
SWRS
Timesteps
Generated Hydropower [GWh]

Results
37
NC_AIr_
Seikth
aDY
NC_ AIr_
Feede
rCut
DY
CW_A
Ir_Shw
eTaC
haun
gDY1
CW_A
Ir_Shw
eTaC
haun
gDY2
NC_Air_
LatK
aung
DY
NC_AIr_
Alebon
DY
NC_AIr_
Htanb
ingon
DY
NC_AIr_
Kabed
DY
NC_AIr_
Lund
aung
DY
SC_AIr_
Nanda
DY
SC_AIr_
Kyauk
than
batD
Y
SC_AIr_
Pathe
ingyiD
Y
SC_AIr_
Yankin
gtau
ngDY&Ye.
..
SE_AIr_
168M
inor
SC_AIr_
Wan
gingo
nDY
SC_Air_
Kyauk
MiD
Y
S_AIr_
Tadain
gShe
DY
S_AIr_
Tamok
soDY
S_AIr_
Kinbak
DY
NE_AIr_
DY1
N_AIr_
DY2
N_AIr_
DY3-4-
5
NW_A
Ir_DY6-
7
CE_AIr_
L1-L
160.00
1000.00
2000.00
3000.00
4000.00
5000.00
6000.00
7000.00Cultivated Areas Sedawgyi Irrigation Network
Total Planned AreaBase CaseDO Nothing CaseADB Reference CaseSUDS CaseCTA CaseSOC CaseSWRS Case
Distributaries
Area [ha]

Results
38
CE_AIr_
L1-L
16
NC_AIr_
Seikth
aDY
NC_ AIr_
Feede
rCut
Dy
SE_AIr_
168M
inor
S_AIr_
Tamok
soDY
S_AIr_
Tadain
gshe
DY
SC_Air_
Kyauk
MiD
Y
S_AIr_
Kinbak
DY
CW_D
iv_Shw
eTaC
haun
gDY2
SC_AIr_
Kyauk
ThanB
attD
Y
SC_AIr_
Pathe
ingyiD
Y
SC_AIr_
Nanda
DY
NC_AIr_
Lund
aung
DY
NC_AIr_
Kabed
DY
NC_AIr_
Htanb
ingon
DY
NC_AIr_
Alebon
DY
NC_Air_
LatK
aung
DY
CW_A
Ir_Shw
eTaC
haun
gDY
SC_AIr_
Yankin
gtau
ngDY&Yek
yiDY
SC_AIr_
Wan
gingo
nDY
NW_A
Ir_DY6-
7
N_AIr_
DY3-4-
5
NE_AIr_
DY1
N_AIr_
DY20%
10%
20%
30%
40%
50%
60%
70%
80%
90%
100% Supply Demand ratios in Sedawgyi Irrigation Network
Base CaseDo Nothing CaseADB Reference caseSUDSCTASOC
Results
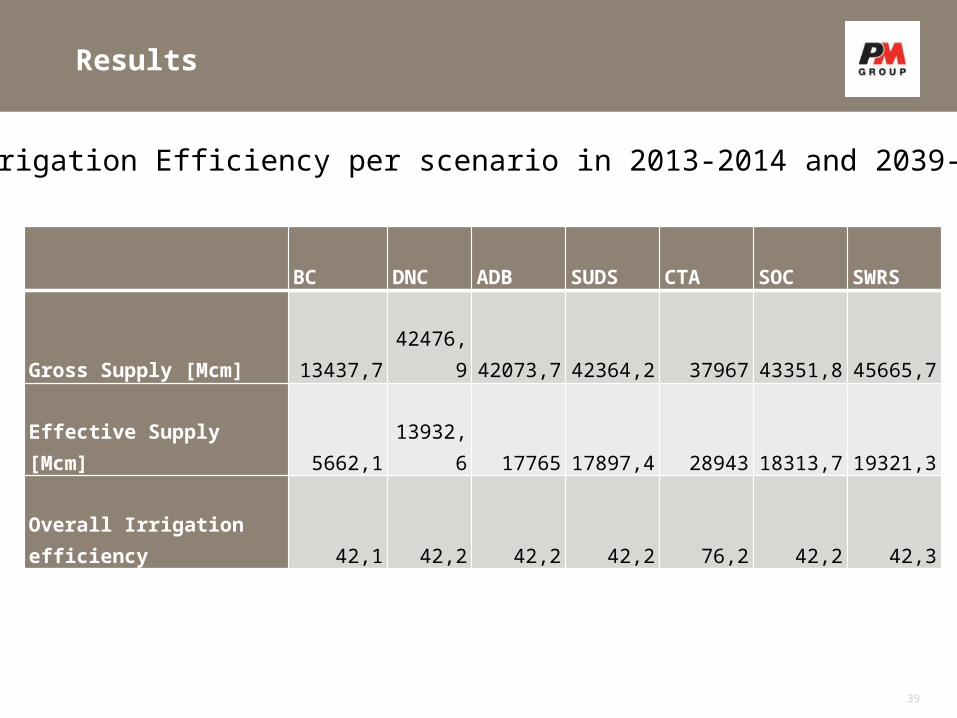
BC DNC ADB SUDS CTA SOC SWRS
Gross Supply [Mcm] 13437,7 42476,9 42073,7 42364,2 37967 43351,8 45665,7
Effective Supply [Mcm] 5662,1 13932,6 17765 17897,4 28943 18313,7 19321,3
Overall Irrigation efficiency 42,1 42,2 42,2 42,2 76,2 42,2 42,3
39
• Irrigation Efficiency per scenario in 2013-2014 and 2039-2040

Results
40
BC DNC ADB SUDS CTA SOC SWRS
Average Monthly supply 2013-2039
0.27371125 0.326463908333333
1.2229581625 1.22252697916667
1.35654595833333
1.21764873333333
0
Average Monthly short-age 2013-2039
0.05474225 0.155267820833333
0.6921655 0.692596666666667
0.558577708333333
0.697474958333333
0
Average Monthly supply 2014-2040
0.3147679375 0.341226641666667
1.2652659375 1.26415363333333
1.500329875 1.2652659375 0
Average Monthlyl Shortage 2014-2040
0.0136855625 0.1405050875 0.64985775 0.650970041666667
0.4147938 0.64985775 0
0.250.751.251.752.252.753.253.754.25
Average Monthly flow for supply and shortageMandalay
Flow [m3/s]

Results
41
DNC ADB SUDS CTA SOC SWRS
Average Monthly supply 2039
0.0270061658333333
0.0270061658333333
0.0270061658333333
0.027006165 0.0270061658333333
0.027006165
Average Monthly Shortage 2039
0.0000000046566125
0.000000005587935
0.0000000046566125
0.00000013411044
0.0000000046566125
0.0000000046566125
Average Monthly Supply 2040
0.0270061658333333
0.0270061658333333
0.0270061658333333
0.0270061658333333
0.0270061658333333
0.0270061658333333
Average Monthly Shortage 2040
0.0000001117587
0.0000000046566125
0.0000000046566125
0.0000000046566125
0.0000000046566125
0.0000000046566125
0.01
0.03
0.05
Average Monthly flow supply and shortage Madaya
Yearly Supply & Shortage [m3/s]
Results
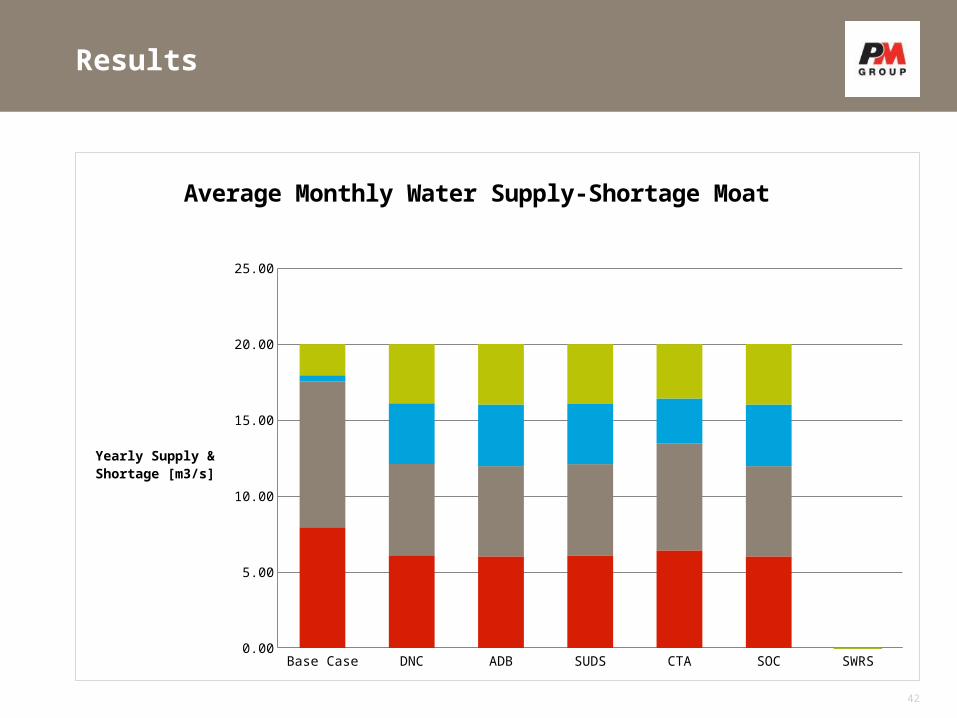
42
Base Case DNC ADB SUDS CTA SOC SWRS
Average Monthly Supply 2013-2039
7.94733098333333
6.10068497 6.02503871166667
6.09462284625
6.41915845833333
6.02307430833333
0
Average Monthly Supply 2014-2040
9.58333325 6.00725438333333
5.94594887916667
6.00642379583333
7.05462455833333
5.9459489625
0
Average Monthly Shortage 2014-2040
0.416666746139542
3.99274555437981
4.05405114197288
3.99357615122479
2.94537541280621
4.0540510625
0
Average MonthlyShortage 2013-2039
2.05266899806976
3.89931499004262
3.97496128780621
3.9053771192093
3.58084153780621
3.97692570833333
0
2.50
7.50
12.50
17.50
22.50
Average Monthly Water Supply-Shortage Moat
Yearly Supply & Shortage [m3/s]

Conclusions & Recommendations
• The increased dependency of surface water from the Sedawgyi for PWS in Mandalay is very unlikely to occur in practical sense, since the Ayeyarwaddy and groundwater are the major sources for water supply. Nevertheless, the cases have been modelled this way, because it is always a good modelling incentive to prove from the absurd/extreme values in order to show the differences between the scenarios the best.
• The model shows clearly, given the current operational settings of the Sedawgyi dam, that in 2040 as a result of the expected population growth and increased urbanization, large water shortages. Solely the Sedawgyi Reservoir can not supply both, public water supply and irrigation, if no additional corrective measures are taken (do-nothing scenario)
• The effect of the water supply situation will be exacerbated by the expected climate change effects in 2040.
• Sustainable Urban Drainage Systems (SUDS) are strongly recommended to improve urban drainage and flood management in and around Mandalay city, but will have a relative small effect on the water resources /water supply conditions.
43

Conclusions & Recommendations
• One of the most effective measures to improve the situation is to increase the irrigation efficiency, reducing losses in the system and ensuring that irrigation water will be delivered at the right moment and the right place.
• A collector drain at the Shan plateau foothills is strongly recommended as it will be effective to reduce the flooding problem in Mandalay city, but will not do much for the water supply situation.
• Separation of the Water Resources System of Mandalay and Sedawgyi is very effective for increasing the cultivation areas and ensuring the city water supply. These cultivations react correspondingly by having an acceptable supply demand ratio, if compared to the other cases.
• In some cases the North-Eastern parts of town (and people) get flooded due to reservoir releases from Sedawgyi dam. This generally happens without any warning, and in winter time when water levels are high already. Rescue service is provided by the government, but it would be better to provide flood early warning. Further emergency assistance is given by Red Cross and other NGOs.
44
Conclusions & Recommendations
Final Conclusion
Given the current operational settings of the Sedawgyi Dam, it clearly shows that in 2040 Sedawgyi Reservoir could not support both Public Water Supply and irrigation systems. So the water resources systems of Mandalay and Sedawgyi Irrigation Network should be separated. Sedawgyi will supply the irrigation and Mandalay will be provided by surface water of the Ayeyarwaddy and Dokhthawaddy. The modelling results of this study support the choices made by ADB PPTA.
If the irrigation efficiency is increased (ie. In steps of 50% to 60% to ... to 90%) in the long term (20 to 25 yrs) high yields can be achieved, by investments in training, technology and resources. This will also include lower losses and spillages in the water resources systems.
The current allocation of the dam is not efficient, in a way that there is still a high shortage of water supply in the downstream area of the Sedawgyi. In the future the allocation of Sedawgyi Dam should be based upon a hydrological study and including the demands of all stakeholders.
45

Questions and Answers
Any Questions??
46
47
Final
Thank you for this amazing experience here in Myanmar
Related Documents


![Sebastiaan Faber · S. Faber, CV—p. 1 Sebastiaan Faber [Updated: June 2020] Department of Hispanic Studies sebastiaan.faber@oberlin.edu Oberlin College tel. (440) 775-8189](https://static.cupdf.com/doc/110x72/5f577219e1ce3f4de814acb5/sebastiaan-faber-s-faber-cvap-1-sebastiaan-faber-updated-june-2020-department.jpg)


![Sebastiaan Faber€¦ · S. Faber, CV—p. 1 Sebastiaan Faber [Updated: November 2019] Department of Hispanic Studies 331 Eastern Ave Oberlin College Oberlin, OH 44074](https://static.cupdf.com/doc/110x72/606c23092ab7986baf6ba49f/sebastiaan-faber-s-faber-cvap-1-sebastiaan-faber-updated-november-2019-department.jpg)