THE PRODUCTION AND CHARACTERIZATION OF ACTIVATED CARBON USING LOCAL AGRICULTURAL WASTE THROUGH CHEMICAL ACTIVATION PROCESS by NURUL’AIN BINTI JABIT Thesis submitted in fulfillment of the requirements for the degree of Master of Science JUNE 2007

Welcome message from author
This document is posted to help you gain knowledge. Please leave a comment to let me know what you think about it! Share it to your friends and learn new things together.
Transcript

THE PRODUCTION AND CHARACTERIZATION OF ACTIVATED CARBON USING LOCAL AGRICULTURAL WASTE THROUGH CHEMICAL ACTIVATION PROCESS
by
NURUL’AIN BINTI JABIT
Thesis submitted in fulfillment of the requirements for the degree
of Master of Science
JUNE 2007
ii
ACKNOWLEDGEMENTS
In the name of ALLAH the most merciful. For blessing and giving me strength and
ability to complete this thesis.
Firstly, I would like to acknowledge my deepest gratitude to my principal
supervisor, Dr Norlia Binti Baharun for his guidance, constant attention, valuable
suggestion, enthusiastic support and personal concern during the research and through
out the course of my study. Furthermore, appreciation also goes to my Co-supervisor,
Associate Professor Dr. Rizal Astrawinata for his attention and guidance.
Special thanks to the Dean of School of Material and Mineral Engineering,
Associate Professor Dr. Khairun Azizi Binti Azizli for his permission to let me use all the
brilliant facilities and equipment in completing my project. The quality leadership of her
creates a healthy learning environment in the school. I would also extend my sincere
appreaciation for all lecturers in the school that always gave me support and guidance. My
deepest gratitude to all technicians and administrative staffs of the School of Material and
Mineral Engineering, USM, especially to Puan Fong Lee Lee, En.Shaarani, Cik Mahani,
En. Kemuridan , En. Hasnor, for helping me throughout my study. My deepest appreciation
also goes The Ministry of science, Technology and Environment and Universiti Sains
Malaysia, Penang for awarding me with a scholarship that support my studies and living.
Special appreciation goes to my loving parents especially my mom who is always
on my side, riding along with me on my ups and downs as well as giving me the
encouragement to pursue my dreams.

iii
Enormous appreciation to my husband, Yuzran Bin Azam for supporting me
financially and always give me a strength and my beloved son Akmal Syahmi Bin Yuzran
who always be there for me through my thick and thin and always love me, Thank you.
Love you all. Not to forget, my Father in law, my Mother in law and my family also who
always giving me support to complete my thesis.
To my dear friends, Nor Wanis, Siti Aida, Shahrizam, Faizul Che Pa, Suhaina,
Hakimah, Dr Hasmaliza, Dr Zuhailawati , Kak Zurina and all close members in School of
Material and Mineral Engineering , USM thanks for making my stayed in USM so colourful
and enjoyable, the memory of your friendships will forever stay inside my heart.
May ALLAH bless all of us and only HE, The Almighty could repay all my debts to all of
you.
Wassalamu’alaikum warahmatullah wabarakatuh.
iv
TABLE OF CONTENT
Page
ACKNOWLEDGEMENTS ii TABLE OF CONTENTS iv LIST OF TABLES viii
LIST OF FIGURES x
LIST OF PLATE xii
LIST OF SYMBOLS xii
LIST OF ABBREVIATION xv
LIST OF APPENDICES xvi
LIST OF PUBLICATIONS & SEMINARS xvi
ABSTRAK xvii
ABSTRACT xviii
CHAPTER ONE : INTRODUCTION 1.1 Background 1
1.2 The Importance of the Research 3
1.3 The Objectives of the Research 4
1.4 Scope of the Research 5
CHAPTER TWO : LITERATURE REVIEW 2.1 Activated Carbon 7
2.1.1 Introduction 7
2.1.2 Definition of Activated Carbon 8
2.2 Characterization and Properties of Activated Carbon 9
2.2.1 Moisture Content 10
2.2.2 Ash Content 10
2.2.3 Surface Area 11
2.2.4 Surface Chemistry of Activated Carbon 12
v
2.3 Pore Structure 13
2.4 The Microstructure of Activated Carbon 19
2.5 Processing of Activated Carbon 21
2.5.1 Factors Affecting Activated Carbon Production 21
2.5.2 Carbonization 24
2.5.3 Activation 28
2.5.4 Activation Mechanism 33
2.6 Application of Activated Carbon 35
2.6.1 Gas-Phase Applications 35
2.6.2 Liquid-Phase Applications 36 2.7 The Importance of Activated Carbon 38
CHAPTER THREE : MATERIALS AND EXPERIMENTAL WORKS
3.1 Materials and Apparatus 40
3.1.1 Raw Material 40
3.1.2 Raw Material Preparation 40
3.1.3 Reagent and chemicals 41
3.2 Production of Activated Carbon 42
3.2.1 Chemical Activation Process 42
3.2.2 Carbonization Stage 45
3.2.3 Studies the Effect of Activation Temperature and Activation 47
Time On BET Surface Area and Yield of Activated Carbon
3.3 Characterization of Produced Activated Carbon 48
3.3.1 Elemental Analysis 48
3.3.2 Proximate Analysis 49
3.3.3 Scanning Electron Microscopy(SEM) studies on the Activated 53
Carbon
3.4.4 Infrared Spectrophotometry (FTIR) Study of Activated Carbon 53
3.4.5 Adsorption Capacity 53
3.4 Application of Produced Activated Carbon 55
3.4.1 Activated Carbon Preparation 55
3.4.2 Copper Impregnation Stage 55
vi
3.4.3 Adsorption on Produced Activated Carbon 56
3.4.4 Cyanide Analysis 56
CHAPTER FOUR : RESULT AND DISCUSSION
4.1 Raw Material Analysis 58
4.1.1 Proximate Analysis 58
4.1.2 Elemental Analysis 60
4.2 Effect of Chemical Activation on the Development of Pore Structure 61
and Surface Area of the Activated Carbon Produced
4.2.1 Effect of Chemical Activation on the Development of Pore 61
Structure (SEM) of the Activated Carbon Produced from
Coconut Shell (CS)
4.2.2 Effect of Chemical Activation on the Development of Pore 68
Structure (SEM) of the Activated Carbon Produced from
Palm Kernel Shell (PS)
4.2.3 Effect of Chemical Activation on Surface Area of Activated 74
Carbon produced from Coconut Shell(CS) and Palm Kernel
Shell(PS).
4.3 Carbonization Studies 78
4.3.1 Effect of Activation Temperature on Yield of Activated Carbon 78
4.3.2 Effect of Time on Yield of Activated Carbon Produced 80
4.3.3 Effect of Activation Temperature on Surface Area of Activated 81 Carbon.
4.3.4 Effect of Activation Time on BET Surface Area of Activated 83 Carbon
4.4 The Characterization of Produced Activated Carbon 84
4.4.1 Elemental Analysis (C N S) 85
4.4.2 Proximate Analysis 86
4.4.3 Scanning Electron Microscopy on the Pore Size of AC Produced 88
4.4.4 Infrared Spectrophotometry Study of Activated Carbon(FTIR) 92
4.4.5 Adsortion Capacity 101
4.5 Application of Produced Activated Carbon 103
vii
CHAPTER FIVE : CONCLUSION 5.1 Conclusion 106
5.2 Recommendations For Future Work 109
REFERENCES 110
APPENDICES Appendix A [Calculation of Zinc Chloride and Phosphoric Acid concentration] 115
Appendix B [Calculation of percentage yield] 116
Appendix C [Iodine Number Calculations (ASTM D 4607)] 117
PUBLICATIONS AND SEMINARS
1.1 Characterization of Activated Carbon Prepared from Coconut Shell by
Zinc Chloride impregnation at different stage.
1.2 Physical and Chemical Properties of Activated Carbon from Coconut Shell
viii
LIST OF TABLE Page
1.1 Summary of earlier work on activated carbon using coconut shell 2
and palm shell.
2.1 Minimum pore diameter for adsorbate (Hassler,1974) 19
2.2 Characteristics of various conventional raw materials used for making 22 AC (Manocha, 2003) 2.3 The earlier works of removal cyanide using activated carbon 38 3.1 The specification of chemical reagent used in this research 41 3.2 Varying condition used in the chemical activation and carbonization 44
process 3.3 Samples identification code of activated carbon produced 45 3.4 Parameters that has been used during impregnation of copper 55
to the activated carbon produced 4.1 The proximate analysis of the raw material using ASTM method 59 4.2 The chemical composition of coconut shell and palm kernel shell 60 4.3 Sample identification codes for the pore structure and 61 surface area analysis 4.4 Summary of results showing the pore structure and surface area 77 analysis on activated carbon produced 4.5 Identification samples coded for carbonization analysis 78 4.6 List of activated carbon and its properties 84 4.7 Elemental analysis of activated carbon 85 4.8 The result of proximate analysis for selected samples 86
4.9 The pore size of four types activated carbon produced 89
4.10 Infrared Spectral data showing the stretching frequencies for 94 the various species observed for CS samples
4.11 Infrared Spectral data showing the stretching frequencies for 95
the various species observed for CSZ samples.
ix
4.12 Infrared Spectral data showing the stretching frequencies for 96 the various species observed for CSH samples 4.13 Infrared Spectral data showing the stretching frequencies for 99
the various species observed for PSZ samples 4.14 Infrared Spectral data showing the stretching frequencies for 100 the various species observed for PSZ samples. 4.15 Infrared Spectral data showing the stretching frequencies for 101
the various species observed for PSH samples 4.16 Iodine numbers of activated carbon produced and from other 102 researchers and commercial
5.1 Summary of earlier work from various authors and properties 106 of their AC compared with AC produced from this research.
x
LIST OF FIGURE
2.1 IR- active functionalities on carbon surfaces: (a) aromatic c=c stretching; 13 (b) and (c) carboxyl-carbonates; (d) carboxylic acid; (e)lactone (4-membered ring);(f) lactone (5- membered ring); (g) ether brigde; (h) cyclic ether; (i) cyclic anhydride (5-membered ring); (j) cyclic
anhydride(6-membered ring); (k) quinine; (l) phenol; (m) alcohol; and (n) ketene (Radovic, 2001) 2.2 Different types of porosity in a porous solid (Marsh, 1989) 14 O-open pores; C- closed pores; t-transport pores; b-blind pores. 2.3 The schematic of internal pore structure in activated carbon 15
2.4 Cellular micropores in an almond shell carbon (Marsh, 1989) 15
2.5 HREM of a cellulose carbon (Marsh, 1989) 16
2.6 SEM shows different shape of pores depending on types of raw materials 17
2.7 The pore distribution in activated carbon from different precursor 18 materials(Radovic, 2001) 2.8 A model for the microstructure of a microporous carbon(McEnaney,2002) 20 2.9 Theoritical structures of crystallite (Hassler,1974) 25 2.10 Thermogravimetric curves showing evolution of volatile matter from 26
two coals during carbonization in flowing nitrogen.(McEnaney, 2002) 2.11 A typical dehydrogenative condensation reaction during carbonization 28
(McEnaney, 2002) 3.1 The specification of chemical reagent used in this research 43
3.2 Experimental setup for carbonization in the production of activated carbon 46
4.1 SEM morphology of (a) coconut shell and, activated carbon produced 63 from coconut shell (b) CSZ1M
4.2 SEM morphology of activated carbon produced from coconut shell 64
(a)CSZ3M and (b) CSZ5M 4.3 SEM morphology of activated carbon prepared from coconut shell at 66
different concentration of H3PO4 (a) 10% (b) 20% (400x) 4.4 SEM photomicrograph showing the morphology of activated carbon 67 produced from coconut shell at different concentration of H3PO4 (a) 30% (b) 40%. (400x)
xi
4.5 SEM morphology of (a) palm shells and activated carbon produced from 69 palm kernel shell at different zinc chloride concentration(b) PSZ1M
4.6 SEM morphology of activated carbon produced from palm kernel shell at 70 different zinc chloride concentration (a)PSZ3M and (b) PSZ5M 4.7 SEM micrograph of activated carbon prepared from palm shell at different 72
concentration of H3PO4 (a) 10%,(b)20%. 4.8 SEM micrograph of activated carbon prepared from palm shell at different 73
concentration of H3PO4 (a) 30% and (b) 40%.
4.9 Effect of zinc chloride concentration on the BET surface area on activated 75 carbon from different types of raw material.
4.10 Effect of phosphoric acid concentration on the BET surface area on 77
activated carbon from different types of raw material. 4.11 The relationship between activation temperature and yield using different 79
types of raw material and activating agents. 4.12 The relationship between activation time and yield using different types 80
of raw material and activating agents. 4.13 The relation between activation temperature and surface area of the 81
activated carbon from different types of raw material and activating agents 4.14 The relation between activation time and surface area of the activated 83
carbon from different types of raw material and activating agents. 4.15 SEM micrograph of CSZ and CSH 90 4.16 SEM micrograph of PSZ and PSH 91 4.17 The Infrared spectrum of coconut shell (a) and activated carbon from 93 selected samples (b)CSZ and (c) CSH. 4.18 The Infrared spectrum of coconut shell (a) and activated carbon from 98 selected samples (b)CSZ and (c) CSH. 4.19 Cyanide removal efficiencies on the produced AC and the raw AC after 104 copper impregnation from cyanide aqueous solutions at 25 mg/l concentration 4.20 Cyanide removal efficiencies on the produced AC and the raw AC 105
after copper impregnation from cyanide aqueous solutions at 50 mg/l concentration.
xii
LIST OF PLATE
Page
Plate 3.1 The photograph of raw materials as-received before crushing 40
LIST OF SYMBOL
% Percentage of weight
K Kelvin
˚C Celcius
nm nanometer (1x 10⁻⁹)
cm3 centimeter cubic
m2/g meter square per gram
Ǻ Angstron (1x 10⁻¹⁰)
Kg/m3 Kilogram per meter cubic
g/mol Gram per mol
mm Millimeter
mg Milligram
cm Centimeter
g/l Gram/liter
ppm part per million
M Molar
mg/g milligram/gram
v vibration
xiii
LIST OF ABBREVIATIONS
AC Activated Carbon ASTM American Standard Test Method
BSU Basic strucure unit
BET Brunauer-Emmett-Teller
CS Coconut shell CSZ Activated carbon from coconut shell with zinc chloride activation
CSH Activated carbon from coconut shell with phosphoric acid activation
CSZ1M Activated carbon from coconut shell with zinc chloride activation at 1 M
concentration
CSZ3M Activated carbon from coconut shell with zinc chloride activation at 3 M
concentration
CSZ5M Activated carbon from coconut shell with zinc chloride activation at 5M
concentration
CSZ300 Activated carbon from coconut shell with zinc chloride activation at 300°C
activation temperature
CSZ400 Activated carbon from coconut shell with zinc chloride activation at 400°C
activation temperature
CSZ500 Activated carbon from coconut shell with zinc chloride activation at 500°C
activation temperature CSZ060 Activated carbon from coconut shell with zinc chloride activation at 60
minute activation time
CSZ060 Activated carbon from coconut shell with zinc chloride activation at 60
minute activation time
CSZ120 Activated carbon from coconut shell with zinc chloride activation at 120
minute activation time
CSZ180 Activated carbon from coconut shell with zinc chloride activation at 180
minute activation time
CSH10 Activated carbon from coconut shell with phosphoric acid activation at 10 %
concentration
CSH020 Activated carbon from coconut shell with phosphoric acid activation at 20 %
concentration
xiv
CSH030 Activated carbon from coconut shell with phosphoric acid activation at 30 %
concentration
CSH040 Activated carbon from coconut shell with phosphoric acid activation at 40 %
concentration
CSH300 Activated carbon from coconut shell with phosphoric acid activation at
300°C activation temperature
CSH400 Activated carbon from coconut shell with phosphoric acid activation at
400°C activation temperature
CSH500 Activated carbon from coconut shell with phosphoric acid activation at
500°C activation temperature
CSH060 Activated carbon from coconut shell with phosphoric acid activation at 60
minutes activation temperature
CSH120 Activated carbon from coconut shell with phosphoric acid activation at 120
minutes activation temperature
CSH180 Activated carbon from coconut shell with phosphoric acid activation at 180
minutes activation temperature
FTIR Fourier Transform Infrared Spectrophotometer
min Minute
PS Palm kernel shell
PSH Activated carbon from coconut shell with phosphoric acid activation
PSZ Activated carbon from palm kernel shell with zinc chloride activation
SEM Scanning electron microscopy
xv
LIST OF APPENDICES
1.1 Appendix A [Calculation of Zinc Chloride and Phosphoric Acid 116
concentration]
1.2 Appendix B [Calculation of percentage yield] 117
1.3 Appendix C [Iodine Number Calculations (ASTM D 4607)] 118
LIST OF PUBLICATIONS AND SEMINARS
1.1 Characterization of Activated Carbon Prepared From Coconut Shell By Zinc Chloride Impregnation At Different Stages
1.2 Physical and Chemical Properties of Activated Carbon from Coconut Shell
xvi
PENGHASILAN DAN PENCIRIAN KARBON TERAKTIF MENGGUNAKAN BAHAN BUANGAN PERTANIAN TEMPATAN MELALUI PROSES PENGAKTIFAN KIMIA
ABSTRAK
Karbon teraktif daripada tempurung kelapa dan tempurung kelapa sawit
telah berjaya dihasilkan melalui proses pengaktifan kimia dengan menggunakan zink
klorida dan asid fosforik sebagai agen pengaktif. Kesan suhu pengaktifan, masa
pengaktifan dan kepekatan agen pengaktif terhadap luas permukaan BET, morfologi
permukaan dan hasil (berat kering) telah dikaji. Keputusan menunjukkan di dalam semua
kes, peningkatan suhu pengaktifan dari 300˚C hingga 500˚C dan masa pengaktifan dari 60
minit hingga 180 minit menyebabkan peratus hasil menurun, manakala luas permukaan
meningkat. Nilai luas permukaan karbon teraktif tertinggi diperolehi dengan menggunakan
5 M kepekatan zink klorida dan 30% kepekatan larutan asid fosforik iaitu 893 m2/g dan 833
m2/g masing-masing. Oleh itu, suhu optimum yang diperolehi adalah pada 500˚C dan
masa pengaktifan yang diperlukan adalah 120 minit. Pencirian ke atas karbon teraktif
dilakukan dengan memilih empat sampel yang dihasilkan dari kedua-dua jenis bahan mula
(CS & PS) pada suhu, masa dan kepekatan yang optimum (CSZ, PSZ, CSH, PSH).
Keputusan analisis unsur menunjukkan kandungan karbon di dalam sampel adalah lebih
daripada 75% manakala kandungan nitrogen dan sulfur adalah kurang dari 0.1%.
Manakala, kandungan karbon tetap bagi karbon teraktif yang dihasilkan adalah di antara
54% hingga 79% dan kandungan bahan meruap yang tinggal adalah dari 11% hingga
36%. Kandungan peratus lembapan pula adalah kurang daripada 10% dan akhir sekali
nilai abu akhir adalah kurang dari 2%. Analisis FTIR menunjukkan bahawa kumpulan
hidroksil, karbonil, alifatik, eter, alkohol, fenol dan kumpulan karbosilik dapat dikesan pada
permukaan kedua-dua bahan mula. Setelah proses pengaktifan dan pengkarbonan,
keputusan menunjukkan bahawa terdapat kumpulan berfungsi baru yang terbentuk seperti
xvii
karbon-aromatik dan polifosfat-ester pada karbon teraktif yang dihasilkan dan beberapa
kumpulan berfungsi telah disingkirkan seperti karbosilik, alkohol dan karbonil. Ujian
keupayaan penjerapan telah dijalankan keatas karbon teraktif yang dihasilkan
menggunakan kaedah pentitratan nombor iodin. Keputusan menunjukkan bahawa nilai
nombor iodin yang tinggi telah diperolehi bagi sampel CSZ dan PSZ iaitu pada 966 mg/g
dan 959 mg/g masing –masing. Kajian keberkesanan penyingkiran sianida telah
dijalankan untuk menentukan potensi penggunaan karbon teraktif yang dihasilkan. Peratus
penyingkiran sianida berjaya diperolehi lebih daripada 98% pada kepekatan awal sianida
25 mg/l dengan menggunakan 0.5 g karbon teraktif yang dihasilkan dari tempurung kelapa
sawit melalui pengaktifan dengan asid fosforik yang telah di jerap-isi dengan 5 % larutan
kuprum sulfat. Bagi karbon teraktif yang tidak dijerap-isi, keputusan menunjukkan peratus
penyingkiran sianida adalah kurang dari 60% pada kepekatan awal sianida 25 mg/l dan 50
mg/l. Daripada ujian penyingkiran sianida, ia menunjukkan bahawa karbon teraktif yang
dihasilkan daripada tempurung kelapa dan tempurung kelapa sawit boleh digunakan
sebagai penjerap dalam perawatan air sisa sianida.
THE PRODUCTION AND CHARACTERIZATION OF ACTIVATED CARBON USING LOCAL AGRICULTURAL WASTE THROUGH CHEMICAL ACTIVATION PROCESS
xviii
ABSTRACT
Activated carbon from coconut shell and palm kernel shell has been successfully
produced through chemical activation process using zinc chloride and phosphoric acid as
activating agents. The effect of activation temperature, activation time and concentration
of activating agent on BET surface area, surface morphology and yield (dry weight basis)
were studied. The result showed that in all cases, increasing the activation temperature
from 300˚C to 500 ˚C and activation time from 60 to 180 minutes caused a decrease in the
percentage yield while the BET surface area is increased, progressively. The highest BET
surface area of the activated carbon obtained by using 5 M zinc chloride concentration and
30% concentration of phosphoric acid is 893 m2/g and 833 m2/g respectively. Hence, the
optimum temperature for production of activated carbon was obtained at 500˚C and
optimum activation time was obtained at 120 minutes. Characterization of the activated
carbon produced was done by selecting four samples from both the raw materials (CS &
PS) at optimum temperature, activation time and concentration (CSZ, PSZ, CSH, PSH).
Elemantal analysis showed that carbon content in the samples is high which is over 75%
and the nitrogen and sulphur content is less than 0.1%. While, the fixed carbon of
activated carbon produced is in the range of 54% to 79% and the volatile matter left is from
11% to 36%. The moisture content is less than 10% and finally ash content is less than
2% for all samples selected. FTIR analysis showed the hydroxyl, carbonyl, aliphatic,
ethers, alcohol, phenol and carboxylic groups are present on the surfaces of both the raw
materials.
xix
After the activation and carbonization process, the new functional groups were assigned
such as carbon-aromatic groups and polyphosphate esters on activated carbon produced
and some of the functional groups were eliminated such as carboxylic, alcohol and
carbonyl. The adsorption capacity test of the produced activated carbon was determined
by iodine number. The highest iodine number obtained from CSZ and PSH samples are
966 and 959 mg/g respectively. The cyanide removal efficiency was carried out to
determine the potential application of produced activated carbon. The percentage of
cyanide removal is successfully obtained more than 98 % at initial cyanide concentration
of 25 mg/l by using 0.5g of activated carbon produced from palm kernel shell through
phosphoric acid activation (PSH) impregnated with 5 % of copper from Cu(II)SO4 solution.
For raw activated carbon (non-impregnated AC), the results showed a lower cyanide
removal of below 60 % at initial cyanide concentration of 25 mg/l and 50 mg/l. From the
cyanide removal test, the activated carbon produced from coconut shell and palm kernel
shell by chemical activation can be used as an adsorbent in cyanide waste water
treatment.
1
CHAPTER ONE INTRODUCTION
1.1 Background
Recently, carbon has been one of the magnificent elements which have
revolutionized material science. From carbon we obtain the best porous absorber
(activated carbon) with excellent properties for large spectrum of industrial applications.
Activated Carbon (AC) is the common term used for a group of absorbing substances
of crystalline form, having a large internal pore structures that make the carbon more
absorbent (Strand, 2001). These properties are obtained when a char is subjected to
controlled gasification by oxidizing gases, or when a raw material impregnated with
dehydrating agents is subjected to carbonization.
Generally, the raw materials for the production of AC are those with high carbon
but low inorganic contents such as wood, lignite, peat and coal (Lua and Guo, 2001).
Beside that, lot of agricultural waste and by product have successfully converted to AC
for examples macadamia nutshell (Ahmadpour and Do, 1996), paper mill
sludge(Khalili, et al., 2000) and peach stones (Arriagada, et al., 1997). In Malaysia
there are potential raw materials resources for the production of the activated carbon.
In this research, two local agricultural waste which are coconut shells and palm kernel
shells were used to produce an activated carbon due to the availability and inexpensive
material with high carbon and low inorganic content. A number of researches have
been reported in the literature using coconut shell and palm kernel shell as a raw
materials. Table 1.1 summarizes various works with reference to the raw materials
using, methods and their application of AC produced.
2
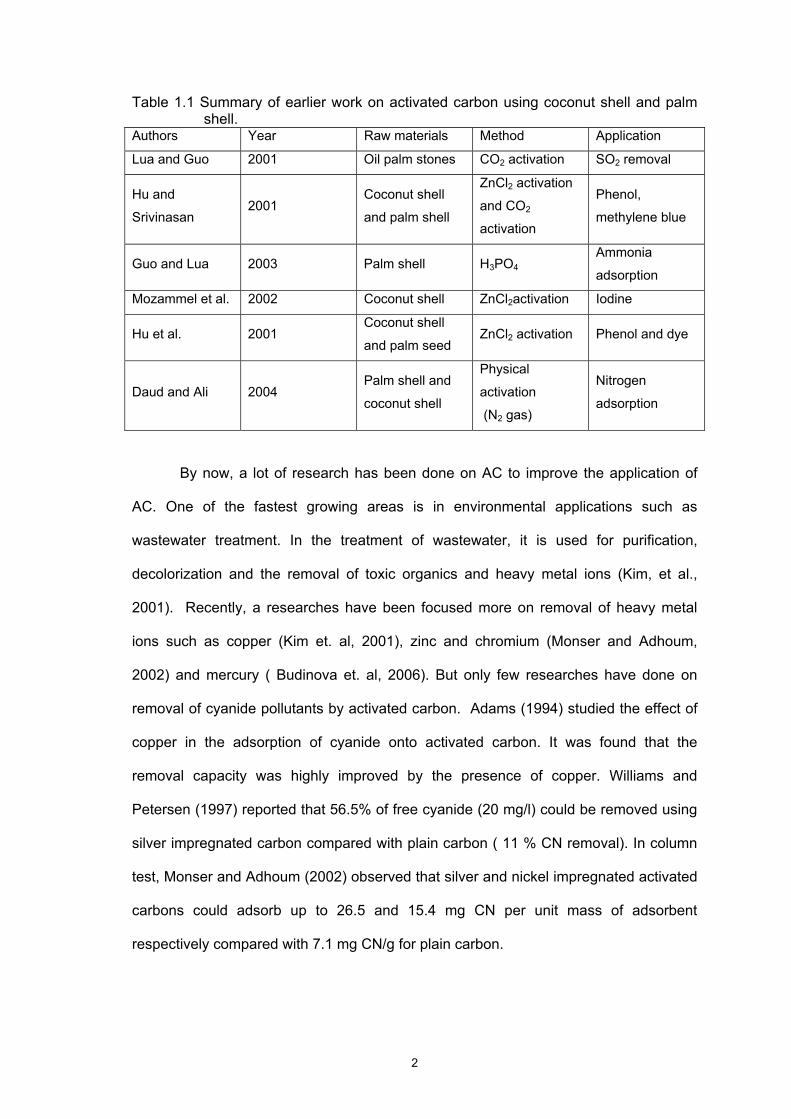
Table 1.1 Summary of earlier work on activated carbon using coconut shell and palm shell.
Authors Year Raw materials Method Application
Lua and Guo 2001 Oil palm stones CO2 activation SO2 removal
Hu and
Srivinasan 2001
Coconut shell
and palm shell
ZnCl2 activation
and CO2
activation
Phenol,
methylene blue
Guo and Lua 2003 Palm shell H3PO4 Ammonia
adsorption
Mozammel et al. 2002 Coconut shell ZnCl2activation Iodine
Hu et al. 2001 Coconut shell
and palm seed ZnCl2 activation Phenol and dye
Daud and Ali 2004 Palm shell and
coconut shell
Physical
activation
(N2 gas)
Nitrogen
adsorption
By now, a lot of research has been done on AC to improve the application of
AC. One of the fastest growing areas is in environmental applications such as
wastewater treatment. In the treatment of wastewater, it is used for purification,
decolorization and the removal of toxic organics and heavy metal ions (Kim, et al.,
2001). Recently, a researches have been focused more on removal of heavy metal
ions such as copper (Kim et. al, 2001), zinc and chromium (Monser and Adhoum,
2002) and mercury ( Budinova et. al, 2006). But only few researches have done on
removal of cyanide pollutants by activated carbon. Adams (1994) studied the effect of
copper in the adsorption of cyanide onto activated carbon. It was found that the
removal capacity was highly improved by the presence of copper. Williams and
Petersen (1997) reported that 56.5% of free cyanide (20 mg/l) could be removed using
silver impregnated carbon compared with plain carbon ( 11 % CN removal). In column
test, Monser and Adhoum (2002) observed that silver and nickel impregnated activated
carbons could adsorb up to 26.5 and 15.4 mg CN per unit mass of adsorbent
respectively compared with 7.1 mg CN/g for plain carbon.
3
Deveci et. al (2006) also reported that by using copper and silver impregnated
activated carbon prepared from coconut shell could adsorb up to 22.4 and 29.9 mg/g
CN respectively. Therefore, in this research the produce activated carbon will used to
examine the potential application of local activated carbon produced on removal of
cyanide pollutants.
1.2 The Importance of the Research
The world production of AC in 1990 was estimated to be 375,000 ton, excluding
what was then Eastern Europe and also China (Mozammel et.al, 2002). In 2002, the
demand for activated carbon reached 200,000ton per year in United States and the
market will very probably be negatively affected by imports from the Asia-Pacific
region. The demands of AC were increase over the year and market growth was
estimated at 4.6% per year (Mozammel et. al, 2002). The strong market position held
by AC relates to their unique properties and low cost compared with that of possible
competitive inorganic adsorbents like zeolites.
AC is used primarily as an adsorbent to remove organic compounds and
pollutant from liquid and gas streams. The market has been increasing constantly as a
consequence of environmental issues, especially water and air purification.
Furthermore, as more and more countries are becoming industrialized, the need for
activated carbon to comply with environmental regulation will grow at faster rate. Liquid
phase applications represent the largest outlet for AC. In these applications, AC is used
in the purification of a variety of liquid streams, such as those used in water treatment
and the processing of food, beverages and pharmaceuticals.
4
The growth of the activated carbon market in the last two decades in the most
industrialized region will very probably continue in the near future as more developing
areas of the world will realize the importance of controlling water and air pollution. This
demand can be satisfied considering the large number of raw material available for the
production of AC, the variety of activation processes described, and the available forms
of AC. Thus, the continuous research has to be implementing to develop the high
quality of AC for specific uses.
1.3 Objectives of the Research
The aim of this research is to produce activated carbon from the local
agricultural waste which is coconut shell and palm kernel shell impregnated with two
activation agent for a particular application. To achieve these, a study was carried out
with the following objectives:
i. To evaluate various operating parameters such as activation temperature and
activation time for the activated carbon produced from coconut shell and palm
kernel shell.
ii. To study the effect of chemical activation on the development of pore structure
on the activated carbon produced.
iii. To examine the characteristic of granular activated carbon produced (i.e
elemental analysis, proximate analysis, adsorption capacity, surface
functionality and pore size of AC produced).
iv. To evaluate the potential application of locally produced activated carbon in
inorganic pollutants such as its performance in cyanide removal.
5
1.4 Scope of the research
Production of all these oils by the small scale or traditional producers is spread
over various areas in the country, whilst the established industries engage mostly in
production of palm oil. The supply of the palm shells is easier as many established
industries dumped the shells as a waste after getting the kernels from the nuts.
Coconut shell wastes, on the other hand, are spread over wider area in the country and
collection ore effort than that of palm shells.
In this research, the production of activated carbon was carried out by using
chemical activation method. In chemical activation, the carbonization and activation are
accomplished in a single step by carrying out the thermal decomposition of the raw
material impregnated with certain activating agents. Two activating agents were used,
there are phosphoric acid and zinc chloride. Zinc chloride known as a Lewis acid is a
strong dehydrating agent which could alter the structure of carbon to form the porous
structure. While phosphoric acid, was also known as a strong acid acts as an acid
catalyst to promote cleavage reactions (Rodriguez-Reinoso, 2002). By using these two
chemical, the influences on the pore structure of AC produced can be compared.
After the impregnation step, the samples were carbonized in the horizontal
furnace under inert atmosphere by using nitrogen gas (N2) by varying the operating
parameter such as carbonization temperature and carbonization time. The
carbonization temperatures of this activation were varied between 300 to 500 ºC to
analyze the effect of temperature on the yield and pores development of activated
carbon.
This work also focuses on optimizing the activation time, instead to optimizing
the activation temperature. The raw materials that have been activated will be
carbonized under certain temperature with control time of 0.5, 1, 2, 3, 4 hours. After
carbonization, the activated carbons produced were washed with water or
6
hydrochloride acid several times until the residual activating agent on the surface of
activated carbon completely removed.
This stage was important because during impregnation the activating agent will
penetrated into raw material particles and occupied substantial volumes. Once they
were extracted by intense washing, a large amount of microporosity was created.
In order to analyze the activated carbon produced, several standard analyses
were employed to characterize the product that will meet the condition for
commercialization. The characterization of the activated carbon produced were
performed by using several analyses such as the elemental analysis, proximate
analysis, pore size analysis, surface functional groups analysis and adsorption
capacity.
7
CHAPTER TWO LITERATURE REVIEW
2.1 ACTIVATED CARBON
2.1.1 Introduction
Activated carbons form a large and important class of porous solids, which have
found a wide range of technological applications. As a consequence, the porous
structures of these materials and their adsorption of gases, vapors, and liquids have
been extensively studied. In this section the microstructural and porous properties of
the principal classes of activated carbon are reviewed. It is outside the scope of this
contribution to consider in detail the very many industrial applications and processes
that employ activated carbon.
Activated carbons have been explained in different way of definition from
several authors. In sec 2.1.2 the definition of activated carbons are reviewed from
certain authors that give an overview about the activated carbons. On the other
hand, some of the principal methods used to characterize the pore structure in
activated carbons are outlined (Section 2.2). Furthermore, the pore structure is having
been reviewed in section 2.3. In order to understand the porous structure of activated
carbons it is first necessary to give an outline review of the carbonization processes
that convert the organic precursors to the carbon product (Section 2.4). This provides
a basis for understanding the relationship of the pore structure of activated carbons to
the fine structure of the solid carbon materials. An appreciation of the fine structure of
activated carbons leads to an account of the surface forces in pores that give rise to
the powerful adsorptive properties of activated carbons.
8
The processing method involved two types of activation, physical and chemical
activation (Sect. 2.5). The development of porosity in activated carbons by "physical"
activation, i.e., by reaction of the carbon with oxidizing gases (steam. carbon dioxide.
and air) is reviewed in Section 2.5.2. Chemical activation. i.e. by reaction of carbon
precursors with reagents, such as phosphoric acid and zinc chloride is considered in
Sect. 2.5.3. The review continues with a some applications of activated carbons (Sect.
2.6) and concludes with Sect. 2.7 that summarizes the salient points to emerge from
the review.
2.1.2 Definition of Activated Carbon
Activated carbon (AC) as many known as a solid, porous, black carbonaceous
material and tasteless. Marsh (1989) defined AC as a porous carbon material, usually
chars, which have been subjected to reaction with gases during or after carbonization
in order to increase porosity. AC is distinguished from elemental carbon by the
removal of all non-carbon impurities and the oxidation of the carbon surface. While
according to Norlia Baharun (1999) AC is an organic material that has an essentially
graphitic structure. The main features common to all AC are; graphite like planes
which show varying degrees of disorientation and the resulting spaces between these
planes which constitute porosity, and the unit built of condensed aromatic rings are
referred to as Basic Structure Units (BSU) (Benaddi,2000). Benaddi(2000) also stated
that AC is predominantly an amorphous solid with a large internal surface area and
pore volume. Cokes, chars and activated carbon are frequently termed amorphous
carbon.
9
X-ray studies have shown that many so-called amorphous substances have
crystalline characteristics, even though they may not show certain features, such as
crystal angles and faces, usually associated with crystalline state. Although
interpretation of the X-ray diffraction patterns is not free from ambiguities, there is
general agreement that amorphous carbon consists of plates in which the carbon
atoms are arranged in a hexagonal lattice, each atom, except those at the edge, being
held by covalent linkages to three other carbon atoms. The crystallites are formed by
two or more of these plates being stacked one above the other. Although these
crystallites have some structural resemblance to a larger graphite crystal, differences
other than size exist (Hassler,1974).
From all the definition, it can be summarized that AC is black, amorphous solid
containing major portion of fixed carbon content and other materials such as ash, water
vapor and volatile matters in smaller percentage. Beside that, AC also contain physical
characteristic such as internal surface area and pore volume. The large surface area
results in a high capacity for absorbing chemicals from gases or liquids. The
adsorptive property stems from the extensive internal pore structure that develops
during the activation process.
2.2 Characterization and Properties of Activated Carbon
Characterization for activated carbon (AC) is very important in order to
classified AC for specific uses. Basically, AC characterized by physical properties and
chemical properties. As Guo and Lua(2003) mentioned that the characteristics of
activated carbon depends on the physical and chemical properties of the raw materials
as well as activation method used.
10
Physical properties of AC, such as ash content and moisture content can affect
the use of a granular AC and render them either suitable or unsuitable for specific
applications. While the specific surface area of activated carbon and surface chemistry
is classified as chemical properties. Furthermore, the porous structure of activated
carbon also can be characterize by various techniques such as adsorption of gases(N2,
Ar, Kr, CO2) or vapors (benzene, water), scanning electron microscopy(SEM) and
transmission electron microscopy (TEM).
2.2.1 Moisture Content
Activated carbon is generally priced on a moisture free basis, although
occasionally some moisture content is stipulated, e.g., 3, 8, 10%. Unless packaged in
airtight containers, some activated carbons when stored under humid conditions will
adsorb considerable moisture over a period of month. They may adsorb as much as 25
to 30% moisture and still appear dry. For many purposes, this moisture content does
not affect the adsorptive power, but obviously it dilutes the carbon. Therefore, an
additional weight of moist carbon is needed to provide the required dry weight.
2.2.2 Ash content
The ash content of a carbon is the residue that remains when the carbonaceous
materials is burned off. As activated carbon contain inorganic constituents derived from
the source materials and from activating agents added during manufacture, the total
amount of inorganic constituents will vary from one grade of carbon to another. The
inorganic constituents in a carbon are usually reported as being in the form in which
they appear when the carbon is ashed.
11
Ash content can lead to increase hydrophilicity and can have catalytic effects,
causing restructuring process during regeneration of used activated carbon. The
inorganic material contained in activated carbon is measured as ash content, generally
in the range between 2 and 10% (Yang, 2003).
To determine the content of ash, a weighed quantity (2 grams of powdered
carbon, or 10 to 20 grams granular carbon) is placed in a porcelain crucible and heated
in air in a muffle furnace until the carbon has been completely burned. The temperature
should be below 600˚C to minimize volatilization of inorganic constituents, and also to
leave the ash in a suitable condition for further examination.
2.2.3 Surface area
Generally, the larger the specific surface area of the adsorbent, the better its
adsorption performance will be (Guo and Lua, 2003). The most widely used
commercial active carbons have a specific surface area of the order of 600- 1200 m2/g
(Ng et.al, 2002). The pore volume limits the size of the molecules that can be adsorbed
whilst the surface area limits the amount of material which can be adsorbed, assuming
a suitable molecular size (Lartley, 1999). The adsorptive capacity of adsorbent is
related to its internal surface area and pore volume.
The specific surface area (m2/g) of porous carbon is most usually determined
from gas adsorption measurement using the Brunauer-Emmett-Teller BET theory (Hu
and Srinivasan, 1999). The most commonly employed method to characterize these
structural aspects of the porosity is based on the interpretation of adsorption isotherm
(e.g., N2 at 77K). Nitrogen at its boiling point of 77K is the recommended adsorptive,
although argon at 77K also used.
12
2.2.4 Surface Functional Group of Activated Carbon
The selectivity of activated carbons for adsorption is depended upon their
surface chemistry, as well as their pore size distribution (Radovic,2001). Normally, the
adsorptive surface of activated carbon is approximately neutral such as that polar and
ionic species are less readily adsorbed than organic molecules.
For many applications it would be advantageous to be able to tailor the surface
chemistry of activated carbon in order to improve their effectiveness. The chemical
composition of the raw material influence the surface chemistry and offer a potentially
lower cost method for adjusting the properties of activated carbons. For example,
activated carbon fiber produced from nitrogen-rich isotropic pitches have been found to
be very active for the catalytic conversion of SO2 to sulfuric acid (Radovic,2001).
Various surface functional groups containing oxygen, nitrogen and other heteroatoms
have been identified on activated carbon. It because activated carbons have a large
porosity and numerous disordered spaces, this makes heteroatom are readily
combined on the surface during manufacturing processes (carbonization and
activation). Heteroatoms are incorporated into the network and are also bound to the
periphery of the planes. The heteroatoms bound to the surfaces assume the character
of the functional groups typically found in aromatic compounds, and react in similar
ways with many reagents. These surface groups play a key role in the surface
chemistry of activated carbon (Yang ,2003).
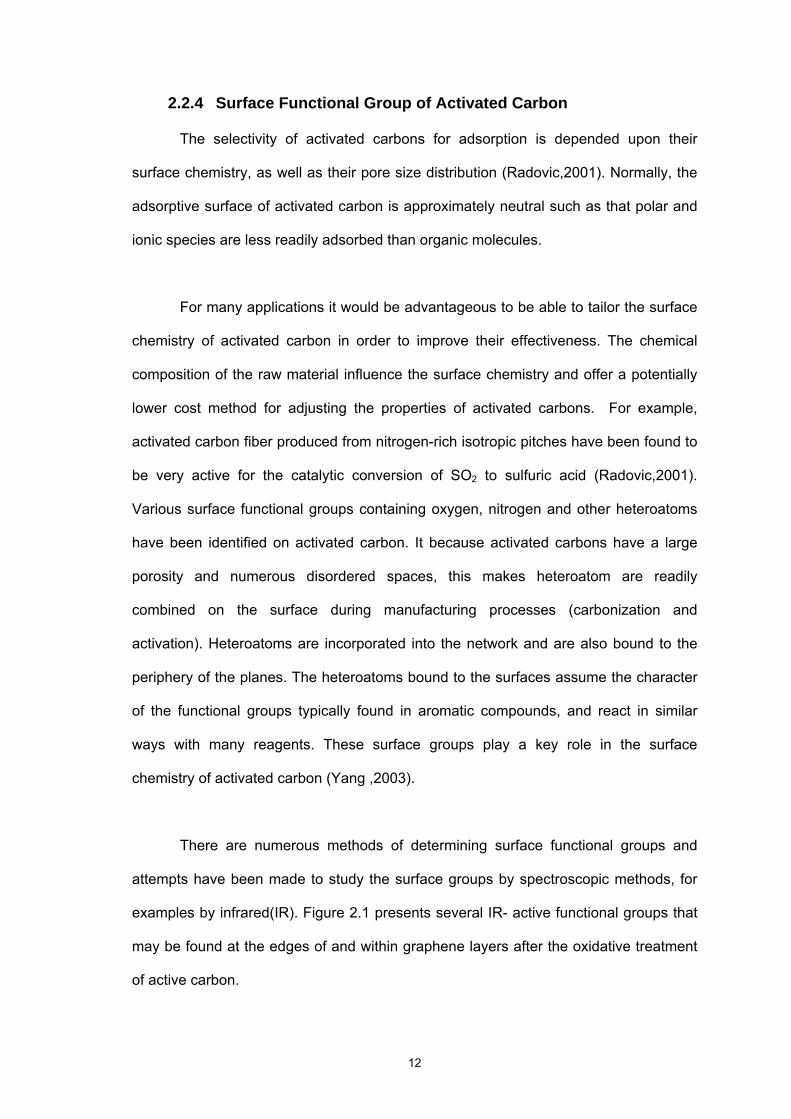
There are numerous methods of determining surface functional groups and
attempts have been made to study the surface groups by spectroscopic methods, for
examples by infrared(IR). Figure 2.1 presents several IR- active functional groups that
may be found at the edges of and within graphene layers after the oxidative treatment
of active carbon.
13
Figure 2.1 IR- active functionalities on carbon surfaces: (a) aromatic c=c stretching;(b) and (c) carboxyl-carbonates; (d) carboxylic acid; (e)lactone(4-membered ring);(f) lactone (5- membered ring); (g) ether brigde; (h) cyclic ether; (i) cyclic anhydride (5-membered ring); (j) cyclic anhydride (6-membered ring); (k) quinine; (l) phenol; (m) alcohol; and (n) ketene (Radovic, 2001).
2.3 Pore structure
The word pore comes from the Greek word, meaning a passage (Marsh, 1989).
In this sense, a pore is a class of void which is connected to the external surface of a
solid and will allow the passage of fluids into, out of, or through a material. Marsh’s
(1989) claim that, in the scientific literature on porous solids the terms ‘open pore’ and
‘closed pore’ are used, the former a pore which is not so connected. Examples of
different pore types are shown schematically in Figure 2.2.
14
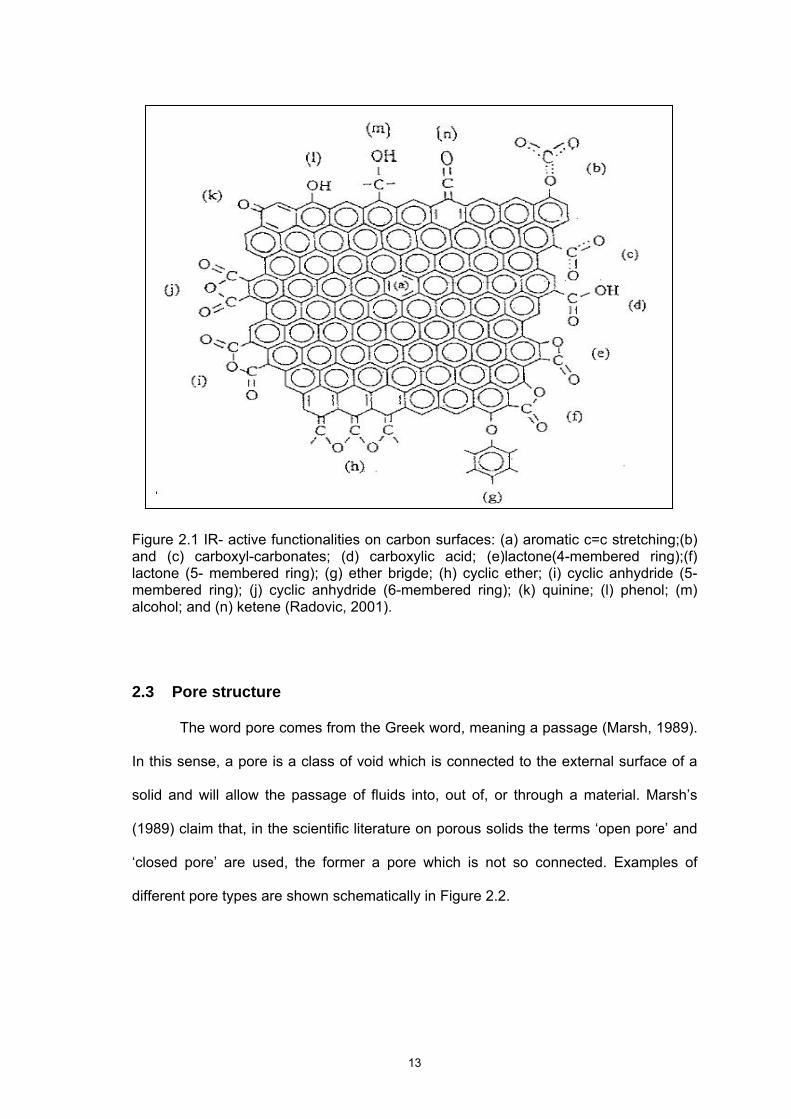
Figure 2.2 Different types of porosity in a porous solid (Marsh, 1989) O-open pores; C- closed pores; t-transport pores; b-blind pores.
Transport pores are those pores in which a concentration gradient exists during
steady state or time-independent fluid flow through the material. Blind pores are
connected to transport pores by a single opening so that in them concentration
gradients and hence fluid flow only occur during unsteady state or time independent
flow.
Differences in pore sizes affect the capacity for molecules of different shapes
and sizes, and this is one of the criteria by which carbons are selected for a specific
application. Porosity is classified by IUPAC into three different groups of pore sizes
(Guo and Lua, 2003):
i. Micropores- width less than 2nm
ii. Mesopores- width between 2 and 50nm
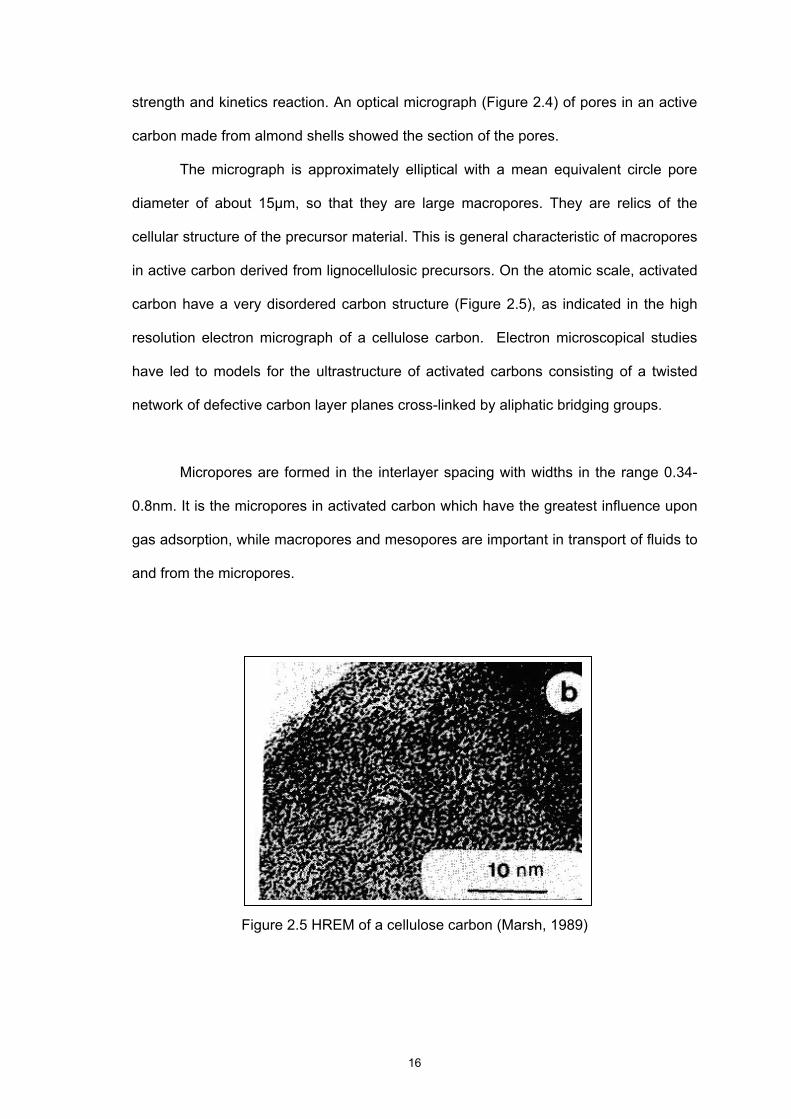
iii. Macropores- width greater than 50nm
15
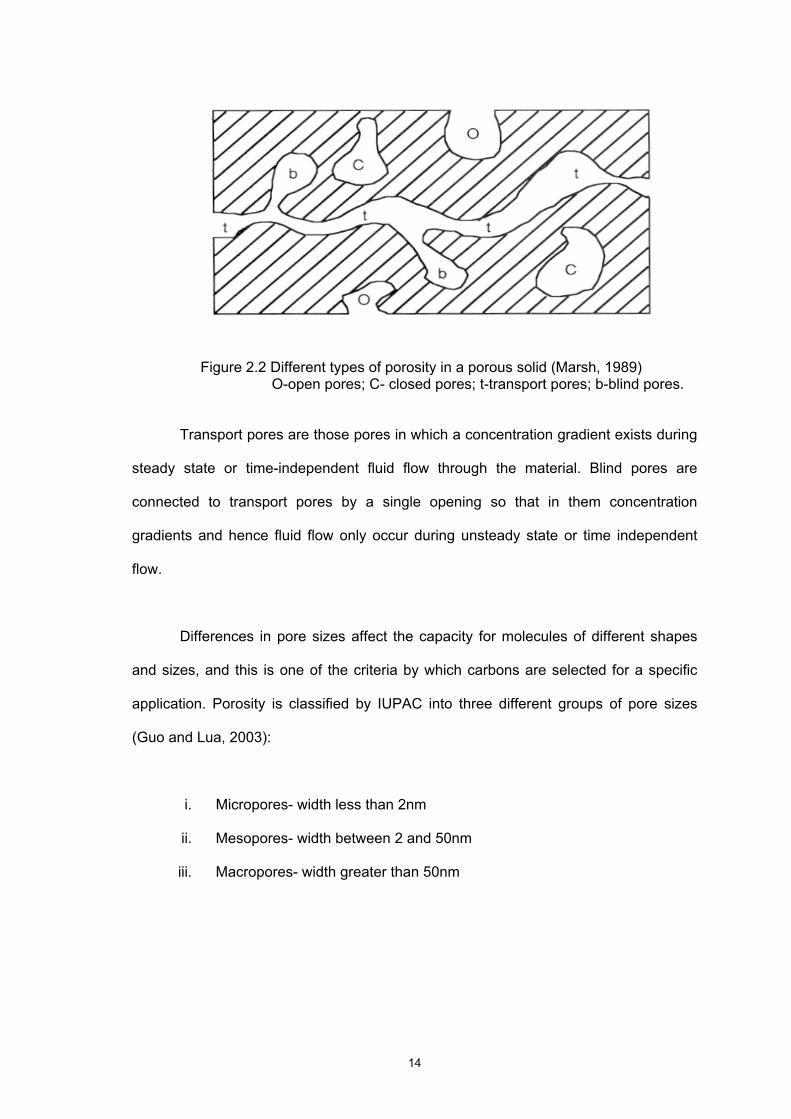
The schematic of internal pores structure in activated carbon was shown in Figure 2.3
below.
Figure 2.3 The schematic of internal pore structure in activated carbon
(http://buildingprotection.rdecom.army.mil/images/af_carbon_pore.jpg)
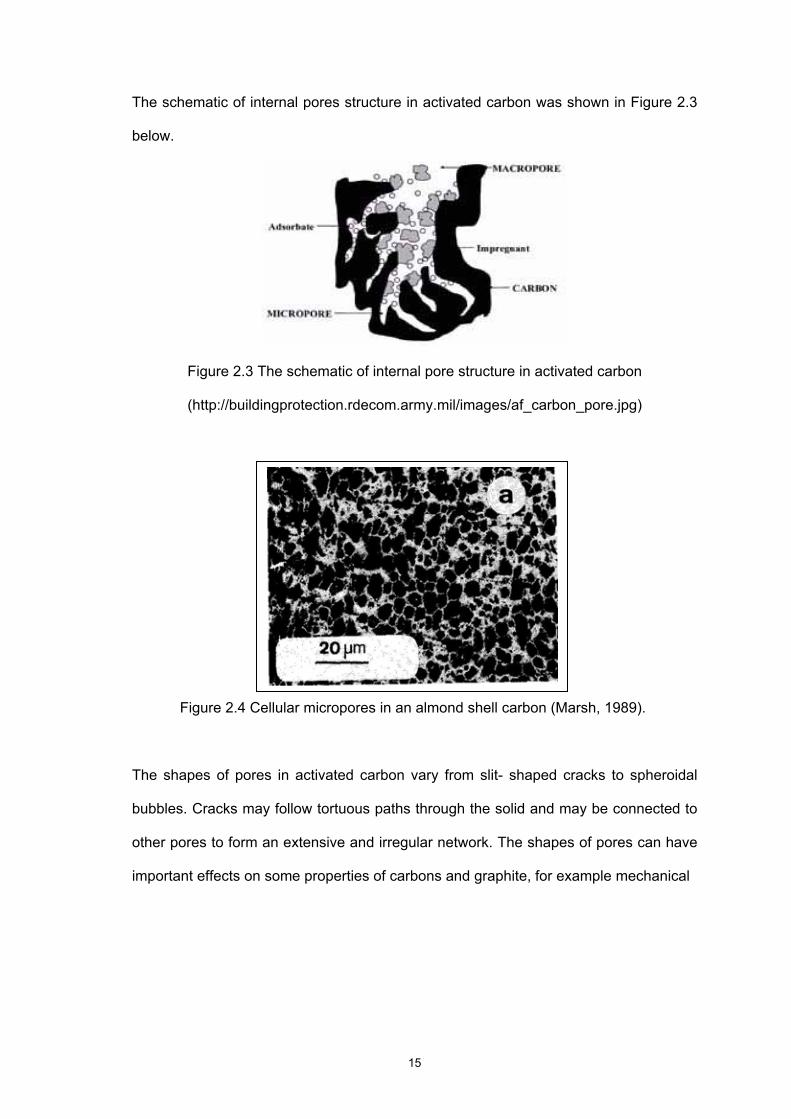
Figure 2.4 Cellular micropores in an almond shell carbon (Marsh, 1989).
The shapes of pores in activated carbon vary from slit- shaped cracks to spheroidal
bubbles. Cracks may follow tortuous paths through the solid and may be connected to
other pores to form an extensive and irregular network. The shapes of pores can have
important effects on some properties of carbons and graphite, for example mechanical
16
strength and kinetics reaction. An optical micrograph (Figure 2.4) of pores in an active
carbon made from almond shells showed the section of the pores.
The micrograph is approximately elliptical with a mean equivalent circle pore
diameter of about 15µm, so that they are large macropores. They are relics of the
cellular structure of the precursor material. This is general characteristic of macropores
in active carbon derived from lignocellulosic precursors. On the atomic scale, activated
carbon have a very disordered carbon structure (Figure 2.5), as indicated in the high
resolution electron micrograph of a cellulose carbon. Electron microscopical studies
have led to models for the ultrastructure of activated carbons consisting of a twisted
network of defective carbon layer planes cross-linked by aliphatic bridging groups.
Micropores are formed in the interlayer spacing with widths in the range 0.34-
0.8nm. It is the micropores in activated carbon which have the greatest influence upon
gas adsorption, while macropores and mesopores are important in transport of fluids to
and from the micropores.
Figure 2.5 HREM of a cellulose carbon (Marsh, 1989)
17
Adsorption takes place in micropores and mesopores with macropores acting
as transport channels. In adsorption from the gas phase, mainly microporous carbon is
used whereas mesoporous carbon is applied in liquid phase processes (Benaddi et.al,
2000). Beside their significant contribution to adsorption, mesopores also serve as the
main transport arteries for this adsorbate (Hu et al., 2001). The mesopores volume lies
between the limits 0.1 to 0.5 cm3 per gram and mesopores surface areas are in the
range of 20 to 100 m2 per gram (Hu et al., 2001). In carbon, mesopores can be formed
by enlargement of micropores, for example by reaction with oxidizing gases as in
activated carbon (Marsh, 1989).
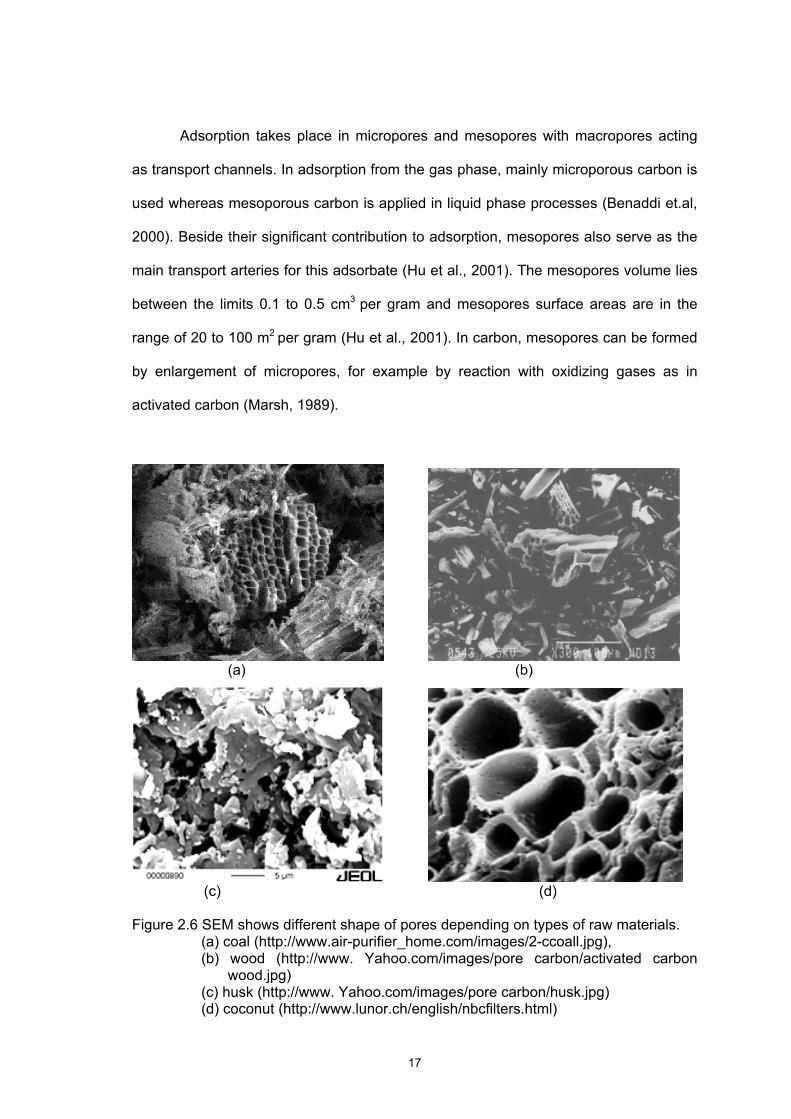
(a) (b)
(c) (d)
Figure 2.6 SEM shows different shape of pores depending on types of raw materials. (a) coal (http://www.air-purifier_home.com/images/2-ccoall.jpg), (b) wood (http://www. Yahoo.com/images/pore carbon/activated carbon
wood.jpg) (c) husk (http://www. Yahoo.com/images/pore carbon/husk.jpg) (d) coconut (http://www.lunor.ch/english/nbcfilters.html)
18
The distribution of pores in activated carbons can vary significant depending
upon the raw material. Figure 2.6 shows the different shape of pore with different of
raw material. The pore size distribution also affects the efficiency and selectivity of
adsorption. A consideration of the dimensions of some pollutants shows that activated
carbon can feasibly be used to remove many of the impurities occurring in water
(Radovic, 2001). The small organic molecules with low solubility have sizes in the
range 0.6 to 0.8 nm and can be adsorbed in micropores while large compounds such
as color molecules and humid acids have dimensions around 1.5 to 3.0 nm that will
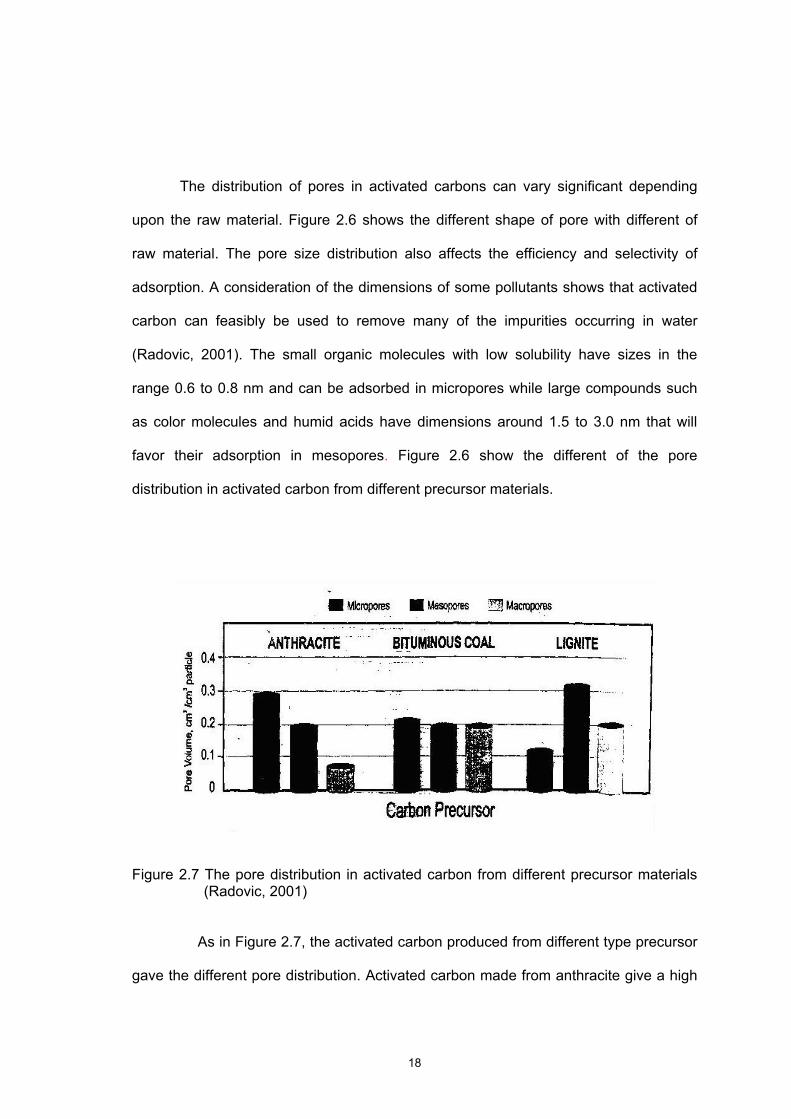
favor their adsorption in mesopores. Figure 2.6 show the different of the pore
distribution in activated carbon from different precursor materials.
Figure 2.7 The pore distribution in activated carbon from different precursor materials
(Radovic, 2001)
As in Figure 2.7, the activated carbon produced from different type precursor
gave the different pore distribution. Activated carbon made from anthracite give a high
19
proportion of micropores while activated carbons from bituminous coal give a broad
pore size distribution while lignite produces mesoporous carbon.
A large part of the carbon surface is furnished by the walls of the pores,
and such surface is accessible only to molecules that are small enough to enter. Table
2.1 showed the minimum pore diameter for adsorbate.
Table 2.1 Minimum pore diameter for adsorbate (Hassler,1974)
Adsorbate Minimum Pore, Diameter, Å
Iodine 10 Potassium permanganate 10 Methylene Blue 15 Erythrosine Red 19 Molasses 28
2.4 The microstructure of activated carbon
Activated carbon, relatively known as amorphous carbon, show a very
disordered microcrystalline structure in which graphitic microcrystals are randomly
oriented (Gomez-Serrano et.al., 2005). The term "turbostratic" has been used to
describe a-graphite like structure with random translation of layer planes along the a-
axis and rotation of layer planes about the c-axis. The interlayer spacing in a
turbostratic structure is 0.344 nm, which is larger than the spacing in a graphite single
crystal-, 0.3354 nm. Various microporous models have been proposed based on
HRTEM studies (McEnaney,2002).
One of the examples of microporous structure for activated carbon is shown in
figure 2.8. An essential feature of all of the models is a twisted network of carbon layer
planes, crosslinked by an extended network of aliphatic carbon. The layer planes are
defective, for example, they may contain vacancies and hetero-elements. The latter are
20
bound to the edges of the layer planes as simple functional groups. e.g., -OH, C-O.
-C--O -C-. There is a continuum of interlayer spaces ranging from the turbostratic value
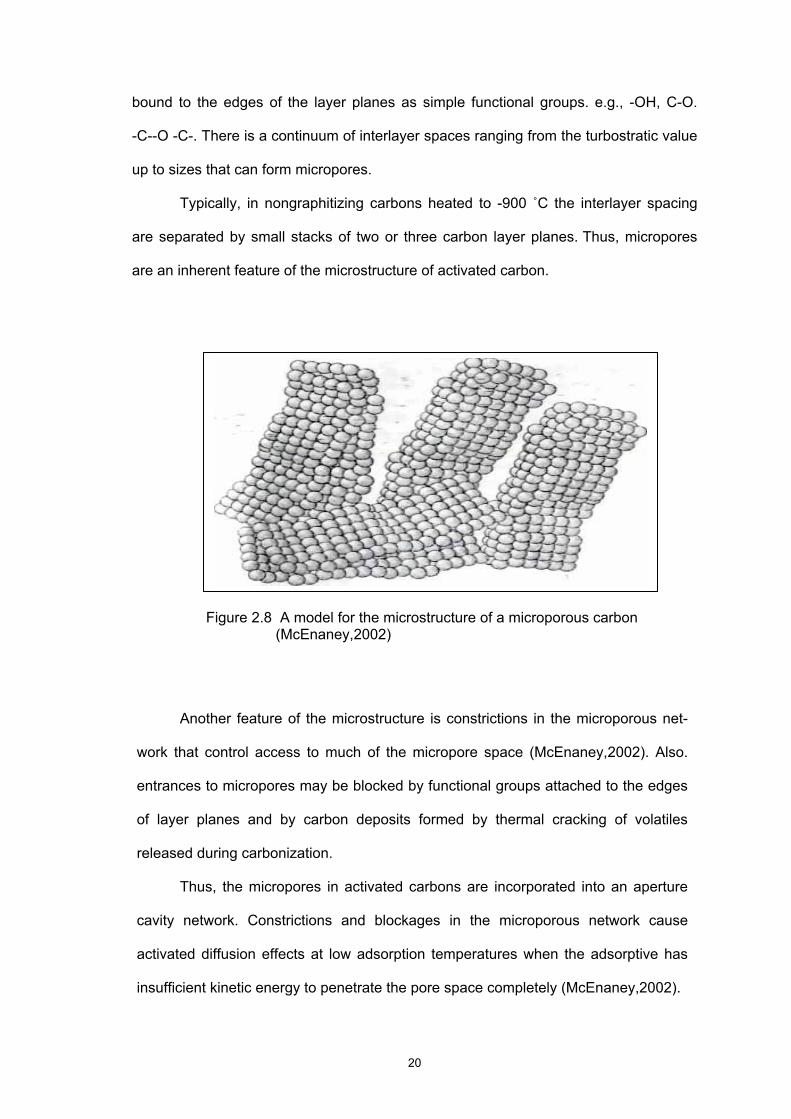
up to sizes that can form micropores.
Typically, in nongraphitizing carbons heated to -900 ˚C the interlayer spacing
are separated by small stacks of two or three carbon layer planes. Thus, micropores
are an inherent feature of the microstructure of activated carbon.
Figure 2.8 A model for the microstructure of a microporous carbon
(McEnaney,2002)
Another feature of the microstructure is constrictions in the microporous net-
work that control access to much of the micropore space (McEnaney,2002). Also.
entrances to micropores may be blocked by functional groups attached to the edges
of layer planes and by carbon deposits formed by thermal cracking of volatiles
released during carbonization.
Thus, the micropores in activated carbons are incorporated into an aperture
cavity network. Constrictions and blockages in the microporous network cause
activated diffusion effects at low adsorption temperatures when the adsorptive has
insufficient kinetic energy to penetrate the pore space completely (McEnaney,2002).
21
2.5 Processing of activated carbon
AC manufactured by the pyrolysis of carbonaceous materials of vegetable
origin, such as wood, coal, peat, fruit stones, and shell or synthetic polymer followed by
activation of the chars obtained from them (Manocha,2003). The pyrolysis of any
carbonaceous material in absence of air involves decomposition of organic molecules,
evolution of tarry and gaseous products, and finally in a solid porous carbon mass. An
adsorbent with highly developed porosity and correspondingly large surface area is
obtained only by activating the carbonized material either by physical or chemical
activation. The processing of AC basically involves selection of parameters that
effecting the activated carbon production, carbonization process and types of
activation.
2.5.1 Factors Affecting Activated Carbon Production
(1) Raw material
Most organic materials rich in carbon that do not fuse upon carbonization can
be used as raw material for the manufacture of AC (Rodriguez-Reinoso,2002). The
selection of raw material for preparation of porous carbon, several factors are taken
into consideration.
The factors are:
i. High carbon content
ii. Low in inorganic content (i.e low ash)
iii. High density and sufficient volatile content
iv. The stability of supply in the countries
v. Potential extent of activation
vi. Inexpensive material
22
vii. Low degradation upon storage
Lignocellulosic materials constitute the more commonly used precursor and
account for around 45% of the total raw materials used for the manufacture of activated
carbon. Low content in organic materials is important to produce AC with low ash
content, but relatively high volatile content is also needed for the control of the
manufacturing process.
Raw material such as coconut shell and fruit stones are very popular for
many types of AC, because their relatively high density, hardness and volatile content
are ideal for manufacture of hard granular AC. Coconut shells, together with peach and
olive stones are used commercially for the production of microporous activated
carbons, useful for a very wide range of applications. Further details about the
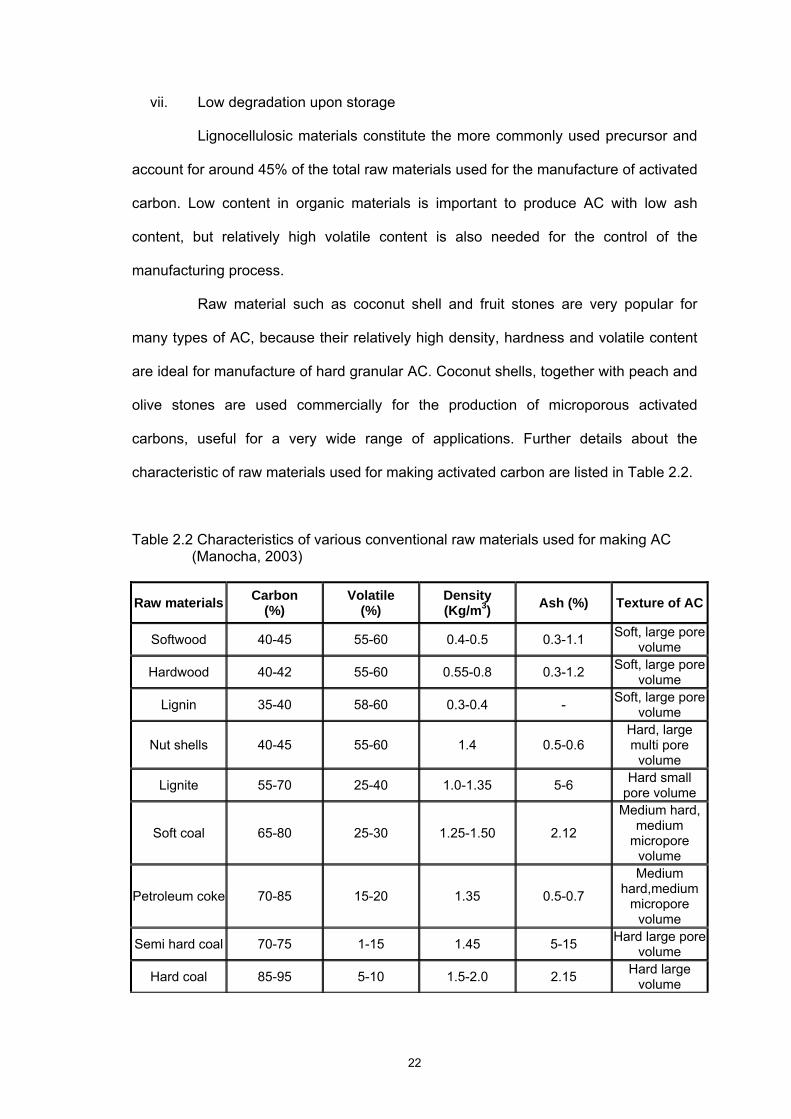
characteristic of raw materials used for making activated carbon are listed in Table 2.2.
Table 2.2 Characteristics of various conventional raw materials used for making AC (Manocha, 2003)
Raw materials Carbon (%)
Volatile (%)
Density (Kg/m3) Ash (%) Texture of AC
Softwood 40-45 55-60 0.4-0.5 0.3-1.1 Soft, large pore volume
Hardwood 40-42 55-60 0.55-0.8 0.3-1.2 Soft, large pore volume
Lignin 35-40 58-60 0.3-0.4 - Soft, large pore volume
Nut shells 40-45 55-60 1.4 0.5-0.6 Hard, large multi pore
volume
Lignite 55-70 25-40 1.0-1.35 5-6 Hard small pore volume
Soft coal 65-80 25-30 1.25-1.50 2.12
Medium hard, medium
micropore volume
Petroleum coke 70-85 15-20 1.35 0.5-0.7
Medium hard,medium
micropore volume
Semi hard coal 70-75 1-15 1.45 5-15 Hard large pore volume
Hard coal 85-95 5-10 1.5-2.0 2.15 Hard large volume
23
(2) Temperature
Temperature, particularly the final activation temperature, affects the
characteristic of the activated carbon produced. Generally, for commercial activated
carbon usually conducted at temperature above 800˚C in a mixture of steam and CO2
(San Miguel, et al.,2003). Recently, the researches have been working out on
optimizing the final activation temperature to economize the cost of production and
time. As reported by several authors, activation temperature significantly affects the
production yield of activated carbon and also the surface area of activated carbon. The
temperature used as low as 200˚C(Haimour and Emeish,2005) and up high to 1100˚C
(San Miguel, et al.,2003).
The optimum temperatures have been reported to be between 400˚C to 500˚C
by most the earlier researchers irrespective of the time of activation and impregnation
ratio for different raw material (Srinivasakannan and Zailani, 2003). The increasing of
activation temperature reduces the yield of the activated carbon continuously.
According to Guo and Lua(2003), this is expected since an increasing amount of
volatiles is released at increasing temperature from 500˚C to 900˚C. The decreasing
trend in yield is paralleled by the increasing activation temperature due to the activation
reaction. These phenomena are also manifested in the decreasing volatile content and
increasing fixed carbon for increasing activation temperature. Previously, Haimour and
Emeish(2005) suggested that the percentage of volatile matter decreased with an
increased of carbonization temperature and the variation of this parameter was
maximum between 200˚C and 800˚C due to rapid carbonization occurring in this
region. It is also unsuitable to prepare activated carbon when carbonization
temperature was more than 800˚C since the successive decreased in volatile matter is
minimal above this range.
24
This was accompanied with an increased of fixed carbon and ash content which
may be attributed to the removal of volatile matter in the material during carbonization
process. Thus, leaving behind the more stable carbon and ash-forming minerals
(Haimour and Emeish, 2005). Another notable feature that showed the effect of
activation temperature on the activated carbon properties is the BET surface area. As
the activation temperature increased, the BET surface area also increased (Haimour
and Emeish, 2005). This may be attributed to the development of new pores as a result
of volatile matter released and the widening of existing ones as the activation
temperature become higher.
(3) Activation time
Besides activation temperature, the activation time also affects the
carbonization process and properties of activated carbon. From previous study, the
activation times normally used were from 1 hour to 3 hour for palm shell and coconut
shell (Srinivasakannan and Zailani, 2003). As the time increased, the percentage of
yield decreased gradually and the BET surface area also increased. This result is
possibly due to the volatilization of organic materials from raw material, which results in
formation of activated carbon. The extent of decrease in product yield is observed to be
reducing when excessive activation occurs (Kim et al., 2001).
2.5.2 Carbonization
During carbonization, most of the non-carbon elements, hydrogen and
oxygen are first removed in gaseous form by pyrolytic decomposition of the starting
materials, and the free atoms of elementary carbon are grouped into organized
crystallographic formations known as elementary graphite crystallites (Manocha, 2003).
The original organic substance may be split into fragments which regroup to form the
thermo-stable aromatic structure existing in the hexagon.
Related Documents


![Preparation and Characterization of Activated Carbon from ... · activated carbon [9] .High degree of porosity that exists in activated carbon is well known to be an excellent candidate](https://static.cupdf.com/doc/110x72/5f234e014bf50a7e26725119/preparation-and-characterization-of-activated-carbon-from-activated-carbon-9.jpg)
