The Primary Care Information Project Sarah Shih, MPH Exec. Dir. Healthcare Quality Information New York City Department of Health and Mental Hygiene [email protected] http://www.nyc.gov /pcip

The Primary Care Information Project
Dec 31, 2015
The Primary Care Information Project. Sarah Shih, MPH Exec. Dir. Healthcare Quality Information New York City Department of Health and Mental Hygiene [email protected]. http://www.nyc.gov/pcip. NYC’s Health Agenda. T ake C are N ew Y ork - PowerPoint PPT Presentation
Welcome message from author
This document is posted to help you gain knowledge. Please leave a comment to let me know what you think about it! Share it to your friends and learn new things together.
Transcript

The Primary Care Information Project
Sarah Shih, MPH
Exec. Dir. Healthcare Quality Information
New York City
Department of Health and Mental Hygiene
http://www.nyc.gov/pcip
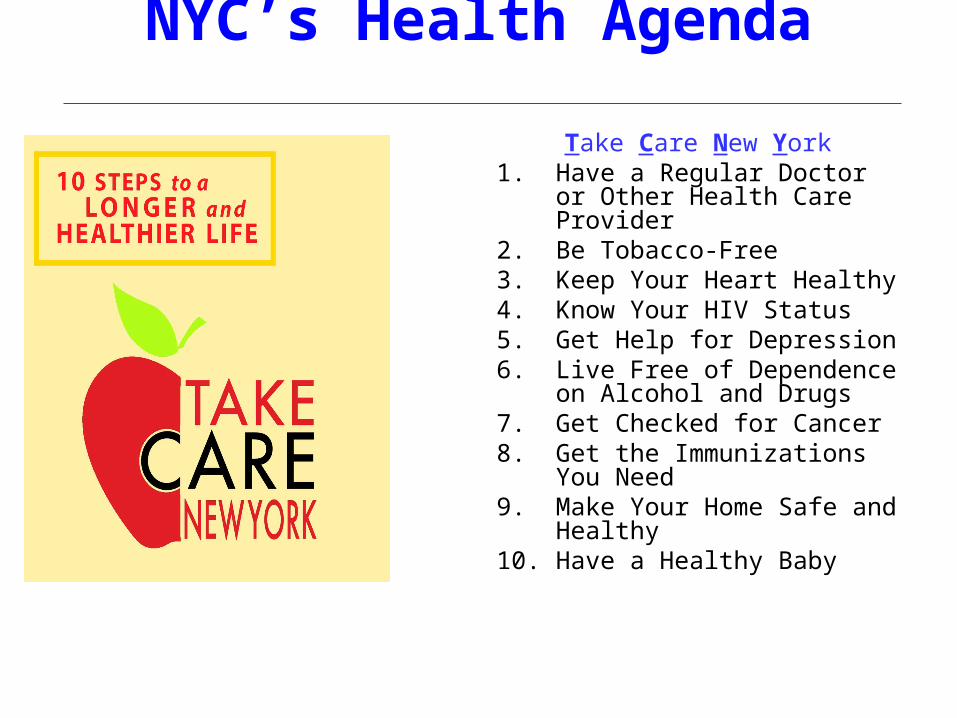
NYC’s Health Agenda
Take Care New York1. Have a Regular Doctor or
Other Health Care Provider2. Be Tobacco-Free3. Keep Your Heart Healthy4. Know Your HIV Status5. Get Help for Depression6. Live Free of Dependence on
Alcohol and Drugs7. Get Checked for Cancer8. Get the Immunizations You
Need9. Make Your Home Safe and
Healthy10. Have a Healthy Baby

Health Carethat Maximizes Health
HEALTH INFORMATION
SYSTEMS that are oriented toward
prevention
PAYMENTthat rewards disease prevention and the
effective management of chronic disease
REDESIGNED PRACTICE
WORKFLOWS
PATIENT ENGAGEMENTthat highlights prevention

Focused on Medically Underserved Patients in NYC
We have secured signed commitments from2,100 providers in 379 practices and at 480 sites
~ 1 new provider goes live on the EHR every day
Practices Live In Progress
Practice: IS ratio
Small Practices 247 96 86:1
Health Centers 18 13* 15:1
Hospital OPDs 3 2* 4:1
Sub-total 268 111
*Practice with sites both live and in implementation

5
BRINGING THE RESOURCES OF LARGE NETWORKS TO INDEPENDENT SMALL PRACTICES - A “VIRTUAL NETWORK”
Kaiser Permanente
NYC PCIP

PCIP, eCW & Practice team structurePCIP eCW Practices
Small LargeImplementation specialists
Project Managers, Business Analysts, SAMs
Providers, Office Managers
Project Management Team
Infrastructure team Technical Specialists IT Consultant IT Department
Interface Coordinator (PM, labs and CIR)
Lab Interface team Providers, Office Managers
IT Department, Ref/In-house lab
Quality Assurance Development team Providers, Office Managers
Site Administrators
Quality Improvement consultants, Super Users, Billing consultants
Trainers, Billing Specialist, Business Analyst
Providers, Office Managers, Biller
Quality Improvement Unit, Financial Dept.
Privacy and Security consultants
Development team Providers, Office Managers
IT Department, Legal
Development team Development team Providers, Office Managers
Super Users
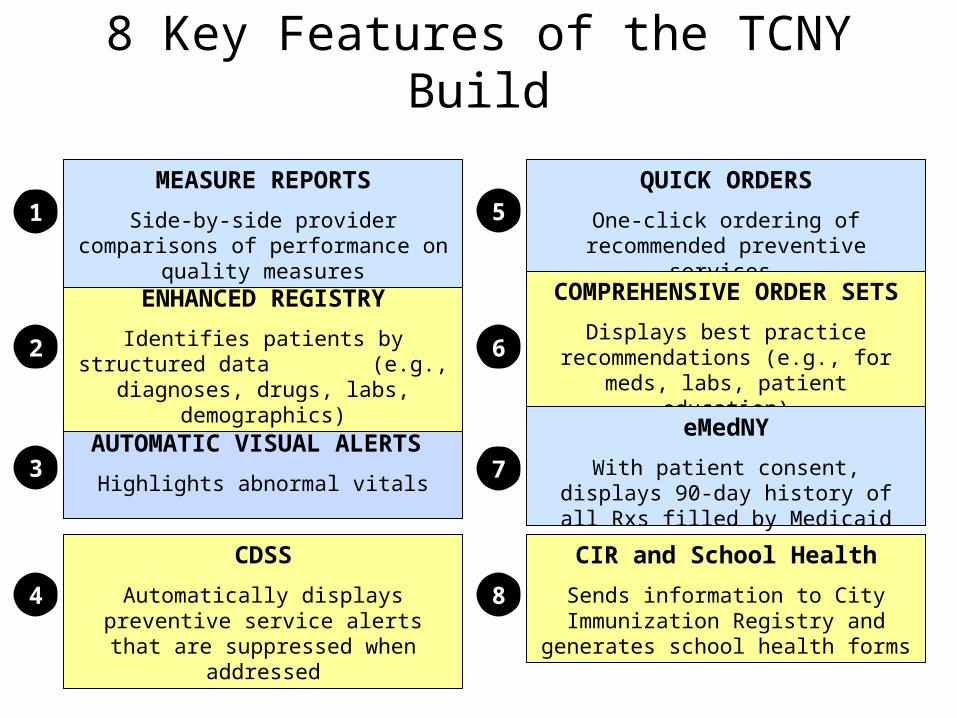
AUTOMATIC VISUAL ALERTS
Highlights abnormal vitals
CDSS
Automatically displays preventive service alerts that are suppressed when
addressed
QUICK ORDERS
One-click ordering of recommended preventive services
2
3
4
5
COMPREHENSIVE ORDER SETS
Displays best practice recommendations (e.g., for meds, labs,
patient education)
ENHANCED REGISTRY
Identifies patients by structured data (e.g., diagnoses, drugs, labs,
demographics)
eMedNY
With patient consent, displays 90-day history of all Rxs filled by Medicaid
patients
CIR and School Health
Sends information to City Immunization Registry and generates school health
forms
6
1
7
8
MEASURE REPORTS
Side-by-side provider comparisons of performance on quality measures
8 Key Features of the TCNY Build
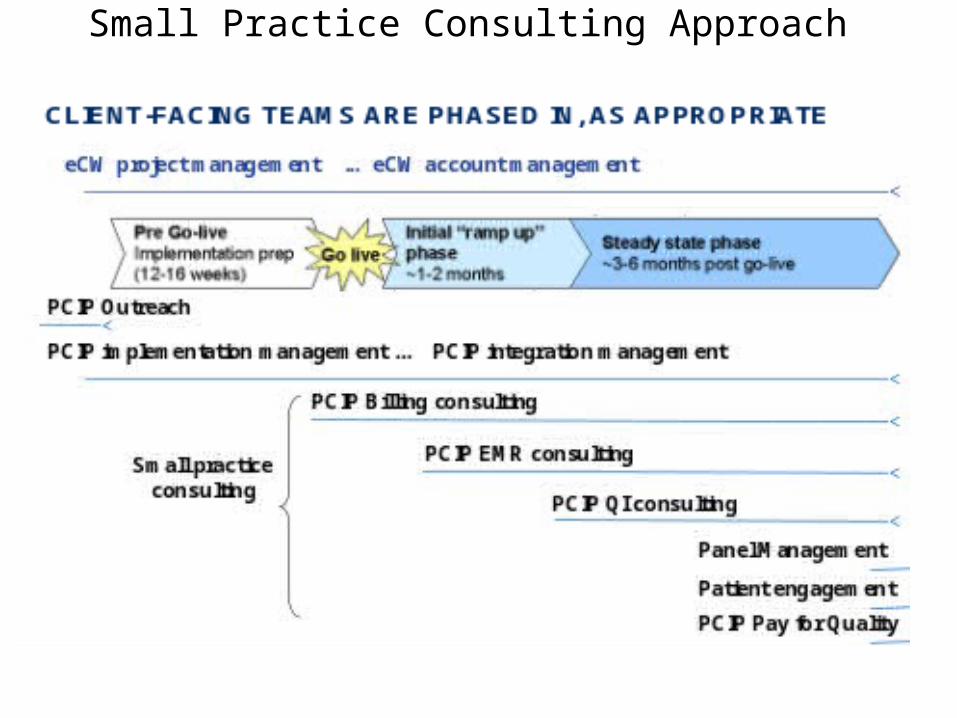
Small Practice Consulting Approach
9
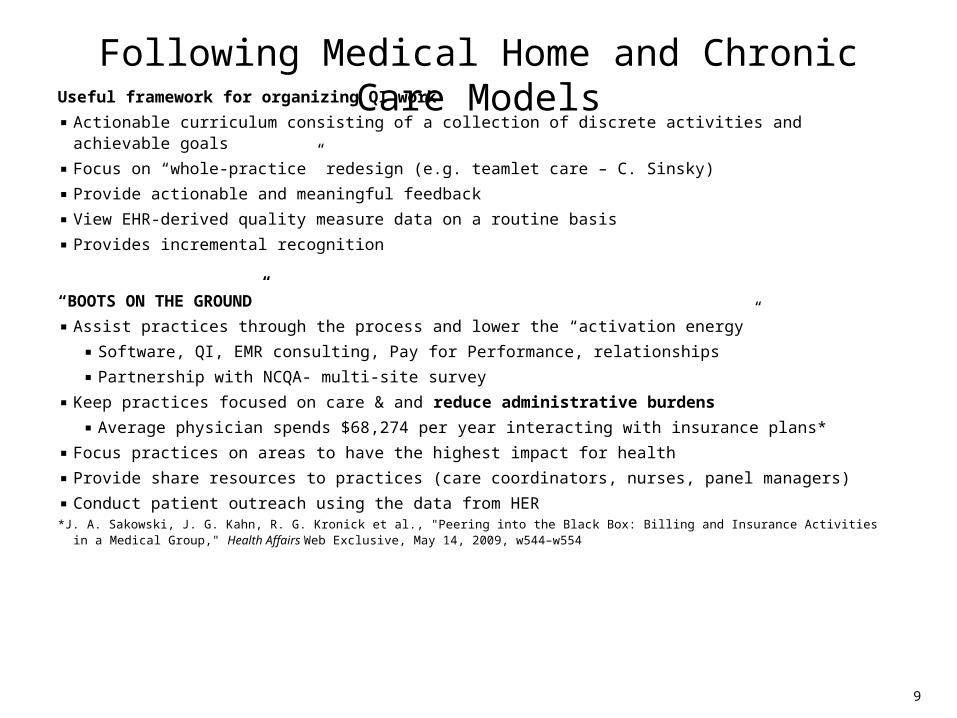
Following Medical Home and Chronic Care ModelsUseful framework for organizing QI work
▪ Actionable curriculum consisting of a collection of discrete activities and achievable goals
▪ Focus on “whole-practice” redesign (e.g. teamlet care – C. Sinsky)
▪ Provide actionable and meaningful feedback
▪ View EHR-derived quality measure data on a routine basis
▪ Provides incremental recognition
“BOOTS ON THE GROUND”
▪ Assist practices through the process and lower the “activation energy”
▪ Software, QI, EMR consulting, Pay for Performance, relationships
▪ Partnership with NCQA- multi-site survey
▪ Keep practices focused on care & and reduce administrative burdens
▪ Average physician spends $68,274 per year interacting with insurance plans*
▪ Focus practices on areas to have the highest impact for health
▪ Provide share resources to practices (care coordinators, nurses, panel managers)
▪ Conduct patient outreach using the data from HER*J. A. Sakowski, J. G. Kahn, R. G. Kronick et al., "Peering into the Black Box: Billing and Insurance Activities in a Medical Group," Health Affairs
Web Exclusive, May 14, 2009, w544–w554
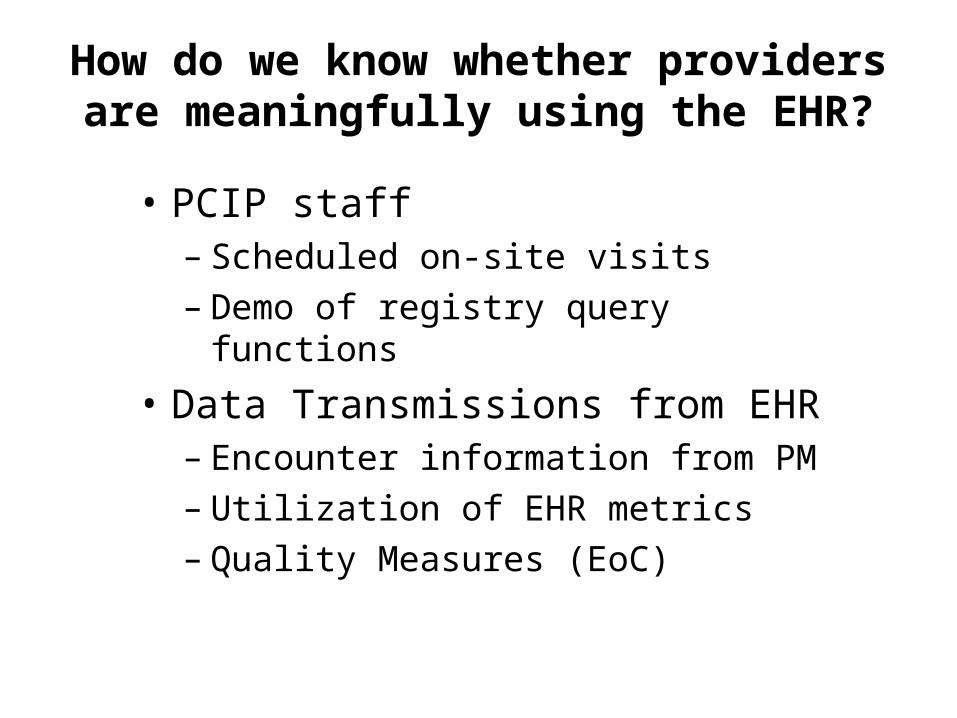
How do we know whether providers are meaningfully using the EHR?
• PCIP staff– Scheduled on-site visits– Demo of registry query functions
• Data Transmissions from EHR– Encounter information from PM– Utilization of EHR metrics– Quality Measures (EoC)

Average Encounters Per Month by Practice Size*
1st3rd
6th
Solo Providers (n = 61)
Two Providers (n = 18)
Three or more Providers (n = 13)
890 9471031
437 500544
233257 317
0
100
200
300
400
500
600
700
800
900
1000
1100
No
. o
f E
nco
un
ters
No. of Months on EHR
*Limited to small practices that have been on the EHR for 6 months or more. Data available on ~116 small practices
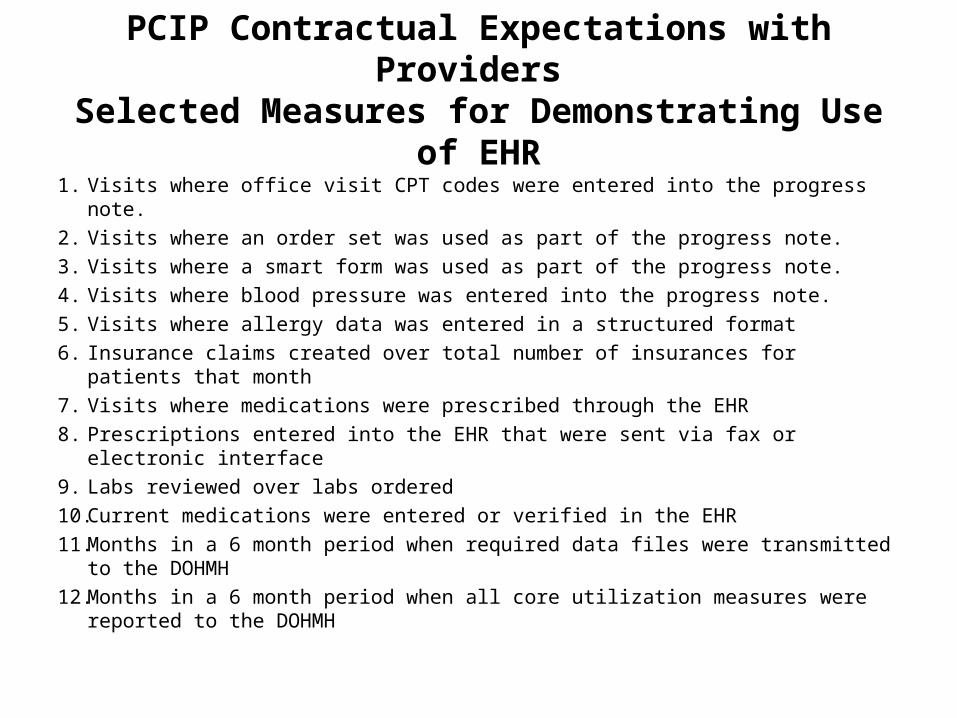
PCIP Contractual Expectations with Providers Selected Measures for Demonstrating Use of EHR
1. Visits where office visit CPT codes were entered into the progress note.
2. Visits where an order set was used as part of the progress note.
3. Visits where a smart form was used as part of the progress note.
4. Visits where blood pressure was entered into the progress note.
5. Visits where allergy data was entered in a structured format
6. Insurance claims created over total number of insurances for patients that month
7. Visits where medications were prescribed through the EHR
8. Prescriptions entered into the EHR that were sent via fax or electronic interface
9. Labs reviewed over labs ordered
10.Current medications were entered or verified in the EHR
11.Months in a 6 month period when required data files were transmitted to the DOHMH
12.Months in a 6 month period when all core utilization measures were reported to the DOHMH
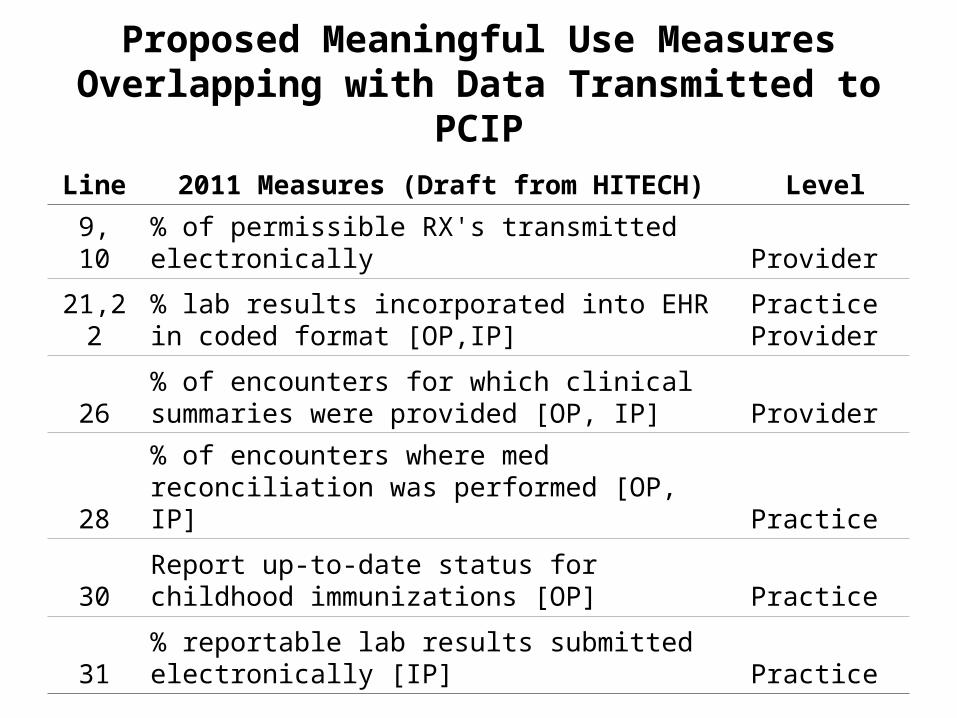
Proposed Meaningful Use MeasuresOverlapping with Data Transmitted to PCIP
Line 2011 Measures (Draft from HITECH) Level
9, 10 % of permissible RX's transmitted electronically Provider
21,22% lab results incorporated into EHR in coded format [OP,IP]
Practice Provider
26% of encounters for which clinical summaries were provided [OP, IP] Provider
28% of encounters where med reconciliation was performed [OP, IP] Practice
30Report up-to-date status for childhood immunizations [OP] Practice
31% reportable lab results submitted electronically [IP] Practice

EHR Utilization Transmitted to PCIP
• Snapshot of monthly activities• Number of practices with EHR use data
– 133 practices in July and August 2009– 85 have been using EHR for 8 months or longer
*limited to practices on the EHR for 8 months or longer
EHR use transmissions Total Jul* Total Aug*
Lab results transmitted 48,072 52,183
Lab results reviewed 56,731 63,882
Use of Medicaid State Rx Claims 2,422 2,560
Active patients 508,079 516,283

Proposed Meaningful Use MeasuresCurrently within PCIP Quality Measures
Line 2011 Measures (Draft from HITECH)
1 % diabetics with A1c under control [OP]
2 % of hypertensive patients with BP under control [OP]
3 % of patients with LDL under control [OP]
4 % of smokers offered smoking cessation counseling [OP, IP]
5,6 % of patients with recorded BMI [OP]
14 % of patients over 50 with annual colorectal cancer screenings [OP]
15 % of females over 50 receiving annual mammogram [OP]
16 % of patients at high-risk for cardiac events on aspirin prophylaxis [OP]
17 % of patients with current pneumovax [OP]
19 % eligible patients who received flu vaccine [OP]
Note: Quality Measures are collected at the provider level and stratified by insurance type. For some practices, stratified by race/ethnicity, though few providers are completing the field for race/ethnicity

Preliminary Data – Quality MeasuresMar08 to Feb09 Aug08 to Jul09
Measure Name N Mean (std) Sum* N Mean (std) Sum*
A1C control (< 7%) 12 53.7 (16.6) 492 44 47.2 (17.0) 2,498
Antithrombic Treatment 58 47.5 (21.2) 8,617 89 49.6 (21.3) 13,686
Asthma control (5-11 yrs) 3 87.8 (18.4) 49 4 89.0 (12.4) 104
Asthma control (12-17 yrs) 2 74.1 (16.4) 22 3 90.6 (8.4) 54
Asthma control (18-56 yrs) 2 45.7 (36.4) 12 11 61.9 (27.5) 105
Body Mass Index 86 61.6 (29.8) 83,029 110 70.4 (26.9) 126,842
BP Control ≤130/80 DM 56 23.9 (13.5) 4,922 78 30.7 (17.3) 7,358
BP control ≤140/90 HTN 63 48.6 (16.4) 12,305 85 51.9 (16.0) 18,480
BP Control ≤140/90 IVD 32 67.4 (16.3) 650 46 69.7 (20.1) 868
Cholesterol Control <100 gen pop 14 63.4 (22.5) 573 48 52.2 (21.3) 3,145
Cholesterol Control <100 IVD,DM 15 65.3 (18.5) 874 37 62.4 (15.7) 1,879
Breast cancer screening 16 4.5 (5.8) 6,346 51 5.2 (7.9) 22,034
Colorectal cancer screening 8 1.9 (1.3) 4,126 46 3.9 (6.2) 22,008
Influenza vaccine (over 50) 48 22.6 (18.4) 25,550 70 15.6 (15.2) 38,431
Pneumococcal vaccine 66 9.8 (13.0) 27,352 98 9.8 (13.5) 45,641
Smoking cessation intervention 45 19.0 (14.5) 4,798 79 29.7 (23.6) 8,253
*A population estimate was derived by summing across practice denominators per measure
Related Documents