Electronic copy available at: http://ssrn.com/abstract=1884827 1 The Political Economy of Natural Disaster Damage Published in: Global Environmental Change 24, 2014, 8-19 Eric Neumayer * London School of Economics, Department of Geography & Environment and Grantham Research Institute on Climate Change and the Environment Thomas Plümper University of Essex, Department of Government Fabian Barthel London School of Economics, Department of Geography & Environment and Grantham Research Institute on Climate Change and the Environment Original version: February 2012 Revised version: November 2012 Final version: March 2013 * Corresponding author (email: [email protected] ). The authors acknowledge financial and other support from the Munich Re Programme “Evaluating the Economics of Climate Risks & Opportunities in the Insurance Sector” at LSE. All views expressed are our own and do not rep- resent the views of Munich Re. We thank Eberhard Faust, Peter Höppe, Stéphane Hallegatte, David Grover as well as participants at various research seminars for many helpful comments. All errors are ours. The replication data and do-file will be made available upon publication at http://personal.lse.ac.uk/neumayer .

Welcome message from author
This document is posted to help you gain knowledge. Please leave a comment to let me know what you think about it! Share it to your friends and learn new things together.
Transcript

Electronic copy available at: http://ssrn.com/abstract=1884827
1
The Political Economy of Natural Disaster Damage
Published in: Global Environmental Change 24, 2014, 8-19
Eric Neumayer∗ London School of Economics, Department of Geography & Environment and
Grantham Research Institute on Climate Change and the Environment
Thomas Plümper University of Essex, Department of Government
Fabian Barthel
London School of Economics, Department of Geography & Environment and Grantham Research Institute on Climate Change and the Environment
Original version: February 2012 Revised version: November 2012
Final version: March 2013
∗ Corresponding author (email: [email protected]). The authors acknowledge financial and
other support from the Munich Re Programme “Evaluating the Economics of Climate Risks &
Opportunities in the Insurance Sector” at LSE. All views expressed are our own and do not rep-
resent the views of Munich Re. We thank Eberhard Faust, Peter Höppe, Stéphane Hallegatte,
David Grover as well as participants at various research seminars for many helpful comments.
All errors are ours. The replication data and do-file will be made available upon publication at
http://personal.lse.ac.uk/neumayer.

Electronic copy available at: http://ssrn.com/abstract=1884827
2
The Political Economy of Natural Disaster Damage
Abstract
Economic damage from natural hazards can sometimes be prevented and always miti-
gated. However, private individuals tend to underinvest in such measures due to prob-
lems of collective action, information asymmetry and myopic behavior. Governments,
which can in principle correct these market failures, themselves face incentives to un-
derinvest in costly disaster prevention policies and damage mitigation regulations.
Yet, disaster damage varies greatly across countries. We argue that rational actors will
invest more in trying to prevent and mitigate damage the larger a country’s propensity
to experience frequent and strong natural hazards. Accordingly, economic loss from
an actually occurring disaster will be smaller the larger a country’s disaster propensity
– holding everything else equal, such as hazard magnitude, the country’s total wealth
and per capita income. At the same time, damage is not entirely preventable and
smaller losses tend to be random. Disaster propensity will therefore have a larger
marginal effect on larger predicted damages than on smaller ones. We employ quan-
tile regression analysis in a global sample to test these predictions, focusing on the
three disaster types causing the vast majority of damage worldwide: earthquakes,
floods and tropical cyclones.

3
1. Introduction
With an estimated economic loss of between 82 billion (Knapp et al. 2005), 125 bil-
lion (Munich Re 2011) and 150 billion US$ (Burton and Hicks 2005), hurricane
Katrina used to be the costliest natural disaster ever. Then March 2011 came and with
it the earthquake and subsequent tsunami in Japan. Estimated costs of this disaster
have grown over time to 235 billion (World Bank, March 21) and finally to 309 bil-
lion US$ according to economic and fiscal policy minister Kaoru Yosano (Xinhua,
March 23). Whatever the final cost will be, the Tōhoku quake will prove to be the
most expensive natural disaster of all time.
Should it be surprising that the two costliest disasters were triggered by a hur-
ricane in the US and an earthquake in Japan? On one level, the answer is clearly no.
Common sense tells us that economic damage of natural disasters is higher the
wealthier the affected country and the US and Japan are among the wealthiest nations
in the world, though hurricane Katrina and the Tōhoku quake struck relatively poor
areas of these countries.
Still, we argue in this article that because the US and Japan are frequently hit
by strong tropical cyclones and quakes, the predicted resulting economic loss is sys-
tematically lower than if cyclones and quakes of similar magnitude struck countries
where such natural hazards generally tend to be less frequent and less strong. Natural
disaster propensity, i.e. the frequency and intensity of experiencing natural hazards of
a certain type, influences disaster damage because it determines the incentives faced
by governments and private actors in undertaking measures that will prevent or at
least mitigate damage in case hazard strikes. In this respect, the two costliest disasters
in human history are outliers. They were so costly because existing safety measures
were insufficient and failed, not because the US and Japanese governments irration-

4
ally abstained from taking any precautionary measures in the face of high tropical cy-
clone and earthquake propensity, respectively. In fact, a safety device that fails leads
to the worst case scenario: If individuals rely on the functioning of, say, a dam they
will accumulate more wealth in areas behind the dam than they would have in the ab-
sence of the dam, thereby exacerbating the disaster effects (Hallegatte 2012). Thus,
the absence of security measures reduces the cost of the worst disasters but increases
the cost of the average disaster.
In Keefer et al. (2011), we developed a theoretical argument predicting that
earthquake propensity reduces earthquake mortality. Here, we augment our analysis in
two important ways. First, we move the focus of the analysis from the death toll of
disasters to the economic toll. While there is a growing literature analyzing the deter-
minants of disaster mortality (e.g., Kahn 2005; Anbarci et al. 2005; Escaleras et al.
2007; Neumayer and Plümper 2007; Plümper and Neumayer 2009, Keefer et al. 2011)
as well as a nascent literature on the determinants of disaster damage (e.g. Mendel-
sohn and Saher 2011; Schumacher and Strobl 2011) we are the first to argue that the
political economy of natural disaster damage predicts systematically lower damage
for any given disaster in high disaster propensity countries.
Whether the effect of disaster propensity on mortality carries over to economic
damage is not clear a priori. For example, early warning systems, which can dramati-
cally reduce fatality for some disaster types if people are moved out of harm’s way in
time, are less effective for preventing economic loss as buildings and infrastructure
cannot be entirely moved out of harms way before hazards strike. One consequence is
that there are many more disaster events with recorded economic loss than with re-
corded loss of life. While previous studies had to rely on publicly available datasets,
which do not report damage estimates for most events, we can employ data from a
5
comprehensive database assembled by Munich Re, the biggest re-insurance company
in the world.
Second, we extend the analysis to other types of natural disasters, demonstrat-
ing that the systematic impact of disaster propensity is not restricted to earthquakes,
but carries over to the other two major disaster types, tropical cyclones and floods.
Together with earthquakes, they account for roughly 70 percent of total worldwide
economic damage from natural disasters.
In the next section, we develop a political economy theory of natural disaster
prevention and loss mitigation. We discuss the various reasons why private individu-
als underinvest in such measures. Governments can step in to overcome collective
action, information asymmetry and myopic behavior problems, but they also suffer
from similar incentives to underprovide disaster prevention and loss mitigation meas-
ures. We argue that private and public incentives are a function of disaster propensity
(the expected frequency and magnitude with which hazards strike). In section 3, we
describe our empirical research design in some detail and report results in section 4
from our empirical analysis. Section 5 conducts two important sets of robustness tests.
Section 6 concludes.
2. Natural Disaster Prevention and Damage Mitigation
Modern science has identified the causes of natural hazards and how to prevent or
mitigate their consequences. Hazards are events triggered by natural forces, but they
only turn into disasters if people are exposed to the hazard and are not resilient to
fully absorbing the impact without damage to life or property (Schwab et al. 2007;
Paul 2011).
Three major, commonly accepted, factors determine disaster damage. First and
foremost, the size of economic loss depends on the magnitude of the natural hazard
6
event triggering the disaster. All other things equal, a stronger earthquake, for exam-
ple, will cause more damage than a more moderate one and below a certain threshold
a quake can hardly be felt, let alone cause much damage. Second, the economic toll is
higher the wealthier the area hit by the natural hazard (Pielke et al. 1999; Neumayer
and Barthel 2012; Bouwer 2011). While human beings cannot prevent natural hazards
or reduce their strengths, they massively influence the level of wealth exposed to the
forces of nature. There is also a risk that anthropogenic greenhouse gas emissions
might increase the occurrence or the strength of weather-related natural hazard events
(Min et al. 2011; Pall et al. 2011). Of course, the likely geographic location of disas-
ters is more easily predictable for some disaster types (e.g., volcanoes) than others
(e.g., earthquakes) and for some hardly at all (e.g., hail storm). However, people ac-
cumulate wealth in areas known to be prone to, say, flooding or hurricane landfall or
known to be near active tectonic plate boundaries. And third, people can either en-
tirely prevent damage with appropriate protection measures or at least mitigate dam-
age by increasing the resistance of the exposed wealth stock to the hazard impact.
Better constructed buildings and infrastructure, even if they were not explicitly built
with natural hazards in mind, can more easily withstand ground shaking and high-
speed winds, for example, than more poorly constructed ones.
A theory of disaster damage, however, has to go beyond this functionalist log-
ic and also explain why some private individuals and governments specifically invest
in disaster prevention and damage mitigation while others do not or not as much. We
argue that investment incentives depend on the probability and expected magnitude of
natural hazards, what we call disaster propensity. Where propensity is high, individu-
als have higher incentives to privately invest in prevention and mitigation measures
and policy-makers are more likely to enact and enforce such measures than where

7
propensity is low. We start with private individuals (both households and profit-
maximizing firms). We argue that due to market failures and due to the expectation of
public transfers after disaster, private individuals tend to underinvest in disaster pre-
vention and damage mitigation, even if disaster propensity is large, but more so when
it is low. We then turn to governments, which can intervene to correct these market
failures. Unfortunately, government intervention and investment in disaster preven-
tion and mitigation might induce individuals in turn to lower their own investments.
2.1 Private Underinvestment in Disaster Prevention and Loss Mitigation
Private individuals can adopt two main strategies for reducing expected disaster costs.
They can refrain from settling or economically operating in high-risk areas or they
can construct buildings and infrastructure in a way as to minimize the probability that
they will become damaged if and when a hazard strikes. Neither strategy is particular-
ly popular. High-risk areas such as coastlines or flood plains are often places that pro-
vide large economic and amenity values to those settling or operating there – so long
as nothing happens. Strong natural hazards tend to be rare, and the time of their occur-
rence as well as their exact location essentially unpredictable, prompting individuals
to neglect or ignore the risk. For example, no one knows when exactly an earthquake
will strike or with what magnitude or where its epicenter will be (Hough 2010).
The second strategy is costly and thus unpopular, too. Earthquake-proof con-
structions increase building costs by at least 10 percent (Kenny 2009), solidly con-
structed dwellings that can withstand high top wind speeds are more expensive than
light-weight wood constructions that can easily be blown away, and so on. Individual
solutions to floods are even more expensive, which is why the Dutch water boards,
some of which stem from the 13th century, can be regarded as one of the earliest pub-
licly provided goods. Compared to the opportunity cost of not settling or operating in

8
high-risk areas, the costs of disaster-proofing settlements are typically smaller. Yet,
individuals often ignore potential impacts that come with very small probability, un-
known size and unknown timing (Camerer and Kunreuther 1989; Kunreuther 1996)
and therefore fail to sufficiently protect their property against natural hazards.
Even if individuals are willing to invest in disaster-proofing buildings, they
face the additional uncertainty that whether a building will in fact be able to withstand
the full force of a natural hazard is unknown even to the owner. It is exacting on the
prospective owner to supervise the construction process in order to verify the quality
of the materials used and of the construction itself, while disaster-proofness is diffi-
cult to verify after construction. These information asymmetries generate disincen-
tives for voluntary private investment in disaster-proof construction. As Akerlof
(1970) has argued, an information gap between seller and buyer leads to a situation in
which sellers do not sell high quality products and buyers assume that goods sold on
this market are of low standard. Applied to the disaster-proofness of buildings (An-
barci et al. 2005), this means investors will find it difficult to get a higher price for
high-quality disaster-proof constructions, which in turn discourages investment in
such constructions in the first place.
To make things worse, even constructors do not fully know the exact hazard
strength up to which a construction can withstand the hazard’s destructive force. For
those constructing a building and willing to invest in disaster-proofness, the worst
case scenario is to invest marginally too little, in which case the costs of construction
rise, but the building still does not withstand the hazard if it occurs. To be on the safe
side, investors would thus have to invest significantly more than the highest expected
level of hazard strength requires. This renders the investment even more expensive
than on average necessary.
9
Another reason why private actors tend to underinvest in disaster prevention
and damage mitigation is that they can cover themselves against the low-probability
risk of natural disaster loss by purchasing insurance. Certain disaster types will be
covered by general insurance policies, for others individuals or businesses need to buy
special policies. However, sometimes insurance companies outright refuse to sell spe-
cific insurance policies in particularly high risk areas or set premia so high that few
wish to buy them. Even if private individuals buy insurance, this does not reduce the
total economic toll of natural disasters, unless the insurance policies are tied to certain
requirements that can prevent or mitigate natural disaster loss and that the insured
need to demonstrate to have enacted in order to receive pay-out. Often, the exact op-
posite may be the case: insured individuals exert less effort at pre-emptively reducing
natural disaster loss in the knowledge that they will be insured in the event the hazard
strikes – a phenomenon well-known as moral hazard. A similar problem arises if gov-
ernments compensate disaster victims for their losses. In fact, governments amplify
the moral hazard problem by creating a so-called charity hazard problem (Raschky
and Weck-Hannemann 2007).
Also, buildings and infrastructure can be made to resist the forces of some
types of natural hazards such as earthquakes and hurricanes, but not others. It would
be prohibitively expensive for individuals to build flood-proof or fire-proof construc-
tions. No construction can withstand the lava flow from the eruption of a volcano. For
these disaster types, either individuals resist the temptation to settle and economically
operate in high-risk areas, which as argued above is unlikely, or the government needs
to step in with regulations and other policies preventing or reducing settlement or or-
ganizing joint and collective investments such as dykes or flood management schemes
10
protecting buildings and infrastructure that cannot be rendered disaster-proof indi-
vidually.
Finally, private individuals will underinvest in disaster prevention and mitiga-
tion policies because some of the economic damage in the form of indirect losses will
be felt not by individuals directly affected, but by others in the wider sub-national re-
gion or even the entire country. Large-scale disasters cause significant collateral dam-
age and macroeconomic distortions that impact the wider population (Lall and
Deichmann 2010; Hallegatte and Przysluski 2011). Only governments can internalize
these costs that private individuals will ignore and we now turn to the role of public
policy.
2.2 Underprovision of Public Disaster Prevention and Damage Mitigation Policies
Governments exert a strong influence on disaster costs. To start with, many buildings
and the vast majority of a country’s infrastructure such as roads, ports, airports, power
lines etc. are built for public ownership, in full or in part. Governments can thus di-
rectly impact the quality of these constructions. But the influence of governments
reaches much further (Paul 2011). With private investment into disaster prevention
and loss mitigation riddled by market failures caused by collective action problems,
information asymmetries and myopic behavior of economic actors, governments
could step in to correct these failures. They can discourage or even ban settlement or
business operations in particularly high-risk areas. They can pass and strictly enforce
disaster-proof building standards (Kenny 2009; World Bank and United Nations
2010). They can overcome the collective action problem and provide public goods in
the form of dam constructions, flood management and warning schemes (Carsell et al.
2004), fire fighting facilities and the like.
11
Not unlike their citizens, however, governments have incentives to underin-
vest in such policies. They face the following dilemma. On the one hand, they can en-
gage in transfer payments for the benefit of pivotal groups with political influence or
in projects which promise to increase short-term political support, but are entirely ir-
relevant for preventing or mitigating disaster damage. On the other hand, they can in-
vest in prevention and mitigation measures, which will only increase political support
in the relatively unlikely event of a severe disaster and is costly both in terms of direct
and opportunity costs. Not surprisingly, many governments prefer short-term political
support. This is consistent with the findings of Gasper and Reeves (2011) who show
that citizens pay greater attention to post-disaster policies than to pre-disaster preven-
tion and mitigation measures. Governments, though they perfectly know that a certain
amount of long-term investments in disaster prevention and mitigation is in the social
interest, decide in favor of their short-term incentives and invest too little. Illustrative
of such incentives is that no one seems to have followed the example of the mayor of
the small city of Fudai on the North-East coast of Japan who in the 1960s built a six-
teen meter high concrete wall against tsunami waves, which protected Fudai’s 3000
inhabitants from the tsunami waves following the March 2011 earthquake. In his
days, mayor Wamura was accused of and ridiculed for wasting public money, even
though the construction was greatly facilitated by mountains on both sides of the dam
such that the construction merely needed to close a gap between mountains (Daily
Mail 2011). Other villages in the vicinity built much smaller dams, which were sim-
ply washed over by the March 2011 tsunami.
Likewise, in the knowledge that discouraging or banning settlement and busi-
ness operations in high-risk areas is politically unpopular unless a natural disaster oc-
curs, governments will under-engage in such policies. The same applies for passing

12
and enforcing building standards (Healy and Malhotra 2009), which will be perceived
as an additional burden on private individuals that serves little purpose in the absence
of disaster. Yet, governments clearly vary in the extent to which they invest in preven-
tion and mitigation measures and our aim is to understand why.
We argue that these incentives are largely influenced by the likelihood and ex-
pected strength of potential future hazard events. Though neither probability nor mag-
nitude can be known with certainty, areas differ in their propensity to experience fre-
quent and strong natural hazards. For simplicity, we call this disaster propensity even
though it is strictly speaking hazard propensity or the propensity to experience poten-
tial disasters that matters. Disaster propensity can be approximately known by gov-
ernments and the public either via receiving expert advice from scientists or simply by
inference from a country’s past history of events. Disaster propensity in turn also af-
fects tax-payers’ willingness to pay for costly prevention and mitigation measures im-
plemented by the government. Thus, the degree to which a government loses political
support from voters and organized interests depends on whether citizens perceive
such measures as responsible government action or wasteful over-reaction. Govern-
ments that invest more than citizens are willing to accept lose support. Loss of support
amongst citizens is more important for democratic countries than for autocracies, in
which the support amongst a small ruling elite matters more. However, even autocra-
cies cannot entirely ignore citizen support and in Keefer et al. (2011) we explore the
conditioning effect of political regime type and other governance aspects on earth-
quake mortality. We leave an exploration of such heterogeneity across political re-
gimes in their response to natural hazard risk to future research.
In sum, when the expected damage of a potential disaster increases, govern-
ments are incentivized to invest more in disaster prevention and damage mitigation.

13
Put differently, a high disaster propensity lowers the political costs to governments of
investing in prevention and mitigation measures, while a low disaster propensity in-
creases these costs. Governments in countries with a high disaster propensity will thus
invest more in such policies than governments in countries with a low disaster pro-
pensity.
Does this mean that governments in high propensity countries can entirely
prevent disaster damage? This is unlikely to be the case for most hazards. Quake-
proofing buildings, for example, can avert their collapse, but cannot entirely prevent
property damage within buildings from the shaking of the ground transmitted into the
shaking of buildings. Infrastructure and buildings that withstand collapse may still be
damaged as the quake causes cracks and other deficiencies that require repair. Worse
still, earthquakes can also trigger tsunamis, landslides and fires, which are much more
difficult to mitigate, let alone prevent. It is telling that a significant portion of the
damage of Japan’s two costliest earthquakes – the 1995 Kobe quake and the 2011 Tō-
hoku quake – was caused not by the ground shaking itself, but by the ensuing fire and
tsunami waves, respectively. Likewise, better constructed buildings and infrastructure
can escape collapse from very high wind speeds, but windows may still be smashed if
a tropical cyclone passes through. Some damage will be caused by debris dragged
along by the storm, while the associated rainfall may cause local flooding. In the
worst case scenario (e.g. hurricane Katrina), the strong winds cause a storm surge that
breaks the protective dam system. Flood damage can more easily be entirely pre-
vented with a proper system of dams and dykes in place. But it is very difficult to pre-
vent local flooding damage everywhere altogether. Such damage can occur because
the rainfall in an area exceeds the intake capacity of the ground and, where existent,

14
of the drainage system or because strong rainfall lets creeks and rivers swell and even-
tually leave their streambed where dams and dykes are not existent or are inadequate.
Two conclusions follow from our reasoning. First, policies enacted by gov-
ernments in high disaster propensity countries typically cannot fully prevent natural
disaster damage. Small-scale damage is often unavoidable and essentially random.
For example, the average estimated damage of minor earthquakes – smaller than 6.0
on the Richter scale – in the low quake propensity countries of Spain (.19 million
US$), Germany (10.6 million US$) and the UK (16.2 million US$) varies for no ap-
parent reason and is not much different from the average damage of 3.9 million US$
caused by minor quakes in Japan with its extreme quake propensity (all values de-
flated to 2009 prices). Where disaster preparedness should have its strongest effect is
in the mitigation and prevention of large-scale damage. Japan is plagued by frequent
large quakes. Yet only eleven quakes over the period 1980 to 2009 inflicted damage
in excess of 500 million US$, only five in excess of one billion US$ and only two in
excess of 30 billion US$. Compare this to Italy with its much lower quake propensity,
where a rare earthquake of magnitude 6.3 on the Richter scale struck close to the town
of L’Aquila in Central Italy in April 2009, leaving almost 300 people dead and caus-
ing an estimated damage of 2.5 billion US$. In contrast, the worst damage any quake
of magnitude 6.3 (or lower) ever caused in Japan was 586 million US$.
The second conclusion following from our reasoning is that while govern-
ments in high disaster propensity countries have an incentive to enact policies that can
mitigate large-scale damage for most of the time, they also have a higher likelihood of
experiencing an outlier disaster event with extreme damage. Exactly because high
disaster propensity means that the country is frequently hit by strong natural hazards,
the likelihood increases that one of these events exceeds the disaster preparedness ca-

15
pacity that otherwise prevents large-scale damage. Hurricane Katrina caused damage
that is about four times larger than the next most damaging hurricane during the 1980
to 2011 period and at least one order of magnitude larger than average damage for
similarly strong tropical cyclones. The 1995 Kobe quake and the 2011 Tōhoku quake
caused about three and ten times higher damage, respectively, than the third most
damaging quake from 2004 in Chūetsu as well as damage far in excess of average
damage for even large Japanese quakes. Largely reduced damage from strong disaster
events can thus go hand in hand with extreme damage from extreme outlier events.
3. Research Design
In this section, we test the hypothesis that follows from our discussion of the political
economy of natural disaster damage, namely that countries with higher disaster pro-
pensity experience lower damage for a hazard of any given strength and that the effect
of disaster propensity is more pronounced at the upper end of the disaster damage dis-
tribution. This renders ordinary least squares (OLS), the standard workhorse of econ-
ometric analysis, ill-suited for two reasons. First, it is vulnerable to the existence of
outliers, which as argued above are bound to exist. Second, it fails to take into account
that disaster propensity is likely to have stronger effects at the top end of the condi-
tional disaster damage distribution than at its lower end. In contrast, quantile regres-
sion, our chosen estimation technique, is more robust to the presence of outliers and
allows us to go “beyond models for the conditional mean” (Koenker and Hallock
2001: 151) by estimating different effects of the explanatory variables at different
points of the conditional disaster damage distribution, thus providing a fuller picture
of the impact of the explanatory variables than just the conditional mean given by
OLS. It is also more suitable for heteroskedastic data (Cameron and Trivedi 2009:
16
205) and inspection of residuals as well as formal tests suggest the presence of het-
eroskedasticity in our data.
We use quantile regression with bootstrapped standard errors with 100 sam-
pling repetitions. We report detailed results for five quantiles, namely the .05, .25, .5
(median), .75 and .95 quantiles, but for the effect of disaster propensity we also pre-
sent graphs, which show its changing effect as one continuously moves in .05 inter-
vals from the .05 to the .95 quantile. A quantile (or percentile) q is defined such that q
proportions of the values of the dependent variable fall below and (1-q) proportions
fall above. Quantile regression works similarly to OLS. The estimation formulas are
somewhat complex involving linear programming techniques (Cameron and Trivedi
2009: 206-207), but in essence rather than minimizing the sum of squared residuals as
with OLS, one minimizes the sum of equally weighted absolute residuals for the me-
dian quantile and the sum of asymmetrically weighted absolute residuals for all other
quantiles (Koenker and Hallock 2005: 145).
Analysis of disaster damage is hampered by the fact that none of the publicly
available disaster datasets provide comprehensive economic loss estimates. This pa-
per’s analysis benefits from the authors having been granted access to a unique high-
quality dataset compiled by Munich Re (2011), the biggest re-insurance company in
the world. The construction and maintenance of the dataset is described in detail in
Wirtz et al. (2012) and Kron et al. (2012). Economic loss consists predominantly of
damage to buildings and the physical infrastructure, but also of production losses if
economic operations are interrupted as a result of the disaster. Even price increases as
a consequence of demand surges in the wake of large disasters are included. What is
not included, however, is the loss of life and no measures of the statistical value of life
lost enters the economic damage estimates.

17
The data are of course not perfect. For example, smaller disasters are underre-
ported especially in the early periods. Likewise, data on disasters in developing coun-
tries appear to be less reliable than data on events in developed countries. Still, with
more than 20,000 entries of country years with recorded disaster damage over the pe-
riod 1980 to 2009, it is by far the most comprehensive existing global database on
natural disaster damage. The database reaches further back in time, but Munich Re
acknowledges that before 1980 the data become increasingly unreliable and incom-
plete.
In order to maintain the database, several analysts gather information about
natural disaster events. Information on economic losses is collected from a variety of
sources including government representatives, relief organizations and research facili-
ties, but also based on information of insurance associations and insurance services as
well as on claims made by Munich Re’s customers. Initial reports on losses, which are
usually available in the immediate aftermath of a disaster, are often highly unreliable.
To deal with these problems, data are updated continuously as more accurate informa-
tion becomes available, which might be even years after the disaster event.
Munich Re groups natural disasters into one of 24 types. These are avalanche,
blizzard/snow storm, drought, flash flood, cold wave/frost, general flood, ground
shaking/earthquake, hail storm, heat wave, lightning, landslide, local windstorm,
sandstorm, storm surge, subsidence, tropical cyclone, tempest/severe storm, tornado,
tsunami, rockfall, volcano, winter damage, wildfire, winter storm. We study the three
types that cause the largest economic damage: earthquakes, tropical cyclones and
general floods. General floods are distinguished from and do not include flash floods,
storm surges and tsunami flooding (Kron et al. 2012: 544-545). General floods are
typically caused by intense and prolonged rain affecting a large area or by snowmelt.

18
Flash floods instead refer to highly localized events caused by very heavy but geo-
graphically concentrated rainfall temporarily limited to at maximum one day. Storm
surges are caused by high winds as part of winter storms or tropical cyclones, while
most tsunamis are caused by earthquakes.
Natural disasters can thus involve multiple hazard events. Tropical cyclones
for example may also cause flooding and storm surges. Earthquakes may also cause
tsunamis and fires. Where multiple hazard events are involved, it is typically impossi-
ble to attribute economic losses to individual hazards. As a general rule (see Kron et
al. 2012: 538-540 and 544-545 for details), the losses from a tsunami triggered by an
earthquake are attributed to the earthquake event. So, for example, the March 2011
natural disaster in Japan, which is not yet in our dataset, would enter as quake dam-
age. For all disasters involving named tropical cyclones, the entire damage is attrib-
uted to the tropical cyclone. For all disasters involving both general floods and
storms, the loss is generally attributed to the storm events rather than floods, unless
there is information that water damage dominates damage caused by wind.
Together, earthquakes, tropical cyclones and general floods account for
roughly 70 percent of total disaster damage in the Munich Re dataset, with the rest
scattered over the remaining 21 types. Of the estimated sum of disaster damage
worldwide over the period 1980 to 2009 of more than 2.8 trillion US$ (in prices of
2009), 28.8 percent were caused by general floods, 22.8 percent by tropical cyclones
and 17.6 percent by earthquakes. The average damage is 212, 363 and 224 million
US$, respectively, but damage is highly skewed with most disasters causing relatively
small damage and relatively few disasters causing relatively large damage. Of the al-
most 3,900 country years with general flood events, 448 caused damage above 100
million US$ and 98 resulted in damage above 1 billion US$. For the roughly 1,800
19
country years with tropical cyclone and the 2,200 country years with quake events,
the relevant numbers are, respectively, 394 and 101 for cyclones and 117 and 40 for
quakes. That there are more general flood than tropical cyclone and earthquake events
is entirely consistent with many more countries and many more regions within coun-
tries exposed to flood hazards than exposed to earthquake or tropical cyclone hazards
(World Bank 2005: 38).
To appropriately test the predictions derived from our theory, we require
measures of hazard strength or magnitude, both in order to control for strength itself
but also to construct a proxy for the latent disaster propensity variable (see the discus-
sion below). The Munich Re database contains Richter scale and top wind speed in-
formation for the vast majority of quake and tropical cyclone events. It holds no com-
prehensive and consistent information on precipitation for floods. However, because
almost without exception the geographical location of the disaster center is given by
degree latitude and longitude, we combine information from the NatCatSERVICE
database with precipitation measures taken from Willmott and Matsuura (2011). We
acknowledge that the Richter scale is not the only relevant magnitude variable for
quakes (see Keefer et al. 2011), nor are top wind speed and precipitation the only rel-
evant magnitude variables for tropical cyclones and floods. However, these measures
capture the main destructive forces of the respective hazard events and offer the best
available proxy since other relevant magnitude variables (such as focal depth for
quakes, minimum air pressure for tropical cyclones or the melting of snow in moun-
tains feeding into upstream rivers for floods) are either not reported for the majority of
relevant disaster events or entirely unavailable.
We aggregate the data from the individual disaster event to the country-year
level, principally because with a string of events of a particular disaster type the des-
20
ignation of economic loss to each single event is somewhat arbitrary and does not of-
fer much additional information. For 56.4 percent of our country-years only one event
of a specific disaster type had occurred. To arrive at country-year values in years with
more than one event of a specific disaster type in a given country, we use the sum of
values in a year in a country. Our results are robust toward estimating the same esti-
mation models at the individual disaster event level, which produces results that are
statistically indistinguishable from our results at the country year level.
We transform the raw hazard magnitude variables in accordance with what
can be known about their likely non-linear impact on economic loss. Given the Rich-
ter scale is a base-32 logarithmic scale in terms of the amount of energy set free,
which implies that small increases on the scale result in very large increases in un-
leashed energy (our proxy for hazard strength), we transform the Richter scale magni-
tude according to the formula 32^(Richter magnitude) so that the transformed scale
measures the energy actually unleashed by the earthquake. Wind speed is typically
seen as causing damage as a function of its cubed magnitude (Emanuel 2005; Schmidt
et al. 2009). Nordhaus (2010) finds that a 9th-power transformation of top wind speed
fits US hurricane damage data best, while Bouwer and Botzen (2011) find a best fit
for an 8th-power transformation. Both sets of authors acknowledge that their estimated
best fit power transformations are well above what other studies suggest. We thus take
the cube of top wind speeds, i.e. the highest or maximum wind speed reached during
the event, as our measure. For precipitation we know of no suggestions on how to ac-
count for any potential non-linearity. Monthly data on precipitation on a 0.5 degree
latitude and 0.5 degree longitude spatial resolution is provided by Willmott and Ma-
tsuura (2011) and we use the absolute precipitation during the flood disaster period
from the nearest measurement point to the disaster centre, implicitly assuming that
21
flood damage is a linear function of precipitation. Ideally, one would like to have data
on daily rainfall, but such information is not available. Instead, we attribute monthly
rainfall equally across days; longer lasting floods are attributed more rainfall by sum-
ming up “daily” rainfall over the period of the disaster.
Compared to the transformed Richter scale as proxy for quake hazard strength,
our hazard magnitude variables for tropical cyclones and floods suffer from larger
measurement error. What matters for tropical cyclones are wind speeds sustained over
some pre-defined short time period rather than top wind speeds as such, which might
occur for only a few seconds without being sustained for longer. Unfortunately, the
database only records top wind speeds, which will be correlated with maximum sus-
tained wind speeds, but less than perfectly so. For floods, our precipitation measure
similarly measures true hazard magnitude only with considerable, probably even lar-
ger, measurement error. Floods need not be exclusively caused by local rainfall. Ra-
ther, they can be caused by rainfall or the melting of snow in far-away regions where
the excess run-off water is carried by rivers downstream causing a flood there. Unfor-
tunately, we have no way of capturing for each of the 1662 general flood events in our
sample the relevant area from which the excess water originates. Extending the num-
ber of relevant measurement points away from the nearest one to the disaster center
would not only increase the likelihood that we capture potentially relevant rainfall in
remote places, but also the likelihood that we capture irrelevant rainfall that, for to-
pographical reasons, could never reach the area affected by the disaster.
We use the same sources of information for constructing our central explana-
tory variable disaster propensity – a latent variable. To approximate disaster propen-
sity, we sum over the entire period 1980 to 2008 all the transformed hazard magni-
tudes separately for each of the three specific disaster events occurring in a country.
22
This variable has two desirable properties: it is systematically higher the more fre-
quent a country experiences hazards of a certain type and the stronger these hazard
events are. For example, the proxy for earthquake propensity takes very high values
for Japan and Indonesia given very large quake activity, is high for Iran, medium for
New Zealand and low for Germany or Spain with their low quake activity. It might
appear problematic to use a value that covers the entire estimation period when this
value can only be truly known to individuals and governments at the very end of the
period. However, note that these measures proxy for latent and next to time-invariant
disaster propensity of countries, such that the value from 1980 to 2008, for which we
have data, should be very highly correlated with the values from, say, 1900 to 1979 or
from the entire 19th century, for which we do not have data.
As control variables we include a country’s total gross domestic product
(GDP), with data taken from World Bank (2010). All other things equal, countries of
larger economic size will have more wealth potentially destroyable and are therefore
expected to experience larger losses. Similarly, economic growth leads to a rise in po-
tentially destroyable wealth and disaster losses may even grow faster than wealth
(Hallegatte 2011). We have no information on wealth as such, but GDP can function
as a proxy. While wealth is a stock and GDP is a flow, wealth and income (GDP) are
highly correlated with each other. From the same source comes information on a
country’s income per capita. There are reasons why richer countries should experi-
ence lower damages. Buildings and infrastructure tend to be better constructed in
richer countries and thus more likely to withstand the forces of natural hazards than in
poorer countries. Also, disaster prevention and damage mitigation measures are costly
and both private actors and governments should find it easier to finance such meas-
ures in richer than in poorer countries, where economic opportunity cost imposes a

23
more binding constraint. In economic terminology, disaster prevention and damage
mitigation should be normal goods, that is, goods with a positive per capita income
elasticity of demand. At the same time, however, richer countries also accumulate
more capital seemingly protected by such policies, which means they have higher
capital at risk and thus higher economic losses in case of disasters that are not fully
prevented (Hallegatte 2011, 2012) The effect of per capita income is therefore am-
biguous, given our proxy for wealth will necessarily fail to fully capture the value of
capital at risk. Schumacher and Strobl (2011) report non-linear effects of per capita
income on damage for earthquakes, but not for tropical cyclones or floods. We find no
evidence for non-linear effects for any of our three disaster types and therefore only
include the “linear” term.
The sample size depends on whether an economic loss of a specific disaster
type is recorded for a country year in the Munich Re database. Country years with no
known damage are excluded from the sample. This presupposes that the database cap-
tures all relevant natural hazard events of quakes, tropical cyclones and floods – an
assumption that can be questioned on various grounds: some hazard events will not
have caused damage because of successful prevention measures, smaller disasters
from the early years of data collection might have escaped Munich Re’s attention, and
disaster events in the developing world are likely to be underreported. Starting with
the latter two factors, they provide yet another reason for out quantile analysis: at
higher quantiles of the conditional damage distribution under-reporting is not a prob-
lem since high damage events will not have escaped Munich Re’s attention or are un-
reported. As concerns the problem that some hazard events will not have caused dam-
age, as argued in the previous section, in the vast majority of cases hazard events are
bound to cause some positive damage despite the best mitigation measures in place.
24
This will be particularly true for quakes and tropical cyclones. For floods, on the other
hand, successful measures, e.g. in the form of dams, might sometimes prevent any
recorded damage, such that the estimation results for floods might suffer from selec-
tion bias: some country years of damage zero should be in the sample as countries
successfully withstood the hazard event, but are not included in the sample since no
economic loss occurred. The sample selection makes it less likely that we find empiri-
cal support for our hypothesis under the assumption that countries with high propen-
sity are more likely to enact policies that can entirely prevent damage for some hazard
events. The relative under-representation of smaller disasters in the early periods of
our study does not seem to be severe since in non-reported robustness tests we found
neither a linear year variable to be statistically significant nor did we find a trend in
year-specific period dummy variables. The relative underrepresentation of damage in
the developing world should also not represent a problem for our estimations since,
firstly, we control for total economic size in countries and, secondly, any sample se-
lection effect is unlikely to be systematically correlated with disaster strength and dis-
aster propensity as these are not systematically higher or lower in developing coun-
tries. The appendix lists the countries included in each of the respective natural disas-
ter event type samples.
We convert the nominal economic loss, GDP and income per capita data into
constant US$ of 1995 using the US GDP deflator. Disaster damage is a highly skewed
variable with the vast majority of events causing relatively little damage and only a
small minority of events causing very large damage. To reduce skewness, we take the
natural log of disaster damage and, as Mendelssohn and Saher (2011) have done be-
fore us, estimate log-log models. This allows interpreting the estimated coefficients as

25
elasticities. Our analysis starts in 1980, the year from which onwards damage esti-
mates were comprehensively collected in the database, and ends in 2008.
4. Results
Table 1 presents estimation results on the determinants of economic damage from
earthquakes. Each column presents estimated elasticities at one of the five quantiles
looked at, moving from the .05 quantile on the left to the .95 quantile on the right. Re-
sults for the lowest quantile at .05 corroborate our contention that very small damages
tend to be random. With the exception of quake magnitude, none of the explanatory
variables is statistically significant and the pseudo-R2 value is very low. The explana-
tory power of the estimation model increases for higher quantiles. As can be seen,
disaster damage is higher the stronger the quake magnitude, as one would expect. Its
effect increases at higher quantiles, meaning that for higher damages the same in-
crease in unleashed energy results in a larger increase in damage. The estimated elas-
ticity of a country’s GDP is smaller than unitary. This is consistent with Mendelsohn
and Saher (2011) who similarly find income elasticities below one in their log-log es-
timation models, using EM-DAT as the source for disaster damage. What this implies
is that quake damage increases less than proportionally with a country’s GDP as a
proxy for the stock of potentially destroyable wealth. Per capita income has no consis-
tent effect on expected quake damage, being statistically significantly negative for
only one quantile, the .75 one.
Quake propensity, our central explanatory variable, is estimated to have a neg-
ative effect on quake damage throughout, albeit statistically indistinguishable from
zero at the bottom quantile. The estimated elasticities increase for higher quantiles
and become statistically significant. All other things equal, the effect of quake pro-
pensity on expected quake damage is almost four times larger at the .95 quantile than
26
at the .25 quantile. At the .95 quantile, a ten percent increase in quake propensity low-
ers expected damage by 2.4 percent, whereas the same increase in quake propensity
lowers expected damage by only .8 percent at the .25 quantile. In other words, a very
high quake propensity is much more conducive for reducing very large damages than
it is for reducing relatively small quake damages. An F-test rejects the hypothesis that
the estimated coefficients at the five quantiles are equal at p<0.0004, while another F-
test rejects the hypothesis that the coefficients at the .25 quantile (i.e., in the middle of
the lower half of the distribution) and at the .75 quantile (i.e., in the middle of the up-
per half of the distribution) are equal at p<0.0037. Figure 1a illustrates how the elas-
ticity of quake propensity increases in absolute size as one moves in .05 intervals
from the .05 to the .95 quantile.
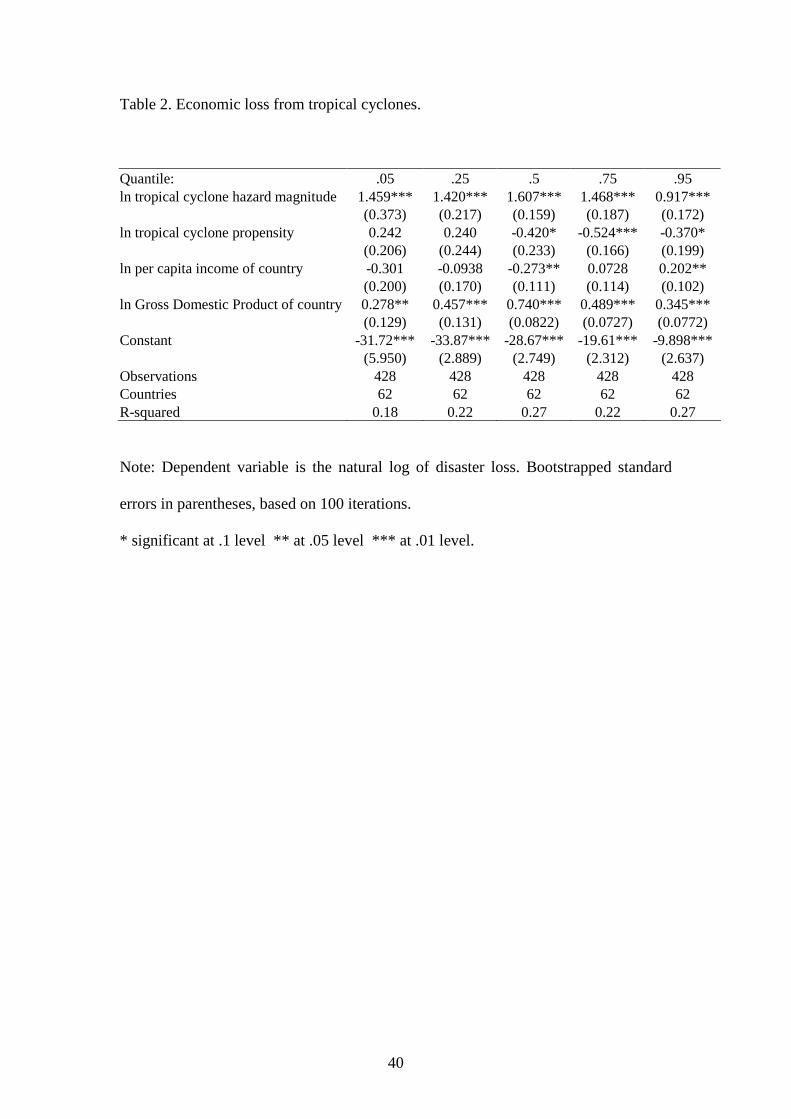
Table 2 presents estimation results for economic damage from tropical cy-
clones. As with earthquakes, the explanatory power of the regression model increases,
if less strongly, moving from lower to higher quantiles, and damage increases with
higher tropical cyclone hazard magnitude. Also similar to earthquakes, damage in-
creases less than unitarily with a country’s larger economic size and per capita income
has no consistent effect on expected tropical cyclone damages. In fact, at the largest
quantile per capita income even has a statistically significant positive effect. This
could be because of the larger potentially destroyable wealth in richer countries,
which might not be fully captured by a country’s total GDP. As concerns tropical cy-
clone propensity, it has no statistically significant effect at the lower quantiles of the
cyclone damage distribution, but it becomes significant at roughly the median of the
distribution. An F-test rejects the hypothesis that the estimated coefficients at the five
quantiles are equal at p<0.0055, while another F-test rejects the hypothesis that the
coefficients at the specific .25 and .75 quantiles are equal at p<0.0098. Figure 2a

27
graphically summarizes the changing effect of cyclone propensity on expected dam-
age. After an initial unexpected upward spike at low quantiles, it continuously falls
(that is, becomes stronger in absolute terms) from about the .15 quantile onward, but
levels off at about the .7 quantile. At high quantiles of the damage distribution cy-
clone propensity has a stronger effect on expected damage than at low quantiles, but
at very high quantiles the effect is not stronger than at high quantiles. At the .75 quan-
tile, a ten percent increase in tropical cyclone propensity lowers expected cyclone
damage by about five percent.
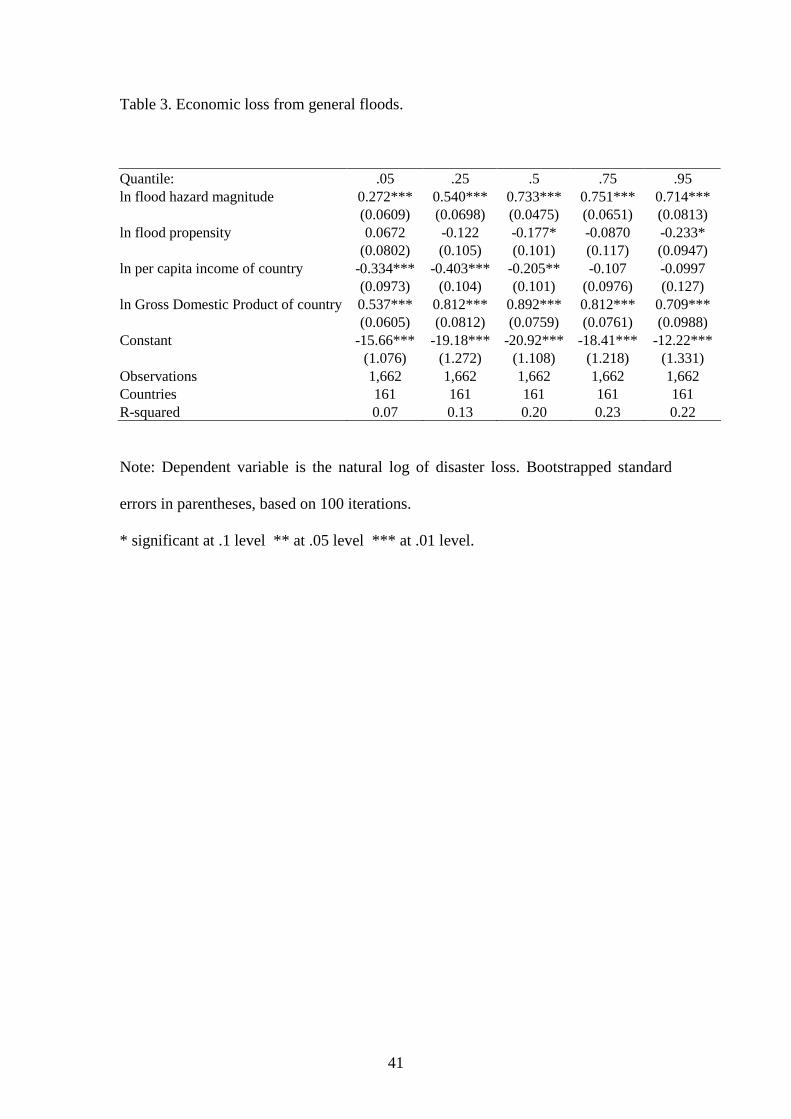
Finally, table 3 presents estimation results for flood damage. The estimated
elasticities for flood hazard magnitude increase at higher quantiles. As with quakes
and tropical cyclones, the estimated elasticity of a country’s GDP is less than unitary,
but somewhat higher than for these two other disaster types. Apparently, flood dam-
age increases almost proportionally with a country’s total economic size. Richer coun-
tries experience lower expected damage, an effect that is statistically distinguishable
from zero at the lower quantiles up to the median. As concerns flood propensity, simi-
lar to the other disaster types there is no significant effect at the lowest quantile
looked at. A negative effect starts at the .25 quantile, the effect becomes more nega-
tive and statistically significant at the median quantile, decreases in absolute size as
well as becoming statistically indistinguishable from zero at the .75 quantile, but in-
creases again in absolute size at the .95 quantile, where it is again statistically distin-
guishable from zero. An F-test rejects the hypothesis that the estimated coefficients at
the five quantiles are equal at p<0.0751. A similar F-test cannot reject the hypothesis
that the coefficients at the .25 and .75 quantiles are equal, but rejects the hypothesis
that the coefficients at the .05 and .95 quantiles are equal at p<0.0165. Figure 3a sum-
marizes the effect of flood propensity at continuously varying .05 intervals of quan-
28
tiles of the flood damage distribution. Note that the 90 percent confidence interval
around the estimated elasticities as represented by the shaded area is relatively larger
than it was for tropical cyclones propensity, where the confidence interval in turn was
larger than was the case for quake propensity. This is to be expected, given, as dis-
cussed above, the likely larger measurement error for the cyclone and even larger
measurement error for the flood propensity measures and the fact that the flood sam-
ple might suffer from sample selection as well. Despite this larger measurement error,
which renders it less likely that we find statistically significant evidence for our hy-
pothesis, on the whole it remains true that a higher flood propensity has no effect on
avoiding smaller flood damages, but higher propensity predicts lower damage at high-
er quantiles of the conditional damage distribution. At median flood damage, a ten
percent increase in flood propensity lowers predicted damage by an estimated 1.8 per-
cent, while at the .95 quantile, the same flood propensity increase lowers predicted
damage by 2.3 percent.
5. Robustness tests
We conducted two sets of important robustness tests. First, our main estimations do
not include country fixed effects since our theory makes predictions about the cross-
country variation of disaster propensity – a variable that does not change in the short
term. However, we tested the robustness of our inferences toward including income
group fixed effects (following the classification of countries into low-, lower middle-,
upper middle-, high- and high-OECD income groups in World Bank 2010), which
accounts for heterogeneity across countries according to their economic development
status, as well as a fixed effect for small island nation states (as defined in World
Bank 2010), which may be particularly vulnerable (Pelling and Uitto 2001). In addi-
tion, we included a measure of insurance penetration (disaster-relevant insurance pre-

29
mia divided by gross domestic product), directly provided by Munich Re (Barthel and
Neumayer 2012), in order to account for the fact that countries with higher insurance
penetration are more likely to have disaster damage more comprehensively recorded.
Detailed results are provided in the replication data, but figures 1b to 3b graphically
show the effect of disaster propensity on each disaster type. Clearly, the results are
very similar. For earthquakes, quake propensity has a significantly negative effect
over a similar range as in the main estimations, except around the .6 quantile where
the relative large confidence interval just so includes the zero threshold. For tropical
cyclones, the inferences across the quantiles are also very similar, except for the very
last one, in which the effect becomes marginally statistically insignificant. For flood
damage, the effect of flood propensity is actually significantly negative for a wider
range of quantiles in this robustness test compared to the main estimations. In sum,
the corroborating empirical evidence for our theory of natural disaster damage is fully
robust to accounting for country group heterogeneity and for differences in insurance
penetration rates across countries.
Our second robustness test deals with the fact that all data on natural disaster
damage are based on estimates, which carry considerable uncertainty with them. In
the opening paragraph of this article, we referred to cost estimates for hurricane
Katrina that vary from a low of 82 billion US$ (Knapp and Brown 2005) to a high of
150 billion US$ (Burton and Hicks 2005); similarly wide cost estimate intervals will
almost inevitably result for the vast majority of other disaster events. We therefore
conducted a Monte Carlo study, similar to what Plümper and Neumayer (2009) do for
mortality from famines, which aims at exploring the effect of measurement error.
Specifically, we re-estimated all models 100 times. In each re-estimation, we injected
a random measurement error of up to ±30 percent on all observations. By reporting
30
the full range of coefficients from the Monte Carlo study (minimum to maximum) in
table 4 rather than merely the mean, we report the full range of vulnerability of our
estimates to measurement error, not just average vulnerability. Measurement error
will only be random on average, but it is correlated with the covariates in almost all
individual iterations. By looking at the full range of the Monte Carlo estimates, we
thus also take some non-random measurement error into account.
We focus on estimates for disaster propensity, our central explanatory vari-
able. As one would expect, the minimum of the Monte Carlo estimates suggest a
stronger effect of disaster propensity, while the maximum suggests a weaker effect
than the mean of the Monte Carlo estimates, which in turn is close to our main estima-
tion results without induced measurement error. Importantly, however, results are ful-
ly robust for all disaster types in the sense that the sign of the maximum of the Monte
Carlo estimates is always consistent with the sign of the mean estimate, which in turn
is consistent with the results from the main estimates without measurement error in-
jected into the observations. In other words, whenever our main estimations suggest a
negative effect of disaster propensity this is not contradicted by either random (mean
estimate) or partially non-random measurement error (minimum to maximum) ac-
counted for in the Monte Carlo analysis.
6. Conclusion
Economic damage caused by natural hazards can be mitigated, though typically not
entirely prevented. In this article, we explained why individuals and governments of-
ten fail to do so. Given individuals face collective action problems, myopic behavior
and asymmetric information, successful disaster prevention and damage mitigation in
important respects depend on government policies, regulations and interventions. We
have argued that the incentives to enact both private and public disaster prevention

31
and damage mitigation measures strongly depend on the propensity with which a
country experiences frequent and strong natural hazards. Where propensity is high,
the incentives are high and vice versa where propensity is low. Natural disasters thus
cause more damage when a relatively strong outlier hazard hits an area where histori-
cally hazard events are infrequent or tend to be of low strength.
We have also argued that the effect of disaster propensity on predicted damage
is stronger toward the top end of the conditional damage distribution than toward the
bottom end since smaller losses are often unpreventable and tend to be random. We
found evidence for this hypothesis in our quantile regressions of damage from earth-
quakes, tropical cyclones and floods, which together make up nearly three quarters of
global economic damage from natural disasters over the period 1980 to 2008.
Our analysis does not answer the question whether the lower prevention and
mitigation efforts undertaken in countries with lower disaster propensity is fully ra-
tional given the lower frequency or intensity of expected disasters or is sub-optimal.
To answer this question one would have to compare the costs of prevention and miti-
gation efforts to the expected disaster damage costs, which is beyond the scope of this
article since we have no information on the costs of prevention and mitigation. For the
same reason, it is unclear whether countries with high disaster propensity invest suffi-
ciently in prevention and mitigation measures in response to the high propensity they
face or whether even their higher efforts are still below the social optimum. Our the-
ory predicts that prevention and mitigation are likely to be sub-optimal given market
and government failures, but we cannot empirically demonstrate this.
One thing we do know is that even where disaster propensity is high, preven-
tion and mitigation can fail and, for the odd strong outlier hazard event, sometimes
spectacularly so. For example, dams will be built, but built too low to withstand the

32
forces of extreme events. Ironically, the existence of a dyke will encourage settlement
and investment in high-risk areas so that when the dam breaks fatalities and damage
massively increase relative to the counterfactual situation of no dyke. As a result, ex-
pected damage for hazard events of “normal” magnitude is much lower, but damage
will be larger if an exceptionally strong outlier hazard event hits that nullifies the pre-
ventive measures. Both hurricane Katrina and the Tōhoku earthquake demonstrate
that extreme economic losses and fatalities are possible despite considerable public
prevention and mitigation efforts. In New Orleans, the levees were just “not built for
worst case events” (Handwerk 2005) and were inadequately maintained. In Japan, the
vast majority of people were not killed and the greatest damage was not caused by the
earthquake itself, for which Japan is well prepared, but by the ensuing tsunami, for
which it is not. It would have been possible but extremely expensive to protect Ja-
pan’s coastline against waves of such height. In future research, we intend to explore
further the costs and benefits of disaster prevention and mitigation measures in order
to provide better insights into what an optimal policy response to a given disaster pro-
pensity would look like.
33
References
Akerlof, G.A. (1970), The Market for “Lemons”: Quality Uncertainty and the Market
Mechanism, The Quarterly Journal of Economics, 84 (3), 488-500.
Anbarci, N., Escaleras, M. and Register, C. A. (2005), Earthquake fatalities: the inter-
action of nature and political economy, Journal of Public Economics, 89 (9-
10), 1907-1933.
Barthel, B. and E. Neumayer (2012), A trend analysis of normalized insured damage
from natural disasters. Climatic Change, 113, 215–237.
Bouwer, L. (2011), Have Disaster Losses Increased Due to Anthropogenic Climate
Change?, Bulletin of the American Meteorological Society, 32, 39-46.
Bouwer, L. and W.J.W. Botzen (2011), How Sensitive are US Hurricane Damages to
Climate? Comment on a Paper by W.D. Nordhaus. Climate Change Econom-
ics 2 (1), 1-7.
Brouwer, Roy and Rob van der Veeren (2009), Costs and Benefits of Water Policy,
in: Stijn Reinhard and Henk Folmer (eds.): Water Policy in the Netherlands, pp.
91-107. RFF Press, Oxford.
Burton, Mark L. and Michael J. Hicks (2005), Hurricane Katrina: Preliminary Esti-
mates of Commercial and Public Sector Damages, unp. manuscript, Center for
Business and Economic Research, Marshall University, Huntington.
Camerer, C. and H. Kunreuther (1989), Decision Processes for Low Probability
Events: Policy Implications, Journal of Policy Analysis and Management, 8,
565-592.
Cameron, A.C., and P.K. Trivedi (2009), Microeconometrics using Stata. College Sta-
tion: Stata Press.
Carsell, Kim M., Nathan D. Pingel, David t. Ford and M. Asce (2004), Quantifying

34
the Benefit of a Flood Warning System, Natural Hazards Review, 5 (3), 131-
140.
Daily Mail (2011), The Japanese mayor who was laughed at for building a huge sea
wall. http://www.dailymail.co.uk/news/article-1386978/The-Japanese-mayor-
laughed-building-huge-sea-wall--village-left-untouched-tsunami.html (last ac-
cessed 22 November 2012).
Emanuel, K. (2005), Increasing Destructiveness of Tropical Cyclones over the past 30
Years. Nature, 436, 686-688.
Escaleras, M., N. Anbarci, and C. A. Register (2007), Public sector corruption and
major earthquakes: A potentially deadly interaction. Public Choice, 132, 209-
230.
Gasper, J. T. and A. Reeves (2011), Make It Rain? Retrospection and the Attentive
Electorate in the Context of Natural Disasters. American Journal of Political
Science 55 (2), 340-355.
Hallegatte, S. and V. Przyluski (2010), The Economics of Natural Disasters – Con-
cepts and Methods. Policy Research Working Paper 5507. Washington, DC:
The World Bank.
Hallegatte, S. (2011), How Economic Growth and Rational Decisions Can Make Dis-
aster Losses Grow Faster than Wealth. Policy Research Working Paper 5617.
Washington, DC: The World Bank.
Hallegatte, S. (2012), An Exploration of the Link Between Development, Economic
Growth, and Natural Risk.. Policy Research Working Paper 6216. Washing-
ton, DC: The World Bank.
Handwerk, Brian (2005), New Orleans Levees not Built for Worst Case Events. Na-

35
tional Geographic News 2 September. National Geographic Society.
Healy, A. J., and N. Malhotra (2009). Myopic Voters and Natural Disaster Policy.
American Political Science Review, 103 (2), 387-406.
Hough, S. (2010), Predicting the Unpredictable. The Tumultuous Science of Earth-
quake Prediction, Princeton University Press, Princeton.
Kahn, M. E. (2005), The death toll from natural disasters: the role of income, geogra-
phy, and institutions, Review of Economics and Statistics, 87 (2), 271-284.
Keefer, P., E. Neumayer, and T. Plümper (2011), Earthquake Propensity and the Poli-
tics of Mortality Prevention, World Development, 39 (9), 1530-1541.
Kenny, C. (2009), Why Do People Die in Earthquakes? The Costs, Benefits and Insti-
tutions of Disaster Risk Reduction in Developing Countries, Policy Research
Working Paper 4823. Washington, DC: The World Bank.
Knabb, Richard D., Jamie R. Rhome, and Daniel P. Brown (2005), Tropical Cyclone
Report: Hurricane Katrina, National Hurricane Center, Miami.
Koenker, R. and K.F. Hallock (2001), Quantile Regression, Journal of Economic Per-
spectives 15 (4): 143-156.
Kron, Wolfgang, Markus Steuer, Petra Löw and Angelika Wirtz (2012), How to Deal
Properly with a Natural Catastrophe Database – Analysis of Flood Losses,
Natural Hazards and Earth System Sciences, 12: 535-550.
Kunreuther, H. (1996), Mitigating Disaster Loss through Insurance, Journal of Risk
and Uncertainty 12: 171-187.
Lall, S.V. and U. Deichmann (2010), Density and Disasters: Economics of Urban
Hazard Risk. World Bank Research Observer 27: 74-105.

36
Mendelsohn, R. and G. Saher (2011), The Global Impact of Climate Change on Ex-
treme Events. Policy Research Working Paper 5566. Washington, DC: The
World Bank.
Min, Seung-Ki, Xuebin Zhang, Francis W. Zwiers, and Gabriele C. Hegerl (2011),
Human contribution to more-intense precipitation extremes, Nature, 470, pp.
378-381.
Munich Re (2011), NatCatSERVICE database. Munich.
Neumayer, E. and T. Plümper (2007), The Gendered Nature of Natural Disasters: The
Impact of Catastrophic Events on the Gender Gap in Life Expectancy, 1981-
2002, Annals of the American Association of Geographers, 97 (3), 551-566.
Neumayer, Eric and Fabian Barthel, (2011), Normalizing Economic Loss from Natu-
ral Disasters: A Global Analysis. Global Environmental Change, 21 (1), 13-24.
Nordhaus, William D. (2010), The economics of hurricanes and implications of global
warming, Climate Change Economics, 1, 1-20.
Pall, Pardeep, Tolu Aina, Dáithi A. Stone, Peter A. Stott, Toru Nozawa, Arno G.J.
Hilberts, Dag Lohmann, and Myles R. Allen (2011), Anthropogenic greenhouse
gas contribution to flood risk in England and Wales in autumn 2000, Nature 470,
pp. 382-385.
Paul, Bimal Kanti (2011), Environmental Hazards and Disasters: Contexts, Perspec-
tives and Management. Chichester: John Wiley & Sons.
Pelling, Mark and Juha I. Uitto (2001), Small island developing states: natural disaster
vulnerability and global change, Global Environmental Change B: Environ-
mental Hazards, 3 (2), 49-62.

37
Pielke, Roger A. Jr., Christopher W. Landsea, Rade T. Musulin and Mary Downton
(1999), Evaluation of Catastrophe Models using a Normalized Historical Re-
cord, Journal of Insurance Regulation, 18 (2), 177-194.
Plümper, T. and E. Neumayer (2009), Famine Mortality, Rational Political Inactivity,
and International Food Aid. World Development, 37 (1), 50-61.
Raschky, P.A. and H. Weck-Hannemann (2007), Charity hazard – a real hazard to
natural disaster insurance? Environmental Hazards, 7 (4), 321-329.
Schmidt, S., C. Kemfert and P. Höppe (2009), The Impact of Socio-economics and
Climate Change on Tropical Cyclone Losses in the USA. Regional Environ-
mental Change, 10, 13-26.
Schumacher, I. and E. Strobl (2011), Economic Development and Losses due to Natu-
ral Disasters: The role of Hazard Exposure. Ecological Economics, 72, 97-105.
Schwab, A.K., Eschelbach, K., Brower, D.J. (2007), Hazard Mitigation and Prepar-
edness. Hoboken: Wiley & Sons.
Willmott, C. and K. Matsuura (2011), Willmott, Matsuura and Collaborators’ Global
Climate Resource Pages, University of Dallaware, available at:
http://climate.geog.udel.edu/~climate/ (last accessed 22 November 2012).
Wirtz, Angelika, Wolfgang Kron, Petra Löw and Markus Steuer (2012), The Need for
Data: Natural Disasters and the Challenges of Database Management, Natural
Hazards (forthcoming).
World Bank and United Nations (2010), Natural Hazards, UnNatural Disasters – The
Economics of Effective Prevention. Washington, DC and New York: World
Bank and United Nations.
World Bank (2005), Natural Disaster Hotspots – A Global Risk Analysis. Washing-
ton, DC: World Bank.
38
World Bank (2010), World Development Indicators Online Database. Washington,
DC: World Bank.
World Bank (2011), The Recent Earthquake and Tsunami in Japan: Implications for
East Asia, March 21. Washington, DC: World Bank, Washington.
http://siteresources.worldbank.org/INTEAPHALFYEARLYUPDATE/Resource
s/550192-1300567391916/EAP_Update_March2011_japan.pdf (last accessed 22
November 2012).
Xinhua (2011), Japanese Gov't puts Quake cost Damage to Economy at 309 bln USD,
March 23. http://news.xinhuanet.com/english2010/business/2011-
03/23/c_13794483.htm (last accessed 22 November 2012).

39
Table 1. Economic loss from earthquakes.
Quantile: .05 .25 .5 .75 .95 ln quake hazard magnitude 0.0818** 0.302*** 0.452*** 0.640*** 0.702*** (0.0380) (0.0341) (0.0441) (0.0416) (0.0801) ln quake propensity -0.00755 -0.0725*** -0.108*** -0.207*** -0.242** (0.0197) (0.0259) (0.0343) (0.0461) (0.103) ln per capita income of country 0.0387 -0.0332 -0.164 -0.404** 0.0204 (0.0542) (0.0859) (0.118) (0.176) (0.236) ln Gross Domestic Product of country 0.0722 0.369*** 0.502*** 0.753*** 0.633*** (0.0540) (0.0528) (0.0831) (0.0875) (0.130) Constant -8.000*** -15.80*** -18.69*** -22.07*** -19.60*** (1.545) (1.132) (1.497) (1.577) (3.720) Observations 847 847 847 847 847 Countries 117 117 117 117 117 R-squared 0.02 0.12 0.19 0.25 0.24
Note: Dependent variable is the natural log of disaster loss. Bootstrapped standard
errors in parentheses, based on 100 iterations.
** significant at .05 level *** at .01 level.
40
Table 2. Economic loss from tropical cyclones.
Quantile: .05 .25 .5 .75 .95 ln tropical cyclone hazard magnitude 1.459*** 1.420*** 1.607*** 1.468*** 0.917*** (0.373) (0.217) (0.159) (0.187) (0.172) ln tropical cyclone propensity 0.242 0.240 -0.420* -0.524*** -0.370* (0.206) (0.244) (0.233) (0.166) (0.199) ln per capita income of country -0.301 -0.0938 -0.273** 0.0728 0.202** (0.200) (0.170) (0.111) (0.114) (0.102) ln Gross Domestic Product of country 0.278** 0.457*** 0.740*** 0.489*** 0.345*** (0.129) (0.131) (0.0822) (0.0727) (0.0772) Constant -31.72*** -33.87*** -28.67*** -19.61*** -9.898*** (5.950) (2.889) (2.749) (2.312) (2.637) Observations 428 428 428 428 428 Countries 62 62 62 62 62 R-squared 0.18 0.22 0.27 0.22 0.27
Note: Dependent variable is the natural log of disaster loss. Bootstrapped standard
errors in parentheses, based on 100 iterations.
* significant at .1 level ** at .05 level *** at .01 level.
41
Table 3. Economic loss from general floods.
Quantile: .05 .25 .5 .75 .95 ln flood hazard magnitude 0.272*** 0.540*** 0.733*** 0.751*** 0.714*** (0.0609) (0.0698) (0.0475) (0.0651) (0.0813) ln flood propensity 0.0672 -0.122 -0.177* -0.0870 -0.233* (0.0802) (0.105) (0.101) (0.117) (0.0947) ln per capita income of country -0.334*** -0.403*** -0.205** -0.107 -0.0997 (0.0973) (0.104) (0.101) (0.0976) (0.127) ln Gross Domestic Product of country 0.537*** 0.812*** 0.892*** 0.812*** 0.709*** (0.0605) (0.0812) (0.0759) (0.0761) (0.0988) Constant -15.66*** -19.18*** -20.92*** -18.41*** -12.22*** (1.076) (1.272) (1.108) (1.218) (1.331) Observations 1,662 1,662 1,662 1,662 1,662 Countries 161 161 161 161 161 R-squared 0.07 0.13 0.20 0.23 0.22
Note: Dependent variable is the natural log of disaster loss. Bootstrapped standard
errors in parentheses, based on 100 iterations.
* significant at .1 level ** at .05 level *** at .01 level.

42
Table 4. Summary Statistics of Monte Carlo Analysis testing the Robustness of Re-
sults toward Measurement Error.
Mean Std. Dev. Min Max
Quake propensity at .05 quantile -0.0135 0.0096 -0.0364 0.0113 at .25 quantile -0.2349 0.0285 -0.3442 -0.1827 at .5 quantile -0.1038 0.0091 -0.1267 -0.0870 at .75 quantile -0.2090 0.0115 -0.2364 -0.1795 at .95 quantile -0.2368 0.0278 -0.3109 -0.1806 Tropical cyclone propensity at .05 quantile 0.2424 0.0501 0.1252 0.3580 at .25 quantile 0.2455 0.0486 0.1473 0.3528 at .5 quantile -0.4347 0.0425 -0.5453 -0.3388 at .75 quantile -0.5513 0.0455 -0.6488 -0.4297 at .95 quantile -0.3377 0.0751 -0.4842 -0.1602 Flood propensity at .05 quantile 0.0633 0.0335 -0.0063 0.1422 at .25 quantile -0.1065 0.0215 -0.1566 -0.0610 at .5 quantile -0.1664 0.0218 -0.2241 -0.1234 at .75 quantile -0.0765 0.0220 -0.1182 -0.0036 at .95 quantile -0.2420 0.0297 -0.3002 -0.1572
Note: Random measurement error of up to ±30 percent injected into all observations.
Based on 100 iterations. N = 847 for earthquakes, N = 428 for tropical cyclones and N
= 1,662 for general floods.

43
Figure 1. The effect of quake propensity for varying damage quantiles.
a) Main estimation
-0.4
0-0
.30
-0.2
0-0
.10
0.00
quak
e pr
open
sity
0 .2 .4 .6 .8 1Quantile
b) Robustness test
-0.6
0-0
.40
-0.2
00.
00qu
ake
prop
ensi
ty
0 .2 .4 .6 .8 1Quantile
Note: the solid line shows the estimated coefficient, while the grey area represents a
90 percent confidence interval around it.

44
Figure 2. The effect of tropical cyclone propensity for varying damage quantiles.
a) Main estimation
-1.0
0-0
.50
0.00
0.50
1.00
cycl
one
prop
ensi
ty
0 .2 .4 .6 .8 1Quantile
b) Robustness test
-1.0
0-0
.50
0.00
0.50
1.00
cycl
one
prop
ensi
ty
0 .2 .4 .6 .8 1Quantile
Note: the solid line shows the estimated coefficient, while the grey area represents a
90 percent confidence interval around it.
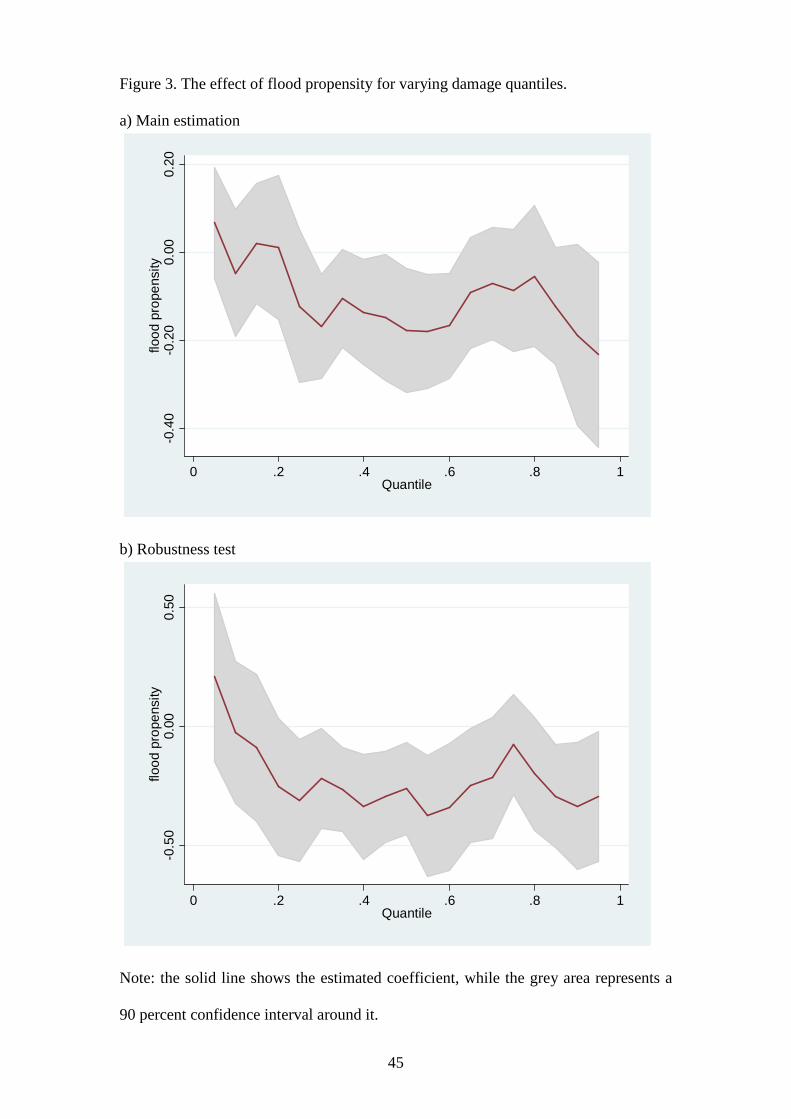
45
Figure 3. The effect of flood propensity for varying damage quantiles.
a) Main estimation
-0.4
0-0
.20
0.00
0.20
flood
pro
pens
ity
0 .2 .4 .6 .8 1Quantile
b) Robustness test
-0.5
00.
000.
50flo
od p
rope
nsity
0 .2 .4 .6 .8 1Quantile
Note: the solid line shows the estimated coefficient, while the grey area represents a
90 percent confidence interval around it.

46
Appendix. Countries included in the samples.
Earthquakes:
Afghanistan, Albania, Algeria, Argentina, Armenia, Australia, Austria, Azerbaijan, Bangladesh, Barbados, Belgium, Bhutan, Bolivia, Bosnia and Herzegovina, Brazil, Bulgaria, Burundi, Canada, Chile, China, Colombia, Congo (DRC), Costa Rica, Croa-tia, Cuba, Cyprus, Czech Republic, Djibouti, Dominica, Dominican Republic, Ecua-dor, Egypt, El Salvador, Ethiopia, Fiji, France, Georgia, Germany, Ghana, Greece, Guatemala, Guyana, Haiti, Honduras, Hungary, Iceland, India, Indonesia, Iran, Israel, Italy, Jamaica, Japan, Jordan, Kazakhstan, Kenya, Kyrgyz Republic, Lao PDR, Leba-non, Macedonia, Madagascar, Malawi, Malaysia, Maldives, Mexico, Moldova, Mon-golia, Morocco, Mozambique, Nepal, Netherlands, New Zealand, Nicaragua, Paki-stan, Panama, Papua New Guinea, Paraguay, Peru, Philippines, Poland, Portugal, Puerto Rico, Romania, Russian Federation, Rwanda, Samoa, Saudi Arabia, Sey-chelles, Slovenia, Solomon Islands, Somalia, South Africa, Spain, Sri Lanka, St. Lu-cia, St. Vincent and the Grenadines, Sudan, Sweden, Switzerland, Tajikistan, Tanza-nia, Thailand, Tonga, Trinidad and Tobago, Tunisia, Turkey, Turkmenistan, Uganda, United Kingdom, United States, Uzbekistan, Vanuatu, Venezuela, Vietnam, Yemen, Zambia, Zimbabwe.
Floods:
Afghanistan, Albania, Algeria, Angola, Argentina, Armenia, Australia, Austria, Azer-baijan, Bahamas, Bahrain, Bangladesh, Belarus, Belgium, Belize, Benin, Bhutan, Bo-livia, Bosnia and Herzegovina, Botswana, Brazil, Bulgaria, Burkina Faso, Burundi, Cambodia, Cameroon, Canada, Central African Republic, Chad, Chile, China, Co-lombia, Congo (DRC), Congo (Rep.), Costa Rica, Cote d'Ivoire, Croatia, Cuba, Cy-prus, Czech Republic, Denmark, Djibouti, Dominica, Dominican Republic, Ecuador, Egypt, El Salvador, Eritrea, Estonia, Ethiopia, Fiji, Finland, France, Gabon, Gambia, The, Georgia, Germany, Ghana, Greece, Greenland, Guatemala, Guinea, Guinea-Bissau, Guyana, Haiti, Honduras, Hungary, Iceland, India, Indonesia, Iran, Ireland, Israel, Italy, Jamaica, Japan, Jordan, Kazakhstan, Kenya, Kuwait, Kyrgyz Republic, Lao PDR, Latvia, Lebanon, Lesotho, Liberia, Liechtenstein, Luxembourg, Mace-donia, Madagascar, Malawi, Malaysia, Mali, Mauritania, Mexico, Moldova, Mongo-lia, Morocco, Mozambique, Namibia, Nepal, Netherlands, New Zealand, Nicaragua, Niger, Nigeria, Norway, Oman, Pakistan, Panama, Papua New Guinea, Paraguay, Peru, Philippines, Poland, Portugal, Puerto Rico, Romania, Russian Federation, Rwanda, Saudi Arabia, Senegal, Sierra Leone, Singapore, Slovak Republic, Slovenia, Somalia, South Africa, South Korea, Spain, Sri Lanka, St. Lucia, St. Vincent and the Grenadines, Sudan, Suriname, Swaziland, Sweden, Switzerland, Syrian Arab Repub-lic, Tajikistan, Tanzania, Thailand, Timor-Leste, Togo, Trinidad and Tobago, Tunisia, Turkey, Turkmenistan, Uganda, Ukraine, United Arab Emirates, United Kingdom, United States, Uruguay, Uzbekistan, Vanuatu, Venezuela, Vietnam, Yemen, Zambia, Zimbabwe.
Tropical Cyclones:
Antigua and Barbuda, Australia, Bahamas, Bangladesh, Barbados, Belize, Brazil, Cambodia, Canada, China, Colombia, Costa Rica, Cuba, Dominica, Dominican Re-

47
public, El Salvador, Fiji, French Polynesia, Grenada, Guatemala, Haiti, Honduras, In-dia, Indonesia, Iran, Jamaica, Japan, Madagascar, Malaysia, Mauritius, Mexico, Mi-cronesia, Morocco, Mozambique, New Caledonia, New Zealand, Nicaragua, Oman, Pakistan, Papua New Guinea, Philippines, Portugal, Puerto Rico, Russian Federation, Samoa, Seychelles, Solomon Islands, South Africa, South Korea, Spain, Sri Lanka, St. Kitts and Nevis, St. Lucia, St. Vincent and the Grenadines, Swaziland, Thailand, Tonga, Trinidad and Tobago, United States, Vanuatu, Venezuela, Vietnam.
Related Documents