The Phillips Curve and Expectations Theory CHAPTER 27

The Phillips Curve and Expectations Theory C HAPTER 27.
Dec 20, 2015
Welcome message from author
This document is posted to help you gain knowledge. Please leave a comment to let me know what you think about it! Share it to your friends and learn new things together.
Transcript
The Phillips Curve andExpectations Theory
CHAPTER
27
2Tucker Economics for Today, 4e • Ch 27 The Phillips Curve and Expectations Theory© 2005 Thomson/South-Western
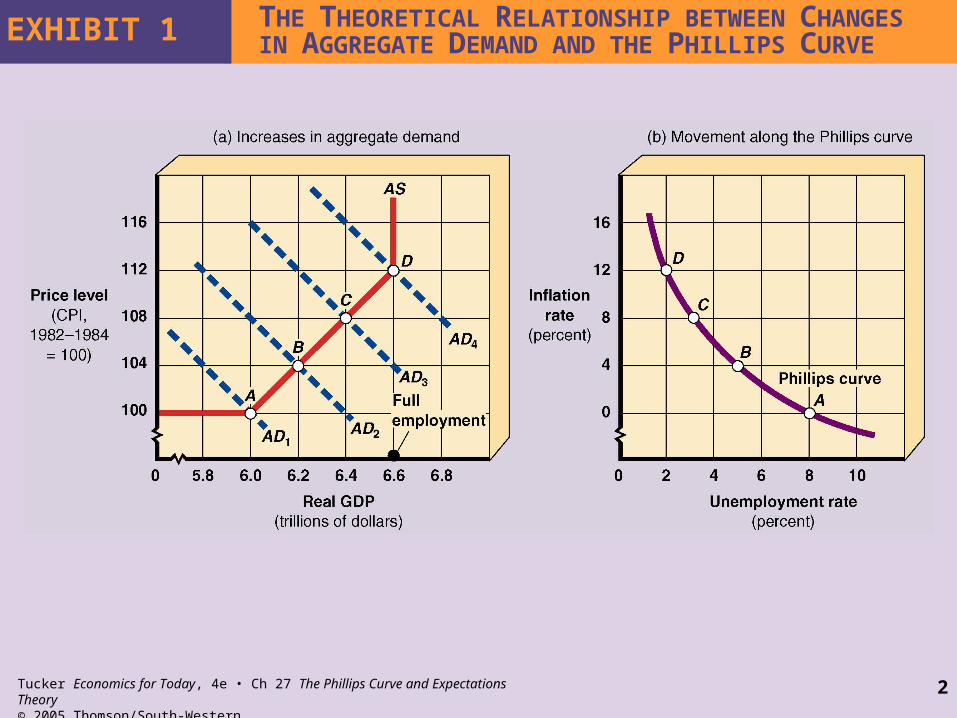
EXHIBIT 1 THE THEORETICAL RELATIONSHIP BETWEEN CHANGES IN AGGREGATE DEMAND AND THE PHILLIPS CURVE
3Tucker Economics for Today, 4e • Ch 27 The Phillips Curve and Expectations Theory© 2005 Thomson/South-Western
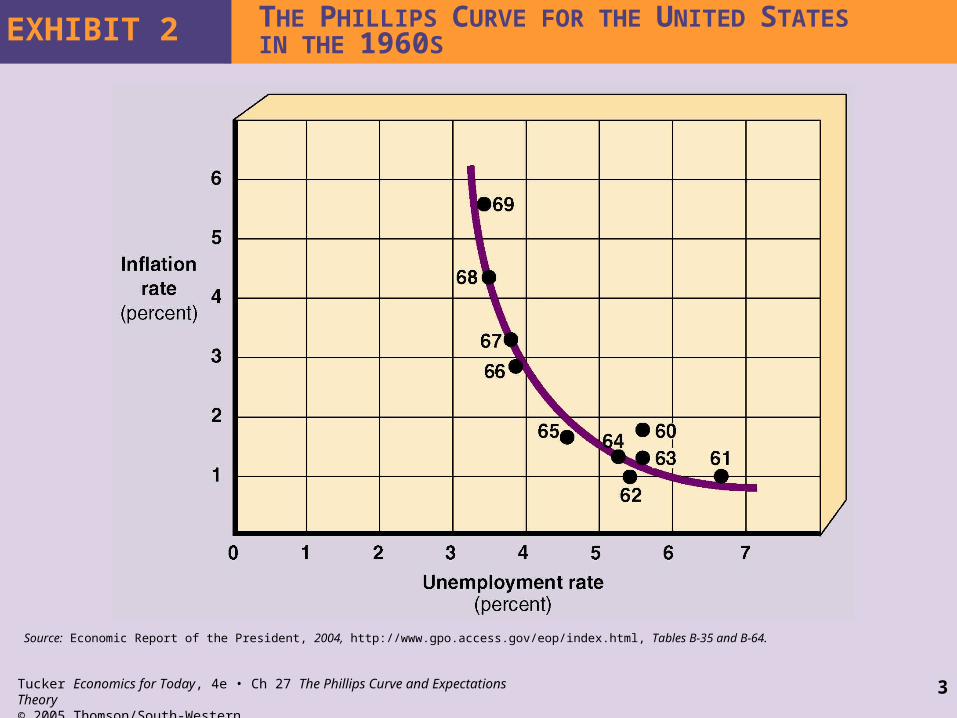
EXHIBIT 2 THE PHILLIPS CURVE FOR THE UNITED STATES IN THE 1960S
Source: Economic Report of the President, 2004, http://www.gpo.access.gov/eop/index.html, Tables B-35 and B-64.

4Tucker Economics for Today, 4e • Ch 27 The Phillips Curve and Expectations Theory© 2005 Thomson/South-Western
EXHIBIT 3 INFLATION AND UNEMPLOYMENT RATES FOR THE UNITED STATES, 1970–2003
Source: Economic Report of the President, 2004, http://www.gpo.access.gov/eop/index.html, Tables B-35 and B-64.

5Tucker Economics for Today, 4e • Ch 27 The Phillips Curve and Expectations Theory© 2005 Thomson/South-Western
EXHIBIT 4 THE SHORT-RUN AND LONG-RUN PHILLIPS CURVES
6Tucker Economics for Today, 4e • Ch 27 The Phillips Curve and Expectations Theory© 2005 Thomson/South-Western
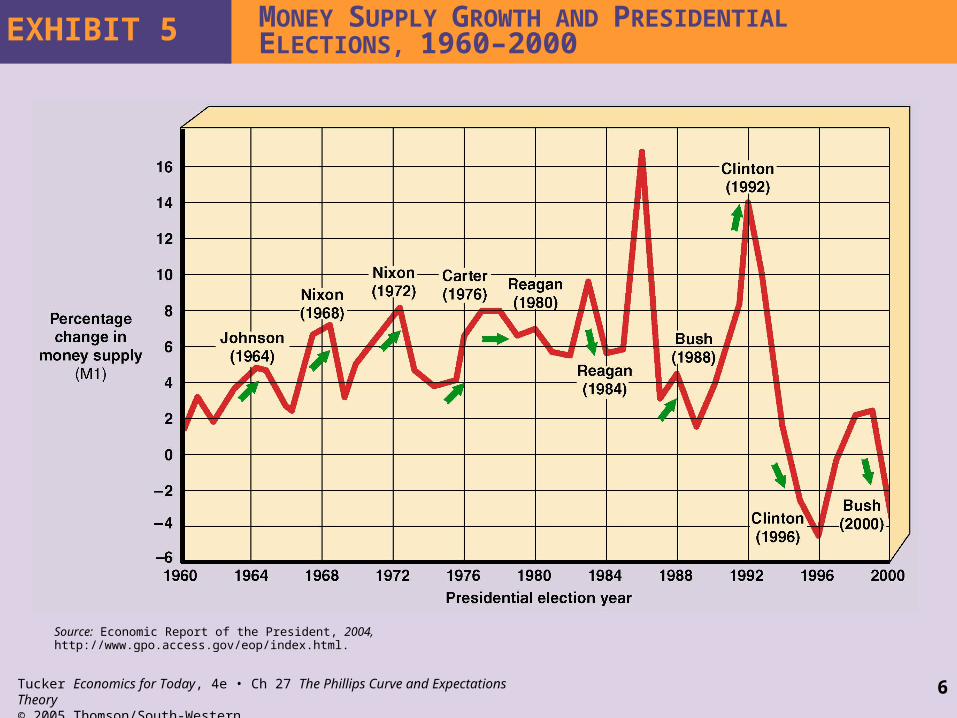
EXHIBIT 5 MONEY SUPPLY GROWTH AND PRESIDENTIAL ELECTIONS, 1960–2000
Source: Economic Report of the President, 2004, http://www.gpo.access.gov/eop/index.html.
7Tucker Economics for Today, 4e • Ch 27 The Phillips Curve and Expectations Theory© 2005 Thomson/South-Western
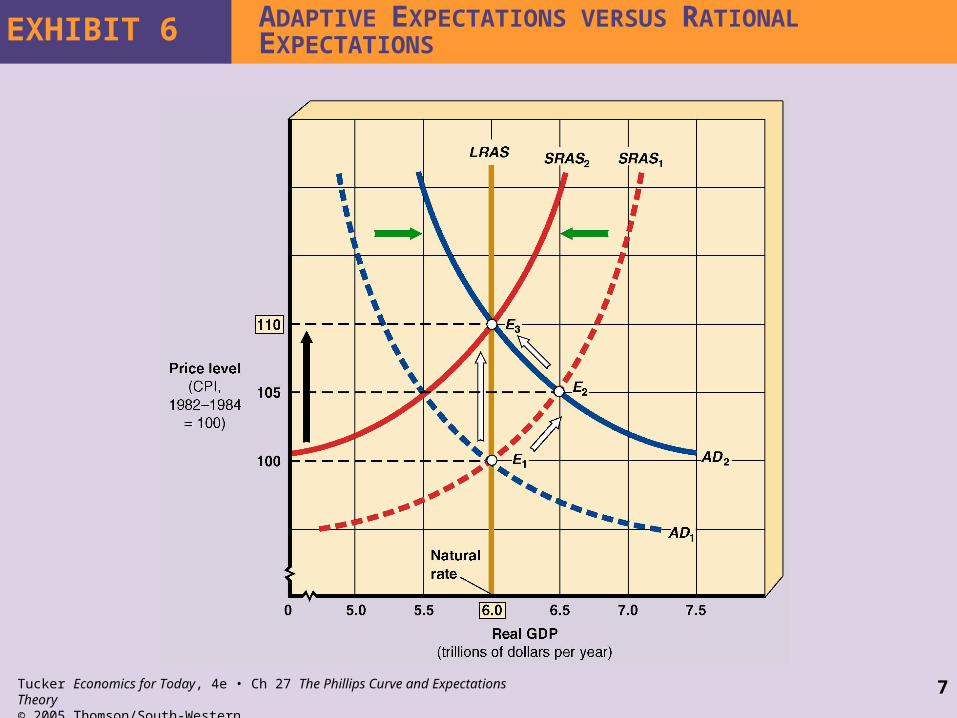
EXHIBIT 6 ADAPTIVE EXPECTATIONS VERSUS RATIONAL EXPECTATIONS
8Tucker Economics for Today, 4e • Ch 27 The Phillips Curve and Expectations Theory© 2005 Thomson/South-Western
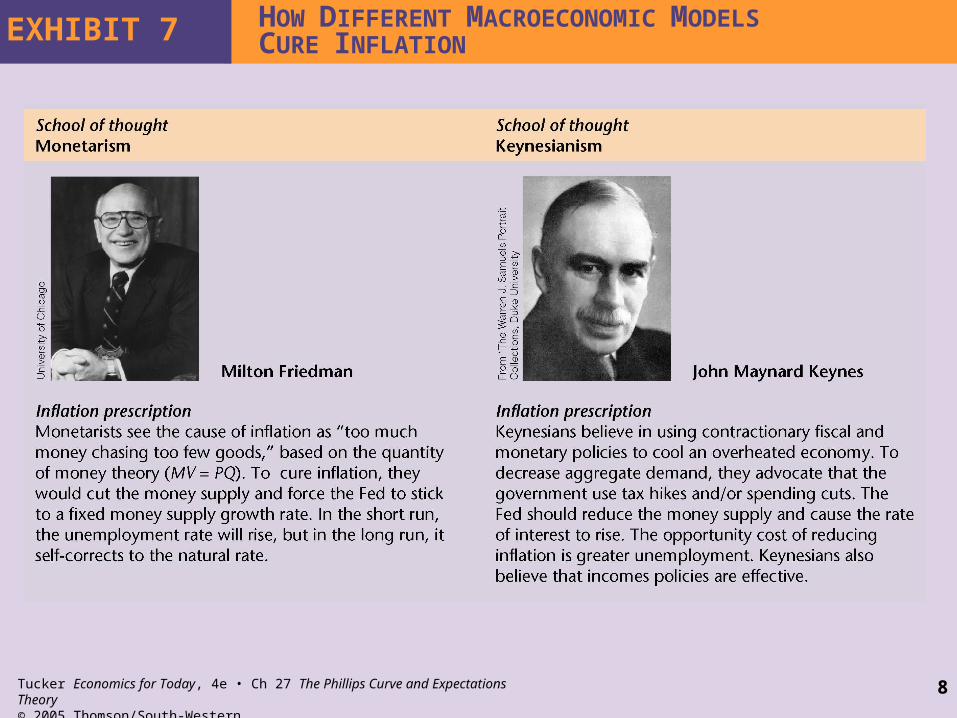
EXHIBIT 7 HOW DIFFERENT MACROECONOMIC MODELS CURE INFLATION
9Tucker Economics for Today, 4e • Ch 27 The Phillips Curve and Expectations Theory© 2005 Thomson/South-Western
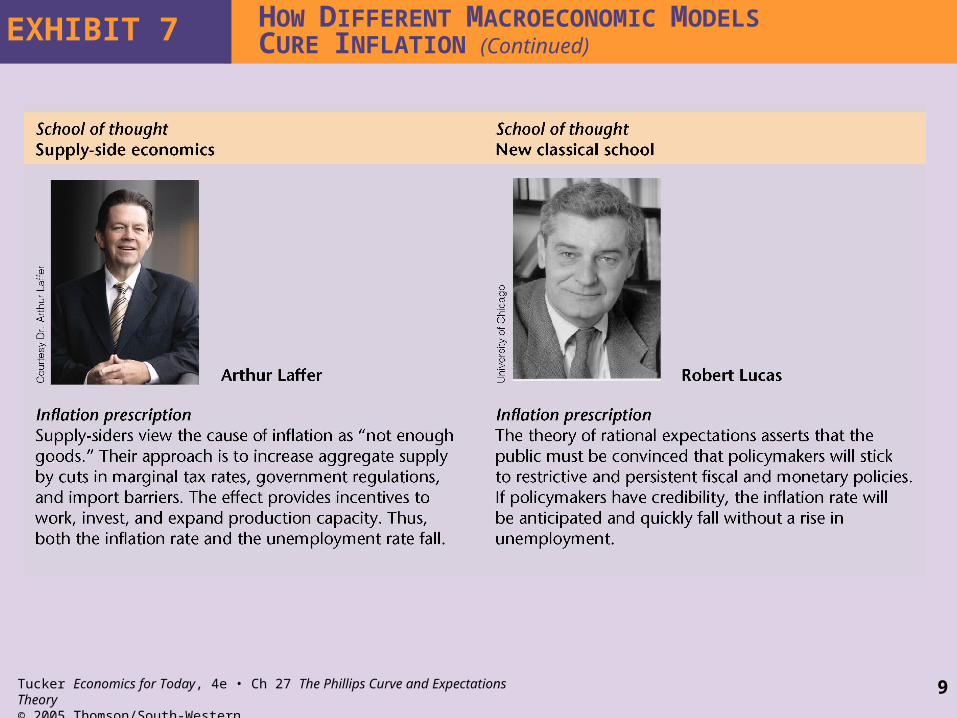
EXHIBIT 7 HOW DIFFERENT MACROECONOMIC MODELS CURE INFLATION (Continued)
Related Documents


