Nutrition Assistance Program Report Series Office of Research, Nutrition and Analysis Special Nutrition Programs Report No. CN-07-PAP The Pennsylvania SFSP Rural Area Eligibility Pilot Evaluation Final Report United States Food and Department of Nutrition Agriculture Service February 2008

Welcome message from author
This document is posted to help you gain knowledge. Please leave a comment to let me know what you think about it! Share it to your friends and learn new things together.
Transcript
Nutrition Assistance Program Report Series Office of Research, Nutrition and Analysis
Special Nutrition Programs Report No. CN-07-PAP
The Pennsylvania SFSP Rural Area
Eligibility Pilot Evaluation
Final Report
United States Food and Department of Nutrition Agriculture Service
February 2008
Non-Discrimination Policy The U.S. Department of Agriculture (USDA) prohibits discrimination in all its programs and activities on the basis of race, color, national origin, age, disability, and where applicable, sex, marital status, familial status, parental status, religion, sexual orientation, genetic information, political beliefs, reprisal, or because all or part of an individual’s income is derived from any public assistance program. (Not all prohibited bases apply to all programs). Persons with disabilities who require alternative means for communication of program information (Braille, large print, audiotape, etc.) should contact USDA’s TARGET Center at (202) 720-2600 (voice and TDD). To file a complaint of discrimination, write to USDA, Director, Office of Civil Rights, 1400 Independence Avenue, SW, Washington, DC 20250-9410 or call (800) 759-3272 (voice) or (202) 720-6382 (TDD). USDA is an equal opportunity provider and employer.

The Pennsylvania SFSP Rural Area
Eligibility Pilot Evaluation
Final Report Authors: Joseph Kirchner, Ph.D. Nancy Teed Submitted by: Submitted to: Exceed Corporation Office of Research, Nutrition and Analysis 8100 Professional Place, Suite 211 Food and Nutrition Service Lanham, MD 20785 3101 Park Center Drive, Room 1014 Alexandria, VA 22302-1500 Project Director: Project Officer: Joseph Kirchner, Ph.D. Sheku G. Kamara, Ph.D. This study was conducted under Contract Number 53-3198-5-5015 ($400,000.00) with the Food and Nutrition Service. This report is available on the Food and Nutrition Service website: http://www.fns.usda.gov/oane. Suggested Citation: U.S. Department of Agriculture, Food and Nutrition Service, Office of Research, Nutrition and Analysis, The Pennsylvania SFSP Rural Area Eligibility Pilot Evaluation: Final Report, by Joseph Kirchner, Ph.D. and Nancy Teed. Project Officer: Sheku G. Kamara, Ph.D., Alexandria, VA: 2008.
United States Food and Department of Nutrition Agriculture Service
February 2008Special Nutrition Programs
Report No. CN-07-PAP

i
ACKNOWLEDGEMENTS
This report was prepared by Joseph Kirchner, Ph.D., and Nancy Teed of Exceed Corporation for the U.S.
Department of Agriculture’s Food and Nutrition Service. Many individuals made important contributions
to this report. The authors would like to thank Jonathan Morancy, Craig Gundersen, Ph.D., and Suzane
McDevitt, Ph.D., for their analytic support; Hania Al Saket and Jeff Bennett for providing data analysis
support; and Bronwyn Johnson and Marti Posey for assisting with the survey. The authors would also
like to thank the staff of the eight Pennsylvania sponsors for their hospitality and assistance to this project
during visits to their offices; and Susan Still, Supervisor, Laurie Kepner, Administrator and other staff of
the Pennsylvania Department of Education for their assistance during the visit to their office and for
subsequent information requests; and the staff of sponsoring organizations and their sites for their
assistance in collecting survey data. Finally, the authors thank Sheku G. Kamara, Ph.D., Ted Malacuso,
Ph.D., Ronald Ulibarri, Linda Jupin, and Keith Churchill at the Food and Nutrition Service, USDA, for
their outstanding support to the effort.

ii
iii
TABLE OF CONTENTS Page
ACKNOWLEDGEMENTS ............................................................................................................. i
EXECUTIVE SUMMARY .............................................................................................................. ix
CHAPTER 1: BACKGROUND ................................................................................................... 1
Description of the Summer Food Service Program ............................................... 2 Description of the 40 Percent SFSP Pilot ............................................................... 3 Evaluation Methods ............................................................................................... 3
CHAPTER 2: FINDINGS ............................................................................................................. 7
Sponsors of the Summer Food Service Program ................................................... 7 Summer Food Service Program Sites .................................................................. 13 Geographic Locations of Sites ............................................................................. 24 Ancillary Services Provided at Sites..................................................................... 27 Other Factors Influencing Program Expansion .................................................... 29
CHAPTER 3: CONCLUSION ................................................................................................... 39
Background .......................................................................................................... 39 Effect of the Pilot on the Number of Sponsors .................................................... 39 Effect of the Pilot on the Number of Sites ............................................................ 43 Effect of Geographic Location on Sites ............................................................... 44 Effect of Ancillary Services Provided at the Sites on SFSP Participation ........... 45 Other Factors Influencing SFSP Participation .....................................................45 Summary and Conclusion .................................................................................... 46
REFERENCES ............................................................................................................................ 47 APPENDICES ........................................................................................................................... A-1
Appendix A: Study Methodology ........................................................................ A-3 Appendix B: Data Element by Source ................................................................. B-1 Appendix C: Survey Questionnaires: Instructions ............................................ C-1 Appendix C1: Sponsor Survey .............................................................................. C-3 Appendix C2: Site Survey ................................................................................... C-24 Appendix D: Additional Survey Tables............................................................... D-1 Appendix E: Summer Food Service Program Sponsors Visited ......................... E-1
iv
LIST OF TABLES Page
Table 1: Size Ranges of SFSP Sponsors from 2004 to 2006 .................................................... 8
Table 2: Sponsor Size Range by Year and by 40 and 50 Percent Sites from 2004 to 2006 ............................................................................................................................ 9
Table 3: Change in SFSP Sponsors Administering Rural Sites in Pennsylvania, Excluding Residential Camps from 2005 to 2006...................................................... 9
Table 4: Distribution of SFSP Rural Sponsors by Organizational Type in Pennsylvania in 2006 ...................................................................................................................... 10
Table 5: Local and Non-Local Partners with Sponsors in 2006 ............................................. 11
Table 6: Urban and Rural SFSP Sites in Pennsylvania by Year from 2004 to 2006............... 14
Table 7: Number of SFSP Sites by Eligibility Method in Pennsylvania from 2004 to 2006 ...........................................................................................................................18
Table 8: Distribution of Pre-Existing and New SFSP Sites in Rural Pennsylvania, Not Including Residential Camps from 2004 to 2006 ...............................................19
Table 9: Number and Percent Increase in Children, Days Attended, and Meals Served in Pennsylvania SFSP from 2004 to 2006 .....................................................21
Table 10: Percent of Children that Attended SFSP 40- and 50-Percent Sites By Age Group from 2004 to 2006 (%) .................................................................... 22
Table 11: Percent of Children that attended SFSP Sites from 2004 to 2006, by Race/Ethnicity (%) ....................................................................................................23
Table 12: A Comparison of the Distances Children Must Travel to Attend SFSP 40-Percent Sites and 50-Percent Sites in 2006 ......................................................... 26
Table 13: Modes of Transportation to 40-Percent Sites and 50-Percent Sites in 2006............. 26
Table 14: The Primary Reasons Children Attended the SFSP Sites in 2006 ........................... 28
Table 15: The Methods Utilized by 40-Percent and 50-Percent Sites to Enhance the SFSP in 2006............................................................................................................. 30
v
Table 16: Marketing Techniques Used by Sponsors to Recruit Children to SFSP Sites in Pennsylvania in 2006 ............................................................................................... 33
Table 17: Establishment of SFSP Sites in Pennsylvania in 2006 ............................................ 34
Table 18: Number and percent of SFSP Sites that Served Breakfast, Lunch, Dinner and Snacks from 2004 to 2006 .........................................................................................35
Table 19: Random Sample of Site Monitor Reports in 2006 ................................................... 36

vi
LIST OF FIGURES
Page
Figure 1: Urban and Rural Sites from 2004 to 2006, Showing 40- and 50-Percent Sites........ 13
Figure 2: The Number and Percentage of 40- and 50-Percent Rural Sites from 2004 to 2006 ............................................................................................................ 14
Figure 3: Eligibility Types for Rural Sites Including Residential Camps from 2004 to 2006 ...........................................................................................................................15
Figure 4: The Total Number of Rural Sites Compared to Rural Sites Excluding Residential Camps from 2004 to 2006 ......................................................................16
Figure 5: The Percentage Increase in Rural Sites Compared to Rural Sites Excluding Residential Camps in 2005 and 2006 ........................................................................17
Figure 6: Pre-Existing and New SFSP Sites from 2004 to 2006, Comparing 40- and 50-Percent Sites ............................................................................................17

vii
LIST OF MAPS Page
Map 1: SFSP Sponsor Visit Locations in Pennsylvania in 2005............................................ 12
Map 2: Location of SFSP Sites and the Number of Children under 185 Percent of the Federal Poverty Line Per Census Block ..................................................................... 24

viii
ix
EXECUTIVE SUMMARY
THE SUMMER FOOD SERVICE PROGRAM
The Summer Food Service Program (SFSP) was established by the National School Lunch Act
of 1968 as the Special Food Service Program for Children (P.L. 90-302).1 In 1975, a separate
Child Care Food Program and a Summer Food Service Program were authorized by an
amendment to the National School Lunch Act (P.L. 94-105).2 The SFSP is intended to ensure
that low-income children continue to receive nutritious meals when school is not in session.
Through the program, approved sponsors provide free meals to children in areas with significant
concentrations of low-income children. Eligible sponsoring organizations include schools,
camps, colleges and universities participating in the National Youth Sports Program (NYSP);
units of Federal, State, or local government; and other community- or faith-based organizations.
Sponsors receive Federal reimbursement from the U.S. Department of Agriculture (USDA)
through their State administering agency to assist with the costs of preparing and serving meals
at feeding sites.
SFSP sites must be located in a low-income area or serve a group with a majority of enrolled
low-income children. The threshold for determining eligibility in low-income areas is defined by
statute (Richard B. Russell National School Lunch Act, 42 U.S.C. 1761) as areas in which at
least 50 percent of the children are eligible for free or reduced price school meals.3 A similar
threshold is established for sites that provide meals to low-income children in other areas, i.e., 50
percent of the children enrolled in the group must be eligible for free or reduced price school
meals.
1 National School Lunch Act of 1968 (P.L. 90-302, Section 3, May 8, 1968; 82 Stat. 117). 2 National School Lunch Act of 1975 (P.L. 94-105, Section 13, October 7, 1975; 89 Stat. 515). 3 A child is eligible for a free school meal if he or she is in a household with income less than 130 percent of the poverty line, in a household getting food stamps or Temporary Assistance for Needy Families (TANF), or in foster care. A child is eligible for a reduced price meal if he or she is in a household with income between 130 and 185 percent of the poverty line.

x
DESCRIPTION OF THE 40 PERCENT SFSP PILOT
The Child Nutrition and WIC Reauthorization Act of 2004 (P.L. 108-265) authorized a pilot to
operate in rural areas of Pennsylvania during the summers of 2005 and 2006.4 The purpose of
the pilot was to test whether lowering the threshold for site eligibility in low-income areas from
50 percent to 40 percent of children eligible for free or reduced price school meals in rural areas
would increase the number of children participating in the Program. Hereafter, these sites will be
referred to as 50-percent sites if they meet the more stringent 50 percent threshold, and as 40-
percent sites if they fail to meet the 50 percent threshold, but do meet the 40 percent threshold.
The authorizing legislation directed USDA through the Food and Nutrition Service (FNS) to
evaluate the impact of the pilot eligibility criterion on:
1. The number of sponsors operating sites that offer meals under the SFSP;
2. The number of sites offering meals through the SFSP;
3. The geographic locations of sites;
4. The services provided to eligible children; and
5. Other factors determined by the Secretary.5
KEY FINDINGS
Effect of Pilot on Number of Sponsors
• During the two years of the pilot, 72 new sponsors began administering rural sites.
In 2005 (the first pilot year), about one-third (10 of 31) of the new rural sponsors were
sponsors of 40-percent sites. In 2006, 7 of the 41 new rural sponsors (17 percent) were
administering 40-percent sites.
4 The Child Nutrition and WIC Reauthorization Act of 2004 (P.L. 108-265, Section 13, June 30, 2004; 118 Stat. 749). 5 The Child Nutrition and WIC Reauthorization Act of 2004 (P.L. 108-265, Section 13, June 30, 2004; 118 Stat. 749).

xi
• Pre-existing SFSP rural sponsors also began administering sites meeting the 40
percent threshold. In 2005, 10 SFSP sponsors already in the program added at least one
40-percent site.
• There is a great amount of fluctuation in and out of the SFSP for sponsors
administering rural sites. Although 72 new SFSP rural sponsors were added to the
Program during the pilot period, 44 SFSP sponsors no longer were administering rural
sites, resulting in a net gain of 28 rural sponsors during that two-year period. Of the 20
rural sponsors serving at least one 40-percent site in 2005, 16 continued serving 40-
percent sites in 2006.
• The characteristics of rural sponsors serving 40-percent sites are similar to
traditional sponsors. Rural sponsors not administering residential camps are mostly
school districts (49 percent) and non-profit organizations (44 percent). This is equally
true of pilot (40-percent) and 50-percent sponsors.
Effect of the Pilot on the Number of Sites
• The number of rural SFSP sites in Pennsylvania increased by 15 percent while the
number of urban SFSP sites declined by 6 percent during the pilot. We cannot say
how much of this increase was due to the pilot and how much to other factors. All rural
sites in Pennsylvania, including residential camps, increased from 385 in 2004 to 444 in
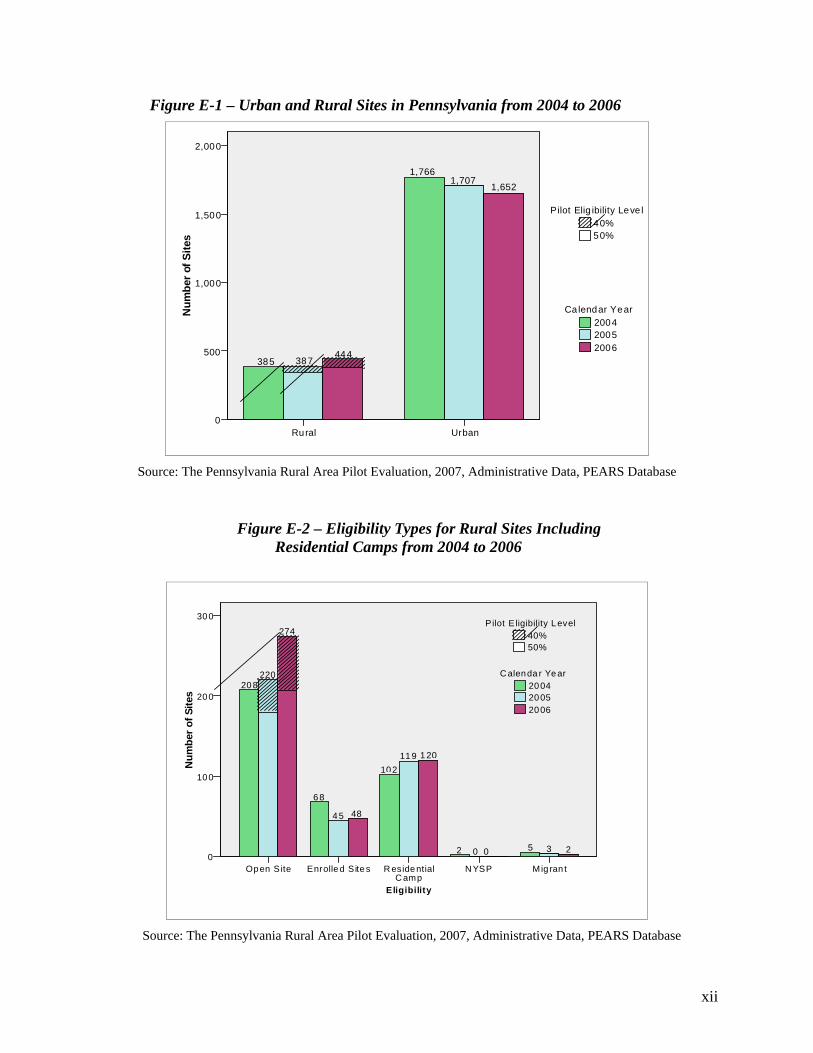
2006, and urban sites decreased from 1,766 to 1,652 (Figure E-1).
• The number of new SFSP sites serving rural areas meeting the 40 percent
threshold increased each year. Forty new 40-percent sites were added in 2005 while
67 new pilot sites were added in 2006. They represented 10 percent of all rural sites in
2005 and 15 percent in 2006. One fourth of the 40-percent sites in 2005 had been SFSP
sites previously that would not have qualified based on area eligibility had the
thresholds not changed to 40 percent.
xii
Figure E-1 – Urban and Rural Sites in Pennsylvania from 2004 to 2006
UrbanRural
Num
ber o
f Site
s
2,000
1,500
1,000
500
0
50%40%
Pilot Elig ibility Leve l
200620052004
Calendar Year
385 387444
1,7661,707
1,652
Source: The Pennsylvania Rural Area Pilot Evaluation, 2007, Administrative Data, PEARS Database
Figure E-2 – Eligibility Types for Rural Sites Including Residential Camps from 2004 to 2006
Eligibility
Mig ran tN YSPR esidential C amp
Enrolle d Site sOpen S ite
Num
ber o
f Site
s
300
200
100
0
50%40%
Pilot E ligibility L evel
200620052004
C alenda r Ye ar20 8
220
274
68
4 5 48
10211 9 1 20
2 0 0 5 3 2
Source: The Pennsylvania Rural Area Pilot Evaluation, 2007, Administrative Data, PEARS Database
xiii
• All of the new rural 40-percent SFSP sites were open sites (where eligibility is based
on area rather than children enrolled). Open sites increased from 208 in 2004 to 274
in 2006 in part due to the increase in pilot sites. However, enrolled sites decreased from
68 in 2004 to 48 in 2006 (Figure E-2).
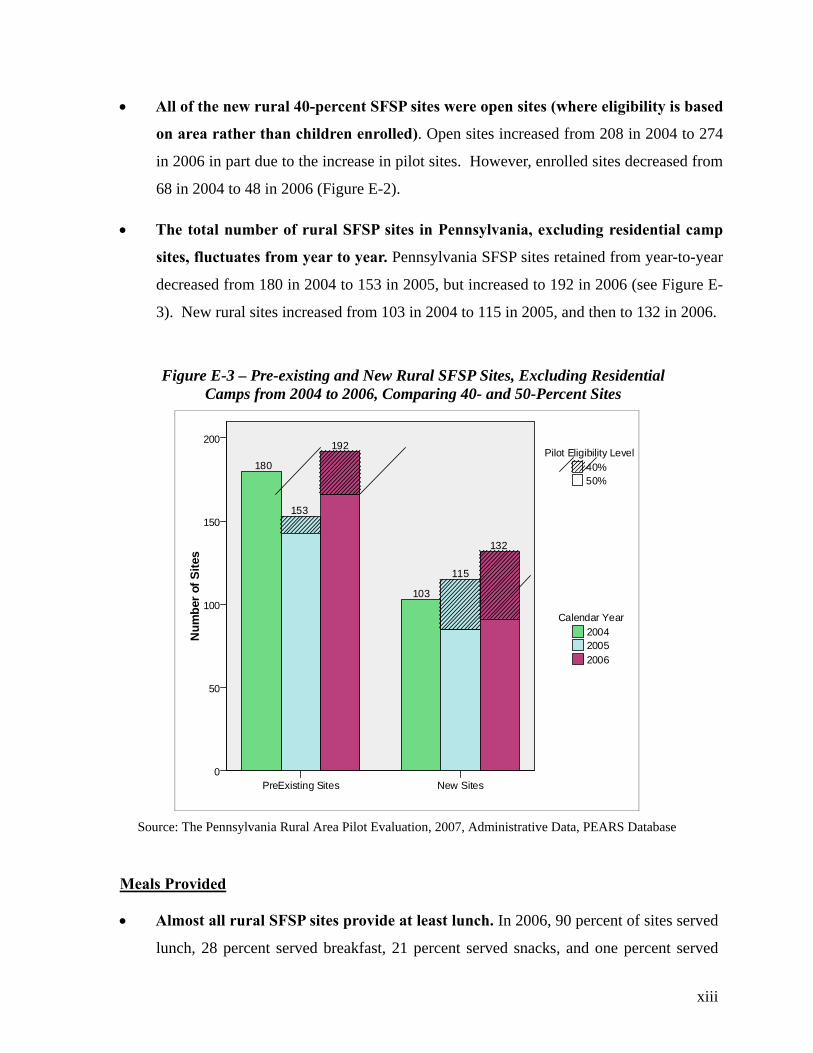
• The total number of rural SFSP sites in Pennsylvania, excluding residential camp
sites, fluctuates from year to year. Pennsylvania SFSP sites retained from year-to-year
decreased from 180 in 2004 to 153 in 2005, but increased to 192 in 2006 (see Figure E-
3). New rural sites increased from 103 in 2004 to 115 in 2005, and then to 132 in 2006.
Figure E-3 – Pre-existing and New Rural SFSP Sites, Excluding Residential Camps from 2004 to 2006, Comparing 40- and 50-Percent Sites
New SitesPreExisting Sites
Num
ber o
f Site
s
200
150
100
50
0
50%40%
Pilot Eligibility Level
200620052004
Calendar Year
180
153
192
103
115
132
Source: The Pennsylvania Rural Area Pilot Evaluation, 2007, Administrative Data, PEARS Database
Meals Provided
• Almost all rural SFSP sites provide at least lunch. In 2006, 90 percent of sites served
lunch, 28 percent served breakfast, 21 percent served snacks, and one percent served

xiv
dinner. About two thirds offered one meal, almost one third offered two meals or a
meal and a snack, and 4 percent offered three meals.
Effect of Geographic Location on Sites
• Despite increases in the number of rural sponsors and sites, there are still areas of
rural poverty not served by SFSP. The areas without SFSP sites are the most rural
areas, which may not have enough density of children to easily establish and maintain
an SFSP site.
• Most sites serve children who live in close proximity to the site. Site sponsors of
both 40-percent and 50-percent sites reported that over 80 percent of the children came
from within a one-mile radius of a site.
Effect of Ancillary Services Provided at the Sites on SFSP Participation
• Activities provided by SFSP sites are important elements in attracting children to
SFSP sites. Among the activities frequently found at SFSP sites are arts and crafts,
structured play, playgrounds, sports, and academic enrichment. About 39 percent of
sites reported activities and meals as equally important. Another 32 percent reported
activities alone and a further 19 percent reported meals alone as the most important
reasons for children’s attendance.
Other Factors Influencing SFSP Participation
• Sponsors expressed concerns about SFSP. The concerns most frequently heard were:
low reimbursements, too many reporting requirements and the short duration of the
pilot – 2 years only.
xv
• Transportation remains an issue. Most sponsors and site administrators reported that
transportation is very important to the success of SFSP in rural areas. Typically,
children walk, ride bikes, or receive rides.
CONCLUSION
In conclusion, lowering the eligibility threshold to 40 percent had the desirable impact of
increasing the number of sponsors and sites. The 15 percent growth in rural SFSP sites and the
addition and retention of 67 new sponsors that accrued during the pilot are indications that
lowering the eligibility threshold from 50 percent to 40 percent has the potential to increase rural
SFSP meal service to poor children in rural areas. Those sponsors and sites serving rural areas
close to the 50 percent threshold may be more inclined to continue serving children in future
years knowing that they may be eligible at the 40 percent threshold, should the legislation be
extended.
Finally, a key finding of the study is that sponsor concerns about the volume of paperwork may
be limiting sponsor participation in SFSP. Therefore, extending the period of certification from
one to three or five years, so that sponsors do not have to re-establish qualification every year,
will likely contribute to sponsor retention and program success.

xvi

1
CHAPTER 1
BACKGROUND
The Summer Food Service Program (SFSP) was established by Congress in 1968, first as the
Special Food Service Program for Children (P.L. 90-302).6 In 1975, a separate Child Care Food
Program and a Summer Food Service Program were authorized (P.L. 94-105).7 As a permanent
entitlement program, the SFSP was authorized to ensure that low-income children continue to
receive nutritious meals when school is not in session. To address a concern that the SFSP was
not adequately reaching children in rural America, the Child Nutrition and WIC Reauthorization
Act of 2004 (P.L. 108-265) authorized a pilot program for rural areas of Pennsylvania during the
summers of 2005 and 2006.8 The purpose of the pilot was to test whether lowering the threshold
for site eligibility in low-income areas from 50 percent to 40 percent of children eligible for free
or reduced price school meals would increase the Program’s reach in rural areas.
Although Pennsylvania has no rural counties with over 20 percent poverty9 131 Pennsylvania
municipalities, 76 of them rural, had persistent poverty rates over 15 percent from 1979 through
2000 (Center for Rural Pennsylvania, 2005). Pennsylvania’s persistently poor municipalities
have lower population densities; are smaller in population and land area than other areas of rural
Pennsylvania; and have residents with lower levels of educational attainment. In these
municipalities, 29 percent of residents did not graduate from high school and less than 10 percent
have a college education, in contrast to non-persistent poverty municipalities where the rates
were 19 percent and 14 percent respectively.
6 National School Lunch Act of 1968 (P. L. 90-302, Section 3, May 8, 1968; 82 Stat. 117). 7 National School Lunch Act of 1975 (P. L. 94-105, Section 13, October 7, 1975; 89 Stat. 515). 8 The Child Nutrition and WIC Reauthorization Act of 2004 (P. L. 108-265, June 30, 2004, 118 Stat. 749). 9 There are seven rural counties with a child poverty rate of 20 percent or over

2
The overall rate of child poverty in Pennsylvania according to US census estimates was 16
percent in 2006. The percent of children eligible for free and reduced lunches in the same year
was 33.9 percent,10 making one in three Pennsylvania children eligible for free or reduced lunch.
DESCRIPTION OF THE SUMMER FOOD SERVICE PROGRAM
To ensure that low-income children continue to receive nutritious meals and snacks when school
is not in session, the Summer Food Service Program (SFSP) provides free meals and snacks that
meet Federal nutrition guidelines to all children at approved SFSP sites in areas with significant
concentrations of low-income children.
The Food and Nutrition Service (FNS) of the U.S. Department of Agriculture (USDA)
administers the SFSP at the national level. Within each State, the Program is administered by the
State Department of Education or an alternate State-designated agency. Locally, public or
private non-profit organizations that want to provide meals and snacks through the SFSP apply to
the State agency. These sponsoring organizations sign annual agreements with their State agency
and are responsible for overseeing SFSP operations. Only certain types of public or private non-
profit organizations may sponsor the SFSP. These include: schools, camps, colleges or
universities participating in the National Youth Sports Program (NYSP), units of Federal, State,
or local government, and other community-based or faith-based organizations. Sponsors receive
Federal reimbursement from the State agency to assist with the administrative and operating
costs for preparing and serving meals and snacks to eligible children (children through age 18 or
disabled persons) at one or more meal sites.11
Meal sites may be located in a variety of settings such as schools, recreation centers,
playgrounds, parks, churches, residential and non-residential camps, housing projects, migrant
centers, and Indian Reservations. To be approved, SFSP sites generally must be located in a low-
income area (open site) or serve children enrolled in a group activity, the majority of whom are
from low-income households (closed, enrolled site). The threshold for determining the eligibility
of open sites in low-income areas is defined by statute (Richard B. Russell National School
10 It increased to 34.9 by 2006. 11 The Child Nutrition and WIC Reauthorization Act of 2004 (P. L. 108–265, Section 13, June 30, 2004; 118 Stat.
749).

3
Lunch Act, 42 U.S.C. 1761) as areas in which at least 50 percent of the children are eligible for
free or reduced price school meals.12 A similar threshold is established for closed, enrolled sites
that provide meals to low-income children in other areas – 50 percent of the children enrolled in
the group activity must be eligible for free or reduced price school meals.
DESCRIPTION OF THE 40 PERCENT SFSP PILOT
The Child Nutrition and WIC Reauthorization Act of 2004 (P.L. 108-265) authorized the pilot to
operate in the rural areas of Pennsylvania during the summers of 2005 and 2006.13 The purpose
of the pilot was to test whether lowering the threshold for site eligibility in low-income areas
from 50 percent to 40 percent of children eligible for free or reduced-price school meals would
increase the Program’s reach in rural areas. The authorizing legislation directed USDA, through
FNS, to evaluate the effectiveness of the pilot for the summers of 2005 and 2006. The research
objective was to assess the impact of the pilot threshold on:
1. The number of sponsors operating sites that offer meals under the FSP;
2. The number of sites offering meals through the SFSP;
3. The geographic locations of sites;
4. The services provided to eligible children; and
5. Other factors determined by the Secretary.
EVALUATION METHODS
The evaluation methods focused on the five research objectives stated in the legislation, and on
assessing the impact of the change in the eligibility criterion on the number of sponsors, number
of sites, geographic location of sites, services provided to children and other factors. Data were
collected through three methods – visits to sponsors, randomly sampled site monitor records,
administrative data and a survey.
12 A child is eligible for a free school meal if he or she is in a household with income less than 130 percent of the
poverty line, in a household getting food stamps or Temporary Assistance for Needy Families (TANF), or in foster care. A child is eligible for a reduced price meal if he or she is in a household with income between 130 and 185 percent of the poverty line.
13 The Child Nutrition and WIC Reauthorization Act of 2004 (Public Law 108-265, June 30, 2004, 118 Stat. 749).
4
2005 Sponsor Visits
Eight out of 133 rural sponsors of the Pennsylvania SFSP were visited in the fall of 2005 to
obtain information on the basic operations of sponsors and their sites. Sponsors were selected
for the visits to reflect the diversity of organizational type, size, and location. Priority in
selection was given to sponsors with 40-percent sites. Pennsylvania sponsors differed widely in
their organization type and characteristics. For example, some encompassed entire school
districts, while others were non-profit organizations. Some were new to SFSP in 2005, while
others had been in the program for many years.
The following eight sponsors were visited:
1. Armstrong Board of Commissioners in Kittaning
2. Greater Susquehanna Valley YMCA in Milton
3. Marion Center School District in Marion Center
4. Northwest Tri-County IU 5 in Erie
5. Pocono Mountain School District in Swiftwater
6. Somerset Area School District in Somerset
7. West Branch Area School District in Morrisdale
8. Westmoreland County Food Bank in Delmont
Administrative Data
The Pennsylvania Department of Education maintains administrative data to track contract
information, eligibility determination, program characteristics, and meals served to participants.
The data are maintained in a web-based database called the Pennsylvania Department of
Education’s Child Nutrition Program Electronic Application and Reimbursement Systems
(PEARS) database. Unfortunately, the Pennsylvania Department of Education information
technology contractor was unable to provide SFSP data in a format required for efficient and
timely analysis of historical activity prior to 2004. This report therefore only includes analysis of
data from the summers of 2004, 2005, and 2006.
5
Survey of Site and Sponsor Administrators
In 2006 and 2007, the research team administered a survey to rural sites and sponsors of rural
sites not including residential camps that participated in the SFSP in the summer of 2006.
Sponsors were surveyed online, and sites were given the option of completing the survey either
online or by mail. The response rates for the sponsor and site surveys were 76 percent and 48
percent respectively.
Geographic analysis consisted of an analysis of the distance children travel to sites and a series
of maps showing the location of sites in relation to population centers and poverty.
Study Limitations
Three significant limitations of the research need to be kept in mind when reviewing results of
the pilot. Pennsylvania was only able to supply screen-by-screen read-only access to
administrative data, not an electronic data file. This required the research team to download
individual screens for each site, and use an algorithm to parse needed data. Some data was also
transcribed by hand to build an analysis file. As a result, data used for the study only go back to
2004, the year prior to the pilot. Without earlier data, the report is unable to determine how pilot
results compare to continuing or potential long-term trends in the Pennsylvania SFSP. In
addition, there is no comparison group to the pilot. The report does not examine data from rural
areas of states comparable to Pennsylvania, so the report cannot say whether an increase or
decrease in sponsors and meal sites is potentially attributable to the pilot, or to broader national
trends that exist in rural areas outside Pennsylvania. Finally, study resources were insufficient to
determine the food security status of children served by pilot meal sites; whether participating
children qualified for free, reduced price, or paid status in the school lunch and breakfast
programs; or whether they participated in other assistance programs, such as the Food Stamp
Program.

6

7
CHAPTER 2
FINDINGS
The Child Nutrition and WIC Reauthorization Act of 2004 (P.L. 108-265)14 directed the U.S.
Department of Agriculture to conduct the Pennsylvania Rural Area Eligibility Pilot Evaluation
for the purpose of measuring whether lowering the threshold for site eligibility in low-income
areas from 50 percent to 40 percent of children eligible for free or reduced price school meals
would increase the numbers of sponsors and sites in rural areas, and the provision of services to
children in different geographical areas. The evaluation compared sites that qualified under the
50 percent and 40 percent thresholds (hereafter referred to as 50-percent sites and 40-percent
sites respectively) with respect to five outcomes: (1) increases in the numbers of sponsors, (2)
increases in the numbers of sites, (3) the effect of the geographic locations of sites on increasing
participation, (4) the effect of ancillary services provided at the sites on attracting participants,
and (5) the influence of other factors on program participation.
SPONSORS OF THE SUMMER FOOD SERVICE PROGRAM
Sponsors of SFSP sites are of a variety of sizes and types. Some are very large, administering
hundreds of urban and rural sites, while others are small, administering only one or two sites.
The focus of the evaluation is on rural sponsoring organizations defined as any sponsor with at
least one rural site. An urban sponsor is defined as one that had only urban sites.
Table 1 summarizes the number of urban and rural sponsors and their size distribution based on
the number of sites they administer. The categories on Table 1 are not overlapping, for instance a
14 The Child Nutrition and WIC Reauthorization Act of 2004 (P. L. 108–265, Section 13, June 30, 2004; 118 Stat.
749).
8
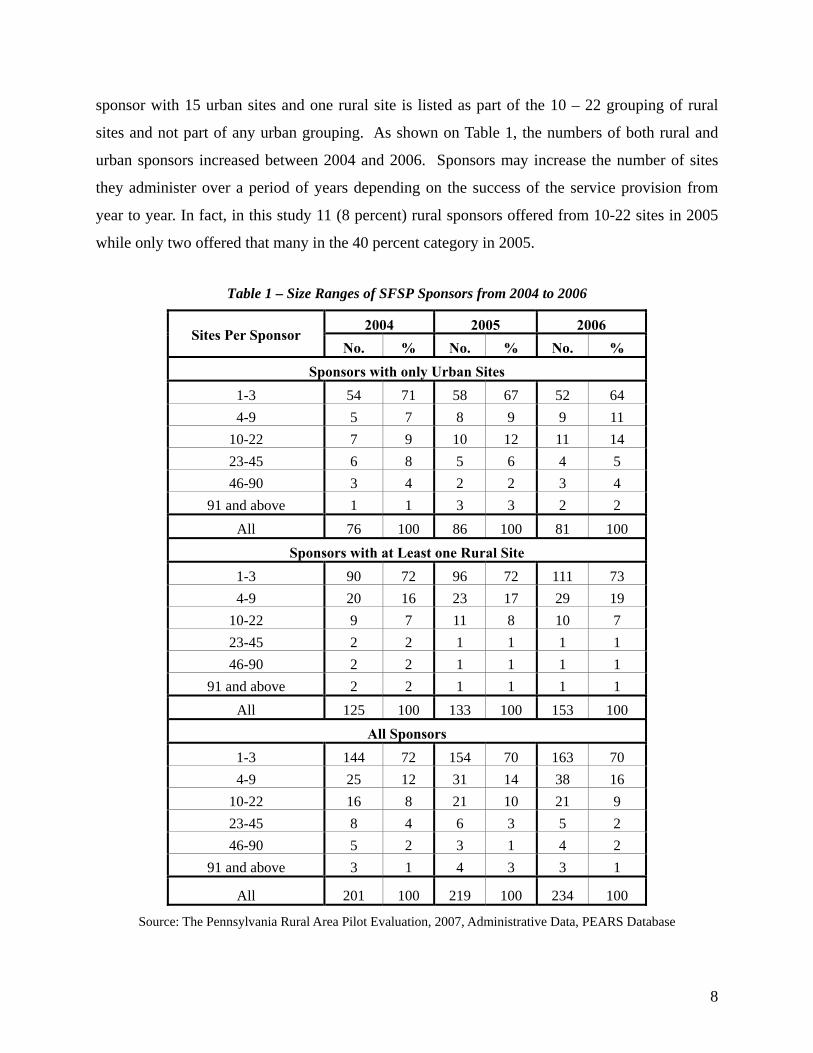
sponsor with 15 urban sites and one rural site is listed as part of the 10 – 22 grouping of rural
sites and not part of any urban grouping. As shown on Table 1, the numbers of both rural and
urban sponsors increased between 2004 and 2006. Sponsors may increase the number of sites
they administer over a period of years depending on the success of the service provision from
year to year. In fact, in this study 11 (8 percent) rural sponsors offered from 10-22 sites in 2005
while only two offered that many in the 40 percent category in 2005.
Table 1 – Size Ranges of SFSP Sponsors from 2004 to 2006
2004 2005 2006 Sites Per Sponsor
No. % No. % No. % Sponsors with only Urban Sites
1-3 54 71 58 67 52 64 4-9 5 7 8 9 9 11
10-22 7 9 10 12 11 14 23-45 6 8 5 6 4 5 46-90 3 4 2 2 3 4
91 and above 1 1 3 3 2 2 All 76 100 86 100 81 100
Sponsors with at Least one Rural Site 1-3 90 72 96 72 111 73 4-9 20 16 23 17 29 19
10-22 9 7 11 8 10 7 23-45 2 2 1 1 1 1 46-90 2 2 1 1 1 1
91 and above 2 2 1 1 1 1 All 125 100 133 100 153 100
All Sponsors 1-3 144 72 154 70 163 70 4-9 25 12 31 14 38 16
10-22 16 8 21 10 21 9 23-45 8 4 6 3 5 2 46-90 5 2 3 1 4 2
91 and above 3 1 4 3 3 1
All 201 100 219 100 234 100
Source: The Pennsylvania Rural Area Pilot Evaluation, 2007, Administrative Data, PEARS Database

9
A comparison of rural sponsors that have at least one 40 percent site with those that have only
50-percent sites is shown on Table 2. Fifty-seven to 60 percent of rural 40 percent sponsors have
1-3 sites only, compared to 72 to 75 percent of 50 percent sponsors.
Table 2 – Sponsor Size Range by Year and by 40- and 50-Percent Sites from 2004 to 2006
Sponsors with at least one 40% Site
Sponsors with only 50% Sites
Total Sponsors
2005 2006 2004 2005 2006 2004 2005 2006Sites per Rural
Sponsor No. % No. % No. % No. % No. % No. % No. % No. %
1-3 12 60 13 57 90 72 84 74 98 75 90 72 96 72 111 73
4-9 4 20 6 26 20 16 19 17 23 18 20 16 23 17 29 19
10-22 2 10 2 9 9 7 9 8 8 6 9 7 11 8 10 7
23-45 1 5 1 4 2 2 0 0 0 0 2 2 1 1 1 1
46-90 1 5 1 4 2 2 0 0 0 0 2 2 1 1 1 1
91 and above 0 0 0 0 2 2 1 1 1 1 2 2 1 1 1 1
Total Sponsors 20 100 23 100 125 100 113 100 130 100 125 100 133 100 153 100
Source: The Pennsylvania Rural Area Pilot Evaluation, 2007, Administrative Data, PEARS Database
Table 3 shows the number and increase in sponsors administering rural sites. In 2005 there were
102 pre-existing rural sponsors in the program. Thirty-one new rural sponsors joined the
program bringing the total to 133 rural sponsors in 2005. However, 23 rural sponsors left the
program, leaving a net gain of 8 rural sponsors in 2005.
Table 3 – Change in SFSP Sponsors Administering Rural Sites in Pennsylvania, Excluding Residential Camps from 2005 to 2006
Sponsor Type 2005 2006 Change from 2005 to 2006
Pre-Existing Rural Sponsors 102 112 10
New Rural Sponsors 31 41 10
Total 133 153 20
Departing Sponsors 23 21 -2
Net Gain 8 20 12
Source: The Pennsylvania Rural Area Pilot Evaluation, 2007, Administrative Data, PEARS Database
10
Similarly, in 2006, there were 112 pre-existing rural sponsors and 41 new ones joined the
program while 21 departed, leaving a net gain of 20 rural sponsors in 2006. Thus between 2005
and 2006, rural sponsors increased from 133 to 153 (or 15 percent).
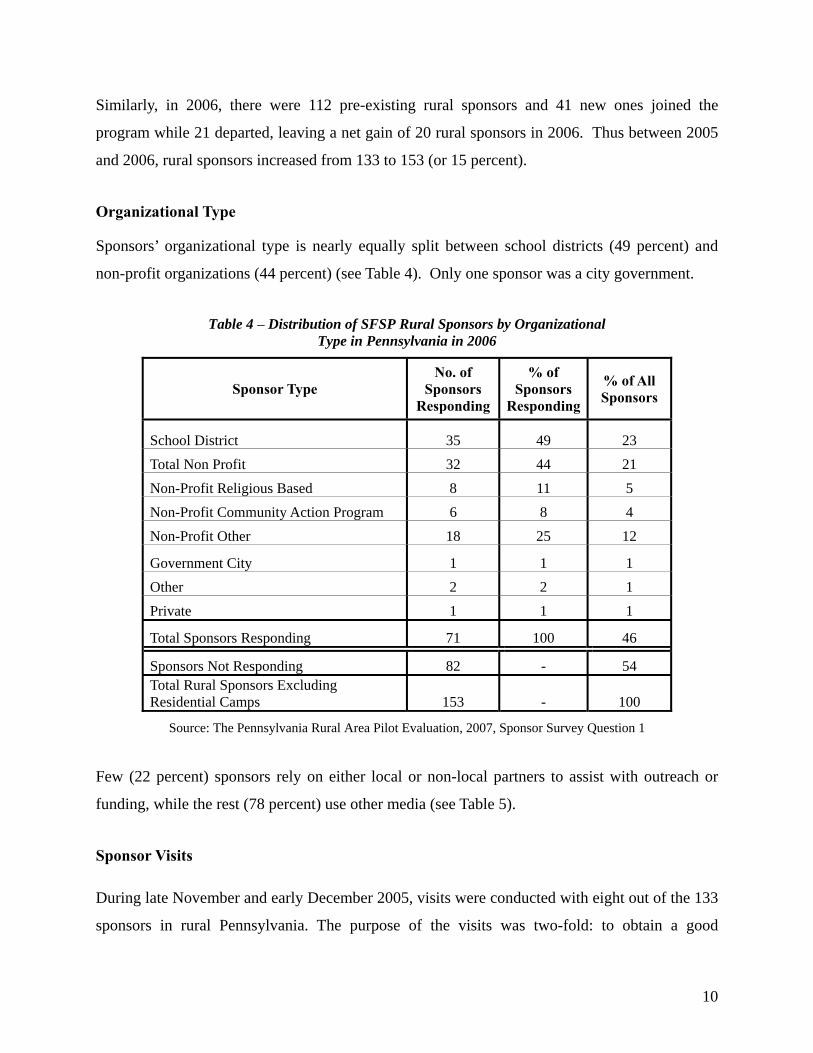
Organizational Type
Sponsors’ organizational type is nearly equally split between school districts (49 percent) and
non-profit organizations (44 percent) (see Table 4). Only one sponsor was a city government.
Table 4 – Distribution of SFSP Rural Sponsors by Organizational Type in Pennsylvania in 2006
Sponsor Type No. of
Sponsors Responding
% of Sponsors
Responding
% of All Sponsors
School District 35 49 23 Total Non Profit 32 44 21 Non-Profit Religious Based 8 11 5 Non-Profit Community Action Program 6 8 4 Non-Profit Other 18 25 12
Government City 1 1 1 Other 2 2 1 Private 1 1 1
Total Sponsors Responding 71 100 46
Sponsors Not Responding 82 - 54 Total Rural Sponsors Excluding Residential Camps 153 - 100
Source: The Pennsylvania Rural Area Pilot Evaluation, 2007, Sponsor Survey Question 1
Few (22 percent) sponsors rely on either local or non-local partners to assist with outreach or
funding, while the rest (78 percent) use other media (see Table 5).
Sponsor Visits
During late November and early December 2005, visits were conducted with eight out of the 133
sponsors in rural Pennsylvania. The purpose of the visits was two-fold: to obtain a good
11
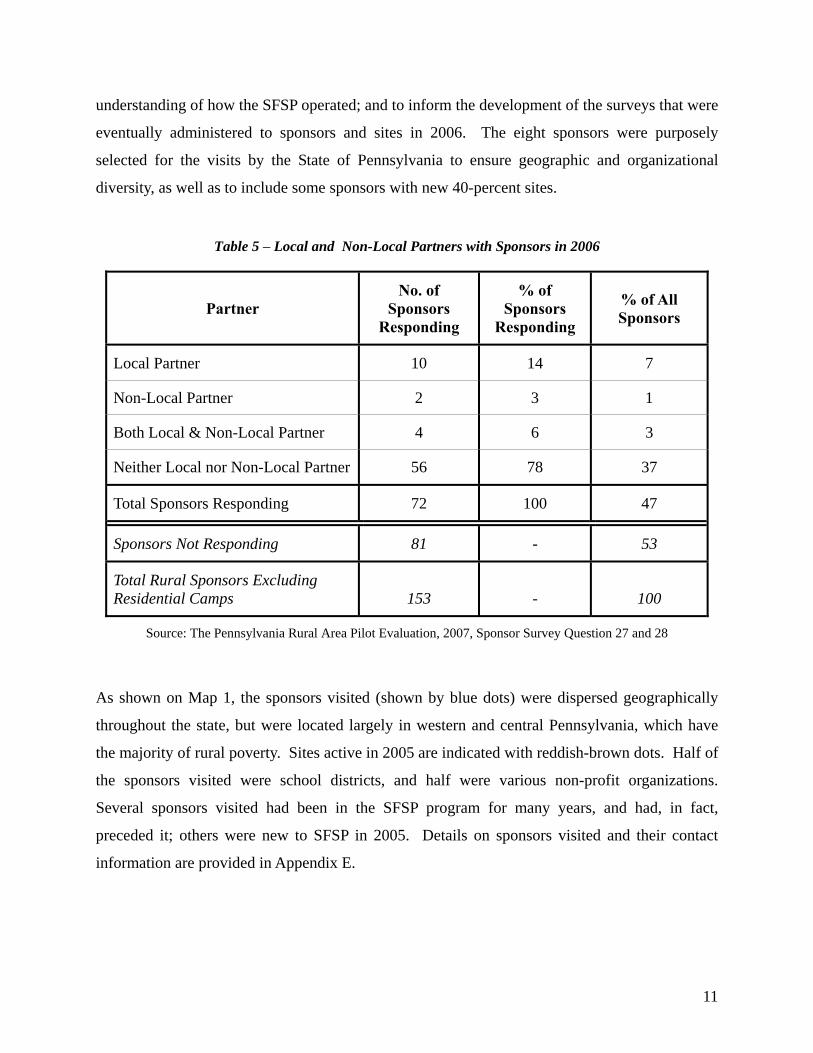
understanding of how the SFSP operated; and to inform the development of the surveys that were
eventually administered to sponsors and sites in 2006. The eight sponsors were purposely
selected for the visits by the State of Pennsylvania to ensure geographic and organizational
diversity, as well as to include some sponsors with new 40-percent sites.
Table 5 – Local and Non-Local Partners with Sponsors in 2006
Partner No. of
Sponsors Responding
% of Sponsors
Responding
% of All Sponsors
Local Partner 10 14 7
Non-Local Partner 2 3 1
Both Local & Non-Local Partner 4 6 3
Neither Local nor Non-Local Partner 56 78 37
Total Sponsors Responding 72 100 47
Sponsors Not Responding 81 - 53
Total Rural Sponsors Excluding Residential Camps 153 - 100
Source: The Pennsylvania Rural Area Pilot Evaluation, 2007, Sponsor Survey Question 27 and 28
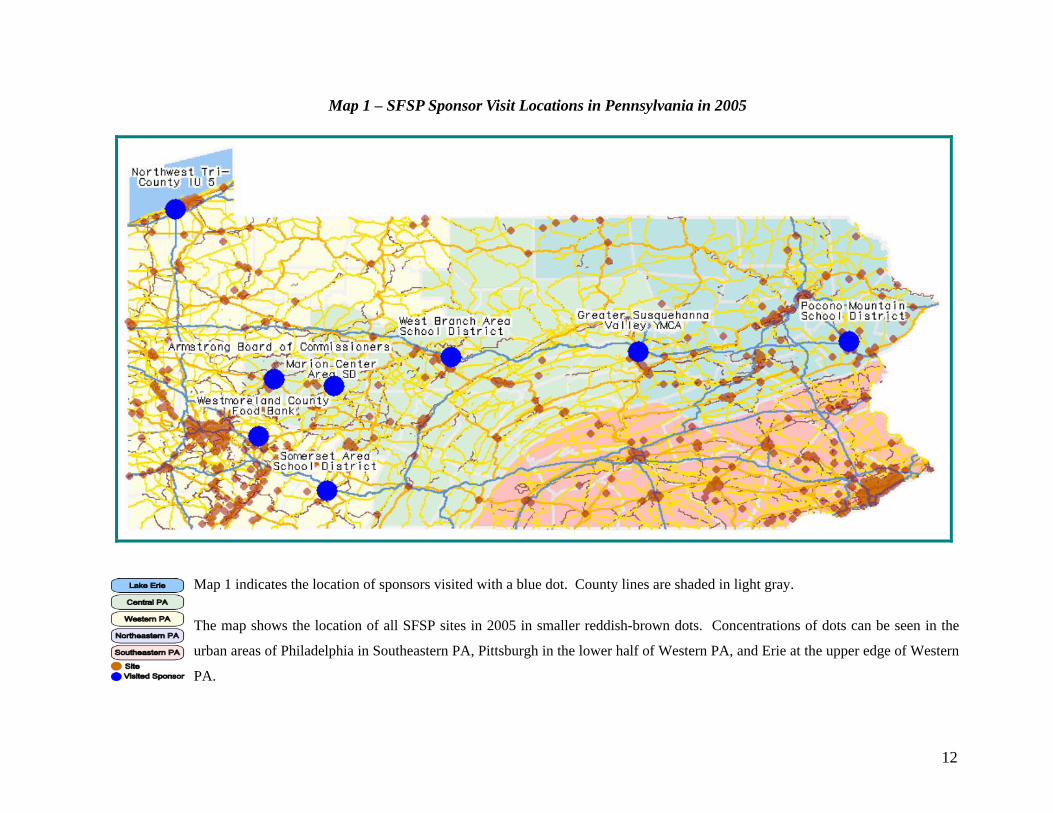
As shown on Map 1, the sponsors visited (shown by blue dots) were dispersed geographically
throughout the state, but were located largely in western and central Pennsylvania, which have
the majority of rural poverty. Sites active in 2005 are indicated with reddish-brown dots. Half of
the sponsors visited were school districts, and half were various non-profit organizations.
Several sponsors visited had been in the SFSP program for many years, and had, in fact,
preceded it; others were new to SFSP in 2005. Details on sponsors visited and their contact
information are provided in Appendix E.
12
Map 1 – SFSP Sponsor Visit Locations in Pennsylvania in 2005
Map 1 indicates the location of sponsors visited with a blue dot. County lines are shaded in light gray.
The map shows the location of all SFSP sites in 2005 in smaller reddish-brown dots. Concentrations of dots can be seen in the
urban areas of Philadelphia in Southeastern PA, Pittsburgh in the lower half of Western PA, and Erie at the upper edge of Western
PA.
13
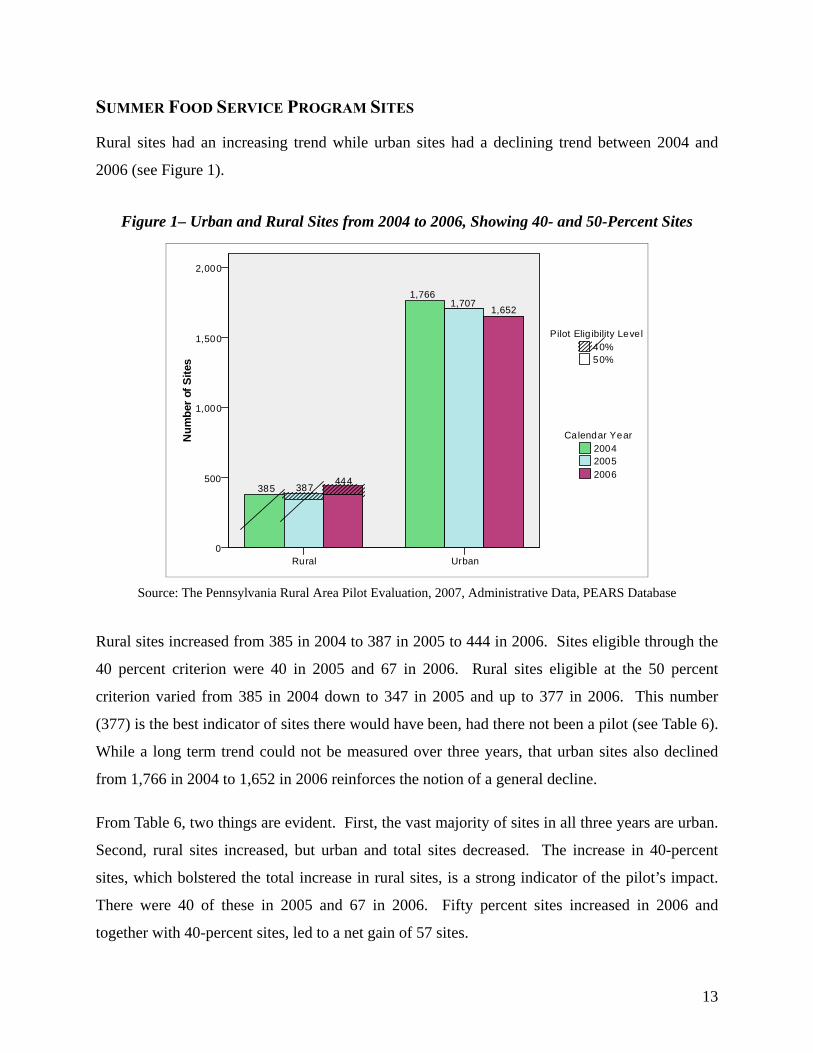
SUMMER FOOD SERVICE PROGRAM SITES
Rural sites had an increasing trend while urban sites had a declining trend between 2004 and
2006 (see Figure 1).
Figure 1– Urban and Rural Sites from 2004 to 2006, Showing 40- and 50-Percent Sites
UrbanRural
Num
ber o
f Site
s
2,000
1,500
1,000
500
0
50%40%
Pilot Elig ibility Level
200620052004
Calendar Year
385 387444
1,7661,707
1,652
Source: The Pennsylvania Rural Area Pilot Evaluation, 2007, Administrative Data, PEARS Database
Rural sites increased from 385 in 2004 to 387 in 2005 to 444 in 2006. Sites eligible through the
40 percent criterion were 40 in 2005 and 67 in 2006. Rural sites eligible at the 50 percent
criterion varied from 385 in 2004 down to 347 in 2005 and up to 377 in 2006. This number
(377) is the best indicator of sites there would have been, had there not been a pilot (see Table 6).
While a long term trend could not be measured over three years, that urban sites also declined
from 1,766 in 2004 to 1,652 in 2006 reinforces the notion of a general decline.
From Table 6, two things are evident. First, the vast majority of sites in all three years are urban.
Second, rural sites increased, but urban and total sites decreased. The increase in 40-percent
sites, which bolstered the total increase in rural sites, is a strong indicator of the pilot’s impact.
There were 40 of these in 2005 and 67 in 2006. Fifty percent sites increased in 2006 and
together with 40-percent sites, led to a net gain of 57 sites.

14
Table 6 – Urban and Rural SFSP Sites in Pennsylvania by Year from 2004 to 2006
40% 50% Total
2005 2006 2004 2005 2006 2004 2005 2006
No. % No. % No. % No. % No. % No. % No. % No. %
Urban NA NA NA NA 1,766 100 1,707 100 1,652 100 1,766 100 1,707 100 1,652 100
Rural 40 10 67 15 385 100 347 90 377 85 385 100 387 100 444 100
Total 40 2 67 3 2,151 100 2,054 98 2,029 97 2,151 100 2,094 100 2,096 100
Source: The Pennsylvania Rural Area Pilot Evaluation, 2007, Administrative Data, PEARS Database
The 40-percent sites were 10 percent of rural sites in 2005, and 15 percent of rural sites in 2006
(see Figure 2).
Figure 2 – The Number and Percentage of 40 and 50 Percent Rural Sites from 2004 to 2006
R ura l
Num
ber o
f Site
s
500
400
300
200
100
0
50%40%
Pilot Elig ibility Leve l
200620052004
Ca lendar Year
385 387 444
385
40
347
67
37790% 85%100%
10%
15%
Source: The Pennsylvania Rural Area Pilot Evaluation, 2007, Administrative Data, PEARS Database
15
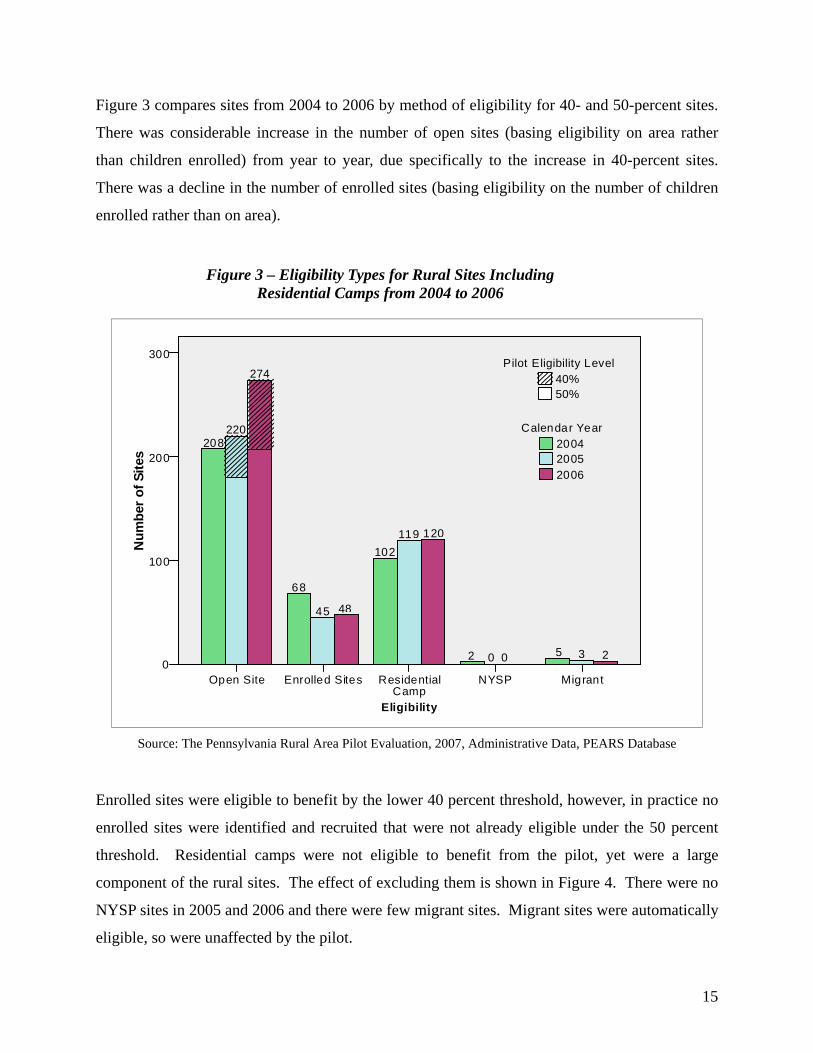
Figure 3 compares sites from 2004 to 2006 by method of eligibility for 40- and 50-percent sites.
There was considerable increase in the number of open sites (basing eligibility on area rather
than children enrolled) from year to year, due specifically to the increase in 40-percent sites.
There was a decline in the number of enrolled sites (basing eligibility on the number of children
enrolled rather than on area).
Figure 3 – Eligibility Types for Rural Sites Including Residential Camps from 2004 to 2006
Eligibility
MigrantNYSPResidential Camp
Enrolled SitesOpen Site
Num
ber o
f Site
s
300
200
100
0
50%40%
Pilot Eligibility Level
200620052004
Calendar Year208
220
274
68
45 48
102119 120
2 0 0 5 3 2
Source: The Pennsylvania Rural Area Pilot Evaluation, 2007, Administrative Data, PEARS Database
Enrolled sites were eligible to benefit by the lower 40 percent threshold, however, in practice no
enrolled sites were identified and recruited that were not already eligible under the 50 percent
threshold. Residential camps were not eligible to benefit from the pilot, yet were a large
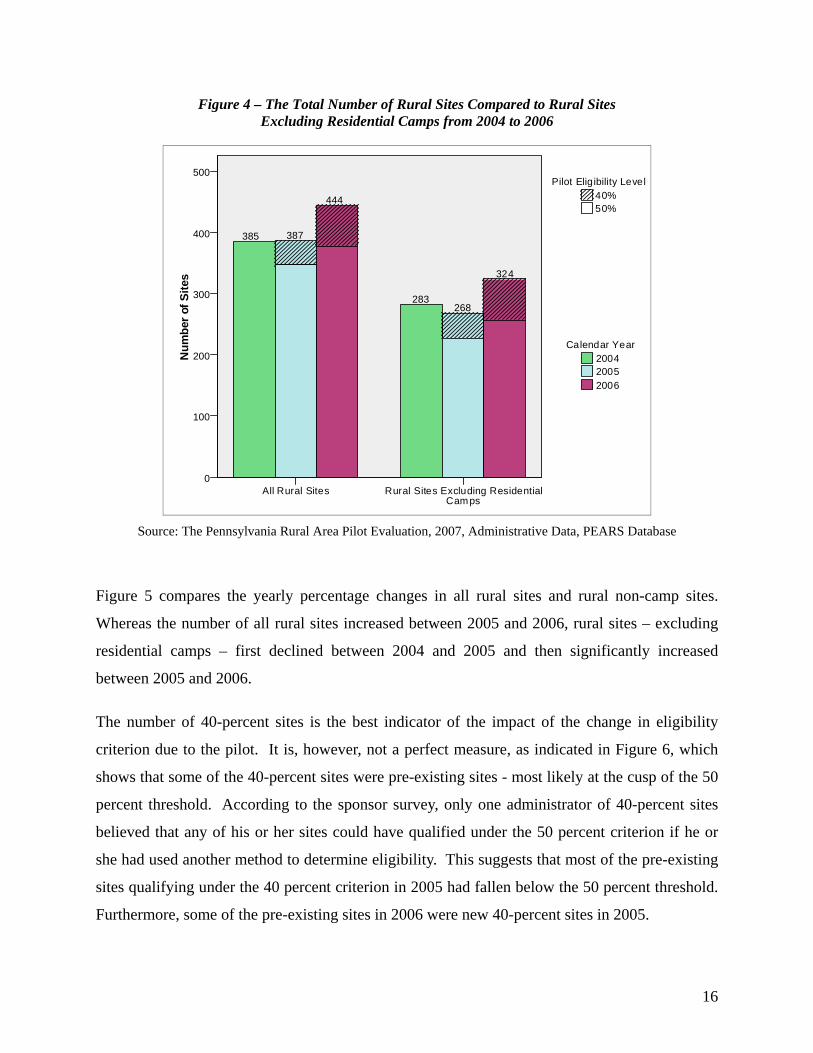
component of the rural sites. The effect of excluding them is shown in Figure 4. There were no
NYSP sites in 2005 and 2006 and there were few migrant sites. Migrant sites were automatically
eligible, so were unaffected by the pilot.
16
Figure 4 – The Total Number of Rural Sites Compared to Rural Sites Excluding Residential Camps from 2004 to 2006
Rural Sites Excluding Residential Camps
All Rural Sites
Num
ber o
f Site
s500
400
300
200
100
0
50%40%
Pilot Eligibility Level
200620052004
Calendar Year
385 387
444
283268
324
Source: The Pennsylvania Rural Area Pilot Evaluation, 2007, Administrative Data, PEARS Database
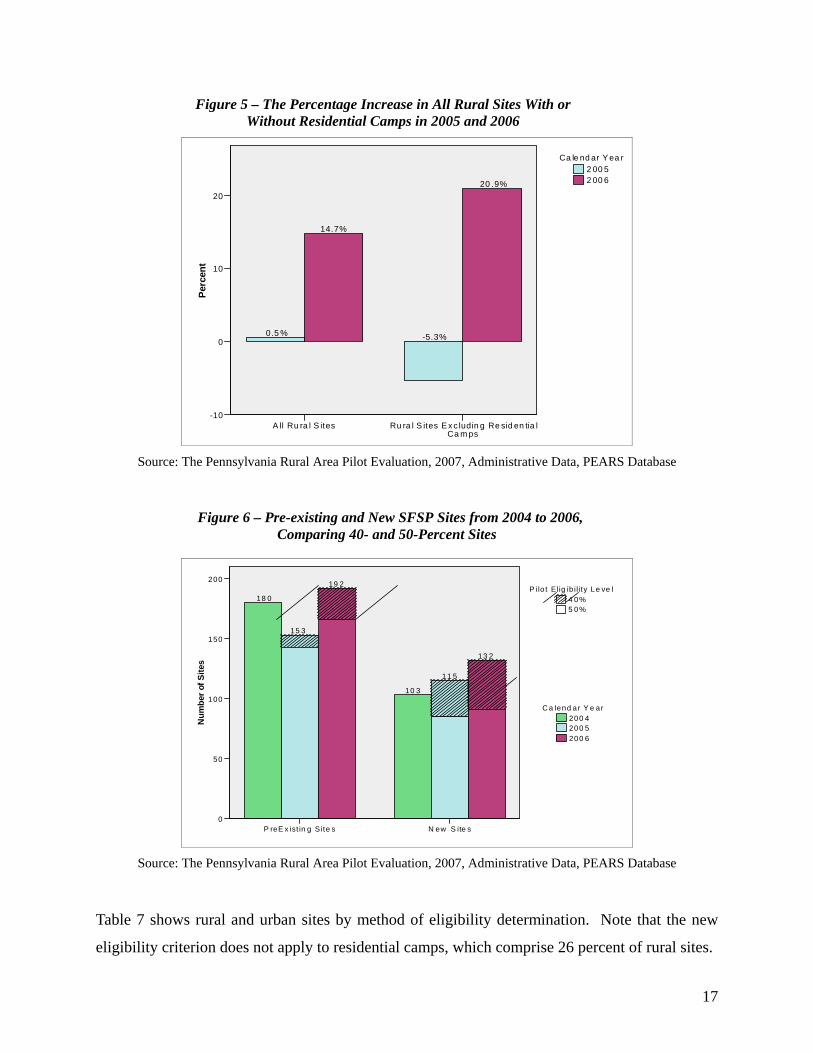
Figure 5 compares the yearly percentage changes in all rural sites and rural non-camp sites.
Whereas the number of all rural sites increased between 2005 and 2006, rural sites – excluding
residential camps – first declined between 2004 and 2005 and then significantly increased
between 2005 and 2006.
The number of 40-percent sites is the best indicator of the impact of the change in eligibility
criterion due to the pilot. It is, however, not a perfect measure, as indicated in Figure 6, which
shows that some of the 40-percent sites were pre-existing sites - most likely at the cusp of the 50
percent threshold. According to the sponsor survey, only one administrator of 40-percent sites
believed that any of his or her sites could have qualified under the 50 percent criterion if he or
she had used another method to determine eligibility. This suggests that most of the pre-existing
sites qualifying under the 40 percent criterion in 2005 had fallen below the 50 percent threshold.
Furthermore, some of the pre-existing sites in 2006 were new 40-percent sites in 2005.
17
Figure 5 – The Percentage Increase in All Rural Sites With or Without Residential Camps in 2005 and 2006
Ru ra l S ites E x c ludin g Re sid en tia l Ca m ps
A ll Ru ra l S ites
Perc
ent
20
10
0
-10
2 00 62 00 5
Ca le nd ar Y ea r
0.5 %
14.7%
-5.3%
20 .9%
Source: The Pennsylvania Rural Area Pilot Evaluation, 2007, Administrative Data, PEARS Database
Figure 6 – Pre-existing and New SFSP Sites from 2004 to 2006, Comparing 40- and 50-Percent Sites
N ew S ite sP reE x ist in g S ite s
Num
ber o
f Site
s
200
150
100
50
0
5 0%4 0%
P ilo t Elig ib ility Le ve l
200 6200 5200 4
C a lend ar Y e ar
18 0
15 3
19 2
10 3
11 5
13 2
Source: The Pennsylvania Rural Area Pilot Evaluation, 2007, Administrative Data, PEARS Database
Table 7 shows rural and urban sites by method of eligibility determination. Note that the new
eligibility criterion does not apply to residential camps, which comprise 26 percent of rural sites.

18
Table 7 – Number of SFSP Sites by Eligibility Method in Pennsylvania from 2004 to 2006
40% 50% Total
2005 2006 2004 2005 2006 2004 2005 2006 Type of Site by
Eligibility Criterion Used
No. % No. % No. % No. % No. % No. % No. % No. %
Urban Open Site 0 0 0 0 1,634 100 1,608 100 1,566 100 1,634 100 1,608 100 1,566 100 Enrolled Site 0 0 0 0 108 100 72 100 66 100 108 100 72 100 66 100 Residential Camp 0 0 0 0 16 100 17 100 15 100 16 100 17 100 15 100 NYSP 0 0 0 0 4 100 6 100 1 100 4 100 6 100 1 100 Migrant 0 0 0 0 4 100 4 100 4 100 4 100 4 100 4 100
Total 0 0 0 0 1,766 100 1,707 100 1,652 100 1,766 100 1,707 100 1,652 100
Rural Open Site 40 18 67 24 208 100 180 82 207 76 208 100 220 100 274 100 Enrolled Site 0 0 0 0 68 100 45 100 48 100 68 100 45 100 48 100 Residential Camp 0 0 0 0 102 100 119 100 120 100 102 100 119 100 120 100 NYSP 0 NA 0 NA 2 100 0 NA 0 NA 2 100 0 NA 0 NA Migrant 0 0 0 0 5 100 3 100 2 100 5 100 3 100 2 100
Total 40 10 67 15 385 100 347 90 377 85 385 100 387 100 444 100
Total Open Site 40 2 67 4 1,842 100 1,788 98 1,773 96 1,842 100 1,828 100 1,840 100 Enrolled Site 0 0 0 0 2136 100 2041 100 2022 100 2136 100 2081 100 2089 100 Residential Camp 0 0 0 0 118 100 136 100 135 100 118 100 136 100 135 100 NYSP 0 0 0 0 6 100 6 100 1 100 6 100 6 100 1 100 Migrant 0 0 0 0 9 100 7 100 6 100 9 100 7 100 6 100
Total 40 2 67 3 2,151 100 2,054 98 2,029 97 2,151 100 2,094 100 2,096 100
Source: The Pennsylvania Rural Area Pilot Evaluation, 2007, Administrative Data, PEARS Database
19
By excluding residential camps from a calculation of growth rates of rural sites, the pilot’s
impact seems greater than shown in Figures 5 and 6. Enrolled sites (basing eligibility on family
income of children enrolled rather than on area) drops from 68 percent in 2004 (the year prior to
the pilot), to 45 in 2005, and increased to 48 in 2006. All rural sites increased in 2006 by 57,
from 387 to 444 (15 percent), while rural sites excluding residential camps, rose by 56, from 268
to 324 (21 percent).
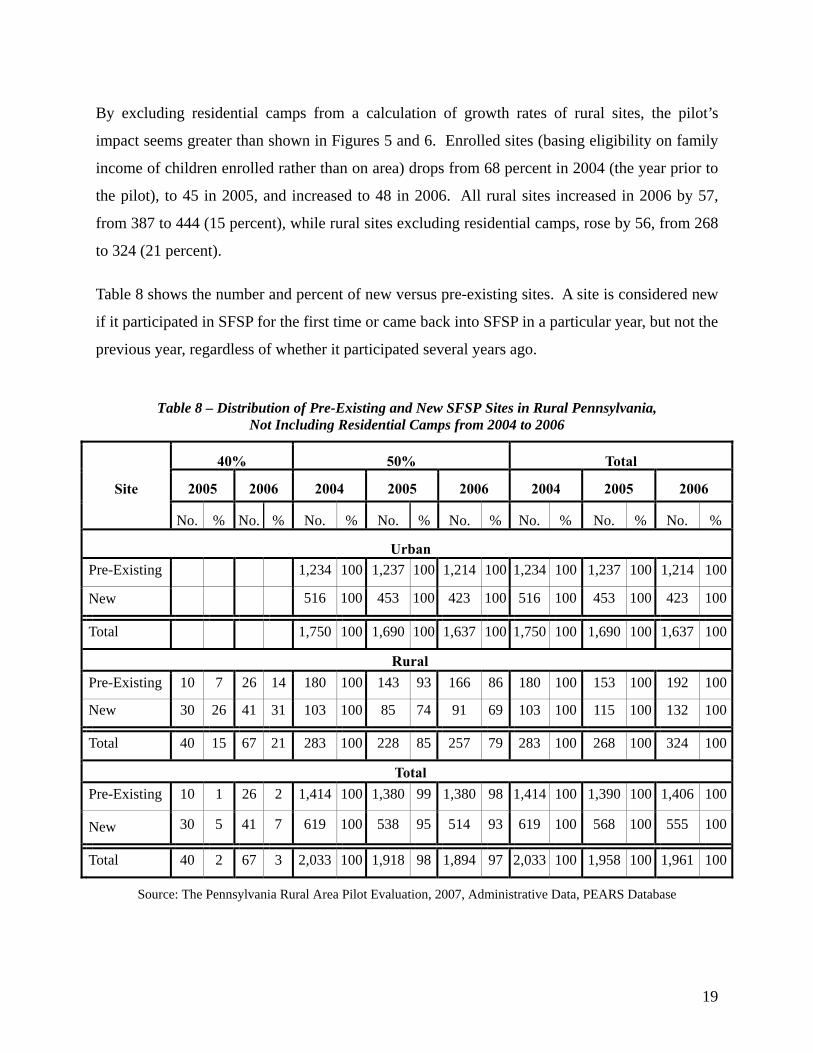
Table 8 shows the number and percent of new versus pre-existing sites. A site is considered new
if it participated in SFSP for the first time or came back into SFSP in a particular year, but not the
previous year, regardless of whether it participated several years ago.
Table 8 – Distribution of Pre-Existing and New SFSP Sites in Rural Pennsylvania, Not Including Residential Camps from 2004 to 2006
40% 50% Total
2005 2006 2004 2005 2006 2004 2005 2006 Site
No. % No. % No. % No. % No. % No. % No. % No. %
Urban
Pre-Existing 1,234 100 1,237 100 1,214 100 1,234 100 1,237 100 1,214 100
New 516 100 453 100 423 100 516 100 453 100 423 100
Total 1,750 100 1,690 100 1,637 100 1,750 100 1,690 100 1,637 100
Rural
Pre-Existing 10 7 26 14 180 100 143 93 166 86 180 100 153 100 192 100
New 30 26 41 31 103 100 85 74 91 69 103 100 115 100 132 100
Total 40 15 67 21 283 100 228 85 257 79 283 100 268 100 324 100
Total
Pre-Existing 10 1 26 2 1,414 100 1,380 99 1,380 98 1,414 100 1,390 100 1,406 100
New 30 5 41 7 619 100 538 95 514 93 619 100 568 100 555 100
Total 40 2 67 3 2,033 100 1,918 98 1,894 97 2,033 100 1,958 100 1,961 100
Source: The Pennsylvania Rural Area Pilot Evaluation, 2007, Administrative Data, PEARS Database

20
Table 8 highlights two issues. First, both site recruitment and retention are important. In 2005,
there were 115 new rural sites (43 percent), but they were not enough to stem the loss of 130
rural sites. Despite high recruitment, rural sites declined from 283 to 268. Recruitment of new
sites increased in 2006 by 132, while 76 rural sites left the program, for a net gain of 41 sites in
the two-year period. A comparison of the 26 existing 40-percent sites in Summer 2006 with the
40 total sites in Summer 2005 shows that roughly 15 40-percent sites (39 percent) from Summer
2005 dropped out by 2006. This loss rate exceeds the loss rate of 32 percent15 for all rural sites
between 2004 and 2006. Despite this, in the second year, sites benefiting from the new
eligibility requirements increased by 68 percent, from 40 to 67.
Second, Table 8 shows that some 40-percent sites had existed (as 50-percent sites) even prior to
the pilot. Of the 40 sites benefiting from the 40 percent criterion in the first year, 30 were new
and 10 were pre-existing - hence a quarter were eligible in the previous year, i.e., prior to the new
eligibility requirement. This may be because they were on the cusp of eligibility under the
previous requirements. For example, in 2004, they may have been eligible under the previous
criterion of 50 percent, but when recalculated in 2005, they may have only been eligible under
the 40 percent criterion and hence may have continued operation only due to the pilot.
Another possibility is that it was easier to document eligibility at the 40 percent than 50 percent
threshold. Documentation using school data was easier than income documentation of enrolled
children, because the data are readily available. However, according to the Pennsylvania
Department of Education, this rarely, if ever, occurred – a point that is confirmed by the site
survey. Only one 40 percent site administrator (out of seven) believed that his or her site could
have been eligible under the 50 percent criterion if it had used a different method of applying.
In sponsors’ response to the survey question "Did you become a sponsor because of the new
eligibility criterion?" 21 (29 percent) of 72 respondents claimed they became sponsors because
of the new 40 percent eligibility criterion. The site survey also addressed this question, ninety-
four sites responded to the question of whether the new 40 percent eligibility criterion influenced
their decision about becoming an SFSP site. Of these, 17 (18 percent) became SFSP sites
because of the 40 percent eligibility criterion, and another four did not know. Of these 21 sites,
15 (283 Total 2004 rural sites – 192 preexisting rural 2006 sites) / 283 = 32 percent.
21
only seven were 40-percent sites. Of the seven 40-percent sites, only one thought it would have
been approved for the SFSP under the more stringent 50 percent criterion as well.
Children Served
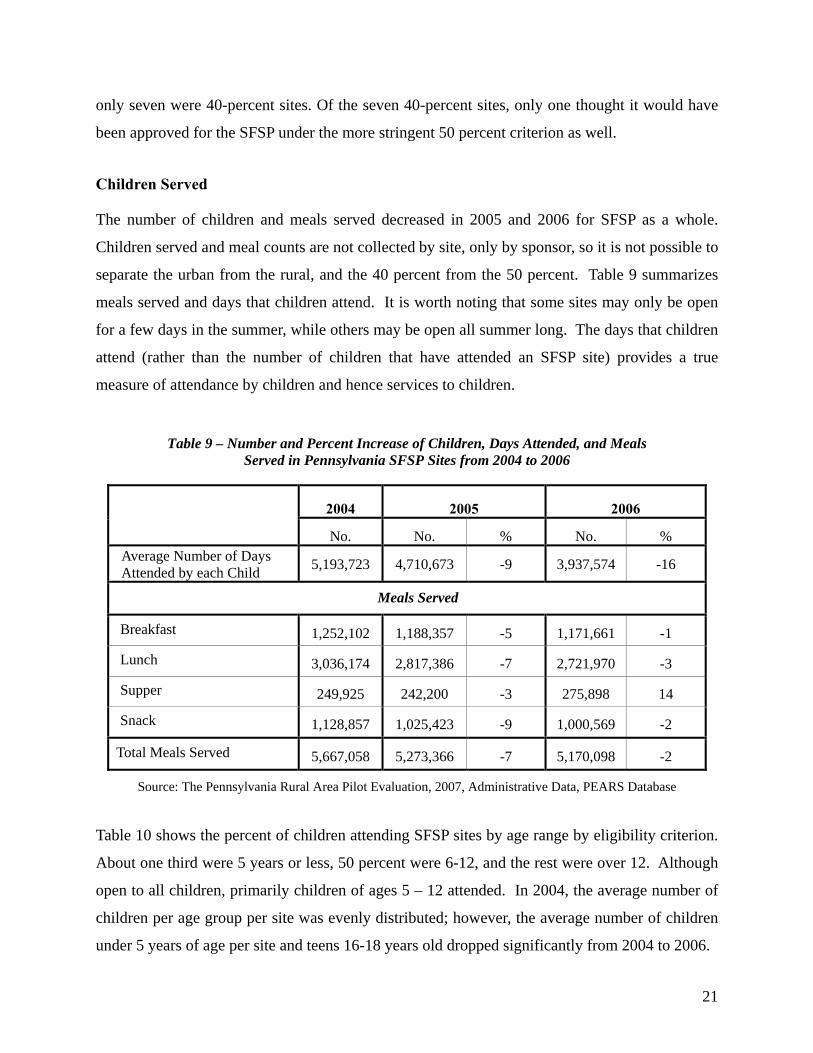
The number of children and meals served decreased in 2005 and 2006 for SFSP as a whole.
Children served and meal counts are not collected by site, only by sponsor, so it is not possible to
separate the urban from the rural, and the 40 percent from the 50 percent. Table 9 summarizes
meals served and days that children attend. It is worth noting that some sites may only be open
for a few days in the summer, while others may be open all summer long. The days that children
attend (rather than the number of children that have attended an SFSP site) provides a true
measure of attendance by children and hence services to children.
Table 9 – Number and Percent Increase of Children, Days Attended, and Meals Served in Pennsylvania SFSP Sites from 2004 to 2006
Source: The Pennsylvania Rural Area Pilot Evaluation, 2007, Administrative Data, PEARS Database
Table 10 shows the percent of children attending SFSP sites by age range by eligibility criterion.
About one third were 5 years or less, 50 percent were 6-12, and the rest were over 12. Although
open to all children, primarily children of ages 5 – 12 attended. In 2004, the average number of
children per age group per site was evenly distributed; however, the average number of children
under 5 years of age per site and teens 16-18 years old dropped significantly from 2004 to 2006.
2004 2005 2006
No. No. % No. % Average Number of Days Attended by each Child 5,193,723 4,710,673 -9 3,937,574 -16
Meals Served
Breakfast 1,252,102 1,188,357 -5 1,171,661 -1
Lunch 3,036,174 2,817,386 -7 2,721,970 -3
Supper 249,925 242,200 -3 275,898 14
Snack 1,128,857 1,025,423 -9 1,000,569 -2
Total Meals Served 5,667,058 5,273,366 -7 5,170,098 -2
22
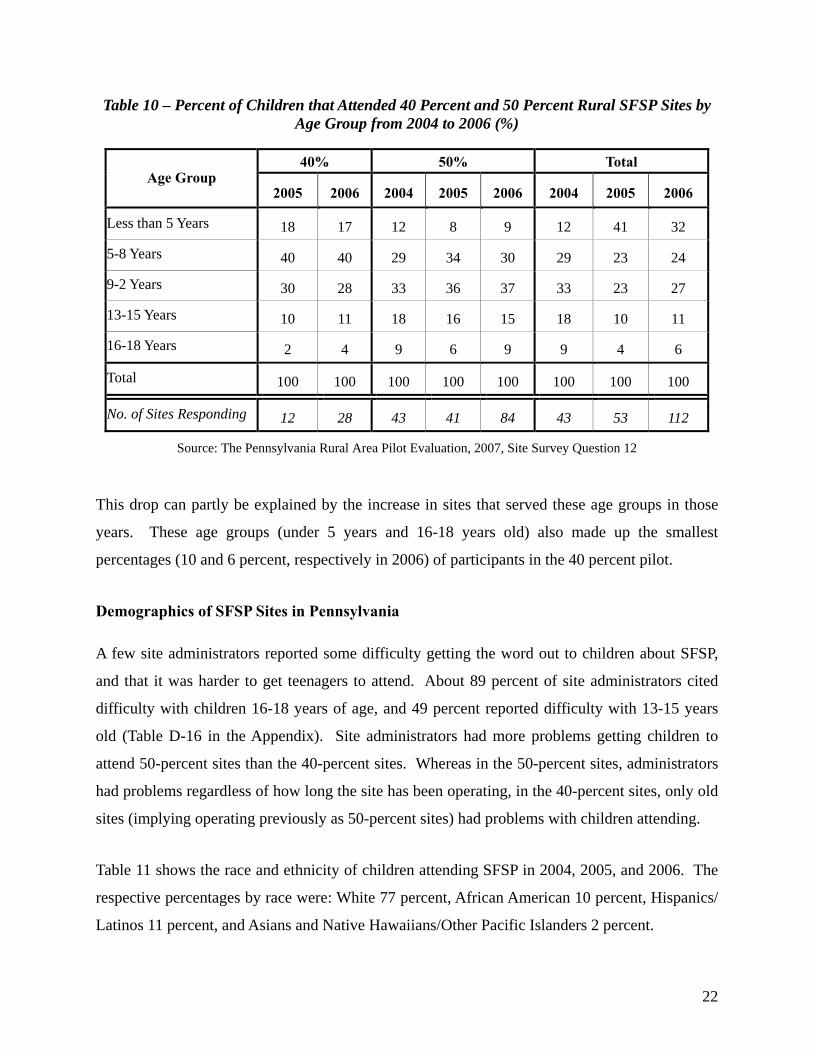
Table 10 – Percent of Children that Attended 40 Percent and 50 Percent Rural SFSP Sites by Age Group from 2004 to 2006 (%)
40% 50% Total Age Group
2005 2006 2004 2005 2006 2004 2005 2006
Less than 5 Years 18 17 12 8 9 12 41 32
5-8 Years 40 40 29 34 30 29 23 24
9-2 Years 30 28 33 36 37 33 23 27
13-15 Years 10 11 18 16 15 18 10 11
16-18 Years 2 4 9 6 9 9 4 6
Total 100 100 100 100 100 100 100 100
No. of Sites Responding 12 28 43 41 84 43 53 112
Source: The Pennsylvania Rural Area Pilot Evaluation, 2007, Site Survey Question 12
This drop can partly be explained by the increase in sites that served these age groups in those
years. These age groups (under 5 years and 16-18 years old) also made up the smallest
percentages (10 and 6 percent, respectively in 2006) of participants in the 40 percent pilot.
Demographics of SFSP Sites in Pennsylvania
A few site administrators reported some difficulty getting the word out to children about SFSP,
and that it was harder to get teenagers to attend. About 89 percent of site administrators cited
difficulty with children 16-18 years of age, and 49 percent reported difficulty with 13-15 years
old (Table D-16 in the Appendix). Site administrators had more problems getting children to
attend 50-percent sites than the 40-percent sites. Whereas in the 50-percent sites, administrators
had problems regardless of how long the site has been operating, in the 40-percent sites, only old
sites (implying operating previously as 50-percent sites) had problems with children attending.
Table 11 shows the race and ethnicity of children attending SFSP in 2004, 2005, and 2006. The
respective percentages by race were: White 77 percent, African American 10 percent, Hispanics/
Latinos 11 percent, and Asians and Native Hawaiians/Other Pacific Islanders 2 percent.

23
Table 11 – Percentage of Children that Attended the SFSP Sites from 2004 to 2006, by Race/Ethnicity (%)
40% 50% Total Ethnicity
2005 2006 2004 2005 2006 2004 2005 2006American Indian or Alaska Native 1 0 0 0 0 0 0 0 Asian 3 2 1 1 1 1 1 1 Black or African American 11 9 8 7 10 8 8 10 Native Hawaiian/Pacific Islander 2 1 0 2 0 0 2 0 White 80 85 60 64 75 60 66 77 Hispanic or Latino 3 2 30 27 13 30 23 11 Total 100 100 100 100 100 100 100 100
Number of Sites Responding 11 30 43 45 95 43 56 125
Source: The Pennsylvania Rural Area Pilot Evaluation, 2007, Site Survey Question 14
For some ethnic groups, such as Hispanics and Latinos, the number of children attending 40-
percent sites does not reflect their overall proportion in the SFSP as a whole, but rather the ethnic
compositions of their geographic locations. This may explain why the percentage of Latinos
among 40-percent sites (3 percent) is drastically lower than at 50-percent sites (27 percent) in
2005.
Relatively few site administrators reported having difficulty either reaching children of different
race/ethnicities, or getting them to attend the SFSP. None of the site administrators who
responded to the survey had collected data on the gender of the children attending their SFSP.
However, all respondents estimated that the number of girls and boys attending was roughly
equal.
The site survey asked administrators if they had migrant children and what types of migrants
they were. There was no migrant child attending any 40-percent site. Four 50-percent sites
reported having migrant children that attended in 2004, three sites in 2005, and eight sites in
2006. Half of the migrant children came from families that worked year-round. The others came
from migrant families who moved from place-to-place following the crops, or were seasonal
farm workers who stayed for a full season.
24
GEOGRAPHIC LOCATIONS OF SITES
Despite increases in the numbers of rural sponsors and sites, gaps remain in the provision of
SFSP. Serious poverty exists in some of the most rural counties, yet some counties lack the
population centers which make the provision of SFSP practical. Gaps in other counties are
difficult to explain. For example, in the southwest of Pennsylvania, the two counties bordering
West Virginia have eligibility rates for free and reduced school lunches of 46.7 percent (Greene
County) and 51.2 (Fayette County) making the entire counties eligible for the pilot. Yet, Fayette
has noticeably more sites than Greene.
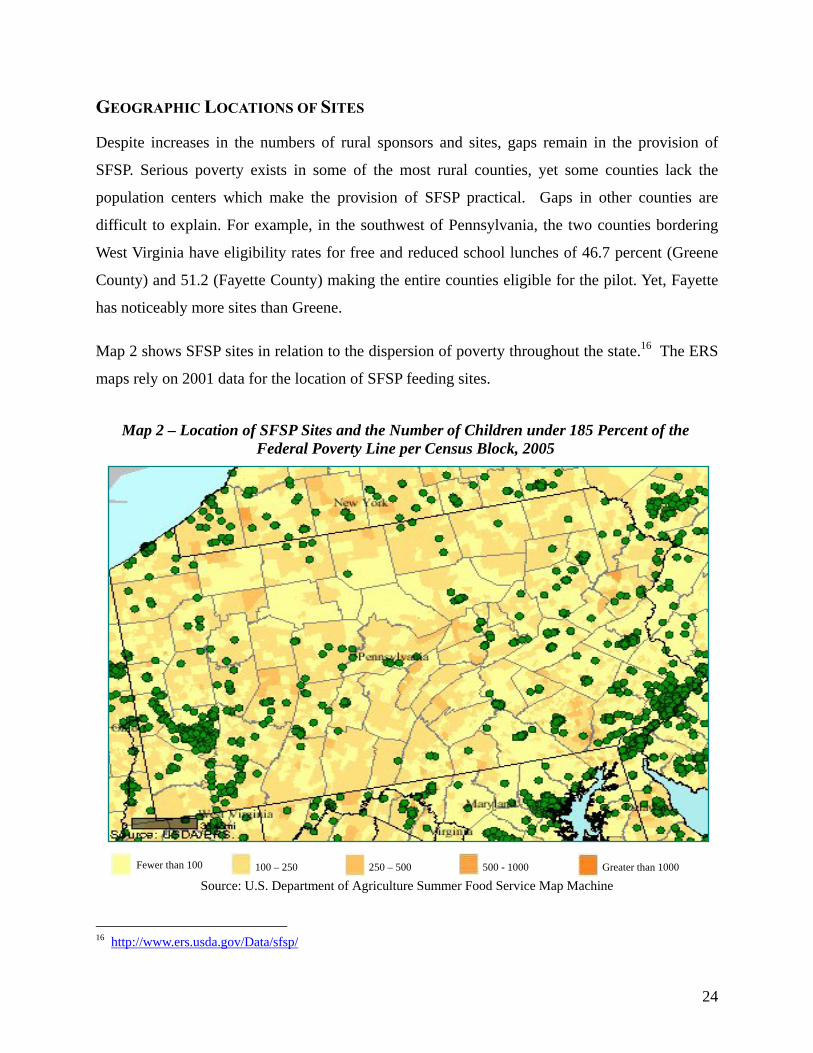
Map 2 shows SFSP sites in relation to the dispersion of poverty throughout the state.16 The ERS
maps rely on 2001 data for the location of SFSP feeding sites.
Map 2 – Location of SFSP Sites and the Number of Children under 185 Percent of the Federal Poverty Line per Census Block, 2005
Source: U.S. Department of Agriculture Summer Food Service Map Machine
16 http://www.ers.usda.gov/Data/sfsp/
Fewer than 100 100 – 250 250 – 500 500 - 1000 Greater than 1000

25
The green dots show the locations of all rural sites. The gradient of orange areas shows the
number of children below 185 percent of the Federal Poverty Level (FPL). In the northwestern
to north central corner of the state, three counties – McKean, Potter and Tioga –have eligibility
rates of 40.0 percent, 41.9 percent and 43.6 percent respectively for the whole county. McKean
has a population density of 43 people per square mile and at least four sites; Potter has a
population density of 17 per square mile and one site; and Tioga has a population density of 36
per square mile and at least four sites. Yet, a similar county, Clinton, directly south of Potter, has
an eligibility rate of 41.7 percent, a population density of 43, and no sites. Potter may be so
geographically dispersed that service provision is difficult, but geography does not seem to
explain the lack of service provision for Clinton.
The following discussion examines the site administrators’ point of view on the importance of
distance in attracting children, the distance that children travel to get to sites, and the mode of
transportation, based on responses received from the site administrators’ survey.
Distance
Site administrators were asked what percent of the children travel less than one mile, 1 – 5 miles,
5 – 10 miles, and more than 10 miles to attend their SFSP sites. Table 12 shows the distances
children were traveling to reach the SFSP based on the responses of site administrators. Of the 63
sites that were able to assess distance, the table indicates that a majority (85 percent) of the
participating children lived within one mile of the SFSP; 14 percent lived within 1 to 5 miles; 1
percent lived within 5 to 10 miles; and no one lived more than 10 miles away. Differences
between 40- and 50-percent sites in travel distances were negligible.
The majority of site administrators (66 percent) believed that distance was somewhat or very
important in attracting children to the sites (see Table D-1a in the Appendix). Distance was
perceived as equally important by 50-percent sites than by 40-percent sites. Sponsor directors
placed a similar emphasis (65 percent) on distance to the SFSP as a factor in children’s
participation (see Table D-1b in the Appendix).
26
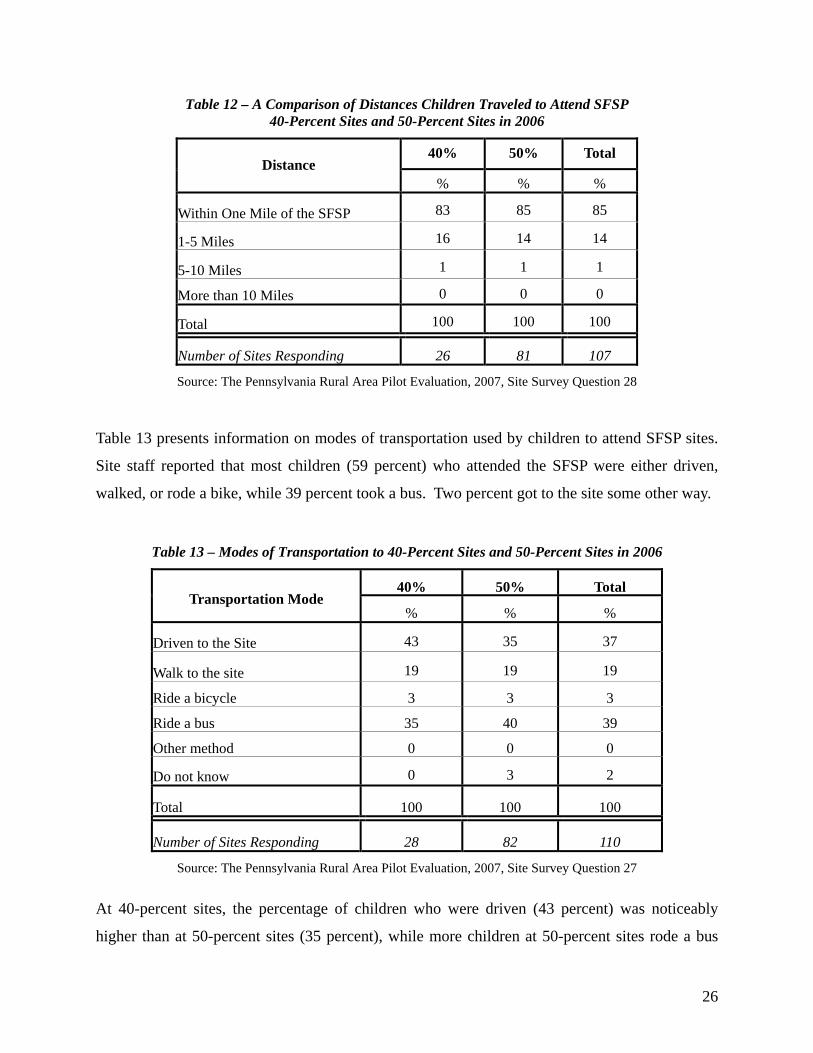
Table 12 – A Comparison of Distances Children Traveled to Attend SFSP 40-Percent Sites and 50-Percent Sites in 2006
40% 50% Total Distance
% % %
Within One Mile of the SFSP 83 85 85
1-5 Miles 16 14 14
5-10 Miles 1 1 1
More than 10 Miles 0 0 0
Total 100 100 100
Number of Sites Responding 26 81 107
Source: The Pennsylvania Rural Area Pilot Evaluation, 2007, Site Survey Question 28
Table 13 presents information on modes of transportation used by children to attend SFSP sites.
Site staff reported that most children (59 percent) who attended the SFSP were either driven,
walked, or rode a bike, while 39 percent took a bus. Two percent got to the site some other way.
Table 13 – Modes of Transportation to 40-Percent Sites and 50-Percent Sites in 2006
40% 50% Total Transportation Mode
% % %
Driven to the Site 43 35 37
Walk to the site 19 19 19
Ride a bicycle 3 3 3
Ride a bus 35 40 39
Other method 0 0 0
Do not know 0 3 2
Total 100 100 100
Number of Sites Responding 28 82 110
Source: The Pennsylvania Rural Area Pilot Evaluation, 2007, Site Survey Question 27
At 40-percent sites, the percentage of children who were driven (43 percent) was noticeably
higher than at 50-percent sites (35 percent), while more children at 50-percent sites rode a bus
27
(40 percent) to the site than children at 40-percent sites (35 percent). While this is a small
difference in terms of percentage, the average number of children per site who took a bus was
considerably higher at 50-percent sites (89 children) than at 40-percent sites (57 children).
In 30 of the 110 responding sites, at least one child rode a bus to the SFSP site. In these 30 sites,
an average of 81 children per site rode a bus, suggesting that when available, a large number of
children will take advantage of bus transportation. In 58 percent of the sites where children rode
the bus, it was provided either by the site or a partner; in 14 percent of the sites, it was provided
by public transportation; and in the remaining 28 percent, it was provided by other entities. In
one case, children with medical disabilities were bused with funds provided by a medical grant.
In summary, site administrators view distance as an important factor in attracting children.
Children use a variety of transportation methods including 39 percent who travel by bus. More
than 85 percent of children travel less than one mile.
What these findings suggest is that distance is important to the recruitment of children. Sites
typically attract most of their children from within a one-mile radius, even in situations where
multiple modes of transportation are available. Given this, there appears to be a large area in
rural Pennsylvania where the population density of children may be too low to support an SFSP
site, whether the eligibility criterion is 40 percent or 50 percent.
ANCILLARY SERVICES PROVIDED AT SITES
Services provided to children include meals, activities, and sometimes transportation. Activities
are important both for the enrichment of children and for attracting them to the SFSP sites. Most
sites offered a large variety of activities and site administrators believed they are very important
in attracting children to sites. Fifty-eight percent of site administrators reported that activities are
very important in attracting children (see Tables D-2a and D-4 in the Appendix). Activities were
more important at 40-percent sites (71 percent) than 50-percent sites (55 percent). Given that 40-
percent sites were more likely to be new, this finding is consistent.
Tables D-2a and D-2b in the Appendix list the numbers of sites engaging in typical activities. A
comparison of 40-percent and 50-percent sites for 2005 and 2006 shows that a higher proportion

28
of 40-percent sites provided activities at their sites than 50-percent sites. The variety of activities
ranged from swimming, to arts and crafts, to academics. Arts and crafts were the most widely
offered. Over half of all responding sites reported providing arts and crafts activities for all three
years surveyed. Sports/playground/playfields were almost as common as arts and crafts at sites
that offered activities. At least half of the sites reported offering each of arts and crafts,
structured playground and sports. Religious study and swimming pools were the least common.
All the listed activities, except religious study, were offered by at least a quarter of the sites that
responded to the survey question.
Site administrators reported that both meals and activities are important to attract children, with
slightly more emphasis on activities. Only 19 percent of the 141 responding site administrators
reported that children participated in the program primarily “for the meals” (see Table 14).
Table 14 – The Primary Reasons Children Attended SFSP Sites in 2006
40% 50% TotalSites
Responding Sites
Responding Sites
Responding Reason Children Come to the Site
No. %
% of All
Sites No. %
% of All
Sites No. %
% of All
Sites
For the Meals 7 23 10 20 18 8 27 19 8
To Participate in Activities 13 42 19 32 29 12 45 32 14
For the Meals & Activities 7 23 10 48 44 19 55 39 17
For Other Reason 4 13 6 10 9 4 14 10 4
Total Sites Responding 31 100 46 110 100 43 141 100 44
Sites Not Responding 36 - 54 147 - 57 183 - 56
Total Sites Excluding Residential Camps 67 - 100 257 - 100 324 - 100
Source: The Pennsylvania Rural Area Pilot Evaluation, 2007, Site Survey Question 11.
One third of the administrators reported activities as the primary reason, and 39 percent reported
both meals and activities as equally important. The combination of meals and activities was
stronger for 50-percent sites than 40-percent sites.
29
OTHER FACTORS INFLUENCING PROGRAM EXPANSION
During the site visits, several factors influencing program expansion were discussed. Despite
differences in the types of sponsors visited, some similarities emerged. The sponsors reported a
general dissatisfaction with SFSP reimbursement rates. They also reported a lack of rural
transportation options, which some deemed to be a prime cause of their inability to provide
meals to a majority of low-income rural children. Despite these transportation limitations, some
sponsors indicated that activities can draw children to the program, and marketing and
advertising could impact program success. The sponsors reported little direct competition with
other summer food programs, such as the National School Lunch Program and the School
Breakfast Program.
Further investigation was conducted to assess first whether other factors external to the pilot
influenced the numbers of sites and children served. If the factors were new, or had merely
grown in importance during the pilot, they could be confused with the direct impact of the pilot.
Second, untapped methods of expanding the program were discussed, such as funding,
recruitment, marketing, types of meals (hot or cold), and concerns of sites and sponsors.
Enhancing the SFSP
Sites and sponsors were asked questions about what they did to enhance their SFSP. As shown in
Table 15, few sites used the methods listed. Among those that did, free USDA commodities (30
percent) and state-provided marketing materials (25 percent and large banners 32 percent) were
the most common. More 50-percent sites than 40-percent sites had taken advantage of these
programs, perhaps due to their longer experience with SFSP.
Funding Sources
Sponsors were asked whether the costs of administering SFSP were fully covered by
reimbursements. For 2004, 73 percent of respondents said that costs were not covered by
reimbursements. For 2005, 92 percent and for 2006, 80 percent said the costs were not covered
(see Table D-7 in Appendix D).

30
Table 15 – The Methods Utilized by 40-Percent and 50-Percent Sites to Enhance the SFSP in 2006
40% 50% Total
Sites Responding
Sites Responding
Sites Responding
Programs Sites Have Utilized to Enhance their SFSP to Lower Costs & Attract and Retain Children
No. %
% of All
Sites No. %
% of All
Sites No. %
% of All
Sites
Federal Transportation Grant 0 0 0 6 5 2 6 4 2
State-Provided Marketing Materials 4 13 6 33 29 13 37 25 13
Incentives from Local Produce Purveyors 0 0 0 1 1 0 1 1 0
WIC Marketing 0 0 0 1 1 0 1 1 0
Free Commodities from the USDA 7 22 10 37 32 14 44 30 14
Reaching to Federal Title Programs Early in Summer at Elementary School 4 13 6 23 20 9 27 18 9
Large Banners Announcing the Program 8 25 12 39 34 15 47 32 15
Money for Special Events to Draw Children 2 6 3 4 3 2 6 4 2
State Grant Money to Sponsors/Sites to Experiment with New Techniques to Reach Children 3 9 4 5 4 2 8 5 2
State Campaign to Introduce the Program 0 0 0 3 3 1 3 2 1
Other 3 9 4 22 19 9 25 17 9
None of the Above 12 38 18 34 30 13 46 31 13
Total Sites Responding 31 100 46 109 100 42 140 100 42
Sites Not Responding 36 - 54 148 - 58 184 - 58
Total Rural Sites Excluding Residential Camps 67 - 100 257 - 100 324 - 100
Source: The Pennsylvania Rural Area Pilot Evaluation, 2007, Site Survey Question 21a
31
Recruitment and Marketing
Four factors are important to the ability of sites to recruit and retain children: meals, activities,
the location of the site (measured as distance to the children’s houses), and marketing.
Meals, Activities, and Distance
Site administrators were asked about the importance of activities and proximity (distance from
children’s homes to sites) in attracting or recruiting children to the SFSP. Sponsors were also
asked about the importance of meals relative to both activities and proximity. Although the
importance of activities and proximity were separately discussed above, they are compared with
meals in this section as well. As shown in Table D-9 in the Appendix, 83 percent of sites
reported that activities and were somewhat or very important in attracting children to SFSP sites.
Sixty-six percent of sites reported that distance was somewhat or very important. Ninety-four
percent of 40-percent sites reported that activities were somewhat or very important, compared to
81 percent for 50-percent sites. Similarly, 64 percent of 40-percent sites reported that distance
was somewhat or very important, as did 66 percent of 50-percent sites.
Similarly, 96 percent of sponsors reported that activities were somewhat or very important, 89
percent reported that distance was somewhat or very important, and 87 percent reported that
meals were somewhat or very important. These results show that travel distance and activities
are at least as important as meals, if not more important, in attracting children to SFSP sites (see
Table D-17 in the Appendix).
Marketing Sites to Recruit Children
Only 13 of the 40-percent sites and 22 of the 50-percent sites reported having a separate budget
for marketing their sites and the SFSP. Also, an even smaller percentage of sites reported
receiving contributions from anyone else for marketing – two in 2004, four in 2005, and five in
2006.
Site administrators and sponsor directors were asked to indicate the marketing techniques they
used to recruit children to sites, and to rank them according to their effectiveness. Site directors
used few marketing techniques, with local newspapers cited by the greatest number of sites (85
32
percent), followed by flyers (76 percent) and community outreach (73 percent) (see Table D-8 in
the Appendix). These percentages should be interpreted as the percent of responding sponsors
who used marketing techniques. For example, 76 percent of sites that did marketing used flyers.
Reliance on marketing techniques was somewhat greater for 40-percent sites than 50-percent
sites, perhaps because they are new in the system and need to attract children.
Almost all of the site directors that reported using marketing techniques evaluated them to be
effective or very effective means of recruiting children. Sites eligible at the 50 percent threshold
rated all techniques except direct mailings as more effective than sites eligible at the 40 percent
criterion (see Tables D-10a and 10b in the Appendix). A cautionary note in reading these tables
is to keep in mind that the total number of sites responding was low because those who did not
use marketing, and perhaps felt marketing was not an important consideration, did not respond.
Sponsors used various marketing techniques to attract children to sites. Table 19 shows that
newspapers were popular (76 percent), despite the fact that only 49 percent felt newspapers had
more than average effectiveness (see Table D-9 in the Appendix).17 This might be because
sponsors reported in a follow-up question that they relied little on advertising, preferring to issue
press releases to get articles written about their programs. Directors also relied on word of
mouth (63 percent), primarily at food banks and school districts, which was the most effective
marketing tool. The next most popular techniques were using school district newsletters and
posting flyers throughout the community.
Recruitment of Sites
Sponsors used many marketing techniques to attract sites. Similar to the recruitment of children
(Table 16), word of mouth was both the most popular and effective technique for recruiting sites
(see Table D-11b in Appendix). About 50-60 percent of sponsors used either word of mouth or
the local newspaper. Most sites reported hearing about the program in multiple ways, with the
most common being direct mailings from sponsors (40 percent), followed by word of mouth and
presentations by sponsors. About one-third of sites reported that they learned about the SFSP by
mail or some other means (see Table D-13).
17 Table D-9 reports effectiveness from most (1) to least (5) effectiveness. Given that 3 is average effectiveness, responses 1 and 2 are greater than average effectiveness.
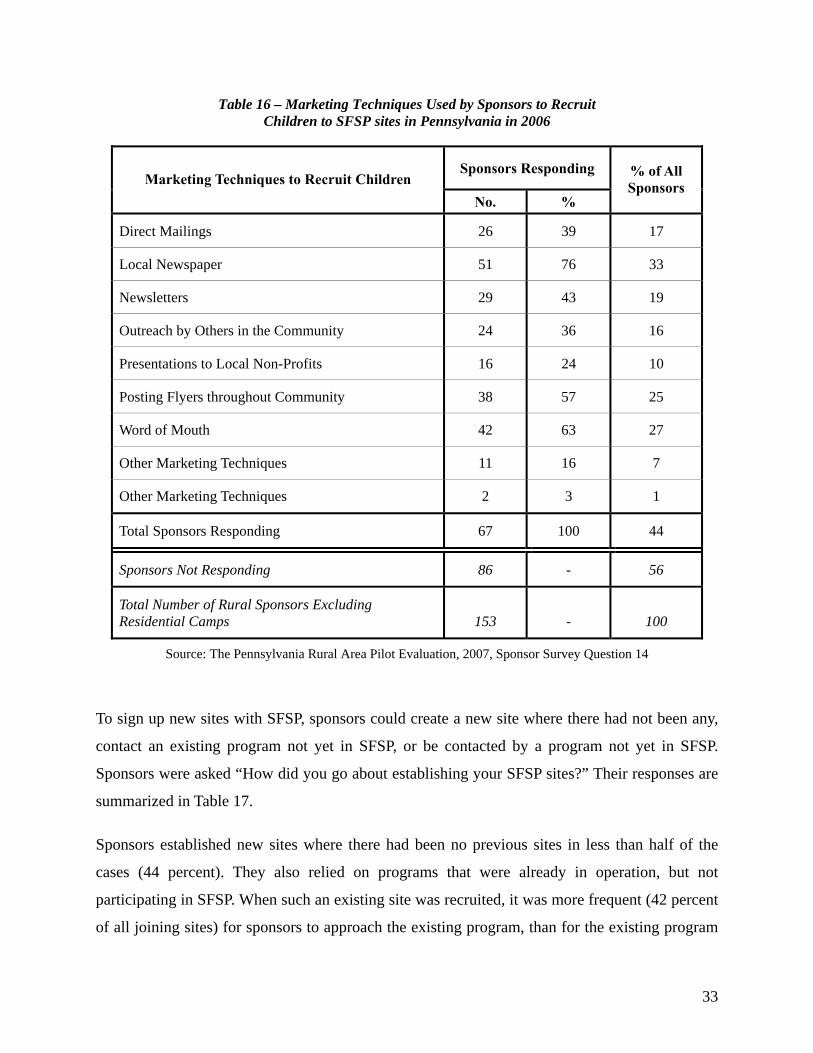
33
Table 16 – Marketing Techniques Used by Sponsors to Recruit Children to SFSP sites in Pennsylvania in 2006
Sponsors Responding Marketing Techniques to Recruit Children
No. %
% of All Sponsors
Direct Mailings 26 39 17
Local Newspaper 51 76 33
Newsletters 29 43 19
Outreach by Others in the Community 24 36 16
Presentations to Local Non-Profits 16 24 10
Posting Flyers throughout Community 38 57 25
Word of Mouth 42 63 27
Other Marketing Techniques 11 16 7
Other Marketing Techniques 2 3 1
Total Sponsors Responding 67 100 44
Sponsors Not Responding 86 - 56
Total Number of Rural Sponsors Excluding Residential Camps 153 - 100
Source: The Pennsylvania Rural Area Pilot Evaluation, 2007, Sponsor Survey Question 14
To sign up new sites with SFSP, sponsors could create a new site where there had not been any,
contact an existing program not yet in SFSP, or be contacted by a program not yet in SFSP.
Sponsors were asked “How did you go about establishing your SFSP sites?” Their responses are
summarized in Table 17.
Sponsors established new sites where there had been no previous sites in less than half of the
cases (44 percent). They also relied on programs that were already in operation, but not
participating in SFSP. When such an existing site was recruited, it was more frequent (42 percent
of all joining sites) for sponsors to approach the existing program, than for the existing program

34
to approach the sponsor (23 percent of all joining sites). Sponsors were also asked if they knew
where children were congregating before they established new sites. Two-thirds responded
affirmatively to this question. In these cases, they were further asked whether they located new
sites in these areas. Forty-one percent said yes.
Table 17 – Establishment of SFSP Sites in Pennsylvania in 2006
Sponsors Responding SFSP Establishment
No. %
% of All Sponsors
Sponsors Approached Existing Programs, not Participating in SFSP 30 42 20
Existing Programs, not Participating in SFSP, Contacted Sponsor 16 23 10
Sponsors Established Sites Where There Was No Pre-Existing Program 31 44 20
Other Establishing Method 11 15 7
Total Sponsors Responding 71 100 46
Sponsors Not Responding 82 - 54
Total Rural Sponsors Excluding Residential Camps 153 - 100
Source: The Pennsylvania Rural Area Pilot Evaluation, 2007, Site Survey Question 7
Type of Meals
Breakfast, lunch, dinner, and snacks can be offered by SFSP sites, but it is up to the sponsors and
the sites to plan how many and which meals they offer. In 2006, 90 percent of sites served lunch,
28 percent served breakfast, 21 percent served snacks, and one percent served dinner (see Table
18). This pattern held through all three years and for both 40-percent and 50-percent sites.
About two-thirds of sites served only one meal, and slightly less than one-third served two meals
or one meal and a snack. Only four percent of sites served three meals.

35
Table 18 – Number and percent of SFSP Sites that Served Breakfast, Lunch, Dinner and Snacks from 2004 to 2006
40% 50% Total
2005 2006 2004 2005 2006 2004 2005 2006Meal
No. % No. % No. % No. % No. % No. % No. % No. %
Breakfast 13 33 19 28 124 44 60 26 71 28 124 44 73 27 90 28
Lunch 37 93 56 84 259 92 212 93 234 91 259 92 249 93 290 90
Dinner 0 0 0 0 3 1 3 1 3 1 3 1 3 1 3 1
Snacks 8 20 19 28 38 13 41 18 50 19 38 13 49 18 69 21
Total Sites 40 100 67 100 283 100 228 100 257 100 283 100 268 100 324 100
Note: Categories are not mutually exclusive. A site can serve more than one meal.
Source: The Pennsylvania Rural Area Pilot Evaluation, 2007, Administrative Data from the PEARS Database
Meal sites are monitored by the Pennsylvania Department of Education staff hired each summer.
A random sample of 100 sites was selected in 2006. Site monitor reports were reviewed and
summarized in Table 19.
Forty out of the 100 site reports sampled had a review, four had a violation and two sites had a
second review. Lunch was the meal that was most frequently reviewed. There were no
substantive differences between 40- and 50-percent sites. The report shows that:
• Twenty-one percent of the sampled sites were 40-percent sites
• Eighteen percent of reviewed sites were 40-percent sites
• Twenty-five percent of sites with violations were 40-percent sites
• Seventeen percent of meals reviewed were 40-percent sites
• Twenty percent of violations were from 40-percent sites
• There was about equal tendency for violations to occur in either 40- or 50-percent sites
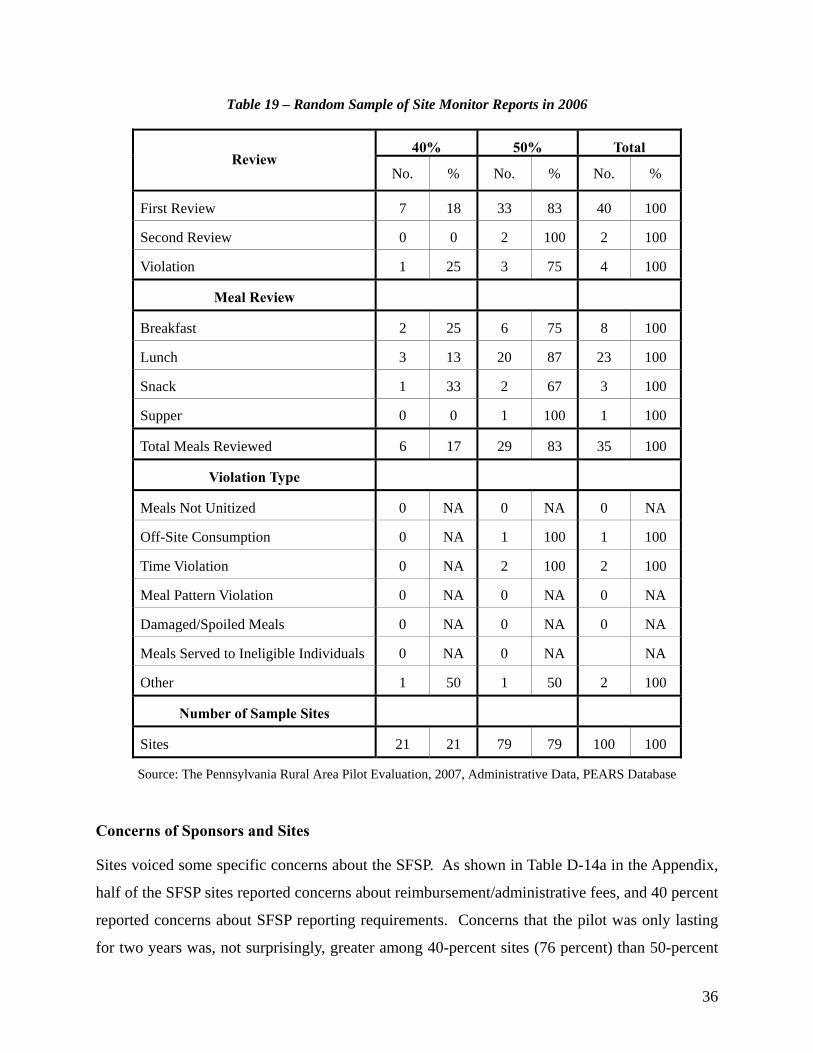
36
Table 19 – Random Sample of Site Monitor Reports in 2006
40% 50% Total Review
No. % No. % No. %
First Review 7 18 33 83 40 100
Second Review 0 0 2 100 2 100
Violation 1 25 3 75 4 100
Meal Review
Breakfast 2 25 6 75 8 100
Lunch 3 13 20 87 23 100
Snack 1 33 2 67 3 100
Supper 0 0 1 100 1 100
Total Meals Reviewed 6 17 29 83 35 100
Violation Type
Meals Not Unitized 0 NA 0 NA 0 NA
Off-Site Consumption 0 NA 1 100 1 100
Time Violation 0 NA 2 100 2 100
Meal Pattern Violation 0 NA 0 NA 0 NA
Damaged/Spoiled Meals 0 NA 0 NA 0 NA
Meals Served to Ineligible Individuals 0 NA 0 NA NA
Other 1 50 1 50 2 100
Number of Sample Sites
Sites 21 21 79 79 100 100
Source: The Pennsylvania Rural Area Pilot Evaluation, 2007, Administrative Data, PEARS Database
Concerns of Sponsors and Sites
Sites voiced some specific concerns about the SFSP. As shown in Table D-14a in the Appendix,
half of the SFSP sites reported concerns about reimbursement/administrative fees, and 40 percent
reported concerns about SFSP reporting requirements. Concerns that the pilot was only lasting
for two years was, not surprisingly, greater among 40-percent sites (76 percent) than 50-percent
37
sites (30 percent). Concerns about this issue were also voiced during in-person interviews with
sponsors.
Table D-14b in the Appendix, shows that among old sites that reported concerns about
reimbursement, 70 percent of 40-percent sites, and 62 percent of 50-percent sites thought that
reimbursement was too low and did not cover actual expenses. Seventy percent of 40-percent
sites and 35 percent of 50-percent sites also thought that the reimbursement rates did not provide
enough money to pay staff wages. The number of sites responding to this question was low
because only those expressing a concern about reimbursement rates were asked the question.
While one might want to be cautious about this response, it reflects a sentiment that was voiced
during in-person interviews. While some concerns were greater among 40-percent sites and
others greater among 50-percent sites, it appears that the concerns were about equal in 40-
percent and 50-percent sites.
Sponsors’ primary concerns about operating SFSP were regulations and requirements,
reimbursement of administrative fees, and the end of the pilot after two years (see Table D-15 in
the Appendix). This finding reflects the same concerns raised by sponsors during the site visits.
Fifty-three percent of sponsors were concerned with reimbursements and administrative fees, but
less than 20 percent were concerned with menu and monitoring requirements, thus supporting the
anecdotal findings of the sponsor visits. Furthermore, during sponsor visits, respondents
indicated that paperwork concerns were important, because they affect staffing costs.
Sponsor directors were also asked to rate their level of concern about administrative issues (see
Table D-16 in the Appendix). Of the 28 sponsors who indicated some concern with
reimbursement rates (Table D-15 in the Appendix), 50 percent reported that it was of the highest
level. Additionally, of the 21 sponsors who expressed concerns about the two-year limit on 40
percent eligibility, 57 percent rated it at a high level of concern.

38

39
CHAPTER 3
CONCLUSION
BACKGROUND
The primary purpose of the Pennsylvania Rural Eligibility Pilot Evaluation was to compare the
pilot eligibility criterion of 40 percent area eligibility (based on the Federal Poverty Level) in
rural Pennsylvania with the original eligibility criterion of 50 percent, and assess its impacts on:
(1) the number of rural sponsors offering meals through the SFSP; (2) the number of rural sites
offering meals through the SFSP; (3) the geographic location of the sites; (4) the services
provided to eligible children; and 5) other factors influencing participation.18
During the pilot period there was a decline in urban sites in the Pennsylvania SFSP, and an
increase in rural sites. The evaluation cannot determine whether the increase in rural sites was
due to the pilot or other influences. The provision of food in rural areas is related to a number of
factors including transportation, the concentrations of low-income populations, sensitivity of the
local community to the needs of the disadvantaged, the availability of sponsoring schools and
various non-profit organizations, and geographic factors. The evaluation was conducted during
the summers of 2005 and 2006, and the findings are summarized in the following sections.
EFFECT OF THE PILOT ON THE NUMBER OF SPONSORS
The number of rural sponsors increased during the pilot. There were 133 rural sponsors in
Pennsylvania in 2005 and 31 (23 percent) were new sponsors. There were 153 rural sponsors in
2006 and 41 (27 percent) were new sponsors. During these two years, the number of new rural
18 The Child Nutrition and WIC Act of 2004 (P.L. 108-265, Section 13, June 30, 2004; 118 Stat. 749).

40
sponsors exceeded the number of departing sponsors for a net gain of 8 in 2005 and 20 in 2006.
Similarities Among Sponsors
Types of Sponsors
Overall, most of the sponsors fell into two groups. Almost half were school districts and nearly
the other half (44 percent) were non-profits. There were also 8 (11 percent) religious and 6 (8
percent) community action programs.
Number of Children Served
Children of all age groups were served by 40-percent and 50-percent sites. Sponsors interviewed
believed that the children they served in 2005 were far less than the children in their areas that
needed assistance. One sponsor estimated that as few as five to ten percent of the needy children
in their area were receiving SFSP meals, although this study has no way of assessing the
accuracy of the perception. None of the administrators made statistical calculations, however
several pointed out that the numbers of children served by SFSP in their area was not close to the
numbers of children “in need” as defined by the school lunch program.
Transportation
The eight sponsors visited stressed the importance of transportation in rural areas. Typically,
children walk, ride bikes, or receive rides from parents or someone else to get to sites. Children
typically obtain rides to sites with organized programs of activities. At sites with few or no
activities, transportation was a serious obstacle because the cost to the family of driving could
exceed the value of the meal, even if the family possessed or had access to an automobile. A
recent study19 of food pantries in rural Pennsylvania found that many pantries permit one client
to transport food for friends and neighbors.
Reimbursement Rate and Administrative Burden
During the sponsor visits, two sponsors commented that the administrative burden coupled with
19 McDevitt, Suzanne and Daponte, Beth “An Examination of Food Assistance Availability to Residents of rural Pennsylvania,” Report submitted to the Center for Rural Pennsylvania, June 28, 2007.
41
low reimbursement rates caused them to reconsider participation in the program. The sponsor
survey examined this further by asking whether reimbursements that sponsors received covered
costs. A slight majority of sponsors (53 percent) reported a perception that the reimbursement
rate for the SFSP was too low, especially for administrative costs. This required them to use
funding from other sources to cover costs. In addition, some sponsors have long-term contracts
with food service workers that required them to pay wages in excess of what they could afford
with the SFSP reimbursement. This was particularly a problem for school districts.
A quarter of responding sponsors said that application requirements for the program were a
concern. Thirty-eight percent said that the reporting requirements were a concern. During visits
with sponsor organizations, two sponsors said that they might not take part in SFSP during 2006
as a result of the paperwork and regulations. They expressed their perception that the paperwork
and regulations required by this program were excessive and out of proportion with the amount
of service they were providing through this program. Nevertheless, the majority of sponsors did
not say that regulations were a problem. Different types of organizations had different
experiences with SFSP regulations. Some school directors reported that there was too much
regulatory burden associated with the program. Most community non-profits did not express
such concerns.
Advertising
A recent analysis of non-participating families, carried out in the urban areas of Miami, FL,
Kansas City, MO, Oakland, CA and Salisbury, MD found that more than half of the parents and
guardians of non-participating children were not aware of SFSP sites in their areas. These
families were also more likely to be moderately or severely hungry, according to the Food
Security Index developed from the USDA, “Guide to Measuring Household Food Security.”20
This suggests that the level of outreach will also be critical in Pennsylvania in regard to the
attraction of children, particularly children more in need of the services.
Sponsors use numerous methods to get the word out about SFSP to potential site operators,
20 “Analysis of Summer Food and Food Needs of Nonparticipating Children: Final Report,” Special Nutrition Program Report Series, No CN-06-SFSP, Project Officer: Fred Lesnett, U.S. Department of Agriculture, Food and Nutrition Service, Office of Analysis, Nutrition, and Evaluation, Alexandria, VA: 2006.
42
children, and community partners, including newsletters, local newspaper articles and ads,
school notices, and word-of-mouth. Nevertheless, the results of the survey indicated that
sponsors had only small budgets for publicity and marketing. The preferred and most used
methods were the no-cost methods of word-of-mouth and newspaper articles, but not newspaper
advertising. Newspaper articles may be effective in reaching educated parents who read the
paper. Word-of-mouth is effective with neighbors, friends, relatives and co-workers.
These marketing issues combined with concerns about reimbursement rates may contribute to the
difficulties of reaching the poorest, most isolated, and least educated families with children. The
poor are often unemployed or semi-employed and hence lack co-workers, the isolated (living in
remote, low population very rural areas) have fewer neighbors to interact with and the least
educated tend to read less.
Variations Among Sponsors
Age Groups Served
All age-groups - from elementary to 18 years of age – were served during the Pilot by the
Pennsylvania SFSP. There was wide variation among sponsors in the age groups of children
served. Forty percent of children served in 40-percent sites in both 2005 and 2006 were between
the ages of 5 and 8. In the 50-percent sites, the largest percentage served in all three years was
comprised of ages 9 through 12. Some sponsors served primarily elementary age children while
others served primarily middle school or high school-age-kids. All sponsors seemed to focus on
one age group more than the others. Eighty-nine percent of sponsors reported difficulties in
getting children ages 16-18 to attend and 49 percent cited difficulty in getting children ages 13-
15 to attend. There was little difference between the 40- and 50-percent sites in this regard.
Many of the older children served in the pilot were attending sports camps.
Children’s Motivation in Taking Part in the Program
Most sponsors indicated that it is critical to have activities at sites to motivate children to show
up. Most sponsors believed that these were more important than food alone to attract children to
sites. However, since at least half the sponsors are school districts and their primary task is the
43
activities provided, it is possible that the activities are viewed as the primary incentive rather
than the food.
Meal Preparation
Meal preparation and delivery varied widely across the eight sponsors visited. Some sponsors
prepared their own meals and delivered them to the sites. Others had meals prepared by vendors,
but then delivered them themselves. Yet other sponsors had meals prepared and delivered by
vendors. Some sponsors did not need to deliver meals because they operated only one site, and
prepared meals on the premises.
EFFECT OF THE PILOT ON THE NUMBER OF SITES
There were 385 rural sites including residential camps in Pennsylvania in 2004, 347 in 2005 and
377 in 2006 among the 50-percent sites. The pilot resulted in an additional forty new sites
eligible under the 40 percent criterion in 2005 and 67 in 2006. This represented an increase of 15
percent in 2005 and 21 percent or one-fifth of the total in 2006. At the same time, urban sites
declined in both years, though it was not possible to determine whether or not this was part of a
longer-term dynamic.
Increase in the Number of Sites Due to the Pilot
All rural sites (including residential camps) increased from 385 to 444 (15 percent) from 2004 to
2006. Excluding residential camps, rural sites increased from 283 to 324 from 2004 to 2006 (14
percent). New sites were added by pre-existing sponsors and new sponsors were attracted.
Perhaps as important, the number of sites provided per sponsor increased on average over the
three summers examined.
In 2005 there were 115 new rural sites, including the 30 under the 40 percent criterion. However,
during the same period, 130 rural sites were lost for a lower total overall. Recruitment in 2006
resulted in 132 new rural sites, 41 under the 40 percent criterion and only 76 rural sites were lost.
Although it was not possible within the scope of this evaluation to determine what dynamics
result in the loss of sites, seasonal programs experience ups and downs.
44
EFFECT OF GEOGRAPHIC LOCATION ON SITES
Site staff reported that most children (83 percent of 40-percent sites and 85 percent of 50-percent
sites) lived within one mile of the SFSP site and, with few exceptions, the rest within five miles.
About 89 percent of sponsors and 66 percent of sites felt that distance was somewhat or very
important but 11 percent of sponsors and 34 percent of sites felt it was not, presumably because
children at 31 percent of the sites had bus transportation available and 39 percent of children
were being transported by bus. Fifty-eight percent of sites that had children who traveled by bus
either provided the bus themselves or had a partner that provided the bus.
The numbers of children transported to the sites varied among the 40-percent and 50-percent
sites. At the 40-percent sites, slightly more children were driven (43 percent) than at the 50-
percent sites (35 percent). On the other hand, the proportion of children at 50-percent sites who
rode a bus was 40 percent, yet in those sites where children rode a bus, the average number of
children riding the bus was 89. Furthermore, the proportion of children at 40-percent sites who
rode a bus was 35 percent and in these sites an average of 57 children rode a bus. This high
concentration of children riding buses indicates that these sites were organized as
academic/recreational programs where the school district was supplying transportation and
where the food was considered secondary to the programming, as indicated by the comments of
the administrators regarding the motivation of children to attend. In one-quarter of 40-percent
sites, children rode buses and in 28 percent of the 50-percent sites, children rode buses.
Examination of the geographic location of sites shows an inverse relation between population
density and availability of SFSP sites. This suggests that sites require a minimum population
density to attract enough children to establish and maintain a site. There was no evidence of the
two-year long change in eligibility requirements having an impact on changing this fundamental
geographic reality. Evidence from this report suggests that other policy variables, such as, rural
transportation, the promotion of organized activities, and the use of more effective marketing
may augment the geographic impact of the change in the eligibility threshold tested in this pilot.
Gaps between Poverty and Provision of Summer Food Service Programs
Despite expansion, gaps remain in the provision of SFSP. Serious poverty exists in some of the
most rural counties, yet some counties lack the population centers, which make the provision of
45
SFSP practical. Gaps in other counties are more difficult to account for. For example, in the
northwestern corner of the state at least three counties exist with child poverty populations above
the state average (16 percent in 2004) and no SFSP service or only one site available.21 Yet in a
similar county with similar dynamics (McKean), with a child poverty rate of 19.5 percent and a
population density of 43, four SFSP sites exist.
EFFECT OF ANCILLARY SERVICES PROVIDED AT THE SITES ON SFSP PARTICIPATION
Sites offered a variety of services to participants. Sites under the 40 percent criterion had a
greater variety of activities per site than did 50-percent sites, indicating perhaps that these were
pre-existing sites for summer activities and SFSP was added when it became available.
Among the activities frequently found at SFSP sites are arts and crafts, structured play,
playgrounds, sports, and academic enrichment. About 39 percent of sites reported activities and
meals as equally important. Another 32 percent reported activities alone and a further 19 percent
reported meals alone as the most important reasons for children’s attendance.
OTHER FACTORS INFLUENCING SFSP PARTICIPATION
Sponsors expressed concerns about SFSP. The concerns most frequently heard were: low
reimbursements, too many reporting requirements and the short duration of the pilot – 2 years
only.
Transportation remains an issue. Most sponsors and site administrators reported that
transportation is very important to the success of SFSP in rural areas. Typically, children walk,
ride bikes, or receive rides.
21 Warren, with child poverty of 17.5 percent and a population density of 50 per square mile, Forest with a child poverty rate of 22.8 percent and a population density of 12 per square mile and Clinton with a child poverty rate of 18.9 and a population density of 43 per square mile. One additional county, Potter, has one SFSP site, a child poverty rate of 18.5 percent and a population density of 17 per square mile.(compiled from Center for Rural Pennsylvania, 2007).

46
SUMMARY AND CONCLUSION
In conclusion, lowering the eligibility threshold to 40 percent had the desirable impact of
increasing the number of sponsors and sites. The 15 percent growth in rural SFSP sites and the
addition of 72 new sponsors that accrued during the pilot are indications that lowering the
eligibility threshold from 50 percent to 40 percent has the potential to increase rural SFSP meal
service to poor children in rural areas. Those sponsors and sites serving rural areas close to the
50 percent threshold may be more inclined to continue serving children in future years knowing
that they may be eligible at the 40 percent threshold, should the legislation be extended.

47
REFERENCES
1. The Center for Rural Pennsylvania. “Rural by the Numbers 2005: A Look at
Pennsylvania’s Rural Population,” The Center for Rural Pennsylvania, September 2005,
page 3. http://www.ruralpa.org/Rural_by_numbers_2005.pdf
2. The Child Nutrition and WIC Reauthorization Act of 2004 (P.L 108-265, June 30, 2004;
118 Stat. 749.
3. Gordon, Anne and Briefel, Ronette, “Feeding Low-Income Children When School Is Out—
The Summer Food Service Program,” U.S. Department of Agriculture, Economic Research
Service, Food Assistance and Nutrition Research Report Number 30, April 2003.
http://www.ers.usda.gov/publications/fanrr30/
4. Gordon, Anne, Briefel, Ronette, et al. “Feeding Low-Income Children When School Is
Out—The Summer Food Service Program,” U.S. Department of Agriculture, Economic
Research Service, March 2003. http://www.ers.usda.gov/publications/efan03001/
5. Groves, R., Dillman, D., Eltinge, J., and Little, R. Survey Nonresponse, Wiley Publishers,
October 2001.
6. Gundersen, Craig, and Ziliak, James Patrick. "Poverty and Macroeconomic Performance:
A View from the States in the Welfare Reform Era," Demography, Vol. 41 (1), 61-68.
2004.
7. U.S. Department of Agriculture, Food and Nutrition Service, Office of Analysis, Nutrition,
and Evaluation, “Analysis of Summer Food and Food Needs of Nonparticipating Children:
Final Report,” Special Nutrition Program Report Series, No. CN-06-SFSP, 2006. Project
Officer: Fred Lesnett.
48
8. National School Lunch Act of 1968 (P.L. 90-302, Section 3, May 8, 1968; 82 Stat. 117).
9. National School Lunch Act of 1975 (P.L. 94-105, Section 13, October 7, 1975; 89 Stat.
515).
10. Saxonhouse, Gary R. “Estimated Parameters as Dependent Variables,” The American
Economic Review, Vol. 66, No. 1. (March 1976), pp.178 – 183.
11. Sheehan, K. “E-mail Survey Response Rates: A Review.” Journal of Computer-Mediated
Communication, Vol. 6 (2), 2001.
12. Yun, G. and Trumbo, C. “Comparative Response to a Survey Executed by Post, E-mail,
and Web Form,” Journal of Computer-Mediated Communication, 6 (1), 2000.

APPENDICES
A-1

A-2
A-3
APPENDIX A
STUDY METHODOLOGY
EVALUATION DESIGN
The evaluation design had four primary components:
1. Comparisons of sponsors, and sites, for the 40-percent (pilot) and 50-percent sites before
and after the implementation of the eligibility change;
2. Comparisons across sites before and after the eligibility change;
3. Description and analyses of data to determine changes in the numbers, types, and
characteristics of participants, sites, and sponsors. In addition, regression models22 were
built to assess evidence of correlation between change in eligibility and changes in
numbers, types and characteristics of sponsors, sites, and children.
4. Geographic analysis of data to depict visual representations of site locations, pockets of
poverty, transportation networks and nearest urban centers.
The list of data sources and the data elements collected from each source are shown in Appendix
A-1. The primary data sources for SFSP data were the State of Pennsylvania Child Nutrition
database (PEARS) and the sponsor and site surveys (see Appendix B). Census data were also
collected and used in the geographic analysis.
22 See Appendix C for a discussion of the regression analysis.
A-4
COMPARISON ACROSS SITES
A second set of comparisons, the cross-site analyses, was designed to compare 40-percent sites
with 50-percent sites within the same time period. These two comparisons were used to measure
whether there is a difference after the imposition of the new eligibility criterion. The cross-site
comparisons by eligibility status (40 percent versus 50 percent) provided answers the following
questions:
1. Were more children served by sites that qualified under the 40 percent criterion
than the 50 percent criterion?
2. Was the average site larger under the 40 percent criterion?
3. Were the demographic characteristics of children served under the 40 percent
criterion different from those served under the 50 percent criterion?
4. Were the 40-percent sites more rural than the 50-percent sites?23
RESEARCH OBJECTIVES
The research objectives for this study were set in the legislation to “evaluate the impact of the
[pilot] eligibility criteria … as compared to the [original] eligibility criteria…. The evaluation
assessed the impact of the threshold on:
1. The number of sponsors offering meals through the summer food service program;
2. The number of sites offering meals through the summer food service program;
3. The geographic location of the sites;
4. The services provided to eligible children; and
5. Other factors determined by the Secretary.24”
DATA SOURCES
The variables analyzed included primary dependent variables which the legislation intended to
impact; secondary dependent variables which may not have been affected by the legislation; and 23 While all sites within the pilot are rural, we measure the degree of rurality by population density. 24 The Child Nutrition and WIC Reauthorization Act of 2004 (P.L. 108-265, Section 116, June 30, 2004).
A-5
independent variables, which may have helped to determine the magnitudes of, or explanations
for, the dependent variables. Appendix B – Data Elements by Source summarizes the data used
in the study.
Pennsylvania’s Administrative Database
The Pennsylvania Child Nutrition Program Electronic Application and Reimbursement System
(PEARS) database is the repository for all SFSP data, as well as data for other state-supported
programs. A rich source of data, PEARS provided information for this analysis. Approximately
10,000 records were downloaded one at a time from the PEARS website. Customized programs
were developed to parse the relevant data from each of the downloaded files to construct the
database.
The quality of extracted data was initially somewhat inconsistent and contradictory. This could
have been for two reasons. First, errors such as missing and duplicate records may have
occurred as a result of the download process. These were verified against lists of sites and
sponsors. Second, data entry errors and omissions could have occurred in the original records
viewable on the website. To the extent possible, outliers and anomalies were verified for all data
fields. Anomalous database records were identified through crosschecking and internal
consistency checks, and against website records. Finally, an extensive quality control check was
applied. Lists of sponsors by year and sites per sponsor by year were acquired and site
application records were compared to these to assure that all data records were captured and
there were no duplicates.
Sponsor Visits
Visits were conducted to eight out of 133 sponsors operating rural sites in Pennsylvania in winter
2005. Two-hour meetings were held with each sponsor.
In order to capture a wide range of variation in sponsor and site experience during the visits, the
following criteria were developed and used to select sponsors for the visits.
1. Rurality – very rural location (in terms of distance from the nearest urban center) versus a
location adjacent to an urban area.
A-6
2. Sponsor SFSP Experience – new sponsor in the SFSP program versus sponsor that
expanded an existing program.
3. Type of sponsor – school, private non-profit organization, or migrant center.
4. Sponsor success – very successful sponsor versus sponsor who faced challenges and
overcame them.
5. Size of sponsor – small versus large.
6. Food preparation – sponsor purchases food from a vendor versus preparing food locally.
7. Geographic diversity.
During the sponsor visits a number of topics were discussed, including common patterns and
themes; divergences among sponsors and sites; the extent and role of community partners;
marketing and outreach strategy successes and failures; turnover in sites and reasons for them;
strategies used in site selection – open or enrolled; explanations for data captured in PEARS; and
unintended impacts of the program. The findings of the sponsor visits are summarized in
Chapter 2.
Survey Data
Overview: Survey instruments were designed and used to survey sponsors, site administrators
and site monitors. The surveys were scheduled to be conducted in the summer of 2006, however,
OMB approval of survey instruments was not received until November. Site monitors were no
longer on staff and it was not possible to obtain a list of monitors and contact information from
the PA Department of Education once they were no longer on staff. Instead, this report
conducted an analysis of 100 randomly selected monitor reports.
Sponsor Survey: Sponsors with rural sites active during 2006 were invited to participate via a
web-based survey. All sponsors submit reports via the PEARS website data entry screens. They
therefore had access to the Internet to respond electronically. Sponsors were asked about their
administrative experiences and the experiences of their sites, including both present and previous
experiences.
A-7
Site Survey: Site survey respondents included all active rural sites except residential camps. The
pilot did not include residential camps. Given the small number of sites, active sites in 2006 were
all invited to participate in the survey. Consequently, over-sampling or stratified sampling was
not employed.
As with the Sponsor Survey, the primary data collection technique for the Site Survey was
intended to be a web-based Internet survey, with contact information obtained from PEARS.
Unlike the sponsors who were administrators, not all site administrators were expected to have
Internet access. Many sites were located at playgrounds or other locations without Internet
access. Based on interviews with sponsors and the Pennsylvania Department of Education, it
was expected that 75 percent of site administrators would have Internet access – from the site,
home, or some other location.
In conducting the survey, two issues arose. Very few sites responded to the on-line survey, and
the response rate was lower than expected. To address these issues, hardcopy versions of the site
survey questionnaire were mailed to all sites; address correction calls were made to nearly all
rural sponsors and administrators and approximately half of all site administrators. In the course
of doing so, many sponsors indicated that they administer the sites themselves, and that listed
site administrators in the PEARS database had a minimal role, often confined simply to food
distribution. Listed site administrators did not have the knowledge to complete the survey in
these cases. As a consequence, it would fall upon the sponsor administrators to complete the
survey questionnaires.
To overcome this problem, two approaches were taken. First, site questions were reprinted and
mailed in batch to sponsors. Sponsors believed they could best distribute the questionnaires to
site administrators or complete them themselves. Second, to overcome the reporting burden on
the sponsor of completing multiple questionnaires, sponsors were offered the opportunity to
complete them by phone if they preferred. In this way, sponsors could respond to each question
with an answer that applied to all sites just once, or provide details for each site, where
appropriate. Since their sites were administered by themselves, similar approaches were used
and hence common answers could be given to save reporting burden, yet were accurate for each
site.
A-8
Sites that were active both before and during 2006 were contacted, and information collected on
the activities of both the current and earlier years. This allowed for an assessment of how long-
term sites may have changed over time and why inactive sites may have dropped out. It also
reduced costs by providing information from multiple years from participating sites.
USDA Economic Research Service Database
The USDA Economic Research Service serves as a repository for the Summer Food Service
Program (SFSP) information nationwide. The SFSP Map Machine provided mapping
information on SFSP sites. The map machine juxtaposes this information against concentrated
areas of child poverty.25 These data were used to assess whether the SFSP is reaching poor
children.
25 http://www.ers.usda.gov/Data/SFSP.
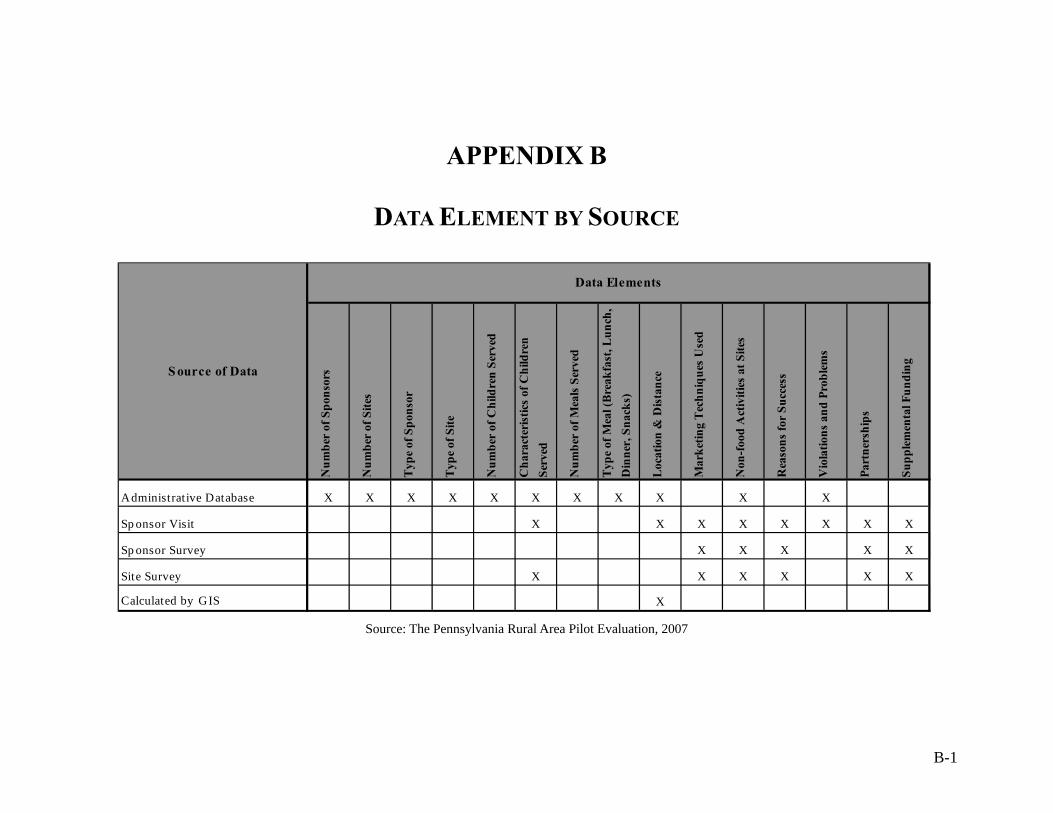
B-1
APPENDIX B
DATA ELEMENT BY SOURCE
Source: The Pennsylvania Rural Area Pilot Evaluation, 2007
Num
ber
of S
pons
ors
Num
ber
of S
ites
Typ
e of
Spo
nsor
Typ
e of
Site
Num
ber
of C
hild
ren
Serv
ed
Cha
ract
eris
tics
of C
hild
ren
Serv
ed
Num
ber
of M
eals
Ser
ved
Typ
e of
Mea
l (B
reak
fast
, Lun
ch,
Din
ner,
Sna
cks)
Loc
atio
n &
Dis
tanc
e
Mar
ketin
g T
echn
ique
s U
sed
Non
-foo
d A
ctiv
ities
at S
ites
Rea
sons
for
Succ
ess
Vio
latio
ns a
nd P
robl
ems
Part
ners
hips
Supp
lem
enta
l Fun
ding
Administrative Database X X X X X X X X X X X
Sp onsor Visit X X X X X X X X
Sp onsor Survey X X X X X
Site Survey X X X X X X
Calculated by GIS X
S ource of Data
Data Elements

B-2

C-1
APPENDIX C
SURVEY QUESTIONNAIRES: INSTRUCTIONS
Assumptions
(1) The following assumes an online survey. The question-by-question layout for the mail
survey will be slightly different.
(2) Survey respondents will only be shown questions and response categories for years in
which they were active.
(3) We will pilot-test the ability of sponsors who are no longer active to respond to
questions.
(4) In a few instances (noted), we will pilot test two different versions of the same question
and use the version that respondents find the easiest to use.
Formatting
Red text is used in the accompanying pages to indicate where
• Information is pulled from the Pennsylvania database (e.g., We will pull the following
information from PEARS.)
• Questions are being asked only to a subset of the population, (e.g., Sponsors that did
not establish new sites will skip to Q5.)
• Questions are to be asked in multiple ways during the pilot test, (e.g., Pilot test: half
to provide dollars amount; half to provide percents)
Red text will not be shown in the final survey, but will be programmed.
C-2
Red text that is underlined is used to show the exact data that are being pulled from the database,
(e.g., “number of 40-percent sites in 2005”). When the respondent sees this question, the actual
number of 40-percent sites for that sponsor will be displayed.
Sections that are only asked of a subset of the population are set off by horizontal lines before
and after each section.
Skip patterns, which may not be obvious, are shown in blue, e.g., GO TO Q2.

C-3
APPENDIX C–1
SPONSOR SURVEY
Pull the following information from PEARS and display on screen.
The Pennsylvania Department of Education lists your address as:
Sponsor name: _________________________________________________________________
Address 1: ____________________________________________________________________
Address 1: ____________________________________________________________________
City: ______________________________________ Zip code: __________________________
(1) What type of organization are you?
___ School district
___ Non-profit
___ Religious-based
___ Community action program
___ Other non-profit (Specify____________________)
___ Government agency
___ State
___ County
___ City
___ Other (Specify ____________________________)
___ Private (Specify ___________________________).
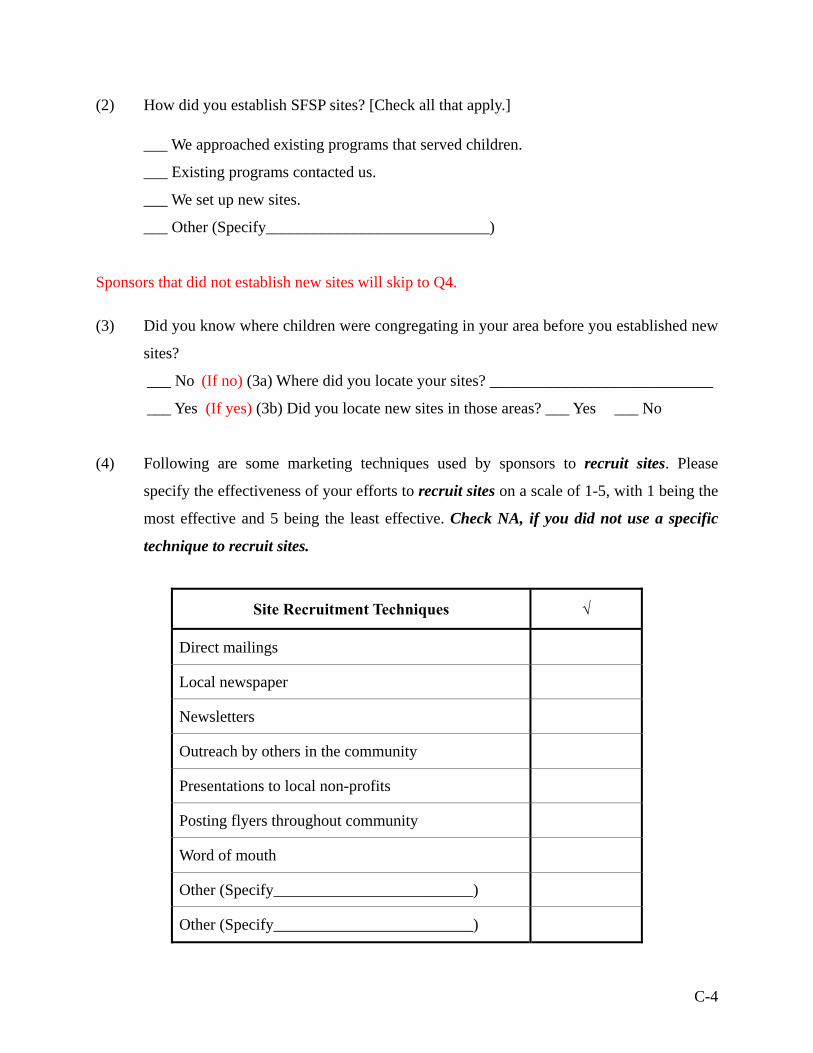
C-4
(2) How did you establish SFSP sites? [Check all that apply.]
___ We approached existing programs that served children.
___ Existing programs contacted us.
___ We set up new sites.
___ Other (Specify____________________________)
Sponsors that did not establish new sites will skip to Q4.
(3) Did you know where children were congregating in your area before you established new
sites?
___ No (If no) (3a) Where did you locate your sites? ____________________________
___ Yes (If yes) (3b) Did you locate new sites in those areas? ___ Yes ___ No
(4) Following are some marketing techniques used by sponsors to recruit sites. Please
specify the effectiveness of your efforts to recruit sites on a scale of 1-5, with 1 being the
most effective and 5 being the least effective. Check NA, if you did not use a specific
technique to recruit sites.
Site Recruitment Techniques √
Direct mailings
Local newspaper
Newsletters
Outreach by others in the community
Presentations to local non-profits
Posting flyers throughout community
Word of mouth
Other (Specify_________________________)
Other (Specify_________________________)
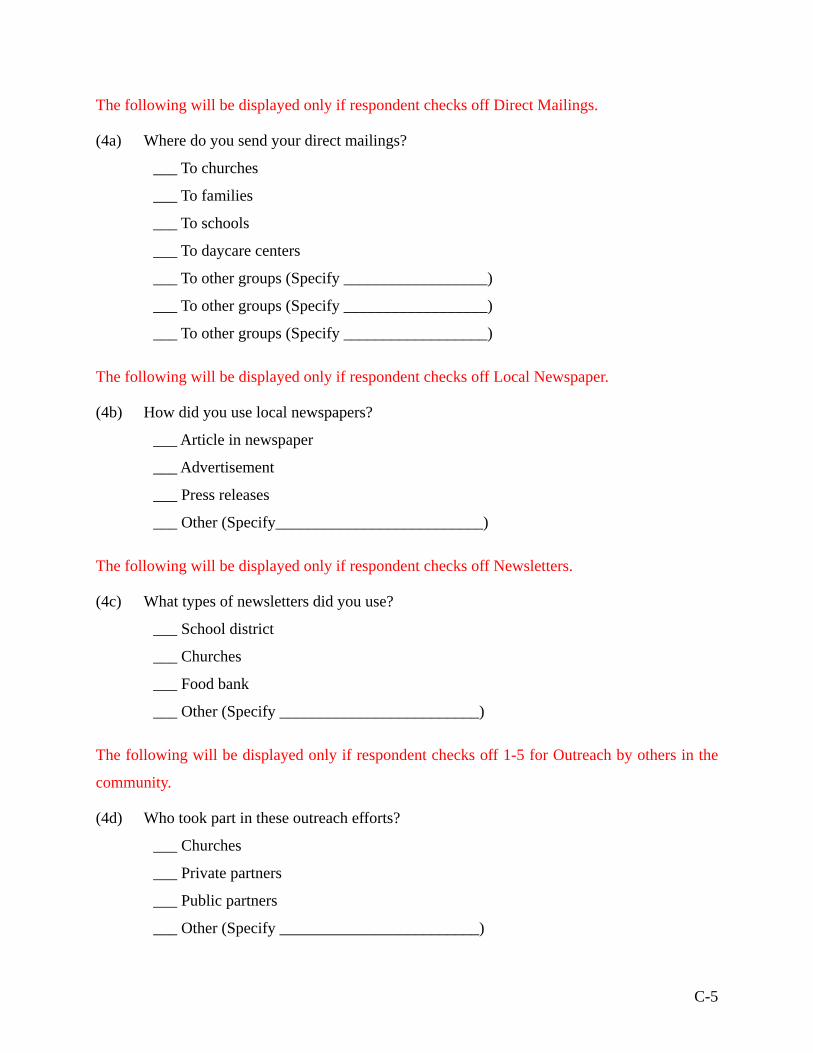
C-5
The following will be displayed only if respondent checks off Direct Mailings.
(4a) Where do you send your direct mailings?
___ To churches
___ To families
___ To schools
___ To daycare centers
___ To other groups (Specify __________________)
___ To other groups (Specify __________________)
___ To other groups (Specify __________________)
The following will be displayed only if respondent checks off Local Newspaper.
(4b) How did you use local newspapers?
___ Article in newspaper
___ Advertisement
___ Press releases
___ Other (Specify__________________________)
The following will be displayed only if respondent checks off Newsletters.
(4c) What types of newsletters did you use?
___ School district
___ Churches
___ Food bank
___ Other (Specify _________________________)
The following will be displayed only if respondent checks off 1-5 for Outreach by others in the
community.
(4d) Who took part in these outreach efforts?
___ Churches
___ Private partners
___ Public partners
___ Other (Specify _________________________)

C-6
(5) Please rate the effectiveness of your efforts on a scale of 1 to 5, with 1 being the most
effective and 5 being the least.
Effectiveness Site Recruitment Techniques
1 2 3 4 5 √
Direct mailings
Local newspaper
Newsletters
Outreach by others in the community
Presentations to local non-profits
Posting flyers throughout community
Word of mouth
Other (Specify_________________________)
Other (Specify_________________________)
(6) Please describe any obstacles to opening more sites? ____________________________
_______________________________________________________________________
_______________________________________________________________________
Q7 & Q8 are presented only if sponsor is new in 2005 or 2006.
(7) Did you become a sponsor because of the new eligibility criterion (40 percent of the
children are living in households with 185 percent of the poverty level)?
___ No
___ Yes
(8) How did you learn of the new eligibility requirements?
___ Sponsor meeting in Harrisburg
___ Notification by the Pennsylvania State Department of Education
___ Notification by USDA
___ SFSP training
___ Other (Specify___________________________)

C-7
___ Did not know of the new eligibility requirements
Attendance
(9) What is/was the average number of children served at your sites?
___ 2004
___ 2005
___ 2006
(10) Some sponsors report that children of certain ages are less likely to attend the SFSP than children of other ages. Do you have difficulty either “getting the word out” or convincing children of different ages to attend the SFSP?
(Please leave blank if there was no difference.) GO TO Q11
Age Getting the Word Out
Getting Children to Attend Why?
Less than 5 years 5-8 years 9-12 years 13-15 years
16-18 years
(11) What about gender? Is it harder to get the word out to boys or girls to attend the SFSP?
(Please leave blank if there was no difference.) GO TO Q12
Gender Getting the Word Out
Getting Children to Attend
Why?
Girls
Boys
(12) Some sponsors report that the following children are also difficult to reach. Do you have
difficulty either “getting the word out” or convincing any of the following children to
attend the SFSP? What about any other children?

C-8
(Please leave blank if there was no difference.) GO TO Q13
Hard-to-reach children Getting the Word Out
Getting Children to
Attend Why?
Home-schooled Special needs Children with disabilities Migrant children Other (Specify__________) Other (Specify__________)
(13) Do you have any migrant sites?
___ No
___ Yes (If yes) (13a) Please name your migrant sites? ______________________
(13b) Did any of your sites have migrant children attend?
___ No
___ Yes
___ Don’t Know
(14) Following are some marketing techniques used by sites to recruit children. Please select
which one you have used.
Site Recruitment Techniques √
Direct mailings
Local newspaper
Newsletters
Outreach by others in the community
Presentations to local non-profits
Posting flyers throughout community
Word of mouth
Other (Specify_________________________)
Other (Specify_________________________)
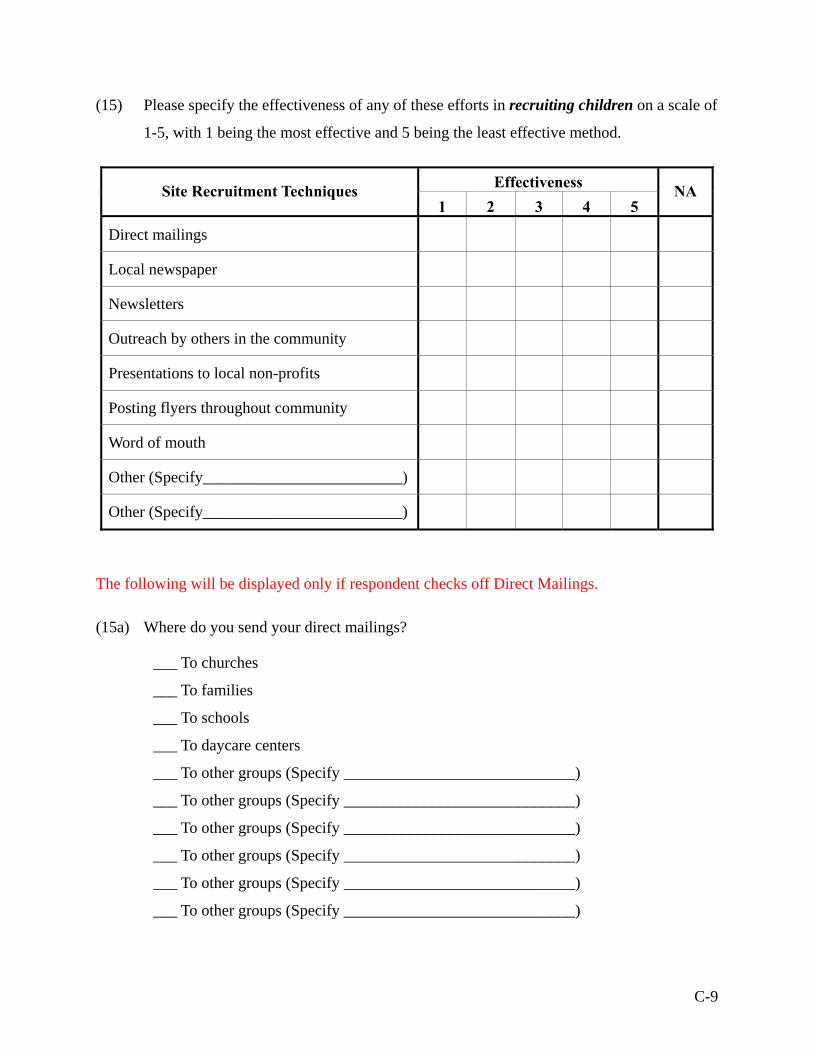
C-9
(15) Please specify the effectiveness of any of these efforts in recruiting children on a scale of
1-5, with 1 being the most effective and 5 being the least effective method.
Effectiveness Site Recruitment Techniques 1 2 3 4 5
NA
Direct mailings
Local newspaper
Newsletters
Outreach by others in the community
Presentations to local non-profits
Posting flyers throughout community
Word of mouth
Other (Specify_________________________)
Other (Specify_________________________)
The following will be displayed only if respondent checks off Direct Mailings.
(15a) Where do you send your direct mailings?
___ To churches
___ To families
___ To schools
___ To daycare centers
___ To other groups (Specify _____________________________)
___ To other groups (Specify _____________________________)
___ To other groups (Specify _____________________________)
___ To other groups (Specify _____________________________)
___ To other groups (Specify _____________________________)
___ To other groups (Specify _____________________________)

C-10
The following will be displayed only if respondent checks off Local Newspaper.
(15b) How did you use local newspapers?
___ Article in newspaper
___ Advertisement
___ Press releases
___ Other (Specify__________________________)
___ Other (Specify__________________________)
The following will be displayed only if respondent checks off for Newsletters.
(15c) What types of newsletters did you use?
___ School district
___ Churches
___ Food bank
___ Other (Specify _____________________)
___ Other (Specify _____________________)
The following will be displayed only if respondent checks Outreach by others in the community.
(15d) Who took part in these outreach efforts?
___ Churches
___ Private partners
___ Public partners
___ Other (Specify _________________________)
___ Other (Specify _________________________)
SFSP Enhancements
(16) Following is a list of some of the things that sponsors have used to enhance their SFSP
and thereby lower cost, and attract and retain children. Please check off those that you
have used and note which have been the most useful.

C-11
Enhancement Used by Sites Most Useful
Federal transportation grant
State-provided marketing materials
Incentives from local produce purveyors
WIC marketing
Free commodities from the USDA
Reaching out to federal title programs early in summer at elementary school
Large banners announcing the program
Money for special events to draw out the children
State grant money to sponsors/sites to experiment with new techniques to reach children
State campaign to introduce the program
Other (Specify_______________________)
Other (Specify_______________________)
Other (Specify_______________________)
(17) Are there any other things that you have not tried, but that you think might help? ______
______________________________________________________________________
(18) How important do you think the actual meal is in getting children to take part in the
SFSP?
___ Very important
___ Somewhat important
___ Not very important
___ Very unimportant
(19) How important do you think the distance from home to site is in getting children to take
part in the SFSP?

C-12
___ Very important
___ Somewhat important
___ Not very important
___ Very unimportant
(20) How important do you think activities are in getting children to take part in the SFSP?
___ Very important
___ Somewhat important
___ Not very important
___ Very unimportant
(21) About how often do you communicate with others involved with the SFSP during the
summer season? Do you think that additional communication with any of the following
during the summer season would make your SFSP stronger?
Amount of Communication since Last Summer
Never
Occasionally (Less than 5
times)
Often (5 times or
more)
Would more communication
help? (yes or no)
With other sponsors
With your site directors
With other site directors
With site monitors
With state program staff
With USDA
(22) About how often do you communicate with others involved with the SFSP prior to the
summer season? Do you think that additional communication with any of the following
prior to the summer season would make your SFSP stronger?
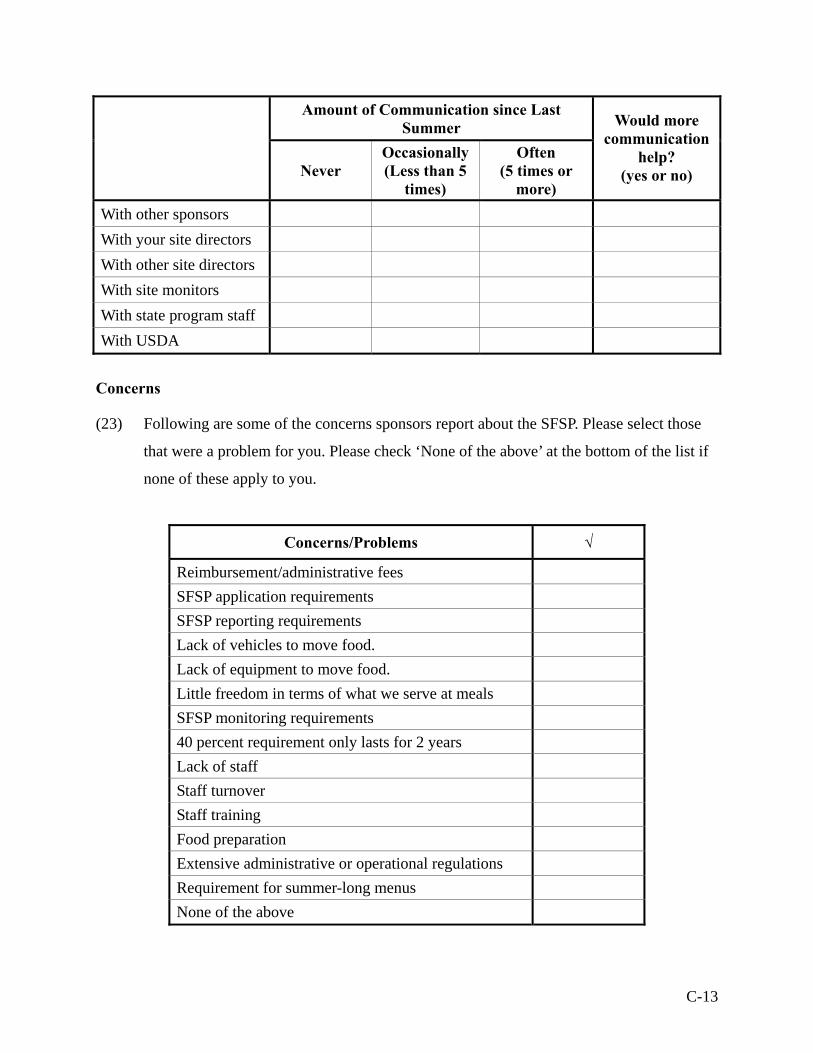
C-13
Amount of Communication since Last Summer
Never
Occasionally (Less than 5
times)
Often (5 times or
more)
Would more communication
help? (yes or no)
With other sponsors With your site directors With other site directors With site monitors With state program staff With USDA
Concerns
(23) Following are some of the concerns sponsors report about the SFSP. Please select those
that were a problem for you. Please check ‘None of the above’ at the bottom of the list if
none of these apply to you.
Concerns/Problems √
Reimbursement/administrative fees SFSP application requirements SFSP reporting requirements Lack of vehicles to move food. Lack of equipment to move food. Little freedom in terms of what we serve at meals SFSP monitoring requirements 40 percent requirement only lasts for 2 years Lack of staff Staff turnover Staff training Food preparation Extensive administrative or operational regulations Requirement for summer-long menus None of the above

C-14
(24) Please specify how problematic each of the following was for you on a scale of 1 to 5,
with 1 being the most problematic and 5 the least.
Concerns/Problems 1 2 3 4 5 NA
Reimbursement/administrative fees
SFSP application requirements
SFSP reporting requirements
Lack of vehicles to move food.
Lack of equipment to move food.
Little freedom in terms of what we serve at meals
SFSP monitoring requirements
40 percent requirement only lasts for 2 years
Lack of staff
Staff turnover
Staff training
Food preparation
Extensive administrative or operational regulations
Requirement for summer-long menus
The following will be displayed only if respondent checks off reimbursement/ administrative
fees.
(25) In what ways were reimbursement/administrative rates a problem?
___ Are too low and do not cover actual expenses
___ Only reimburse 2 percent for second servings
___ Do not cover transportation costs needed to reach distant areas
___ Do not provide enough reimbursement for paper work
___ Do not provide enough money to pay staff wages
___ Other (specify__________________________)

C-15
Only for those sponsors who had sites that dropped out.
(26) Please list the sites that dropped out of SFSP during the last 5 years. Please specify the
main reasons they did so.
Site Name Year Dropped Out Reason Dropped Out
Site Name 1 2003 Site Name 2 2003
Site Name 3 2004
Site Name 4 2005
Partners
(27) Do you now or did you ever have any local partners?
___ No
___ Yes
(28) Do you now or did you ever have any non-local partners?
___ No
___ Yes
Sponsors who answer “No” to Q27 and Q28 will skip to Q30.
(29) Are there any partners (local or non-local) that you collaborated with prior to 2005, but
whom you do not collaborate with now?
___ No GO TO Q29
___ Yes (if yes answer Q29a & Q29b)
(29a) Who are they? ___________________________________________________________
(29b) Why do you no longer collaborate with them? _________________________________
Sponsors active in 2005 and 2006 will be shown both Q30 & Q31; sponsors active in 2006, but
not 2005, will only see Q30 “Importance in 2006.”
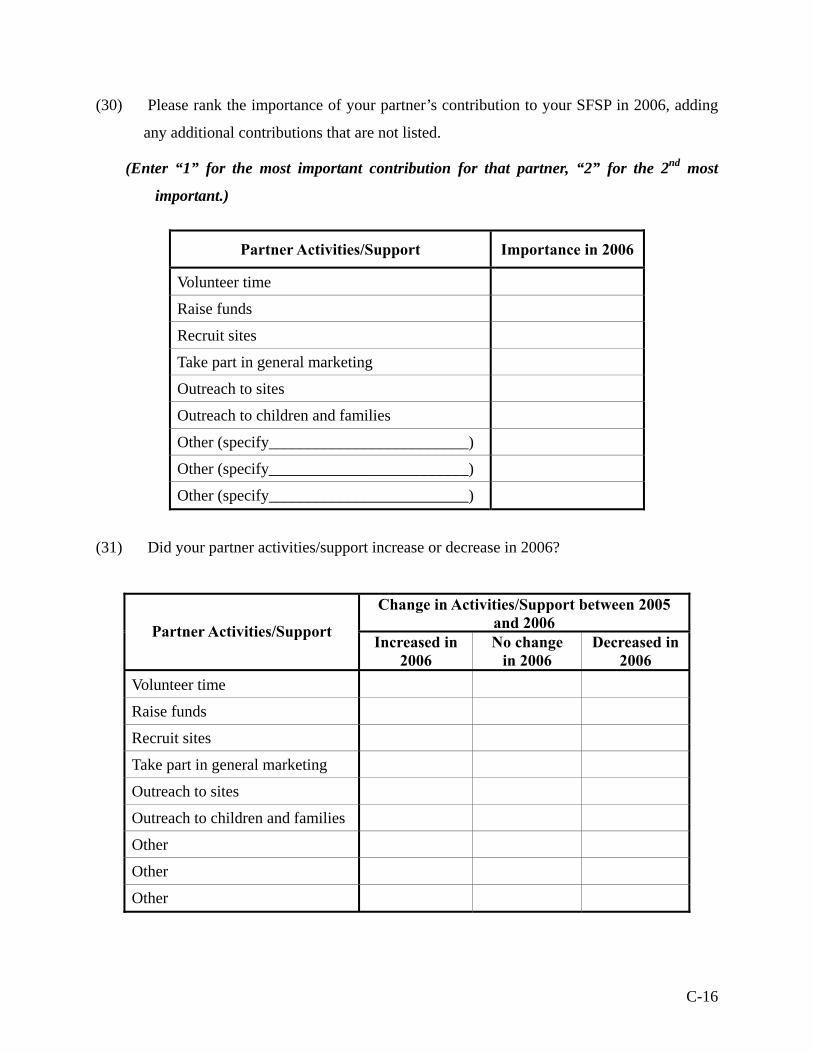
C-16
(30) Please rank the importance of your partner’s contribution to your SFSP in 2006, adding
any additional contributions that are not listed.
(Enter “1” for the most important contribution for that partner, “2” for the 2nd most
important.)
Partner Activities/Support Importance in 2006
Volunteer time
Raise funds
Recruit sites
Take part in general marketing
Outreach to sites
Outreach to children and families
Other (specify_________________________)
Other (specify_________________________)
Other (specify_________________________)
(31) Did your partner activities/support increase or decrease in 2006?
Change in Activities/Support between 2005 and 2006Partner Activities/Support
Increased in 2006
No change in 2006
Decreased in 2006
Volunteer time
Raise funds
Recruit sites
Take part in general marketing
Outreach to sites
Outreach to children and families
Other
Other
Other
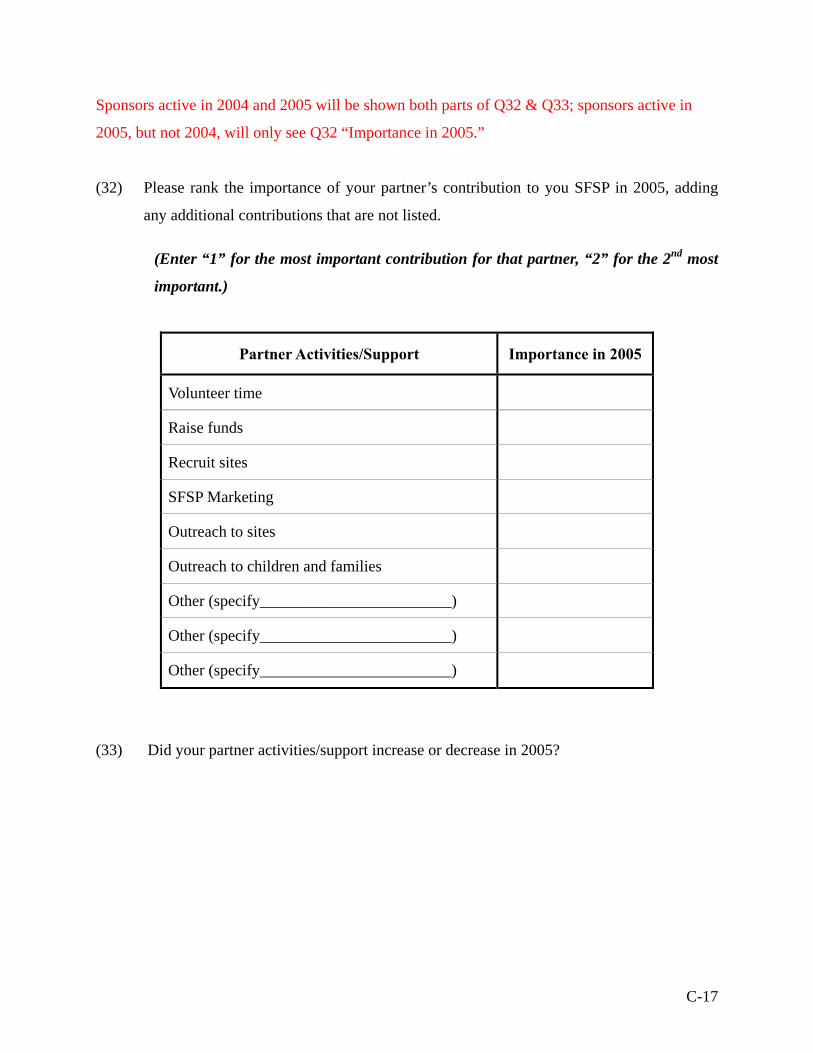
C-17
Sponsors active in 2004 and 2005 will be shown both parts of Q32 & Q33; sponsors active in
2005, but not 2004, will only see Q32 “Importance in 2005.”
(32) Please rank the importance of your partner’s contribution to you SFSP in 2005, adding
any additional contributions that are not listed.
(Enter “1” for the most important contribution for that partner, “2” for the 2nd most
important.)
Partner Activities/Support Importance in 2005
Volunteer time
Raise funds
Recruit sites
SFSP Marketing
Outreach to sites
Outreach to children and families
Other (specify________________________)
Other (specify________________________)
Other (specify________________________)
(33) Did your partner activities/support increase or decrease in 2005?
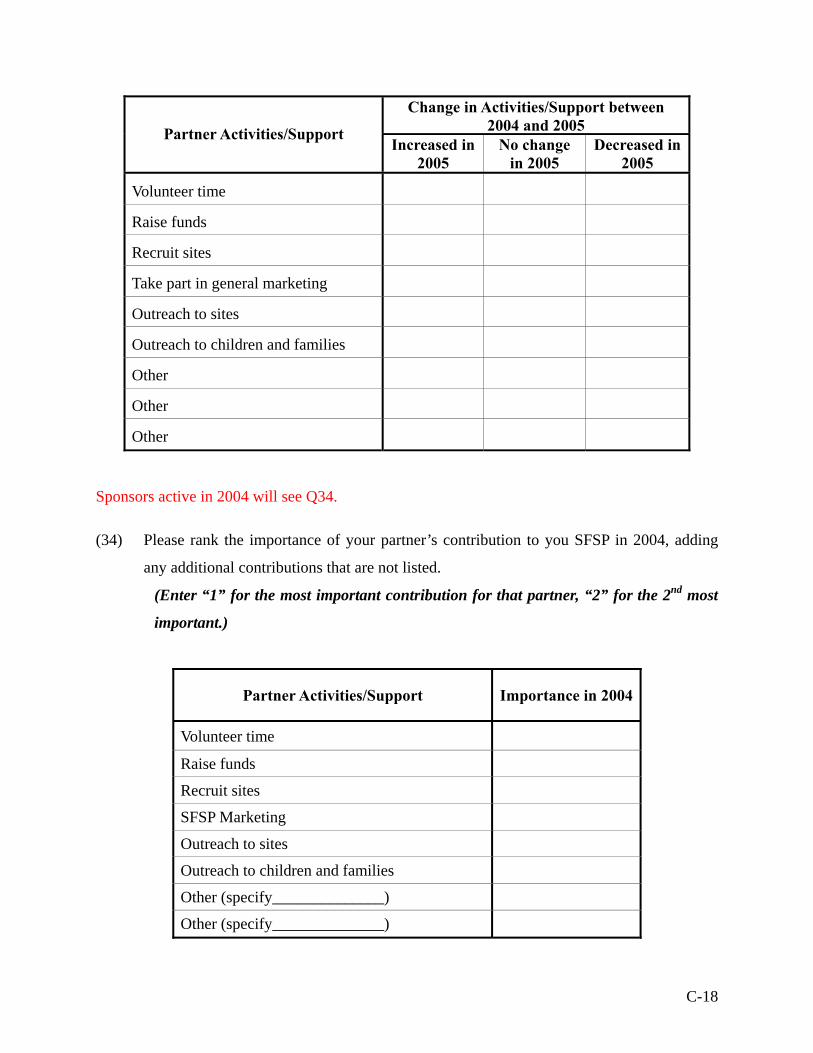
C-18
Change in Activities/Support between 2004 and 2005 Partner Activities/Support
Increased in 2005
No change in 2005
Decreased in2005
Volunteer time
Raise funds
Recruit sites
Take part in general marketing
Outreach to sites
Outreach to children and families
Other
Other
Other
Sponsors active in 2004 will see Q34.
(34) Please rank the importance of your partner’s contribution to you SFSP in 2004, adding
any additional contributions that are not listed.
(Enter “1” for the most important contribution for that partner, “2” for the 2nd most
important.)
Partner Activities/Support Importance in 2004
Volunteer time
Raise funds
Recruit sites
SFSP Marketing
Outreach to sites
Outreach to children and families
Other (specify______________)
Other (specify______________)

C-19
(35) Do you make any special efforts to recruit partners?
___ No
___ Yes (If yes) (35a) What do you do? ______________________________________
(36) Please provide suggestions for getting community members involved in the SFSP?
______________________________________________________________________
______________________________________________________________________
Budget and Funding Sources
(37) How much of the cost of administering and managing the SFSP (including sponsor and
all site costs) was NOT covered by the Pennsylvania Department of Education SFSP
funding?
2004 $ ____________________
2005 $ ____________________
2006 $ ____________________
(38) Do you have a budget for marketing the SFSP?
___ No
___ Yes (If yes) GO TO Q38a
(38a) How much money did you allocate to marketing SFSP?
(Please enter -1 if you don’t know)
2004 $ ____________________
2005 $ ____________________
2006 $ ____________________

C-20
(39) Which of the following contributed to the cost of these marketing efforts? Check all that
provided any funding.
Funding Sources for Marketing Costs 2006 2005 2004
My organization
Partners (Specify __________)
Partners (Specify __________)
Individuals
Other (specify_______________)
Sponsors active in 2006 that chose more than one funding source in 2006 will be asked Q40.
(40) Which of these provided the most funds for your marketing efforts in 2006?
Funding Sources for Marketing Costs √
My organization
Partners
Partners
Individuals
Other
Sponsors active in 2005 that chose more than one funding source in 2005 will be asked Q41.
(41) Which of these provided the most funds for your marketing efforts in 2005?
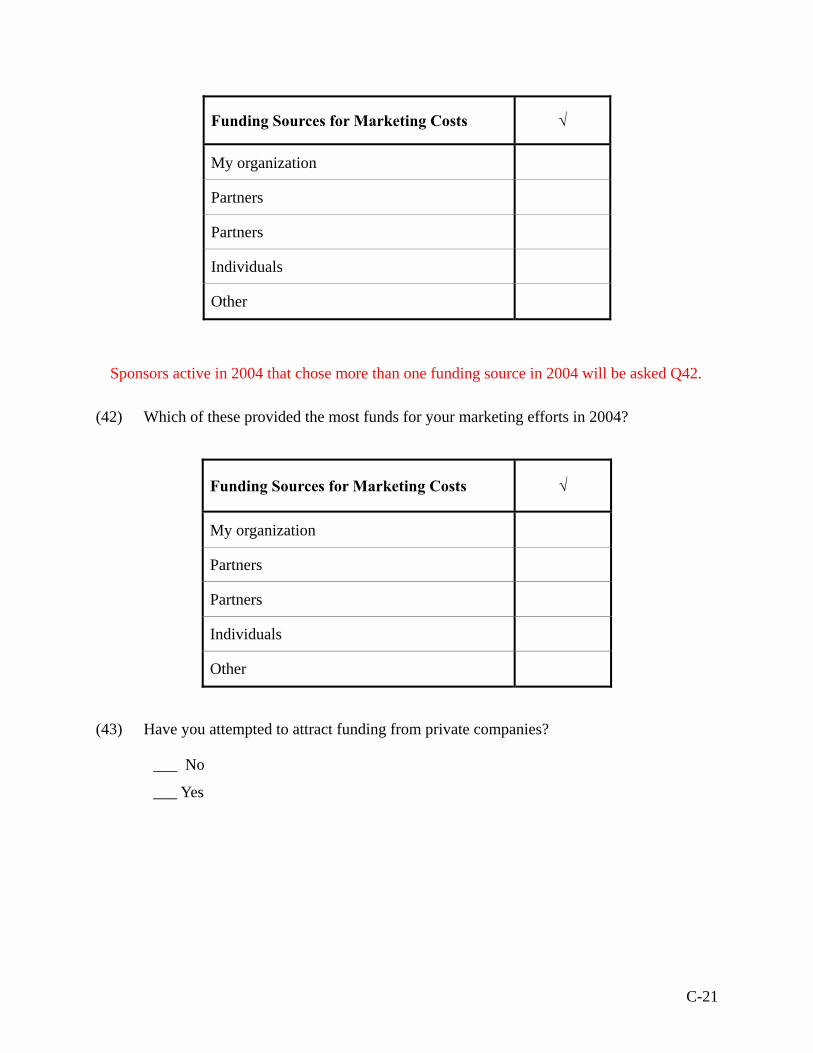
C-21
Funding Sources for Marketing Costs √
My organization
Partners
Partners
Individuals
Other
Sponsors active in 2004 that chose more than one funding source in 2004 will be asked Q42.
(42) Which of these provided the most funds for your marketing efforts in 2004?
Funding Sources for Marketing Costs √
My organization
Partners
Partners
Individuals
Other
(43) Have you attempted to attract funding from private companies?
___ No
___ Yes

C-22
Staff
(44) Thinking about all of the people, including yourself, working to administer the Summer
Food Service Program (SFSP), NOT including the operation of the food sites, how much
time is spent on SFSP activities. Is this paid time or volunteer? Use the following
example as a guide.
Amount of time Staff Position During
Summer Rest of Year
Paid Volunteer
Director 3/4 time 1 /4 time �
Assistant Full time 10 % time �
Driver (to deliver food to sites) 1/2 time No time �
(45) Are you aware of any other programs that offer summer food programs for children in
your area, other than the SFSP?
___ No
___ Yes (If yes, present Q45a, Q45b, and Q45c)
(45a) Approximately how many children attend these other programs each summer? ________
(45b) Who do these programs target? (e.g., Are they elementary age? Migrants? Do they
provide special arts programs? Sports programs? Religious programs?) ______________
________________________________________________________________________
________________________________________________________________________
________________________________________________________________________

C-23
(45c) Why do you think these children attend those programs rather than the SFSP?
________________________________________________________________________
________________________________________________________________________
Position:____________
Date:_______________

C-24
APPENDIX C–2
SITE SURVEY
We will pull the following information from PEARS and present it.
The Pennsylvania Department of Education lists your address as:
Site name: ____________________________________________________________________
Address 1: ____________________________________________________________________
Address 2: ____________________________________________________________________
City: __________________________________ Zip code: ______________________________
(1) What type of organization are you?
___ School district
___ Non-profit
___ Religious-based
___ Community action program
___ Other non-profit (Specify____________________)
___ Government agency
___ State
___ County
___ City
___ Other (Specify ____________________________)
___ Private (Specify ___________________________).
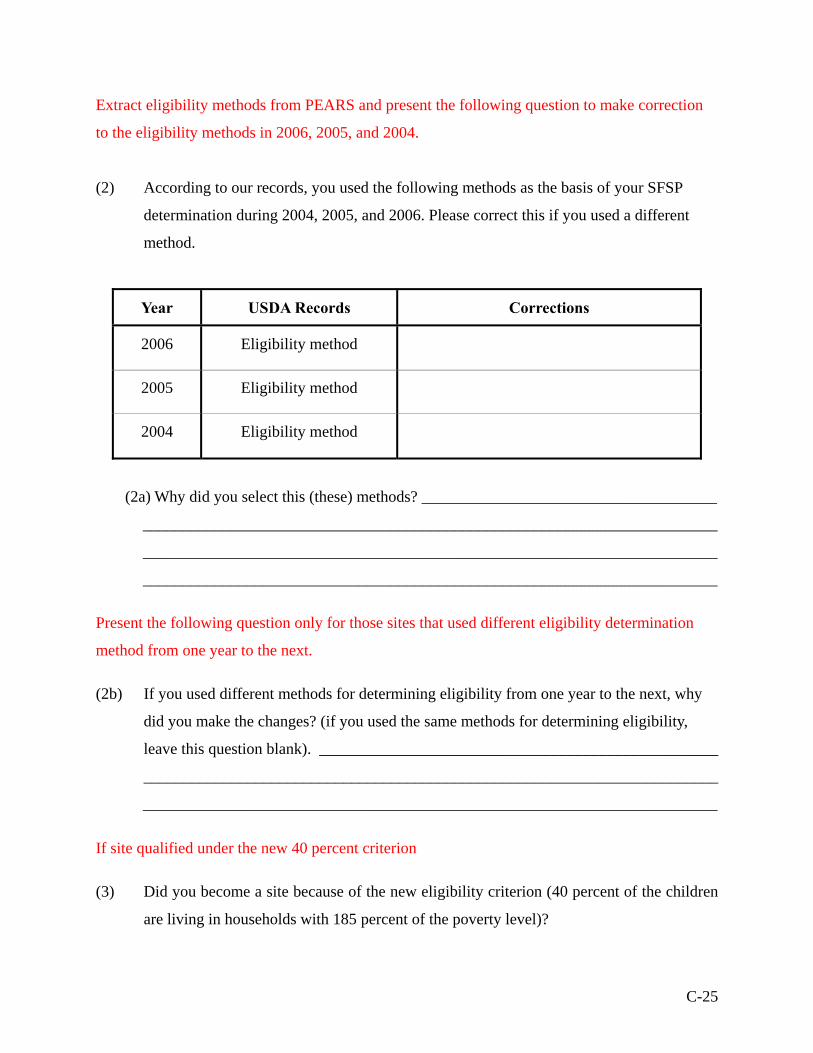
C-25
Extract eligibility methods from PEARS and present the following question to make correction
to the eligibility methods in 2006, 2005, and 2004.
(2) According to our records, you used the following methods as the basis of your SFSP
determination during 2004, 2005, and 2006. Please correct this if you used a different
method.
Year USDA Records Corrections
2006 Eligibility method
2005 Eligibility method
2004 Eligibility method
(2a) Why did you select this (these) methods? _____________________________________
________________________________________________________________________
________________________________________________________________________
________________________________________________________________________
Present the following question only for those sites that used different eligibility determination
method from one year to the next.
(2b) If you used different methods for determining eligibility from one year to the next, why
did you make the changes? (if you used the same methods for determining eligibility,
leave this question blank). __________________________________________________
________________________________________________________________________
________________________________________________________________________
If site qualified under the new 40 percent criterion
(3) Did you become a site because of the new eligibility criterion (40 percent of the children
are living in households with 185 percent of the poverty level)?

C-26
___ No GO TO Q5
___ Yes
(4) Would your site have qualified under the 50 percent criterion had you used another
method to determine eligibility?
___ No GO TO Q5.
___ Yes GO TO Q4a
___ Don’t know GO TO Q5.
(4a) Would you have applied for eligibility had the 50 percent criterion been the requirement?
___ No (If No, GO TO 4b)
___ Yes GO TO Q4c
___ Don’t know GO TO Q5
(4b) Why not? _____________________________________________________ GO TO Q5
(4c) What alternative method for determining eligibility could you have used?
___ Open GO TO 4d
___ Enrolled-income applications collected GO TO Q5
___ Enrolled, eligibility provided by school or other child nutrition program GO TO Q5
___ Residential camp GO TO Q5
___ National Youth Sports Program GO TO Q5
___ Migrant site GO TO Q5
(4d) What type of “open” criterion would you have used?
___ School data
___ Housing data
___ Census track/block
___ Children’s eligibility area

C-27
(5) How did you learn about the SFSP?
Way You Learned About SFSP √
Direct mailings from sponsors
Local newspaper
Newsletters
Outreach by others in the community
Presentations by sponsors
Flyers posted in the community
Word of mouth
Other (Specify_________________________)
(6) If you learned about the SFSP from your sponsor, how did this happen?
___ Phone Call
___ Presentation
___ Mail
___ Other (please specify _______________________________)
(7) How did you go about establishing your SFSP sites?
___ We had an existing program that served children and our sponsor approached us
about becoming an SFSP site.
___ We had an existing program that served children and we approached our sponsor
about becoming an SFSP site.
___ This was a new site instituted because of the SFSP.
___ Other (Specify_______________________________________)
(8) Please describe any obstacles to opening new site _______________________________
______________________________________________________________________
______________________________________________________________________
______________________________________________________________________

C-28
Attendance
(9) How many children did you serve each day?
2006 2005 2004 Meal Type Average Highest Lowest Average Highest Lowest Average Highest Lowest
Breakfast
Lunch
Dinner
Snack
(10) What do you do if more children than you plan for show up? ______________________
______________________________________________________________________
______________________________________________________________________
______________________________________________________________________
(11) In your experience, do the children come to your site: (check one).
___ Mostly for the meals?
___ Mostly to participate in other activities?
___ For the meals and the activities equally?
___ Or mostly for some other reason? Please specify Other: ____________________
______________________________________________________________________
______________________________________________________________________
(12) How many children of the following ages, ON AVERAGE, attended your SFSP in each
of the following years?
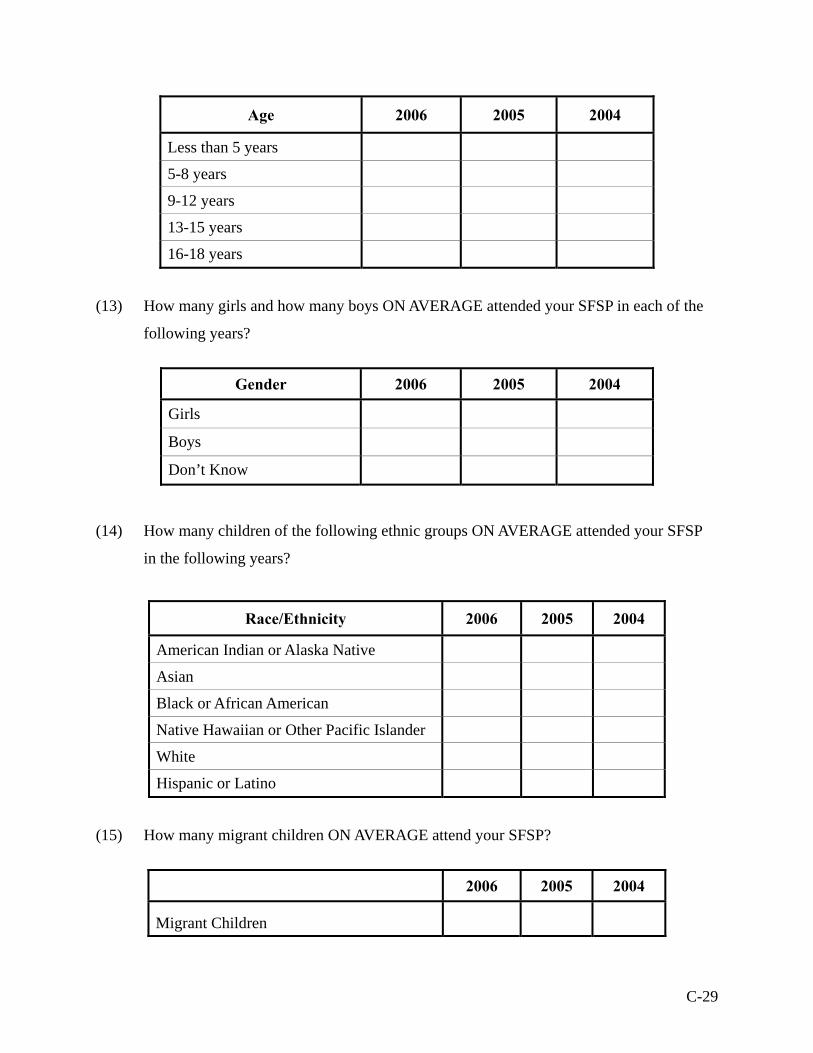
C-29
Age 2006 2005 2004
Less than 5 years
5-8 years
9-12 years
13-15 years
16-18 years
(13) How many girls and how many boys ON AVERAGE attended your SFSP in each of the
following years?
Gender 2006 2005 2004
Girls
Boys
Don’t Know
(14) How many children of the following ethnic groups ON AVERAGE attended your SFSP
in the following years?
Race/Ethnicity 2006 2005 2004
American Indian or Alaska Native
Asian
Black or African American
Native Hawaiian or Other Pacific Islander
White
Hispanic or Latino
(15) How many migrant children ON AVERAGE attend your SFSP?
2006 2005 2004
Migrant Children

C-30
Ask only if migrants attended the SFSP.
(15a) What type of migrants do you serve? (Check all that apply.)
___ Traditional migrants who move from place to place, following the crops
___ Migrants that work year-round, e.g., chicken and fish processing plant migrants
___ Seasonal farm workers who stay for a full season, e.g., summer, but return to a
home base in winter (e.g., Texas)
(16) Some sites report that children of different ages are less likely to attend the SFSP than
others.
(16a) Do you have difficulty either “reaching children” children of different ages?
(16b) Do you have difficulty getting children of different ages to attend SFSP?
(16c) Why?
Check off those ages that were either difficult to reach or difficult to get to attend the SFSP and explain why. If there was no difference, leave this question blank: GO TO Q17
Age Getting the Word Out
Getting Children to Attend Why?
Less than 5 years
5-8 years
9-12 years
13-15 years
16-18 years
(17) Gender?
(17a) Do you have difficulty reaching either boys or girls?
(17b) Do you have difficulty getting either boys or girls to attend the SFSP?
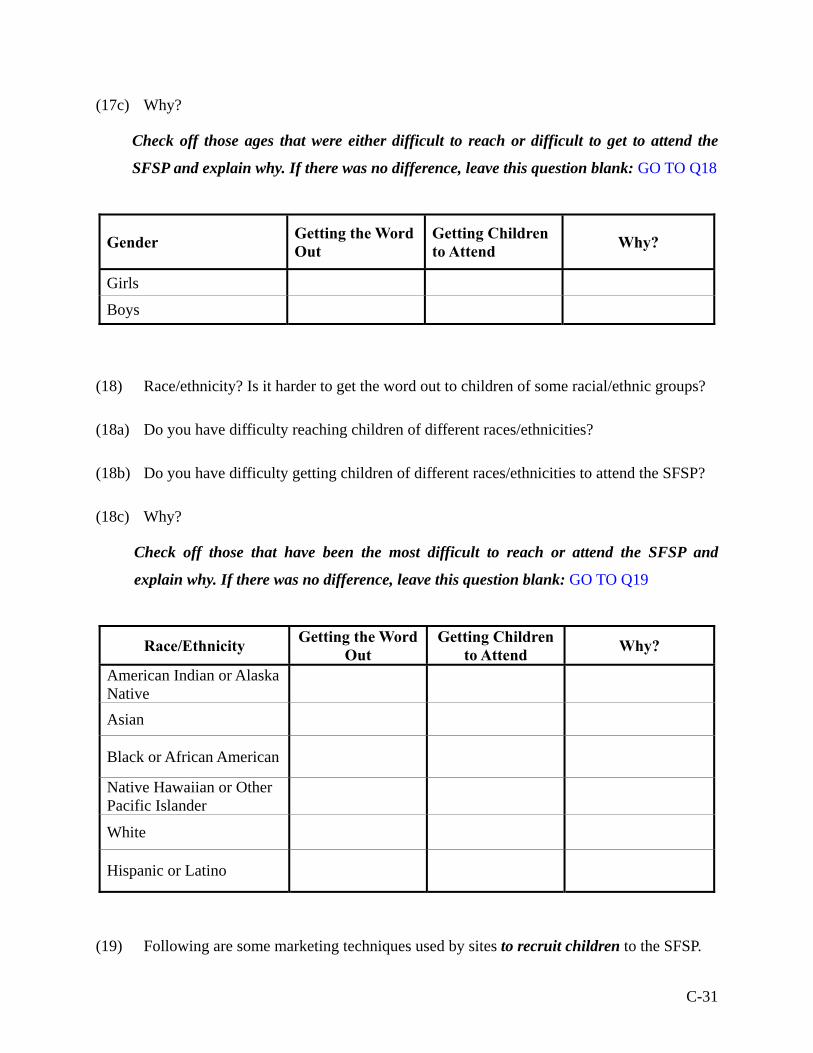
C-31
(17c) Why?
Check off those ages that were either difficult to reach or difficult to get to attend the
SFSP and explain why. If there was no difference, leave this question blank: GO TO Q18
Gender Getting the Word Out
Getting Children to Attend Why?
Girls
Boys
(18) Race/ethnicity? Is it harder to get the word out to children of some racial/ethnic groups?
(18a) Do you have difficulty reaching children of different races/ethnicities?
(18b) Do you have difficulty getting children of different races/ethnicities to attend the SFSP?
(18c) Why?
Check off those that have been the most difficult to reach or attend the SFSP and
explain why. If there was no difference, leave this question blank: GO TO Q19
Race/Ethnicity Getting the Word Out
Getting Children to Attend Why?
American Indian or Alaska Native
Asian
Black or African American
Native Hawaiian or Other Pacific Islander
White
Hispanic or Latino
(19) Following are some marketing techniques used by sites to recruit children to the SFSP.

C-32
(19a) Check each technique that your site used.
(19b) Rate the effectiveness of each of the techniques.
Effectiveness
Effective Ineffective Marketing Techniques Techni-
que Used
Very Some-what
Neither Effective nor in-
effective Some-what Very
Don’t Know
Direct mailings
Local newspaper
Newsletters
Outreach by others in the community
Presentations to local non-profits
Posting flyers throughout the community
Other (specify____________)
The following will be displayed only if respondent checks off Direct Mailings.
(20) If you used direct mailings, where do you send your direct mailings? (check all that
apply).
___ To churches
___ To families
___ To schools
___ To daycare centers
___ To other groups (Specify ___________________)
___ To other groups (Specify ___________________)
___ To other groups (Specify ___________________)
___ To other groups (Specify ___________________)
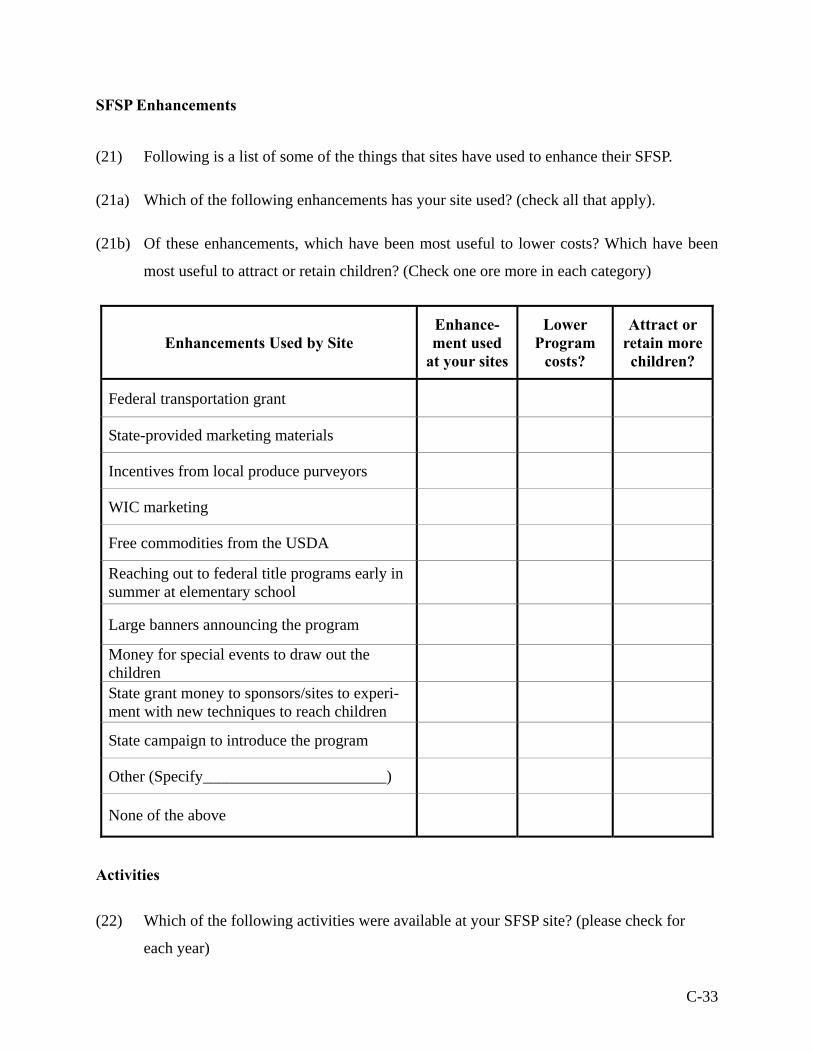
C-33
SFSP Enhancements
(21) Following is a list of some of the things that sites have used to enhance their SFSP.
(21a) Which of the following enhancements has your site used? (check all that apply).
(21b) Of these enhancements, which have been most useful to lower costs? Which have been
most useful to attract or retain children? (Check one ore more in each category)
Enhancements Used by Site Enhance-ment used
at your sites
Lower Program
costs?
Attract or retain more children?
Federal transportation grant
State-provided marketing materials
Incentives from local produce purveyors
WIC marketing
Free commodities from the USDA
Reaching out to federal title programs early in summer at elementary school
Large banners announcing the program
Money for special events to draw out the children
State grant money to sponsors/sites to experi-ment with new techniques to reach children
State campaign to introduce the program
Other (Specify_______________________)
None of the above
Activities
(22) Which of the following activities were available at your SFSP site? (please check for
each year)
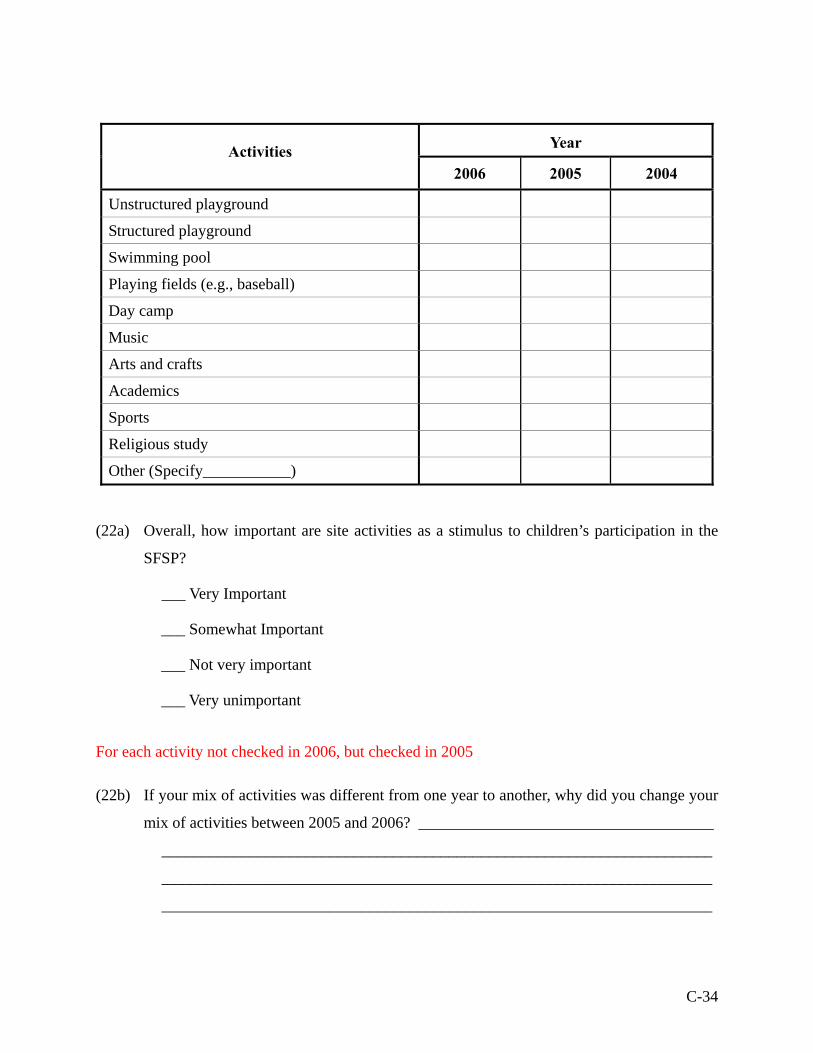
C-34
Year Activities 2006 2005 2004
Unstructured playground
Structured playground
Swimming pool
Playing fields (e.g., baseball)
Day camp
Music
Arts and crafts
Academics
Sports
Religious study
Other (Specify___________)
(22a) Overall, how important are site activities as a stimulus to children’s participation in the
SFSP?
___ Very Important
___ Somewhat Important
___ Not very important
___ Very unimportant
For each activity not checked in 2006, but checked in 2005
(22b) If your mix of activities was different from one year to another, why did you change your
mix of activities between 2005 and 2006? _____________________________________
_____________________________________________________________________
_____________________________________________________________________
_____________________________________________________________________

C-35
For each activity not checked in 2005, but checked in 2004
(22c) Why did you change your mix of activities between 2004 and 2005? _______________
_____________________________________________________________________
_____________________________________________________________________
Meals
(23) Which meals did you serve in the following years?
Type Meal 2006 2005 2004
Breakfast
Lunch
Dinner
Snack
(24) Were these meals primarily hot, primarily cold, or both hot and cold? (Leave blank those meals you did not serve.)
2006 2005 2004 Type of
Meal
Prima-rily Hot
Prima-rily
Cold
Both hot and
cold
Prima-rily Hot
Prima-rily
Cold
Both hot and
cold
Prima-rily Hot
Prima-rily
Cold
Both hot and
cold
Breakfast
Lunch
Dinner
Snack
(25) Did you make any substantive changes to your menus in these years?

C-36
2006 2005 2004 Changes to your Menu Yes No Yes No Yes No
Breakfast
Lunch
Dinner
Snack
If you made any substantive changes to your menu from one year to another, please answer
questions 25a, 25b, and 25c; otherwise GO TO Q26.
(25a) In what ways did you change your menu in 2006? ______________________________
_____________________________________________________________________
_____________________________________________________________________
(25b) In what ways did you change your menu in 2005? ______________________________
_____________________________________________________________________
_____________________________________________________________________
(25c) In what ways did you change your menu in 2004? ______________________________
______________________________________________________________________
______________________________________________________________________
(26) Were the meals you served mostly full or mostly light?
(Leave blank those meals you did not serve.)
An example of a “light meal” might be a ham sandwich, an apple, juice or milk.
An example of a “full meal” might be turkey with gravy, mashed potatoes, peas, juice or milk, desert.
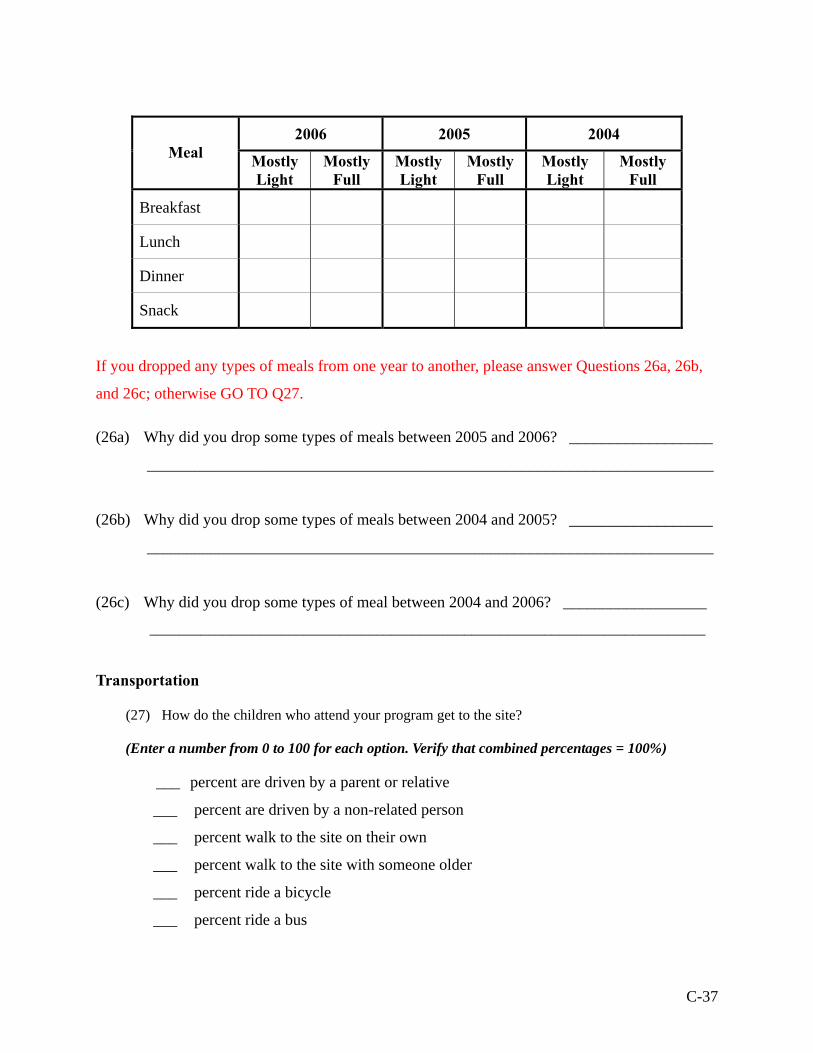
C-37
2006 2005 2004 Meal Mostly
Light Mostly
Full Mostly Light
Mostly Full
Mostly Light
Mostly Full
Breakfast
Lunch
Dinner
Snack
If you dropped any types of meals from one year to another, please answer Questions 26a, 26b,
and 26c; otherwise GO TO Q27.
(26a) Why did you drop some types of meals between 2005 and 2006? __________________
_______________________________________________________________________
(26b) Why did you drop some types of meals between 2004 and 2005? __________________
_______________________________________________________________________
(26c) Why did you drop some types of meal between 2004 and 2006? __________________
____________________________________________________________________________
Transportation
(27) How do the children who attend your program get to the site?
(Enter a number from 0 to 100 for each option. Verify that combined percentages = 100%)
___ percent are driven by a parent or relative
___ percent are driven by a non-related person
___ percent walk to the site on their own
___ percent walk to the site with someone older
___ percent ride a bicycle
___ percent ride a bus
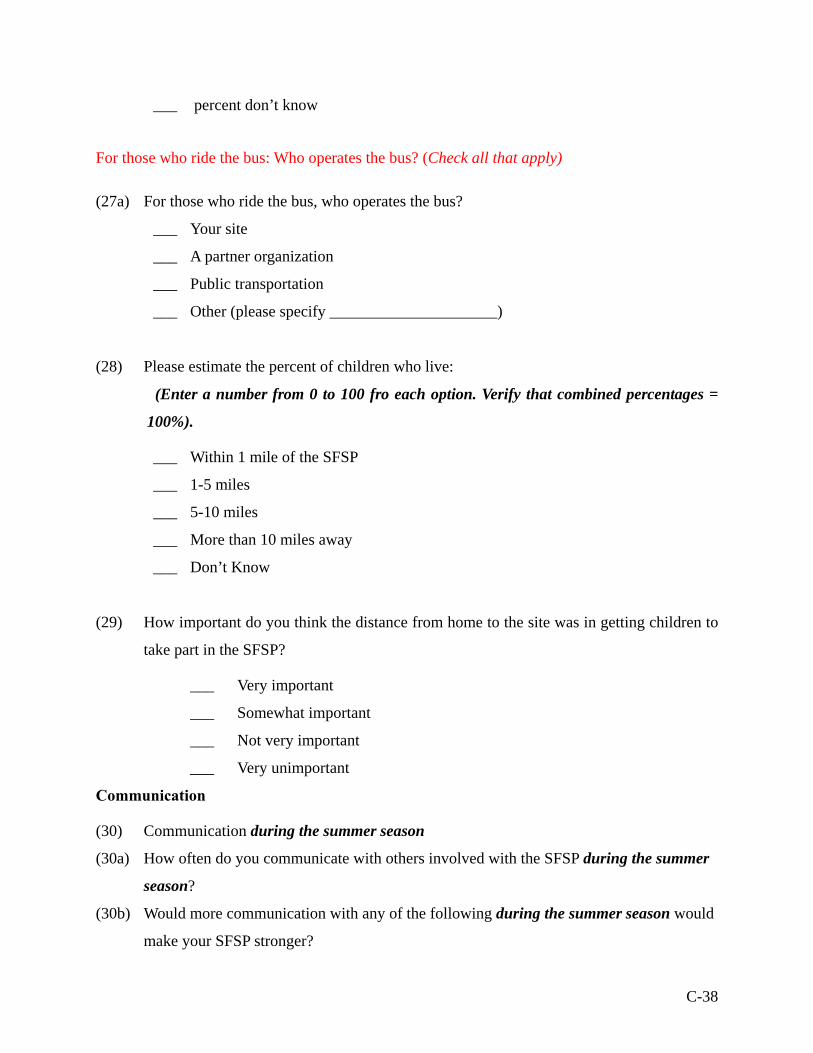
C-38
___ percent don’t know
For those who ride the bus: Who operates the bus? (Check all that apply)
(27a) For those who ride the bus, who operates the bus?
___ Your site
___ A partner organization
___ Public transportation
___ Other (please specify _____________________)
(28) Please estimate the percent of children who live:
(Enter a number from 0 to 100 fro each option. Verify that combined percentages =
100%).
___ Within 1 mile of the SFSP
___ 1-5 miles
___ 5-10 miles
___ More than 10 miles away
___ Don’t Know
(29) How important do you think the distance from home to the site was in getting children to
take part in the SFSP?
___ Very important
___ Somewhat important
___ Not very important
___ Very unimportant
Communication
(30) Communication during the summer season
(30a) How often do you communicate with others involved with the SFSP during the summer
season?
(30b) Would more communication with any of the following during the summer season would
make your SFSP stronger?
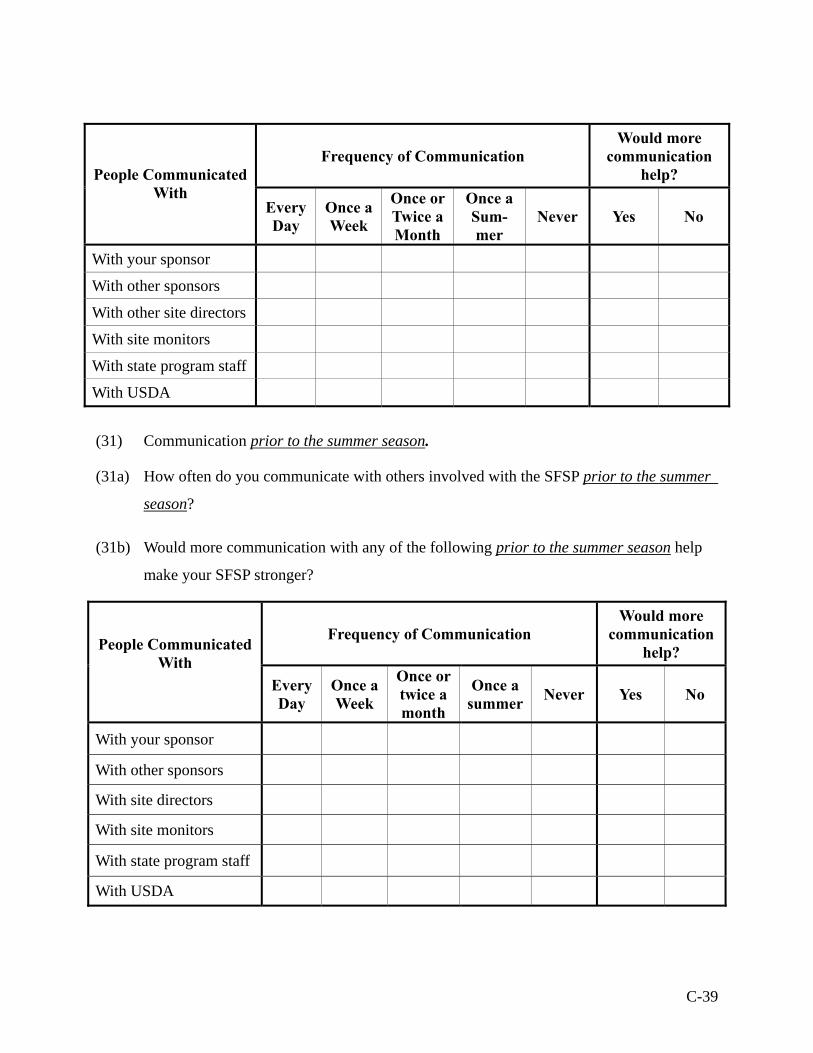
C-39
Frequency of Communication Would more
communication help? People Communicated
With Every Day
Once a Week
Once or Twice a Month
Once a Sum-mer
Never Yes No
With your sponsor With other sponsors With other site directors With site monitors With state program staff With USDA
(31) Communication prior to the summer season.
(31a) How often do you communicate with others involved with the SFSP prior to the summer
season?
(31b) Would more communication with any of the following prior to the summer season help
make your SFSP stronger?
Frequency of Communication Would more
communication help? People Communicated
With Every Day
Once a Week
Once or twice a month
Once a summer Never Yes No
With your sponsor
With other sponsors
With site directors
With site monitors
With state program staff
With USDA

C-40
Concerns
(32) Following are some of the concerns sites report about the SFSP. Please check all of those
items that apply to your operation.
Concerns/Problems √
Reimbursement/administrative fees
SFSP application requirements
SFSP reporting requirements
Lack of vehicles to move food
Lack of equipment to move food
Little freedom in terms of what we serve at meals
SFSP monitoring requirements
40% requirement only lasts for 2 years
Lack of staff
Staff turnover
Staff training
Food preparation
Extensive administrative or operational regulations
Requirement for summer-long menus
The following will be displayed only if respondent checks reimbursement/administrative fees.
(32a) In what ways were reimbursement/administrative fees a problem?
___ Are too low and do not cover actual expenses
___ Only reimburse 2 percent for second servings
___ Does not cover transportation costs needed to reach distant areas
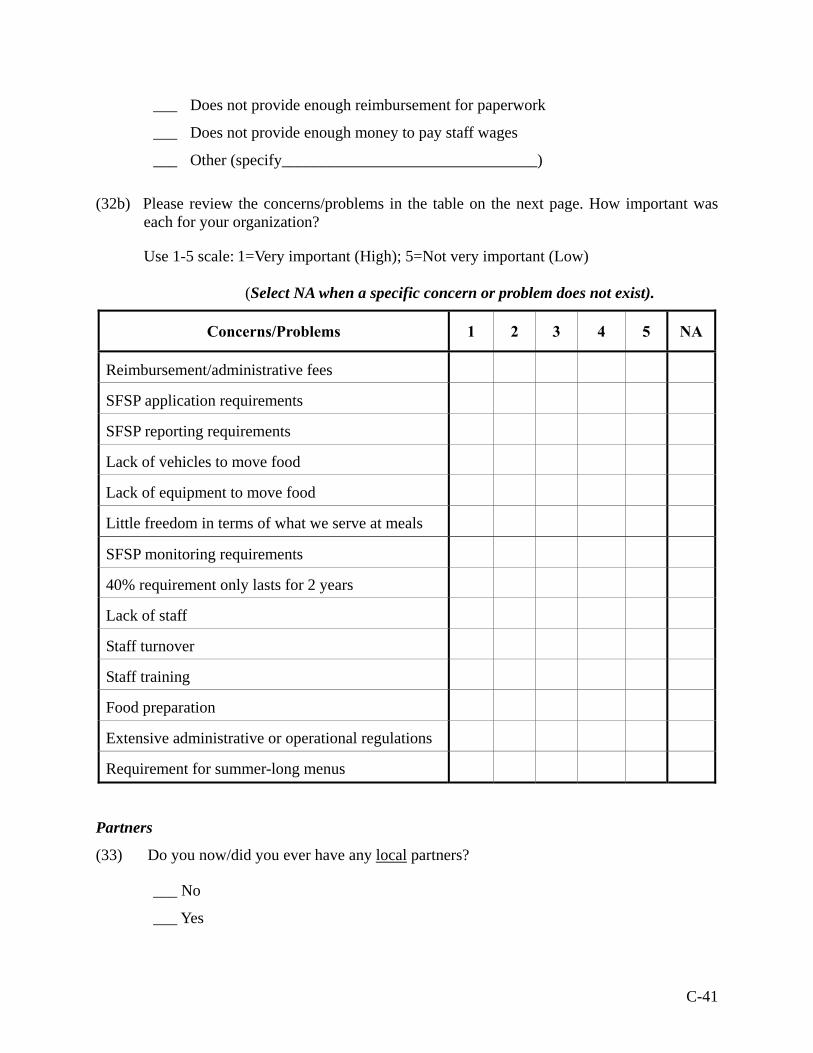
C-41
___ Does not provide enough reimbursement for paperwork
___ Does not provide enough money to pay staff wages
___ Other (specify________________________________)
(32b) Please review the concerns/problems in the table on the next page. How important was each for your organization?
Use 1-5 scale: 1=Very important (High); 5=Not very important (Low)
(Select NA when a specific concern or problem does not exist).
Concerns/Problems 1 2 3 4 5 NA
Reimbursement/administrative fees
SFSP application requirements
SFSP reporting requirements
Lack of vehicles to move food
Lack of equipment to move food
Little freedom in terms of what we serve at meals
SFSP monitoring requirements
40% requirement only lasts for 2 years
Lack of staff
Staff turnover
Staff training
Food preparation
Extensive administrative or operational regulations
Requirement for summer-long menus
Partners
(33) Do you now/did you ever have any local partners?
___ No
___ Yes

C-42
(34) Do you now/did you ever have any non-local partners?
___ No
___ Yes
Sponsors who answer “No” to Q33 and Q34 will skip to Q36.
(35) Are there any partners (local or non-local) that you collaborated with prior to 2005, but
whom you do not collaborate with now?
___ No
___ Yes (If yes) (39a) Who are they? _____________________________________
If you answer No for Question 33
(35a) Why do you no longer collaborate with them? _________________________________
______________________________________________________________________
______________________________________________________________________
______________________________________________________________________
The following questions will only be shown if the site was active during the relevant time
periods. Sites active in 2005 and 2006 will see all parts of Q36. Sites active in 2006, but not
2005, will only see Q36a “Importance in 2006.”
(36) Importance of Partner’s Contributions in 2006
(36a) Please rank order of importance of your partner’s contribution to your SFSP in 2006. List
additional contributions if they are not shown below. Enter “1” for the most important
contribution, “2” for the 2nd most important contribution, etc.
(36b) Did your partner activities/support increased or decreased from 2005 to 2006.
(If your partners were not involved in some of these activities, lease those blank.)

C-43
Sites active in 2004 and 2005 will see all parts in Q37. Sites active in 2005, but not 2004, will
only see Q37a “Importance in 2005.”
(37) Importance of Partner’s Contributions in 2006
(37a) Please rank order of importance of your partner’s contribution to your SFSP in 2005. List
additional contributions if they are not shown below. Enter “1” for the most important
contribution, “2” for the 2nd most important contribution, etc.
(37b) Did your partner activities/support increased or decreased from 2004 to 2005.
(If your partners were not involved in some of these activities, lease those blank.)
Change in Activities/Support between 2004 and 2005 Partner Activities/Support Importance
in 2005 Increased in 2005
No change in 2005
Decreased in 2005
Volunteer time
Raise funds
Recruit sites
Take part in general marketing
Outreach to sites
Outreach to children and families
Other (specify____________) Sites active in 2004, see Q38.
Change in Activities/Support between 2005 and 2006 Partner Activities/Support Importance in
2006 Increased in 2006
No change in 2006
Decreased in 2006
Volunteer time
Raise funds
Recruit sites
Take part in general marketing
Outreach to sites
Outreach to children and families
Other (specify____________)
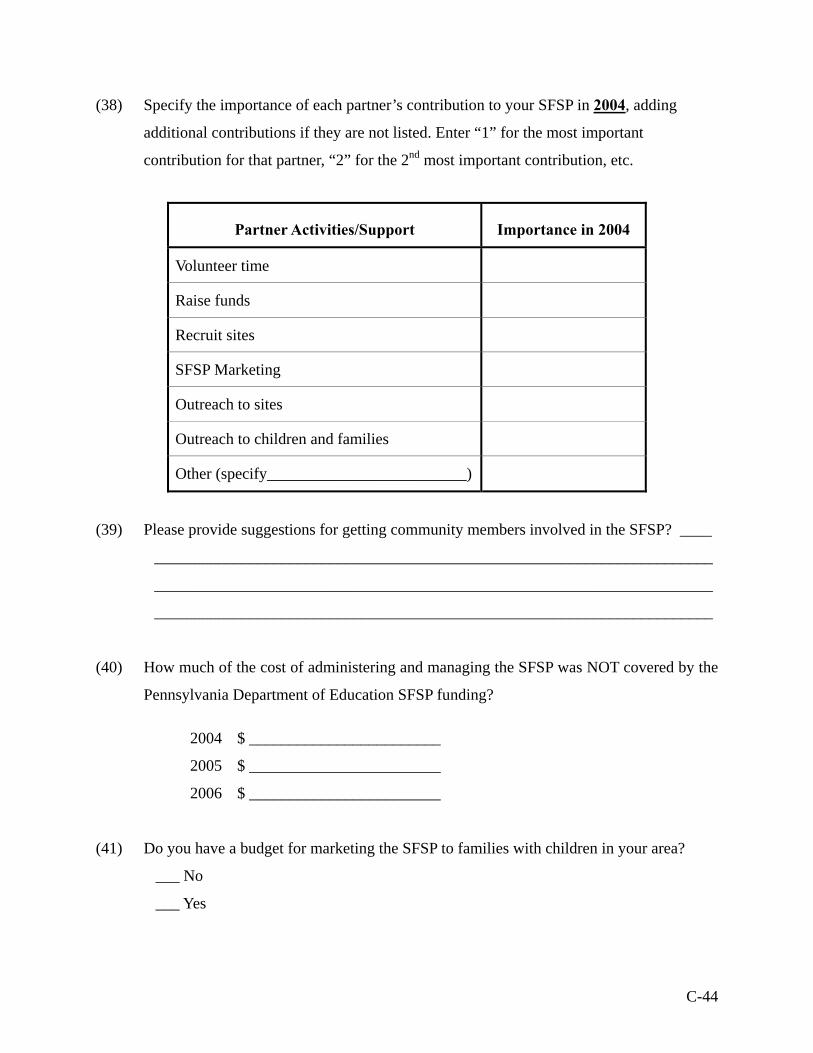
C-44
(38) Specify the importance of each partner’s contribution to your SFSP in 2004, adding
additional contributions if they are not listed. Enter “1” for the most important
contribution for that partner, “2” for the 2nd most important contribution, etc.
Partner Activities/Support Importance in 2004
Volunteer time
Raise funds
Recruit sites
SFSP Marketing
Outreach to sites
Outreach to children and families
Other (specify_________________________)
(39) Please provide suggestions for getting community members involved in the SFSP? ____
______________________________________________________________________
______________________________________________________________________
______________________________________________________________________
(40) How much of the cost of administering and managing the SFSP was NOT covered by the
Pennsylvania Department of Education SFSP funding?
2004 $ ________________________
2005 $ ________________________
2006 $ ________________________
(41) Do you have a budget for marketing the SFSP to families with children in your area?
___ No
___ Yes
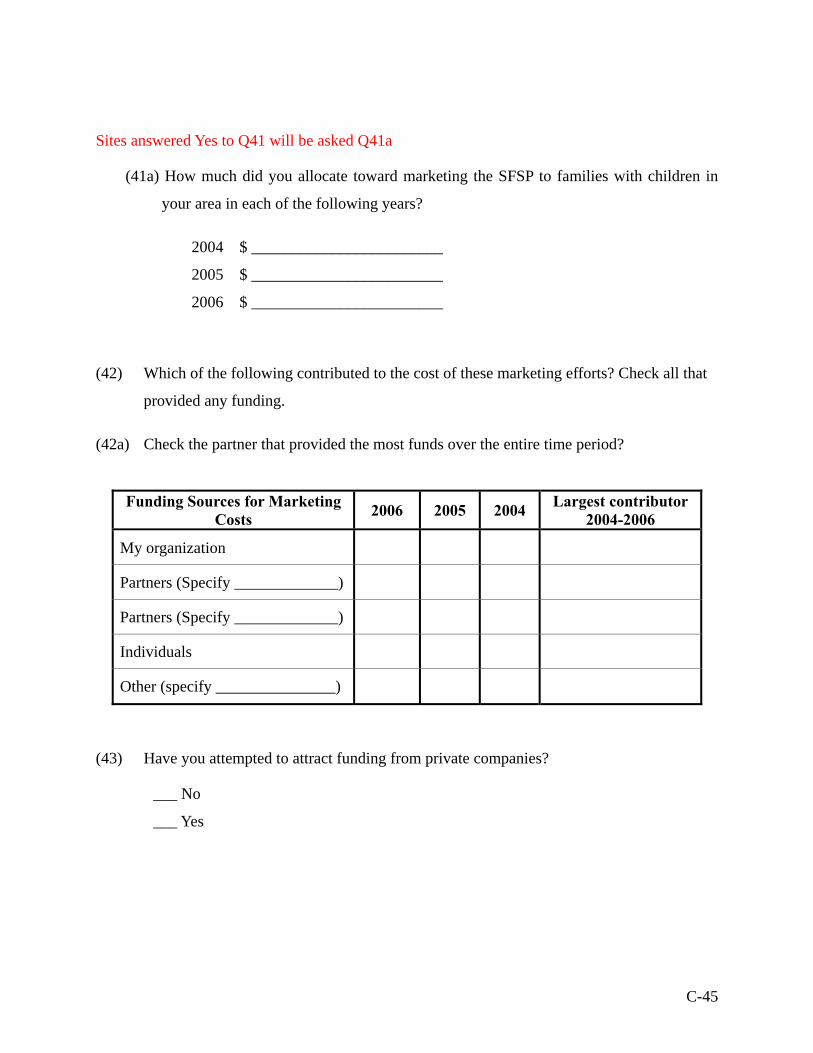
C-45
Sites answered Yes to Q41 will be asked Q41a
(41a) How much did you allocate toward marketing the SFSP to families with children in
your area in each of the following years?
2004 $ ________________________
2005 $ ________________________
2006 $ ________________________
(42) Which of the following contributed to the cost of these marketing efforts? Check all that
provided any funding.
(42a) Check the partner that provided the most funds over the entire time period?
Funding Sources for Marketing Costs 2006 2005 2004 Largest contributor
2004-2006
My organization
Partners (Specify _____________)
Partners (Specify _____________)
Individuals
Other (specify _______________)
(43) Have you attempted to attract funding from private companies?
___ No
___ Yes

C-46
Staff
(44) Thinking about all of the people, including yourself, working to administer the Summer
Food Service Program (SFSP), how much time is spent on SFSP activities.
(44a) During summer?
(44b) During the rest of the year?
(44c) Was this paid time or volunteer?
Use the responses in the grid below as a guide to your own answer.
Amount of time Staff Position During
SummerRest of Year
Paid Volunteer
Director 3/4 time 1 /4 time
Assistant Full time 10 % time
Driver (to deliver food to sites) 1/2 time No time
(45) Are you aware of any other programs that offer summer food programs for children in
your area, other than the SFSP?
___ No
___ Yes (If yes present Q45a, Q45b, and Q45c)
(45a) Approximately how many children attend these other programs each summer? ________
______________________________________________________________________
______________________________________________________________________

C-47
(45b) Who do these programs target? (e.g., Are they elementary age? migrants? Special arts
programs? Sports programs?) ______________________________________________
______________________________________________________________________
______________________________________________________________________
(45c) Why do you think children attend those programs rather than the SFSP? __________
_____________________________________________________________________
_____________________________________________________________________
Position: ___________________________________
Date: __/__/2006

C-48
D-1
APPENDIX D
ADDITIONAL SURVEY TABLES
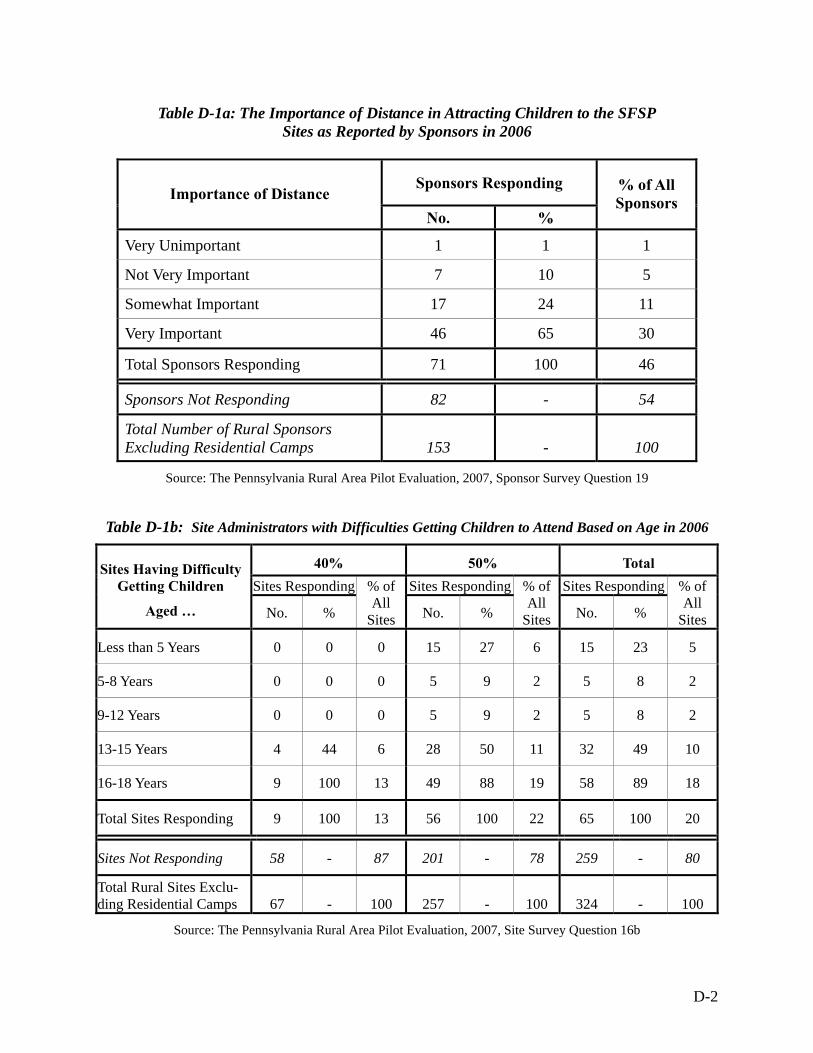
D-2
Table D-1a: The Importance of Distance in Attracting Children to the SFSP Sites as Reported by Sponsors in 2006
Sponsors Responding Importance of Distance
No. %
% of All Sponsors
Very Unimportant 1 1 1
Not Very Important 7 10 5
Somewhat Important 17 24 11
Very Important 46 65 30
Total Sponsors Responding 71 100 46
Sponsors Not Responding 82 - 54
Total Number of Rural Sponsors Excluding Residential Camps 153 - 100
Source: The Pennsylvania Rural Area Pilot Evaluation, 2007, Sponsor Survey Question 19
Table D-1b: Site Administrators with Difficulties Getting Children to Attend Based on Age in 2006
40% 50% Total Sites Responding Sites Responding Sites Responding
Sites Having Difficulty Getting Children
Aged … No. %
% of All
Sites No. %
% of All
Sites No. %
% of All
Sites
Less than 5 Years 0 0 0 15 27 6 15 23 5
5-8 Years 0 0 0 5 9 2 5 8 2
9-12 Years 0 0 0 5 9 2 5 8 2
13-15 Years 4 44 6 28 50 11 32 49 10
16-18 Years 9 100 13 49 88 19 58 89 18
Total Sites Responding 9 100 13 56 100 22 65 100 20
Sites Not Responding 58 - 87 201 - 78 259 - 80
Total Rural Sites Exclu-ding Residential Camps 67 - 100 257 - 100 324 - 100
Source: The Pennsylvania Rural Area Pilot Evaluation, 2007, Site Survey Question 16b
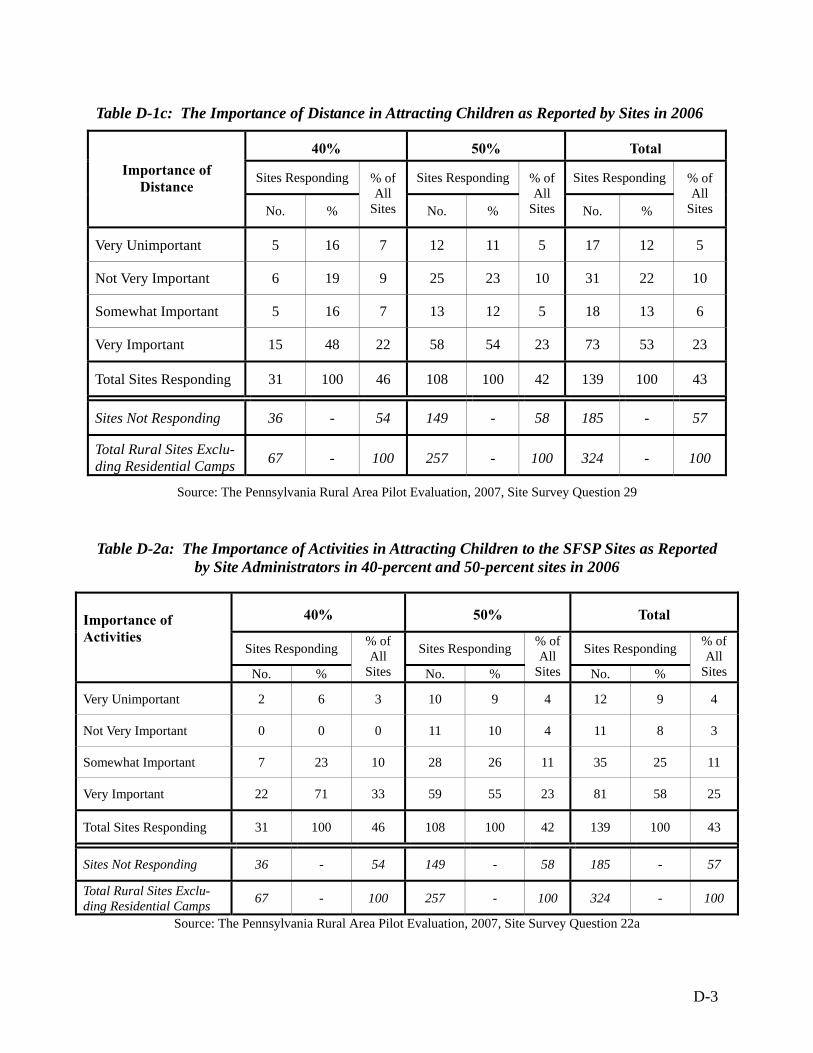
D-3
Table D-1c: The Importance of Distance in Attracting Children as Reported by Sites in 2006
40% 50% Total
Sites Responding Sites Responding Sites Responding Importance of Distance
No. %
% of All
Sites No. %
% of All
Sites No. %
% of All
Sites
Very Unimportant 5 16 7 12 11 5 17 12 5
Not Very Important 6 19 9 25 23 10 31 22 10
Somewhat Important 5 16 7 13 12 5 18 13 6
Very Important 15 48 22 58 54 23 73 53 23
Total Sites Responding 31 100 46 108 100 42 139 100 43
Sites Not Responding 36 - 54 149 - 58 185 - 57
Total Rural Sites Exclu-ding Residential Camps 67 - 100 257 - 100 324 - 100
Source: The Pennsylvania Rural Area Pilot Evaluation, 2007, Site Survey Question 29
Table D-2a: The Importance of Activities in Attracting Children to the SFSP Sites as Reported by Site Administrators in 40-percent and 50-percent sites in 2006
40% 50% Total
Sites Responding Sites Responding Sites Responding
Importance of Activities
No. %
% of All
Sites No. %
% of All
Sites No. %
% of All
Sites
Very Unimportant 2 6 3 10 9 4 12 9 4
Not Very Important 0 0 0 11 10 4 11 8 3
Somewhat Important 7 23 10 28 26 11 35 25 11
Very Important 22 71 33 59 55 23 81 58 25
Total Sites Responding 31 100 46 108 100 42 139 100 43
Sites Not Responding 36 - 54 149 - 58 185 - 57
Total Rural Sites Exclu-ding Residential Camps 67 - 100 257 - 100 324 - 100
Source: The Pennsylvania Rural Area Pilot Evaluation, 2007, Site Survey Question 22a

D-4
Table D-2b: A Comparison of the Number and Percent of Sites that Offered Activities from 2004 to 2006
40% 50%
2005 2006 2004 2005 2006
Sites Responding
Sites Responding
Sites Responding
Sites Responding
Sites Responding
Activities
No. %
% of All Sites
No. %
% of All Sites
No. %
% of All Sites
No. %
% of All Sites
No. %
% of All Sites
Arts and Crafts 8 67 20 15 54 22 27 60 10 32 58 14 55 57 21
Structured Playground 9 75 23 12 43 18 18 40 6 19 35 8 52 54 20
Sports 5 42 13 15 54 22 22 49 8 24 44 11 44 46 17
Academics 5 42 13 12 43 18 19 42 7 22 40 10 39 41 15
Playing Fields 6 50 15 10 36 15 24 53 8 24 44 11 38 40 15
Day Camp 2 15 5 6 21 9 19 42 7 23 42 10 38 39 15
Music 7 58 18 12 43 18 16 36 6 19 35 8 25 26 10
Unstructured Playground 1 8 3 6 21 9 17 38 6 18 33 8 30 31 12
Swimming Pool 4 33 10 8 29 12 13 29 5 14 25 6 24 25 9
Other 2 17 5 6 21 9 5 11 2 12 22 5 21 22 8
Religious Study 0 0 0 0 0 0 4 9 1 6 11 3 9 9 4
Total Sites Responding 13 100 33 29 100 43 51 100 18 55 100 24 97 100 38
Sites Not Responding 27 - 68 38 - 57 232 - 82 173 - 76 160 - 62
Total Number of Rural Sites Excluding Residential Camp 40 - 100 67 - 100 283 - 100 228 - 100 257 - 100
Source: The Pennsylvania Rural Area Pilot Evaluation, 2007, Site Survey Question 22

D-5
Table D-3: A Comparison of the Number of Sites That Offered Activities and the Percentage of Sites that Offered Activities from 2004 to 2006
Total
2004 2005 2006
Sites Responding
Sites Responding Sites Responding
Activities
No. %
% of All
Sites No. %
% of All
Sites No. %
% of All
Sites
Arts and Crafts 29 57 10 40 60 15 70 56 22
Structured Playground 22 43 8 28 42 10 64 52 20
Sports 23 45 8 29 43 11 59 48 18
Academics 20 39 7 27 40 10 51 41 16
Playing Fields 26 51 9 30 45 11 48 39 15
Day Camp 19 37 7 25 37 9 44 35 14
Music 17 33 6 26 39 10 37 30 11
Unstructured 17 33 6 19 28 7 36 29 11
Swimming Pool 13 25 5 18 27 7 32 26 10
Other 6 12 2 14 21 5 27 22 8
Religious Study 4 8 1 6 9 2 9 7 3
Total Sites Responding 51 100 18 68 100 25 126 100 39
Sites Not Responding 232 - 82 200 - 75 198 - 61
Total Rural Sites Exclu-ding Residential Camp 283 - 100 268 - 100 324 - 100
Source: The Pennsylvania Rural Area Pilot Evaluation, 2007, Site Survey Question 22.

D-6
Table D-4: The Importance of Activities in Attracting Children to the SFSP Sites as Reported by Sponsor Directors in 2006
Sponsors Responding Activities Importance
No. %
% of All Sponsors
Very Unimportant 0 0 0 Not Very Important 3 4 2 Somewhat Important 19 27 12 Very Important 49 69 32 Total Sponsors Responding 71 100 46
Sponsors Not Responding 82 - 54 Total Number of Rural Sponsors Excluding Residential Camps 153 - 100
Source: The Pennsylvania Rural Area Pilot Evaluation, 2007, Sponsor Survey Question 20
Table D-5: Methods Sponsors Used to Enhance the SFSP to Lower Costs, and Attract and Retain Children in Pennsylvania in 2006
Sponsors Responding Methods Used
No. %
% of All Sponsors
Federal Transportation Grant 1 2 1 State-Provided Marketing Materials 0 0 0 Incentives from Local Produce Purveyors 21 46 14 WIC Marketing 4 9 3 Free Commodities from the USDA 0 0 0 Reaching Out to Federal Titles Programs Early in Summer at Elementary School 0 0 0 Large Banners Announcing the Program 1 2 1 Money for Special Events to Draw Out the Children 0 0 0 State Grant Money to Sponsors/Sites to Experiment with New Techniques to Reach Children 33 72 22 State Campaign to Introduce the Program 19 41 12 Other 1 13 28 8 Other 2 8 17 5 Other 3 6 13 4 Total Sponsors Responding 46 100 30
Sponsors Not Responding 107 - 70 Total Number of Rural Sponsors Excluding Residential Camps 153 - 100
Source: The Pennsylvania Rural Area Pilot Evaluation, 2007, Sponsor Survey Question 16
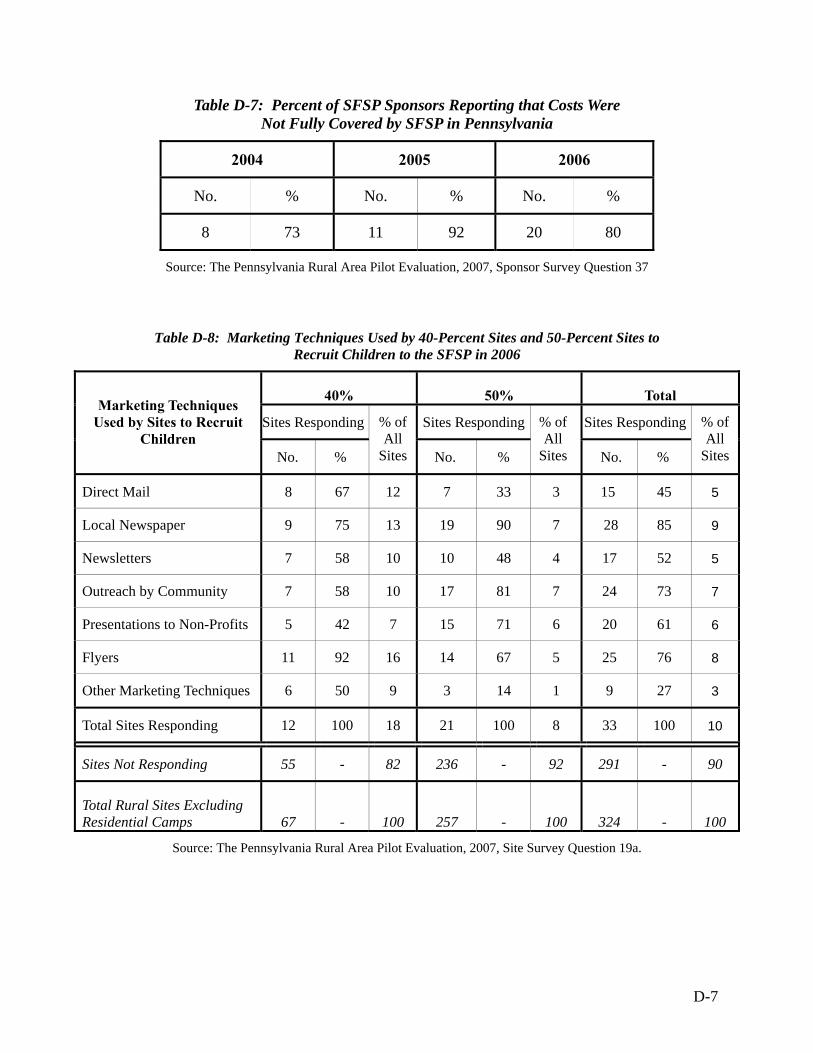
D-7
Table D-7: Percent of SFSP Sponsors Reporting that Costs Were Not Fully Covered by SFSP in Pennsylvania
2004 2005 2006
No. % No. % No. %
8 73 11 92 20 80
Source: The Pennsylvania Rural Area Pilot Evaluation, 2007, Sponsor Survey Question 37
Table D-8: Marketing Techniques Used by 40-Percent Sites and 50-Percent Sites to Recruit Children to the SFSP in 2006
40% 50% Total
Sites Responding Sites Responding Sites RespondingMarketing Techniques
Used by Sites to Recruit Children
No. %
% of All
Sites No. %
% of All
Sites No. %
% of All
Sites
Direct Mail 8 67 12 7 33 3 15 45 5
Local Newspaper 9 75 13 19 90 7 28 85 9
Newsletters 7 58 10 10 48 4 17 52 5
Outreach by Community 7 58 10 17 81 7 24 73 7
Presentations to Non-Profits 5 42 7 15 71 6 20 61 6
Flyers 11 92 16 14 67 5 25 76 8
Other Marketing Techniques 6 50 9 3 14 1 9 27 3
Total Sites Responding 12 100 18 21 100 8 33 100 10
Sites Not Responding 55 - 82 236 - 92 291 - 90
Total Rural Sites Excluding Residential Camps 67 - 100 257 - 100 324 - 100
Source: The Pennsylvania Rural Area Pilot Evaluation, 2007, Site Survey Question 19a.
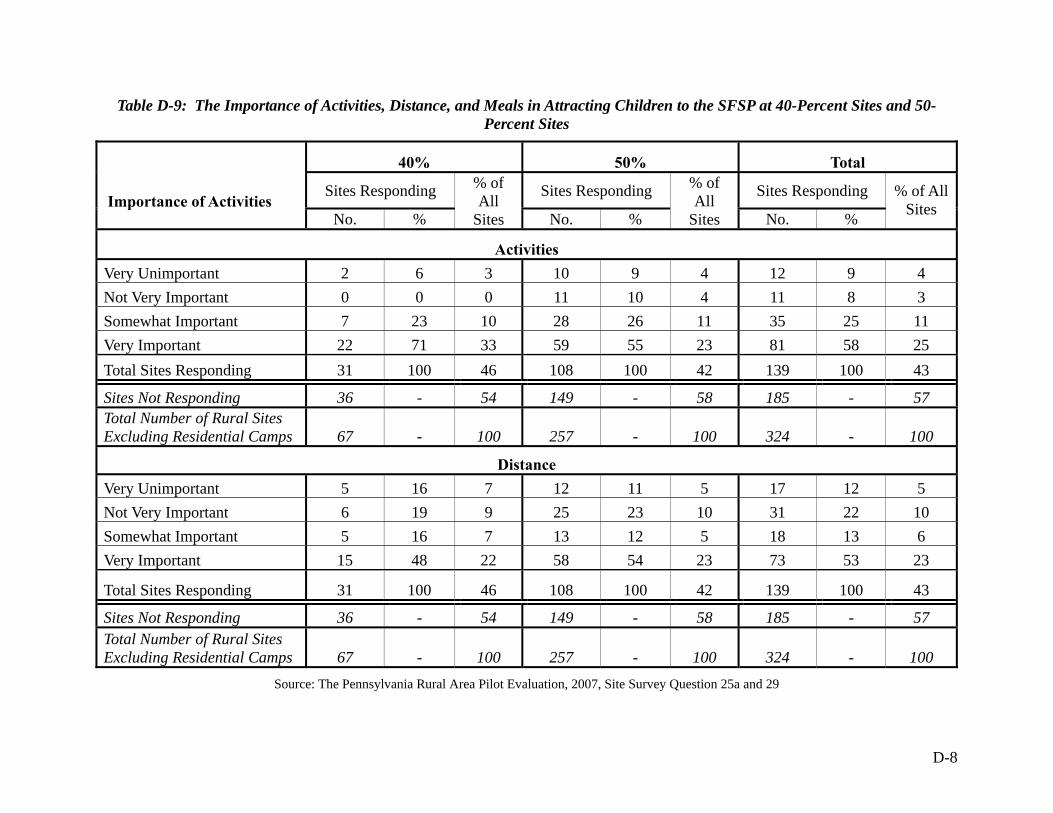
D-8
Table D-9: The Importance of Activities, Distance, and Meals in Attracting Children to the SFSP at 40-Percent Sites and 50-Percent Sites
40% 50% Total
Sites Responding Sites Responding Sites Responding Importance of Activities
No. %
% of All
Sites No. %
% of All
Sites No. %
% of All Sites
Activities Very Unimportant 2 6 3 10 9 4 12 9 4 Not Very Important 0 0 0 11 10 4 11 8 3 Somewhat Important 7 23 10 28 26 11 35 25 11 Very Important 22 71 33 59 55 23 81 58 25 Total Sites Responding 31 100 46 108 100 42 139 100 43
Sites Not Responding 36 - 54 149 - 58 185 - 57 Total Number of Rural Sites Excluding Residential Camps 67 - 100 257 - 100 324 - 100
Distance Very Unimportant 5 16 7 12 11 5 17 12 5 Not Very Important 6 19 9 25 23 10 31 22 10 Somewhat Important 5 16 7 13 12 5 18 13 6 Very Important 15 48 22 58 54 23 73 53 23
Total Sites Responding 31 100 46 108 100 42 139 100 43
Sites Not Responding 36 - 54 149 - 58 185 - 57 Total Number of Rural Sites Excluding Residential Camps 67 - 100 257 - 100 324 - 100
Source: The Pennsylvania Rural Area Pilot Evaluation, 2007, Site Survey Question 25a and 29
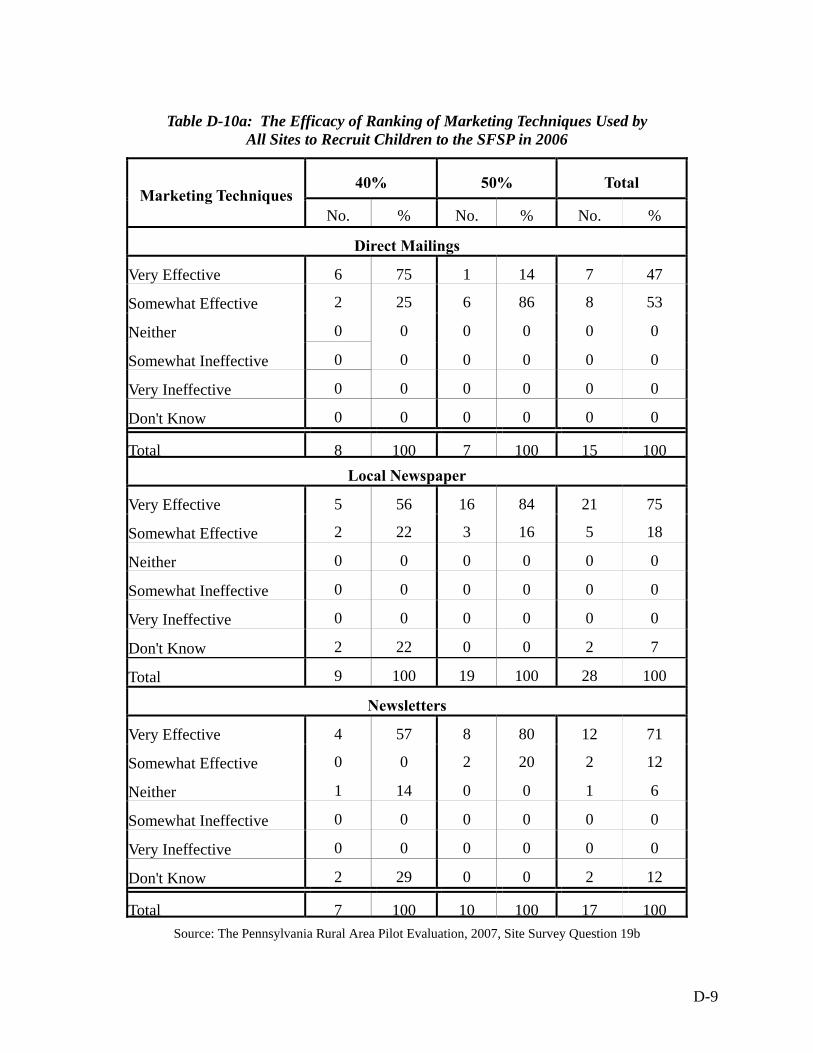
D-9
Table D-10a: The Efficacy of Ranking of Marketing Techniques Used by All Sites to Recruit Children to the SFSP in 2006
40% 50% Total Marketing Techniques
No. % No. % No. %
Direct Mailings
Very Effective 6 75 1 14 7 47
Somewhat Effective 2 25 6 86 8 53
Neither 0 0 0 0 0 0
Somewhat Ineffective 0 0 0 0 0 0
Very Ineffective 0 0 0 0 0 0
Don't Know 0 0 0 0 0 0
Total 8 100 7 100 15 100Local Newspaper
Very Effective 5 56 16 84 21 75
Somewhat Effective 2 22 3 16 5 18
Neither 0 0 0 0 0 0
Somewhat Ineffective 0 0 0 0 0 0
Very Ineffective 0 0 0 0 0 0
Don't Know 2 22 0 0 2 7
Total 9 100 19 100 28 100
Newsletters
Very Effective 4 57 8 80 12 71
Somewhat Effective 0 0 2 20 2 12
Neither 1 14 0 0 1 6
Somewhat Ineffective 0 0 0 0 0 0
Very Ineffective 0 0 0 0 0 0
Don't Know 2 29 0 0 2 12
Total 7 100 10 100 17 100Source: The Pennsylvania Rural Area Pilot Evaluation, 2007, Site Survey Question 19b

D-10
Table D-10b: The Efficacy of Ranking of Marketing Techniques Used by All Sites to Recruit Children to the SFSP in 2006, Continued
40% 50% Total Marketing Techniques
No. % No. % No. %
Outreach
Very Effective 4 57 13 76 17 71
Somewhat Effective 0 0 4 24 4 17
Neither 1 14 0 0 1 4
Somewhat Ineffective 0 0 0 0 0 0
Very Ineffective 0 0 0 0 0 0
Don't Know 2 29 0 0 2 8
Total 7 100 17 100 24 100
Presentations
Very Effective 2 40 9 60 11 55
Somewhat Effective 3 60 6 40 9 45
Neither 0 0 0 0 0 0
Somewhat Ineffective 0 0 0 0 0 0
Very Ineffective 0 0 0 0 0 0
Don't Know 0 0 0 0 0 0
Total 5 100 15 100 20 100
Flyers
Very Effective 5 45 11 79 16 64
Somewhat Effective 4 36 3 21 7 28
Neither 1 9 0 0 1 4
Somewhat Ineffective 0 0 0 0 0 0
Very Ineffective 0 0 0 0 0 0
Don't Know 1 9 0 0 1 4
Total 11 100 14 100 25 100
Source: The Pennsylvania Rural Area Pilot Evaluation, 2007, Site Survey Question 19b

D-11
Table D-10c: The Efficacy of Ranking of Marketing Techniques Used by All Sites to Recruit Children to the SFSP in 2006, Continued
40% 50% Total Marketing Techniques No. % No. % No. %
Other
Very Effective 6 100 2 100 8 100
Somewhat Effective 0 0 0 0 0 0
Neither 0 0 0 0 0 0
Somewhat Ineffective 0 0 0 0 0 0
Very Ineffective 0 0 0 0 0 0
Don't Know 0 0 0 0 0 0
Total 6 100 2 100 8 100
Source: The Pennsylvania Rural Area Pilot Evaluation, 2007, Site Survey Question 19b
Table D-11a: Marketing Techniques Used by Sponsors to Recruit Children to SFSP Sites, from Most to Least Effective in 2006
Most Effective
Least Effective
1 2 3 4 5
Total Marketing Techniques to Recruit
Children No. % No. % No. % No. % No. % No. %
Direct Mailing 6 23 6 23 9 35 3 12 2 8 29 100
Local Newspaper 13 25 12 24 18 35 4 8 4 8 51 100
Newsletters 4 14 10 34 10 34 4 14 14 3 42 100
Outreach by Others in Community 5 21 9 38 4 38 2 8 8 17 28 100
Presentations to Local Non-Profits 3 19 6 38 6 38 1 6 6 0 22 100
Posting Flyers in the Community 6 16 13 34 17 34 0 0 0 5 36 100
Word of Mouth 18 43 10 24 5 24 4 10 10 12 47 100
Other Marketing Techniques 1 5 45 2 18 3 18 1 9 9 0 20 100
Other Marketing Techniques 2 0 0 1 50 0 0 0 0 1 50 2 100
Note: 67 sponsors responded to the marketing techniques effectiveness questions
Source: The Pennsylvania Rural Area Pilot Evaluation, 2007, Sponsor Survey Question 15
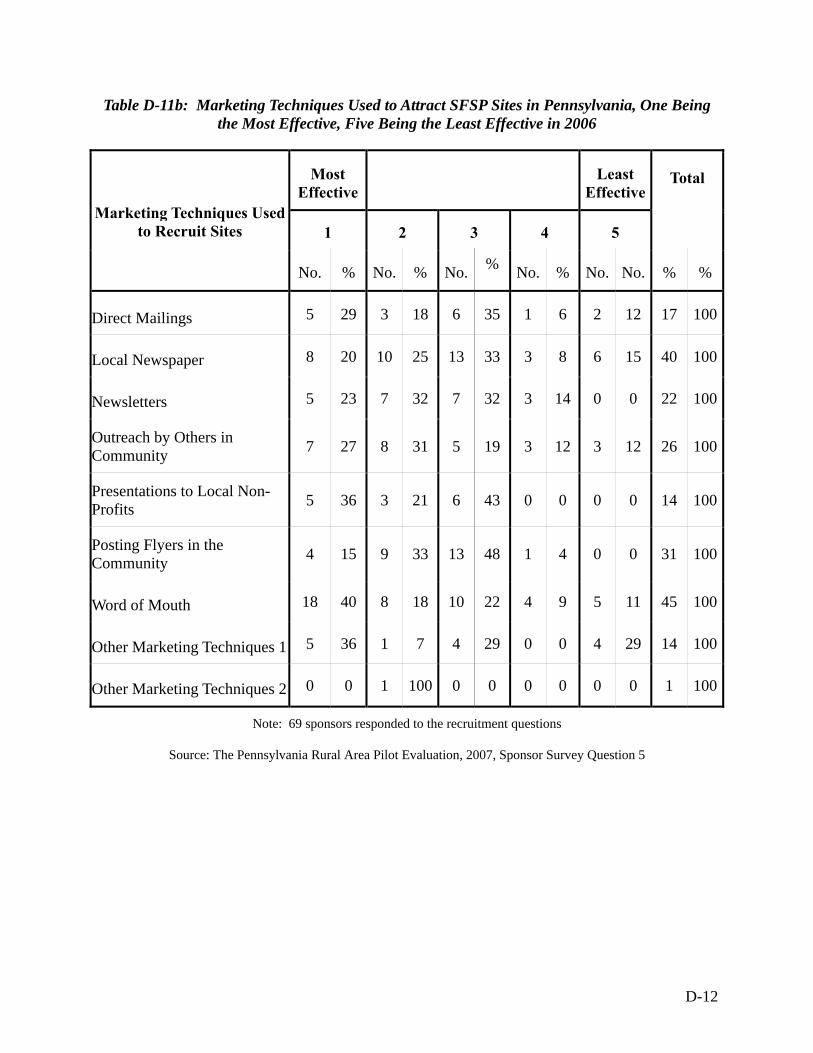
D-12
Table D-11b: Marketing Techniques Used to Attract SFSP Sites in Pennsylvania, One Being the Most Effective, Five Being the Least Effective in 2006
Most Effective Least
Effective
1 2 3 4 5
Total
Marketing Techniques Used to Recruit Sites
No. % No. % No. % No. % No. No. % %
Direct Mailings 5 29 3 18 6 35 1 6 2 12 17 100
Local Newspaper 8 20 10 25 13 33 3 8 6 15 40 100
Newsletters 5 23 7 32 7 32 3 14 0 0 22 100
Outreach by Others in Community 7 27 8 31 5 19 3 12 3 12 26 100
Presentations to Local Non-Profits 5 36 3 21 6 43 0 0 0 0 14 100
Posting Flyers in the Community 4 15 9 33 13 48 1 4 0 0 31 100
Word of Mouth 18 40 8 18 10 22 4 9 5 11 45 100
Other Marketing Techniques 1 5 36 1 7 4 29 0 0 4 29 14 100
Other Marketing Techniques 2 0 0 1 100 0 0 0 0 0 0 1 100
Note: 69 sponsors responded to the recruitment questions
Source: The Pennsylvania Rural Area Pilot Evaluation, 2007, Sponsor Survey Question 5
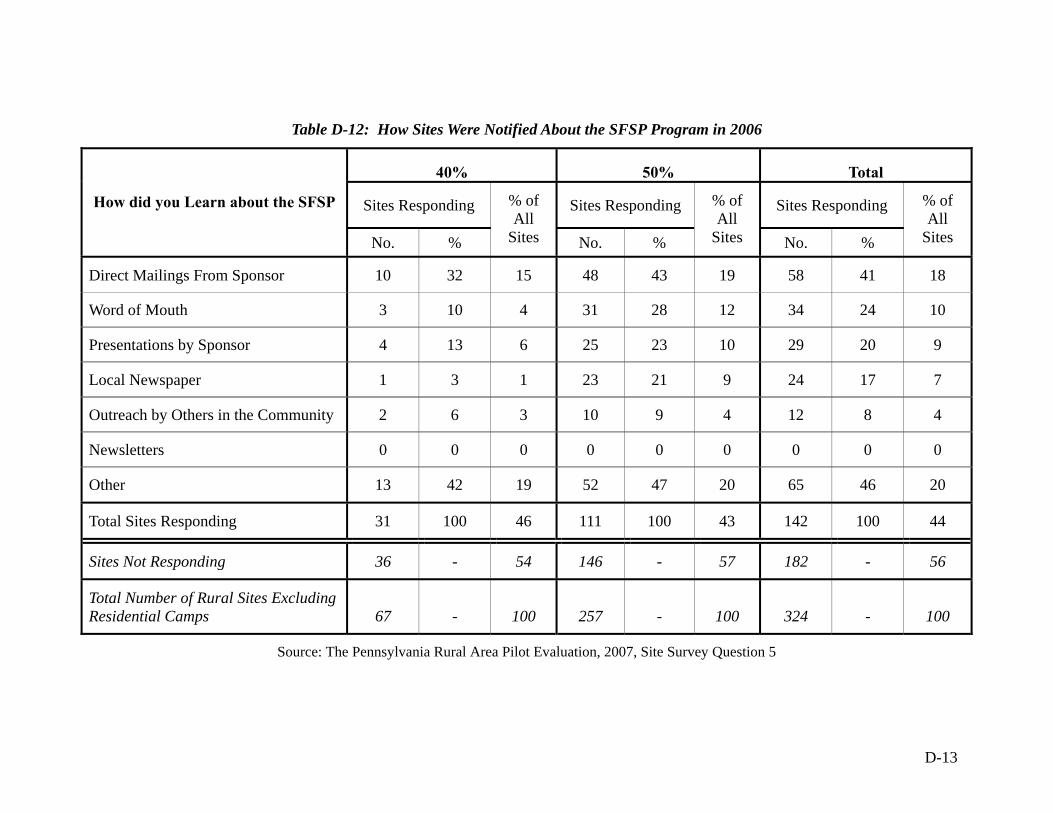
D-13
Table D-12: How Sites Were Notified About the SFSP Program in 2006
40% 50% Total
Sites Responding Sites Responding Sites Responding How did you Learn about the SFSP
No. %
% of All
Sites No. %
% of All
Sites No. %
% of All
Sites
Direct Mailings From Sponsor 10 32 15 48 43 19 58 41 18
Word of Mouth 3 10 4 31 28 12 34 24 10
Presentations by Sponsor 4 13 6 25 23 10 29 20 9
Local Newspaper 1 3 1 23 21 9 24 17 7
Outreach by Others in the Community 2 6 3 10 9 4 12 8 4
Newsletters 0 0 0 0 0 0 0 0 0
Other 13 42 19 52 47 20 65 46 20
Total Sites Responding 31 100 46 111 100 43 142 100 44
Sites Not Responding 36 - 54 146 - 57 182 - 56
Total Number of Rural Sites Excluding Residential Camps 67 - 100 257 - 100 324 - 100
Source: The Pennsylvania Rural Area Pilot Evaluation, 2007, Site Survey Question 5
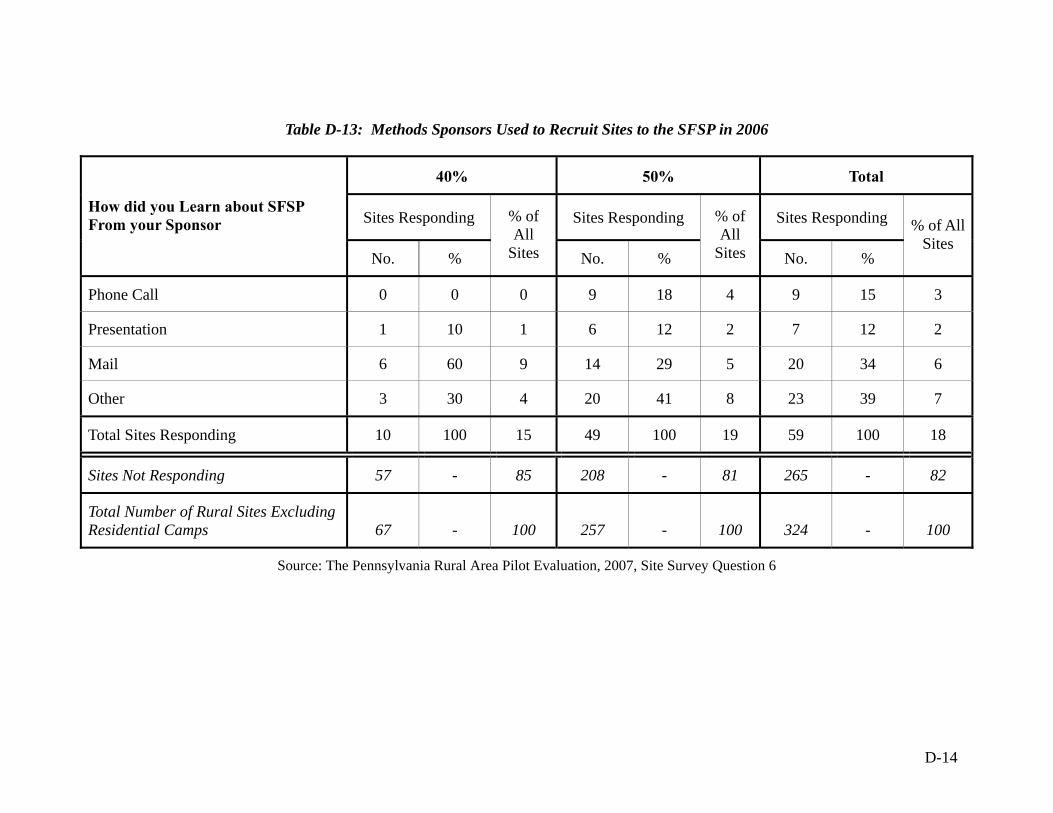
D-14
Table D-13: Methods Sponsors Used to Recruit Sites to the SFSP in 2006
40% 50% Total
Sites Responding Sites Responding Sites Responding How did you Learn about SFSP From your Sponsor
No. %
% of All
Sites No. %
% of All
Sites No. %
% of All Sites
Phone Call 0 0 0 9 18 4 9 15 3
Presentation 1 10 1 6 12 2 7 12 2
Mail 6 60 9 14 29 5 20 34 6
Other 3 30 4 20 41 8 23 39 7
Total Sites Responding 10 100 15 49 100 19 59 100 18
Sites Not Responding 57 - 85 208 - 81 265 - 82
Total Number of Rural Sites Excluding Residential Camps 67 - 100 257 - 100 324 - 100
Source: The Pennsylvania Rural Area Pilot Evaluation, 2007, Site Survey Question 6

D-15
Table D-14a: Concerns 40-Percent Sites and 50-Percent Sites had with SFSP Administration in 2006
40% 50% Total
Sites Responding Sites Responding Sites Responding Concerns About SFSP
No. %
% of All
Sites No. %
% of All
Sites No. %
% of All Sites
Reimbursement/administrative fees 10 48 15 40 50 16 50 50 15 SFSP application requirements 6 29 9 13 16 5 19 19 6 SFSP reporting requirements 9 43 13 31 39 12 40 40 12 Lack of vehicles to move food 0 0 0 10 13 4 10 10 3 Lack of equipment to move food 0 0 0 3 4 1 3 3 1 Little freedom in terms of what we serve at Meals 0 0 0 12 15 5 12 12 4 SFSP monitoring requirements 1 5 1 23 29 9 24 24 7 40% requirement only lasts for 2 Years 16 76 24 24 30 9 40 40 12 Lack of staff 0 0 0 8 10 3 8 8 2 Staff turnover 0 0 0 4 5 2 4 4 1 Staff training 0 0 0 9 11 4 9 9 3 Food preparation 0 0 0 8 10 3 8 8 2 Extensive administrative or operational regulations 2 10 3 13 16 5 15 15 5 Requirement for summer-long menus 0 0 0 6 8 2 6 6 2 Other 0 0 0 5 6 2 5 5 2 Total sites responding 21 NA 31 80 NA 31 101 NA 31 Sites not responding 46 - 69 177 - 69 223 - 69 Total number of rural sites excluding residential camps 67 - 100 257 - 100 324 - 100
Source: The Pennsylvania Rural Area Pilot Evaluation, 2007, Site Survey Question 32

D-16
Table D-14b: A Comparison of 40-Percent Sites and 50-Percent Sites That Expressed Concern about Reimbursement Rates
40% 50% Total
Sites Responding Sites Responding Sites Responding Reimbursement Concerns
No. %
% of All
Sites No. %
% of All
Sites No. %
% of All Sites
Are Too Low and Do Not Cover Actual Expenses 7 70 10 23 62 9 30 64 9 Only Reimburse 2% for Second Servings 1 10 1 11 30 4 12 26 4 Does Not Cover Transportation Costs Needed to Reach Distant Areas 2 20 3 6 16 2 8 17 2 Does Not Provide Enough Reimbursement for Paperwork 3 30 4 13 35 5 16 34 5 Does Not Provide Enough Money to Pay Staff Wages 7 70 10 13 35 5 20 43 6
Other 2 20 3 12 32 5 14 30 4
Total Sites Responding 10 100 15 37 100 14 47 100 15
Sites Not Responding 57 - 85 220 - 86 277 - 85
Total Number of Rural Sites Excluding Residential Camps 67 - 100 257 - 100 324 - 100
Source: The Pennsylvania Rural Area Pilot Evaluation, 2007, Site Survey Question 32a
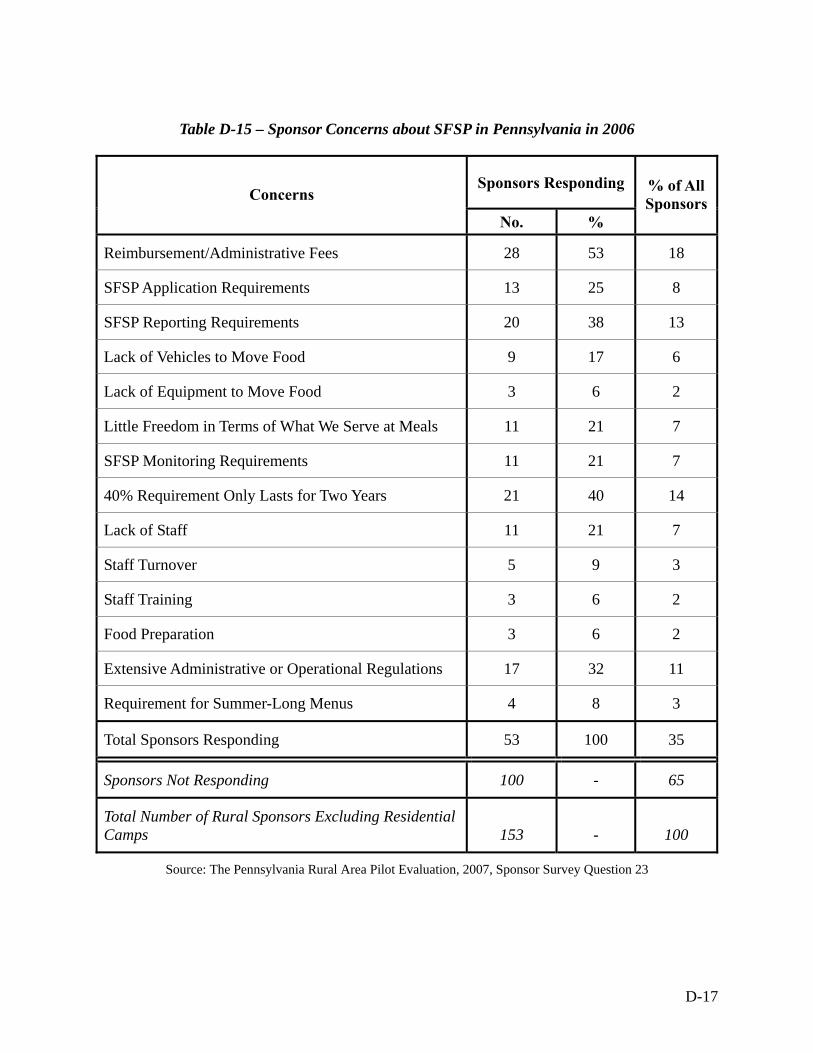
D-17
Table D-15 – Sponsor Concerns about SFSP in Pennsylvania in 2006
Sponsors Responding Concerns
No. %
% of All Sponsors
Reimbursement/Administrative Fees 28 53 18
SFSP Application Requirements 13 25 8
SFSP Reporting Requirements 20 38 13
Lack of Vehicles to Move Food 9 17 6
Lack of Equipment to Move Food 3 6 2
Little Freedom in Terms of What We Serve at Meals 11 21 7
SFSP Monitoring Requirements 11 21 7
40% Requirement Only Lasts for Two Years 21 40 14
Lack of Staff 11 21 7
Staff Turnover 5 9 3
Staff Training 3 6 2
Food Preparation 3 6 2
Extensive Administrative or Operational Regulations 17 32 11
Requirement for Summer-Long Menus 4 8 3
Total Sponsors Responding 53 100 35
Sponsors Not Responding 100 - 65
Total Number of Rural Sponsors Excluding Residential Camps 153 - 100
Source: The Pennsylvania Rural Area Pilot Evaluation, 2007, Sponsor Survey Question 23
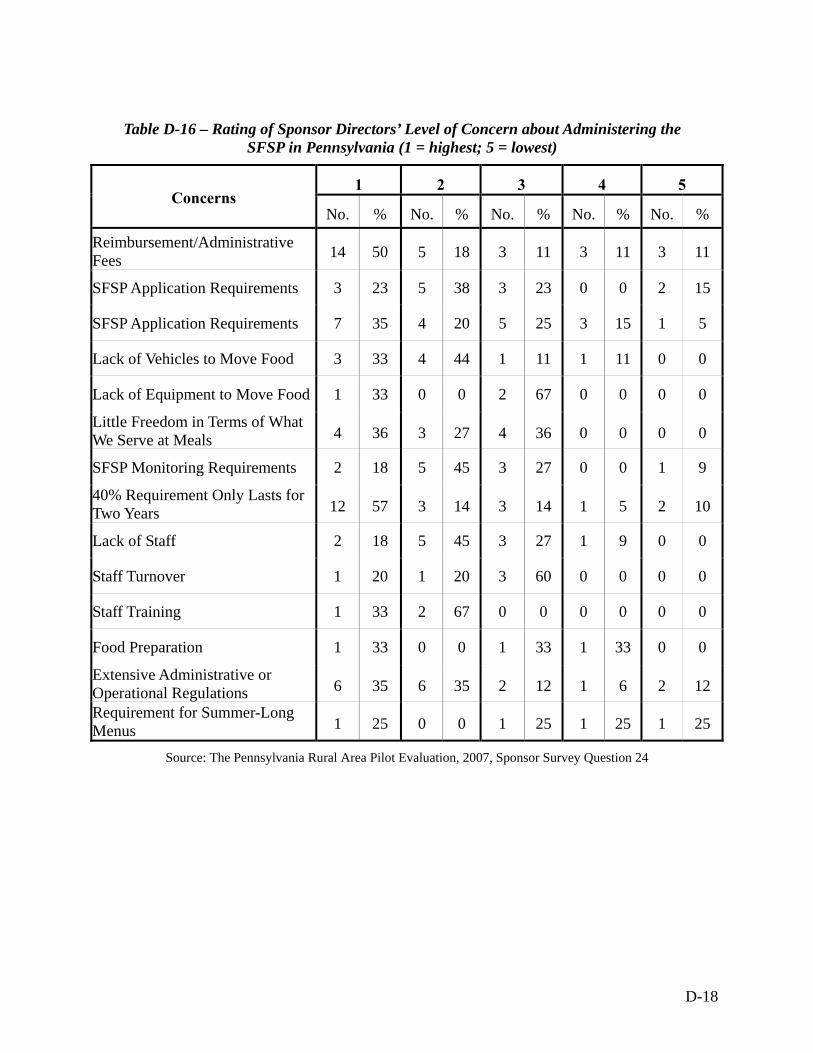
D-18
Table D-16 – Rating of Sponsor Directors’ Level of Concern about Administering the SFSP in Pennsylvania (1 = highest; 5 = lowest)
1 2 3 4 5 Concerns
No. % No. % No. % No. % No. %
Reimbursement/Administrative Fees 14 50 5 18 3 11 3 11 3 11
SFSP Application Requirements 3 23 5 38 3 23 0 0 2 15
SFSP Application Requirements 7 35 4 20 5 25 3 15 1 5
Lack of Vehicles to Move Food 3 33 4 44 1 11 1 11 0 0
Lack of Equipment to Move Food 1 33 0 0 2 67 0 0 0 0
Little Freedom in Terms of What We Serve at Meals 4 36 3 27 4 36 0 0 0 0
SFSP Monitoring Requirements 2 18 5 45 3 27 0 0 1 9
40% Requirement Only Lasts for Two Years 12 57 3 14 3 14 1 5 2 10
Lack of Staff 2 18 5 45 3 27 1 9 0 0
Staff Turnover 1 20 1 20 3 60 0 0 0 0
Staff Training 1 33 2 67 0 0 0 0 0 0
Food Preparation 1 33 0 0 1 33 1 33 0 0
Extensive Administrative or Operational Regulations 6 35 6 35 2 12 1 6 2 12
Requirement for Summer-Long Menus 1 25 0 0 1 25 1 25 1 25
Source: The Pennsylvania Rural Area Pilot Evaluation, 2007, Sponsor Survey Question 24

D-19
Table D-17 – The Importance of Activities, Distance, and Meals in Attracting Children to the SFSP as Reported by Sponsors
Sponsors Responding Level of Importance
No. %
% of All Sponsors
Activities
Very Unimportant 0 0 0 Not Very Important 3 4 2 Somewhat Important 19 27 12 Very Important 49 69 32
Total Sponsors Responding 71 100 46
Sponsors Not Responding 82 - 54 Total Number of Rural Sponsors Excluding Residential Camps 153 - 100
Distance
Very Unimportant 1 1 1 Not Very Important 7 10 5 Somewhat Important 17 24 11 Very Important 46 65 30
Total Sponsors Responding 71 100 46
Sponsors Not Responding 82 - 54 Total Number of Rural Sponsors Excluding Residential Camps 153 - 100
Meals
Very Unimportant 4 5 3 Not Very Important 6 8 4 Somewhat Important 20 27 13 Very Important 44 60 29
Total Sponsors Responding 74 100 48
Sponsors Not Responding 79 - 52 Total Number of Rural Sponsors Excluding Residential Camps 153 - 100
Source: The Pennsylvania Rural Area Pilot Evaluation, 2007, Sponsor Survey Question 18, 19, and 20

E-1
APPENDIX E
SUMMER FOOD SERVICE PROGRAM SPONSORS VISITED
The eight sponsors visited were:
1. Armstrong Board of Commissioners in Kittaning
2. Greater Susquehanna Valley YMCA in Milton
3. Marion Center School District in Marion Center
4. Northwest Tri-County IU 5 in Erie
5. Pocono Mountain School District in Swiftwater
6. Somerset Area School District in Somerset
7. West Branch Area School District in Morrisdale
8. Westmoreland County Food Bank in Delmont
1. Armstrong Board of Commissioners – Kittanning
The Armstrong Board of Commissioners in Kittanning operated SFSP sites for many summers
prior to the start of the 2005 pilot. The supervisor reported that it was one of the first non-profits
to join the SFSP in Pennsylvania. It opened four new sites in the summer of 2005 – Lakeside
Aires, Old Manorville School, St. John’s Lutheran Church, and Templeton Community Park.
The Old Manorville School site had operated in 2003, though inactive in 2004. The Kittanning
sponsor also had two 40-percent sites in 2005, but neither was new. Despite 4 new site openings,
the sponsor only had a net gain of two sites in 2005 as a result of two site closings in the same
year. The school district prepared meals for the program. While the average daily participation
at these sites rose by 21 participants, this increase may have been offset by a fewer number of
operating days in 2005. As in the other areas, the sponsor director in Kittanning believes that the
children in very rural areas are the least likely to take part in the SFSP. To reach these

E-2
geographically distant areas, the sponsor indicated that they would need to have higher
reimbursements to pay for transportation.
2. Greater Susquehanna Valley YMCA – Milton
The Greater Susquehanna Valley YMCA was established years before SFSP, and has been part of
SFSP for many years. It began by running its own (YMCA) camps, but expanded to supervising
other sites. In 2005, only three of its active sites were YMCA sites. It opened three new sites in
2005 – the Columbia Avenue Playground Site, the Oak Park YMCA, and Paint Township
YMCA. One site closed, leaving two sites open in 2005. One site, Columbia, would not have
been eligible for SFSP were it not for the pilot The YMCA prepares its meals at a single, central
facility in Milton and delivers them to all sites. The average daily attendance across all sites was
247 participants in 2004 and 235 participants in 2005. The YMCA’s only geographical limitation
was how far it could transport meals at a constant temperature, and within a certain timeframe.
Even so, the director posited that there are many eligible children in her area who do not receive
meals.
3. Marion Center School District – Marion Center
The Marion Center Area School District was established as an SFSP sponsor in 2005 as a direct
result of the pilot. The area did not qualify under the 50 percent criterion, but qualified under the
pilot. The summer of 2005 was the first year of Marion Center’s participation. The
Pennsylvania Department of Education used elementary school attendance data to determine
eligibility. The school district operated six open sites during 2005, preparing and delivering
2,684 meals over 39 operating days. The average daily participation was 68 students. However,
unlike many SFSP sponsors that serve predominately young children, the Marion Center site
served mostly middle and high school children. Because most summer programs are offered to
older children, there are fewer elementary school children receiving meals through the SFSP.
4. Northwest Tri-County IU 5 – Erie
The Northwest Tri-County organization has operated SFSP sites for nearly 30 years. In recent
summers it has steadily increased the number of sites from 20 to 80. However, between 2004
and 2005, the average number of participants each day fell by 1,430 - from 2,693 to 1,263. In
E-3
spite of that, the sites had longer periods of operation and served 22,148 meals in 2005, as
opposed to 21,667 in 2004. Eight of its 76 sites were rural, and four were eligible for the pilot.
5. Pocono Mountain School District – Swiftwater
The Pocono Mountain School District was a new sponsor in Summer 2005, with all of its sites
eligible through the 50 percent criterion, rather than at the lower threshold. Its primary focus
was elementary-school-aged children. Through its six open sites, it served an average of 557
children a day, and provided 26,706 meals during its 24 days of operation. The School District
Supervisor in Swiftwater thought that participation in activities, rather than meals, was the
primary motivator for attendance. Despite its first year of success, the supervisor was concerned
about the burden of regulations and claimed – as had other sponsors – that reimbursements do
not cover costs. As a result, the supervisor indicated the district may not remain in SFSP after
2006, even though it would be eligible at the 50 percent criterion.
6. Somerset Area School District – Somerset
The Somerset Area School District also became an SFSP sponsor in 2005 as a result of the pilot.
It was not eligible at the 50 percent criterion in prior years, and only operated one site in Summer
2005. The site, which was active for two weeks in August, was located at the senior high school
primarily because of the many summer activities (e.g., sports camps). It catered to 124 students
and served 1,141 meals. During 2005, the entire school district was eligible under the 40 percent
criterion. Data from the elementary school, Maple Ridge, was used to determine eligibility. A
vendor prepared the food on site and served it at the school. As a result of its location, this
sponsor served teenagers who came to the school for the activities.
7. West Branch Area School District – Morrisdale
The West Branch Area School District in Morrisdale became eligible for SFSP in 2005. It
operated a single site, which was eligible as a pilot (40 percent) site based on school district data.
On average, 112 children participated over 29 days. The programs offered to elementary school
children were primarily geared toward enrichment, while those offered to high school children
were geared toward both enrichment and remedial learning. It served children ages 6-10 and a
small number of high school students. The director believed that activities were critical in

E-4
attracting children to the SFSP, and that food alone could not have drawn children to the
program, because of the long travel distances. The sponsor prepared 2,845 meals at the site.
8. Westmoreland County Food Bank – Delmont
The Westmoreland County Food Bank has been a long-time sponsor of SFSP, participating for
the 24th summer in 2005 with 27 sites. The number of sites it operates has fluctuated over the
years. In 2005, it had four new sites that met the 40 percent threshold. Nevertheless, it lost eight
old sites and gained ten new sites for a net increase of two. The net increase enabled the sponsor
to serve an additional 60 children and 5,754 meals in 2005. The program director thought that
most children attended SFSP because of free meals rather than activities, since fewer than 50
percent of sites offered activities. The director estimated that half of the county was served by
SFSP. The Food Bank used to prepare its own meals, but now uses a vendor to prepare and
deliver meals.
Differences and Similarities Among the Sponsors Visited
A matrix outlining the differences and similarities observed among the eight sponsoring
organizations visited during the sponsor visits is shown in Table E-1. The table lists data on the
total number of sites and the number of sites gained or lost; the average daily participation of
children for each sponsor; the number of operating days; the number of 40-percent sites; and
meals served. As shown, 4 of the visited sponsors had no sites in 2005. In almost all cases, more
meals were served in 2005 than 2004.
Table E-2 depicts descriptive information collected during site interviews, with several themes
standing out. First, sponsors perceive that childrens’ (and their parents’) motivation to attend is
related more to activities than food. This theme is indirectly related to the transportation, travel
distance, and geographical influences, but directly related to the ancillary activities. It is critical
because activities can induce parents to overcome transportation obstacles. Second, several
sponsors were not sure that they would continue in the program because of financial,
administrative, and regulatory obstacles. Sponsors were asked whether the reimbursement rate
fully covers the cost of providing meals and the associated administrative work, as well as
sponsors’ concerns about the burden of administrative and regulatory obstacles.
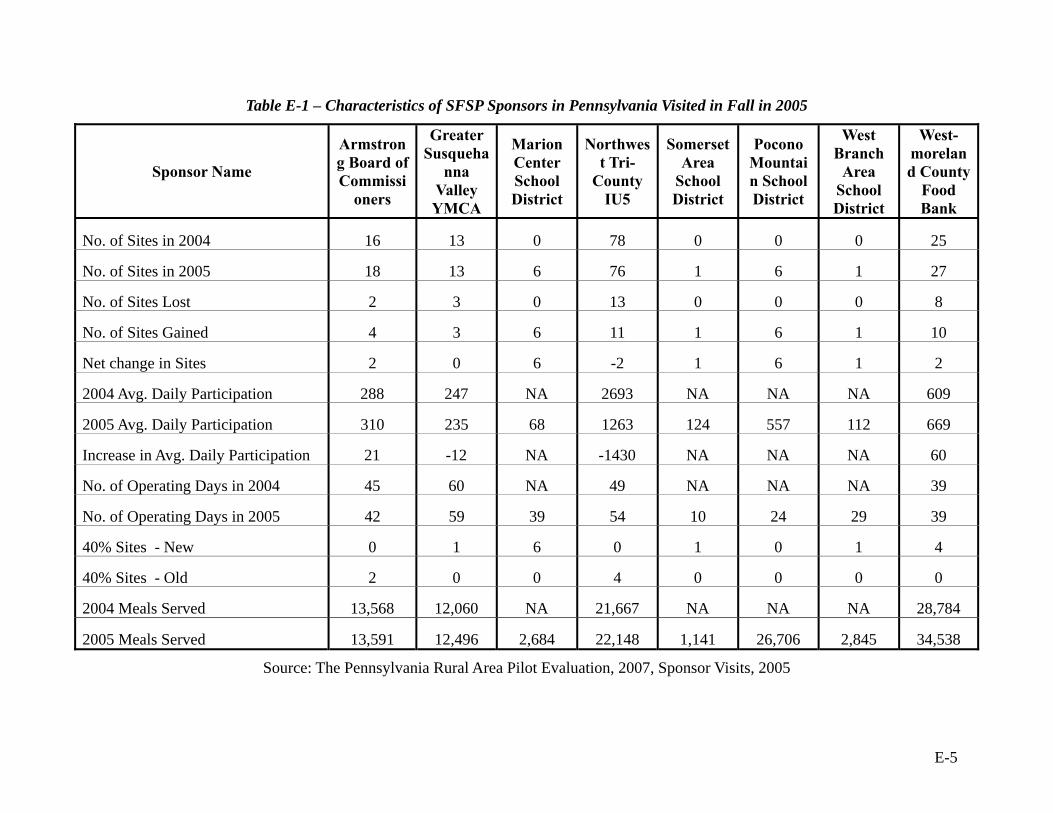
E-5
Table E-1 – Characteristics of SFSP Sponsors in Pennsylvania Visited in Fall in 2005
Sponsor Name
Armstrong Board of Commissi
oners
Greater Susqueha
nna Valley YMCA
Marion Center School District
Northwest Tri-
County IU5
Somerset Area
School District
Pocono Mountain School District
West Branch
Area School District
West-moreland County
Food Bank
No. of Sites in 2004 16 13 0 78 0 0 0 25
No. of Sites in 2005 18 13 6 76 1 6 1 27
No. of Sites Lost 2 3 0 13 0 0 0 8
No. of Sites Gained 4 3 6 11 1 6 1 10
Net change in Sites 2 0 6 -2 1 6 1 2
2004 Avg. Daily Participation 288 247 NA 2693 NA NA NA 609
2005 Avg. Daily Participation 310 235 68 1263 124 557 112 669
Increase in Avg. Daily Participation 21 -12 NA -1430 NA NA NA 60
No. of Operating Days in 2004 45 60 NA 49 NA NA NA 39
No. of Operating Days in 2005 42 59 39 54 10 24 29 39
40% Sites - New 0 1 6 0 1 0 1 4
40% Sites - Old 2 0 0 4 0 0 0 0
2004 Meals Served 13,568 12,060 NA 21,667 NA NA NA 28,784
2005 Meals Served 13,591 12,496 2,684 22,148 1,141 26,706 2,845 34,538
Source: The Pennsylvania Rural Area Pilot Evaluation, 2007, Sponsor Visits, 2005

E-6
Table E-2 – Descriptive Data Collected From Eight SFSP Sponsors in Pennsylvania During Visits in 2005
Armstrong School District
Kittanning
Greater Susquehanna Valley YMCA
Milton
Marion Center Area School
District Marion Center
Northwest Tri-County
IU 5 Erie
Pocono Mountain
School District Swiftwater
Somerset Area School
District Somerset
West Branch Area School
District Morrisdale
Westmoreland County Food
Bank Delmont
Rural/Urban sites Rural Rural Rural Both Rural Rural Rural Both
Self-prep/ Vended Vended Self-prep Self-prep Both Vended Vended Self-prep Vended
New/Returning Returning Returning New Returning New New New Returning
40-Percent/ 50-Percent Sites Both Both All 40% Both 50% 40% 40% Both
Age Group Served Primarily
Under 13 years old
Under 10 years old
Middle and high school
students All Ranges Elementary
School Children High school
students 6 to 10 years
old Under 13 years
old
Motivation for Children to Attend Site * NA Activities Food and
Activities Food and Activities Activities Activities Activities Food
Type of Organization Community-based non-
profit
National non-profit School district
Community-based non-
profit School district School district School
district
Community-based non-
profit
Adequacy of reimbursement * Partial Partial Partial Partial Partial Complete Complete Partial
Concerns about regulations * Yes NA Yes No Yes No Yes NA
No. of 40-Percent sites 1 1 6 4 0 1 1 4
Open/Enrolled Open Open Open NA NA Open Open Both
* As reported by the sponsor
Source: The Pennsylvania Rural Area Pilot Evaluation, 2007, Sponsor Visits, 2005
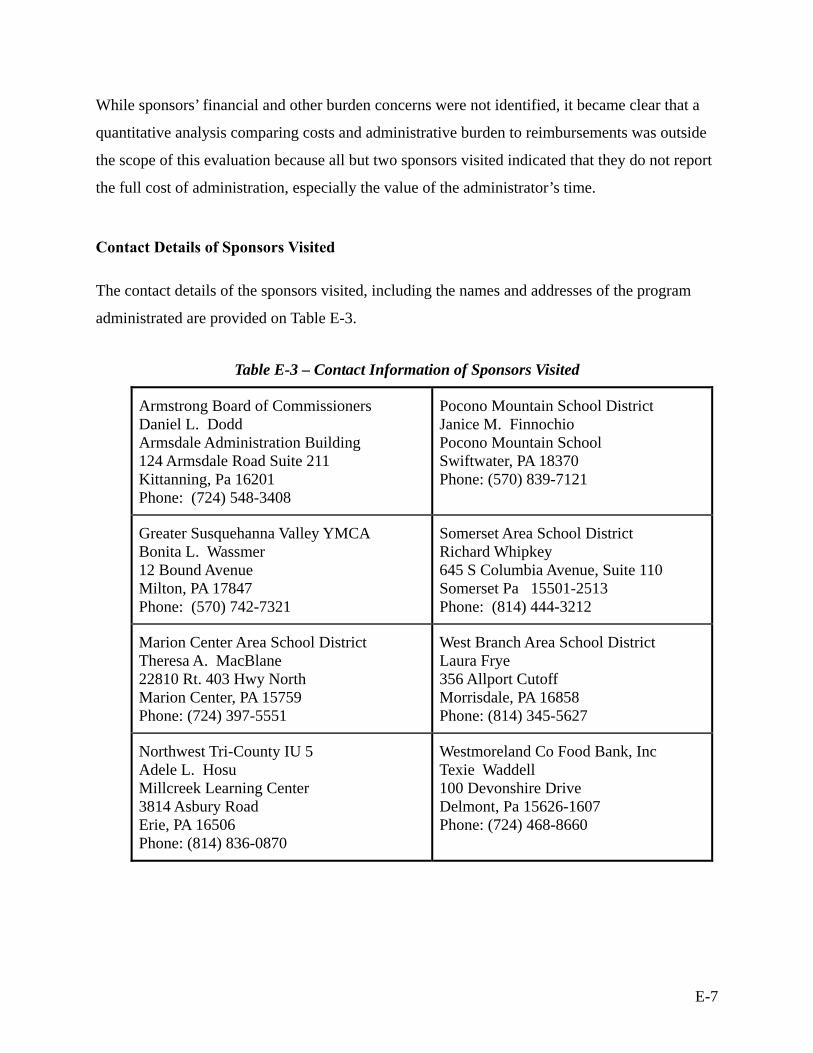
E-7
While sponsors’ financial and other burden concerns were not identified, it became clear that a
quantitative analysis comparing costs and administrative burden to reimbursements was outside
the scope of this evaluation because all but two sponsors visited indicated that they do not report
the full cost of administration, especially the value of the administrator’s time.
Contact Details of Sponsors Visited
The contact details of the sponsors visited, including the names and addresses of the program
administrated are provided on Table E-3.
Table E-3 – Contact Information of Sponsors Visited
Armstrong Board of Commissioners Daniel L. Dodd Armsdale Administration Building 124 Armsdale Road Suite 211 Kittanning, Pa 16201 Phone: (724) 548-3408
Pocono Mountain School District Janice M. Finnochio Pocono Mountain School Swiftwater, PA 18370 Phone: (570) 839-7121
Greater Susquehanna Valley YMCA Bonita L. Wassmer 12 Bound Avenue Milton, PA 17847 Phone: (570) 742-7321
Somerset Area School District Richard Whipkey 645 S Columbia Avenue, Suite 110 Somerset Pa 15501-2513 Phone: (814) 444-3212
Marion Center Area School District Theresa A. MacBlane 22810 Rt. 403 Hwy North Marion Center, PA 15759 Phone: (724) 397-5551
West Branch Area School District Laura Frye 356 Allport Cutoff Morrisdale, PA 16858 Phone: (814) 345-5627
Northwest Tri-County IU 5 Adele L. Hosu Millcreek Learning Center 3814 Asbury Road Erie, PA 16506 Phone: (814) 836-0870
Westmoreland Co Food Bank, Inc Texie Waddell 100 Devonshire Drive Delmont, Pa 15626-1607 Phone: (724) 468-8660
Related Documents