INNOCENTI WORKING PAPERS No. 86 THE OUTCOMES OF TEENAGE MOTHERHOOD IN EUROPE Richard Berthoud and Karen Robson

Welcome message from author
This document is posted to help you gain knowledge. Please leave a comment to let me know what you think about it! Share it to your friends and learn new things together.
Transcript
INNOCENTI WORKING PAPERS
No. 86
THE OUTCOMES
OF TEENAGE MOTHERHOOD
IN EUROPE
Richard Berthoud and Karen Robson

Innocenti Working Paper
No. 86
The Outcomes of TeenageMotherhood in Europe
RICHARD BERTHOUD AND KAREN ROBSON*
July 2001
*Institute for Social and Economic Research, University of Essex, UK
AcknowledgementsThe initial analysis for this paper was commissioned by the UNICEFInnocenti Research Centre, Florence, as a contribution to its review ofTeenage Births in Rich Nations. Additional analysis was carried out underthe auspices of the European Panel Analysis Group’s programme of researchon the Dynamics of Social Change in Europe, funded by the Commission ofthe European Communities. The data from the European CommunityHousehold Panel survey were supplied by Eurostat. Many thanks to JohnMicklewright, Kath Kiernan and John Ermisch for timely and helpfulcomments on an earlier draft.
This paper will also appear with the same title as European Panel AnalysisGroup Working Paper 22, published by the Institute for Social and EconomicResearch, University of Essex. See www.iser.essex.ac.uk/epag
Copyright UNICEF, 2001
Cover design: Miller, Craig and Cocking, Oxfordshire – UK
Printed on recycled paper by: Tipografia Giuntina, Florence, Italy
ISSN: 1014-7837
Readers citing this document are asked to use the following form of words:
Berthoud, Richard and Karen Robson (2001), ‘The Outcomes of TeenageMotherhood in Europe’. Innocenti Working Paper No. 86. Florence: UNICEFInnocenti Research Centre.

UNICEF INNOCENTI RESEARCH CENTRE
The UNICEF Innocenti Research Centre in Florence, Italy, wasestablished in 1988 to strengthen the research capability of the UnitedNations Children's Fund (UNICEF) and to support its advocacy forchildren worldwide. The Centre (formally known as the InternationalChild Development Centre) helps to identify and research current andfuture areas of UNICEF's work. Its prime objectives are to improveinternational understanding of issues relating to children's rights and tohelp facilitate the full implementation of the United NationsConvention on the Rights of the Child in both industrialized anddeveloping countries.
The Centre's publications are contributions to a global debate on childrights issues and include a wide range of opinions. For that reason, theCentre may produce publications that do not necessarily reflectUNICEF policies or approaches on some topics. The views expressedare those of the authors and are published by the Centre in order tostimulate further dialogue on child rights.
The Centre collaborates with its host institution in Florence, the Istitutodegli Innocenti, in selected areas of work. Core funding for the Centreis provided by the Government of Italy, while financial support forspecific projects is also provided by other governments, internationalinstitutions and private sources, including UNICEF NationalCommittees.
The opinions expressed are those of the authors and do notnecessarily reflect the policies or views of UNICEF.
CONTENTS
1. Introduction........................................................................................................................ 1Aims ................................................................................................................................... 1Outcomes’ … or ‘consequences’? ..................................................................................... 3
2. Identifying Women’s Age at First Birth............................................................................ 7The European Community Household Panel .................................................................... 7Basic method of identifying mothers’ age at the birth of their children ........................... 9Women’s age at the time of the survey .............................................................................. 9Age-specific fertility rates ................................................................................................. 12Age at first birth ................................................................................................................ 14
3. Analytical Approach.......................................................................................................... 15Correcting for age-related biases in the identification procedure.................................... 15Interpreting the links between outcomes ........................................................................... 15Europe, then countries ...................................................................................................... 16Choosing a metric for age-at-first-birth (AaFB) ............................................................... 16Logistic regression equations............................................................................................ 18
4. Educational Qualifications................................................................................................. 19
5. Family Structure ................................................................................................................ 23A high-marriage country: Greece ..................................................................................... 23Low-marriage countries: the UK and Ireland .................................................................. 24Variations across Europe .................................................................................................. 27The effects of education ..................................................................................................... 28Living with (grand)parents................................................................................................ 29
6. Employment. ...................................................................................................................... 31Mothers’ employment ........................................................................................................ 31Family employment ........................................................................................................... 36
7. Income ............................................................................................................................... 40Defining poor households ................................................................................................. 40Proportion of families in poverty ...................................................................................... 41The roles of education, family structure and employment ................................................ 44Interpreting the differences between countries ................................................................. 47
8. Review and Conclusions.................................................................................................... 50
Appendix 1: Five outcomes: teenage mothers compared with mothers whose first child wasborn in their twenties, by country
1
AbstractResearch in many countries has confirmed that teenage mothers and theirfamilies are often at a disadvantage compared with those whose children areborn in their twenties or thirties. But there has never been an opportunity for asystematic comparison between countries, based on a common data source.This paper analyses the current positions of women whose first child wasborn when they were teenagers, across 13 countries in the European Union,based on the European Community Household Panel survey. Outcomesconsidered include educational attainment, family structure, familyemployment and household income. Teenage mothers were disadvantaged inall countries, but the severity of their position varied substantially betweencountries.
1. IntroductionAimsAlthough the age range during which women are conventionally assumed tobe fertile is between 15 and 44, nine out of ten babies in western countries areborn when their mother is in her twenties or thirties (Eurostat 2000).Relatively few women conceive and give birth before the age of twenty. And,as a combination of prolonged education, increased employmentopportunities and the availability of contraception have tended to delaywomen’s decision to start their families, teenage motherhood is increasinglyrare in many countries. Even in countries where fertility rates amongteenagers have not been falling, it is seen as increasingly exceptional, as theaverage age at which other women have their first child has risen.
Teenage motherhood has been of concern to governments for two distinctreasons – medical and socio-economic. Teenage mothers and their babiesshow higher than average risks of unsatisfactory progress during pregnancy,difficulties at the birth, and poor health in subsequent years (Fraser and others1995, Strobino 1992, Cunnington 2001). Teenage mothers and their familieshave also been shown to experience social disadvantage on such measures aseducation, housing, employment and family income (Hoffman and others1993, Ribar 1999, Wellings and others 1999). In practice these two types ofproblem are probably not as independent as they may seem, since the medicalproblems may be associated as much with low levels of care as with anystraightforwardly physiological difficulty associated with early conception(SEU 1999).
During the peak fertility period in the mid- to late-twenties, as many as120 women in every thousand have a baby in the course of a year (see page12). Teenage birth rates are much lower (UNICEF 2001): between 6 and 14per thousand in the continental west-European countries, though between 18

2
and 31 per thousand in the UK and some other English-speaking countries,and as high as 52 per thousand in the United States. Another importantdifference is that the teenage birth rate has fallen in many continental WestEuropean countries, but has remained stable in English-speaking countries,including the UK.
UNICEF Innocenti Research Centre has been conducting a major reviewof teenage motherhood. A key component of the enquiry is a comparisonbetween western countries in the risk of teenage motherhood, in thedisadvantages for mothers and for children associated with early parenting,and in the policies adopted to address the issue.
Although the outcomes of teenage motherhood have been well-studiedwithin various countries, each research project has been carried outindependently, and it is extremely difficult to make direct comparisonsbetween countries. This current paper is based on a structured comparisonbetween member-states of the European Union, derived from analysis of asingle data set, the European Community Household Panel (ECHP). Theinitial analysis was undertaken at the request of, and in collaboration with, theUNICEF Innocenti Research Centre, as a direct contribution to its widerenquiry. Much of the more detailed analysis has been undertaken as acontribution to a wider programme of research on The Dynamics of SocialChange in Europe, supported by the European Commission. The paper isbeing released jointly by UNICEF and ISER, to coincide with the publicationof the UNICEF Innocenti Research Centre’s own ‘Report Card’ on TeenageBirths in Rich Nations (UNICEF 2001).
It is not the objective of this analysis to estimate the prevalence of teenagemotherhood in European countries. Our own and UNICEF’s estimates of age-specific fertility rates are based on the most reliable source, national birth-registration statistics. The ECHP survey, though, includes a sample of womenwith dependent children, and we can work out how old they must have beenwhen their first child was born. We then compared the current situation of thewomen, and of their families, according to the age of the mother at her firstbirth. We will focus on four types of outcome: the women’s educationalqualifications; their family structures; their and their families’ employment;and their households’ level of income.
Although the medical outcomes of teenage pregnancy are an importantissue both for clinicians and for policy makers, they are not included in thisanalysis. The paper is entirely based on the socio-economic disadvantages onwhich the ECHP provides detailed information.
This is the first time that precise cross-national comparisons of this sorthave been available. They are made possible by a combination of two factors:the development of a technique for using data about current family structureto identify mothers’ age at first birth (Berthoud 2001); and the existence for
3
the first time of a substantial survey conducted on the same basis in mostcountries in the European Union. The results confirm that many of thedisadvantages associated with early parenting are in common acrossEuropean countries. But they also indicate substantial differences betweencountries which will be important for the assessment and development ofrelevant policies.
In the remainder of this introduction, we briefly discuss the difficulty ofinterpreting the outcomes of teenage motherhood, based on informationcollected many years after the event.
The second main chapter describes the ECHP – the primary source of theanalysis – and explains the procedure for identifying the age at which womenhad their children, based on their own and their children’s dates of birth. Thissection also assesses the reliability of the method, using birth-registrationstatistics as the basis for comparison.
There then follows a series of chapters presenting the data: one discussingsome general analytical issues; the next four showing the results for each ofthe types of outcome under consideration.
The final chapter reviews these findings with the aim of reaching broadconclusions about the varying experience of teenage motherhood acrosswestern Europe.
‘Outcomes’ . . . or ‘consequences’?The primary objective of the research is to observe variations in the outcomesfor women and their families, depending on when their first child was born.The simplest possible summary of the findings is shown in Table 1. Takingthe European Union as a whole (except Sweden), it can be seen that womenwhose first child was born when they were teenagers were consistently worseoff than women who started a family in their twenties. A slightly higherproportion were bringing up their child(ren) without a co-resident partner. Asubstantially higher proportion of the mothers were not in employment.Twice as many teen-mothers as twenties-mothers had minimal educationalachievements, and twice as many were in poverty. More than three times asmany relied on transfers from outside their immediate family, because neitherthey nor their partner had a job.
4
Table 1: Five outcomes: teenage mothers compared with women whose first child wasborn in their twenties
Column percentages
15 to 19 20 to 29 Ratio
Less than upper secondary education 67 34 2.0
Without partner 23 19 1.2
Not working (inactive or unemployed) 59 41 1.4
Neither woman nor partner is working 26 8 3.3
Household income below bottom quintile 45 21 2.1
Note: All Europe (13 countries), weighted. All the differences are significant.
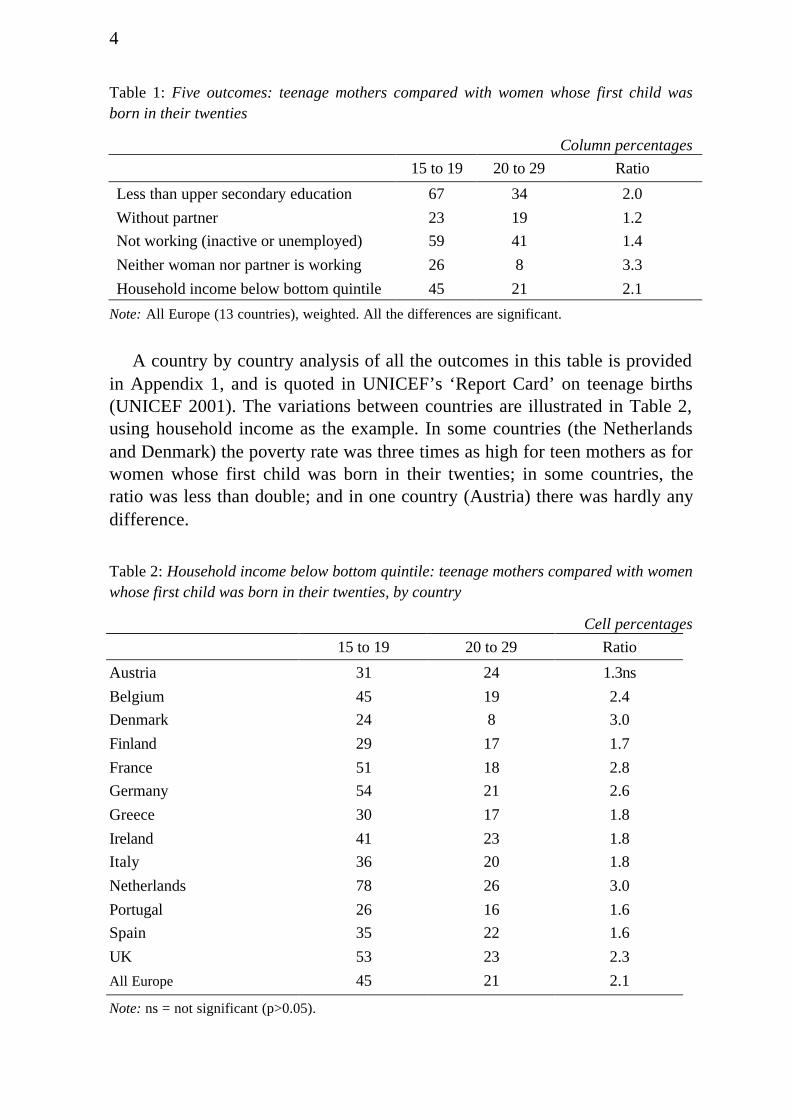
A country by country analysis of all the outcomes in this table is providedin Appendix 1, and is quoted in UNICEF’s ‘Report Card’ on teenage births(UNICEF 2001). The variations between countries are illustrated in Table 2,using household income as the example. In some countries (the Netherlandsand Denmark) the poverty rate was three times as high for teen mothers as forwomen whose first child was born in their twenties; in some countries, theratio was less than double; and in one country (Austria) there was hardly anydifference.
Table 2: Household income below bottom quintile: teenage mothers compared with womenwhose first child was born in their twenties, by country
Cell percentages
15 to 19 20 to 29 Ratio
Austria 31 24 1.3ns
Belgium 45 19 2.4
Denmark 24 8 3.0
Finland 29 17 1.7
France 51 18 2.8
Germany 54 21 2.6
Greece 30 17 1.8
Ireland 41 23 1.8
Italy 36 20 1.8
Netherlands 78 26 3.0
Portugal 26 16 1.6
Spain 35 22 1.6
UK 53 23 2.3
All Europe 45 21 2.1
Note: ns = not significant (p>0.05).
5
Much of the remainder of this paper will be devoted to detailed analysis ofthese findings. It is important to think carefully about the interpretation. TheECHP data provides information about the current social and economicpositions of women, and of their families. The key base for comparison,within each country, and across all Europe, is the age at which mothers hadtheir first child, at some date between one and fifteen years earlier. The paperconfirms that families with a teenage mother were indeed worse off in severalrespects than families whose mother had had her first child in her twenties orthirties.
Thus a high risk of poverty, for example, is an ‘outcome’ of teenagemotherhood. Is this a ‘consequence’ of teenage motherhood? Can we beconfident that the same women would have had a lower risk of poverty if theyhad decided to delay their family until, say, their late twenties? Supposewomen from disadvantaged backgrounds were much more likely to becomepregnant in their teens. They might have had a high risk of eventual poverty,even if they had not had a child so early. If so, their poverty should beascribed to their background, rather than to their early parenthood.
The ECHP analysis of current circumstances does not help with thisquestion, because there is no information, which unequivocally relates to theperiod before women reached the age-group of interest. Two British sourcesof longitudinal data can be used, though, to provide an indication of the likelyrelationships.
The first is the National Child Development Study (NCDS). All the Britishchildren born in one week in 1958 have been studied at intervals up to the ageof 33. By that time, a majority of the women had children of their own.Hobcraft and Kiernan (1999) have used the data explicitly to address the‘outcomes’ or ‘consequences’ issue – could the relative disadvantage ofwomen who had had children in their teens be explained in terms of thepoverty they themselves had experienced as children, or did the early entryinto parenthood have a direct effect in its own right?
• The analysis confirms that women who had been poor in their childhoodwere more likely to have become teenage mothers than women who hadno history of poverty.
• It confirms that childhood experience of poverty was associated with ahigher risk of poverty as an adult, independent of the woman’s parentingpattern.
• These two findings suggest that part of the poverty experienced by teenagemothers and their families could be explained in terms of their familybackground – but only part.

6
• Teenage mothers were more likely to experience disadvantageousoutcomes than other women, even after the influence of familybackground had been taken into account. In fact most of the apparentdifference in risk was attributable to the age at which the woman had herfirst child, rather than to her childhood experiences.
• Teenage mothers were more likely to experience disadvantageousoutcomes than other women, even after the influence of familybackground had been taken into account. In fact most of the apparentdifference in risk was attributable to the age at which the woman had herfirst child, rather than to her childhood experiences.
A more specific version of the same issue is concerned with the role ofeducational qualifications. In all the countries studied, teenage mothers wereless likely than other women to have standard qualifications (page 21). Thiswas one of the strongest associations observed; but also, one of the mostdifficult to interpret. Standard qualifications tend to be acquired during theteenage period, and education and motherhood may be seen as competingoccupations at that age. Do women without qualifications, and littleexpectation of acquiring any, tend to start a family? Or do women who have ababy in their teens have to give up their schooling to look after it, and so losethe opportunity to gain qualifications?
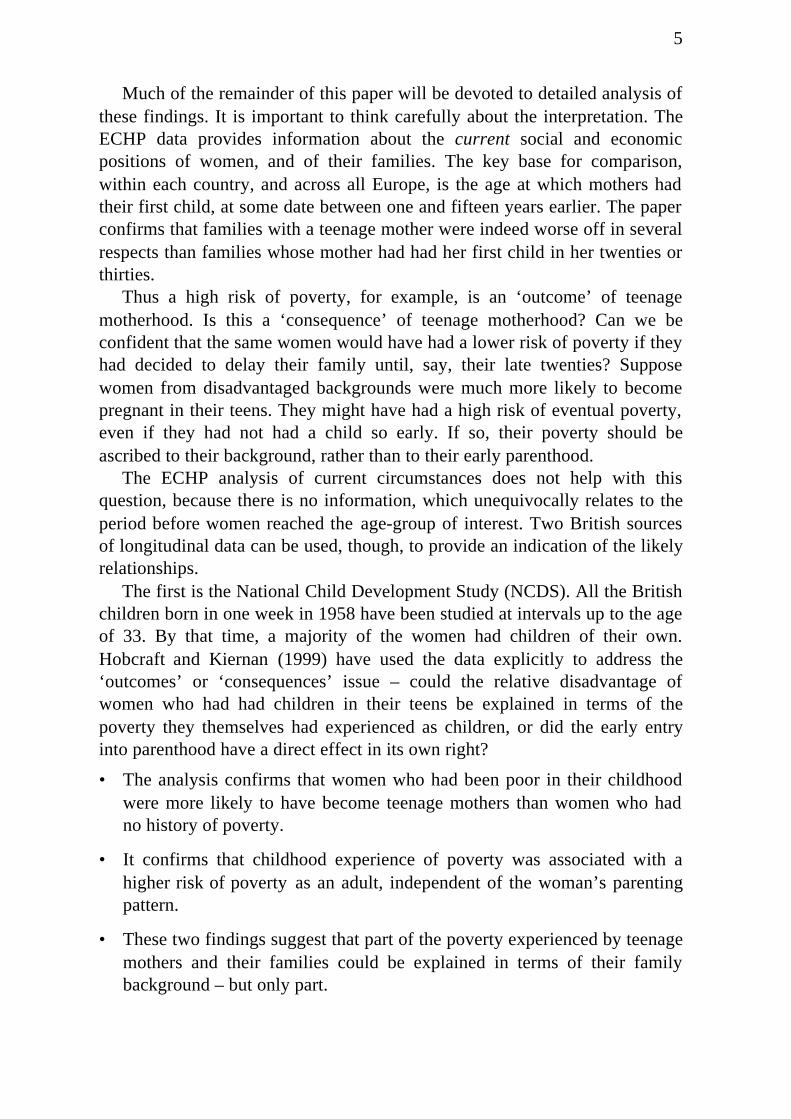
The British Household Panel Survey sheds some light on this question. Ithas interviewed the same individuals in Britain for nine years across the1990s. This includes about 500 women who were interviewed at the age of18, and again a year later. As Table 3 shows:
• Young women with no, or minimal, qualifications at the age of 18 weremuch more likely to have a baby in the following year than those with thebasic standard qualification. Those with better qualifications had evenlower fertility rates.
• Young women who already had a baby at the age of 18 were only abouthalf as likely to obtain additional qualifications in the following year, asthose with no child.
This simple longitudinal analysis of teenagers’ immediate experiences isnot conclusive, because it does not take account of other potential influenceson young women’s decisions. But the sequence of events may suggest that alow level of qualifications is in part a ‘cause’ of teenage motherhood, and inpart an ‘effect’.
7
Table 3: Relationships between having a baby and acquiring educational qualificationsbetween age 18 and age 19: BHPS 1991-99
Percentage who hada baby between
18 and 19
Percentage whoacquired qualifications
between 18 and 19Qualifications atage 18
Family at age 18
None, or less thanupper secondary
13.7 Had a child 7.7
Upper secondary 3.8 No child 14.8
Better qualifications 1.5
Of course, this analysis only covers the British situation, and does notnecessarily apply in other countries. The ECHP data do not allow us to assignshares to these directions of influence in each country. The analysis in thispaper provides, though, the only available consistent comparison betweencountries of the extent of the disadvantage experienced by teenage mothersacross Europe. The British evidence just reviewed suggests that at least part,perhaps a large part, of this disadvantage is a direct consequence of thefertility decision.
2. Identifying Women’s Age at First BirthThe European Community Household PanelThe European Community Household Panel (ECHP) is a harmonised surveyorganised and largely funded by Eurostat, covering most member countries ofthe European Union. In each country, an initial sample of households wasselected. All adults in each selected household were interviewed (and dataalso collected about children in the household). Each of the adults in thesample has then been re-interviewed in each subsequent year – thus making ita ‘panel’ survey, from which it is possible to study the changes affectingindividuals, and their families, from year to year.
In most of the countries covered, the sample was selected, and interviewsfirst took place, in 1994. In some countries, data from existing householdpanel surveys were transcribed into the common ECHP format, so that theycould be analysed in parallel with the new surveys. Two of the countriescovered, Austria and Finland, started their fieldwork in 1995 and 1996respectively, having only recently joined the union. The most recent dataavailable at the time of this analysis covered 1996.1
1 It should be noted that the data describes the current situation of the families in 1996, whose(first) children has been born an average of eight years earlier.
8
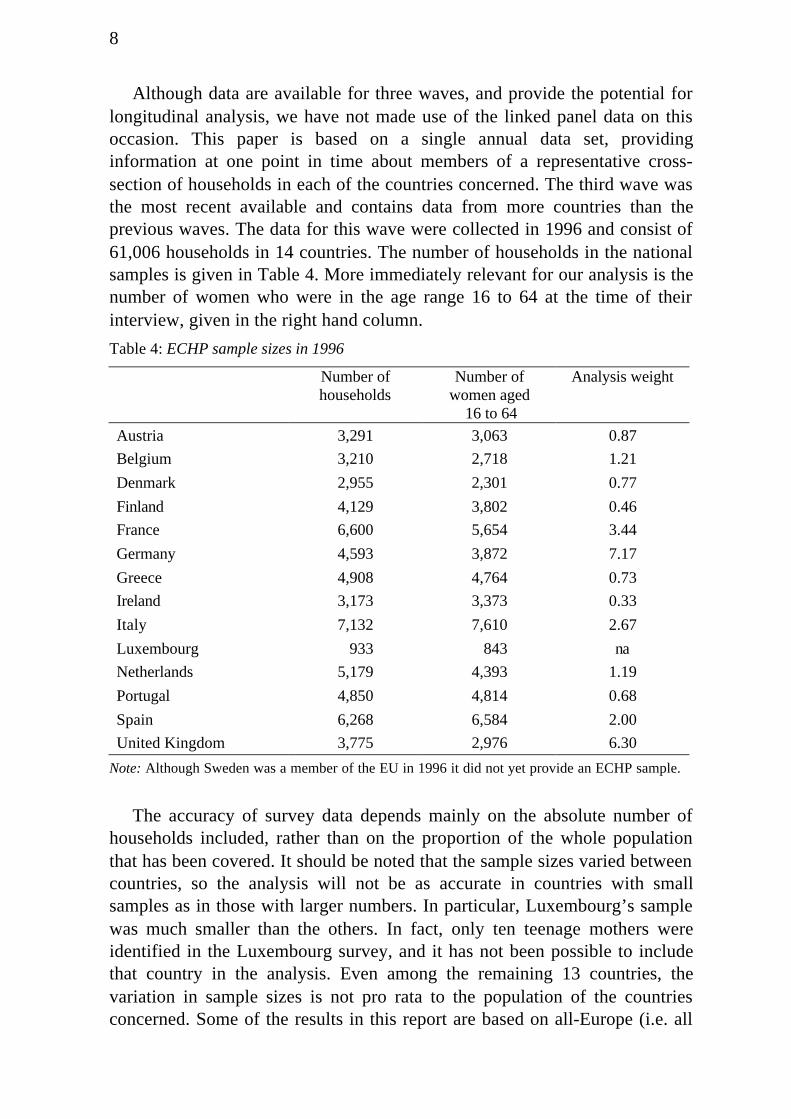
Although data are available for three waves, and provide the potential forlongitudinal analysis, we have not made use of the linked panel data on thisoccasion. This paper is based on a single annual data set, providinginformation at one point in time about members of a representative cross-section of households in each of the countries concerned. The third wave wasthe most recent available and contains data from more countries than theprevious waves. The data for this wave were collected in 1996 and consist of61,006 households in 14 countries. The number of households in the nationalsamples is given in Table 4. More immediately relevant for our analysis is thenumber of women who were in the age range 16 to 64 at the time of theirinterview, given in the right hand column.
Table 4: ECHP sample sizes in 1996
Number ofhouseholds
Number ofwomen aged
16 to 64
Analysis weight
Austria 3,291 3,063 0.87
Belgium 3,210 2,718 1.21
Denmark 2,955 2,301 0.77
Finland 4,129 3,802 0.46
France 6,600 5,654 3.44
Germany 4,593 3,872 7.17
Greece 4,908 4,764 0.73
Ireland 3,173 3,373 0.33
Italy 7,132 7,610 2.67
Luxembourg 933 843 na
Netherlands 5,179 4,393 1.19
Portugal 4,850 4,814 0.68
Spain 6,268 6,584 2.00
United Kingdom 3,775 2,976 6.30
Note: Although Sweden was a member of the EU in 1996 it did not yet provide an ECHP sample.
The accuracy of survey data depends mainly on the absolute number ofhouseholds included, rather than on the proportion of the whole populationthat has been covered. It should be noted that the sample sizes varied betweencountries, so the analysis will not be as accurate in countries with smallsamples as in those with larger numbers. In particular, Luxembourg’s samplewas much smaller than the others. In fact, only ten teenage mothers wereidentified in the Luxembourg survey, and it has not been possible to includethat country in the analysis. Even among the remaining 13 countries, thevariation in sample sizes is not pro rata to the population of the countriesconcerned. Some of the results in this report are based on all-Europe (i.e. all
9
13 countries included in the analysis), or on more limited combinations ofcountries. Where countries have been combined, the data have been weightedso that each is represented in the results in due proportion to its population.The weights used are shown in the right hand column of Table 4.2
Basic method of identifying mothers’ age at the birth of their childrenThe analysis is based on the assumption that the overwhelming majority ofchildren live in the same household as their natural mother throughout theirchildhood. The ECHP contains data about all the members of eachparticipating household, including their relationships to each other, and theirdates of birth. For each woman in the sample, therefore:
• we linked her to her children, if any;
• we calculated how old she was when each child was born, by subtractingher date of birth from the child’s date of birth.3
Consider, for example, a woman of 23 in 1996 with a child of five. Shehad been born in 1973 and her child in 1991. She would have been 18 whenthe child was born. The same principle can be applied to all birth ages(though in practice we have limited the analysis to birth-ages between 15 and44). In eleven of the countries analysed, dates of birth were recorded bymonth as well as by year, and this information allowed us to calculate themother’s age at the birth of her child quite accurately. In Germany no monthswere recorded for either parents or children. In Denmark adults’ month ofbirth was recorded, but not those of children under 17. These two countrieswere therefore less accurate.
The method just described had already been used for the analysis of a verylarge sample of women in Great Britain, and has been shown to provideteenage birth-rate estimates very close to those recorded in registrationstatistics (Berthoud 2001). It should be noted that it does not provide data onteenage pregnancy rates in countries where abortion is common. It will alsobe inaccurate as a measure of birth rates if there are countries where adoptionis common.
Women’s age at the time of the surveyAn important technical consideration is the current age of the woman beinganalysed. Consider births that took place when a woman was aged 18.
2 The weights were originally calculated to gross up to national populations; they were then scaleddown to be relative weights, with an average of 1.3 Throughout the analysis, ‘age’ is used to mean age-last-birthday, or the number of complete yearssince the woman’s or the child’s birth. Note that the Eurostat definition of age at birth, commonlyapplied in many continental countries, is slightly different: it is the age reached during the calendaryear of the birth.

10
Clearly, women now aged up to 17 cannot have had a baby at 18, though theymay do so in future. Women now aged 18 may already have had a baby atthat age; but some others may have a baby in the months between theirinterview and their 19th birthday, so we cannot measure 18-year-old birthrates accurately for those who are now 18. Good estimates can be made,though, for women who were 19 or older when interviewed. All the analysisin this paper is based on women who were at least a year older than the birth-age being considered.
There is also a maximum current age at which a woman’s birth-age can becalculated. The method is based on the assumption that the great majority ofchildren live with their mother. This assumption is valid when the child is 10.By the time the child is 30, the majority of children do not live with theirmother (though this varies a lot between countries). It would not be possibleto work out which women had had children at a particular age, and which hadnot, 30 years after the event. We need to know at what age the proportion ofchildren no longer living with their mother becomes so high that estimates ofwomen’s previous fertility rates start to be under-estimated.
A previous analysis of the ECHP has shown that European countries canbe divided into two groups, according to the ages and stages of youngpeople’s leaving home and starting a family of their own (Iacovou 1999). Anorthern/Protestant group of countries was characterised by a tendency toleave home relatively early, and settle down with spouse and childrenrelatively late; while young people in a southern/Catholic group of countriestended to move straight from their family of origin to their family ofprocreation without intermediate stages. For our purposes, we divided thethirteen ECHP countries as follows:
Northern/Protestant
Southern/Catholic
Belgium Austria
Denmark Greece
Finland Ireland
France Italy
Germany Portugal
Netherlands Spain
United Kingdom
Chart A plots the estimated fertility rates at ages 25 to 29 according to thenumber of years between the birth-age and the current age of the mother. (25-29 year old fertility rates have been used here, rather than teenage fertilityrates, because we have a much larger sample of women who gave birth at

11
those ages, and because the trends over time have been less strong.4) For thenorthern/Protestant group of countries, estimated fertility rates remainedstable for about 19 years after the birth-age under consideration, and thendeclined very rapidly as increasing numbers of young people had left home.For the southern/Catholic group of countries, the same pattern is observed,except that the plunge in estimated birth rates occurred a few years later, afterage 22, and was less steep.
Chart A: Estimated fertility between 25 and 29, by number of years since birth-age underconsideration.
Since a consistent rule is required, we have based our initial identificationof fertility rates on women who were less than twenty years older than thebirth-age under consideration. For example, births at age 18 are calculated forwomen who were aged up to 37. Some older women were of course livingwith a child, now in his or her twenties. On the other hand, we cannot becertain that other women above the age cut-off had not had a child at the ageunder consideration, who has since left home.
4 Strong trends over time complicate the analysis because of the direct association between thecurrent age of the child, and the date when s/he was born.
Estimated 25-29 fertility, per 1000
0
20
40
60
80
100
120
140
160
0 5 10 15 20 25 30Years since birth-age
Northern/Protestant
Southern/Catholic

12
Age-specific fertility rates
Although estimating fertility rates at each age is not the object of thisanalysis, it is appropriate to compare the ages at birth identified according tothe procedure just described, with the published statistics.
Chart B shows the number of births per thousand women across the fullrange of birth-ages between 15 and 44, derived from the ECHP. These overallstatistics for all ages and across all countries are not a main output from theanalysis, and are shown mainly to demonstrate that the shape of the curve isexactly as would have been expected, rising from close to zero at age 15 to apeak of about 125 per thousand between the ages of 25 and 27, and falling toclose to zero again at age 44. The figures imply that the average womanwould have 1.7 children over her life-time.
Chart B: Overall age-specific fertility rates
Our particular interest is in women who had given birth as teenagers. AsChart B shows, they were much less common than births at later ages, andcorrespondingly difficult to estimate with any precision. Another difficulty isthat teenage birth rates have been falling rapidly in many countries. Thismeans that the rate will be lower for women in our sample who are now intheir early twenties, than for those now in their early thirties. Table 5compares the teenage birth rate estimated from the ECHP with the figuresderived from official statistics, according to the date at which the woman wasat risk.5
5 Each woman in the sample was assigned an ‘expected risk’ of teenage motherhood – the officialrate per thousand recorded in that country in the year the woman reached 18½. The ‘official
Fertility rate, per 1000
0
20
40
60
80
100
120
140
15 20 25 30 35 40 45
Age
13
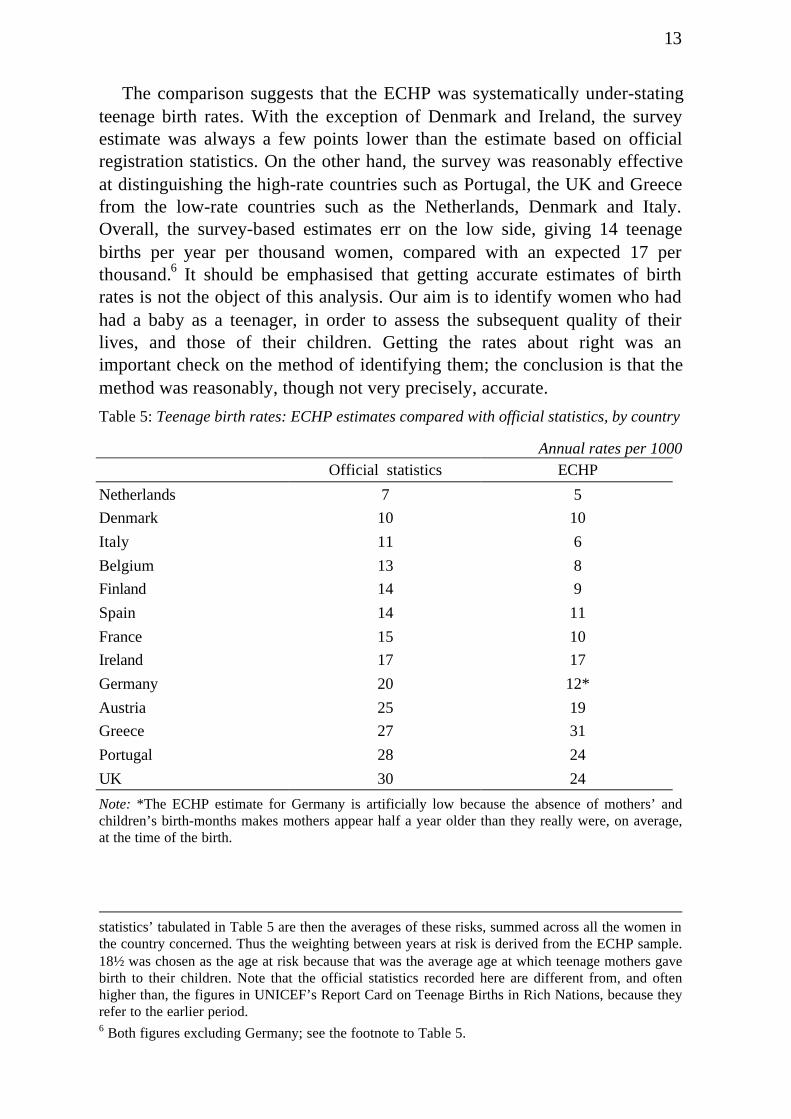
The comparison suggests that the ECHP was systematically under-statingteenage birth rates. With the exception of Denmark and Ireland, the surveyestimate was always a few points lower than the estimate based on officialregistration statistics. On the other hand, the survey was reasonably effectiveat distinguishing the high-rate countries such as Portugal, the UK and Greecefrom the low-rate countries such as the Netherlands, Denmark and Italy.Overall, the survey-based estimates err on the low side, giving 14 teenagebirths per year per thousand women, compared with an expected 17 perthousand.6 It should be emphasised that getting accurate estimates of birthrates is not the object of this analysis. Our aim is to identify women who hadhad a baby as a teenager, in order to assess the subsequent quality of theirlives, and those of their children. Getting the rates about right was animportant check on the method of identifying them; the conclusion is that themethod was reasonably, though not very precisely, accurate.
Table 5: Teenage birth rates: ECHP estimates compared with official statistics, by country
Annual rates per 1000Official statistics ECHP
Netherlands 7 5
Denmark 10 10
Italy 11 6
Belgium 13 8
Finland 14 9
Spain 14 11
France 15 10
Ireland 17 17
Germany 20 12*
Austria 25 19
Greece 27 31
Portugal 28 24
UK 30 24
Note: *The ECHP estimate for Germany is artificially low because the absence of mothers’ andchildren’s birth-months makes mothers appear half a year older than they really were, on average,at the time of the birth.
statistics’ tabulated in Table 5 are then the averages of these risks, summed across all the women inthe country concerned. Thus the weighting between years at risk is derived from the ECHP sample.18½ was chosen as the age at risk because that was the average age at which teenage mothers gavebirth to their children. Note that the official statistics recorded here are different from, and oftenhigher than, the figures in UNICEF’s Report Card on Teenage Births in Rich Nations, because theyrefer to the earlier period.6 Both figures excluding Germany; see the footnote to Table 5.

14
Age at first birth
Having identified the ages at which women in the sample gave birth to eachof their children, it is an initially straightforward task to work out the earliestof those ages; and to define a woman’s age at first birth (AaFB) accordingly.However the classification of age at first birth was then limited to womenwhose oldest child still living with her was less than 16. Given that weconsider the identification to be accurate until a child is aged 20, this allows afour year gap to ensure that the earliest ‘observed’ birth was in fact thewoman’s earliest ‘ever’ birth.7
This method has identified 1,336 women in the ECHP sample whose firstchild was born before they were 20. These are divided by country as shown inthe first column of Table 6 – the number by country being the joint outcomeof the total number of women in the sample, and the rate at which they hadteenage births. Eight countries provided at least 100 ex-teenage mothers andshould provide robust comparisons between them and those whose firstchildren were born later. The samples dip below 100 in the other fivecountries, including numbers in the 30s in small countries with low teen birthrates.
Table 6: Number of women in the sample available for analysis, by age at birth of firstchild
15 to 19 20 to 24 25 to 29 30 or more
Austria 104 350 258 109
Belgium 38 284 363 132
Denmark 37 205 245 130
Finland 38 274 399 252
France 100 529 564 278
Germany 63 352 374 215
Greece 223 465 340 181
Ireland 112 257 292 191
Italy 114 529 599 348
Netherlands 32 295 526 273
Portugal 216 474 288 167
Spain 142 510 540 256
United Kingdom 117 282 329 174
Total 1336 4806 5117 863
7 This is a potentially confusing point. The identification of a mother’s age at the birth of each ofher children was limited to children under 20. The identification of her age at the birth of her firstchild was further limited to those whose oldest child was less than 16.

15
3. Analytical ApproachCorrecting for age-related biases in the identification procedure
The previous chapter explained how women’s childbearing history had beenworked out on the basis of the dates of birth of the children now living withthem. This involved limiting the identification of women whose earliest childhad been born at a particular age to those who were now above that age, butwhose oldest child was less than 16. This means that the women wereinterviewed at various stages between one and 15 years after their first childhad been born, with an average elapsed time of eight years.
A consequence is that the current ages (at the time of the survey interview)of the women identified as having had children at various periods of theirlives were not the same; the members of each five-year range of age-at-first-birth were necessarily about five years older, on average, than the previousgroup. For example, women whose first child was born at the age of 18 wereaged 26, on average, when they were interviewed; but women who startedtheir family at 28 were now 36, on average. These variations are entirelyartificial consequences of the method of identifying women’s fertility history.It is necessary to check, for each outcome to be analysed, whether thatoutcome is very sensitive to biases associated either with current age or withelapsed time since the first birth. It will be shown, for example, that theproportion of women reporting good educational qualifications varies a greatdeal, depending on their current age. It is necessary to correct for thevariations between age-at-first-birth groups in their current age, in order toobtain a true measure of the age-at-first-birth effect. By the same token, itmay be necessary to correct for variations in the elapsed time since the firstchild was born, to obtain a true comparison of outcomes, which tend tochange over time.
Interpreting the links between outcomes
It has already been seen (Table 1) that teenage mothers had relatively pooreducational qualifications; they are less likely to be married than othermothers; they (and their husbands) were less likely to have jobs; and they(and their families) were more likely to live in poverty. These conclusionswill remain true after the age-biases just discussed have been taken intoaccount.
It can immediately be seen that there may be a chain of causes betweenteenage motherhood at the beginning of the sequence and poverty at the end.The direct consequence of having a baby as a teenager might be that theyoung women had to leave school; if she was not married when she gotpregnant, that would increase the chances of her remaining single bothimmediately after the birth and in subsequent years. The low level of

16
education could then influence her own chances of getting a job; and the lackof a partner would reduce the likelihood of receiving financial support withinthe family. The absence of earnings would then increase the risk of poverty.
Without longitudinal data following women and their families throughoutthe period before and after their children were born, it is not possible to tiedown causal pathways with any precision. It is possible, though, to interpretthe outcomes in the light of the hypothetical links just outlined. The analysisin the following sections starts with education – the outcome which may bemost immediately associated with fertility decisions (see the discussion onpage 5). We then follow through the potential sequence of causation in a‘layered’ analysis: it will be asked, for example, how far the apparentrelationship between age at first birth and employment can be explained bythe already-established relationships with education and family structure; thenthe analysis of poverty considers explanations in terms of education, familystructure and employment.
Each section therefore adopts a similar format. The first task is to establishwhether the crude differences observed between age-at-first-birth groupsstand up after allowing for possible age biases. The second is to show to whatextent variations in the outcome under consideration may be mediated by theoutcomes already covered in previous sections.
Europe, then countries
In principle, we might investigate all of these possible relationshipsindependently in each of the 13 countries included in the ECHP. In practicethat would provide far too complex a set of findings. Instead, we haveundertaken a preliminary analysis of the relationships between the variablesof interest, covering the whole of Europe (defined as the 13 countries in thesample). These analyses have been weighted to ensure that each country’scontribution to the analysis is in proportion to its population size, rather thanin proportion to the sample that happened to be interviewed for the survey.Having determined and discussed the overall Europe-wide relationship, wethen undertake an identical analysis within each country to show localpatterns. It is assumed that the broad shape of the relationship betweenvariables is identical in each country; but the strength of those relationships isallowed to vary from country to country.
A reminder: the sample of women in Luxembourg was too small for anymeaningful analysis by their age at first birth, and that country has beenexcluded from the analysis.
Choosing a metric for age-at-first-birth (AaFB)
Policy concern about the potentially negative outcomes of early child-bearingis closely focused on ‘teenage’ motherhood – that is, a clear dividing line is
17
made, depending on whether the mother had reached her twentieth birthday.The analysis will confirm that teenage mothers and their families doexperience disadvantage in comparison with women who have children later,throughout Western Europe.
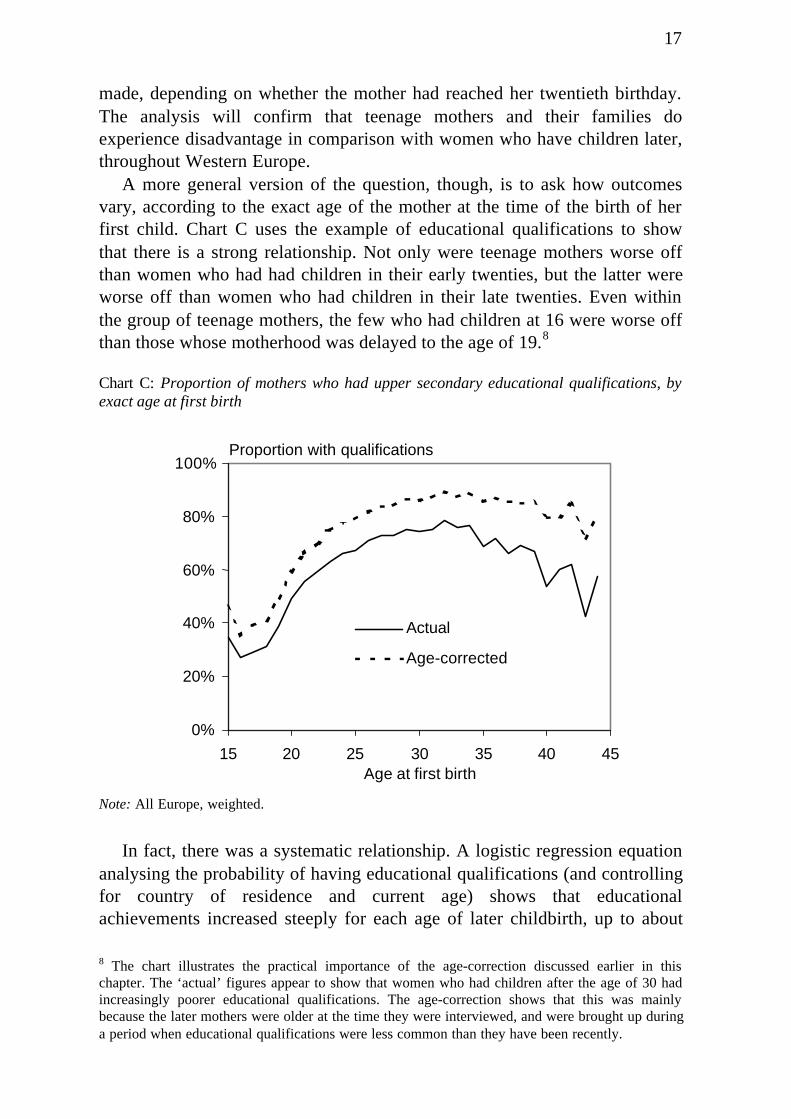
A more general version of the question, though, is to ask how outcomesvary, according to the exact age of the mother at the time of the birth of herfirst child. Chart C uses the example of educational qualifications to showthat there is a strong relationship. Not only were teenage mothers worse offthan women who had had children in their early twenties, but the latter wereworse off than women who had children in their late twenties. Even withinthe group of teenage mothers, the few who had children at 16 were worse offthan those whose motherhood was delayed to the age of 19.8
Chart C: Proportion of mothers who had upper secondary educational qualifications, byexact age at first birth
Note: All Europe, weighted.
In fact, there was a systematic relationship. A logistic regression equationanalysing the probability of having educational qualifications (and controllingfor country of residence and current age) shows that educationalachievements increased steeply for each age of later childbirth, up to about
8 The chart illustrates the practical importance of the age-correction discussed earlier in thischapter. The ‘actual’ figures appear to show that women who had children after the age of 30 hadincreasingly poorer educational qualifications. The age-correction shows that this was mainlybecause the later mothers were older at the time they were interviewed, and were brought up duringa period when educational qualifications were less common than they have been recently.
Proportion with qualifications
0%
20%
40%
60%
80%
100%
15 20 25 30 35 40 45Age at first birth
Actual
Age-corrected

18
the age of 28. Educational levels then held steady, or may even have declinedslowly as the woman’s age at first birth increased beyond the age of 28. Verysimilar relationships were observed for the other outcomes to be discussed inthe following sections.
For each outcome, therefore, we have estimated the effect of age-at-first-birth in two ways.
• The more detailed equations have been estimated using a statistical device(known as a ‘spline’), in which the year-by-year relationship betweenAaFB and the dependent variable was estimated independently for womenwhose first child was born before the age of 28, and for those whose childwas born later. In general, the interest is in the first of these – taking 28 as,in a sense, an ‘optimum’ time to start a family (from the point of view ofthe outcomes being analysed here), how much better off was a woman andher family observed to be, for each year (up to 28) that she delayed herfirst child? 9
• A second analysis will then be used simply to compare teenage mothers asa group (i.e. AaFB between 15 and 19) with all other mothers, to provide amuch more straightforward, if less sensitive, summary of the variation inoutcomes.
Logistic regression equations
Logistic regression equations have been used to sort out the relativeimportance of the factors associated with each of the five outcomes to beconsidered. The technique involves using each of the factors to build up acumulative prediction of the likelihood of a mother (or family) with givencharacteristics reaching a particular outcome. The influence of each of thefactors included in the equation is calculated, independent of all of the others.
An example of the output is Table 8, which sets out the relationshipsbetween current age and parenting history on women’s achievement ofstandard qualifications. The coefficients indicate the strength of theassociations. A positive sign means that the factor concerned is associatedwith an increased probability; a negative sign indicates a reduced probability.Large coefficients can be compared with small ones in the normal way,though it is necessary to take account of the fact that some coefficients areassociated with a single characteristic (e.g. teen mother), while others refer toa unit increase in the variable under consideration (e.g. age at first birth). Wecannot directly interpret the coefficients in terms of an increase or decrease ofso many percentage points in the outcome variable. It is possible, on the otherhand, to calculate the proportion for individuals with certain stated
9 A series of splines was tested, with the ‘knots’ at different ages of first birth. 28 was the versionwhich most efficiently predicted educational qualifications.
19
characteristics, and these ‘logistic regression estimates’ are frequently used toillustrate certain key differences.
The ‘pseudo R-squared’ reported at the foot of each logistic regressionequation is an indication of how close the fit is between the combinedpredictor variables and the outcome being predicted. In principle it couldreach 100 per cent if every case could be predicted unambiguously, althoughpseudo R-squared rarely reaches much more than 25 per cent in surveyanalysis of this sort. None of the equations here provides a very close fit. Theaim is not so much to find a comprehensive explanation of the influences onany of the outcomes under consideration, as to clarify the consequences of asingle factor – teenage motherhood.
4. Educational QualificationsThe ECHP analysis confirms the findings of many other studies, that womenwho had a child when still a teenager had fewer educational qualificationsthan those who started a family later. As discussed in the introduction to thispaper (page 5), measures of education taken several years after the pregnancycannot distinguish cause from effect:
• who had already performed poorly in the education system, or who couldpredict that they would make little further progress, decide to have a babyas they had completed their studies?
• or did women who fell pregnant as teenagers decide to give up theireducation in order to care for the baby?
Although we cannot establish the direction of cause and effect, the analysisof the ECHP provides an opportunity to compare the strength of thisrelationship between different countries.
Each country contributing to the ECHP asked respondents to describe theireducational qualifications. All countries’ qualifications were then codedaccording to a common framework, using the ‘ISCED’ classification.10 Theimportant point is that the upper secondary qualifications (‘Level 3’) analysedin this paper are the certificates which students are expected to attained oncompletion of secondary schooling, at about the age of 18.
Table 7 demonstrates rather clearly the extent to which education andmotherhood were alternative activities during the crucial period of youngwomen’s lives. Nearly three quarters of 16 to 19 year olds who had not had ababy remained in full time education; only a third of mothers in that agegroup were still at school or college. A large proportion of women without
10 International Standard Classification of Education
20
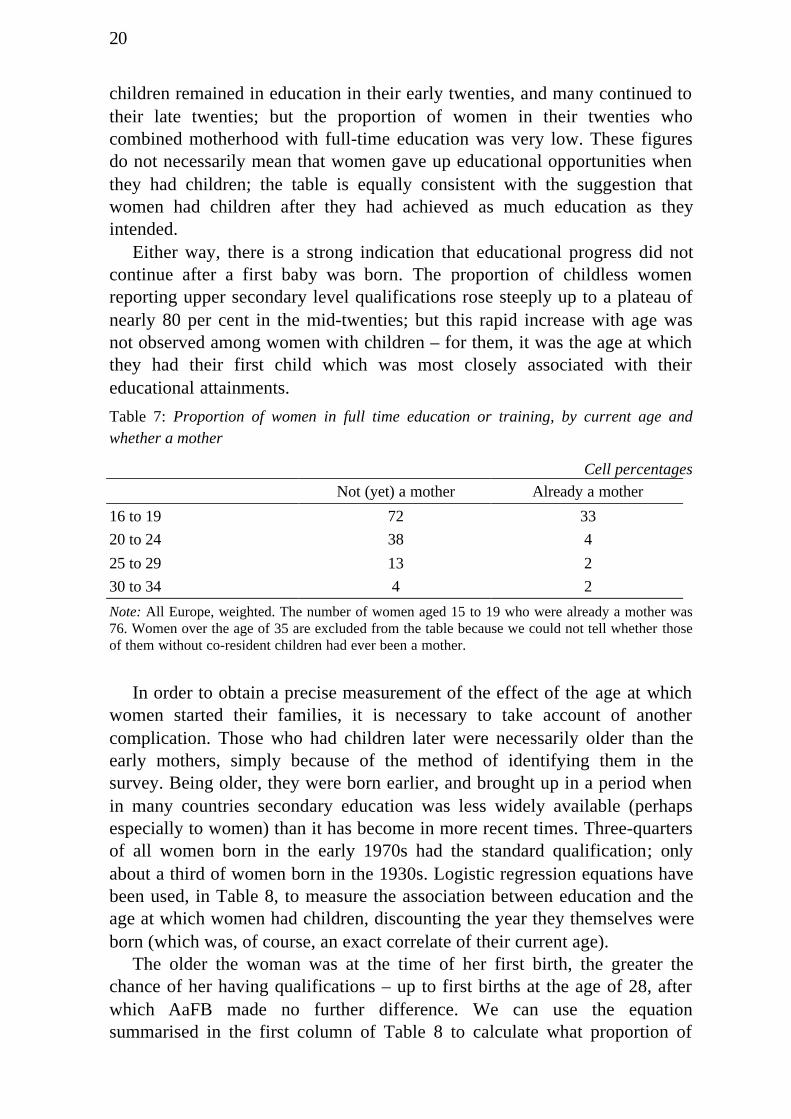
children remained in education in their early twenties, and many continued totheir late twenties; but the proportion of women in their twenties whocombined motherhood with full-time education was very low. These figuresdo not necessarily mean that women gave up educational opportunities whenthey had children; the table is equally consistent with the suggestion thatwomen had children after they had achieved as much education as theyintended.
Either way, there is a strong indication that educational progress did notcontinue after a first baby was born. The proportion of childless womenreporting upper secondary level qualifications rose steeply up to a plateau ofnearly 80 per cent in the mid-twenties; but this rapid increase with age wasnot observed among women with children – for them, it was the age at whichthey had their first child which was most closely associated with theireducational attainments.
Table 7: Proportion of women in full time education or training, by current age andwhether a mother
Cell percentagesNot (yet) a mother Already a mother
16 to 19 72 33
20 to 24 38 4
25 to 29 13 2
30 to 34 4 2
Note: All Europe, weighted. The number of women aged 15 to 19 who were already a mother was76. Women over the age of 35 are excluded from the table because we could not tell whether thoseof them without co-resident children had ever been a mother.
In order to obtain a precise measurement of the effect of the age at whichwomen started their families, it is necessary to take account of anothercomplication. Those who had children later were necessarily older than theearly mothers, simply because of the method of identifying them in thesurvey. Being older, they were born earlier, and brought up in a period whenin many countries secondary education was less widely available (perhapsespecially to women) than it has become in more recent times. Three-quartersof all women born in the early 1970s had the standard qualification; onlyabout a third of women born in the 1930s. Logistic regression equations havebeen used, in Table 8, to measure the association between education and theage at which women had children, discounting the year they themselves wereborn (which was, of course, an exact correlate of their current age).
The older the woman was at the time of her first birth, the greater thechance of her having qualifications – up to first births at the age of 28, afterwhich AaFB made no further difference. We can use the equationsummarised in the first column of Table 8 to calculate what proportion of

21
women with children would be expected to have qualifications, in a situationwhere age and country were held constant,11 but age at first birth was allowedto vary:
Among women whose first child was born when she was 18 54 per centAmong women whose first child was born when she was 28 89 per cent
The simpler specification in the right hand column of Table 8 shows thatwomen who had been teen mothers were less likely to have qualificationsthan all other mothers, again after taking account of their own date of birthand the countries they were living in. Again, taking a ‘standard’ woman, wecan estimate the following probabilities:
Among those who had a baby as a teenager 44 per centAmong all other mothers 75 per cent
Table 8: Logistic regression equations of the probability of having upper secondaryqualifications
Logistic regression coefficientsDetailed
specification of ageat first birth
Summaryspecification
Year mother born Per year 0.033 -0.01ns
Age at first birth Per year, up to 28 0.192 na
Per year, 28 on -0.011ns na
Teen mother na -1.32
Constant -69.18 14.52
Pseudo R squared 10.7% 8.9%
Note: All Europe, weighted; country dummies included in equation but not shown. ns=notsignificant (p>0.05).
The results in Table 8 are based on the whole of Europe, pooling the datafrom all countries in the survey, and imposing the condition that a singlerelationship had to be found. Table 9 then shows what happens if we estimatean equation of the same form separately in each country. The column headed‘logistic regression coefficients’ again refers to the model in which the age atwhich women had their first child was assumed to have a continuousrelationship with education, up to age 28. There was a strong and significantlink between early motherhood and educational achievement, in all of thecountries under study. On the other hand, the strength of that relationshipvaried from country to country: early parenting was most closely associated
11 The standard case was assumed to be a woman born in 1971, living in France. The latter was inthe middle of the overall distribution of levels of qualification.
22
with educational disadvantage in Greece and Denmark, but least in theNetherlands and Germany.
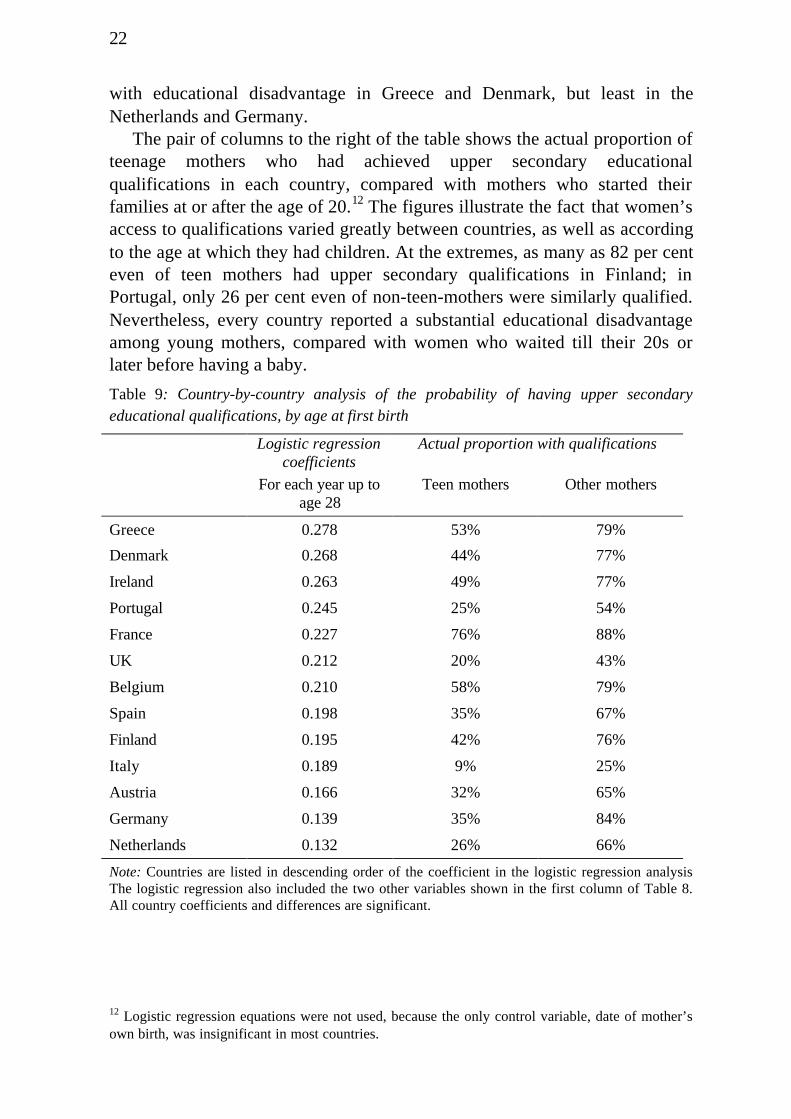
The pair of columns to the right of the table shows the actual proportion ofteenage mothers who had achieved upper secondary educationalqualifications in each country, compared with mothers who started theirfamilies at or after the age of 20.12 The figures illustrate the fact that women’saccess to qualifications varied greatly between countries, as well as accordingto the age at which they had children. At the extremes, as many as 82 per centeven of teen mothers had upper secondary qualifications in Finland; inPortugal, only 26 per cent even of non-teen-mothers were similarly qualified.Nevertheless, every country reported a substantial educational disadvantageamong young mothers, compared with women who waited till their 20s orlater before having a baby.
Table 9: Country-by-country analysis of the probability of having upper secondaryeducational qualifications, by age at first birth
Logistic regressioncoefficients
Actual proportion with qualifications
For each year up toage 28
Teen mothers Other mothers
Greece 0.278 53% 79%
Denmark 0.268 44% 77%
Ireland 0.263 49% 77%
Portugal 0.245 25% 54%
France 0.227 76% 88%
UK 0.212 20% 43%
Belgium 0.210 58% 79%
Spain 0.198 35% 67%
Finland 0.195 42% 76%
Italy 0.189 9% 25%
Austria 0.166 32% 65%
Germany 0.139 35% 84%
Netherlands 0.132 26% 66%
Note: Countries are listed in descending order of the coefficient in the logistic regression analysisThe logistic regression also included the two other variables shown in the first column of Table 8.All country coefficients and differences are significant.
12 Logistic regression equations were not used, because the only control variable, date of mother’sown birth, was insignificant in most countries.

23
5. Family StructureThe family context of early parenthood can vary strongly from one socialgroup to the next. In many societies, it is common for women to marry at anearly age, and to have children within marriage. Where early marriage andchildbearing are conventionally accepted, it is likely that teenage motherswould often have the approval of both sets of families, and not necessarily beperceived as either disgraced or disadvantaged.
In other societies, it is unusual for women to marry so young, and a largeproportion of teenage pregnancies originate outside marriage. Yet theoutcome may vary again, according to the circumstances and expectations ofthe social situation in which young women find themselves. Conception mayend in abortion; in a live birth followed by adoption; in marriage (perhapsprecipitated by the pregnancy); or in a period of single parenthood. Some ofthose starting as single mothers may remain in that state, others may marrylater, not necessarily to their first baby’s father.
Studies based on direct information about women’s marital status at thetime of the birth of their first child show that early parenthood is stronglyassociated with births outside marriage throughout Europe. (Kiernan 1999).The ECHP data describe women’s and families’ positions at the time of theirinterview, after their child was born. Some were interviewed only a year afterthe event, while for others the interview took place 15 years later. We can usethis variation in elapsed time since the first birth to infer a process of unionformation and dissolution, and to work out, from that, what the situation waslikely to have been, soon after mothers started their families.
A high-marriage country: Greece
In Greece, only one mother in the survey said that she was single at the timeof her interview. 93 per cent were married, only 1 per cent were cohabiting13
and 6 per cent were formerly married (widowed, separated or divorced).Marriage was so overwhelmingly the dominant family structure that there waslittle room for variation between sub-groups. Almost all ex-teenage motherswere married, just as almost all other mothers were. It is also worth notingthat the husbands of Greek teenage mothers were about 7½ years older thanthey were, on average, so that the rate of early parenthood would not look so
13 Cohabiting is the word used here to describe men and women living as partners without beingmarried to each other. This is labeled a ‘consensual union’ in the ECHP data.
24
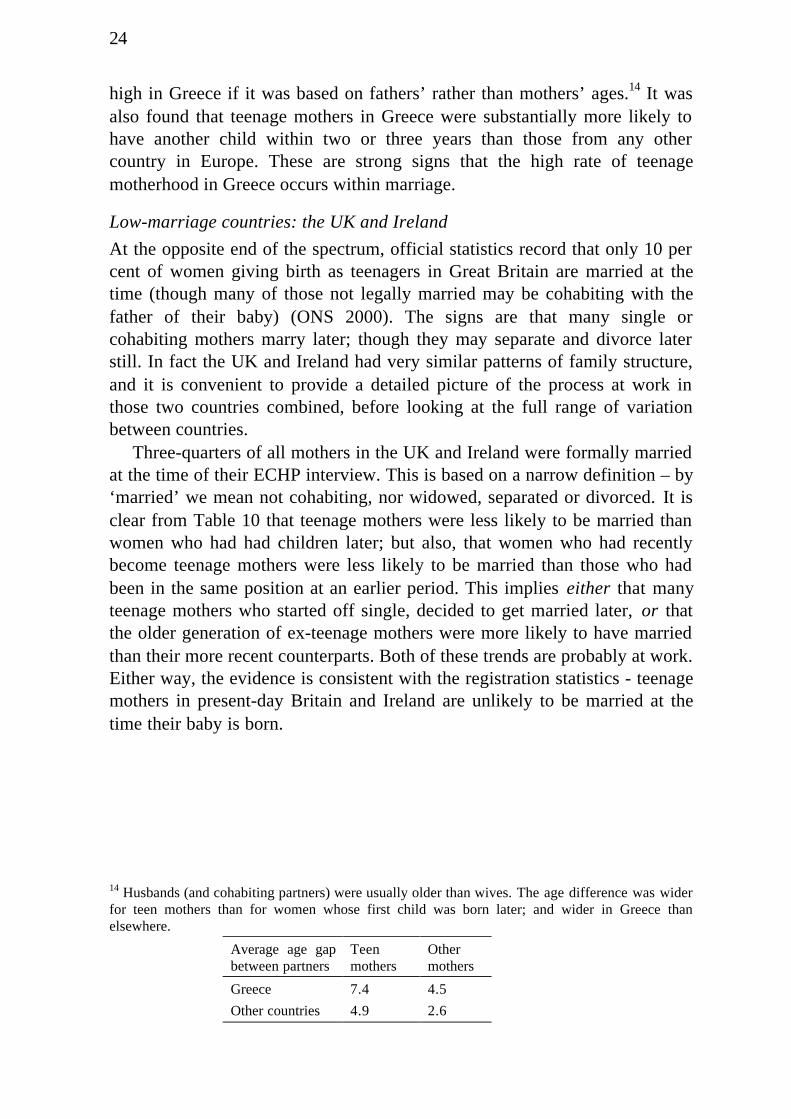
high in Greece if it was based on fathers’ rather than mothers’ ages.14 It wasalso found that teenage mothers in Greece were substantially more likely tohave another child within two or three years than those from any othercountry in Europe. These are strong signs that the high rate of teenagemotherhood in Greece occurs within marriage.
Low-marriage countries: the UK and Ireland
At the opposite end of the spectrum, official statistics record that only 10 percent of women giving birth as teenagers in Great Britain are married at thetime (though many of those not legally married may be cohabiting with thefather of their baby) (ONS 2000). The signs are that many single orcohabiting mothers marry later; though they may separate and divorce laterstill. In fact the UK and Ireland had very similar patterns of family structure,and it is convenient to provide a detailed picture of the process at work inthose two countries combined, before looking at the full range of variationbetween countries.
Three-quarters of all mothers in the UK and Ireland were formally marriedat the time of their ECHP interview. This is based on a narrow definition – by‘married’ we mean not cohabiting, nor widowed, separated or divorced. It isclear from Table 10 that teenage mothers were less likely to be married thanwomen who had had children later; but also, that women who had recentlybecome teenage mothers were less likely to be married than those who hadbeen in the same position at an earlier period. This implies either that manyteenage mothers who started off single, decided to get married later, or thatthe older generation of ex-teenage mothers were more likely to have marriedthan their more recent counterparts. Both of these trends are probably at work.Either way, the evidence is consistent with the registration statistics - teenagemothers in present-day Britain and Ireland are unlikely to be married at thetime their baby is born.
14 Husbands (and cohabiting partners) were usually older than wives. The age difference was widerfor teen mothers than for women whose first child was born later; and wider in Greece thanelsewhere.
Average age gapbetween partners
Teenmothers
Othermothers
Greece 7.4 4.5
Other countries 4.9 2.6

25
Table 10: Proportion of mothers in the UK and Ireland who were married at the time ofinterview, by age at birth of first child and number of years since birth of first child
Cell percentages Age at birth of first child
Years since first birth 15 to 19 20-24 25-29
0 to 4 years 21 71 83
5-9 years 30 62 79
10-14 years 54 72 87
15-19 years 65
This inter-relationship between the mother’s age when her child was born,and her age now (i.e. the number of years since the birth) can be summarisedin the form of another logistic regression equation, this time predictingfamilies’ marital status (Table 11). Because there are four possible outcomes(single, cohabiting, married and ex-married), we use a multinomial analysiswith three sets of coefficients, predicting each of three conditions other thanmarriage.
Table 11: Multinomial logistic analysis of mothers’ marital status in the UK and Ireland,based on age at birth of first child and years since first birth
Logistic regression coefficients
Single Cohabiting Widowed,separated or
divorced
Years since firstbirth
Per year -0.153 -0.149 0.062
Age at first birth Per year, up to 28 -0.363 -0.223 -0.155
Per year, 28onwards
0.107ns 0.038ns 0.028ns
Constant 7.14 4.39 1.21
Note: Pseudo R-squared=9.7%. ns = not significant (p>0.05).
• The longer the time that had elapsed since she had her first baby, the lesslikely a mother was to be single or cohabiting, but the more likely to haveseparated or divorced. These findings are consistent with the idea ofmarital stages, in which being single and cohabiting occur beforemarriage, and separation or divorce (obviously) after it.
• The model confirms that the older a woman was when she had a child (upto the age of 28), the less likely she was to be single when interviewed,less likely to be cohabiting, and slightly less likely to have separated ordivorced. Thus early motherhood is associated with all three of thealternatives to formal marriage.
26
• Above the age of 28, there was no significant relationship betweenmothers’ age at first birth and her later marital status.
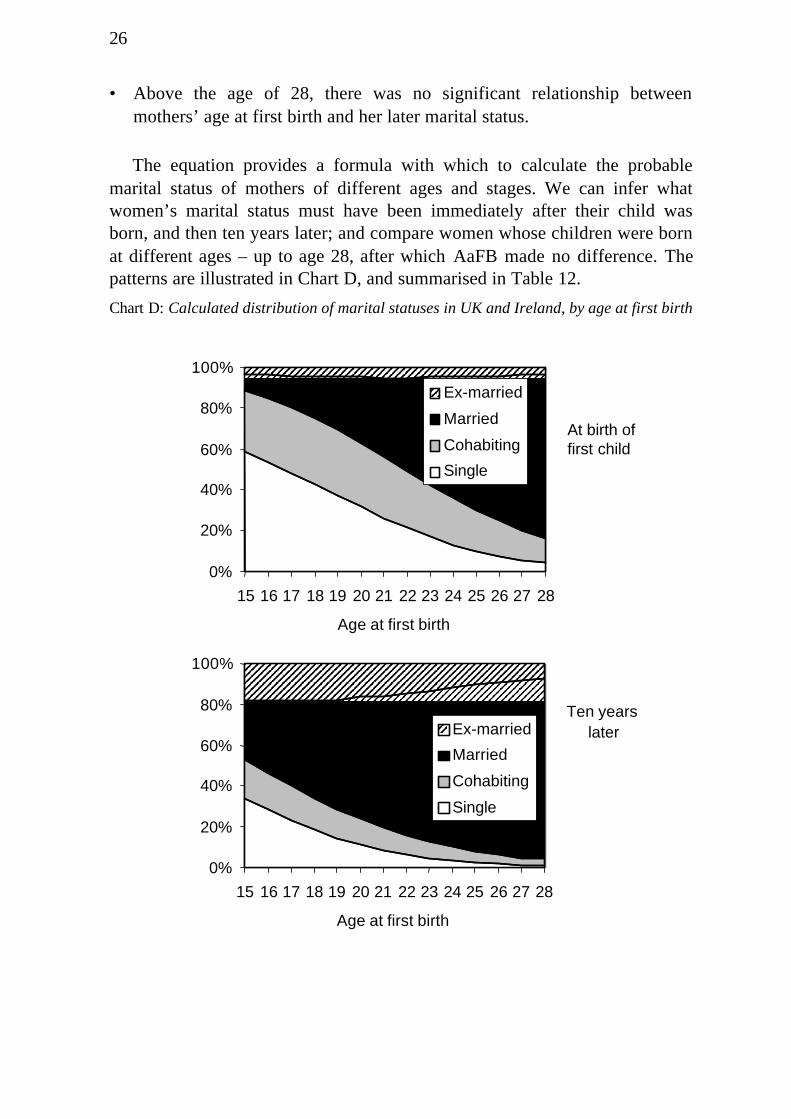
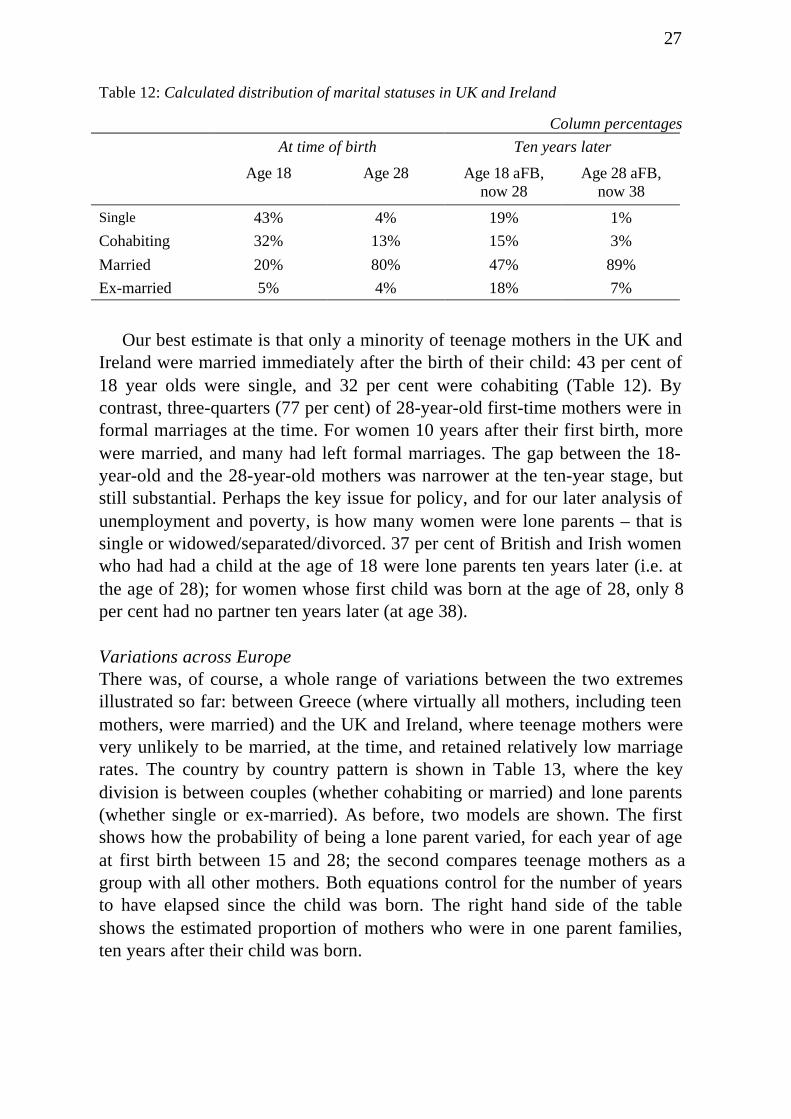
The equation provides a formula with which to calculate the probablemarital status of mothers of different ages and stages. We can infer whatwomen’s marital status must have been immediately after their child wasborn, and then ten years later; and compare women whose children were bornat different ages – up to age 28, after which AaFB made no difference. Thepatterns are illustrated in Chart D, and summarised in Table 12.
Chart D: Calculated distribution of marital statuses in UK and Ireland, by age at first birth
0%
20%
40%
60%
80%
100%
15 16 17 18 19 20 21 22 23 24 25 26 27 28
Age at first birth
At birth offirst child
Ex-married
Married
Cohabiting
Single
0%
20%
40%
60%
80%
100%
15 16 17 18 19 20 21 22 23 24 25 26 27 28
Age at first birth
Ten yearslaterEx-married
Married
Cohabiting
Single
27
Table 12: Calculated distribution of marital statuses in UK and Ireland
Column percentages
At time of birth Ten years later
Age 18 Age 28 Age 18 aFB,now 28
Age 28 aFB,now 38
Single 43% 4% 19% 1%
Cohabiting 32% 13% 15% 3%
Married 20% 80% 47% 89%
Ex-married 5% 4% 18% 7%
Our best estimate is that only a minority of teenage mothers in the UK andIreland were married immediately after the birth of their child: 43 per cent of18 year olds were single, and 32 per cent were cohabiting (Table 12). Bycontrast, three-quarters (77 per cent) of 28-year-old first-time mothers were informal marriages at the time. For women 10 years after their first birth, morewere married, and many had left formal marriages. The gap between the 18-year-old and the 28-year-old mothers was narrower at the ten-year stage, butstill substantial. Perhaps the key issue for policy, and for our later analysis ofunemployment and poverty, is how many women were lone parents – that issingle or widowed/separated/divorced. 37 per cent of British and Irish womenwho had had a child at the age of 18 were lone parents ten years later (i.e. atthe age of 28); for women whose first child was born at the age of 28, only 8per cent had no partner ten years later (at age 38).
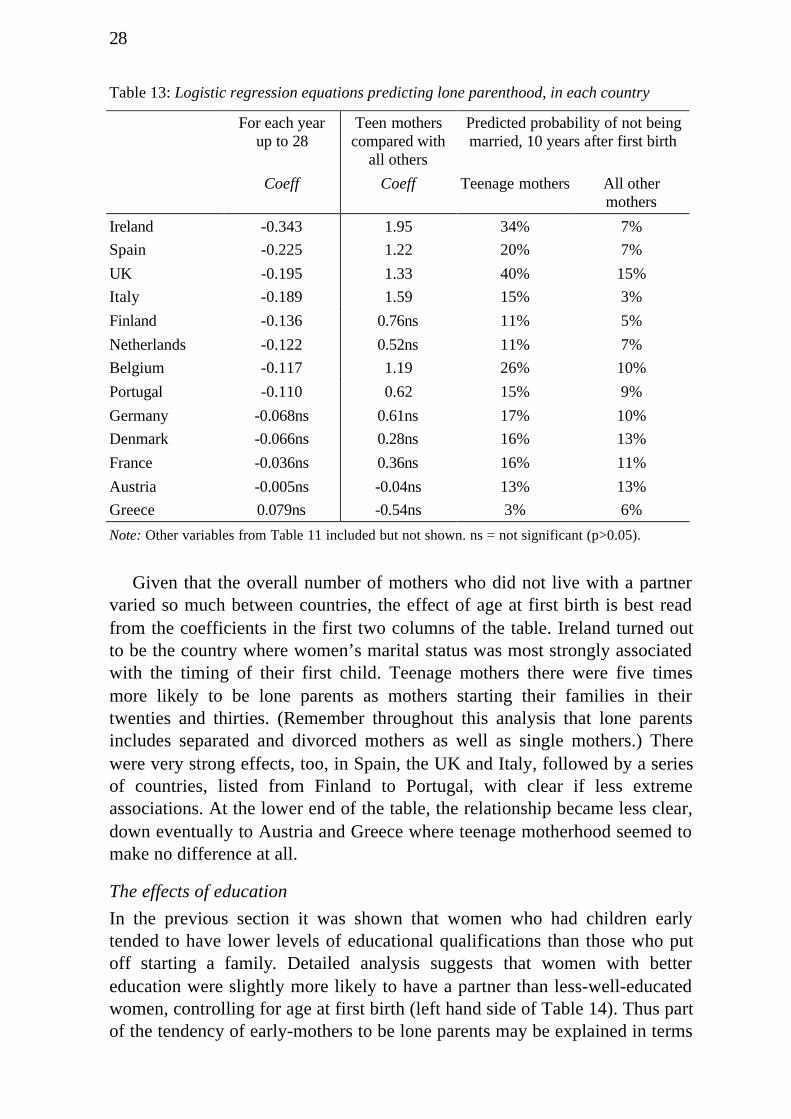
Variations across EuropeThere was, of course, a whole range of variations between the two extremesillustrated so far: between Greece (where virtually all mothers, including teenmothers, were married) and the UK and Ireland, where teenage mothers werevery unlikely to be married, at the time, and retained relatively low marriagerates. The country by country pattern is shown in Table 13, where the keydivision is between couples (whether cohabiting or married) and lone parents(whether single or ex-married). As before, two models are shown. The firstshows how the probability of being a lone parent varied, for each year of ageat first birth between 15 and 28; the second compares teenage mothers as agroup with all other mothers. Both equations control for the number of yearsto have elapsed since the child was born. The right hand side of the tableshows the estimated proportion of mothers who were in one parent families,ten years after their child was born.
28
Table 13: Logistic regression equations predicting lone parenthood, in each country
For each yearup to 28
Teen motherscompared with
all others
Predicted probability of not beingmarried, 10 years after first birth
Coeff Coeff Teenage mothers All othermothers
Ireland -0.343 1.95 34% 7%
Spain -0.225 1.22 20% 7%
UK -0.195 1.33 40% 15%
Italy -0.189 1.59 15% 3%
Finland -0.136 0.76ns 11% 5%
Netherlands -0.122 0.52ns 11% 7%
Belgium -0.117 1.19 26% 10%
Portugal -0.110 0.62 15% 9%
Germany -0.068ns 0.61ns 17% 10%
Denmark -0.066ns 0.28ns 16% 13%
France -0.036ns 0.36ns 16% 11%
Austria -0.005ns -0.04ns 13% 13%
Greece 0.079ns -0.54ns 3% 6%
Note: Other variables from Table 11 included but not shown. ns = not significant (p>0.05).
Given that the overall number of mothers who did not live with a partnervaried so much between countries, the effect of age at first birth is best readfrom the coefficients in the first two columns of the table. Ireland turned outto be the country where women’s marital status was most strongly associatedwith the timing of their first child. Teenage mothers there were five timesmore likely to be lone parents as mothers starting their families in theirtwenties and thirties. (Remember throughout this analysis that lone parentsincludes separated and divorced mothers as well as single mothers.) Therewere very strong effects, too, in Spain, the UK and Italy, followed by a seriesof countries, listed from Finland to Portugal, with clear if less extremeassociations. At the lower end of the table, the relationship became less clear,down eventually to Austria and Greece where teenage motherhood seemed tomake no difference at all.
The effects of education
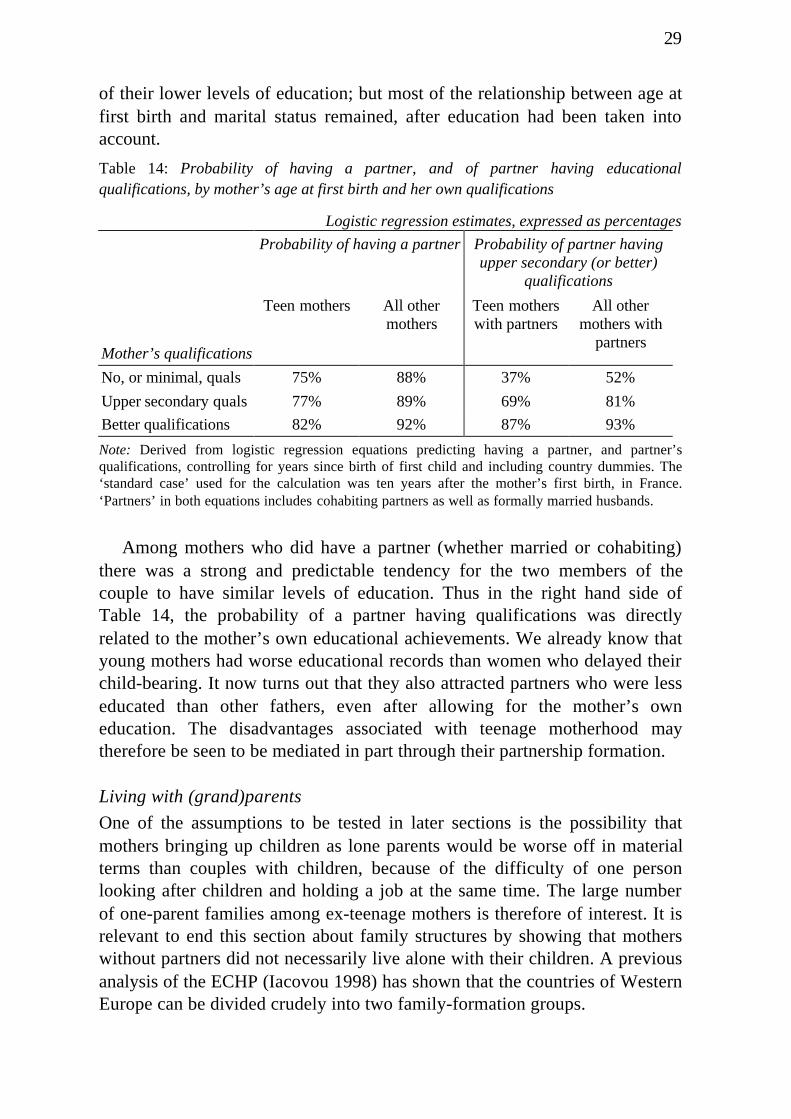
In the previous section it was shown that women who had children earlytended to have lower levels of educational qualifications than those who putoff starting a family. Detailed analysis suggests that women with bettereducation were slightly more likely to have a partner than less-well-educatedwomen, controlling for age at first birth (left hand side of Table 14). Thus partof the tendency of early-mothers to be lone parents may be explained in terms
29
of their lower levels of education; but most of the relationship between age atfirst birth and marital status remained, after education had been taken intoaccount.
Table 14: Probability of having a partner, and of partner having educationalqualifications, by mother’s age at first birth and her own qualifications
Logistic regression estimates, expressed as percentages
Probability of having a partner Probability of partner havingupper secondary (or better)
qualifications
Mother’s qualifications
Teen mothers All othermothers
Teen motherswith partners
All othermothers with
partners
No, or minimal, quals 75% 88% 37% 52%
Upper secondary quals 77% 89% 69% 81%
Better qualifications 82% 92% 87% 93%
Note: Derived from logistic regression equations predicting having a partner, and partner’squalifications, controlling for years since birth of first child and including country dummies. The‘standard case’ used for the calculation was ten years after the mother’s first birth, in France.‘Partners’ in both equations includes cohabiting partners as well as formally married husbands.
Among mothers who did have a partner (whether married or cohabiting)there was a strong and predictable tendency for the two members of thecouple to have similar levels of education. Thus in the right hand side ofTable 14, the probability of a partner having qualifications was directlyrelated to the mother’s own educational achievements. We already know thatyoung mothers had worse educational records than women who delayed theirchild-bearing. It now turns out that they also attracted partners who were lesseducated than other fathers, even after allowing for the mother’s owneducation. The disadvantages associated with teenage motherhood maytherefore be seen to be mediated in part through their partnership formation.
Living with (grand)parents
One of the assumptions to be tested in later sections is the possibility thatmothers bringing up children as lone parents would be worse off in materialterms than couples with children, because of the difficulty of one personlooking after children and holding a job at the same time. The large numberof one-parent families among ex-teenage mothers is therefore of interest. It isrelevant to end this section about family structures by showing that motherswithout partners did not necessarily live alone with their children. A previousanalysis of the ECHP (Iacovou 1998) has shown that the countries of WesternEurope can be divided crudely into two family-formation groups.
30
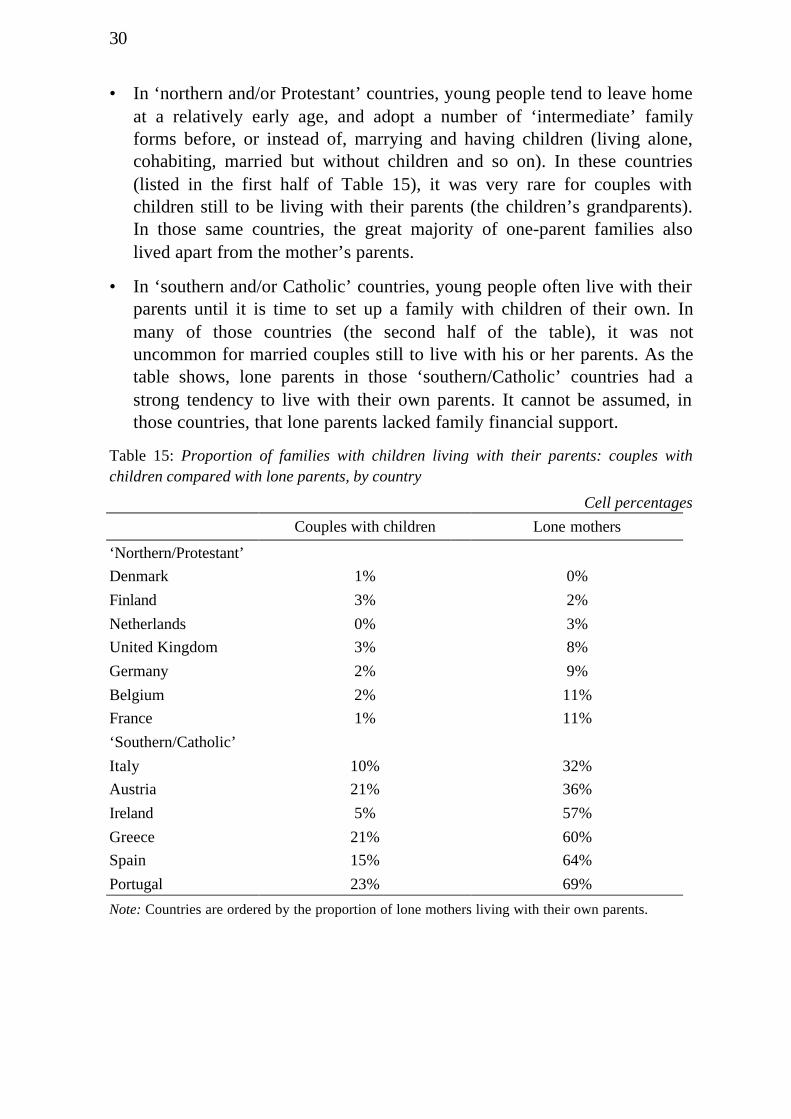
• In ‘northern and/or Protestant’ countries, young people tend to leave homeat a relatively early age, and adopt a number of ‘intermediate’ familyforms before, or instead of, marrying and having children (living alone,cohabiting, married but without children and so on). In these countries(listed in the first half of Table 15), it was very rare for couples withchildren still to be living with their parents (the children’s grandparents).In those same countries, the great majority of one-parent families alsolived apart from the mother’s parents.
• In ‘southern and/or Catholic’ countries, young people often live with theirparents until it is time to set up a family with children of their own. Inmany of those countries (the second half of the table), it was notuncommon for married couples still to live with his or her parents. As thetable shows, lone parents in those ‘southern/Catholic’ countries had astrong tendency to live with their own parents. It cannot be assumed, inthose countries, that lone parents lacked family financial support.
Table 15: Proportion of families with children living with their parents: couples withchildren compared with lone parents, by country
Cell percentages
Couples with children Lone mothers
‘Northern/Protestant’
Denmark 1% 0%
Finland 3% 2%
Netherlands 0% 3%
United Kingdom 3% 8%
Germany 2% 9%
Belgium 2% 11%
France 1% 11%
‘Southern/Catholic’
Italy 10% 32%
Austria 21% 36%
Ireland 5% 57%
Greece 21% 60%
Spain 15% 64%
Portugal 23% 69%
Note: Countries are ordered by the proportion of lone mothers living with their own parents.
31
6. EmploymentThere are few better indicators of current prosperity and future life chancesthan whether a woman or her partner (where a partner exists) is in paidemployment. There are two distinct issues to be examined: whether themother herself works and whether any member of the family unit works.These two questions will be analysed in turn, focusing always on differencesbetween mothers and families according to the age at which she had her firstchild.
Mothers’ employment
The employment status of mothers varies according to many circumstances.For the lone parents identified in the previous section, the mother may be theonly source of earnings. In couples, there are two potential earners, and themother’s earnings may not be seen to be so crucial. Nevertheless, there areissues to be resolved: between the traditional belief that women with childrenshould remain at home or have minimal participation in the workforce, on theone hand; and the need to increase the family income and maintain a sense ofpersonal economic independence, on the other. The resolution of these issuesvaries widely between countries – the employment rate of women with both apartner and children ranged from one third in Spain to three-quarters inFinland.
Although women with children were less likely to work than all otherwomen, the focus of the analysis here is whether women who were teenagemothers were less likely to be employed than other mothers. Our overallanalyses suggested that early childbearing decreased the likelihood of awoman being in employment, and that it was not necessarily having a baby asa teenager that put her at a disadvantage. We have shown that youngparenthood is associated with curtailed educational attainment and increasedlikelihood of lone parenthood, which, taken together, help explain whywomen who had their first birth at a young age were less likely to be inemployment. In Table 16, we begin by presenting the percentage of womenwith children in employment, grouped by age at first birth, for all of theEuropean countries considered in this analysis. Women who had their firstbirths as teenagers were less likely to be in employment than women in allother age-at-first-birth categories.
It should be noted that employment dropped among women who hadchildren later than their early thirties, however, and this may represent acohort effect in which earlier generations of women were less likely tocombine work and motherhood. As previously established, the technique foridentifying age at first birth meant that woman who had babies at later ages
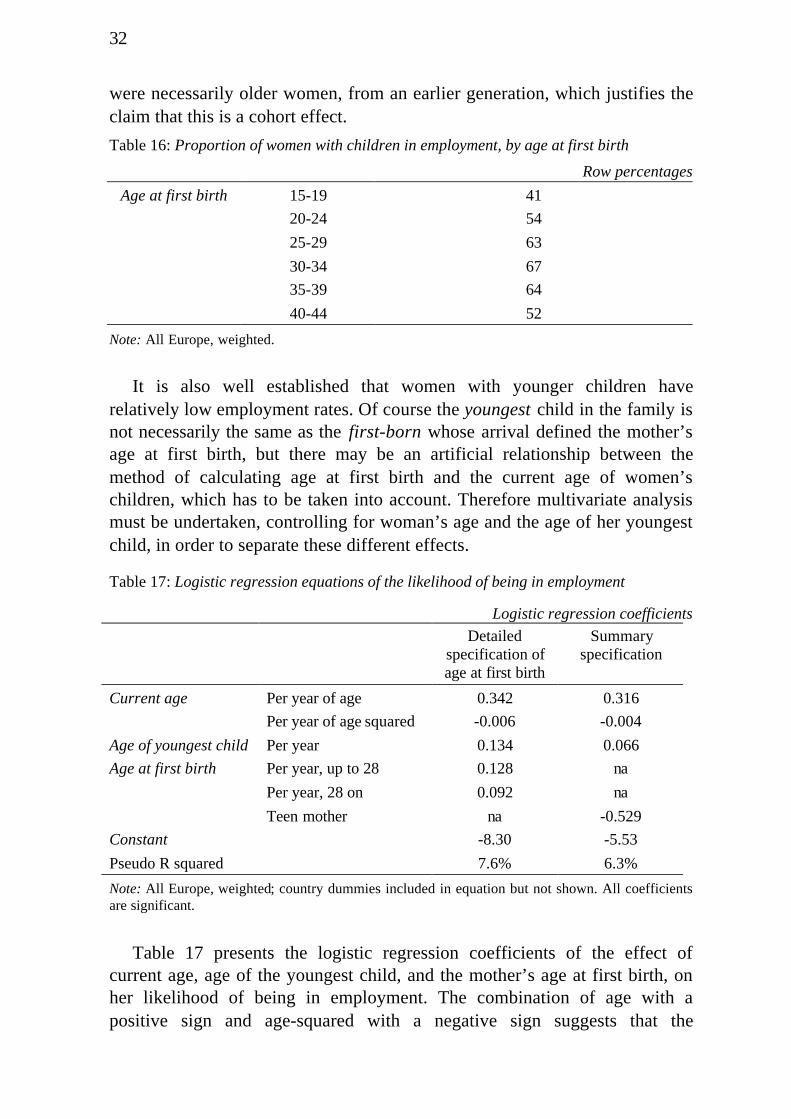
32
were necessarily older women, from an earlier generation, which justifies theclaim that this is a cohort effect.
Table 16: Proportion of women with children in employment, by age at first birth
Row percentages
Age at first birth 15-19 41
20-24 54
25-29 63
30-34 67
35-39 64
40-44 52
Note: All Europe, weighted.
It is also well established that women with younger children haverelatively low employment rates. Of course the youngest child in the family isnot necessarily the same as the first-born whose arrival defined the mother’sage at first birth, but there may be an artificial relationship between themethod of calculating age at first birth and the current age of women’schildren, which has to be taken into account. Therefore multivariate analysismust be undertaken, controlling for woman’s age and the age of her youngestchild, in order to separate these different effects.
Table 17: Logistic regression equations of the likelihood of being in employment
Logistic regression coefficientsDetailed
specification ofage at first birth
Summaryspecification
Current age Per year of age 0.342 0.316
Per year of age squared -0.006 -0.004
Age of youngest child Per year 0.134 0.066
Age at first birth Per year, up to 28 0.128 na
Per year, 28 on 0.092 na
Teen mother na -0.529
Constant -8.30 -5.53
Pseudo R squared 7.6% 6.3%
Note: All Europe, weighted; country dummies included in equation but not shown. All coefficientsare significant.
Table 17 presents the logistic regression coefficients of the effect ofcurrent age, age of the youngest child, and the mother’s age at first birth, onher likelihood of being in employment. The combination of age with apositive sign and age-squared with a negative sign suggests that the

33
relationship between likelihood of employment and age was curved, ratherthan linear. In other words, women’s likelihood of being in paid employmentincreased over the twenties, flattened off in the late twenties and early thirties,and then started to decrease again. Age of youngest child was also statisticallysignificant, suggesting that the older the youngest child was, the more likely awoman was to be in employment. Conversely, the younger the child, the lesslikely the mother was to work. Perhaps surprisingly, variations inemployment rates continued right through the children’s age-range from birthto 18; there was no strong kink in the relationship at about the time childrenstart going to school.
As before, two measures of age at first birth are presented: the ‘spline’previously discussed which distinguishes individual age-years up to, and thenbeyond, 28; and the variable that simply compares women who gave birth asa teenager with all other mothers. Both were statistically significant. Thespline (left hand column) shows that the logistic function of the likelihood ofemployment increased for each additional year of age at first birth by 0.128until the age of 28, then continued to increase by 0.092 for every year afterage 28. Conversely, being a teen mother significantly reduced the likelihoodof employment. Note that the relationships between age at first birth andeducation and family structure (in the previous sections) were both limited tothe period up to 28, and for those outcomes there was no significantassociation over the later period. Now the analysis of employment shows thata mother’s chance of a job continued to increase, the later she had her firstchild, though less steeply than in the earlier period.
In order to determine whether these effects differed by country, a countryby country analysis was undertaken of the effect on mothers’ employment ofteenage motherhood, age of youngest child, and the age terms. Table 18displays the results of this analysis. The most striking finding is that earlyparenthood reduced the likelihood of women’s employment in only nine ofthe countries considered here. The association was strongest in France andBelgium, but there was no evidence of any link in Finland, Greece, Denmarkor Austria. If the simpler specification is used, the predicted proportion ofemployed former teenage mothers in France was only 36 per cent, comparedto 60 per cent of all other mothers. The Netherlands, Spain, Italy and Portugaldrop out of the group of countries where teen mothers were found to bedisadvantaged with respect to other mothers. It was only a minority ofcountries, therefore, where the simple comparison of teenage mothers withother mothers provided clear evidence of reduced employment prospects.
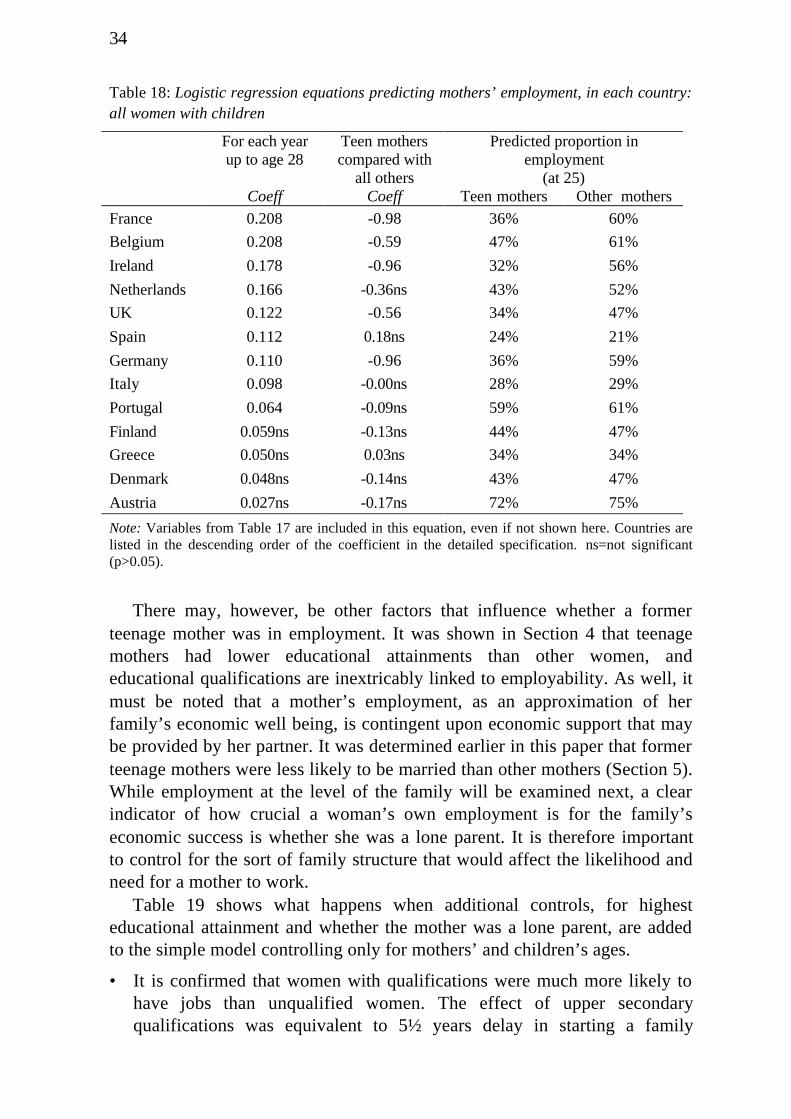
34
Table 18: Logistic regression equations predicting mothers’ employment, in each country:all women with children
For each yearup to age 28
Teen motherscompared with
all others
Predicted proportion inemployment
(at 25)Coeff Coeff Teen mothers Other mothers
France 0.208 -0.98 36% 60%
Belgium 0.208 -0.59 47% 61%
Ireland 0.178 -0.96 32% 56%
Netherlands 0.166 -0.36ns 43% 52%
UK 0.122 -0.56 34% 47%
Spain 0.112 0.18ns 24% 21%
Germany 0.110 -0.96 36% 59%
Italy 0.098 -0.00ns 28% 29%
Portugal 0.064 -0.09ns 59% 61%
Finland 0.059ns -0.13ns 44% 47%
Greece 0.050ns 0.03ns 34% 34%
Denmark 0.048ns -0.14ns 43% 47%
Austria 0.027ns -0.17ns 72% 75%
Note: Variables from Table 17 are included in this equation, even if not shown here. Countries arelisted in the descending order of the coefficient in the detailed specification. ns=not significant(p>0.05).
There may, however, be other factors that influence whether a formerteenage mother was in employment. It was shown in Section 4 that teenagemothers had lower educational attainments than other women, andeducational qualifications are inextricably linked to employability. As well, itmust be noted that a mother’s employment, as an approximation of herfamily’s economic well being, is contingent upon economic support that maybe provided by her partner. It was determined earlier in this paper that formerteenage mothers were less likely to be married than other mothers (Section 5).While employment at the level of the family will be examined next, a clearindicator of how crucial a woman’s own employment is for the family’seconomic success is whether she was a lone parent. It is therefore importantto control for the sort of family structure that would affect the likelihood andneed for a mother to work.
Table 19 shows what happens when additional controls, for highesteducational attainment and whether the mother was a lone parent, are addedto the simple model controlling only for mothers’ and children’s ages.
• It is confirmed that women with qualifications were much more likely tohave jobs than unqualified women. The effect of upper secondaryqualifications was equivalent to 5½ years delay in starting a family
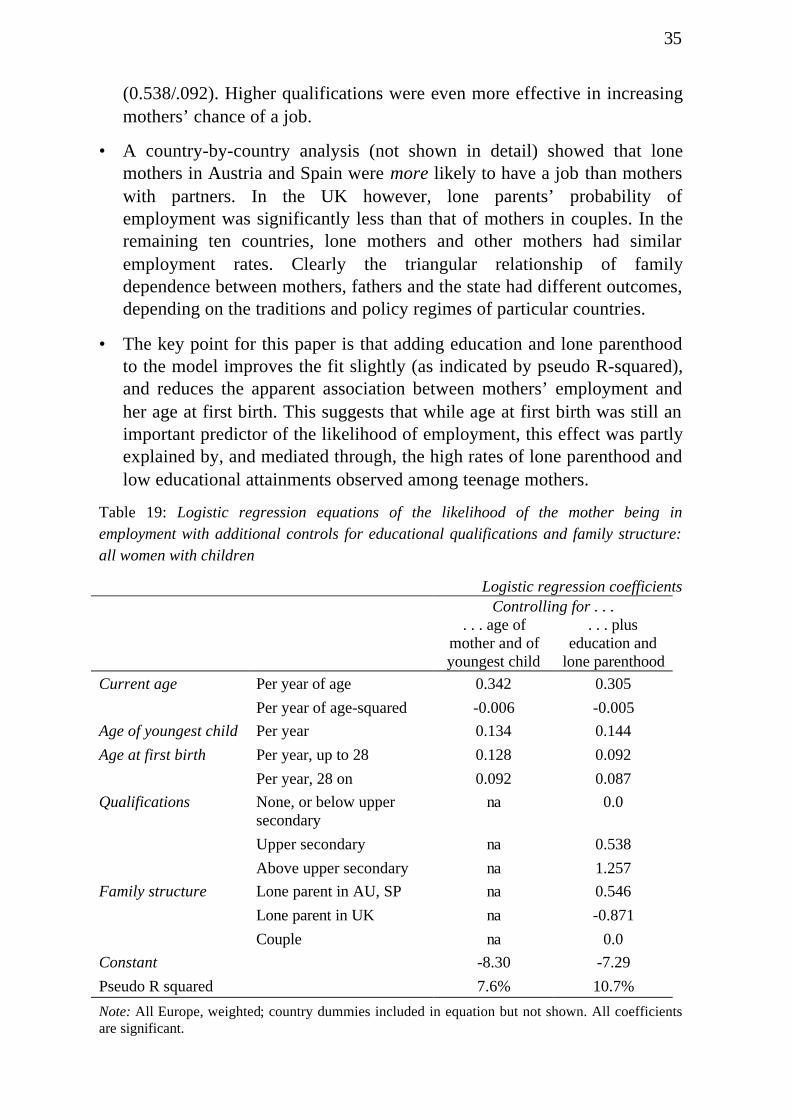
35
(0.538/.092). Higher qualifications were even more effective in increasingmothers’ chance of a job.
• A country-by-country analysis (not shown in detail) showed that lonemothers in Austria and Spain were more likely to have a job than motherswith partners. In the UK however, lone parents’ probability ofemployment was significantly less than that of mothers in couples. In theremaining ten countries, lone mothers and other mothers had similaremployment rates. Clearly the triangular relationship of familydependence between mothers, fathers and the state had different outcomes,depending on the traditions and policy regimes of particular countries.
• The key point for this paper is that adding education and lone parenthoodto the model improves the fit slightly (as indicated by pseudo R-squared),and reduces the apparent association between mothers’ employment andher age at first birth. This suggests that while age at first birth was still animportant predictor of the likelihood of employment, this effect was partlyexplained by, and mediated through, the high rates of lone parenthood andlow educational attainments observed among teenage mothers.
Table 19: Logistic regression equations of the likelihood of the mother being inemployment with additional controls for educational qualifications and family structure:all women with children
Logistic regression coefficientsControlling for . . .
. . . age ofmother and ofyoungest child
. . . pluseducation and
lone parenthood
Current age Per year of age 0.342 0.305
Per year of age-squared -0.006 -0.005
Age of youngest child Per year 0.134 0.144
Age at first birth Per year, up to 28 0.128 0.092
Per year, 28 on 0.092 0.087
Qualifications None, or below uppersecondary
na 0.0
Upper secondary na 0.538
Above upper secondary na 1.257
Family structure Lone parent in AU, SP na 0.546
Lone parent in UK na -0.871
Couple na 0.0
Constant -8.30 -7.29
Pseudo R squared 7.6% 10.7%
Note: All Europe, weighted; country dummies included in equation but not shown. All coefficientsare significant.
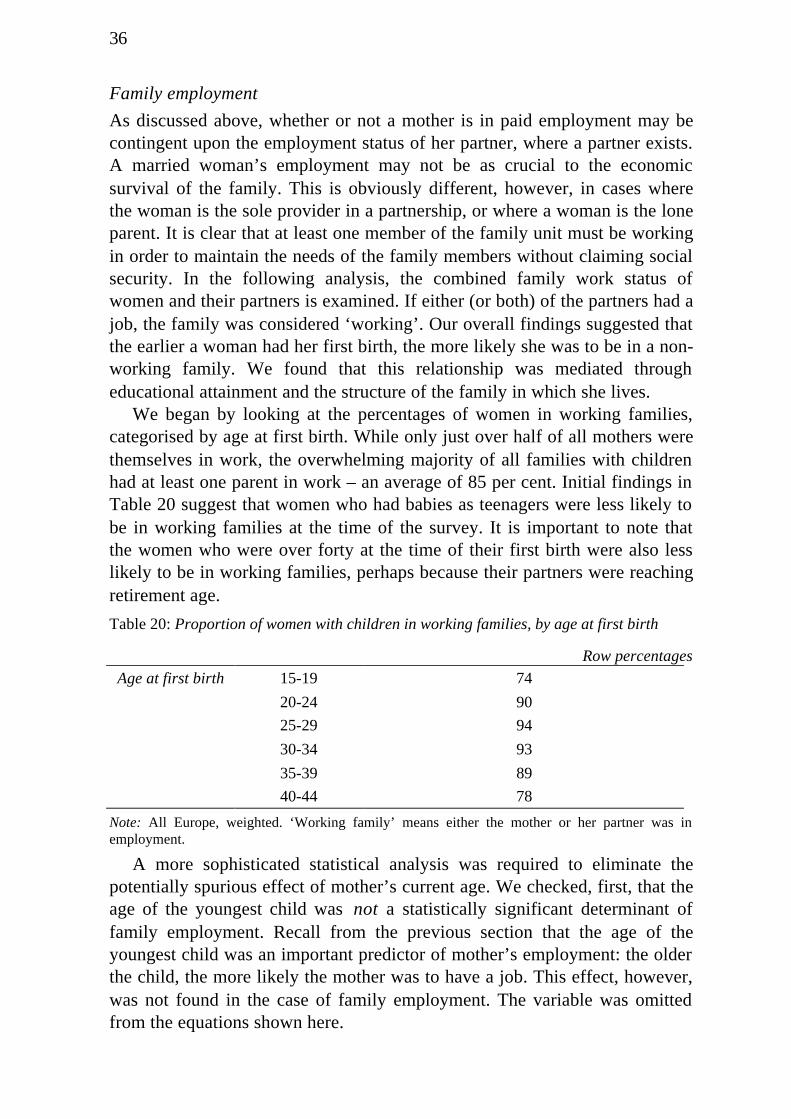
36
Family employment
As discussed above, whether or not a mother is in paid employment may becontingent upon the employment status of her partner, where a partner exists.A married woman’s employment may not be as crucial to the economicsurvival of the family. This is obviously different, however, in cases wherethe woman is the sole provider in a partnership, or where a woman is the loneparent. It is clear that at least one member of the family unit must be workingin order to maintain the needs of the family members without claiming socialsecurity. In the following analysis, the combined family work status ofwomen and their partners is examined. If either (or both) of the partners had ajob, the family was considered ‘working’. Our overall findings suggested thatthe earlier a woman had her first birth, the more likely she was to be in a non-working family. We found that this relationship was mediated througheducational attainment and the structure of the family in which she lives.
We began by looking at the percentages of women in working families,categorised by age at first birth. While only just over half of all mothers werethemselves in work, the overwhelming majority of all families with childrenhad at least one parent in work – an average of 85 per cent. Initial findings inTable 20 suggest that women who had babies as teenagers were less likely tobe in working families at the time of the survey. It is important to note thatthe women who were over forty at the time of their first birth were also lesslikely to be in working families, perhaps because their partners were reachingretirement age.
Table 20: Proportion of women with children in working families, by age at first birth
Row percentagesAge at first birth 15-19 74
20-24 90
25-29 94
30-34 93
35-39 89
40-44 78
Note: All Europe, weighted. ‘Working family’ means either the mother or her partner was inemployment.
A more sophisticated statistical analysis was required to eliminate thepotentially spurious effect of mother’s current age. We checked, first, that theage of the youngest child was not a statistically significant determinant offamily employment. Recall from the previous section that the age of theyoungest child was an important predictor of mother’s employment: the olderthe child, the more likely the mother was to have a job. This effect, however,was not found in the case of family employment. The variable was omittedfrom the equations shown here.

37
The all-Europe analysis confirmed that age was an important predictor offamily employment (Table 21). Because the age-squared term had a negativesign, this suggested that the likelihood of employment increased with age upuntil a certain point, and then decreased – the same shape as observed formothers’ own employment. This is consistent with the interpretation madefrom the previous table that older families were less likely to have a workingmember as they were closer to retirement age.
As with previous sections, we employed two measures of age at first birth:the ‘spline’ (described earlier) and whether or not the woman was a teenagemother. The results indicated that the likelihood of family employmentincreased by 0.136 for each year’s delay in starting until age 28. This lendssupport to the hypothesis that younger mothers were less likely to be inemployed families. The coefficient up to 28 was very similar to that observedfor mothers’ employment. There was, however, a decrease in the likelihood offamily employment for each year’s delay in starting after age 28, in contrastto the continued positive association between age at first birth and mothers’own employment. The simpler measure confirmed that former teenagemothers are significantly less likely to be in working families than womenthat had their first children later in life.
Table 21: Logistic regression equations of the likelihood of family employment: all womenwith children
Logistic regression coefficientsDetailed
specification ofage at first birth
Summaryspecification
Current age Per year of age 0.395 0.495
Per year of age-squared -0.005 -0.007
Age at first birth Per year, up to 28 0.136 na
Per year, 28 on -.085 na
Teen mother na -0.860
Constant -7.76 -6.31
Pseudo R squared 9.7% 9.1%
Note: All Europe, weighted; country dummies included in equation but not shown. All coefficientsare significant.
Table 22 displays the country by country results of the logistic regressionof family employment on age, age squared, and the age at first birth measures.The first column shows the logistic regression coefficients for the continuousmeasure of age at first birth up to 28. The coefficient was positive for the firsteight countries listed in the table, indicating that there was an increase in thelikelihood of family employment for every additional year of age at first birthuntil age 28. This variable had no effect on family employment in Italy,

38
Finland, Greece, Germany or Austria. Three of these five countries were alsoamong the five where there was no effect on mothers’ employment.
The variable that measured whether or not a woman was a teenage motherat first birth produced very similar results, except that Germany and Italy nowappear among the countries where teenage motherhood was significantlyassociated with disadvantage. The next columns to the right illustrate theprobabilities that mothers would be in working families at age twenty-five.Where the coefficient for having been a teenage mother was strongest, theNetherlands, the probability of a former teenage mother being in an employedfamily was only 62 per cent compared to 89 per cent of other mothers.
Overall, Table 22 displays results consistent with what may have beenexpected: former teenage mothers were more likely to be in non-employedfamilies compared to woman who had their first child later in life. It shouldbe pointed out, however, that neither measure of age at first birth predictedfamily employment in Finland, Austria, and Greece.
Table 22: Logistic regression equations predicting family employment, in each country
For each yearup to age 28
Teen motherscompared with
all others
Predicted proportion inemployment
(at 25)Coeff Coeff Teen mothers Other mothers
Ireland 0.247 -0.96 51% 73%
Belgium 0.221 -0.70 73% 85%
UK 0.209 -0.95 52% 74%
Netherlands 0.201 -1.63 62% 89%
France 0.199 -0.83 77% 88%
Denmark 0.143 -0.94 75% 89%
Portugal 0.112 -0.70 91% 96%
Spain 0.111 -0.38ns 68% 76%
Italy 0.057ns -0.77 80% 90%
Finland 0.045ns 0.25ns 82% 78%
Greece -0.003ns 0.36ns 93% 92%
Germany -0.009ns -1.29 71% 90%
Austria -0.010ns 0.09ns 93% 94%
Note: Variables from Table 21 are included in this equation, even if not shown here. Countries arelisted in the descending order of the coefficient in the detailed specification. ns=not significant(p>0.05).
In order to determine whether the disadvantage associated with earlyparenthood could be explained by the other outcomes already analysed, weadded educational attainments and marital status to the logistic regressionequation (Table 23).
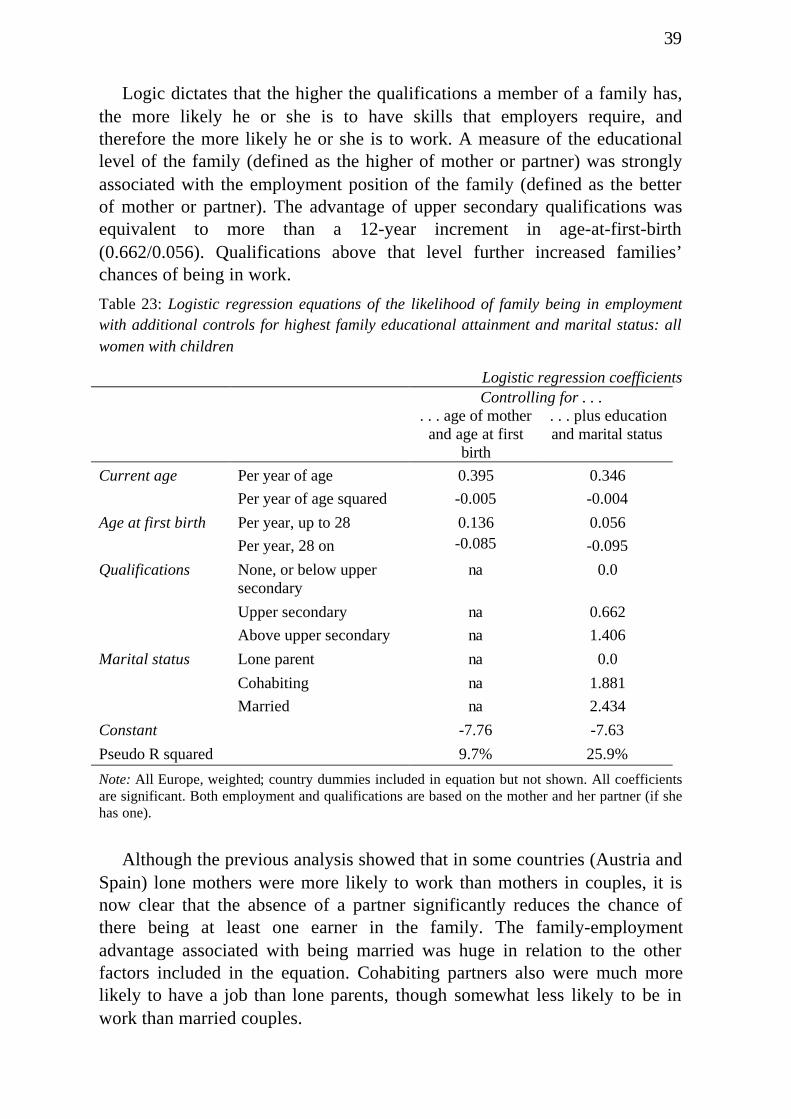
39
Logic dictates that the higher the qualifications a member of a family has,the more likely he or she is to have skills that employers require, andtherefore the more likely he or she is to work. A measure of the educationallevel of the family (defined as the higher of mother or partner) was stronglyassociated with the employment position of the family (defined as the betterof mother or partner). The advantage of upper secondary qualifications wasequivalent to more than a 12-year increment in age-at-first-birth(0.662/0.056). Qualifications above that level further increased families’chances of being in work.
Table 23: Logistic regression equations of the likelihood of family being in employmentwith additional controls for highest family educational attainment and marital status: allwomen with children
Logistic regression coefficientsControlling for . . .
. . . age of motherand age at first
birth
. . . plus educationand marital status
Current age Per year of age 0.395 0.346
Per year of age squared -0.005 -0.004
Age at first birth Per year, up to 28 0.136 0.056
Per year, 28 on -0.085 -0.095
Qualifications None, or below uppersecondary
na 0.0
Upper secondary na 0.662
Above upper secondary na 1.406
Marital status Lone parent na 0.0
Cohabiting na 1.881
Married na 2.434
Constant -7.76 -7.63
Pseudo R squared 9.7% 25.9%
Note: All Europe, weighted; country dummies included in equation but not shown. All coefficientsare significant. Both employment and qualifications are based on the mother and her partner (if shehas one).
Although the previous analysis showed that in some countries (Austria andSpain) lone mothers were more likely to work than mothers in couples, it isnow clear that the absence of a partner significantly reduces the chance ofthere being at least one earner in the family. The family-employmentadvantage associated with being married was huge in relation to the otherfactors included in the equation. Cohabiting partners also were much morelikely to have a job than lone parents, though somewhat less likely to be inwork than married couples.
40
Taking account of these factors significantly reduced the apparent effectsof age at first birth on family employment. The gradient per year up to age 28fell from 0.136 to 0.056. This suggests that a large part of the ‘age at firstbirth’ effect was mediated through education and marital status. That is,young mothers and their families were still worse off than women whodelayed their parenting: this is partly because they (and their partners) hadpoorer educational qualifications; partly because they were less likely to bemarried; and partly because of a remaining effect associated with teenagemotherhood, unexplained by these other factors.
7. IncomeDefining poor householdsThe preceding section established that family employment was associatedwith mothers’ age at first birth in some European Union countries, thoughthere was no apparent relationship in others. The ECHP also provides dataabout income, and it is therefore possible to undertake a direct analysis of thelinks between early fertility and poverty.
Income and poverty analyses are usually based on the combined income ofa whole household, on the grounds that resources are often shared betweenhousehold members rather than retained for the sole use of the person whoearned them, and it is not possible to work out exactly how much eachindividual benefits. Many ‘families’ (i.e. partners and children) live inindependent ‘households’, so that for them family income and householdincome come to the same thing. On the other hand (as was shown in Table15) many families, especially in southern Europe, live in more complexhouseholds, often including the older generation; for them household incomeincludes the income of the other residents. The ECHP collected informationfrom all household members about a range of sources of income (earnings,social security benefits, pensions and so on), covering the calendar year priorto the interview.15 These were added together across all sources and allhousehold members, and taxes were subtracted.
Total net household income was then divided by an equivalence scalewhich took account of the number of adults and the number of children in thehousehold (again including all generations), among whom the income has tobe spread. In common with most international comparisons, the OECDequivalence scale has been used which takes a value of 1.0 for a single personhousehold, and adds 0.7 for each additional adult and 0.5 for each child. Thisneeds-adjusted income is known as ‘equivalent income’.
15 That is, January to December 1995, for the 1996 survey.

41
Within each country, we have identified the one-fifth of individuals withthe lowest equivalent household incomes, and labeled them ‘poor’.16 Notethat this calculation has been done within each country, rather than across allcountries; and that it has been based on all adults and children in the sample,not just the families with dependent children who were the subject of detailedanalysis. This provided us with a purely relative measure of poverty, whichwas, by definition, equally frequent in each country; this facilitatescomparisons between countries in the effect of age at first birth.
It might be thought that low income and lack of employment could be soclosely related as to represent almost the same thing. It is true that nearly twothirds (57 per cent) of the families with children in which neither the mothernor the father had a job, were in the bottom fifth of their national householdincome distribution. These were a minority of the poor, though – among thosewho did have a job, their combined earnings, divided by the needs assessmentimplied by the equivalence scale, still left 16 per cent of them below thepoverty threshold used for this analysis
Proportion of families in poverty
Although the poverty line defined 20 per cent of the population of eachcountry as living in ‘poor’ households, families with children had a ratherhigher-than-average rate of poverty in many countries. As the left-hand sideof Table 24 shows, teenage mothers and their families were substantiallymore likely to be in poverty than women who had children later.
Table 24: Proportion of families with children in lowest one-fifth of their national incomedistribution, by age of mother at first birth, and her age at the time of the interview
Row percentagesAge at first birth Age at time of
interview15 to 19 45 15 to 19 54
20 to 24 26 20 to 24 42
25 to 29 16 25 to 29 27
30 to 34 13 30 to 34 23
35 to 39 13 35 to 39 16
40 to 44 20 40 to 44 15
45 to 49 18
50 to 54 19
55 to 59 40
Note: Income is annual net household equivalent income.
16 A more commonly used conventional poverty line is half national average income. We did notuse the latter measure because the rate of poverty varied more between countries. About 14 percent of the population of Europe would have been as identified as poor on the half-averagecalculation.

42
The straightforwardly calculated risk of poverty was lowest for familieswhose mother started in her late twenties or early thirties, but then rose againfor women whose children were born in their early forties. On the other hand,those identified as having had children later, were older when they wereinterviewed. The right hand side of Table 24 shows a similar U shapeddistribution of the proportion of families in poverty, according to the mother’scurrent age. A logistic regression analysis has been undertaken to check theinter-relationship between the two sets of apparent influences (Table 25). Theanalysis confirmed that families were less likely to be poor (negativecoefficient) the older the mother was at the time of having her first child, upto the age of 28, and this was independent of any direct effect of her age at thetime of the survey. Whereas the simple table suggested an increase in povertyrisk among women who had children later on, the new analysis suggests thatthere was a continued reduction in poverty beyond first births at 28, althoughthe effect was much weaker than in the pre-28 period.
Table 25: Logistic regression analysis of the probability of being in the lowest fifth of thenational income distribution
Logistic regression coefficientsDetailed
specification of ageat first birth
Summaryspecification
Current age Per year -0.190 -0.192
Per year-squared 0.003 0.002
Age at first birth Per year, up to 28 -0.157 na
Per year, 28 on -0.018 na
Teen mother na 0.939
Constant 5.79 2.57
Pseudo R-squared 5.5% 4.0%
Note: All Europe, weighted. Country dummies are included but not shown. All coefficients aresignificant.
Although the coefficients in the logistic regression analysis do not showthis clearly, the effect of the mother’s age at the time she had her first childwas much more important an influence on the risk of poverty than her agenow. This is very clearly illustrated in Table 26, which uses the regressioncoefficients as a formula to calculate the average risk at certain specifiedpoints in the two distributions. Mothers who were 18 when their child wasborn remained at greater risk of poverty than later starters, throughout thefollowing 15 year period when their increasing age was only slightlyassociated with a reduced poverty risk. Another potentially important point isthat the teen mother’s risk of poverty was especially high in the early periodof her child-rearing – when, other research suggests, the potential ill-effects
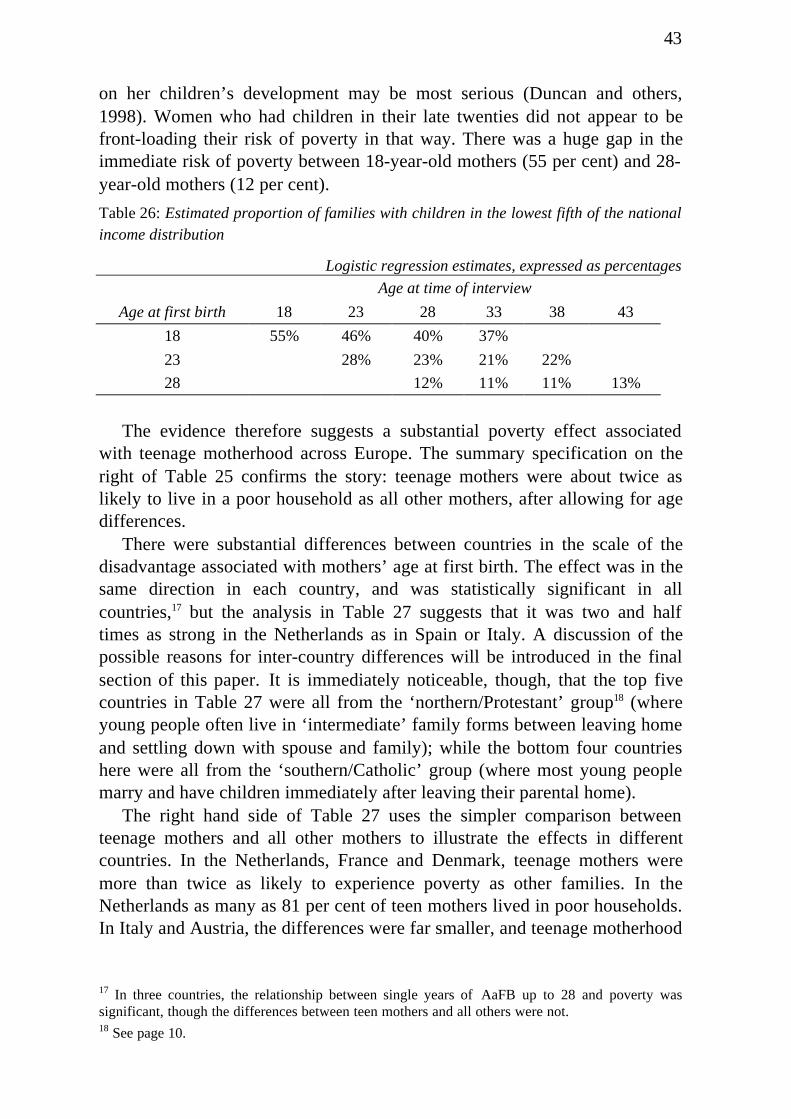
43
on her children’s development may be most serious (Duncan and others,1998). Women who had children in their late twenties did not appear to befront-loading their risk of poverty in that way. There was a huge gap in theimmediate risk of poverty between 18-year-old mothers (55 per cent) and 28-year-old mothers (12 per cent).
Table 26: Estimated proportion of families with children in the lowest fifth of the nationalincome distribution
Logistic regression estimates, expressed as percentagesAge at time of interview
Age at first birth 18 23 28 33 38 43
18 55% 46% 40% 37%
23 28% 23% 21% 22%
28 12% 11% 11% 13%
The evidence therefore suggests a substantial poverty effect associatedwith teenage motherhood across Europe. The summary specification on theright of Table 25 confirms the story: teenage mothers were about twice aslikely to live in a poor household as all other mothers, after allowing for agedifferences.
There were substantial differences between countries in the scale of thedisadvantage associated with mothers’ age at first birth. The effect was in thesame direction in each country, and was statistically significant in allcountries,17 but the analysis in Table 27 suggests that it was two and halftimes as strong in the Netherlands as in Spain or Italy. A discussion of thepossible reasons for inter-country differences will be introduced in the finalsection of this paper. It is immediately noticeable, though, that the top fivecountries in Table 27 were all from the ‘northern/Protestant’ group18 (whereyoung people often live in ‘intermediate’ family forms between leaving homeand settling down with spouse and family); while the bottom four countrieshere were all from the ‘southern/Catholic’ group (where most young peoplemarry and have children immediately after leaving their parental home).
The right hand side of Table 27 uses the simpler comparison betweenteenage mothers and all other mothers to illustrate the effects in differentcountries. In the Netherlands, France and Denmark, teenage mothers weremore than twice as likely to experience poverty as other families. In theNetherlands as many as 81 per cent of teen mothers lived in poor households.In Italy and Austria, the differences were far smaller, and teenage motherhood
17 In three countries, the relationship between single years of AaFB up to 28 and poverty wassignificant, though the differences between teen mothers and all others were not.18 See page 10.
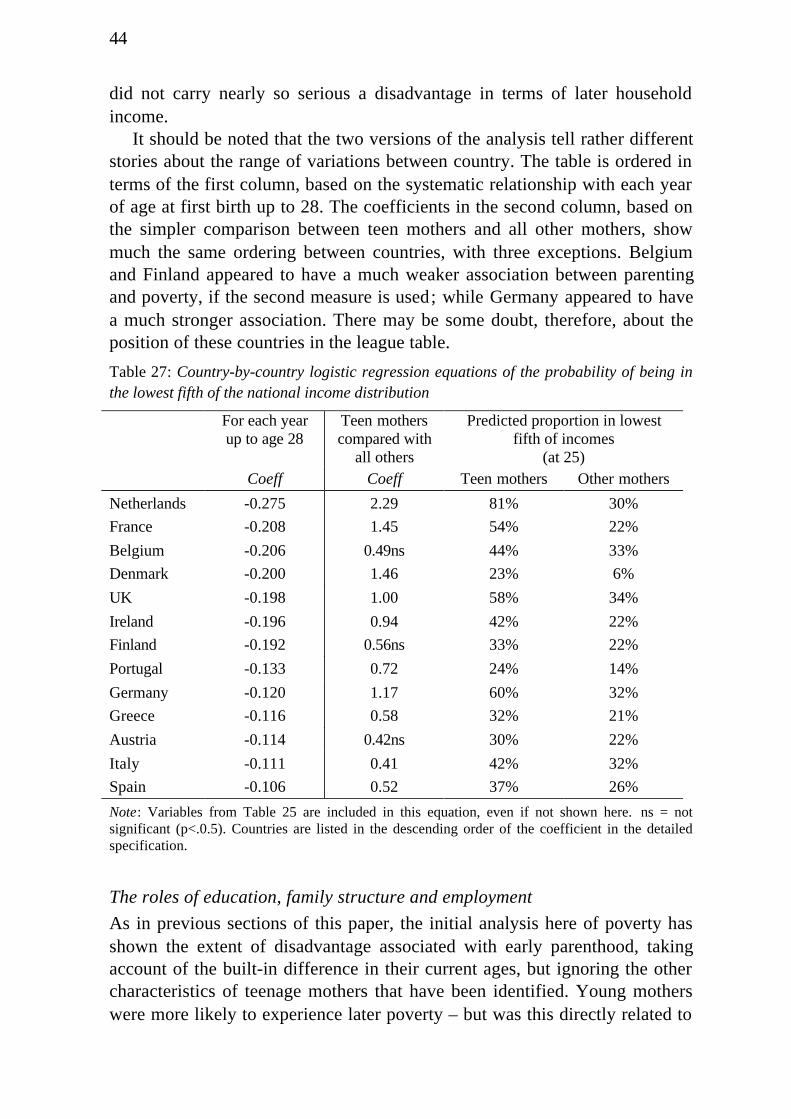
44
did not carry nearly so serious a disadvantage in terms of later householdincome.
It should be noted that the two versions of the analysis tell rather differentstories about the range of variations between country. The table is ordered interms of the first column, based on the systematic relationship with each yearof age at first birth up to 28. The coefficients in the second column, based onthe simpler comparison between teen mothers and all other mothers, showmuch the same ordering between countries, with three exceptions. Belgiumand Finland appeared to have a much weaker association between parentingand poverty, if the second measure is used; while Germany appeared to havea much stronger association. There may be some doubt, therefore, about theposition of these countries in the league table.
Table 27: Country-by-country logistic regression equations of the probability of being inthe lowest fifth of the national income distribution
For each yearup to age 28
Teen motherscompared with
all others
Predicted proportion in lowestfifth of incomes
(at 25)Coeff Coeff Teen mothers Other mothers
Netherlands -0.275 2.29 81% 30%
France -0.208 1.45 54% 22%
Belgium -0.206 0.49ns 44% 33%
Denmark -0.200 1.46 23% 6%
UK -0.198 1.00 58% 34%
Ireland -0.196 0.94 42% 22%
Finland -0.192 0.56ns 33% 22%
Portugal -0.133 0.72 24% 14%
Germany -0.120 1.17 60% 32%
Greece -0.116 0.58 32% 21%
Austria -0.114 0.42ns 30% 22%
Italy -0.111 0.41 42% 32%
Spain -0.106 0.52 37% 26%
Note: Variables from Table 25 are included in this equation, even if not shown here. ns = notsignificant (p<.0.5). Countries are listed in the descending order of the coefficient in the detailedspecification.
The roles of education, family structure and employment
As in previous sections of this paper, the initial analysis here of poverty hasshown the extent of disadvantage associated with early parenthood, takingaccount of the built-in difference in their current ages, but ignoring the othercharacteristics of teenage mothers that have been identified. Young motherswere more likely to experience later poverty – but was this directly related to
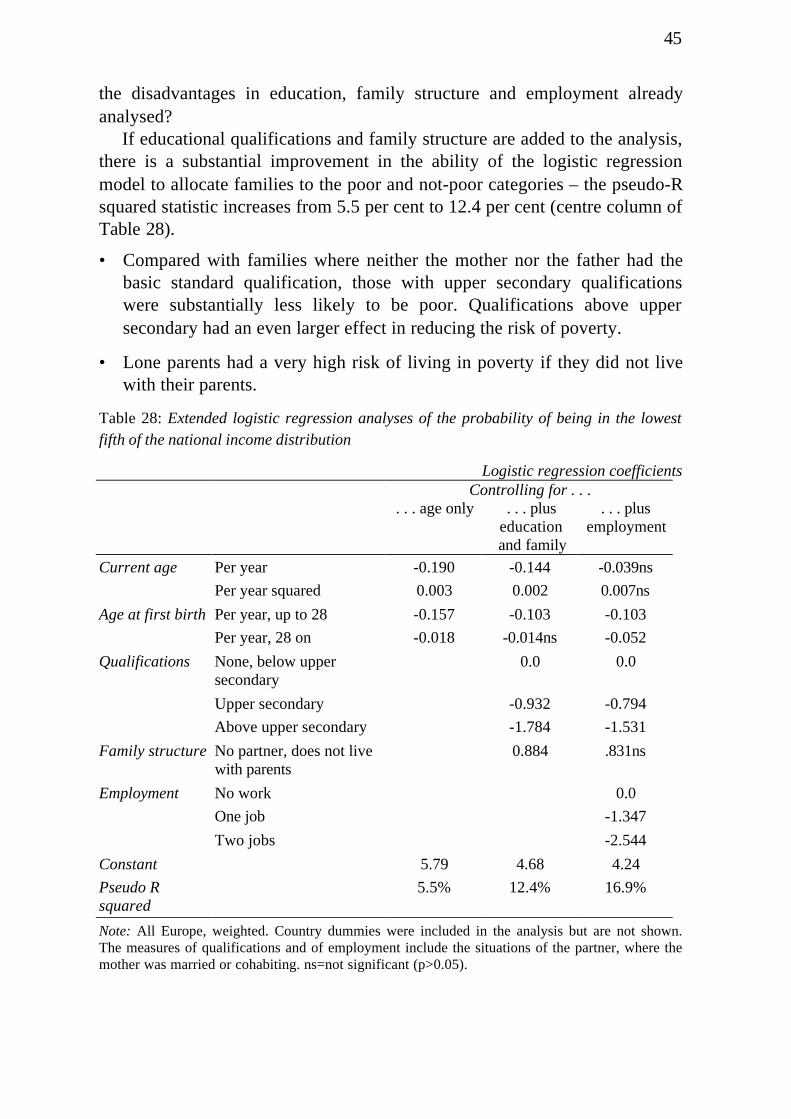
45
the disadvantages in education, family structure and employment alreadyanalysed?
If educational qualifications and family structure are added to the analysis,there is a substantial improvement in the ability of the logistic regressionmodel to allocate families to the poor and not-poor categories – the pseudo-Rsquared statistic increases from 5.5 per cent to 12.4 per cent (centre column ofTable 28).
• Compared with families where neither the mother nor the father had thebasic standard qualification, those with upper secondary qualificationswere substantially less likely to be poor. Qualifications above uppersecondary had an even larger effect in reducing the risk of poverty.
• Lone parents had a very high risk of living in poverty if they did not livewith their parents.
Table 28: Extended logistic regression analyses of the probability of being in the lowestfifth of the national income distribution
Logistic regression coefficientsControlling for . . .
. . . age only . . . pluseducation
and family
. . . plusemployment
Current age Per year -0.190 -0.144 -0.039ns
Per year squared 0.003 0.002 0.007ns
Age at first birth Per year, up to 28 -0.157 -0.103 -0.103
Per year, 28 on -0.018 -0.014ns -0.052
Qualifications None, below uppersecondary
0.0 0.0
Upper secondary -0.932 -0.794
Above upper secondary -1.784 -1.531
Family structure No partner, does not livewith parents
0.884 .831ns
Employment No work
One job
Two jobs
0.0
-1.347
-2.544
Constant 5.79 4.68 4.24
Pseudo Rsquared
5.5% 12.4% 16.9%
Note: All Europe, weighted. Country dummies were included in the analysis but are not shown.The measures of qualifications and of employment include the situations of the partner, where themother was married or cohabiting. ns=not significant (p>0.05).
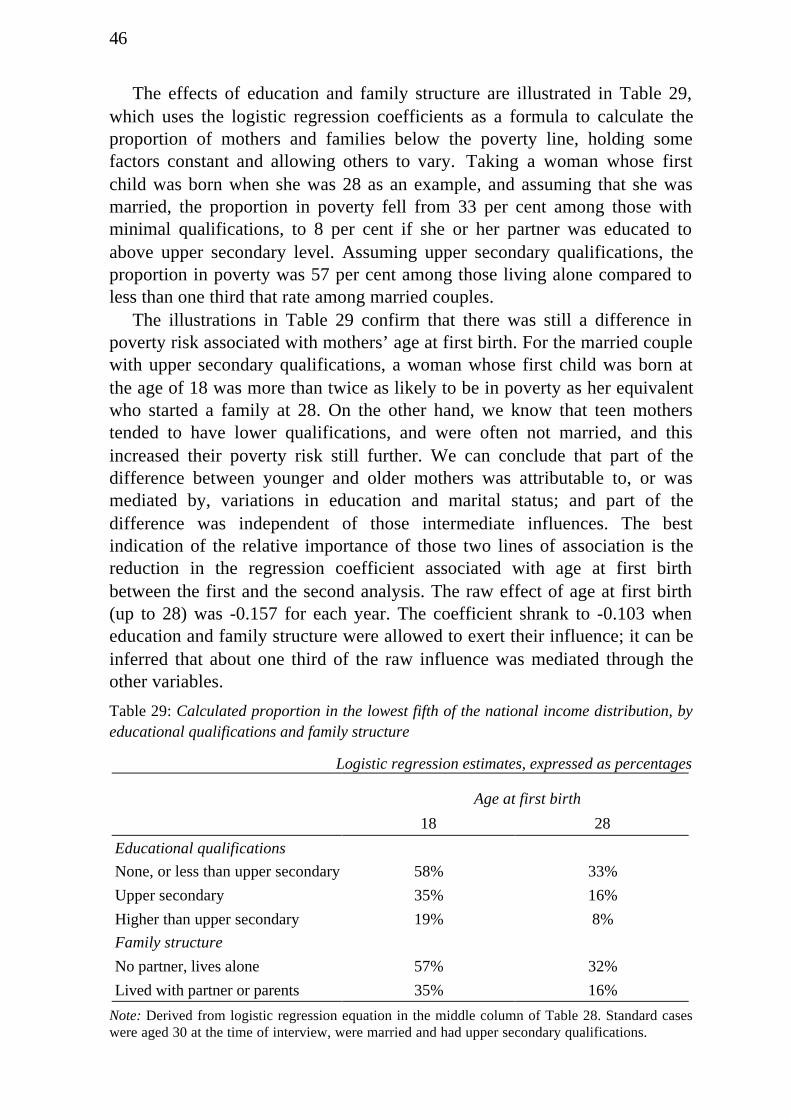
46
The effects of education and family structure are illustrated in Table 29,which uses the logistic regression coefficients as a formula to calculate theproportion of mothers and families below the poverty line, holding somefactors constant and allowing others to vary. Taking a woman whose firstchild was born when she was 28 as an example, and assuming that she wasmarried, the proportion in poverty fell from 33 per cent among those withminimal qualifications, to 8 per cent if she or her partner was educated toabove upper secondary level. Assuming upper secondary qualifications, theproportion in poverty was 57 per cent among those living alone compared toless than one third that rate among married couples.
The illustrations in Table 29 confirm that there was still a difference inpoverty risk associated with mothers’ age at first birth. For the married couplewith upper secondary qualifications, a woman whose first child was born atthe age of 18 was more than twice as likely to be in poverty as her equivalentwho started a family at 28. On the other hand, we know that teen motherstended to have lower qualifications, and were often not married, and thisincreased their poverty risk still further. We can conclude that part of thedifference between younger and older mothers was attributable to, or wasmediated by, variations in education and marital status; and part of thedifference was independent of those intermediate influences. The bestindication of the relative importance of those two lines of association is thereduction in the regression coefficient associated with age at first birthbetween the first and the second analysis. The raw effect of age at first birth(up to 28) was -0.157 for each year. The coefficient shrank to -0.103 wheneducation and family structure were allowed to exert their influence; it can beinferred that about one third of the raw influence was mediated through theother variables.
Table 29: Calculated proportion in the lowest fifth of the national income distribution, byeducational qualifications and family structure
Logistic regression estimates, expressed as percentages
Age at first birth
18 28
Educational qualifications
None, or less than upper secondary 58% 33%
Upper secondary 35% 16%
Higher than upper secondary 19% 8%
Family structure
No partner, lives alone 57% 32%
Lived with partner or parents 35% 16%
Note: Derived from logistic regression equation in the middle column of Table 28. Standard caseswere aged 30 at the time of interview, were married and had upper secondary qualifications.
47
The right hand column of Table 28 (above) shows that, as one mightexpect, having a job significantly reduced the risk of poverty, and that havingtwo jobs in the family (i.e. both parents in work) reduced it still further.Knowing which families had jobs improved the ability of the model to‘predict’ which ones would be poor. Including employment in the newequation reduced the apparent association between poverty and some of theother variables such as age and family structure; this implies that much of thevariations by age and family were mediated though employment. On the otherhand, the independent effect of the age at which mothers had their first babywas just as strong after employment was taken into account, as it had beenbefore. The indications are, therefore, that the employment characteristicsanalysed in the previous section were not important mediators in the linkbetween teenage motherhood and poverty.
Interpreting the differences between countries
It has been shown that the risk of poverty was higher among families whosemother first had children at a relatively young age – in all the countriesstudied. Table 27 showed, however, substantial differences between countriesin the extent of the disadvantage associated with mothers’ age at first birth.The coefficient in the more detailed specification (first column of the table)was nearly three times as high in the Netherlands, as it was in Italy and Spain.Including education and marital status in the analysis helped to explain someof the processes at work, but did not affect the range of variation betweencountries.
It has already been pointed out that many of the countries with thestrongest association between poverty and age at first birth were in the‘northern/Protestant group. It is useful to look for other characteristics thatmight be associated with the varying risk of poverty. This has been done inChart E. The vertical axis, ‘increased risk of poverty’, plots the countrycoefficients from the first column of Table 27 (but with negative signsreversed). It is therefore a measure of the extent to which having childrenearly rather than late increased the probability that a woman and her familywould live in a ‘poor’ household at the time of the ECHP interview(controlling for her current age), compared with women who delayed theirfirst child. It can be seen from both graphs that there were three groups ofcountries:
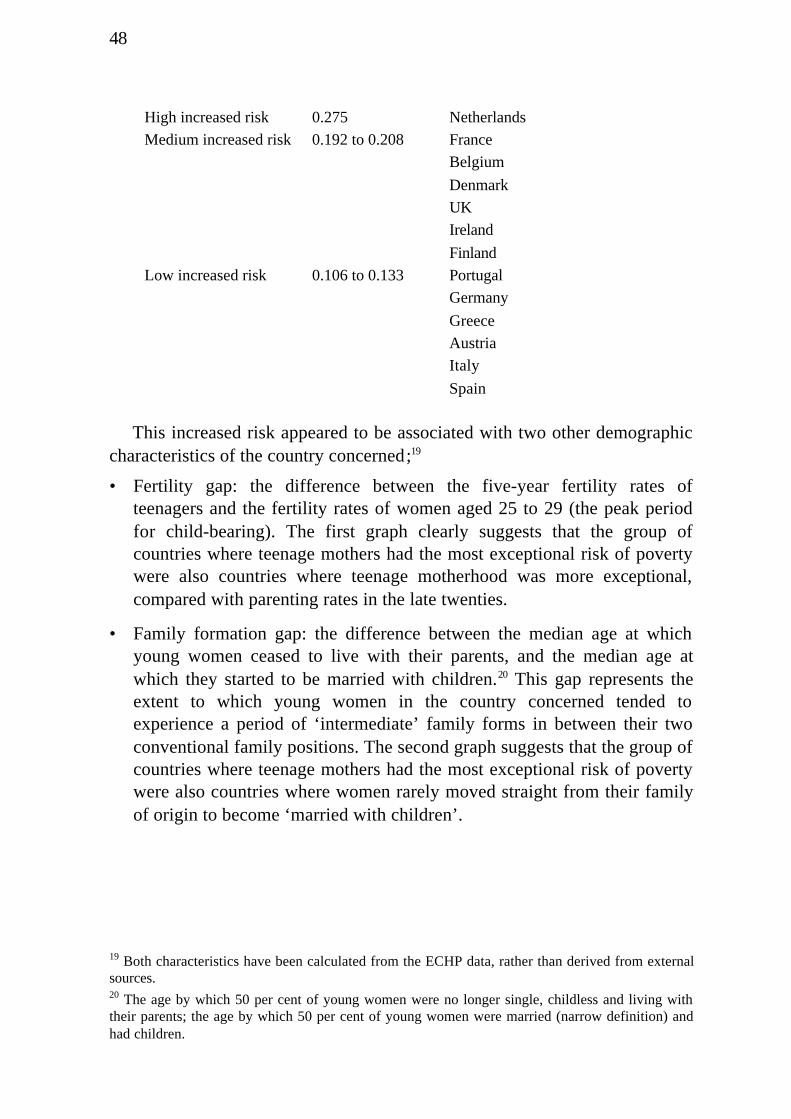
48
High increased risk 0.275 Netherlands
Medium increased risk 0.192 to 0.208 France
Belgium
Denmark
UK
Ireland
Finland
Low increased risk 0.106 to 0.133 Portugal
Germany
Greece
Austria
Italy
Spain
This increased risk appeared to be associated with two other demographiccharacteristics of the country concerned;19
• Fertility gap: the difference between the five-year fertility rates ofteenagers and the fertility rates of women aged 25 to 29 (the peak periodfor child-bearing). The first graph clearly suggests that the group ofcountries where teenage mothers had the most exceptional risk of povertywere also countries where teenage motherhood was more exceptional,compared with parenting rates in the late twenties.
• Family formation gap: the difference between the median age at whichyoung women ceased to live with their parents, and the median age atwhich they started to be married with children.20 This gap represents theextent to which young women in the country concerned tended toexperience a period of ‘intermediate’ family forms in between their twoconventional family positions. The second graph suggests that the group ofcountries where teenage mothers had the most exceptional risk of povertywere also countries where women rarely moved straight from their familyof origin to become ‘married with children’.
19 Both characteristics have been calculated from the ECHP data, rather than derived from externalsources.20 The age by which 50 per cent of young women were no longer single, childless and living withtheir parents; the age by which 50 per cent of young women were married (narrow definition) andhad children.

49
Not surprisingly, these two measures of a country’s demographic patternswere correlated with each other; but each was also independently associatedwith the increased poverty risk of young mothers.21
It is not possible to reach firm conclusions about the existence ofrelationships at the country-by-country level, when only 13 observations areavailable. The conclusions to be drawn from Chart E can only be tentative.
Chart E: Increased risk of poverty associated with early parenthood, plotted against otherdemographic characteristics of countries.
Note: See text for explanation of variables plotted. Each marker represents a country.
21 A multiple regression equation using fertility gap and family formation gap to predict increasedpoverty risk had an adjusted R squared of 63 per cent.
Increased povertyrisk
0
0.1
0.2
0.3
0 1 2 3 4 5 6 7 8 9 10 11 12Family formation gap
Increased povertyrisk
0
0.1
0.2
0.3
0 0.1 0.2 0.3 0.4 0.5 0.6 0.7 0.8Fertility gap

50
One interpretation may be that teenage motherhood is especiallyproblematic in societies where most young women leave home early, adopt anindependent lifestyle in their twenties, and then start a family some yearslater. Women who have children much younger than that are exceptional; andfind that the family and neighbourhood networks which might otherwise havesupported them are no longer available. In countries where young people areclosely tied to their families of origin, and where women quite often havechildren at a relatively young age, teenage mothers are less isolated. Thesefactors help to explain why early parenting is more disadvantaging in‘northern/Protestant’ Europe, where the gap between leaving home andstarting a family is widest (Iacovou 1998). This gap is probably widening inmost countries across Europe; if so, the problems associated with teenagemotherhood may become more severe.
8. Review and ConclusionsIt has long been clear that teenage mothers in many western countries had ahigh risk of disadvantage in fields such as education, employment andpoverty. It has also been known that the teenage birth rate varied widelybetween countries. There has, though, been no opportunity to make asystematic comparison of the outcomes of early fertility, between countries –across societies and across policy regimes. The availability of a single survey,asking the same questions in almost all the countries of the European Union,has enabled us to assess the impact of teenage motherhood across Europe as awhole, and to make detailed comparisons between countries.
We used data about the children who lived in a family to calculate the ageat which women had their first baby. The technique proved broadly reliable,though three issues need to be taken into account. First, the analysis seemedto under-estimate teenage birth rates in many countries, compared with whatwould have been expected on the basis of official statistics for the periodwhen the women were at risk. Second, because the time-frame within which afirst birth could be identified was between 1 and 15 years after the event,women identified as having given birth at different ages inevitably varied intheir ages at the time of the survey; this meant that quite complex analysiswas necessary to isolate the effects of early fertility, independent of otherfactors. The third, and ultimately the most important, methodologicaldifficulty is that all the information relates to a period after the event, and it isnot possible to distinguish causes and effects in a rigorous way.
In spite of these technical difficulties, the availability of a single surveyhas provided the first opportunity to make direct comparisons betweencountries in the disadvantages experienced by young mothers and theirfamilies. The analysis confirms that the disadvantage applies in all countries.

51
But for the first time a systematic comparison between countries allows someinsight into the potential influences of social values and/or of public policy.
Over Europe as a whole,22 the findings can be interpreted in terms of aseries of influences on mothers’ and families’ life courses. If the age at whicha woman started her family is left on one side for a moment, we can conceiveof a range of key factors which might make the difference between prosperityand disadvantage: starting, perhaps, with a woman’s educational attainment;the family structure within which she raises children (i.e. marriage as opposedto lone parenthood); the qualifications of her partner; her own employmentprospects, the chances of anyone in the family having a job; the family’s levelof income. The analysis has confirmed that across Europe, all these factorsare associated with each other, to a greater or less degree, so thatdisadvantage in one dimension tends to coincide with disadvantage inanother. To the extent that a mother’s status in one dimension is determinedbefore her position in the next, it is possible to talk in terms of causal links.So, one might say, for example, that a low level of education might increasethe probability of lone parenthood; lone parenthood might mean the absenceof family employment; which would lead to poverty. All these potential linksare visible in the European data.
The age at which a woman gave birth to her first child proved to beassociated with all of these factors, with teenage motherhood alwaysrepresenting the disadvantaged end of the spectrum. On average acrossEurope, 54 per cent of women who had a child at 18 gained upper secondaryeducational qualifications; among women who delayed having a child untilthey were 28, the proportion was 89 per cent (page 21). It is not possible tosay for sure whether poor educational achievements and prospectsencouraged young women to take the early route to motherhood, or whetherthe birth of a baby encouraged or forced them to give up their schooling.Probably both effects occur. Either way, though, it is not surprising that 40per cent of the 18-year-old mothers are estimated to have been in povertywhen their child was ten years old, compared with only 11 per cent of the 28-year-old mothers (page 43). The analysis has established that part of teenmothers’ increased risk of poverty can be explained by their low level ofeducational qualifications, part by their family positions, and so on; but muchof the poverty problem appears to have been a direct correlate of the age atwhich she had her child, independently of the intermediate factors included inthe analysis.
The starting point for the research was concern about the fate of teenagemothers and their children, compared with families whose mother was overthe age of 20 when the first child was born. For most outcomes, in most
22 Defined as the 13 EU countries with large enough samples of ECHP data.

52
countries, this straight comparison was a valid one. But in every case, theanalysis produced clearer results if each year of age at first birth was allowedto contribute to the measure of advantage and disadvantage, between 15 and28. That is, a baby born at 15 or 16 was more serious, in terms of outcomes,than one born at 19; a 25 year old mother would expect to be better off than a20 year old, and so on. Thus teenage motherhood may be seen asconceptually equivalent to poverty – a convenient benchmark on which tofocus analysis and policy, rather than a clearly delineated boundary betweenan acceptable and unacceptable social position.
The range of experiences in different countries was wide. In every country,young mothers were less likely to have upper secondary educationalqualifications than older mothers; but the highest regression coefficient wasmore than twice the size of the lowest. In most countries, young mothers wereless likely to be in formal marriages – the exception was Greece. In themajority of countries, young mothers were less likely to have a job, and lesslikely to have a partner in work, though there were several countries wheresuch relationships could not be established. In every country, earlymotherhood was associated with an increased risk of poverty; here, thehighest regression coefficient was nearly three times the lowest.
It may be suggested that poverty is, in a sense, the most general measure ofdisadvantage. Chart F therefore plots the association between poverty and theage at which mothers started their families, to provide an overview of thefindings. The Netherlands was clearly the country where young mothers weremost disadvantaged, according to this measure. There followed a group ofcountries, from France to Finland, where the apparent consequences of youngmotherhood remained severe. There was a third group of countries, fromPortugal to Spain, where the associations, though still significant, were lessstrong.23
Why should the age at which a woman starts her family make such a bigdifference to her prospects in one country, and so little difference in another?The simple model linking the age at which women had children througheducation, family structure and employment to income provided a way ofthinking about possible processes at a Europe-wide level, but it was not sohelpful in providing an explanation for variations between countries.
23 It was pointed out on page 44, though, that the positions of Belgium, Finland and Germany inthis ordering were subject to uncertainty.

53
Chart F: Association between household income and age at first birth (up to 28)
Note: The chart plots the logistic regression coefficients from the first column of Table 27, withnegative signs reversed. Countries with coefficients below 0.15 are coloured grey.
The associations between early motherhood and each of the other fouroutcome variables analysed are plotted in Chart G (page 55). The orderingand colouring of the countries in the new chart are the same as those in ChartF, which was designed to emphasise the rank order of the countries in termsof the link between parenting and poverty. This method of presentation helpsto show that the ordering of countries on the other variables was not, ingeneral, the same as for poverty.
It might have been supposed that the countries where young motherssuffered the greatest educational disadvantage would show the greatestincreased risk of poverty. Far from it: Greece was top of the educationaldisadvantage scale (first panel of Chart G), and near the bottom of the incomedisadvantage scale. It was the Netherlands where the increased risk of povertywas greatest – the place where young mothers’ education suffered least. Moregenerally, there was no association (either way) between the results of thecountry-by-country analysis of education and of poverty. The same could besaid of lone parenthood and mothers’ employment (second and third panels ofthe chart). There was, though, a significant tendency for countries where ageat first birth was closely associated with family employment (fourth panel of
0.00 0.05 0.10 0.15 0.20 0.25 0.30 0.35
Netherlands
France
Belgium
Denmark
UK
Ireland
Finland
Portugal
Germany
Greece
Austria
Italy
Spain

54
Chart G), to be the same countries where it was closely associated withhousehold income.24
Detailed country by country studies would be valuable; but a comparisonacross countries may also provide some hints. It was shown at the end of theprevious chapter that the group of countries where the families of youngmothers were most likely to be poor (relative to older mothers) tended to becountries where, first, the rate of teenage motherhood was much lower thanthe equivalent fertility rate for 25 to 29 year olds and, second, where womenoften had a lengthy period between leaving their parental home and forming anuclear family of their own. These two findings, in combination, suggest thatoutcomes may be linked to social conventions. In the (mainly northern) groupof countries where age at first birth is closely associated with poverty, womenwho have children as teenagers are exceptional; and find that the family andneighbourhood networks which might otherwise have supported them are nolonger available. In the (mainly Southern) group of countries with a relativelyweak link between parenting and poverty, young people are closely tied totheir families of origin, and women quite often have children at a relativelyyoung age, so teenage mothers are less isolated.
The discussion in the previous paragraphs has assumed that poverty wasthe best overall indicator of disadvantage, and that other issues, such aseducation, family structure and employment, were mainly contributors to thatprimary outcome. An alternative way of summarising the results is to giveequal weight to all five indicators. This may be considered to provide a morebalanced view, taking account of each type of outcome as a disadvantage inits own right. A technical argument for looking at all five indicators is that theresults may be less sensitive to any quirks of measurement or analysis whichmight affect any one of them.
24 The correlation coefficient was 0.75

55
Chart G: Association between education, lone parenthood, employment and family employment,and age at first birth (up to 28)
Note: The chart plots the logistic regression coefficients from the first columns of Tables 9, 13, 18and 22 respectively. In the lone parents graph, the negative signs have been reversed. The orderingand colouring of the countries is derived from Chart F, and all graphs have the same scale.Coefficients which appeared to be less than zero are shown as zero; coefficients which were notstatistically significant are dappled.
0.00 0.05 0.10 0.15 0.20 0.25 0.30 0.35
Netherlands
France
Belgium
Denmark
UK
Ireland
Finland
Portugal
Germany
Greece
Austria
Italy
Spain
Education0.00 0.05 0.10 0.15 0.20 0.25 0.30 0.35
Netherlands
France
Belgium
Denmark
UK
Ireland
Finland
Portugal
Germany
Greece
Austria
Italy
Spain
Lone parent
0.00 0.05 0.10 0.15 0.20 0.25 0.30 0.35
Netherlands
France
Belgium
Denmark
UK
Ireland
Finland
Portugal
Germany
Greece
Austria
Italy
Spain
Mother's employment0.00 0.05 0.10 0.15 0.20 0.25 0.30 0.35
Netherlands
France
Belgium
Denmark
UK
Ireland
Finland
Portugal
Germany
Greece
Austria
Italy
Spain
Family employment
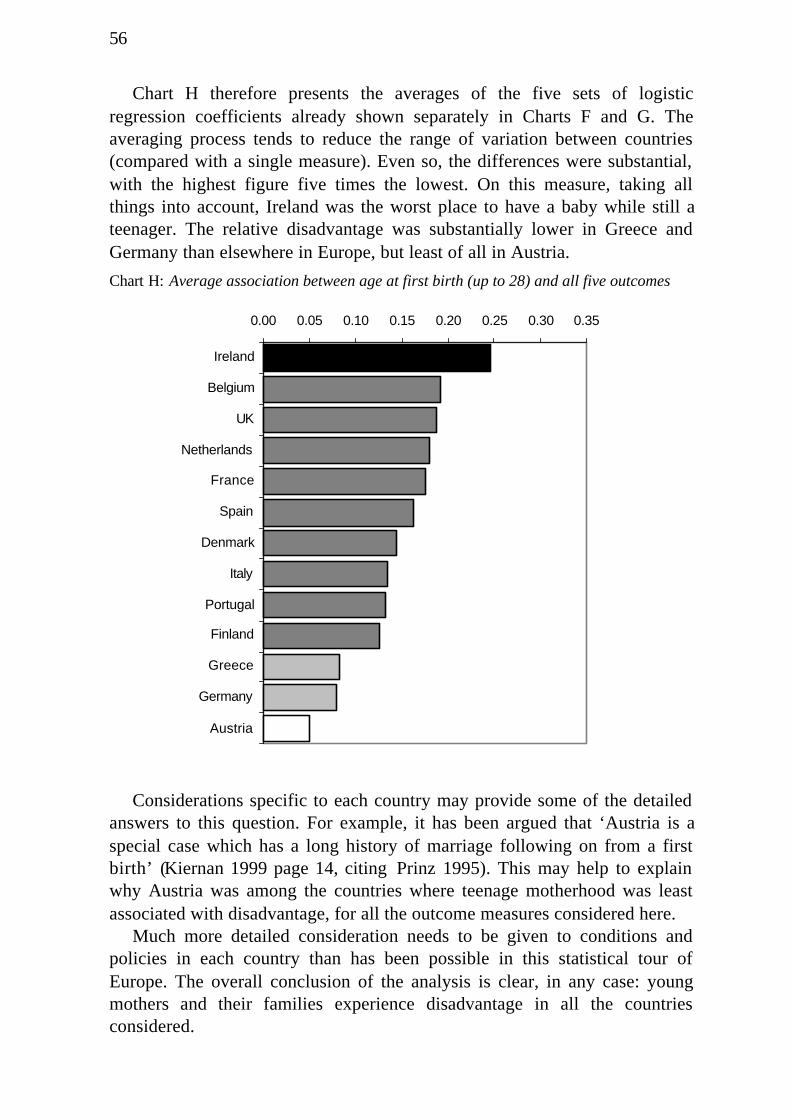
56
Chart H therefore presents the averages of the five sets of logisticregression coefficients already shown separately in Charts F and G. Theaveraging process tends to reduce the range of variation between countries(compared with a single measure). Even so, the differences were substantial,with the highest figure five times the lowest. On this measure, taking allthings into account, Ireland was the worst place to have a baby while still ateenager. The relative disadvantage was substantially lower in Greece andGermany than elsewhere in Europe, but least of all in Austria.
Chart H: Average association between age at first birth (up to 28) and all five outcomes
Considerations specific to each country may provide some of the detailedanswers to this question. For example, it has been argued that ‘Austria is aspecial case which has a long history of marriage following on from a firstbirth’ (Kiernan 1999 page 14, citing Prinz 1995). This may help to explainwhy Austria was among the countries where teenage motherhood was leastassociated with disadvantage, for all the outcome measures considered here.
Much more detailed consideration needs to be given to conditions andpolicies in each country than has been possible in this statistical tour ofEurope. The overall conclusion of the analysis is clear, in any case: youngmothers and their families experience disadvantage in all the countriesconsidered.
0.00 0.05 0.10 0.15 0.20 0.25 0.30 0.35
Ireland
Belgium
UK
Netherlands
France
Spain
Denmark
Italy
Portugal
Finland
Greece
Germany
Austria
57
ReferencesBerthoud, R. (2001), ‘Teenage births to ethnic minority mothers’, Population
Trends 104.
Cunnington, A.J. (2001), ‘What's so bad about teenage pregnancy?’ Journal ofFamily Planning and Reproductive Health Care, 27 (1): 36-41.
Duncan, G., Yeung, W. and Brooks-Gunn, J. (1998), ‘How much does childhoodpoverty affect the life chances of children?’ American Sociological Review,vol 63 no 3.
Eurostat (2000), Population and Vital Statistics.
Fraser, A.M., Brockert, J.E. and Ward, R.H. (1995), ‘Association of young maternalage with adverse reproductive outcomes.’ New England Journal ofMedicine, 332(17): 1113-1117.
Hobcraft, J. and Kiernan, K. (1999), ‘Childhood poverty, early motherhood andadult social exclusion’, CASEpaper 28, London School of Economics.
Hoffman, Saul D., Foster, E. Michael and. Furstenberg Jr., Frank F. (1993),‘Reevaluating the costs of teenage childbearing.’ Demography, 30(1): 1-13.
Iacovou, M. (1998), ‘Young people in Europe: two models of householdformation’, European Panel Analysis Group working paper 6, University ofEssex.
Kiernan, K. (1999), ‘Childbearing outside marriage in Western Europe’, PopulationTrends 98.
Office for National Statistics (2000), Population Trends, quarterly.
Prinz, C. (1995), Cohabiting, Married or Single, Avebury.
Ribar, David C. (1999), ‘The socioeconomic consequences of young women’schildbearing: reconciling disparate evidence’. Journal of PopulationEconomics, 12: 547-565.
Social Exclusion Unit (1999) Teenage Pregnancy, cm 4342.
Strobino, D.M. (1992), ‘Young motherhood and infant hospitalisation during thefirst year of birth’. Journal of Adolescent Health, 13(7): 553-560.
UNICEF (2001), A League Table of Teenage Births in Rich Nations, InnocentiReport Card No 3, UNICEF Innocenti Research Centre.
Wellings, Kaye, Wadsworth, Jane, Johnson, Anne, Field, Julia and Macdowall,Wendy (1999), ‘Teenage fertility and life chances'. Reviews ofReproduction, 4: 184-190.

58
Appendix 1: Five outcomes: teenage mothers compared with mothers whose first child was born in their twenties, by countryCell percentages
Less than uppersecondary education
Without partner Not working Neither woman norpartner is working
Household incomebelow bottom quintile
15-19 20-29 15-19 20-29 15-19 20-29 15-19 20-29 15-19 20-29
Austria 52 23 13 12 30 31 6 4 31 24
Belgium 52 22 24 8 55 27 32 7 45 19
Denmark 65 17 16 12 46 25 22 6 24 8
Finland 24 9 11 5 42 27 13 8 29 17
France 62 24 16 10 61 35 18 6 51 18
Germany 57 24 18 10 60 36 24 5 54 21
Greece 74 35 4 6 61 55 6 6 30 17
Ireland 73 37 42 14 69 51 46 14 41 23
Italy 77 52 15 3 64 54 18 5 36 20
Netherlands 50 22 13 7 53 42 31 7 78 26
Portugal 92 78 15 7 37 32 8 4 26 16
Spain 80 59 20 7 70 66 27 12 35 22
UK 65 37 39 15 61 37 43 14 53 23
All Europe 67 34 23 19 59 41 26 8 45 21
Difference 33 4 18 18 24
Note: Shaded cells indicate significant differences (p<0.05). This table is identical to Figure 5 in UNICEF’s report on Teenage Births in Rich Countries,
except that the order of rows and columns are different.
Innocenti Working Papers
The papers in the series (ISSN 1014-7837) are all available in English. Papers EPS 63onwards are available for download as .pdf files from the IRC web site (http://www.unicef-icdc.org). Individual copies are available from: Distribution Unit, UNICEF-IRC, PiazzaSS. Annunziata 12, 50122 Florence, Italy (e-mail [email protected] fax +39 055-24-48-17).
EPS 1 Economic Decline and Child Survival: The Plight of Latin America in theEighties. Teresa Albanez, Eduardo Bustelo, Giovanni Andrea Cornia andEva Jespersen. (March 1989).
EPS 2 Child Poverty and Deprivation in Industrialized Countries: Recent Trendsand Policy Options. Giovanni Andrea Cornia. (March 1990). Also availablein French and Spanish.
EPS 3 Education, Skills and Industrial Development in the StructuralTransformation of Africa. Sanjaya Lall. (July 1990).
EPS 4 Rural Differentiation, Poverty and Agricultural Crisis in Sub-SaharanAfrica: Toward An Appropriate Policy Response. Giovanni Andrea Corniaand Richard Strickland. (July 1990).
EPS 5 Increased Aid Flows and Human Resource Development in Africa. PaulMosley. (August 1990).
EPS 6 Child Poverty and Deprivation in Italy: 1950 to the Present. ChiaraSaraceno. (September 1990). Also available in Italian.
EPS 7 Toward Structural Transformation with a Human Focus: The EconomicProgrammes and Policies of Zambia in the 1980s. Venkatesh Seshamani.(October 1990).
EPS 8 Child Poverty and Deprivation in the UK. Jonathan Bradshaw. (October1990).
EPS 9 Adjustment Policies in Tanzania, 1981-1989: The Impact on Growth,Structure and Human Welfare. Jumanne H. Wagao. (October 1990).
EPS10 The Causes and Consequences of Child Poverty in the United States.Sheldon Danziger and Jonathan Stern. (November 1990).
EPS 11 The Fiscal System, Adjustment and the Poor. Giovanni Andrea Cornia andFrances Stewart. (November 1990).
EPS 12 The Health Sector and Social Policy Reform in the Philippines since 1985.Wilfredo G. Nuqui. (January 1991).
EPS 13 The Impact of Economic Crisis and Adjustment on Health Care in Mexico.Carlos Cruz Rivero, Rafael Lozano Ascencio and Julio Querol Vinagre.(February 1991).
EPS 14 Structural Adjustment, Growth and Welfare: The Case of Niger, 1982-1989. Kiari Liman-Tinguiri. (March 1991).

60
EPS 15 The Impact of Self-Imposed Adjustment: The Case of Burkina Faso, 1983-1989. Kimseyinga Savadogo and Claude Wetta. (April 1991).
EPS 16 Liberalization for Development: Zimbabwe’s Adjustment without the Fund.Robert Davies, David Sanders and Timothy Shaw. (May 1991).
EPS 17 Fiscal Shock, Wage Compression and Structural Reform: MexicanAdjustment and Educational Policy in the 1980s. Fernando Valerio. (June1991).
EPS 18 Patterns of Government Expenditure in Developing Countries during the1980s: The Impact on Social Services. Beth Ebel. (July 1991).
EPS 19 Ecuador: Crisis, Adjustment and Social Policy in the 1980s. TheEcuadorian Centre of Social Research. (August 1991).
EPS 20 Government Expenditures for Children and Their Families in AdvancedIndustrialized Countries, 1960-85. Sheila B. Kamerman and Alfred J.Kahn. (September 1991).
EPS 21 Is Adjustment Conducive to Long-term Development?: The Case of Africain the 1980s. Giovanni Andrea Cornia. (October 1991).
EPS 22 Children in the Welfare State: Current Problems and Prospects in Sweden.Sven E. Olsson and Roland Spånt. (December 1991).
EPS 23 Eradicating Child Malnutrition: Thailand’s Health, Nutrition and PovertyAlleviation Policy in the 1980s. Thienchay Kiranandana and KraisidTontisirin. (January 1992).
EPS 24 Child Welfare and the Socialist Experiment: Social and Economic Trendsin the USSR, 1950-90. Alexandr Riazantsev, Sándor Sipos and OlegLabetsky. (February 1992).
EPS 25 Improving Nutrition in Tanzania in the 1980s: The Iringa Experience.Olivia Yambi and Raphael Mlolwa. (March 1992).
EPS 26 Growth, Income Distribution and Household Welfare in the IndustrializedCountries since the First Oil Shock. Andrea Boltho. (April 1992).
EPS 27 Trends in the Structure and Stability of the Family from 1950 to thePresent: The Impact on Child Welfare. Chiara Saraceno. (May 1992).
EPS 28 Child Poverty and Deprivation in Portugal: A National Case Study.Manuela Silva. (June 1992).
EPS 29 Poverty Measurement in Central and Eastern Europe before the Transitionto the Market Economy. Sándor Sipos. (July 1992).
EPS 30 The Economics of Disarmament: Prospects, Problems and Policies for theDisarmament Dividend. Saadet Deger. (August 1992).
EPS 31 External Debt, Fiscal Drainage and Child Welfare: Trends and PolicyProposals. Stephany Griffith-Jones. (September 1992).
EPS 32 Social Policy and Child Poverty: Hungary since 1945. Júlia Szalai.(October 1992).
61
EPS 33 The Distributive Impact of Fiscal and Labour Market Policies: Chile’s1990-91 Reforms. Mariana Schkolnik. (November 1992).
EPS 34 Changes in Health Care Financing and Health Status: The Case of Chinain the 1980s. Yu Dezhi. (December 1992).
EPS 35 Decentralization and Community Participation for Improving Access toBasic Services: An Empirical Approach. Housainou Taal. (January 1993).
EPS 36 Two Errors of Targeting. Giovanni Andrea Cornia and Frances Stewart.(March 1993).
EPS 37 Education and the Market: Which Parts of the Neoliberal Solution areCorrect? Christopher Colclough. (July 1993).
EPS 38 Policy and Capital Market Constraints to the African Green Revolution: AStudy of Maize and Sorghum Yields in Kenya, Malawi and Zimbabwe,1960-91. Paul Mosley. (December 1993).
EPS 39 Tax Reforms and Equity in Latin America: A Review of the 1980s andProposals for the 1990s. Ricardo Carciofi and Oscar Cetrángolo. (January1994).
EPS 40 Macroeconomic Policy, Poverty Alleviation and Long-term Development:Latin America in the 1990s. Giovanni Andrea Cornia. (February 1994).
EPS 41 Réformes Fiscales, Génération de Ressources et Equité en AfriqueSubsaharienne durant les Années 1980. Kiari Liman-Tinguiri. (March1994).
EPS 42 Tax Reform and Equity in Asia: The Experience of the 1980s. AndreaManuelli. (April 1994).
EPS 43 Family Support Policies in Transitional Economies: Challenges andConstraints . Gáspár Fajth. (August 1994).
EPS 44 Income Distribution, Poverty and Welfare in Transitional Economies: AComparison between Eastern Europe and China. Giovanni Andrea Cornia.(October 1994).
EPS 45 Death in Transition: The Rise in the Death Rate in Russia since 1992.Jacob Nell and Kitty Stewart. (December 1994).
EPS 46 Child Well-being in Japan: The High Cost of Economic Success. Martha N.Ozawa and Shigemi Kono. (March 1995).
EPS 47 Ugly Facts and Fancy Theories: Children and Youth during the Transition.Giovanni Andrea Cornia. (April 1995).
EPS 48 East Joins West: Child Welfare and Market Reforms in the “Special Case”of the Former GDR. Bernhard Nauck and Magdalena Joos. (June 1995).
EPS 49 The Demographic Impact of Sudden Impoverishment: Eastern Europeduring the 1989-94 Transition. Giovanni Andrea Cornia and RenatoPaniccià. (July 1995).

62
EPS 50 Market Reforms and Social Welfare in the Czech Republic: A True SuccessStory? Miroslav Hiršl, Jiøí Rusnok and Martin Fassmann. (August 1995).
EPS 51 The Winding Road to the Market: Transition and the Situation of Childrenin Bulgaria. Theodora Ivanova Noncheva. (August 1995).
EPS 52 Child Institutionalization and Child Protection in Central and EasternEurope. Mary Anne Burke. (September 1995).
EPS 53 Economic Transition in the Baltics: Independence, Market Reforms andChild Well-being in Lithuania. Romas Lazutka and Zita Sniukstiene.(September 1995).
EPS 54 Economic Reforms and Family Well-being in Belarus: Caught betweenLegacies and Prospects. Galina I. Gasyuk and Antonina P. Morova.(December 1995).
EPS 55 The Transition in Georgia: From Collapse to Optimism. TeimurazGogishvili, Joseph Gogodze and Amiran Tsakadze. (September 1996).
EPS 56 Children at Risk in Romania: Problems Old and New. Elena Zamfir andCãtãlin Zamfir. (September 1996).
EPS 57 Children in Difficult Circumstances in Poland. Stanislawa Golinowska,Bo¿ena Balcerzak-Paradowska, Bo¿ena Ko³aczek and Dorota G³ogosz.(December 1996).
EPS 58 The Implications of Exhausting Unemployment Insurance Entitlement inHungary. John Micklewright and Gyula Nagy. (September 1997).
EPS 59 Are Intergovernmental Transfers in Russia Equalizing? Kitty Stewart.(September 1997).
EPS 60 Marital Splits and Income Changes: Evidence for Britain. Sarah Jarvis andStephen P. Jenkins. (September 1997).
EPS 61 Decentralization: A Survey from a Child Welfare Perspective. JeniKlugman. (September 1997).
EPS 62 Living Standards and Public Policy in Central Asia: What Can Be Learnedfrom Child Anthropometry? Suraiya Ismail and John Micklewright.(November 1997).
EPS 63 Targeting Social Assistance in a Transition Economy: The Mahallas inUzbekistan. Aline Coudouel, Sheila Marnie and John Micklewright.(August 1998).
EPS 64 Income Inequality and Mobility in Hungary, 1992-96. Péter Galasi, (August1998).
EPS 65 Accounting for the Family: The Treatment of Marriage and Children inEuropean Income Tax Systems. Cathal O’Donoghue and Holly Sutherland.(September 1998).
EPS 66 Child Poverty in Spain: What Can Be Said? Olga Cantó-Sánchez andMagda Mercader-Prats. (September 1998).
63
EPS 67 The Education of Children with Special Needs: Barriers and Opportunitiesin Central and Eastern Europe. Mel Ainscow and Memmenasha Haile-Giorgis. (September 1998).
EPS 68 EMU, Macroeconomics and Children. A.B. Atkinson. (December 1998).
EPS 69 Is Child Welfare Converging in the European Union? John Micklewrightand Kitty Stewart. (May 1999).
EPS 70 Income Distribution, Economic Systems and Transition. John Flemmingand John Micklewright. (May 1999).
EPS 71 Child Poverty across Industrialized Nations. Bruce Bradbury and MarkusJäntti. (September 1999).
EPS 72 Regional Monitoring of Child and Family Well-Being: UNICEF’s MONEEProject in CEE and the CIS in a Comparative Perspective. Gáspár Fajth(January 2000).
EPS 73 Macroeconomics and Data on Children. John Micklewright. (January2000). Available as a .pdf file only from http://www.unicef-icdc.org
EPS 74 Education, Inequality and Transition. John Micklewright (January 2000).Available as a .pdf file only from http://www.unicef-icdc.org
EPS 75 Child Well-Being in the EU – and Enlargement to the East. JohnMicklewright and Kitty Stewart. (February 2000).
IWP 76 From Security to Uncertainty: The Impact of Economic Change on ChildWelfare in Central Asia. Jane Falkingham. (May 2000).
IWP 77 How Effective is the British Government’s Attempt to Reduce ChildPoverty? David Piachaud and Holly Sutherland. (June 2000).
IWP 78 Child Poverty Dynamics in Seven Nations. Bruce Bradbury, StephenJenkins and John Micklewright. (June 2000).
IWP 79 What is the Effect of Child Labour on Learning Achievement? Evidencefrom Ghana. Christopher Heady (October 2000).
IWP 80 Integrating Economic and Social Policy: Good Practices from High-Achieving Countries. Santosh Mehrotra (October 2000).
IWP 81 The Impact of the Indonesian Financial Crisis on Children: An AnalysisUsing the 100 Villages Data. Lisa A. Cameron (December 2000).
IWP 82 An Analysis of the Role of Social Safety Net Scholarship in ReducingSchool Drop-Out During the Indonesian Economic Crisis. Lisa A.Cameron (December 2000).
IWP 83 The Family-in-Focus Approach: Developing Policy-Oriented Monitoringand Analysis of Human Development in Indonesia. Friedhelm Betke(January 2001).
IWP 84 Children in Bulgaria – Growing Impoverishment and UnequalOpportunities. Roumiana Gantcheva and Alexandre Kolev (January 2001).

64
IWP 85 The Rhetoric of International Development Targets and the Reality ofOfficial Development Assistance. Santosh Mehrotra (June 2001).
IWP 86 The Outcomes of Teenage Motherhood in Europe. Richard Berthoud andKaren Robson (July 2001).
##
THE OUTCOMES
OF TEENAGE MOTHERHOOD
IN EUROPE
This paper analyses the current positions of
women whose first child was born when they
were teenagers across 13 countries in the
European Union, based on the European
Community Household Panel survey. Outcomes
considered include educational attainment, family
structure, family employment and household
income. Teenage mothers were disadvantaged in
all countries, but the severity of their position
varied substantially between countries.
UNICEF Innocenti Research CentrePiazza SS. Annunziata, 1250122 Florence, Italy
Tel.: +39 055 203 30Fax: +39 055 244 817Email (general information): [email protected] (publication orders): [email protected]

60
Website: www.unicef-icdc.org
Related Documents