September 2011 SAFE MOTHERHOOD PREGNANCY OUTCOMES Table SM-1: Pregnancy outcomes in the last two years [Location and year]. {N = total pregnancies in last two years, Sum of Q218} Pregnancy outcome % (n) of pregnancies Singleton pregnancies Live birth Still birth Multiple pregnancies Spontaneous abortion Induced abortion Ectopic pregnancy Key Indicator SM-A: Proportion of women who were pregnant in the last two years among women of reproductive age [Location and year]. {N = total surveyed} Indicator % (n) women Pregnant in the last two years 1

Welcome message from author
This document is posted to help you gain knowledge. Please leave a comment to let me know what you think about it! Share it to your friends and learn new things together.
Transcript
September 2011
SAFE MOTHERHOOD
PREGNANCY OUTCOMES
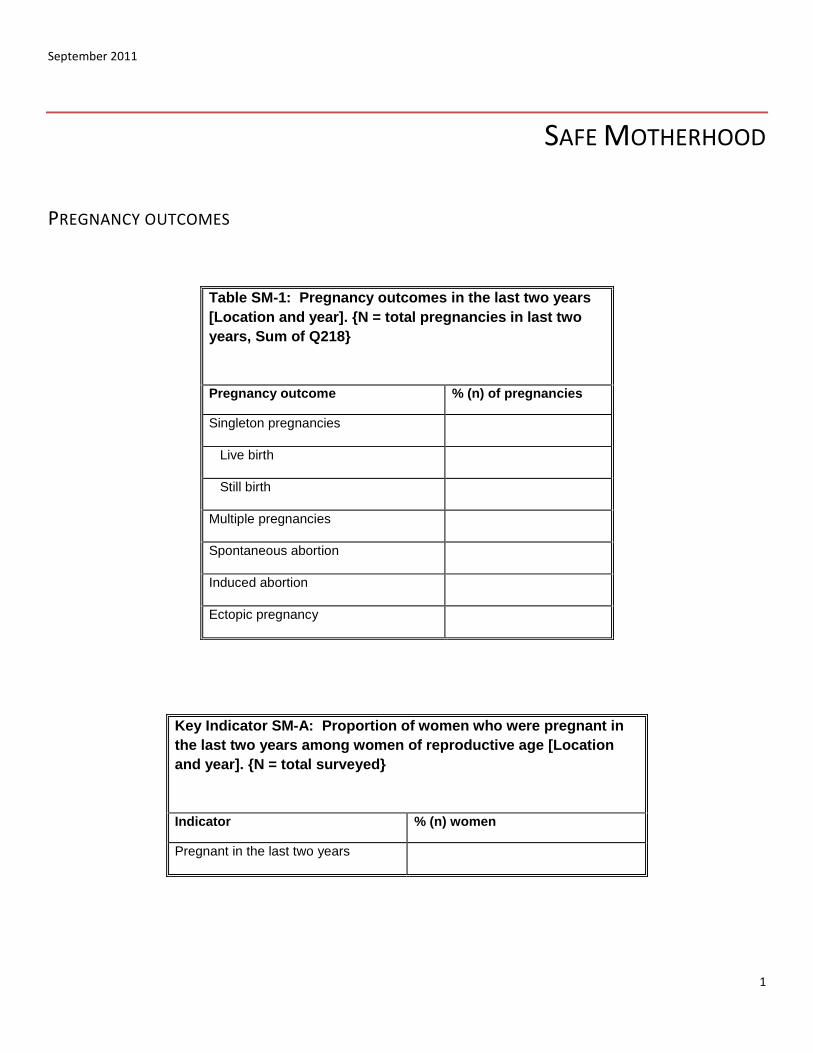
Table SM-1: Pregnancy outcomes in the last two years
[Location and year]. {N = total pregnancies in last two
years, Sum of Q218}
Pregnancy outcome % (n) of pregnancies
Singleton pregnancies
Live birth
Still birth
Multiple pregnancies
Spontaneous abortion
Induced abortion
Ectopic pregnancy
Key Indicator SM-A: Proportion of women who were pregnant in
the last two years among women of reproductive age [Location
and year]. {N = total surveyed}
Indicator % (n) women
Pregnant in the last two years
1
September 2011
AWARENESS OF DANGER SIGNS DURING PREGNANCY
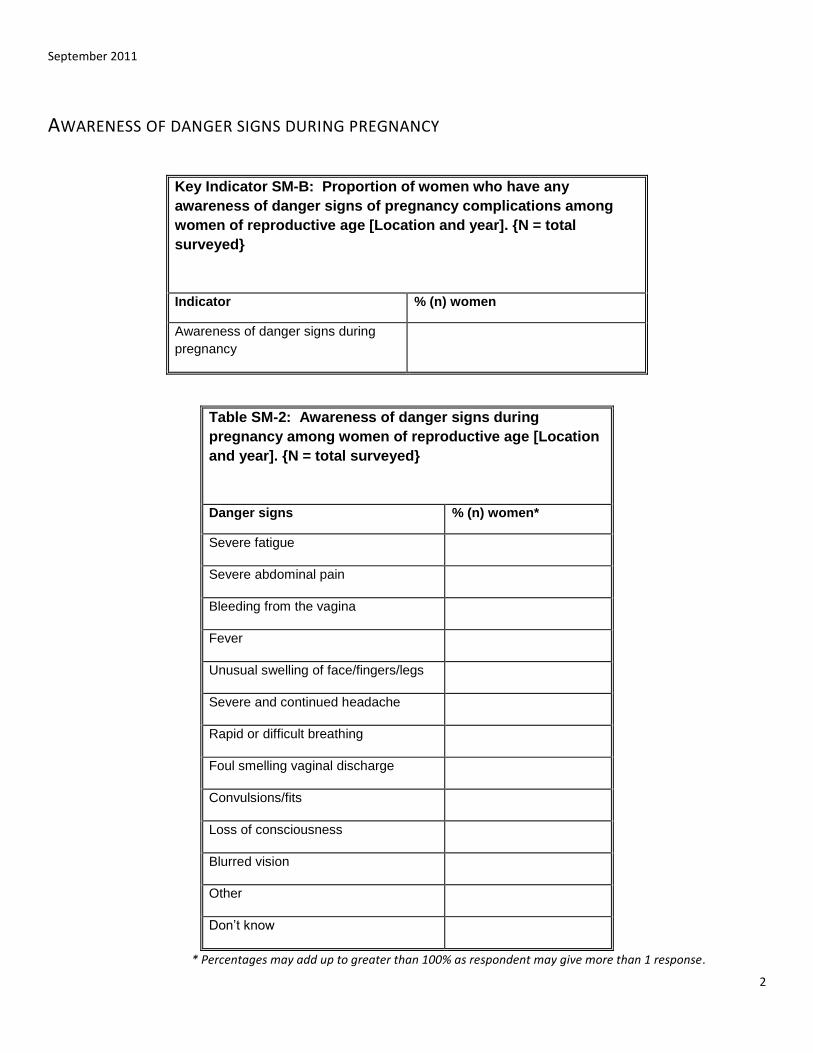
Key Indicator SM-B: Proportion of women who have any
awareness of danger signs of pregnancy complications among
women of reproductive age [Location and year]. {N = total
surveyed}
Indicator % (n) women
Awareness of danger signs during
pregnancy
Table SM-2: Awareness of danger signs during
pregnancy among women of reproductive age [Location
and year]. {N = total surveyed}
Danger signs % (n) women*
Severe fatigue
Severe abdominal pain
Bleeding from the vagina
Fever
Unusual swelling of face/fingers/legs
Severe and continued headache
Rapid or difficult breathing
Foul smelling vaginal discharge
Convulsions/fits
Loss of consciousness
Blurred vision
Other
Don’t know
* Percentages may add up to greater than 100% as respondent may give more than 1 response.
2
September 2011
CURRENTLY PREGNANT WOMEN
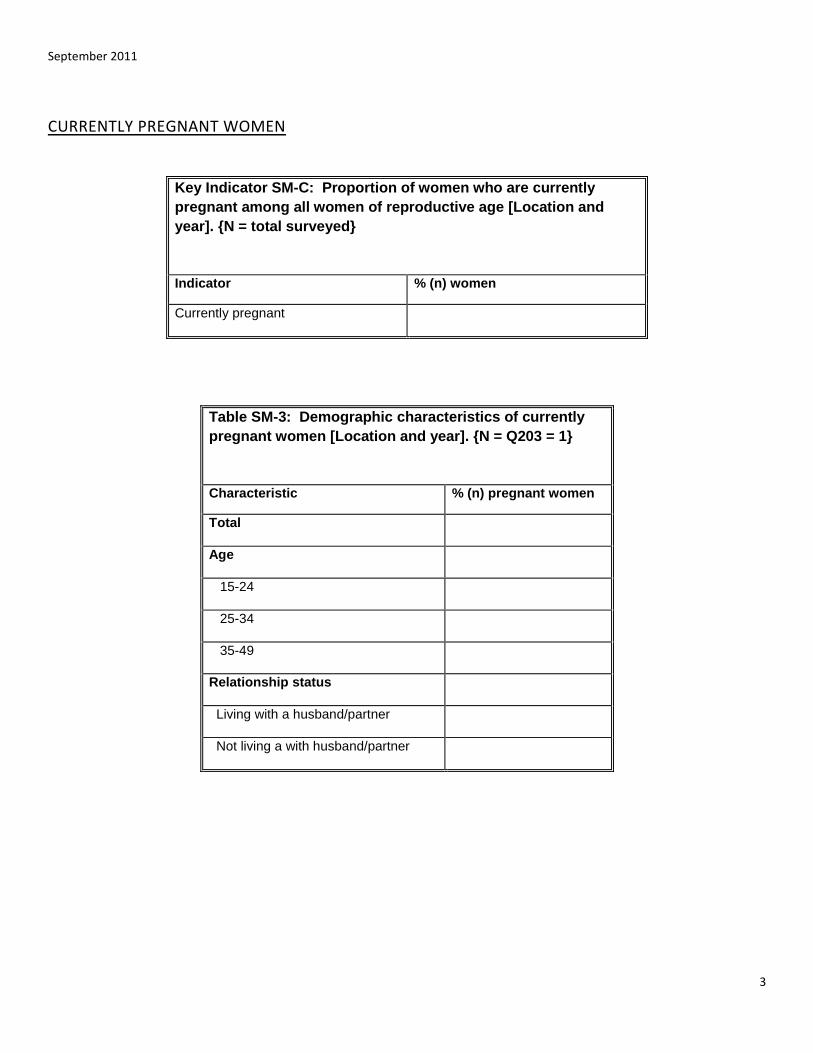
Key Indicator SM-C: Proportion of women who are currently
pregnant among all women of reproductive age [Location and
year]. {N = total surveyed}
Indicator % (n) women
Currently pregnant
Table SM-3: Demographic characteristics of currently
pregnant women [Location and year]. {N = Q203 = 1}
Characteristic % (n) pregnant women
Total
Age
15-24
25-34
35-49
Relationship status
Living with a husband/partner
Not living a with husband/partner
3
September 2011
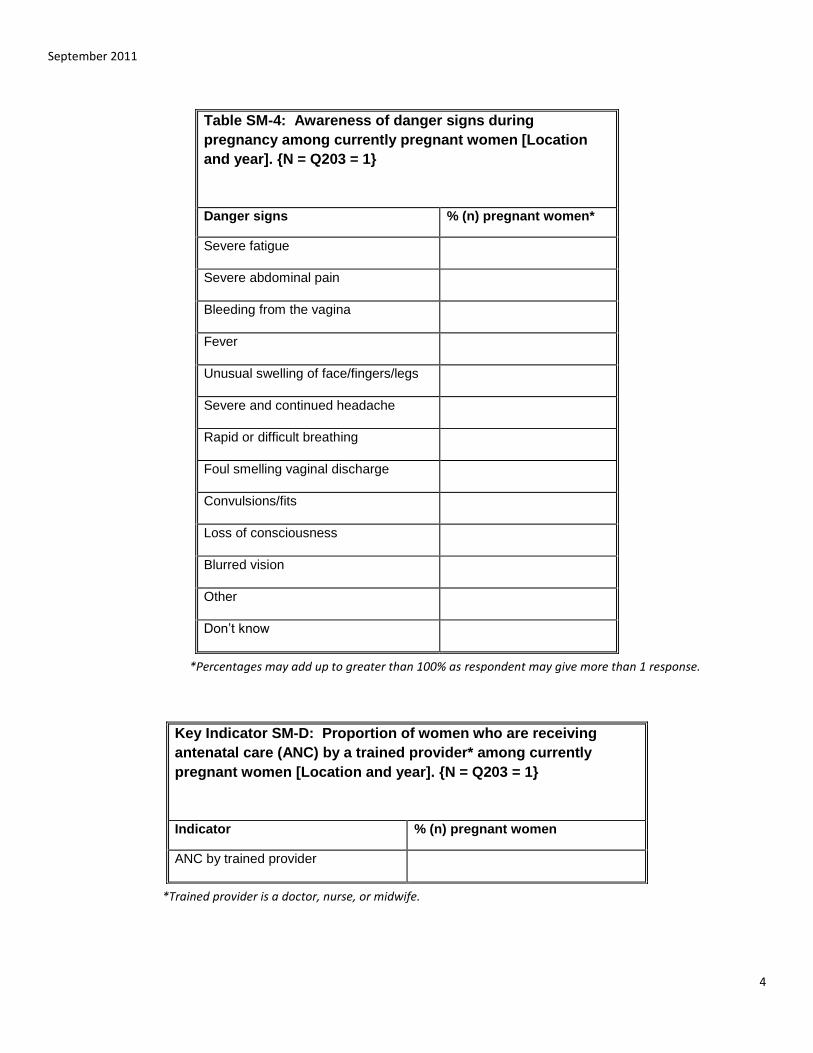
Table SM-4: Awareness of danger signs during
pregnancy among currently pregnant women [Location
and year]. {N = Q203 = 1}
Danger signs % (n) pregnant women*
Severe fatigue
Severe abdominal pain
Bleeding from the vagina
Fever
Unusual swelling of face/fingers/legs
Severe and continued headache
Rapid or difficult breathing
Foul smelling vaginal discharge
Convulsions/fits
Loss of consciousness
Blurred vision
Other
Don’t know
*Percentages may add up to greater than 100% as respondent may give more than 1 response.
Key Indicator SM-D: Proportion of women who are receiving
antenatal care (ANC) by a trained provider* among currently
pregnant women [Location and year]. {N = Q203 = 1}
Indicator % (n) pregnant women
ANC by trained provider
*Trained provider is a doctor, nurse, or midwife.
4

September 2011
Table SM-5: Demographic characteristics of currently pregnant women by receipt of
antenatal care (ANC) [Location and year]. {N = Q203 = 1}
Characteristic ANC by a trained provider*
% (n) pregnant women
(Q206=doctor OR nurse/midwife)
ANC by an untrained provider
†
% (n) pregnant women
(Q206=TBA/CHW or other)
No ANC
% (n) pregnant women
(Q205=2)
Total
Age
15-24
25-34
35-49
Relationship Status
Living with a husband/partner
Not living a with husband/partner
*Trained provider is a doctor, nurse, or midwife. †Untrained provider is a traditional birth attendant (TBA), community health worker (CHW), or anyone that is not a doctor,
nurse, or midwife.
5
September 2011
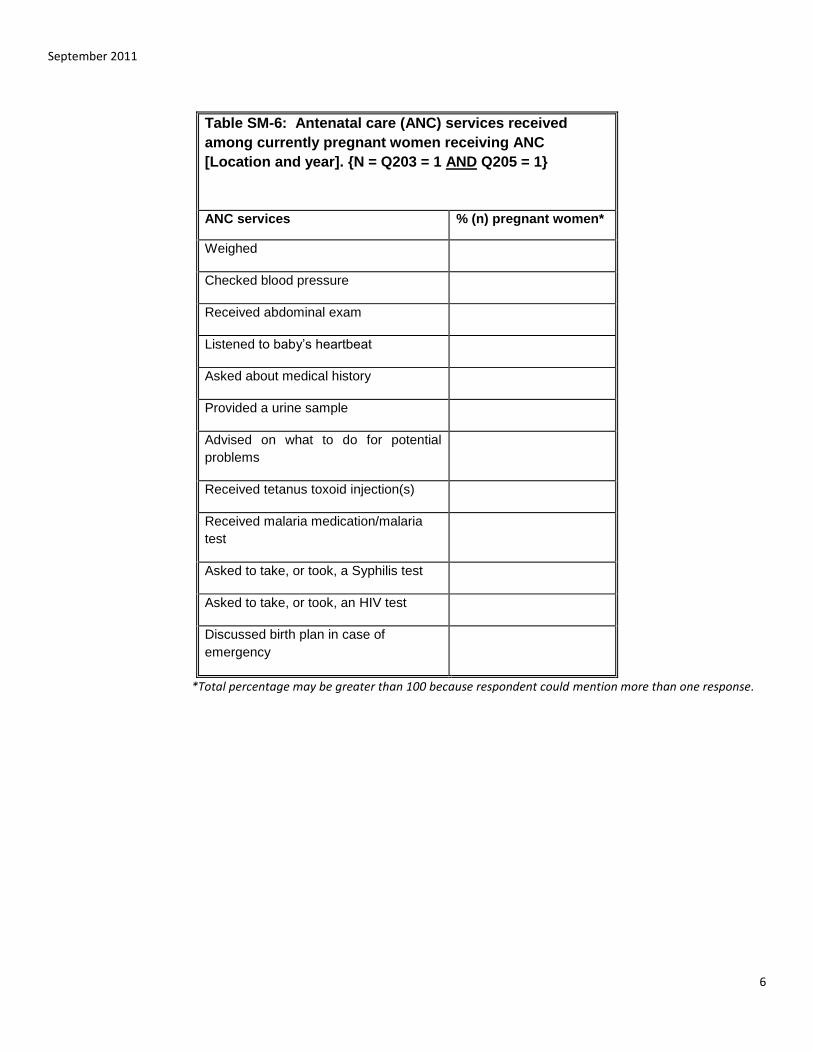
Table SM-6: Antenatal care (ANC) services received
among currently pregnant women receiving ANC
[Location and year]. {N = Q203 = 1 AND Q205 = 1}
ANC services % (n) pregnant women*
Weighed
Checked blood pressure
Received abdominal exam
Listened to baby’s heartbeat
Asked about medical history
Provided a urine sample
Advised on what to do for potential
problems
Received tetanus toxoid injection(s)
Received malaria medication/malaria
test
Asked to take, or took, a Syphilis test
Asked to take, or took, an HIV test
Discussed birth plan in case of
emergency
*Total percentage may be greater than 100 because respondent could mention more than one response.
6
September 2011
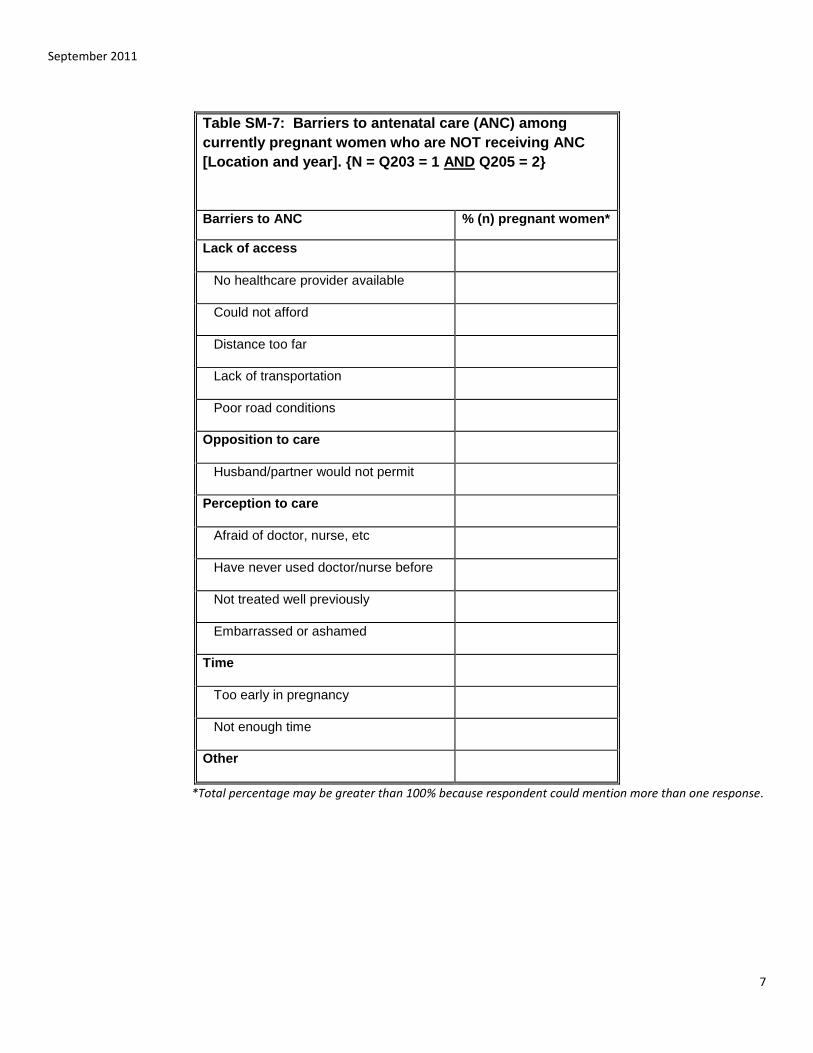
Table SM-7: Barriers to antenatal care (ANC) among
currently pregnant women who are NOT receiving ANC
[Location and year]. {N = Q203 = 1 AND Q205 = 2}
Barriers to ANC % (n) pregnant women*
Lack of access
No healthcare provider available
Could not afford
Distance too far
Lack of transportation
Poor road conditions
Opposition to care
Husband/partner would not permit
Perception to care
Afraid of doctor, nurse, etc
Have never used doctor/nurse before
Not treated well previously
Embarrassed or ashamed
Time
Too early in pregnancy
Not enough time
Other
*Total percentage may be greater than 100% because respondent could mention more than one response.
7
September 2011
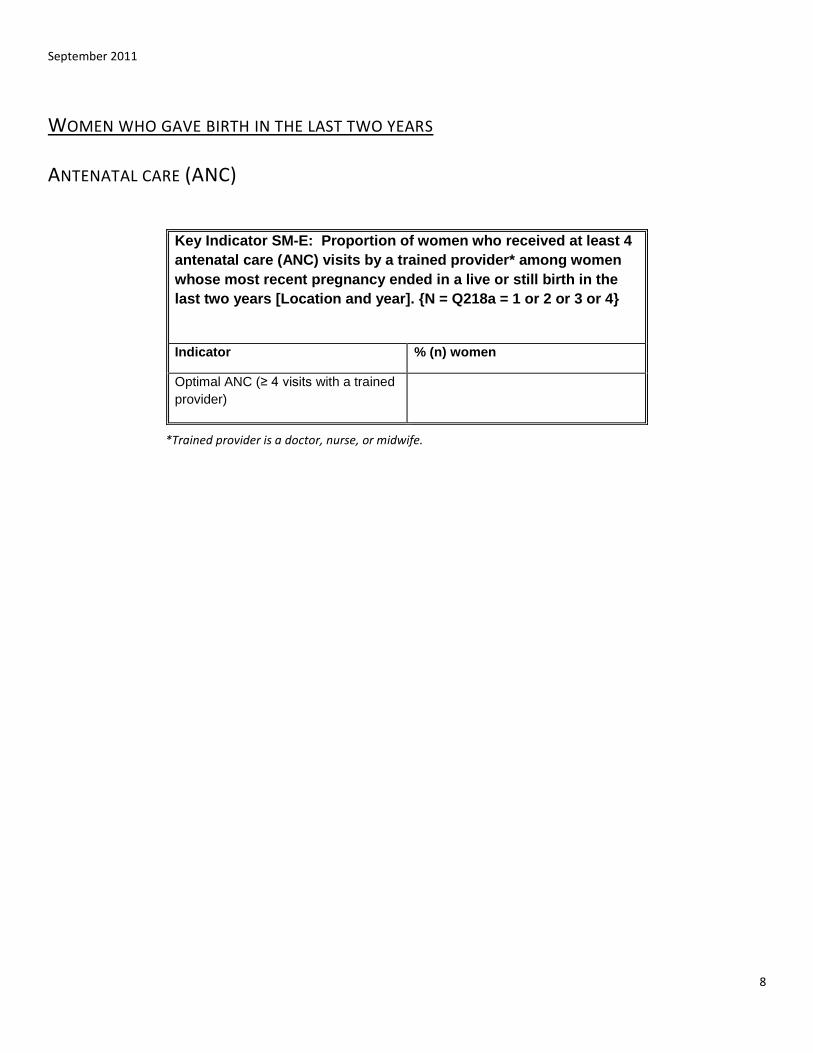
WOMEN WHO GAVE BIRTH IN THE LAST TWO YEARS
ANTENATAL CARE (ANC)
Key Indicator SM-E: Proportion of women who received at least 4
antenatal care (ANC) visits by a trained provider* among women
whose most recent pregnancy ended in a live or still birth in the
last two years [Location and year]. {N = Q218a = 1 or 2 or 3 or 4}
Indicator % (n) women
Optimal ANC (≥ 4 visits with a trained
provider)
*Trained provider is a doctor, nurse, or midwife.
8

September 2011
Table SM-8: Demographic characteristics of women whose most recent pregnancy ended in a live
or still birth in the last two years by receipt of antenatal care (ANC) [Location and year]. {N = Q218a
= 1 or 2 or 3 or 4}
Characteristic ANC by a trained provider* and ≥4 visits
% (n) women
(Q220=doctor OR nurse/midwife) AND Q220=3 or 4)
ANC by a trained provider and <4 visits OR by an untrained
† provider
% (n) women
(Q220=doctor OR nurse/midwife AND Q221=1, 2 or 3) OR (Q220=TBA/CHW or other)
No ANC
% (n) women
(Q219=2)
Total
Age
15-24
25-34
35-49
Relationship Status
Living with a husband/partner
Not living a with husband/partner
*Trained provider is a doctor, nurse, or midwife. †Untrained provider is a traditional birth attendant (TBA), community health worker (CHW), or anyone that is not a doctor,
nurse, or midwife.
9
September 2011
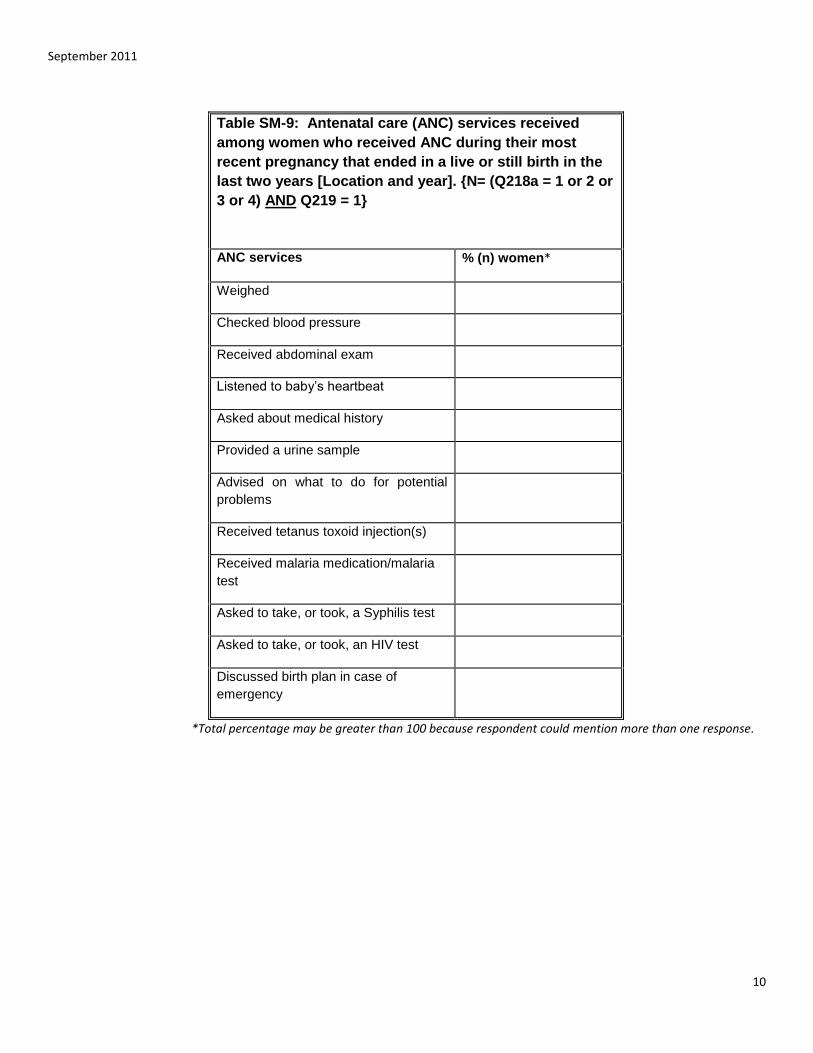
Table SM-9: Antenatal care (ANC) services received
among women who received ANC during their most
recent pregnancy that ended in a live or still birth in the
last two years [Location and year]. {N= (Q218a = 1 or 2 or
3 or 4) AND Q219 = 1}
ANC services % (n) women*
Weighed
Checked blood pressure
Received abdominal exam
Listened to baby’s heartbeat
Asked about medical history
Provided a urine sample
Advised on what to do for potential
problems
Received tetanus toxoid injection(s)
Received malaria medication/malaria
test
Asked to take, or took, a Syphilis test
Asked to take, or took, an HIV test
Discussed birth plan in case of
emergency
*Total percentage may be greater than 100 because respondent could mention more than one response.
10

*Total percentage may be greater than 100 because respondent could mention more than one response.
September 2011
Table SM-10: Barriers to antenatal care (ANC) among
women who did not receive ANC during their most
recent pregnancy that ended in a live or still birth in the
last two years [Location and year]. {N = (Q218a = 1 or 2
or 3 or 4) AND Q219 = 2}
Barriers to ANC % (n) women*
Lack of access
No healthcare provider available
Could not afford
Distance too far
Lack of transportation
Poor road conditions
Opposition to care
Husband/partner would not permit
Perception to care
Afraid of doctor, nurse, etc
Have never used doctor/nurse
Not treated well previously
Embarrassed or ashamed
Time
Too early in pregnancy
Not enough time
Other
11
September 2011
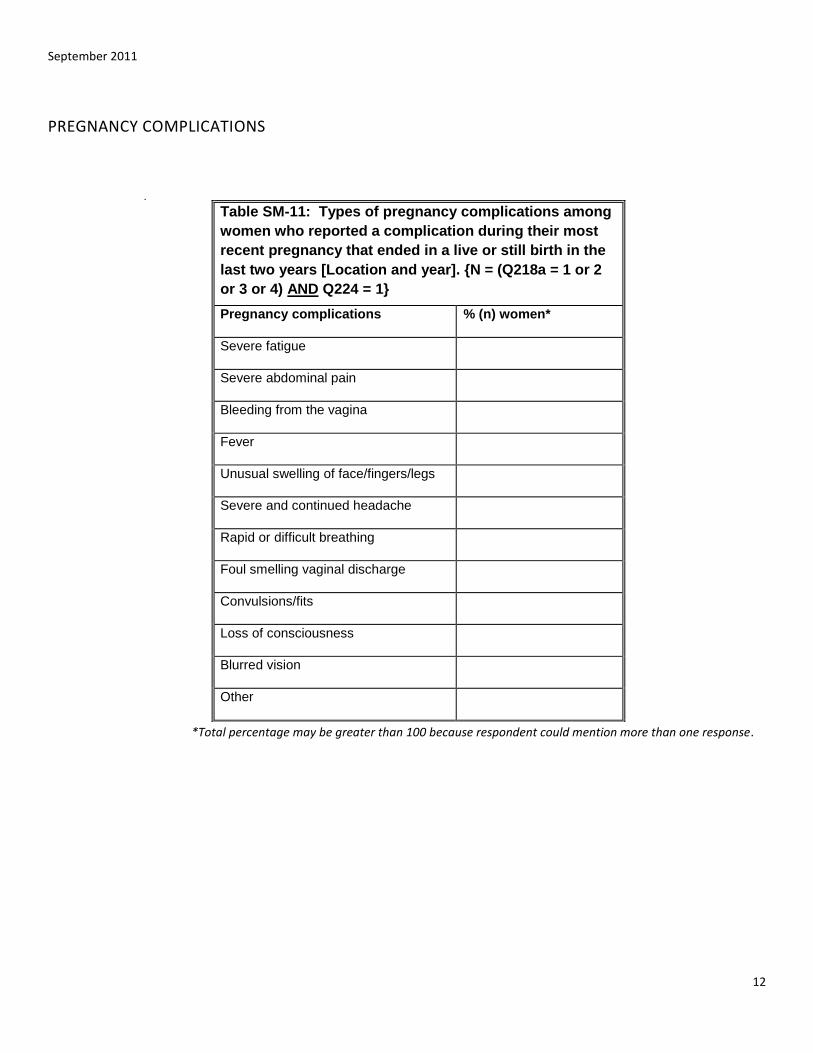
PREGNANCY COMPLICATIONS
.
Table SM-11: Types of pregnancy complications among
women who reported a complication during their most
recent pregnancy that ended in a live or still birth in the
last two years [Location and year]. {N = (Q218a = 1 or 2
or 3 or 4) AND Q224 = 1}
Pregnancy complications % (n) women*
Severe fatigue
Severe abdominal pain
Bleeding from the vagina
Fever
Unusual swelling of face/fingers/legs
Severe and continued headache
Rapid or difficult breathing
Foul smelling vaginal discharge
Convulsions/fits
Loss of consciousness
Blurred vision
Other
*Total percentage may be greater than 100 because respondent could mention more than one response.
12
September 2011
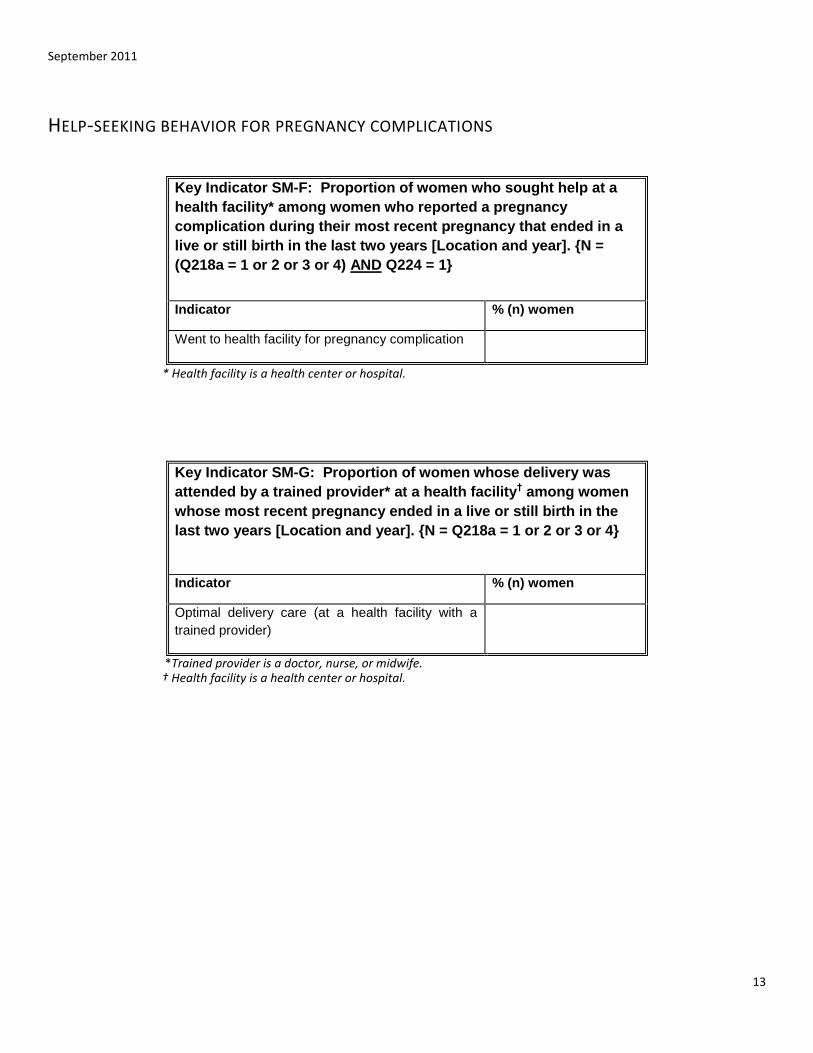
HELP-SEEKING BEHAVIOR FOR PREGNANCY COMPLICATIONS
Key Indicator SM-F: Proportion of women who sought help at a
health facility* among women who reported a pregnancy
complication during their most recent pregnancy that ended in a
live or still birth in the last two years [Location and year]. {N =
(Q218a = 1 or 2 or 3 or 4) AND Q224 = 1}
Indicator % (n) women
Went to health facility for pregnancy complication
* Health facility is a health center or hospital.
Key Indicator SM-G: Proportion of women whose delivery was
attended by a trained provider* at a health facility† among women
whose most recent pregnancy ended in a live or still birth in the
last two years [Location and year]. {N = Q218a = 1 or 2 or 3 or 4}
Indicator % (n) women
Optimal delivery care (at a health facility with a
trained provider)
*Trained provider is a doctor, nurse, or midwife. † Health facility is a health center or hospital.
13
September 2011
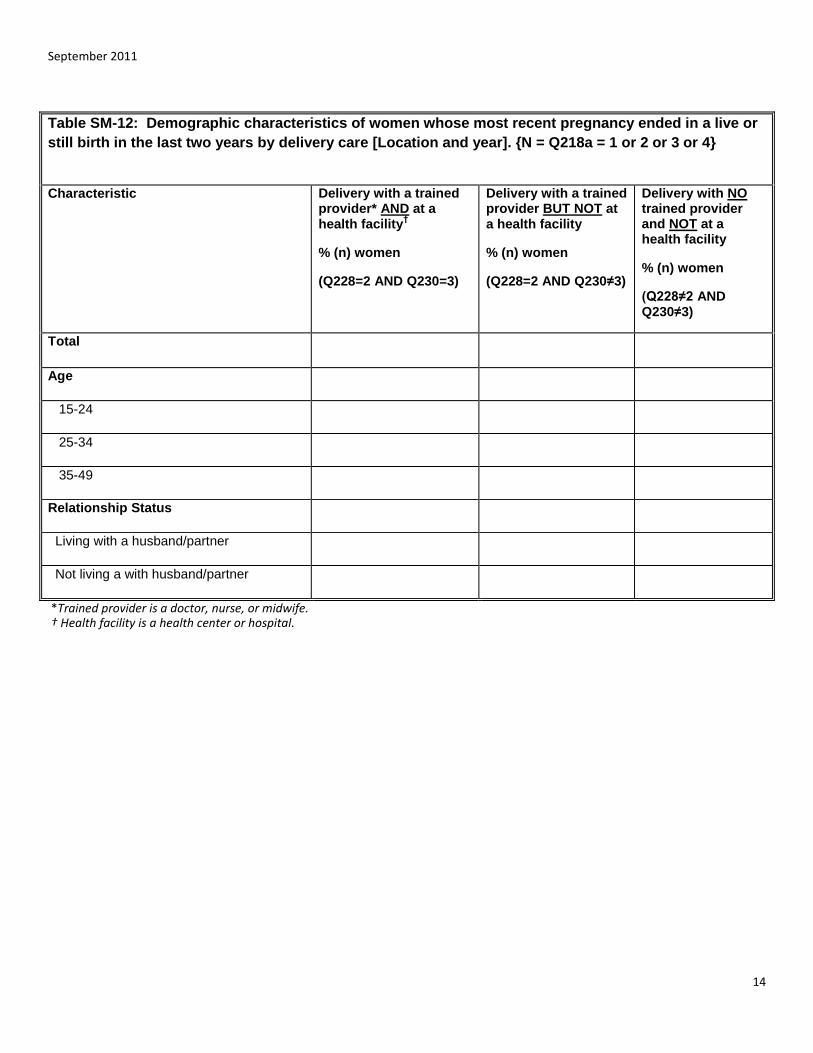
Table SM-12: Demographic characteristics of women whose most recent pregnancy ended in a live or
still birth in the last two years by delivery care [Location and year]. {N = Q218a = 1 or 2 or 3 or 4}
Characteristic Delivery with a trained provider* AND at a health facility
†
% (n) women
(Q228=2 AND Q230=3)
Delivery with a trained provider BUT NOT at a health facility
% (n) women
(Q228=2 AND Q230≠3)
Delivery with NO trained provider and NOT at a health facility
% (n) women
(Q228≠2 AND Q230≠3)
Total
Age
15-24
25-34
35-49
Relationship Status
Living with a husband/partner
Not living a with husband/partner
*Trained provider is a doctor, nurse, or midwife. † Health facility is a health center or hospital.
14

September 2011
Table SM-13: Types of complications among women
who reported at least one complication during labor and
delivery in their most recent pregnancy that ended in a
live or still birth in the last two years [Location and year].
{N = (Q218a = 1 or 2 or 3 or 4) AND Q231 = 1}
Labor and delivery complications % (n) women*
Heavy bleeding
Prolonged (>12 hours) labor
Vaginal tearing
Convulsions
Fever
Green or brown water coming from the
vagina
Water breaks and labor not induced within 6
hours
Placenta not expelled within 1 hour of birth
Other
*Total percentage may be greater than 100 because respondent could mention more than one response.
POSTPARTUM CARE
Key Indicator SM-H: Proportion of women who received at least
one postpartum care visit within six weeks of delivery among
women whose most recent pregnancy ended in a live or still birth
in the last two years [Location and year]. {N = Q218a = 1 or 2 or 3
or 4}
Indicator % (n) women
Received postpartum care visit
15

September 2011
Table SM-14: Demographic characteristics of women whose most recent
pregnancy ended in a live or still birth in the last two years by receipt of
postpartum care* [Location and year]. {N = Q218a = 1 or 2 or 3 or 4}
Characteristic Received postpartum care
% (n) women
(Q233≠4)
Did NOT receive postpartum care
% (n) women
(Q233=4)
Total
Age
15-24
25-34
35-49
Relationship Status
Living with a husband/partner
Not living a with husband/partner
*Health worker visited or the respondent went to health center.
Table SM-15: Receipt of information or counseling
about family planning during a postpartum visit among
women whose most recent pregnancy ended in a live or
still birth in the last two years AND received postpartum
care [Location and year]. {N= (Q218a = 1 or 2 or 3 or 4)
AND Q233 ≠ 4}
Characteristic % (n) women
Received information or counseling
Did NOT receive information or counseling
16
September 2011
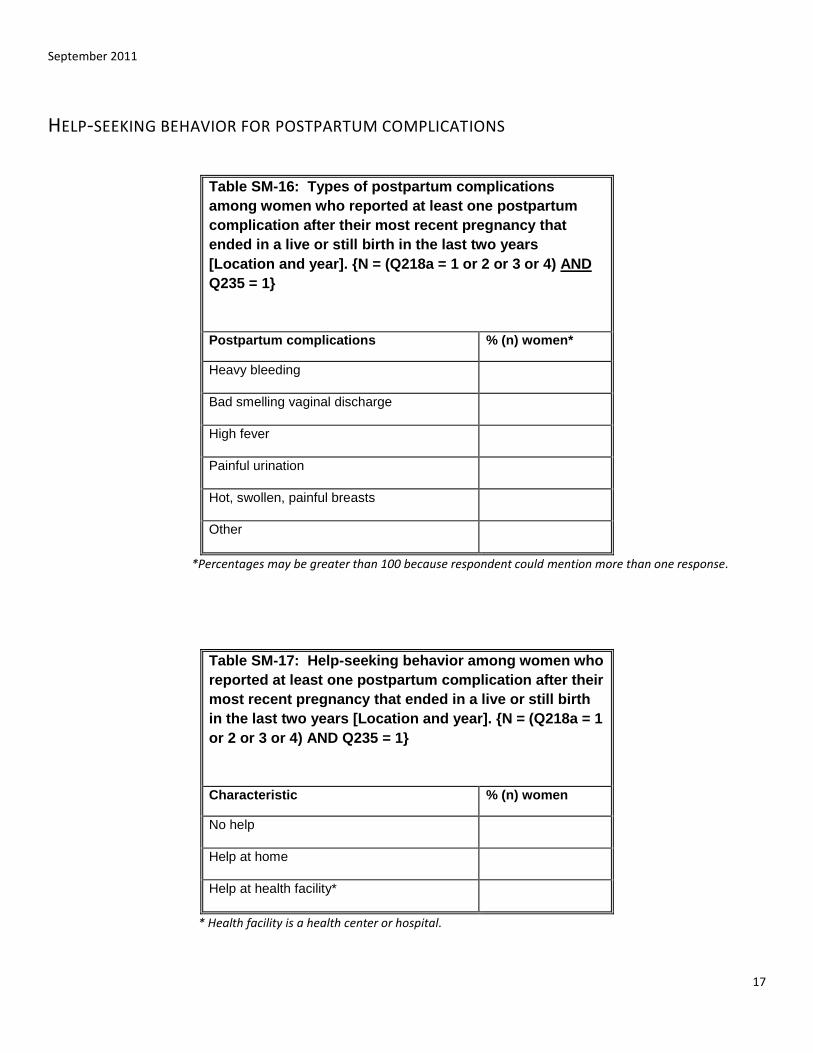
HELP-SEEKING BEHAVIOR FOR POSTPARTUM COMPLICATIONS
Table SM-16: Types of postpartum complications
among women who reported at least one postpartum
complication after their most recent pregnancy that
ended in a live or still birth in the last two years
[Location and year]. {N = (Q218a = 1 or 2 or 3 or 4) AND
Q235 = 1}
Postpartum complications % (n) women*
Heavy bleeding
Bad smelling vaginal discharge
High fever
Painful urination
Hot, swollen, painful breasts
Other
*Percentages may be greater than 100 because respondent could mention more than one response.
Table SM-17: Help-seeking behavior among women who
reported at least one postpartum complication after their
most recent pregnancy that ended in a live or still birth
in the last two years [Location and year]. {N = (Q218a = 1
or 2 or 3 or 4) AND Q235 = 1}
Characteristic % (n) women
No help
Help at home
Help at health facility*
* Health facility is a health center or hospital.
17
Related Documents


