Welcome message from author
This document is posted to help you gain knowledge. Please leave a comment to let me know what you think about it! Share it to your friends and learn new things together.
Transcript

QC Tools
Pareto Analysis
Flowcharts
Cause and effects diagrams
SPC
2

The Role of Quality (pre- WWII)
3
Make ProductRaw Materials
Production
Inspect Product
QAShip product
rework
RejectDid we forget
someone here?
Oops...

4
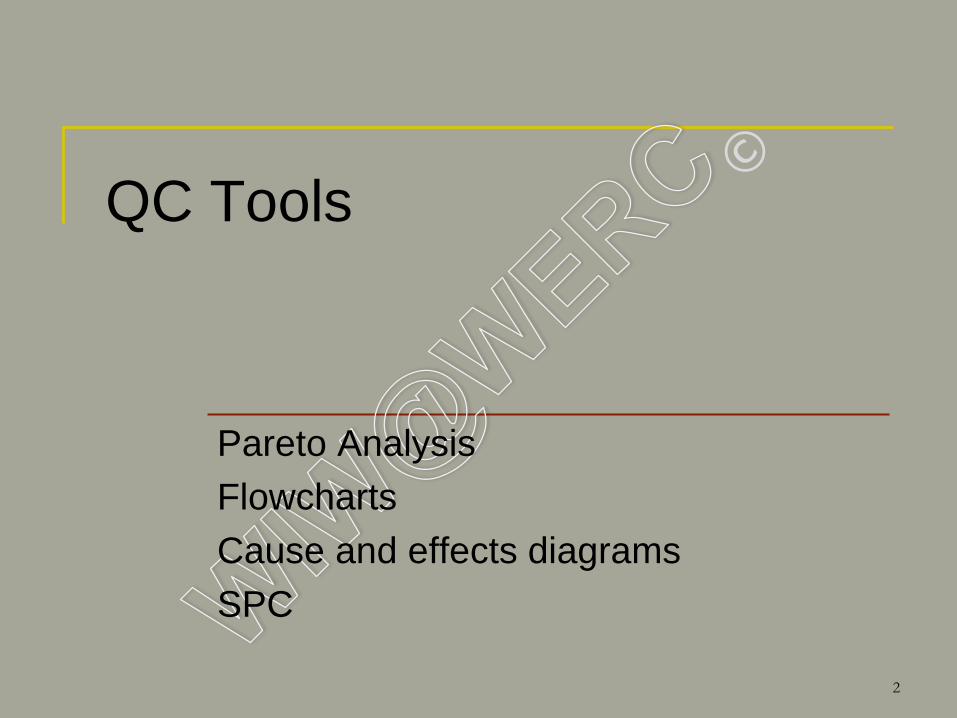
Modern Quality Management
Customer
ExpectationsTranslation
Quality
Control
Voice of the customer Voice of the processProcess specifications
5


Introduction to SPC
7
8
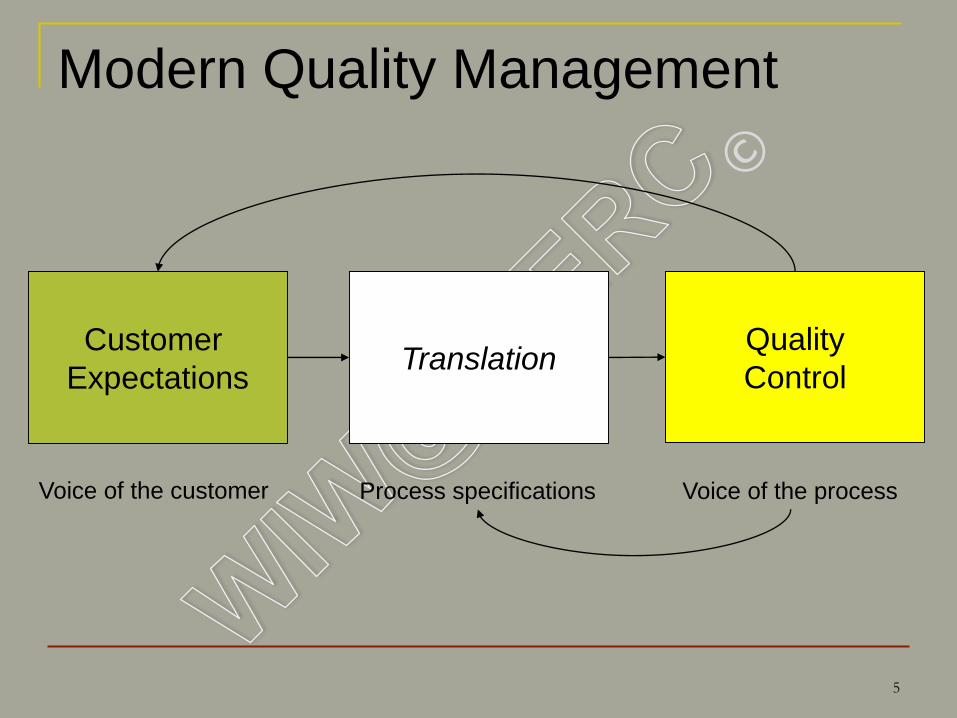
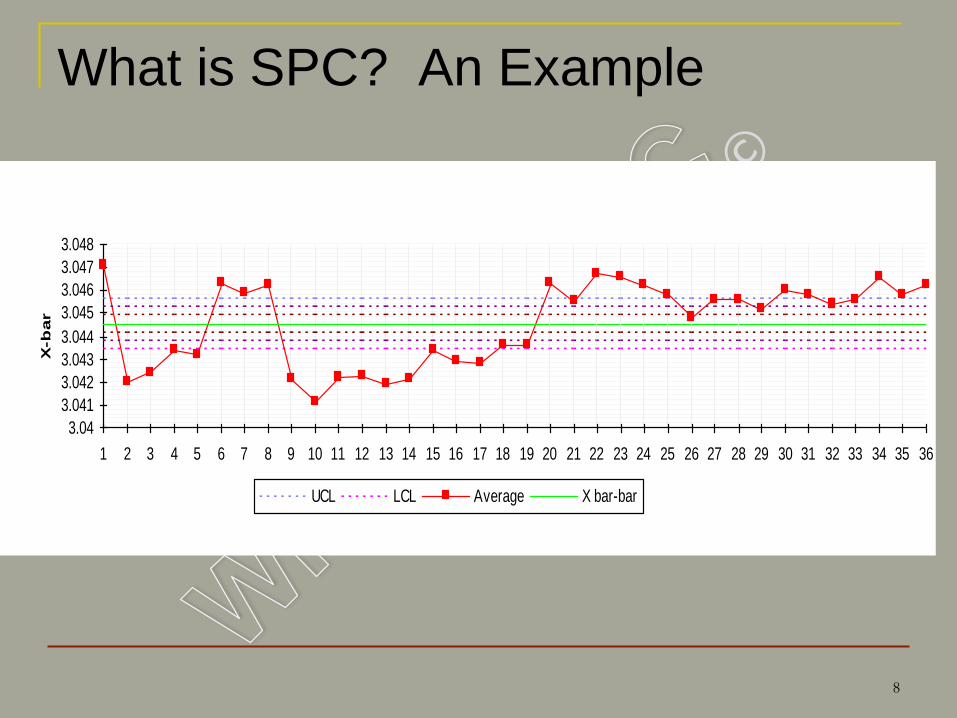
3.04
3.041
3.042
3.043
3.044
3.045
3.046
3.047
3.048
1 2 3 4 5 6 7 8 9 10 11 12 13 14 15 16 17 18 19 20 21 22 23 24 25 26 27 28 29 30 31 32 33 34 35 36
X-b
ar
UCL LCL Average X bar-bar
What is SPC? An Example

Day Shift
9
3.04
3.041
3.042
3.043
3.044
3.045
3.046
3.047
3.048
1 2 3 4 5 6 7 8 9 10 11 12 13 14 15 16 17 18 19 20 21 22 23 24 25 26 27 28 29 30 31 32 33 34 35 36
X-b
ar
UCL LCL Average X bar-bar

Swing Shift
10
3.043.0413.0423.0433.0443.0453.0463.0473.048
1 2 3 4 5 6 7 8 9 10 11 12 13 14 15 16 17 18 19 20 21 22 23 24 25 26 27 28 29 30 31 32 33 34 35 36
X-b
ar
UCL LCL Average X bar-bar

11
3.04
3.041
3.042
3.043
3.044
3.045
3.046
3.047
3.048
1 2 3 4 5 6 7 8 9 10 11 12 13 14 15 16 17 18 19 20 21 22 23 24 25 26 27 28 29 30 31 32 33 34 35 36
X-b
ar
UCL LCL Average X bar-bar
What the Customer Sees
Reducing reject rate from
30% to 20% = $120,000 per year

Origins of SPC
1920-30’s: SPC invented as economical means to control quality in manufacturing
1940-50’s: During WWII, Bell Labs personnel train armament manufacturers to use SPC U.S. economy intact, SPC “disappears”
Japanese devastated; W. Edwards Deming arrives
1960-70’s: Quality techniques blossom in Japan
1980’s: world begins to recognize “Made in Japan” as a sign of quality. In U.S., automotive and electronics industry lead “quality
revolution”
12
Origins of SPC
1990’s: SPC recognized by most U.S. industries as a vital QC tool In wood products industry, principal use is size control in
sawmills
2000’s: Real-time SPC “Black box” SPC?
13
Philosophy of SPC
Variation is the enemy and it is inevitable
inherent, common, random
special, assignable
Real improvement comes from defect
prevention, not defect detection - “You can’t
inspect quality into a product”
Prevent defects by monitoring, controlling &
reducing variation
Continuous process improvement to reduce
variation
14

If SPC is the answer,
what was the question?
What is the distribution of process output?
centering, range or “spread”, likelihood of an
extreme value
Is the process capable of meeting customer
expectations?
What is causing the variability?
When is it reasonable to “get tough” with
employees?
15

If SPC is the answer,
what was the question?
Can we afford to minimize the variability?
Over time, how can we be sure the process
hasn’t changed?
When should we “tinker” with the process and
when should we leave it alone?
16

SPC is only a tool
It complements, not replaces, existing knowledge
Use of SPC leads to
increased profits
increased productivity
increased employee involvement in the process
increased morale
New tools require change. Change fear, resistance,...
17

How & Why SPC Works
SPC in a “nutshell”
18

SPC in a “nutshell”:
Describe the distribution of process output
Estimate the limits within which the process
operates under “normal” conditions
Determine if the process is “stable”
Determine if the process is “capable”
19

Neither accurate,
nor precise
Precise, but
not accurate
Precise and
accurate
Distribution of process output
20

Moisture Content (%)
21

Creating Histograms
Using Excel
22

HistogramsHands-On
Open histogram1.xls
Enter in column E 2.5
2.55
2.6
2.65
Etc. to 3.05
Click on ‘Data’, ‘Data Analysis’, ‘Histogram’
Input range = C4:C128
Bin Range = E4:E15
Click ‘Chart Output’
23

HistogramsHands-On
Open histogram2.xls
24

SPC in a “nutshell”:
Describe the distribution of process output
Estimate the limits within which the process
operates under “normal” conditions
Determine if the process is “stable”
Determine if the process is “capable”
25
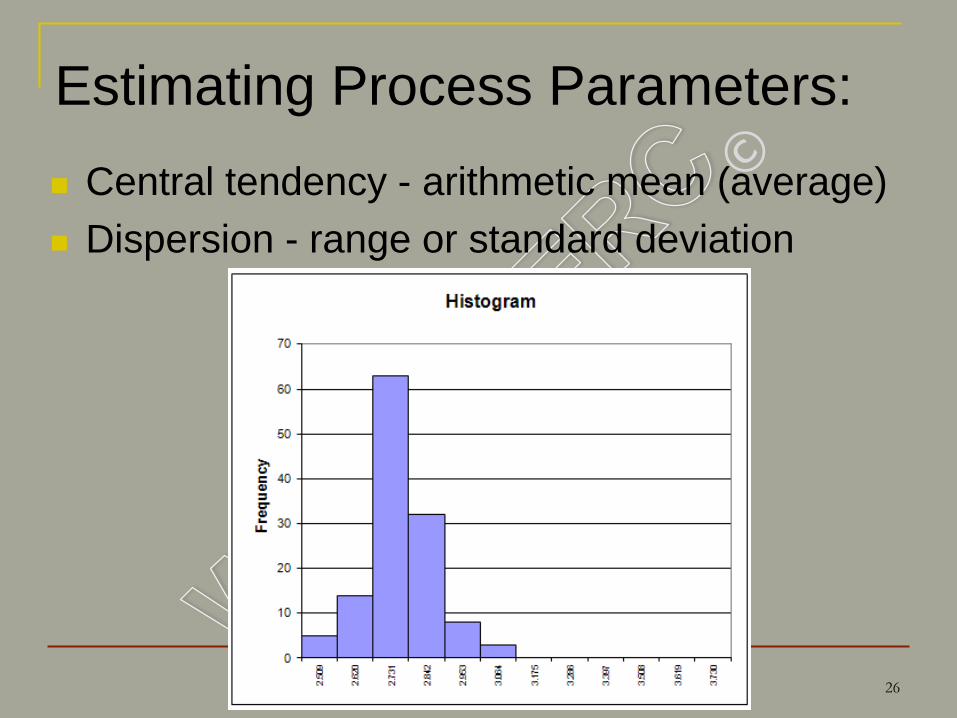
Estimating Process Parameters:
Central tendency - arithmetic mean (average)
Dispersion - range or standard deviation
26
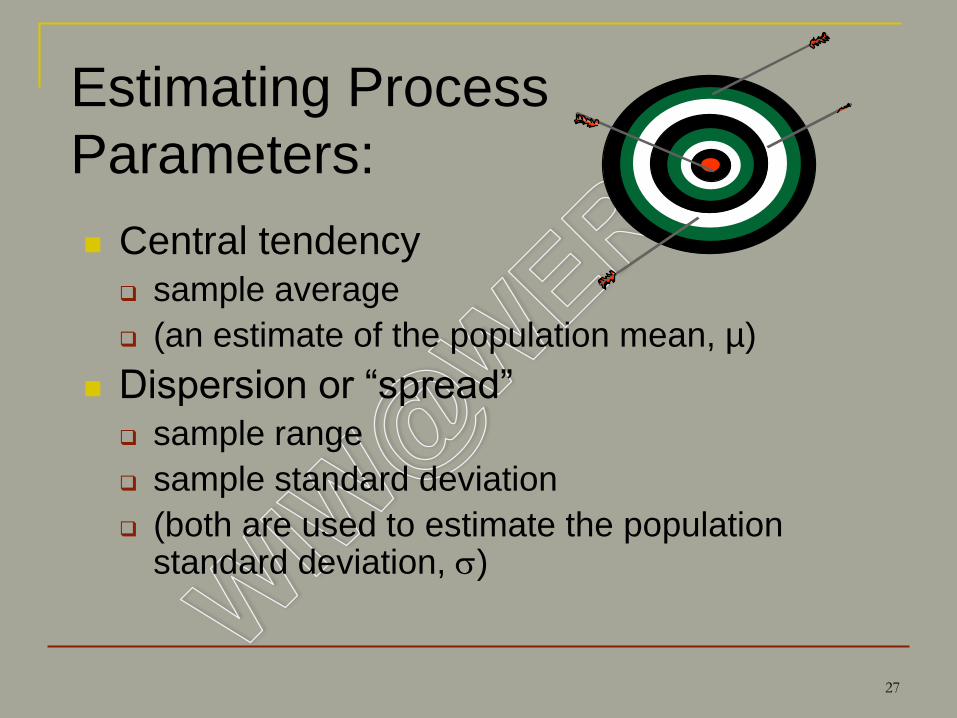
Estimating Process
Parameters:
Central tendency
sample average
(an estimate of the population mean, µ)
Dispersion or “spread”
sample range
sample standard deviation
(both are used to estimate the population standard deviation, )
27

Important Concepts:
Population – “the whole enchilada”
Parameter – a specific characteristic of the
population
Sample – a subset of the population, used to
estimate certain population parameters
Statistic* - a value derived from the sample,
an estimate of a parameter
* The word “statistics” has 2 meanings
1) the science of variation
2) estimates of population parameters
28

Estimating Process Parameters:
Process centering
n
i
i
n
xX
1
An estimate of the population mean, µ
mean or average,
29

Why isn’t the average good
enough?
Target 3.4”3.2
3.7
4.2
2.8
3.1
X = 3.4
We need a way to quantify the “spread”
in the data
X = 3.40
3.43
3.35
3.43
3.41
3.38
30

Estimating Process Parameters:
Process “spread”:
standard deviation,
range,
1
1
2
n
Xx
s
n
i
i
Both can be used to estimate the population
standard deviation, σ
XXRminmax
31
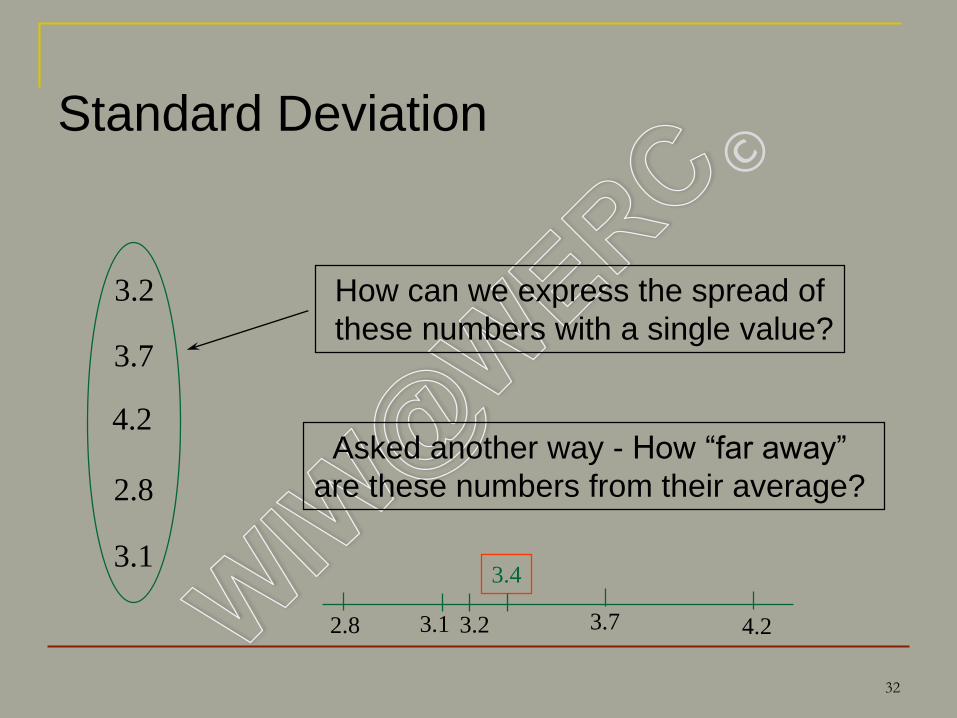
Standard Deviation
3.2
3.7
4.2
2.8
3.1
How can we express the spread of
these numbers with a single value?
Asked another way - How “far away”
are these numbers from their average?
2.8 3.1 3.2 3.7 4.2
3.4
32

Calculating Standard Deviation
- 3.4 = (-0.2)2 = 0.04
- 3.4 = (+0.3)2 = 0.09
- 3.4 = (+0.8)2 = 0.64
- 3.4 = (-0.6)2 = 0.36
- 3.4 = (-0.3)2 = 0.09
X = 3.4 sum = 1.22
1.22
5 - 1= 0.305
55.0305.0 s
1
1
2
n
Xx
s
n
i
i
3.2
3.7
4.2
2.8
3.1
33

Let’s try it using Excel
Start Excel
Enter the following data:
Calculate the mean and standard deviation
for each set of data
34
3.2
3.7
4.2
2.8
3.1
3.43
3.35
3.43
3.41
3.38

Do 2 numbers really tell us much?
Wouldn’t it be nice, if knowing only the
average and standard deviation, we could
determine the limits within which the process
should operate?
For example, given an average of 2.76%, and a
standard deviation of 0.102%, we might say that
over 99% of the product will have a MC between
2.45 and 3.07%.
35

Determining the “limits”:The Normal Distribution
Fre
quency
µ µ + 3µ - 3
2
2
2
)(
2
1)(
x
exF
36
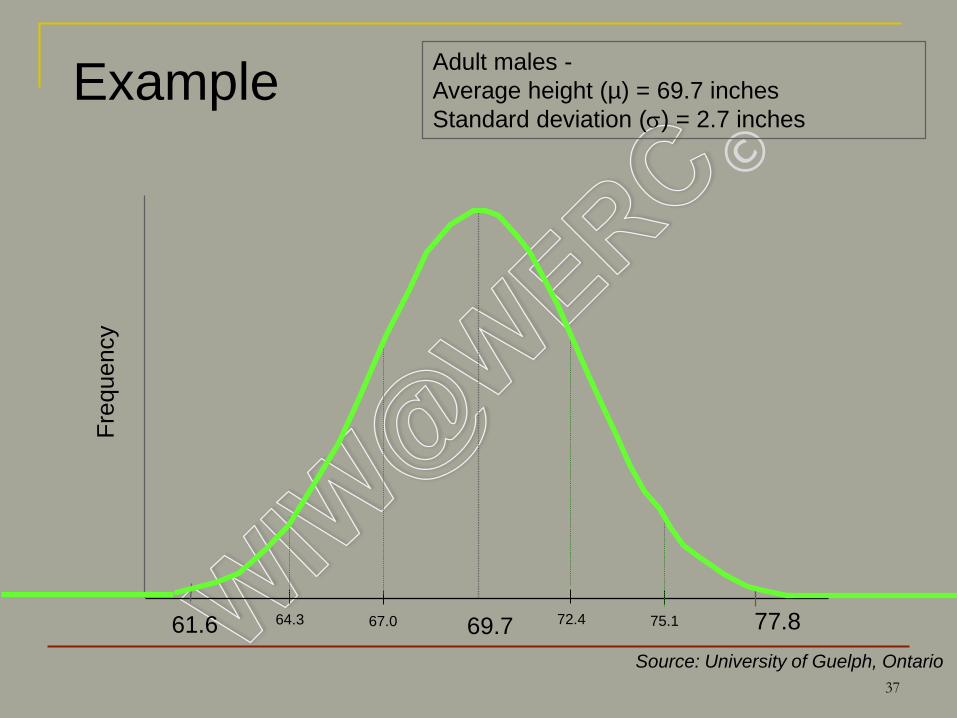
ExampleF
requency
69.7 77.8
Adult males -
Average height (µ) = 69.7 inches
Standard deviation () = 2.7 inches
61.6
Source: University of Guelph, Ontario
37
72.4 75.164.3 67.0

So what?
38

By knowing the average and standard
deviation, and that the numbers are
approximately normally distributed, we know
everything we need to know about the
distribution of process output - it is
predictable...
IF- we can somehow be sure that
the process is stable
39

ExampleF
requency
2.76 3.07
Moisture Content -
Average = 2.76%
Standard deviation = 0.102
2.45
40

SPC in a “nutshell”:
Describe the distribution of process output
Estimate the limits within which the process operates under “normal” conditions
Determine if the process is “stable”
Determine if the process is “capable”
41
Is the process “stable?”
or
in SPC lingo, is the process
in statistical control?
42

Causes of Variation Random, chance, constant, common,
unknown causes
the “rhythm” of the process
Assignable, special causes
something has changed
43

Examples of things that may be assignable
causes of variation:
machine troubles (damaged saw teeth, plugged
blowpipe, etc.)
faulty measuring device
operator overcontrol
worker fatigue
drastic changes in raw material
undocumented change in procedures
Assignable Causes of Variation:
44
“Statistical Control”
“A process is described as in control
when a stable system of chance
causes seems to be operating.”
(Grant & Leavenworth, Statistical Quality Control)
45
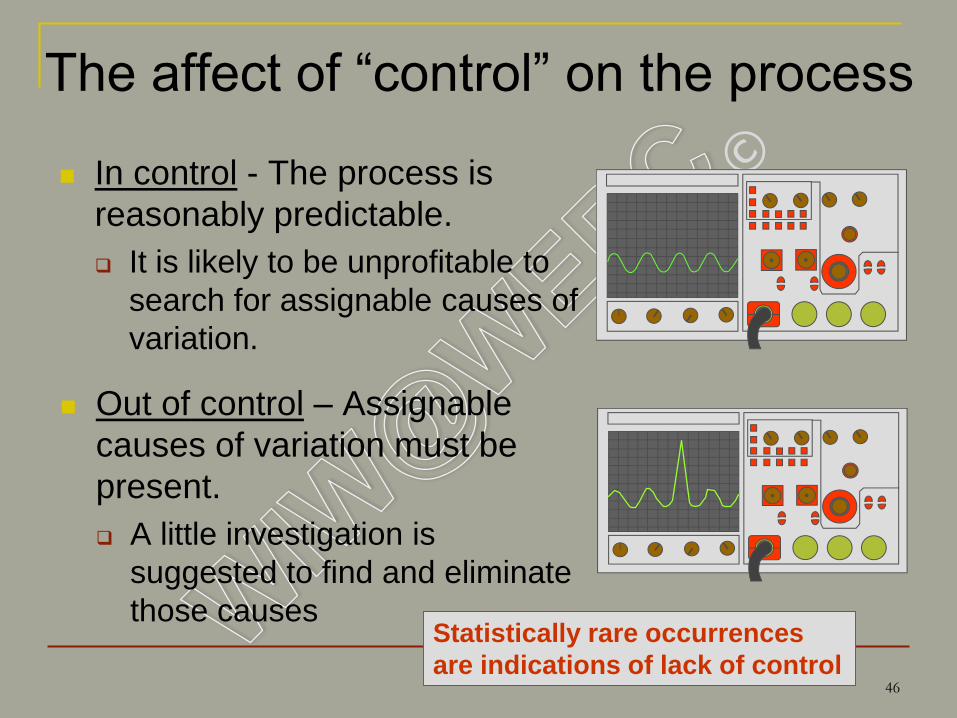
The affect of “control” on the process
In control - The process is
reasonably predictable.
It is likely to be unprofitable to
search for assignable causes of
variation.
Statistically rare occurrences
are indications of lack of control
Out of control – Assignable
causes of variation must be
present.
A little investigation is
suggested to find and eliminate
those causes
46

How about a little poker?
47

Either this guy’s cheatin’ or I’ve just witnessed a
statistical anomaly!
48

A statistically rare event -
An outcome with a very small probability of
occurrence (“the odds are against it”)
In manufacturing, an outcome that is
“statistically rare” usually signals the
presence of assignable causes of variation
How can you know what is statistically rare
and what is commonplace?
SPC
49

What is a “statistically rare
occurrence?”
Obtaining a sample value that is “very far away”
from the average is a highly unlikely event
In SPC, we usually define “very far away” as 3
µ µ + 3µ - 3
99.73%
50

Determining the state of control:The Control Chart Graphical view of the process over time
- central tendency - trends
- spread - changes
Average = X
UCL
LCL
Time51
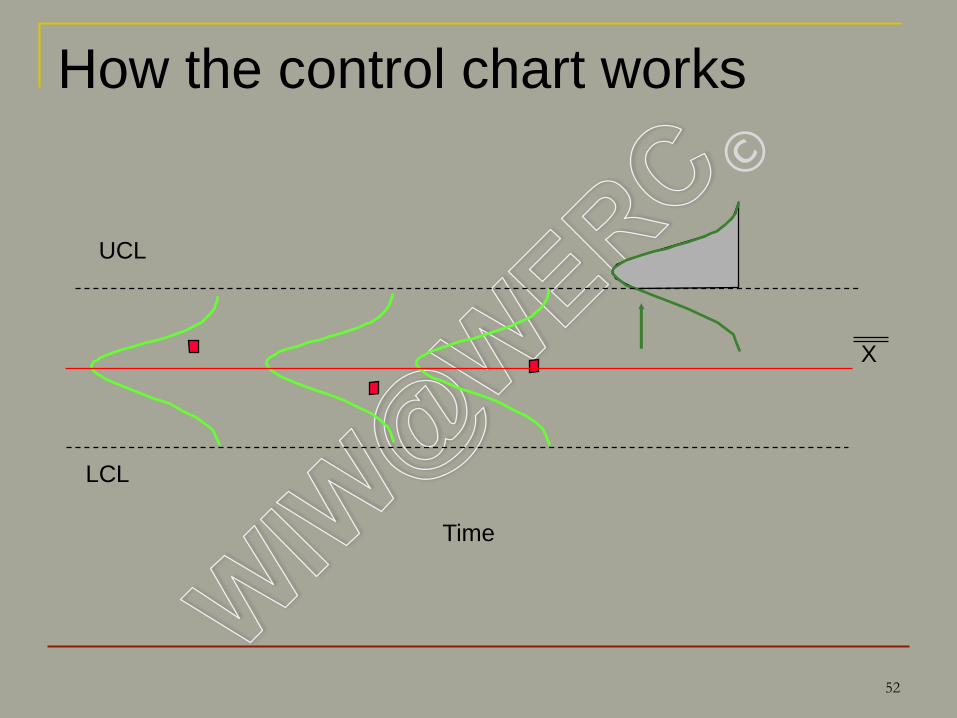
Time
LCL
UCL
How the control chart works
X
52

Control Charts:
Two different broad categories:
variables measurement data
attributes fraction defective (go/no-go data)
defect counts
53
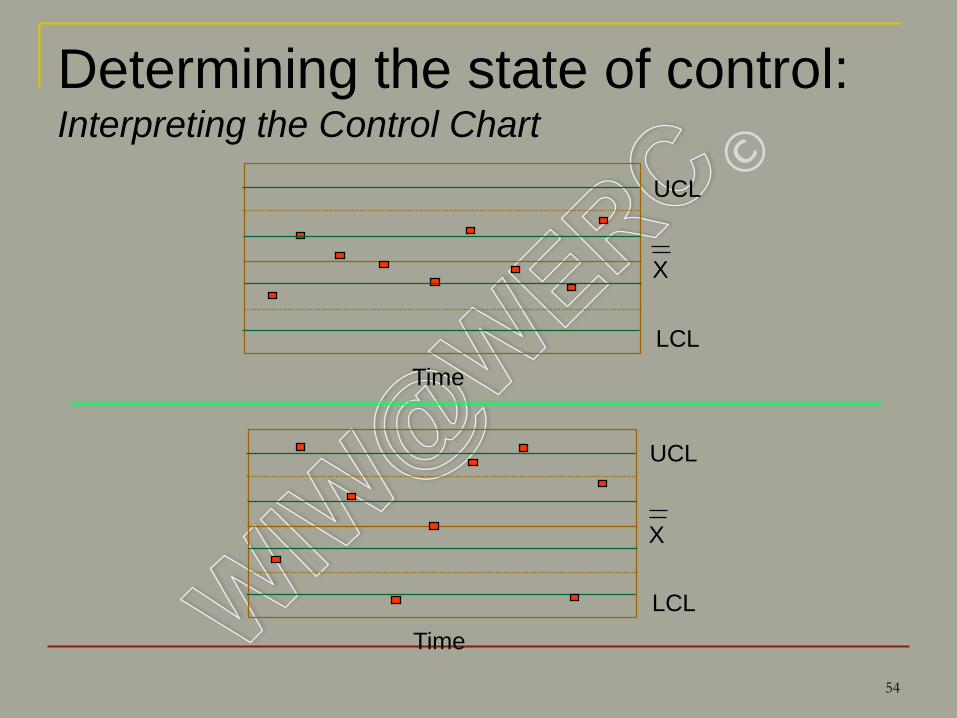
Determining the state of control:Interpreting the Control Chart
X
UCL
LCL
Time
X
UCL
LCL
Time
54

SPC in a “nutshell”:
Describe the distribution of process output
Estimate the limits within which the process operates under “normal” conditions
Determine if the process is “stable”
Determine if the process is “capable”
55

Is the process capable of
meeting specifications?
Process Capability Analysis:
Process capability - Measuring process potential by comparing the specification width to the variation of the process
or
How “wide” are the specs relative to the natural spread of the process?
56
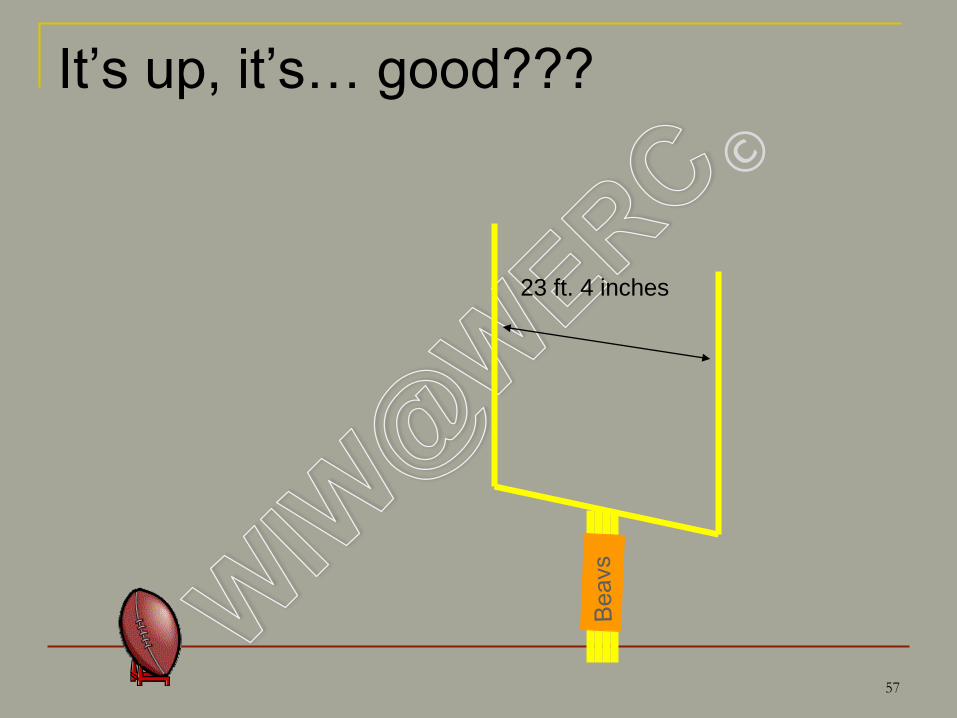
It’s up, it’s… good???
23 ft. 4 inches
57

What are the “specs?”
23.3011.65
58

A visual look at process variation
µLSL USL(Target) 59

Case Example
XYZ Forest Products Inc.
60
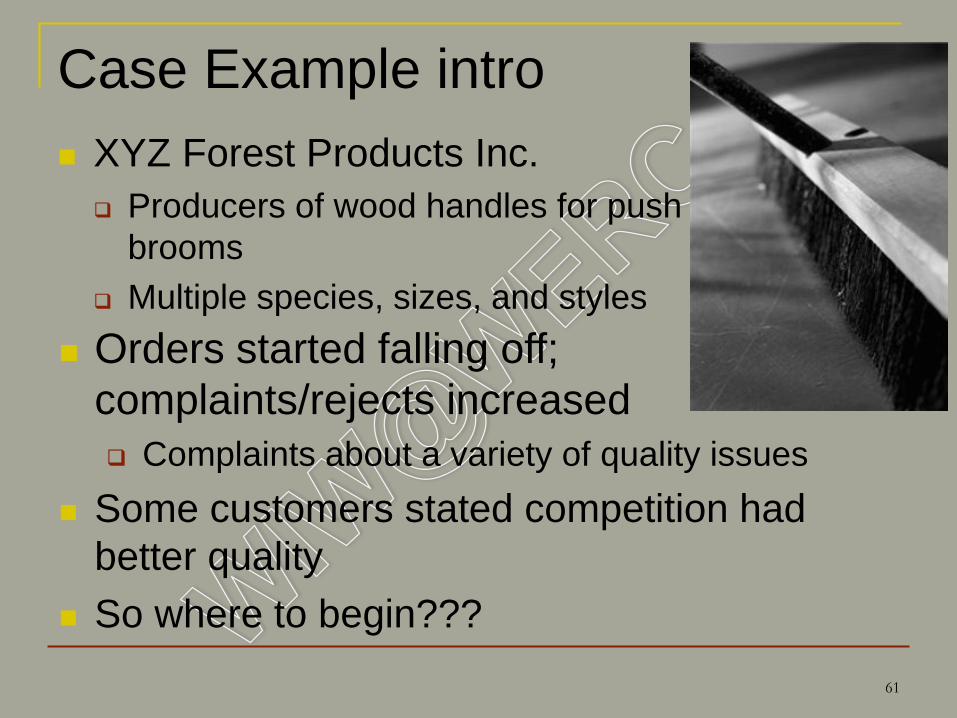
Case Example intro
XYZ Forest Products Inc.
Producers of wood handles for push
brooms
Multiple species, sizes, and styles
Orders started falling off;
complaints/rejects increased
Complaints about a variety of quality issues
Some customers stated competition had
better quality
So where to begin???
61

Case Example intro
Quality improvement team visited customers,
examined ‘scrap & rework’ bins
What to do next?
62
Pareto Analysis &
Checksheets
Where should we focus?
What’s the most important/costly quality problem?
63

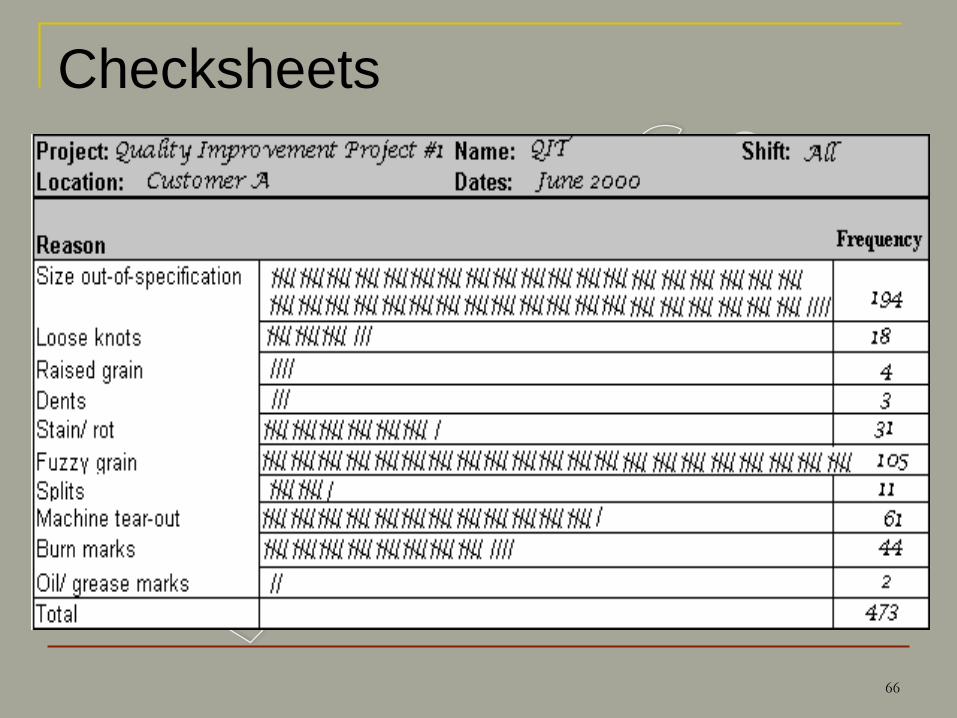
Checksheets
Record historical data or compile info as it
occurs
Observe patterns and trends
Stratification? – collect data separately for
shift, operator, etc.
Can drive the need for precise & consistent
definitions of nonconformities (or events)
64

NonconformitiesEstablishing precise & consistent definitions
A simple experiment:
Have several different people examine product
and tally # of nonconformities by category
Compare differences between inspectors
Develop a standard set (actual product
and/or photos) for each nonconformity
65
Checksheets
66

Pareto Charts
Based on Pareto principle
a.k.a., the “80:20 rule”
“the vital few vs. the trivial many”
It’s all about prioritizing!
Bar chart – similar to a histogram
Graphical method to view checksheet information
Data plotted in descending order
Include cost data
67

Pareto Chart - example
Category Frequency Cost/item
Size out of spec. 194 $0.12
Loose knots 18 $0.27
Raised grain 4 $0.07
Dents 3 $0.14
Stain/rot 31 $0.27
Fuzzy grain 105 $0.08
Splits 11 $0.14
Machine tear-out 61 $0.18
Burn marks 44 $0.08
Oil/grease marks 2 $0.06
68
Flowcharts
Where in the process might the
problems be occurring?
69

Flowcharts
Where (specific processes) might the
problems be occurring?
What quality characteristic should we
measure?
How does the process actually work (vs.
ideal)?
70

Flowcharts
1. Determine start & stop points
2. List major steps in process
3. Put steps in order
4. Draw flowchart
5. Test chart for accuracy & completeness
6. Look for opportunities to improve process
(remove non value-added activities)
71

Flowchart
Symbols
72

73

74

FlowchartingHands-On
Break into teams of 4 and draw a chart for:
Stacking lumber
Grading lumber
Kiln operation
Customer complaint resolution process
75

Cause & Effect Diagrams
What are some potential causes of the
problem?
76

Cause & Effect Diagrams(a.k.a. Ishikawa or ‘fishbone’ diagrams)
Purpose – organize & display interrelationships
of various theories of root cause of a problem
First step in root cause analysis
Enables clarification of thinking about potential
causes
Helps to avoid ‘pet theory’; can aid consensus-
building
Often done via brainstorming and/or w/
checksheets & flowcharts
77

Cause & Effect Diagrams
Process is often more important than product
Types
Dispersion analysis: cause categories
Process classification: process steps as
categories
Customer needs – ‘head’ is need; ‘bones’ are
specifications, components, features, etc.
78

Cause & Effect Diagrams
Effect
EnvironmentOperator
Machine Methods Materials
79

Cause & Effect DiagramsHands-On
Groups of 4 – the problem (effect) is:
Size out of specification
Machine tear-out on handles
Inconsistent color on units
Internal burning/checking
Surface checking
?
80

C&E Diagrams
81

Acknowledgements
SUSTAINABLE
Related Documents