Technical Documentation J.A. Lennox Report No. 14 ___ ....... LE P LAND ENVIRONMENT & PEOPLE

Welcome message from author
This document is posted to help you gain knowledge. Please leave a comment to let me know what you think about it! Share it to your friends and learn new things together.
Transcript
Technical Documentation
J.A. Lennox
Report No. 14
___ ....... LE P LAND ENVIRONMENT & PEOPLE
The New Zealand Tourism General Equilibrium Model (NZTGEM)
Technical Documentation
J.A. Lennox Senior Researcher, Ecological Economics
Landcare Research NZ, PO Box 40, Lincoln 7640
Land Environment and People Research Report No. 14
April 2010
ISSN 1172‐0859 (Print)
ISSN 1172‐0891 (Online)
ISBN 978‐0‐86476‐228‐3
Lincoln University, Canterbury, New Zealand
Reviewed by:
Dr Tien Pham University of Queensland
Acknowledgements The NZTGEM model was developed as part of the ‘Oil and Tourism’ project of Lincoln University, funded by the Foundation for Research Science and Technology, New Zealand. The author is grateful for the many contributions of made by the entire research team (led by Susanne Becken and including Aaron Schiff, Shane Vuletich, John Small and Andrea Carboni) to developing the concepts and empirical underpinnings for the NZTGEM model. Officials from the Ministries of Tourism and Transport also provided useful advice regarding some of the many areas where underlying data were deficient or entirely lacking. Finally, the author thanks Tien Pham for the many constructive suggestions contained in his review of this report.
©LEaP, Lincoln University, New Zealand 2008 This information may be copied or reproduced electronically and distributed to others without restriction, provided LEaP, Lincoln University is acknowledged as the source of information. Under no circumstances may a charge be made for this information without the express permission of LEaP, Lincoln University, New Zealand. Series URL: http://hdl.handle.net/10182/2345
The New Zealand Tourism General Equilibrium Model (NZTGEM)
Contents
Contents ...................................................................................................................................... i List of Tables................................................................................................................................ii List of Figures...............................................................................................................................ii Chapter 1 Introduction........................................................................................................ 1 Chapter 2 Background......................................................................................................... 3
2.1 CGE Models .......................................................................................... 3 2.2 Tourism CGE Models ............................................................................ 4 2.3 Tourism Social Accounting Matrices .................................................... 5
Chapter 3 A Tourism Social Accounting Matrix (SAM) for New Zealand ............................ 7
3.1 Overview............................................................................................... 7 3.2 Construction of the Basic Social Accounting Matrix ............................ 8 3.3 Tourist Consumption ............................................................................ 9 3.4 Production of Accommodation, Domestic and International Transport ............................................................................................ 10
Chapter 4 The New Zealand Tourism General Equilibrium Model (NZTGEM).................. 17
4.1 Domestic Production .......................................................................... 17 4.2 Markets............................................................................................... 20 4.3 International Air Passenger Transport ............................................... 20 4.4 Institutions.......................................................................................... 22 4.5 Tourist Demands ................................................................................ 24
Chapter 5 Application of the model ................................................................................. 27 References................................................................................................................................ 29 Appendix 1 Input‐output Sectors and Tourism Activities................................................... 33 Appendix 2 Concordance between Tourism Satellite Account, Input‐output Sectors and Tourism Activities ...................................................................................... 35
i
The New Zealand Tourism General Equilibrium Model (NZTGEM)
List of Tables
Table 1 Institutional Accounts in the SAM................................................................................. 9
Table 2 International Visitor Market Segments and 4‐letter Codes .......................................... 9
Table 3 Accommodation activities in NZTGEM and energy cost shares.................................. 11
Table 4 Tax and Bus Transport Activities in NZTGEM and Energy Cost Shares ....................... 11
Table 5 Estimated consumption of ordinary products in NZTGEM by international tourists ($m 2006) .............................................................................................................. 15
Table 6 Estimated consumption of tourism products in NZTGEM by international tourists ($m 2006) ................................................................................................. 16
Table 7 Elasticities for agricultural and forestry industries ..................................................... 19
Table 8 Elasticities for non‐land based industries and tourism activities............................... 19
Table 9 Assumed domestic carrier air passenger market shares ............................................ 21
Table 10 Elasticities for inbound tourist market segments ..................................................... 25
List of Figures
Figure 1 Circular Flow of Payments in a Basic CGE Model.................................................... 3
Figure 2 Structure of the New Zealand Tourism Social Accounting Matrix .......................... 8
Figure 3 Generic industry production structure in NZTGEM .............................................. 18
Figure 4 Land‐based industries’ production structure in NZTGEM..................................... 19
Figure 5 Household consumption function in NZTGEM...................................................... 22
Figure 6 Tourism demand function for each inbound tourist market ................................ 24
ii
The New Zealand Tourism General Equilibrium Model (NZTGEM)
Chapter 1 Introduction
The New Zealand Tourism General Equilibrium Model (NZTGEM) is a multisectoral economic model designed specifically to analyse the long‐run impacts of tourism and related policies, and of external economic shocks affecting international inbound tourism. As inbound international tourism currently accounts for about 16 percent of New Zealand’s total exports and total tourism consumption for about 5 percent of GDP, understanding the direct and indirect economic impacts of such policies and shocks is of vital interest to both policy‐makers and industry. Conventionally, such economic analyses have relied on the use of the Tourism Satellite Account and the calculation of indirect effects using input‐output multipliers (e.g. Butcher et al., 1998). However, these methods cannot account for general equilibrium effects, which may often be important. For example, they will typically over‐estimate the macroeconomic benefits of advertising and other policies that increase international tourism demand (Dwyer et al., 2004). Other things being equal, such policies will tend to drive up the real exchange rate in the long run, decreasing the competitiveness of other exports and of domestic production that competes with imports. Other CGE models of the New Zealand economy already exist (see e.g. Lennox and van Nieuwkoop, 2009, in preparation; NZIER and Infometrics, 2009). However, NZTGEM treats tourism in much more detail than any of those models. It includes an explicit and relatively detailed description of tourist demand for eighteen international market segments and domestic leisure tourists. On the supply side, accommodation and domestic transport are modelled in detail (five types of accommodation and six of domestic transport), while the supply of international air transport to and from New Zealand is modelled specifically for each tourist market segment. Particular attention is given to demands for energy, as the model was initially developed to analyse the impacts of higher oil prices. This report describes the NZTGEM model and the key underlying dataset: a social accounting matrix extended for tourism. NZTGEM does not explicitly model the choice of inbound tourists between New Zealand and alternative destinations (which include their home country). It also does not model the response of other economies more generally to external shocks. Either or both of these may be important limitations when modelling external policies or shocks. Such limitations could be overcome in a global general equilibrium model for tourism. However, constructing such a model would be both a formidable undertaking, and would in practice, limit the detail in tourism and the wider economy in New Zealand that could be modelled. An alternative, partial but pragmatic solution is to ‘link’ NZTGEM with a suitable global model, such that some of the global model outputs become inputs of the NZTGEM model. We have demonstrated this approach by linking the Global Trade Analysis Project (GTAP)1 global
1 Global Trade Analysis Project. A description of the model and other information may be found at https://www.gtap.agecon.purdue.edu/ (accessed June 2010).
1

The New Zealand Tourism General Equilibrium Model (NZTGEM)
2
general equilibrium model to NZTGEM to develop high oil price scenarios. The linking method and scenario are described by Lennox (2010).
The New Zealand Tourism General Equilibrium Model (NZTGEM)
Chapter 2 Background
2.1 CGE Models
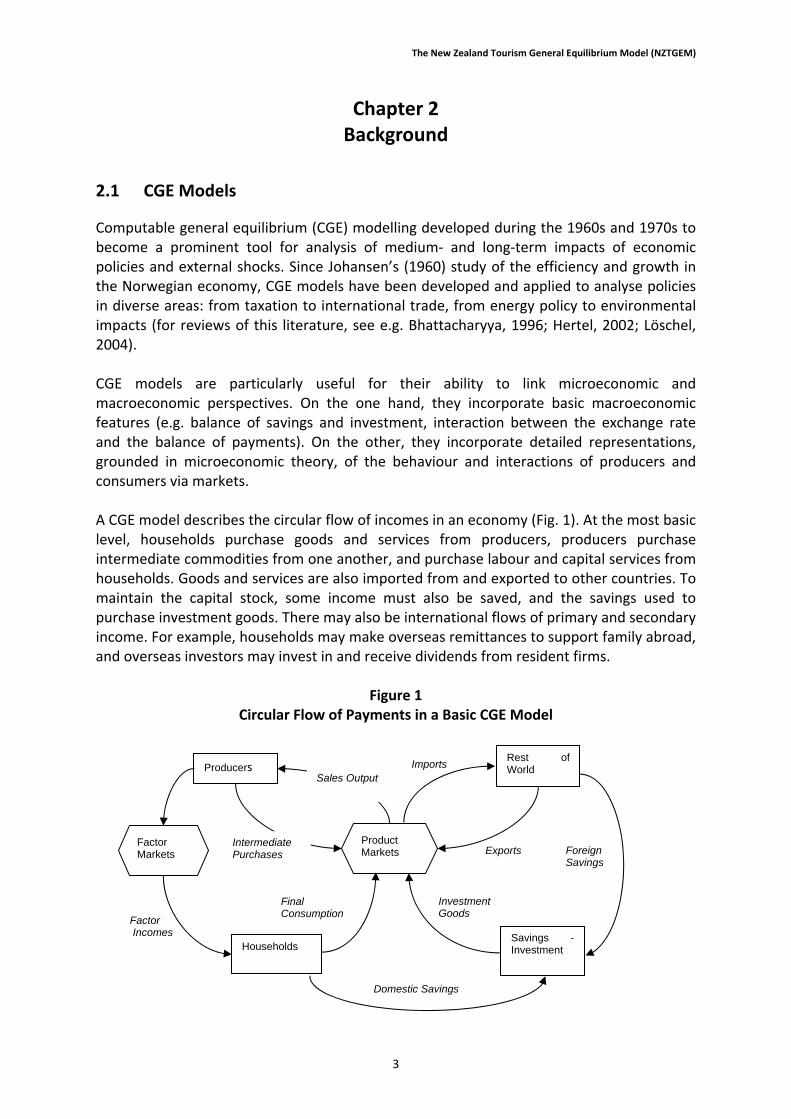
Computable general equilibrium (CGE) modelling developed during the 1960s and 1970s to become a prominent tool for analysis of medium‐ and long‐term impacts of economic policies and external shocks. Since Johansen’s (1960) study of the efficiency and growth in the Norwegian economy, CGE models have been developed and applied to analyse policies in diverse areas: from taxation to international trade, from energy policy to environmental impacts (for reviews of this literature, see e.g. Bhattacharyya, 1996; Hertel, 2002; Löschel, 2004). CGE models are particularly useful for their ability to link microeconomic and macroeconomic perspectives. On the one hand, they incorporate basic macroeconomic features (e.g. balance of savings and investment, interaction between the exchange rate and the balance of payments). On the other, they incorporate detailed representations, grounded in microeconomic theory, of the behaviour and interactions of producers and consumers via markets. A CGE model describes the circular flow of incomes in an economy (Fig. 1). At the most basic level, households purchase goods and services from producers, producers purchase intermediate commodities from one another, and purchase labour and capital services from households. Goods and services are also imported from and exported to other countries. To maintain the capital stock, some income must also be saved, and the savings used to purchase investment goods. There may also be international flows of primary and secondary income. For example, households may make overseas remittances to support family abroad, and overseas investors may invest in and receive dividends from resident firms.
Figure 1 Circular Flow of Payments in a Basic CGE Model
Producers
Households
Product Markets
Factor Markets
Savings - Investment
Imports Rest of World
Sales Output
Intermediate Purchases Foreign
Savings Exports
Final Consumption
Investment Goods
Factor Incomes
Domestic Savings
3
The New Zealand Tourism General Equilibrium Model (NZTGEM)
2.2 Tourism CGE Models
From the late 1990s, CGE models have been developed and applied to answer questions relating specifically to tourism. The earliest contributions were made by Adams and Parmenter (1995) on tourism in Australia and by Zhou (1997) on tourism in Hawaii. The key distinguishing feature of ‘tourism CGE models’ is their explicit representation of domestic and/or international tourist demands. Explicit representation of tourism demands is important for two reasons. From an analytical perspective, it allows a clear and conceptually correct delimitation of ‘tourism’ in the economy. Consumption of goods and services by domestic and international tourists is distinguished from non‐tourism household consumption and exports (respectively) of the same types of goods and services. From a modelling perspective, this distinction of tourism and non‐tourism consumption allows the complementarity of travel, accommodation and other goods and services consumed by tourists to be represented. Production activities relevant to tourism may also be represented in more detail in tourism CGE models than is typical of non‐tourism CGE models. However, this is more a difference in degree than in kind, and the same strategy is applied in many other fields of application (e.g. energy policy, agricultural policy). The degree of detail that is desirable is usually guided by the problem at hand, while it may often be constrained by the availability of data and sometimes, by computational or other practical considerations. Over the last decade, tourism CGE models have been developed for numerous countries and regions and applied to analyse the impacts of a wide variety of external shocks and domestic policies. These include for example:
The contribution of tourism to the economy of the state of New South Wales, Australia (Madden and Thapa, 2000);
The US response to September 11 (Blake and Sinclair, 2003);
Foot and mouth disease in the UK (Blake et al., 2003a);
The effects of EU accession on Malta and Cyprus (Blake et al., 2003b);
Economic impacts of tourism in Fiji (Narayan, 2004);
Globalisation and the economic impacts of tourism in Indonesia (Sugiyarto et al., 2003);
Economic impacts of tourism in China (Fan and Oosterhaven, 2005);
Tourism taxation in Mauritius (Gooroochurn and Sinclair, 2005);
Forecasting tourism impacts in Scotland (Blake et al., 2006);
Tourism taxation in Spain (Labandeira et al., 2006); and
Tourism development and poverty in Thailand (Wattanakuljarus and Coxhead, 2008).
This list is far from exhaustive and gives preference to studies published in academic journals. As reflected in this list though, one finds more generally a relatively large number of studies for smaller economies in which tourism has an important or even a dominant economic role. Given the importance of international tourism (including for most of the countries listed above), one might be surprised that there has not been a parallel development of multi‐
4
The New Zealand Tourism General Equilibrium Model (NZTGEM)
5
country and global tourism CGE models. The sole example of which we are aware is an adaptation of the GTAP model to assess climate change impacts on global tourism (Berrittella et al., 2006). This is probably explained by the limited data that are available to support such modelling efforts, as explained in the next section.
2.3 Tourism Social Accounting Matrices
The key dataset underpinning a CGE model is known as a social accounting matrix (SAM). A SAM has a square matrix format in which each entry (i,j) is a payment made by the jth account to the ith account. The accounting period is usually one year and the CGE model is ‘calibrated’ to that year. That is, economic parameters are determined such that the model can reproduce exactly the economy as described by the SAM. Note that the SAM alone is insufficient to fully specify most CGE models. Other parameter values—most commonly elasticities of substitution in production and consumption—must be identified by other means. A simple SAM typically includes accounts for industries, for products, for capital and labour, for the government, for households, and an external account. For example:
Total wage earnings are recorded as a payment from the labour to the household account;
Exports of milk products are recorded as a payment from the external account to the account for milk products; and
Sales of milk by firms are recorded as payments from the milk products account to the industry (or possibly industries) to which those firms belong.
The SAM as described thus far is not tourism‐specific. To create a tourism SAM, payments must be distinguished by purpose: tourism or non‐tourism. For example, exports must be split into tourism and non‐tourism exports. The former could be further split according to say the country of origin and/or the purpose of travel. A Tourism Satellite Account (TSA) provides the essential data needed to distinguish tourism within the more comprehensive SAM framework. Guidelines for TSAs are provided by the United Nations World Tourism Organisation (UNWTO, 2002).

The New Zealand Tourism General Equilibrium Model (NZTGEM)
The New Zealand Tourism General Equilibrium Model (NZTGEM)
Chapter 3 A Tourism Social Accounting Matrix (SAM) for New Zealand
3.1 Overview
A detailed tourism SAM for New Zealand was constructed for the year 2006, drawing on four key datasets:
Input‐output tables for 2005–06 (Stroombergen, 2008);
National Accounts 2005–06 (Statistics New Zealand, 2006);
Tourism expenditure from the TSA 2005–06 (Statistics New Zealand, 2007); and
TSA‐consistent expenditure estimates for 18 international visitor market segments (Becken et al., 2008).
The first two datasets allow us to construct an ordinary SAM. Tourism sales and expenditure are then disaggregated using the second two datasets. The basic structure of the tourism SAM is shown in Figure 2 (below) Structure of the New Zealand Tourism Social Accounting Matrix, with the household and government sectors combined for simplicity. Each tourism activity and each international visitor market segment has a separate account in the tourism SAM. The latter requires balancing ‘transfers’ of funds from the generic external account that constitute the ‘New Zealand tourism budget’ of each visitor market. The tourism SAM includes the following accounts:
General (53) and tourism‐specific (11) production activities/products
Tourist market‐specific international air transport to/from New Zealand
Factors of production (capital, labour, land)
Direct and indirect taxes
The household sector
The government sector
Savings and investment
Eighteen international tourist markets
The general (non‐tourism) foreign sector
7
The New Zealand Tourism General Equilibrium Model (NZTGEM)
Figure 2 Structure of the New Zealand Tourism Social Accounting Matrix
I
Ordinary industries
II Tourism activities
III Factor markets
IV Households & Government
V Savings‐Investment
VI Rest of World (excl. tourism)
VII Int’l tourist markets
I Intermediate uses of ordinary products
Final uses Investment goods
Non‐tourism exports
II Intermediate uses of tourism products
Domestic tourism consumption
International tourism consumption
III Factor inputs
IV Indirect taxes Factor incomes
Net direct taxes and transfers
V Depreciation Net saving Net foreign borrowing
VI Imported intermediate inputs Direct imports to final demand
VII Factor payments abroad
Net transfers abroad
Tourism budgets
3.2 Construction of the Basic Social Accounting Matrix
At the core of the SAM, is an inter‐industry input‐output (IO) table. This table describes the purchases of one industry from another, abstracting from the distinct commodities produced by them (see e.g. Miller and Blair, 2009). The IO table also shows imports, industries’ value added, and final demand for and exports of industry output. These tables provide data for the combined first and second columns, and combined first and second rows of the SAM as illustrated in Figure 2 – Structure of the New Zealand Tourism Social Accounting Matrix. That is, tourism‐specific production and consumption are not yet distinguished. There are 53 industries/products distinguished at this point. The remaining non‐tourism entries in the SAM (Table 1 below) are based on the national accounts (Statistics New Zealand, 2009b). Assumptions must be made in some cases, as New Zealand does not have a full and consistent set of institutional accounts. The methodology and limitations are explained in Lennox and van Nieuwkoop (in preparation).
8
The New Zealand Tourism General Equilibrium Model (NZTGEM)
Table 1
Institutional Accounts in the SAM
Labour Capital Taxes Households Government Savings‐Investment
External Account
Taxes 21096 12846 0 8532 671 952 785
Household 49024 14815 0 0 16357 10464 3712
Government 0 3176 54707 678 0 0 0
Change in inventories 0 0 0 0 0 697 0
Savings & Investment 0 21587 0 0 12423 0 14471
Rest of World 0 13229 0 105 1120 0 0
3.3 Tourist Consumption
New Zealand’s Tourism Satellite Accounts (TSA) provide relatively detailed information on expenditure of domestic leisure, business, government and international tourists. However, they do not distinguish international visitor market segments, nor the full 53 sector products compatible with the IO tables in the SAM framework. Thus, we use market segment expenditure data (Becken et al., 2008) to distribute TSA expenditure across 18 international visitor market segments (Table 2) proportionally.
Table 2 International Visitor Market Segments and 4‐letter Codes
Markets 4‐letter code
Australia FIT Holiday AUFH
Australia FIT VFR AUFV
Australia FIT Other AUFO
Australia Tour AUTR
UK Holiday UKHL
UK VFR and Other UKVO
USA FIT Holiday USFH
USA FIT VFR and Other USFV
USA Tour USTR
Japan FIT Holiday JPFH
Japan FIT VFR and Other JPFV
Japan Tour JPTR
South Korea All KRAT
China FIT CNFT
China Tour CNTR
Germany All DEAT
Rest of World FIT RWFT
Rest of World Tour RWTR
FIT = Free, independent traveller; VFR = visiting friends and relatives; Tour = tour group; Other travel includes business travel and education related tourism.
9
The New Zealand Tourism General Equilibrium Model (NZTGEM)
As the market segment expenditure data are already scaled to be consistent with the international visitor account of the TSA, the steps to fully disaggregate international visitor expenditure within the SAM are as follows: 1. Distribute expenditure data for each tourist market across relevant TSA product
categories in the same proportions as for aggregate expenditure; 2. Distribute TSA‐disaggregated expenditure of each visitor market across relevant IO
industries in fixed proportions; and 3. Subtract total tourism exports thus calculated from the total export values per the IO
accounts. For domestic business and government tourism, consumption of tourism products are allocated over industries in proportion to their consumption of the parent products. A small number of ad hoc exceptions are made to this rule in cases where this apportionment was clearly inappropriate.
3.4 Production of Accommodation, Domestic and International Transport
The 53 industries of the IO table do not provide a sufficiently detailed description of tourism sector supply. We therefore disaggregate some of them to distinguish a number of tourism‐characteristic production activities. The generic steps for disaggregation of these activities are: 1. Calculate input‐output coefficients (i.e. dollars input per dollar output) for the parent
sectors; 2. Adjust energy and in some cases factor input coefficients for these activities and in some
cases, the residual sector, based on bottom‐up data; 3. Calculate the corresponding inputs by multiplying by the aggregate demand for each
activity and enter these into columns of the SAM; and 4. Use a bi‐proportional scaling algorithm to rebalance the intermediate uses in the SAM
given fixed row and column totals.
3.4.1 Accommodation
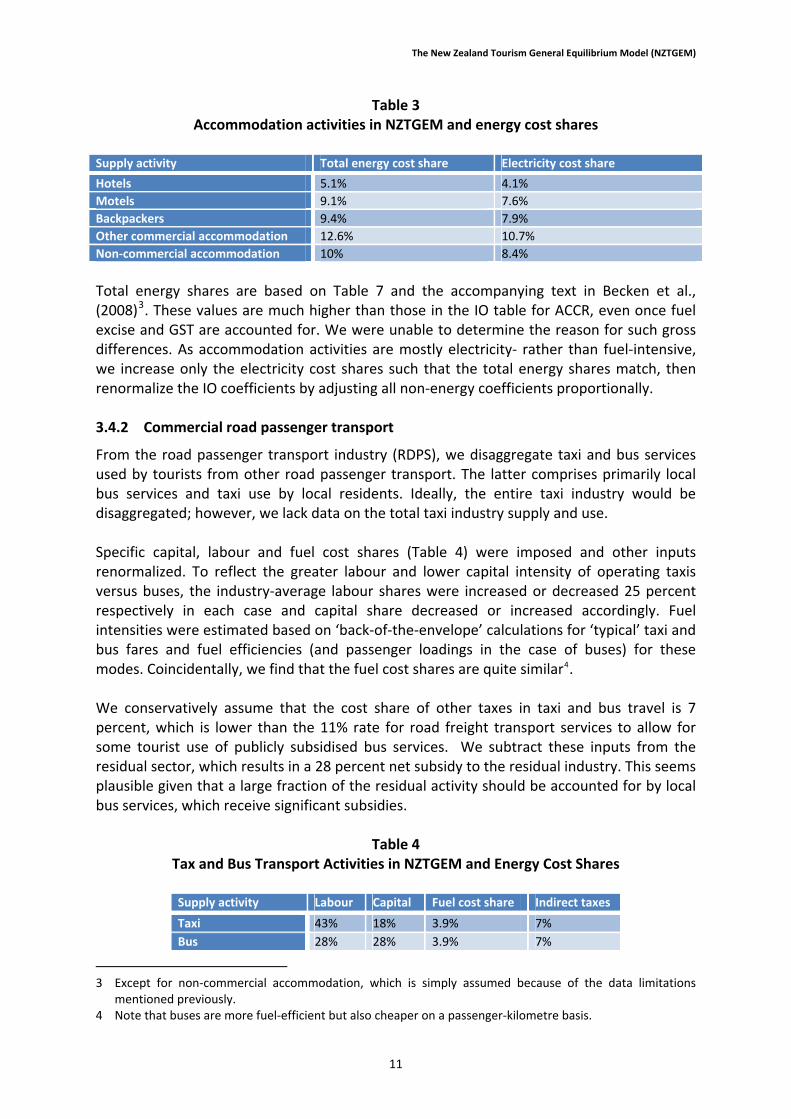
We disaggregate from the industry ‘accommodation, restaurants and bars’ (ACCR) the provision of five types of accommodation (Table 3). Other commercial accommodation comprises mainly ‘bed and breakfast’ operations. The non‐commercial accommodation activity covers provision of accommodation by friends and relatives2, as well as some non‐commercial/informal rental arrangements. While it is likely that the cost structure of other and non‐commercial accommodation activities differ quite dramatically from those for larger scale accommodation, limited data and our focus on energy issues constrains us to focus only on accounting for differences in energy cost shares. Activity‐specific total energy and electricity cost shares are shown in Table 3.
2 Expenditure on non‐commercial accommodation may include payments to friends or relatives in kind as well as cash, or relate to expenditure on boarding fees.
10
The New Zealand Tourism General Equilibrium Model (NZTGEM)
Table 3 Accommodation activities in NZTGEM and energy cost shares
Supply activity Total energy cost share Electricity cost share
Hotels 5.1% 4.1%
Motels 9.1% 7.6%
Backpackers 9.4% 7.9%
Other commercial accommodation 12.6% 10.7%
Non‐commercial accommodation 10% 8.4%
Total energy shares are based on Table 7 and the accompanying text in Becken et al., (2008)3. These values are much higher than those in the IO table for ACCR, even once fuel excise and GST are accounted for. We were unable to determine the reason for such gross differences. As accommodation activities are mostly electricity‐ rather than fuel‐intensive, we increase only the electricity cost shares such that the total energy shares match, then renormalize the IO coefficients by adjusting all non‐energy coefficients proportionally. 3.4.2 Commercial road passenger transport
From the road passenger transport industry (RDPS), we disaggregate taxi and bus services used by tourists from other road passenger transport. The latter comprises primarily local bus services and taxi use by local residents. Ideally, the entire taxi industry would be disaggregated; however, we lack data on the total taxi industry supply and use. Specific capital, labour and fuel cost shares (Table 4) were imposed and other inputs renormalized. To reflect the greater labour and lower capital intensity of operating taxis versus buses, the industry‐average labour shares were increased or decreased 25 percent respectively in each case and capital share decreased or increased accordingly. Fuel intensities were estimated based on ‘back‐of‐the‐envelope’ calculations for ‘typical’ taxi and bus fares and fuel efficiencies (and passenger loadings in the case of buses) for these modes. Coincidentally, we find that the fuel cost shares are quite similar4. We conservatively assume that the cost share of other taxes in taxi and bus travel is 7 percent, which is lower than the 11% rate for road freight transport services to allow for some tourist use of publicly subsidised bus services. We subtract these inputs from the residual sector, which results in a 28 percent net subsidy to the residual industry. This seems plausible given that a large fraction of the residual activity should be accounted for by local bus services, which receive significant subsidies.
Table 4 Tax and Bus Transport Activities in NZTGEM and Energy Cost Shares
Supply activity Labour Capital Fuel cost share Indirect taxes
Taxi 43% 18% 3.9% 7%
Bus 28% 28% 3.9% 7%
3 Except for non‐commercial accommodation, which is simply assumed because of the data limitations mentioned previously. 4 Note that buses are more fuel‐efficient but also cheaper on a passenger‐kilometre basis.
11
The New Zealand Tourism General Equilibrium Model (NZTGEM)
3.4.3 Rail passenger transport
Tourist, local passenger and freight transport all fall within the rail transport industry. We separate a tourist rail activity. However, due to lack of data and the very small share of tourist expenditure on this mode, we assume that it has a cost structure identical to that of the parent sector. 3.4.4 Water passenger transport
Supply of water transport to tourists is disaggregated from the water transport sector. The remainder of this sector comprises use of local ferries by residents and coastal and a very small quantity of international sea freight5. Most tourist expenditure on sea transport is for inter‐island crossing, especially across the Cook Strait. Few data are available to determine the cost structure of these operations. Becken (p12, 2001) suggests an average figure of 2.4MJ/pkm can be attributed to passengers, allowing that trucks and trains may be transported on the same vessels. Assuming 40MJ/kg heavy fuel oil and NZ$0.54/kg, this comes to 3.2c/pkm for fuel. Compared to the estimated average price of $1.30/pkm for ferries (p 11, Becken et al., 2008), this gives a cost share of 2.5 percent. Although this is significantly lower than the industry‐average 12.1 percent from the IO table, the difference could plausibly be explained by the relatively higher service component of passenger transport compared to freight transport. To reflect this presumed higher labour input, we renormalize the costs by increasing the labour cost share from the industry‐average 20.9 percent to 30.5 percent. 3.4.5 Rental cars and campervans
The activities of supplying rental cars or campervans to tourists falls within the ‘equipment hire and investors in other property’ industry. As we account separately for the purchase of fuel by tourists and have few data on the specific cost structures of these rental service activities, we assume that these activities have the same cost structure as their parent industry. 3.4.6 Domestic and international air transport
Supply of domestic air transport (i.e. flights within New Zealand) and international air transport to and from New Zealand are distinguished in the tourism SAM. International air transport is a large share of expenditure for all international visitor markets and fuel is a large share of airline costs. This is especially the case for more distant origin markets. It is therefore desirable to account for the expenditure of each visitor market on air travel in the SAM, and to account for the different fuel cost shares, which depend not only on distance, but also on average fares. National accounting rules allocate economic activity of airlines to countries on the basis of (a) the residence of the operator and (b) the residence of passengers. Thus, only the sales of New Zealand‐domiciled carriers fall within the ‘air transport and transport services’ (AIRS) industry in the IO table. Sales of New Zealand carriers are classified as exports when provided to non‐residents. Countries’ of flight origin and destination play no role in this definition. However, to account for the impacts of oil price on airfares and thence tourist
5 Almost all international shipping is foreign‐operated.
12
The New Zealand Tourism General Equilibrium Model (NZTGEM)
behaviour of the entire visitor markets, we must extend the tourism SAM to account for all flights to and from New Zealand, including those serviced by foreign‐domiciled carriers. When purchased by New Zealand residents, such flights are classified as imports. When purchased by non‐residents, such flights are normally outside the boundary of the accounting system but will be treated here as if they were re‐exports (i.e. foreign air transport services are imported, only to be directly sold to non‐resident visitors to New Zealand). Two international air passenger transport activities are distinguished for each of the 18 international visitor markets; one for New Zealand and one for foreign carriers. To estimate fuel costs, we first determine typical CO2 emissions6 for a typical direct return flight from each market (e.g. for UK we assume a return flight from London Heathrow to Auckland via Hong Kong)7. Based on the CO2 emissions, we estimate the volume and cost8 of fuel per passenger and thence given average airfares for each visitor market (Becken et al., 2008), the fuel cost share. All other inputs are rescaled proportionally. We assume that foreign and domestic carriers have the same cost structures on each route, but that domestic carriers use domestic and foreign inputs in the same proportions as the parent industry (AIRS), while foreign carriers use only foreign inputs9. Estimated fuel cost shares range from 15 percent for ‘Australian FIT Other’ to 39 percent for UK VFR and Other. A similar pair of international air transport services is made to account for the international air travel of New Zealand residents. For simplicity, we do not distinguish different countries of destination and hence different oil cost shares for such travel, although the same methods as applied to inbound visitors would be feasible for outbound visitation. In 2006, almost all domestic air passenger transport was provided by domestic carriers. We therefore account for a single domestic air passenger transport activity, assuming a fuel cost share of 18 percent. In reality, the average fuel cost share is likely to vary substantially between visitor markets, depending on the domestic routes travelled and prices paid. Credible estimates could be constructed of passenger‐kilometres on the main domestic air routes for each market, and even of the average fuel per passenger on these flights. However, lack of data on domestic airfare expenditure for each of the visitor markets makes estimating market‐specific fuel cost shares impossible, given that there is a wide dispersion of airfares between regular fare classes and extensive discounting. We adjust the petroleum inputs of the residual of the parent sector so that the input shares are equal to those in the other business services (OBUS) sector. This is necessary so that the residual sector (comprising storage and other services) is much less fuel‐intensive than the parent sector (including air transport).
6 We use the TRX emissions calculator, which provides estimates for specific flights, fare classes and routes. 7 Due to lack of data we do not attempt to account for less direct return journeys. Nor, due both to lack of data and to the inherent limitations of our single‐country modelling framework, do we attempt to account for journeys involving multiple country destinations (e.g. many visitors to New Zealand also visit Australia or stop‐over in a South‐East Asian country). 8 Assuming 3.15 kg CO2 / kg jet fuel and NZ$0.90/kg. 9 This assumption is made only for simplicity and because of lack of data. In reality, foreign carriers will use some domestic inputs such as in‐country labour and food and beverages taken on‐board their flights departing New Zealand.
13
The New Zealand Tourism General Equilibrium Model (NZTGEM)
14
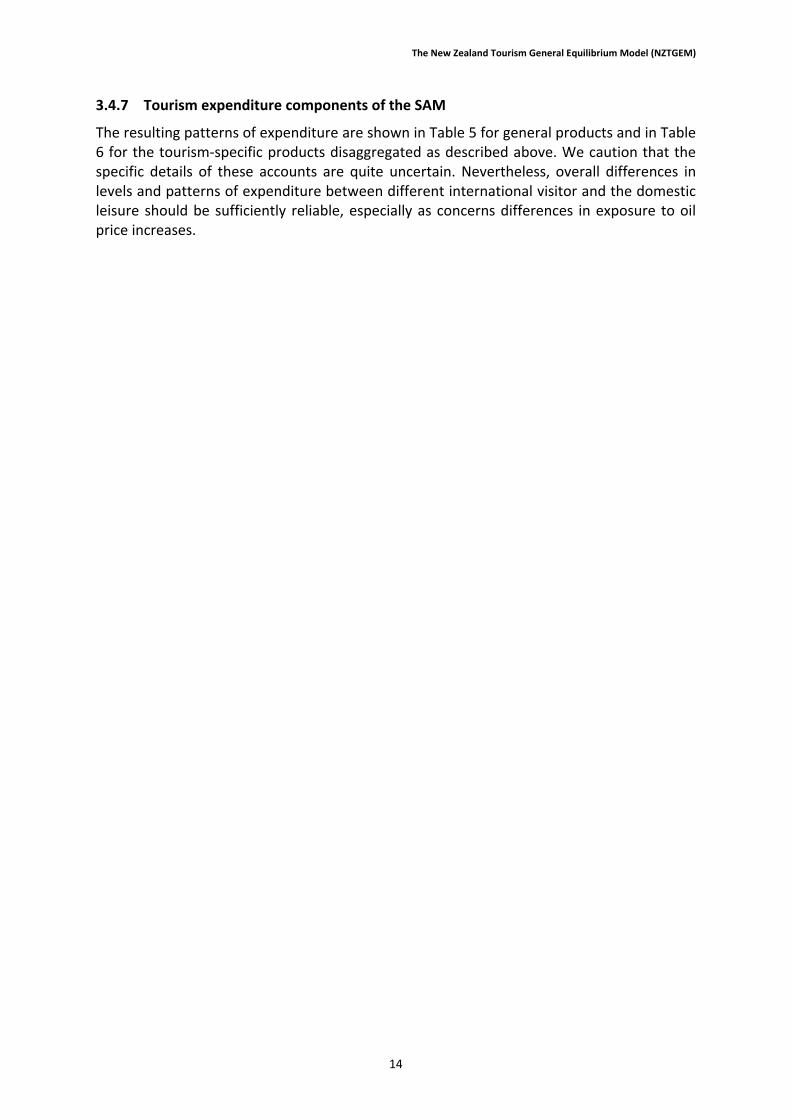
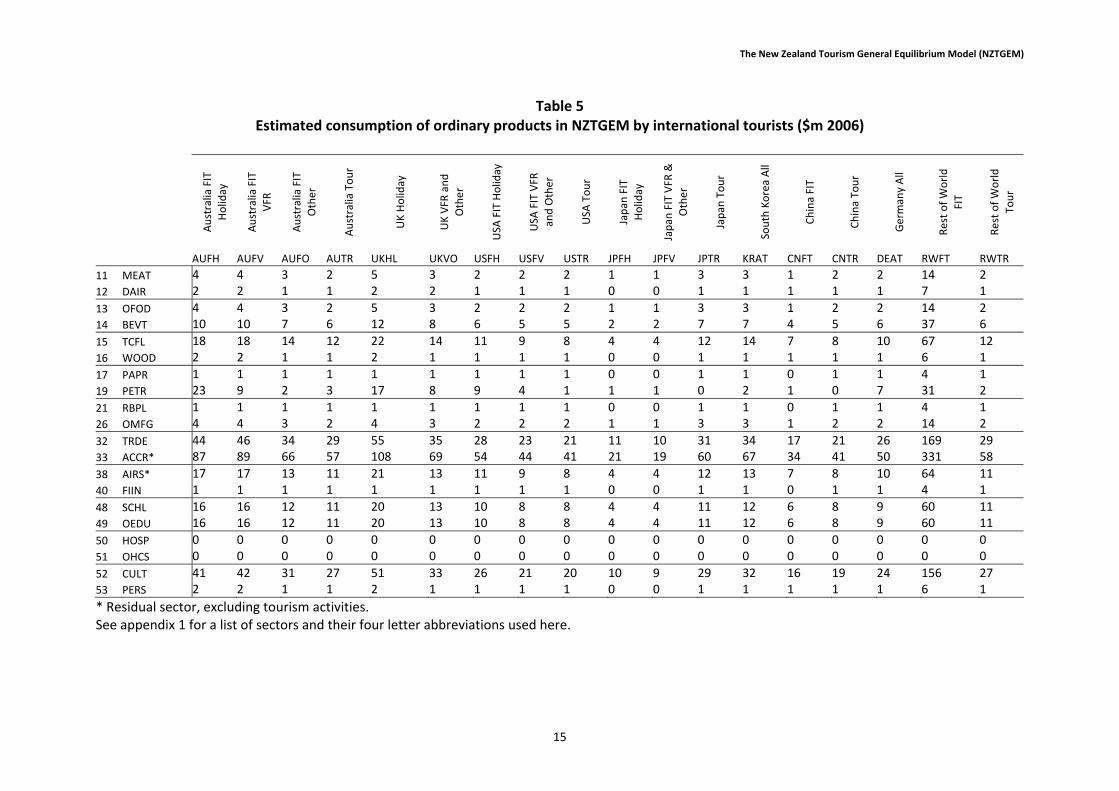
3.4.7 Tourism expenditure components of the SAM
The resulting patterns of expenditure are shown in Table 5 for general products and in Table 6 for the tourism‐specific products disaggregated as described above. We caution that the specific details of these accounts are quite uncertain. Nevertheless, overall differences in levels and patterns of expenditure between different international visitor and the domestic leisure should be sufficiently reliable, especially as concerns differences in exposure to oil price increases.
The New Zealand Tourism General Equilibrium Model (NZTGEM)
Table 5 Estimated consumption of ordinary products in NZTGEM by international tourists ($m 2006)
Australia FIT
Holiday
Australia FIT
VFR
Australia FIT
Other
Australia Tour
UK Holiday
UK VFR
and
Other
USA
FIT Holiday
USA
FIT VFR
and Other
USA
Tour
Japan
FIT
Holiday
Japan
FIT VFR
&
Other
Japan
Tour
South Korea All
China FIT
China To
ur
Germany All
Rest of World
FIT
Rest of World
Tour
AUFH AUFV AUFO AUTR UKHL UKVO USFH USFV USTR JPFH JPFV JPTR KRAT CNFT CNTR DEAT RWFT RWTR
11 MEAT 4 4 3 2 5 3 2 2 2 1 1 3 3 1 2 2 14 2
12 DAIR 2 2 1 1 2 2 1 1 1 0 0 1 1 1 1 1 7 1
13 OFOD 4 4 3 2 5 3 2 2 2 1 1 3 3 1 2 2 14 2 14 BEVT 10 10 7 6 12 8 6 5 5 2 2 7 7 4 5 6 37 6
15 TCFL 18 18 14 12 22 14 11 9 8 4 4 12 14 7 8 10 67 12
16 WOOD 2 2 1 1 2 1 1 1 1 0 0 1 1 1 1 1 6 1
17 PAPR 1 1 1 1 1 1 1 1 1 0 0 1 1 0 1 1 4 1
19 PETR 23 9 2 3 17 8 9 4 1 1 1 0 2 1 0 7 31 2
21 RBPL 1 1 1 1 1 1 1 1 1 0 0 1 1 0 1 1 4 1
26 OMFG 4 4 3 2 4 3 2 2 2 1 1 3 3 1 2 2 14 2
32 TRDE 44 46 34 29 55 35 28 23 21 11 10 31 34 17 21 26 169 29 33 ACCR* 87 89 66 57 108 69 54 44 41 21 19 60 67 34 41 50 331 58
38 AIRS* 17 17 13 11 21 13 11 9 8 4 4 12 13 7 8 10 64 11
40 FIIN 1 1 1 1 1 1 1 1 1 0 0 1 1 0 1 1 4 1
48 SCHL 16 16 12 11 20 13 10 8 8 4 4 11 12 6 8 9 60 11
49 OEDU 16 16 12 11 20 13 10 8 8 4 4 11 12 6 8 9 60 11
50 HOSP 0 0 0 0 0 0 0 0 0 0 0 0 0 0 0 0 0 0
51 OHCS 0 0 0 0 0 0 0 0 0 0 0 0 0 0 0 0 0 0
52 CULT 41 42 31 27 51 33 26 21 20 10 9 29 32 16 19 24 156 27 53 PERS 2 2 1 1 2 1 1 1 1 0 0 1 1 1 1 1 6 1
* Residual sector, excluding tourism activities. See appendix 1 for a list of sectors and their four letter abbreviations used here.
15
The New Zealand Tourism General Equilibrium Model (NZTGEM)
16
Table 6 Estimated consumption of tourism products in NZTGEM by international tourists ($m 2006)
Domestic
Leisure
Australia FIT
Holiday
Australia FIT
VFR
Australia FIT
Other
Australia Tour
UK Holiday
UK VFR
and
Other
USA
FIT Holiday
USA
FIT VFR
and Other
USA
Tour
Japan
FIT
Holiday
Japan
FIT VFR
and Other
Japan
Tour
South Korea All
China FIT
China To
ur
Germany All
Rest of World
FIT
Re st of World
Tour
DLTR AUFH AUFV AUFO AUTR UKHL UKVO USFH USFV USTR JPFH JPFV JPTR KRAT CNFT CNTR DEAT RWFT RWTR
Hotel 261 41 13 48 40 51 13 22 17 19 6 3 27 21 4 17 12 61 35
Motel 117 38 8 4 13 25 9 9 3 1 3 2 1 3 3 0 5 37 5
Backpackers 16 6 1 1 1 19 4 7 2 0 3 1 0 2 0 0 16 50 1
Other accom. 70 22 3 8 5 17 8 9 6 3 2 3 3 1 1 0 13 44 6
Non‐commercial accom. 22 5 2 5 0 11 9 2 6 0 3 6 1 6 9 0 7 55 1
Rental car 42 44 21 6 7 31 17 18 8 2 3 2 1 4 2 0 13 60 4
Rental van 6 11 1 0 0 12 2 4 1 0 0 0 0 0 0 0 6 14 0
Bus 100 7 1 1 10 15 2 3 1 4 2 1 9 7 1 5 4 18 10
Boat 58 6 2 1 3 9 2 5 2 5 1 0 0 0 0 0 6 13 2
Taxi 37 2 1 4 0 1 1 1 1 1 1 0 5 0 0 1 1 4 1
Train 10 1 0 0 1 1 0 1 0 0 0 0 0 0 0 0 0 1 1
Domestic Air 301 7 8 7 4 10 11 14 10 8 4 2 13 8 3 5 4 38 13
International Air NZ airline 301 54 57 47 14 114 86 117 112 56 40 46 81 14 11 20 10 160 28
International Air non‐NZ 1250 132 138 116 33 266 200 63 60 30 22 25 44 219 51 89 133 728 128
The New Zealand Tourism General Equilibrium Model (NZTGEM)
Chapter 4 The New Zealand Tourism General Equilibrium Model (NZTGEM)
The New Zealand Tourism General Equilibrium Model (NZTGEM) is a computable general equilibrium (CGE) model of New Zealand that focuses on international tourism demand. It includes detailed modelling of tourism:
Accommodation and transport supply (including international air transport) to tourists’ and
Tourist consumption behaviour for 18 international visitor markets and the domestic leisure market.
It is a comparative static model, meaning that rather than modelling time explicitly, the model is solved to find a new economic equilibrium in response to external and/or policy shocks. NZTGEM is implemented in the GAMS/MPSGE software10. Most non‐tourism components of NZTGEM are derived from the earlier New Zealand Climate Economics Model (NZCEM); however, unlike NZCEM, NZTGEM does not model greenhouse gas emissions11. NZCEM is described by Lennox and van Nieuwkoop (2009, in preparation). This section provides a technical description of the model, describing first the production side, second institutional behaviour, factor supply and final consumption and third tourism consumption.
4.1 Domestic Production
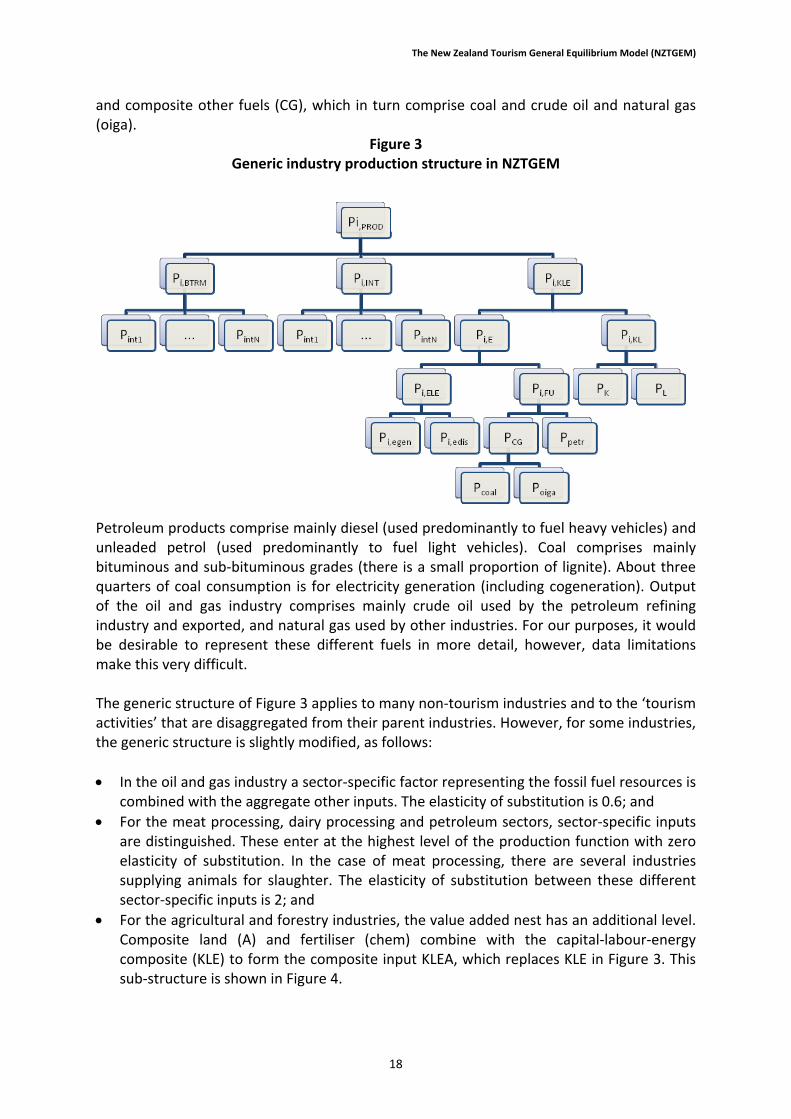
We assume that each industry is composed of perfectly competitive, profit‐maximising firms that employ identical technologies with constant returns to scale. Each technology has a single commodity output. The behaviour of firms in each industry/activity is described by a hierarchical nesting of constant elasticity of substitution (CES) functions. We describe first the part of the nesting structure common to all industries, and subsequently, variations that are made for specific industries. At the top level, composites of non‐energy intermediate inputs (INT) and of business tourism inputs (BTRM) are combined with a composite of energy and factor inputs (KLE). The INT nest combines individual non‐energy intermediate inputs. The KLE nest combines composite capital and labour inputs (KL) with composite energy inputs (E). The composite energy input combines electricity (ELE) and fuels (FU). Electricity comprises electricity generation and distribution (in fixed proportions). Fuels comprise petroleum products (petr)
10 See www.gams.com. 11 NZTGEM could be extended to include greenhouse gas emissions if desired, and this has been done for the particular case of international air transport Lennox, J.A., 2009. Pricing CO2 emissions from international aviation: a preliminary analysis for New Zealand from international aviation: a preliminary analysis for New Zealand. Ministry of Transport, Wellington, New Zealand..
17
The New Zealand Tourism General Equilibrium Model (NZTGEM)
and composite other fuels (CG), which in turn comprise coal and crude oil and natural gas (oiga).
Figure 3 Generic industry production structure in NZTGEM
Petroleum products comprise mainly diesel (used predominantly to fuel heavy vehicles) and unleaded petrol (used predominantly to fuel light vehicles). Coal comprises mainly bituminous and sub‐bituminous grades (there is a small proportion of lignite). About three quarters of coal consumption is for electricity generation (including cogeneration). Output of the oil and gas industry comprises mainly crude oil used by the petroleum refining industry and exported, and natural gas used by other industries. For our purposes, it would be desirable to represent these different fuels in more detail, however, data limitations make this very difficult. The generic structure of Figure 3 applies to many non‐tourism industries and to the ‘tourism activities’ that are disaggregated from their parent industries. However, for some industries, the generic structure is slightly modified, as follows:
In the oil and gas industry a sector‐specific factor representing the fossil fuel resources is combined with the aggregate other inputs. The elasticity of substitution is 0.6; and
For the meat processing, dairy processing and petroleum sectors, sector‐specific inputs are distinguished. These enter at the highest level of the production function with zero elasticity of substitution. In the case of meat processing, there are several industries supplying animals for slaughter. The elasticity of substitution between these different sector‐specific inputs is 2; and
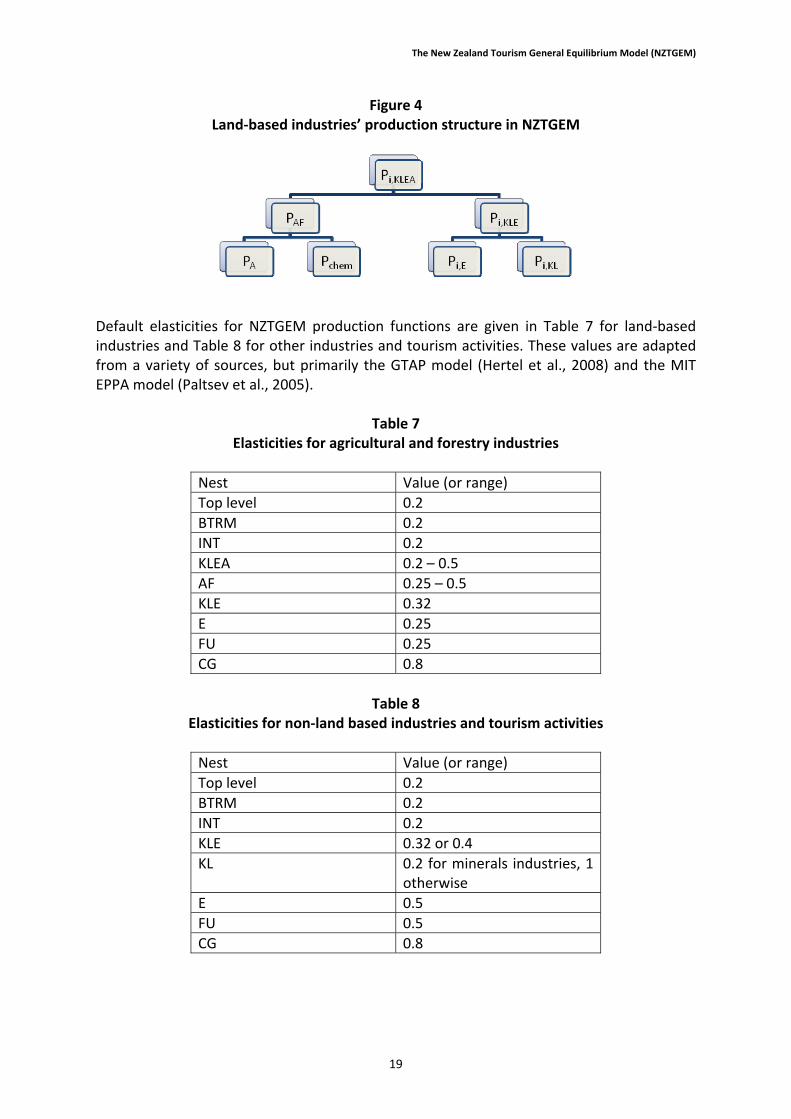
For the agricultural and forestry industries, the value added nest has an additional level. Composite land (A) and fertiliser (chem) combine with the capital‐labour‐energy composite (KLE) to form the composite input KLEA, which replaces KLE in Figure 3. This sub‐structure is shown in Figure 4.
18
The New Zealand Tourism General Equilibrium Model (NZTGEM)
Figure 4 Land‐based industries’ production structure in NZTGEM
Default elasticities for NZTGEM production functions are given in Table 7 for land‐based industries and Table 8 for other industries and tourism activities. These values are adapted from a variety of sources, but primarily the GTAP model (Hertel et al., 2008) and the MIT EPPA model (Paltsev et al., 2005).
Table 7 Elasticities for agricultural and forestry industries
Nest Value (or range)
Top level 0.2
BTRM 0.2
INT 0.2
KLEA 0.2 – 0.5
AF 0.25 – 0.5
KLE 0.32
E 0.25
FU 0.25
CG 0.8
Table 8
Elasticities for non‐land based industries and tourism activities
Nest Value (or range)
Top level 0.2
BTRM 0.2
INT 0.2
KLE 0.32 or 0.4
KL 0.2 for minerals industries, 1 otherwise
E 0.5
FU 0.5
CG 0.8
19
The New Zealand Tourism General Equilibrium Model (NZTGEM)
4.2 Markets
For non‐tourism products, it is assumed that at the level of aggregation of the model, competing imports are imperfect substitutes for output of the equivalent domestic industries. For each industry and final user, each commodity input is formed as a CES aggregate of imported and domestic supply. The supply of imports is assumed to be perfectly elastic. Exports are treated analogously. Firms in each industry can adjust their output between domestic and export supply with a constant elasticity of transformation (CET). Armington elasticities for imports are adapted from the GTAP model (Hertel et al., 2008). Following common practice, elasticities of transformation of exports are set to double the corresponding Armington elasticities. For products of OTG tourism activities, we assume that there is a single market for each product. Differentiation of products (e.g. quality of hotel) and price discrimination (e.g. to businesses versus individuals, advance versus last‐minute purchases) are significant phenomena for some tourism activities. For each tourist market, the aggregate effects of such practices are reflected in the SAM and so are captured in the model’s benchmark quantities. However, the model does not show how these behaviours affect the response of markets to external shocks or policies. Although different forms of imperfect competition can and sometimes are represented in CGE models, doing so here would increase both the complexity of the model and its data requirements.
4.3 International Air Passenger Transport
International air transport represents a large share of the total cost faced by inbound tourists to New Zealand as well as by outbound New Zealand tourists. Moreover, fuel represents a large share of airlines’ costs of production, so it is important that the model can show the impacts of changes in oil price on airfares. It is clear that airfares are not set to equal the marginal costs of operating each route. Actual pricing reflects the complex network economics of air transportation, product and price discrimination and strategic interactions between airlines competing on different routes. As was the case for OTG tourism activities (see above), we cannot hope to account for these complexities within the NZTGEM model framework. We ignore the way that these factors will affect policy responses, but capture their aggregate effects insofar as they are reflected in the SAM data. We do account for tourist market‐specific differences in the fuel cost share of producing international passenger transport. Firstly, fuel costs become relatively more important as distance increases12. Secondly, the average return airfare may differ by origin market segment irrespective of distance, because of differences in preferences for e.g. lower or higher cost airlines, cabin classes, and season of travel. We use the bottom‐up estimates of aggregate expenditure on aviation gas in providing transport to each tourist market and distribute the overall expenditure on fuel in the SAM and expenditure on other inputs in these proportions.
12 Note that fuel consumption per aircraft kilometre decreases with distance. However, significant fixed and per‐flight costs can easily outweigh that effect.
20
The New Zealand Tourism General Equilibrium Model (NZTGEM)
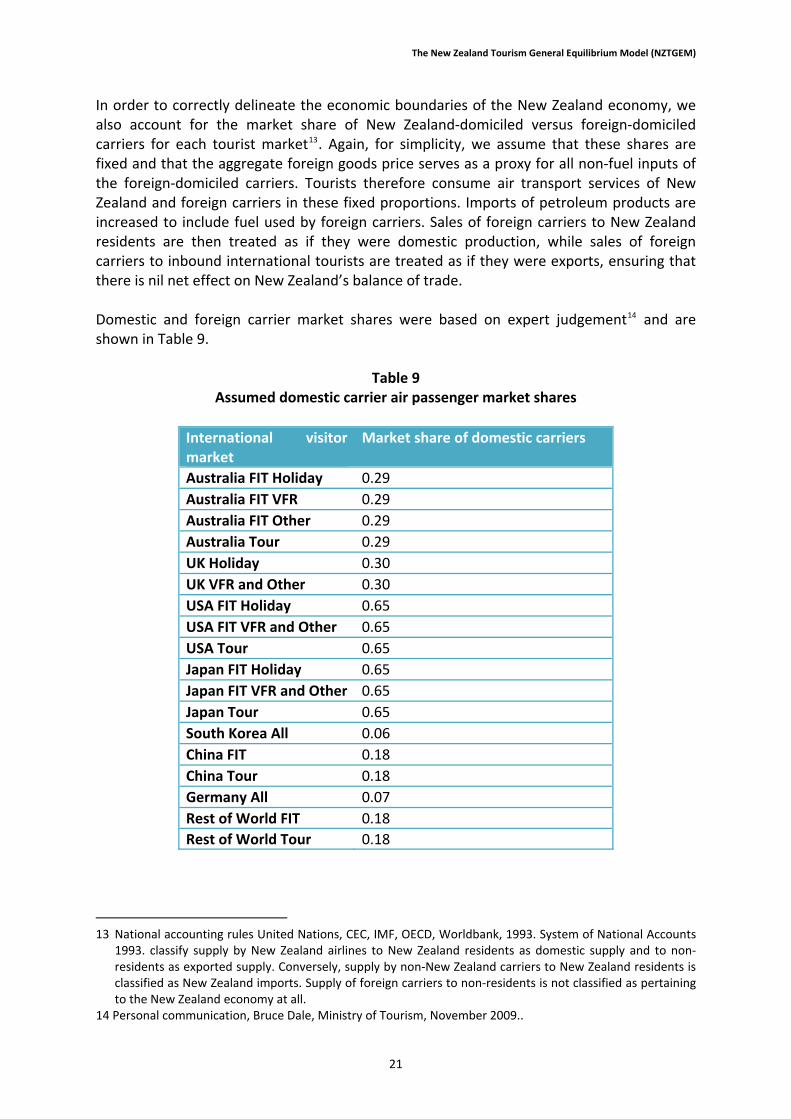
In order to correctly delineate the economic boundaries of the New Zealand economy, we also account for the market share of New Zealand‐domiciled versus foreign‐domiciled carriers for each tourist market13. Again, for simplicity, we assume that these shares are fixed and that the aggregate foreign goods price serves as a proxy for all non‐fuel inputs of the foreign‐domiciled carriers. Tourists therefore consume air transport services of New Zealand and foreign carriers in these fixed proportions. Imports of petroleum products are increased to include fuel used by foreign carriers. Sales of foreign carriers to New Zealand residents are then treated as if they were domestic production, while sales of foreign carriers to inbound international tourists are treated as if they were exports, ensuring that there is nil net effect on New Zealand’s balance of trade. Domestic and foreign carrier market shares were based on expert judgement14 and are shown in Table 9.
Table 9 Assumed domestic carrier air passenger market shares
International visitor market
Market share of domestic carriers
Australia FIT Holiday 0.29
Australia FIT VFR 0.29
Australia FIT Other 0.29
Australia Tour 0.29
UK Holiday 0.30
UK VFR and Other 0.30
USA FIT Holiday 0.65
USA FIT VFR and Other 0.65
USA Tour 0.65
Japan FIT Holiday 0.65
Japan FIT VFR and Other 0.65
Japan Tour 0.65
South Korea All 0.06
China FIT 0.18
China Tour 0.18
Germany All 0.07
Rest of World FIT 0.18
Rest of World Tour 0.18
13 National accounting rules United Nations, CEC, IMF, OECD, Worldbank, 1993. System of National Accounts 1993. classify supply by New Zealand airlines to New Zealand residents as domestic supply and to non‐ residents as exported supply. Conversely, supply by non‐New Zealand carriers to New Zealand residents is classified as New Zealand imports. Supply of foreign carriers to non‐residents is not classified as pertaining to the New Zealand economy at all. 14 Personal communication, Bruce Dale, Ministry of Tourism, November 2009..
21
The New Zealand Tourism General Equilibrium Model (NZTGEM)
4.4 Institutions
4.4.1 Household demands
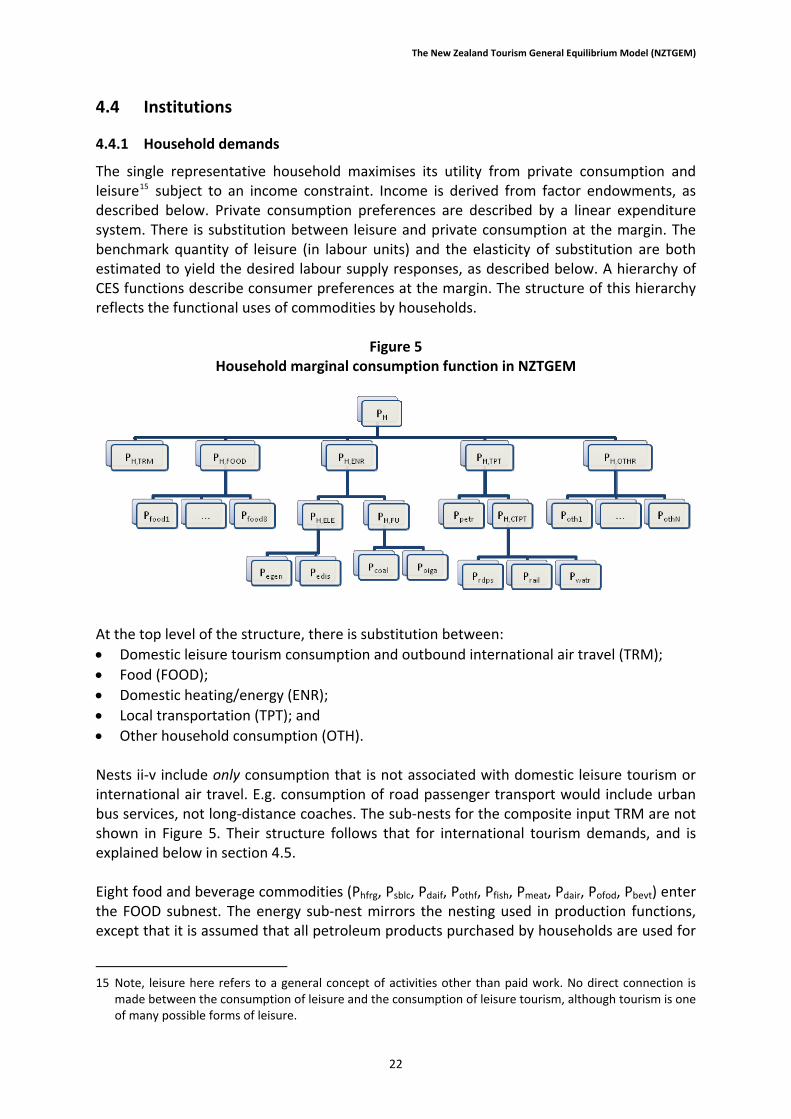
The single representative household maximises its utility from private consumption and leisure15 subject to an income constraint. Income is derived from factor endowments, as described below. Private consumption preferences are described by a linear expenditure system. There is substitution between leisure and private consumption at the margin. The benchmark quantity of leisure (in labour units) and the elasticity of substitution are both estimated to yield the desired labour supply responses, as described below. A hierarchy of CES functions describe consumer preferences at the margin. The structure of this hierarchy reflects the functional uses of commodities by households.
Figure 5 Household marginal consumption function in NZTGEM
At the top level of the structure, there is substitution between:
Domestic leisure tourism consumption and outbound international air travel (TRM);
Food (FOOD);
Domestic heating/energy (ENR);
Local transportation (TPT); and
Other household consumption (OTH). Nests ii‐v include only consumption that is not associated with domestic leisure tourism or international air travel. E.g. consumption of road passenger transport would include urban bus services, not long‐distance coaches. The sub‐nests for the composite input TRM are not shown in Figure 5. Their structure follows that for international tourism demands, and is explained below in section 4.5. Eight food and beverage commodities (Phfrg, Psblc, Pdaif, Pothf, Pfish, Pmeat, Pdair, Pofod, Pbevt) enter the FOOD subnest. The energy sub‐nest mirrors the nesting used in production functions, except that it is assumed that all petroleum products purchased by households are used for
15 Note, leisure here refers to a general concept of activities other than paid work. No direct connection is made between the consumption of leisure and the consumption of leisure tourism, although tourism is one of many possible forms of leisure.
22

The New Zealand Tourism General Equilibrium Model (NZTGEM)
private transportation, rather than for home heat or power. For this reason, the transport sub‐nest first allows substitution between petroleum products (petr) and commercial transport (CTPT). Within the latter nest, road passenger transport (rdps), rail transport (rail) and water transport (watr) are combined. All other household consumption is included in the OTHR nest. 4.4.2 Government and investment demands
For both the government and the investment sectors, demand for individual commodities is determined by single‐level CES demand functions. Aggregate government expenditure on goods is, by default, proportional to real gross national disposable income (RGNDI). Aggregate investment is, by default, proportional to the real stock of capital goods. 4.4.3 Transfer payments
The value of foreign transfer payments is fixed in terms of foreign prices. The value of transfer payments from the government to households is fixed in real (i.e. CPI‐adjusted) terms. 4.4.4 Capital supply
We make the common assumption that in the long run, capital is effectively perfectly mobile between sectors. The user cost of capital includes depreciation. Depreciation is deducted prior to the distribution of primary income to the household, government and foreign sectors, which each have claims on the returns to capital. We assume a fixed rate of physical depreciation and that the aggregate quantity of investment is proportional to the aggregate supply of capital services. The real stock of capital is always specified as fixed in the short run, but may be specified as fixed or elastic in the long run. In the latter case, supply of domestic‐owned capital remains fixed, but supply of foreign‐owned capital responds to the price of capital relative to the foreign price level. Domestic‐ and foreign‐owned capital are perfect substitutes in production and therefore earn the same return. It would be more natural to allow the domestic saving rate to adjust in response to real returns in the long run. However, such a formulation is difficult to reconcile with the SAM, which shows a current account deficit and a very high rate of household sector dissaving in 2006.We have not found direct empirical evidence on the responsiveness of direct and indirect foreign investment in New Zealand to changes in the rate of return. The empirical literature as a whole suggests that foreign investment usually adjusts sluggishly, with possible explanations including the existence of adjustment costs and, for countries with a negative net asset position, credit constraints (ch 3, Barro and Sala‐i‐Martin, 2004). 4.4.5 Labour supply
Labour supply may be specified as fixed, or may vary in response to a labour‐leisure choice of households. In the latter case, the benchmark ratio of leisure to labour supply and the elasticity of substitution are calibrated to give compensated and uncompensated wage elasticities of aggregate labour supply of 0.3 and 0.1 respectively, in response to a shock to labour productivity. These values are not based directly on specific empirical evidence for
23
The New Zealand Tourism General Equilibrium Model (NZTGEM)
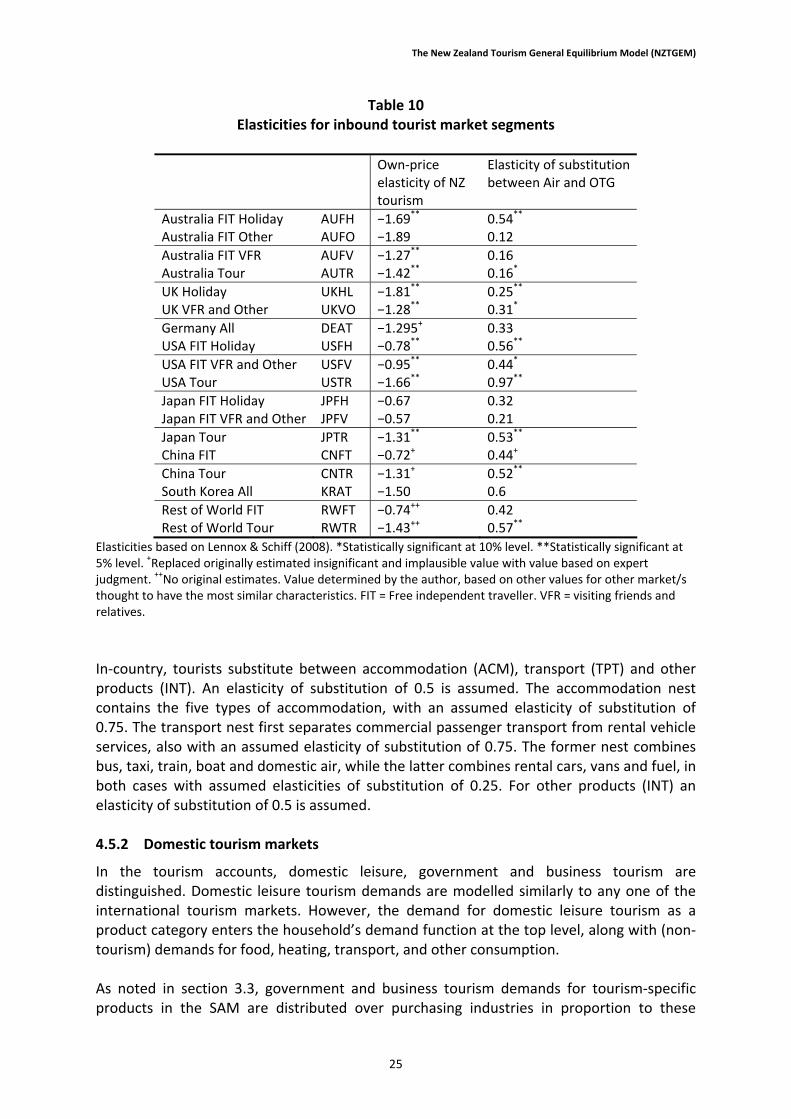
New Zealand, but are consistent with the majority of the literature (see e.g. p 543, Stiglitz, 2000).
4.5 Tourist Demands
4.5.1 International visitor markets
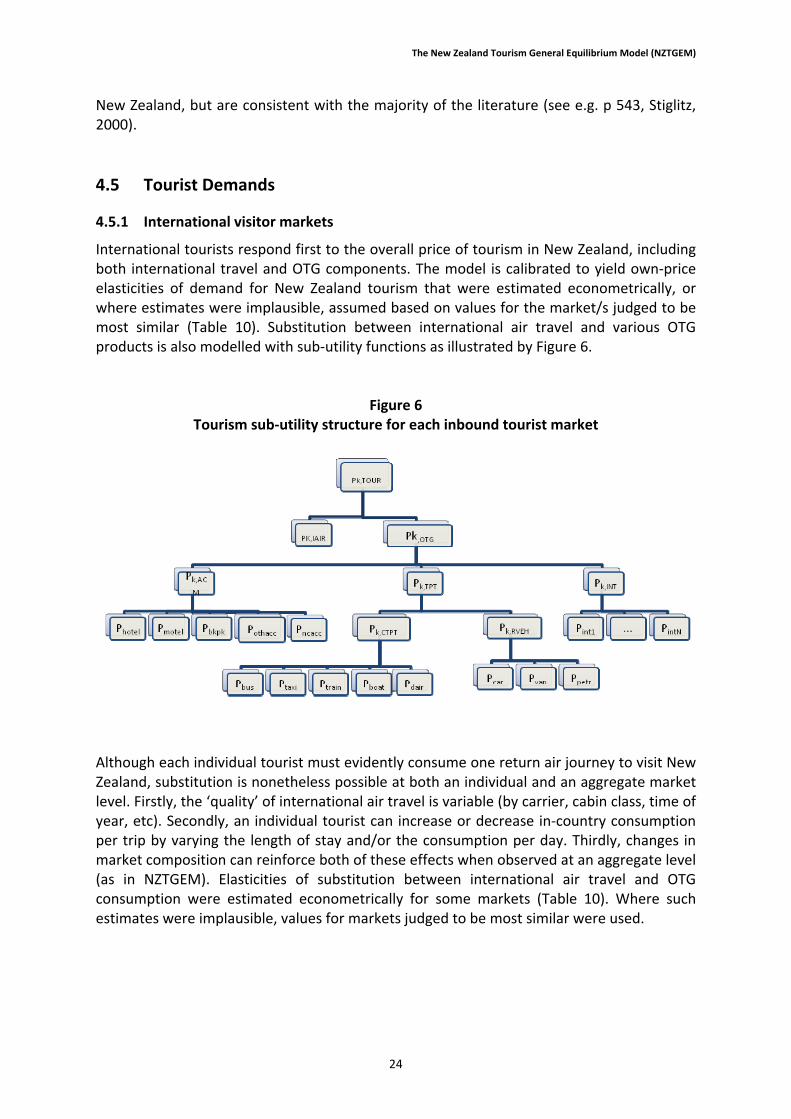
International tourists respond first to the overall price of tourism in New Zealand, including both international travel and OTG components. The model is calibrated to yield own‐price elasticities of demand for New Zealand tourism that were estimated econometrically, or where estimates were implausible, assumed based on values for the market/s judged to be most similar (Table 10). Substitution between international air travel and various OTG products is also modelled with sub‐utility functions as illustrated by Figure 6.
Figure 6 Tourism sub‐utility structure for each inbound tourist market
Although each individual tourist must evidently consume one return air journey to visit New Zealand, substitution is nonetheless possible at both an individual and an aggregate market level. Firstly, the ‘quality’ of international air travel is variable (by carrier, cabin class, time of year, etc). Secondly, an individual tourist can increase or decrease in‐country consumption per trip by varying the length of stay and/or the consumption per day. Thirdly, changes in market composition can reinforce both of these effects when observed at an aggregate level (as in NZTGEM). Elasticities of substitution between international air travel and OTG consumption were estimated econometrically for some markets (Table 10). Where such estimates were implausible, values for markets judged to be most similar were used.
24
The New Zealand Tourism General Equilibrium Model (NZTGEM)
Table 10 Elasticities for inbound tourist market segments
Own‐price elasticity of NZ tourism
Elasticity of substitution between Air and OTG
Australia FIT Holiday AUFH −1.69** 0.54** Australia FIT Other AUFO −1.89 0.12
Australia FIT VFR AUFV −1.27** 0.16 Australia Tour AUTR −1.42** 0.16*
UK Holiday UKHL −1.81** 0.25** UK VFR and Other UKVO −1.28** 0.31*
Germany All DEAT −1.295+ 0.33 USA FIT Holiday USFH −0.78** 0.56**
USA FIT VFR and Other USFV −0.95** 0.44* USA Tour USTR −1.66** 0.97**
Japan FIT Holiday JPFH −0.67 0.32 Japan FIT VFR and Other JPFV −0.57 0.21
Japan Tour JPTR −1.31** 0.53** China FIT CNFT −0.72+ 0.44+
China Tour CNTR −1.31+ 0.52** South Korea All KRAT −1.50 0.6
Rest of World FIT RWFT −0.74++ 0.42 Rest of World Tour RWTR −1.43++ 0.57**
Elasticities based on Lennox & Schiff (2008). *Statistically significant at 10% level. **Statistically significant at 5% level. +Replaced originally estimated insignificant and implausible value with value based on expert judgment. ++No original estimates. Value determined by the author, based on other values for other market/s thought to have the most similar characteristics. FIT = Free independent traveller. VFR = visiting friends and relatives.
In‐country, tourists substitute between accommodation (ACM), transport (TPT) and other products (INT). An elasticity of substitution of 0.5 is assumed. The accommodation nest contains the five types of accommodation, with an assumed elasticity of substitution of 0.75. The transport nest first separates commercial passenger transport from rental vehicle services, also with an assumed elasticity of substitution of 0.75. The former nest combines bus, taxi, train, boat and domestic air, while the latter combines rental cars, vans and fuel, in both cases with assumed elasticities of substitution of 0.25. For other products (INT) an elasticity of substitution of 0.5 is assumed. 4.5.2 Domestic tourism markets
In the tourism accounts, domestic leisure, government and business tourism are distinguished. Domestic leisure tourism demands are modelled similarly to any one of the international tourism markets. However, the demand for domestic leisure tourism as a product category enters the household’s demand function at the top level, along with (non‐tourism) demands for food, heating, transport, and other consumption. As noted in section 3.3, government and business tourism demands for tourism‐specific products in the SAM are distributed over purchasing industries in proportion to these
25

The New Zealand Tourism General Equilibrium Model (NZTGEM)
26
industries’ purchases of the corresponding parent products (e.g. demand for hotels in proportion to the originally recorded demands for ACCR). These tourism‐specific intermediate inputs are treated the same way any other intermediates in the production functions of industries. This disaggregation merely ensures that elasticities of supply of tourism‐specific products are reasonable. For example, a large proportion of total demand for hotel accommodation comes from domestic government and business tourists. These demands buffer the tourism activities against changes in demand of international tourists and domestic leisure tourists.
The New Zealand Tourism General Equilibrium Model (NZTGEM)
Chapter 5 Application of the model
To date, NZTGEM has been used to produce scenarios of high global oil prices (Lennox, 2010) and to assess the impacts on tourism and the wider New Zealand economy of carbon pricing for international aviation (Lennox, 2009). In the first case, NZTGEM was used in combination with a global economic model in order to approximate global income and terms of trade effects. NZTGEM currently allows for the analysis of many types of domestic policies. This includes a range of fiscal policies whether directly targeting tourism (e.g. an accommodation or airport tax) or of a general nature (e.g. an increase of the goods and services tax). It is planned to extend NZTGEM in the near future to model greenhouse gas emissions from all sectors of the economy. This will enable modelling the impacts on tourism of the New Zealand Emissions Trading Scheme. A wider variety of other policies can potentially be modelled using NZTGEM if their effects on prices and/or quantities can be appropriately quantified. For example, the impacts of tourism promotion can be assessed if the increase in tourism demand can be quantified. Similarly, investments in increasing amenity value (of e.g. national parks) to tourists could be modelled if such non‐market goods and tourists’ preferences for them can be adequately characterised. With respect to international policies and drivers, the most important limitation of NZTGEM is that being a single country model, it does not model prices of other international destination, or tourists’ choices between them. The model implies the assumption that New Zealand prices change unilaterally, all other relevant prices remaining constant. If, in fact, prices of competing destinations are also affected, the modelled effects will be over‐ or under‐stated (over‐stated in the case that prices of competing destinations move in the same direction and under‐stated if they move in opposite directions). A solution to this problem would be to extend a multi‐country CGE model to explicitly represent international tourism. However, there are formidable empirical challenges to do so credibly.
27

The New Zealand Tourism General Equilibrium Model (NZTGEM)
The New Zealand Tourism General Equilibrium Model (NZTGEM)
References
Adams, P.D., Parmenter, B.P., 1995. An Applied General Equilibrium analysis of the economic effects of tourism in a quite small, quite open economy. Applied Economics 27, 985‐994.
Barro, R.J., X, Sala‐i‐Martin, 2004. Economic growth, 2nd ed. MIT Press, Cambridge, MA. Becken, S., 2001. Tourism and transport in New Zealand. Lincoln University, Lincoln, New
Zealand. Becken, S., Carboni, A., Vuletich, S., Schiff, A., 2008. Analysis of tourist consumption,
expenditure and prices for key international visitor segments: technical report. Lincoln University. Environment Society and Design Division., Lincoln, New Zealand.
Berrittella, M., Bigano, A., Roson, R., Tol, R.S.J., 2006. A general equilibrium analysis of
climate change impacts on tourism. Tourism Management 27, 913‐924. Bhattacharyya, S.C., 1996. Applied general equilibrium models for energy studies: a survey.
Energy Economics 18, 145‐164. Blake, A., Durbarry, R., Eugenio‐Martin, J.L., Gooroochurn, N., Hay, B., Lennon, J., Thea
Sinclair, M., Sugiyarto, G., Yeoman, I., 2006. Integrating forecasting and CGE models: The case of tourism in Scotland. Tourism Management 27, 292‐305.
Blake, A., Sinclair, M.T., 2003. Tourism crisis management: US Response to September 11.
Annals of Tourism Research 30, 813‐832. Blake, A., Sinclair, M.T., Sugiyarto, G., 2003a. Quantifying the impact of foot and mouth
disease on tourism and the UK economy Tourism Economics 9, 449‐465. Blake, A., Sinclair, T., Sugiyarto, G., 2003b. Tourism and EU accession in Malta and Cyprus,
Tourism modelling and competitiveness: implications for policy and strategic planning, Paphos, Cyprus.
Butcher, G., Fairweather, J.R., Simmons, D.G., 1998. The Economic Impact of Tourism on
Kaikoura. Tourism Recreation Research and Education Centre (TRREC). Dwyer, L., Forsyth, P., Spurr, R., 2004. Evaluating tourism's economic effects: new and old
approaches. Tourism Management 25, 307‐317. Fan, T., Oosterhaven, J., 2005. The Impact of International Tourism on the Chinese Economy,
International Input‐Output Conference. International Input‐Output Association, Beijing, China.
Gooroochurn, N., Sinclair, T.M., 2005. Economics of tourism taxation: Evidence from
Mauritius. Annals of Tourism Research 32, 478‐498.
29
The New Zealand Tourism General Equilibrium Model (NZTGEM)
Hertel, T., 2002. Applied General Equilibrium Analysis of Agricultural and Resource Policies, in: Gardner, B., Rausser, G. (Eds.), Handbook of Agricultural and Resource Economics. Amsterdam: North Holland Press., Amsterdam, The Netherlands.
Hertel, T., McDougall, R., Narayanan, B., Aguiar, A.H., 2008. GTAP 7 Data Base
Documentation ‐ Chapter 14: Behavioral Parameters, in: Narayanan, B.G., Walmsley, T.L. (Eds.), Global Trade, Assistance, and Production: The GTAP 7 Data Base, Center for Global Trade Analysis, . Purdue University, Lafayette, IN.
Johansen, L., 1960. A multisector study of economic growth. North Holland, Amsterdam. Labandeira, X., Gago, A., Picos, F., Rodríguez Méndez, M., 2006. Taxing Tourism in Spain:
Results and Recommendations. SSRN. Lennox, J., 2010. Modelling the impacts of high oil prices on tourism with the New Zealand
Tourism General Equilibrium Model. Lincoln University, Lincoln, New Zealand Lennox, J.A., 2009. Pricing CO2 emissions from international aviation: a preliminary analysis
for New Zealand from international aviation: a preliminary analysis for New Zealand. Ministry of Transport, Wellington, New Zealand.
Lennox, J.A., van Nieuwkoop, R., 2009. Affordable and effective climate change mitigation
policies for New Zealand, 15th Annual International Sustainable Development Research Conference, Utrecht, The Netherlands.
Lennox, J.A., van Nieuwkoop, R., in preparation. Affordable and effective climate change
mitigation policies for New Zealand. Löschel, A., 2004. Measuring Sustainable Development: The Use of Computable General
Equilibrium Models. Zentrum für Europäische Wirtschaftsforschung GmbH, Berlin, Germany.
Madden, P.J., Thapa, J.R., 2000. The Contribution of Tourism to the New South Wales Economy: A Multi‐regional General Equilibrium Analysis. Centre for Regional Economic Analysis, University of Tasmania Hobart, Australia.
Miller, R.E., Blair, P.D., 2009. Input‐Output Analysis. Foundations and Extensions, 2nd ed.
Cambridge University Press, Cambridge, UK. Narayan, P.K., 2004. Economic impact of tourism on Fiji's economy: empirical evidence from
the computable general equilibrium model. Tourism Economics 10, 419‐433. NZIER, Infometrics, 2009. Macroeconomic impacts of climate change policy Impact of
Assigned Amount Units and International Trading. Final Report to the Ministry for the Environment, Wellington, New Zealand.
Paltsev, S., Reilly, J.M., Jacoby, H.D., Eckaus, R.S., McFarland, J., Sarofim, M., Asadoorian, M.,
Babiker, M., 2005. The MIT Emissions Prediction and Policy Analysis (EPPA) Model:
30
The New Zealand Tourism General Equilibrium Model (NZTGEM)
31
Version 4, Joint Program Report Series. MIT Joint Program on the Science and Policy of Global Change, Cambridge, Massachussetts, USA.
Statistics New Zealand, 2006. National accounts (revised): year ended March 2006. Statistics
New Zealand, Wellington, NZ. Statistics New Zealand, 2007. Tourism Satellite Account 2006. Statistics New Zealand,
Wellington, NZ. Statistics New Zealand, 2009a. Balance of Payments and International Investment Position:
June 2009 Quarter, Wellington, New Zealand. Statistics New Zealand, 2009b. National accounts (revised): year ended March 2009.
Statistics New Zealand, Wellington, NZ. Stiglitz, J.E., 2000. Economics of the public sector, 3rd ed. W W Norton & Co, New York, NY. Stroombergen, A., 2008. ESSAM General Equilibrium Model:Estimation of 2005/06 Input‐
Output Tables. Motu Economic and Public Policy Research, Wellington, New Zealand. Sugiyarto, G., Blake, A., Sinclair, M.T., 2003. Tourism and globalization: Economic Impact in
Indonesia. Annals of Tourism Research 30, 683‐701. United Nations, CEC, IMF, OECD, Worldbank, 1993. System of National Accounts 1993. UNWTO, 2002. About the correct treatment of the tourism business expenses in the
compilation of the tourism satellite account (TSA). United Nations World Tourism Organization, Madrid, Spain.
Wattanakuljarus, A., Coxhead, I., 2008. Is tourism‐based development good for the poor?: A
general equilibrium analysis for Thailand. Journal of Policy Modeling 30, 929‐955. Zhou, D., Yanagida, J.F., Chakravorty, U., Leung, P., 1997. Estimating economic impacts from
tourism. Annals of Tourism Research 24, 76‐89.

The New Zealand Tourism General Equilibrium Model (NZTGEM)
The New Zealand Tourism General Equilibrium Model (NZTGEM)
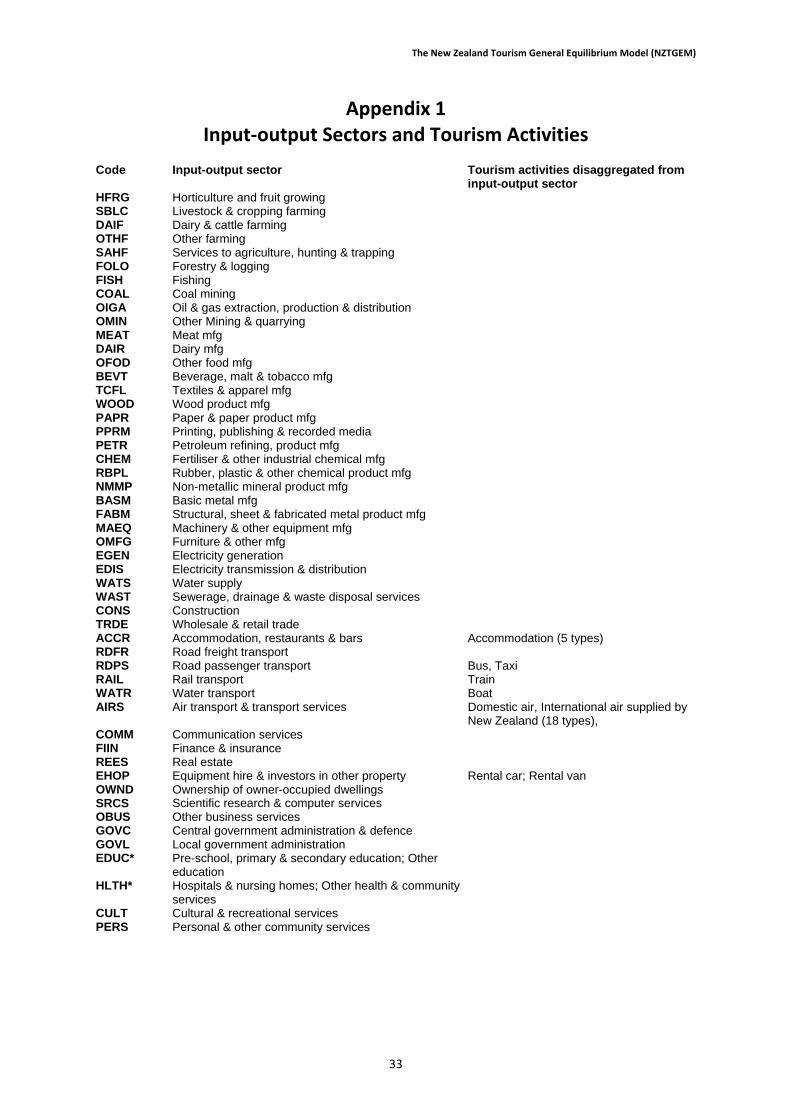
Appendix 1 Input‐output Sectors and Tourism Activities
Code Input-output sector Tourism activities disaggregated from input-output sector
HFRG Horticulture and fruit growing SBLC Livestock & cropping farming DAIF Dairy & cattle farming OTHF Other farming SAHF Services to agriculture, hunting & trapping FOLO Forestry & logging FISH Fishing COAL Coal mining OIGA Oil & gas extraction, production & distribution OMIN Other Mining & quarrying MEAT Meat mfg DAIR Dairy mfg OFOD Other food mfg BEVT Beverage, malt & tobacco mfg TCFL Textiles & apparel mfg WOOD Wood product mfg PAPR Paper & paper product mfg PPRM Printing, publishing & recorded media PETR Petroleum refining, product mfg CHEM Fertiliser & other industrial chemical mfg RBPL Rubber, plastic & other chemical product mfg NMMP Non-metallic mineral product mfg BASM Basic metal mfg FABM Structural, sheet & fabricated metal product mfg MAEQ Machinery & other equipment mfg OMFG Furniture & other mfg EGEN Electricity generation EDIS Electricity transmission & distribution WATS Water supply WAST Sewerage, drainage & waste disposal services CONS Construction TRDE Wholesale & retail trade ACCR Accommodation, restaurants & bars Accommodation (5 types) RDFR Road freight transport RDPS Road passenger transport Bus, Taxi RAIL Rail transport Train WATR Water transport Boat AIRS Air transport & transport services Domestic air, International air supplied by
New Zealand (18 types), COMM Communication services FIIN Finance & insurance REES Real estate EHOP Equipment hire & investors in other property Rental car; Rental van OWND Ownership of owner-occupied dwellings SRCS Scientific research & computer services OBUS Other business services GOVC Central government administration & defence GOVL Local government administration EDUC* Pre-school, primary & secondary education; Other
education
HLTH* Hospitals & nursing homes; Other health & community services
CULT Cultural & recreational services PERS Personal & other community services
33

The New Zealand Tourism General Equilibrium Model (NZTGEM)
The New Zealand Tourism General Equilibrium Model (NZTGEM)
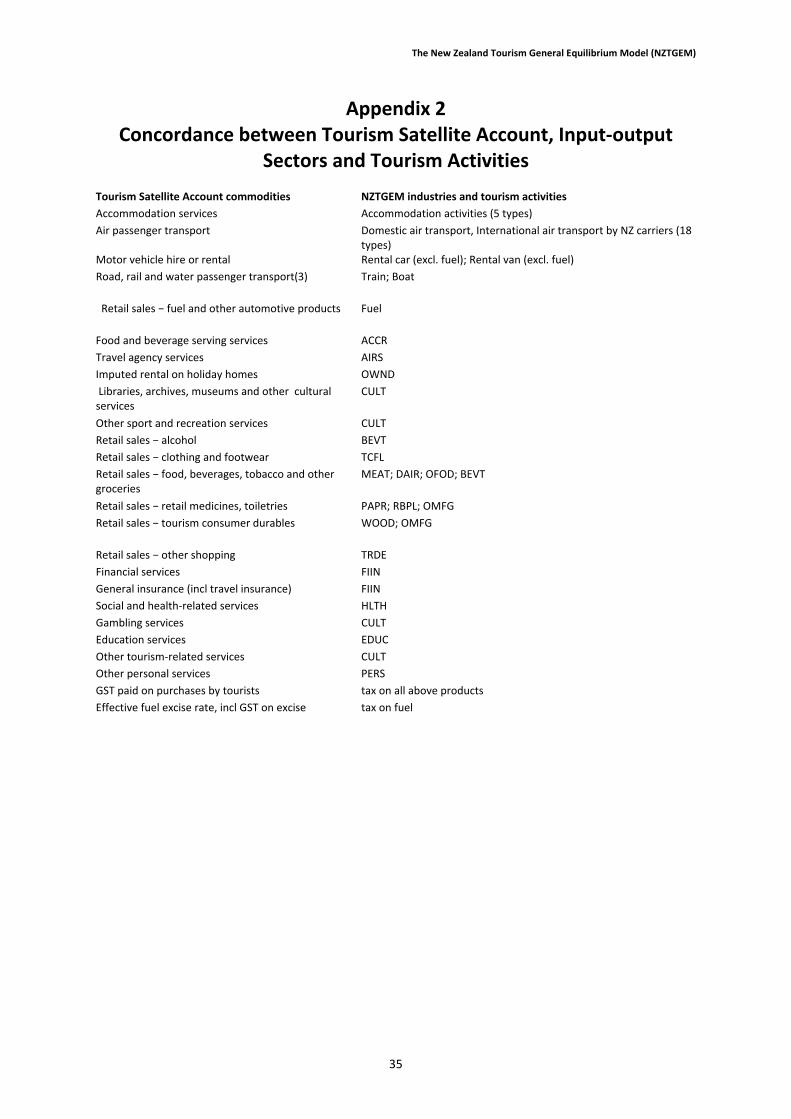
Appendix 2 Concordance between Tourism Satellite Account, Input‐output
Sectors and Tourism Activities
Tourism Satellite Account commodities NZTGEM industries and tourism activities
Accommodation services Accommodation activities (5 types)
Air passenger transport Domestic air transport, International air transport by NZ carriers (18 types)
Motor vehicle hire or rental Rental car (excl. fuel); Rental van (excl. fuel)
Road, rail and water passenger transport(3) Train; Boat
Retail sales − fuel and other automotive products Fuel
Food and beverage serving services ACCR
Travel agency services AIRS
Imputed rental on holiday homes OWND
Libraries, archives, museums and other cultural services
CULT
Other sport and recreation services CULT
Retail sales − alcohol BEVT
Retail sales − clothing and footwear TCFL
Retail sales − food, beverages, tobacco and other groceries
MEAT; DAIR; OFOD; BEVT
Retail sales − retail medicines, toiletries PAPR; RBPL; OMFG
Retail sales − tourism consumer durables WOOD; OMFG
Retail sales − other shopping TRDE
Financial services FIIN
General insurance (incl travel insurance) FIIN
Social and health‐related services HLTH
Gambling services CULT
Education services EDUC
Other tourism‐related services CULT
Other personal services PERS
GST paid on purchases by tourists tax on all above products
Effective fuel excise rate, incl GST on excise tax on fuel
35
Related Documents


![Management of seal tourism in New Zealand …vuir.vu.edu.au/24831/1/Mary Cowling.pdftourism in New Zealand – Tourism and the New Zealand fur seal in the Bay of Plenty” ] is no](https://static.cupdf.com/doc/110x72/5f5d6743a9f458434e370a14/management-of-seal-tourism-in-new-zealand-vuirvueduau248311mary-tourism-in.jpg)