The New Markets Tax Credit Progress Report 2010 A Report by the New Markets Tax Credit Coalition Revised July 2010 ■

Welcome message from author
This document is posted to help you gain knowledge. Please leave a comment to let me know what you think about it! Share it to your friends and learn new things together.
Transcript

TheNew Markets Tax Credit
Progress Report2010
A Report by the New Markets Tax Credit Coalition
Revised
July 2010
■

Ron Phillips, President ✔
Coastal Enterprises, Inc.Wiscasset, ME
Tony Brown, Secretary ✔T. Brown Consulting Cincinnati, OH
Annie Donovan, Treasurer ✔
NCB Capital Impact Arlington, VA
Frank Altman ✔Community Reinvestment FundMinneapolis, MN
David BeckSelf-HelpDurham, NC
Kermit BillupsCAPMARK Finance Washington, DC
Al Bogdan Michigan Magnet Fund Huntington Woods, MI
Ken BrezenoffSeedco Financial Services New York, NY
Angela Butler Carver Federal Savings BankNew York, NY
Douglas Bystry Clearinghouse CDFILake Forest, CA
Robert DavenportNational Development Council New York, NY
Joseph Flatley Massachusetts HousingInvestment Corporation Boston, MA
Lori GlassThe Reinvestment FundWashington, DC
Phil GlynnTravois New Markets LLCKansas City, MO
Edmundo HidalgoChicanos Por La CausaPhoenix, AZ
Marc Hirshman US Bancorp CDCSt. Louis, MO
James D. Howard, Jr.Dudley VenturesPhoenix, AZ
Robert Jenkins Hampton Roads Ventures, LLC Norfolk, VA
James Klein Ohio Community DevelopmentFinance FundColumbus, OH
Kim Latimer-NelliganLow Income Investment FundSan Francisco, CA
Peter Lawrence Enterprise Community PartnersWashington, DC
John Leith-Tetrault National Trust Comm.Investment Corp.Washington, DC
Steven McCulloughBethel New Life Chicago, IL
Richmond McCoyUrbanAmericaNew York, NY
Ray Moncrief Kentucky Highlands InvestmentCorporationLondon, KY
Julia Nelmark ✔Midwest Minnesota CDCDetroit Lakes, MN
Michael NovogradacNovogradac & Company, LLPSan Francisco, CA
Gary PerlowReznick GroupBaltimore, MD
Carl Powell ✔The Integral GroupAtlanta, GA
Radhika ReddyAriel Ventures, LLCCleveland, OH
Matt ReileinJPMorgan ChaseChicago, IL
Buzz RobertsLocal Initiatives SupportCorporationWashington, DC
Hugh ShortAlaska Growth Capital Anchorage, AK
Kenny SimpsonRural Enterprises of Oklahoma, Inc.Durant, OK
Bill Sisneros New Mexico Finance Authority Sante Fe, NM
Kevin Smith Community VenturesCorporation Lexington, KY
Cam Turner United Fund Advisors Portland, OR
Jennifer Vasiloff Opportunity Finance NetworkPhiladelphia, PA
Jose Villalobos ✔TELACULos Angeles, CA
Jeff WellsOpportunity Fund NorthernCaliforniaSan Jose, CA
New Markets Tax Credit Coalition1331 G Street, NW, 10th Floor • Washington, DC 20005(202) 204-4500 • (202) 393-3034 fax • www.nmtccoalition.org
This report was prepared by Rapoza Associates for the New Markets Tax Credit Coalition.
The New Markets Tax Credit (NMTC) Coalition is a national membership organization thatadvocates on behalf of the NMTC program. The Coalition is managed by Rapoza Associates,a public interest lobbying policy analysis and government relations firm located inWashington, DC that specializes in providing comprehensive legislative and support servicesto community development organizations, associations and public agencies.
New Markets Tax Credit Coalition Board of Directors:
✔ Executive Committee

TheNew Markets Tax Credit
Progress Report 2010
A Report by the New Markets Tax Credit Coalition
Revised
July 2010
■


Acknowledgements:
The following provided generous financial support for this publication:
Bank of America, Charlotte, NC
Baker Tilly Virchow Krause, Madison, WI
Capital One, N.A., New Orleans, LA
Dudley Ventures, Phoenix, AZ
JPMorgan Chase, New York, NY
Novogradac & Company LLP, San Francisco, CA
Reznick Group, Baltimore, MD
Rockland Trust, Rockland, MA
SunTrust Community Capital LLC, Atlanta, GA
US Bancorp Community Development Corporation, St. Louis, MO
The following entities provided generous amounts of their time and talent to assist in the development of this report:
Advantage Capital Partners, New Orleans, LA
National Development Council, New York, NY
Iowa Business Growth Company, Johnston, IA
Rural Enterprises of Oklahoma, Inc., Durant, OK
Michigan Magnet Fund, Detroit, MI
Florida Community Loan Fund, Orlando, FL
ASPIRA Florida, Miami, FL
The following provided valuable assistance in the preparation of this report:Fusion MR — Market Research for Sustainable Business, Portland, ORampersand graphic design, Boulder, CO
Contents
Introduction . . . . . . . . . . . . . . . . . . . . . . . . . . . . . . . . . . . . . . . . . . . . . . . . . . . . . . . . . . . . . . . . . . . . . . . . . . . . . . . . . . . . . .1
Survey Findings . . . . . . . . . . . . . . . . . . . . . . . . . . . . . . . . . . . . . . . . . . . . . . . . . . . . . . . . . . . . . . . . . . . . . . . . . . . . . . . . . .4
Stories from the Field . . . . . . . . . . . . . . . . . . . . . . . . . . . . . . . . . . . . . . . . . . . . . . . . . . . . . . . . . . . . . . . . . . . . . . .21
Conclusion . . . . . . . . . . . . . . . . . . . . . . . . . . . . . . . . . . . . . . . . . . . . . . . . . . . . . . . . . . . . . . . . . . . . . . . . . . . . . . . . . . . . . . .35
Appendices . . . . . . . . . . . . . . . . . . . . . . . . . . . . . . . . . . . . . . . . . . . . . . . . . . . . . . . . . . . . . . . . . . . . . . . . . . . . . . . . . . . . . .39
Appendix A: NMTC Survey Instrument . . . . . . . . . . . . . . . . . . . . . . . . . . . . . . . .40
Appendix B: A New Markets Tax Credit Timeline . . . . . . . . . . . . . . . . . . . . . . . . .51
Appendix C: The New Markets Tax Credit Extension Act of 2009(H.R. 2628) and accompanying “Dear Colleague” letter from Representatives Neal and Tiberi . . . . . . . . . . . . . . . . . . . . . . . . . . . . . . . . . . . . . . .53
Appendix D: The New Markets Tax Credit Extension Act of 2009(S. 1583) and accompanying “Dear Colleague” letter from Senators Rockefeller and Snowe . . . . . . . . . . . . . . . . . . . . . . . . . . . . . . . . . . . . . . .57
Appendix E: Treasury Department Press Release – February 18, 2010 . . . . . . . . . .62
Appendix F: NMTC Coalition Letter to IRS Requesting Guidance, July 21, 2009 . .64
Appendix G: IRS Revenue Ruling 2010-16 – June 8, 2010 . . . . . . . . . . . . . . . . . .66

List of Charts and Table
Page:
Chart 1: New Markets Tax Credit Investment 2006–2010.................................................................................1
Table 1: Allocation Availability and Demand...................................................................................................................4
Chart 2: QEIs Issued as Percent of Total Allocations .............................................................................................6
Chart 3: QEIs Issued, Committed and To Be Committed in 2010 ...........................................................7
Chart 4: Sources of QEI Investment..........................................................................................................................................7
Chart 5: Time to Deploy QEIs Once Issued........................................................................................................................8
Chart 6: Percentage of Capital Deployed in QLICIs .................................................................................................9
Chart 7: Loans and Investments in Real Estate and Non-Real Estate Businesses ..........10
Chart 8: Type of Transactions as Percentage of Total Transactions ..................................................10
Chart 9: Average Size of NMTC Transactions ..............................................................................................................11
Chart 10: Value of Real Estate Transactions by Type ...........................................................................................12
Chart 11: Percent of Total Real Estate Transactions by Type.......................................................................12
Chart 12: Value of Non-Real Estate Transactions by Type...............................................................................13
Chart 13: Percentage of Total Non-Real Estate Transactions by Type................................................14
Chart 14: Total Value of Investment in “Other” Activities ...............................................................................15
Chart 15: Average Size of “Other” Investment Activities..................................................................................15
Chart 16: Most Popular Flexible and Non-traditional Financing Products .....................................16
Chart 17: Percent of QLICIs to Rural, Major Urban and Minor Urban Areas ...............................18
Chart 18: Percent of QLICIs in Dollars to Rural, Major Urban and Minor Urban Areas .....18
Chart 19: Average Size of Transaction to Rural, Major Urban and Minor Urban Areas......19
Chart 20: QLICIs in Areas of Economic Distress..........................................................................................................20
Introduction
This 2010 Progress Report was prepared by the New Markets Tax Credit Coalition, a nationalmembership organization of Community Development Entities (CDEs) and investorsorganized to advocate on behalf of the New Markets Tax Credit (NMTC). This is theCoalition’s sixth annual NMTC progress report and, as previous reports, is designed toinform policymakers and practitioners on the Credit and how it is working to generateinvestment and economic activity in low income communities.
The New Markets Tax Credit (NMTC) was signed into law in December 2000 and the firstNMTC allocations were awarded by the Treasury Department in March 2003. In a relativelyshort period of time the NMTC has generated more than $16 billion in private capital toinvest in businesses and economic development efforts in some of our nation’s poorestcommunities. According to the CDFI Fund, 15,000 businesses have already been financedwith capital made available through the NMTC. These businesses have generated jobs,expanded health care and educational facilities, and created viable markets in economicallydistressed communities.
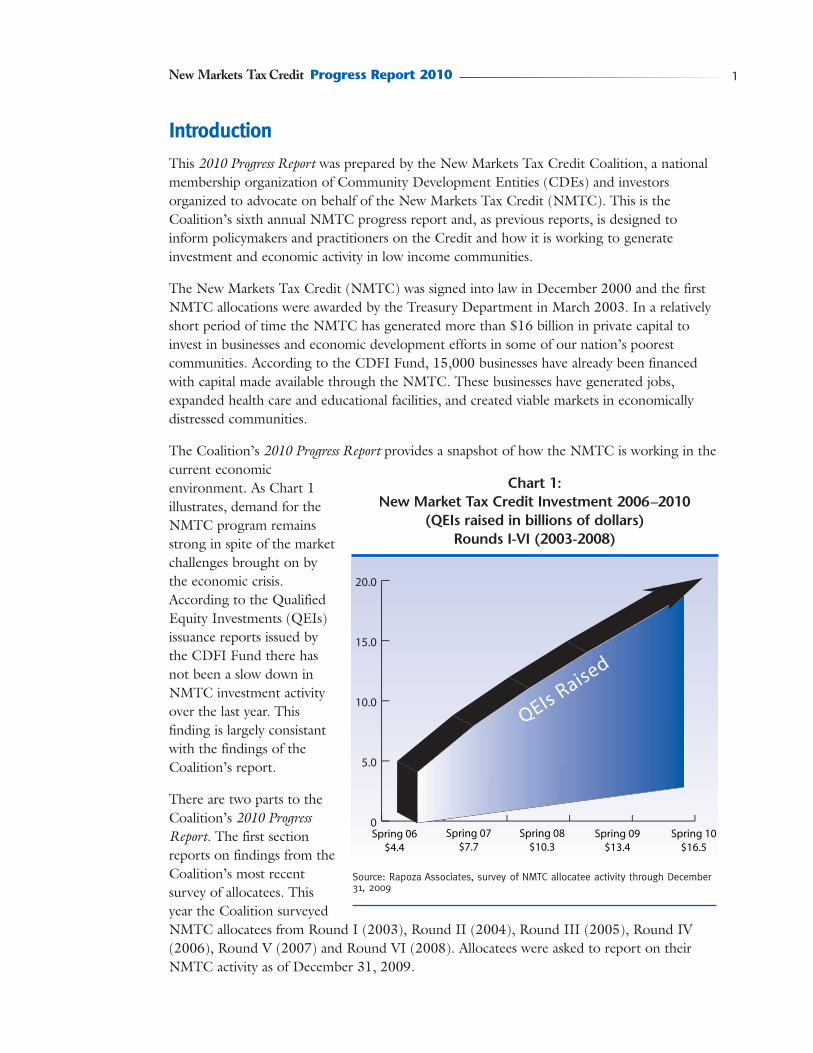
The Coalition’s 2010 Progress Report provides a snapshot of how the NMTC is working in thecurrent economicenvironment. As Chart 1illustrates, demand for theNMTC program remainsstrong in spite of the marketchallenges brought on bythe economic crisis.According to the QualifiedEquity Investments (QEIs)issuance reports issued bythe CDFI Fund there hasnot been a slow down inNMTC investment activityover the last year. Thisfinding is largely consistantwith the findings of theCoalition’s report.
There are two parts to theCoalition’s 2010 ProgressReport. The first sectionreports on findings from theCoalition’s most recentsurvey of allocatees. Thisyear the Coalition surveyedNMTC allocatees from Round I (2003), Round II (2004), Round III (2005), Round IV(2006), Round V (2007) and Round VI (2008). Allocatees were asked to report on theirNMTC activity as of December 31, 2009.
Chart 1: New Market Tax Credit Investment 2006–2010
(QEIs raised in billions of dollars)Rounds I-VI (2003-2008)
Source: Rapoza Associates, survey of NMTC allocatee activity through December31, 2009
Spring 06$4.4
Spring 07$7.7
Spring 08$10.3
Spring 09$13.4
Spring 10$16.5
0
5.0
10.0
15.0
20.0
QEIs Raised
New Markets Tax Credit Progress Report 2010 1

In addition, this report includes a series of stories from the field to illustrate how CommunityDevelopment Entities are using the NMTC to channel a variety of investment products to afull range of businesses and community development projects in low income communities.This year the Coalition’s report profiles several high impact NMTC projects in Florida, Iowa,Louisiana, Michigan and Oklahoma.
Background on the New Markets Tax Credit
The New Markets Tax Credit was designed to stimulate private investment and economicgrowth in low income communities that have historically been overlooked by conventionalinvestors. These economically distressed communities lack access to the patient capital that isneeded to support new and existing businesses, create jobs and generate economic activity.
The Credit attracts private sector investors to low income areas by offering a 39 percentfederal tax credit, for each dollar invested, over seven years – a 5 percent credit in each of thefirst three years and a 6 percent credit in each of the last four years. The investor receives theCredit in return for a Qualified Equity Investment (QEI) in a Community DevelopmentEntity (CDE). The CDE in turn uses the capital derived from the Credit to make loans orinvestments in businesses and projects in low income communities. These loans andinvestments are called Qualified Low Income Community Investments (QLICIs).
The Department of the Treasury’s Community Development Financial Institutions (CDFI)Fund, which administers the New Market Tax Credit program, starts the allocation processby certifying CDEs. In general, a CDE is a domestic corporation with a track record incommunity development and is accountable to the residents of the low income communitiesit serves (i.e. by having such residents represented on the CDE’s governing or advisoryboards). Examples of a CDE are a Community Development Corporation, a CommunityDevelopment Financial Institution, a private financial institution, or a Small BusinessInvestment Company.
The CDFI Fund also oversees the competitive Credit allocation application process thatdetermines which CDEs are awarded New Markets Tax Credits. If a CDE is awarded anallocation of Credits it must sign an Allocation Agreement with the CDFI Fund, giving theallocatee the authority to market the Credit to investors and to implement its New MarketsTax Credit business strategy.
Political Support for NMTC on Both Sides of the Aisle
Since its inception in 2000, Congress has consistently supported the NMTC making it one ofthe largest community development programs in the federal government. From thebeginning the NMTC has enjoyed bi-partisan support. The NMTC was signed into law byPresident Clinton and became law as part of the Community Renewal Tax Relief Act of 2000(P.L. 106-554). The Credit was launched under President Bush with the Round I awardsmade in 2003 and the first extension was passed by a Republican Congress in 2006.
2 A Report by the New Markets Tax Credit Coalition

3New Markets Tax Credit Progress Report 2010
The original NMTC legislation provided $15 billion in Credit allocations between 2000 and2007. These Credits were awarded over five allocation rounds in years 2003 through 2007.In December 2005, an additional $1 billion was authorized in New Markets Tax Creditallocations for Gulf Coast communities devastated by Hurricane Katrina and those Creditswere allocated in 2006 and 2007.
The Tax Relief and Health Care Act of 2006 (P.L. 109-432) extended the Credit through2008 with an additional $3.5 billion in Credit authority and language requiring theDepartment of Treasury to better target the Credit to non-metro areas. In the fall of 2008,Congress passed the Renewable Energy and Job Creation Act of 2008 (P.L. 110-140) thatincluded a NMTC extension through 2009 at the $3.5 billion rate.
In February of 2009, Congress passed the American Recovery and Reinvestment Act of 2009(P.L. 115-5) (ARRA) that included $3 billion in additional New Markets Tax Credit authoritydivided equally between 2008 and 2009. The ARRA legislation increased the overall NMTCallocation authority to $5 billion annually.
In the summer of 2009, The New Markets Tax Credit Extension Act of 2009 (H.R. 2628 and S. 1583) was introduced in the House by Representatives Richard Neal (D-MA) and PatrickTiberi (R-OH) and in the Senate by Senators John Rockefeller (D-WV) and Olympia Snowe(R-ME). The New Markets Tax Credit Extension Act of 2009 would extend the NMTCthrough 2014 with $5 billion in annual allocation authority. The bill would also provideAlternative Minimum Tax (AMT) relief to NMTC investors.
While the NMTC Coalition continues to advocate for a longer term extension of the NMTC,the 111th Congress is expected to approve a tax extender bill that will provide a one-yearextension of the NMTC with $5 billion in allocation authority available for 2010. On May28, 2010 the House passed tax extender legislation that includes that extension and theSenate is expected to follow suit.
To date the CDFI Fund has awarded seven rounds of Credit allocations for a total of $26billion in NMTC allocation authority. Applications for the 2010 allocations (Round VIII)were due on June 2, 2010 and the CDFI Fund expects to announce the 2010 NMTCallocation awards before the end of 2010.
Demand for Credits Remains Strong
The NMTC allocation application process is highly competitive. As shown in Table 1,between 2003 and 2010 the demand for allocations outstripped the availability of Credits bymore than $171 billion.
When a CDE submits an allocation application to the CDFI Fund it must detail how itintends to use the requested NMTC allocation. A CDE applicant is required to provide detailin four areas: business strategy, capitalization strategy, management capacity, and communityimpact. Each of these four areas is scored equally and the stiff competition requires thatsuccessful applicants score well in all four categories. The CDFI Fund typically receives somany highly rated applications that in order for a CDE applicant to be successful it mustexceed the minimum standards for raising and deploying capital and demonstrate how it
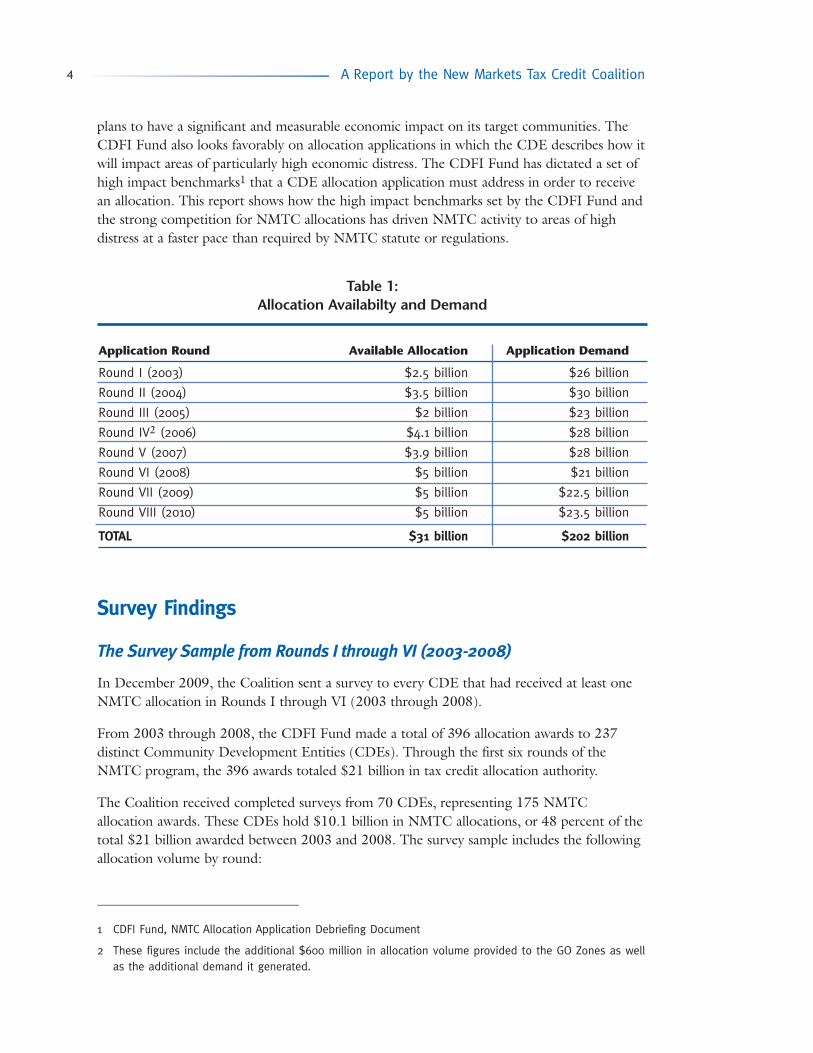
plans to have a significant and measurable economic impact on its target communities. TheCDFI Fund also looks favorably on allocation applications in which the CDE describes how itwill impact areas of particularly high economic distress. The CDFI Fund has dictated a set ofhigh impact benchmarks1 that a CDE allocation application must address in order to receivean allocation. This report shows how the high impact benchmarks set by the CDFI Fund andthe strong competition for NMTC allocations has driven NMTC activity to areas of highdistress at a faster pace than required by NMTC statute or regulations.
Survey Findings
The Survey Sample from Rounds I through VI (2003-2008)
In December 2009, the Coalition sent a survey to every CDE that had received at least oneNMTC allocation in Rounds I through VI (2003 through 2008).
From 2003 through 2008, the CDFI Fund made a total of 396 allocation awards to 237distinct Community Development Entities (CDEs). Through the first six rounds of theNMTC program, the 396 awards totaled $21 billion in tax credit allocation authority.
The Coalition received completed surveys from 70 CDEs, representing 175 NMTCallocation awards. These CDEs hold $10.1 billion in NMTC allocations, or 48 percent of thetotal $21 billion awarded between 2003 and 2008. The survey sample includes the followingallocation volume by round:
_______________________________
1 CDFI Fund, NMTC Allocation Application Debriefing Document
2 These figures include the additional $600 million in allocation volume provided to the GO Zones as wellas the additional demand it generated.
Table 1: Allocation Availabilty and Demand
Application Round Available Allocation Application Demand
Round I (2003) $2.5 billion $26 billion
Round II (2004) $3.5 billion $30 billion
Round III (2005) $2 billion $23 billion
Round IV2 (2006) $4.1 billion $28 billion
Round V (2007) $3.9 billion $28 billion
Round VI (2008) $5 billion $21 billion
Round VII (2009) $5 billion $22.5 billion
Round VIII (2010) $5 billion $23.5 billion
TOTAL $31 billion $202 billion
A Report by the New Markets Tax Credit Coalition4
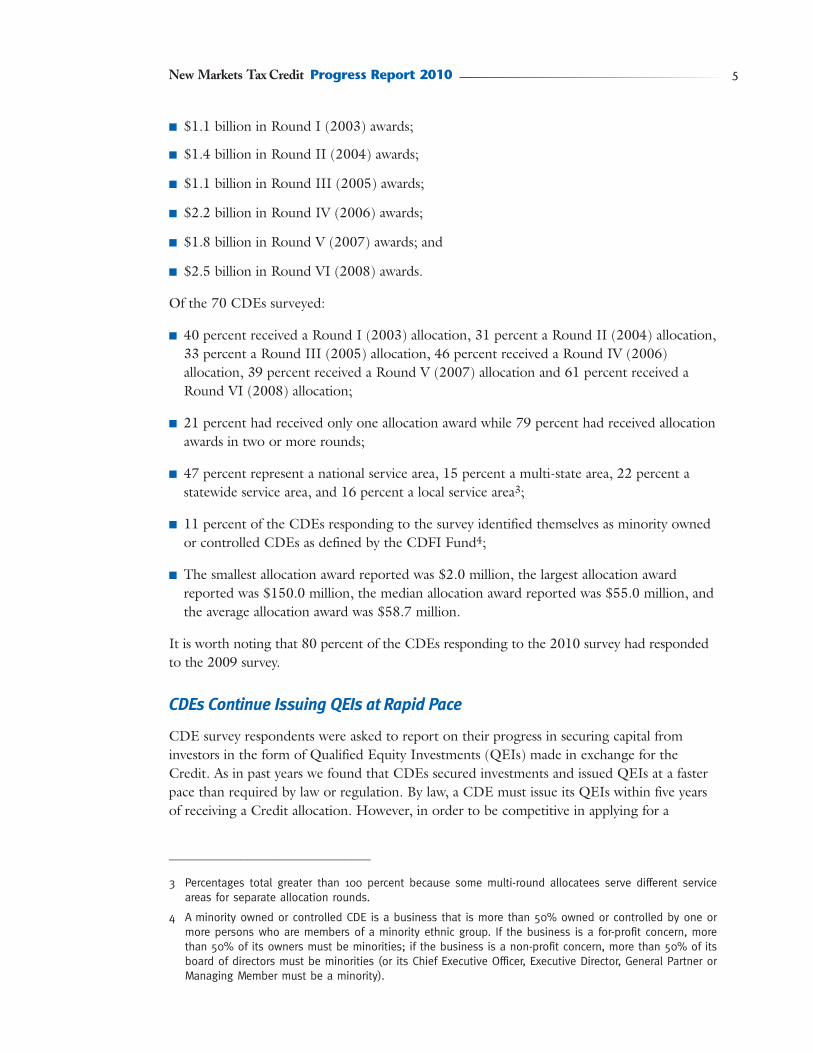
■ $1.1 billion in Round I (2003) awards;
■ $1.4 billion in Round II (2004) awards;
■ $1.1 billion in Round III (2005) awards;
■ $2.2 billion in Round IV (2006) awards;
■ $1.8 billion in Round V (2007) awards; and
■ $2.5 billion in Round VI (2008) awards.
Of the 70 CDEs surveyed:
■ 40 percent received a Round I (2003) allocation, 31 percent a Round II (2004) allocation,33 percent a Round III (2005) allocation, 46 percent received a Round IV (2006)allocation, 39 percent received a Round V (2007) allocation and 61 percent received aRound VI (2008) allocation;
■ 21 percent had received only one allocation award while 79 percent had received allocationawards in two or more rounds;
■ 47 percent represent a national service area, 15 percent a multi-state area, 22 percent astatewide service area, and 16 percent a local service area3;
■ 11 percent of the CDEs responding to the survey identified themselves as minority ownedor controlled CDEs as defined by the CDFI Fund4;
■ The smallest allocation award reported was $2.0 million, the largest allocation awardreported was $150.0 million, the median allocation award reported was $55.0 million, andthe average allocation award was $58.7 million.
It is worth noting that 80 percent of the CDEs responding to the 2010 survey had respondedto the 2009 survey.
CDEs Continue Issuing QEIs at Rapid Pace
CDE survey respondents were asked to report on their progress in securing capital frominvestors in the form of Qualified Equity Investments (QEIs) made in exchange for theCredit. As in past years we found that CDEs secured investments and issued QEIs at a fasterpace than required by law or regulation. By law, a CDE must issue its QEIs within five yearsof receiving a Credit allocation. However, in order to be competitive in applying for a
New Markets Tax Credit Progress Report 2010 5
_______________________________
3 Percentages total greater than 100 percent because some multi-round allocatees serve different serviceareas for separate allocation rounds.
4 A minority owned or controlled CDE is a business that is more than 50% owned or controlled by one ormore persons who are members of a minority ethnic group. If the business is a for-profit concern, morethan 50% of its owners must be minorities; if the business is a non-profit concern, more than 50% of itsboard of directors must be minorities (or its Chief Executive Officer, Executive Director, General Partner orManaging Member must be a minority).

NMTC allocation a CDE must demonstrate its ability to raise 80 percent of its investmentcapital within two years and 100 percent within three years5.
In aggregate, as of December 31, 2009, the CDEs surveyed had issued over $7.7 billion inQEIs or 76 percent of the total $10.1 billion in NMTC allocations awarded. In addition, theseCDEs had legally committed6 another $552 million as of year end 2009 and anticipated thatanother $2 billion will be issued as QEIs by the end of 2010. This QEI issuance rate is slightlyslower than reported in the 2009 survey, when Allocatees from Rounds I-V (2003-2007)indicated that 82 percent of their allocations had been issued as QEIs as of December 31,2008 (Chart 2). The QEI issuance rate by round is shown in Chart 3.
As in past years, the survey revealed that after 3 years CDEs have issued or committed mostof their allocations as QEIs (Chart 2). This year’s survey revealed that by the end of 2009:
■ Round I (2003) CDEs had issued $1.1 billion and legally committed an additional $6million;
■ Round II (2004) CDEs had issued $1.4 billion making them fully committed;
■ Round III (2005) CDEs had issued $1.1 billion and legally committed $10.1 million;
■ Round IV (2006) CDEs had issued $1.9 billion and legally committed $14 million;
■ Round V (2007) CDEs had issued $1.3 billion and legally committed $94 million; and
■ Round VI (2008) CDEs had issued $808 million and legally committed $326 million.
Chart 2: QEIs Issued as Percent of Total Allocations — Rounds I-VI (2003-2008)
Source: Rapoza Associates, survey of NMTC allocatee activity through December 31, 2009
Legallycommitted
5%
Remainder ofallocations19%
QEIs issued by 12/31/0976%
A Report by the New Markets Tax Credit Coalition6
QEIs issued by 12/31/08
Total legally committedRemainder of allocations
_______________________________
5 CDFI Fund, NMTC Allocation Application Debriefing Document
6 A legally binding contract signed between a CDE and an investor whereby the latter agrees to make aninvestment or a series of investments according to a determined schedule.
82%
5%
13%
ssued by 12/31/08
Rounds I-V as of 12/31/08
Source: 2009 NMTC Progress Report

NMTC Investor Market
CDEs were asked toidentify their NMTCinvestors by sector -indicating the types ofinstitutions to which theyhad issued QEIs. Fortypercent of the CDEsresponding indicated thatthey had securedinvestments from morethan one type of investorand Chart 4 shows thediversity of institutionalinvestors engaged in theCredit.
As in past surveys, CDEsreported that regulatedfinancial institutions are themost common source ofNMTC investment. Thesurvey found that 88.6percent of the CDEsreporting had secured all or
Chart 4: Sources of QEI Investment — Rounds I-VI (2003-2008)
Source: Rapoza Associates, survey of NMTC allocatee activity through December 31, 2009
2%
9%
10%
19%
20%
86%
0% 10% 20% 30% 40% 50% 60% 70% 80% 90% 100%
Individual
Insurance company
Other
ration (other than listed)
nregulated financial services
Bank
0% 10% 20% 30% 40% 50% 60% 70% 80% 90% 100%
Individuals
InsuranceCompanies
Other
PrivateCorporations
UnregulatedFinancial Institutions
RegulatedFinancial Institutions
88.6%
4.3%
8.6%
17.1%
22.9%
Venture CapitalFunds
0%
10.0%
New Markets Tax Credit Progress Report 2010 7
Chart 3: QEIs Issued, Committed and To Be Committed in 2010
as Percent of Allocation by Round — Rounds I-VI (2003-2008)
Source: Rapoza Associates, survey of NMTC allocatee activity through December31, 2009
0%
10%
20%
30%
40%
50%
60%
70%
80%
90%
100%
Round I 2003
Round II 2004
Round III 2005
Round IV 2006
Round V 2007
Round VI 2008
QEIs to be issued by 12/31/10
QEIs legally committed but not made by 12/31/09
QEIs issued by 12/31/09

some of their QEIs from regulated financial institutions. The survey found that 23 percent ofthe CDEs had secured investments from private corporations and 17 percent from unregulatedfinancial institutions.
It is important to note that 17 percent of CDEs responding to the survey were themselvesregulated financial institutions. It is not uncommon for these institutions to be both theNMTC Allocatees and investors. This may contribute to the predominance of financialinstitutions as investors.
The “other” sources of investment in Chart 4 includes leveraged upper tier funds,community development corporations, pension funds, and government sponsored enterpriseshighlighting even further the diverse sources of capital invested in underserved communitiesthrough the NMTC program.
CDE respondents were asked if over the last year an investor had withdrawn or otherwisebeen unable to close a NMTC transaction as anticipated. Seventeen percent of the CDEsreported to have had an investor pull back from a commitment and 54 percent reporteddifficulty securing leveraged debt over the last year. CDEs revealed that it was taking longerto find investors, particularly leveraged debt lenders. CDEs also indicated that investors wereputting more stringent underwriting requirements in place, making it more difficult to securedebt financing for leveraged investments.
Deploying NMTC Capital
CDEs responding to the survey continue to get loans and investments into the field at afaster rate than required by law or by the CDFI Fund. The law requires CDEs to have“substantially all” (at least 85 percent by regulation) of their QEIs deployed in Qualified LowIncome Community Investments (QLICIs) within one year of issuance.
A Report by the New Markets Tax Credit Coalition8
Chart 5: Time to Deploy QEIs Once Issued — Rounds I-VI (2003-2008)
Source: Rapoza Associates, survey of NMTC allocatee activity through December 31, 2009
0% 5% 10% 15% 20% 25% 30% 35% 40%
9-12 months
6-9 months
3-6 months
1-3 months
One month or less
Less than one week
Percent of Respondents
50%
5.7%
7.1%
10.0%
12.9%
17.1%
47.1%

Forty-seven percent of the CDEs surveyed indicated that they deploy their capital in less thana week after issuing a QEI. This is up from 36 percent of the CDEs who reported suchtimely deployment in the 2009 survey. Seventeen percent of the CDEs reported that QEIsare deployed within thirty days, and another 13 percent deploy QEIs within three months(Chart 5). Thus, 77 percent deploy their capital in three months or less.
As of December 31, 2009, survey respondents had collectively made a total of 2,082 QLICIstotaling $8.8 billion, which represents approximately 86 percent of the total allocationsawarded to survey respondents. This figure is significant for several reasons. First, CDEsresponding to this year’s survey had deployed a higher percentage of the allocations asQLICIs as compared to the 2009 survey respondents that had deployed 79 percent of theirallocations into QLICIs (Chart 6).
In addition, this year’s survey respondents deployed $8.8 billion in QLICIs between 2003and 2009 while securing $7.7 billion in QEI investments. This finding indicates that CDEsare starting to redeploy principal as it is returned from original QLICIs thus furtherenhancing the community impact of a NMTC investment.
New Markets Tax Credit Progress Report 2010 9
Chart 6: Percentage of Capital Deployed as QLICIs — Rounds I-VI as of 12/31/09
Source: Rapoza Associates, survey of NMTC allocatee activity through December 31, 2009
Remainder ofallocations14%
QLICIs as of 12/31/0986%
79%
21%
QLICIs as of 12/31/08
Rounds I-V as of 12/31/08
Source: 2009 NMTC Progress Report
QLICIs as of 12/31/08
Remainder of allocations

NMTC Loans and Investments
A QLICI can take the form of an investment or loan in a qualified business, an equityinvestment or loan in another CDE, the purchase of a qualified loan from another CDE, orfinancial counseling to businesses or residents in a low income community.
As Charts 7 and 8 show, most of the nearly $8.8 billion in QLICIs deployed by the CDEssurveyed as of December 31, 2009 were in the category of investments and loans to qualifiedbusinesses. Almost 80 percent of the QLICIs reported took the form of debt financing whileapproximately 17 percent of the QLICIs were invested as equity.
A Report by the New Markets Tax Credit Coalition10
Chart 8: Type of Transactions as Percentage of Total Transactions
Rounds I-VI (2003-2008)
Source: Rapoza Associates, survey of NMTC allocatee activity through December 31, 2009
0%
10%
20%
30%
40%
50%
Investments in non-realestate businesses
Investments in real-estate businesses
Loans to non-real estate businesses
Loans to real-estatebusinesses
Other activities
7.5% 9.9% 35.6% 44.2%2.7%
Chart 7: Loans and Investments in Real Estate and Non-Real Estate Businesses
Rounds I-VI (2003-2008)
Source: Rapoza Associates, survey of NMTC allocatee activity through December 31, 2009
$3,150,923,024 $3,910,759,248$0
$500,000,000
$1,000,000,000
$1,500,000,000
$2,000,000,000
$2,500,000,000
$3,000,000,000
$3,500,000,000
$4,000,000,000
Investments in non-real estate businesses
Investments in real-estate businesses
Loans to non-real estate businesses
Loans to real-estate businesses
$663,178,452 $876,532,715

In addition, CDEs reported 2.7 percent of the QLICIs financed financial counseling, loans orinvestments in another CDE and/or to purchase loans from another CDE.
The CDEs reported that more than $3.8 billion, or 43 percent of the QLICIs, financed non-real estate businesses and more than $4.8 billion, or 54 percent of the QLICIs, financed realestate businesses.
In making the distinction between real estate and non-real estate transations the Coalition isusing the CDFI Fund’s definition that defines a “real estate business” as a business that isprincipally engaged in the development of a specific real estate project as opposed to a non-real estate business securing NMTC financing for business operations or expansion.
Over the last three years the Coalition’s surveys have revealed a steady increase in QLICIsbeing made in non-real estate businesses. The Coalition’s 2008 survey found that 35 percentof the QLICIs were made in non-real estate businesses, 40 percent in 2009 and now 43percent in this survey.
Chart 9 shows the average size of QLICI loans and investments made in qualified businesses.Loans to real-estate businesses have always been the largest type of QLICI and the $4.8million average loan reported this year is similar to that reported over the last three years.However, the average size of loans and investments made in non-real estate businesses hasincreased over the last three years according to the survey. In 2008 the Coalition’s surveyfound that the average investment in a non-real estate business was $3.4 million, in 2009 itwas $3.9 million and this year’s survey reports $4.1 million. Similarly, the average loan to anon-real estate business reported in the 2008 survey was $2.0 million, in 2009 it was $3.4million and this year’s survey reports the average loan to be $3.8 million.
New Markets Tax Credit Progress Report 2010 11
Chart 9: Average Size of NMTC Transactions by Type (in dollars) — Rounds I-VI (2003-2008)
Source: Rapoza Associates, survey of NMTC allocatee activity through December 31, 2009
$4,170,934 $2,827,525 $3,819,301 $4,888,449$0
$1,000,000
$2,000,000
$3,000,000
$4,000,000
$5,000,000
$6,000,000
Investments in non-real estate businesses
Investments in real-estate businesses
Loans to non-real estate businesses
Loans to real-estatebusinesses
Type of Transaction

A Report by the New Markets Tax Credit Coalition12
Chart 11: Percent of Total Real Estate Transactions by Type — Rounds I-VI (2003-2008)
Source: Rapoza Associates, survey of NMTC allocatee activity through December 31, 2009
0%
5%
10%
15%
20%
25%
30%
Mixed-Use Retail Office Space CommunityFacility
Other Industrial/Manufacturing
For-SaleHousing
Type of Transaction
2.3%6.7%9.7%14.1%29.2% 22.5% 15.6%
Chart 10: Value of Real Estate Transactions by Type — Rounds I-VI (2003-2008)
Source: Rapoza Associates, survey of NMTC allocatee activity through December 31, 2009
$1,397,573,930 $744,860,575 $672,827,813 $466,155,467 $318,484,515$0
$200,000,000
$400,000,000
$600,000,000
$800,000,000
$1,000,000,000
$1,200,000,000
$1,400,000,000
$1,600,000,000
Mixed-Use Retail Office Space CommunityFacility
Other Industrial/Manufacturing
For-SaleHousing
Type of Transaction
$1,076,271,833 $112,046,986
Charts 10 and 11 reveal the prominence of mixed use and retail projects among the realestate transactions. Mixed use deals account for 29 percent of all real estate transactionsreported by the survey respondents. The second most common type of real estate projectreported was retail at $1 billion, or 23 percent of all real estate transactions. These findingsare consistent with previous Coalition reports.
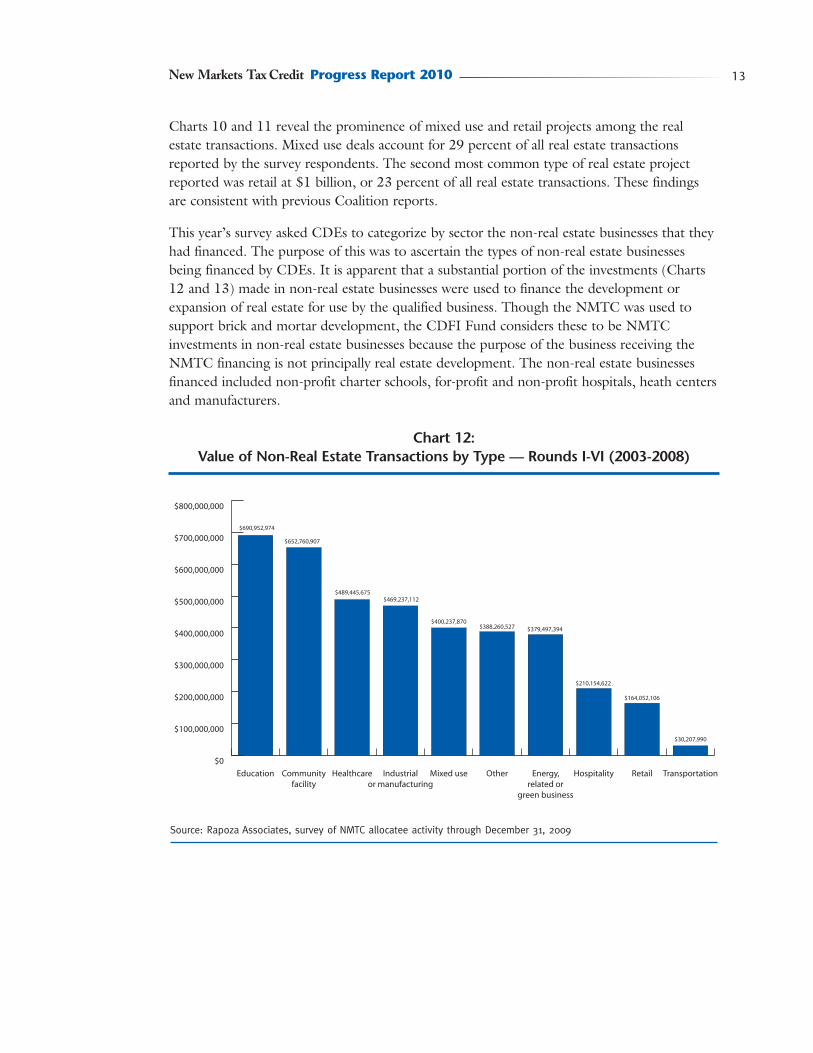
This year’s survey asked CDEs to categorize by sector the non-real estate businesses that theyhad financed. The purpose of this was to ascertain the types of non-real estate businessesbeing financed by CDEs. It is apparent that a substantial portion of the investments (Charts12 and 13) made in non-real estate businesses were used to finance the development orexpansion of real estate for use by the qualified business. Though the NMTC was used tosupport brick and mortar development, the CDFI Fund considers these to be NMTCinvestments in non-real estate businesses because the purpose of the business receiving theNMTC financing is not principally real estate development. The non-real estate businessesfinanced included non-profit charter schools, for-profit and non-profit hospitals, heath centersand manufacturers.
Chart 12: Value of Non-Real Estate Transactions by Type — Rounds I-VI (2003-2008)
Source: Rapoza Associates, survey of NMTC allocatee activity through December 31, 2009
$0
$100,000,000
$200,000,000
$300,000,000
$400,000,000
$500,000,000
$600,000,000
$700,000,000
$800,000,000
TransportationRetailHospitalityEnergy,related or
green business
OtherMixed useIndustrialor manufacturing
HealthcareCommunityfacility
Education
$690,952,974
$652,760,907
$489,445,675$469,237,112
$400,237,870$388,260,527 $379,497,394
$210,154,622
$30,207,990
$164,052,106
New Markets Tax Credit Progress Report 2010 13
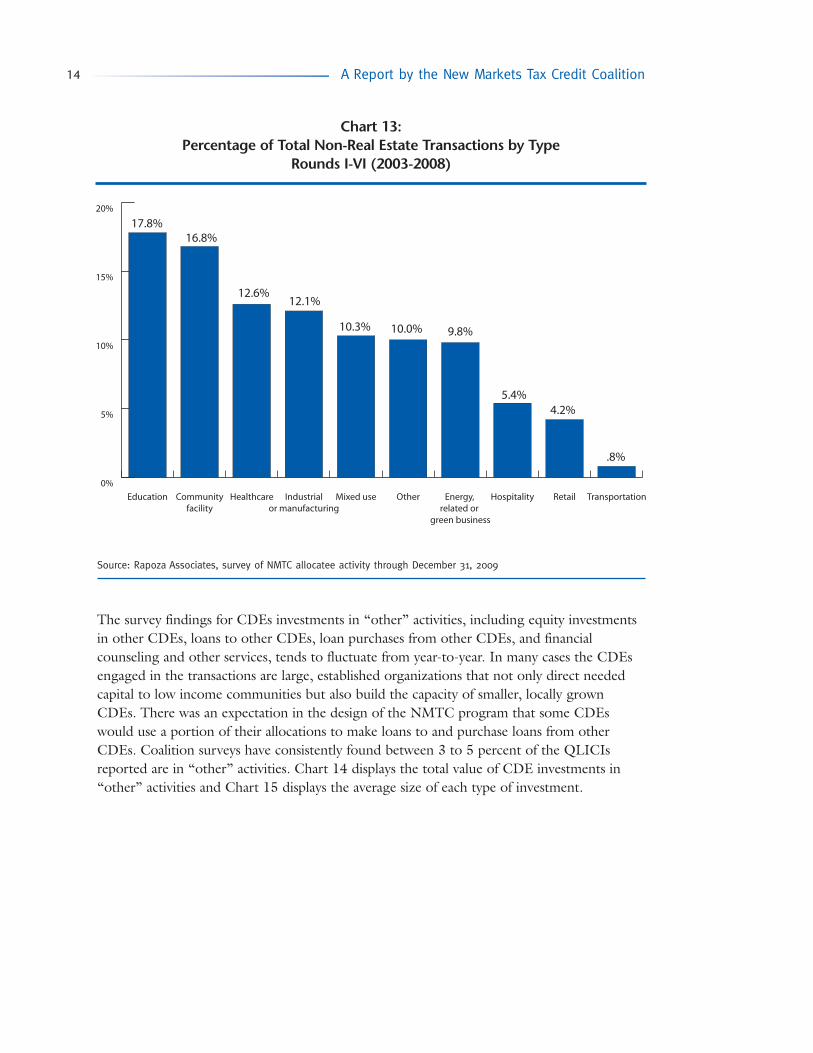
The survey findings for CDEs investments in “other” activities, including equity investmentsin other CDEs, loans to other CDEs, loan purchases from other CDEs, and financialcounseling and other services, tends to fluctuate from year-to-year. In many cases the CDEsengaged in the transactions are large, established organizations that not only direct neededcapital to low income communities but also build the capacity of smaller, locally grownCDEs. There was an expectation in the design of the NMTC program that some CDEswould use a portion of their allocations to make loans to and purchase loans from otherCDEs. Coalition surveys have consistently found between 3 to 5 percent of the QLICIsreported are in “other” activities. Chart 14 displays the total value of CDE investments in“other” activities and Chart 15 displays the average size of each type of investment.
A Report by the New Markets Tax Credit Coalition14
Chart 13: Percentage of Total Non-Real Estate Transactions by Type
Rounds I-VI (2003-2008)
Source: Rapoza Associates, survey of NMTC allocatee activity through December 31, 2009
0%
5%
10%
15%
20%
TransportationRetailHospitalityEnergy, related or
green business
OtherMixed useIndustrialor manufacturing
HealthcareCommunityfacility
Education
17.8%16.8%
12.1%12.6%
10.3% 10.0% 9.8%
5.4%4.2%
.8%

New Markets Tax Credit Progress Report 2010 15
Chart 14: Total Value of Investment in “Other” Activities (in dollars)
Rounds I-VI (2003-2008)
Source: Rapoza Associates, survey of NMTC allocatee activity through December 31, 2009
$0
$20,000,000
$40,000,000
$60,000,000
$800,000,00
$100,000,000
$120,000,000
FinancialCounseling and Other Services
Loan Purchases from Other
CDEs
Loans toOther CDEs
Equity Investments
in Other CDEs
$1,569,664$11,040,000
$109,605,558$116,938,856
Chart 15: Average Size of “Other” Investment Activities (in dollars)
Rounds I-VI (2003-2008)
Source: Rapoza Associates, survey of NMTC allocatee activity through December 31, 2009
$0
$1,000,000
$2,000,000
$3,000,000
$4,000,000
$5,000,000
FinancialCounseling andOther Services
LoanPurchases from
Other CDEs
Loans toOther CDEs
Equity Investments
in Other CDEs
$2,760,000
$2,051,559
$4,566,898
$50,634

Patient, Flexible Financing Products
The flexibility of the Credit allows CDEs to structure financing products and strategies basedon the needs of the business, the profile of the community, and the financing gaps in themarket.
However, in order to succeed in the competitive allocation process, a CDE must show how itwill target investments to communities with high economic distress and demonstrate how theCredit will be used to provide patient, flexible capital at terms and conditions not otherwiseavailable in the market. The CDFI Fund has continued to add application questions on thetypes of flexible products offered and award points to CDEs committed to making use ofthem.
Survey respondents were asked to identify their three most frequently utilized flexible or non-traditional financing products out of a list of products identified by the CDFI Fund(Chart 16).
A Report by the New Markets Tax Credit Coalition16
Chart 16:Most Popular Flexible and Non-traditional Financing Products, 2010 vs. 2009 vs.
2008 (by Percent of Survey Respondents)
Source: Rapoza Associates, survey of NMTC allocatee activity through December 31, 2009
0% 10% 20% 30% 40% 50% 60% 70% 80% 90% 100%
Non-traditional forms of collateral
Loan loss reserve requirementsthat are less than standard
Equity equivalent terms and conditions
Lower than standard debtservice coverage ratio
Equity investments
More flexible borrower credit standards
Debt with equity features
Debt with longer thanstandard amortization period
Debt with higher than standardloan to value ratio
Debt with lower thanstandard origination fees
Subordinated debt
Debt with longer than standard periodof interest-only loan payments
Debt with below marketinterest rates
2009
Fin
anci
ng
Pro
du
cts
Percentage of Survey Respondents who utilized the product
2010
2008
Over 87 percent of survey respondents indicated that debt with below market interest rates isthe CDE’s most frequently utilized product. This is consistent with prior years’ findings.Here are the next “top three” products offered by the CDEs surveyed:
■ Longer than standard period of interest-only loan payments – 64 percent
■ Subordinated debt – 31 percent
■ Debt with lower than standard origination fees – 27 percent
This year revealed some shifts in the use of certain financing products, perhaps a result ofchanges in the capital markets. Chart 16 shows survey results from 2008, 2009 and 2010 toillustrate changes in the most popular financing products CDEs choose to offer each year. Forinstance, in the 2008 Progress Report, 47 percent of respondents indicated that they usedlower than standard origination fees, and in the 2010 Progress Report that number dropped to25 percent of respondents. Debt with a higher than standard loan to value ratio droppedfrom 40 percent usage in 2008 to 20 percent in this year’s report. The survey also found thatit is less common now to provide products with more flexible borrower credit standards;usage declined from 25 percent in 2008 to 2.9 percent in 2010.
Leveraging Additional Investment into Target Communities
Neither the law nor regulation requires a CDE to leverage additional resources from outsideinvestors when structuring deals. The New Markets Tax Credit program is by its verydefinition leverage; as originally authorized the program uses a $0.39 federal tax creditsubsidy to make a $1 investment in a poor community. However, at the same time, CDEshave proven adept at using NMTC financing to leverage additional dollars into targetcommunities at the project level.
In some instances a CDE will use its QEIs to provide 100 percent financing to a localbusiness. In other situations, a CDE may be the first investor in a deal, thus helping to lowerthe risk profile of the deal and attract other private and public investors. Finally, a CDE mayprovide gap financing supplying the patient capital necessary to finalize a deal.
Survey respondents were asked what percentage of a project’s total cost is typically financedusing NMTC. On average CDEs reported that 47 percent of a project’s cost was coveredusing NMTC financing. However 31 percent of the CDEs reported that they are increasinglybeing called on to use NMTC to finance a larger percentage of a project’s overall cost asother sources of financing become tight.
New Markets Tax Credit Progress Report 2010 17

NMTC Activity in Rural, Major Urban,Minor Urban Areas
CDEs reported that 15 percent of theirQLICIs made as of December 31, 2009were invested in rural areas7 (Chart 17) and14 percent of the total QLICI dollars wereinvested in rural areas (Chart 18). Over thelast three years the Coalition’s surveys haverevealed a steady increase in NMTC activityin rural areas. The Coalition’s 2008 surveyfound that 11 percent of the QLICIs and11 percent of the QLICI dollars went torural areas. The 2009 survey found that 14percent of the of the QLICIs and 13percent of the QLICI dollars went to ruralareas.
The Tax Relief and Health Care Act of 2006(P.L. 109-432) extended the Creditthrough 2008 and amended the statute toaddress the need for more capitalinvestment in rural areas. Starting in 2008,the CDFI Fund has been required toensure that at least 20 percent of QLICIsmade by allocatees are invested in non-metropolitan counties. The increase seen inrural activity in this year’s survey could inpart be attributed to this change.
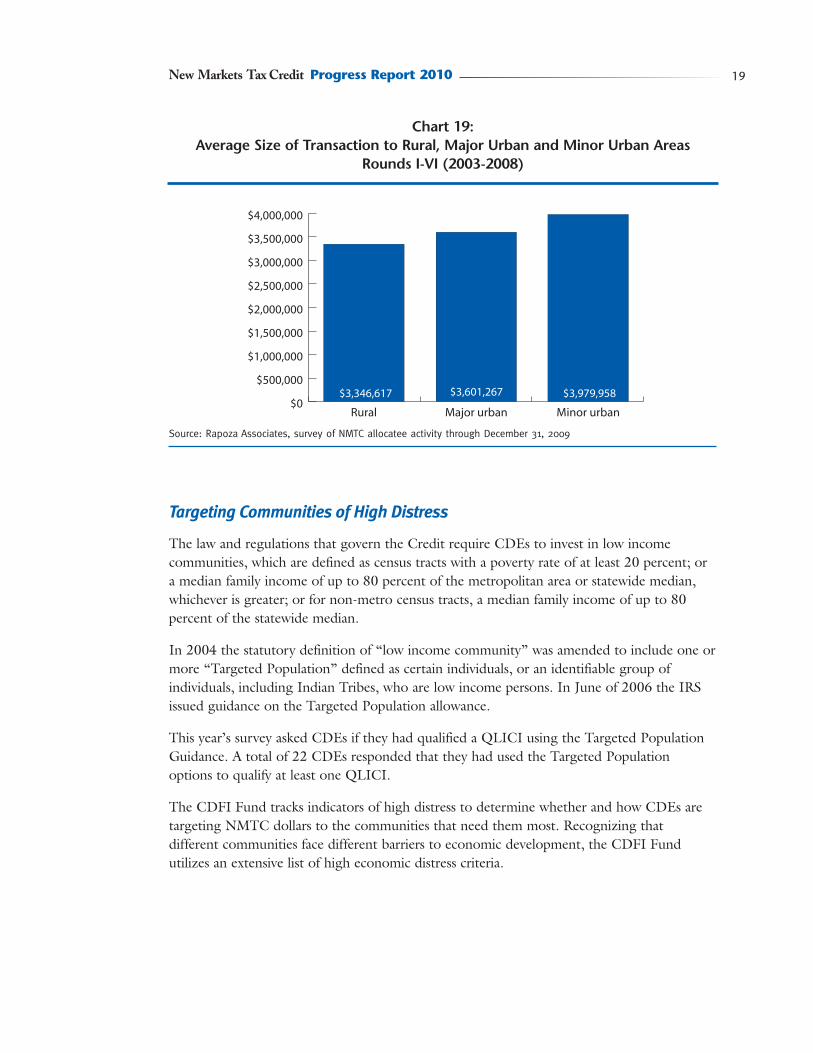
Of note, for the last three years theCoalition’s survey results found that theaverage size of NMTC investments inurban and rural areas has been relativelysimilar in spite of an overall lower level ofinvestment in rural areas (Chart 19).
A Report by the New Markets Tax Credit Coalition18
Chart 17: Percent of QLICIs to Rural, Major
Urban and Minor Urban Areas Rounds I-VI (2003-2008)
Source: Rapoza Associates, survey of NMTC allocateeactivity through December 31, 2009
# of QLICIs to minorurban areas
21.2%# of QLICIs to
rural areas14.9%
# of QLICIs tomajor urban areas
63.9%
Chart 18: Percent of QLICIs in Dollars to Rural,Major Urban and Minor Urban Areas
Rounds I-VI (2003-2008)
Source: Rapoza Associates, survey of NMTC allocateeactivity through December 31, 2009
$ of QLICIs to minorurban areas
23.1%$ of QLICIs to
rural areas13.7%
$ of QLICIs tomajor urban areas
63.2%
______________________________
7 CDFI Fund Definitions:
• Major Urban Area - a metropolitan area with a population equal to or greater than 1 million, includingboth central city and surrounding suburbs.
• Minor Urban Area - a metropolitan area with a population less than 1 million, including both centralcity and surrounding suburbs.
• Rural Area - areas not contained within major urban or minor urban areas.
Targeting Communities of High Distress
The law and regulations that govern the Credit require CDEs to invest in low incomecommunities, which are defined as census tracts with a poverty rate of at least 20 percent; ora median family income of up to 80 percent of the metropolitan area or statewide median,whichever is greater; or for non-metro census tracts, a median family income of up to 80percent of the statewide median.
In 2004 the statutory definition of “low income community” was amended to include one ormore “Targeted Population” defined as certain individuals, or an identifiable group ofindividuals, including Indian Tribes, who are low income persons. In June of 2006 the IRSissued guidance on the Targeted Population allowance.
This year’s survey asked CDEs if they had qualified a QLICI using the Targeted PopulationGuidance. A total of 22 CDEs responded that they had used the Targeted Populationoptions to qualify at least one QLICI.
The CDFI Fund tracks indicators of high distress to determine whether and how CDEs aretargeting NMTC dollars to the communities that need them most. Recognizing thatdifferent communities face different barriers to economic development, the CDFI Fundutilizes an extensive list of high economic distress criteria.
19New Markets Tax Credit Progress Report 2010
Chart 19: Average Size of Transaction to Rural, Major Urban and Minor Urban Areas
Rounds I-VI (2003-2008)
Source: Rapoza Associates, survey of NMTC allocatee activity through December 31, 2009
$0
$500,000
$1,000,000
$1,500,000
$2,000,000
$2,500,000
$3,000,000
$3,500,000
$4,000,000
Rural Minor urbanMajor urban
$3,601,267 $3,979,958$3,346,617
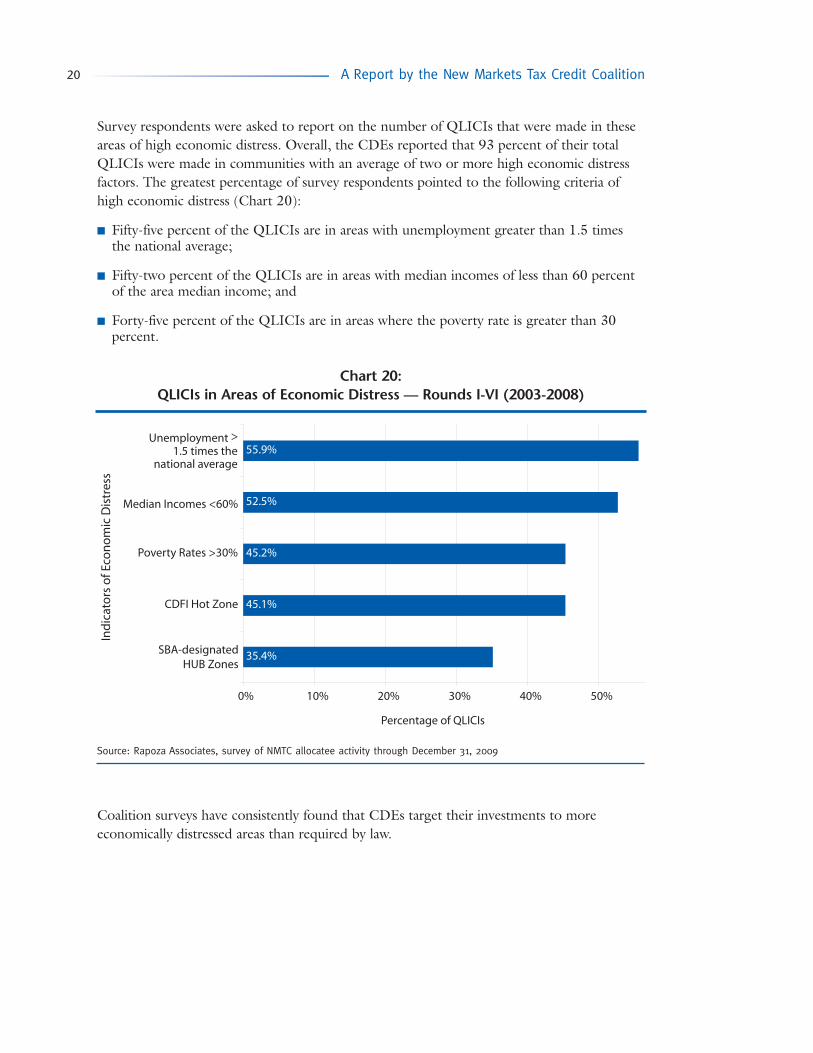
Survey respondents were asked to report on the number of QLICIs that were made in theseareas of high economic distress. Overall, the CDEs reported that 93 percent of their totalQLICIs were made in communities with an average of two or more high economic distressfactors. The greatest percentage of survey respondents pointed to the following criteria ofhigh economic distress (Chart 20):
■ Fifty-five percent of the QLICIs are in areas with unemployment greater than 1.5 timesthe national average;
■ Fifty-two percent of the QLICIs are in areas with median incomes of less than 60 percentof the area median income; and
■ Forty-five percent of the QLICIs are in areas where the poverty rate is greater than 30percent.
Coalition surveys have consistently found that CDEs target their investments to moreeconomically distressed areas than required by law.
20 A Report by the New Markets Tax Credit Coalition
Chart 20: QLICIs in Areas of Economic Distress — Rounds I-VI (2003-2008)
Source: Rapoza Associates, survey of NMTC allocatee activity through December 31, 2009
35.4%
45.1%
45.2%
52.5%
55.9%
0% 10% 20% 30% 40% 50%
SBA-designatedHUB Zones
CDFI Hot Zone
Poverty Rates >30%
Unemployment > 1.5 times the
national average
Median Incomes <60%
Percentage of QLICIs
Ind
icat
ors
of E
con
om
ic D
istr
ess

21New Markets Tax Credit Progress Report 2010
Stories from the Field
The following NMTC stories from the field describe how a cross-section of CDEs andinvestors are using the New Markets Tax Credit to generate private sector investments,expand business opportunities, finance quality community facilities and create jobs incommunities across the country.

22 A Report by the New Markets Tax Credit Coalition
Story from the Field: NMTC Brings Quality Health Care toRural Louisiana
Advantage Capital Partners is a New Orleans based venture capital and small business financefirm that was founded in 1992 to pursue a ‘double bottom-line’ mission – to generatereturns for its investors while at the same time financing early stage businesses with thepotential to generate wealth, and bring new technologies and quality jobs to communitiesthat have historically lacked access to venture capital. The company provides both equity anddebt financing as well as value-added technical assistance to the businesses and communities itworks with. Over its 18 year history the firm has raised more than $1.3 billion in privatecapital and has invested in more than 200 companies, and created or retained more than15,000 jobs.
While the company works with businesses and communities across the country, it hasmaintained a strong presence in the Gulf Coast. Advantage Capital currently maintains officesin Louisiana, Missouri, New York, Texas, California, Illinois, Florida, Mississippi andWashington, DC with affiliated offices in Alabama, Colorado and Wisconsin.
Advantage Capital formed its CDE, Advantage Capital Community Development Fund, LLC(ACCDF), and was awarded a $110 million NMTC allocation in 2003 (NMTC Round I).ACCDF was looking to use its NMTC allocation to provide both debt and equity to hightech companies with the potential to have a significant job creation and economic impact indistressed communities. The first NMTC investments made by ACCDF included smallbusiness investments in several technology and retail businesses, as well as investments inmixed use, commercial and residential real estate.
Initially, ACCDF was formed as a CDE targeting three principal regions of the country:New Orleans, LA; St. Louis, MO; and Honolulu, HI. When ACCDF applied for its 2005allocation it expanded its certification to cover a national service area. In both 2006 and2007, Advantage Capital was awarded Credits for the Gulf Opportunity Zone (GO Zone) inorder to stimulate growth in low income communities that were devastated by HurricaneKatrina in 2005.
In total Advantage Capital has been awarded $388 million in NMTC allocations. ACCDFhas used the NMTC to invest in 73 businesses in nine states, generating wealth incommunities and creating or retaining more than 4,053 jobs.
ACCDF has used the NMTC with other state and federal financing tools to leverage fundsand maximize the impact of its NMTC capital. For example, Advantage Capital is putting
Allocatee:
Headquarters:
Service Area:
Allocation:
Advantage Capital Community Development Fund, LLCNew Orleans, LANationwide$388 million (Rounds 2003, 2005, 2006, 2007, 2008 and 2009)

23New Markets Tax Credit Progress Report 2010
USDA loan guarantees to use with the NMTC in rehabbing Morehouse General Hospital inBastrop, Louisiana.
Morehouse General Hospital is a 60 bed rural hospital facility offering a wide range of bothinpatient and outpatient care to northeast Louisiana and southeast Arkansas residents.Morehouse General is the only hospital in Morehouse Parish, which is home to 31,000residents, over 15 percent of whom are elderly and more than 20 percent are uninsured.There are no hospitals within a three hourdriving radius of Morehouse General so manypatients travel great distances to receive care.The aging facility was on the verge of closingwhen ACCDF intervened in the summer of2008.
To date, ACCDF, along with AdvantageCapital’s small business lending divisionBizCapital, has committed over $12.5 millionin financing to Morehouse General usingcapital raised through the NMTC, theLouisiana New Markets Developmentprogram, the Louisiana CAPCO program, and the USDA’s Business and Industry (B&I)guarantee and Community Facility (CF) direct and guaranteed loan programs.
In the summer of 2008, ACCDF provided a $4.6 million loan to Morehouse that was inlarge part used to finance equipment and begin work on the rehabilitation of the facility. TheNMTC investor for this first phase investment was US Bancorp Community DevelopmentFund, with leverage loans provided by several lenders including USBank, Enterprise Bank &Trust, Pulaski Bank and Southwest Bank of St. Louis, Missouri. The loan was structured as a348-month fully amortized loan, priced at prime plus 4.5 points and the loan was backed byan 80 percent B&I guarantee.
In November 2009, ACCDF stepped in on the second phase of financing and providedMorehouse with a $7.8 million, one-year, prime plus 0.5 point loan to cover the constructionphase of the project. That second loan was backed by a Community Facility (CF) guaranteeand after construction USDA will take out the loan and provide financing through its directcommunity facility loan program.
ACCDF’s funding for Morehouse General supported the direct creation and retention ofapproximately 250 hospital jobs. It also helped to bring desperately needed improvements tothe Emergency Department and will soon provide new, state-of-the-art diagnostic equipmentincluding digital mammography, digital radiology and digital fluoroscopy equipment. NewCT and MRI equipment are slated for installation in the near future. The EmergencyDepartment is under construction to add a five room non-urgent clinic adjacent to the mainemergency room. A new, larger waiting area is also planned. Additionally, the hospital isreplacing old washers and dryers to bring the laundry services back in-house for better qualityand utilization.

24 A Report by the New Markets Tax Credit Coalition
Story from the Field: NMTC Investment Brings World-ClassHospital to Rural Oklahoma
In 2007, a group of 24 physicians had an idea to open a new, state-of-the-art hospital inMuskogee, Oklahoma where there was a lack of satisfactory healthcare facilities. An oldercommunity hospital existed, but due to lack of equipment and limited services it was losingpatients to Tulsa, Oklahoma 50 miles away. Therefore, many of the doctors employed at theold hospital were contemplating relocating their practice. The lack of an adequate medicalfacility was a deterrent to many businesses and households that might otherwise locate inMuskogee. As a result, the community at-large was suffering from a weak economic base andwas starved for capital.
The cost to build a new hospital and hire skilled physicians was substantial; the price tag forland and the building were $49 million and equipment alone cost $15 million. Thephysicians contacted Rural Enterprises of Oklahoma, Inc. (REI) in search of financial
assistance. REI has beenworking to strengthen thestate’s economy since 1982with a mission to create andretain jobs in Oklahomathrough effective economicdevelopment services.
REI began as a smallbusiness lender and hasgrown to meet various,larger economicdevelopment needs ofcommunities throughtargeted services and flexible
financing for both families and businesses, with a statewide network of partners to helpdeliver its programs. For example, REI offers an equipment lease and purchase program toassist small rural manufacturing companies, and through NMTC the organization brings newinvestments to low income underserved areas in the state. For every $1 million invested byREI New Markets Investment, LLC $980,000 in additional economic activity is generated inthe local economy, so REI has effectively doubled its impact in Oklahoma’s weak marketsmost in need of additional capital. To date, REI has helped finance more than twenty-fiveNMTC transactions in fourteen communities which has allowed local businesses to retain orhire hundreds of workers.
Allocatee:
Headquarters:
Service Area:
Allocation:
REI New Markets Investment, LLC
Durant, OK
Statewide: Oklahoma$136 million (Rounds 2003 and 2005)

25New Markets Tax Credit Progress Report 2010
REI used $15 million of its New Markets Tax Credit (NMTC) allocation in conjunction withan Oklahoma state tax credit program to provide debt and equity in order to acquire land,cover construction costs, pay for equipment and then extend short term working capital tothe new Muskogee Community Hospital (MCH). This was a significant portion of theoverall project cost, and Mark Roberts, MCH President noted that “All of this potentialgrowth has been made possible by the initial tax credit investments. That initial investmentwas instrumental in creating a planned first year payroll of over $6 million and duringconstruction provided payroll totaling over $18 million. The capital investment was over $50million at time of official opening in 2009.”
This acute-care hospital is located on22 acres and features 45 privaterooms, geothermal heating andcooling, eco-friendly paint, andfurniture and flooring made fromrecycled materials. The physiciansinvesting in MCH were committed tobuild an environmentally friendly andhealthy building and REI’s assistancewith Oklahoma community-basedSpirit Bank as the investor providedthe capital necessary to build to themore expensive Leadership in Energyand Environmental Design (LEED)standard. Spirit Bank provided the senior debt of $38 million; REI provided $15 million insubordinated debt, interest-only for 7 years; and another Oklahoma CDE MetaMarkets OK,LLC provided another $5 million in debt on the same terms. MCH is completely digital andis proud to be the first for-profit LEED Gold Certified hospital in the world.
In addition to its environmentally friendly atmosphere, patients now receive services throughstate-of-the-art technology which also allows nurses and other medical staff to stay inconstant touch with the patient. The project created 300 temporary jobs during constructionand now the hospital employs 190 skilled physicians and healthcare professionals earningabove-average wages for this economically depressed region. The majority of employees livewithin 10 minutes of MCH, and the positive local community impact has been substantial.
The presence of the hospital has generated $600,000 for the local school system throughproperty taxes, and MCH is partnering with 5 institutes of higher education in Oklahoma toprovide clinical rotations, mentoring and classroom space. MCH has experienced a greaterdemand for additional space, and has already completed expansion for a radiology center,sleep center, and pulmonary rehab center, so the hospital is considering expanding its medicalfacilities and training center. The hospital has served as a catalyst for communitydevelopment; discussions are underway to build a retirement village with assisted living andnursing homes that will be served by MCH’s physicians. A Women’s Center and HeartCenter are also being considered in the expansion plans.

26 A Report by the New Markets Tax Credit Coalition
Story from the Field: The NMTC Catalyzing Reinvestment in Michigan
The Michigan Magnet Fund, Inc. (MMF) is a broad-based statewide nonprofit 501(c)3organization organized by a consortium made up of the Michigan Economic DevelopmentCorporation, Great Lakes Capital Fund, and the Michigan State Housing DevelopmentAuthority. It has won two $60 million NMTC allocations. Using its 2005 allocation MMFinvested in 10 projects located in 6 cities, including the renovation of the Rowe Building indowntown Flint and the Woodward Lofts in rural Owosso, Michigan.
Flint:
It takes a whole community to rebuild a city. Especially a city as devastated as Flint, which hasbeen a national symbol of the loss of American automobile manufacturing jobs. Flint is aHUD-designated Enterprise Community and a Small Business Administration (SBA)designated HUB Zone. The City of Flint has a 45 percent poverty rate, a median familyincome equal to 39 percent of the area median income, and an unemployment rate of 25.8percent.
In this case, a local development group made the commitment to invest in the center of thisdevastated city. The Rowe Building combined three adjacent buildings on brownfield sites inthe heart of the downtown business district, combining them into a four-story, 83,000-square-foot building on South Saginaw Street. The effort was backed by a local nonprofit,the Uptown Reinvestment Corporation; the Mott Foundation; the City of Flint; and theState of Michigan.
Originally projected to cost $12.5 million, the cost escalated to $22.5 million following thecollapse of the atrium being built across from the three buildings during construction, whichthreatened the entire project. The developer, the city, and MMF obtained commitments fromtwo CDEs to support the project and the Local Initiatives Support Corporation (LISC)provided $6.9 million in NMTC financing and MMF provided $6.5 million in NMTCfinancing. The project secured a total of $13.4 million in NMTC financing from LISC andMMF: $2.9 million structured as an equity investment and $10.5 in debt financing. USBankwas the NMTC investor in both LISC and MMF.
Additional project financing was provided by the City of Flint which dedicated $3.5 millionin HUD Section 108 loan guarantee financing as well as $2 million through a HUDBrownfield Economic Development Initiative grant. In addition, the Mott Foundation madeclose to $2 million available to the Uptown Reinvestment Fund to finance the project. The
Allocatee:
Controlling Entity:
Headquarters:
Service Area:
Allocation:
Michigan Magnet Fund, Inc.
Michigan State Housing Development Authority
Huntington Woods, MIStatewide: Michigan$120 million (Rounds 2005 and 2009)
27New Markets Tax Credit Progress Report 2010
State of Michigan also made state brownfield and historic tax credit financing available tosupport the renovation project.
The completed project is named for the Rowe Professional Services Company which is anengineering firm that occupies the second and third floors. The firm signed a 10-year lease tohouse its headquarters in the newly renovated building bringing 100 professionals to the city.The building features open brick walls, high ceilings, and huge windows. A restaurant isscheduled to open on the first floor. Prior to the development’s completion, each of the eightfourth-floor lofts were leased.
The development is a shot in the arm for a community that has lost literally tens of thousandof jobs from the closing of GM plants in Flint. It is returning hope to a community that hasbeen devastated by the de-industrialization of America.
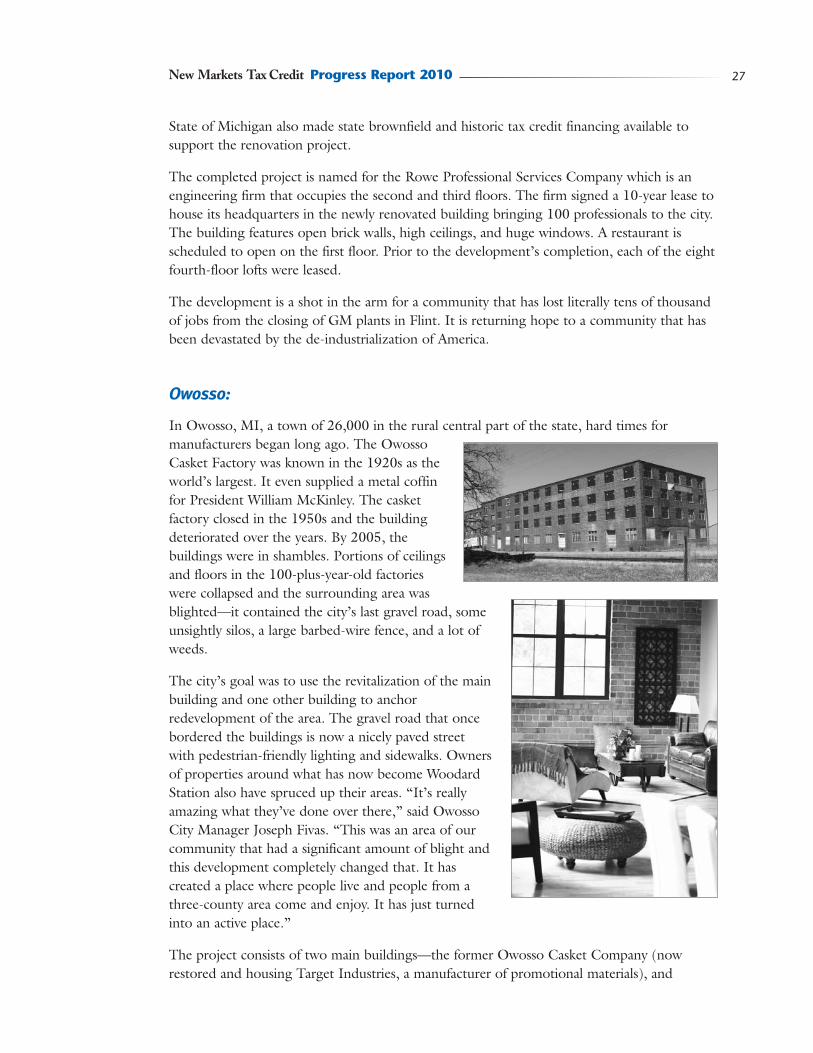
Owosso:
In Owosso, MI, a town of 26,000 in the rural central part of the state, hard times formanufacturers began long ago. The OwossoCasket Factory was known in the 1920s as theworld’s largest. It even supplied a metal coffinfor President William McKinley. The casketfactory closed in the 1950s and the buildingdeteriorated over the years. By 2005, thebuildings were in shambles. Portions of ceilingsand floors in the 100-plus-year-old factorieswere collapsed and the surrounding area wasblighted—it contained the city’s last gravel road, someunsightly silos, a large barbed-wire fence, and a lot ofweeds.
The city’s goal was to use the revitalization of the mainbuilding and one other building to anchorredevelopment of the area. The gravel road that oncebordered the buildings is now a nicely paved streetwith pedestrian-friendly lighting and sidewalks. Ownersof properties around what has now become WoodardStation also have spruced up their areas. “It’s reallyamazing what they’ve done over there,” said OwossoCity Manager Joseph Fivas. “This was an area of ourcommunity that had a significant amount of blight andthis development completely changed that. It hascreated a place where people live and people from athree-county area come and enjoy. It has just turnedinto an active place.”
The project consists of two main buildings—the former Owosso Casket Company (nowrestored and housing Target Industries, a manufacturer of promotional materials), and

28 A Report by the New Markets Tax Credit Coalition
Woodard Station. Woodard Station, once home to Woodard Wrought Iron Furniture, is nowa multi-use facility with 48 loft apartments and retail facilities that offer space for smallbusinesses. A physical rehabilitation center is being built in the retail space for MemorialHealthcare of Owosso. In all, the project has generated nearly 200 jobs and provided afacelift for a part of the community that desperately needed it.
The total development costs were $20 million. MMF invested $5 million in NMTC financingand Phase 2 of the project was financed by a $7.6 million NMTC investment from LISC.The leveraged debt investor was Huntington Bank and the equity investor was Fifth ThirdBank for Phase 1 and Huntington Bank for Phase 2. The State of Michigan provided statehistoric and brownfield tax credits valued at $600,000. To make the project possible,assistance was also provided through a variety of additional economic incentives including aNeighborhood Enterprise Zone, a Corridor Improvement Authority, Michigan business taxcredits, brownfield redevelopment, and historic district designation. It has been estimatedthat the various tools and tax incentives saved about $5 million on the $20 million project.The site is in a non-metropolitan county that is an SBA designated HUB Zone. The medianfamily income for Owosso is 48.6 percent of state’s median family income and 24 percent ofthe residents are living in poverty.

29New Markets Tax Credit Progress Report 2010
Story from the Field: Charter School Expansion Made Possiblewith NMTC Investments
ASPIRA North Youth Leadership Charter School in North Miami served 300 students ingrades 6 through 9 during the 2006/2007 school year. In the fall of 2008, thanks to theFlorida Community Loan Fund (FCLF) and financing made available through New MarketsTax Credits, ASPIRA was able to enroll 600 students. ASPIRA moved from its original10,000 square foot facility where 6 of its classrooms were housed in temporary modular unitsinto its new 35,000-square-foot, 3-story, state-of-the-art educational facility that allowedthem to serve twice as many middle school children.
George Cabrera, ASPIRA’s Chief Financial Officer, credits NCB Capital Impact and FCLFfor introducing ASPIRA to the NMTC as a financing tool to help expand services forchildren in an area of severe economic distress.
The Florida Community Loan Fund(FCLF) was established in 1994 to providefinancing to nonprofit organizations tosupport community and economicdevelopment in low income communitiesthroughout the state of Florida. It made itsfirst loan in 1996 and became a certifiedCommunity Development FinancialInstitution (CDFI) that same year. Overthe past 15 years, FCLF has provided morethan $49 million in below market debtfinancing, and leveraged an additional$300 million to support its statewidelending activity. Using financing out of its original community development loan pool, FCLFtypically made loans of between $150,000 and $1 million. As it grew, FCLF saw a need tofinance larger projects with the potential to create jobs and bring much needed services andfacilities to poor communities.
Before securing its first NMTC allocation FCLF had not worked with federal tax creditfinancing but recognized the potential to use the NMTC to raise private investment capital tofinance larger real estate and community facilities projects. In 2003 FCLF was awarded a $15million NMTC allocation and was the first Florida-based CDE to secure Credits. NelsonBlack, FCLF’s Director of Lending, described how the NMTC has allowed FCLF to financea number of high impact, larger scale projects that they previously would have passed over
Allocatee:
Headquarters:
Service Area:
Allocation:
Florida Community Loan FundOrlando, FLStatewide: Florida$60 million (Rounds 2004 and 2009)

30 A Report by the New Markets Tax Credit Coalition
because the capital need was too great. With the NMTC capital, FCLF is now able to lookfor businesses in need of between $6 million and $15 million in financing.
One such project was the $7.9 million expansion of the ASPIRA North Youth LeadershipCharter School campus in North Miami. ASPIRA Florida is a non-profit organization thatwas launched 30 years ago to administer youth leadership and education programs targetingthe needs of young people in the Puerto Rican/Latino community. ASPIRA administersthree charter schools in the greater Miami area. Two of the schools are in buildings owned byASPIRA and the third is in a building that is currently being leased.
In 2006 ASPIRA approached NCB Capital Impact seeking financing for the renovation andexpansion of its middle school campus in North Miami. ASPIRA owned its aging facility aswell as an adjacent piece of land but as a non-profit charter school they were having difficultycoming up with the financing to support the construction and renovation of the facility.
NCB Capital Impact put ASPIRA intouch with FCLF knowing that theywere interested in financingcommunity facilities with their NMTCallocation. NCB Capital Impactstepped forward as the leveragedlender in the project providing $5.8million. USBancorp is the equityinvestor. Using the leveragedinvestment structure, FCLF providedASPIRA with two below market loans.The first loan, or A note, for $5.8
million was structured as a seven-year note with a 6.67% interest rate, amortized over 30years, with interest-only payments for 7 years, and a balloon payment after year 7. The secondloan, or B note, for $1.6 million, was also structured as a seven-year, interest only note, witha 6.67% interest rate, with a balloon payment after year seven. The two notes taken togetherhad an effective interest rate that was close to 1 percentage point below market. After sevenyears ASPIRA will repay and refinance the A note in full, and the B note will be converted toequity and remain invested in ASPIRA and contribute to the long-term health of thiscommunity institution.
To date, FCLF has financed three projects using its first allocation of NMTC capital. Theyhave a rigorous screening process in place to evaluate potential NMTC projects and ensurethat the businesses benefitting from NMTC financing will have a strong community impact.With its 2009 allocation, FCLF has already committed $15 million to another charter schoolproject, located in Jacksonville, Florida. FCLF looks for projects that are “shovel ready” andideally for projects that have some financing already committed or ready to be committedonce NMTC financing is brought to the table.
ASPIRA is now in talks with FCLF about financing the purchase of the current leased facilityin which ASPIRA is hosting 500 charter school students. The project would enable ASPIRAto build out the entire 59,000-square-foot three-story facility and welcome a potential totalof 1,000 students.

31New Markets Tax Credit Progress Report 2010
Story from the Field: Iowa Communities Benefit from NMTCInvestments Coming from Near and Far
In Iowa, New Markets Tax Credit (NMTC) investments have been made not only by localentities but also by organizations headquartered outside the state. According to the mostrecent data published by the CDFI Fund, six CDEs have utilized the NMTC to finance 13transactions totaling more than $61.5 million in six Iowa communities through 2007.
An Established Iowa Business Lender Grows into New Markets
Iowa Business Growth Company (IBG) is headquartered in Johnston, IA and beganoperating as a Small Business Administration (SBA) 504 loan company in 1981. IBG has along history of providing flexible alternative financing for small businesses throughout Iowathat complements products available through conventional lenders. To date, IBG hasfacilitated more than 650 loans to small businesses in Iowa, creating nearly 7,000 new jobs inthe Hawkeye State. “The NMTC program was a natural fit that complemented IBG’smission to create jobs and promote economic development within Iowa’s most needycommunities,” commented IBG President Daniel T. Robeson.
IBG’s Community Development Entity the Iowa Community Development LC has anexclusive statewide service area in Iowa andhas received three NMTC allocationstotaling $165 million. NMTC allocationshave allowed IBG to extend its flexible ratesand terms to qualified borrowers and nowleverages NMTC debt to finance muchlarger business and real estate transactionsthan they could otherwise authorize.Distressed communities throughout Iowahave benefited from IBG’s sizable economicinvestments that have ensured sustained jobgrowth in the state.
When asked how Iowa CommunityDevelopment LC decides the size and scaleof its NMTC transactions, the investmentstrategy is simple: “The story guides ourinvestment,” says IBG Senior Vice PresidentJim DePauw. One community’s story thatso compelled Iowa Community
CDE:
Controlling Entity:
Headquarters:
Service Area:
Allocation:
Iowa Community Development LCIowa Business Growth Company (IBG)Johnston, IA
Statewide: Iowa$165 million (Rounds 2006, 2008 and 2009)

32 A Report by the New Markets Tax Credit Coalition
Development LC to put up $10 million of its NMTC allocation and urge CDE colleagues todo the same was the opportunity for a single office renovation to attract more than 1,300good paying jobs to downtown Dubuque.
A prominent technology company needed large enough space to host 1,300 employees. IowaCommunity Development LC saw the potential to harness this economic engine to benefit adistressed city starved for capital and marked by unemployment more than 1.5 times thenational average. The $45.5 million cost to renovate and bring the massive 255,000-square-foot building to LEED Gold certification was prohibitive. A supercharged partnershipbetween Iowa Community Development LC, National Community Fund I, LLC andUSBCDE, LLC was necessary to tackle this large renovation. Each CDE made a $10 millioninvestment so the total Qualified Equity Investment was $30 million and USBank served asthe investor. Financing to the QALICB was provided with roughly $10 million of debt fromeach CDE totaling $30 million, $10.6 million from a state historic tax credit, and $5.1million in equity from the developer. This capital structure brought the project to scale andmade it financially feasible.
As a condition of its financing, Iowa Community Development LC secured a commitmentfrom the technology company to fund green job training and sustainability-orientededucational programs for the surrounding low income community residents. This RoshekBuilding renovation was nominated for Novogradac & Company’s “Real Estate QLICI ofthe Year” and “Metro QLICI of the Year” awards.
Council Bluffs: Targeted Revitalization Bolsters Local Economy
The National Development Council (NDC), headquartered in New York City, has a nationalservice area and works with communities large and small, urban and rural, throughout thecountry to address their economic development needs through business and real estateinvestment. NDC has a longstanding presence in Iowa, and has attracted more than $17million in Qualified Equity Investments for three targeted revitalization efforts in CouncilBluffs that have spurred job creation in the city. Financing provided by NMTC accounted formore than 60% of each project’s total cost, and in two projects the NMTC equity investmentcontributed almost 90% of each project’s total financing needs. Capital for these communitydevelopment projects would not have been available without NMTC. The tax creditsfacilitated lower-than-standard interest rates and terms that were beneficial to each communitybusiness that had struggled to attract capital in the form and with the terms it needed.
Council Bluffs, Iowa (pop. 58,000) is a community whose history was rooted in railroadexpansion and the early automotive industry. Like many of its counterparts throughout the
CDE:
Controlling Entity:
Headquarters:
Service Area:
Allocation:
HEDC New Markets, Inc.
National Development Council (NDC)
New York, NY
National
$486 million (Rounds 2002, 2003, 2006, 2008 and 2009)

33New Markets Tax Credit Progress Report 2010
Midwest, the city suffered an economic decline that threatened the survival of its localproduction economy, its downtown and its rich architectural heritage.
Omaha Standard, Inc.
In 2004, when the Pottawattamie County Development Corporation (PCDC) was workingto retain one of the area’s largest employers, thehigh cost of land for a new facility presented aserious threat to those efforts. PCDC turned toNDC for development assistance.
NDC made its first investment in Iowa in theOmaha Standard Inc., a leading manufacturer oftrucks and truck accessories, including joists andlifts. In 2006, HEDC New Markets raised$10.5 million in qualified equity investmentswith a $7.5 million loan and $3 million in equity from the First National Bank of Omaha tofinance equipment and a new expanded facility for the business. These investments allowedthe company to retain 200 employees and hire 65 new workers.
NDC did not stop there. Committed to meeting the development goals of its communitypartners, NDC continued its efforts with PCDC and the city to build the local economy.With two more projects, this time addressing downtown renewal and historic preservation,NDC worked with the city to leverage public debt and private equity for the redevelopmentof two key landmark buildings that have been instrumental in revitalizing historic downtown.
Nonpareil Building
In 2008, NDC attracted financing from an array of sources to meet the $2.8 million projectcost of restoring the historic Nonpareil Building, the former home of the Daily Nonpareilnewspaper. The $2.475 million Qualified Equity Investment included $750,000 in HUDSection 108 debt, a $750,000 loan from the local PCDC, $725,000 in NMTC equity and a$250,000 loan from the developer. In turn, NDC provided three below-market rate loansand secured the last $430,000 in equity from the developer. TransCapital served as theinvestor to restore and put to new economic use this 13,000-square-foot facility, built in the1920s and empty since 2003. The restoration also included an energy efficient retrofit. Thebuilding now houses the Council Bluffs Savings Bank, which provides banking services todowntown residents and businesses and has brought 15 permanent jobs to this low incomecommunity. In addition, 78 construction jobs were involved in the building of the project.
Hughes-Irons (O’Malley) Building
In 2009, NDC partnered with investor USBank to begin restoring the 44,000-square-footHughes-Irons Motor Co. building. Built in 1914, this building is rooted in the city’scommercial past and has historical significance as an early automobile sales and servicebusiness. The building was eligible to be listed on the National Register of Historic Places,
34 A Report by the New Markets Tax Credit Coalition
but was vacant and dilapidated. In order to finance the hefty $7 million historicredevelopment, NDC used $1.1 million in historic tax credits, obtained a $3 million loanfrom the PCDC, and provided $1.6 million in NMTC equity. HEDC New Markets offeredbelow market interest rates of less than 2% on three notes, with equity provided to the tenanttotaling $5.7 million in qualified low income community investments. To cover the totalproject cost of $7 million, HEDC New Markets secured $1 million from a deferreddevelopment fee and $300,000 in contributed property. This landmark will be converted intoa mixed use property and bring much needed residential and retail space to downtown.Street-level commercial space will be leased to the Chamber of Commerce and a local foodproprietor, and seventeen apartments will become home to the residential tenants of thebuilding, signaling rebirth of this historic neighborhood.

35New Markets Tax Credit Progress Report 2010
Conclusion
This is the sixth NMTC Progress Report released by the NMTC Coalition. Like the previousreports, this report indicates that capital generated by the New Markets Tax Credit (NMTC)is getting to some of the poorest communities in America at a faster pace than required bylaw. With $16 billion in capital invested to date thanks to the NMTC, we are seeing how theCredits can generate jobs, business opportunities and economic growth across the nation.
With seven years of NMTC allocations awarded, we can say this about the New Markets TaxCredit:
1. As America continues to crawl out of a deep, long lasting recession, the New Marketsprogram remains a remarkably stable and successful tool for revitalization. For the lastfive years, CDEs have raised $3 billion annually in equity investments. In the worst economy in 70 years, New Markets investing in 2009 did not decline. In fact, since thebeginning of the recession in 2008, CDEs have used the NMTC to raise more than $6billion in private capital for investments and loans in low income communities.
2. As the New Markets industry has matured the program has become more efficient. Fromthe beginning of the program QEIs issuance rates increased every year, reaching a high of87% in 2008. In this report, notwithstanding economic circumstances, CDEs reportingon transactions utilizing allocations through Round VI had over 80% of their QEIs eitherissued or legally committed through December 31, 2009.
From the beginning CDEs have quickly deployed QEIs. The 2005 report indicated thattwo-thirds of CDEs deployed capital within 90 days of receipt of a QEI. Seventy-sevenpercent of CDEs responding to this Progress Report make loans or investments within 90days of receiving a QEI. When one considers the challenging economic environment andthe relative inaccessibility of credit, this is a very good record.
3. According to this 2010 Progress Report, private, regulated banks continue to lead the wayas a source of investments for CDEs. The challenge for the future is to increase the num-ber of participating banks and diversify the investor base.
4. Demand for the Credit remains strong, and that yields benefits to businesses and com-munities. Since 2003 over 1,800 CDEs have applied for $202 billion in New MarketsTax Credits. Of that number 495 received allocations totaling $26 billion. According tothe CDFI Fund, because of the intense competition for Credits, CDEs are committing toinvest a greater portion of their QEIs. As a result, all of the allocatees in the 2009 roundcommitted to invest more than the minimum (85 percent) of their QEIs, and 96 percentof the CDEs agreed to invest at least 95 percent of their QEIs, according to the CDFIFund’s FY 2009 Performance and Accountability Report:8
“In real dollars, this means at least $630 million above and beyond what is minimallyrequired by the NMTC Program rules …”
______________________________
8 FY 2009 Performance and Accountability Report, The U.S. Department of the Treasury’s CommunityDevelopment Financial Institutions Fund (CDFI Fund), March 24, 2010.

36 A Report by the New Markets Tax Credit Coalition
5. The size and scope of the program continues to mount. The CDFI Fund’s recent reportindicates that between 2003 and 2009 CDEs invested a total of $12.5 billion in over3,300 NMTC transactions and in almost 15,000 businesses. Of this amount $7.7 billion(61%) was in loans and investment in real estate businesses, and $4.1 billion (33%) innon-real estate businesses.
6. This 2010 Progress Report and the CDFI Fund’s recent report both point to an emergingtrend of NMTC investing more in non-real estate businesses. The CDFI Fund reportindicates that non-real estate lending and investing increased to 41 percent of theQLICIs in 2009, totaling $1.2 billion. This report found non-real estate QLICIsincreased from 35 percent of all QLICIs reported in 2008 to 43 percent of the QLICIsin 2010.
Non-real estate QLICIs include financing for operating businesses including workingcapital and equipment, although financing for these activities still lags behind other typesof NMTC financing. For this reason there is still more to be done to address the capitalneeds of businesses through the Credit, which is explained below.
7. The 2010 Progress Report found that CDEs were issuing QEIs at a slightly slower rate ascompared to the 2009 Progress Report, perhaps due to the retraction of bank lending andinvesting. However, the 2010 report found that CDEs are deploying capital at a some-what faster rate than reported last year. This year, the Coalition found that CDEs hadraised $7.7 billion in QEIs between 2003 and 2008 and yet they had deployed morethan $8.8 billion in QLICIs during that period. As of December 31, 2009 CDEs report-ed that they had more than $2 billion in high quality deals in the pipeline.
8. The poorest communities in the country continue to benefit from the Credit. According tothe CDFI Fund, 95 of the 99 Round VII allocatees indicated that at least 90 percent oftheir activities will be provided in areas of higher economic distress than required by law,and 91 of the 99 will target 100 percent of their activities in these more highly distressedcommunities. This report similarly finds that high percentages of CDEs are targeting invest-ments to communities with high unemployment rates, low median incomes and highpoverty rates.
The Road Ahead
In February 2010, as President Obama released his FY 2011 Budget, Treasury SecretaryGeithner announced a number of important Administration initiatives regarding NewMarkets Tax Credits. The Administration supports a two year (2010 & 2011) extension at $5billion in annual credit authority, AMT exemption for investors in NMTC, and review ofproposals for revision of passive activity rules and enhanced small business lending.
Revising Passive Activity Rules — In 2009 the Coalition proposed that Treasury make adetermination that the passive activity rules do not exclude individual taxpayers frominvesting in the Credit. In general, passive activity rules limit the loss or tax benefits that anindividual tax payer might claim if he or she is not directly participating in the relevantbusiness activity. Until recently there was not any clear guidance on whether the passiveactivity rules apply to New Markets. Under the Coalition’s proposed revision, S Corporation

37New Markets Tax Credit Progress Report 2010
investors, that are currently treated like individual investors, as well as high net worthindividuals, could invest. This could include some rural banks that tend to be S Corporations,as well as certain individuals who may have an interest in socially responsible investment.Moreover, intergenerational wealth transfers in the coming years are expected to top $42billion and there is little or no opportunity for families of very high wealth to offset taxesthrough social investment because of the passive activity rules adopted in the Tax Reform Actof 1986.
On June 8, 2010 the Internal Revenue Service issued a ruling (Revenue Ruling 2010-16) onpassive activity that was consistent with the Coalition’s recommendation. The IRS held that ifan individual's acquisition of a qualified equity investment in a CDE is not in connection withthe conduct of the individual's trade or business, the NMTC allowable under Sec 45D willnot be a subject to passive activity limitations.
As this report goes to press Congress is on a path to extend the New Markets Tax Creditthrough December 31, 2010 with $5 billion in additional credit authority and provide AMTrelief for NMTC investors from March 15, 2010 to January 1, 2012.
In the future the NMTC Coalition will continue to work with Congress and theAdministration to further strengthen the Credit by:
Enacting a Long Term Extension of the NMTC Program, Including AMT Relief. This is inkeeping with legislation co-sponsored by Representatives Richard Neal and Patrick Tiberi inthe House and Senators John Rockefeller and Olympia Snowe (H.R. 2628, S. 1583). A five-year authorization will encourage investors to make long term commitments to invest, whichis essential for the success of the program. Long term authorization should include aprovision on AMT relief that puts New Markets on par with other similar tax creditsincluding Low Income Housing and Historic Tax Credits. Without this incentive, NewMarkets is at a disadvantage in the investor marketplace even if it is otherwise extended.Without both AMT and a long term extension it will be difficult to broaden the base ofthose investing beyond the core investors comprised largely of CRA motivated banks. Moreinvestors will increase competition for Credits, which should result in better pricing and moresubsidies going to the qualified businesses.
Increasing Credit for Operating Businesses. As the upheaval in the financial services industrycontinues, Congress and the Administration continue to work to improve access to credit forbusinesses, particularly small businesses. It is worth noting both that CDEs are responding tosmall business needs and financing operating businesses, and that conventional bank lendinghas declined. According to the Federal Deposit Insurance Corporation (FDIC), bank lendingfell by 7.5 percent between 2008 and 2009 which is the largest annual decline in banklending since 1942.
Both the recent CDFI Fund report and this 2010 Progress Report indicate that a greater shareof NMTC investment is flowing to non-real estate businesses, which includes operatingbusinesses. The increase in non-real estate business activities likely represents the confluenceof events in the economy and public policy that have resulted in an increase in non-real estateQLICIs but not necessarily an increase in financing for operating businesses. The recessionhas pushed down the value of commercial and residential real estate, thereby making those
38 A Report by the New Markets Tax Credit Coalition
investments tougher, although as this report indicates, not impossible. At the same time,federal support for charter schools, health care facilities and community facilities hasincreased; in part due to the stimulus bill, the American Recovery and Reinvestment Act of2009 (P.L. 111-5) which increased the flow of loans, guarantees and operating funds to arange of urban and rural facilities. As a result, in difficult economic circumstances loans andinvestments in businesses that operate these facilities are a good bet, in terms of both thequality of the investment as well as the responsiveness to needs of low income communitiesfor improved education facilities, health care, day care and related community facilities.
So, the question remains: how to encourage more NMTC financing of operating businesses?In developing the New Markets legislation, the sponsors and advocates anticipated a programthat included real estate financing but also business lending and venture capital financing asstrategies to improve economies in low income communities.
Making a QEI in a blind pool for loans or investments in operating businesses is a challengefor the investor. Financing for operating businesses usually centers on working capital, lines ofcredit or equipment. This financing typically takes the form of amortizing debt with a term ofless than seven years. The seven-year term of NMTC coupled with reinvestment and“substantially all” (at least 85% by regulation) requirements limit a CDE’s ability to structurecapital that operating businesses need. Under current rules, CDEs are required to re-deployreturned principal within a time certain: 12 months for investments, and by the end of thecalendar year after the year in which the capital is returned for amortizing debt. The pressureto reinvest principal has given many investors pause and steered them away from CDEs thatare financing operating businesses.
To improve the performance of the Credit in assisting operating businesses, the Coalition hasrecommended that Treasury revise the rule governing the Credit to establish a safe harbor forNMTC Qualified Low Income Community Investments (QLICIs) made for the sole purposeof financing operating businesses. The proposed safe harbor is designed to ease investorconcerns regarding “substantially all” requirements and should have a salutory effect oninvestor interest in supporting CDEs that offer flexible financing products to operatingbusinesses.
In detail, the advantage of the special rule of safe harbor protection would require a CDE to:
1) Satisfy the “substantially all” test at the initial deployment of the Qualified EquityInvestment into one or more QLICIs made in one or more qualified businesses aslong as the operating business was established for a purpose other than thedeveloping or leasing of a real estate project or projects; and
2) Any amounts received by the CDE as a return of capital, equity or principal withrespect to such a QLICI must either be reinvested in another qualified non-real estatebusiness or retained by the CDE for the remaining term of the 7-year credit period.
In an economy the likes of which none of us have ever seen, the New Markets Tax Creditcontinues to be a source of capital to improve local economies and enhance revitalization oflow income communities. With a few improvements and continued bi-partisan support, theNew Markets Tax Credit will improve on its already strong record of success in revitalizingurban and rural communities across America.
39New Markets Tax Credit Progress Report 2010
Appendices
Appendix A: NMTC Survey Instrument . . . . . . . . . . . . . . . . . . . . . . . . . . . . . . . . . .40
Appendix B: A New Markets Tax Credit Timeline . . . . . . . . . . . . . . . . . . . . . . . . . .51
Appendix C: The New Markets Tax Credit Extension Act of 2009(H.R. 2628) and accompanying “Dear Colleague” letter from Representatives Neal and Tiberi . . . . . . . . . . . . . . . . . . . . . . . . . . . . . . . . . . . . . . . . .53
Appendix D: The New Markets Tax Credit Extension Act of 2009(S. 1583) and accompanying “Dear Colleague” letter from Senators Rockefeller and Snowe . . . . . . . . . . . . . . . . . . . . . . . . . . . . . . . . . . . . . . . .57
Appendix E: Treasury Department Press Release – February 18, 2010 . . . . . . . . . . .62
Appendix F: NMTC Coalition Letter to IRS Requesting Guidance, July 21, 2009 . . .64
Appendix G: IRS Revenue Ruling 2010-16 – June 8, 2010 . . . . . . . . . . . . . . . . . . . .66

40 A Report by the New Markets Tax Credit Coalition
Appendix A: NMTC Survey Instrument
NEW MARKETS TAX CREDIT COALITION: SURVEY OF ROUND 1-8 ALLOCATEES
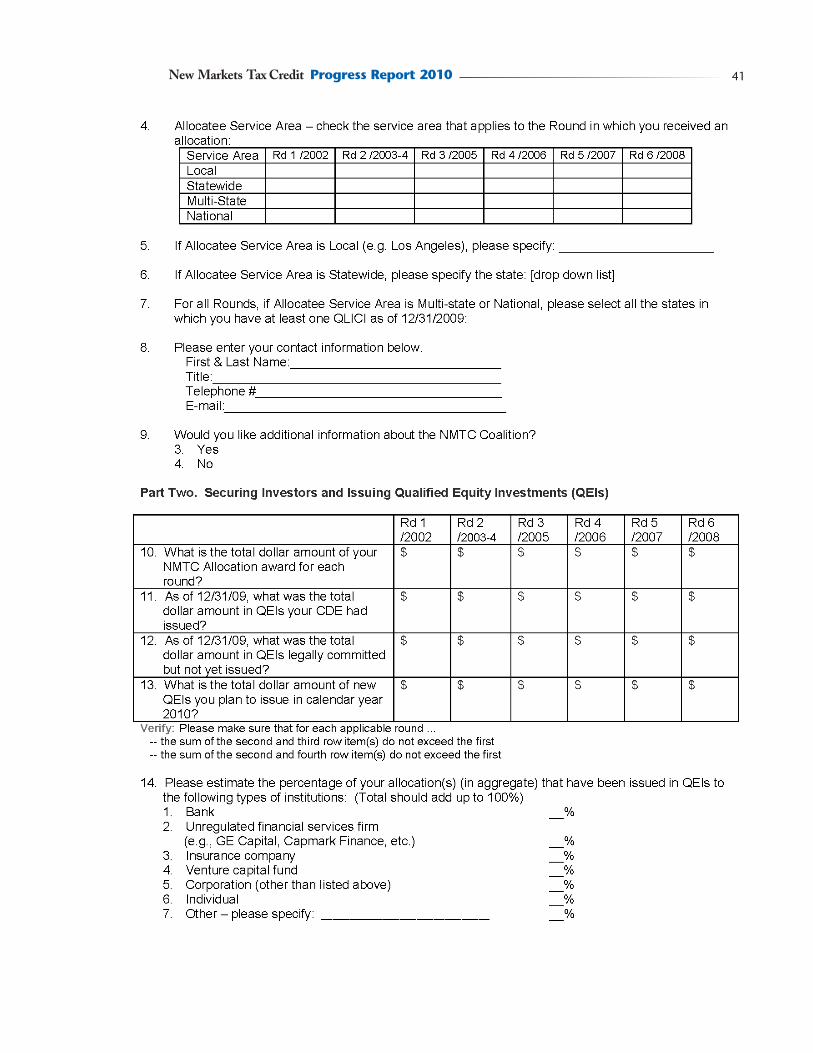
41New Markets Tax Credit Progress Report 2010
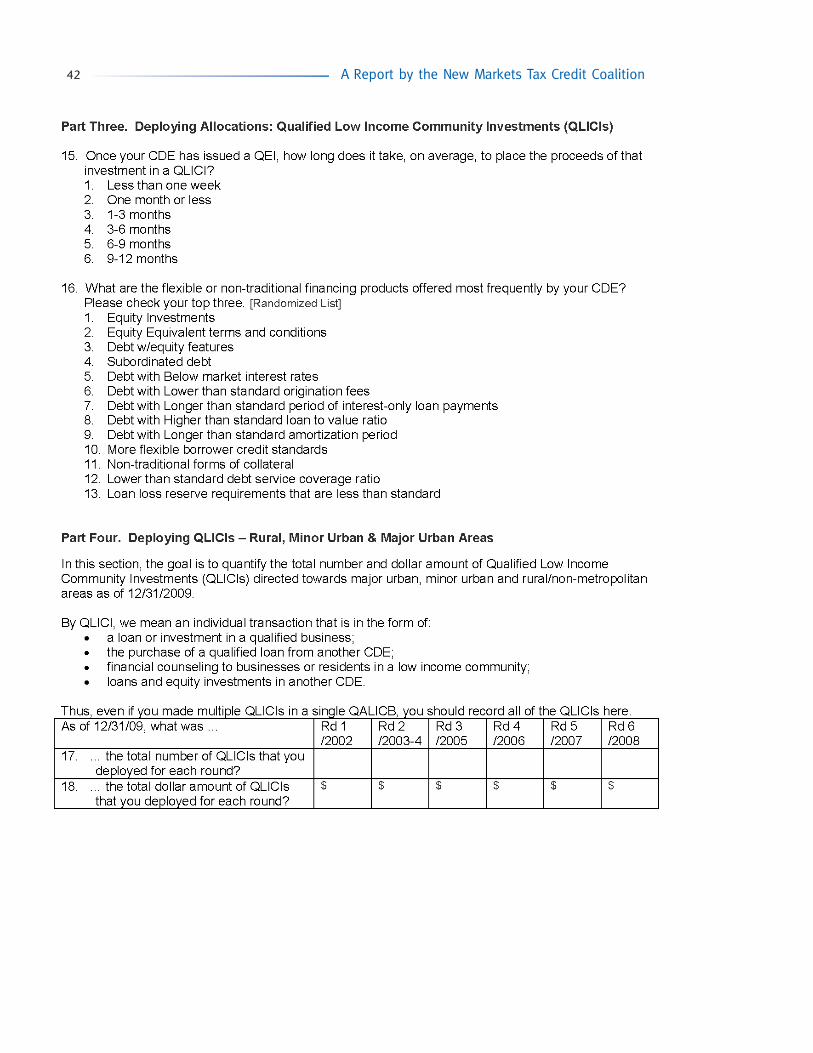
42 A Report by the New Markets Tax Credit Coalition

43New Markets Tax Credit Progress Report 2010

44 A Report by the New Markets Tax Credit Coalition
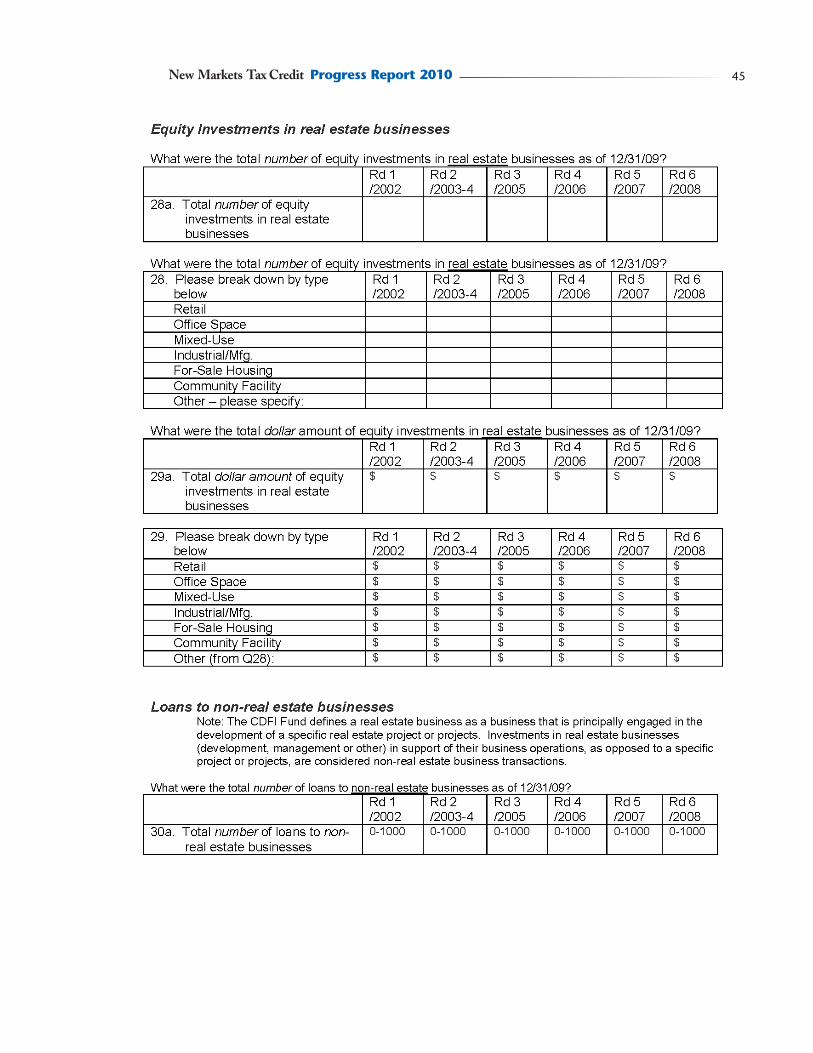
45New Markets Tax Credit Progress Report 2010

46 A Report by the New Markets Tax Credit Coalition

47New Markets Tax Credit Progress Report 2010

48 A Report by the New Markets Tax Credit Coalition

49New Markets Tax Credit Progress Report 2010

50 A Report by the New Markets Tax Credit Coalition

51New Markets Tax Credit Progress Report 2010
Appendix B:A New Markets Tax Credit Timeline
2000
December ■ NMTC Program signed into law as part of the Community Renewal Tax Relief Act of 2004 (P.L. 105-554)
2001
December ■ IRS releases temporary NMTC regulations■ CDFI Fund issues CDE certification application
2002
October ■ First-round allocation applications submitted to CDFI Fund with $26 billion indemand for $2.5 billion in available allocations
2003
March ■ CDFI Fund awards $2.5 billion in first-round allocations
October ■ Second-round allocation applications submitted to CDFI Fund with $30 billionin demand for $3.5 billion in available allocations
November/December ■ First-round allocation agreements signed
2004
March ■ IRS releases revised temporary NMTC regulations
May ■ CDFI Fund awards $3.5 billion in second-round allocations
October ■ American Jobs Creation Act of 2004 (P.L. 108-357) passed with a provision expand-ing the definition of low income communities to include Targeted Population
■ Third-round allocation applications submitted to CDFI Fund with $23 billion indemand for $2 billion in available allocations
Fall/Winter ■ Second-round allocation agreements signed
December ■ IRS releases final NMTC regulations
2005
March ■ CDFI Fund announces $2 billion in QEIs issued by first- and second-round allocatees
July ■ CDFI Fund awards $2 billion in third-round allocations
Fall/Winter ■ Third-round allocation agreements signed
December ■ Gulf Opportunity Zone Act of 2005 (P.L. 109-135), which provides an additional $1 billion in New Markets Tax Credit volume for areas affected by Hurricane Katrina, signed into law
2006
March ■ The CDFI Fund announces plans to award the first $600 million in targetedCredits to CDEs working in qualified GO Zone communities
June ■ CDFI Fund awards $3.5 billion fourth-round allocations and $600 million in Credits for GO Zone
■ IRS issues notice on Targeted Population
Fall/Winter ■ Fourth-round allocation agreements signed
December ■ Tax Relief and Health Care Act of 2006 (P.L. 109-432) including one-year reauthoriza- tion of NMTC and language targeting Credit to non-metro areas, signed into law

52 A Report by the New Markets Tax Credit Coalition
2007 March ■ Fifth-round allocation applications submitted to CDFI Fund with $28 billion in
demand for $3.5 billion in available allocations
■ CDFI Fund releases NMTC Qualified Equity Investment Report and announces$7.7 billion in finalized QEIs
April ■ New Markets Tax Credit Extension Act of 2007 introduced in Congress (H.R. 2075, S. 1239)
October ■ The CDFI Fund awards $3.5 billion in fifth-round allocations and $400 million in credits for GO Zone
2008Winter ■ Fifth-round allocation agreements signed
February ■ President Bush calls for a one-year extension of the NMTC in his FY 2009 Budget
March ■ Sixth-round allocation applications submitted to CDFI Fund with $21 billion indemand for $3.5 billion in available allocations
May ■ CDFI Fund releases NMTC Qualified Equity Investment Report and announces$10.3 billion in finalized QEIs
October ■ The CDFI Fund awards $3.5 billion in sixth-round allocations
2009February ■ American Recovery and Reinvestment Act of 2009 (P.L. 111-5) (ARRA) is signed into
law adding $3 billion in New Markets Tax Credit Authority divided equally between2008 allocation authority and 2009 – with $1.5 billion to be made available to highly qualified CDEs that applied in 2008 but did not receive awards and $1.5 billion added to 2009 making $5 billion available for seventh-round applicants
April ■ Seventh-round allocation applications submitted to CDFI Fund with 249 applications requesting $22.5 billion for $5 billion in available allocations
May ■ The CDFI Fund announces $13.3 billion in QEIs by allocatees
■ The CDFI Fund awards $1.5 billion in additional 2008 allocations made available through ARRA to 32 CDEs
Summer ■ New Markets Tax Credit Extension Act of 2009 (H.R. 2628, S. 1583) introduced inthe House of Representatives by Congressmen Neal (D-MA) and Tiberi (R-OH)and in the Senate by Senators Rockefeller (D-WV) and Snowe (R-ME)
December ■ The House of Representatives passes the Tax Extenders Act of 2009 (H.R. 4213) which extends the NMTC through 2010 with $5 billion in NMTC allocation
2010February ■ President Obama’s Fiscal Year 2011 Budget calls for a two-year extension of
the NMTC, through 2011, with $5 billion in annual allocation authority and AMT relief for NMTC Investors
March ■ Senate passes an amended version of H.R. 4213 with the NTMC extension through 2010 with $5 billion in NMTC allocation authority
■ House passes Small Business and Infrastructure Jobs Act of 2010 (H.R. 4849) providing AMT relief for NMTC investments made from March 2010 through January 2012
April ■ CDFI Fund releases allocation applications for $5 billion in Round VIII (2010)
May ■ CDFI Fund releases NMTC Qualified Equity Investment Report and announces $16 billion in finalized QEIs
June ■ Eighth-round NMTC (2010) allocation applications submitted to CDFI Fund with 250 applications requesting $23.5 billion for $5 billion in available allocations
■ IRS issues Revenue Ruling 2010-16 which clarifies that an individual’s acquisition of a QEI in a CDE is not subject to passive activity limitations

53New Markets Tax Credit Progress Report 2010
Appendix C: The New Markets Tax Credit Extension Act of 2009 (H.R. 2628)and accompanying “Dear Colleague” letter fromRepresentatives Neal and Tiberi

54 A Report by the New Markets Tax Credit Coalition

55New Markets Tax Credit Progress Report 2010

56 A Report by the New Markets Tax Credit Coalition

57New Markets Tax Credit Progress Report 2010
Appendix D: The New Markets Tax Credit Extension Act of 2009 (S. 1583)and accompanying “Dear Colleague” letter from SenatorsRockefeller and Snowe
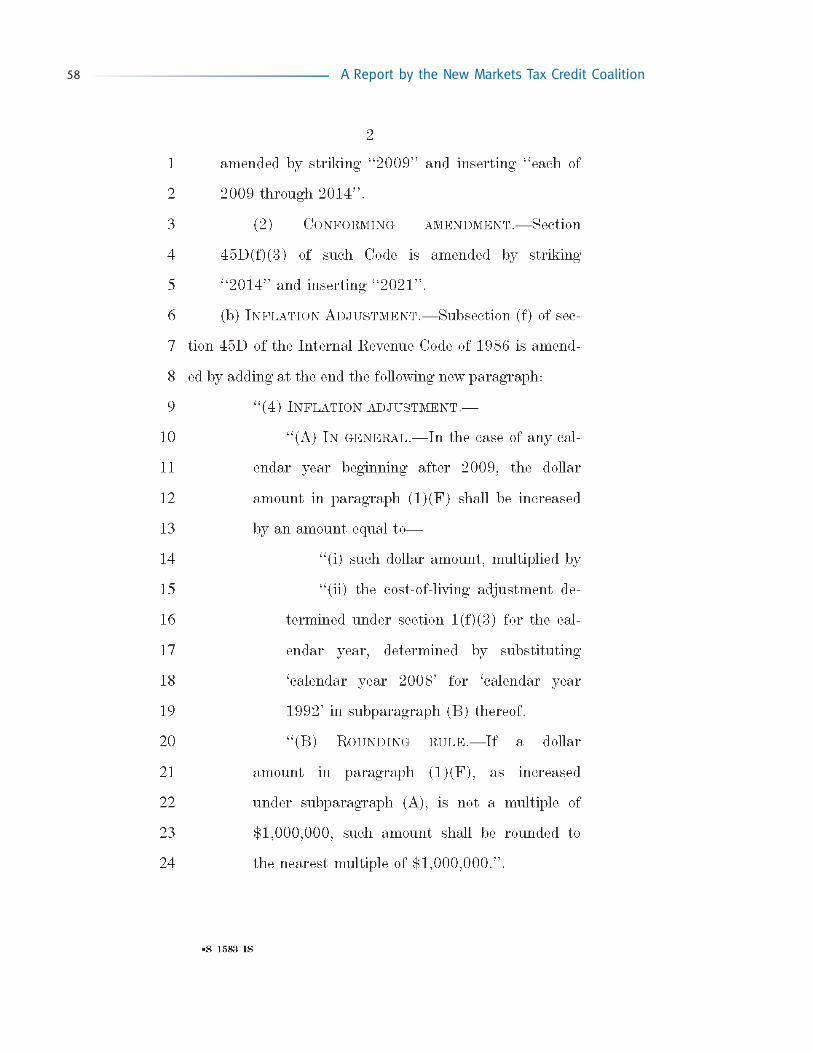
58 A Report by the New Markets Tax Credit Coalition

59New Markets Tax Credit Progress Report 2010

60 A Report by the New Markets Tax Credit Coalition
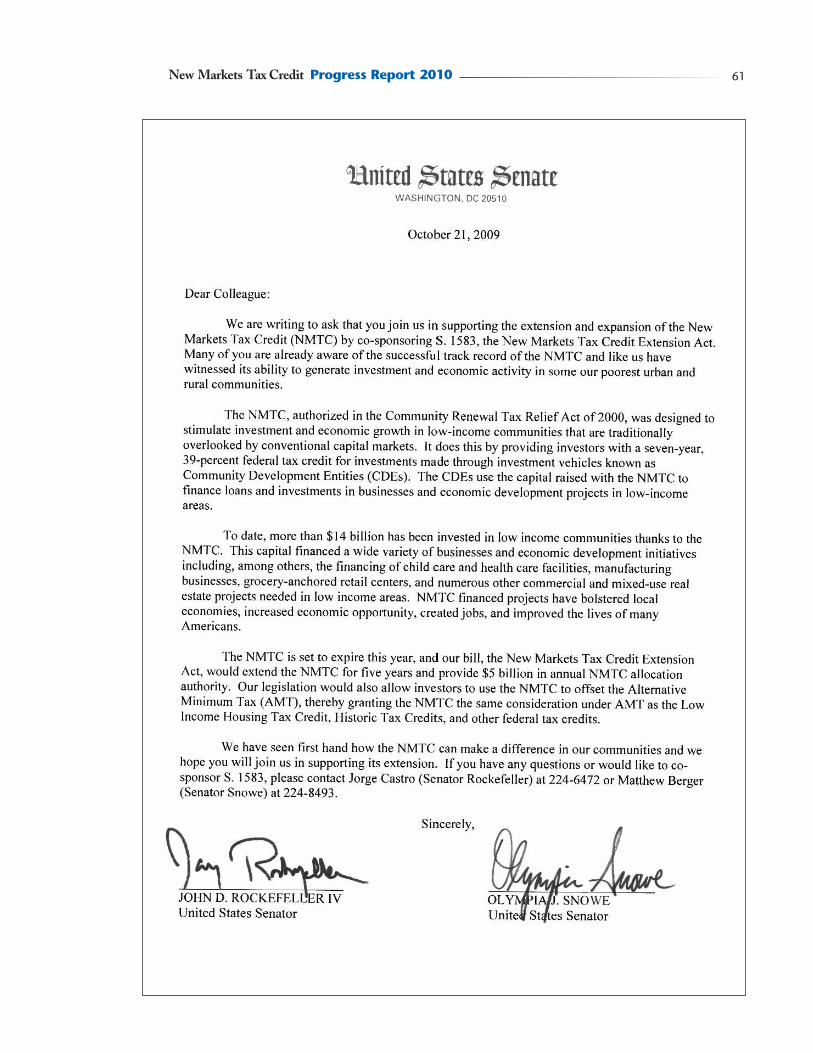
61New Markets Tax Credit Progress Report 2010

62 A Report by the New Markets Tax Credit Coalition
Appendix E: Treasury Department Press Release – February 18, 2010

63New Markets Tax Credit Progress Report 2010

64 A Report by the New Markets Tax Credit Coalition
Appendix F: NMTC Coalition Letter to IRS Requesting Guidance July 21, 2009

65New Markets Tax Credit Progress Report 2010
66 A Report by the New Markets Tax Credit Coalition
Appendix G:IRS Revenue Ruling 2010-16 – June 8, 2010
67New Markets Tax Credit Progress Report 2010

68 A Report by the New Markets Tax Credit Coalition

69New Markets Tax Credit Progress Report 2010

70 A Report by the New Markets Tax Credit Coalition
71New Markets Tax Credit Progress Report 2010

72 A Report by the New Markets Tax Credit Coalition

Notes
____________________________________________________________________________________
____________________________________________________________________________________
____________________________________________________________________________________
____________________________________________________________________________________
____________________________________________________________________________________
____________________________________________________________________________________
____________________________________________________________________________________
________________________________________________________________________________________________________________________________________________________________________
____________________________________________________________________________________
____________________________________________________________________________________
73New Markets Tax Credit Progress Report 2010

Notes
____________________________________________________________________________________
____________________________________________________________________________________
____________________________________________________________________________________
____________________________________________________________________________________
____________________________________________________________________________________
____________________________________________________________________________________
____________________________________________________________________________________
________________________________________________________________________________________________________________________________________________________________________
____________________________________________________________________________________
____________________________________________________________________________________
________________________________________________________________________________________________________________________________________________________________________
____________________________________________________________________________________
____________________________________________________________________________________
________________________________________________________________________________________________________________________________________________________________________
____________________________________________________________________________________
____________________________________________________________________________________
________________________________________________________________________________________________________________________________________________________________________
____________________________________________________________________________________
____________________________________________________________________________________
________________________________________________________________________________________________________________________________________________________________________
____________________________________________________________________________________
____________________________________________________________________________________
________________________________________________________________________________________________________________________________________________________________________
____________________________________________________________________________________
____________________________________________________________________________________
________________________________________________________________________________________________________________________________________________________________________
____________________________________________________________________________________
____________________________________________________________________________________
74 A Report by the New Markets Tax Credit Coalition


New Markets Tax Credit Coalition
1331 G Street, NW, 10th FloorWashington, DC 20005202-204-4500 (Phone)202-393-3034 (Fax)www.nmtccoalition.org
Related Documents