[1], Netherlands Performance Plan (annex to FABEC PP) version 1.0. The Netherlands Performance Plan – RP1 2012-2014

Welcome message from author
This document is posted to help you gain knowledge. Please leave a comment to let me know what you think about it! Share it to your friends and learn new things together.
Transcript
[1], Netherlands Performance Plan (annex to FABEC PP) version 1.0.
The Netherlands Performance Plan – RP1
2012-2014
[2], Netherlands Performance Plan (annex to FABEC PP) version 1.0.
DOCUMENT SUMMARY
Objective : This document contains the Netherlands Performance Plan for the first reference period (2012-2014) on cost-efficiency and Military Mission Effectiveness as well as the additional national KPIs on capacity, environment and safety
Origin: NSA The Netherlands Audience : FABEC, European Commission
Title: Air Navigation Services Performance Plan The Netherlands, Reference period 1: 2012-2014
Reference: EU Regulation 691/2010, annex 2
Version: 1.0 Date: June 2011 Status : oDraft Released þ
Classification : þPublic o FABEC limited o Addressees limited
Electronic source
Host system Software Size
Microsoft Windows XP Microsoft Word 97-2003 Mb
DOCUMENT CHANGE RECORD
Version Date Reason for changes Author of changes
0.1 04052011 First draft Saskia Brouwer
0.1.1 16052011 Second draft Saskia Brouwer/ Ad van der Westen
0.1.2 15/06/2011 Third draft Saskia Brouwer/ Ad van der Westen
[3], Netherlands Performance Plan (annex to FABEC PP) version 1.0.
Document sign off sheet Member States submitting this Performance Plan:
The Netherlands
Organisation Empowered by the MS
Ministry of Infrastructure and the Environment
Names and signatures of Members States representatives
The Netherlands On behalf of
THE STATE SECRETARY OF INFRASTRUCTURE AND
THE ENVIRONMENT,
JOOP ATSMA
THE DIRECTOR GENERAL FOR CIVIL AVIATION AND
MARITIME AFFAIRS,
MARK DIERIKX
[4], Netherlands Performance Plan (annex to FABEC PP) version 1.0.
Contents 1. Introduction .................................................................................................................................. 8
1.1. The situation ................................................................................................................................. 8
1.1.a General Introduction ................................................................................................................... 8
1.1.b. Geographical Scope of the Plan ................................................................................................ 8
1.2. Overall assumptions for Reference Period 1 .............................................................................. 10
1.2.a General ..................................................................................................................................... 10
1.2.b Air Traffic Movements ............................................................................................................... 11
1.3. Overall Status of Aviation Safety and State Safety Programme................................................. 11
1.4. Institutional context ..................................................................................................................... 12
1.5. Description of the outcome of the Stakeholder Consultation Meetings ...................................... 13
2.National Performance Targets and Alert Thresholds ......................................................................... 15
2.1. National performance targets and alert thresholds in each performance area .......................... 15
2.1. (a) Safety targets and thresholds ................................................................................................ 15
2.1. (b) Capacity targets and thresholds ............................................................................................ 15
2.1. (c) Environment targets and thresholds ...................................................................................... 16
2.2. Cost efficiency in the FIR AMSTERDAM .................................................................................... 18
2.2.2a Determined nominal costs for en route ANS for the reference period 2012-2014 ................. 19
2.2.2b Determined en-route ANS costs in real terms ........................................................................ 21
2.2.3. Determined nominal costs for terminal ANS for the reference period 2012-2014 ................... 23
2.2.4 En route service units ............................................................................................................... 24
2.2.4 (a) En route service units forecast for each year of the reference period ............................... 24
2.2.4(b) Terminal service units forecast for each year of the reference period ................................. 25
2.2.5. Determined en route unit rate .................................................................................................. 25
2.2.6. Method of calculation of the determined en route unit rate in the FIR Amsterdam ................. 26
2.2.7. Local context and specificities of the determined unit rate in the FIR Amsterdam, achievements in the cost efficiency field in the past and shortcomings ............................................ 26
2.2.8. Description and justification of the return on equity of the air navigation service providers in relation to the actual risk incurred. ..................................................................................................... 27
2.2.9. National alert thresholds .......................................................................................................... 27
2.2.10. Description of investments necessary to achieve the performance targets with a description of their relevance in relation to the European ATM Masterplan and their coherence with the main areas and directions of progress and change set out therein. ........................................................... 27
2.2.11. Description and justification of the measures planned to achieve a lower proportion of debt financing and their timing. .................................................................................................................. 27
2.2.12. Description of the uncontrollable costs in line with Article 11a. 2 of Regulation (EC) 1794/2006. ......................................................................................................................................... 29
2.2.13. EU wide PIs on cost efficiency ............................................................................................... 30
2.2.14. KPIs on cost efficiency to be used in the second reference period The determined ............ 30
2.2.15. Reporting tables: .................................................................................................................... 30
[5], Netherlands Performance Plan (annex to FABEC PP) version 1.0.
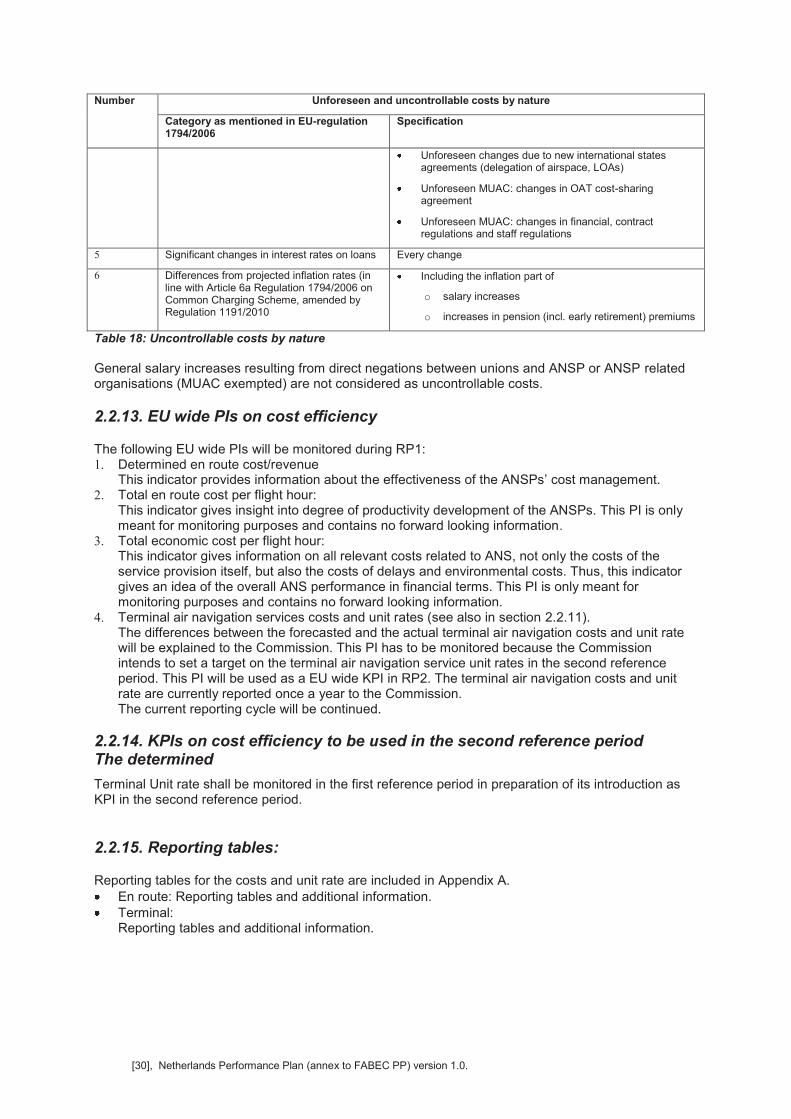
2.3. Summary of the (additional) national KPIs. ................................................................................ 31
2.4.Consistency of the performance targets with the European Union-wide performance targets ... 31
2.5. Carry-overs from the years before RP1 ...................................................................................... 34
2.6. Parameters for risk sharing and incentives ................................................................................. 34
3.Contribution of each accountable entity ............................................................................................. 37
3.1. Entity ((x)) share in the national targets and individually binding performance targets. ............. 37
3.2. Incentive mechanism to be applied to entity x to encourage targets to be met over the reference period. ................................................................................................................................................ 37
4.Civil-military dimension of the plan ..................................................................................................... 39
4.1. Performance of the FUA concept ............................................................................................... 39
4.2. Additional KPI’s ........................................................................................................................... 40
5. Analysis of sensitivity and comparison with the previous Performance Plan .................................... 41
5.1.Sensitivity to external assumptions .............................................................................................. 41
5.2.Comparison with previous Performance Plan.............................................................................. 42
6. Implementation of the Performance Plan .......................................................................................... 43
6.1 Monitoring and reporting .............................................................................................................. 43
6.2.Appropriate measures .................................................................................................................. 43
6.3 Adaptation of the Performance Plan ............................................................................................ 44
Appendices ............................................................................................................................................ 45
[6], Netherlands Performance Plan (annex to FABEC PP) version 1.0.
Acronyms
AAS: Amsterdam Airport Schiphol
ACC: Area Control Centre
AFMU: Air Flow Management Unit
AIS: Aeronautical Information Services
AMC: Acceptable Means of Compliance
ANS: Air Navigation Services
ANSP: Air Navigation Service Provider
ATCO: Air Traffic Controller
ATFCM: Air Traffic Flow and Capacity Management
ATFM: Air Traffic Flow Management
AFMU: Air Traffic Flow Management Unit
ATC: Air Traffic Control
ATM: Air Traffic Management
ATSP: Air Traffic Service Provider
ASM: Airspace Management
CAA-NL: Civil Aviation Authority The Netherlands
CDM: Collaborative Decision Making
CDR: Conditional Route
CFMU: Central Flow Management Unit
CNS: Communication, Navigation and Surveillance
CPB: Netherlands Bureau for Economic Policy Analysis
DSNA: French Air Navigation Service Provider
EASP: European Aviation Safety Programme
EASp: European Aviation Safety Plan
FAB: Functional Airspace Blocks
FABEC: Functional Airspace Block Europe Central
FABEC SSB: States Strategic Board
FAQ: Frequently Asked Question
FIR: Flight Information Region
FL: Flight Level
FPP: FABEC Performance Plan
FUA: Flexible Use of Air Space
IAF: Initial Approach Fix
ICAO: International Civil Aviation Organisation
IFRS: International Financial Reporting Standards
KNMI: Royal Netherlands Meteorological Institute
KPA: Key Performance Area
KPI: Key Performance Indicator
LARA: Local and Regional Airspace Management System

[7], Netherlands Performance Plan (annex to FABEC PP) version 1.0.
LOA’s: Letters of Agreement
LSSIP: Local Single Sky Implementation Plan
LVNL: Air Traffic Control the Netherlands
MAA: Military Aviation Authority
MET: Meteorological information
Mill-ATCC: Nieuw Milligen Area Traffic Control Centre
MME: Military Mission Effectiveness
MoD: Ministry of Defence
MoI&E: Ministry of Infrastructure and the Environment
MUAC: Maastricht Upper Area Control Centre
NSA: National Supervisory Authority
PRB: Performance Review Body
PRC: Performance Review Commission
PRU: Performance Review Unit
PRISMIL: Pan-European Repository of Information Supporting Civil-Military Performance Measurement
RAT: Risk Analysis Tool
RP: Reference Period
RMI: Airport Traffic Decree for Schiphol
SADIS: Satellite Distribution System (meteorological services)
SCM: Stakeholder Consultation Meeting
SES: Single European Sky
SPP: State Safety Programme
SSE: Safety Significant Event
STATFOR: Statistic Forecast Eurocontrol
SU: Service Units
TRA: Temporary Reserved Airspace
VFR: Visual Flight Rules
[8], Netherlands Performance Plan (annex to FABEC PP) version 1.0.
1. INTRODUCTION
This document contains the Netherlands Performance Plan, which has a clear link to the Functional Airspace Block Europe Central (FABEC) performance plan in that it elaborates at national level the Netherlands cost efficiency Key Performance Indicators (KPI). The aggregated national cost efficiency figures will be included in the FABEC Performance Plan. The national documents on cost efficiency and the additional national KPIs are to be considered as a specific contribution to the FABEC Performance Plan and will be included in an Annex to the FABEC Performance Plan. The national cost efficiency data are coordinated with the KPIs on capacity, environment, safety and Military Mission Effectiveness (MME) as included in the FABEC Performance Plan.
1.1. The situation
1.1.a General Introduction
The Single European Sky (SES) II package was introduced to improve the Air Navigation Service (ANS) performance within the overall objective of the SES initiative to create a single sky in Europe. To improve performance in the European airspace a performance scheme for ANS has been introduced, starting from January 2012. The ultimate goal is an improvement of the ANS performance in four Key Performance Areas (KPA), namely safety, environment, capacity and cost efficiency. The first reference period (RP1) of the scheme runs from 1
st January 2012 till 31
st December 2014. EU
Member States, either individually or jointly within a Functional Airspace Block (FAB), have to develop a national or FAB Performance Plan, with national or FAB targets that are consistent with the European wide targets
1 and setting out the measures (investments, actions plans and incentives) that
need to be taken to meet these targets. In addition, the plan contains a description of the monitoring and reporting mechanisms that have been put in place. The Plan covers the reference period 2012-2014 and deals with the cost efficiency KPI and the other KPIs on safety, capacity and environment, in keeping with the (provisional) FABEC Performance Plan which covers the EU wide KPAs on safety, environment, capacity and MME. The Plan is in accordance with Regulation (EC) 691/2010, Annex II, the Commission Regulation (EU) No 1794/2006 as amended by Commission Regulation (EU) No 1191/2010 and the Guidance Material (GM) provided by the Performance Review Body (PRB) as issued on 23
rd February 2011.
The Plan covers the services provided in the Netherlands airspace controlled by Air Traffic Control the Netherlands (LVNL) and in the Netherlands en route airspace controlled by Maastricht Upper Area Control Centre (MUAC). This Performance Plan has been developed by the Netherlands National Supervisory Authority (NSA), i.e. the Air Traffic Management Division of the Ministry of Infrastructure and the Environment and the Civil Aviation Authority The Netherlands (CAA-NL).
1.1.b. Geographical Scope of the Plan
The accountable entities covered by this national Performance Plan are: LVNL (Air Traffic Control Netherlands) MUAC (Maastricht Upper Area Control Centre) KNMI (Royal Netherlands Meteorological Institute) The Ministry of Defence, Royal Netherlands Air Force Civil Aviation Authority The Netherlands (CAA-NL) Eurocontrol
1 (COM) 2011/121/EU Commission Decision of 21 February 2011 setting the European Union-wide performance targets and alert thresholds for the provision of air navigation services for the years 2012 to 2014
[9], Netherlands Performance Plan (annex to FABEC PP) version 1.0.
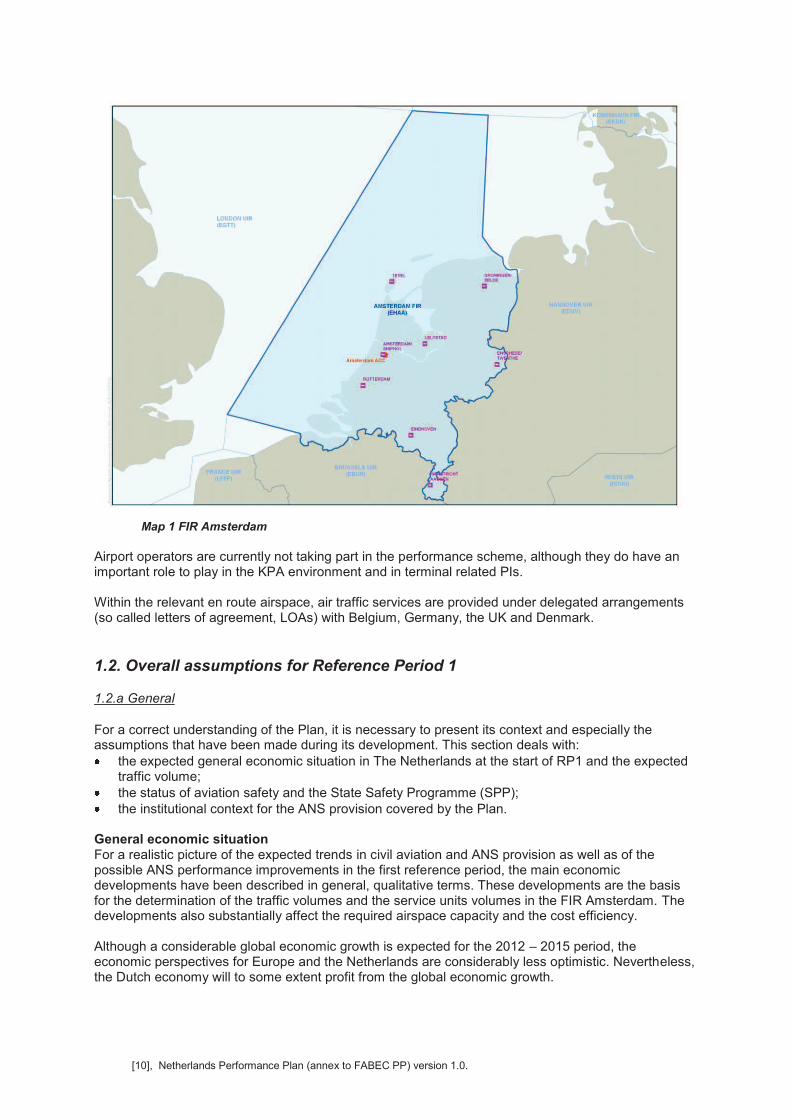
LVNL (Air Traffic Control the Netherlands) LVNL has been certified for Air Traffic Services (ATS), Communication, Navigation and Surveillance (CNS) and Aeronautical Information Services (AIS) provision and by law been designated as ANSP. ANS are provided at Amsterdam Airport Schiphol, Rotterdam-The Hague Airport, Groningen Eelde Airport and Maastricht Aachen Airport. At Amsterdam Airport services are provided by two control units, namely Schiphol Tower and Schiphol Approach. LVNL provides en route ANS in the airspace beyond a radius of 20 km (= 12 nautical miles) around all controlled airports in the terminal charging zone above Flight Level (FL) 30 up to FL 245. Furthermore, LVNL provides terminal services below FL 30 within a radius of 20 km around the four mentioned controlled airports. MUAC (Maastricht Upper Area Control Centre) Under the Maastricht Agreement of 1986, four States, namely Belgium, Germany, Luxembourg and the Netherlands have entrusted the air navigation services in the upper airspace above 24.500 ft (FL 245) of the Benelux area and the North Western part of Germany to MUAC, which is part of the Eurocontrol organisation. Under the same agreement the four contracting States put, free of charge, specified installations, equipment and air-ground and ground-ground communication facilities at the disposal of MUAC. In addition, other facilities and services which are essential to the operation of the MUAC services, such as AIS, Meteorological (MET) information and navigational facilities are also made available, free of charge. MUAC is a certified ANSP. It is located in the Netherlands and has by Dutch law been designated. MUAC provides en route air navigation services in the entire Flight Information Region (FIR) Amsterdam above FL 245. KNMI (Royal Netherlands Meteorological Institute) KNMI has been certified as an ANS provider for meteorological services in the Amsterdam FIR and has by law been designated. Civil Aviation Authority The Netherlands (CAA-NL) CAA partly acts as NSA for Air Traffic Management (ATM and is within the Ministry separated from the policy bodies (organizational separation), i.e. the Directorate General Civil Aviation and Maritime Affairs. It is also separated from the KNMI. LVNL and MUAC are not part of the ministerial organization. Ministry of Defence/ Royal Netherlands Air Force Civil-military cooperation in the Netherlands airspace has been and is increasingly being realized along Flexible Use of Airspace (FUA) lines, with the ultimate goal of a joint and integrated approach to airspace management. Options for closer operational cooperation are being looked into. For the use of airspace by the military, the Minister of Defence has by law his own accountability. Eurocontrol Eurocontrol, the European Organisation for the Safety of Air Navigation is an intergovernmental organization. The Dutch financial contribution to Eurocontrol, based on a sharing key, is part of the costs for ANS provision in the FIR Amsterdam. The geographical scope of the Plan covers the Amsterdam FIR, both for civil and military aviation. The map below shows the geographical situation of the Dutch airspace
[10], Netherlands Performance Plan (annex to FABEC PP) version 1.0.
Map 1 FIR Amsterdam
Airport operators are currently not taking part in the performance scheme, although they do have an important role to play in the KPA environment and in terminal related PIs. Within the relevant en route airspace, air traffic services are provided under delegated arrangements (so called letters of agreement, LOAs) with Belgium, Germany, the UK and Denmark.
1.2. Overall assumptions for Reference Period 1
1.2.a General
For a correct understanding of the Plan, it is necessary to present its context and especially the assumptions that have been made during its development. This section deals with: the expected general economic situation in The Netherlands at the start of RP1 and the expected
traffic volume; the status of aviation safety and the State Safety Programme (SPP); the institutional context for the ANS provision covered by the Plan.
General economic situation For a realistic picture of the expected trends in civil aviation and ANS provision as well as of the possible ANS performance improvements in the first reference period, the main economic developments have been described in general, qualitative terms. These developments are the basis for the determination of the traffic volumes and the service units volumes in the FIR Amsterdam. The developments also substantially affect the required airspace capacity and the cost efficiency. Although a considerable global economic growth is expected for the 2012 – 2015 period, the economic perspectives for Europe and the Netherlands are considerably less optimistic. Nevertheless, the Dutch economy will to some extent profit from the global economic growth.
[11], Netherlands Performance Plan (annex to FABEC PP) version 1.0.
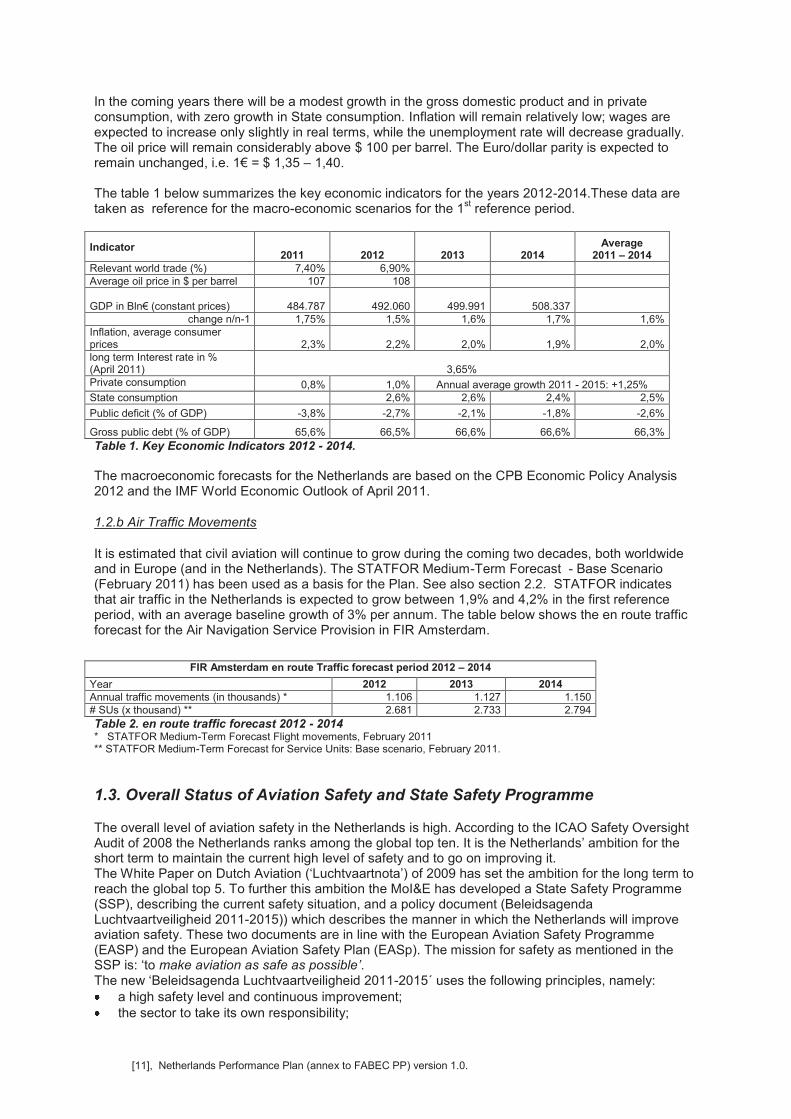
In the coming years there will be a modest growth in the gross domestic product and in private consumption, with zero growth in State consumption. Inflation will remain relatively low; wages are expected to increase only slightly in real terms, while the unemployment rate will decrease gradually. The oil price will remain considerably above $ 100 per barrel. The Euro/dollar parity is expected to remain unchanged, i.e. 1€ = $ 1,35 – 1,40. The table 1 below summarizes the key economic indicators for the years 2012-2014.These data are taken as reference for the macro-economic scenarios for the 1
st reference period.
Indicator 2011 2012 2013 2014
Average 2011 – 2014
Relevant world trade (%) 7,40% 6,90%
Average oil price in $ per barrel 107 108
GDP in Bln€ (constant prices) 484.787
492.060 499.991 508.337 change n/n-1 1,75% 1,5% 1,6% 1,7% 1,6%
Inflation, average consumer prices 2,3% 2,2% 2,0% 1,9% 2,0% long term Interest rate in % (April 2011) 3,65% Private consumption 0,8% 1,0% Annual average growth 2011 - 2015: +1,25% State consumption 2,6% 2,6% 2,4% 2,5%
Public deficit (% of GDP) -3,8% -2,7% -2,1% -1,8% -2,6%
Gross public debt (% of GDP) 65,6% 66,5% 66,6% 66,6% 66,3%
Table 1. Key Economic Indicators 2012 - 2014.
The macroeconomic forecasts for the Netherlands are based on the CPB Economic Policy Analysis 2012 and the IMF World Economic Outlook of April 2011.
1.2.b Air Traffic Movements
It is estimated that civil aviation will continue to grow during the coming two decades, both worldwide and in Europe (and in the Netherlands). The STATFOR Medium-Term Forecast - Base Scenario (February 2011) has been used as a basis for the Plan. See also section 2.2. STATFOR indicates that air traffic in the Netherlands is expected to grow between 1,9% and 4,2% in the first reference period, with an average baseline growth of 3% per annum. The table below shows the en route traffic forecast for the Air Navigation Service Provision in FIR Amsterdam.
FIR Amsterdam en route Traffic forecast period 2012 – 2014
Year 2012 2013 2014
Annual traffic movements (in thousands) * 1.106 1.127 1.150 # SUs (x thousand) ** 2.681 2.733 2.794
Table 2. en route traffic forecast 2012 - 2014 * STATFOR Medium-Term Forecast Flight movements, February 2011 ** STATFOR Medium-Term Forecast for Service Units: Base scenario, February 2011.
1.3. Overall Status of Aviation Safety and State Safety Programme
The overall level of aviation safety in the Netherlands is high. According to the ICAO Safety Oversight Audit of 2008 the Netherlands ranks among the global top ten. It is the Netherlands’ ambition for the short term to maintain the current high level of safety and to go on improving it. The White Paper on Dutch Aviation (‘Luchtvaartnota’) of 2009 has set the ambition for the long term to reach the global top 5. To further this ambition the MoI&E has developed a State Safety Programme (SSP), describing the current safety situation, and a policy document (Beleidsagenda Luchtvaartveiligheid 2011-2015)) which describes the manner in which the Netherlands will improve aviation safety. These two documents are in line with the European Aviation Safety Programme (EASP) and the European Aviation Safety Plan (EASp). The mission for safety as mentioned in the SSP is: ‘to make aviation as safe as possible’. The new ‘Beleidsagenda Luchtvaartveiligheid 2011-2015´ uses the following principles, namely: a high safety level and continuous improvement; the sector to take its own responsibility;
[12], Netherlands Performance Plan (annex to FABEC PP) version 1.0.
a decrease in pressure from regulations and administrative burdens. As required by Regulation 2007/1315/EU, the NSA shall issue a safety directive as soon as it has detected the occurence of an unsafe condition in a functional system requiring immediate action. At this moment no safety directives are pending.
1.4. Institutional context
No major changes in the ATM organisation have recently taken place or are currently envisaged in the 1
st reference period. However, closer civil-military cooperation is being looked into. This might lead to
organisational changes and unforeseen costs, possibly during the first reference period. The institutional context of ANS provision is as follows: 1. The Ministry of Infrastructure and the Environment (MoI&M, ´Ministerie van Infrastructuur en
Milieu´) 2 is the State authority for civil aviation in the Netherlands. Within MoI&E, the Directorate
General for Civil Aviation and Maritime Affairs (DGLM, ´Directoraat-Generaal Luchtvaart en Maritieme Zaken´) is responsible for the development of aviation policy and legislation, including transport, environment and safety.
2. Policy implementation and supervision have been delegated to the Civil Aviation Authority The Netherlands (CAA-NL, ´Inspectie Verkeer en Waterstaat´), which is also a part of MoI&E. For the SES, part of the Civil Aviation Authority The Netherlands acts as NSA.
3. The Ministry of Defence (MoD) is the State military authority responsible for military aviation. By law airspace regulation is a joint responsibility of the civil and military authorities and is realized by MoI&E in cooperation with the MoD. Within the MoD, the Military Aviation Authority (MAA, ´Militaire Luchtvaart Autoriteit´), established in July 2005, closely co-operates with the civil authorities of DGLM and CAA-NL. The military ANSP organisation controls part of the airspace, including all military air bases (some of which with structural civil joint use). The Royal Netherlands Air Force (RNLAF), as part of the MoD, operates MilATCC Nieuw Milligen.
4. Air Traffic Control Netherlands (LVNL, ´Luchtverkeersleiding Nederland´) is the national air navigation service provider (a corporatised public entity since January 1993 – Independent Administrative Body - ZBO). While accountable to MoI&E for its performance, LVNL is a separate entity from DGLM and CAA-NL. The Aviation Act stipulates that LVNL, MilATCC and MUAC share the responsibility for the provision of ANS to all air traffic within the Amsterdam FIR, each within its own area of responsibility. Air Navigation Services located at Amsterdam Airport cover both Schiphol and Rotterdam -The Hague Approach. ATS, CNS and all other activities directly related to Groningen Airport Eelde and Maastricht Aachen Airport are part of the ATM Service Provision of the LVNL Regional Unit. LVNL and MilATCC operate the joint civil-military Airspace and Flow Management Unit (AFMU).
5. The EUROCONTROL Maastricht Upper Area Control Centre (MUAC) MUAC is part of Eurocontrol. At the request of the Benelux and Germany, MUAC is operated as a EUROCONTROL Agency service under the Maastricht Agreement of 25 November 1986. It is a certified ANSP and designated by law to provide services in the upper airspace of the Netherlands, Belgium, Luxembourg and the North Western part of Germany.
6. The Royal Netherlands Meteorological Institute (KNMI, ´Koninklijk Nederlands Meteorologisch Instituut´) is an agency within MoI&E and is responsible for the provision of meteorological services to aviation in the Amsterdam FIR. KNMI is certified as a provider for meteorological services (MET) and has been designated as such by law.
7. Eurocontrol and NSA The Netherlands is a Eurocontrol member State and carries 3% of the yearly Eurocontrol (Part I and IX) costs.
2 The Ministry of Transport, Public Works and Water Management, the former State authority for civil aviation, has been merged with the Ministry of Housing, Spatial Planning and the Environment into the new Ministry of Infrastructure and the Environment.
[13], Netherlands Performance Plan (annex to FABEC PP) version 1.0.
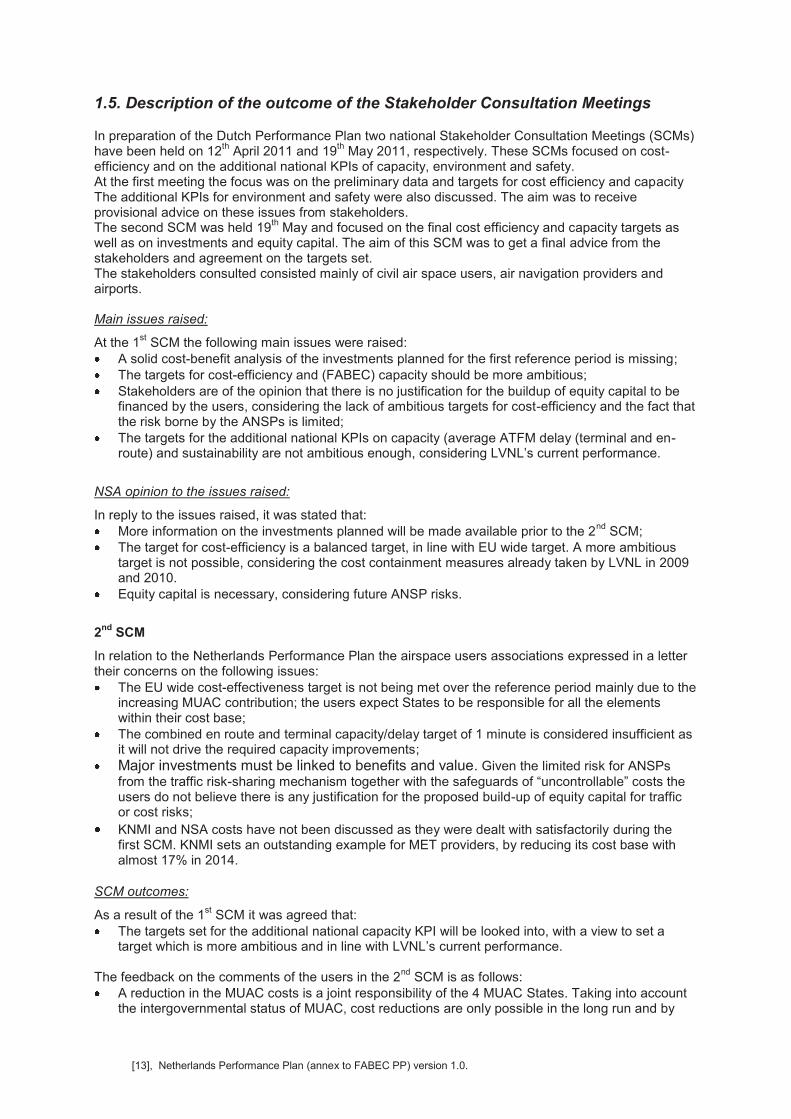
1.5. Description of the outcome of the Stakeholder Consultation Meetings
In preparation of the Dutch Performance Plan two national Stakeholder Consultation Meetings (SCMs) have been held on 12
th April 2011 and 19
th May 2011, respectively. These SCMs focused on cost-
efficiency and on the additional national KPIs of capacity, environment and safety. At the first meeting the focus was on the preliminary data and targets for cost efficiency and capacity The additional KPIs for environment and safety were also discussed. The aim was to receive provisional advice on these issues from stakeholders. The second SCM was held 19
th May and focused on the final cost efficiency and capacity targets as
well as on investments and equity capital. The aim of this SCM was to get a final advice from the stakeholders and agreement on the targets set. The stakeholders consulted consisted mainly of civil air space users, air navigation providers and airports. Main issues raised:
At the 1st SCM the following main issues were raised:
A solid cost-benefit analysis of the investments planned for the first reference period is missing; The targets for cost-efficiency and (FABEC) capacity should be more ambitious; Stakeholders are of the opinion that there is no justification for the buildup of equity capital to be
financed by the users, considering the lack of ambitious targets for cost-efficiency and the fact that the risk borne by the ANSPs is limited;
The targets for the additional national KPIs on capacity (average ATFM delay (terminal and en-route) and sustainability are not ambitious enough, considering LVNL’s current performance.
NSA opinion to the issues raised:
In reply to the issues raised, it was stated that: More information on the investments planned will be made available prior to the 2
nd SCM;
The target for cost-efficiency is a balanced target, in line with EU wide target. A more ambitious target is not possible, considering the cost containment measures already taken by LVNL in 2009 and 2010.
Equity capital is necessary, considering future ANSP risks.
2nd
SCM
In relation to the Netherlands Performance Plan the airspace users associations expressed in a letter their concerns on the following issues: The EU wide cost-effectiveness target is not being met over the reference period mainly due to the
increasing MUAC contribution; the users expect States to be responsible for all the elements within their cost base;
The combined en route and terminal capacity/delay target of 1 minute is considered insufficient as it will not drive the required capacity improvements;
Major investments must be linked to benefits and value. Given the limited risk for ANSPs from the traffic risk-sharing mechanism together with the safeguards of “uncontrollable” costs the users do not believe there is any justification for the proposed build-up of equity capital for traffic or cost risks;
KNMI and NSA costs have not been discussed as they were dealt with satisfactorily during the first SCM. KNMI sets an outstanding example for MET providers, by reducing its cost base with almost 17% in 2014.
SCM outcomes:
As a result of the 1st SCM it was agreed that:
The targets set for the additional national capacity KPI will be looked into, with a view to set a target which is more ambitious and in line with LVNL’s current performance.
The feedback on the comments of the users in the 2nd
SCM is as follows: A reduction in the MUAC costs is a joint responsibility of the 4 MUAC States. Taking into account
the intergovernmental status of MUAC, cost reductions are only possible in the long run and by

[14], Netherlands Performance Plan (annex to FABEC PP) version 1.0.
unanimity of the 4 States; More transparency will be given of the total MUAC costs (including the cost for CNS infrastructure of the other ANSPs used by MUAC free of charge), the distribution of the total MUAC costs over the 4 States and the MUAC revenues (again in total and per State of origin)
Without the change in the MUAC cost sharing key, The Netherlands would have met the cost efficiency target; The change in the cost sharing key wiped out the cost efficiencies realised by MUAC in the FIR Amsterdam; Without this change in the cost sharing key the targeted determined en route unit rate in 2014 would have been 11.2% (yearly average of -3.9%) lower than in 2011.
The 2014 average en route delay targets for MUAC (0.22) and LVNL (0.18) are completely in line with the capacity reference values of the PRU and thus consistent with and contributing to the EU wide target;
LVNL will analyze the feasibility of a decrease in the total ATFM delay per flight in cooperation with KLM and Amsterdam Airport Schiphol. Particular attention will be paid to the role and responsibilities of the various parties involved;
An extensive explanation of the rationale and the building up of LVNL equity capital is included both in this Performance Plan and in the additional information on the reporting tables of the en route cost data.
The consultation documents, including the invitation and the list of participants, as well as the minutes of both SCMs are included in the appendices.
[15], Netherlands Performance Plan (annex to FABEC PP) version 1.0.
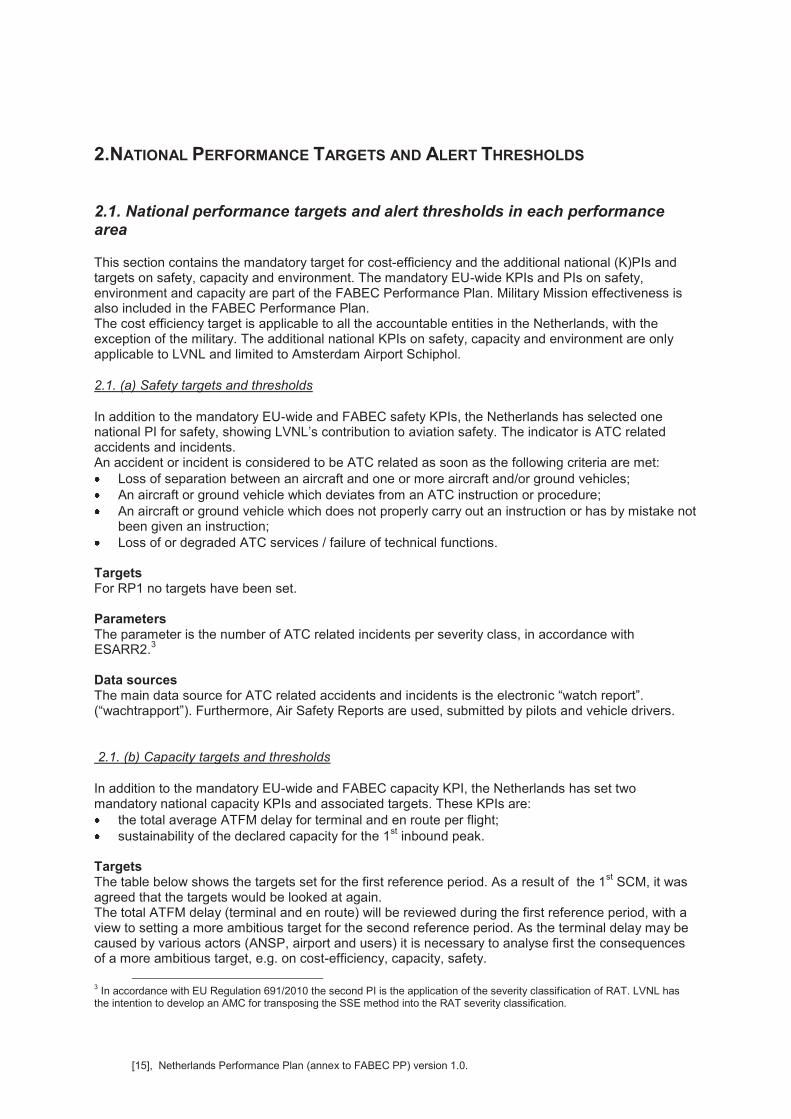
2.NATIONAL PERFORMANCE TARGETS AND ALERT THRESHOLDS
2.1. National performance targets and alert thresholds in each performance area
This section contains the mandatory target for cost-efficiency and the additional national (K)PIs and targets on safety, capacity and environment. The mandatory EU-wide KPIs and PIs on safety, environment and capacity are part of the FABEC Performance Plan. Military Mission effectiveness is also included in the FABEC Performance Plan. The cost efficiency target is applicable to all the accountable entities in the Netherlands, with the exception of the military. The additional national KPIs on safety, capacity and environment are only applicable to LVNL and limited to Amsterdam Airport Schiphol.
2.1. (a) Safety targets and thresholds
In addition to the mandatory EU-wide and FABEC safety KPIs, the Netherlands has selected one national PI for safety, showing LVNL’s contribution to aviation safety. The indicator is ATC related accidents and incidents. An accident or incident is considered to be ATC related as soon as the following criteria are met: Loss of separation between an aircraft and one or more aircraft and/or ground vehicles; An aircraft or ground vehicle which deviates from an ATC instruction or procedure; An aircraft or ground vehicle which does not properly carry out an instruction or has by mistake not
been given an instruction; Loss of or degraded ATC services / failure of technical functions.
Targets For RP1 no targets have been set. Parameters The parameter is the number of ATC related incidents per severity class, in accordance with ESARR2.
3
Data sources The main data source for ATC related accidents and incidents is the electronic “watch report”. (“wachtrapport”). Furthermore, Air Safety Reports are used, submitted by pilots and vehicle drivers.
2.1. (b) Capacity targets and thresholds
In addition to the mandatory EU-wide and FABEC capacity KPI, the Netherlands has set two mandatory national capacity KPIs and associated targets. These KPIs are: the total average ATFM delay for terminal and en route per flight; sustainability of the declared capacity for the 1
st inbound peak.
Targets The table below shows the targets set for the first reference period. As a result of the 1
st SCM, it was
agreed that the targets would be looked at again. The total ATFM delay (terminal and en route) will be reviewed during the first reference period, with a view to setting a more ambitious target for the second reference period. As the terminal delay may be caused by various actors (ANSP, airport and users) it is necessary to analyse first the consequences of a more ambitious target, e.g. on cost-efficiency, capacity, safety.
3 In accordance with EU Regulation 691/2010 the second PI is the application of the severity classification of RAT. LVNL has the intention to develop an AMC for transposing the SSE method into the RAT severity classification.
[16], Netherlands Performance Plan (annex to FABEC PP) version 1.0.
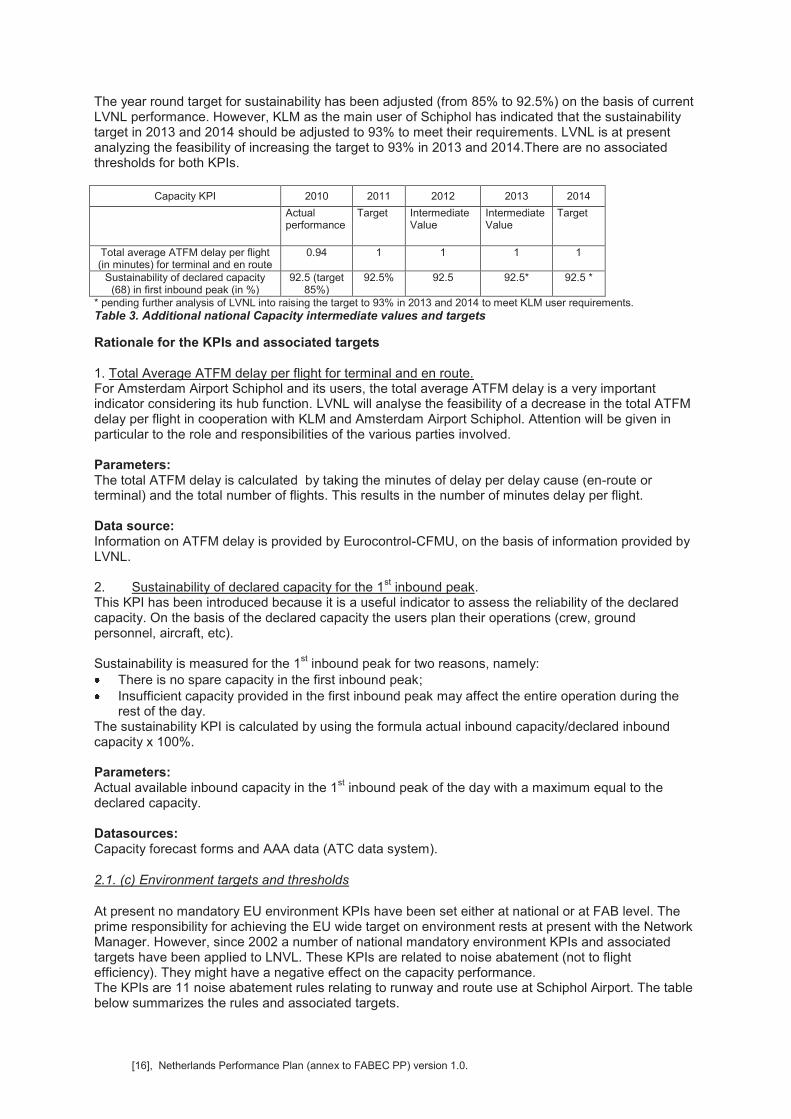
The year round target for sustainability has been adjusted (from 85% to 92.5%) on the basis of current LVNL performance. However, KLM as the main user of Schiphol has indicated that the sustainability target in 2013 and 2014 should be adjusted to 93% to meet their requirements. LVNL is at present analyzing the feasibility of increasing the target to 93% in 2013 and 2014.There are no associated thresholds for both KPIs.
Capacity KPI 2010 2011 2012 2013 2014
Actual performance
Target Intermediate Value
Intermediate Value
Target
Total average ATFM delay per flight (in minutes) for terminal and en route
0.94 1 1 1 1
Sustainability of declared capacity (68) in first inbound peak (in %)
92.5 (target 85%)
92.5% 92.5 92.5* 92.5 *
* pending further analysis of LVNL into raising the target to 93% in 2013 and 2014 to meet KLM user requirements.
Table 3. Additional national Capacity intermediate values and targets
Rationale for the KPIs and associated targets 1. Total Average ATFM delay per flight for terminal and en route. For Amsterdam Airport Schiphol and its users, the total average ATFM delay is a very important indicator considering its hub function. LVNL will analyse the feasibility of a decrease in the total ATFM delay per flight in cooperation with KLM and Amsterdam Airport Schiphol. Attention will be given in particular to the role and responsibilities of the various parties involved. Parameters: The total ATFM delay is calculated by taking the minutes of delay per delay cause (en-route or terminal) and the total number of flights. This results in the number of minutes delay per flight. Data source: Information on ATFM delay is provided by Eurocontrol-CFMU, on the basis of information provided by LVNL. 2. Sustainability of declared capacity for the 1
st inbound peak.
This KPI has been introduced because it is a useful indicator to assess the reliability of the declared capacity. On the basis of the declared capacity the users plan their operations (crew, ground personnel, aircraft, etc). Sustainability is measured for the 1
st inbound peak for two reasons, namely:
There is no spare capacity in the first inbound peak; Insufficient capacity provided in the first inbound peak may affect the entire operation during the
rest of the day. The sustainability KPI is calculated by using the formula actual inbound capacity/declared inbound capacity x 100%. Parameters: Actual available inbound capacity in the 1
st inbound peak of the day with a maximum equal to the
declared capacity. Datasources: Capacity forecast forms and AAA data (ATC data system).
2.1. (c) Environment targets and thresholds
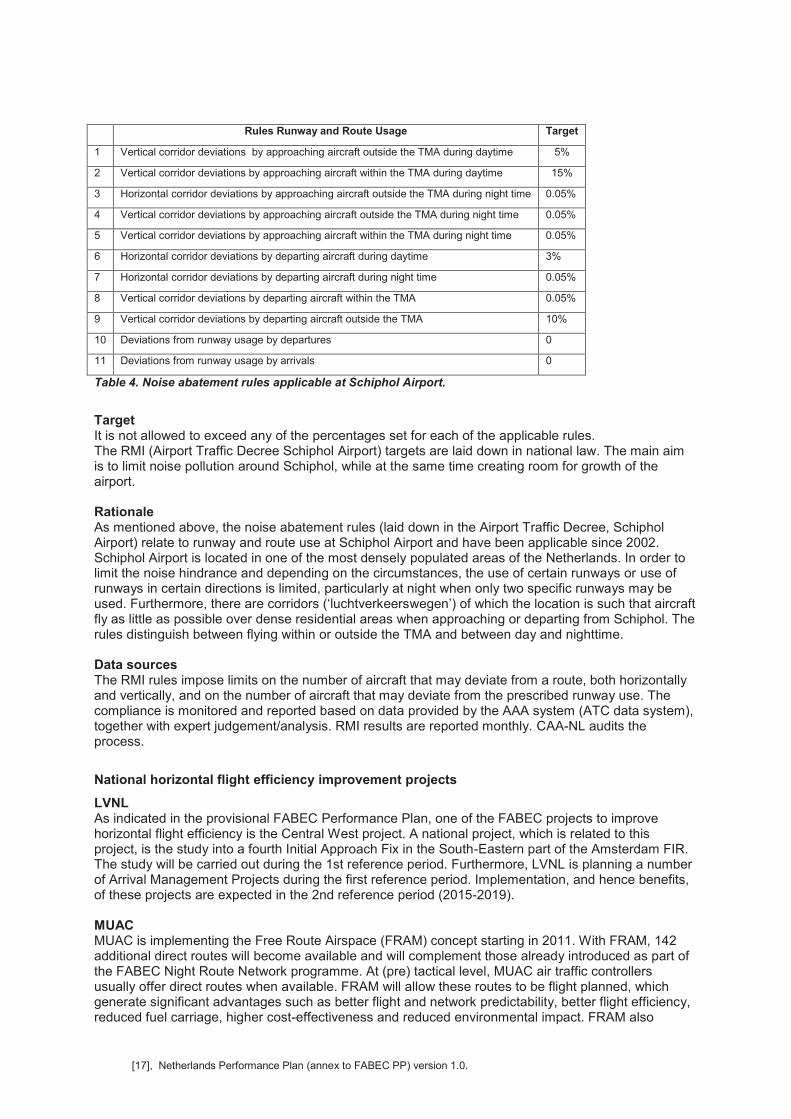
At present no mandatory EU environment KPIs have been set either at national or at FAB level. The prime responsibility for achieving the EU wide target on environment rests at present with the Network Manager. However, since 2002 a number of national mandatory environment KPIs and associated targets have been applied to LNVL. These KPIs are related to noise abatement (not to flight efficiency). They might have a negative effect on the capacity performance. The KPIs are 11 noise abatement rules relating to runway and route use at Schiphol Airport. The table below summarizes the rules and associated targets.
[17], Netherlands Performance Plan (annex to FABEC PP) version 1.0.
Rules Runway and Route Usage Target
1 Vertical corridor deviations by approaching aircraft outside the TMA during daytime 5%
2 Vertical corridor deviations by approaching aircraft within the TMA during daytime 15%
3 Horizontal corridor deviations by approaching aircraft outside the TMA during night time 0.05%
4 Vertical corridor deviations by approaching aircraft outside the TMA during night time 0.05%
5 Vertical corridor deviations by approaching aircraft within the TMA during night time 0.05%
6 Horizontal corridor deviations by departing aircraft during daytime 3%
7 Horizontal corridor deviations by departing aircraft during night time 0.05%
8 Vertical corridor deviations by departing aircraft within the TMA 0.05%
9 Vertical corridor deviations by departing aircraft outside the TMA 10%
10 Deviations from runway usage by departures 0
11 Deviations from runway usage by arrivals 0
Table 4. Noise abatement rules applicable at Schiphol Airport.
Target It is not allowed to exceed any of the percentages set for each of the applicable rules. The RMI (Airport Traffic Decree Schiphol Airport) targets are laid down in national law. The main aim is to limit noise pollution around Schiphol, while at the same time creating room for growth of the airport. Rationale As mentioned above, the noise abatement rules (laid down in the Airport Traffic Decree, Schiphol Airport) relate to runway and route use at Schiphol Airport and have been applicable since 2002. Schiphol Airport is located in one of the most densely populated areas of the Netherlands. In order to limit the noise hindrance and depending on the circumstances, the use of certain runways or use of runways in certain directions is limited, particularly at night when only two specific runways may be used. Furthermore, there are corridors (‘luchtverkeerswegen’) of which the location is such that aircraft fly as little as possible over dense residential areas when approaching or departing from Schiphol. The rules distinguish between flying within or outside the TMA and between day and nighttime. Data sources The RMI rules impose limits on the number of aircraft that may deviate from a route, both horizontally and vertically, and on the number of aircraft that may deviate from the prescribed runway use. The compliance is monitored and reported based on data provided by the AAA system (ATC data system), together with expert judgement/analysis. RMI results are reported monthly. CAA-NL audits the process.
National horizontal flight efficiency improvement projects
LVNL As indicated in the provisional FABEC Performance Plan, one of the FABEC projects to improve horizontal flight efficiency is the Central West project. A national project, which is related to this project, is the study into a fourth Initial Approach Fix in the South-Eastern part of the Amsterdam FIR. The study will be carried out during the 1st reference period. Furthermore, LVNL is planning a number of Arrival Management Projects during the first reference period. Implementation, and hence benefits, of these projects are expected in the 2nd reference period (2015-2019). MUAC MUAC is implementing the Free Route Airspace (FRAM) concept starting in 2011. With FRAM, 142 additional direct routes will become available and will complement those already introduced as part of the FABEC Night Route Network programme. At (pre) tactical level, MUAC air traffic controllers usually offer direct routes when available. FRAM will allow these routes to be flight planned, which generate significant advantages such as better flight and network predictability, better flight efficiency, reduced fuel carriage, higher cost-effectiveness and reduced environmental impact. FRAM also
[18], Netherlands Performance Plan (annex to FABEC PP) version 1.0.
provides an initial operational validation for conceptual elements of the SESAR ATM Target Concept. It is therefore a first step towards the implementation of aircraft operators’ preferred business trajectories.
2.2. Cost efficiency in the FIR AMSTERDAM
General introduction The FABEC States Strategic Board (SSB) has decided that for the first reference period the provisional FABEC Performance Plan (FPP) will focus on the KPAs of Safety, Environment, Capacity and Military Mission Effectiveness. The KPA on Cost Efficiency and the possible interrelations of this KPA with the other KPAs will not be included in the FABEC Plan, but in the separate national Performance Plans. Therefore, the Dutch Performance Plan will focus on the following issues: the determined costs for en route and the costs for terminal air navigation services on a full cost
recovery basis as well as possible cost reductions; the forecast of the traffic volume (en route service units) for each year of the reference period.
As a consequence, the determined unit rates for the reference period, which are related to these costs and tariff issue raises the following issues to be dealt with: a description and justification of the return on equity of the air navigation service providers in
relation to the actual risk incurred; a description of the investments necessary to achieve the performance targets in relation to:
v their relevance with the European ATM Master Plan; v their coherence with the main areas and directions of progress and change as set in that plan.
2.2.1 General principles governing the determined ANS (en route and terminal) costs
The general principles for the determined ANS costs are mentioned in. Article 15.2(a) and 2(b) of the service provision Regulation (s (EU) No 550/2004, as amended by Regulation (EU) No 1070/2009, set out the principle Commission Regulation of the determined costs. Articles 3.2 and 3.3 of the Charging Regulation (EU) No 1794/2006, as amended by (EU) No 1191/2010 prescribe that the determined ANS costs shall be financed by means of the charges imposed on the users and/or other revenues. For determined costs of terminal ANS the other revenues may include cross-subsidies in accordance with Community law. Article 6.1 makes a distinction between the determined costs (to be established in accordance with Article 15 of the Service Provision Regulation and for performance purposes) and the actual costs (to be established for charging purposes). Determined costs are defined by the European Commission as the costs that are considered necessary in each of the years of the Performance Plan reference period to deliver the forecasted number of service units, given the level of the targets for capacity and environment while assuming the safety level will remain at least the same. In both cost concepts the costs shall be composed of eligible services, facilities and activities. The distinction between the determined costs and the actual costs is very clear in both the traffic risk volume (Article 11a.1) and the cost risk (Article 11a.2). The determined cost level shall be fixed for each year of the performance reference period before the start of that period. This is in line with Article 15.3(c) of Regulation (EU) No 550/2004, which specifies that the charges shall be set in advance per calendar year on the basis of the determined costs, or may be set under conditions established by Member States for determining the maximum level of the unit rate or the maximum revenue for each year over a period not exceeding five years. MUAC For MUAC specific financial arrangements have been agreed upon and are included in the financial protocol to the Maastricht Agreement. It stipulates that the investment expenditure shall be covered by a special annex in the Eurocontrol budget and balanced by receipts from the German Ministry of Defence for the military part of the investment expenditure, on the one hand, and by receipts from route charges, on the other hand. The four national contracting parties therefore include their part of
[19], Netherlands Performance Plan (annex to FABEC PP) version 1.0.
the annual amortization and interest on the Maastricht capital expenditure in their national en route cost bases. The mechanism is cost neutral for the Eurocontrol Member States as a whole. The investment expenses are pre-financed through the Eurocontrol budget (all States) and covered by bank loans but reimbursed (interest costs included) by the 4 contracting States. Operating expenditure in respect of the Maastricht Centre is offset by direct contributions from the four contracting States for the control of General Air Traffic (GAT) and by a special contribution from the German Ministry of Defence for the military part of the operating costs. Although the contributions are calculated and based on the MUAC budget, a correction mechanism ensures that only actual expenses are claimed. The cost-sharing formula applied to the operational expenses as well as to the amortization and interest costs of the capital expenditure (non military part) by the four contracting States is based on the number of air traffic control personnel assigned to the control sectors serving their specific part of the airspace on 1
st January of the budgetary year. For RP1, the four Contracting States agreed this
cost sharing key would be fixed during the whole period 2012-2014. The traffic volume risk will not be not applicable to MUAC in the first reference period as MUAC does not have equity capital. Possibilities to build up equity capital will be looked into during RP1.
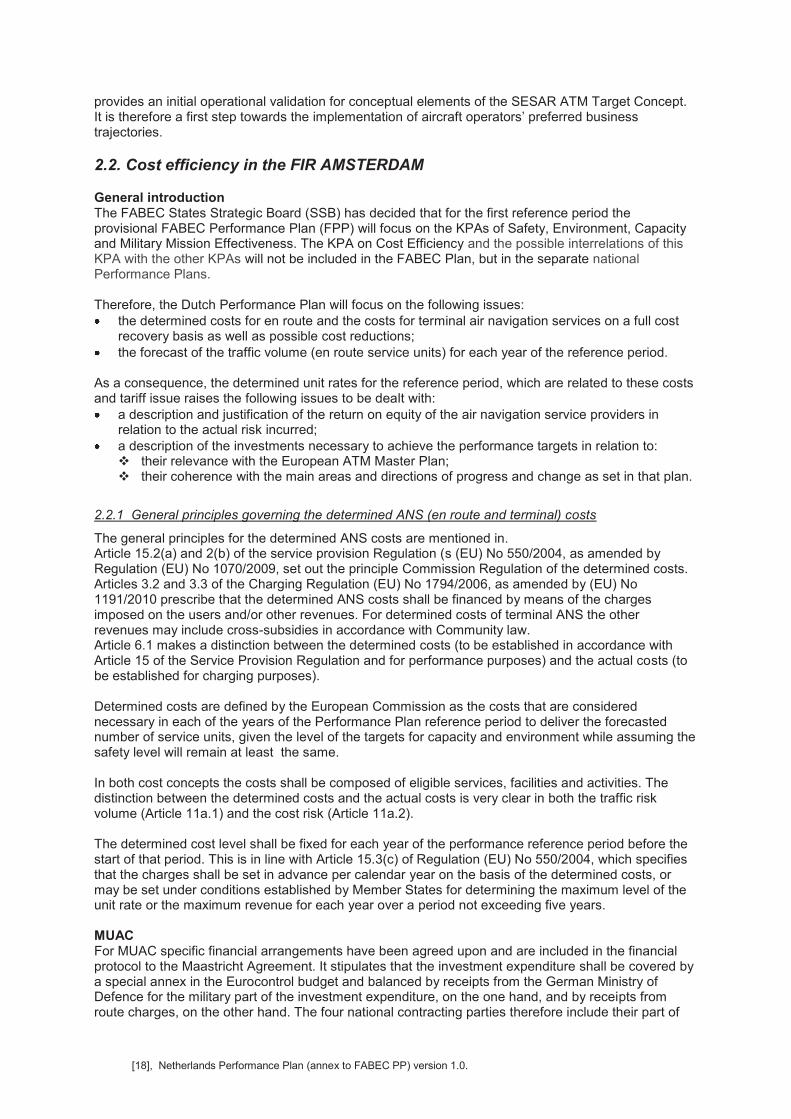
2.2.2a Determined nominal costs for en route ANS for the reference period 2012-2014
The following entities are involved in the en route traffic service provision in the FIR Amsterdam: Air Traffic Control the Netherlands (LVNL) Maastricht Upper Area Control Centre (MUAC) Royal Netherlands Meteorological Institute (KNMI) National Supervisory Authority (NSA) Eurocontrol
The table below contains the determined costs of each of these entities for the en route ANS provision. The MUAC costs are calculated on the basis of the cost sharing keys, which will be valid for the period 2012-2014. An average inflation rate of 2% per year is forecasted (see macro economic scenarios).
ANS en route costs (x 1.000) per entity 2009 A 2010 A 2011 2012 2013 2014
LVNL total costs 123.536
113.993 110.467
108.706
110.070
113.568
%n/n-1 -7,7% -3,1% -1,6% 1,3% 3,2%
MUAC total costs for the Dutch airspace (*) 32.979
31.065
29.354
31.843
33.059
34.505
%n/n-1 -5,8% -5,5% 8,5% 3,8% 4,4%
KNMI MET 9.019
8.033 7.872
7.708
7.544
7.544
%n/n-1 -10,9% -2,0% -2,1% -2,1% 0,0%
NSA (incl. other State costs) - -
1.462
1.862
1.862
1.862
%n/n-1 27,4% 0,0% 0,0%
Eurocontrol 14.092
16.083
16.508
15.707
15.802
16.154
%n/n-1 14,1% 2,6% -4,9% 0,6% 2,2%
Total ANS en route costs (x 1.000) in FIR Amsterdam
179.626 169.174 165.663
165.826 168.337 173.633
%n/n-1 -5,8% -2,1% 0,1% 1,5% 3,1%
(*)This figure represents the MUAC costs for the Dutch airspace and is influenced by application of an agreed cost sharing key.
Table 5. Determined en route nominal costs (x € 1.000) in FIR Amsterdam – breakdown per entity
[20], Netherlands Performance Plan (annex to FABEC PP) version 1.0.
Figure 1. Determined en route nominal costs (x € 1.000) in FIR Amsterdam – breakdown per entity
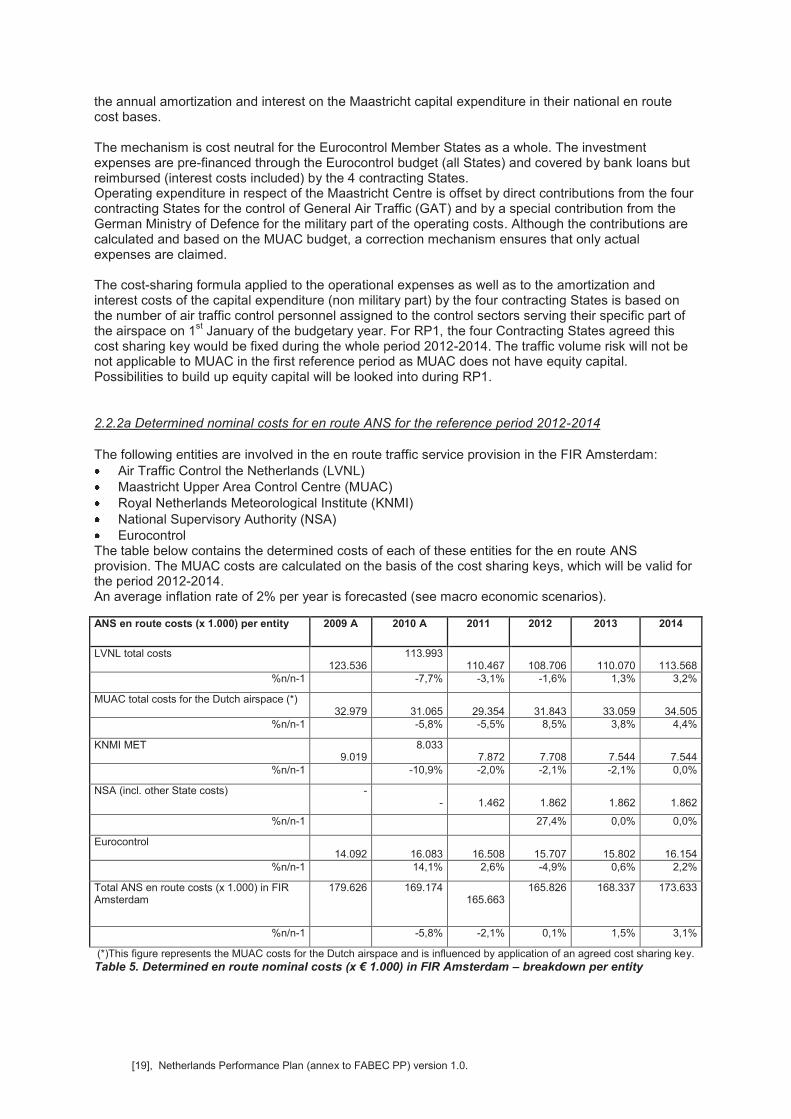
In line with Article 6.1(a) of Regulation (EC) 1794/2006 the following costs are included in the determined en route costs for the first reference period Staff costs Other operating costs Depreciation costs Interest costs Exceptional items
The table below contains the cost data for the en route ATS provision broken down by nature.
ANS en route costs (x 1.000) by nature 2009 A 2010 A 2011 2012 2013 2014
Staff costs
123.061
107.521
105.377
106.360
109.521
113.490
%n/n-1 -12,6% -2,0% 0,9% 3,0% 3,6%
Other operating costs
27.799
31.601
29.444
30.663
30.036
30.504
%n/n-1 13,7% -6,8% 4,1% -2,0% 1,6%
Depreciation
11.487
10.488
11.167
10.212
10.681
11.235
%n/n-1 -8,7% 6,5% -8,5% 4,6% 5,2%
Interest
3.187
3.481
3.166
2.884
2.296
2.250
%n/n-1 9,2% -9,0% -8,9% -20,4% -2,0%
Eurocontrol costs
14.092
16.083
16.508
15.707
15.802
16.154
%n/n-1 14,1% 2,6% -4,9% 0,6% 2,2%
Exceptional items
-
-
-
-
-
-
%n/n-1 Total ANS costs by nature
179.626
169.174
165.663
165.826
168.337
173.633
%n/n-1 -5,8% -2,1% 0,1% 1,5% 3,1%
Table 6: Determined en route nominal costs (x € 1.000) in FIR Amsterdam – breakdown by nature
[21], Netherlands Performance Plan (annex to FABEC PP) version 1.0.
Figure 2. Determined en route nominal costs (x € 1.000) in FIR Amsterdam – breakdown by nature
In the table below the main cost changes and adjustments outside the International Accounting Standards are given for each organization, including those having a significant impact on the overall costs. Major reallocations of ANS costs to the en-route and terminal activities have not taken place since 2008 and are not foreseen before the end of RP1. Based on the use of the facilities for either en route or terminal traffic only marginal changes in the allocation sharing keys have been implemented. Changes in year N are based on the actual allocation of resources in year N-2. Costs by nature
LVNL MUAC KNMI Eurocontrol
Staff costs 2012: no real wage increase
2013 and 2014: 1.5% annually real wage increase
Career progression
Salary index: 2.5% nominal or 0.5% real
Career progression: 1.1%
2012: zero-growth of salaries (no compensation)
Salary index: 2.5% nominal or 0.5% real
Career progression: 1.1%
Other operating expenses
Annual inflation rate 2%
Annual inflation rate 2%
Annual inflation rate 2%
Depreciation Interests Exceptional items
Expiry of ATCO lease to Vienna at the end of 2013
Table 7. Information on changes in the costs by nature
2.2.2b Determined en-route ANS costs in real terms
The different elements of the conversion of the determined en route costs from nominal terms into real terms are indicated in the table below, including a justification of the rationale for the national average inflation assumption and a link to public official sources. Based on the economic forecasts of the CPB Economic Policy Analysis, the inflation rate has been set at 2% per year. As the depreciation costs of LVNL, KNMI and MUAC are determined on the basis of the historic value (historic capitalization costs), depreciation costs are not related to the inflation rate. Interest costs are not related to inflation. Thus, the inflation rate is corrected for the depreciation costs and the interest costs. If these costs are equal to for instance 20% of the total costs, the weighted average inflation rate is 20% below the assumed originally used inflation rate.
[22], Netherlands Performance Plan (annex to FABEC PP) version 1.0.
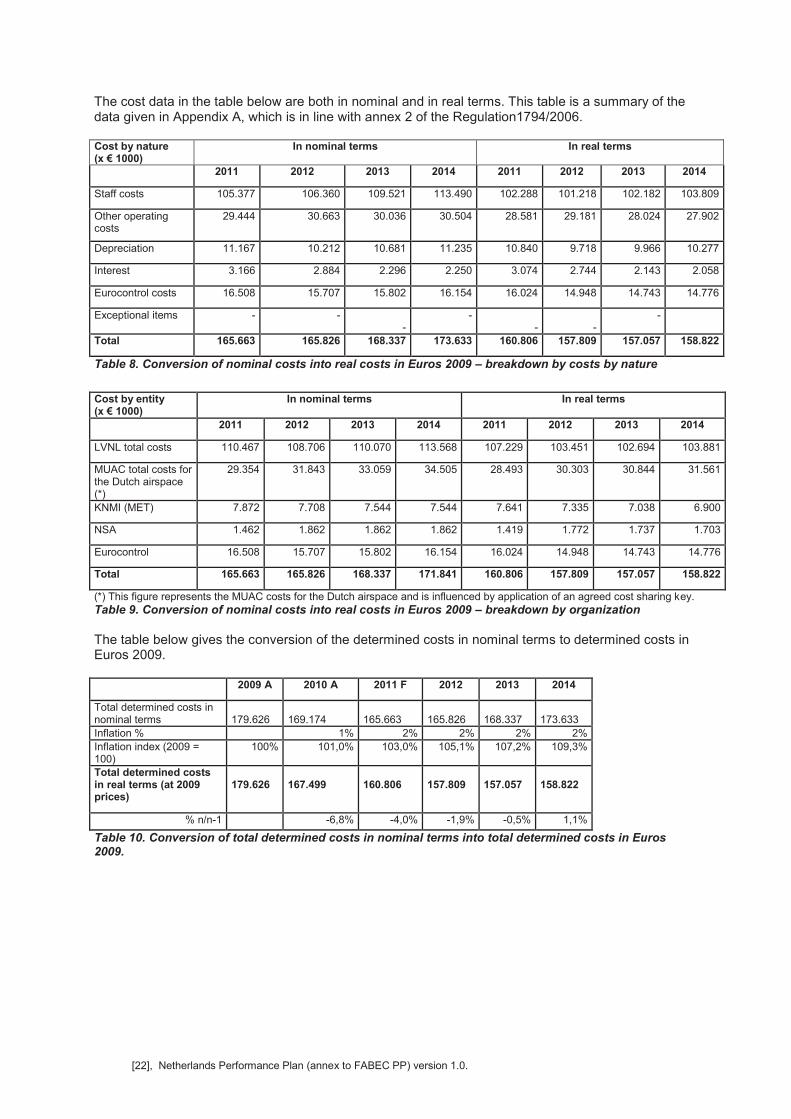
The cost data in the table below are both in nominal and in real terms. This table is a summary of the data given in Appendix A, which is in line with annex 2 of the Regulation1794/2006. Cost by nature (x € 1000)
In nominal terms In real terms
2011 2012 2013 2014 2011 2012 2013 2014
Staff costs 105.377 106.360 109.521 113.490 102.288 101.218 102.182 103.809
Other operating costs
29.444 30.663 30.036 30.504 28.581 29.181 28.024 27.902
Depreciation 11.167 10.212 10.681 11.235 10.840 9.718 9.966 10.277
Interest 3.166 2.884 2.296 2.250 3.074 2.744 2.143 2.058
Eurocontrol costs 16.508 15.707 15.802 16.154 16.024 14.948 14.743 14.776
Exceptional items - - -
- -
-
-
Total 165.663 165.826 168.337 173.633 160.806 157.809 157.057 158.822
Table 8. Conversion of nominal costs into real costs in Euros 2009 – breakdown by costs by nature
Cost by entity (x € 1000)
In nominal terms In real terms
2011 2012 2013 2014 2011 2012 2013 2014
LVNL total costs 110.467 108.706 110.070 113.568 107.229 103.451 102.694 103.881
MUAC total costs for the Dutch airspace (*)
29.354 31.843 33.059 34.505 28.493 30.303 30.844 31.561
KNMI (MET) 7.872 7.708 7.544 7.544 7.641 7.335 7.038 6.900
NSA 1.462 1.862 1.862 1.862 1.419 1.772 1.737 1.703
Eurocontrol 16.508 15.707 15.802 16.154 16.024 14.948 14.743 14.776
Total 165.663 165.826 168.337 171.841 160.806 157.809 157.057 158.822
(*) This figure represents the MUAC costs for the Dutch airspace and is influenced by application of an agreed cost sharing key.
Table 9. Conversion of nominal costs into real costs in Euros 2009 – breakdown by organization
The table below gives the conversion of the determined costs in nominal terms to determined costs in Euros 2009. 2009 A 2010 A 2011 F 2012 2013 2014
Total determined costs in nominal terms
179.626
169.174
165.663
165.826
168.337
173.633
Inflation % 1% 2% 2% 2% 2%
Inflation index (2009 = 100)
100% 101,0% 103,0% 105,1% 107,2% 109,3%
Total determined costs in real terms (at 2009 prices)
179.626
167.499
160.806
157.809
157.057
158.822
% n/n-1 -6,8% -4,0% -1,9% -0,5% 1,1%
Table 10. Conversion of total determined costs in nominal terms into total determined costs in Euros 2009.
[23], Netherlands Performance Plan (annex to FABEC PP) version 1.0.
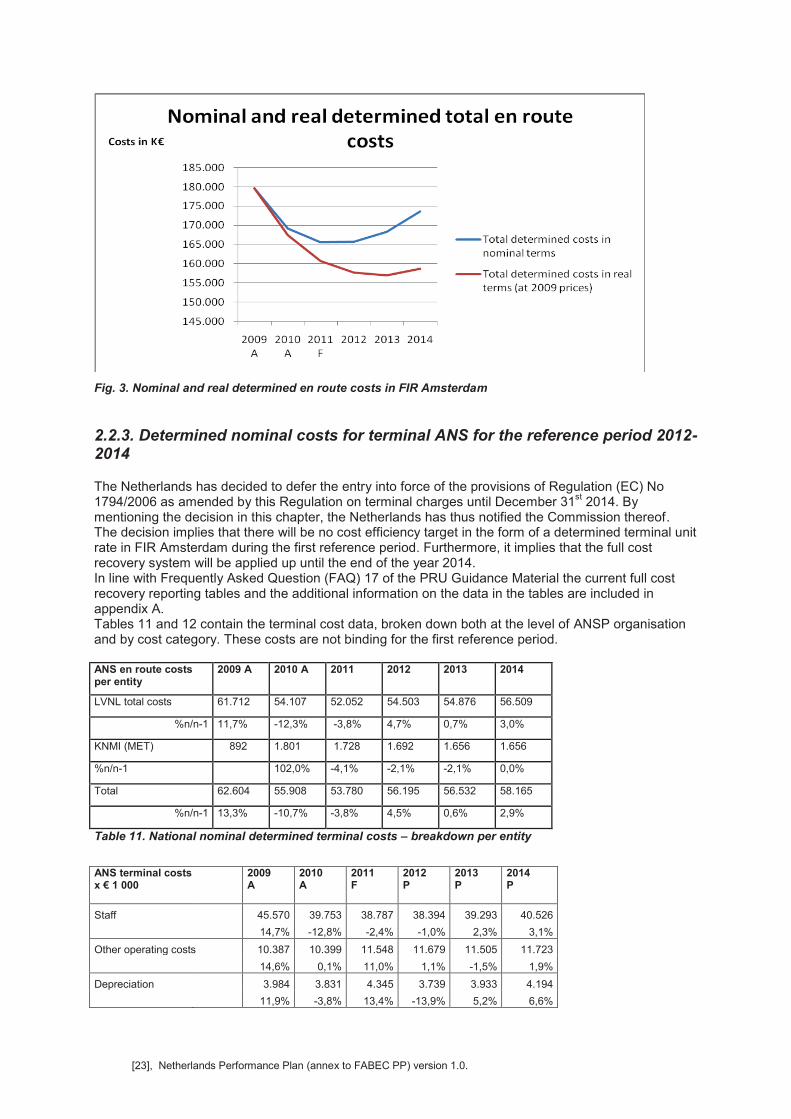
Fig. 3. Nominal and real determined en route costs in FIR Amsterdam
2.2.3. Determined nominal costs for terminal ANS for the reference period 2012-2014
The Netherlands has decided to defer the entry into force of the provisions of Regulation (EC) No 1794/2006 as amended by this Regulation on terminal charges until December 31
st 2014. By
mentioning the decision in this chapter, the Netherlands has thus notified the Commission thereof.The decision implies that there will be no cost efficiency target in the form of a determined terminal unit rate in FIR Amsterdam during the first reference period. Furthermore, it implies that the full cost recovery system will be applied up until the end of the year 2014. In line with Frequently Asked Question (FAQ) 17 of the PRU Guidance Material the current full cost recovery reporting tables and the additional information on the data in the tables are included in appendix A. Tables 11 and 12 contain the terminal cost data, broken down both at the level of ANSP organisation and by cost category. These costs are not binding for the first reference period. ANS en route costs per entity
2009 A 2010 A 2011 2012 2013 2014
LVNL total costs 61.712 54.107 52.052 54.503 54.876 56.509
%n/n-1 11,7% -12,3% -3,8% 4,7% 0,7% 3,0%
KNMI (MET) 892 1.801 1.728 1.692 1.656 1.656
%n/n-1 102,0% -4,1% -2,1% -2,1% 0,0%
Total 62.604 55.908 53.780 56.195 56.532 58.165
%n/n-1 13,3% -10,7% -3,8% 4,5% 0,6% 2,9%
Table 11. National nominal determined terminal costs – breakdown per entity
ANS terminal costs x € 1 000
2009 A
2010 A
2011 F
2012 P
2013 P
2014 P
Staff 45.570 39.753 38.787 38.394 39.293 40.526
14,7% -12,8% -2,4% -1,0% 2,3% 3,1%
Other operating costs 10.387 10.399 11.548 11.679 11.505 11.723
14,6% 0,1% 11,0% 1,1% -1,5% 1,9%
Depreciation 3.984 3.831 4.345 3.739 3.933 4.194
11,9% -3,8% 13,4% -13,9% 5,2% 6,6%
[24], Netherlands Performance Plan (annex to FABEC PP) version 1.0.
ANS terminal costs x € 1 000
2009 A
2010 A
2011 F
2012 P
2013 P
2014 P
Cost of capital 2.662 1.925 2.741 2.383 1.801 1.722
-8,8% -27,7% 42,4% -13,1% -24,4% -4,4%
Exceptional items 0 0 -3.641 0 0 0
Total costs 62.604 55.908 53.780 56.195 56.532 58.165
13,3% -10,7% -3,8% 4,5% 0,6% 2,9%
Table 12. National nominal determined terminal costs – breakdown by nature
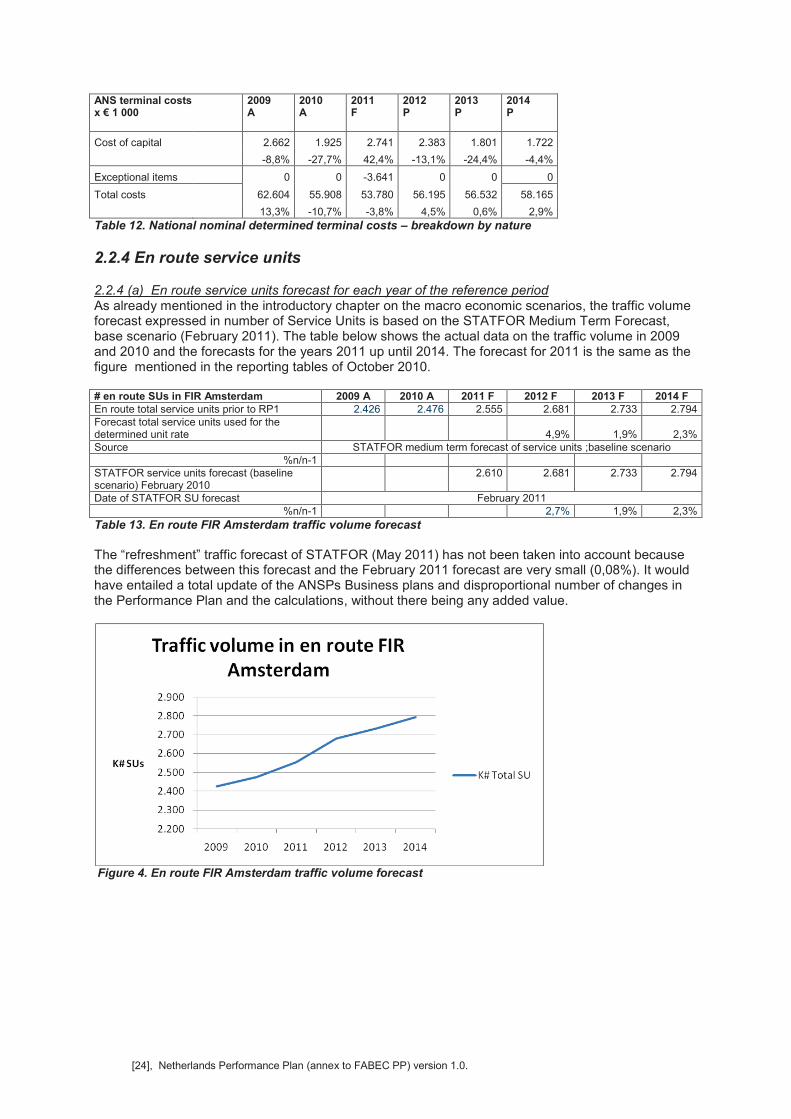
2.2.4 En route service units
2.2.4 (a) En route service units forecast for each year of the reference period As already mentioned in the introductory chapter on the macro economic scenarios, the traffic volume forecast expressed in number of Service Units is based on the STATFOR Medium Term Forecast, base scenario (February 2011). The table below shows the actual data on the traffic volume in 2009 and 2010 and the forecasts for the years 2011 up until 2014. The forecast for 2011 is the same as the figure mentioned in the reporting tables of October 2010. # en route SUs in FIR Amsterdam 2009 A 2010 A 2011 F 2012 F 2013 F 2014 F
En route total service units prior to RP1 2.426 2.476 2.555 2.681 2.733 2.794 Forecast total service units used for the determined unit rate
4,9% 1,9% 2,3%
Source STATFOR medium term forecast of service units ;baseline scenario %n/n-1
STATFOR service units forecast (baseline scenario) February 2010
2.610 2.681 2.733 2.794
Date of STATFOR SU forecast February 2011 %n/n-1 2,7% 1,9% 2,3%
Table 13. En route FIR Amsterdam traffic volume forecast
The “refreshment” traffic forecast of STATFOR (May 2011) has not been taken into account because the differences between this forecast and the February 2011 forecast are very small (0,08%). It would have entailed a total update of the ANSPs Business plans and disproportional number of changes in the Performance Plan and the calculations, without there being any added value.
Figure 4. En route FIR Amsterdam traffic volume forecast
[25], Netherlands Performance Plan (annex to FABEC PP) version 1.0.
2.2.4(b) Terminal service units forecast for each year of the reference period Table 14 gives the forecast of the terminal service units.
Table 14. Terminal traffic forecast FIR Amsterdam
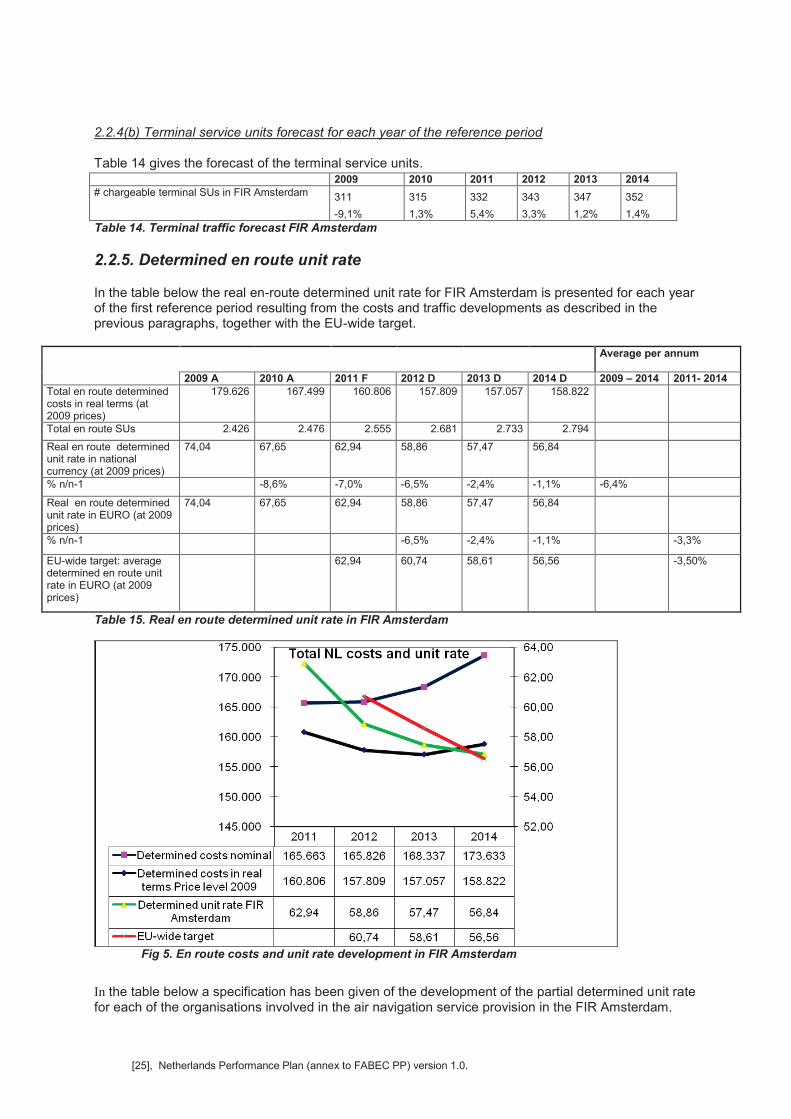
2.2.5. Determined en route unit rate
In the table below the real en-route determined unit rate for FIR Amsterdam is presented for each year of the first reference period resulting from the costs and traffic developments as described in the previous paragraphs, together with the EU-wide target.
Average per annum
2009 A 2010 A 2011 F 2012 D 2013 D 2014 D 2009 – 2014 2011- 2014
Total en route determined costs in real terms (at 2009 prices)
179.626 167.499 160.806 157.809 157.057 158.822
Total en route SUs 2.426 2.476 2.555 2.681 2.733 2.794 Real en route determined unit rate in national currency (at 2009 prices)
74,04 67,65 62,94 58,86 57,47 56,84
% n/n-1 -8,6% -7,0% -6,5% -2,4% -1,1% -6,4%
Real en route determined unit rate in EURO (at 2009 prices)
74,04 67,65 62,94 58,86 57,47 56,84
% n/n-1 -6,5% -2,4% -1,1%
-3,3%
EU-wide target: average determined en route unit rate in EURO (at 2009 prices)
62,94 60,74 58,61 56,56
-3,50%
Table 15. Real en route determined unit rate in FIR Amsterdam
Fig 5. En route costs and unit rate development in FIR Amsterdam
In the table below a specification has been given of the development of the partial determined unit rate for each of the organisations involved in the air navigation service provision in the FIR Amsterdam.
2009 2010 2011 2012 2013 2014
# chargeable terminal SUs in FIR Amsterdam 311 315 332 343 347 352 -9,1% 1,3% 5,4% 3,3% 1,2% 1,4%
[26], Netherlands Performance Plan (annex to FABEC PP) version 1.0.
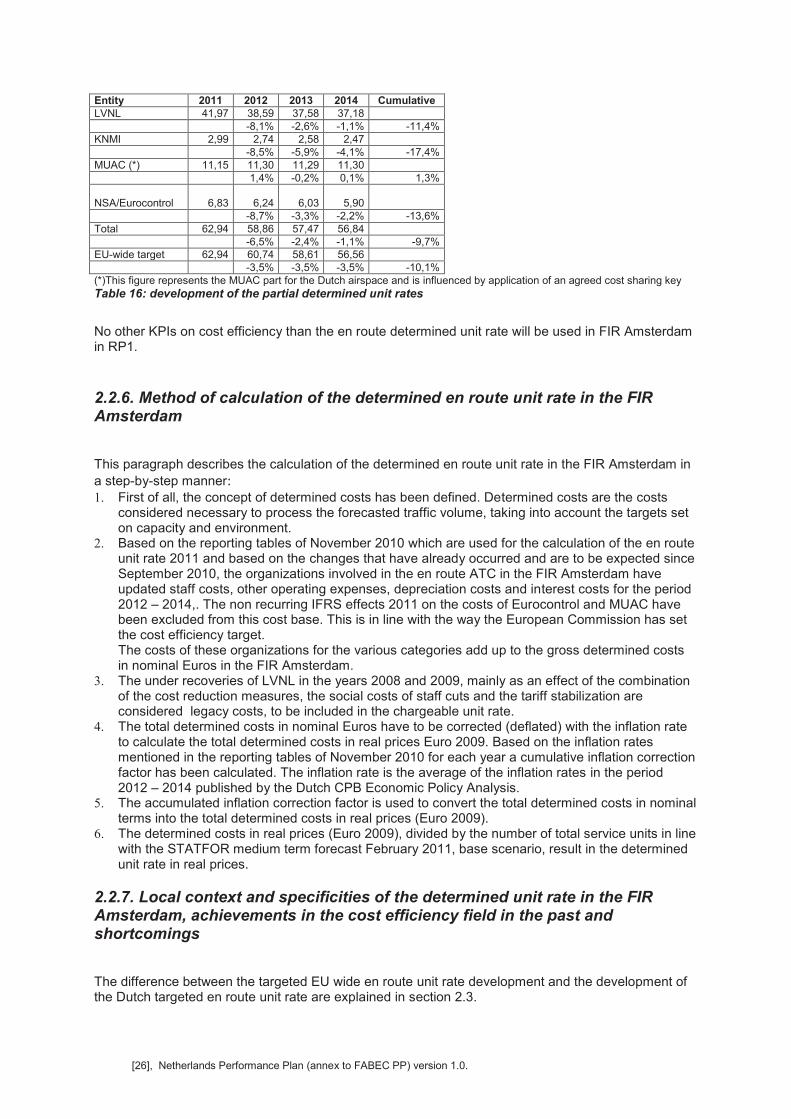
Entity 2011 2012 2013 2014 Cumulative
LVNL 41,97 38,59 37,58 37,18 -8,1% -2,6% -1,1% -11,4% KNMI 2,99 2,74 2,58 2,47 -8,5% -5,9% -4,1% -17,4% MUAC (*) 11,15 11,30 11,29 11,30 1,4% -0,2% 0,1% 1,3%
NSA/Eurocontrol
6,83
6,24
6,03
5,90 -8,7% -3,3% -2,2% -13,6% Total 62,94 58,86 57,47 56,84 -6,5% -2,4% -1,1% -9,7% EU-wide target 62,94 60,74 58,61 56,56 -3,5% -3,5% -3,5% -10,1% (*)This figure represents the MUAC part for the Dutch airspace and is influenced by application of an agreed cost sharing key
Table 16: development of the partial determined unit rates
No other KPIs on cost efficiency than the en route determined unit rate will be used in FIR Amsterdam in RP1.
2.2.6. Method of calculation of the determined en route unit rate in the FIR Amsterdam
This paragraph describes the calculation of the determined en route unit rate in the FIR Amsterdam in
a step-by-step manner:
1. First of all, the concept of determined costs has been defined. Determined costs are the costs considered necessary to process the forecasted traffic volume, taking into account the targets set on capacity and environment.
2. Based on the reporting tables of November 2010 which are used for the calculation of the en route unit rate 2011 and based on the changes that have already occurred and are to be expected since September 2010, the organizations involved in the en route ATC in the FIR Amsterdam have updated staff costs, other operating expenses, depreciation costs and interest costs for the period 2012 – 2014,. The non recurring IFRS effects 2011 on the costs of Eurocontrol and MUAC have been excluded from this cost base. This is in line with the way the European Commission has set the cost efficiency target. The costs of these organizations for the various categories add up to the gross determined costs in nominal Euros in the FIR Amsterdam.
3. The under recoveries of LVNL in the years 2008 and 2009, mainly as an effect of the combination of the cost reduction measures, the social costs of staff cuts and the tariff stabilization are considered legacy costs, to be included in the chargeable unit rate.
4. The total determined costs in nominal Euros have to be corrected (deflated) with the inflation rate to calculate the total determined costs in real prices Euro 2009. Based on the inflation rates mentioned in the reporting tables of November 2010 for each year a cumulative inflation correction factor has been calculated. The inflation rate is the average of the inflation rates in the period 2012 – 2014 published by the Dutch CPB Economic Policy Analysis.
5. The accumulated inflation correction factor is used to convert the total determined costs in nominal terms into the total determined costs in real prices (Euro 2009).
6. The determined costs in real prices (Euro 2009), divided by the number of total service units in line with the STATFOR medium term forecast February 2011, base scenario, result in the determined unit rate in real prices.
2.2.7. Local context and specificities of the determined unit rate in the FIR Amsterdam, achievements in the cost efficiency field in the past and shortcomings
The difference between the targeted EU wide en route unit rate development and the development of the Dutch targeted en route unit rate are explained in section 2.3.
[27], Netherlands Performance Plan (annex to FABEC PP) version 1.0.
2.2.8. Description and justification of the return on equity of the air navigation service providers in relation to the actual risk incurred.
As LVNL will become subject to the traffic volume risk and the cost risk mechanisms, the building up of an equity capital is considered necessary to absorb fluctuations in operating results. The method of building up equity capital is subject to consultation. No capital costs will be included in the chargeable unit rate in the first reference period.
2.2.9. National alert thresholds Both the traffic volume alert threshold and the cost alert threshold have been set at 10%. There is no reason for deviation from the threshold level mentioned in Article 2 of the Commission Decision of 21 February 20114.
2.2.10. Description of investments necessary to achieve the performance targets with a description of their relevance in relation to the European ATM Masterplan and their coherence with the main areas and directions of progress and change set out therein.
Appendix C shows the investments of LVNL, MUAC and KNMI required to achieve the performance targets, including their relevance in relation to the European ATM Master Plan
5 and their coherence
with the main areas and directions of progress and change set out therein. Where possible, an indication is given of the nature of this relationship, by classifying the investments into ATM Master Plan Operational Improvement (OIs), Interoperability Implementing Rules (IR) and Community Specifications (CS).
2.2.11. Description and justification of the measures planned to achieve a lower proportion of debt financing and their timing. Equity capital LVNL It was decided to apply the volume risk as of the first reference period despite a lack of equity. During the first reference period (RP1) of the Performance Plan LVNL aims to build up an equity capital to meet the traffic volume risk. The aim is to have built up an equity capital of M€ 22 at the end of the first reference period. Rationale At the moment LVNL is fully debt financed. It has no equity capital to absorb negative operating results. Due to the absence of any equity capital and the negative en route and terminal appropriation funds (together about M€ 35 at the end of 2010) LVNL is already nearing the limits of a sound financial situation. Continuation of the current situation could lead to possible non compliance with the Common Requirements on financial strength (and could thus possibly jeopardize LVNL’s certification), even in a full cost recovery situation. Exposure to the newly introduced traffic volume risk and cost risk will further deteriorate LVNL’s financial risk profile. In the EU Regulation 1794/2010, laying down a common charging scheme, amended by EU Regulation 1191/2010, the necessity of equity capital is acknowledged. Article 11a.7 allows ANSPs with an equity capital below 5% of total liabilities to be temporarily exempted from the traffic volume risk. If the traffic risk is exempted the Performance Plan has to include a description of the measures to achieve a lower proportion of debt financing as well as the duration of these measures. The Netherlands has opted for an arrangement under which LVNL is given the opportunity to build up equity capital during the first reference period, while at the same time being exposed to the traffic volume risk. This combination is more advantageous for the users than the building up of an equalization provision without the application of the traffic volume risk, as the traffic volume risk scheme possibly gives them 70% of the additional revenues (in case of a traffic volume increase
4 COM 2011/121/EU Commission Decision of 21 February 2011 setting the European-wide performance targets and alert thresholds for the provision of air navigation services for the years 2012 to 2014. 5 More details on the European ATM Masterplan is available at: www.atmmasterplan.eu
[28], Netherlands Performance Plan (annex to FABEC PP) version 1.0.
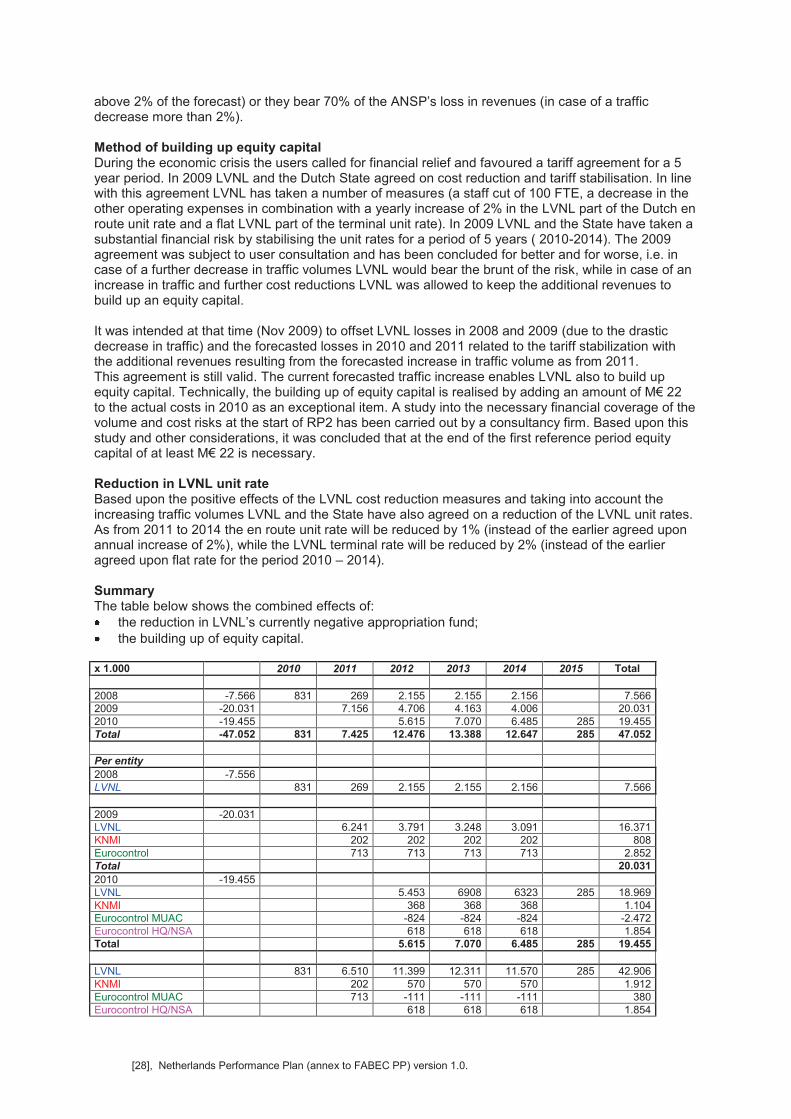
above 2% of the forecast) or they bear 70% of the ANSP’s loss in revenues (in case of a traffic decrease more than 2%). Method of building up equity capital During the economic crisis the users called for financial relief and favoured a tariff agreement for a 5 year period. In 2009 LVNL and the Dutch State agreed on cost reduction and tariff stabilisation. In line with this agreement LVNL has taken a number of measures (a staff cut of 100 FTE, a decrease in the other operating expenses in combination with a yearly increase of 2% in the LVNL part of the Dutch en route unit rate and a flat LVNL part of the terminal unit rate). In 2009 LVNL and the State have taken a substantial financial risk by stabilising the unit rates for a period of 5 years ( 2010-2014). The 2009 agreement was subject to user consultation and has been concluded for better and for worse, i.e. in case of a further decrease in traffic volumes LVNL would bear the brunt of the risk, while in case of an increase in traffic and further cost reductions LVNL was allowed to keep the additional revenues to build up an equity capital. It was intended at that time (Nov 2009) to offset LVNL losses in 2008 and 2009 (due to the drastic decrease in traffic) and the forecasted losses in 2010 and 2011 related to the tariff stabilization with the additional revenues resulting from the forecasted increase in traffic volume as from 2011. This agreement is still valid. The current forecasted traffic increase enables LVNL also to build up equity capital. Technically, the building up of equity capital is realised by adding an amount of M€ 22 to the actual costs in 2010 as an exceptional item. A study into the necessary financial coverage of the volume and cost risks at the start of RP2 has been carried out by a consultancy firm. Based upon this study and other considerations, it was concluded that at the end of the first reference period equity capital of at least M€ 22 is necessary. Reduction in LVNL unit rate Based upon the positive effects of the LVNL cost reduction measures and taking into account the increasing traffic volumes LVNL and the State have also agreed on a reduction of the LVNL unit rates. As from 2011 to 2014 the en route unit rate will be reduced by 1% (instead of the earlier agreed upon annual increase of 2%), while the LVNL terminal rate will be reduced by 2% (instead of the earlier agreed upon flat rate for the period 2010 – 2014). Summary The table below shows the combined effects of: the reduction in LVNL’s currently negative appropriation fund; the building up of equity capital.
x 1.000 2010 2011 2012 2013 2014 2015 Total
2008 -7.566 831 269 2.155 2.155 2.156 7.566 2009 -20.031 7.156 4.706 4.163 4.006 20.031 2010 -19.455 5.615 7.070 6.485 285 19.455 Total -47.052 831 7.425 12.476 13.388 12.647 285 47.052
Per entity
2008 -7.556 LVNL 831 269 2.155 2.155 2.156 7.566
2009 -20.031 LVNL 6.241 3.791 3.248 3.091 16.371 KNMI 202 202 202 202 808 Eurocontrol 713 713 713 713 2.852 Total 20.031
2010 -19.455 LVNL 5.453 6908 6323 285 18.969 KNMI 368 368 368 1.104 Eurocontrol MUAC -824 -824 -824 -2.472 Eurocontrol HQ/NSA 618 618 618 1.854 Total 5.615 7.070 6.485 285 19.455
LVNL 831 6.510 11.399 12.311 11.570 285 42.906 KNMI 202 570 570 570 1.912 Eurocontrol MUAC 713 -111 -111 -111 380 Eurocontrol HQ/NSA 618 618 618 1.854
[29], Netherlands Performance Plan (annex to FABEC PP) version 1.0.
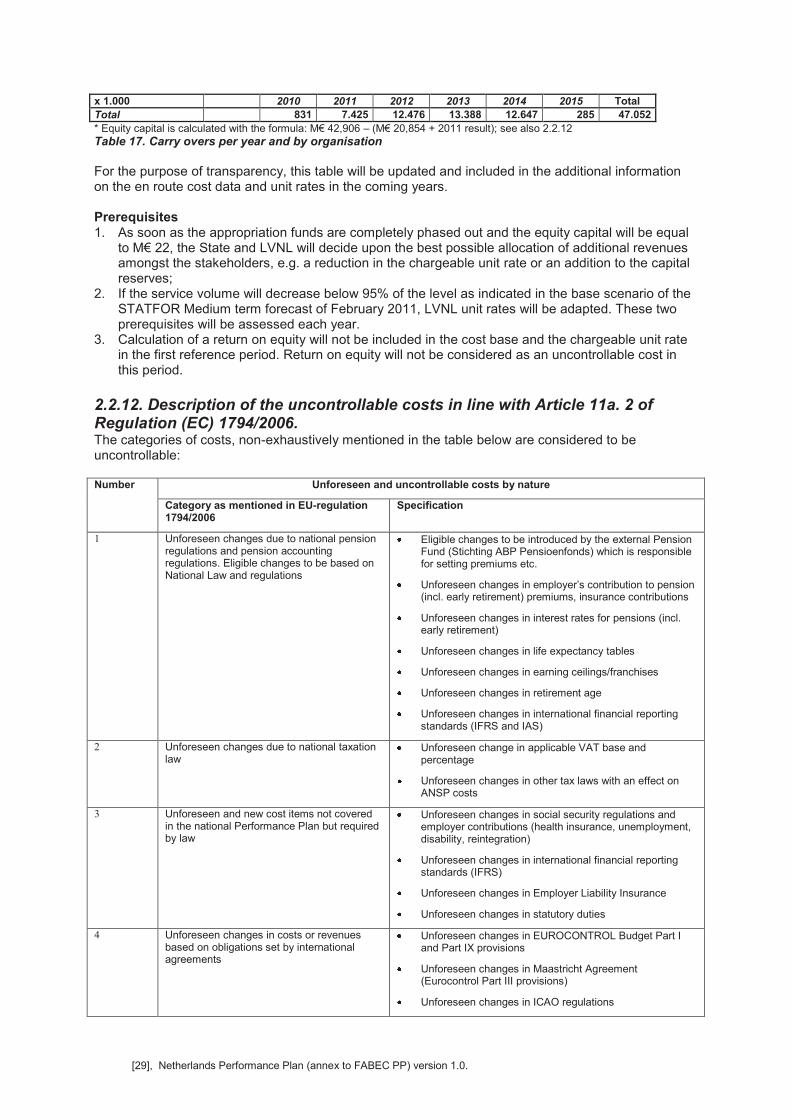
x 1.000 2010 2011 2012 2013 2014 2015 Total
Total 831 7.425 12.476 13.388 12.647 285 47.052
* Equity capital is calculated with the formula: M€ 42,906 – (M€ 20,854 + 2011 result); see also 2.2.12
Table 17. Carry overs per year and by organisation
For the purpose of transparency, this table will be updated and included in the additional information on the en route cost data and unit rates in the coming years. Prerequisites 1. As soon as the appropriation funds are completely phased out and the equity capital will be equal
to M€ 22, the State and LVNL will decide upon the best possible allocation of additional revenues amongst the stakeholders, e.g. a reduction in the chargeable unit rate or an addition to the capital reserves;
2. If the service volume will decrease below 95% of the level as indicated in the base scenario of the STATFOR Medium term forecast of February 2011, LVNL unit rates will be adapted. These two prerequisites will be assessed each year.
3. Calculation of a return on equity will not be included in the cost base and the chargeable unit rate in the first reference period. Return on equity will not be considered as an uncontrollable cost in this period.
2.2.12. Description of the uncontrollable costs in line with Article 11a. 2 of Regulation (EC) 1794/2006. The categories of costs, non-exhaustively mentioned in the table below are considered to be uncontrollable: Number Unforeseen and uncontrollable costs by nature
Category as mentioned in EU-regulation 1794/2006
Specification
1 Unforeseen changes due to national pension regulations and pension accounting regulations. Eligible changes to be based on National Law and regulations
Eligible changes to be introduced by the external Pension Fund (Stichting ABP Pensioenfonds) which is responsible for setting premiums etc.
Unforeseen changes in employer’s contribution to pension (incl. early retirement) premiums, insurance contributions
Unforeseen changes in interest rates for pensions (incl. early retirement)
Unforeseen changes in life expectancy tables
Unforeseen changes in earning ceilings/franchises
Unforeseen changes in retirement age
Unforeseen changes in international financial reporting standards (IFRS and IAS)
2 Unforeseen changes due to national taxation law
Unforeseen change in applicable VAT base and percentage
Unforeseen changes in other tax laws with an effect on ANSP costs
3 Unforeseen and new cost items not covered in the national Performance Plan but required by law
Unforeseen changes in social security regulations and employer contributions (health insurance, unemployment, disability, reintegration)
Unforeseen changes in international financial reporting standards (IFRS)
Unforeseen changes in Employer Liability Insurance
Unforeseen changes in statutory duties
4 Unforeseen changes in costs or revenues based on obligations set by international agreements
Unforeseen changes in EUROCONTROL Budget Part I and Part IX provisions
Unforeseen changes in Maastricht Agreement (Eurocontrol Part III provisions)
Unforeseen changes in ICAO regulations
[30], Netherlands Performance Plan (annex to FABEC PP) version 1.0.
Number Unforeseen and uncontrollable costs by nature
Category as mentioned in EU-regulation 1794/2006
Specification
Unforeseen changes due to new international states agreements (delegation of airspace, LOAs)
Unforeseen MUAC: changes in OAT cost-sharing agreement
Unforeseen MUAC: changes in financial, contract regulations and staff regulations
5 Significant changes in interest rates on loans Every change
6 Differences from projected inflation rates (in line with Article 6a Regulation 1794/2006 on Common Charging Scheme, amended by Regulation 1191/2010
Including the inflation part of
o salary increases
o increases in pension (incl. early retirement) premiums
Table 18: Uncontrollable costs by nature
General salary increases resulting from direct negations between unions and ANSP or ANSP related organisations (MUAC exempted) are not considered as uncontrollable costs.
2.2.13. EU wide PIs on cost efficiency
The following EU wide PIs will be monitored during RP1: 1. Determined en route cost/revenue
This indicator provides information about the effectiveness of the ANSPs’ cost management. 2. Total en route cost per flight hour:
This indicator gives insight into degree of productivity development of the ANSPs. This PI is only meant for monitoring purposes and contains no forward looking information.
3. Total economic cost per flight hour: This indicator gives information on all relevant costs related to ANS, not only the costs of the service provision itself, but also the costs of delays and environmental costs. Thus, this indicator gives an idea of the overall ANS performance in financial terms. This PI is only meant for monitoring purposes and contains no forward looking information.
4. Terminal air navigation services costs and unit rates (see also in section 2.2.11). The differences between the forecasted and the actual terminal air navigation costs and unit rate will be explained to the Commission. This PI has to be monitored because the Commission intends to set a target on the terminal air navigation service unit rates in the second reference period. This PI will be used as a EU wide KPI in RP2. The terminal air navigation costs and unit rate are currently reported once a year to the Commission. The current reporting cycle will be continued.
2.2.14. KPIs on cost efficiency to be used in the second reference period The determined
Terminal Unit rate shall be monitored in the first reference period in preparation of its introduction as KPI in the second reference period.
2.2.15. Reporting tables:
Reporting tables for the costs and unit rate are included in Appendix A. En route: Reporting tables and additional information. Terminal:
Reporting tables and additional information.
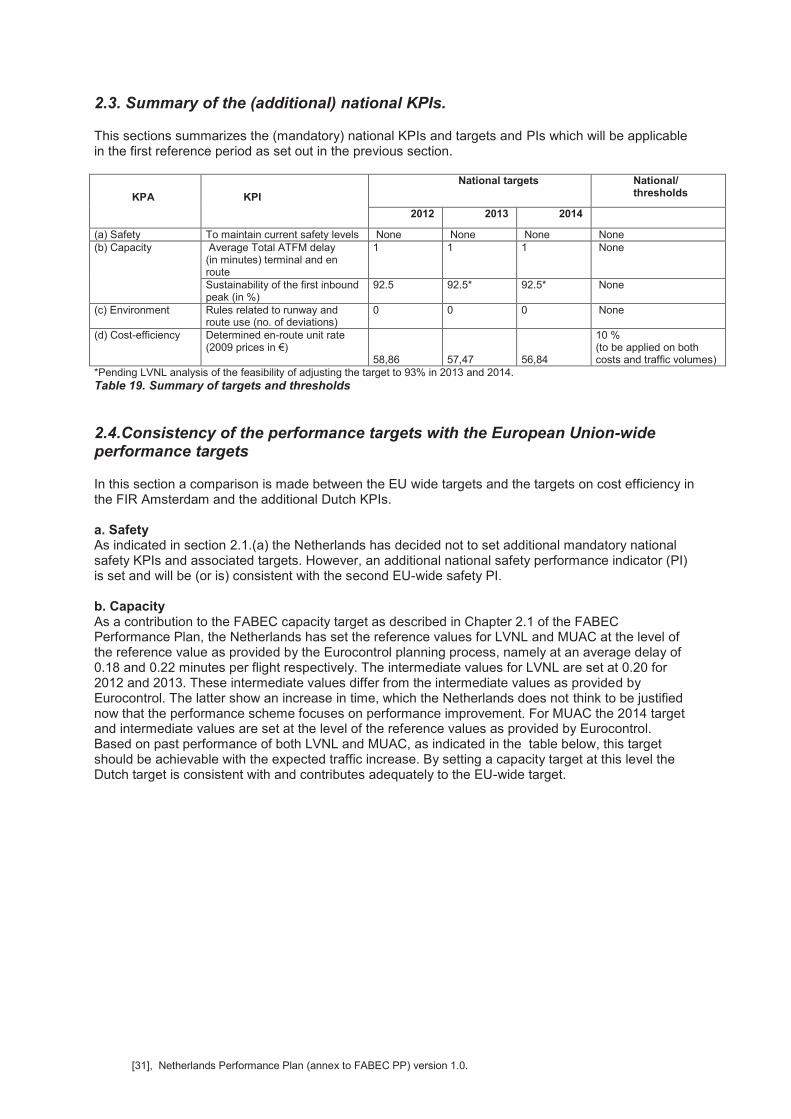
[31], Netherlands Performance Plan (annex to FABEC PP) version 1.0.
2.3. Summary of the (additional) national KPIs.
This sections summarizes the (mandatory) national KPIs and targets and PIs which will be applicable in the first reference period as set out in the previous section.
KPA KPI
National targets National/ thresholds
2012 2013 2014
(a) Safety To maintain current safety levels None None None None (b) Capacity Average Total ATFM delay
(in minutes) terminal and en route
1 1 1 None
Sustainability of the first inbound peak (in %)
92.5 92.5* 92.5* None
(c) Environment Rules related to runway and route use (no. of deviations)
0 0 0 None
(d) Cost-efficiency Determined en-route unit rate (2009 prices in €)
58,86 57,47 56,84
10 % (to be applied on both costs and traffic volumes)
*Pending LVNL analysis of the feasibility of adjusting the target to 93% in 2013 and 2014.
Table 19. Summary of targets and thresholds
2.4.Consistency of the performance targets with the European Union-wide performance targets
In this section a comparison is made between the EU wide targets and the targets on cost efficiency in the FIR Amsterdam and the additional Dutch KPIs. a. Safety As indicated in section 2.1.(a) the Netherlands has decided not to set additional mandatory national safety KPIs and associated targets. However, an additional national safety performance indicator (PI) is set and will be (or is) consistent with the second EU-wide safety PI. b. Capacity As a contribution to the FABEC capacity target as described in Chapter 2.1 of the FABEC Performance Plan, the Netherlands has set the reference values for LVNL and MUAC at the level of the reference value as provided by the Eurocontrol planning process, namely at an average delay of 0.18 and 0.22 minutes per flight respectively. The intermediate values for LVNL are set at 0.20 for 2012 and 2013. These intermediate values differ from the intermediate values as provided by Eurocontrol. The latter show an increase in time, which the Netherlands does not think to be justified now that the performance scheme focuses on performance improvement. For MUAC the 2014 target and intermediate values are set at the level of the reference values as provided by Eurocontrol. Based on past performance of both LVNL and MUAC, as indicated in the table below, this target should be achievable with the expected traffic increase. By setting a capacity target at this level the Dutch target is consistent with and contributes adequately to the EU-wide target.
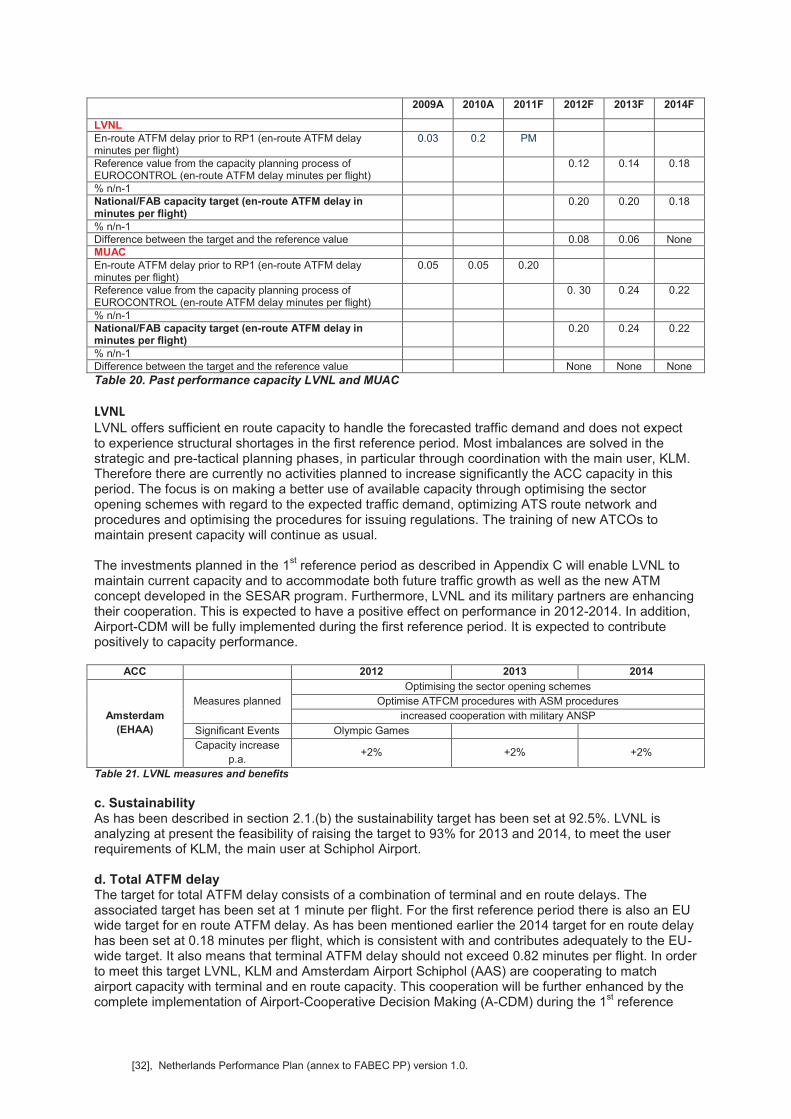
[32], Netherlands Performance Plan (annex to FABEC PP) version 1.0.
Table 20. Past performance capacity LVNL and MUAC
LVNL
LVNL offers sufficient en route capacity to handle the forecasted traffic demand and does not expect to experience structural shortages in the first reference period. Most imbalances are solved in the strategic and pre-tactical planning phases, in particular through coordination with the main user, KLM. Therefore there are currently no activities planned to increase significantly the ACC capacity in this period. The focus is on making a better use of available capacity through optimising the sector opening schemes with regard to the expected traffic demand, optimizing ATS route network and procedures and optimising the procedures for issuing regulations. The training of new ATCOs to maintain present capacity will continue as usual. The investments planned in the 1
st reference period as described in Appendix C will enable LVNL to
maintain current capacity and to accommodate both future traffic growth as well as the new ATM concept developed in the SESAR program. Furthermore, LVNL and its military partners are enhancing their cooperation. This is expected to have a positive effect on performance in 2012-2014. In addition, Airport-CDM will be fully implemented during the first reference period. It is expected to contribute positively to capacity performance.
ACC 2012 2013 2014
Amsterdam
(EHAA)
Measures planned
Optimising the sector opening schemes
Optimise ATFCM procedures with ASM procedures
increased cooperation with military ANSP
Significant Events Olympic Games
Capacity increase
p.a. +2% +2% +2%
Table 21. LVNL measures and benefits
c. Sustainability As has been described in section 2.1.(b) the sustainability target has been set at 92.5%. LVNL is analyzing at present the feasibility of raising the target to 93% for 2013 and 2014, to meet the user requirements of KLM, the main user at Schiphol Airport. d. Total ATFM delay The target for total ATFM delay consists of a combination of terminal and en route delays. The associated target has been set at 1 minute per flight. For the first reference period there is also an EU wide target for en route ATFM delay. As has been mentioned earlier the 2014 target for en route delay has been set at 0.18 minutes per flight, which is consistent with and contributes adequately to the EU-wide target. It also means that terminal ATFM delay should not exceed 0.82 minutes per flight. In order to meet this target LVNL, KLM and Amsterdam Airport Schiphol (AAS) are cooperating to match airport capacity with terminal and en route capacity. This cooperation will be further enhanced by the complete implementation of Airport-Cooperative Decision Making (A-CDM) during the 1
st reference
2009A 2010A 2011F 2012F 2013F 2014F
LVNL En-route ATFM delay prior to RP1 (en-route ATFM delay minutes per flight)
0.03 0.2 PM
Reference value from the capacity planning process of EUROCONTROL (en-route ATFM delay minutes per flight)
0.12 0.14 0.18
% n/n-1 National/FAB capacity target (en-route ATFM delay in minutes per flight)
0.20 0.20 0.18
% n/n-1 Difference between the target and the reference value 0.08 0.06 None MUAC En-route ATFM delay prior to RP1 (en-route ATFM delay minutes per flight)
0.05 0.05 0.20
Reference value from the capacity planning process of EUROCONTROL (en-route ATFM delay minutes per flight)
0. 30 0.24 0.22
% n/n-1 National/FAB capacity target (en-route ATFM delay in minutes per flight)
0.20 0.24 0.22
% n/n-1 Difference between the target and the reference value None None None
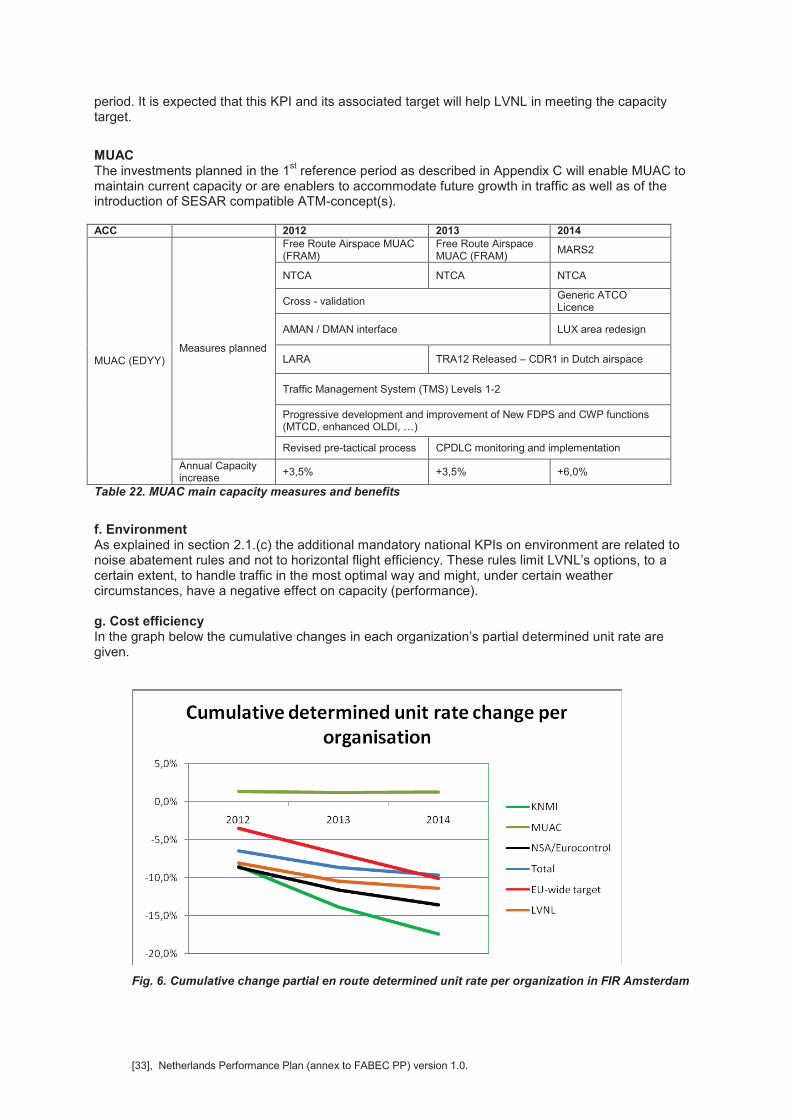
[33], Netherlands Performance Plan (annex to FABEC PP) version 1.0.
period. It is expected that this KPI and its associated target will help LVNL in meeting the capacity target.
MUAC The investments planned in the 1
st reference period as described in Appendix C will enable MUAC to
maintain current capacity or are enablers to accommodate future growth in traffic as well as of the introduction of SESAR compatible ATM-concept(s). ACC 2012 2013 2014
MUAC (EDYY) Measures planned
Free Route Airspace MUAC (FRAM)
Free Route Airspace MUAC (FRAM)
MARS2
NTCA NTCA NTCA
Cross - validation Generic ATCO Licence
AMAN / DMAN interface LUX area redesign
LARA TRA12 Released – CDR1 in Dutch airspace
Traffic Management System (TMS) Levels 1-2
Progressive development and improvement of New FDPS and CWP functions (MTCD, enhanced OLDI, …)
Revised pre-tactical process CPDLC monitoring and implementation
Annual Capacity increase
+3,5% +3,5% +6,0%
Table 22. MUAC main capacity measures and benefits
f. Environment As explained in section 2.1.(c) the additional mandatory national KPIs on environment are related to noise abatement rules and not to horizontal flight efficiency. These rules limit LVNL’s options, to a certain extent, to handle traffic in the most optimal way and might, under certain weather circumstances, have a negative effect on capacity (performance). g. Cost efficiency In the graph below the cumulative changes in each organization’s partial determined unit rate are given.
Fig. 6. Cumulative change partial en route determined unit rate per organization in FIR Amsterdam
[34], Netherlands Performance Plan (annex to FABEC PP) version 1.0.
The EU wide target of an annual decrease of 3.5% in the determined en route unit rate is almost completely achieved in the FIR Amsterdam, because: 1. the 2009 cost reduction (100 FTE = 15% of the support staff plus a decrease in the other
operating expenses, leading to a decrease in the support staff ratio from 5.1 in 2009 to 4.5 in 2011 and tariff stabilisation measures by LVNL have not left much room for further improvement in the cost efficiency field: nevertheless, LVNL will in the coming years reduce its support staff with 28 FTE. The number of controllers will increase. There will be a net reduction of 104 FTE. Furthermore, the interest costs will decrease by using State loan facilities, both for operating expenses and for investments.
2. After the implementation of AUTO METAR, KNMI has little room left for any further cost reductions. KNMI will reduce its staff by 4.5 FTE and has an ongoing focus on systems automation.
3. On the basis of the cost sharing key agreement for MUAC, lower costs sharing keys have been applied for the Netherlands in 2011. This also implied lower costs. However, the application of the same cost sharing key agreement results in higher cost sharing keys for the Netherlands during the first reference period 2012-2014 and this is resulting in a more than proportional cost increase. The cost reductions achieved by MUAC are negatively compensated by this higher cost sharing key for the Netherlands and finally have a negative effect on the overall Dutch cost efficiency performance.
4. MUAC is also focusing on cost efficiency and cost reduction measures, inter alia the optimisation of the ATCO deployment, the review of its recruitment programme Ab Initio’s by outsourcing its Ab Initio training to FABEC partners, leasing ATCOs to Austrocontrol (2011-2013), a reduction in its support cost ratio, renegotiating running contracts and starting a common procurement of a FABEC compliant New Voice Communication System with DSNA.
All in all, the targeted unit rate in the FIR Amsterdam will decrease with 9.7% in the period 2012 – 2014 (compared to 2011). Without the change in the MUAC cost sharing key, the targeted unit rate would decrease with 11.2%. h. Interdependencies between targets The key performance indicators in this Performance Plan should not be considered in isolation, as performance in one area will affect performance in other areas. A balance should be found specifically between the KPAs on capacity and cost efficiency. Capacity investments will in most cases lead to cost increases and should only be considered if a capacity shortage is expected. Whereas a higher target for cost-efficiency will have an effect on capacity as this would most likely result in reducing the number of ATCOs or reducing investments. For LVNL a more ambitious target for capacity will most certainly require higher investments, the more so as their current system already has reached the end of its life cycle. Higher investments will result in a lower performance on cost efficiency. LVNL will only implement replacements of outdated systems in the first reference period. A higher target on cost–efficiency will not be feasible, considering the substantial cost containment measures that have already been taken by LVNL in 2009 and 2010. In the case of MUAC, a high performing state of the art New FDPS platform is operational. The proposed capacity plan aims at further deploying its capabilities and functionalities to improve ATCO productivity. The current Netherlands targets for cost efficiency and capacity targets are considered to be achievable while maintaining a very high safety standard.
2.5. Carry-overs from the years before RP1
Section 2.2.12 already includes a table (table 14) showing the carry overs.
2.6. Parameters for risk sharing and incentives
Article 11 of the Performance Regulation describes incentives. A distinction is made between financial and non-financial incentives. No distinction is made between ex ante incentives (both the reward and its volume and the criteria for obtaining the reward are set in advance) and ex post incentives in the
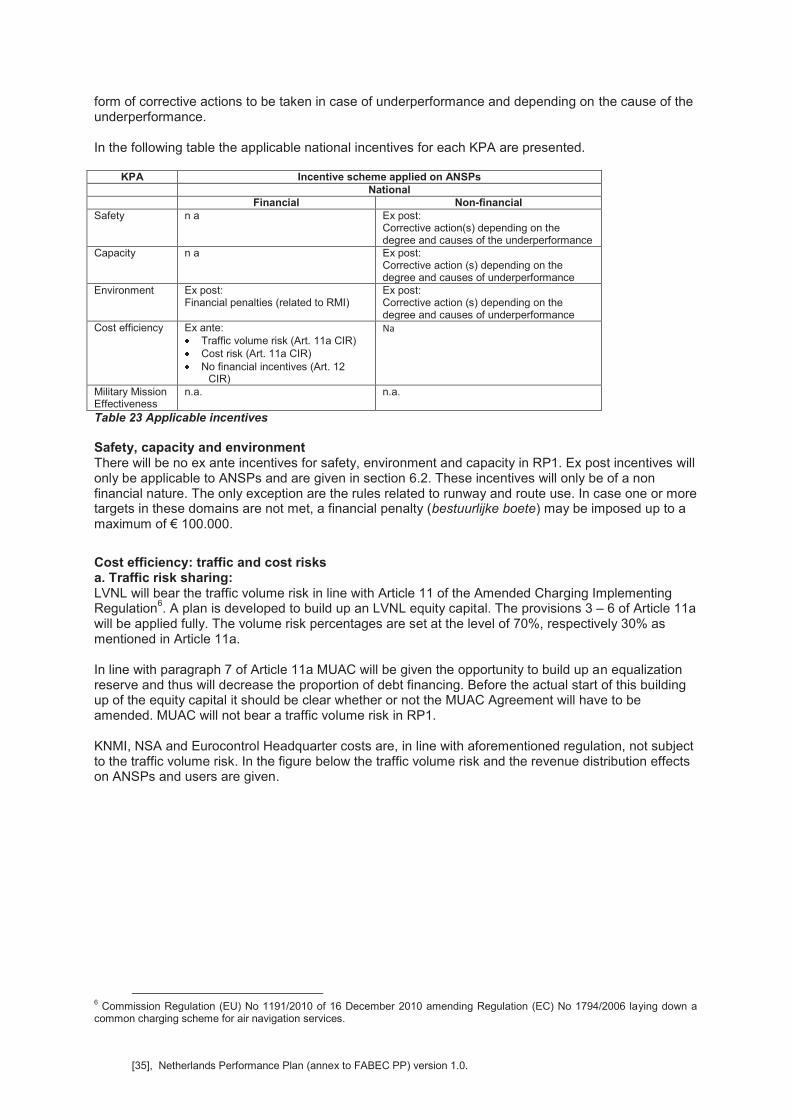
[35], Netherlands Performance Plan (annex to FABEC PP) version 1.0.
form of corrective actions to be taken in case of underperformance and depending on the cause of the underperformance. In the following table the applicable national incentives for each KPA are presented.
KPA Incentive scheme applied on ANSPs
National
Financial Non-financial
Safety n a Ex post: Corrective action(s) depending on the degree and causes of the underperformance
Capacity n a Ex post: Corrective action (s) depending on the degree and causes of underperformance
Environment Ex post: Financial penalties (related to RMI)
Ex post: Corrective action (s) depending on the degree and causes of underperformance
Cost efficiency Ex ante: Traffic volume risk (Art. 11a CIR) Cost risk (Art. 11a CIR) No financial incentives (Art. 12
CIR)
Na
Military Mission Effectiveness
n.a. n.a.
Table 23 Applicable incentives
Safety, capacity and environment There will be no ex ante incentives for safety, environment and capacity in RP1. Ex post incentives will only be applicable to ANSPs and are given in section 6.2. These incentives will only be of a non financial nature. The only exception are the rules related to runway and route use. In case one or more targets in these domains are not met, a financial penalty (bestuurlijke boete) may be imposed up to amaximum of € 100.000.
Cost efficiency: traffic and cost risks a. Traffic risk sharing: LVNL will bear the traffic volume risk in line with Article 11 of the Amended Charging Implementing Regulation
6. A plan is developed to build up an LVNL equity capital. The provisions 3 – 6 of Article 11a
will be applied fully. The volume risk percentages are set at the level of 70%, respectively 30% as mentioned in Article 11a. In line with paragraph 7 of Article 11a MUAC will be given the opportunity to build up an equalization reserve and thus will decrease the proportion of debt financing. Before the actual start of this building up of the equity capital it should be clear whether or not the MUAC Agreement will have to be amended. MUAC will not bear a traffic volume risk in RP1. KNMI, NSA and Eurocontrol Headquarter costs are, in line with aforementioned regulation, not subject to the traffic volume risk. In the figure below the traffic volume risk and the revenue distribution effects on ANSPs and users are given.
6 Commission Regulation (EU) No 1191/2010 of 16 December 2010 amending Regulation (EC) No 1794/2006 laying down a common charging scheme for air navigation services.
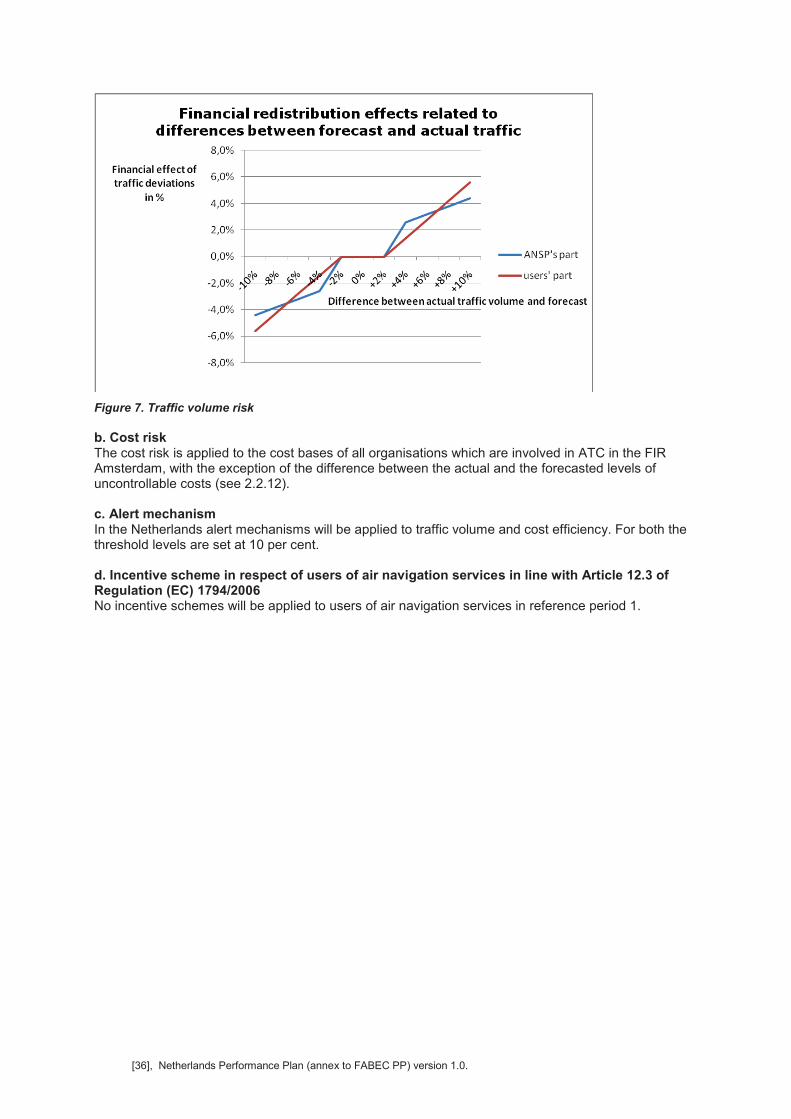
[36], Netherlands Performance Plan (annex to FABEC PP) version 1.0.
Figure 7. Traffic volume risk
b. Cost risk The cost risk is applied to the cost bases of all organisations which are involved in ATC in the FIR Amsterdam, with the exception of the difference between the actual and the forecasted levels of uncontrollable costs (see 2.2.12). c. Alert mechanism In the Netherlands alert mechanisms will be applied to traffic volume and cost efficiency. For both the threshold levels are set at 10 per cent. d. Incentive scheme in respect of users of air navigation services in line with Article 12.3 of Regulation (EC) 1794/2006 No incentive schemes will be applied to users of air navigation services in reference period 1.
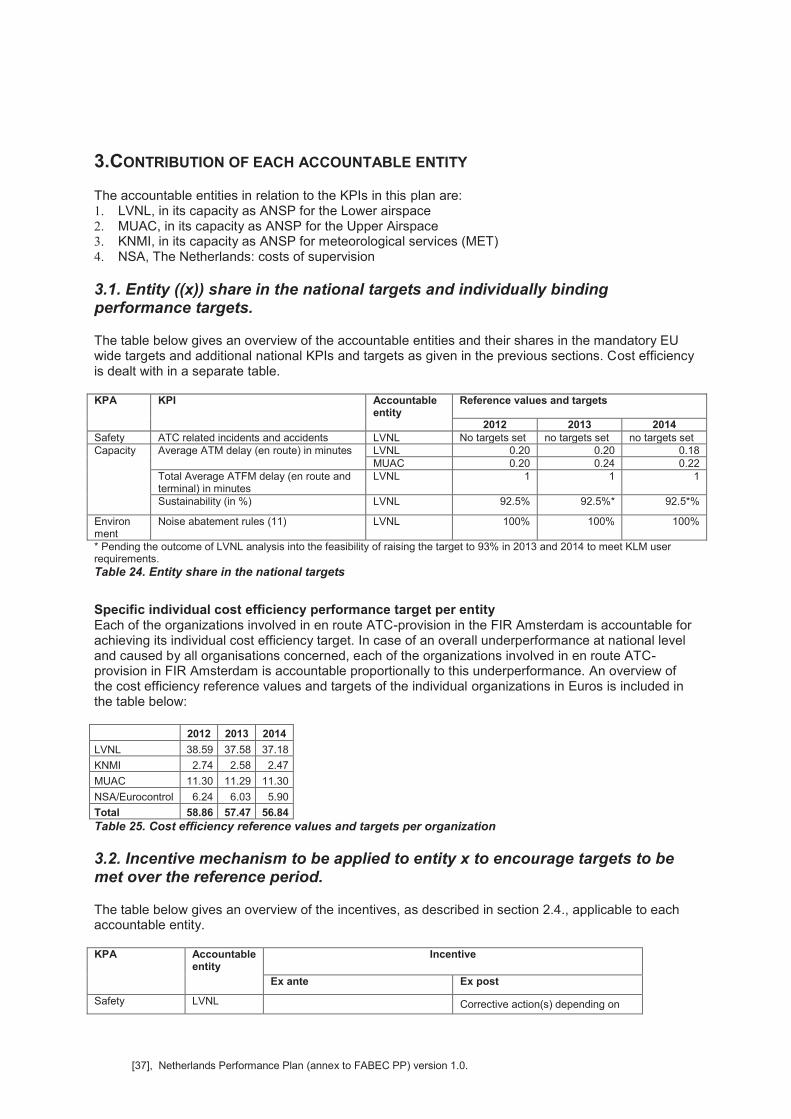
[37], Netherlands Performance Plan (annex to FABEC PP) version 1.0.
3.CONTRIBUTION OF EACH ACCOUNTABLE ENTITY
The accountable entities in relation to the KPIs in this plan are: 1. LVNL, in its capacity as ANSP for the Lower airspace 2. MUAC, in its capacity as ANSP for the Upper Airspace 3. KNMI, in its capacity as ANSP for meteorological services (MET) 4. NSA, The Netherlands: costs of supervision
3.1. Entity ((x)) share in the national targets and individually binding performance targets.
The table below gives an overview of the accountable entities and their shares in the mandatory EU wide targets and additional national KPIs and targets as given in the previous sections. Cost efficiency is dealt with in a separate table. KPA KPI Accountable
entity Reference values and targets
2012 2013 2014
Safety ATC related incidents and accidents LVNL No targets set no targets set no targets set Capacity Average ATM delay (en route) in minutes LVNL 0.20 0.20 0.18
MUAC 0.20 0.24 0.22 Total Average ATFM delay (en route and terminal) in minutes
LVNL 1 1 1
Sustainability (in %) LVNL 92.5% 92.5%* 92.5*%
Environ ment
Noise abatement rules (11) LVNL 100% 100% 100%
* Pending the outcome of LVNL analysis into the feasibility of raising the target to 93% in 2013 and 2014 to meet KLM user requirements.
Table 24. Entity share in the national targets
Specific individual cost efficiency performance target per entity Each of the organizations involved in en route ATC-provision in the FIR Amsterdam is accountable for achieving its individual cost efficiency target. In case of an overall underperformance at national level and caused by all organisations concerned, each of the organizations involved in en route ATC-provision in FIR Amsterdam is accountable proportionally to this underperformance. An overview of the cost efficiency reference values and targets of the individual organizations in Euros is included in the table below: 2012 2013 2014
LVNL 38.59 37.58 37.18
KNMI 2.74 2.58 2.47
MUAC 11.30 11.29 11.30
NSA/Eurocontrol 6.24 6.03 5.90
Total 58.86 57.47 56.84
Table 25. Cost efficiency reference values and targets per organization
3.2. Incentive mechanism to be applied to entity x to encourage targets to be met over the reference period.
The table below gives an overview of the incentives, as described in section 2.4., applicable to each accountable entity. KPA Accountable
entity Incentive
Ex ante Ex post
Safety LVNL Corrective action(s) depending on
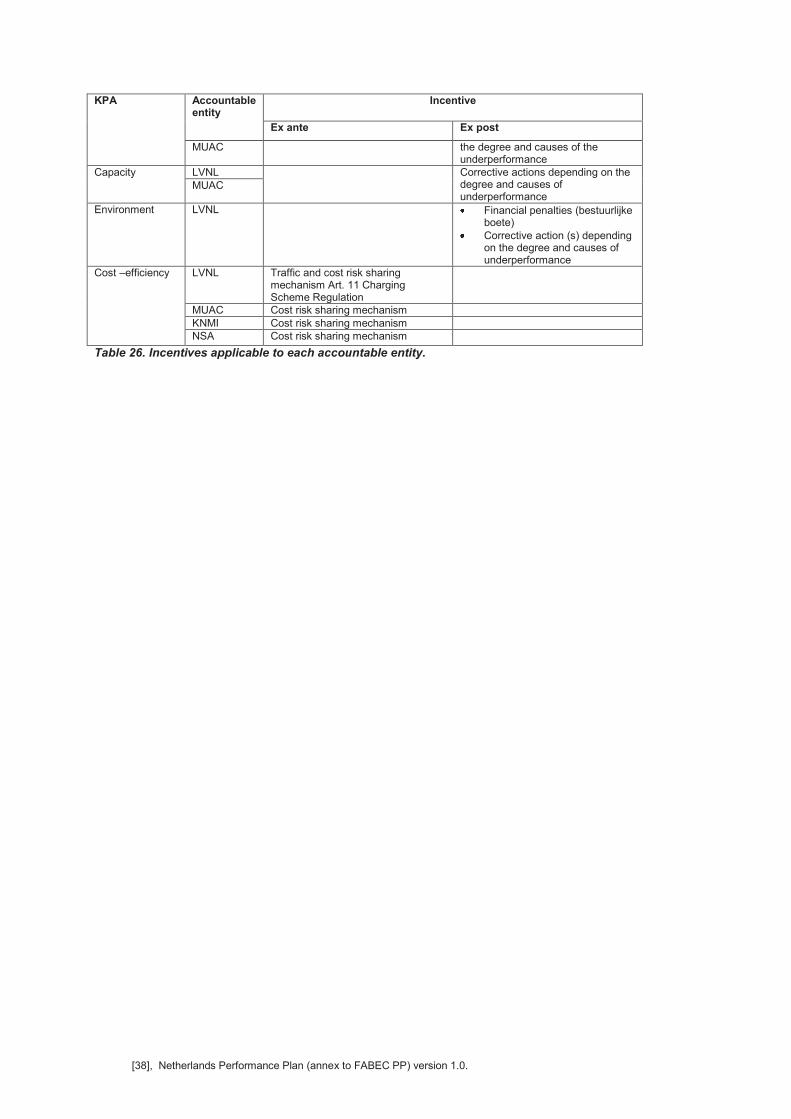
[38], Netherlands Performance Plan (annex to FABEC PP) version 1.0.
KPA Accountable entity
Incentive
Ex ante Ex post
MUAC the degree and causes of the underperformance
Capacity LVNL Corrective actions depending on the degree and causes of underperformance
MUAC
Environment LVNL Financial penalties (bestuurlijke boete)
Corrective action (s) depending on the degree and causes of underperformance
Cost –efficiency LVNL Traffic and cost risk sharing mechanism Art. 11 Charging Scheme Regulation
MUAC Cost risk sharing mechanism KNMI Cost risk sharing mechanism NSA Cost risk sharing mechanism
Table 26. Incentives applicable to each accountable entity.
[39], Netherlands Performance Plan (annex to FABEC PP) version 1.0.
4.CIVIL-MILITARY DIMENSION OF THE PLAN
4.1. Performance of the FUA concept
Current situation A joint Civil Military ATM Policy Unit (MoI&E and MoD) is responsible for ASM Level 1 and is supported by the Netherlands Air Traffic Committee (LVC). This committee is established by agreement between MoI&E and MoD and acts as advisory body on airspace issues to the two ministers. It consists of representatives of both ministries (involving the MLA, DGLM and CAA-NL) and the service providers (LVNL, MUAC and Mill-ATCC, KNMI) while other ad-hoc stakeholders, such as airlines, also take part. Improvement of FUA measures planned At the end of 2011 the Dutch government will agree on a strategic airspace vision developed by the MoI&E and the MoD so as to provide political guidance at a national level to meet national requirements and the international framework of SES and FABEC. The main objective of this policy document is to provide guidance regarding future perspectives and the context of the way in which the Dutch airspace will be designed, managed and used. This document must be in line with the FABEC developments and the (inter)national initiatives regarding the use of airspace and the respective roles and tasks of the many stakeholders, both civil and military. Within the Netherlands, civil military cooperation is gaining momentum. The ongoing deployment and enhancement of the AFMU entity (as a centralised focal point in airspace management from a national perspective) and the corresponding processes and procedures are, together with the realisation of enhanced civil-military cooperation, on the political agenda. Following an agreement between the MoD and MoI&E, in April 2011, the civil-military cooperation programme will have to develop a plan for the realisation of military ACC tasks at the LVNL premises. This is expected to take place in the first reference period.
FUA Level 1
The Dutch MoD and MoI&E aim at setting up a formalised national decision making process during 2011 in support of the national and FABEC ASM and Airspace Design work in which AFMU will play a vital role; The Dutch MoD plans to introduce PRISMIL (Pan European Repository of Information Supporting Civil Military Performance Measurement) and LARA (Local and Regional Airspace Management System) during the first reference period. These tools will provide the required data and analyses regarding performance data which are mainly focussed on MME and on complete transparency of airspace use data to EUROCONTROL (PRC, CFMU), FABEC Committees and relevant task forces. A similar transparency is requested from the civil ANSPs (MUAC and LVNL) to allow for informed, performance based decision-making.
The introduction of LARA will support transparency, enhance the military booking processes and is envisaged to facilitate real-time CDM between all parties involved. The introduction of LARA is expected before the end of 2011.
At present no data are available to perform any formal data analysis regarding airspace utilisation and booking performance. With the absence of any data, (K)PIs cannot be measured and targets cannot be set. The introduction of PRISMIL should change this situation; but reference data should be collected for at least one year after the introduction of PRISMIL.
FUA Level 2 A joint civil military Airspace and Flow Management Unit (AFMU) has been established and operates from LVNL Schiphol. For the activation of two major exercise areas (TRA 10(A) and 12(A)) enhanced FUA application is proving to increase efficiency. The short notice activation option of the TRAs provides the required flexibility on the military side and offers an optional offload for the affected CDRs. All major exercises, requiring a non standard airspace volume with its associated impact on
[40], Netherlands Performance Plan (annex to FABEC PP) version 1.0.
civil capacity, are subject to a coordination process involving civil and military stakeholders and CDM. If no consensus can be reached, a formal decision will be requested from level 1. FUA Level 3 Additional CDR 2 utilisation is envisaged after the introduction of LARA. At present the introduction of new CDRs on the 10th of March 2011 involving the Temporary Restricted Area (TRA) 10(A) is expected to provide substantial benefits to civil ANSPs and users. Based on the feasibility study the estimated benefits for airspace users as a result of fuel savings (and CO2 reduction) and network optimisation, based on the optimal use of air space, range between €14 million and €21 million per year, consisting of possible cost savings and additional income. In addition, a possible cost saving of air traffic service for the benefit of both civil and military airspace users is expected, depending on the details of a possible merger or co-location of LVNL and the military air traffic control.
4.2. Additional KPI’s
No additional national civil-military KPA/KPIs are set for the first reference period.
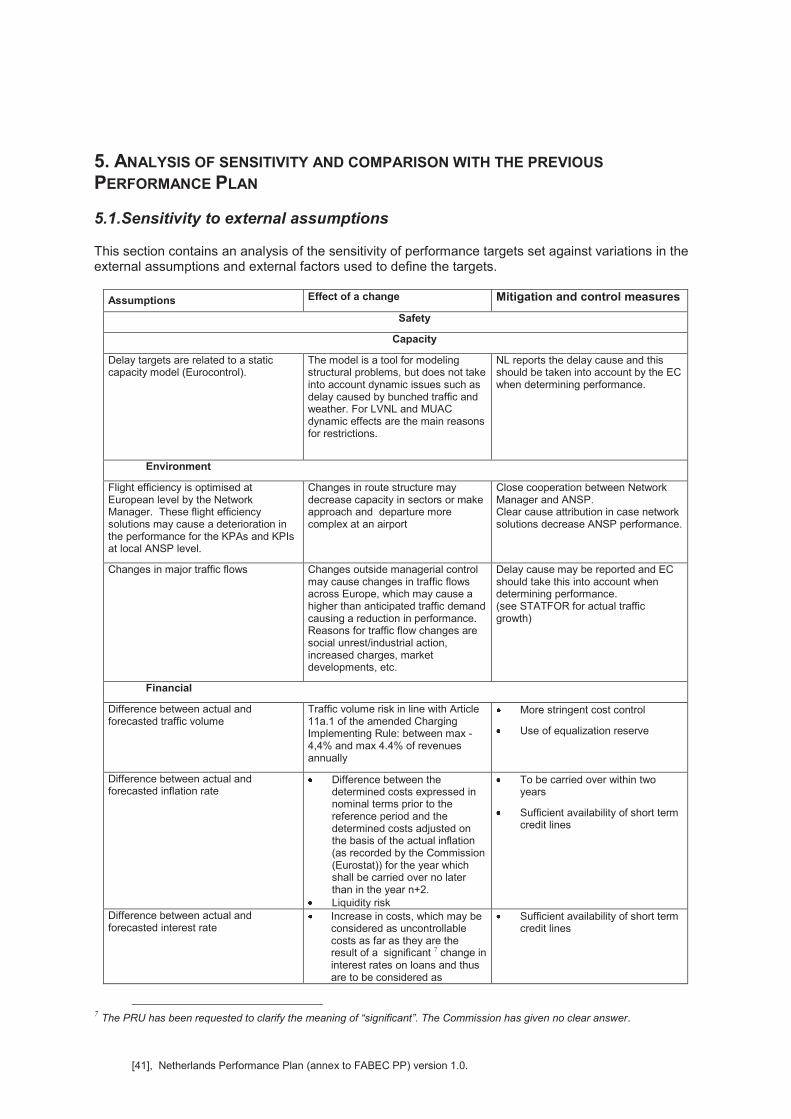
[41], Netherlands Performance Plan (annex to FABEC PP) version 1.0.
5. ANALYSIS OF SENSITIVITY AND COMPARISON WITH THE PREVIOUS
PERFORMANCE PLAN
5.1.Sensitivity to external assumptions
This section contains an analysis of the sensitivity of performance targets set against variations in the external assumptions and external factors used to define the targets.
Assumptions Effect of a change Mitigation and control measures
Safety
Capacity
Delay targets are related to a static capacity model (Eurocontrol).
The model is a tool for modeling structural problems, but does not take into account dynamic issues such as delay caused by bunched traffic and weather. For LVNL and MUAC dynamic effects are the main reasons for restrictions.
NL reports the delay cause and this should be taken into account by the EC when determining performance.
Environment
Flight efficiency is optimised at European level by the Network Manager. These flight efficiency solutions may cause a deterioration in the performance for the KPAs and KPIs at local ANSP level.
Changes in route structure may decrease capacity in sectors or make approach and departure more complex at an airport
Close cooperation between Network Manager and ANSP. Clear cause attribution in case network solutions decrease ANSP performance.
Changes in major traffic flows Changes outside managerial control may cause changes in traffic flows across Europe, which may cause a higher than anticipated traffic demand causing a reduction in performance. Reasons for traffic flow changes are social unrest/industrial action, increased charges, market developments, etc.
Delay cause may be reported and EC should take this into account when determining performance. (see STATFOR for actual traffic growth)
Financial
Difference between actual and forecasted traffic volume
Traffic volume risk in line with Article 11a.1 of the amended Charging Implementing Rule: between max -4,4% and max 4.4% of revenues annually
More stringent cost control
Use of equalization reserve
Difference between actual and forecasted inflation rate
Difference between the determined costs expressed in nominal terms prior to the reference period and the determined costs adjusted on the basis of the actual inflation (as recorded by the Commission (Eurostat)) for the year which shall be carried over no later than in the year n+2.
Liquidity risk
To be carried over within two years
Sufficient availability of short term credit lines
Difference between actual and forecasted interest rate
Increase in costs, which may be considered as uncontrollable costs as far as they are the result of a significant 7 change in interest rates on loans and thus are to be considered as
Sufficient availability of short term credit lines
7 The PRU has been requested to clarify the meaning of “significant”. The Commission has given no clear answer.
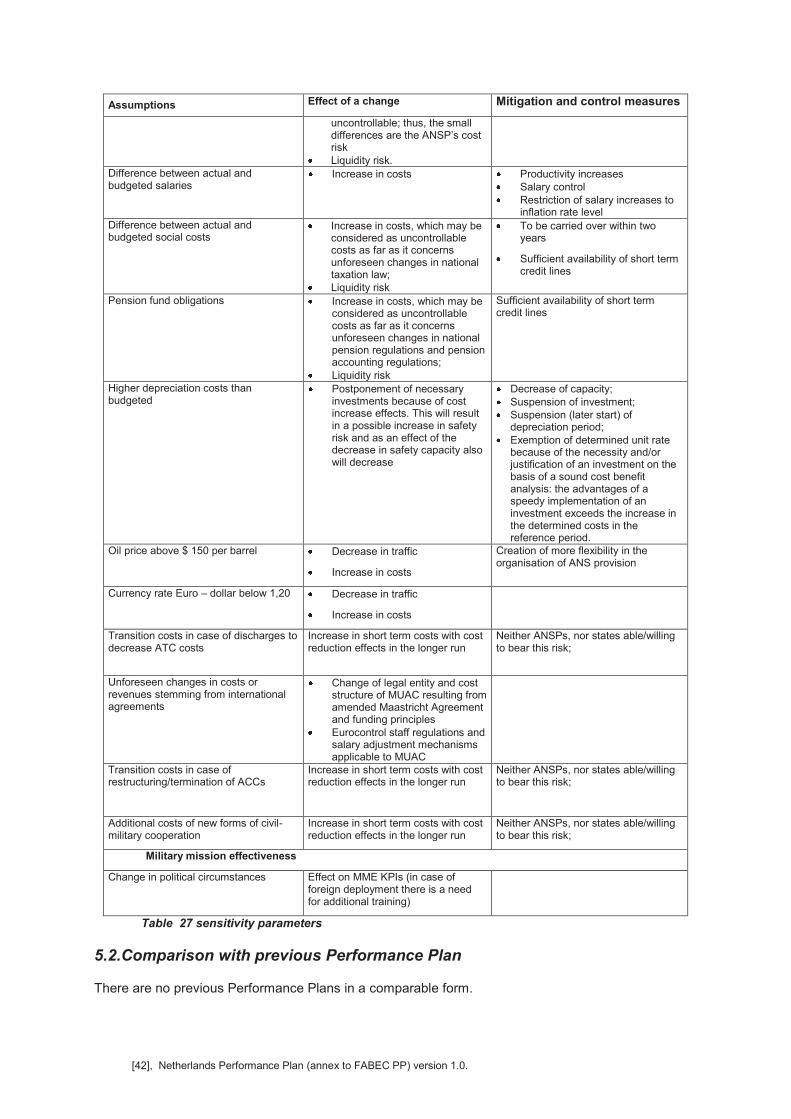
[42], Netherlands Performance Plan (annex to FABEC PP) version 1.0.
Assumptions Effect of a change Mitigation and control measures
uncontrollable; thus, the small differences are the ANSP’s cost risk
Liquidity risk. Difference between actual and budgeted salaries
Increase in costs Productivity increases Salary control Restriction of salary increases to
inflation rate level Difference between actual and budgeted social costs
Increase in costs, which may be considered as uncontrollable costs as far as it concerns unforeseen changes in national taxation law;
Liquidity risk
To be carried over within two years
Sufficient availability of short term credit lines
Pension fund obligations Increase in costs, which may be considered as uncontrollable costs as far as it concerns unforeseen changes in national pension regulations and pension accounting regulations;
Liquidity risk
Sufficient availability of short term credit lines
Higher depreciation costs than budgeted
Postponement of necessary investments because of cost increase effects. This will result in a possible increase in safety risk and as an effect of the decrease in safety capacity also will decrease
Decrease of capacity; Suspension of investment; Suspension (later start) of
depreciation period; Exemption of determined unit rate
because of the necessity and/or justification of an investment on the basis of a sound cost benefit analysis: the advantages of a speedy implementation of an investment exceeds the increase in the determined costs in the reference period.
Oil price above $ 150 per barrel Decrease in traffic
Increase in costs
Creation of more flexibility in the organisation of ANS provision
Currency rate Euro – dollar below 1,20 Decrease in traffic
Increase in costs
Transition costs in case of discharges to decrease ATC costs
Increase in short term costs with cost reduction effects in the longer run
Neither ANSPs, nor states able/willing to bear this risk;
Unforeseen changes in costs or revenues stemming from international agreements
Change of legal entity and cost structure of MUAC resulting from amended Maastricht Agreement and funding principles
Eurocontrol staff regulations and salary adjustment mechanisms applicable to MUAC
Transition costs in case of restructuring/termination of ACCs
Increase in short term costs with cost reduction effects in the longer run
Neither ANSPs, nor states able/willing to bear this risk;
Additional costs of new forms of civil-military cooperation
Increase in short term costs with cost reduction effects in the longer run
Neither ANSPs, nor states able/willing to bear this risk;
Military mission effectiveness
Change in political circumstances Effect on MME KPIs (in case of foreign deployment there is a need for additional training)
Table 27 sensitivity parameters
5.2.Comparison with previous Performance Plan
There are no previous Performance Plans in a comparable form.
[43], Netherlands Performance Plan (annex to FABEC PP) version 1.0.
6. IMPLEMENTATION OF THE PERFORMANCE PLAN
6.1 Monitoring and reporting
This section deals with the monitoring and reporting mechanisms as well as with the measures put in place to ensure that the targets are monitored and met. a) Content of the monitoring and reporting The monitoring and reporting will focus on the following: Achievement of the actions defined in the ANS part of the State Safety Programme(s) and of the
ANS Business Plans; Performance of the accountable entity with regard to each of the KPAs; Actual realisation of external assumptions and external factors affecting performance; Evolution of uncontrollable costs; Reaching of the alert threshold beyond which the alert mechanism may be activated; In case the alert thresholds are likely to be reached, a description of the possible measures the
relevant accountable entity plans to take to resolve the situation; Corrective measures, action plans (necessity, planning, implementation, costs and effects).
The NSA will once a year report to the European Commission on the monitoring of the progress made under the Performance Plan. This annual monitoring report will be sent to the Commission in May of the following year.
b) Monitoring and reporting cycle
For the monitoring of the cost efficiency KPI and the additional mandatory national KPIs and PIs on safety, capacity and environment the following applies: LVNL Monitoring and reporting on the performance of the additional mandatory national KPIs and PIs on safety, capacity, environment and cost efficiency will be done on a quarterly basis. Because of its ZBO status, LVNL will also report on specific financial issues as is done in the present circumstances. LVNL will submit a report to the NSA on a quarterly basis. MUAC Monitoring and reporting on the safety, capacity, environment and cost efficiency will be on a quarterly basis as part of the Management Review process applied to MUAC. MUAC will submit a monitoring report to the Maastricht Coordination Group. KNMI Monitoring and reporting on the cost efficiency performance will be on an annual basis. KNMI will submit a monitoring report to the NSA each year in May.
6.2.Appropriate measures
Accountable entity In case the performance targets are not met or are likely not to be met, the relevant accountable entity (ies) will be requested to submit a corrective action plan to the NSA within two months containing the following information: An analysis of the causes of the underperformance; A description of possible measure(s) to be taken to resolve the situation, taking due account of
other developments planned at national and/or FABEC level to achieve the performance targets; A description of any (negative) effect of the (possible) corrective measures taken on other KPIs
and targets;
[44], Netherlands Performance Plan (annex to FABEC PP) version 1.0.
An indication of the lead time for the corrective measures to have an effect; The costs associated with the measures to be taken;
A planning of the development, deployment and implementation of the corrective measures. NSA On the basis of the corrective action plan, the NSA has to decide which measures are to be taken by the relevant accountable entity to rectify the underperformance and what frequency is applied for submitting progress reports to assess progress in the situation. Current consultation procedures will remain unchanged.
6.3 Adaptation of the Performance Plan
In case it is decided to adapt the Performance plan, (e.g. in case the alert thresholds have been met), a new Performance plan will be drafted.
[45], Netherlands Performance Plan (annex to FABEC PP) version 1.0.
APPENDICES
A Reporting tables
B Overview of investments
C Extracts from the State Safety Plan
D Stakeholder consultation documents
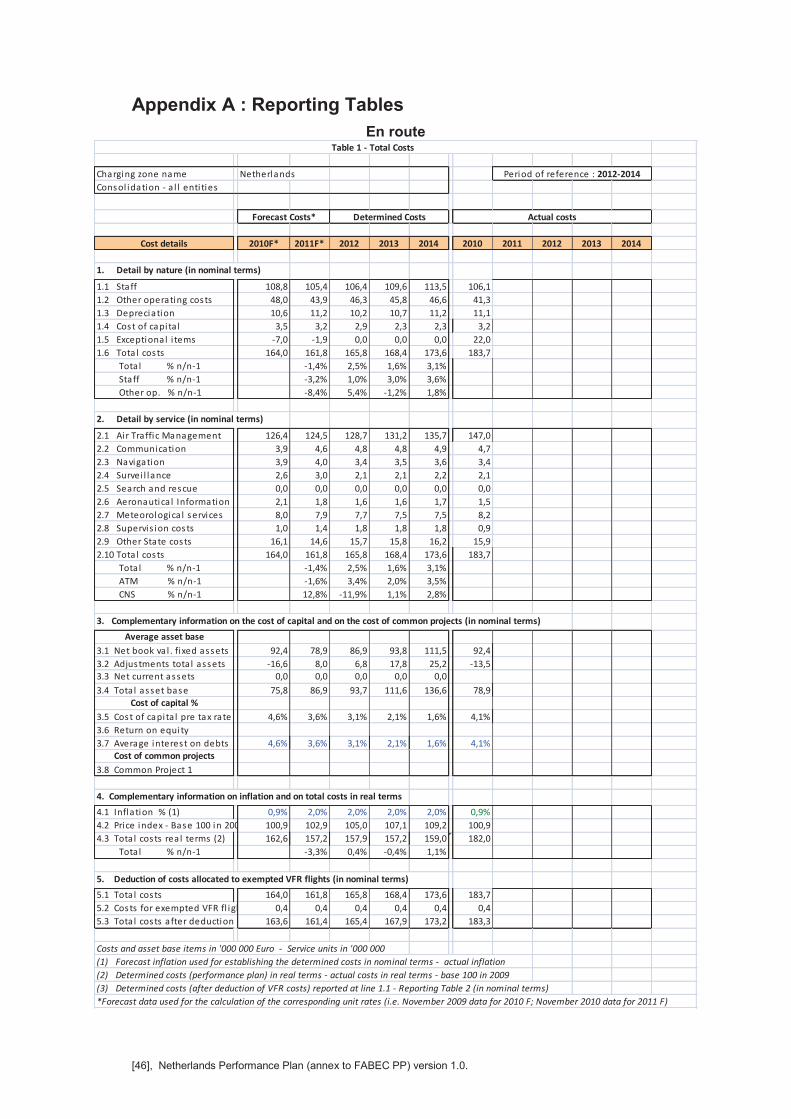
[46], Netherlands Performance Plan (annex to FABEC PP) version 1.0.
Appendix A : Reporting Tables
En route
Charging zone name Netherlands
Consol idation - a l l enti ties
Cost details 2010F* 2011F* 2012 2013 2014 2010 2011 2012 2013 2014
1. Detail by nature (in nominal terms)
1.1 Staff 108,8 105,4 106,4 109,6 113,5 106,1
1.2 Other operating costs 48,0 43,9 46,3 45,8 46,6 41,3
1.3 Depreciation 10,6 11,2 10,2 10,7 11,2 11,1
1.4 Cost of capita l 3,5 3,2 2,9 2,3 2,3 3,2
1.5 Exceptional i tems -7,0 -1,9 0,0 0,0 0,0 22,0
1.6 Tota l costs 164,0 161,8 165,8 168,4 173,6 183,7
Tota l % n/n-1 -1,4% 2,5% 1,6% 3,1%
Staff % n/n-1 -3,2% 1,0% 3,0% 3,6%
Other op. % n/n-1 -8,4% 5,4% -1,2% 1,8%
2. Detail by service (in nominal terms)
2.1 Ai r Traffic Management 126,4 124,5 128,7 131,2 135,7 147,0
2.2 Communication 3,9 4,6 4,8 4,8 4,9 4,7
2.3 Navigation 3,9 4,0 3,4 3,5 3,6 3,4
2.4 Survei l lance 2,6 3,0 2,1 2,1 2,2 2,1
2.5 Search and rescue 0,0 0,0 0,0 0,0 0,0 0,0
2.6 Aeronautica l Information 2,1 1,8 1,6 1,6 1,7 1,5
2.7 Meteorologica l services 8,0 7,9 7,7 7,5 7,5 8,2
2.8 Supervis ion costs 1,0 1,4 1,8 1,8 1,8 0,9
2.9 Other State costs 16,1 14,6 15,7 15,8 16,2 15,9
2.10 Tota l costs 164,0 161,8 165,8 168,4 173,6 183,7
Tota l % n/n-1 -1,4% 2,5% 1,6% 3,1%
ATM % n/n-1 -1,6% 3,4% 2,0% 3,5%
CNS % n/n-1 12,8% -11,9% 1,1% 2,8%
3. Complementary information on the cost of capital and on the cost of common projects (in nominal terms)
Average asset base
3.1 Net book va l . fixed assets 92,4 78,9 86,9 93,8 111,5 92,4
3.2 Adjustments tota l assets -16,6 8,0 6,8 17,8 25,2 -13,5
3.3 Net current assets 0,0 0,0 0,0 0,0 0,0
3.4 Tota l asset base 75,8 86,9 93,7 111,6 136,6 78,9
Cost of capital %
3.5 Cost of capita l pre tax rate 4,6% 3,6% 3,1% 2,1% 1,6% 4,1%
3.6 Return on equity
3.7 Average interest on debts 4,6% 3,6% 3,1% 2,1% 1,6% 4,1%
Cost of common projects
3.8 Common Project 1
4. Complementary information on inflation and on total costs in real terms
4.1 Inflation % (1) 0,9% 2,0% 2,0% 2,0% 2,0% 0,9%
4.2 Price index - Base 100 in 2009 100,9 102,9 105,0 107,1 109,2 100,9
4.3 Tota l costs rea l terms (2) 162,6 157,2 157,9 157,2 159,0 182,0
Tota l % n/n-1 -3,3% 0,4% -0,4% 1,1%
5. Deduction of costs allocated to exempted VFR flights (in nominal terms)
5.1 Tota l costs 164,0 161,8 165,8 168,4 173,6 183,7
5.2 Costs for exempted VFR fl ights 0,4 0,4 0,4 0,4 0,4 0,4
5.3 Tota l costs after deduction (3) 163,6 161,4 165,4 167,9 173,2 183,3
Costs and asset base items in '000 000 Euro - Service units in '000 000
(1) Forecast inflation used for establishing the determined costs in nominal terms - actual inflation
(2) Determined costs (performance plan) in real terms - actual costs in real terms - base 100 in 2009
(3) Determined costs (after deduction of VFR costs) reported at line 1.1 - Reporting Table 2 (in nominal terms)
*Forecast data used for the calculation of the corresponding unit rates (i.e. November 2009 data for 2010 F; November 2010 data for 2011 F)
Actual costs
Period of reference : 2012-2014
Table 1 - Total Costs
Forecast Costs* Determined Costs
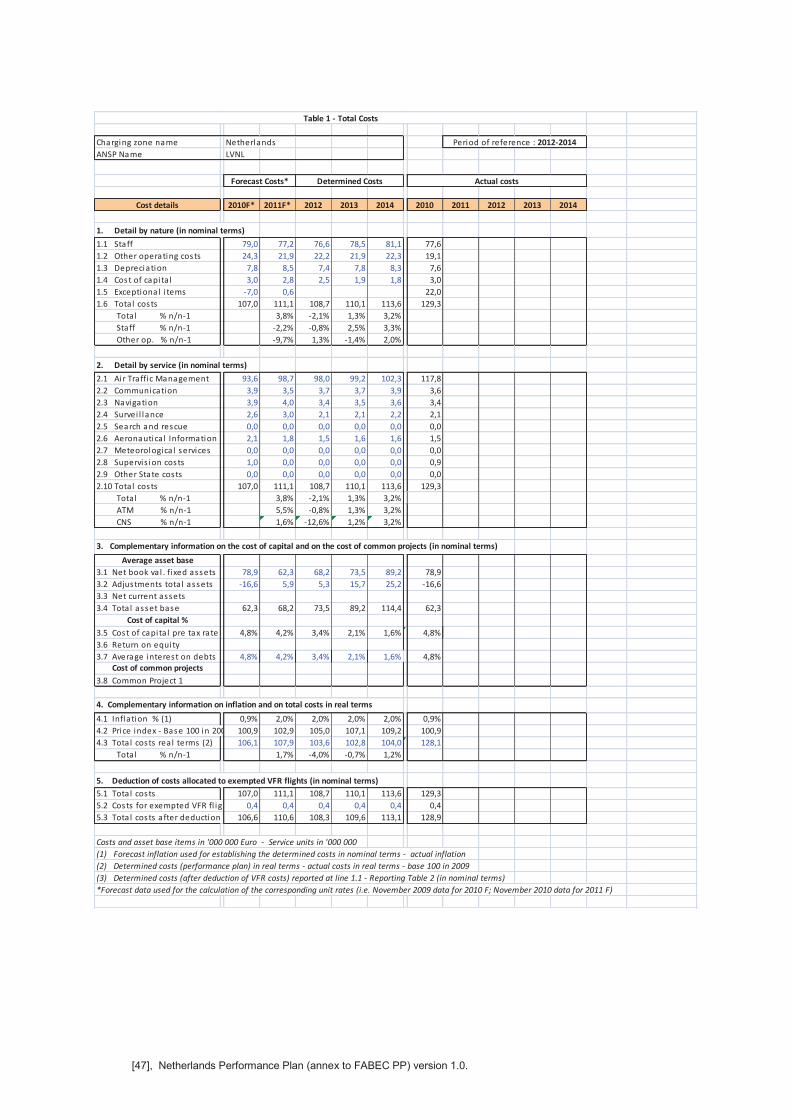
[47], Netherlands Performance Plan (annex to FABEC PP) version 1.0.
Charging zone name Netherlands
ANSP Name LVNL
Cost details 2010F* 2011F* 2012 2013 2014 2010 2011 2012 2013 2014
1. Detail by nature (in nominal terms)
1.1 Staff 79,0 77,2 76,6 78,5 81,1 77,6
1.2 Other operating costs 24,3 21,9 22,2 21,9 22,3 19,1
1.3 Depreciation 7,8 8,5 7,4 7,8 8,3 7,6
1.4 Cost of capita l 3,0 2,8 2,5 1,9 1,8 3,0
1.5 Exceptional i tems -7,0 0,6 22,0
1.6 Tota l costs 107,0 111,1 108,7 110,1 113,6 129,3
Total % n/n-1 3,8% -2,1% 1,3% 3,2%
Staff % n/n-1 -2,2% -0,8% 2,5% 3,3%
Other op. % n/n-1 -9,7% 1,3% -1,4% 2,0%
2. Detail by service (in nominal terms)
2.1 Ai r Traffic Management 93,6 98,7 98,0 99,2 102,3 117,8
2.2 Communication 3,9 3,5 3,7 3,7 3,9 3,6
2.3 Navigation 3,9 4,0 3,4 3,5 3,6 3,4
2.4 Survei l lance 2,6 3,0 2,1 2,1 2,2 2,1
2.5 Search and rescue 0,0 0,0 0,0 0,0 0,0 0,0
2.6 Aeronautica l Information 2,1 1,8 1,5 1,6 1,6 1,5
2.7 Meteorologica l services 0,0 0,0 0,0 0,0 0,0 0,0
2.8 Supervis ion costs 1,0 0,0 0,0 0,0 0,0 0,9
2.9 Other State costs 0,0 0,0 0,0 0,0 0,0 0,0
2.10 Tota l costs 107,0 111,1 108,7 110,1 113,6 129,3
Total % n/n-1 3,8% -2,1% 1,3% 3,2%
ATM % n/n-1 5,5% -0,8% 1,3% 3,2%
CNS % n/n-1 1,6% -12,6% 1,2% 3,2%
3. Complementary information on the cost of capital and on the cost of common projects (in nominal terms)
Average asset base
3.1 Net book va l . fixed assets 78,9 62,3 68,2 73,5 89,2 78,9
3.2 Adjustments tota l assets -16,6 5,9 5,3 15,7 25,2 -16,6
3.3 Net current assets
3.4 Tota l asset base 62,3 68,2 73,5 89,2 114,4 62,3
Cost of capital %
3.5 Cost of capita l pre tax rate 4,8% 4,2% 3,4% 2,1% 1,6% 4,8%
3.6 Return on equity
3.7 Average interest on debts 4,8% 4,2% 3,4% 2,1% 1,6% 4,8%
Cost of common projects
3.8 Common Project 1
4. Complementary information on inflation and on total costs in real terms
4.1 Inflation % (1) 0,9% 2,0% 2,0% 2,0% 2,0% 0,9%
4.2 Price index - Base 100 in 2009 100,9 102,9 105,0 107,1 109,2 100,9
4.3 Tota l costs rea l terms (2) 106,1 107,9 103,6 102,8 104,0 128,1
Total % n/n-1 1,7% -4,0% -0,7% 1,2%
5. Deduction of costs allocated to exempted VFR flights (in nominal terms)
5.1 Tota l costs 107,0 111,1 108,7 110,1 113,6 129,3
5.2 Costs for exempted VFR fl ights 0,4 0,4 0,4 0,4 0,4 0,4
5.3 Tota l costs after deduction (3) 106,6 110,6 108,3 109,6 113,1 128,9
Costs and asset base items in '000 000 Euro - Service units in '000 000
(1) Forecast inflation used for establishing the determined costs in nominal terms - actual inflation
(2) Determined costs (performance plan) in real terms - actual costs in real terms - base 100 in 2009
(3) Determined costs (after deduction of VFR costs) reported at line 1.1 - Reporting Table 2 (in nominal terms)
*Forecast data used for the calculation of the corresponding unit rates (i.e. November 2009 data for 2010 F; November 2010 data for 2011 F)
Actual costs
Period of reference : 2012-2014
Table 1 - Total Costs
Forecast Costs* Determined Costs
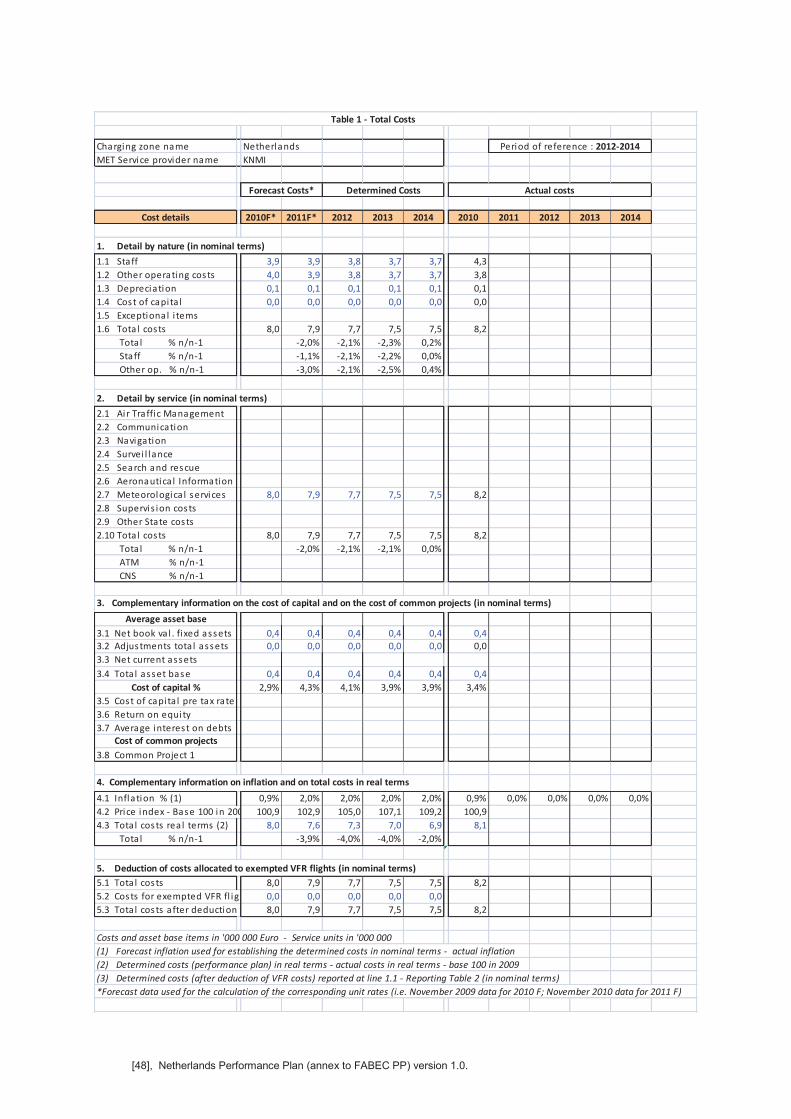
[48], Netherlands Performance Plan (annex to FABEC PP) version 1.0.
Charging zone name Netherlands
MET Service provider name KNMI
Cost details 2010F* 2011F* 2012 2013 2014 2010 2011 2012 2013 2014
1. Detail by nature (in nominal terms)
1.1 Staff 3,9 3,9 3,8 3,7 3,7 4,3
1.2 Other operating costs 4,0 3,9 3,8 3,7 3,7 3,8
1.3 Depreciation 0,1 0,1 0,1 0,1 0,1 0,1
1.4 Cost of capita l 0,0 0,0 0,0 0,0 0,0 0,0
1.5 Exceptional i tems
1.6 Tota l costs 8,0 7,9 7,7 7,5 7,5 8,2
Total % n/n-1 -2,0% -2,1% -2,3% 0,2%
Staff % n/n-1 -1,1% -2,1% -2,2% 0,0%
Other op. % n/n-1 -3,0% -2,1% -2,5% 0,4%
2. Detail by service (in nominal terms)
2.1 Ai r Traffic Management
2.2 Communication
2.3 Navigation
2.4 Survei l lance
2.5 Search and rescue
2.6 Aeronautica l Information
2.7 Meteorologica l services 8,0 7,9 7,7 7,5 7,5 8,2
2.8 Supervis ion costs
2.9 Other State costs
2.10 Tota l costs 8,0 7,9 7,7 7,5 7,5 8,2
Total % n/n-1 -2,0% -2,1% -2,1% 0,0%
ATM % n/n-1
CNS % n/n-1
3. Complementary information on the cost of capital and on the cost of common projects (in nominal terms)
Average asset base
3.1 Net book va l . fixed assets 0,4 0,4 0,4 0,4 0,4 0,4
3.2 Adjustments tota l assets 0,0 0,0 0,0 0,0 0,0 0,0
3.3 Net current assets
3.4 Tota l asset base 0,4 0,4 0,4 0,4 0,4 0,4
Cost of capital % 2,9% 4,3% 4,1% 3,9% 3,9% 3,4%
3.5 Cost of capita l pre tax rate
3.6 Return on equity
3.7 Average interest on debts
Cost of common projects
3.8 Common Project 1
4. Complementary information on inflation and on total costs in real terms
4.1 Inflation % (1) 0,9% 2,0% 2,0% 2,0% 2,0% 0,9% 0,0% 0,0% 0,0% 0,0%
4.2 Price index - Base 100 in 2009 100,9 102,9 105,0 107,1 109,2 100,9
4.3 Tota l costs rea l terms (2) 8,0 7,6 7,3 7,0 6,9 8,1
Total % n/n-1 -3,9% -4,0% -4,0% -2,0%
5. Deduction of costs allocated to exempted VFR flights (in nominal terms)
5.1 Tota l costs 8,0 7,9 7,7 7,5 7,5 8,2
5.2 Costs for exempted VFR fl ights 0,0 0,0 0,0 0,0 0,0
5.3 Tota l costs after deduction (3) 8,0 7,9 7,7 7,5 7,5 8,2
Costs and asset base items in '000 000 Euro - Service units in '000 000
(1) Forecast inflation used for establishing the determined costs in nominal terms - actual inflation
(2) Determined costs (performance plan) in real terms - actual costs in real terms - base 100 in 2009
(3) Determined costs (after deduction of VFR costs) reported at line 1.1 - Reporting Table 2 (in nominal terms)
*Forecast data used for the calculation of the corresponding unit rates (i.e. November 2009 data for 2010 F; November 2010 data for 2011 F)
Actual costs
Period of reference : 2012-2014
Table 1 - Total Costs
Forecast Costs* Determined Costs
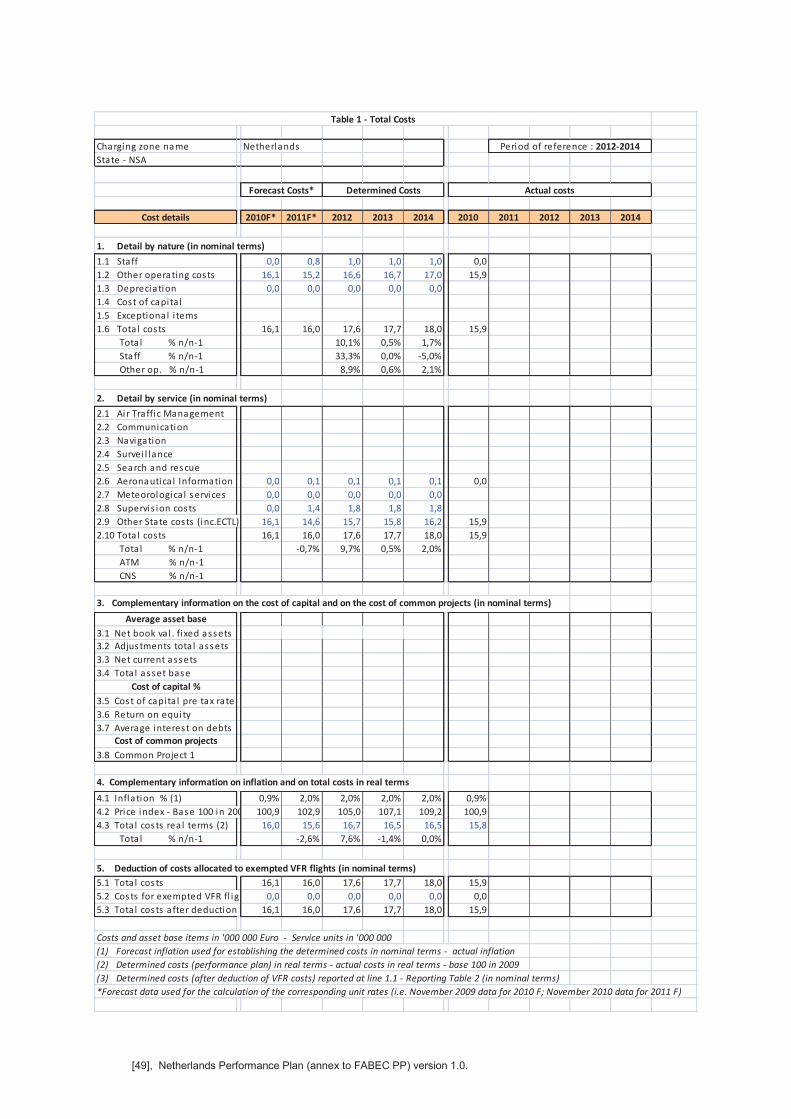
[49], Netherlands Performance Plan (annex to FABEC PP) version 1.0.
Charging zone name Netherlands
State - NSA
Cost details 2010F* 2011F* 2012 2013 2014 2010 2011 2012 2013 2014
1. Detail by nature (in nominal terms)
1.1 Staff 0,0 0,8 1,0 1,0 1,0 0,0
1.2 Other operating costs 16,1 15,2 16,6 16,7 17,0 15,9
1.3 Depreciation 0,0 0,0 0,0 0,0 0,0
1.4 Cost of capita l
1.5 Exceptional i tems
1.6 Tota l costs 16,1 16,0 17,6 17,7 18,0 15,9
Total % n/n-1 10,1% 0,5% 1,7%
Staff % n/n-1 33,3% 0,0% -5,0%
Other op. % n/n-1 8,9% 0,6% 2,1%
2. Detail by service (in nominal terms)
2.1 Ai r Traffic Management
2.2 Communication
2.3 Navigation
2.4 Survei l lance
2.5 Search and rescue
2.6 Aeronautica l Information 0,0 0,1 0,1 0,1 0,1 0,0
2.7 Meteorologica l services 0,0 0,0 0,0 0,0 0,0
2.8 Supervis ion costs 0,0 1,4 1,8 1,8 1,8
2.9 Other State costs (inc.ECTL) 16,1 14,6 15,7 15,8 16,2 15,9
2.10 Tota l costs 16,1 16,0 17,6 17,7 18,0 15,9
Total % n/n-1 -0,7% 9,7% 0,5% 2,0%
ATM % n/n-1
CNS % n/n-1
3. Complementary information on the cost of capital and on the cost of common projects (in nominal terms)
Average asset base
3.1 Net book va l . fixed assets
3.2 Adjustments tota l assets
3.3 Net current assets
3.4 Tota l asset base
Cost of capital %
3.5 Cost of capita l pre tax rate
3.6 Return on equity
3.7 Average interest on debts
Cost of common projects
3.8 Common Project 1
4. Complementary information on inflation and on total costs in real terms
4.1 Inflation % (1) 0,9% 2,0% 2,0% 2,0% 2,0% 0,9%
4.2 Price index - Base 100 in 2009 100,9 102,9 105,0 107,1 109,2 100,9
4.3 Tota l costs rea l terms (2) 16,0 15,6 16,7 16,5 16,5 15,8
Total % n/n-1 -2,6% 7,6% -1,4% 0,0%
5. Deduction of costs allocated to exempted VFR flights (in nominal terms)
5.1 Tota l costs 16,1 16,0 17,6 17,7 18,0 15,9
5.2 Costs for exempted VFR fl ights 0,0 0,0 0,0 0,0 0,0 0,0
5.3 Tota l costs after deduction (3) 16,1 16,0 17,6 17,7 18,0 15,9
Costs and asset base items in '000 000 Euro - Service units in '000 000
(1) Forecast inflation used for establishing the determined costs in nominal terms - actual inflation
(2) Determined costs (performance plan) in real terms - actual costs in real terms - base 100 in 2009
(3) Determined costs (after deduction of VFR costs) reported at line 1.1 - Reporting Table 2 (in nominal terms)
*Forecast data used for the calculation of the corresponding unit rates (i.e. November 2009 data for 2010 F; November 2010 data for 2011 F)
Actual costs
Period of reference : 2012-2014
Table 1 - Total Costs
Forecast Costs* Determined Costs
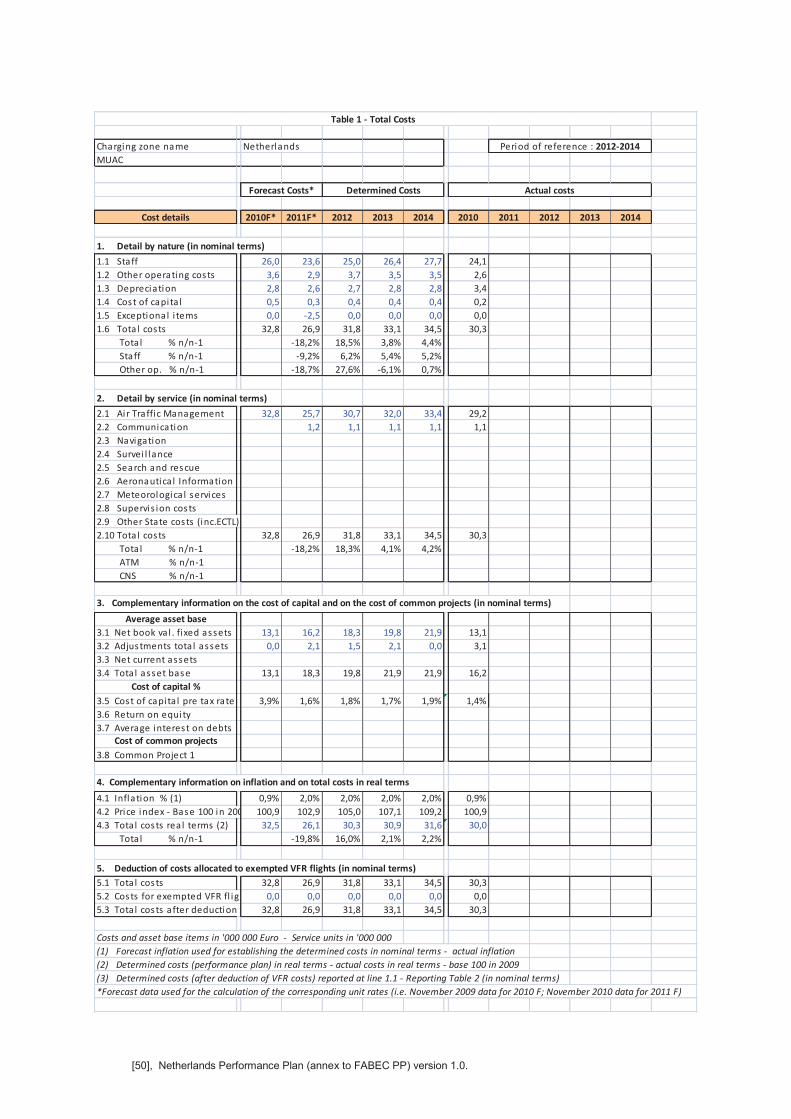
[50], Netherlands Performance Plan (annex to FABEC PP) version 1.0.
Charging zone name Netherlands
MUAC
Cost details 2010F* 2011F* 2012 2013 2014 2010 2011 2012 2013 2014
1. Detail by nature (in nominal terms)
1.1 Staff 26,0 23,6 25,0 26,4 27,7 24,1
1.2 Other operating costs 3,6 2,9 3,7 3,5 3,5 2,6
1.3 Depreciation 2,8 2,6 2,7 2,8 2,8 3,4
1.4 Cost of capita l 0,5 0,3 0,4 0,4 0,4 0,2
1.5 Exceptional i tems 0,0 -2,5 0,0 0,0 0,0 0,0
1.6 Tota l costs 32,8 26,9 31,8 33,1 34,5 30,3
Total % n/n-1 -18,2% 18,5% 3,8% 4,4%
Staff % n/n-1 -9,2% 6,2% 5,4% 5,2%
Other op. % n/n-1 -18,7% 27,6% -6,1% 0,7%
2. Detail by service (in nominal terms)
2.1 Ai r Traffic Management 32,8 25,7 30,7 32,0 33,4 29,2
2.2 Communication 1,2 1,1 1,1 1,1 1,1
2.3 Navigation
2.4 Survei l lance
2.5 Search and rescue
2.6 Aeronautica l Information
2.7 Meteorologica l services
2.8 Supervis ion costs
2.9 Other State costs (inc.ECTL)
2.10 Tota l costs 32,8 26,9 31,8 33,1 34,5 30,3
Total % n/n-1 -18,2% 18,3% 4,1% 4,2%
ATM % n/n-1
CNS % n/n-1
3. Complementary information on the cost of capital and on the cost of common projects (in nominal terms)
Average asset base
3.1 Net book va l . fixed assets 13,1 16,2 18,3 19,8 21,9 13,1
3.2 Adjustments tota l assets 0,0 2,1 1,5 2,1 0,0 3,1
3.3 Net current assets
3.4 Tota l asset base 13,1 18,3 19,8 21,9 21,9 16,2
Cost of capital %
3.5 Cost of capita l pre tax rate 3,9% 1,6% 1,8% 1,7% 1,9% 1,4%
3.6 Return on equity
3.7 Average interest on debts
Cost of common projects
3.8 Common Project 1
4. Complementary information on inflation and on total costs in real terms
4.1 Inflation % (1) 0,9% 2,0% 2,0% 2,0% 2,0% 0,9%
4.2 Price index - Base 100 in 2009 100,9 102,9 105,0 107,1 109,2 100,9
4.3 Tota l costs rea l terms (2) 32,5 26,1 30,3 30,9 31,6 30,0
Total % n/n-1 -19,8% 16,0% 2,1% 2,2%
5. Deduction of costs allocated to exempted VFR flights (in nominal terms)
5.1 Tota l costs 32,8 26,9 31,8 33,1 34,5 30,3
5.2 Costs for exempted VFR fl ights 0,0 0,0 0,0 0,0 0,0 0,0
5.3 Tota l costs after deduction (3) 32,8 26,9 31,8 33,1 34,5 30,3
Costs and asset base items in '000 000 Euro - Service units in '000 000
(1) Forecast inflation used for establishing the determined costs in nominal terms - actual inflation
(2) Determined costs (performance plan) in real terms - actual costs in real terms - base 100 in 2009
(3) Determined costs (after deduction of VFR costs) reported at line 1.1 - Reporting Table 2 (in nominal terms)
*Forecast data used for the calculation of the corresponding unit rates (i.e. November 2009 data for 2010 F; November 2010 data for 2011 F)
Table 1 - Total Costs
Period of reference : 2012-2014
Actual costsForecast Costs* Determined Costs
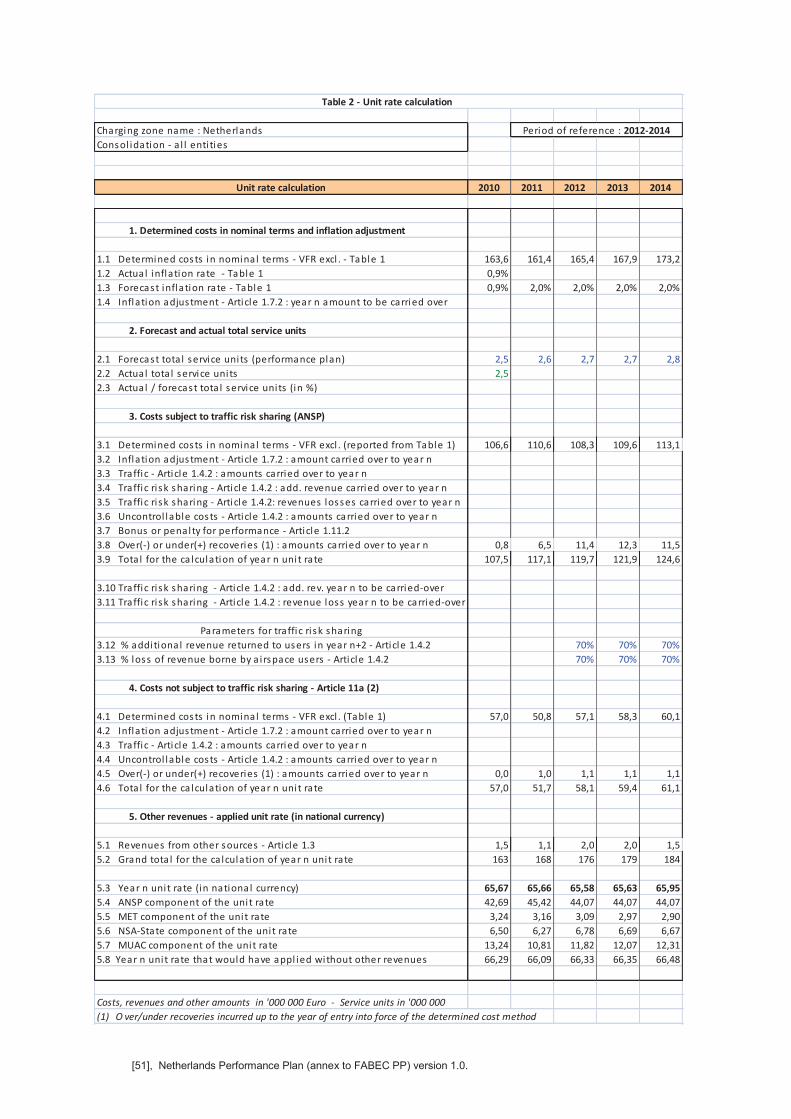
[51], Netherlands Performance Plan (annex to FABEC PP) version 1.0.
Charging zone name : Netherlands
Consol idation - a l l enti ties
Unit rate calculation 2010 2011 2012 2013 2014
1. Determined costs in nominal terms and inflation adjustment
1.1 Determined costs in nominal terms - VFR excl . - Table 1 163,6 161,4 165,4 167,9 173,2
1.2 Actual inflation rate - Table 1 0,9%
1.3 Forecast inflation rate - Table 1 0,9% 2,0% 2,0% 2,0% 2,0%
1.4 Inflation adjustment - Article 1.7.2 : year n amount to be carried over
2. Forecast and actual total service units
2.1 Forecast tota l service units (performance plan) 2,5 2,6 2,7 2,7 2,8
2.2 Actual tota l service units 2,5
2.3 Actual / forecast tota l service units (in %)
3. Costs subject to traffic risk sharing (ANSP)
3.1 Determined costs in nominal terms - VFR excl . (reported from Table 1) 106,6 110,6 108,3 109,6 113,1
3.2 Inflation adjustment - Article 1.7.2 : amount carried over to year n
3.3 Traffic - Article 1.4.2 : amounts carried over to year n
3.4 Traffic ri sk sharing - Article 1.4.2 : add. revenue carried over to year n
3.5 Traffic ri sk sharing - Article 1.4.2: revenues losses carried over to year n
3.6 Uncontrol lable costs - Article 1.4.2 : amounts carried over to year n
3.7 Bonus or penalty for performance - Article 1.11.2
3.8 Over(-) or under(+) recoveries (1) : amounts carried over to year n 0,8 6,5 11,4 12,3 11,5
3.9 Tota l for the ca lculation of year n unit rate 107,5 117,1 119,7 121,9 124,6
3.10 Traffic ri sk sharing - Article 1.4.2 : add. rev. year n to be carried-over
3.11 Traffic ri sk sharing - Article 1.4.2 : revenue loss year n to be carried-over
Parameters for traffic ri sk sharing
3.12 % additional revenue returned to users in year n+2 - Article 1.4.2 70% 70% 70%
3.13 % loss of revenue borne by a i rspace users - Article 1.4.2 70% 70% 70%
4. Costs not subject to traffic risk sharing - Article 11a (2)
4.1 Determined costs in nominal terms - VFR excl . (Table 1) 57,0 50,8 57,1 58,3 60,1
4.2 Inflation adjustment - Article 1.7.2 : amount carried over to year n
4.3 Traffic - Article 1.4.2 : amounts carried over to year n
4.4 Uncontrol lable costs - Article 1.4.2 : amounts carried over to year n
4.5 Over(-) or under(+) recoveries (1) : amounts carried over to year n 0,0 1,0 1,1 1,1 1,1
4.6 Tota l for the ca lculation of year n unit rate 57,0 51,7 58,1 59,4 61,1
5. Other revenues - applied unit rate (in national currency)
5.1 Revenues from other sources - Article 1.3 1,5 1,1 2,0 2,0 1,5
5.2 Grand tota l for the ca lculation of year n unit rate 163 168 176 179 184
5.3 Year n unit rate (in national currency) 65,67 65,66 65,58 65,63 65,95
5.4 ANSP component of the unit rate 42,69 45,42 44,07 44,07 44,07
5.5 MET component of the unit rate 3,24 3,16 3,09 2,97 2,90
5.6 NSA-State component of the unit rate 6,50 6,27 6,78 6,69 6,67
5.7 MUAC component of the unit rate 13,24 10,81 11,82 12,07 12,31
5.8 Year n unit rate that would have appl ied without other revenues 66,29 66,09 66,33 66,35 66,48
Costs, revenues and other amounts in '000 000 Euro - Service units in '000 000
(1) O ver/under recoveries incurred up to the year of entry into force of the determined cost method
Period of reference : 2012-2014
Table 2 - Unit rate calculation
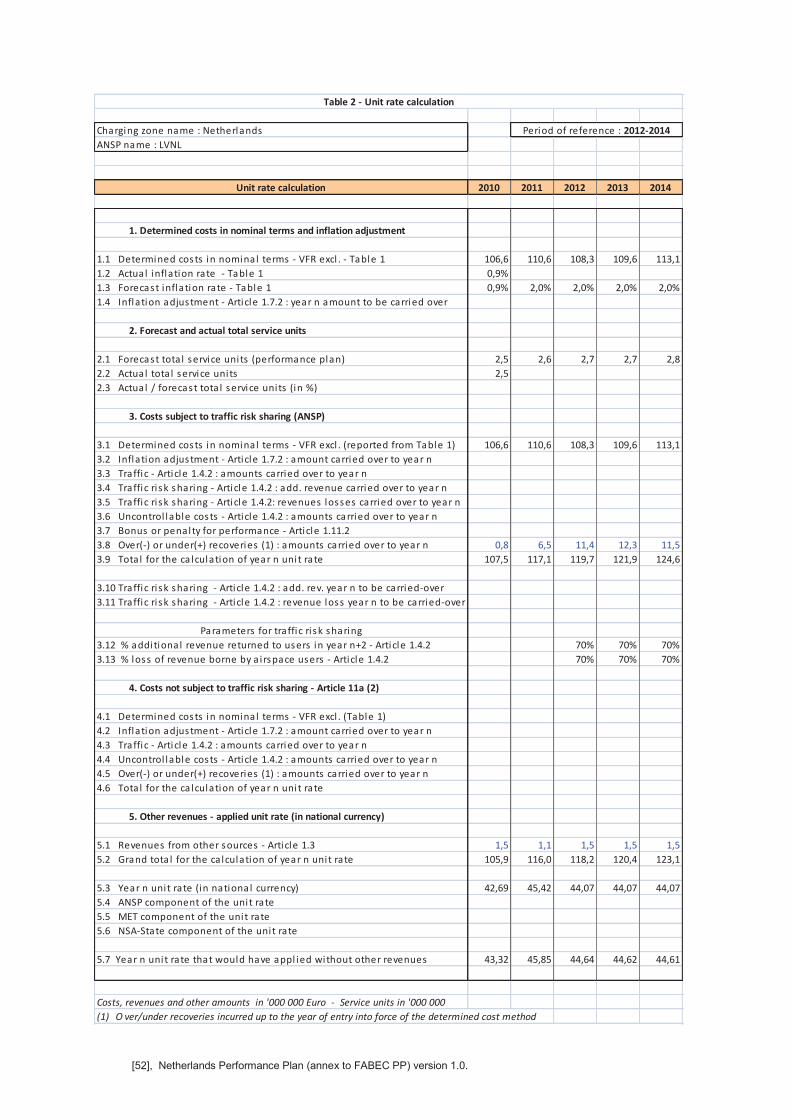
[52], Netherlands Performance Plan (annex to FABEC PP) version 1.0.
Charging zone name : Netherlands
ANSP name : LVNL
Unit rate calculation 2010 2011 2012 2013 2014
1. Determined costs in nominal terms and inflation adjustment
1.1 Determined costs in nominal terms - VFR excl . - Table 1 106,6 110,6 108,3 109,6 113,1
1.2 Actual inflation rate - Table 1 0,9%
1.3 Forecast inflation rate - Table 1 0,9% 2,0% 2,0% 2,0% 2,0%
1.4 Inflation adjustment - Article 1.7.2 : year n amount to be carried over
2. Forecast and actual total service units
2.1 Forecast tota l service units (performance plan) 2,5 2,6 2,7 2,7 2,8
2.2 Actual tota l service units 2,5
2.3 Actual / forecast tota l service units (in %)
3. Costs subject to traffic risk sharing (ANSP)
3.1 Determined costs in nominal terms - VFR excl . (reported from Table 1) 106,6 110,6 108,3 109,6 113,1
3.2 Inflation adjustment - Article 1.7.2 : amount carried over to year n
3.3 Traffic - Article 1.4.2 : amounts carried over to year n
3.4 Traffic ri sk sharing - Article 1.4.2 : add. revenue carried over to year n
3.5 Traffic ri sk sharing - Article 1.4.2: revenues losses carried over to year n
3.6 Uncontrol lable costs - Article 1.4.2 : amounts carried over to year n
3.7 Bonus or penalty for performance - Article 1.11.2
3.8 Over(-) or under(+) recoveries (1) : amounts carried over to year n 0,8 6,5 11,4 12,3 11,5
3.9 Tota l for the ca lculation of year n unit rate 107,5 117,1 119,7 121,9 124,6
3.10 Traffic ri sk sharing - Article 1.4.2 : add. rev. year n to be carried-over
3.11 Traffic ri sk sharing - Article 1.4.2 : revenue loss year n to be carried-over
Parameters for traffic ri sk sharing
3.12 % additional revenue returned to users in year n+2 - Article 1.4.2 70% 70% 70%
3.13 % loss of revenue borne by a i rspace users - Article 1.4.2 70% 70% 70%
4. Costs not subject to traffic risk sharing - Article 11a (2)
4.1 Determined costs in nominal terms - VFR excl . (Table 1)
4.2 Inflation adjustment - Article 1.7.2 : amount carried over to year n
4.3 Traffic - Article 1.4.2 : amounts carried over to year n
4.4 Uncontrol lable costs - Article 1.4.2 : amounts carried over to year n
4.5 Over(-) or under(+) recoveries (1) : amounts carried over to year n
4.6 Tota l for the ca lculation of year n unit rate
5. Other revenues - applied unit rate (in national currency)
5.1 Revenues from other sources - Article 1.3 1,5 1,1 1,5 1,5 1,5
5.2 Grand tota l for the ca lculation of year n unit rate 105,9 116,0 118,2 120,4 123,1
5.3 Year n unit rate (in national currency) 42,69 45,42 44,07 44,07 44,07
5.4 ANSP component of the unit rate
5.5 MET component of the unit rate
5.6 NSA-State component of the unit rate
5.7 Year n unit rate that would have appl ied without other revenues 43,32 45,85 44,64 44,62 44,61
Costs, revenues and other amounts in '000 000 Euro - Service units in '000 000
(1) O ver/under recoveries incurred up to the year of entry into force of the determined cost method
Period of reference : 2012-2014
Table 2 - Unit rate calculation

[53], Netherlands Performance Plan (annex to FABEC PP) version 1.0.
Charging zone name : Netherlands
MET Service provider name : KNMI
Unit rate calculation 2010 2011 2012 2013 2014
1. Determined costs in nominal terms and inflation adjustment
1.1 Determined costs in nominal terms - VFR excl . - Table 1 8,0 7,9 7,7 7,5 7,5
1.2 Actual inflation rate - Table 1
1.3 Forecast inflation rate - Table 1 0,9% 2,0% 2,0% 2,0% 2,0%
1.4 Inflation adjustment - Article 1.7.2 : year n amount to be carried over
2. Forecast and actual total service units
2.1 Forecast tota l service units (performance plan) 2,5 2,6 2,7 2,7 2,8
2.2 Actual tota l service units 2,5
2.3 Actual / forecast tota l service units (in %)
3. Costs subject to traffic risk sharing (ANSP)
3.1 Determined costs in nominal terms - VFR excl . (reported from Table 1)
3.2 Inflation adjustment - Article 1.7.2 : amount carried over to year n
3.3 Traffic - Article 1.4.2 : amounts carried over to year n
3.4 Traffic ri sk sharing - Article 1.4.2 : add. revenue carried over to year n
3.5 Traffic ri sk sharing - Article 1.4.2: revenues losses carried over to year n
3.6 Uncontrol lable costs - Article 1.4.2 : amounts carried over to year n
3.7 Bonus or penalty for performance - Article 1.11.2
3.8 Over(-) or under(+) recoveries (1) : amounts carried over to year n
3.9 Tota l for the ca lculation of year n unit rate
3.10 Traffic ri sk sharing - Article 1.4.2 : add. rev. year n to be carried-over
3.11 Traffic ri sk sharing - Article 1.4.2 : revenue loss year n to be carried-over
Parameters for traffic ri sk sharing
3.12 % additional revenue returned to users in year n+2 - Article 1.4.2
3.13 % loss of revenue borne by a i rspace users - Article 1.4.2
4. Costs not subject to traffic risk sharing - Article 11a (2)
4.1 Determined costs in nominal terms - VFR excl . (Table 1) 8,0 7,9 7,7 7,5 7,5
4.2 Inflation adjustment - Article 1.7.2 : amount carried over to year n
4.3 Traffic - Article 1.4.2 : amounts carried over to year n
4.4 Uncontrol lable costs - Article 1.4.2 : amounts carried over to year n
4.5 Over(-) or under(+) recoveries (1) : amounts carried over to year n 0,0 0,2 0,6 0,6 0,6
4.6 Tota l for the ca lculation of year n unit rate 8,0 8,1 8,3 8,1 8,1
5. Other revenues - applied unit rate (in national currency)
5.1 Revenues from other sources - Article 1.3 0,0 0,0 0,0 0,0 0,0
5.2 Grand tota l for the ca lculation of year n unit rate 8,0 8,1 8,3 8,1 8,1
5.3 Year n unit rate (in national currency) 3,24 3,16 3,09 2,97 2,90
5.4 ANSP component of the unit rate
5.5 MET component of the unit rate
5.6 NSA-State component of the unit rate
5.7 Year n unit rate that would have appl ied without other revenues 3,24 3,16 3,09 2,97 2,90
Costs, revenues and other amounts in '000 000 Euro - Service units in '000 000
(1) O ver/under recoveries incurred up to the year of entry into force of the determined cost method
Period of reference : 2012-2014
Table 2 - Unit rate calculation
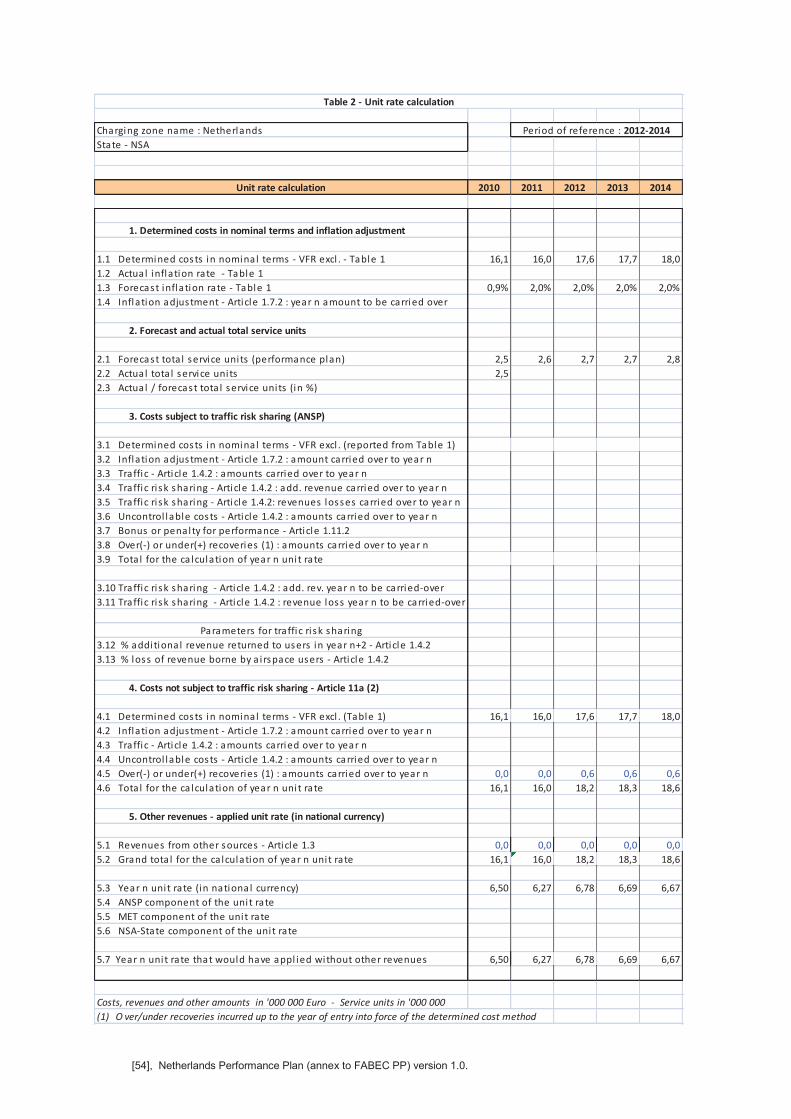
[54], Netherlands Performance Plan (annex to FABEC PP) version 1.0.
Charging zone name : Netherlands
State - NSA
Unit rate calculation 2010 2011 2012 2013 2014
1. Determined costs in nominal terms and inflation adjustment
1.1 Determined costs in nominal terms - VFR excl . - Table 1 16,1 16,0 17,6 17,7 18,0
1.2 Actual inflation rate - Table 1
1.3 Forecast inflation rate - Table 1 0,9% 2,0% 2,0% 2,0% 2,0%
1.4 Inflation adjustment - Article 1.7.2 : year n amount to be carried over
2. Forecast and actual total service units
2.1 Forecast tota l service units (performance plan) 2,5 2,6 2,7 2,7 2,8
2.2 Actual tota l service units 2,5
2.3 Actual / forecast tota l service units (in %)
3. Costs subject to traffic risk sharing (ANSP)
3.1 Determined costs in nominal terms - VFR excl . (reported from Table 1)
3.2 Inflation adjustment - Article 1.7.2 : amount carried over to year n
3.3 Traffic - Article 1.4.2 : amounts carried over to year n
3.4 Traffic ri sk sharing - Article 1.4.2 : add. revenue carried over to year n
3.5 Traffic ri sk sharing - Article 1.4.2: revenues losses carried over to year n
3.6 Uncontrol lable costs - Article 1.4.2 : amounts carried over to year n
3.7 Bonus or penalty for performance - Article 1.11.2
3.8 Over(-) or under(+) recoveries (1) : amounts carried over to year n
3.9 Tota l for the ca lculation of year n unit rate
3.10 Traffic ri sk sharing - Article 1.4.2 : add. rev. year n to be carried-over
3.11 Traffic ri sk sharing - Article 1.4.2 : revenue loss year n to be carried-over
Parameters for traffic ri sk sharing
3.12 % additional revenue returned to users in year n+2 - Article 1.4.2
3.13 % loss of revenue borne by a i rspace users - Article 1.4.2
4. Costs not subject to traffic risk sharing - Article 11a (2)
4.1 Determined costs in nominal terms - VFR excl . (Table 1) 16,1 16,0 17,6 17,7 18,0
4.2 Inflation adjustment - Article 1.7.2 : amount carried over to year n
4.3 Traffic - Article 1.4.2 : amounts carried over to year n
4.4 Uncontrol lable costs - Article 1.4.2 : amounts carried over to year n
4.5 Over(-) or under(+) recoveries (1) : amounts carried over to year n 0,0 0,0 0,6 0,6 0,6
4.6 Tota l for the ca lculation of year n unit rate 16,1 16,0 18,2 18,3 18,6
5. Other revenues - applied unit rate (in national currency)
5.1 Revenues from other sources - Article 1.3 0,0 0,0 0,0 0,0 0,0
5.2 Grand tota l for the ca lculation of year n unit rate 16,1 16,0 18,2 18,3 18,6
5.3 Year n unit rate (in national currency) 6,50 6,27 6,78 6,69 6,67
5.4 ANSP component of the unit rate
5.5 MET component of the unit rate
5.6 NSA-State component of the unit rate
5.7 Year n unit rate that would have appl ied without other revenues 6,50 6,27 6,78 6,69 6,67
Costs, revenues and other amounts in '000 000 Euro - Service units in '000 000
(1) O ver/under recoveries incurred up to the year of entry into force of the determined cost method
Period of reference : 2012-2014
Table 2 - Unit rate calculation

[55], Netherlands Performance Plan (annex to FABEC PP) version 1.0.
Charging zone name : Netherlands
MUAC
Unit rate calculation 2010 2011 2012 2013 2014
1. Determined costs in nominal terms and inflation adjustment
1.1 Determined costs in nominal terms - VFR excl . - Table 1 32,8 26,9 31,8 33,1 34,5
1.2 Actual inflation rate - Table 1
1.3 Forecast inflation rate - Table 1 0,9% 2,0% 2,0% 2,0% 2,0%
1.4 Inflation adjustment - Article 1.7.2 : year n amount to be carried over
2. Forecast and actual total service units
2.1 Forecast tota l service units (performance plan) 2,5 2,6 2,7 2,7 2,8
2.2 Actual tota l service units 2,5
2.3 Actual / forecast tota l service units (in %)
3. Costs subject to traffic risk sharing (ANSP)
3.1 Determined costs in nominal terms - VFR excl . (reported from Table 1)
3.2 Inflation adjustment - Article 1.7.2 : amount carried over to year n
3.3 Traffic - Article 1.4.2 : amounts carried over to year n
3.4 Traffic ri sk sharing - Article 1.4.2 : add. revenue carried over to year n
3.5 Traffic ri sk sharing - Article 1.4.2: revenues losses carried over to year n
3.6 Uncontrol lable costs - Article 1.4.2 : amounts carried over to year n
3.7 Bonus or penalty for performance - Article 1.11.2
3.8 Over(-) or under(+) recoveries (1) : amounts carried over to year n
3.9 Tota l for the ca lculation of year n unit rate 0,0 0,0 0,0 0,0 0,0
3.10 Traffic ri sk sharing - Article 1.4.2 : add. rev. year n to be carried-over
3.11 Traffic ri sk sharing - Article 1.4.2 : revenue loss year n to be carried-over
Parameters for traffic ri sk sharing
3.12 % additional revenue returned to users in year n+2 - Article 1.4.2
3.13 % loss of revenue borne by a i rspace users - Article 1.4.2
4. Costs not subject to traffic risk sharing - Article 11a (2)
4.1 Determined costs in nominal terms - VFR excl . (Table 1) 32,8 26,9 31,8 33,1 34,5
4.2 Inflation adjustment - Article 1.7.2 : amount carried over to year n
4.3 Traffic - Article 1.4.2 : amounts carried over to year n
4.4 Uncontrol lable costs - Article 1.4.2 : amounts carried over to year n
4.5 Over(-) or under(+) recoveries (1) : amounts carried over to year n 0,8 -0,1 -0,1 -0,1
4.6 Tota l for the ca lculation of year n unit rate 32,8 27,6 31,7 33,0 34,4
5. Other revenues - applied unit rate (in national currency)
5.1 Revenues from other sources - Article 1.3 0,0 0,5 0,5 0,0
5.2 Grand tota l for the ca lculation of year n unit rate 32,8 27,6 31,2 32,5 34,4
5.3 Year n unit rate (in national currency) (MUAC) 13,24 10,81 11,64 11,90 12,31
5.4 ANSP component of the unit rate
5.5 MET component of the unit rate
5.6 NSA-State component of the unit rate
5.7 Year n unit rate that would have appl ied without other revenues 13,24 10,81 11,82 12,07 12,31
Costs, revenues and other amounts in '000 000 Euro - Service units in '000 000
(1) O ver/under recoveries incurred up to the year of entry into force of the determined cost method
Table 2 - Unit rate calculation
Period of reference : 2012-2014
[56], Netherlands Performance Plan (annex to FABEC PP) version 1.0.
Additional Information on the tables in Annexes II, III and VI of the EU Regulation on the Common Charging Scheme (1794/2006, amended by 1191/2010)
State: Netherlands – FIR Amsterdam en route Definitive data on targeted unit rate 2012 – 2014
Preliminary data on the chargeable unit rate for the period 2012 - 2014
General information
Introduction Under the Commission Regulation (EC) No 1794/2006 of 6 December 2006 laying down a common charging scheme for air navigation services, particularly Chapter II (the cost of Air Navigation Service Provision), every year the reporting tables on cost bases, planned investments and expected traffic as well as the reporting table on charging mechanisms have to be filled in. A description/explanation is given below of the way in which these tables have been filled in. Charging zones This part describes the charging system in the Netherlands. In 2008, two charging zones were established in the Netherlands airspace. An en route charging zone has been introduced, covering the whole of the Flight Information Region (FIR) Amsterdam, which consists of the airspace beyond a radius of 20 km (= 12 nautical miles) around LVNL controlled airports above flight level (FL) 30 (~ 3000 feet). Service units are calculated in line with the annexes to Regulation 1794/2006. A single cost base and a single unit rate are applicable to this charging zone, except for helicopter flights in the North Sea Area Amsterdam. A separate charge is applicable to these flights. Maastricht Upper Area Control Centre (MUAC) provides en route air navigation services (ANS) from FL 245. LVNL (Air Traffic Control the Netherlands) provides en route ANS in the air space beyond a radius of 20 km (= 12 nautical miles) around the airports above FL 30 up to FL 245. The approach services in this part of the airspace are part of the en route services. On the basis of operational requirements the ANS approach costs are allocated to the en route charging zone. KNMI has been designated as ANS Provider for meteorological services (MET) in the FIR Amsterdam There is no competition in the field of air navigation services in the Netherlands, Article 1.6 of Regulation 1794/2006 is not applicable. Since January 1
st 2008, both the en route service and the terminal service units are calculated in line with
Regulation 1794/2006. The unit rates and their underlying national costs (cost bases) are calculated in line with Commission Regulation 1794/2006, while observing the Eurocontrol principles for establishing the cost base for en route facility charges and the calculation of the unit rates as well as the conditions of application of the route charges system and conditions of payment. Both LVNL and KNMI have introduced new cost allocation models as of January 1
st 2009 LVNL also applied
this model on its Annual Report 2008. These models and the underlying allocation principles are in line with Regulation 1794/2006 and the other Regulations. The LVNL model has been simplified in 2010. This change had no effects on the allocation of costs to the various charging zones.
International Financial Reporting Standards (IFRS) Under article 12 of the Service Provision Regulation (EC no 550/2004) the accounts of ANSPs have to comply with the IFRS to the maximum possible extent. LVNL As of 2008 the LVNL financial statements comply with IFRS with the exception of the provisions related to the early retirement arrangements of the operational LVNL-staff (FLNA; IAS 19 IFRS). The Netherlands has decided to exclude this specific item from the IFRS implementation. As a consequence of this decision neither the FLNA obligations nor a related provision is presented as liabilities in the LVNL balance sheet. As
[57], Netherlands Performance Plan (annex to FABEC PP) version 1.0.
in the past users will only be charged for the actual FLNA expenses. According to actuarial calculations of December 31
st 2010, the net present value of the defined benefit obligations is about
M€ 250, including the standard tax penalty of 52%). To minimize the lack of transparency on this issue, LVNL presents these obligations as ‘off-balance sheet rights and commitments’. KNMI Under Article 12 of the Service Provision Regulation (EC no 550/2004) the accounts of KNMI have to comply with IFRS to the maximum possible extent. From 2011 onwards the financial statements of KNMI have been as much as possible drawn up in accordance to IFRS. A few issues remain which could not be dealt with according to IFRS due to the national legal rules and regulations . These issues are described in the financial statements of KNMI. Since January 2009 the under or over recovery of the charges due to the traffic volume changes and the costs are included in the KNMI balance, instead of the LVNL balance. Since the start of 2011 KNMI receives its part of the Dutch en route charge directly from CRCO. MUAC and Eurocontrol The financial impact of non-recurring effects of the introduction of IFRS in the 2011 cost base of MUAC is estimated at M€ 2,632 and will be reduced from the cost base. From 2012 onwards, these one-off effects will not influence the cost base any more. The cost base will resume to the previous levels. For the calculation of the 2011 baseline these non-recurring IFRS effects have not been taken into account in the calculation of the targeted determined unit rate .
State costs The Eurocontrol, ICAO/SADIS and NSA costs are classified as State costs. All these costs are included in the NSA cost spreadsheet. The non-recurring effects of the introduction of IFRS in the 2011 cost base of Eurocontrol is M€ 1.615. These non-recurring effects are allocated to the cost base 2011. From 2012 onwards these effects will not affect the cost base anymore. Thus, the cost base will return to the previous levels. In the calculation of the targeted unit rate these non-recurring IFRS effects have not been taken into account. The termination of MUAC/ASRO (Agency Safety Regulatory Oversight) and the transfer of ASRO activities to the Dutch NSA, the development of the EU-wide performance scheme (Performance Implementing Rule), the increase in FABEC-related activities, international NSA cooperation and coordination and NSA ATM EASA activities have led to a considerable increase in the oversight workload and thus to an increase in the oversight costs. Unit rates, costs and cost allocation model Determined costs are defined by the European Commission as the costs which are considered necessary to be made in each of the years of the performance plan reference period to provide the forecasted number of air navigation service units, given the level of the targets for capacity and environment while assuming the safety level will at least remain at the same level. In line with Article 7 of Regulation 1794/2006, the cost of all eligible services, facilities and activities as defined in Article 5 of the Regulation, have been allocated, in a transparent manner, to the charging zones, where they have been actually made. As of 1
st January 2009, both LVNL and KNMI have introduced a new
and more sophisticated cost allocation model. The targeted unit rates and their underlying national costs are in line with the Commission Regulation 1794/2006, while observing the Eurocontrol principles for establishing the cost base for en route facility charges and the calculation of the unit rates as well as the conditions of application of the route charges system and conditions of payment. Enforced recovery Enforcement measures to secure payment of the charges by the users will enter into force in 2011. Possible enforcements will take place in close cooperation with Eurocontrol (CRCO). Consultation In line with the Commission Regulations 1794/2006 (amended by Regulation 1191/2010) and 691/2010 the Ministry of Infrastructure and the Environment organises Dutch Stakeholder Consultation Meetings. At this meetings under the chairmanship of the Ministry LVNL, MUAC and KNMI present their plans on the
[58], Netherlands Performance Plan (annex to FABEC PP) version 1.0.
Performance KPAs, as well as ways to improve their performance and the unit rates to be applied. The Netherlands contributed also to the FABEC consultation meeting on the provisional FABEC Performance Plan, albeit that the cost efficiency performance is dealt with at national level. At FABEC level both the consolidated FABEC performance and the national performance have been presented just for information purposes. Furthermore, the Eurocontrol Enlarged Committee organises Multilateral User Consultation Meetings on the en route charging schemes, while the European Commission organises meetings on the terminal charging schemes (costs, unit rates, etc.). Costs General information This part describes the developments in the costs to be allocated to the en route charging zone. Inflation In 2010 inflation in the Netherlands was 0,9% (Source: Eurostat, Harmonised Index of Consumer Prices (HICP). Based on the economic forecasts of both IMF WEO and CPB Economic Policy Analysis the inflation rate is set at an average rate of 2% per year. LVNL LVNL has taken a number of cost containment measures for the period 2010 up to and including 2014. Internal cost reduction measures have been taken, such as a cut in staff of 100 fte in 2010 and an additional reduction of 28 fte in the period 2012 - 2014, a salary freeze in 2010, an anticipation of the R&D activities within the SESAR project and a decrease in general operating costs (about M€ 10) and in capital costs. Regarding the latter LVNL agreed with the Ministry of Infrastructure and the Environment on a funding arrangement for the investment plan of the coming years. This funding through the State will reduce the cost of capital. Furthermore, the Dutch government has also taken some measures, inter alia the permission to establish an equalisation provision, government funding of past under recoveries due to the TNC service provision on the regional LVNL controlled airports, access to loan facilities (both operating and investments) and the earmarking of the net available amount of internal tax to the TNC cost base. NSA costs have been redistributed and (from 2011 onwards) included in under “Other State costs”. With these cost containment measures and the expected recovery of the traffic volume it is possible to decrease the LVNL component of the en route unit rate with 1% for 2012 to € 44,07 and to freeze it on this level for the years 2013 and 2014. Equity capital LVNL It was decided to apply the volume risk as of the first reference period despite a lack of equity. During the first reference period (RP1) of the performance plan LVNL will build an equity capital to cope with the traffic volume risk. At the end of RP1 there will be an equity capital of at least M€ 22. Rationale At the moment LVNL is fully debt financed. It has no equity capital to absorb negative operating results. Due to the absence of any equity capital and the negative en route and terminal appropriation funds (together about M€ 35 at the end of 2010) LVNL is already nearing the limits of a sound financial situation. Continuation of the current situation could lead to possible non compliance with the Common Requirements on financial strength (and could thus possibly jeopardize LVNL’s certification), even in a full cost recovery situation. Exposure to the newly introduced traffic volume risk and cost risk will worsen LVNL’s financial risk profile. In the EU Regulation 1794/2010, laying down a common charging scheme, amended by EU Regulation 1191/2010, the necessity of equity capital is acknowledged. Article 11a.7 allows ANSPs with an equity capital below 5% of total liabilities to be temporarily exempted from the traffic volume risk. If the traffic risk is exempted the performance plan has to include a description of the measures to achieve a lower proportion of debt financing as well as the duration of these measures.
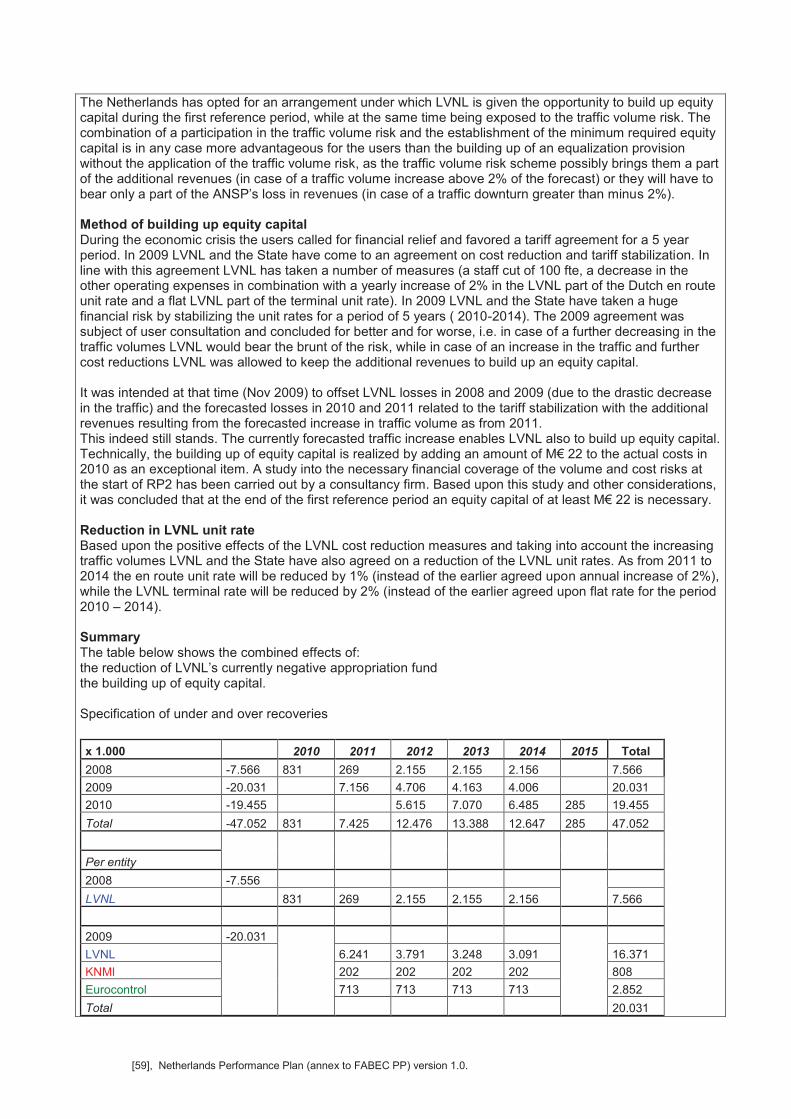
[59], Netherlands Performance Plan (annex to FABEC PP) version 1.0.
The Netherlands has opted for an arrangement under which LVNL is given the opportunity to build up equity capital during the first reference period, while at the same time being exposed to the traffic volume risk. The combination of a participation in the traffic volume risk and the establishment of the minimum required equity capital is in any case more advantageous for the users than the building up of an equalization provision without the application of the traffic volume risk, as the traffic volume risk scheme possibly brings them a part of the additional revenues (in case of a traffic volume increase above 2% of the forecast) or they will have to bear only a part of the ANSP’s loss in revenues (in case of a traffic downturn greater than minus 2%). Method of building up equity capital During the economic crisis the users called for financial relief and favored a tariff agreement for a 5 year period. In 2009 LVNL and the State have come to an agreement on cost reduction and tariff stabilization. In line with this agreement LVNL has taken a number of measures (a staff cut of 100 fte, a decrease in the other operating expenses in combination with a yearly increase of 2% in the LVNL part of the Dutch en route unit rate and a flat LVNL part of the terminal unit rate). In 2009 LVNL and the State have taken a huge financial risk by stabilizing the unit rates for a period of 5 years ( 2010-2014). The 2009 agreement was subject of user consultation and concluded for better and for worse, i.e. in case of a further decreasing in the traffic volumes LVNL would bear the brunt of the risk, while in case of an increase in the traffic and further cost reductions LVNL was allowed to keep the additional revenues to build up an equity capital. It was intended at that time (Nov 2009) to offset LVNL losses in 2008 and 2009 (due to the drastic decrease in the traffic) and the forecasted losses in 2010 and 2011 related to the tariff stabilization with the additional revenues resulting from the forecasted increase in traffic volume as from 2011. This indeed still stands. The currently forecasted traffic increase enables LVNL also to build up equity capital. Technically, the building up of equity capital is realized by adding an amount of M€ 22 to the actual costs in 2010 as an exceptional item. A study into the necessary financial coverage of the volume and cost risks at the start of RP2 has been carried out by a consultancy firm. Based upon this study and other considerations, it was concluded that at the end of the first reference period an equity capital of at least M€ 22 is necessary. Reduction in LVNL unit rate Based upon the positive effects of the LVNL cost reduction measures and taking into account the increasing traffic volumes LVNL and the State have also agreed on a reduction of the LVNL unit rates. As from 2011 to 2014 the en route unit rate will be reduced by 1% (instead of the earlier agreed upon annual increase of 2%), while the LVNL terminal rate will be reduced by 2% (instead of the earlier agreed upon flat rate for the period 2010 – 2014). Summary The table below shows the combined effects of: the reduction of LVNL’s currently negative appropriation fund the building up of equity capital. Specification of under and over recoveries
x 1.000 2010 2011 2012 2013 2014 2015 Total
2008 -7.566 831 269 2.155 2.155 2.156 7.566
2009 -20.031 7.156 4.706 4.163 4.006 20.031
2010 -19.455 5.615 7.070 6.485 285 19.455
Total -47.052 831 7.425 12.476 13.388 12.647 285 47.052
Per entity
2008 -7.556
LVNL 831 269 2.155 2.155 2.156 7.566
2009 -20.031
LVNL 6.241 3.791 3.248 3.091 16.371
KNMI 202 202 202 202 808
Eurocontrol 713 713 713 713 2.852
Total 20.031
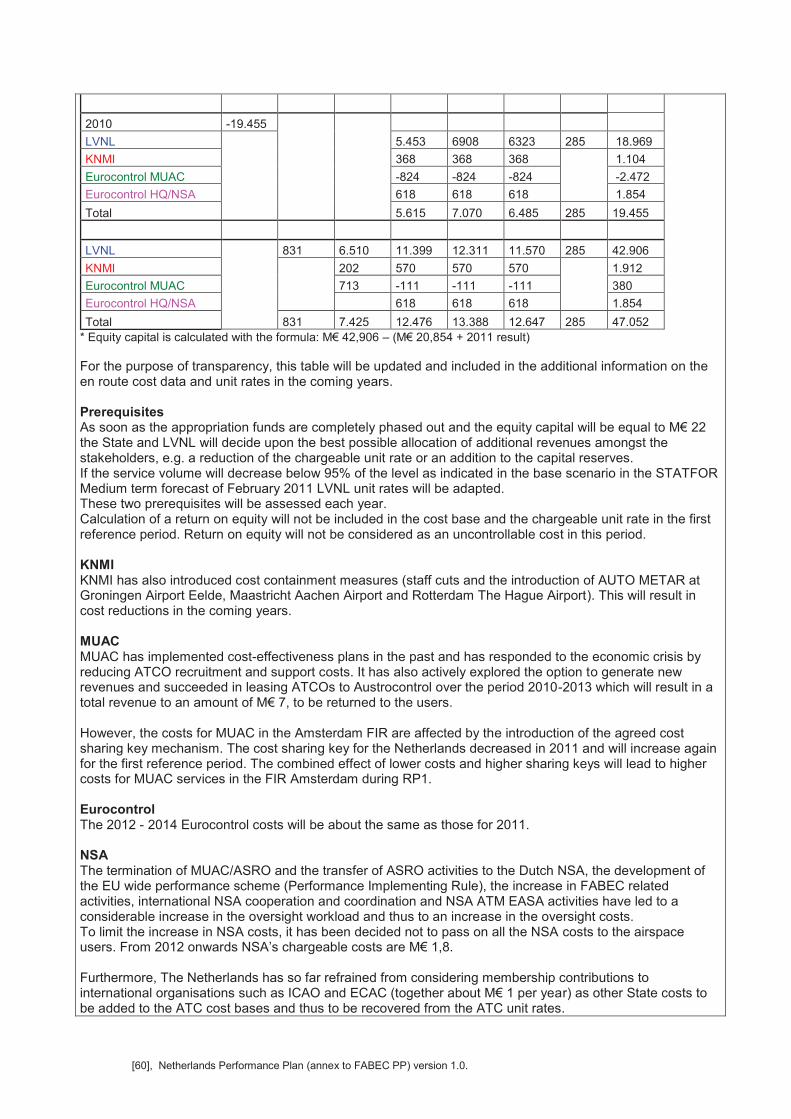
[60], Netherlands Performance Plan (annex to FABEC PP) version 1.0.
2010 -19.455
LVNL 5.453 6908 6323 285 18.969
KNMI 368 368 368 1.104
Eurocontrol MUAC -824 -824 -824 -2.472
Eurocontrol HQ/NSA 618 618 618 1.854
Total 5.615 7.070 6.485 285 19.455
LVNL 831 6.510 11.399 12.311 11.570 285 42.906
KNMI 202 570 570 570 1.912
Eurocontrol MUAC 713 -111 -111 -111 380
Eurocontrol HQ/NSA 618 618 618 1.854
Total 831 7.425 12.476 13.388 12.647 285 47.052
* Equity capital is calculated with the formula: M€ 42,906 – (M€ 20,854 + 2011 result)
For the purpose of transparency, this table will be updated and included in the additional information on the en route cost data and unit rates in the coming years. Prerequisites As soon as the appropriation funds are completely phased out and the equity capital will be equal to M€ 22 the State and LVNL will decide upon the best possible allocation of additional revenues amongst the stakeholders, e.g. a reduction of the chargeable unit rate or an addition to the capital reserves. If the service volume will decrease below 95% of the level as indicated in the base scenario in the STATFOR Medium term forecast of February 2011 LVNL unit rates will be adapted. These two prerequisites will be assessed each year. Calculation of a return on equity will not be included in the cost base and the chargeable unit rate in the first reference period. Return on equity will not be considered as an uncontrollable cost in this period. KNMI KNMI has also introduced cost containment measures (staff cuts and the introduction of AUTO METAR at Groningen Airport Eelde, Maastricht Aachen Airport and Rotterdam The Hague Airport). This will result in cost reductions in the coming years. MUAC MUAC has implemented cost-effectiveness plans in the past and has responded to the economic crisis by reducing ATCO recruitment and support costs. It has also actively explored the option to generate new revenues and succeeded in leasing ATCOs to Austrocontrol over the period 2010-2013 which will result in a total revenue to an amount of M€ 7, to be returned to the users. However, the costs for MUAC in the Amsterdam FIR are affected by the introduction of the agreed cost sharing key mechanism. The cost sharing key for the Netherlands decreased in 2011 and will increase again for the first reference period. The combined effect of lower costs and higher sharing keys will lead to higher costs for MUAC services in the FIR Amsterdam during RP1. Eurocontrol The 2012 - 2014 Eurocontrol costs will be about the same as those for 2011. NSA The termination of MUAC/ASRO and the transfer of ASRO activities to the Dutch NSA, the development of the EU wide performance scheme (Performance Implementing Rule), the increase in FABEC related activities, international NSA cooperation and coordination and NSA ATM EASA activities have led to a considerable increase in the oversight workload and thus to an increase in the oversight costs. To limit the increase in NSA costs, it has been decided not to pass on all the NSA costs to the airspace users. From 2012 onwards NSA’s chargeable costs are M€ 1,8. Furthermore, The Netherlands has so far refrained from considering membership contributions to international organisations such as ICAO and ECAC (together about M€ 1 per year) as other State costs to be added to the ATC cost bases and thus to be recovered from the ATC unit rates.
[61], Netherlands Performance Plan (annex to FABEC PP) version 1.0.
The 2014 targeted determined unit rate in the FIR Amsterdam will show a decrease of more than 9% compared with 2011. This is almost in line with the EU-wide cost efficiency target. The 2012 chargeable en route unit rate in the FIR Amsterdam will show an increase from € 65,67 in 2011 to € 65,80 in 2012. Taking into account the inflation rate in The Netherlands this is an actual decrease of the unit rate. Cost by nature LVNL Staff costs: The change is due to: In the period 2012-2014 a reduction in staff with 28 FTE; In the period 2012-2014 a salary compensation related to the increase in the cost of living will be between 1-1,5%; Increased pension premiums to bring the pension coverage ratio again at the minimum level; The, as a rule, individually agreed upon annual steps in salary grades (career progression); Intake of candidate controllers due to the current shortage (also in preparation of a future demand increase (prevention of future capacity problems). Other operating costs This cost category shows a slight increase due to an increase in energy and housekeeping costs after a decrease of over 20% in 2010. Depreciation costs An increase in the depreciation costs is due to new investments, e.g. Voice Communication System (2014). The investment program was subject to the user and stakeholder consultations in 2011. Capital costs The average operating capital is the sum of the average net book value of fixed assets used by the air navigation service provider in operation or under construction (average long term assets (complementary information) and of the average value of the net current assets. In both cases, assets are those required for the provision of en route services; The cost of capital before tax is the weighted average of the interest rate on debts. As LVNL does not have equity capital the cost of capital before tax is the weighted average of the interest rate on debts (in %). Part of the LVNL debt consists of commercial loans, the remaining part consists of government loans. It is LVNL’s intent to decrease the portion of the commercial loans and fulfil all future funding needs through the funding arrangements with the State. As LVNL will in the future be exposed to the traffic volume risk and the cost risk, the building up of an equity capital is necessary to absorb fluctuations in its operating results. In the first reference period equity capital will be established to cover for the volume risk. Exceptional items There are no exceptional items Other income stems from the sale of Aeronautical publications, hardware maintenance services for third parties and space rental to third parties. KNMI The interest rate is the same as the one used by LVNL. Due to its status as Government Agency KNMI has only a very small equity capital. MUAC Due to its status as part of an intergovernmental organisation MUAC does not have any equity capital. For the first reference period, MUAC is exempted from traffic volume risk. From the start of the second reference period MUAC will be exposed to the traffic volume risk and the cost risk. Thus, MUAC also has to build up of an equity capital to absorb fluctuations in its operating results. The method of building up this equity capital is still object of study and consultation.

[62], Netherlands Performance Plan (annex to FABEC PP) version 1.0.
By service The more sophisticated cost allocation model (introduced as of 1
st January 2009) enables both LVNL and
KNMI to fill in both reporting tables on costs by nature and on costs by service simultaneously.

[63], Netherlands Performance Plan (annex to FABEC PP) version 1.0.
Annex II, Transparency of the cost base
1. Description of the methodology used for allocating costs of facilities or services between different air navigation services based on the list of facilities and services listed in the relevant ICAO Regional Air Navigation Plan (Doc 7754) and a description of the methodology used for allocating those costs between different en route charging zones;
Conformity of cost allocation model with regulations The cost allocation models used by both LVNL and by KNMI are in line with: The Convention on International Civil Aviation (ICAO-Treaty; Chicago Convention), Article
15 and the ICAO Rules en Standards: Ø ICAO’s policies on charges for airports and air navigation services (Doc 9082/7), viz.
numbers 36, 38, 40, 41 en 44; Ø ICAO Manual on Air Navigation Services Economics (Doc 9161);
Commission Regulation (EC) No 1794/2006 of 6th December 2006 laying down a common
charging scheme for air navigation services as amended by Commission regulation (EC) No 1191/2011 of 16
th December 2010;
Eurocontrol International Convention relating to Co-operation for the safety of Air Navigation (“Eurocontrol”, 1961), as amended by Protocol of 12
th February 1981;
Ø Protocol consolidating the Eurocontrol International Convention relating to Co-operation for the safety of Air Navigation, dated 27
th June 1997 (Revised Convention);
Ø Multilateral Agreement Relating to Route Charges; to be replaced by Annex IV of the Revised Convention;
Ø Agreement relating to the provision and operation of air traffic services and facilities by Eurocontrol at Maastricht Upper Area Control Centre” (dated 25
th November 1986);
Ø Principles for establishing the cost-base for en route charges and the calculation of the unit rates (latest version);
Ø Conditions of application of the route charges system and conditions of payment (latest version)
The cost allocation model of KNMI is also in line with:
Convention of the World Meteorological Organization, adopted by the Washington Conference on 11
th October 1947;
Guide 904 of the World Meteorological Organization – Guide on Aeronautical Services Cost Recovery – Principles and Guidance;
Annex 3 to the Convention on International Civil Aviation - Meteorological Service for International Air Navigation;
Other relevant ICAO Documents (e.g. Docs 9377, 7604 and 4444); LVNL Article 7 of the amended Commission regulation (EC) 1794/2006 of 6
th December 2006 laying
down a common charging scheme for air navigation services specifies that, where costs are incurred across different charging zones, they shall be allocated in a proportional way on the basis of a transparent methodology as required in Article 8 of the Regulation. Before the start of a performance plan reference period the criteria used to allocate costs between terminal and en route services for each airport have to be defined and reported to the Commission. Since January 1
st 2008, LVNL has reallocated the costs for air navigation services. The costs
for the traffic services related to the approach phase up to flight level 30 (~ 3000 feet) within 20 kilometres (12 NM) from the LVNL controlled airports are allocated to the terminal charging zone on the basis of the operational requirements. The costs for air traffic services related to the approach phase outside this zone are allocated to the en route charging zone. In line with Article 7 of Regulation 1794/2006, the cost of all eligible services, facilities and activities as defined in Article 5 of said Regulation, have been allocated, in a transparent manner, to the charging zones, where they have actually incurred. Costs of ATCOs are directly
[64], Netherlands Performance Plan (annex to FABEC PP) version 1.0.
allocated to the relevant charging zones. Depending on the degree of application of the various production factors in a specific charging zone, sharing keys are used to allocate the other costs proportionally to these charging zones.
About two thirds of the LVNL costs are related and allocated to the en route charging zone.
KNMI
The KNMI allocation model is also in line with Regulation 1794/2006. 82% of KNMI costs are allocated to the en route charging zone.
NSA
Since January 1st 2011 the NSA costs are taken out of the LVNL cost base and transferred to
the NSA en route cost spreadsheet.
The same goes for the SADIS costs. They are mentioned under the heading “Other state costs” in the NSA spread sheet.
MUAC costs
The costs of the MUAC ATC-services allocated to the FIR Amsterdam above FL 245 are incorporated in the separate en route MUAC costs spreadsheet. The allocation of the MUAC costs to the FIR Amsterdam are based on a cost sharing key of 21,7107%. This cost sharing key is fixed during the whole first reference period. MUAC costs are 100% allocated to En-Route. Eurocontrol contribution The Eurocontrol costs, Parts I and IX, allocated to the Netherlands, are included in the consolidated table.
2. Description and explanation of the method adopted for the calculation of depreciation costs: historic costs or current costs. When current cost accounting is adopted, provision of comparable historic cost data;
Historic capitalization costs are used for the calculation of the depreciation costs.
3. Justification for the cost of capital, including the components of the asset base, the possible adjustments to total assets and the return on equity;
The average operating capital is the sum of the average net book value of fixed assets (on the basis of historic capitalization costs) used by the air navigation service provider in operation or under construction (average long term assets) and of the average value of the net current assets. In both cases, assets are those required for the provision of en route services;
As LVNL does not have an equity capital at the start of the first reference period, the cost of capital before tax is the weighted average of the interest rate on debts (in %). Part of the LVNL debt consists of commercial loans, the remaining part consists of government loans.
Due to its status as Government Agency KNMI has only a very small equity capital. It is financed by the State.
Due to its status as part of an intergovernmental organisation MUAC does not have equity capital. Investment expenditure is financed through bank loans. Capital cost is the average
[65], Netherlands Performance Plan (annex to FABEC PP) version 1.0.
weighted cost of debt.
4. Description of the total determined costs for each airport submitted to the provision of this Regulation for each terminal charging zone; for airports with less than 20 000 commercial air transport movements per year being calculated as the average over the previous three years, costs may be presented in an aggregated way;
This question is not relevant in the context of additional information on en route costs as it is a terminal cost issue
6. Breakdown of the meteorological costs between direct costs and ‘MET core costs’ defined as the costs of supporting meteorological facilities and services that also serve meteorological requirements in general. These include general analysis and forecasting, weather radar and satellite observations, surface and upper-air observation networks, meteorological communication systems, data-processing centres and supporting core research, training and administration;
Aviation Met Costs are based on:
Direct costs, e.g. Airport observation network, Dedicated Aviation Met systems, ICAO / WMO(CAeM) contribution Dedicated Aviation Met Staff, Housing and Dedicated Aviation Met costs incurred by KNMI Technical and Research departments;
Overhead, AviMet allocation “key” based on Dedicated AviMet Staff divided by Total Forecast Services Department Staff which is used to allocate costs of Management of KNMI Forecast Services Department, Training, Customer Relations Services and Office management, and;
Core costs (fixed price for 5 years, except indexation): Radar-, satellite-, surface (SYNOP)-, lightning observations networks (including maintenance and development), Numerical Weather Prediction System infrastructure (including maintenance and development), KNMI overhead not directly allocated to aviation (staffing costs, several international contributions, administrative systems).
7. Description of the methodology used for allocating total MET costs and MET core costs to civil aviation and between en route charging zones;
See also reply to question 1. The KNMI cost allocation model is in line with the World Meteorological Organisation (WMO) No. 904 “Guide to Aeronautical Meteorological Services Cost Recovery”. 82% of KNMI costs
5. Definition of the criteria used to allocate costs between terminal and en route services for each regulated airport
As stated in reply to the first question, since January 1st 2008, LVNL has reallocated the costs
for air navigation services. The costs for the traffic services related to the approach phase up to flight level 30 (~ 3000 feet) within 20 kilometres (12 nM) from the LVNL controlled airports are allocated to the terminal charging zone on the basis of the operational requirements. The costs for air traffic services related to the approach phase beyond this zone are allocated to the en route charging zone. As all LVNL controlled airports are put into a One Group of Airports, the same 12 nM criterion is used for all these airports.
[66], Netherlands Performance Plan (annex to FABEC PP) version 1.0.
are allocated to the en route charging zone.
8. Description of the reported forecast costs and traffic volume (eighteen months before the start of the reference period)
All organisations involved in the air navigation service provision in the FIR Amsterdam have updated their costs data as reported in October 2010 for each of the years of the first reference period.
The following assumptions on possible changes of the costs have been made:
LVNL MUAC KNMI Eurocontrol
Staff costs 2012 -2014: 1-1,5% annually real wage increase due to increased costs of living
Career progression
Salary index: 2.5% nominal or 0.5% real
Career progression: 1.1%
2012: zero-growth of salaries (no compensation)
Salary index: 2.5% nominal or 0.5% real
Career progression: 1.1%
Other operating expenses
Annual inflation rate 2%
Annual inflation rate 2%
Annual inflation rate 2%
Annual inflation rate 2%
Depreciation
Interests
Exceptional items
Expiration of ATCO lease to Vienna at the end of 2013
The en route traffic volume forecast for the FIR Amsterdam is the same as the one forecasted by STATFOR in its Medium term forecast, base scenario (February 2011).
9. Description of the reported actual costs and their difference against the determined costs (every year of the reference period)
An answer to this question cannot be given because the reference period has not yet started.
[67], Netherlands Performance Plan (annex to FABEC PP) version 1.0.
Annex III. Additional information to the reporting table in Annex III, specific transparency requirements for the provision of air navigation services at airports falling within Article 1(6)
The following reasons exist for not delivering this information:
1. In The Netherlands no airports are falling within Article 1(6). 2. The information is not relevant as in this document the additional information is related to en route
cost and unit rate data.
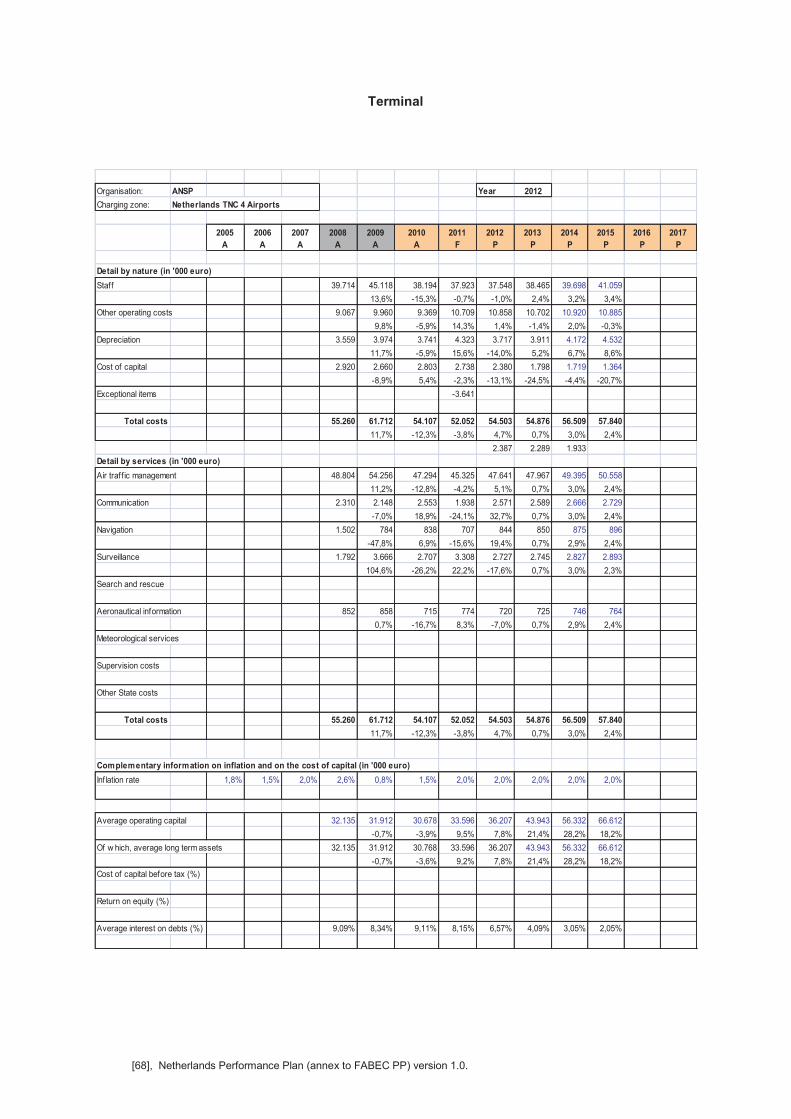
[68], Netherlands Performance Plan (annex to FABEC PP) version 1.0.
Terminal
Organisation: ANSP Year 2012
Charging zone: Netherlands TNC 4 Airports
2005
A
2006
A
2007
A
2008
A
2009
A
2010
A
2011
F
2012
P
2013
P
2014
P
2015
P
2016
P
2017
P
Detail by nature (in '000 euro)
Staff 39.714 45.118 38.194 37.923 37.548 38.465 39.698 41.059
13,6% -15,3% -0,7% -1,0% 2,4% 3,2% 3,4%
Other operating costs 9.067 9.960 9.369 10.709 10.858 10.702 10.920 10.885
9,8% -5,9% 14,3% 1,4% -1,4% 2,0% -0,3%
Depreciation 3.559 3.974 3.741 4.323 3.717 3.911 4.172 4.532
11,7% -5,9% 15,6% -14,0% 5,2% 6,7% 8,6%
Cost of capital 2.920 2.660 2.803 2.738 2.380 1.798 1.719 1.364
-8,9% 5,4% -2,3% -13,1% -24,5% -4,4% -20,7%
Exceptional items -3.641
Total costs 55.260 61.712 54.107 52.052 54.503 54.876 56.509 57.840
11,7% -12,3% -3,8% 4,7% 0,7% 3,0% 2,4%
2.387 2.289 1.933
Detail by services (in '000 euro)
Air traff ic management 48.804 54.256 47.294 45.325 47.641 47.967 49.395 50.558
11,2% -12,8% -4,2% 5,1% 0,7% 3,0% 2,4%
Communication 2.310 2.148 2.553 1.938 2.571 2.589 2.666 2.729
-7,0% 18,9% -24,1% 32,7% 0,7% 3,0% 2,4%
Navigation 1.502 784 838 707 844 850 875 896
-47,8% 6,9% -15,6% 19,4% 0,7% 2,9% 2,4%
Surveillance 1.792 3.666 2.707 3.308 2.727 2.745 2.827 2.893
104,6% -26,2% 22,2% -17,6% 0,7% 3,0% 2,3%
Search and rescue
Aeronautical information 852 858 715 774 720 725 746 764
0,7% -16,7% 8,3% -7,0% 0,7% 2,9% 2,4%
Meteorological services
Supervision costs
Other State costs
Total costs 55.260 61.712 54.107 52.052 54.503 54.876 56.509 57.840
11,7% -12,3% -3,8% 4,7% 0,7% 3,0% 2,4%
Complementary information on inflation and on the cost of capital (in '000 euro)
Inflation rate 1,8% 1,5% 2,0% 2,6% 0,8% 1,5% 2,0% 2,0% 2,0% 2,0% 2,0%
Average operating capital 32.135 31.912 30.678 33.596 36.207 43.943 56.332 66.612
-0,7% -3,9% 9,5% 7,8% 21,4% 28,2% 18,2%
Of w hich, average long term assets 32.135 31.912 30.768 33.596 36.207 43.943 56.332 66.612
-0,7% -3,6% 9,2% 7,8% 21,4% 28,2% 18,2%
Cost of capital before tax (%)
Return on equity (%)
Average interest on debts (%) 9,09% 8,34% 9,11% 8,15% 6,57% 4,09% 3,05% 2,05%
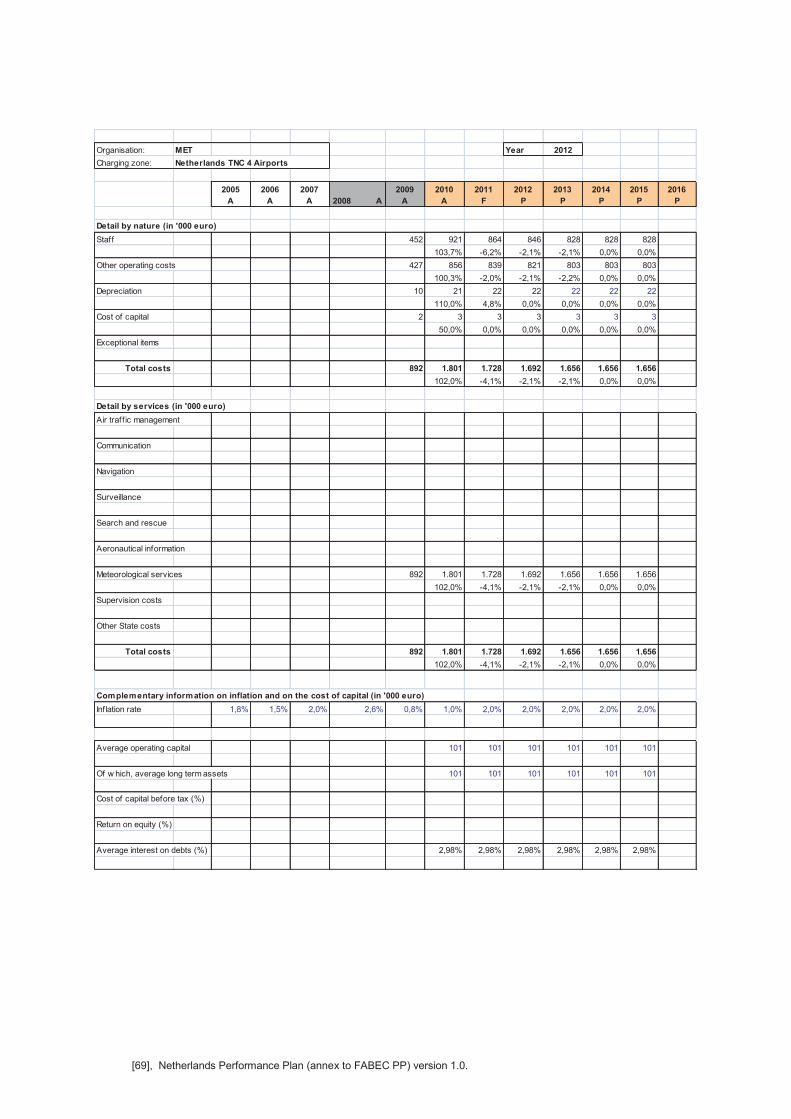
[69], Netherlands Performance Plan (annex to FABEC PP) version 1.0.
Organisation: MET Year 2012
Charging zone: Netherlands TNC 4 Airports
2005
A
2006
A
2007
A 2008 A
2009
A
2010
A
2011
F
2012
P
2013
P
2014
P
2015
P
2016
P
Detail by nature (in '000 euro)
Staff 452 921 864 846 828 828 828
103,7% -6,2% -2,1% -2,1% 0,0% 0,0%
Other operating costs 427 856 839 821 803 803 803
100,3% -2,0% -2,1% -2,2% 0,0% 0,0%
Depreciation 10 21 22 22 22 22 22
110,0% 4,8% 0,0% 0,0% 0,0% 0,0%
Cost of capital 2 3 3 3 3 3 3
50,0% 0,0% 0,0% 0,0% 0,0% 0,0%
Exceptional items
Total costs 892 1.801 1.728 1.692 1.656 1.656 1.656
102,0% -4,1% -2,1% -2,1% 0,0% 0,0%
Detail by services (in '000 euro)
Air traff ic management
Communication
Navigation
Surveillance
Search and rescue
Aeronautical information
Meteorological services 892 1.801 1.728 1.692 1.656 1.656 1.656
102,0% -4,1% -2,1% -2,1% 0,0% 0,0%
Supervision costs
Other State costs
Total costs 892 1.801 1.728 1.692 1.656 1.656 1.656
102,0% -4,1% -2,1% -2,1% 0,0% 0,0%
Complementary information on inflation and on the cost of capital (in '000 euro)
Inflation rate 1,8% 1,5% 2,0% 2,6% 0,8% 1,0% 2,0% 2,0% 2,0% 2,0% 2,0%
Average operating capital 101 101 101 101 101 101
Of w hich, average long term assets 101 101 101 101 101 101
Cost of capital before tax (%)
Return on equity (%)
Average interest on debts (%) 2,98% 2,98% 2,98% 2,98% 2,98% 2,98%
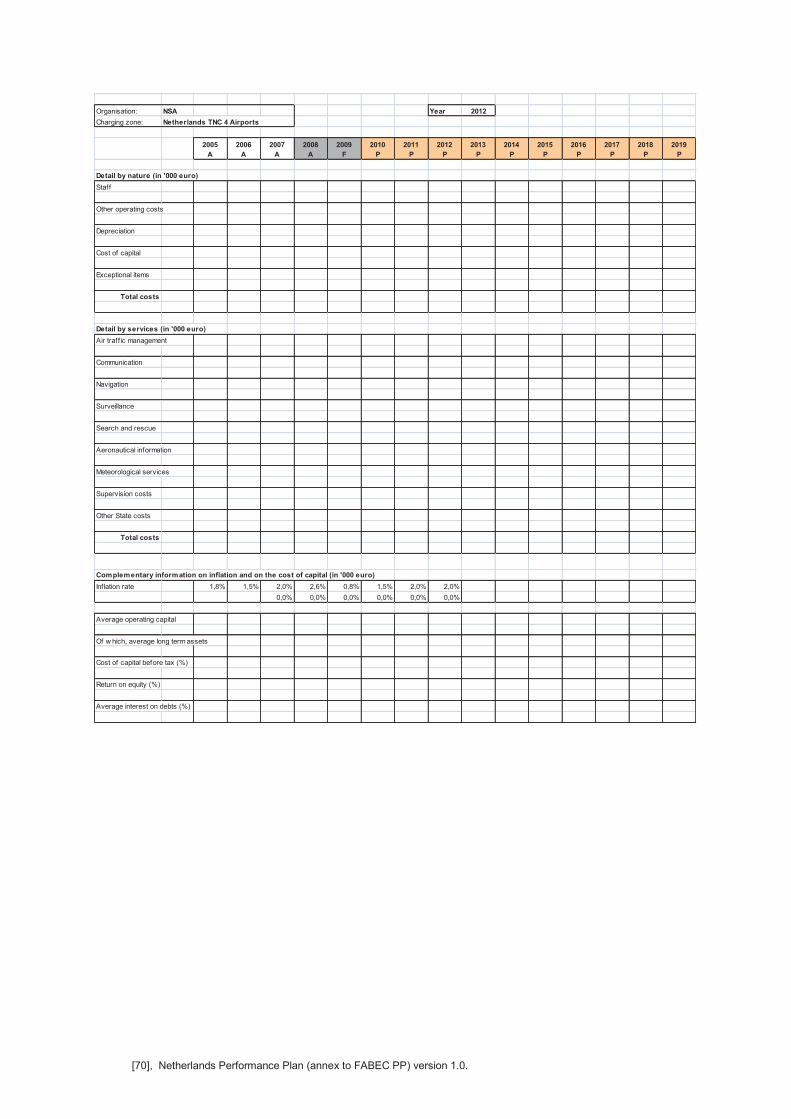
[70], Netherlands Performance Plan (annex to FABEC PP) version 1.0.
Organisation: NSA Year 2012
Charging zone: Netherlands TNC 4 Airports
2005
A
2006
A
2007
A
2008
A
2009
F
2010
P
2011
P
2012
P
2013
P
2014
P
2015
P
2016
P
2017
P
2018
P
2019
P
Detail by nature (in '000 euro)
Staff
Other operating costs
Depreciation
Cost of capital
Exceptional items
Total costs
Detail by services (in '000 euro)
Air traff ic management
Communication
Navigation
Surveillance
Search and rescue
Aeronautical information
Meteorological services
Supervision costs
Other State costs
Total costs
Complementary information on inflation and on the cost of capital (in '000 euro)
Inflation rate 1,8% 1,5% 2,0% 2,6% 0,8% 1,5% 2,0% 2,0%
0,0% 0,0% 0,0% 0,0% 0,0% 0,0%
Average operating capital
Of w hich, average long term assets
Cost of capital before tax (%)
Return on equity (%)
Average interest on debts (%)
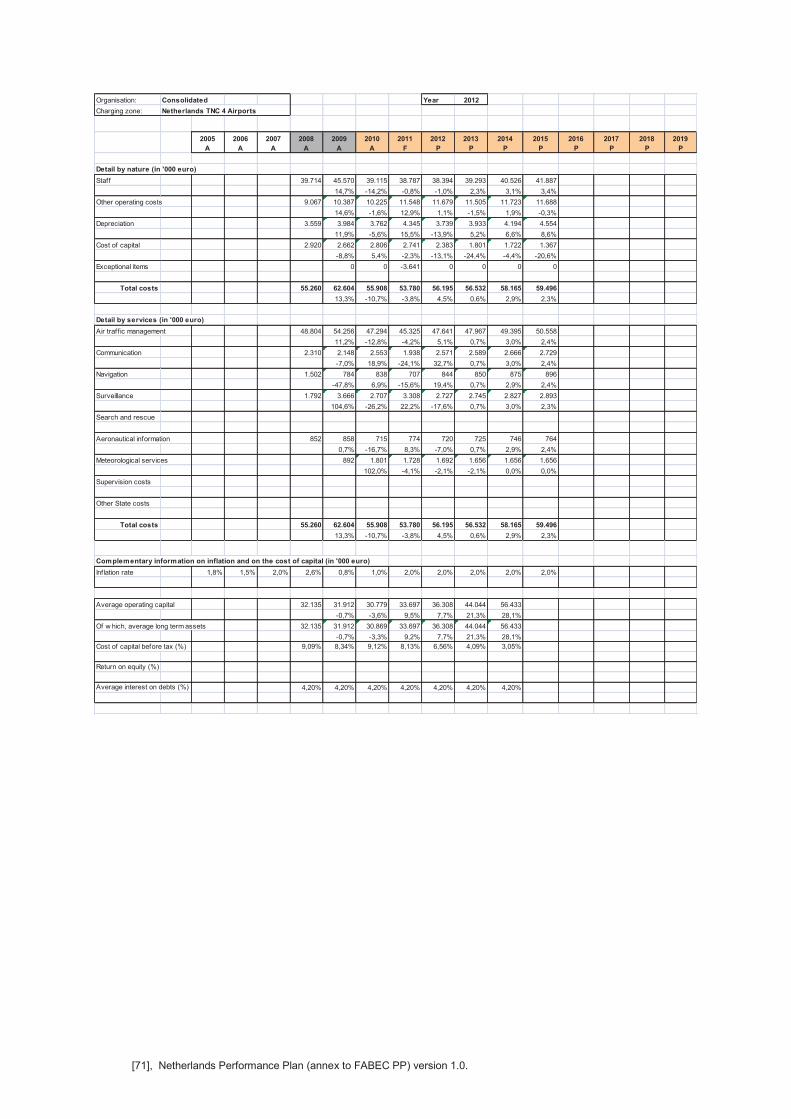
[71], Netherlands Performance Plan (annex to FABEC PP) version 1.0.
Organisation: Consolidated Year 2012
Charging zone: Netherlands TNC 4 Airports
2005
A
2006
A
2007
A
2008
A
2009
A
2010
A
2011
F
2012
P
2013
P
2014
P
2015
P
2016
P
2017
P
2018
P
2019
P
Detail by nature (in '000 euro)
Staff 39.714 45.570 39.115 38.787 38.394 39.293 40.526 41.887
14,7% -14,2% -0,8% -1,0% 2,3% 3,1% 3,4%
Other operating costs 9.067 10.387 10.225 11.548 11.679 11.505 11.723 11.688
14,6% -1,6% 12,9% 1,1% -1,5% 1,9% -0,3%
Depreciation 3.559 3.984 3.762 4.345 3.739 3.933 4.194 4.554
11,9% -5,6% 15,5% -13,9% 5,2% 6,6% 8,6%
Cost of capital 2.920 2.662 2.806 2.741 2.383 1.801 1.722 1.367
-8,8% 5,4% -2,3% -13,1% -24,4% -4,4% -20,6%
Exceptional items 0 0 -3.641 0 0 0 0
Total costs 55.260 62.604 55.908 53.780 56.195 56.532 58.165 59.496
13,3% -10,7% -3,8% 4,5% 0,6% 2,9% 2,3%
Detail by services (in '000 euro)
Air traff ic management 48.804 54.256 47.294 45.325 47.641 47.967 49.395 50.558
11,2% -12,8% -4,2% 5,1% 0,7% 3,0% 2,4%
Communication 2.310 2.148 2.553 1.938 2.571 2.589 2.666 2.729
-7,0% 18,9% -24,1% 32,7% 0,7% 3,0% 2,4%
Navigation 1.502 784 838 707 844 850 875 896
-47,8% 6,9% -15,6% 19,4% 0,7% 2,9% 2,4%
Surveillance 1.792 3.666 2.707 3.308 2.727 2.745 2.827 2.893
104,6% -26,2% 22,2% -17,6% 0,7% 3,0% 2,3%
Search and rescue
Aeronautical information 852 858 715 774 720 725 746 764
0,7% -16,7% 8,3% -7,0% 0,7% 2,9% 2,4%
Meteorological services 892 1.801 1.728 1.692 1.656 1.656 1.656
102,0% -4,1% -2,1% -2,1% 0,0% 0,0%
Supervision costs
Other State costs
Total costs 55.260 62.604 55.908 53.780 56.195 56.532 58.165 59.496
13,3% -10,7% -3,8% 4,5% 0,6% 2,9% 2,3%
Complementary information on inflation and on the cost of capital (in '000 euro)
Inflation rate 1,8% 1,5% 2,0% 2,6% 0,8% 1,0% 2,0% 2,0% 2,0% 2,0% 2,0%
Average operating capital 32.135 31.912 30.779 33.697 36.308 44.044 56.433
-0,7% -3,6% 9,5% 7,7% 21,3% 28,1%
Of w hich, average long term assets 32.135 31.912 30.869 33.697 36.308 44.044 56.433
-0,7% -3,3% 9,2% 7,7% 21,3% 28,1%
Cost of capital before tax (%) 9,09% 8,34% 9,12% 8,13% 6,56% 4,09% 3,05%
Return on equity (%)
Average interest on debts (%) 4,20% 4,20% 4,20% 4,20% 4,20% 4,20% 4,20%
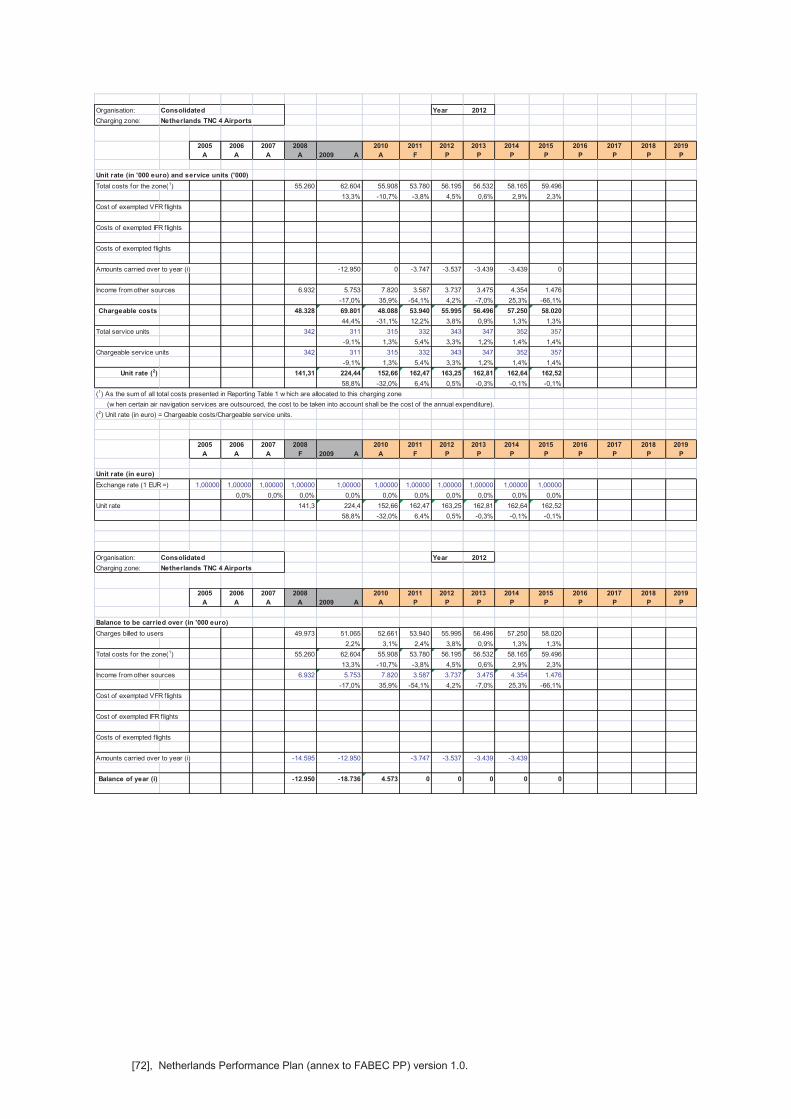
[72], Netherlands Performance Plan (annex to FABEC PP) version 1.0.
Organisation: Consolidated Year 2012
Charging zone: Netherlands TNC 4 Airports
2005
A
2006
A
2007
A
2008
A 2009 A
2010
A
2011
F
2012
P
2013
P
2014
P
2015
P
2016
P
2017
P
2018
P
2019
P
Unit rate (in '000 euro) and service units ('000)
Total costs for the zone(1) 55.260 62.604 55.908 53.780 56.195 56.532 58.165 59.496
13,3% -10,7% -3,8% 4,5% 0,6% 2,9% 2,3%
Cost of exempted VFR flights
Costs of exempted IFR flights
Costs of exempted f lights
Amounts carried over to year (i) -12.950 0 -3.747 -3.537 -3.439 -3.439 0
Income from other sources 6.932 5.753 7.820 3.587 3.737 3.475 4.354 1.476
-17,0% 35,9% -54,1% 4,2% -7,0% 25,3% -66,1%
Chargeable costs 48.328 69.801 48.088 53.940 55.995 56.496 57.250 58.020
44,4% -31,1% 12,2% 3,8% 0,9% 1,3% 1,3%
Total service units 342 311 315 332 343 347 352 357
-9,1% 1,3% 5,4% 3,3% 1,2% 1,4% 1,4%
Chargeable service units 342 311 315 332 343 347 352 357
-9,1% 1,3% 5,4% 3,3% 1,2% 1,4% 1,4%
Unit rate (2) 141,31 224,44 152,66 162,47 163,25 162,81 162,64 162,52
58,8% -32,0% 6,4% 0,5% -0,3% -0,1% -0,1%
(1) As the sum of all total costs presented in Reporting Table 1 w hich are allocated to this charging zone
(w hen certain air navigation services are outsourced, the cost to be taken into account shall be the cost of the annual expenditure).
(2) Unit rate (in euro) = Chargeable costs/Chargeable service units.
2005
A
2006
A
2007
A
2008
F 2009 A
2010
A
2011
F
2012
P
2013
P
2014
P
2015
P
2016
P
2017
P
2018
P
2019
P
Unit rate (in euro)
Exchange rate (1 EUR =) 1,00000 1,00000 1,00000 1,00000 1,00000 1,00000 1,00000 1,00000 1,00000 1,00000 1,00000
0,0% 0,0% 0,0% 0,0% 0,0% 0,0% 0,0% 0,0% 0,0% 0,0%
Unit rate 141,3 224,4 152,66 162,47 163,25 162,81 162,64 162,52
58,8% -32,0% 6,4% 0,5% -0,3% -0,1% -0,1%
Organisation: Consolidated Year 2012
Charging zone: Netherlands TNC 4 Airports
2005
A
2006
A
2007
A
2008
A 2009 A
2010
A
2011
P
2012
P
2013
P
2014
P
2015
P
2016
P
2017
P
2018
P
2019
P
Balance to be carried over (in '000 euro)
Charges billed to users 49.973 51.065 52.661 53.940 55.995 56.496 57.250 58.020
2,2% 3,1% 2,4% 3,8% 0,9% 1,3% 1,3%
Total costs for the zone(1) 55.260 62.604 55.908 53.780 56.195 56.532 58.165 59.496
13,3% -10,7% -3,8% 4,5% 0,6% 2,9% 2,3%
Income from other sources 6.932 5.753 7.820 3.587 3.737 3.475 4.354 1.476
-17,0% 35,9% -54,1% 4,2% -7,0% 25,3% -66,1%
Cost of exempted VFR flights
Cost of exempted IFR flights
Costs of exempted f lights
Amounts carried over to year (i) -14.595 -12.950 -3.747 -3.537 -3.439 -3.439
Balance of year (i) -12.950 -18.736 4.573 0 0 0 0 0
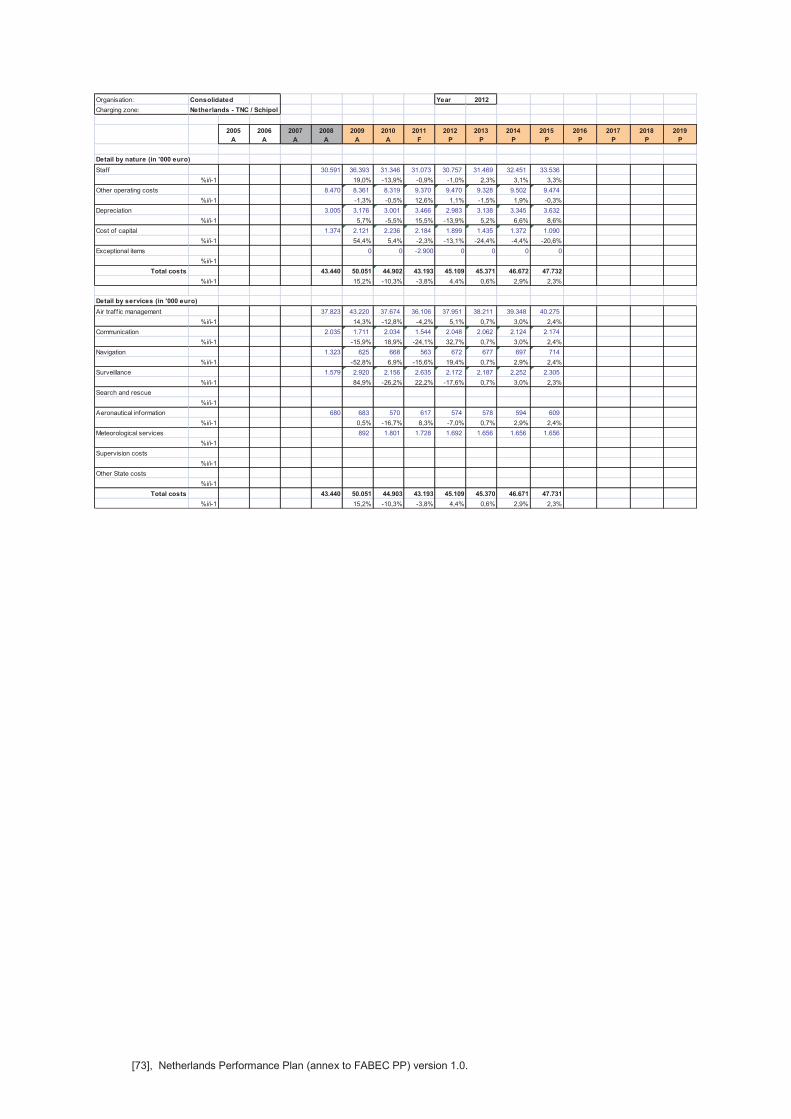
[73], Netherlands Performance Plan (annex to FABEC PP) version 1.0.
Organisation: Consolidated Year 2012
Charging zone: Netherlands - TNC / Schipol
2005
A
2006
A
2007
A
2008
A
2009
A
2010
A
2011
F
2012
P
2013
P
2014
P
2015
P
2016
P
2017
P
2018
P
2019
P
Detail by nature (in '000 euro)
Staff 30.591 36.393 31.346 31.073 30.757 31.469 32.451 33.536
%i/i-1 19,0% -13,9% -0,9% -1,0% 2,3% 3,1% 3,3%
Other operating costs 8.470 8.361 8.319 9.370 9.470 9.328 9.502 9.474
%i/i-1 -1,3% -0,5% 12,6% 1,1% -1,5% 1,9% -0,3%
Depreciation 3.005 3.176 3.001 3.466 2.983 3.138 3.345 3.632
%i/i-1 5,7% -5,5% 15,5% -13,9% 5,2% 6,6% 8,6%
Cost of capital 1.374 2.121 2.236 2.184 1.899 1.435 1.372 1.090
%i/i-1 54,4% 5,4% -2,3% -13,1% -24,4% -4,4% -20,6%
Exceptional items 0 0 -2.900 0 0 0 0
%i/i-1
Total costs 43.440 50.051 44.902 43.193 45.109 45.371 46.672 47.732
%i/i-1 15,2% -10,3% -3,8% 4,4% 0,6% 2,9% 2,3%
Detail by services (in '000 euro)
Air traff ic management 37.823 43.220 37.674 36.106 37.951 38.211 39.348 40.275
%i/i-1 14,3% -12,8% -4,2% 5,1% 0,7% 3,0% 2,4%
Communication 2.035 1.711 2.034 1.544 2.048 2.062 2.124 2.174
%i/i-1 -15,9% 18,9% -24,1% 32,7% 0,7% 3,0% 2,4%
Navigation 1.323 625 668 563 672 677 697 714
%i/i-1 -52,8% 6,9% -15,6% 19,4% 0,7% 2,9% 2,4%
Surveillance 1.579 2.920 2.156 2.635 2.172 2.187 2.252 2.305
%i/i-1 84,9% -26,2% 22,2% -17,6% 0,7% 3,0% 2,3%
Search and rescue
%i/i-1
Aeronautical information 680 683 570 617 574 578 594 609
%i/i-1 0,5% -16,7% 8,3% -7,0% 0,7% 2,9% 2,4%
Meteorological services 892 1.801 1.728 1.692 1.656 1.656 1.656
%i/i-1
Supervision costs
%i/i-1
Other State costs
%i/i-1
Total costs 43.440 50.051 44.903 43.193 45.109 45.370 46.671 47.731
%i/i-1 15,2% -10,3% -3,8% 4,4% 0,6% 2,9% 2,3%
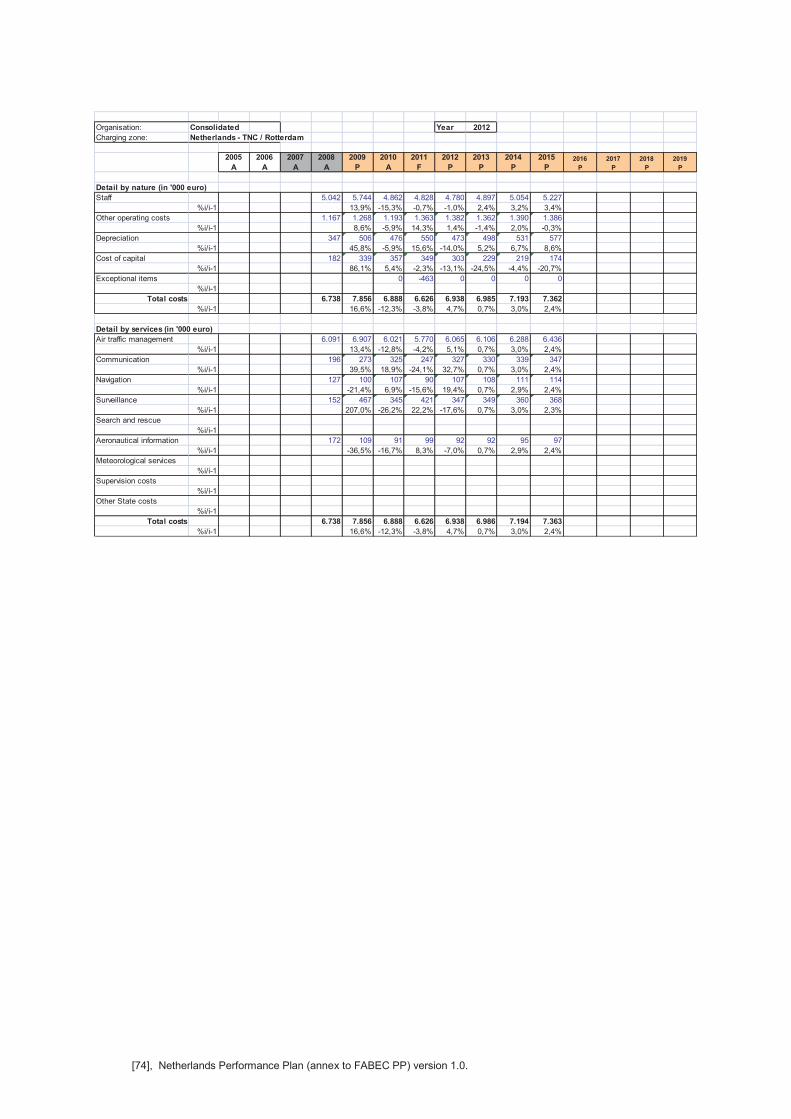
[74], Netherlands Performance Plan (annex to FABEC PP) version 1.0.
Organisation: Consolidated Year 2012
Charging zone: Netherlands - TNC / Rotterdam
2005
A
2006
A
2007
A
2008
A
2009
P
2010
A
2011
F
2012
P
2013
P
2014
P
2015
P2016
P
2017
P
2018
P
2019
P
Detail by nature (in '000 euro)
Staff 5.042 5.744 4.862 4.828 4.780 4.897 5.054 5.227
%i/i-1 13,9% -15,3% -0,7% -1,0% 2,4% 3,2% 3,4%
Other operating costs 1.167 1.268 1.193 1.363 1.382 1.362 1.390 1.386
%i/i-1 8,6% -5,9% 14,3% 1,4% -1,4% 2,0% -0,3%
Depreciation 347 506 476 550 473 498 531 577
%i/i-1 45,8% -5,9% 15,6% -14,0% 5,2% 6,7% 8,6%
Cost of capital 182 339 357 349 303 229 219 174
%i/i-1 86,1% 5,4% -2,3% -13,1% -24,5% -4,4% -20,7%
Exceptional items 0 -463 0 0 0 0
%i/i-1
Total costs 6.738 7.856 6.888 6.626 6.938 6.985 7.193 7.362
%i/i-1 16,6% -12,3% -3,8% 4,7% 0,7% 3,0% 2,4%
Detail by services (in '000 euro)
Air traffic management 6.091 6.907 6.021 5.770 6.065 6.106 6.288 6.436
%i/i-1 13,4% -12,8% -4,2% 5,1% 0,7% 3,0% 2,4%
Communication 196 273 325 247 327 330 339 347
%i/i-1 39,5% 18,9% -24,1% 32,7% 0,7% 3,0% 2,4%
Navigation 127 100 107 90 107 108 111 114
%i/i-1 -21,4% 6,9% -15,6% 19,4% 0,7% 2,9% 2,4%
Surveillance 152 467 345 421 347 349 360 368
%i/i-1 207,0% -26,2% 22,2% -17,6% 0,7% 3,0% 2,3%
Search and rescue
%i/i-1
Aeronautical information 172 109 91 99 92 92 95 97
%i/i-1 -36,5% -16,7% 8,3% -7,0% 0,7% 2,9% 2,4%
Meteorological services
%i/i-1
Supervision costs
%i/i-1
Other State costs
%i/i-1
Total costs 6.738 7.856 6.888 6.626 6.938 6.986 7.194 7.363
%i/i-1 16,6% -12,3% -3,8% 4,7% 0,7% 3,0% 2,4%

[75], Netherlands Performance Plan (annex to FABEC PP) version 1.0.
Organisation: Consolidated Year 2012
Charging zone: Netherlands - TNC / Eelde
2005
A
2006
A
2007
A
2008
A
2009
P
2010
A
2011
F
2012
P
2013
P
2014
P
2015
P2016
P
2017
P
2018
P
2019
P
Detail by nature (in '000 euro)
Staff 1.906 1.701 1.440 1.430 1.416 1.450 1.497 1.548
%i/i-1 -10,8% -15,3% -0,7% -1,0% 2,4% 3,2% 3,4%
Other operating costs 348 375 353 404 409 403 412 410
%i/i-1 7,9% -5,9% 14,3% 1,4% -1,4% 2,0% -0,3%
Depreciation 103 150 141 163 140 147 157 171
%i/i-1 45,5% -5,9% 15,6% -14,0% 5,2% 6,7% 8,6%
Cost of capital 59 100 106 103 90 68 65 51
%i/i-1 70,0% 5,4% -2,3% -13,1% -24,5% -4,4% -20,7%
Exceptional items 0 -137 0 0 0 0
%i/i-1
Total costs 2.416 2.327 2.040 1.962 2.055 2.069 2.130 2.181
%i/i-1 -3,7% -12,3% -3,8% 4,7% 0,7% 3,0% 2,4%
Detail by services (in '000 euro)
Air traffic management 2.289 2.078 1.813 1.739 1.826 1.838 1.892 1.936
%i/i-1 -9,2% -12,8% -4,1% 5,0% 0,7% 2,9% 2,3%
Communication 52 81 96 73 97 98 101 103
%i/i-1 55,7% 18,9% -24,1% 32,7% 0,7% 3,0% 2,4%
Navigation 35 30 32 27 32 32 33 34
%i/i-1 -15,6% 6,9% -15,6% 19,4% 0,7% 2,9% 2,4%
Surveillance 40 138 102 125 103 103 107 109
%i/i-1 245,5% -26,2% 22,2% -17,6% 0,7% 3,0% 2,3%
Search and rescue
%i/i-1
Aeronautical information
%i/i-1
Meteorological services
%i/i-1
Supervision costs
%i/i-1
Other State costs
%i/i-1
Total costs 2.416 2.327 2.043 1.963 2.058 2.071 2.132 2.182
%i/i-1 -3,7% -12,2% -3,9% 4,8% 0,7% 2,9% 2,3%
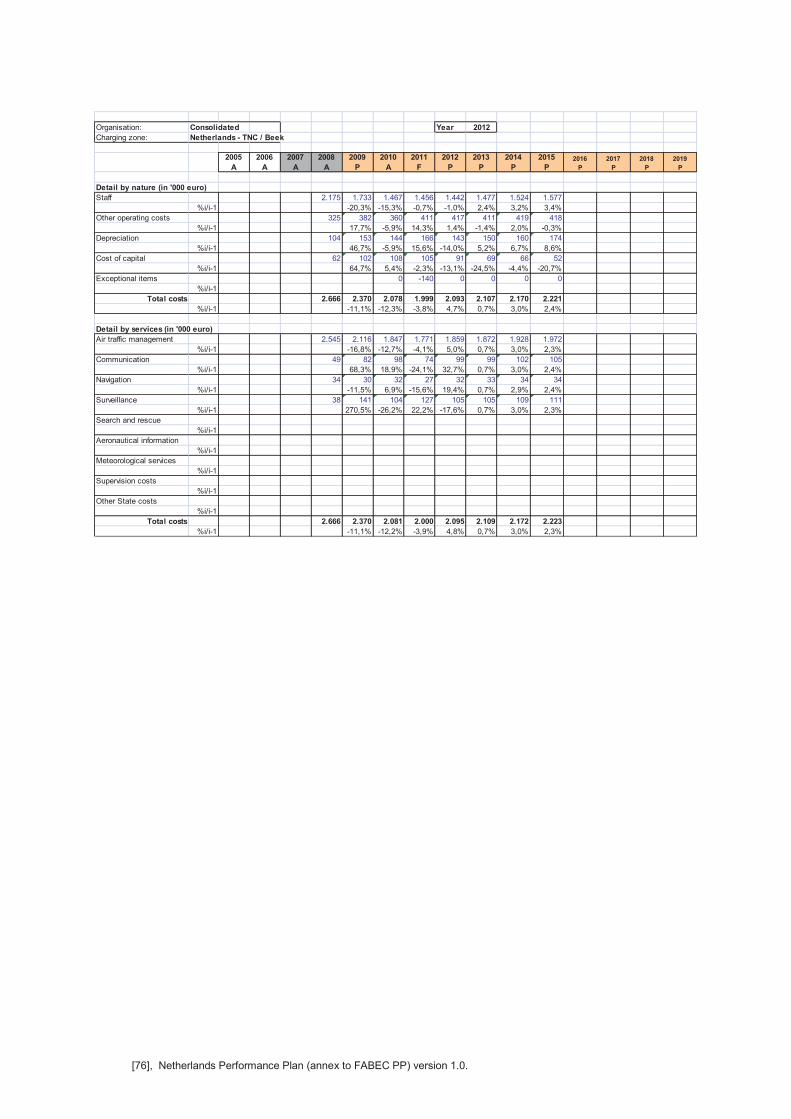
[76], Netherlands Performance Plan (annex to FABEC PP) version 1.0.
Organisation: Consolidated Year 2012
Charging zone: Netherlands - TNC / Beek
2005
A
2006
A
2007
A
2008
A
2009
P
2010
A
2011
F
2012
P
2013
P
2014
P
2015
P2016
P
2017
P
2018
P
2019
P
Detail by nature (in '000 euro)
Staff 2.175 1.733 1.467 1.456 1.442 1.477 1.524 1.577
%i/i-1 -20,3% -15,3% -0,7% -1,0% 2,4% 3,2% 3,4%
Other operating costs 325 382 360 411 417 411 419 418
%i/i-1 17,7% -5,9% 14,3% 1,4% -1,4% 2,0% -0,3%
Depreciation 104 153 144 166 143 150 160 174
%i/i-1 46,7% -5,9% 15,6% -14,0% 5,2% 6,7% 8,6%
Cost of capital 62 102 108 105 91 69 66 52
%i/i-1 64,7% 5,4% -2,3% -13,1% -24,5% -4,4% -20,7%
Exceptional items 0 -140 0 0 0 0
%i/i-1
Total costs 2.666 2.370 2.078 1.999 2.093 2.107 2.170 2.221
%i/i-1 -11,1% -12,3% -3,8% 4,7% 0,7% 3,0% 2,4%
Detail by services (in '000 euro)
Air traffic management 2.545 2.116 1.847 1.771 1.859 1.872 1.928 1.972
%i/i-1 -16,8% -12,7% -4,1% 5,0% 0,7% 3,0% 2,3%
Communication 49 82 98 74 99 99 102 105
%i/i-1 68,3% 18,9% -24,1% 32,7% 0,7% 3,0% 2,4%
Navigation 34 30 32 27 32 33 34 34
%i/i-1 -11,5% 6,9% -15,6% 19,4% 0,7% 2,9% 2,4%
Surveillance 38 141 104 127 105 105 109 111
%i/i-1 270,5% -26,2% 22,2% -17,6% 0,7% 3,0% 2,3%
Search and rescue
%i/i-1
Aeronautical information
%i/i-1
Meteorological services
%i/i-1
Supervision costs
%i/i-1
Other State costs
%i/i-1
Total costs 2.666 2.370 2.081 2.000 2.095 2.109 2.172 2.223
%i/i-1 -11,1% -12,2% -3,9% 4,8% 0,7% 3,0% 2,3%
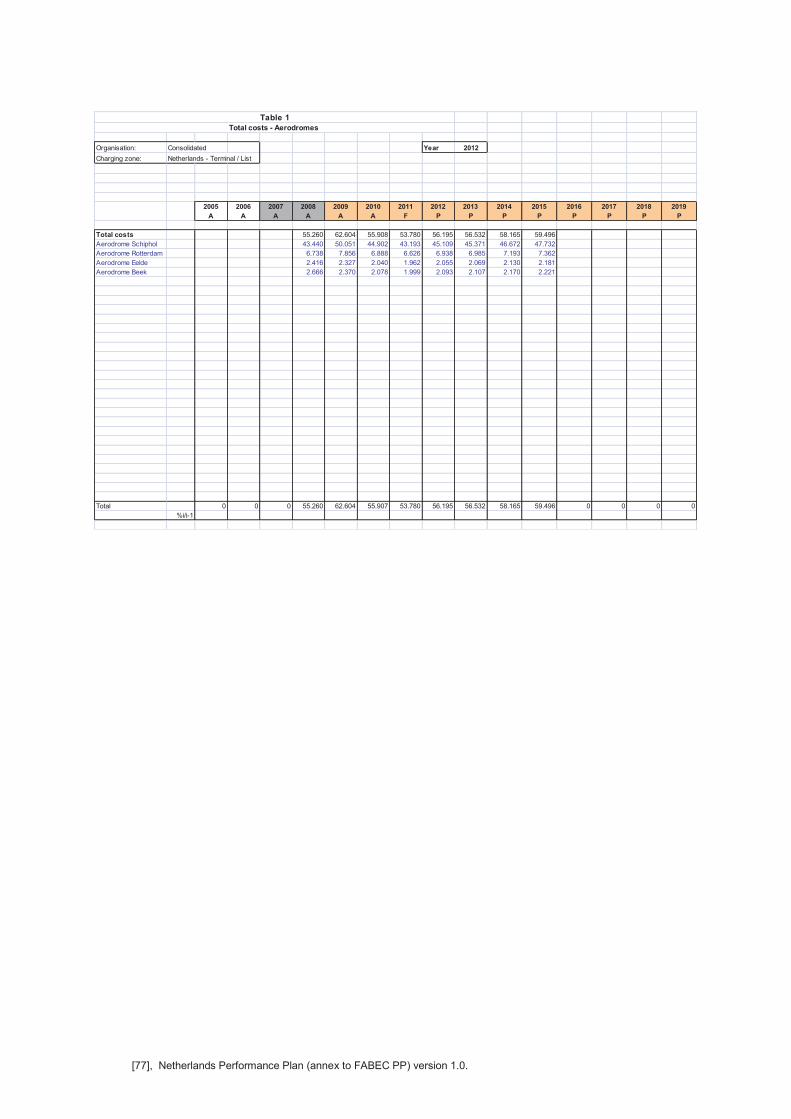
[77], Netherlands Performance Plan (annex to FABEC PP) version 1.0.
Table 1
Total costs - Aerodromes
Organisation: Consolidated Year 2012
Charging zone: Netherlands - Terminal / List
2005
A
2006
A
2007
A
2008
A
2009
A
2010
A
2011
F
2012
P
2013
P
2014
P
2015
P
2016
P
2017
P
2018
P
2019
P
Total costs 55.260 62.604 55.908 53.780 56.195 56.532 58.165 59.496
Aerodrome Schiphol 43.440 50.051 44.902 43.193 45.109 45.371 46.672 47.732
Aerodrome Rotterdam 6.738 7.856 6.888 6.626 6.938 6.985 7.193 7.362
Aerodrome Eelde 2.416 2.327 2.040 1.962 2.055 2.069 2.130 2.181
Aerodrome Beek 2.666 2.370 2.078 1.999 2.093 2.107 2.170 2.221
Total 0 0 0 55.260 62.604 55.907 53.780 56.195 56.532 58.165 59.496 0 0 0 0
%i/i-1
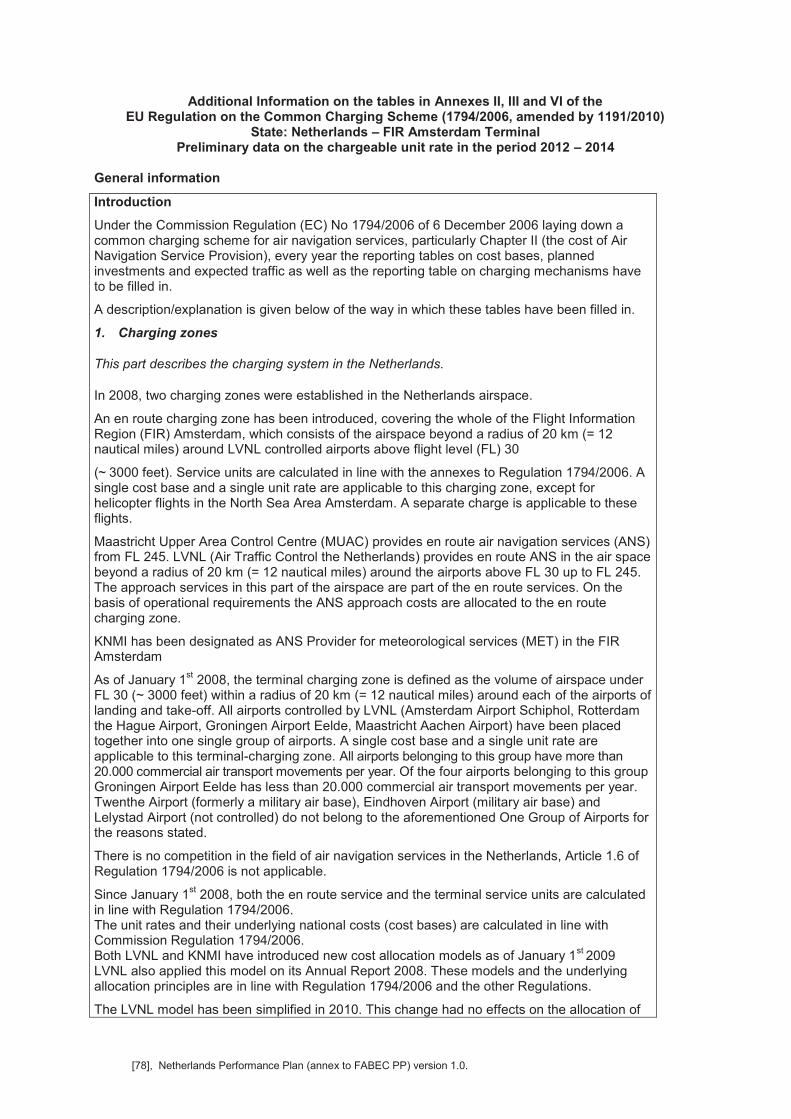
[78], Netherlands Performance Plan (annex to FABEC PP) version 1.0.
Additional Information on the tables in Annexes II, III and VI of the EU Regulation on the Common Charging Scheme (1794/2006, amended by 1191/2010)
State: Netherlands – FIR Amsterdam Terminal Preliminary data on the chargeable unit rate in the period 2012 – 2014
General information
Introduction
Under the Commission Regulation (EC) No 1794/2006 of 6 December 2006 laying down a common charging scheme for air navigation services, particularly Chapter II (the cost of Air Navigation Service Provision), every year the reporting tables on cost bases, planned investments and expected traffic as well as the reporting table on charging mechanisms have to be filled in.
A description/explanation is given below of the way in which these tables have been filled in.
1. Charging zones
This part describes the charging system in the Netherlands.
In 2008, two charging zones were established in the Netherlands airspace.
An en route charging zone has been introduced, covering the whole of the Flight Information Region (FIR) Amsterdam, which consists of the airspace beyond a radius of 20 km (= 12 nautical miles) around LVNL controlled airports above flight level (FL) 30
(~ 3000 feet). Service units are calculated in line with the annexes to Regulation 1794/2006. A single cost base and a single unit rate are applicable to this charging zone, except for helicopter flights in the North Sea Area Amsterdam. A separate charge is applicable to these flights.
Maastricht Upper Area Control Centre (MUAC) provides en route air navigation services (ANS) from FL 245. LVNL (Air Traffic Control the Netherlands) provides en route ANS in the air space beyond a radius of 20 km (= 12 nautical miles) around the airports above FL 30 up to FL 245. The approach services in this part of the airspace are part of the en route services. On the basis of operational requirements the ANS approach costs are allocated to the en route charging zone.
KNMI has been designated as ANS Provider for meteorological services (MET) in the FIR Amsterdam
As of January 1st 2008, the terminal charging zone is defined as the volume of airspace under
FL 30 (~ 3000 feet) within a radius of 20 km (= 12 nautical miles) around each of the airports of landing and take-off. All airports controlled by LVNL (Amsterdam Airport Schiphol, Rotterdam the Hague Airport, Groningen Airport Eelde, Maastricht Aachen Airport) have been placed together into one single group of airports. A single cost base and a single unit rate are applicable to this terminal-charging zone. All airports belonging to this group have more than 20.000 commercial air transport movements per year. Of the four airports belonging to this group Groningen Airport Eelde has less than 20.000 commercial air transport movements per year. Twenthe Airport (formerly a military air base), Eindhoven Airport (military air base) and Lelystad Airport (not controlled) do not belong to the aforementioned One Group of Airports for the reasons stated.
There is no competition in the field of air navigation services in the Netherlands, Article 1.6 of Regulation 1794/2006 is not applicable.
Since January 1st 2008, both the en route service and the terminal service units are calculated
in line with Regulation 1794/2006. The unit rates and their underlying national costs (cost bases) are calculated in line with
Commission Regulation 1794/2006. Both LVNL and KNMI have introduced new cost allocation models as of January 1
st 2009
LVNL also applied this model on its Annual Report 2008. These models and the underlying allocation principles are in line with Regulation 1794/2006 and the other Regulations.
The LVNL model has been simplified in 2010. This change had no effects on the allocation of
[79], Netherlands Performance Plan (annex to FABEC PP) version 1.0.
costs to the various charging zones.
As of 1st January 2008, both the en route service and the terminal service units are calculated
in line with Regulation 1794/2006. The weight factor in the calculation of the terminal service unit is fixed at 0,7.
2. International Financial Reporting Standards (IFRS) Under article 12 of the Service Provision Regulation (EC no 550/2004) the accounts of ANSPs have to comply with the IFRS to the maximum possible extent.
LVNL
As of 2008 the LVNL financial statements comply with IFRS with the exception of the provisions related to the early retirement arrangements of the operational LVNL-staff (FLNA; IAS 19 IFRS). The Netherlands has decided to exclude this specific item from the IFRS implementation. As a consequence of this decision neither the FLNA obligations nor a related provision is presented as liabilities in the LVNL balance sheet. As in the past users will only be charged for the actual FLNA expenses. According to actuarial calculations of December 31
st
2010, the net present value of the defined benefit obligations is about M€ 250, including the standard tax penalty of 52%). To minimize the lack of transparency on this issue, LVNL presents these obligations as ‘off-balance sheet rights and commitments’.
KNMI
Under Article 12 of the Service Provision Regulation (EC no 550/2004) the accounts of KNMI have to comply with IFRS to the maximum possible extent. From 2011 onwards the financial statements of KNMI have been as much as possible drawn up in accordance to IFRS. A few issues remain which could not be dealt with according to IFRS due to the national legal rules and regulations. These issues are described in the financial statements of KNMI.
Since January 2009 the under or over recovery of the charges due to the traffic volume changes and the costs are included in the KNMI balance, instead of the LVNL balance. Since the start of 2011 KNMI receives its part of the Dutch en route charge directly from CRCO.
3. Unit rates, costs and cost allocation model In line with Article 2 of Regulation 1191/2010, amending Regulation 1794/2006, the concept of the determined costs, targeted unit rates and the traffic volume and cost risk will not be applied on the terminal ANS provision. The entry into force of the amendments of the Charging Implementing Rule will be deferred to January 1
st 2015.
In line with Article 7 of Regulation 1794/2006, the cost of all eligible services, facilities and activities as defined in Article 5 of the Regulation, have been allocated, in a transparent manner, to the charging zones, where they are actually incurred. As of January 1
st 2009, both
LVNL and KNMI have introduced a new and more sophisticated cost allocation model.
The terminal unit rates and their underlying costs are in line with the Commission Regulation 1794/2006.
4. Enforced recovery Enforcement measures to secure payment of the charges by the users will enter into force in 2011. Possible enforcements will take place in close cooperation with Eurocontrol (CRCO).
5. Consultation In line with the Commission Regulations 1794/2006 (amended by Regulation 1191/2010) and 691/2010 the Ministry of Infrastructure and the Environment organises Dutch Stakeholder Consultation Meetings. At these meetings under the chairmanship of the Ministry LVNL, MUAC and KNMI present their plans on the Performance KPAs, as well as ways to improve their performance and the unit rates to be applied.
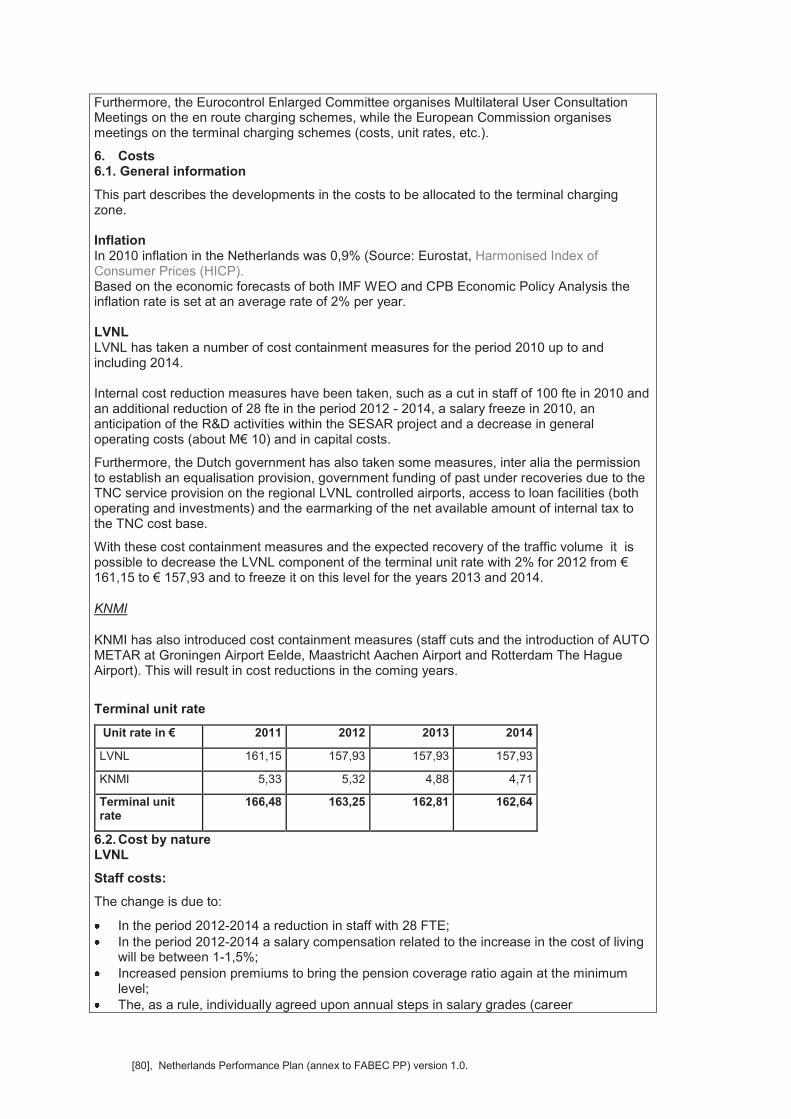
[80], Netherlands Performance Plan (annex to FABEC PP) version 1.0.
Furthermore, the Eurocontrol Enlarged Committee organises Multilateral User Consultation Meetings on the en route charging schemes, while the European Commission organises meetings on the terminal charging schemes (costs, unit rates, etc.).
6. Costs 6.1. General information
This part describes the developments in the costs to be allocated to the terminal charging zone. Inflation In 2010 inflation in the Netherlands was 0,9% (Source: Eurostat, Harmonised Index of Consumer Prices (HICP). Based on the economic forecasts of both IMF WEO and CPB Economic Policy Analysis the inflation rate is set at an average rate of 2% per year. LVNL LVNL has taken a number of cost containment measures for the period 2010 up to and including 2014. Internal cost reduction measures have been taken, such as a cut in staff of 100 fte in 2010 and an additional reduction of 28 fte in the period 2012 - 2014, a salary freeze in 2010, an anticipation of the R&D activities within the SESAR project and a decrease in general operating costs (about M€ 10) and in capital costs.
Furthermore, the Dutch government has also taken some measures, inter alia the permission to establish an equalisation provision, government funding of past under recoveries due to the TNC service provision on the regional LVNL controlled airports, access to loan facilities (both operating and investments) and the earmarking of the net available amount of internal tax to the TNC cost base.
With these cost containment measures and the expected recovery of the traffic volume it is possible to decrease the LVNL component of the terminal unit rate with 2% for 2012 from € 161,15 to € 157,93 and to freeze it on this level for the years 2013 and 2014.
KNMI
KNMI has also introduced cost containment measures (staff cuts and the introduction of AUTO METAR at Groningen Airport Eelde, Maastricht Aachen Airport and Rotterdam The Hague Airport). This will result in cost reductions in the coming years.
Terminal unit rate
Unit rate in € 2011 2012 2013 2014
LVNL 161,15 157,93 157,93 157,93
KNMI 5,33 5,32 4,88 4,71
Terminal unit rate
166,48 163,25 162,81 162,64
6.2. Cost by nature LVNL
Staff costs:
The change is due to:
In the period 2012-2014 a reduction in staff with 28 FTE; In the period 2012-2014 a salary compensation related to the increase in the cost of living
will be between 1-1,5%; Increased pension premiums to bring the pension coverage ratio again at the minimum
level; The, as a rule, individually agreed upon annual steps in salary grades (career
[81], Netherlands Performance Plan (annex to FABEC PP) version 1.0.
progression); Intake of candidate controllers due to the current shortage (also in preparation of a future
demand increase (prevention of future capacity problems).
Other operating costs
This cost category shows a slight increase due to an increase in energy and housekeeping costs after a decrease of over 20% in 2010.
Depreciation costs
An increase in the depreciation costs is due to new investments, e.g. Voice Communication System (2014).
Capital costs
The average operating capital is the sum of the average net book value of fixed assets used by the air navigation service provider in operation or under construction (average long term assets (complementary information) and of the average value of the net current assets. In both cases, assets are those required for the provision of en route services;
The cost of capital before tax is the weighted average of the interest rate on debts. As LVNL does not have equity capital the cost of capital before tax is the weighted average of the interest rate on debts (in %). Part of the LVNL debt consists of commercial loans, the remaining part consists of government loans. It is LVNL’s intent to decrease the portion of the commercial loans. As LVNL will in the future be exposed to the traffic volume risk and the cost risk, the building up of an equity capital is necessary to absorb fluctuations in its operating results.
Exceptional items
There are no exceptional items.
Other income
Other income stems from the sale of Aeronautical publications, hardware maintenance services for third parties and space rental to third parties.
KNMI
The interest rate is the same as the one used by LVNL. Due to its status as Government Agency KNMI has only a very small equity capital.
6.3. By service The more sophisticated cost allocation model (introduced as of 1
st January 2009) enables both
LVNL and KNMI to fill in both reporting tables on costs by nature and on costs by service simultaneously.
[82], Netherlands Performance Plan (annex to FABEC PP) version 1.0.
Annex II, Transparency of the cost base 1. Description of the methodology used for allocating costs of facilities or services between different air navigation services based on the list of facilities and services listed in the relevant ICAO Regional Air Navigation Plan (Doc 7754) and a description of the methodology used for allocating those costs between the different charging zones;
Conformity of cost allocation model with regulations The cost allocation models used by both LVNL and KNMI are in line with: The Convention on International Civil Aviation (ICAO-Treaty; Chicago Convention), Article 15
and the ICAO Rules en Standards: Ø ICAO’s policies on charges for airports and air navigation services (Doc 9082/7), viz.
numbers 36, 38, 40, 41 en 44; Ø ICAO Manual on Air Navigation Services Economics (Doc 9161);
Commission Regulation (EC) No 1794/2006 of 6th December 2006 laying down a common
charging scheme for air navigation services. As stated before the concept of the determined costs, targeted unit rates and the traffic volume and cost risk will not be applied on the terminal ANS provision. This is in line with Article 2 of Regulation 1191/2010, amending Regulation 1794/2006. The entry into force of the amendments of the Charging Implementing Rule will be deferred to January 1
st 2015.
The cost allocation model of KNMI is also in line with:
Convention of the World Meteorological Organization, adopted by the Washington Conference on 11th October 1947;
Guide 904 of the World Meteorological Organization – Guide on Aeronautical Services Cost Recovery – Principles and Guidance;
Annex 3 to the Convention on International Civil Aviation - Meteorological Service for International Air Navigation;
Other relevant ICAO Documents (e.g. Docs 9377, 7604 and 4444). LVNL Article 7 of the amended Commission regulation (EC) 1794/2006 of December 6
th 2006 laying
down a common charging scheme for air navigation services specifies that, where costs are incurred across different charging zones, they shall be allocated in a proportional way on the basis of a transparent methodology as required in Article 8 of the Regulation. Before the start of a performance plan reference period the criteria used to allocate costs between terminal and en route services for each airport have to be defined and reported to the Commission. Since January 1
st 2008, LVNL has reallocated the costs for air navigation services. The costs for
the traffic services related to the approach phase up to flight level 30 (~ 3000 feet) within 20 kilometres (12 nM) from the LVNL controlled airports are allocated to the terminal charging zone on the basis of the operational requirements. The costs for air traffic services related to the approach phase outside this zone are allocated to the en route charging zone. In line with Article 7 of Regulation 1794/2006, the cost of all eligible services, facilities and activities as defined in Article 5 of said Regulation, have been allocated in a transparent manner, to the relevant charging zone, where they have actually incurred. Costs of ATCOs are directly allocated to the relevant charging zone. Depending on the degree of application of the various systems in a specific charging zone, sharing keys are used to allocate the other costs proportionally to these charging zones. About two-thirds of the LVNL-costs are related and allocated to the en route charging zone.
KNMI
The KNMI allocation model is also in line with Regulation 1794/2006. 18% of KNMI costs are allocated to the terminal charging zone.
[83], Netherlands Performance Plan (annex to FABEC PP) version 1.0.
MUAC, Eurocontrol and NSA costs
The MUAC, Eurocontrol Parts I and IX and NSA/Other State costs are exclusively allocated to the en route charging zone.
2. Description and explanation of the method adopted for the calculation of depreciation costs: historic costs or current costs. When current cost accounting is adopted, provision of comparable historic cost data;
Historic capitalization costs are used for the calculation of the depreciation costs.
3. Justification for the cost of capital, including the components of the asset base, the possible adjustments to total assets and the return on equity;
The average operating capital is the sum of the average net book value of fixed assets (on the basis of historic capitalization costs) used by the air navigation service provider in operation or under construction (average long term assets) and of the average value of the net current assets. In both cases, assets are those required for the provision of en route services;
As LVNL does not have an equity capital at the start of the first reference period, the cost of capital before tax is the weighted average of the interest rate on debts (in %). Part of the LVNL debt consists of commercial loans, the remaining part consists of government loans.
Due to its status as Government Agency KNMI has only a very small equity capital. It is financed by the State.
4. Description of the total determined cost for each airport for each terminal charging zone: for aerodromes with less than 20 000 commercial air transport movements per year being calculated as the average over the previous three years, costs may be presented in an aggregated way per aerodrome;
As stated before the concept of the determined costs, targeted unit rates and the traffic volume and cost risk will not be applied on the terminal ANS provision in the period 2012 - 2014. This is in line with Article 2 of Regulation 1191/2010, amending Regulation 1794/2006. The entry into force of the amendments of the Charging Implementing Rule will be deferred to January 1
st 2015.
The costs of the terminal services in the One Group of Airports are pooled and financed by means of the terminal charges imposed on the users of air navigation services. In accordance with Community law other sources of cost recovery (e.g. cross subsidies between en route en terminal charging zone) are not available. The cost data for each one of the LVNL controlled airports are included in the reporting tables.
5. Definition of the criteria used to allocate costs between terminal and en route services for each regulated airport
As stated in reply to the first question, since January 1st 2008, LVNL has reallocated the costs for
air navigation services. The costs for the traffic services related to the approach phase up to flight level 30 (~ 3000 feet) within 20 kilometres (12 nM) from the LVNL controlled airports are allocated to the terminal-charging zone on the basis of the operational requirements. The costs for air traffic services related to the approach phase beyond this zone are allocated to the en route charging zone. As all LVNL controlled airports are put into a One Group of Airports, the same 12 nM criterion is used for all these airports.
[84], Netherlands Performance Plan (annex to FABEC PP) version 1.0.
6. Breakdown of the meteorological costs between direct costs and ‘MET core costs’ defined as the costs of supporting meteorological facilities and services that also serve meteorological requirements in general. These include general analysis and forecasting, weather radar and satellite observations, surface and upper-air observation networks, meteorological communication systems, data-processing centres and supporting core research, training and administration;
Aviation Met Costs are based on:
Direct costs, e.g. Airport observation network, Dedicated Aviation Met systems, ICAO / WMO(CAeM) contribution Dedicated Aviation Met Staff, Housing and Dedicated Aviation Met costs incurred by KNMI Technical and Research departments;
Overhead, AviMet allocation “key” based on Dedicated AviMet Staff divided by Total Forecast Services Department Staff which is used to allocate costs of Management of KNMI Forecast Services Department, Training, Customer Relations Services and Office management and;
Core costs (fixed price for 5 years, except indexation): Radar-, satellite-, surface (SYNOP)-, lightning observations networks (including maintenance and development), Numerical Weather Prediction System infrastructure (including maintenance and development), KNMI overhead not directly allocated to aviation (staffing costs, several international contributions, administrative systems).
7. Description of the methodology used for allocating total MET costs and MET core costs to civil aviation and between charging zones;
See also answer to question 1. The KNMI cost allocation model is in line with the World Meteorological Organisation (WMO) No. 904 “Guide to Aeronautical Meteorological Services Cost Recovery”. 18% of KNMI costs are allocated to the en route charging zone.
8. Description of the reported forecast costs and traffic volume (eighteen months before the start of the reference period)
All organisations involved in the air navigation service provision in the FIR Amsterdam have updated their costs data.
The following assumptions on the possible changes of the costs have been made:
All organisations involved in the air navigation service provision in the FIR Amsterdam have updated their costs data as reported in October 2010 for each of the years of the first reference period.
The following assumptions on possible changes of the costs have been made:
LVNL KNMI
Staff costs 2012 -2014: 1-1,5% annually real wage increase due to increased costs of living
Career progression
2012: zero-growth of salaries (no compensation)
Other operating expenses Annual inflation rate 2% Annual inflation rate 2%
Depreciation
Interests
Exceptional items
[85], Netherlands Performance Plan (annex to FABEC PP) version 1.0.
The terminal volume forecast for the FIR Amsterdam is based upon the LOW Scenario of Statfor regarding the O/D traffic.
9. Description of the reported actual costs and their difference against the determined costs (every year of the reference period)
As stated before the concept of the determined costs, targeted unit rates and the traffic volume and cost risk will not be applied on the terminal ANS provision. This is in line with Article 2 of Regulation 1191/2010, amending Regulation 1794/2006. The entry into force of the amendments of the Charging Implementing Rule will be deferred to January 1
st 2015.

[86], Netherlands Performance Plan (annex to FABEC PP) version 1.0.
Annex III. Additional information to the reporting table in Annex III, specific transparency requirements for the provision of air navigation services at airports falling within Article 1(6)
In The Netherlands no airports are falling within Article 1(6).
[87], Netherlands Performance Plan (annex to FABEC PP) version 1.0.
Additional information to the reporting table in Annex IV, Charging mechanism
1. Description and rationale for the establishment of the different charging zones, in particular with regard to terminal charging zones and potential cross-subsidies between airports;
In 2008 two charging zones have been established in FIR Amsterdam.
Since January 1st 2008, the terminal charging zone has been defined as the volume of
airspace within a radius of 20 kilometres (= 12 nautical miles) around the LVNL controlled airports of landing and take-off and up to flight level 30 (~ 3000 feet).
Since January 1st 2008, all airports controlled by LVNL (Air Traffic Control the Netherlands)
(Amsterdam Airport Schiphol, Rotterdam the Hague Airport, Groningen Airport Eelde, Maastricht Aachen Airport) have been put into a single One Group of Airports. The terminal charging zone comprises the airports in this group.
One single cost base and one single unit rate are also applicable to this terminal charging zone. All airports belonging to this One Group of Airports, Amsterdam Airport Schiphol excepted, have less than 20.000 commercial air transport movements per year.
Twenthe Airport (formerly a military air base), Eindhoven Airport (military air base) and Lelystad Airport (not controlled) do not belong to the aforementioned One Group of Airports for the reasons stated.
As competition in the field of air navigation services is not relevant in the Netherlands, none of the Dutch airports is exempted from Article 1.6 of Regulation 1794/2006.
KNMI is the designated meteorological service provider for the FIR Amsterdam.
2. Description and explanation on the calculation of the forecast chargeable service units;
The number of service units is based on estimates by LVNL of the latest traffic developments, taken into account the CATM forecasts of Amsterdam airport Schiphol. The calculation of a service unit in the terminal charging zone is in line with the Annex V to Regulation 1794/2006.
3. Description of the policy on exemptions and a description of the financing means to cover the related costs;
Since January 1st 2010 the following traffic categories are exempted from the terminal
navigation charges:
Flights performed exclusively for the transport of the reigning monarch and his immediate family, etc.;
Search and rescue flights; Training flights, with the exception of the first touch and go and every successively fourth
touch and go; Humanitarian flights.
In line with Article 9, LVNL receives a financial compensation for the services provided to the exempted flights in the Amsterdam FIR. Funding comes out of the State receipts from the Internal Tax.
[88], Netherlands Performance Plan (annex to FABEC PP) version 1.0.
4. Description of the carry overs of over or under recoveries incurred by member states up to the year 2011 for en route charges;
Article 10 of Regulation 1794/2006 specifies the recovery of the balance resulting from the over and under recoveries of the previous years in general terms. The Netherlands intends to eliminate the under recoveries in the period up until and including 2011 in the first reference period. This will, however, also depend on the traffic volume tendencies. The Dutch government at the same time intends to keep the total chargeable unit rate at the 2011 level. Since January 1
st 2011 the N+2 system of under and over recoveries has been replaced for all
the components of the Dutch cost basis by a N+5 system and thus will be distributed over the years in the period 2011 up until and including 2014.
Although Article 4.1.2 of the Principles for establishing the cost-base for en route charges and the calculation of the unit rates, stating that under- or over-recoveries shall be carried over and included in the cost base of year “N+1” or to a period of up to six years (for years “N” up to “N+5”), is formally not applicable to the terminal charging zone, the en route charging zone carrying over system is applied on the terminal charging zone: in the Dutch terminal cost base in the period 2008 – 2014 will be distributed over the years in the period 2010 up until and including 2014.
5.Description of the under recoveries carried over in accordance with Article 11a (4) second subparagraph;
As stated before, the concept of the determined costs, targeted unit rates and the traffic volume and cost risk will not be applied on the terminal ANS provision in the next years. This is in line with Article 2 of Regulation 1191/2010, amending Regulation 1794/2006. The entry into force of the amendments of the Charging Implementing Rule will be deferred to January 1
st 2015.
Thus, there are no financial traffic volume risk effects on the moment
6 Description by factors of the amounts carried over from the previous reference period in accordance with Article 11a (8) (c);
As stated before the concept of the determined costs, targeted unit rates and the traffic volume and cost risk will not be applied on the terminal ANS provision. This is in line with Article 2 of Regulation 1191/2010, amending Regulation 1794/2006. The entry into force of the amendments of the Charging Implementing Rule will be deferred to January 1
st 2015.
Thus, there are no uncontrollable cost effects on the moment.
7. Description of the other revenues when they exist;
Other income relates to the sale of Aeronautical publications, hardware maintenance services for third parties and space rental to third parties.
[89], Netherlands Performance Plan (annex to FABEC PP) version 1.0.
8. Description of the formula used for calculating terminal charges;
Service units in the terminal charging zone are calculated in line with the formula in Annex V to Regulation 1794/2006. The weight factor is set at 0,7.
9. Description and explanation of incentives applied on users of terminal services;
On the moment no ANS incentive schemes on users are applied. Incentives on users are incorporated in the airport charges, for instance based on the noise production and MTOW.
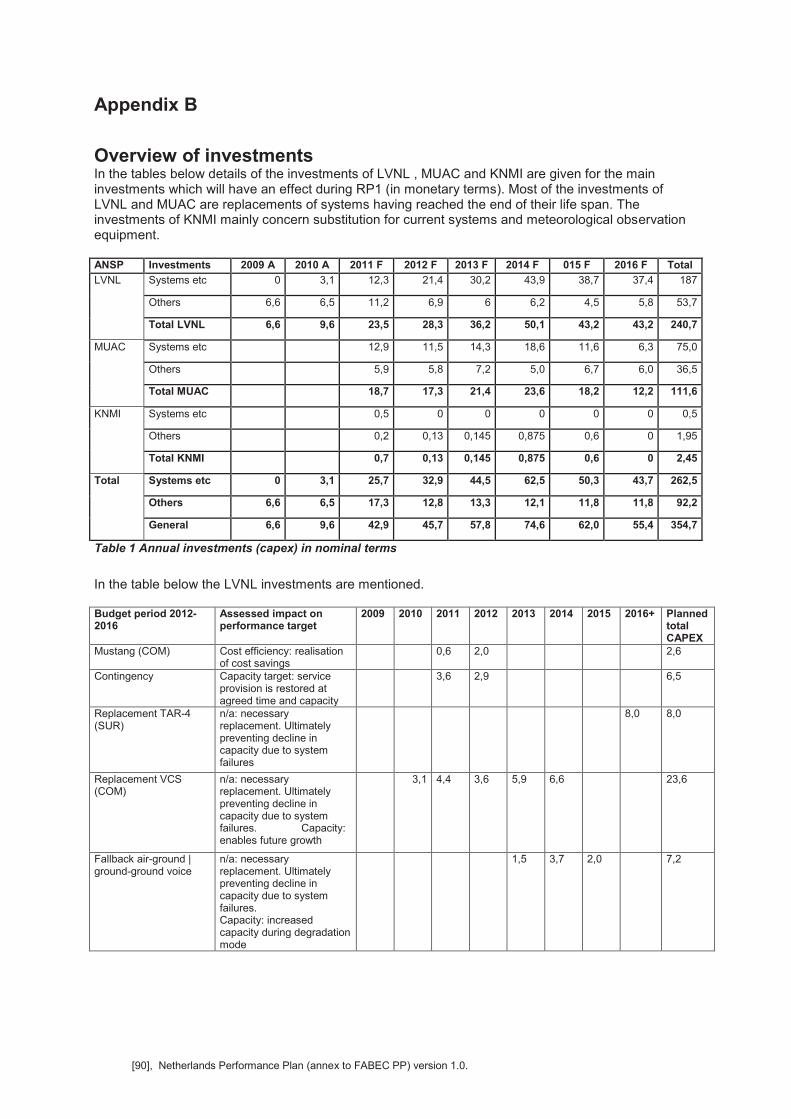
[90], Netherlands Performance Plan (annex to FABEC PP) version 1.0.
Appendix B
Overview of investments In the tables below details of the investments of LVNL , MUAC and KNMI are given for the main investments which will have an effect during RP1 (in monetary terms). Most of the investments of LVNL and MUAC are replacements of systems having reached the end of their life span. The investments of KNMI mainly concern substitution for current systems and meteorological observation equipment. ANSP Investments 2009 A 2010 A 2011 F 2012 F 2013 F 2014 F 015 F 2016 F Total
LVNL Systems etc 0 3,1 12,3 21,4 30,2 43,9 38,7 37,4 187
Others 6,6 6,5 11,2 6,9 6 6,2 4,5 5,8 53,7
Total LVNL 6,6 9,6 23,5 28,3 36,2 50,1 43,2 43,2 240,7
MUAC Systems etc 12,9 11,5 14,3 18,6 11,6 6,3 75,0
Others 5,9 5,8 7,2 5,0 6,7 6,0 36,5
Total MUAC 18,7 17,3 21,4 23,6 18,2 12,2 111,6
KNMI Systems etc 0,5 0 0 0 0 0 0,5
Others 0,2 0,13 0,145 0,875 0,6 0 1,95
Total KNMI 0,7 0,13 0,145 0,875 0,6 0 2,45
Total Systems etc 0 3,1 25,7 32,9 44,5 62,5 50,3 43,7 262,5
Others 6,6 6,5 17,3 12,8 13,3 12,1 11,8 11,8 92,2
General 6,6 9,6 42,9 45,7 57,8 74,6 62,0 55,4 354,7
Table 1 Annual investments (capex) in nominal terms
In the table below the LVNL investments are mentioned. Budget period 2012-2016
Assessed impact on performance target
2009 2010 2011 2012 2013 2014 2015 2016+ Planned total CAPEX
Mustang (COM) Cost efficiency: realisation of cost savings
0,6 2,0 2,6
Contingency Capacity target: service provision is restored at agreed time and capacity
3,6 2,9 6,5
Replacement TAR-4 (SUR)
n/a: necessary replacement. Ultimately preventing decline in capacity due to system failures
8,0 8,0
Replacement VCS (COM)
n/a: necessary replacement. Ultimately preventing decline in capacity due to system failures. Capacity: enables future growth
3,1 4,4 3,6 5,9 6,6 23,6
Fallback air-ground | ground-ground voice
n/a: necessary replacement. Ultimately preventing decline in capacity due to system failures. Capacity: increased capacity during degradation mode
1,5 3,7 2,0 7,2
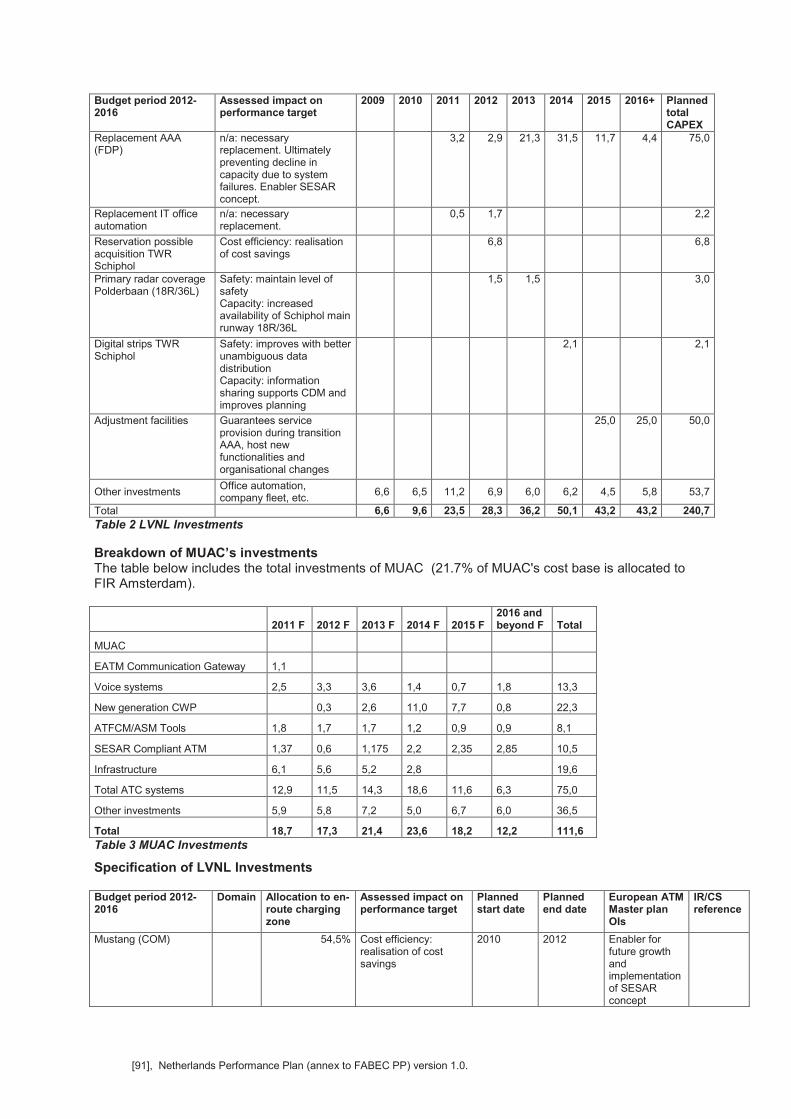
[91], Netherlands Performance Plan (annex to FABEC PP) version 1.0.
Budget period 2012-2016
Assessed impact on performance target
2009 2010 2011 2012 2013 2014 2015 2016+ Planned total CAPEX
Replacement AAA (FDP)
n/a: necessary replacement. Ultimately preventing decline in capacity due to system failures. Enabler SESAR concept.
3,2 2,9 21,3 31,5 11,7 4,4 75,0
Replacement IT office automation
n/a: necessary replacement.
0,5 1,7 2,2
Reservation possible acquisition TWR Schiphol
Cost efficiency: realisation of cost savings
6,8 6,8
Primary radar coverage Polderbaan (18R/36L)
Safety: maintain level of safety Capacity: increased availability of Schiphol main runway 18R/36L
1,5 1,5 3,0
Digital strips TWR Schiphol
Safety: improves with better unambiguous data distribution Capacity: information sharing supports CDM and improves planning
2,1 2,1
Adjustment facilities Guarantees service provision during transition AAA, host new functionalities and organisational changes
25,0 25,0 50,0
Other investments Office automation, company fleet, etc.
6,6 6,5 11,2 6,9 6,0 6,2 4,5 5,8 53,7
Total 6,6 9,6 23,5 28,3 36,2 50,1 43,2 43,2 240,7
Table 2 LVNL Investments
Breakdown of MUAC’s investments The table below includes the total investments of MUAC (21.7% of MUAC's cost base is allocated to FIR Amsterdam).
2011 F 2012 F 2013 F 2014 F 2015 F 2016 and beyond F Total
MUAC
EATM Communication Gateway 1,1
Voice systems 2,5 3,3 3,6 1,4 0,7 1,8 13,3
New generation CWP 0,3 2,6 11,0 7,7 0,8 22,3
ATFCM/ASM Tools 1,8 1,7 1,7 1,2 0,9 0,9 8,1
SESAR Compliant ATM 1,37 0,6 1,175 2,2 2,35 2,85 10,5
Infrastructure 6,1 5,6 5,2 2,8 19,6
Total ATC systems 12,9 11,5 14,3 18,6 11,6 6,3 75,0
Other investments 5,9 5,8 7,2 5,0 6,7 6,0 36,5
Total 18,7 17,3 21,4 23,6 18,2 12,2 111,6
Table 3 MUAC Investments
Specification of LVNL Investments Budget period 2012-2016
Domain Allocation to en-route charging zone
Assessed impact on performance target
Planned start date
Planned end date
European ATM Master plan OIs
IR/CS reference
Mustang (COM)
54,5% Cost efficiency: realisation of cost savings
2010 2012 Enabler for future growth and implementation of SESAR concept
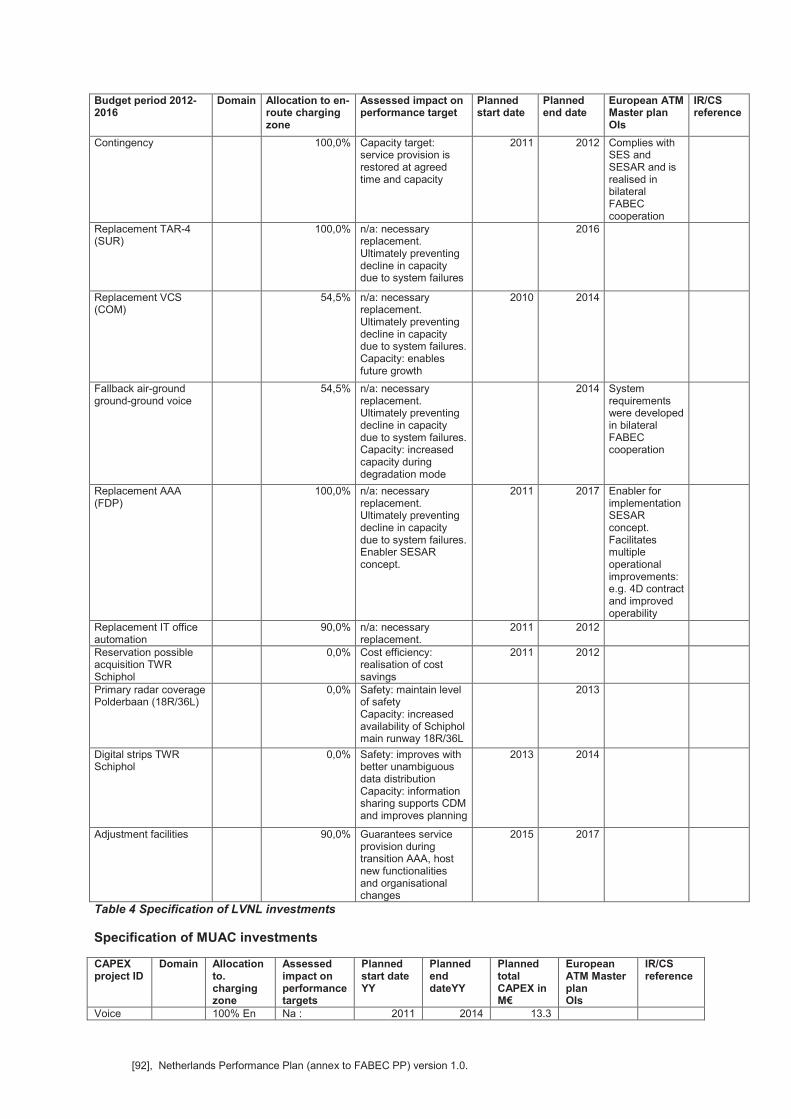
[92], Netherlands Performance Plan (annex to FABEC PP) version 1.0.
Budget period 2012-2016
Domain Allocation to en-route charging zone
Assessed impact on performance target
Planned start date
Planned end date
European ATM Master plan OIs
IR/CS reference
Contingency
100,0% Capacity target: service provision is restored at agreed time and capacity
2011 2012 Complies with SES and SESAR and is realised in bilateral FABEC cooperation
Replacement TAR-4 (SUR)
100,0% n/a: necessary replacement. Ultimately preventing decline in capacity due to system failures
2016
Replacement VCS (COM)
54,5% n/a: necessary replacement. Ultimately preventing decline in capacity due to system failures. Capacity: enables future growth
2010 2014
Fallback air-ground ground-ground voice
54,5% n/a: necessary replacement. Ultimately preventing decline in capacity due to system failures. Capacity: increased capacity during degradation mode
2014 System requirements were developed in bilateral FABEC cooperation
Replacement AAA (FDP)
100,0% n/a: necessary replacement. Ultimately preventing decline in capacity due to system failures. Enabler SESAR concept.
2011 2017 Enabler for implementation SESAR concept. Facilitates multiple operational improvements: e.g. 4D contract and improved operability
Replacement IT office automation
90,0% n/a: necessary replacement.
2011 2012
Reservation possible acquisition TWR Schiphol
0,0% Cost efficiency: realisation of cost savings
2011 2012
Primary radar coverage Polderbaan (18R/36L)
0,0% Safety: maintain level of safety Capacity: increased availability of Schiphol main runway 18R/36L
2013
Digital strips TWR Schiphol
0,0% Safety: improves with better unambiguous data distribution Capacity: information sharing supports CDM and improves planning
2013 2014
Adjustment facilities
90,0% Guarantees service provision during transition AAA, host new functionalities and organisational changes
2015 2017
Table 4 Specification of LVNL investments
Specification of MUAC investments CAPEX project ID
Domain Allocation to. charging zone
Assessed impact on performance targets
Planned start date YY
Planned end dateYY
Planned total CAPEX in M€
European ATM Master plan OIs
IR/CS reference
Voice 100% En Na : 2011 2014 13.3
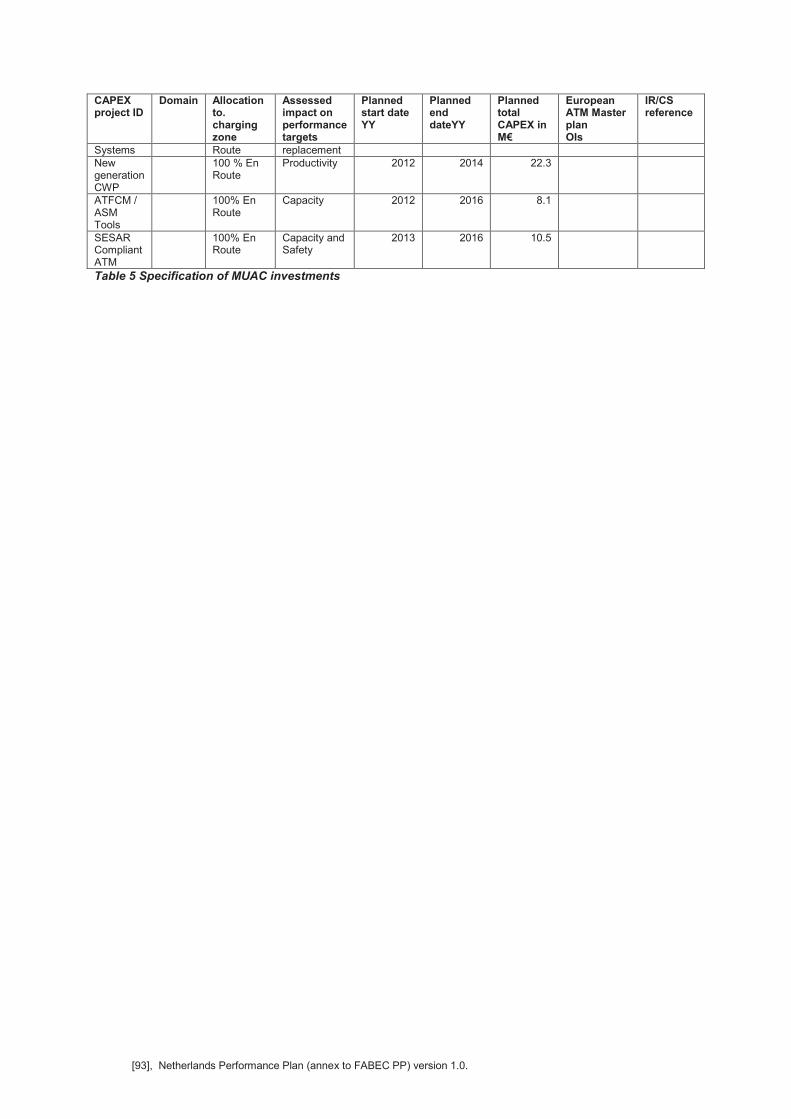
[93], Netherlands Performance Plan (annex to FABEC PP) version 1.0.
CAPEX project ID
Domain Allocation to. charging zone
Assessed impact on performance targets
Planned start date YY
Planned end dateYY
Planned total CAPEX in M€
European ATM Master plan OIs
IR/CS reference
Systems Route replacement New generation CWP
100 % En Route
Productivity 2012 2014 22.3
ATFCM / ASM Tools
100% En Route
Capacity 2012 2016 8.1
SESAR Compliant ATM
100% En Route
Capacity and Safety
2013 2016 10.5
Table 5 Specification of MUAC investments
[94], Netherlands Performance Plan (annex to FABEC PP) version 1.0.
Appendix C Extracts from State Safety Programme
Excerpt
Dutch State Safety Program / Policy agenda Aviation Safety 2011 – 2015
State Safety Programme ICAO standards set out the requirements for States to establish a State Safety Programme (SPP) in order to achieve an acceptable level of safety (AloS) in the operation and maintenance of aircraft, the provision of air traffic services and the operation of aerodromes. The ALoS is a means to verify the performance of the SSP and the separate safety management systems of the various service providers in the aviation chain. The AloS allows a more performance based approach, which complements the more classic compliance based approach. ICAO defines an SPP as a integrated set of rules and activities aiming at improving aviation safety. However, the Netherlands has decided to make a distinction between the State Safety Programme, which describes the current safety situation in the Netherlands and a policy document (Beleidsagenda Luchtvaartveiligheid 2011-2015)) which describes the manner in which the Netherlands intends to improve aviation safety.
Policy document Aviation Safety 2011-2015
The policy document on aviation safety focuses on those issues that need to be improved in the next 5 years in order to be able to improve the civil aviation safety level. The issues have been chosen on the basis of the underlying risks, the division of responsibility and the possibilities to influence the results. Focusing on issue that cannot be influenced should be avoided as this does not contribute to a higher level of safety.
The issues have been selected on the basis of current knowledge of the aviation safety system. This knowledge is based on expert judgment, research and information on incidents and accidents. Furthermore, the issues have been checked by the aviation sector.
As part of the process, an international benchmark of a number of other civil aviation authorities and international organizations has been carried out. It has become clear that the Dutch approach to SSP and SMS does not differ much from those organizations. The issue of strengthening safety management systems is also addressed by that of ICAO, the United States, the United Kingdom and France.
Despite the fact that more and more information is available from incident reporting, it is not yet possible to underpin all the issues in the Aviation Safety Policy Document with evidence. The aim of this policy document is therefore to make issues more measurable as the basis for future policy development issues.
[95], Netherlands Performance Plan (annex to FABEC PP) version 1.0.
Agenda item 4.1.
Introduction and Oversight of Safety Management Systems (SMS)
Introduction
The compliance with rules and regulations by companies and individual persons is currently enforced by granting licenses and carrying out oversight. Oversight consists of both inspections and audits at a system level as well as at product level.
It is considered necessary/essential that all stakeholders in the aviation chain are permanently aware of safety and the need to further improve safety. It is important to deal with the aviation chain as a whole rather than with the individual components. This is the only way to maintain and improve the high safety standard.
The current status
Currently, safety management systems have been implemented (completely or at least partly) in the Dutch aviation sector. A number of companies is preparing the implementation of SMS. In certain parts of the sector SMS is not implemented yet. The degree of the implementation of safety management is dependent the degree of legislation.
Ambition 2011-2015
Support the development of ICAO (Annex 19) on safety management; Align Dutch SMS approach with European developments; Stimulate/promote the increase of the number of companies with SMS; Improve safety awareness in General Aviation (GA) by introduction and elaboration of SMS; Finalise the introduction of SMS certification and developing SMS maturity model to be able to
measure SMS performance.
Actions
Implement an SMS for all those companies in the aviation sector which are legally obliged comply; Stimulate the implementation of SMS in other parts of the aviation sector (esp. General Aviation). Certify Competent Authority (CAA-NL and Military Aviation Authority); Adapt oversight focus towards SMS system and establishing an optimal balance between system
and product oversight; Select indicators to measure effectiveness of SMS; Promote a sector wide SMS system
Indicators
% of companies with an approved SMS; % companies with minimum level of system oversight
Concrete goals 2011-2015
SMS fully implemented in European and national legislation; In 2015 95% of the companies have a certified SMS; ISO certification for Competent Authority
[96], Netherlands Performance Plan (annex to FABEC PP) version 1.0.
Agenda item 4.2.
Development of objective and measurable safety targets
Introduction
The dashboard contains the various elements of the government safety management process. Leading indicators are used to describe the quality of safety management and while lagging indicators are used to describe the performance in the various safety areas. The dashboard gives an overview of the balance between efforts and performance, both at system level and for the various parts.
By clearly defining the goals to be achieved the industry will be enabled to decide which measures they will have to take to meet these goals. The goals should be defined in such a manner as to make the interdependencies within the aviation chain visible.
Current status
The safety goals have already been described at the highest strategic level. Within the context of EU, EASA and ICAO performance indicators and corresponding targets are being developed. By participating in a number of working groups the Netherlands contributes to the international development of these targets.
Ambition 2011-2015
Development of international and harmonized safety indicators
Concrete actions
Define the issues that are of paramount importance to achieve safety; Development of concrete and measurable safety indicators for each part of the aviation system; Set Acceptable and Target Safety Levels in coordination with the relevant stakeholders; Set up an objective monitoring system.
Indicators
Number of objective and measurable indicators Timeliness: the degree to which compliance with implementation dates of international
performance indicators and targets.
Tangible goals
In 2013: development and implementation of a maturity model as indicator of the development phase of Safety Management Systems of both government and major players in the commercial aviation;
In 5 years: a well functioning system for measuring safety performance of the commercial aviation based (safety ) indicators and targets will be in place. The system meets all international requirements/agreements and will enable international benchmarking.
[97], Netherlands Performance Plan (annex to FABEC PP) version 1.0.
Agenda item 4.3. Improvement of data collection and analysis
Introduction
In case of incidents, these are being investigated by the aviation companies within the context of their safety management system. These incidents are also reported to the Analysis Bureau Aviation Incidents (Analyse Bureau Luchtvaartvoorvallen, ABL). On the basis of this information ABL identifies and analyses incidents. It may make recommendations on the basis of these analyses. Feedback is an essential element of safety management systems. By sharing information it is possible to learn from other incidents. Sharing information makes it possible to identify at an early stage possible problems between interfaces. Furthermore, it is possible to use the audit and inspection results for trend analysis.
By investigating possible shortcomings proactively it is possible to prevent incidents and accidents.
Current situation/status
In line with ICAO and European legislation/agreements The Netherlands has incorporated the incident reporting duty in national legislation. A substantial number of incidents have been reported, however, incident analysis can be improved further. The ABL is responsible for collecting the incident reports as well as for analyzing the incidents. Following the evaluation of the mandatory reporting requirement in 2009, the quality of ABL has been improved. The Netherlands shares this information at a European level via the Eccairs (European Co-ordination Centre for Aviation Incident Reporting Systems).
Ambition 2011-2015
Improve quality of incident statistics; Improve European analysis to be able to identify trends or specific problems at an early stage.
Concrete actions
Improve the quality and logging of the data; Carry out frequent and clear trend analyses and warning reports for increasing the benefits of
incident reporting; Subdivide incident reports into quality categories (e.g. usefulness, completeness and relevance); Provide feedback on incident reporting; Improve European analysis to be able to identify trends or specific problems at an early stage; Incident reporting should enable setting new policy priorities on an annual basis.
Indicators
Number of incident analyses carried out by ABL; Quality of the data.
Tangible goals
Semi-annual ABL reports should be available within 2 months; At least 4 signal reports and recommendations (preferably at international level) on the basis of
trend analysis; As of 2015 annual European trend analysis.
[98], Netherlands Performance Plan (annex to FABEC PP) version 1.0.
Agenda item 4.4. Set prerequisites for just culture
Introduction
Having a safety management system in place will not be sufficient to continuously improve aviation safety. Another prerequisite is information. This information will only be available if there is no naming and shaming. Providing or sharing information should be based on trust. In a just culture people will report incidents, which as part of the safety management system will help improve safety. People should not be punished for making mistakes, however repetition/reoccurrence should be prevented. In case of intent or blame, this should be reprimanded/penalized. A mature safety culture depends on trust, transparency and effort as well as on a just culture or a safety culture. A culture of blaming will be detrimental to safety performance.
Current situation/status
The State Law on the Establishment of a Council for Safety (Rijkswet OVV) stipulates that incident and accident analysis is carried out for the benefit of aviation safety;
To increase incident reporting is has also been laid down in law that OVV- testimonies shall not be used in a criminal investigation;
On the basis of an evaluation (Commission van Delden) it has been concluded that none of the indents reported to ABL have been forwarded to the Public Prosecutor;
There is an open dialogue between relevant stakeholders (the aviation sector, ministry of Transport and Justice) on their respective responsibilities and duties.
Ambition 2011-2015
In 2015 there is a safety culture that allows/stimulates an open and transparent sharing of information and investigation of incidents to improve aviation safety;
Sanctions will not be applicable to those who report incidents/provide certain information; Measures will be taken to improve trust between the sector and the Public Prosecutor Stimulate voluntary reporting (in addition to obligatory reporting).
Concrete actions
Develop a tool to measure the maturity of the safety culture; Carry out a bi-annual survey to measure the degree to which one is prepared to report incidents
and accidents and get insight into the main issues one comes across when reporting incidents and accidents;
Draw up clear and concise protocols on the responsibility of the various actors. Establish a strategic meeting to discuss a number of relevant cases and share this information at
a strategic level; Stimulate companies to establish a good code of practice for whistle blowers (people that report
information); Strengthening of just culture by spreading the message that an effective and proactive safety
culture is based on continuously learning; Implement ICAO recommendations; Implement the latest European legislation on incident analysis and incident reporting.
Indicators
% of employees willing to report both internally and externally; The maturity of the safety culture of aviation companies; Number of incident reports
Tangible goals
A minimum of 80% of the participants is willing to report; The safety development develops positively;
[99], Netherlands Performance Plan (annex to FABEC PP) version 1.0.
90% of all the incidents reported that should be reported by several parties are indeed reported.
Agenda item 6.5.
Optimization of Air Navigation Services
Introduction
In the coming years a large number of national and international activities with regard to the use of the Dutch airspace will be carried out, e.g. :
New arrival routes (a a result of the agreement on noise abatement measures); New agreements/arrangements with regard to the civil military use of controlled airspace; Developing and implementing the new Dutch Airspace Vision; Implementation of Single European Sky; Establishment of Functional Airspace Block Europe Central; The transfer of the aviation safety, including Air Navigation Services to the Commission.
The amount of changes require an evaluation of the possible needs to adjust the current the safety concepts/design to maintain a robust safety system. With higher complexity the risk of mistakes and consequences increases.
Current situation/status
The Netherlands is actively involved in European initiatives (EASA, SES and FABEC). Air traffic control the Netherlands, local residents and airports and aircraft operators are involved in the Round Table on Schiphol-issues.
Ambition 2011-2015
Implementation a new air traffic management system to cater for the increase in traffic while at the same time decreasing the complexity;
In case of emergency landings aircraft should preferably make use of the preferential runways in order to avoid densely populated areas;
To increase aviation safety unnecessary flight profiles should be limited as much as possible; New spatial developments that might negatively influence navigation and safety related ground
equipment are avoided; Changes in equipment and systems are only implemented if they contribute to increasing safety
and strengthen the interrelationship between the parties involved/concerned; Arrival and departure routes are designed so as to limit safety risks; The use of the airport is such as to limit safety risks.
Concrete actions
Strengthen safety management systems by introducing change management initiatives involving various actors (introduce pilots in cooperation with the aviation sector) and European legislation.
Decrease the complexity of the operation and increase the overall picture of the operation as well a decentralizing tactical decision making of the operation. LVNL will carry out an impact analysis to assess the impact of the changes proposed on the complexity of the operation;
Air Traffic Control The Netherlands (LVNL) and the Ministry of Transport will jointly set up projects to decrease operational complexity and optimize the role of the pilot in air traffic management as well as technological aids for the support of air traffic management;
Establish the changes needed in ANS to increase safety and efficiency when traffic increases as well as to decrease the environmental impact of air traffic;
Implement new measures to decrease the number of COMLOSS substantially; LVNL reports on the way emergency landings are handled as well as on unusual flight profiles; Establish which ANS changes are necessary to increase safety and to integrate in the policy
agenda; Fit in UAVs in non segregated air space.
Indicators
[100], Netherlands Performance Plan (annex to FABEC PP) version 1.0.
To monitor progress: establish a list of necessary ANS changes for improving safety as well as a schedule for implementation.
Tangible goals 2011-2015
Introduction of Management of Change; Development of a method in order to be able to present internal safety in an uncomplicated
manner; Decisions on changes are only taken if and when the different aspects contribute to a less
complex operation and a reduction in risks. Overall the operation should be less complicated even when capacity increases.
[101], Netherlands Performance Plan (annex to FABEC PP) version 1.0.
Annex D: Stakeholder Consultation Documentation
These documents are provided in a separate document.
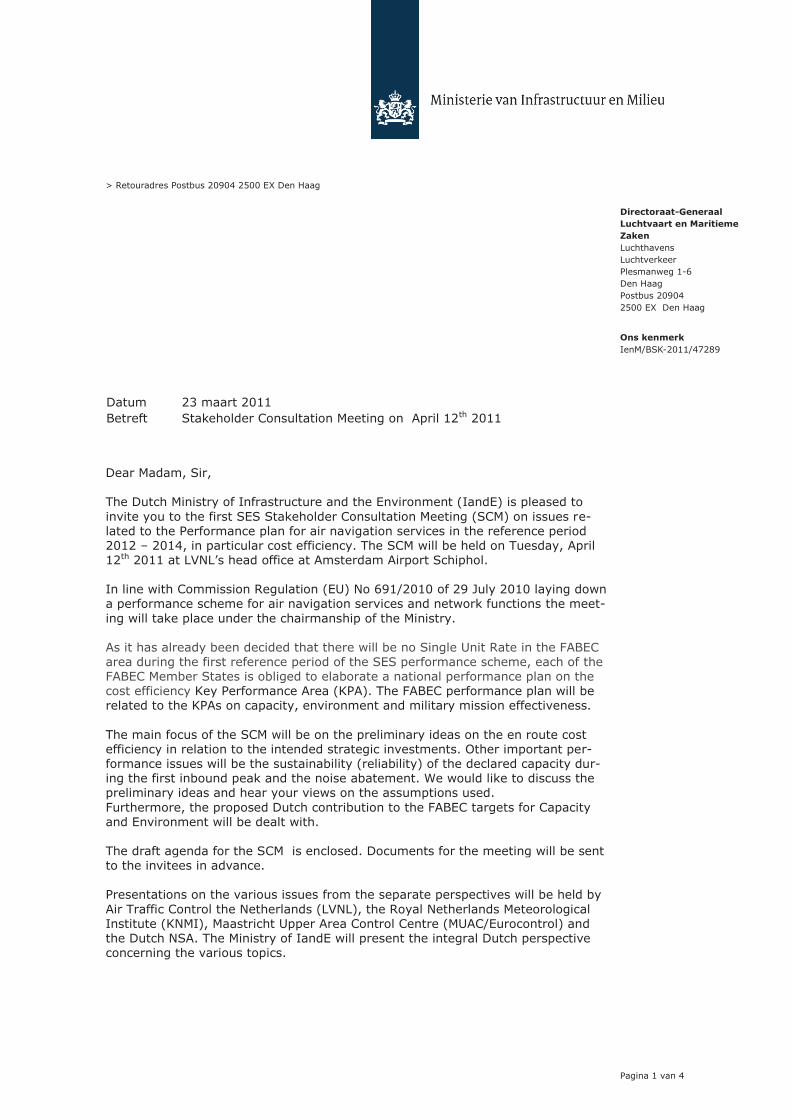
Pagina 1 van 4
> Retouradres Postbus 20904 2500 EX Den Haag
Datum 23 maart 2011
Betreft Stakeholder Consultation Meeting on April 12th 2011
Directoraat-Generaal
Luchtvaart en Maritieme
Zaken
Luchthavens
Luchtverkeer
Plesmanweg 1-6
Den Haag
Postbus 20904
2500 EX Den Haag
Ons kenmerk
IenM/BSK-2011/47289
Dear Madam, Sir, The Dutch Ministry of Infrastructure and the Environment (IandE) is pleased to invite you to the first SES Stakeholder Consultation Meeting (SCM) on issues re-lated to the Performance plan for air navigation services in the reference period 2012 – 2014, in particular cost efficiency. The SCM will be held on Tuesday, April 12th 2011 at LVNL’s head office at Amsterdam Airport Schiphol. In line with Commission Regulation (EU) No 691/2010 of 29 July 2010 laying down a performance scheme for air navigation services and network functions the meet-ing will take place under the chairmanship of the Ministry. As it has already been decided that there will be no Single Unit Rate in the FABEC area during the first reference period of the SES performance scheme, each of the FABEC Member States is obliged to elaborate a national performance plan on the cost efficiency Key Performance Area (KPA). The FABEC performance plan will be related to the KPAs on capacity, environment and military mission effectiveness. The main focus of the SCM will be on the preliminary ideas on the en route cost efficiency in relation to the intended strategic investments. Other important per-formance issues will be the sustainability (reliability) of the declared capacity dur-ing the first inbound peak and the noise abatement. We would like to discuss the preliminary ideas and hear your views on the assumptions used. Furthermore, the proposed Dutch contribution to the FABEC targets for Capacity and Environment will be dealt with. The draft agenda for the SCM is enclosed. Documents for the meeting will be sent to the invitees in advance. Presentations on the various issues from the separate perspectives will be held by Air Traffic Control the Netherlands (LVNL), the Royal Netherlands Meteorological Institute (KNMI), Maastricht Upper Area Control Centre (MUAC/Eurocontrol) and the Dutch NSA. The Ministry of IandE will present the integral Dutch perspective concerning the various topics.
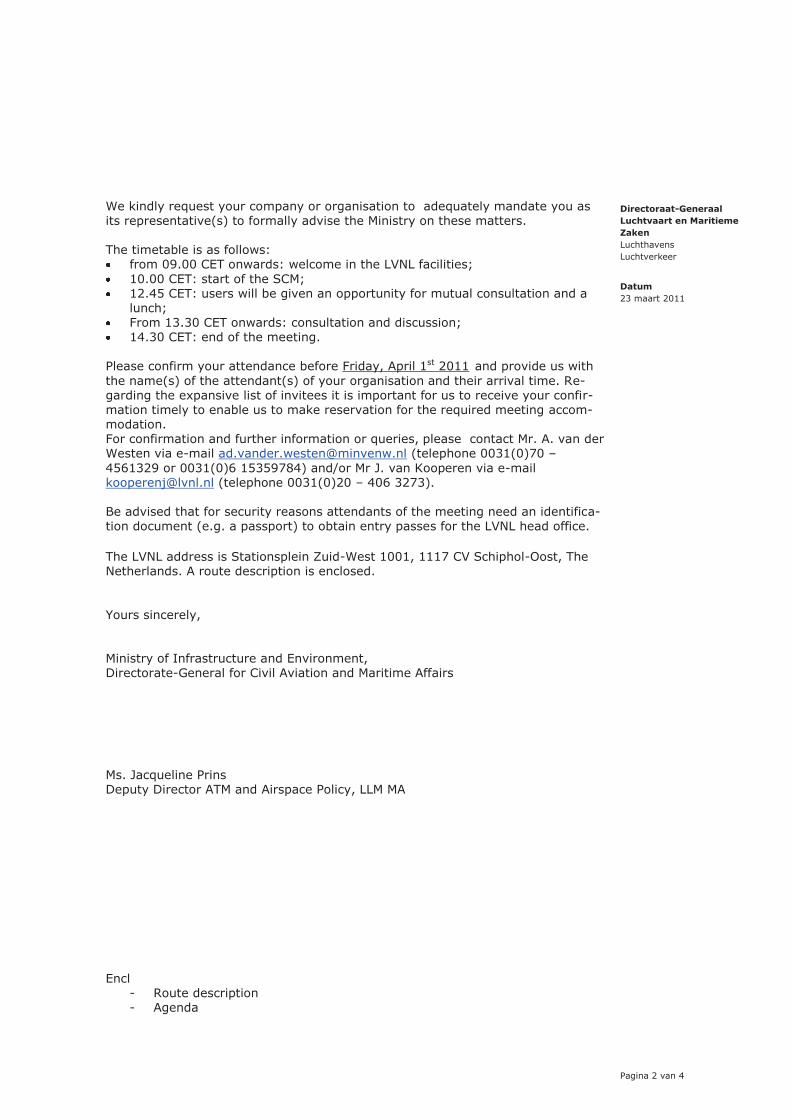
Directoraat-Generaal
Luchtvaart en Maritieme
Zaken
Luchthavens
Luchtverkeer
Datum
23 maart 2011
Pagina 2 van 4
We kindly request your company or organisation to adequately mandate you as its representative(s) to formally advise the Ministry on these matters. The timetable is as follows: from 09.00 CET onwards: welcome in the LVNL facilities; 10.00 CET: start of the SCM; 12.45 CET: users will be given an opportunity for mutual consultation and a
lunch; From 13.30 CET onwards: consultation and discussion; 14.30 CET: end of the meeting.
Please confirm your attendance before Friday, April 1st 2011 and provide us with the name(s) of the attendant(s) of your organisation and their arrival time. Re-garding the expansive list of invitees it is important for us to receive your confir-mation timely to enable us to make reservation for the required meeting accom-modation. For confirmation and further information or queries, please contact Mr. A. van der Westen via e-mail [email protected] (telephone 0031(0)70 – 4561329 or 0031(0)6 15359784) and/or Mr J. van Kooperen via e-mail [email protected] (telephone 0031(0)20 – 406 3273). Be advised that for security reasons attendants of the meeting need an identifica-tion document (e.g. a passport) to obtain entry passes for the LVNL head office. The LVNL address is Stationsplein Zuid-West 1001, 1117 CV Schiphol-Oost, The Netherlands. A route description is enclosed. Yours sincerely, Ministry of Infrastructure and Environment, Directorate-General for Civil Aviation and Maritime Affairs Ms. Jacqueline Prins Deputy Director ATM and Airspace Policy, LLM MA Encl
- Route description - Agenda
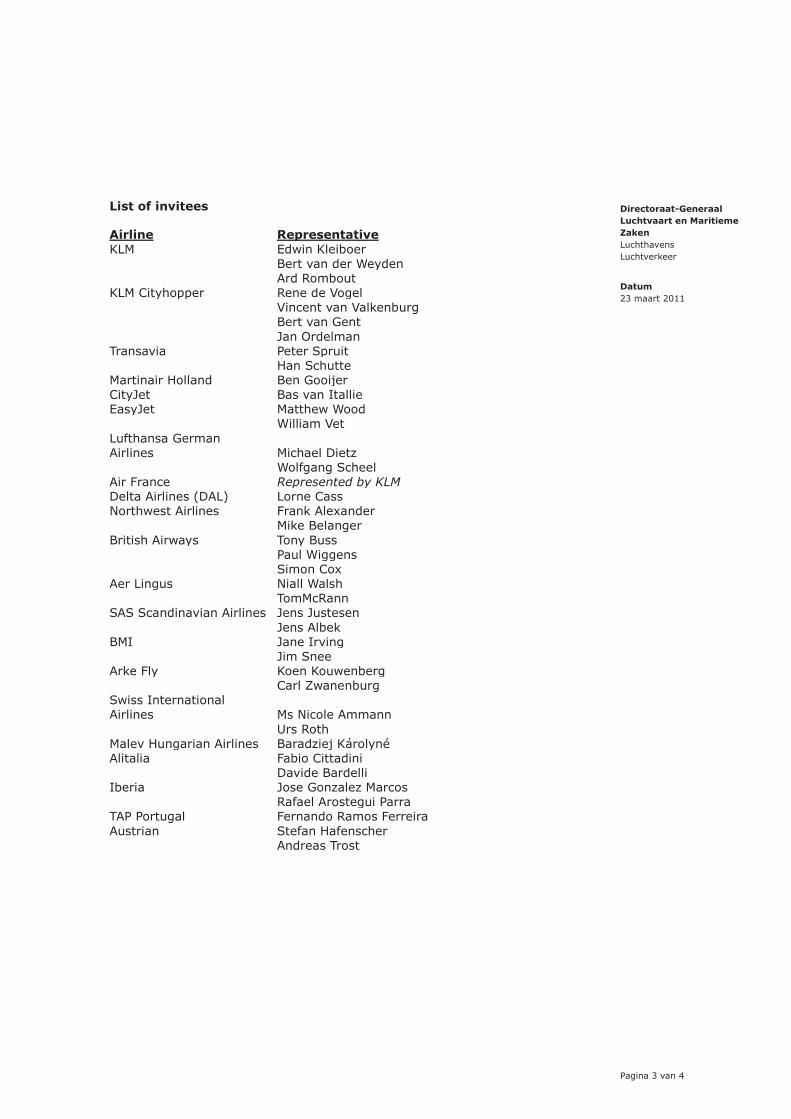
Directoraat-Generaal
Luchtvaart en Maritieme
Zaken
Luchthavens
Luchtverkeer
Datum
23 maart 2011
Pagina 3 van 4
List of invitees
Airline Representative
KLM Edwin Kleiboer
Bert van der Weyden
Ard Rombout
KLM Cityhopper Rene de Vogel
Vincent van Valkenburg
Bert van Gent
Jan Ordelman
Transavia Peter Spruit
Han Schutte
Martinair Holland Ben Gooijer CityJet Bas van Itallie EasyJet Matthew Wood
William Vet
Lufthansa German Airlines Michael Dietz
Wolfgang Scheel
Air France Represented by KLM
Delta Airlines (DAL) Lorne Cass Northwest Airlines Frank Alexander
Mike Belanger
British Airways Tony Buss
Paul Wiggens
Simon Cox
Aer Lingus Niall Walsh
TomMcRann
SAS Scandinavian Airlines Jens Justesen
Jens Albek
BMI Jane Irving
Jim Snee
Arke Fly Koen Kouwenberg
Carl Zwanenburg
Swiss International Airlines Ms Nicole Ammann
Urs Roth
Malev Hungarian Airlines Baradziej Károlyné Alitalia Fabio Cittadini
Davide Bardelli
Iberia Jose Gonzalez Marcos
Rafael Arostegui Parra
TAP Portugal Fernando Ramos Ferreira Austrian Stefan Hafenscher
Andreas Trost
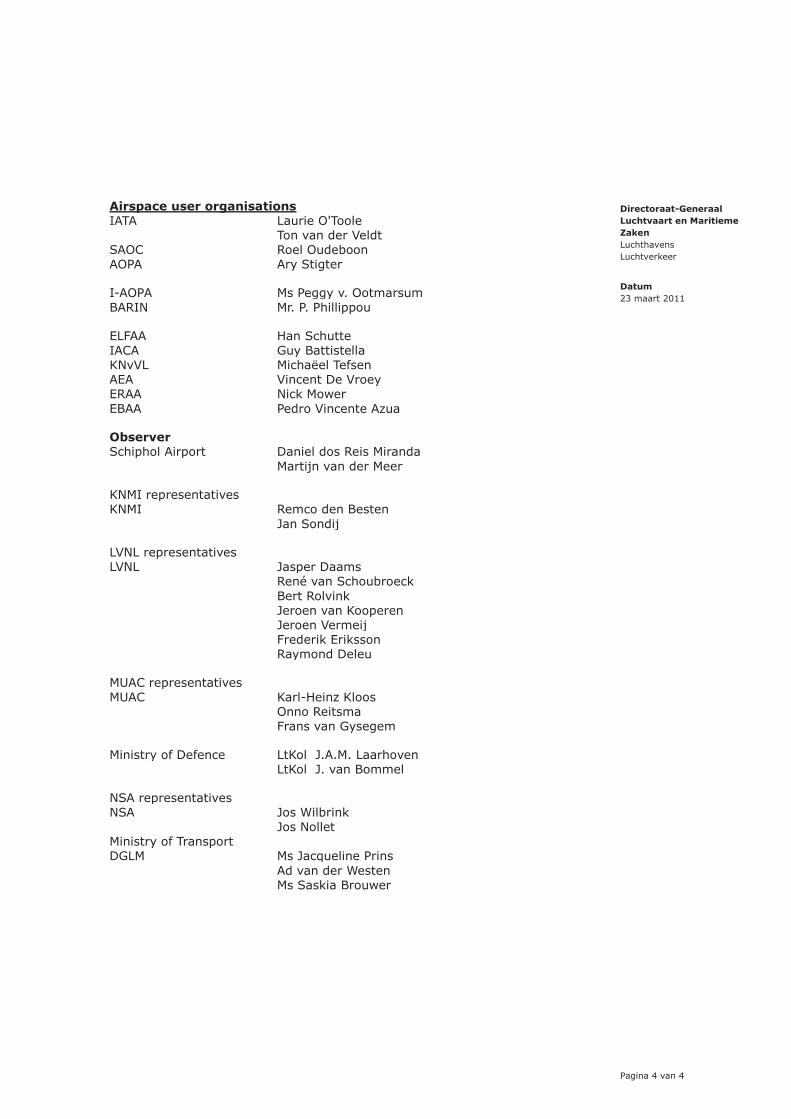
Directoraat-Generaal
Luchtvaart en Maritieme
Zaken
Luchthavens
Luchtverkeer
Datum
23 maart 2011
Pagina 4 van 4
Airspace user organisations
IATA Laurie O'Toole
Ton van der Veldt
SAOC Roel Oudeboon AOPA Ary Stigter
I-AOPA Ms Peggy v. Ootmarsum BARIN Mr. P. Phillippou
ELFAA Han Schutte IACA Guy Battistella KNvVL Michaëel Tefsen AEA Vincent De Vroey ERAA Nick Mower EBAA Pedro Vincente Azua
Observer
Schiphol Airport Daniel dos Reis Miranda
Martijn van der Meer
KNMI representatives KNMI Remco den Besten
Jan Sondij
LVNL representatives LVNL Jasper Daams
René van Schoubroeck
Bert Rolvink
Jeroen van Kooperen
Jeroen Vermeij
Frederik Eriksson
Raymond Deleu
MUAC representatives MUAC Karl-Heinz Kloos
Onno Reitsma
Frans van Gysegem
Ministry of Defence LtKol J.A.M. Laarhoven
LtKol J. van Bommel
NSA representatives NSA Jos Wilbrink
Jos Nollet
Ministry of Transport DGLM Ms Jacqueline Prins
Ad van der Westen
Ms Saskia Brouwer
SES
Perfo
rm
an
ce S
ch
em
eA
NS
1stS
takeh
old
er
Co
nsu
ltati
on
Meeti
ng
co
ncern
ing
Prelim
inary
data
on
perfo
rm
an
ce
for
Am
ste
rd
am
FIR
2
01
2 –
20
14

Agenda
•10.0
0-1
0.1
0 W
elc
om
e–
Purp
ose
and f
orm
at
•10.1
0 –
10.1
5–
Appro
val of
dra
ft m
inute
s o
f U
CM
Septe
mber
21
st2010 (
Chair)
•10.1
5 –
10.2
5–
Info
rmative b
riefing o
n s
tatu
s o
f th
e F
ABEC a
nd N
L-c
ontr
ibution t
o t
he F
ABEC p
erf
orm
ance p
lan:
(Min
istr
y o
f In
frastr
uctu
re a
nd t
he E
nvironm
ent)
•10.2
5 –
10.
35
–Perf
orm
ance p
lan g
enera
l item
s (
Min
istr
y o
f Ia
ndE)
•10.3
5 –
12.1
5–
KPIs
and t
arg
ets
: pre
senta
tions b
y L
VN
L,
KN
MI,
MU
AC a
nd N
SA
•12.1
5 –
12.3
0–
Genera
loverv
iew
, in
clu
din
gin
terr
ela
tionship
s b
etw
een
KPAs/K
PIs
(Min
istr
y I
andE)
•12.3
0 –
12.4
5–
Recap (
Chair)
•12.
45 –
13.3
0–
Users
’m
utu
al consultation d
uring lunch b
reak
•13.3
0 –
14.3
0–
Consultation a
nd d
iscussio
n
•14.3
0–
End o
f m
eeting
2
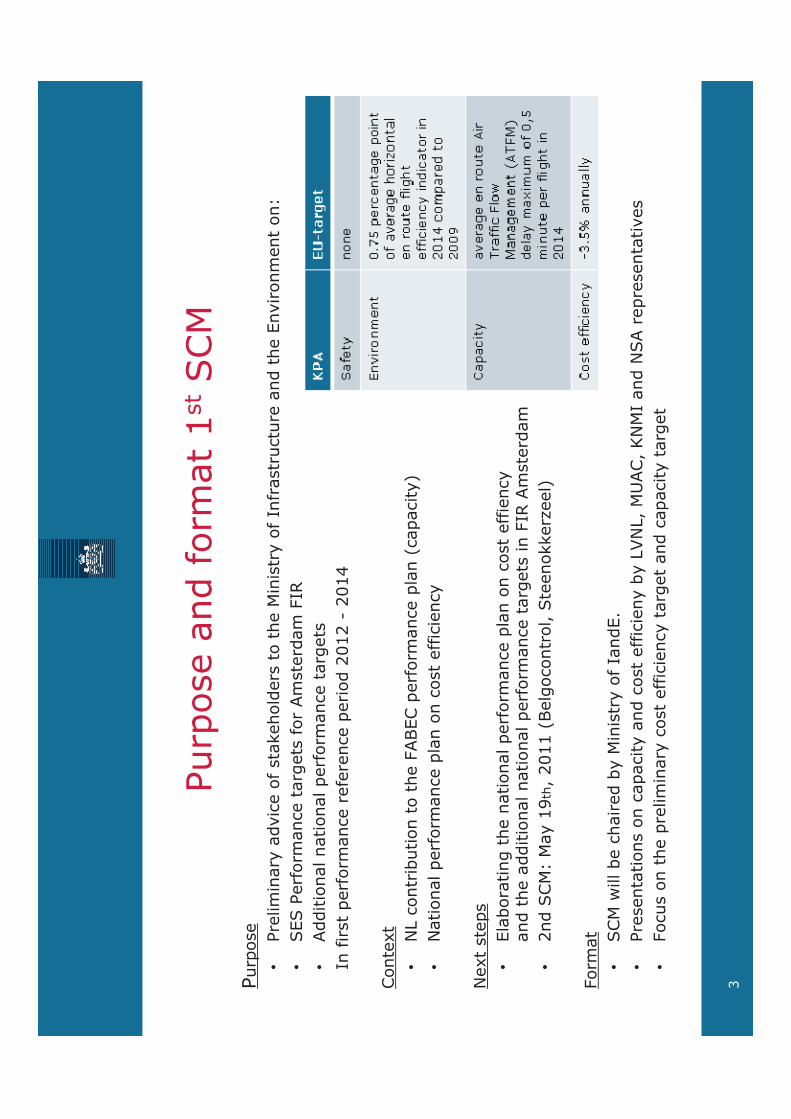
Purp
ose
and f
orm
at
1stSCM
Purp
ose
•Pre
lim
inary
advic
eof sta
kehold
ers
to t
he M
inis
try
of
Infr
astr
uctu
reand t
he E
nvironm
ent
on:
•SES P
erf
orm
ance t
arg
ets
for
Am
ste
rdam
FIR
•Additio
nalnationalperf
orm
ance t
arg
ets
In first
perf
orm
ance r
efe
rence
period
2012 -
2014
Conte
xt
•N
L c
ontr
ibution
to t
he F
ABEC
perf
orm
ance p
lan (
capacity)
•N
ational perf
orm
ance p
lan o
ncost
eff
icie
ncy
Next
ste
ps
•Ela
bora
ting
the n
ationalperf
orm
ance p
lan o
ncost
eff
iency
and t
he a
dditio
nalnationalperf
orm
ance t
arg
ets
in F
IR A
mste
rdam
•2nd S
CM
: M
ay 1
9th
, 2011 (
Belg
ocontr
ol, S
teenokkerz
eel)
Form
at
•SCM
willbe
chaired
by
Min
istr
yof Ia
ndE.
•Pre
senta
tions
on
capacity
and c
ost
eff
icie
ny
by
LVN
L,
MU
AC,
KN
MI
and N
SA r
epre
senta
tives
•Focus o
nth
e p
relim
inary
cost
eff
icie
ncy t
arg
et
and c
apacity
targ
et
3
Min
ute
sand a
ction
list
•M
inute
s:
finalappro
valof
dra
ftre
port
of
meeting S
epte
mber
21st,
2010
suggestions
and r
em
ark
sre
ceiv
ed
have b
een inclu
ded
•Action
list:
all a
ctions
com
ple
ted
and c
losed
4
SES P
erf
orm
ance S
chem
eRefe
rence
period
1 (
2012-2
014)
•Sta
tes
or
FABs
need
to e
lebora
tePerf
orm
ance P
lan.
•FABEC S
SB h
as d
ecid
ed
to s
ubm
ita “
pro
vis
ional”
FABEC
Perf
orm
ance P
lan
for
the first
refe
rence
period
dealing
with
:
–Safe
ty;
–Environm
ent;
–Capacity;
–M
ilitairy
Mis
sio
nEffectivenes;
–Aggre
gate
dnationalCost
effic
iency t
arg
ets
at
FABEC level
(glo
balfigure
dem
onstr
ating
the c
ost
eff
icie
ncy e
ffort
at
FABEC level)
•Cost
effic
iency a
t nationalle
vel due
to a
bsence o
f a F
ABEC s
ingle
unit r
ate
.
The indiv
idualnationalpla
ns o
ncost
effic
iency a
nd a
dditio
nalnationalKPIs
willbe
inclu
ded
in a
nannex t
o F
ABEC P
P.
5
NL m
acro
-econom
icconte
xt
in R
P1
•Purp
ose:
•Expla
nation o
f th
e a
ssum
ptions o
n t
he e
conom
ic c
onditio
ns a
nd c
ircum
sta
nces u
nder
whic
h t
he p
erf
orm
ance p
lan w
ill be im
ple
mente
d.
•Rele
vant
glo
bal econom
ic d
evelo
pm
ents
in g
enera
l qualita
tive t
erm
s:
•Although p
rofiting f
rom
econom
ic d
evelo
pm
ents
in o
ther
regio
ns e
conom
icpers
pectives f
or
NW
-Euro
pe c
onsid
era
bly
less p
ositiv
e/o
ptim
istic t
han f
or
those
oth
er
regio
ns
•O
il p
rice c
onsid
era
ble
incre
ase:
in S
TATFO
R f
ore
cast
betw
een $
100 a
nd $
150 p
er
barr
el.
•Euro
/dollar
parity
will sta
y a
t th
e s
am
e level:
1€
= $
1,3
5 –
1,4
0.
•N
L:
GD
P:
betw
een +
1,5
% a
nd +
2%
per
year
Private
consum
ptions:
+ 1
,25%
per
year
Sta
te’s
consum
ption:
no c
hange
Inflation:
betw
een 1
,5%
and 3
,5%
per
year
Incre
ase in w
ages:
2,5
% p
er
year
Unem
plo
ym
ent
rate
: sta
yin
g a
t about
4,5
%
6
LV
NL
(sep
arate
presen
tati
on
an
d r
oad
map
en
clo
sed
)
7

MU
AC
(sep
arate
presen
tati
on
an
d r
oad
map
en
clo
sed
)
8
KN
MI
(sep
arate
presen
tati
on
an
d r
oad
map
en
clo
sed
)
9
NS
A(sep
arate
presen
tati
on
an
d r
oad
map
en
clo
sed
)
10
MIN
IS
TR
Y I
AN
D E
C
on
so
lid
ati
on
11
Overv
iew
nationalperf
orm
ance t
arg
ets
Cost
eff
icie
ncy
Capacity
Environm
ent
Safe
ty
12
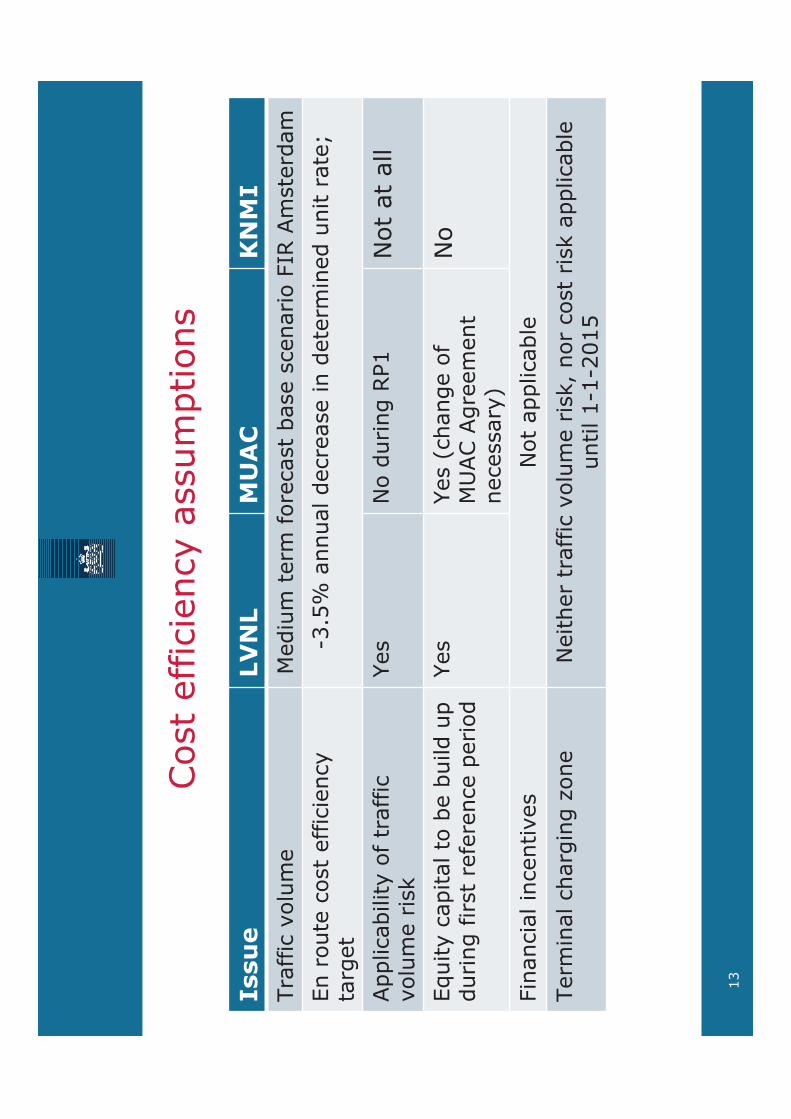
Cost
eff
icie
ncy a
ssum
ptions
Issu
eLV
NL
MU
AC
KN
MI
Tra
ffic
volu
me
Mediu
m t
erm
fore
cast
base s
cenario F
IR A
mste
rdam
En r
oute
cost
effic
iency
targ
et
-3.5
% a
nnualdecre
ase
in d
ete
rmin
ed
unit r
ate
;
Applicability
of
traff
icvolu
me r
isk
Yes
No d
uring
RP1
Not
at
all
Equity
capitalto
be
build
up
during
firs
tre
fere
nce
period
Yes
Yes
(change
of
MU
AC A
gre
em
ent
necessary
)
No
Fin
ancia
l in
centives
Not
applicable
Term
inal charg
ing
zone
Neither
traff
icvolu
me r
isk,
nor
cost
risk a
pplicable
until1-1
-2015
13
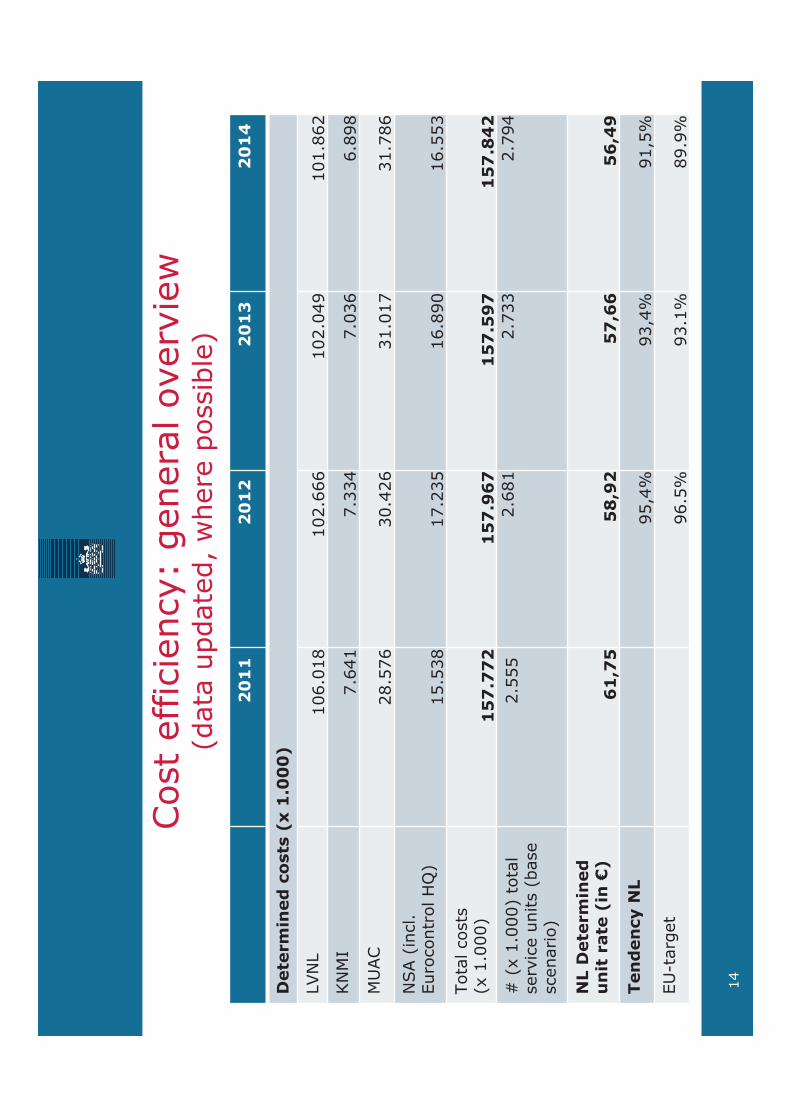
Cost
eff
icie
ncy:
genera
loverv
iew
(data
update
d,
where
possib
le)
20
11
20
12
20
13
20
14
Dete
rm
ined
co
sts
(x 1
.00
0)
LVN
L106.0
18
102.6
66
102.0
49
101.8
62
KN
MI
7.6
41
7.3
34
7.0
36
6.8
98
MU
AC
28.5
76
30.4
26
31.0
17
31.7
86
NSA (
incl.
Euro
contr
ol H
Q)
15.5
38
17.2
35
16.8
90
16.5
53
Tota
l costs
(x 1
.000)
15
7.7
72
15
7.9
67
15
7.5
97
15
7.8
42
# (
x 1
.000)
tota
lserv
ice u
nits (
base
scenario)
2.5
55
2.6
81
2.7
33
2.7
94
NL D
ete
rm
ined
un
it r
ate
(in
€)
61
,75
58
,92
57
,66
56
,49
Ten
den
cy
NL
95,4
%93,4
%91,5
%
EU
-targ
et
96.5
%93.1
%89.9
%
14

Capacity
Additio
nalnationalkpiand t
arg
ets
for
Schip
hol
•KPI
–Avera
ge A
TFM
dela
ySchip
hol(e
n r
oute
and
term
inal)
–Susta
inability
of
decla
red
capacity
in f
irst
inbound
peak.
•Targ
et
–1 m
inute
avera
ge A
TFM
dela
yper
flig
ht
–85%
of
decla
red
capacity
of
68 m
ovem
ents
(inbounds)
15
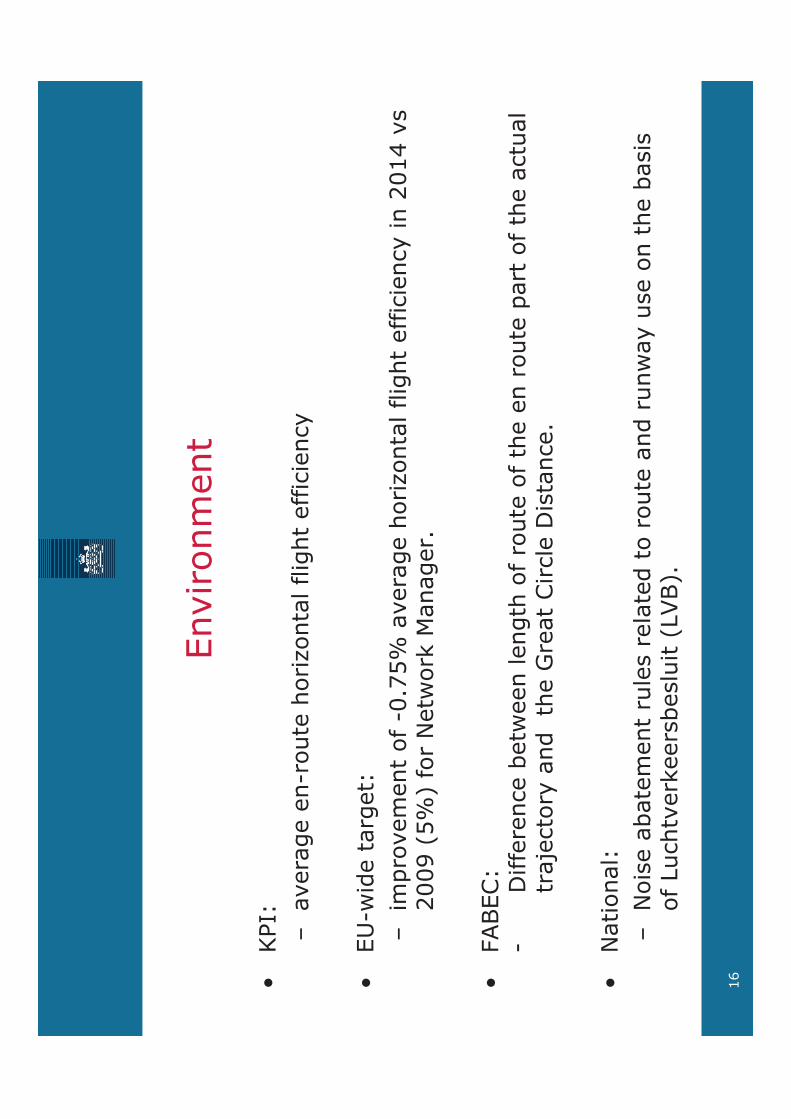
Environm
ent
•KPI:
–avera
ge e
n-r
oute
horizonta
l flig
ht
eff
icie
ncy
•EU
-wid
eta
rget:
–im
pro
vem
ent
of
-0.7
5%
avera
ge h
orizonta
l flig
ht
eff
icie
ncy in 2
014 v
s2009 (
5%
) fo
rN
etw
ork
Manager.
•FABEC:
-D
iffe
rence
betw
een
length
of
route
of th
e e
n r
oute
part
of
the a
ctu
al
traje
cto
ryand
the G
reat
Circle
Dis
tance.
•N
ational:
–N
ois
eabate
ment
rule
sre
late
dto
route
and r
unw
ay
use
on
the b
asis
of
Luchtv
erk
eers
beslu
it (
LVB).
16
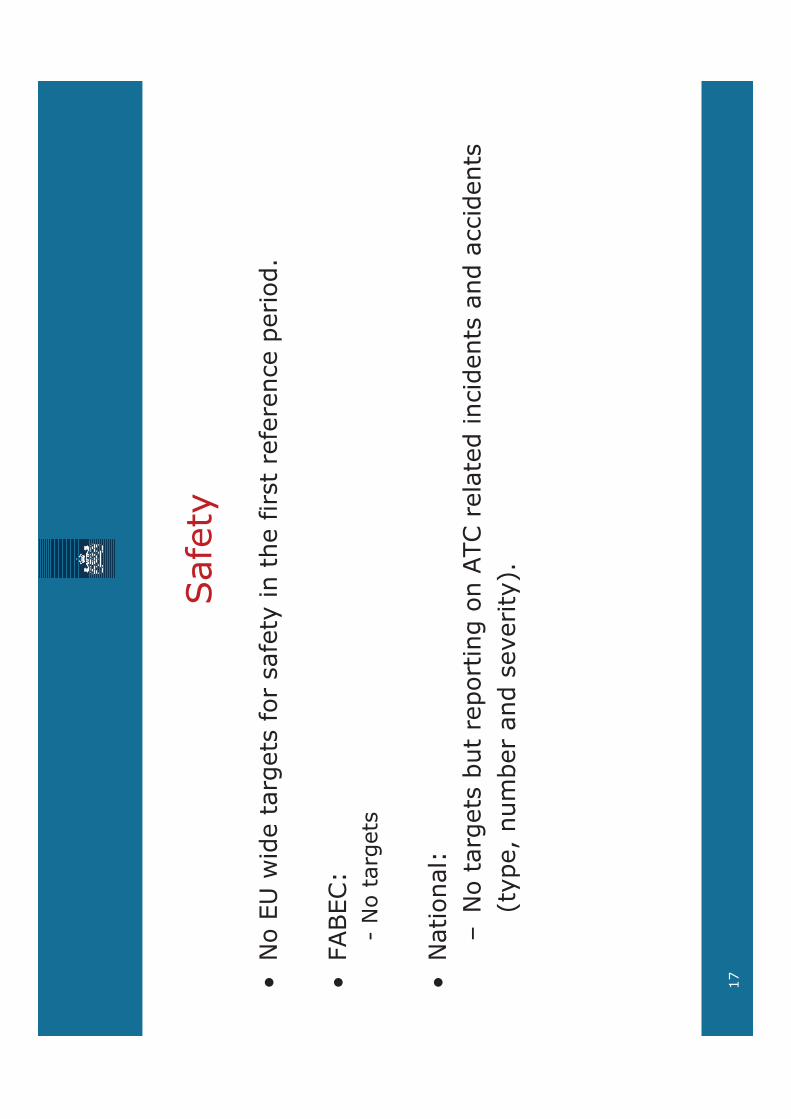
Safe
ty
•N
o E
U w
ide
targ
ets
for
safe
tyin
the f
irst
refe
rence
period.
•FABEC:
-N
o t
arg
ets
•N
ational:
–N
o t
arg
ets
but
report
ing
on
ATC r
ela
ted
incid
ents
and a
ccid
ents
(type,
num
ber
and s
everity
).
17

Monitoring
& r
eport
ing
•Purp
ose:
check o
n p
erf
orm
ance c
om
pliance;
in c
ase o
f non c
om
pliance,
trig
gering o
f suitable
action.
FABEC P
erf
orm
ance P
lan:
monitoring
and r
eport
ing
once
or
twic
ea y
ear
(dependin
gon
the K
PA/K
PI)
•M
UAC:
Capacity:
to b
ein
clu
ded
in F
ABEC p
rocedure
;
Cost-
eff
icie
ncy:
continuation
of
curr
ent
Euro
contr
ol pra
ctice
•LVN
L :
Capacity
to b
ein
clu
ded
in F
ABEC p
rocedure
;
Cost-
effic
iency
and a
dditio
nalkpis
: m
onitoring
and r
eport
ing
on
a q
uart
erly
base (
continuation
of curr
ent
nationalpro
cedure
)
•M
ET:
Cost
eff
icie
ncy:
regula
rly
(continuation
of
curr
ent
nationalpro
cedure
)
18
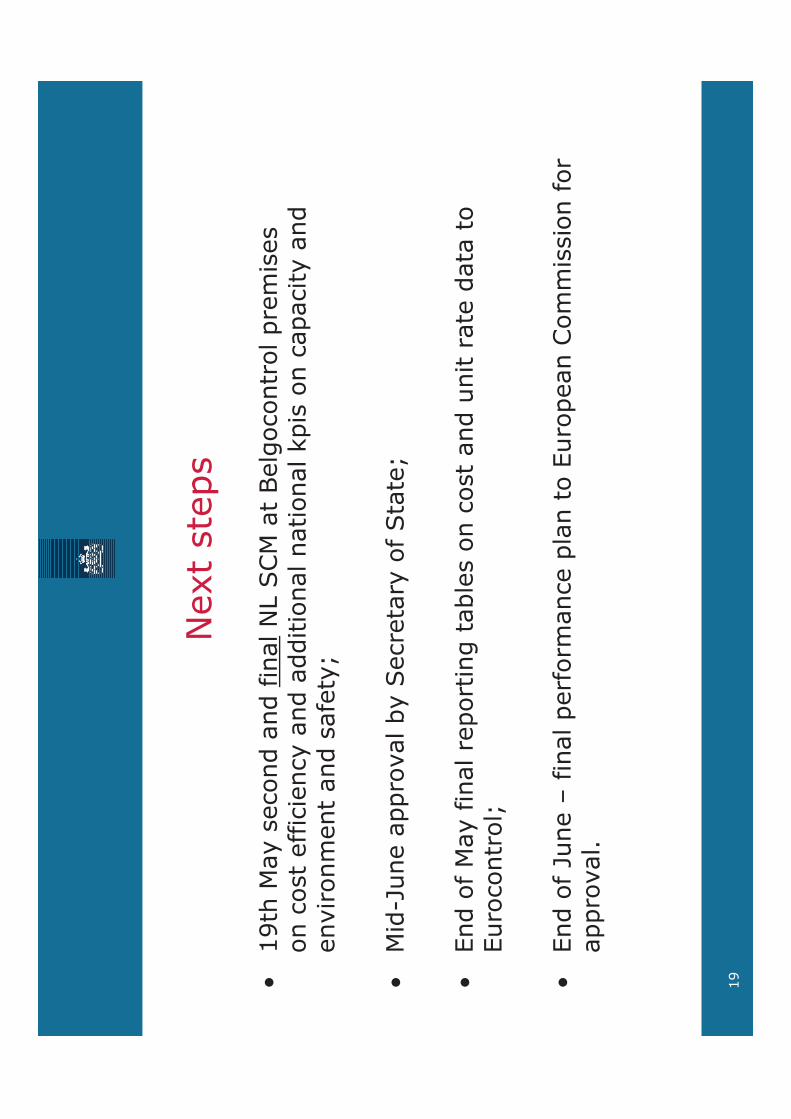
Next
ste
ps
•19th
May s
econd
and f
inalN
L S
CM
at
Belg
ocontr
olpre
mis
es
on
cost
eff
icie
ncy a
nd a
dditio
nalnationalkpis
on
capacity
and
environm
ent
and s
afe
ty;
•M
id-J
une
appro
valby
Secre
tary
of Sta
te;
•End o
f M
ay f
inalre
port
ing
table
s o
ncost
and u
nit r
ate
data
to
Euro
contr
ol;
•End o
f Ju
ne
–finalperf
orm
ance p
lan t
o E
uro
pean
Com
mis
sio
nfo
rappro
val.
19

2nd
SCM
MAY 1
9th,
at
Belg
ocontr
ol
Purp
ose
•Fin
aladvic
eof
sta
kehold
ers
to t
he M
inis
try
of
Infr
astr
uctu
reand t
he
Environm
ent
on:
Cost
data
and t
arg
ete
dunit r
ate
.
Additio
nalnationalperf
orm
ance t
arg
ets
20

Questions
21
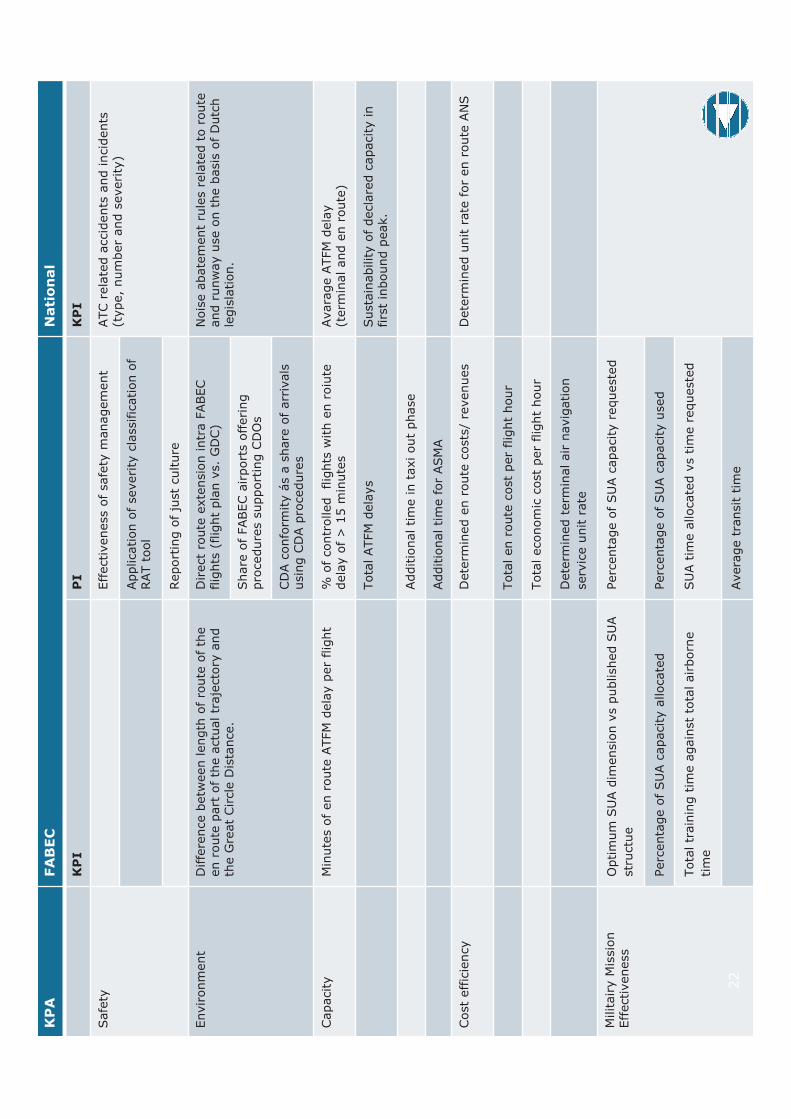
KP
AFA
BEC
Nati
on
al
KP
IP
IK
PI
Indic
ato
rs 1
st
refe
rence
period
Eff
ectiveness
of safe
tym
anagem
ent
Application
of
severi
tycla
ssific
ation
of
RAT t
ool
Safe
tyATC r
ela
ted
accid
ents
and incid
ents
(type,
num
ber
and
severi
ty)
Report
ing
of
just
culture
Dir
ect
route
exte
nsio
nin
tra F
ABEC
flig
hts
(flight
pla
n v
s.
GD
C)
Envir
onm
ent
Diffe
rence
betw
een
length
of
route
of th
een r
oute
part
of th
e a
ctu
altr
aje
cto
ryand
the G
reat
Circle
Dis
tance.
Nois
eabate
ment
rule
sre
late
dto
route
and r
unw
ay
use
on
the b
asis
of D
utc
hle
gis
lation.
Share
of FABEC
air
port
soffering
pro
cedure
s s
upport
ing
CD
Os
CD
A c
onfo
rmity
ás
a s
hare
of
arr
ivals
usin
gCD
A p
rocedure
s
Capacity
Min
ute
sof
en r
oute
ATFM
dela
yper
flig
ht
% o
f contr
olled
flig
hts
with
en r
oiu
tedela
yof
> 1
5 m
inute
sAvara
ge
ATFM
dela
y(t
erm
inal and e
n r
oute
)
Tota
l ATFM
dela
ys
Susta
inability
of decla
red
capacity
infirs
tin
bound
peak.
Additio
naltim
e in
taxi out
phase
Additio
naltim
e f
or
ASM
A
Cost
effic
iency
Dete
rmin
ed e
n r
oute
costs
/ re
venues
Dete
rmin
ed
unit r
ate
for
en r
oute
AN
S
Tota
l en r
oute
cost
per
flig
ht
hour
Tota
l econom
ic c
ost
per
flig
ht
hour
Dete
rmin
ed t
erm
inalair
navig
ation
serv
ice u
nit r
ate
Optim
um
SU
A d
imensio
n v
spublished S
UA
str
uctu
e
Perc
enta
ge o
f SU
A c
apacity r
equeste
d
Perc
enta
ge o
f SU
A c
apacity a
llocate
dPerc
enta
ge o
f SU
A c
apacity u
sed
Militair
yM
issio
nEff
ectiveness
Tota
l tr
ain
ing t
ime a
gain
st
tota
l air
born
e
tim
e
SU
Atim
e a
llocate
d v
stim
e r
equeste
d
Avera
ge t
ransit t
ime
22
Sta
keh
old
er C
on
su
ltati
on
Meeti
ng
LV
NL p
resen
tati
on
Ap
ril
12
th,
20
11
Conte
nt
•Str
ate
gic
orienta
tion L
VN
L
•ATM
syste
m d
evelo
pm
ent
•Perf
orm
ance p
lan
•Safe
ty
•Capacity
•Envir
onm
ent
•Cost
effic
iency
•M
eeting t
he t
arg
ets
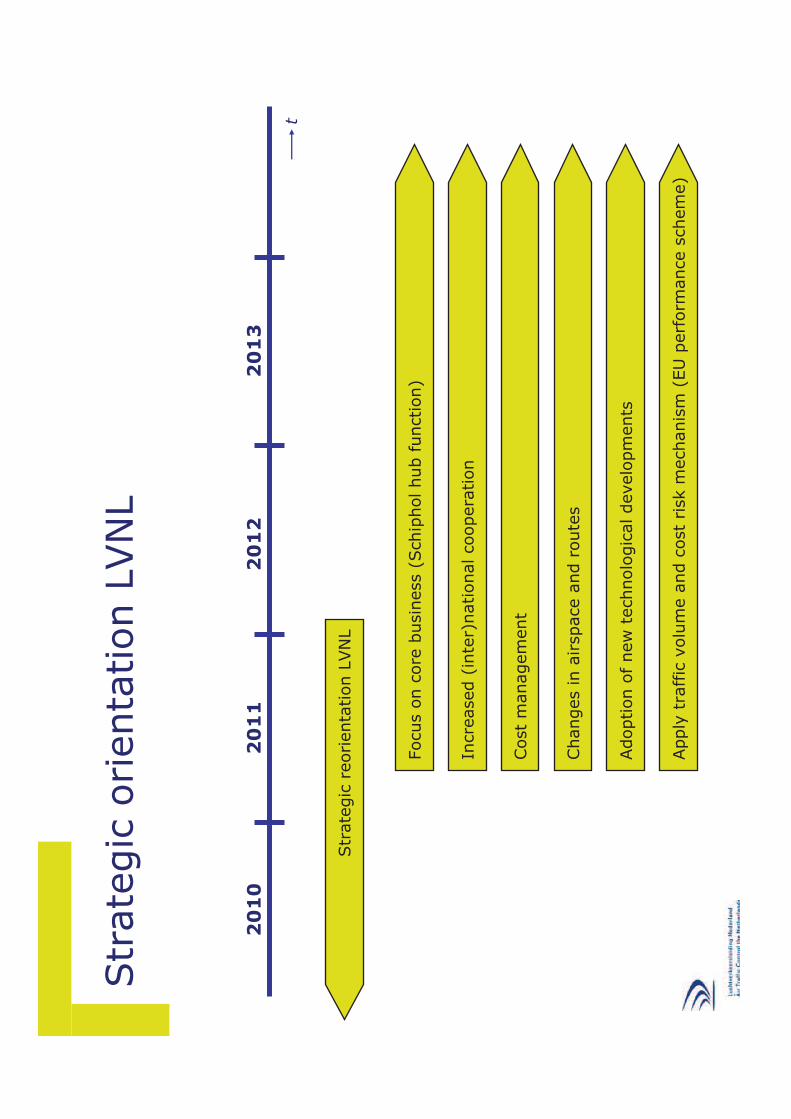
Str
ate
gic
orienta
tion L
VN
L
20
10
20
11
20
12
t
20
13
Str
ate
gic
reorienta
tion L
VN
L
Focus o
n c
ore
busin
ess (
Schip
holhub f
unction)
Incre
ased (
inte
r)nationalcoopera
tion
Cost
managem
ent
Changes in a
irspace a
nd r
oute
s
Adoption o
f new
technolo
gic
al develo
pm
ents
Apply
tra
ffic
volu
me a
nd c
ost
risk m
echanis
m (
EU
perf
orm
ance s
chem
e)
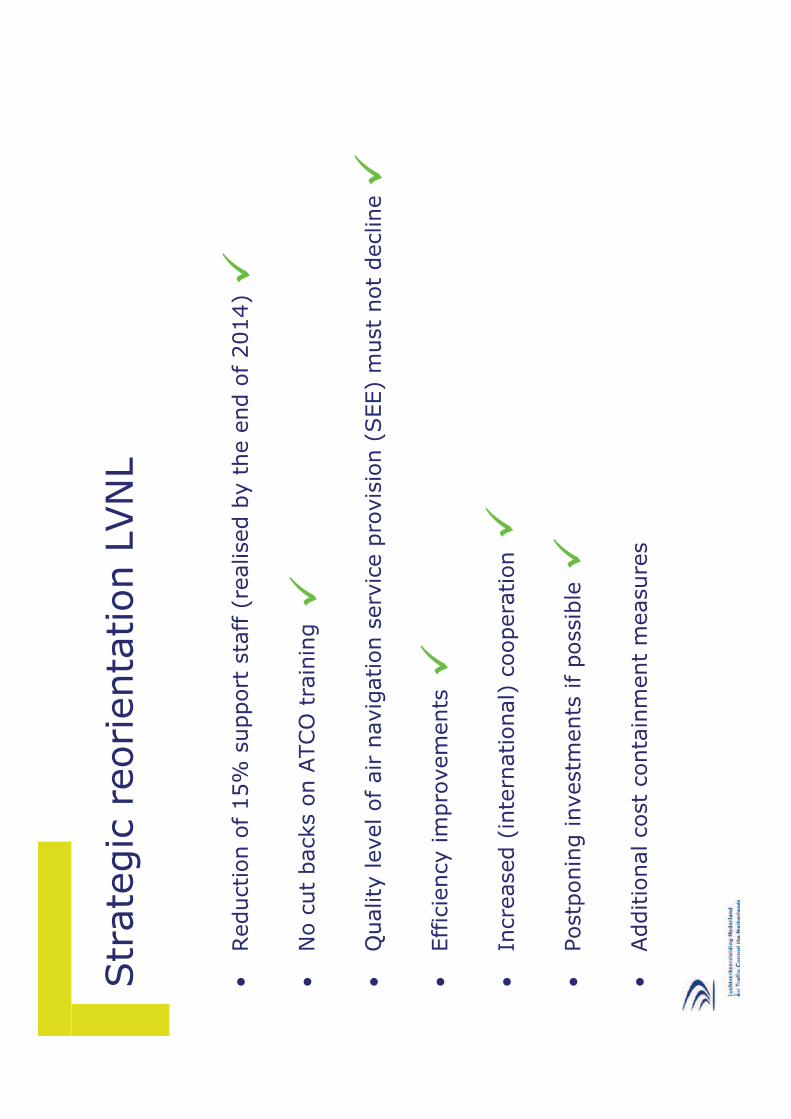
Str
ate
gic
reorienta
tion L
VN
L
•Reduction o
f 15%
support
sta
ff (
realised b
y t
he e
nd o
f 2014)
•N
o c
ut
backs o
n A
TCO
tra
inin
g
•Q
uality
level of
air n
avig
ation s
erv
ice p
rovis
ion (
SEE)
must
not
decline
•Eff
icie
ncy im
pro
vem
ents
•In
cre
ased (
inte
rnational)
coopera
tion
•Postp
onin
g investm
ents
if
possib
le
•Additio
nal cost
conta
inm
ent
measure
s
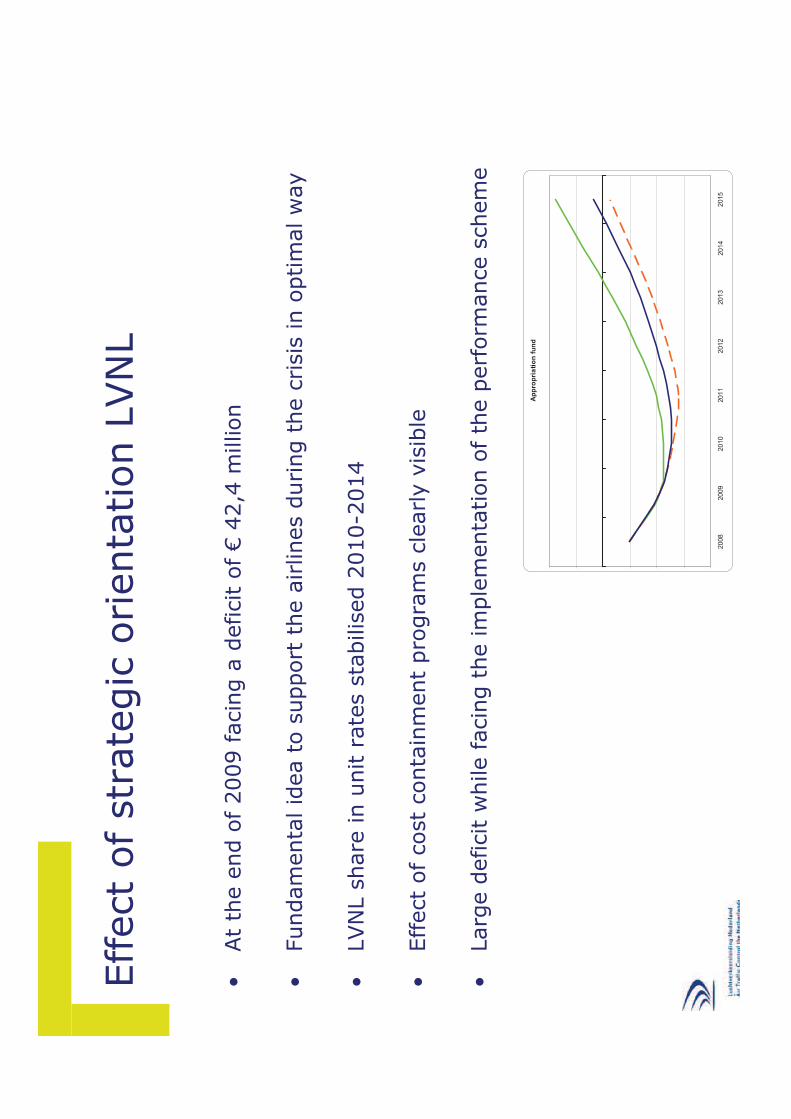
Eff
ect
of
str
ate
gic
orienta
tion L
VN
L
•At
the e
nd o
f 2009 facin
g a
deficit o
f €
42,4
million
•Fundam
enta
l id
ea t
o s
upport
the a
irlines d
uring t
he c
risis
in o
ptim
al w
ay
•LVN
L s
hare
in u
nit r
ate
s s
tabilis
ed 2
010-2
014
•Eff
ect
of
cost
conta
inm
ent
pro
gra
ms c
learly v
isib
le
•Larg
e d
eficit w
hile facin
g t
he im
ple
menta
tion o
f th
e p
erf
orm
ance
schem
e
Ap
pro
pri
ati
on
fu
nd
2008
2009
2010
2011
2012
2013
2014
2015

But
what
will happen if…
..
Ap
pro
pri
ati
on
fu
nd
2008
2009
2010
2011
2012
2013
2014
2015?
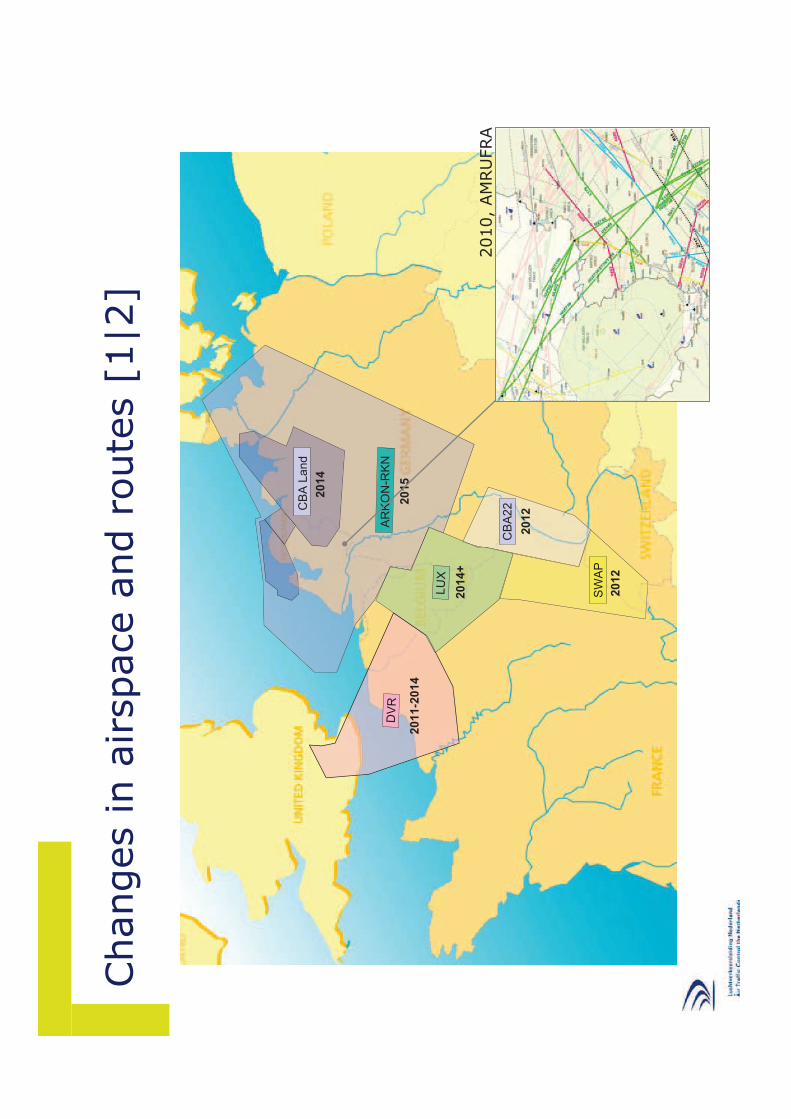
Changes in a
irspace a
nd r
oute
s [
1|2
]
DV
R
CB
A L
and
SW
AP
CB
A22
2011-2
01
4
2012
2012
2014+
2014
LU
X
AR
KO
N-R
KN
2015
2010,
AM
RU
FRA
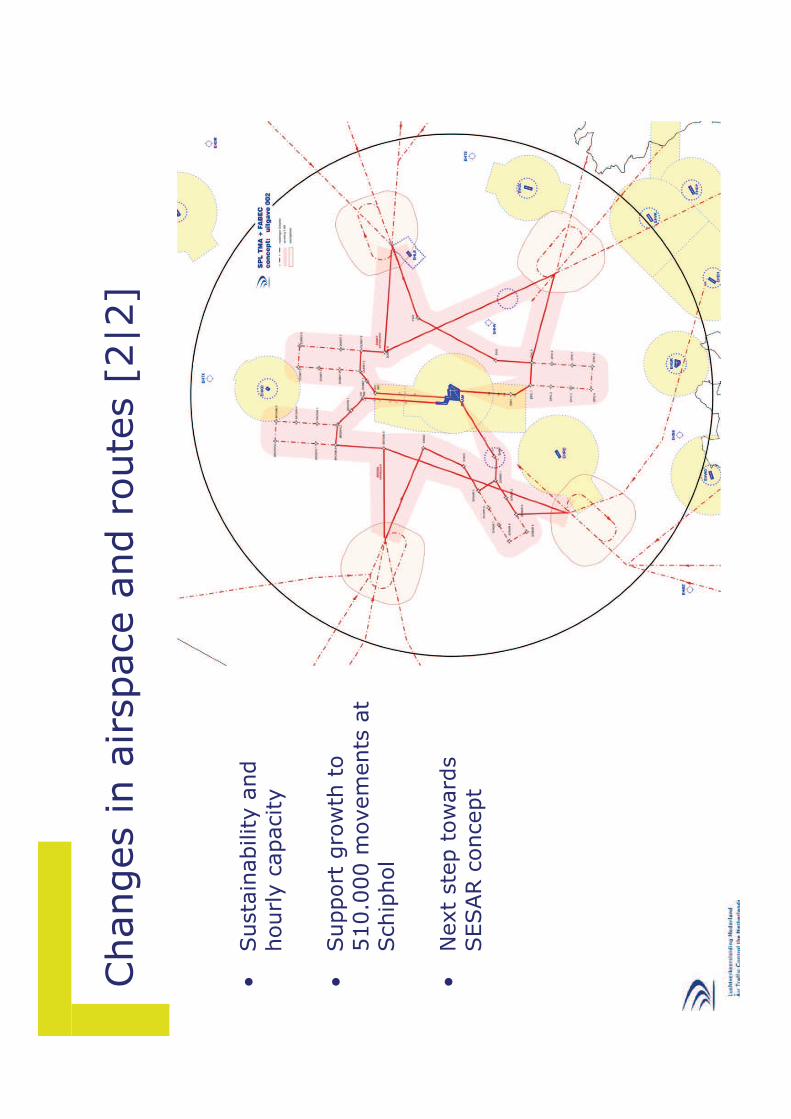
Changes in a
irspace a
nd r
oute
s [
2|2
]
•Susta
inability a
nd
hourly c
apacity
•Support
gro
wth
to
510.0
00 m
ovem
ents
at
Schip
hol
•N
ext
ste
p t
ow
ard
s
SESAR c
oncept
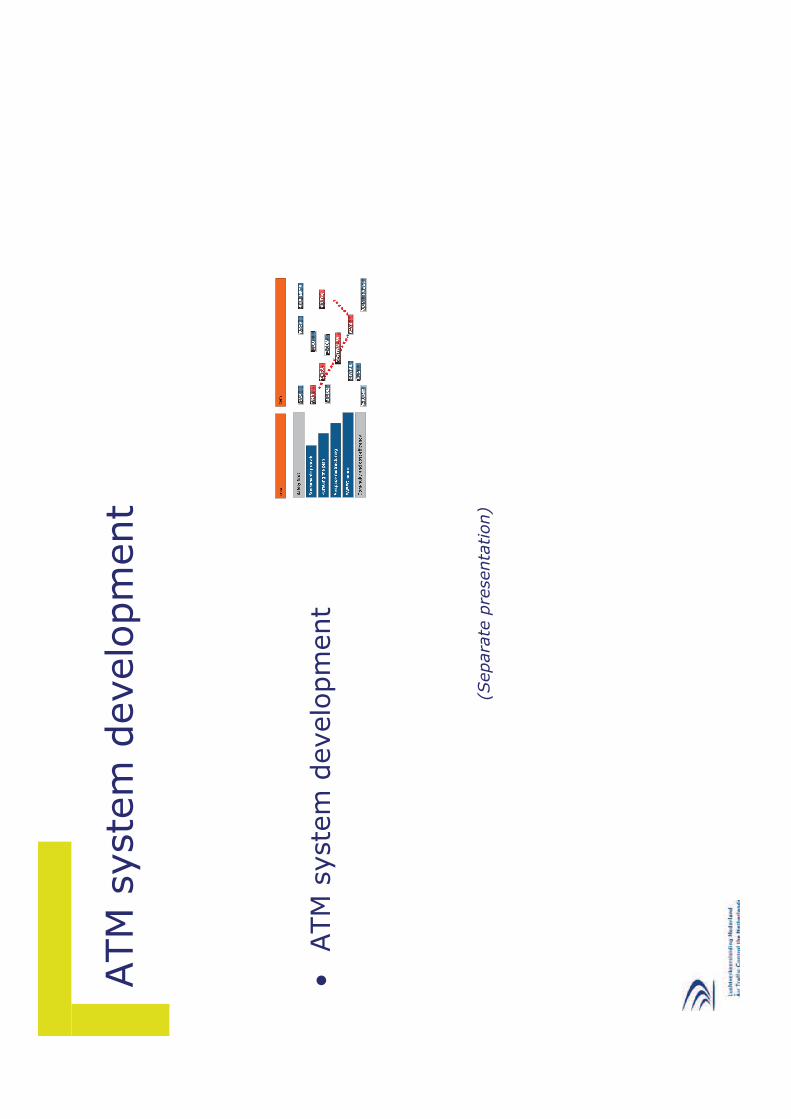
ATM
syste
m d
evelo
pm
ent
•ATM
syste
m d
evelo
pm
ent
(Separa
te p
resenta
tion)
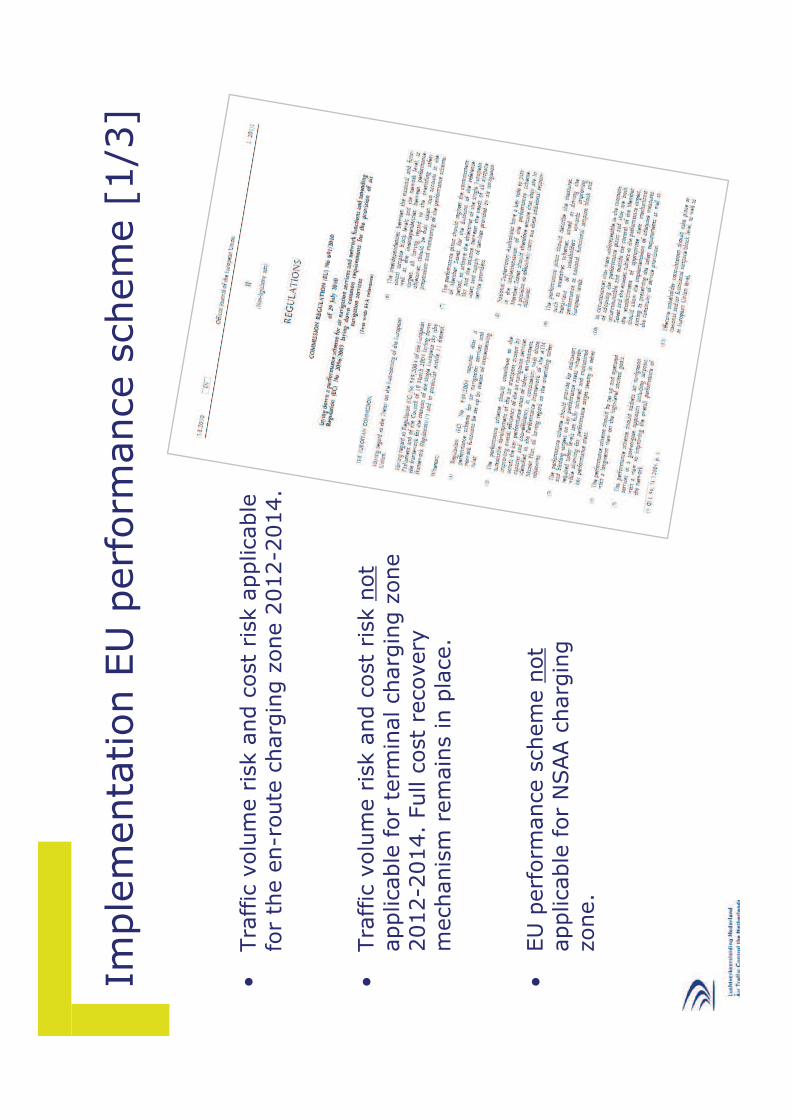
Imple
menta
tion E
U p
erf
orm
ance s
chem
e [
1/3
]
•Tra
ffic
volu
me r
isk a
nd c
ost
risk a
pplicable
fo
r th
e e
n-r
oute
charg
ing z
one 2
012-2
014.
•Tra
ffic
volu
me r
isk a
nd c
ost
risk n
ot
applicable
for
term
inal charg
ing z
one
2012-2
014.
Full c
ost
recovery
mechanis
m r
em
ain
s in p
lace.
•EU
perf
orm
ance s
chem
e n
ot
applicable
for
NSAA c
harg
ing
zone.
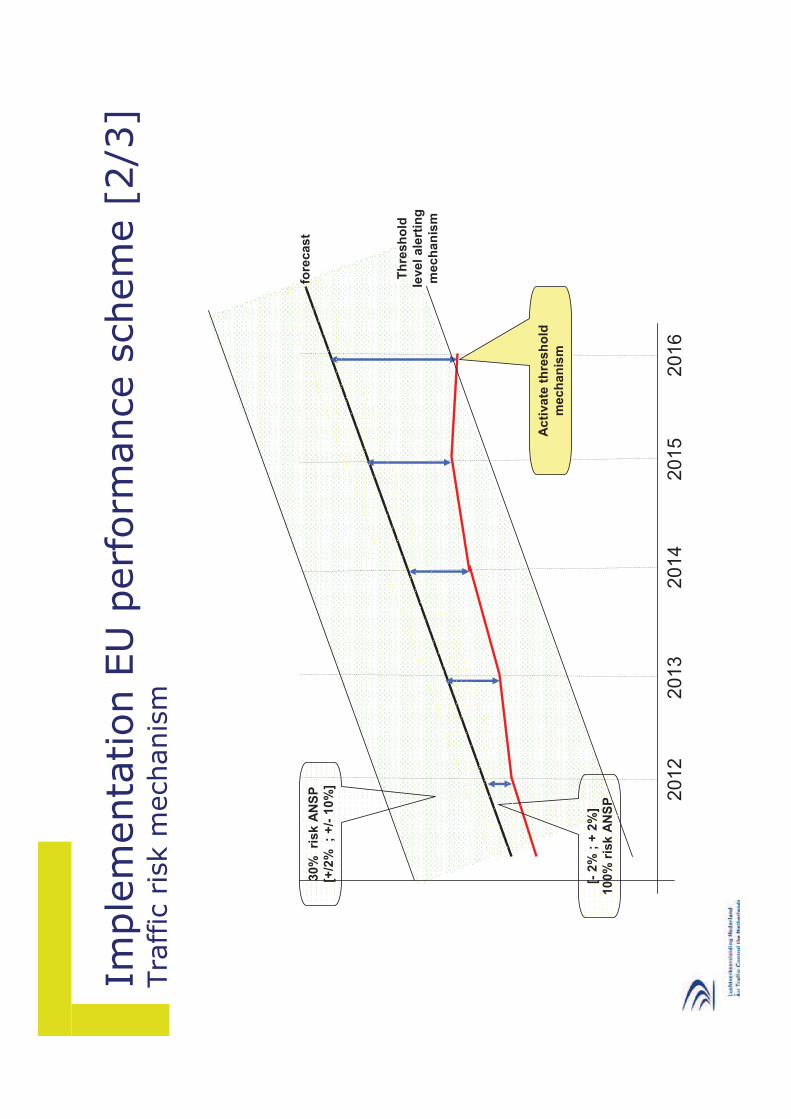
Imple
menta
tion E
U p
erf
orm
ance s
chem
e [
2/3
]Tra
ffic
ris
k m
echanis
m
2012
2013
2014
2015
2016
fore
cas
t
Th
res
ho
ld
leve
l a
lert
ing
mec
ha
nis
m
[-2
% ;
+ 2
%]
10
0%
ris
kA
NS
P
Ac
tiva
teth
res
ho
ld
mec
ha
nis
m
30
%
risk
AN
SP
[+/2
%
; +
/-1
0%
]
Imple
menta
tion E
U p
erf
orm
ance s
chem
e [
3/3
]Im
ple
menta
tion e
ffect
•Tra
ffic
volu
me r
isk s
haring:
need f
or
risk m
itig
ating e
quity c
apital
•Cost
risk s
haring:
need f
or
risk m
itig
ating e
quity c
apital
•Additio
nal risk m
itig
ating m
easure
s a
t th
e s
tart
of
firs
t re
fere
nce p
eriod
•Equity c
apital to
be a
cquired d
uring f
irst
refe
rence p
eriod
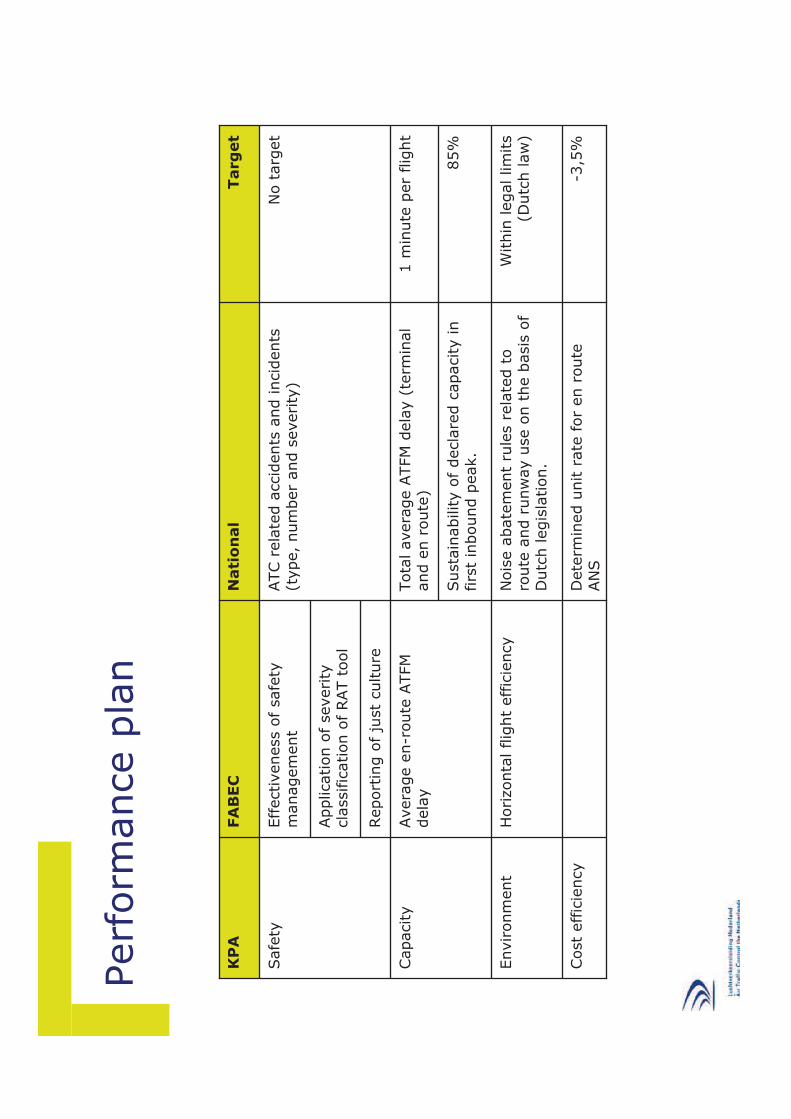
Perf
orm
ance p
lan
KP
AFA
BEC
Nati
on
al
ATC
rela
ted a
ccid
ents
and
incid
ents
(type,
num
ber
and
severity
)
Tota
l avera
ge A
TFM
dela
y(t
erm
inal
and e
nro
ute
)
Susta
inability
of
decla
red c
apacity
infirs
t in
bound p
eak.
Nois
eabate
ment
rule
s r
ela
ted t
o
route
and r
unw
ay u
se o
n t
he b
asis
of
Dutc
h legis
lation.
Dete
rmin
ed u
nit r
ate
for
en r
oute
AN
S
1 m
inute
per
flig
ht
Capacity
Avera
ge e
n-r
oute
ATFM
dela
y
Targ
et
Eff
ectiveness o
fsafe
tym
anagem
ent
Application o
f severity
cla
ssific
ation o
f RAT t
ool
Safe
ty
Report
ing o
f ju
st
culture
85%
No t
arg
et
Envir
onm
ent
Horizonta
l flig
ht
eff
icie
ncy
Within
legal lim
its
(Dutc
h law
)
Cost
effic
iency
-3,5
%
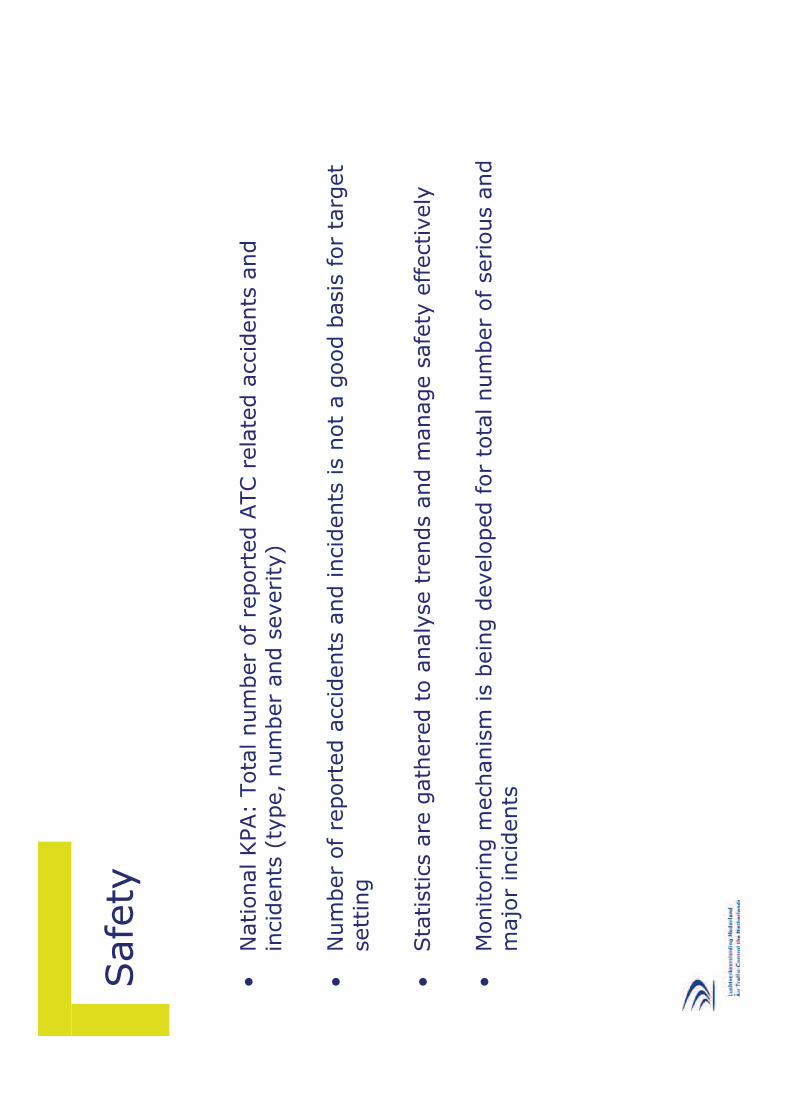
Safe
ty
•N
ational KPA:
Tota
l num
ber
of
report
ed A
TC r
ela
ted a
ccid
ents
and
incid
ents
(ty
pe,
num
ber
and s
everity
)
•N
um
ber
of
report
ed a
ccid
ents
and incid
ents
is n
ot
a g
ood b
asis
for
targ
et
sett
ing
•Sta
tistics a
re g
ath
ere
d t
o a
naly
se
trends a
nd m
anage s
afe
ty e
ffectively
•M
onitoring m
echanis
m is b
ein
g d
evelo
ped f
or
tota
l num
ber
of
serious a
nd
majo
r in
cid
ents
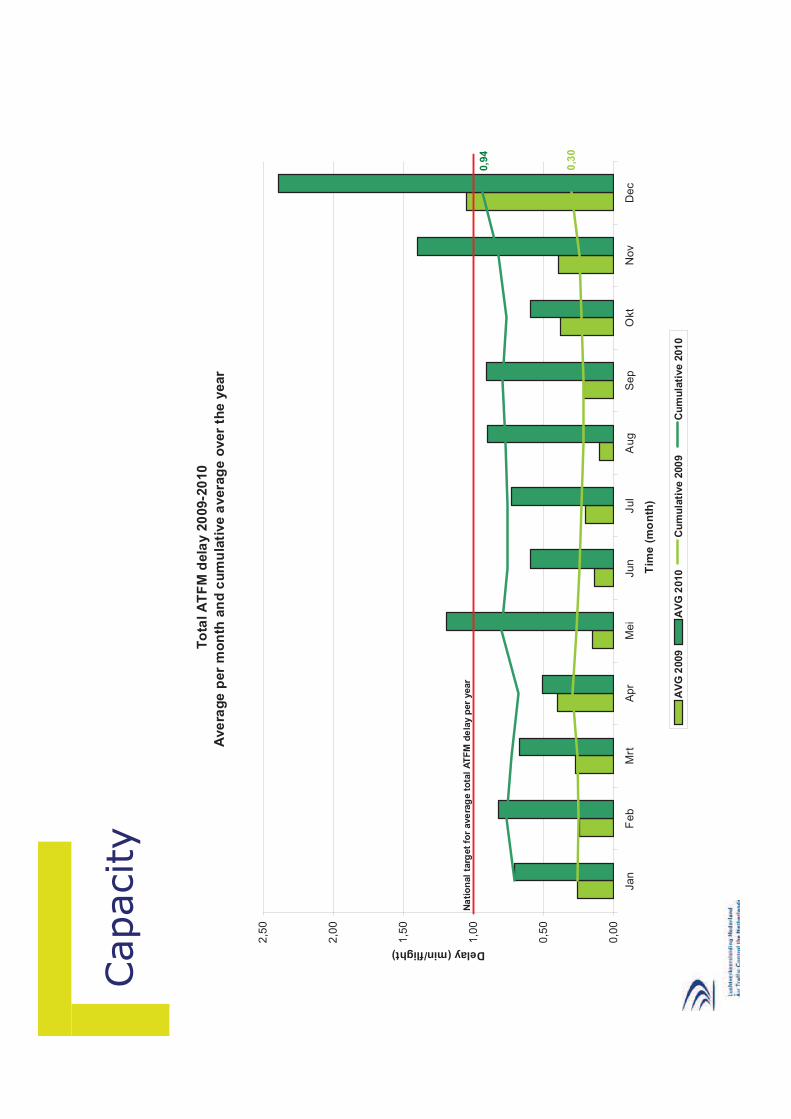
Capacity
To
tal A
TF
M d
ela
y 2
009-2
010
Ave
rag
e p
er
mo
nth
an
d c
um
ula
tive a
vera
ge
over
the
year
0,3
0
0,9
4
0,0
0
0,5
0
1,0
0
1,5
0
2,0
0
2,5
0
Ja
nF
eb
Mrt
Ap
rM
ei
Ju
nJ
ul
Au
gS
ep
Okt
No
vD
ec
Tim
e (
mo
nth
)
Delay (min/flight)
AV
G 2
009
AV
G 2
010
Cu
mu
lati
ve 2
00
9C
um
ula
tive 2
01
0
Na
tio
nal
targ
et
for
ave
rag
e t
ota
lA
TF
Md
ela
yp
er
year
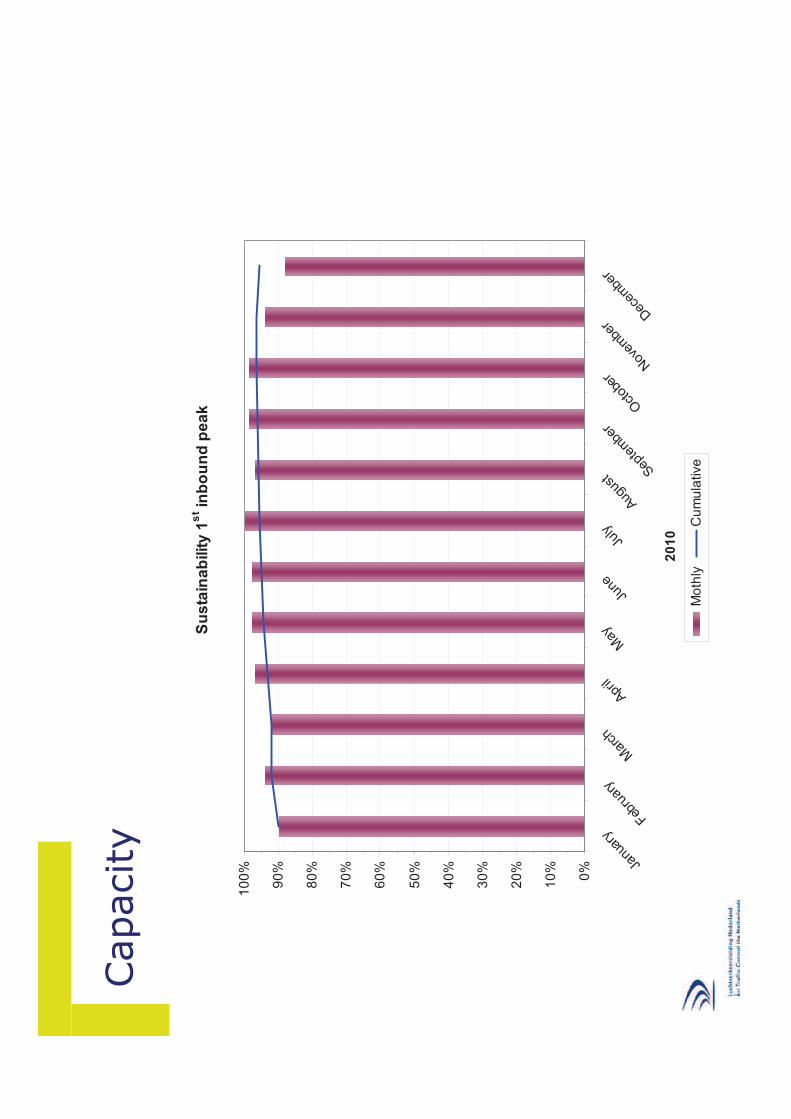
Capacity
Su
sta
ina
bilit
y 1
st i
nb
ou
nd
pe
ak
0%
10
%
20
%
30
%
40
%
50
%
60
%
70
%
80
%
90
%
10
0%
Janu
ary
Febru
ary
Mar
ch
April
May
June
July
Augus
t Septe
mbe
r
Oct
ober
N
ovem
ber
Dec
embe
r
20
10
Mo
thly
C
um
ula
tive
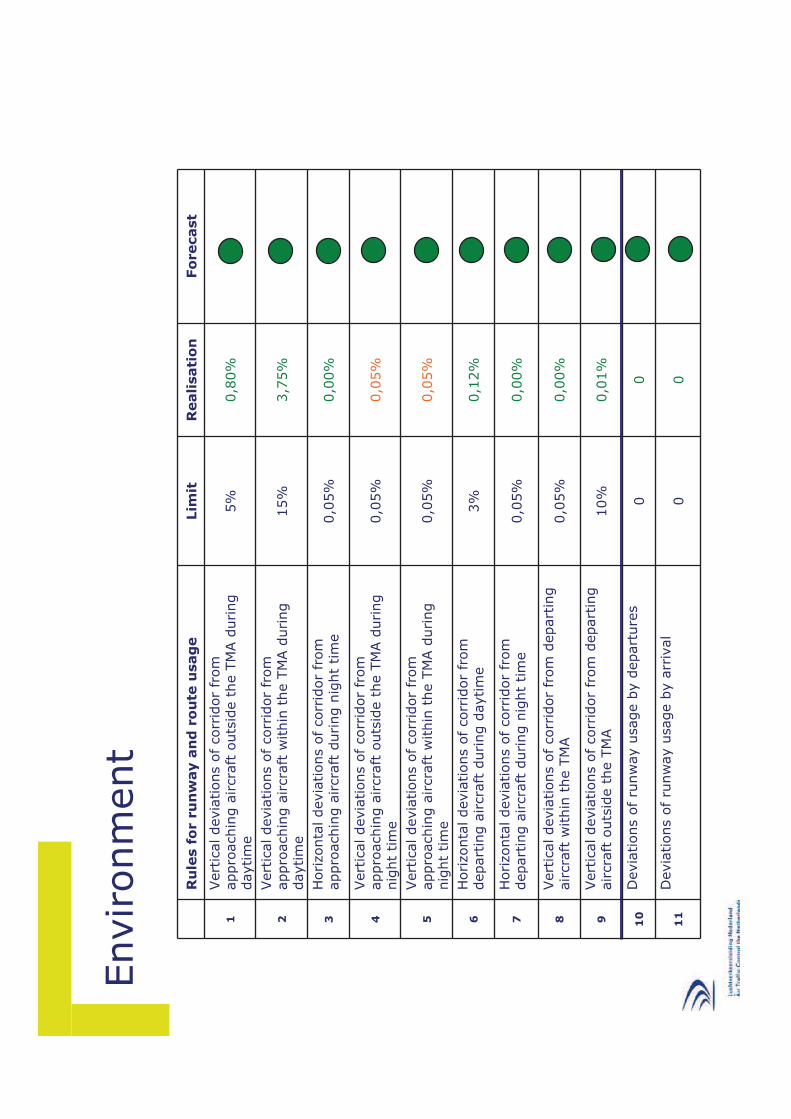
Environm
ent
Ru
les
for
ru
nw
ay
an
d r
ou
teu
sag
eLim
itR
ealisati
on
Fo
recast
1
Vert
ical devia
tions
of
corr
idor
from
appro
achin
g a
ircra
ft o
uts
ide t
he T
MA d
uring
daytim
e5%
0,8
0%
2
Vert
ical devia
tions
of
corr
idor
from
appro
achin
g a
ircra
ft w
ithin
the T
MA d
uring
daytim
e15%
3,7
5%
3H
orizonta
l devia
tions
of
corr
idor
from
appro
achin
g a
ircra
ft d
uring n
ight
tim
e0,0
5%
0,0
0%
4
Vert
ical devia
tions
of
corr
idor
from
appro
achin
g a
ircra
ft o
uts
ide t
he T
MA d
uring
nig
ht
tim
e0,0
5%
0,0
5%
5
Vert
ical devia
tions
of
corr
idor
from
appro
achin
g a
ircra
ft w
ithin
the T
MA d
uring
nig
ht
tim
e0,0
5%
0,0
5%
6H
orizonta
l devia
tions
of
corr
idor
from
depart
ing a
ircra
ft d
uring d
aytim
e3%
0,1
2%
7H
orizonta
l devia
tions
of
corr
idor
from
depart
ing a
ircra
ft d
uring n
ight
tim
e0,0
5%
0,0
0%
8Vert
ical devia
tions
of
corr
idor
from
depart
ing
aircra
ft w
ithin
the T
MA
0,0
5%
0,0
0%
9Vert
ical devia
tions
of
corr
idor
from
depart
ing
aircra
ft o
uts
ide t
he T
MA
10%
0,0
1%
10
Devia
tions
of
runw
ay u
sage b
y d
epart
ure
s0
0
11
Devia
tions
of
runw
ay u
sage b
y a
rriv
al
00
Cost
eff
icie
ncy
•M
eth
odolo
gy
•LVN
L d
ete
rmin
ed c
ost
(budget
2011-2
015)
•Pre
vie
w:
pre
lim
inary
LVN
L b
udget
2012-2
016
•LVN
L investm
ent
pla
n
•Sta
ff d
evelo
pm
ent
•Revie
w:
LVN
L indic
ative f
inancia
l re
sults 2
010
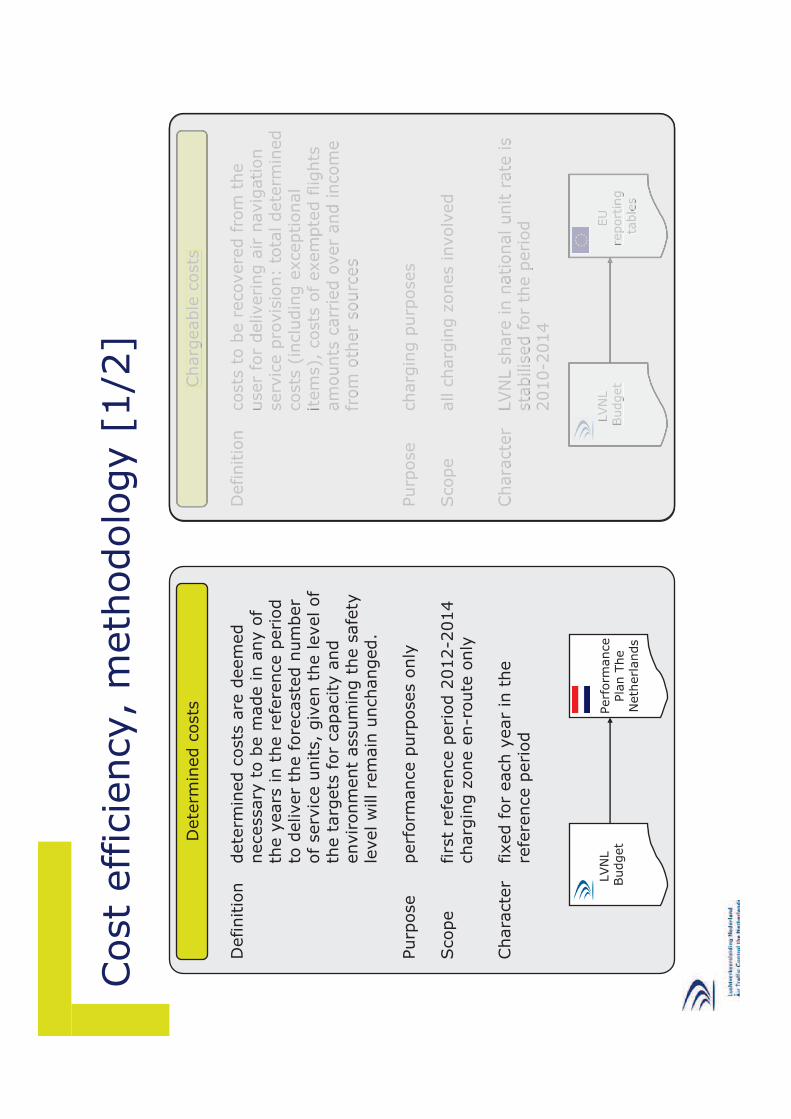
Cost
effic
iency,
meth
odolo
gy
[1/2
]
Definitio
ndete
rmin
ed c
osts
are
deem
ed
necessary
to b
e m
ade in a
ny o
f th
e y
ears
in t
he r
efe
rence p
eriod
to d
eliver
the f
ore
caste
d n
um
ber
of serv
ice u
nits,
giv
en t
he level of
the t
arg
ets
for
capacity a
nd
environm
ent
assum
ing t
he s
afe
tyle
vel w
ill re
main
unchanged.
Purp
ose
perf
orm
ance p
urp
oses o
nly
Scope
firs
t re
fere
nce p
eriod 2
012-2
014
charg
ing z
one e
n-r
oute
only
Chara
cte
rfixed f
or
each y
ear
in t
he
refe
rence p
eriod
Dete
rmin
ed c
osts
Definitio
ncosts
to b
e r
ecovere
d fro
m t
he
user
for
delivering a
ir n
avig
ation
serv
ice p
rovis
ion:
tota
l dete
rmin
ed
costs
(in
clu
din
g e
xceptional
item
s),
costs
of exem
pte
d flights
am
ounts
carr
ied o
ver
and incom
e
from
oth
er
sourc
es
Purp
ose
charg
ing p
urp
oses
Scope
all c
harg
ing z
ones involv
ed
Chara
cte
rLVN
L s
hare
in n
ational unit r
ate
is
sta
bilis
ed
for
the p
eriod
2010-2
014
Charg
eable
costs
EU
report
ing
table
s
LVN
LBudget
LVN
LBudget
Perf
orm
ance
Pla
n T
he
Neth
erl
ands
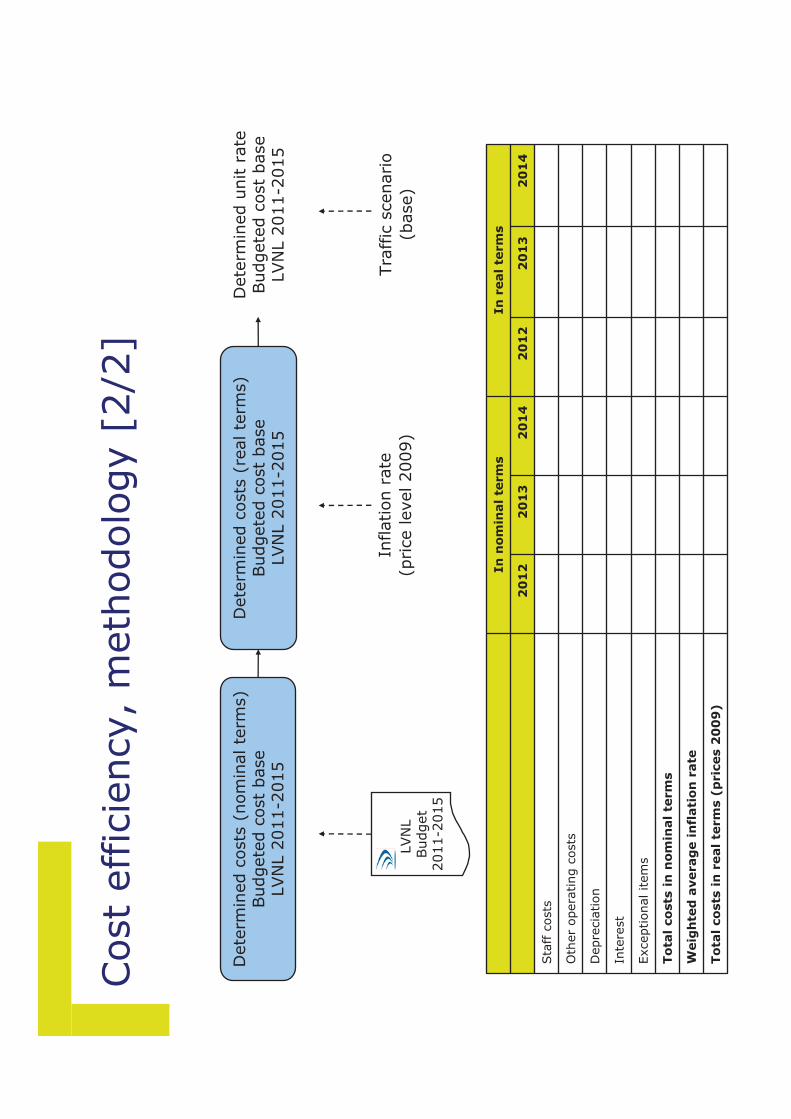
Cost
effic
iency,
meth
odolo
gy
[2/2
]
Dete
rmin
ed c
osts
(nom
inal te
rms)
Budgete
d c
ost
base
LVN
L 2
011-2
015
Dete
rmin
ed u
nit r
ate
Budgete
d c
ost
base
LVN
L 2
011-2
015
Dete
rmin
ed c
osts
(re
al te
rms)
Budgete
d c
ost
base
LVN
L 2
011-2
015
LVN
LBudget
2011-2
015
Inflation r
ate
(price level 2009)
Tra
ffic
scenario
(base)
In
nom
inal
term
sIn
real
term
s
20
12
20
13
20
14
20
12
20
13
20
14
Sta
ff c
osts
Oth
er
opera
ting c
osts
Depre
cia
tion
Inte
rest
Exceptional item
s
To
tal
co
sts
in n
om
inal
term
s
Weig
hte
d a
verag
e i
nfl
ati
on
rate
To
tal
co
sts
in
real
term
s (
pric
es 2
00
9)

LVN
L d
ete
rmin
ed c
ost
en-r
oute
(budgete
d c
ost
base 2
011-2
015,
issued N
ovem
ber
2010)
20
11
forecast
20
12
forecast
20
13
forecast
20
14
forecast
Sta
ff c
osts
77.1
93
21.9
16
8.5
11
2.8
47
110.4
67
Cost
of
exem
pte
d f
lights
-416
-424
-433
-441
Dete
rm
ined
costs
in
no
min
al te
rm
s108.9
25
107.4
30
108.7
17
110.5
57
Weig
hte
d a
vera
ge inflation r
ate
2,0
%2,0
%2,0
%2,0
%
Incom
e f
rom
oth
er
sourc
es
-1.1
26
-1.1
62
-1.1
59
-1.1
54
106.0
18
76.2
85
77.2
11
79.3
26
Oth
er
opera
ting c
osts
22.1
51
22.1
26
22.3
78
Depre
cia
tion
7.8
80
8.6
11
8.4
78
Cost
of
capital
2.7
00
2.3
61
1.9
70
Exceptional item
s
To
tal costs
LV
NL
109.0
16
110.3
09
112.1
52
Dete
rm
ined
costs
in
real te
rm
s (
pric
es
20
09
)102.6
65
102.0
49
101.8
62
Tota
l K#
serv
ice u
nits (
base s
cenari
o,
Feb.
2011)
2.5
55
2.6
81
2.7
33
2.7
94
Bu
dg
ete
d d
ete
rm
ined
en
-ro
ute
un
itrate
41,4
938,2
937,3
436,4
6
(Based u
pon b
udgete
dcost
base 2
011-2
015 issued N
ovem
ber
2010.
Fig
ure
s a
re s
ubje
ct
of
recalibra
tion.
Update
dfigure
s w
ill be p
resente
d d
uring t
he S
CM
of M
ay 2
011)
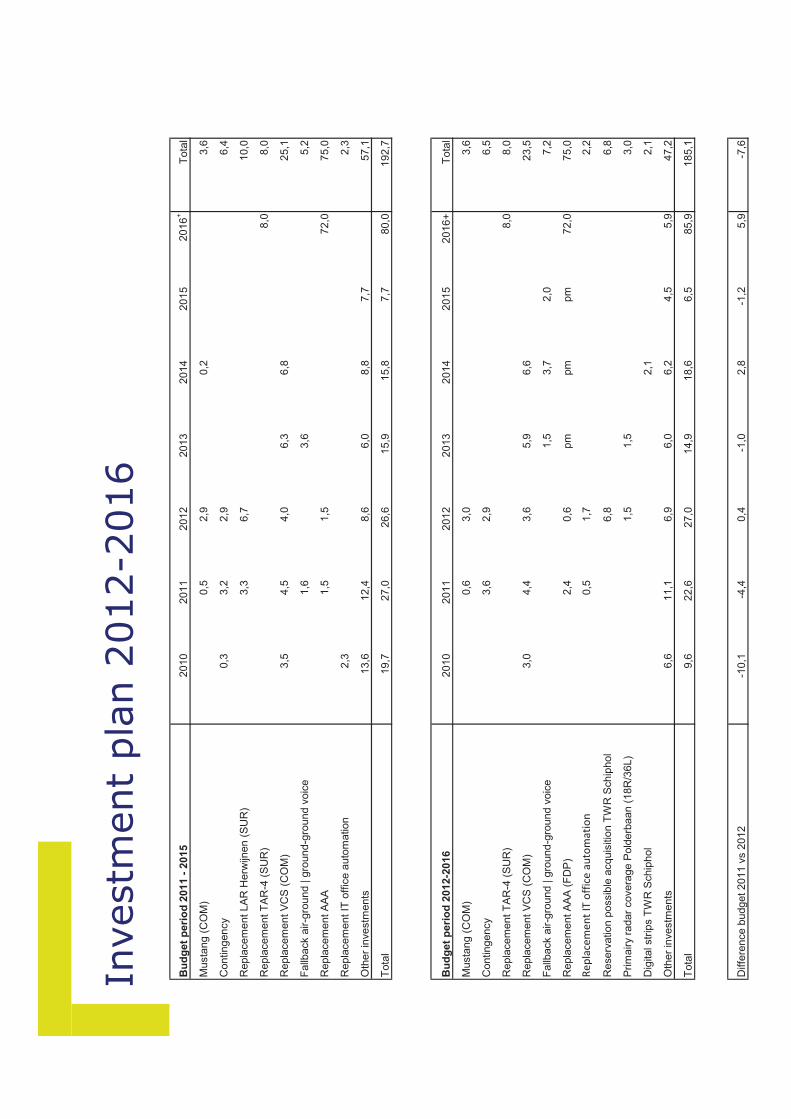
Investm
ent
pla
n 2
012-2
016
Bu
dg
et
peri
od
2011 -
2015
2010
2011
2012
2013
2014
2015
2016
+T
ota
l
Musta
ng (
CO
M)
0,5
2,9
0,2
3,6
Contingency
0,3
3,2
2,9
6,4
Repla
cem
ent LA
R H
erw
ijnen (
SU
R)
3,3
6,7
10,0
Repla
cem
ent T
AR
-4 (
SU
R)
8,0
8,0
Repla
cem
ent V
CS
(C
OM
)3,5
4,5
4,0
6,3
6,8
25,1
Fallb
ack a
ir-g
round | g
round-g
roun
d v
oic
e1,6
3,6
5,2
Repla
cem
ent A
AA
1,5
1,5
72,0
75,0
Repla
cem
ent IT
off
ice a
uto
mation
2,3
2,3
Oth
er
investm
ents
13,6
12,4
8,6
6,0
8,8
7,7
57,1
Tota
l19,7
27,0
26,6
15,9
15,8
7,7
80,0
192,7
Bu
dg
et
peri
od
2012-2
016
2010
2011
2012
2013
2014
2015
2016+
Tota
l
Musta
ng (
CO
M)
0,6
3,0
3,6
Contingency
3,6
2,9
6,5
Repla
cem
ent T
AR
-4 (
SU
R)
8,0
8,0
Repla
cem
ent V
CS
(C
OM
)3,0
4,4
3,6
5,9
6,6
23,5
Fallb
ack a
ir-g
round | g
round-g
roun
d v
oic
e1,5
3,7
2,0
7,2
Repla
cem
ent A
AA
(F
DP
)2,4
0,6
pm
pm
pm
72,0
75,0
ReplacementITofficeautomation
0,5
1,7
2,2
Reserv
ation p
ossib
le a
cquis
itio
n T
WR
Sch
iphol
6,8
6,8
Prim
airy r
adar
covera
ge P
old
erb
aan (
18R
/36L)
1,5
1,5
3,0
Dig
ital str
ips T
WR
Schip
hol
2,1
2,1
Oth
er
investm
ents
6,6
11,1
6,9
6,0
6,2
4,5
5,9
47,2
Tota
l9,6
22,6
27,0
14,9
18,6
6,5
85,9
185,1
Diffe
rence b
udget 2011 v
s 2
012
-10,1
-4,4
0,4
-1,0
2,8
-1,2
5,9
-7,6
Develo
pm
ents
investm
ent
pla
n 2
012-2
016
•Contingency
•Civ
il a
nd m
ilitary
inte
gra
tion
•Repla
cem
ent
of AAA (
FD
P)
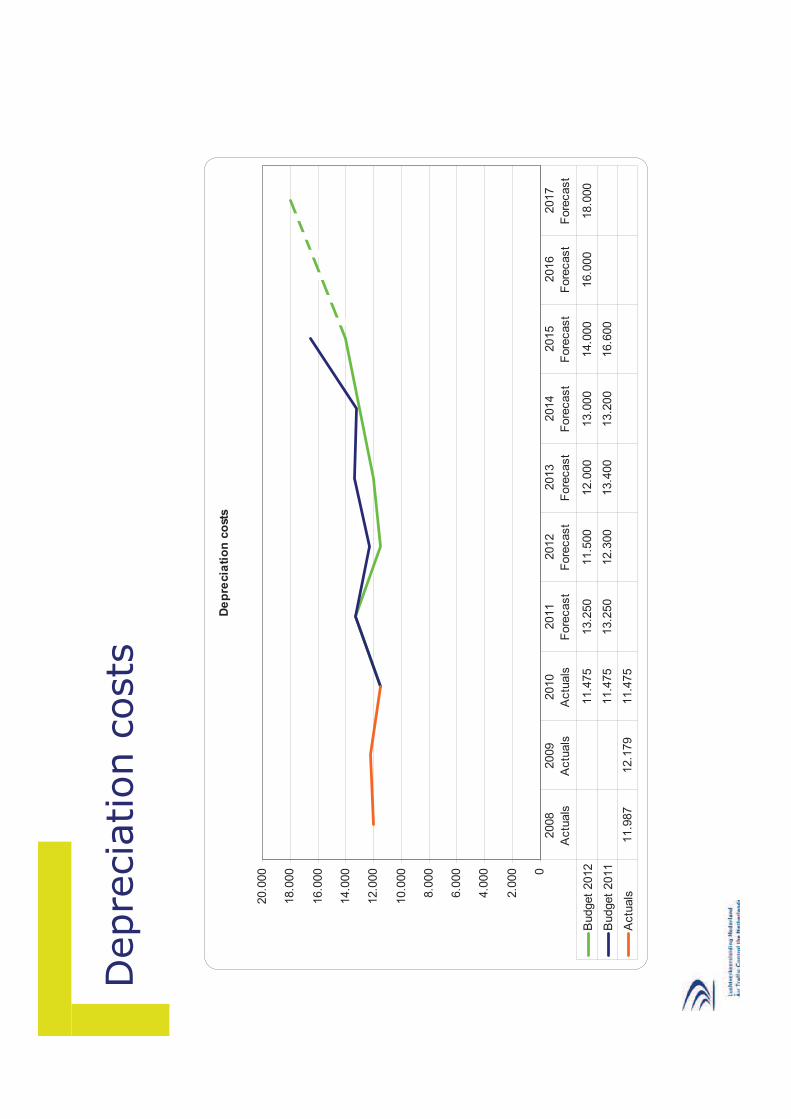
Depre
cia
tion c
osts
De
pre
cia
tio
n c
ost
s
0
2.0
00
4.0
00
6.0
00
8.0
00
10.0
00
12.0
00
14.0
00
16.0
00
18.0
00
20.0
00
Budget
2012
11.4
75
13.2
50
11.5
00
12.0
00
13.0
00
14.0
00
16.0
00
18.0
00
Budget
2011
11.4
75
13.2
50
12.3
00
13.4
00
13.2
00
16.6
00
Actu
als
11.9
87
12.1
79
11.4
75
2008
Actu
als
2009
Actu
als
2010
Actu
als
2011
Fore
cast
2012
Fore
cast
2013
Fore
cast
2014
Fore
cast
2015
Fore
cast
2016
Fore
cast
2017
Fore
cast
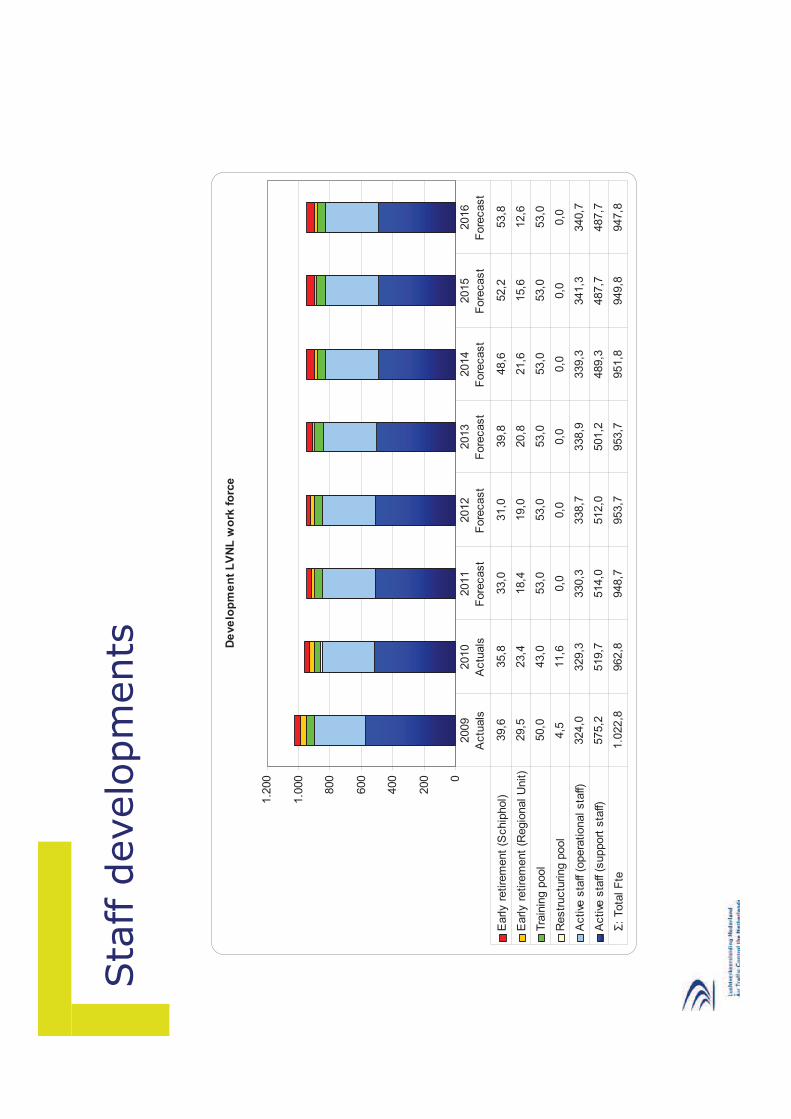
Sta
ff d
evelo
pm
ents D
eve
lop
me
nt
LV
NL
wo
rk f
orc
e
0
200
400
600
800
1.0
00
1.2
00
Early r
etire
ment
(Schip
hol)
39,6
35,8
33,0
31,0
39,8
48,6
52,2
53,8
Early r
etire
ment
(Regio
nal U
nit)
29,5
23,4
18,4
19,0
20,8
21,6
15,6
12,6
Tra
inin
g p
ool
50,0
43,0
53,0
53,0
53,0
53,0
53,0
53,0
Restr
uctu
ring p
ool
4,5
11,6
0,0
0,0
0,0
0,0
0,0
0,0
Active
sta
ff (o
pera
tional sta
ff)324,0
329,3
330,3
338,7
338,9
339,3
341,3
340,7
Active
sta
ff (s
upport
sta
ff)575,2
519,7
514,0
512,0
501,2
489,3
487,7
487,7
: Tota
l F
te1.0
22,8
962,8
948,7
953,7
953,7
951,8
949,8
947,8
2009
Actu
als
2010
Actu
als
2011
Fore
cast
2012
Fore
cast
2013
Fore
cast
2014
Fore
cast
2015
Fore
cast
2016
Fore
cast
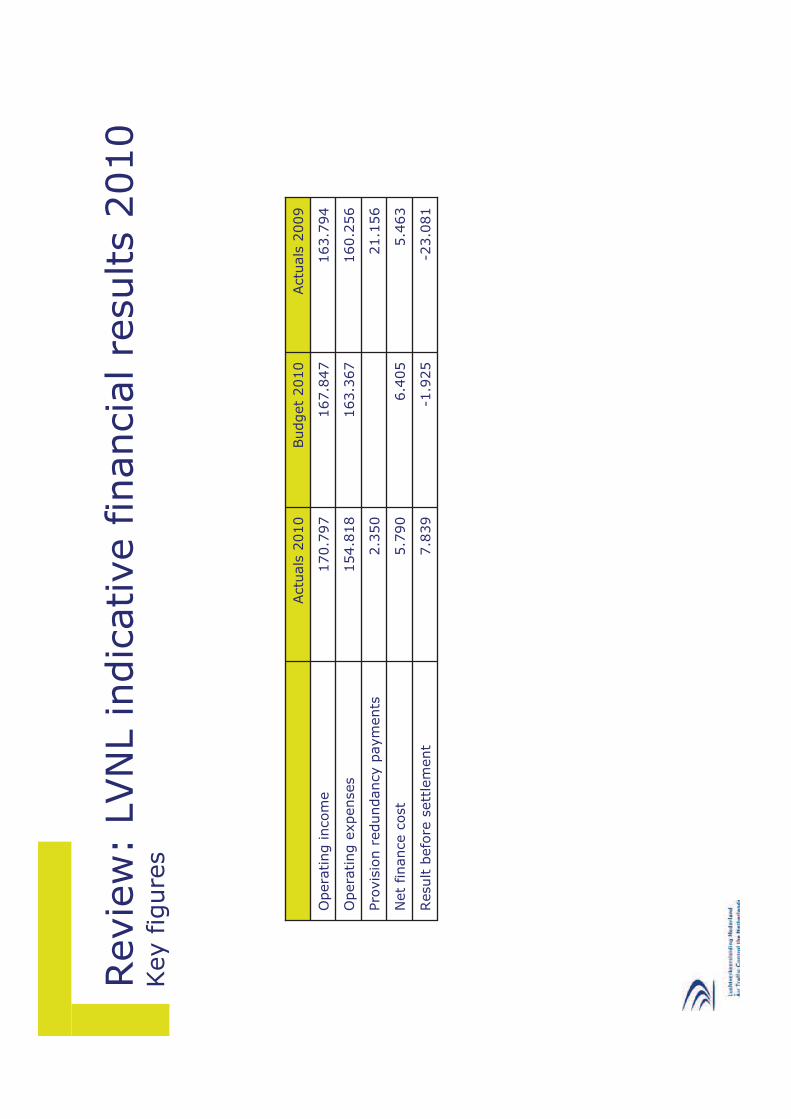
Revie
w:
LVN
L indic
ative f
inancia
l re
sults 2
010
Key f
igure
s
Actu
als
2010
Budget
2010
Actu
als
2009
Opera
ting incom
e170.7
97
167.8
47
163.3
67
Pro
vis
ion r
edundancy p
aym
ents
2.3
50
21.1
56
6.4
05
-1.9
25
163.7
94
Opera
ting e
xpenses
154.8
18
160.2
56
Net
finance
cost
5.7
90
5.4
63
Result b
efo
re s
ett
lem
ent
7.8
39
-23.0
81
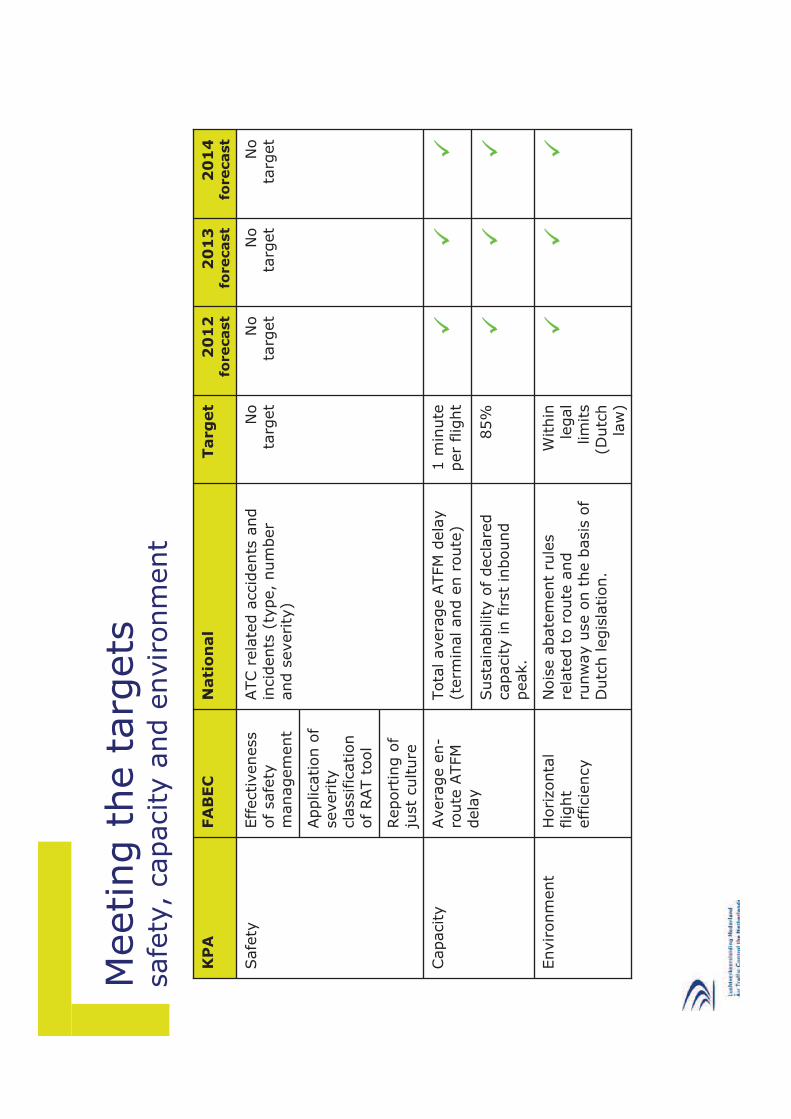
Meeting t
he t
arg
ets
safe
ty,
capacity a
nd e
nvironm
ent
KP
AFA
BEC
Nati
on
al
Targ
et
20
12
forecast
20
13
forecast
No
targ
et
No
targ
et
1 m
inute
per
flig
ht
No
targ
et
85%
Within
legal
lim
its
(Dutc
hla
w)
ATC
rela
ted a
ccid
ents
and
incid
ents
(ty
pe,
num
ber
and s
everity
)
Tota
l avera
ge A
TFM
dela
y(t
erm
inal and
en r
oute
)
Susta
inability o
f decla
red
capacity in fir
st
inbound
peak.
Nois
e a
bate
ment
rule
sre
late
d t
o r
oute
and
runw
ay u
se o
n t
he b
asis
of
Dutc
h legis
lation.
Capacity
Avera
ge e
n-
route
ATFM
dela
y
20
14
forecast
Eff
ectiveness
of safe
tym
anagem
ent
Application o
f severi
tycla
ssific
ation
of RAT t
ool
Safe
tyN
ota
rget
Report
ing o
f ju
st
culture
Envir
onm
ent
Horizonta
lflig
ht
effic
iency
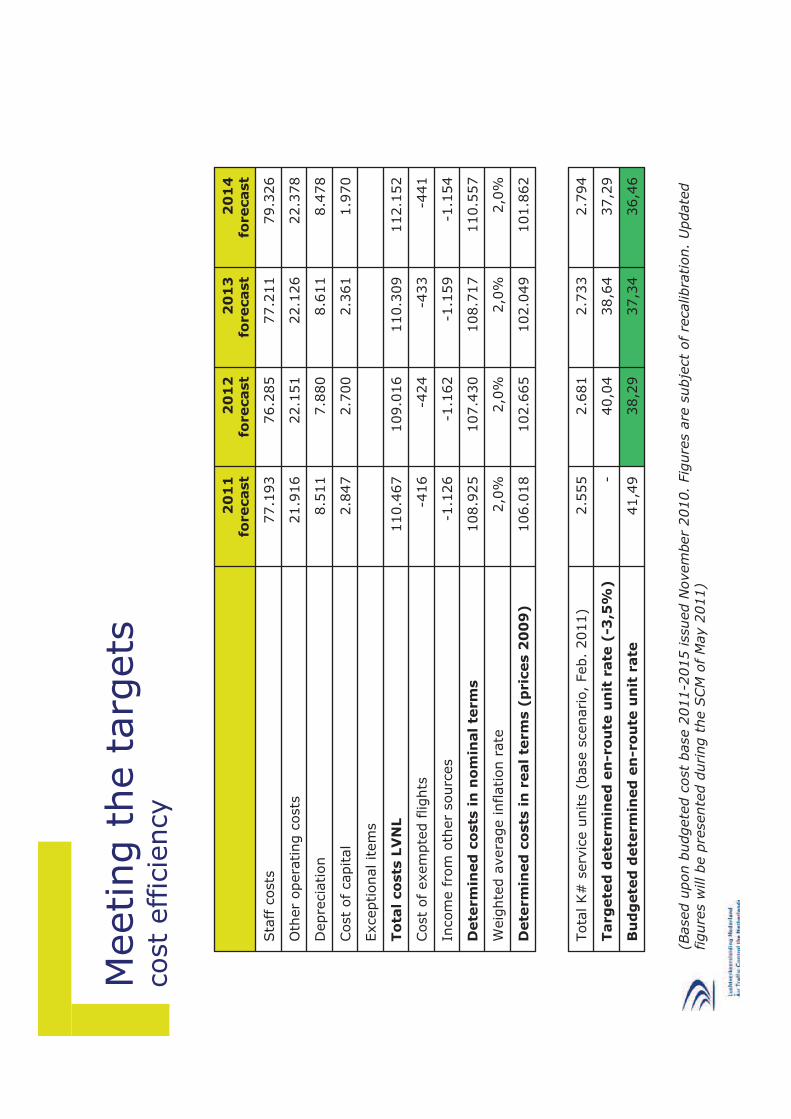
Meeting t
he t
arg
ets
cost
effic
iency
20
11
forecast
20
12
forecast
20
13
forecast
20
14
forecast
Sta
ff c
osts
77.1
93
21.9
16
8.5
11
2.8
47
110.4
67
Cost
of
exem
pte
d f
lights
-416
-424
-433
-441
Dete
rm
ined
costs
in
no
min
al te
rm
s108.9
25
107.4
30
108.7
17
110.5
57
Weig
hte
d a
vera
ge inflation r
ate
2,0
%2,0
%2,0
%2,0
%
Incom
e f
rom
oth
er
sourc
es
-1.1
26
-1.1
62
-1.1
59
-1.1
54
106.0
18
76.2
85
77.2
11
79.3
26
Oth
er
opera
ting c
osts
22.1
51
22.1
26
22.3
78
Depre
cia
tion
7.8
80
8.6
11
8.4
78
Cost
of
capital
2.7
00
2.3
61
1.9
70
Exceptional item
s
To
tal costs
LV
NL
109.0
16
110.3
09
112.1
52
Dete
rm
ined
costs
in
real te
rm
s (
pric
es
20
09
)102.6
65
102.0
49
101.8
62
Tota
l K#
serv
ice u
nits (
base s
cenari
o,
Feb.
2011)
2.5
55
2.6
81
2.7
33
2.7
94
Targ
ete
d d
ete
rm
ined
en
-ro
ute
un
itrate
(-3
,5%
)-
40,0
438,6
437,2
9
41,4
9B
ud
gete
d d
ete
rm
ined
en
-ro
ute
un
itrate
38,2
937,3
436,4
6
(Based u
pon b
udgete
dcost
base 2
011-2
015 issued N
ovem
ber
2010.
Fig
ure
s a
re s
ubje
ct
of
recalibra
tion.
Update
dfigure
s w
ill be p
resente
d d
uring t
he S
CM
of M
ay 2
011)

Questions
End o
f pre
senta
tion
AT
M S
ys
tem
Str
ate
gy
LV
NL
Sta
keh
old
er
Co
nsu
ltati
on
Meeti
ng
Ap
ril 1
2th
, 2
01
1

Str
ate
gic
develo
pm
en
tare
as
Cap
acit
yE
nvir
on
men
tC
ost
Eff
icie
ncy
Sa
fety
Su
sta
inab
leg
row
th
Pu
rsu
ing
the p
lan
Air
sp
ace
restr
uctu
rin
g
FA
BE
C c
en
tre
Sa
fety
firs
t
Co
nti
nu
ity
an
d c
ost
eff
icie
ncy
SS
E s
co
re
SP
L c
ap
ac
ity
,
Su
sta
ina
bil
ity
CD
A c
on
form
ity
.N
ois
e
tota
l, N
ois
en
igh
t,
Ru
nw
ay
& R
ou
teu
sag
e
AT
FM
de
lay
,D
ela
y,
Ta
xi
ou
t ti
me
,A
SM
A
tim
e
Ho
rizo
nta
l fl
igh
t
eff
icie
nc
y
SP
L c
ap
ac
ity
,S
ec
tor
ca
pa
cit
y
Us
eC
iv.-
Mil
. A
irs
pa
ce
,
Le
ss
fuel
bu
rnd
ue
to
dis
tan
ce
SM
S s
co
re,
Ju
st
Cu
ltu
re
Term
inal
ch
arg
e,
FA
BE
C u
nit
ra
te
ch
arg
e, F
lig
ht
h/A
TC
O
h, F
lig
ht
h/S
up
po
rth
Eco
no
mic
Co
st
/Fli
gh
th
Eco
no
mic
Co
st
/Fli
gh
t
h, F
lig
hy
h/A
TC
Oh
FA
BE
C u
nit
rate
En
-
rou
te, E
n-r
ou
teC
ost
/
Fli
gh
th
FA
BE
C u
nit
rate
En
-
rou
te, T
erm
inal
ch
arg
e
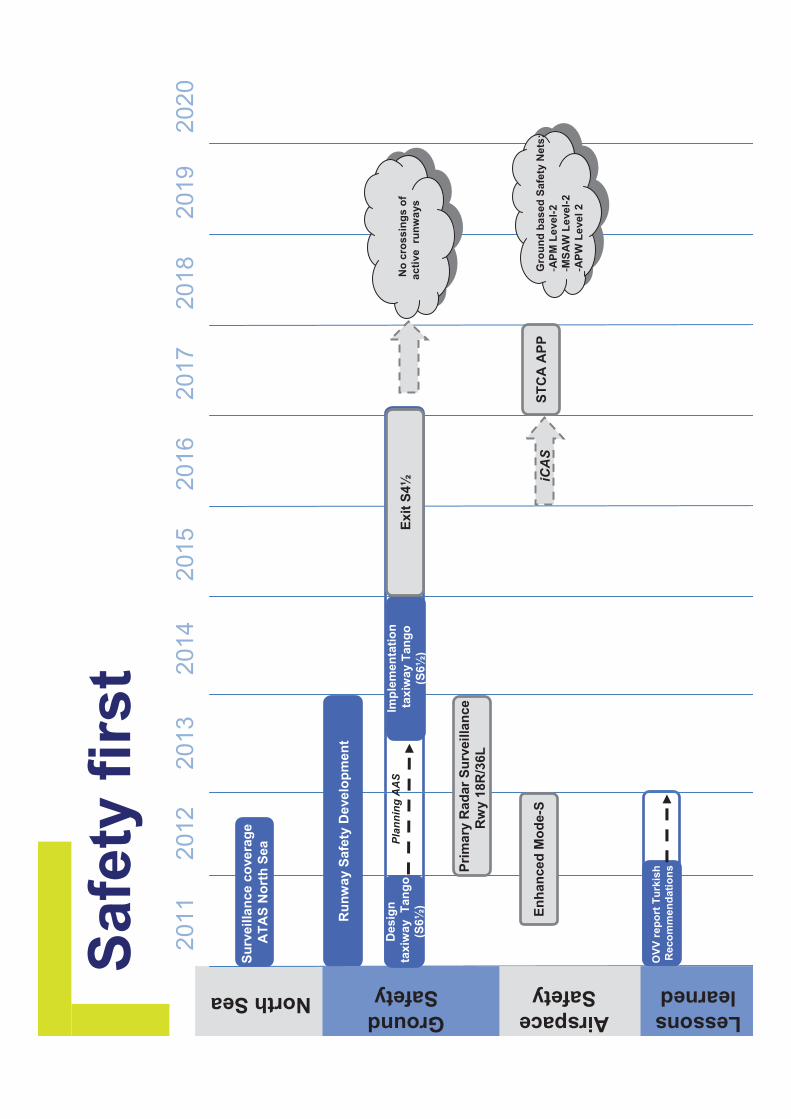
Sa
fety
firs
t2
01
12
01
22
01
32
01
42
01
52
01
62
01
72
01
82
01
92
02
0
Su
rveilla
nce c
ove
rag
e
AT
AS
No
rth
Sea
Ru
nw
ay S
afe
ty D
eve
lop
me
nt
iCA
S
Imp
lem
en
tati
on
taxiw
ay T
an
go
(S6½
)
ST
CA
AP
PG
rou
nd
ba
sed
Sa
fety
Nets
:
-AP
M L
eve
l-2
-MS
AW
Le
ve
l-2
-AP
W L
eve
l2
Ex
it S
4½
En
ha
nce
dM
od
e-S
No
cro
ss
ing
so
f
ac
tive
run
wa
ys
Runway
SafetyNorth SeaAirspace
Safety
OV
V r
ep
ort
Tu
rkis
h
Re
co
mm
en
dati
on
s
Lessons
learned
Ground
Safety
Pri
mary
Rad
ar
Su
rveilla
nce
Rw
y18R
/36L
Desig
n
taxiw
ay
Tan
go
(S6½
)
Pla
nn
ing
AA
S
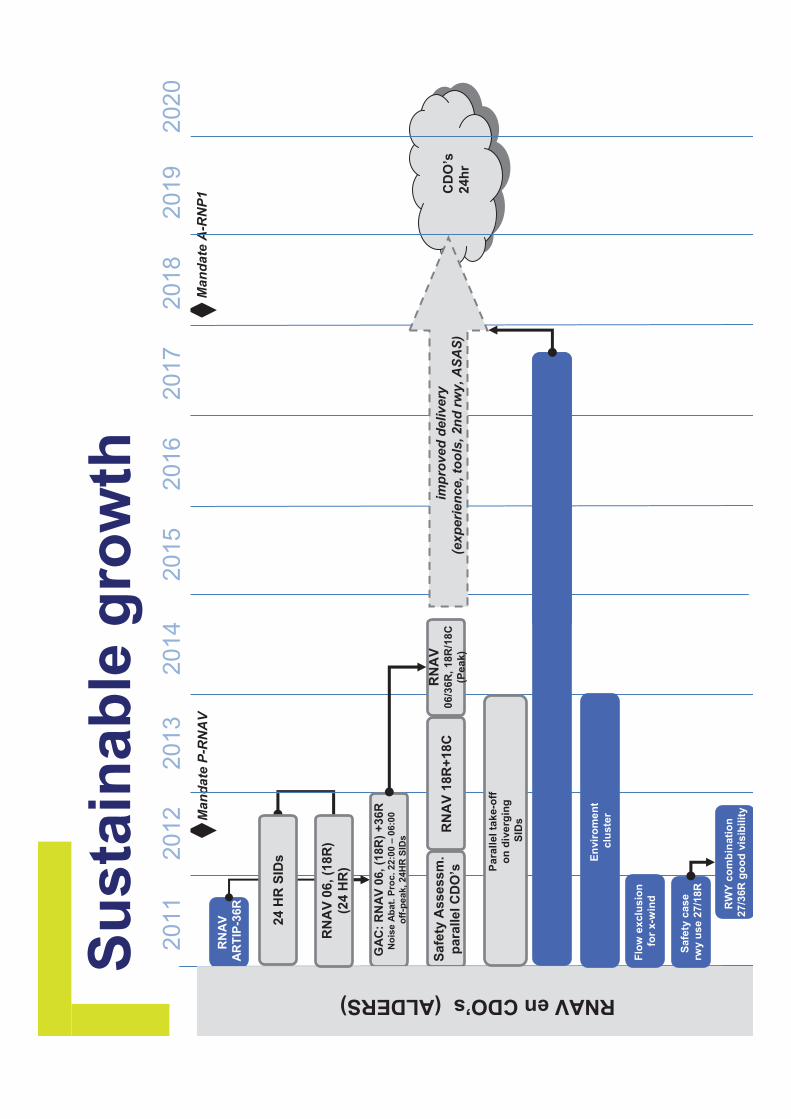
Su
sta
ina
ble
gro
wth
Ma
nd
ate
A-R
NP
1M
an
date
P-R
NA
V
Sa
fety
Assessm
.
para
llel C
DO
’s
RN
AV
AR
TIP
-36
R
CD
O’s
24h
r
imp
rove
d d
elivery
(ex
peri
en
ce, to
ols
, 2n
drw
y, A
SA
S)
GA
C:
RN
AV
06,
(18R
) +
36R
No
ise
Ab
at.
Pro
c.
22:0
0 –
06:0
0
off
-peak,
24H
RS
IDs
RN
AV
18R
+18C
RN
AV
06
/36R
, 1
8R
/18
C
(Pe
ak)
SA
RA
Co
nce
pt
2S
peed
s/R
ou
tes
RNAV en CDO’s(ALDERS)
Flo
w e
xc
lus
ion
for
x-w
ind
Pa
rall
el
tak
e-o
ff
on
div
erg
ing
SID
s
En
vir
om
en
t
clu
ste
r
Safe
ty c
as
e
rwy
us
e 2
7/1
8R
20
11
20
12
20
13
20
14
20
15
20
16
20
17
20
18
20
19
20
20
24 H
RS
IDs
RN
AV
06,(1
8R
)
(24 H
R)
RW
Y c
om
bin
ati
on
27
/36
R g
oo
dvis
ibil
ity
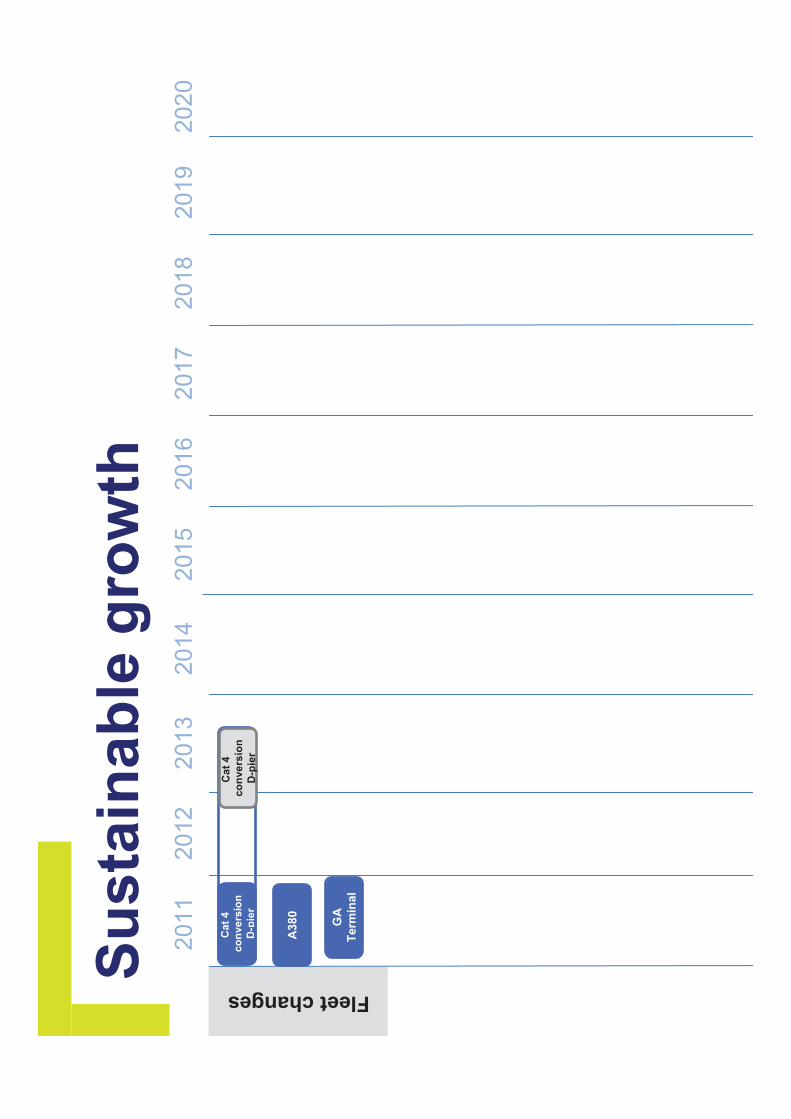
Su
sta
ina
ble
gro
wth
Fleet changes
20
11
20
12
20
13
20
14
20
15
20
16
20
17
20
18
20
19
20
20
Cat
4
co
nve
rsio
n
D-p
ier
A3
80
Cat
4
co
nve
rsio
n
D-p
ier
GA
Term
inal
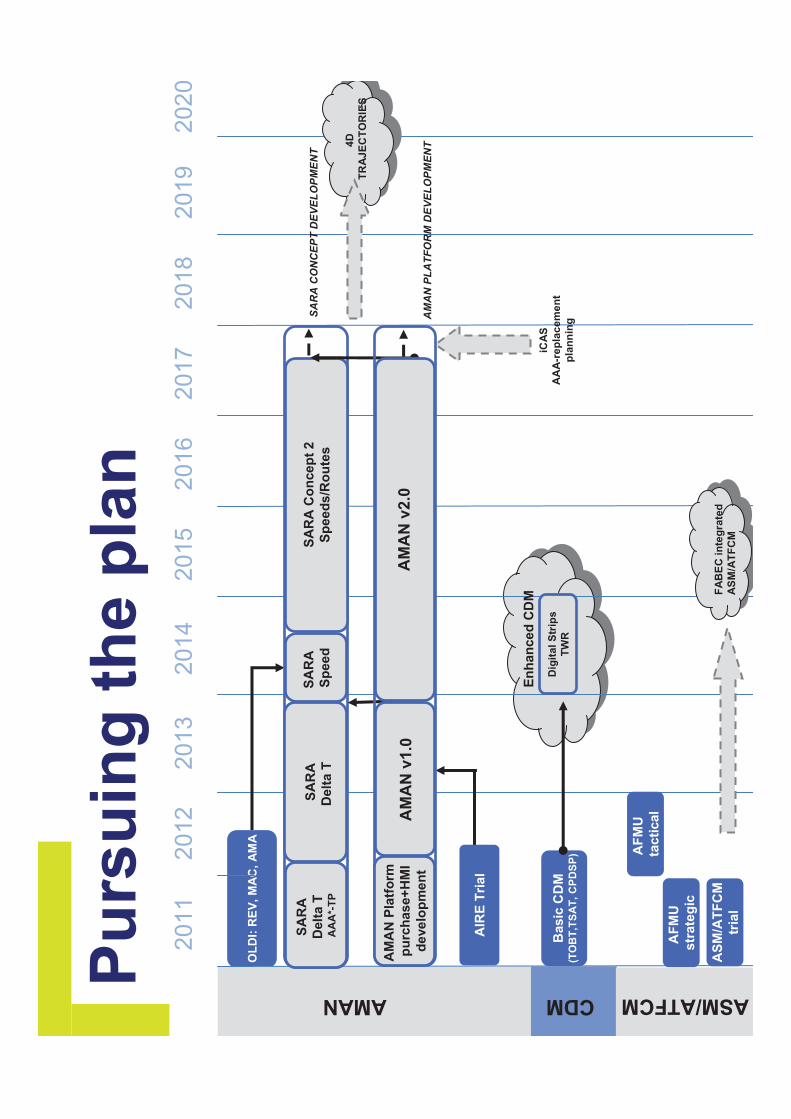
Pu
rsu
ing
the
pla
n
OL
DI:
RE
V,
MA
C,
AM
A
AMAN CDM
Basic
CD
M(T
OB
T,T
SA
T,
CP
DS
P)
SA
RA
Delt
a T
A
AA
*-T
P
SA
RA
Delt
a T
SA
RA
Sp
eed
SA
RA
Co
nce
pt
2
Sp
ee
ds/R
ou
tes
SA
RA
CO
NC
EP
T D
EV
EL
OP
ME
NT
AM
AN
PL
AT
FO
RM
DE
VE
LO
PM
EN
T
iCA
S
AA
A-r
ep
lac
em
en
t
pla
nn
ing
AF
MU
tac
tical
ASM/ATFCM
AF
MU
str
ate
gic
4D
TR
AJ
EC
TO
RIE
S
20
11
20
12
20
13
20
14
20
15
20
16
20
17
20
18
20
19
20
20
AIR
E T
ria
l
AS
M/A
TF
CM
tria
lF
AB
EC
in
teg
rate
d
AS
M/A
TF
CM
Dig
ita
l S
trip
s
TW
R
AM
AN
v1.0
AM
AN
Pla
tfo
rm
pu
rch
ase+
HM
I
deve
lop
men
t
AM
AN
v2.0
En
ha
nce
d C
DM
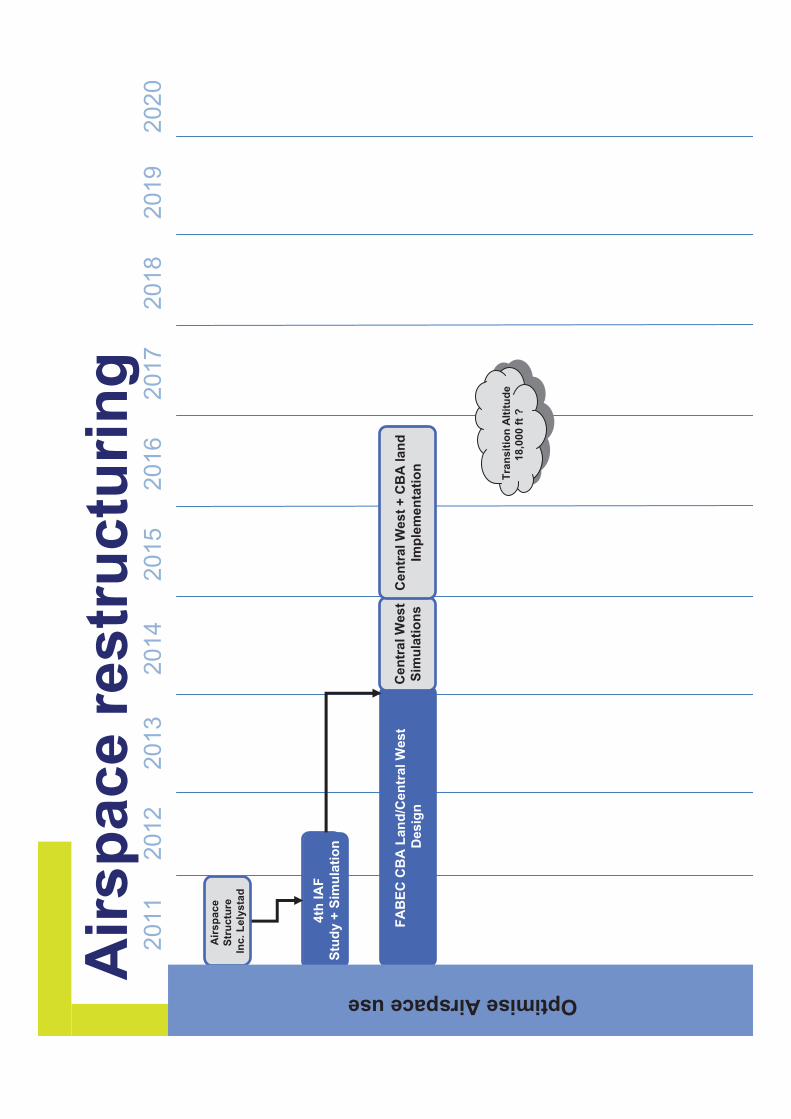
Air
sp
ac
e
Str
uctu
re
Inc
. L
ely
sta
d
4th
IA
F
Stu
dy
+ S
imu
lati
on
FA
BE
C C
BA
Lan
d/C
en
tral W
est
Desig
n
Cen
tra
l W
est
Sim
ula
tio
ns
Ce
ntr
al W
es
t +
CB
A la
nd
Imp
lem
en
tati
on
Optimise Airspace use
20
11
20
12
20
13
20
14
20
15
20
16
20
17
20
18
20
19
20
20
Tra
nsit
ion
Alt
itu
de
18
,00
0 f
t ?
Air
sp
ac
ere
str
uc
turi
ng
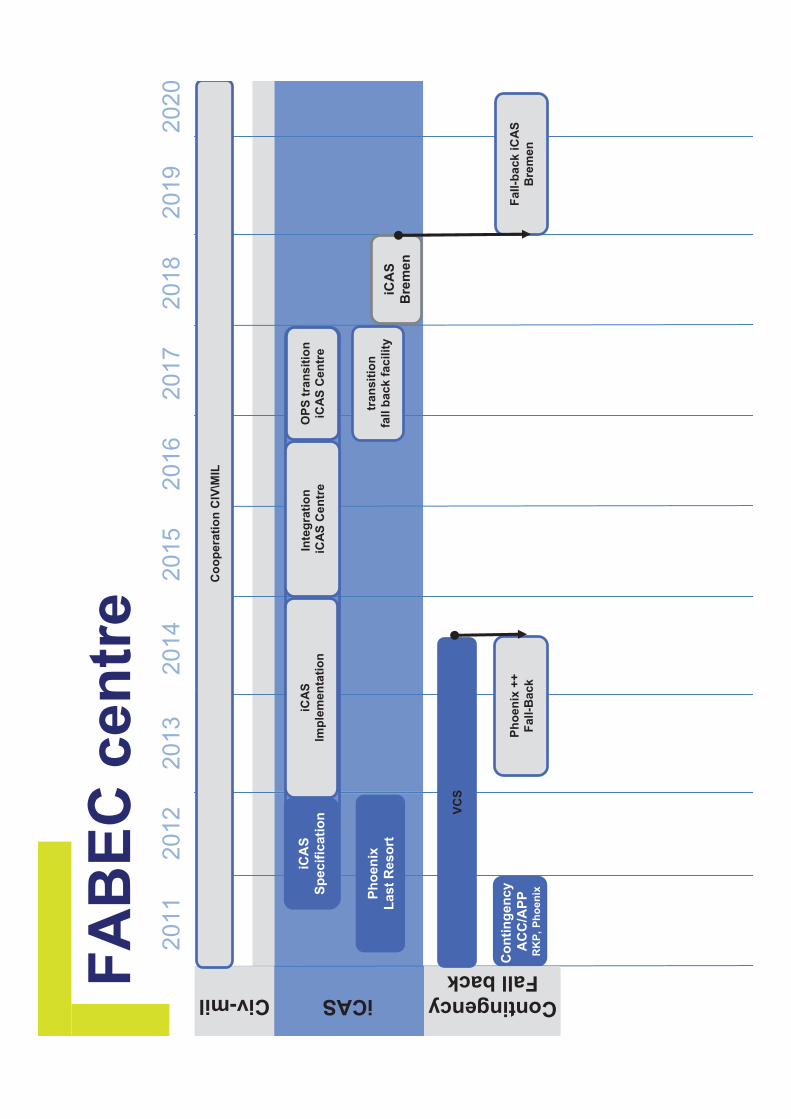
FA
BE
C c
en
tre
iCAS
tran
sit
ion
fall b
ack f
acilit
yP
ho
en
ix
Last
Reso
rt
Co
nti
ng
en
cy
AC
C/A
PP
RK
P,
Ph
oe
nix
Civ-mil
Co
op
era
tio
n C
IV\M
IL
Contingency
Fallback
Fall
-back i
CA
S
Bre
men
iCA
S
Bre
me
n
VC
S
OP
S t
ran
sit
ion
iCA
SC
en
tre
Inte
gra
tio
n
iCA
SC
en
tre
iCA
S
Sp
ec
ific
ati
on
iCA
S
Imp
lem
en
tati
on
Ph
oen
ix +
+
Fall-B
ack
20
11
20
12
20
13
20
14
20
15
20
16
20
17
20
18
20
19
20
20

VC
S
MU
ST
AN
G
Backu
p A
ir-G
rou
nd
/Gro
un
d-
Gro
un
d V
oic
e C
om
mu
nic
ati
on
sD
ata
lin
k
De
ve
lop
men
t
VH
F-C
om
Sta
tio
ns
RD
Communication Sur
TA
R 4
Rep
lacem
en
t
8,3
3 k
Hz
ch
an
ne
l
sp
ac
ing
20
11
20
12
20
13
20
14
20
15
20
16
20
17
20
18
20
19
20
20
ATS System
HA
RD
WA
RE
MA
INT
EN
AN
CE
OP
S t
ran
sit
ion
iCA
SC
en
tre
Inte
gra
tio
n
iCA
SC
en
tre
iCA
S
Imp
lem
en
tati
on
iCA
S
Sp
ecif
icati
on
Re
pla
cem
en
t V
oic
e L
og
gin
g S
yste
m
AD
S-B
Fli
gh
t P
lan
Fo
rmat
up
date
CC
IS r
ep
lace
men
t
Rep
lacem
en
t
RD
S R
D
Red
uce o
ve
rlo
ad
AC
C d
isp
lay
Co
nti
nu
ity
an
d c
ost
eff
icie
ncy
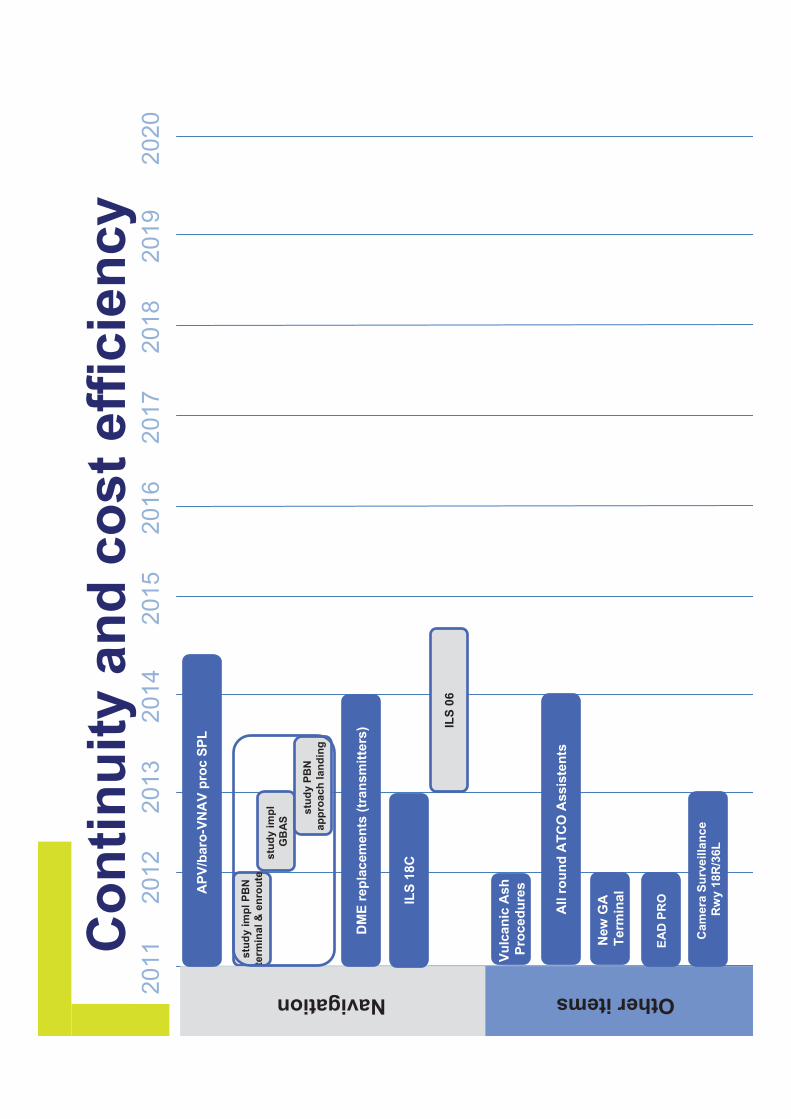
20
11
20
12
20
13
20
14
20
15
20
16
20
17
20
18
20
19
20
20
Co
nti
nu
ity
an
d c
ost
eff
icie
ncy
All r
ou
nd
AT
CO
Assis
ten
ts
Vu
lca
nic
Ash
Pro
ced
ure
s
Other items
New
GA
Term
inal
stu
dy i
mp
lP
BN
term
ina
l &
en
rou
te
Navigation
AP
V/b
aro
-VN
AV
pro
c S
PL
stu
dy i
mp
l
GB
AS
stu
dy P
BN
ap
pro
ach
lan
din
g
DM
E r
ep
lacem
en
ts (
tra
nsm
itte
rs)
ILS
18C
ILS
06
EA
D P
RO
Cam
era
Su
rveilla
nce
Rw
y18R
/36L

En
d

MU
AC
1
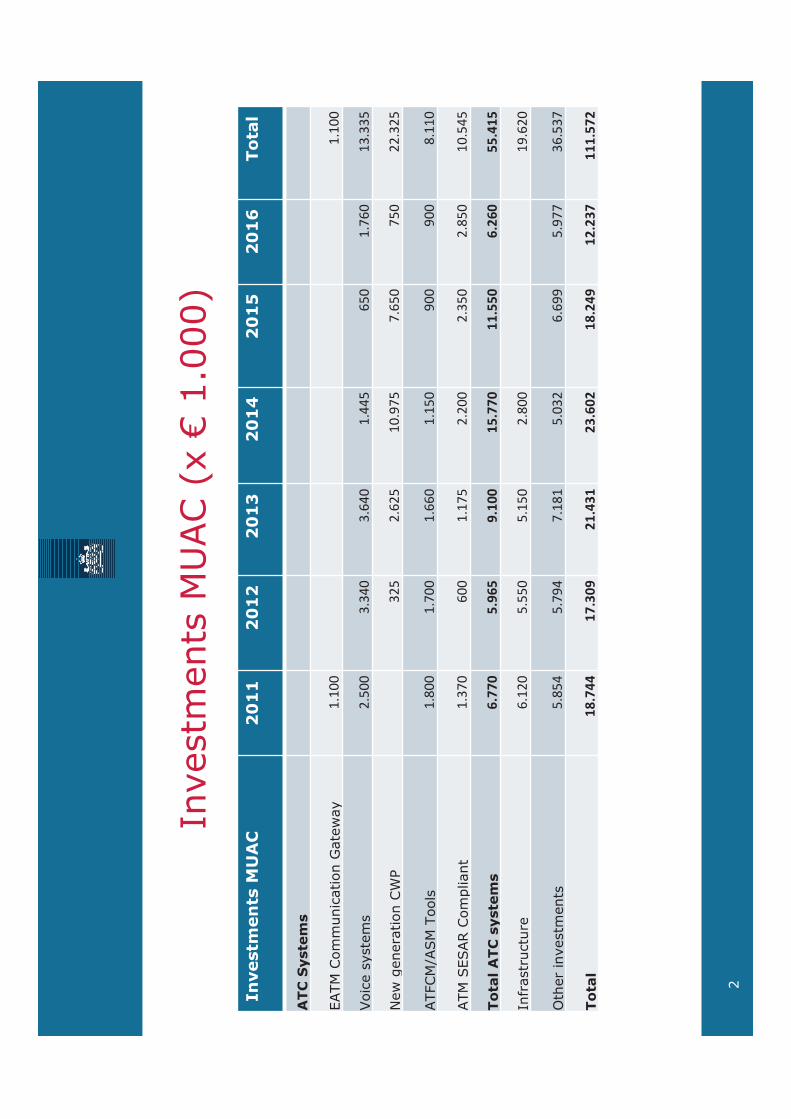
Investm
ents
MU
AC (
x €
1.0
00)
In
vestm
en
tsM
UA
C2
01
12
01
22
01
32
01
42
01
52
01
6To
tal
ATC
Syste
ms
EATM
Com
munic
ation
Gate
way
1.100
1.100
Voic
e s
yste
ms
2.500
3.340
3.640
1.445
650
1.760
13.335
New
genera
tion C
WP
325
2.625
10.975
7.650
750
22.325
ATFCM
/ASM
Tools
1.800
1.700
1.660
1.150
900
900
8.110
ATM
SESAR C
om
pliant
1.370
600
1.175
2.200
2.350
2.850
10.545
To
tal A
TC
syste
ms
6.770
5.965
9.100
15.770
11.550
6.260
55.415
Infr
astr
uctu
re6.120
5.550
5.150
2.800
19.620
Oth
er
investm
ents
5.854
5.794
7.181
5.032
6.699
5.977
36.537
To
tal
18.744
17.309
21.431
23.602
18.249
12.237
111.572
2
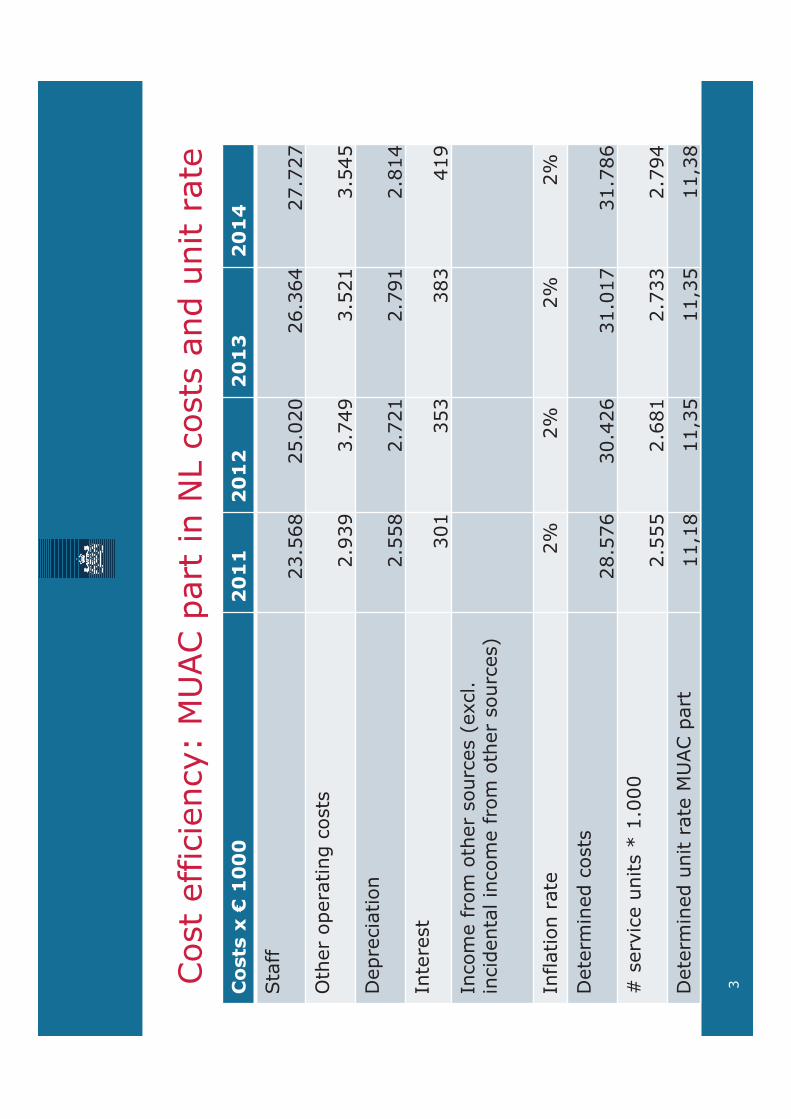
Cost
eff
icie
ncy:
MU
AC p
art
in N
L c
osts
and u
nit r
ate
Co
sts
x €
10
00
20
11
20
12
20
13
20
14
Sta
ff23.5
68
25.0
20
26.3
64
27.7
27
Oth
er
opera
ting c
osts
2.9
39
3.7
49
3.5
21
3.5
45
Depre
cia
tion
2.5
58
2.7
21
2.7
91
2.8
14
Inte
rest
301
353
383
419
Incom
e f
rom
oth
er
sourc
es
(excl.
incid
enta
l in
com
e f
rom
oth
er
sourc
es)
Inflation r
ate
2%
2%
2%
2%
Dete
rmin
ed c
osts
28.5
76
30.4
26
31.0
17
31.7
86
# s
erv
ice u
nits *
1.0
00
2.5
55
2.6
81
2.7
33
2.7
94
Dete
rmin
ed u
nit r
ate
MU
AC p
art
11,1
811,3
511,3
511,3
8
3
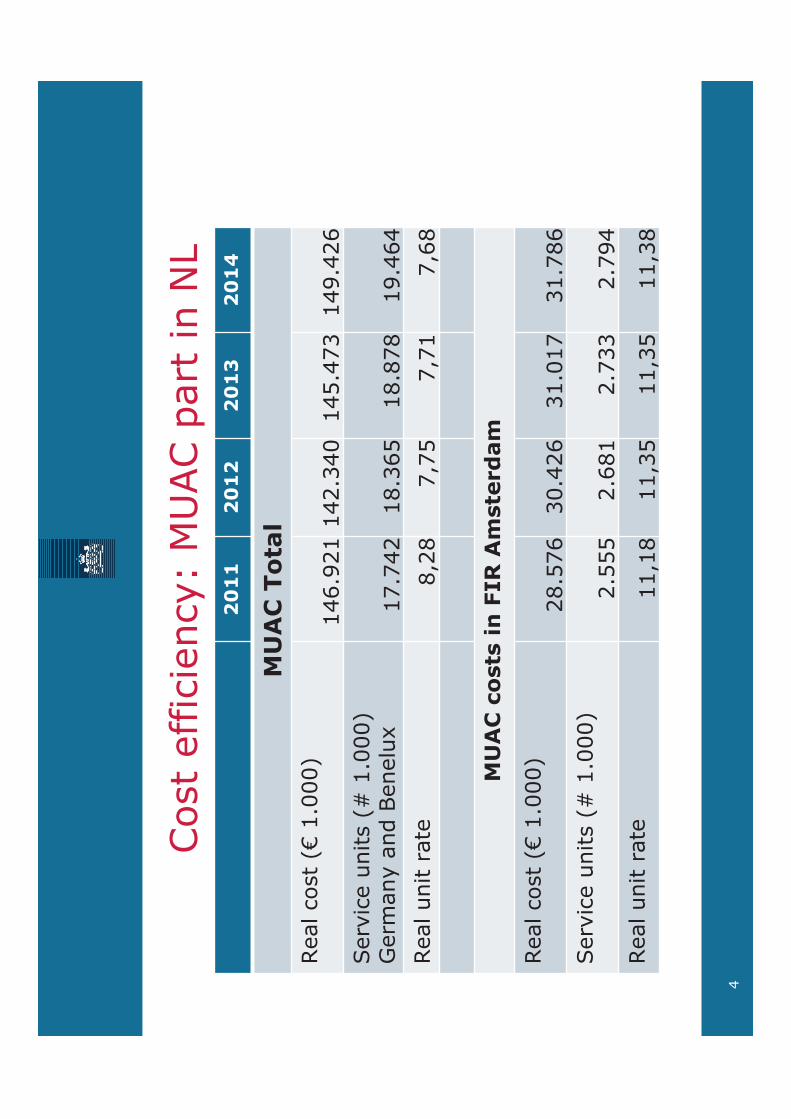
Cost
eff
icie
ncy:
MU
AC p
art
in N
L2
01
12
01
22
01
32
01
4
MU
AC
To
tal
Real cost
(€1.0
00)
146.9
21
142.3
40
145.4
73
149.4
26
Serv
ice u
nits (
# 1
.000)
Germ
any a
nd B
enelu
x17.7
42
18.3
65
18.8
78
19.4
64
Real unit r
ate
8,2
87,7
57,7
17,6
8
MU
AC
co
sts
in
FIR
Am
ste
rd
am
Real cost
(€1.0
00)
28.5
76
30.4
26
31.0
17
31.7
86
Serv
ice u
nits (
# 1
.000)
2.5
55
2.6
81
2.7
33
2.7
94
Real unit r
ate
11,1
811,3
511,3
511,3
8
4
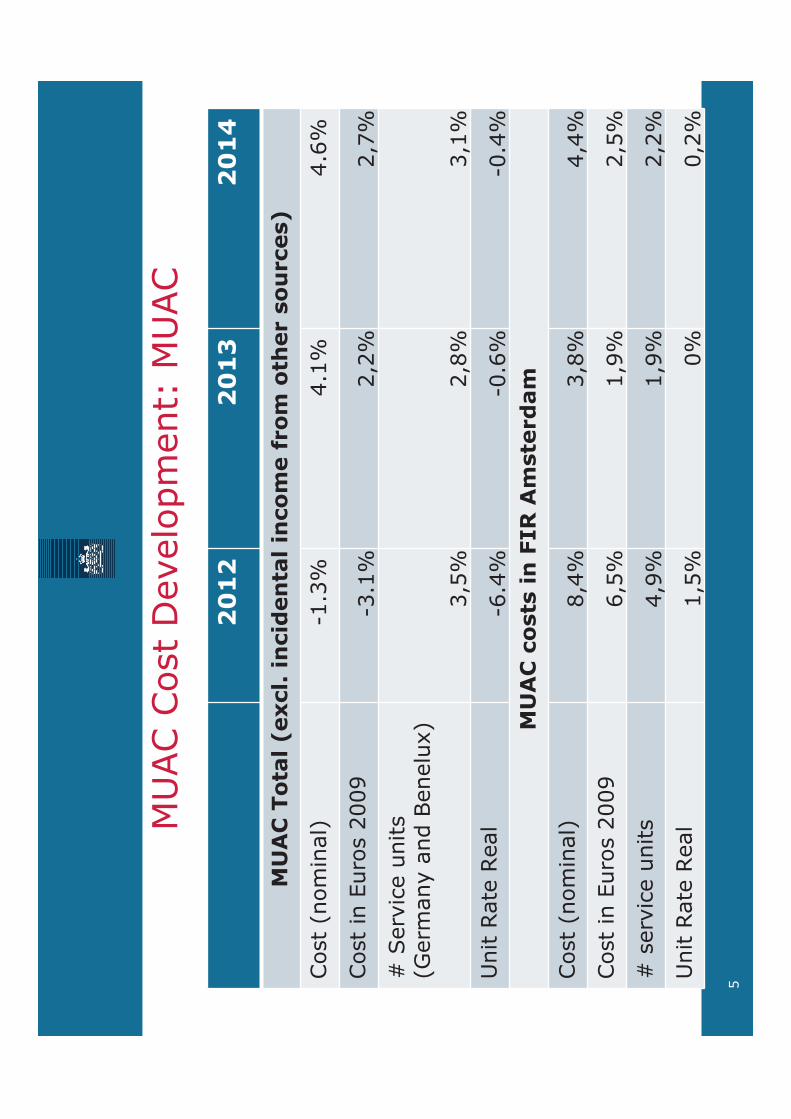
MU
AC C
ost
Develo
pm
ent:
MU
AC
20
12
20
13
20
14
MU
AC
To
tal
(excl.
in
cid
en
tal in
co
me f
ro
m o
ther s
ou
rces)
Cost
(nom
inal)
-1
.3%
4.1
%4.6
%
Cost
in E
uro
s 2
009
-3.1
%2,2
%2,7
%
# S
erv
ice u
nits
(Germ
any a
nd B
enelu
x)
3,5
%2,8
%3,1
%
Unit R
ate
Real
-6.4
%-0
.6%
-0.4
%
MU
AC
co
sts
in
FIR
Am
ste
rd
am
Cost
(nom
inal)
8,4
%3,8
%4,4
%
Cost
in E
uro
s 2
009
6,5
%1,9
%2,5
%
# s
erv
ice u
nits
4,9
%1,9
%2,2
%
Unit R
ate
Real
1,5
%0%
0,2
%
5
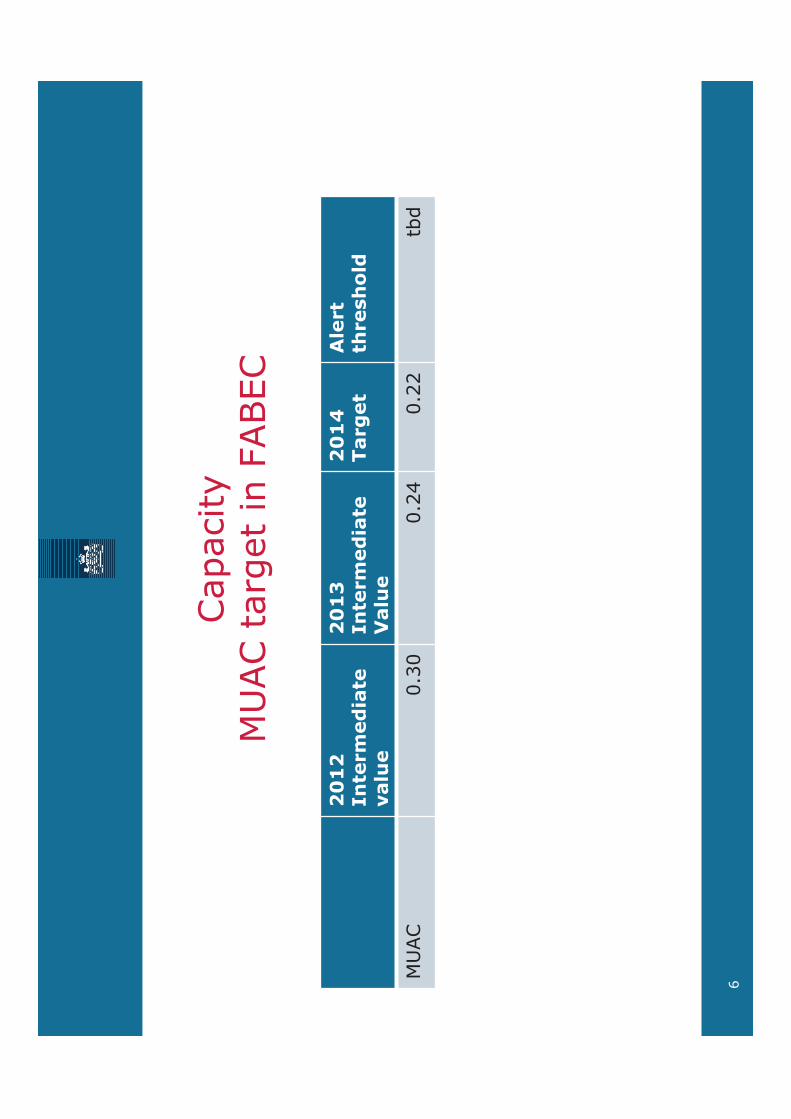
Capacity
MU
AC t
arg
et
in F
ABEC
20
12
In
term
ed
iate
valu
e
20
13
In
term
ed
iate
Valu
e
20
14
Targ
et
Ale
rt
thresh
old
MU
AC
0.3
00.2
40.2
2tb
d
6
Sta
kehold
er
Consultation M
eeting 2
011 -
April 12th
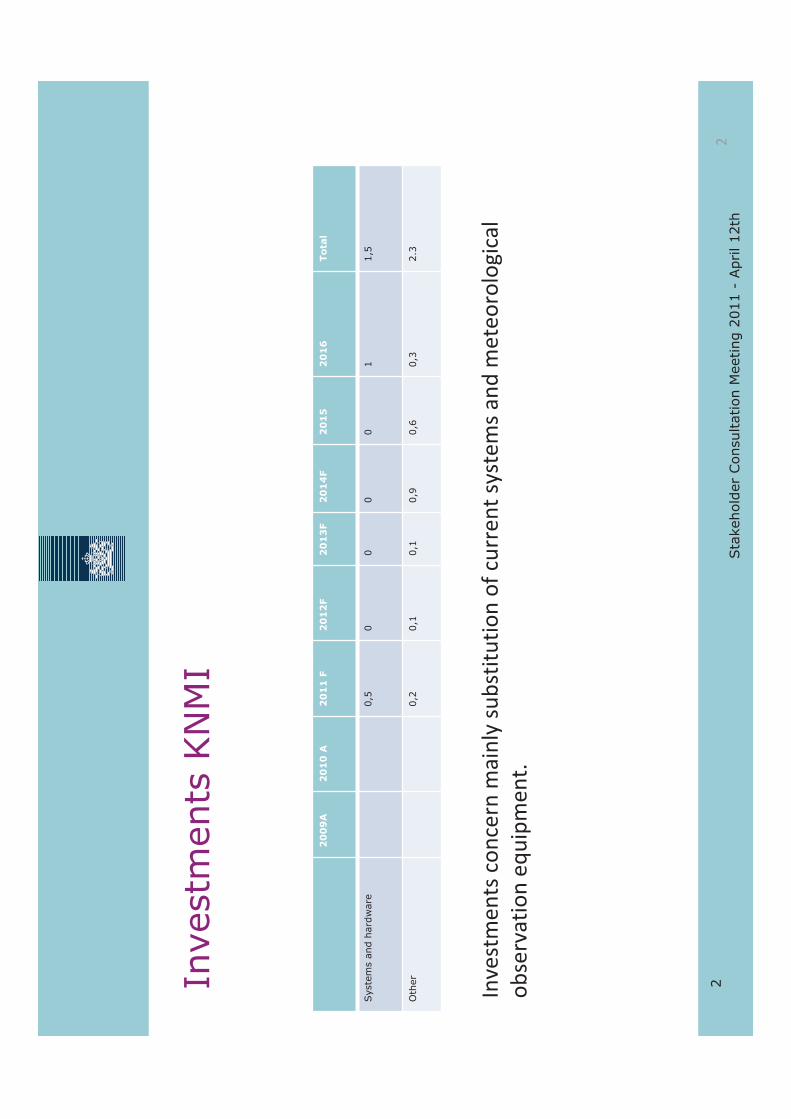
Sta
kehold
er
Consultation M
eeting 2
011 -
April 12th
2Investm
ents
KN
MI
20
09
A2
01
0A
20
11
F2
01
2F
20
13
F2
01
4F
20
15
20
16
Tota
l
Syste
ms
and
hard
ware
0,5
00
00
11,5
Oth
er
0,2
0,1
0,1
0,9
0,6
0,3
2.3
Investmentsconcern
mainlysubstitutionofcurrentsystemsandmeteorological
observationequipment.
2
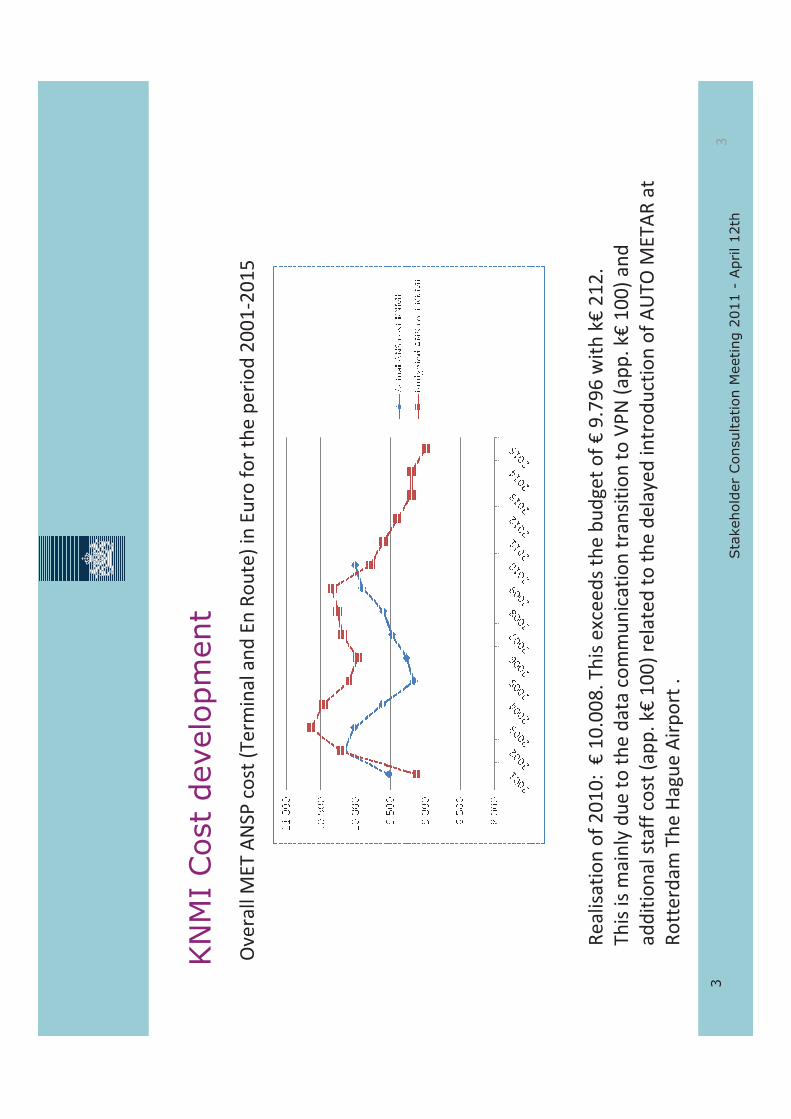
Sta
kehold
er
Consultation M
eeting 2
011 -
April 12th
3
KN
MI
Cost
develo
pm
ent
OverallMETANSPcost(Term
inalandEnRoute)inEuro
fortheperiod20012015
Realisationof2010:€10.008.Thisexceedsthebudgetof€9.796withk€212.
Thisismainlydueto
thedata
communicationtransitionto
VPN(app.k€100)and
additionalstaffcost(app.k€100)relatedto
thedelayedintroductionofAUTOMETARat
Rotterdam
TheHagueAirport.
3

Sta
kehold
er
Consultation M
eeting 2
011 -
April 12th
4
KN
MI
Cost
develo
pm
ent
OverallMETANSPcost
andEnRoute
allocationinEuro
fortheperiod20012015
Year
2001
2002
2003
2004
2005
2006
2007
2008
2009
2010
2011
201
22013
2014
2015
To
tal
ME
TC
osts
€9.5
24
10.1
76
10.0
23
9.6
19
9.1
65
9.2
71
9.4
82
9.6
02
9.9
11
10.0
08
9.6
00
9.4
00
9.2
00
9.2
00
9.0
00
All
ocati
on
En
Ro
ute
%100
100
100
100
100
100
100
100
91
82
82
82
82
82
82
En
Ro
ute
Co
sts
€9.5
24
10.1
76
10.0
23
9.6
19
9.1
65
9.2
71
9.4
82
9.6
02
9.0
19
8.2
07
7.8
72
7.7
08
7.5
44
7.5
44
7.3
80
Numbersingreenare
basedonrealisation,numbersfrom
2011andonwardsare
basedonforecast.
4
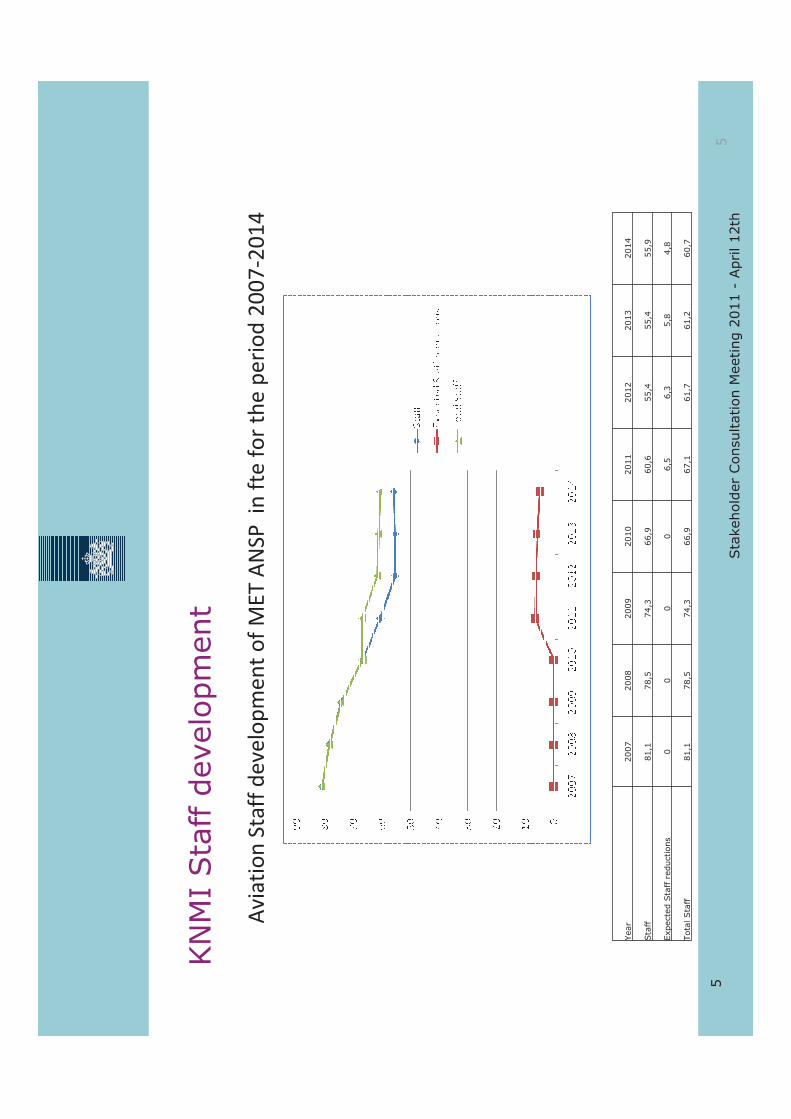
Sta
kehold
er
Consultation M
eeting 2
011 -
April 12th
5
KN
MI
Sta
ffdevelo
pm
ent
AviationStaffdevelopmentofMETANSPinftefortheperiod20072014
Year
2007
2008
2009
2010
2011
2012
2013
2014
Sta
ff81,1
78,5
74,3
66,9
60,6
55,4
55,4
55,9
Expecte
dSta
ffre
ductions
00
00
6,5
6,3
5,8
4,8
Tota
lSta
ff81,1
78,5
74,3
66,9
67,1
61,7
61,2
60,7
5
Sta
kehold
er
Consultation M
eeting 2
011 -
April 12th
6
KN
MI
FABEC S
ynerg
y
METAlliance
•Harm
onisedTAFverificationscheme
•FABECservices:Roadmapinplace
•2physicalredundantservers
(Offenbach
andToulouse)in2012
•Windaloftdata
•Radardata
•Trainingworkshops
•Coordinationofregulationpolicy
Objective:
•Internationaloperationalcollaboration
•Increase
efficiency
•Rationalisation
•Harm
onisation
•“A
ctasifwewere
one”withinFABECinitiative
6
Sta
kehold
er
Consultation M
eeting 2
011 -
April 12th
7
KN
MI
Futu
redevelo
pm
ents
AUTOMETARim
plementedatRotterdam
asof15th
March2011.Further
optimisationofAUTOMETARconceptwillcontinue.Share
bestpracticewithin
EuropeviaICAOInform
ationPaper.
Improveharm
onisationandefficiency
ofFABECMeteorologicalServicesviaMET
Alliance.
InsertDutchmeteorologicalbestpracticesinSESARWP11.2:
•Centralizedweatherroom
•WeatherdependentdeploymentofMeteorologicalAdvisorSchiphol(M
AS)
•AUTOMETAR
•Probabilityforecasting
•RunwayVisualRange(RVR)forecasting
•DerivationofWindandTemperature
from
ModeSdata
•ContributioninMainportSchipholCDM
•
7

NS
A(in
cl.
Eu
ro
co
ntr
ol
HQ
)
1
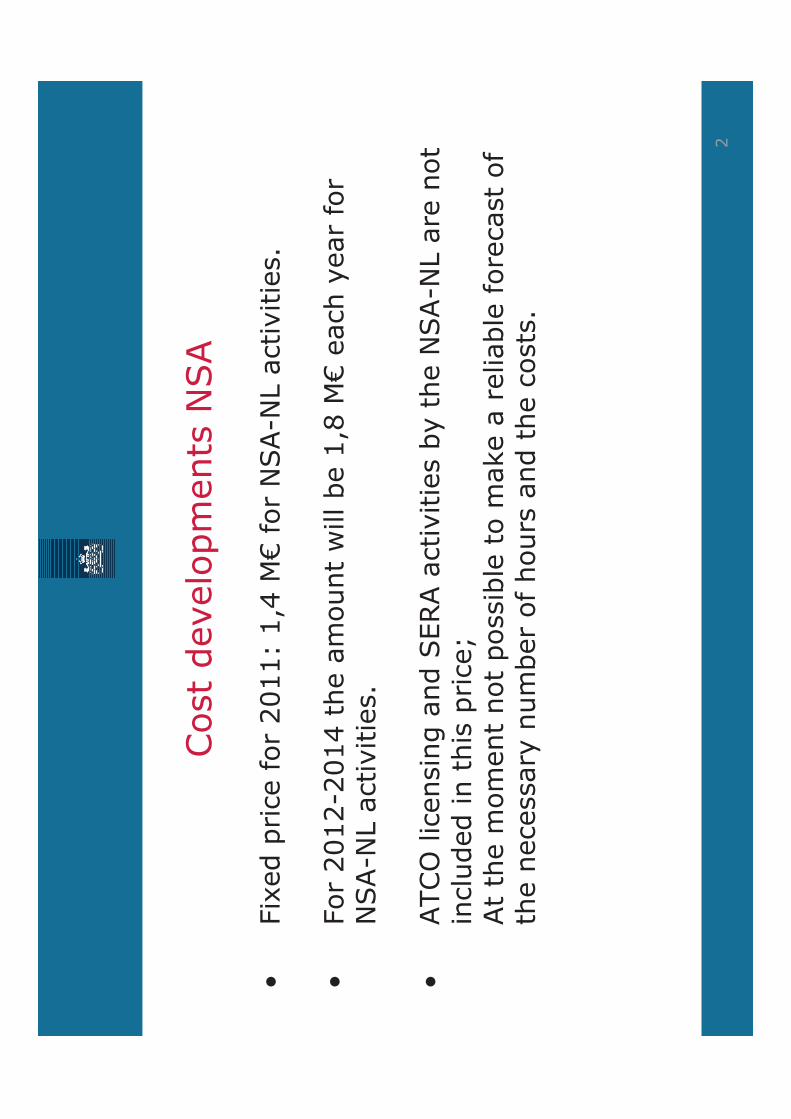
Cost
develo
pm
ents
NSA
•Fix
ed p
rice f
or
2011:
1,4
M€
for
NSA-N
L a
ctivitie
s.
•For
2012-2
014 t
he a
mount
will be 1
,8 M
€each y
ear
for
NSA-N
L a
ctivitie
s.
•ATCO
lic
ensin
g a
nd S
ERA a
ctivitie
s b
y t
he N
SA-N
L a
re n
ot
inclu
ded in t
his
price;
At
the m
om
ent
not
possib
le t
o m
ake a
reliable
fore
cast
of
the n
ecessary
num
ber
of hours
and t
he c
osts
.
2
Cost
develo
pm
ents
NSA
1.
NSA p
ers
onnel continue t
o u
se t
he A
ll S
olu
tions s
yste
m for
regis
tration o
f hours
spent
per
activity.
Als
o t
here
is a
re
gis
tration o
f costs
for
inte
rnational N
SA t
rips a
nd t
rain
ing.
2.
This
info
rmation is u
sed t
o v
erify
the a
ssum
ptions u
sed a
nd
will be u
sed f
or
RP2.
3.
Aft
er
each 3
month
s a
check is p
erf
orm
ed,
to s
ee w
heth
er
the a
ssum
ptions u
sed a
re s
till v
alid.
So f
ar,
the e
arly
indic
ation is t
hey a
re.
3
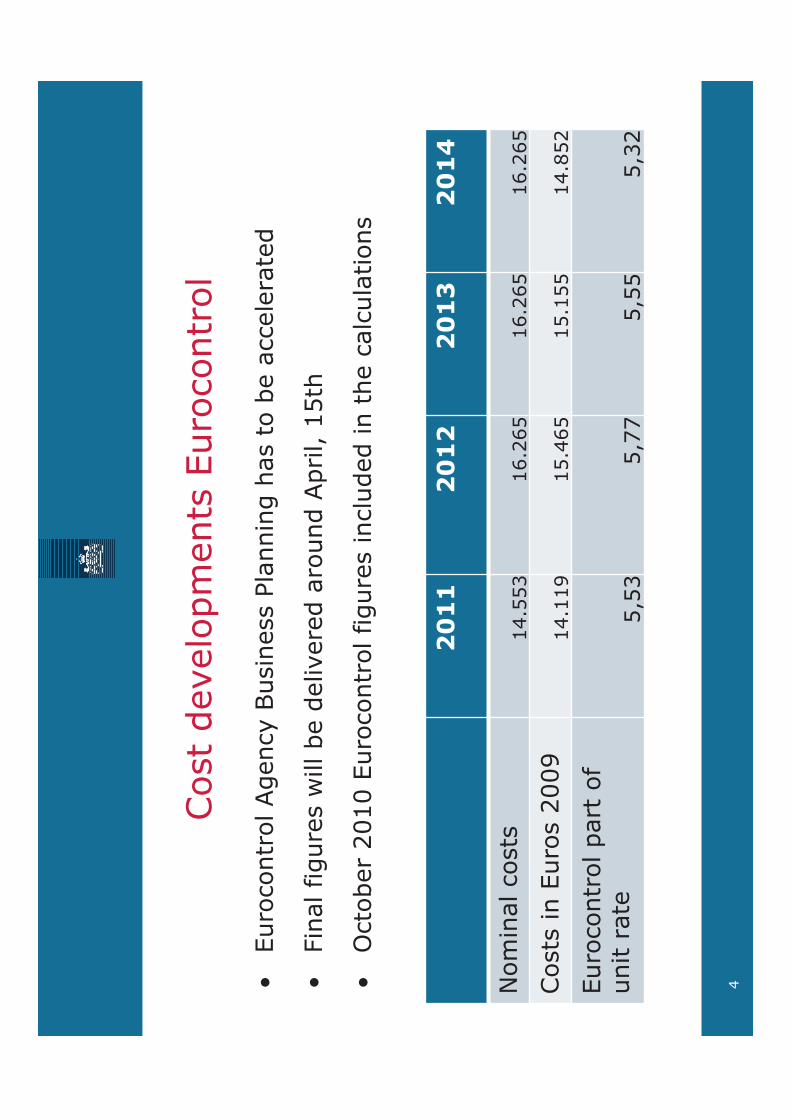
Cost
develo
pm
ents
Euro
contr
ol
•Euro
contr
ol Agency
Busin
ess P
lannin
g h
as t
o b
eaccele
rate
d
•Fin
alfigure
sw
illbe
delivere
daro
und
April, 1
5th
•O
cto
ber
2010 E
uro
contr
ol figure
sin
clu
ded
in t
he c
alc
ula
tions
20
11
20
12
20
13
20
14
Nom
inalcosts
14.5
53
16.2
65
16.2
65
16.2
65
Costs
in E
uro
s2009
14.1
19
15.4
65
15.1
55
14.8
52
Euro
contr
ol part
of
unit r
ate
5,5
35,7
75,5
55,3
2
4

�
�
�
� ������������ ���������
������
��������������� ��
������ ��������
�� ������
�������������
������ ���� ������
���������������
!"��� �#���$���� �%&'()�
*"��� �+��,��� �%�-.�)�
(� �/������0���
&�10�%�)����0�/2��
�#"�� #��"����� 3�� �� �"
��
�
� �4����5�� &� ����67&�6�6����5���� ������ ��
-����#��#����� ���8#� ����,���������
��"�����"0���
���� ������ &�"�+��������%+�&)��
&�"��� �#���$��8#� �%+�&)9��
&�"�':(�����%;!(!)9��
&�"��� �'��������%;�!'�!)9��
&�"�6�������%!'�!)9��
&�"�4����������%;!7!9��
&�"�#� �4���� �%+.&;)9�
&�"�6� #�8�%+.&;)9��
&�"�������%�-.�)9��
&�"������%�-.�)9��
&�"��� �6�������<�%�-.�)9��
&�"�=���� <�%�-.�)9��
&�"��� �+��,��� �%�-.�)9��
&�"�-�����8�%�-.�)9��
&�"�$����� <�%.6!)9�
&�"�+�����%&>!7)9��
&�"�-� �?@������%&>!7)9��
&�"��� �#���&����%6��,��)9��
&�"���� ��%&�(9�7����� ��5��������� �)9��
&�"��� �#���$���� �%&�()�
&�"�4������%&�()�
� ��
���� ������ �/�
�
!,,� #�A�����
�
�
�
�
� ������������ ���������
������
��������������� ��
������ ��������
�� ������
�������������
������ ���� ������
���������������
!"��� �#���$���� �%&'()�
*"��� �+��,��� �%�-.�)�
(� �/������0���
&�10�%�)����0�/2��
�#"�� #��"����� 3�� �� �"
��
�
� �4����5�� &� ����67&�6�6����5���� ������ ��
-����#��#����� ���8#� ����,���������
��"�����"0���
���� ������ &�"�+��������%+�&)��
&�"��� �#���$��8#� �%+�&)9��
&�"�':(�����%;!(!)9��
&�"��� �'��������%;�!'�!)9��
&�"�6�������%!'�!)9��
&�"�4����������%;!7!9��
&�"�#� �4���� �%+.&;)9�
&�"�6� #�8�%+.&;)9��
&�"�������%�-.�)9��
&�"������%�-.�)9��
&�"��� �6�������<�%�-.�)9��
&�"�=���� <�%�-.�)9��
&�"��� �+��,��� �%�-.�)9��
&�"�-�����8�%�-.�)9��
&�"�$����� <�%.6!)9�
&�"�+�����%&>!7)9��
&�"�-� �?@������%&>!7)9��
&�"��� �#���&����%6��,��)9��
&�"���� ��%&�(9�7����� ��5��������� �)9��
&�"��� �#���$���� �%&�()�
&�"�4������%&�()�
� ��
���� ������ �/�
�
�
�
�
�
�
�
�
�
�
�
�
�
�
�
��������������������
(������9�&�"���� �9��,� ���������� �������"���!&�� #��������������67&�
,������,� ��"�(���������5���������6��<���#���7� ������� �&���� ��� ����6�6�
,��5���� ���,�� "�;�������������5��������������&>!7����,���� �"�(���������5������5�
��������� �����������#"�(��������� <���-.��5������� ���������� �"��
�
��������
�������,� ���������� ����!�� #�"�
�
�����������������������
&��$����� <�� #������������ ������ �����5����>7&��5�6�,�����������9������� �
.6!������������������#����.6!�����������5�A�#�,�������#��"�(�������������� ���
�
����� ��0��� ��� ���� ��0��� �/�
�
@������������ �����9����.6!��������<� ��� ���5�A�#�,�������#��"�!���5�����9�
���.6!������������������#�� ���5�A�#�,�������#��"��
�
���������������
� !���������� ������"��#�$�#�������������������� �����������
&��-� �#���$���� ��������������,���� ����� ��5����6�6��� ��A��� #����������
��� ������� ��A��� �=��"�!�B!4�7�,��5���� ���,�� ���������#��5��#�5�����,����@9�
� ���� �� �9���5��@�� #��������@������� ��55������ ���"�������������� ����5���
����� ������ ��C� ��� #����� ���� ��������� �B!4�7�������55���� �@���������#�����
������� ���� ��������"��������9�� ����������� ��5���� ���� ���������55���� �@�
�����������B!4�7����������������� ��#�#�� ����,�� "���
�
&��+��������� #�����������������<��5����� ���� ��������5���B!4�7����#� ���,���
�� �������������� ��5���������55���� �@����B!4�7������"�(��B!4�7�&������6�������
���#������������������������ "�&��-� �#���$���� ���,������������5�������5���
� ���,����#������� �@���� ������������,��5���� ���������������#�� #�&6���@�
���������������� ���� ��������"��
�
$��������#���������� ������� ��A�9���������<�5���$����� ����,�����������,���
��������� �5������������5����,�"�' ���� ��� �������#�����,�� ���5��������,�����
%�������#����D�������������� �����!,���)"�! �����,������������ �����#�����������
����� � ����������,����� ����55��"�&��-� �#���$��8#� ���<��������������#����
,��������������������������� ������ 5������� �5������������B!4�7�&69����������
,�������������<�������,����� "�(���� 5������� ���������,����#�#��5������� ��
,#���#������#���"�%������%� ��&�������'�����)"��
�
(� !�����������&)�������*����
&�"�������5������������ �,#�����5������������������ ����� ��5��-.�9�����������
��������,����#"�(���������� ������ �5��� ����#���� ��5��,,�������559���7B'�
������ ��,,�� ��#�5���������� ����� �9�� ������ �������,���,� �#������,���
�����"�7��� ��� ������ ��������� �@���,������ ��� ������ ��"�!���������������
����������5������������#� ���#���� �"�(���5���� �������<���������#��� �
!(7'����� � �"�(������������#�� ���������#�5������ �����9��������55�����5����
������� ��� �� �������������������@���������� #�������� �� �������,����"�(����
������������� ������5� ������ ����9������������ �������,������%�"�"�����
,����9�#�����,�� ���� ����&�##�������)"��-.��������� ��@� #����<� ���� �����
�5�,��8����9������ �B!4�7�%74!��� #)�� #��������� ���� ���������%5������ ��5����
���!�#����!������ �)��������#�������� ��� ����� ������,����� #�����������
������,,�����������5�6��,�������������������� ���� #�������,���������55����
� �,��5���� ���%��,����@9������ ������@�� #� ������������ �)"�
�
.�A����,���� ����� �������� ��@�&�������� ��-.�E��!(&��@�����#�����,�
�� �F�������@������,�����,��5���� ���� ����������8����"�(��,���� ����� �
������� �����������5����� ������ ���� #�,��8���������-.��������������@� ������ �
������� ��@����"��
�
&��4����������� #���������������A,� ����5���� ������ ����������@������ ��#���
� �����5�������� ��,������������5������ �5�����,����@�%��G�����,������2�� #�
5������5����#��5��!7����,��������)"�(��,���� ����� ������������ ��#���5�
� ������ ���A,� ���9�������� ������ ������� ���������@��� <�#����������55���� �@�
���,��5���� ��9� ������;���� #�!(&�&�����,�� "�;�����#����,�����������,�����
� ������ ���� �,���,��������5�� �� ������#�������55���� �@�� #���,����#�,��5����
� ��"��
�
�
����� ������ ��� ���� ������ �/�
�
&��'E(�����������������������<����&��4���������"������������-.�����������#�
���,��,���������� �5���� ��@���"�&����!.6�E����������� ����,�� �� #F���6���
������ #�; ������ ��,�� 9�� �������������#���������������,�,�����5����� �
������ ����9�� �������@����� ������ ���� �������������������������9�����
#�55��� ���,��� ��������� ��������#�� #��@���@����� ������ ��������#"�(���
� ���������.6!������<����,��,����������� �"��
�
&����������,�������������������������,�� ��,����,��5�����#"�; ������ ���
���#���� ���� �5����� #�����A,����#��� �5�������#��������������������"��
; ��� ����-.��������� �5���� ��@����������� �������#����5����������� ������ ���
,�� �#"�(��������������,���������55����� ����#�,�������� ������"��
&��4����������#�������������&��������� ����������� ���5����#�,�������� ������"�
�-.����������������� ��5����� ��,����#��5�� ������ ������ ����9�� #������� ���
��������������� �5�����5������� ������ ������"�&����������,����������������
��� �� ������ ���� �������� ��,����#����������,������ ���5���������������
������ ��@������ #������,������ ���5�!!!������@��������������#������� #�
�5���5���@���"�4����@�������55��� ����,,��� ������5����-.�"��
�
&���������� ��� �� ������������,���� ����� ��5����,��5���� ��������"�(��
���������������55������<�� #���������<9��-.�� ��#��� ��G��@���,����"�&��4����������
� #������������ �����#����������� �������55������<"�;������ #��#��� �������� ��
5���!.6��9����������<���� ���������� �"�;5�������<��A���#����H��������������
������<"�4����� ��H�� #���H�� �@�0�H��5�������<������� ���@����!.6��"�������
�5�����,� �� ������������� ��8���5������ �5����G��@���,���������������� �����<����
�� ������ ��#��� �������������@��5������������,�������"�!.6������#����������
�� <�����������������,����� ������ ����������,�@"��
&��+�����������#���<�����< ����@��G��@���,�������� ��#�#���������������������<�9�
��������� ������������#��@�,��,���������� ����� �"�&����������,��������� ���
����������� ������ ������#��@��-.�"�&��-� �6�������<��##����������G��@���,��
���� ��#�#���� ������@������ ����"��
�
.�A��&���������A,��� ������##���� ��� ���� ���<,�E��� #���������5�����5��@9����
,����@9�� ���� �� �"�&���� �#���$�@#� ���@������������� ������ ����������5���
!(B&�#���@�%� ������� #������ ��)���� �������������� ��#��� �������������,���
5���� ����5��-.�"�; ���������,��5���� ��������"���#��,��������55������5����
����� ���������#��� #����@�� ���� ���������"�(�������������������5������
��� ������@"�(���-.��,��5���� ������������������ �������� ����������5�2�H"�
4��������������#��������������������9������#@�� ����5�������5��� ���,��
���#"�; ������+�&���G����� ���5�������� ������@�����������H������ ������@�����
@������ #"��
�
&����������,����������������������#���55������� ���,����@�� #������ �����
��@F#���@9���������-.�9�������������+�&�� #��?�&9���������<�� ������,��������
��@��5�����������������������"��
�
.�A�����#������ �#�����������#��������"�&��������� #������������������ #�67&�
���5������������������ �,#���#"�&��4����������������@�#���,,�� ��#��@����5���
���"�(��!(7'����������� ������#��@���H������� ����������9�@���,��#������@�
���� �@�� ������#��@�2H�%��G��������� �5�������#��5��!7���������,���)"��-.��
���� ���5����������A,� �����!.6���� �B!4�7"�7� ��#��� ������ ������ ���#� �9�
���#��A,����#�� �� �������� �,��#������@9�@������5�������������� � �����
,������ ���5�,��5���� ��"��
�
�
�
����� ������ ��� ���� ������ �/�
�
( !����������+) $������,�����
&��6� #�8���������,���� ����� �� ����������5��������������������������,������� "�
(��� ������ ��,�� ���5�+.&;�������� �@������,��������� ���@������� #������
��������������������� ��G�,�� �"�(��+.&;������#�����,�� �9���������������55�
#�����,�� ���������#�� ���#���� #�� ����5�������5��� ���,����#"�!��+.&;����� �
��� �@9������� ���������#������<��� @�,��5���� #����� �@�������#��G��@"�7����
�� ����� ���"G"��#������ ����� ���������5�������@���,���� �"��
(����,�����������55���� �@�� #�����������������������������������,����������� ���#���
�����,�����!(&��,��5���� ��9�+.&;�����������@�� �����#�� �B!4�7������&�(�
!���� ��"�;����������#�55����������,�����������55���� �@�� �B!4�7�������������@�#�55�����
�����@��55������ �� �����55�� �����?���� @�� #�B�� ��"�(������,��������� �(��
.������ #��� #��A,��� ��5������5�������������,���� ����� ��5�!>('�&�(!=�
����,���������� ����.������ #�"�!��,���� �����,��#@�� ���#���� ��5�!>('�
&�(!=����6��,���!��,������� ���@���5������ �������������� �5���� ��@������� ����
����"��
�
-� !���������� ����������. /��������,�������
&��-� �?@��������������,���� ����� �� �&>!7"�!�����������5��������������&>!7�
���,���� ��������67&9�&��-� �?@�����������,���� ������������������<�@�5�����
� #�5������� �&>!7E��,��5���� ��"����5���� �����������5��@9���,����@�� #�� ���
�� �� ������#������������B!4�7�������� #���������������#��@����B!4�7�,��5����
� ���,�� "�7�����55���� �@���������,�����5���� ���� ���,��5���� ���,�� ���5����
B���6�����"�7���#� ���� ����#������������B���6������������%4#�����@�� #�B� � �
�����$��<� ��?��,�� #�&���������7���#� ���� �?��,)"��
�
4���#���6�6��������9�&>!7������������������� ���� ��� �����������5�����5��@9���,���
��@�� #�������55���� �@"�; ����� ���� �� ����,��5���� �������9�&>!7���,����#�
�����,���� ����� ��5�B����=����!���,����%B=!&)�����5��&��������9������ �
����������������<��,�� ����������5�%����)�#�����������"�; ����5������� ��
� �@���H��5����5��������#����#������������� ������5�����,�� � �"�&>!7����
���<� ��� ���,�����������������A�� #������� ��,��������.����!��� ���"�(�@����������
#������ ����������B6�%+������)�� #����.��#���6�����"�&>!7E����,�5���������
�����5�� ��9�+�&9�=@� �!��9�4������!����@��� #�4���� �!��"�&��'��������
���#���<�����< ��������?!���� #�"�&��+�������,�������������� ���A����5������
��������������������������� �@������� ���� #�/H��5�&>!7E������55��"���������
,����#������ 5������� ���G����#��@�&�"�'�������"��
�
(����5����&��-� �?@�������A,��� �����&>!7�� ������ ��,�� "�&� @��5�����
������,������ ��� ������ ��"�!� ������������� ������ ��@��������,�����#�
�������������6.!�� #��������#�� ������ �B!4�7��,���5������ �"�(���� ������
����������� �#������@"�'����� ������ �����������������������#��@�I.����� ������ �
7� ��������$��<� ��������� ��%7$�)J9�I!(B7&F!6&�� � ���� ��������I�� #�
I6�6!=�7��,��� ��!(&J"�(��5���������,��8�����������,����@�� � ���� ��,���
8����9������������������@���������� ��,��,������ �� #���,���� ����� ��5�6�6!=�
#�����������"��
�
6��55������� �������������@�� ����5�������5��� ���,����#�������������5��������� ���5�
�������55����� ��������55"�6,,�������55����@������� ��� ��������"�!��5�������� �����
������55���� �@�������9���������� ��������������������5��� ���,����#����������"�
; ���������������#���� ��5���"0H����5������ ���������� ����������� �#������
���,����#����0�����"�
�
&��4�������������#���,,�� ��#�� �&>!7E���,��5���� ��"�(��5������,���� ��#�����
��#����������� ��5�,��5���� �����,������@����������#����������55���� �@"�!�������

�
����� ������ ��� ���� ������ �/�
�
����� � ���#���� ����� ����������������55���� �@"�(�������� ��,������������
��,����@9�@���&>!7���������� ����� ���������������� ������� �������� ��@����"��
�
&��-� �?@��������,���������&>!7�,��5���� ��� ��#���������������#�� ��������
�����@�� #����#� ���������<� �#�� �,���6����"���� ��=��9�&>!7��� ��������
��������@�������.������ #��������������������������5���&>!7�� ������������
�,��������� ������#��@���H����,���#��������"�(��������� �@�#���� ��@�
�� ����� ������������� ��<�@�� #�#�55��� ����� ����6���5������55���5���������5���
�����5����B���6�����"�(������������������� ��@�&>!7����#���<�����������
���#�#����� ��!.6�"�;�����&>!7E��������� ������ �����������55���� ����������55���
�������@����&>!7��� ����� ����#�55��� ����������� #���8��������� ������5����
���� �������,���������������� �"�(����������,������5���&>!7���������,�������"���
�
0� !����������)1�������,���������
&�"�$����� <���������,���� ����� �� ����.6!����������"�; ����,������������ ��
&��$����� <�� 5����#�������������.6!��������<� ��� ���5�A�#�,�������#��"�(���
������ ���,���� ��#�� ������%.6!�������������"��&)"�(��.6!������5������,����#�
��������������K��92&�,���� �9� ���� ��#� ��!(7'����� �� ��� #�6�=!��������
����"�(�����������@����#������������ �������� �������� ��@����"�
&�"��� �#���$���� ���������������A,�� ���� ��5����� #������������� ������L�
�����"�(��#�5� ��������� ������L���������������#�������#���� #�!,�������"����
�
2��������������������#�����������������
&�"�-� �#���$���� ��� ��������������@��5���� ���� ���,��5���� �����������
������5����� �������55���� �@"�(��6����5�����#���������������� �������������
��#�5���!�����#���B;="�(��55������<����� �@��,,������������-.��� ����5�������5���
� ���,����#"�4���&>!7�� #��-.�����������������#�,��G��@���,������ ����5�����
��5��� ���,����#�� ���#�������������5����5������� ��� ����5� � ���������������
����#����������55���� #���������<�"�B� � ������ �� ����������� �������,,�������"�> ����
��*� ��@���������������� #����55������<������ �������,,������������������� ���
����� ��C� �"�' �����������5�������� ��5�����9�������������,#���#�5������
� #�67&9��������#���� ���������M�0"�H�,���� �9��A��,��5�������"��
�
&��4����������� #����������������5����������#���,,�� �� ��� #���� � ��� ��
�� �� 5����� ������<� �� ������� �"�&��-� �#���$���� �� #������������-.�����
�����#@���<� ������ ������������ ��� �� ����������� #����,������,���� ��#����
������ ��#�,�����"���
�
&��-� �#���$���� ��� ��A,��� ������#����� ��� ����� ��� #���,���� ��� ����
5�������5��� ���,����#"���,� #� ��� ����<,�F,�������,���� ������������� ���@����
� ���G������@�����"��
�
&���� �#���$�@#� ��� #�����5�&��-� �#���$���� ����#������� ��A��,����5���
������������� "�&��-� �#���$���� ��A,��� �������5�5����A��,��9������,����@�����
������� ������9��-.��� #����&� ����@��5�;�� �&������#������������,����@�� ������
� ������������ ������<� "��
�
3�������������./����4��������
�' �����5��5������,���� ���������5���������� #�������� ������ ��&�"�'E(�����
�� �������� <��������&� ����@9��������!.6���� #����.6!�5����������� ���
� #����� 5������� �,����#�#"��
�
• �������9���������� ����55���� ����������#���������� 5������� �� �#�,�"�
• ;�����#���,,�� �� ���������,���� ����� ��������#�� ����.��������������
�
����� ��/��� ��� ���� ��/��� �/�
�
5�����"��• (�������������������,��5���� ��������9�����������@�#���,,�� ��#�����
����>���#�������������������������#�#�� ��@������8���&6"��
• (��5�����5�,��5���� ������#����� �������55���� �@�� #���,����@�
• !���������5��0"�H�,���� ���� ��� 5����� ������ �#����55���������� ��������
��<���������@��������� ����������"�6����@��A,�����������&6������������������
����������"��
• &����� 5������� ������G���#�� �� ������ ��,�� �"�B��������5����� ������ ��
,�� ��������#�������� �5���� ��@�������#�������������"�!����������� �6�������� #�
; ������ ����� �#������� �����������5������ ������ �9�� �������@������ �
������ ����� ��������������������������� #������,��� ��������� ��#���#�� #�
��8����#�� #��@"��
• (������� ��8���5������ �5���������#� ��,��5��G��@���,�����,��#�5����@�����
������� ��#��� ��������<��5������������������� #����5��������������55������<�
5����-.��� #�&>!7����� �@�������#"��A���� ���� ��������� ����������55���� �"�
• &>!7������������ �5���5����������#� ���@���,����� ����������,���"�
�
&��4����������� #���������������� ��������5��#��������,��,���#��������"�!�,����
#������5����� ��#�#9�@����-.��� #�&>!7�#�� ���������������������� �� �������
��� ����������"�����@�� �����#����5����#�� �,��5���� �������� ���������"�
!���� ��� ��#�,��5���� �����,������ ��9�������������� �5�������� ������ ������#�
� #������ �����,������ �������� ��@����"��
�
&��+���������,,�������������<����#���@�&��'E(����"�����##������6������� #�
!.6����������@��,,��������5����,��5���� ������������� ����,�� ������9����
����������@���������� ������ ��� �����������"�;������� �,�������#������� ��
�����<F�����9��������� �� ��,,��� ��@"�6���������#����������������,��5����
� ������������� ����� ������ ����� ������������������� ��� �� ��� #������
������55�������!.6��"��
�
&����� ����,�������������������@��A,�����������.������ #���������@����#������
������� ���#��������������G����������������������5����,��5���� ���,�� "�(��
�����<�����������#�����G��@���,���������������<� �� ������� ��5������ �A��67&"�
;������� ��#�#�����+.&;�#���� ��� ���������@����#����� #����� #�67&�� �&�@�
���"����
�
�
�
�
�
�
�
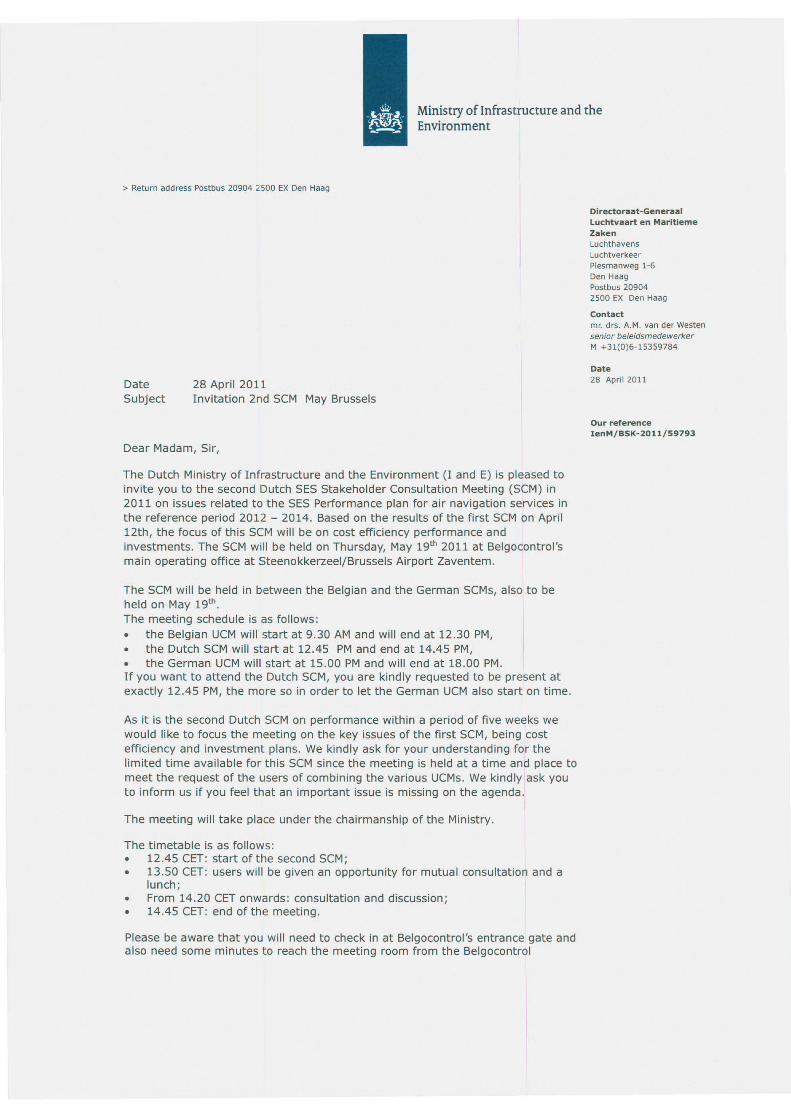
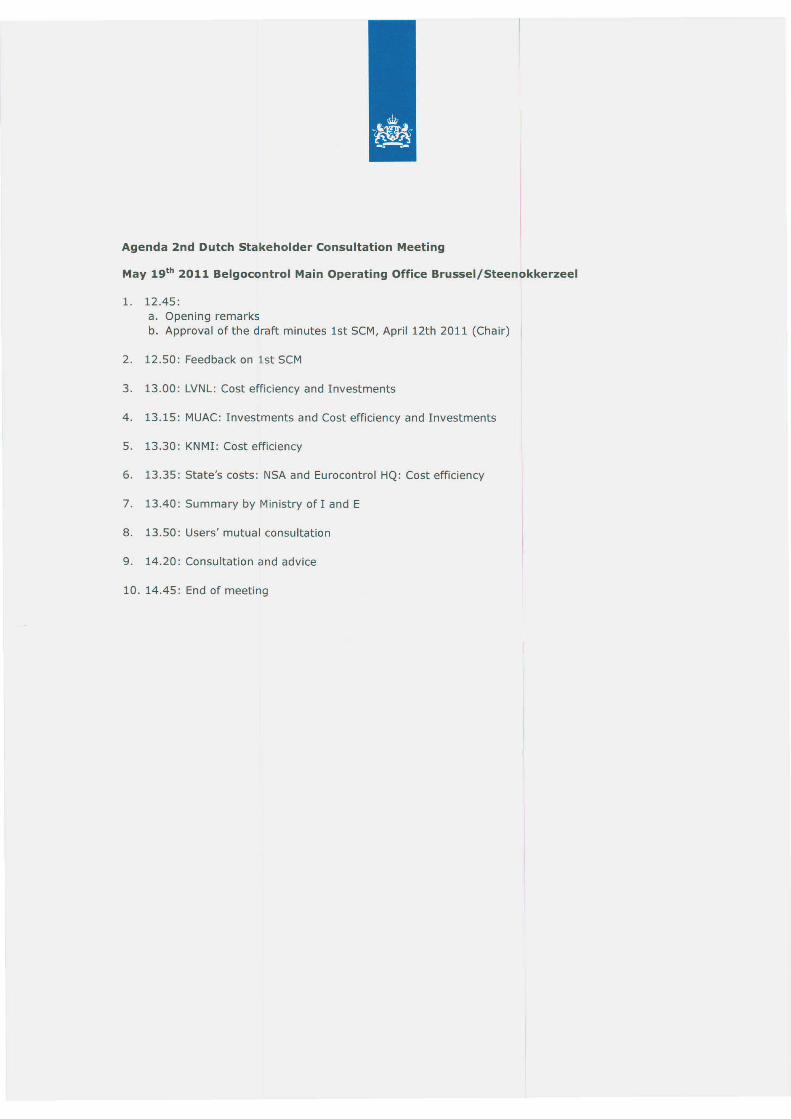
����������
����
�� �������
�� �������
�������� ��������������������������
���������
�������������������
�� �!�� "�
�#� $� ���
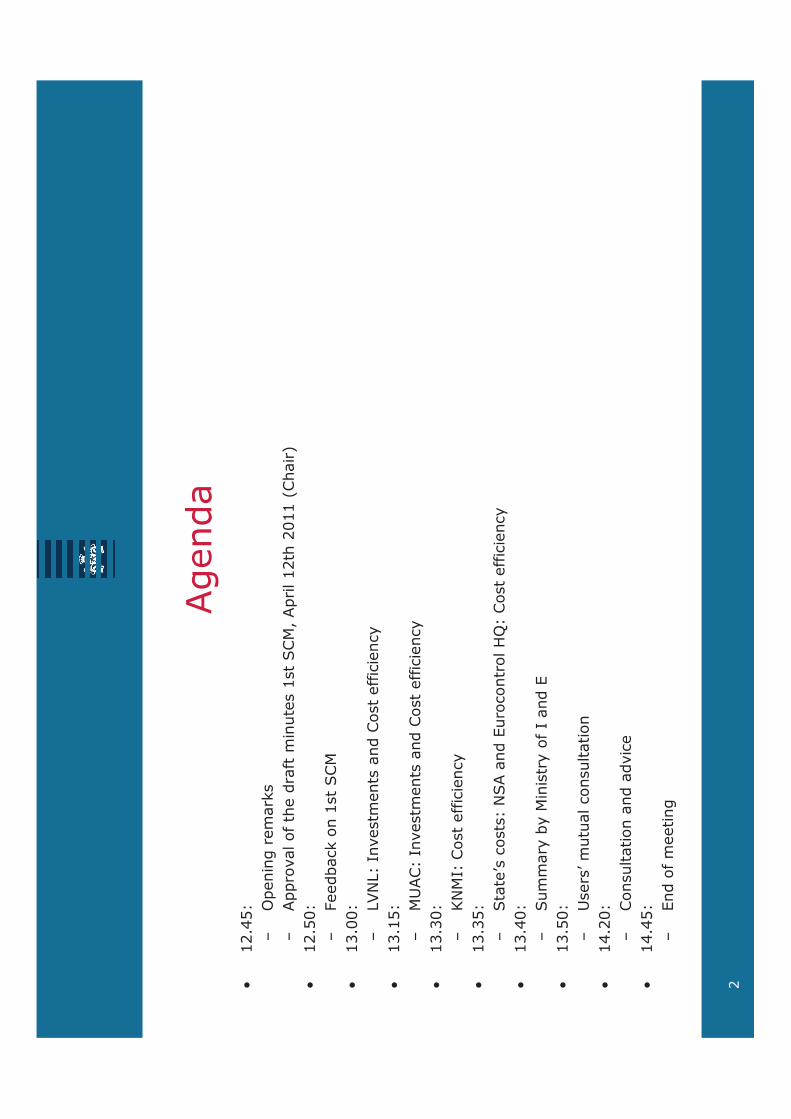
������
% �&"'(��
)*������������
)�����+����� ������������ ������,������� �� ��� �-� ��.�
% �&'�(�
)����/����� �������
% 0&��(�
)12�1(���+���
��������������������#
% 0& '(�
% 0& '(�
)�3��(���+���
��������������������#
% 0&0�(�
)4���(��������������#�
% 0&0'(�
)����5������(��������������������67(��������������#�
% 0&"�(�
)���#
/#�������#���������
% 0&'�(
)3����5�����������������
% "&��(�
)���������������+���
% "&"'(�
)�������������
�
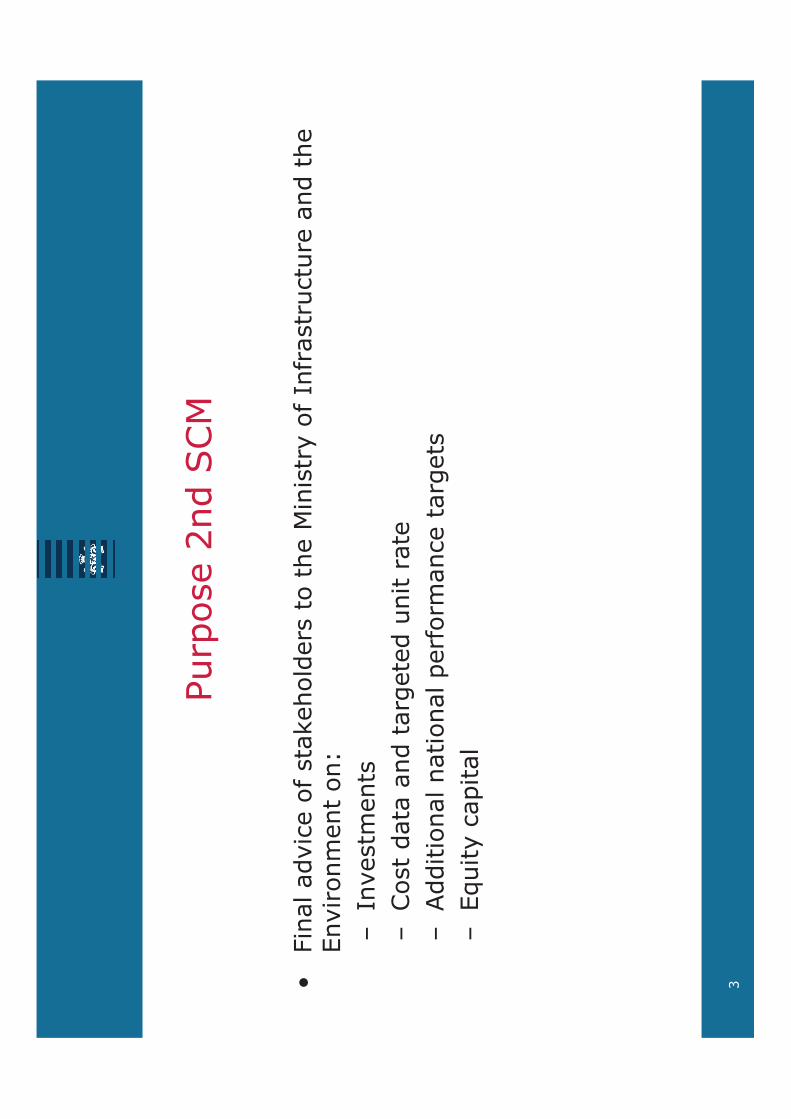
����������������
%������+����������� ����������� ���������#���������������������� ��
��+����������(�
)��+���
����
)����������������������������
)����������������������������
)�����������������������
�����������
)�8���#������
0
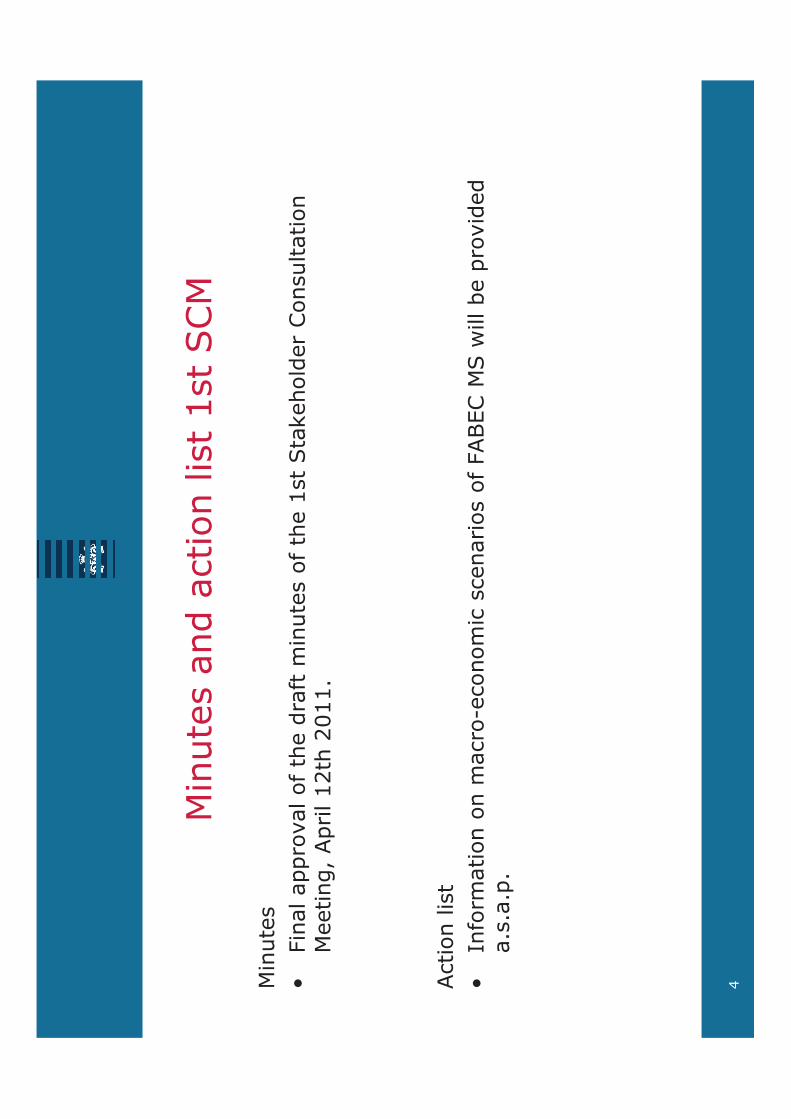
���������������������� ������
��������
%���������+������ �������
����������� �� ������� ������������������
�������,������� �� ��� &�
������������
%�����
��������
���!����������������������9������:����/�����+�����
&�&&�&�
"
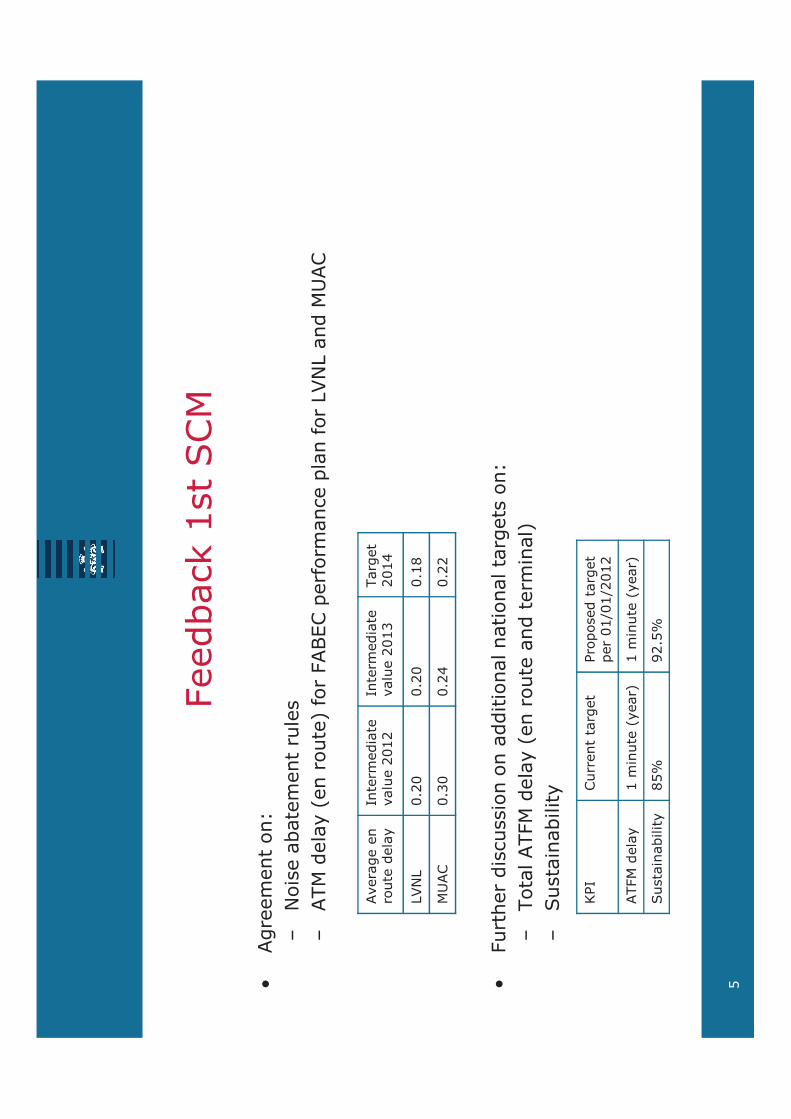
����/��� �������
%�����������(�
)������/������������
)�;�����#�-��������.�������9���������
������������12�1�����3���
�+��������
�����
���#
�����
�����
+����� ��
�����
������
+����� 0�
;�����
�� "�
%���� ������������������������������������������(�
);�����;������#�-���������������
���.�
)������/����#�
12�1�
�&���
�&��
�& <
�3���
�&0�
�&�"
�&��
4���
�������������
���������������
����� =� =�� �
�;������#
�
�����
-#��.�
�
�����
-#��.�
������/����#
<'>�
$�&'>
'
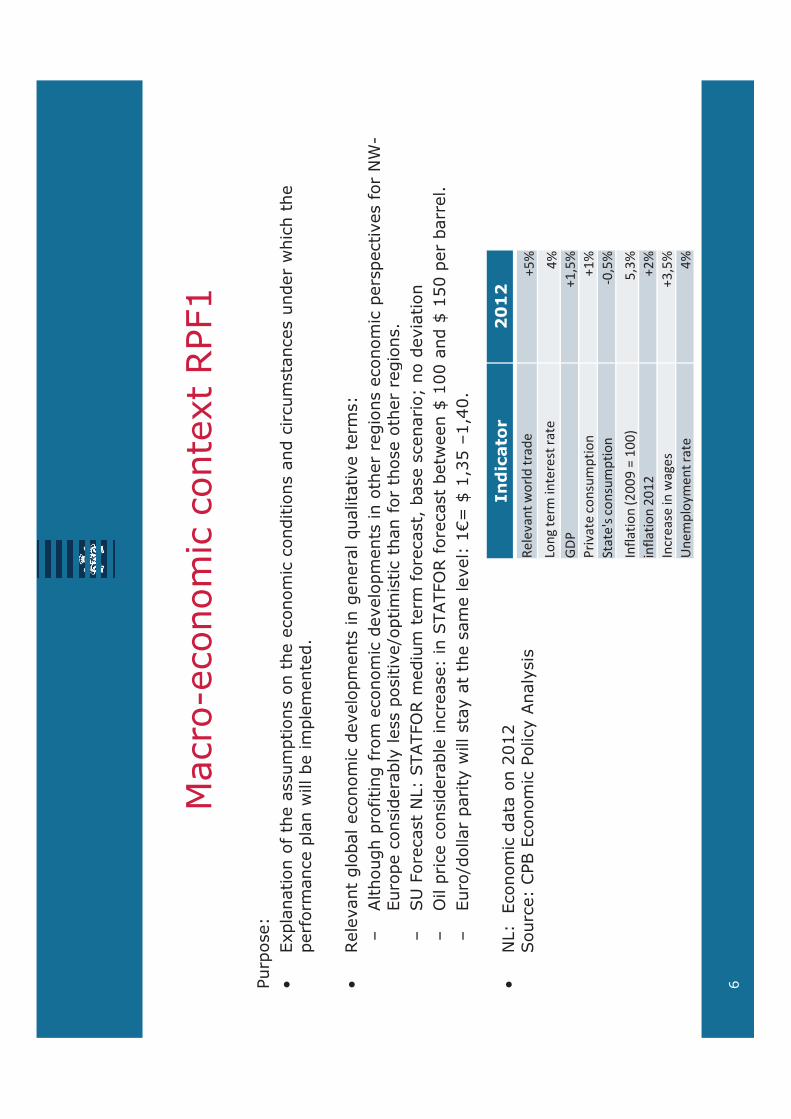
����!�������������?�����
�������(
%�?������������ ���������������� ������������������������������������������: �� �� ��
������
��������:����/�����������&
%����+������/������������+�������������������8������+�����
�(�
)��� ��� �������������������������+�������������� ����������������������������+��������@!
���������������/�#������������+�=����������� ������� ������ ����������&�
���������������/�#������������+�=����������� ������� ������ ����������&�
)�3����������1(��;�;�*��
��������
��������,�/����������A������+�����
)*�����������������/����������(�����;�;�*����������/��:����B� ������B� '������/����&
)����=����������#�:������#���� �������+��(� CD�B� ,0'�) ,"�&
%�1(���������������� �
������(���9�������������#���#���
E
��������
��
����
�����
���
�����
��
��������
�����
����
�����
��
��
� ���
�
�������
�����
�����
��
���
����
����
�����
!��
�
"�#������$%!!&�'
��!!(
��)
�
��#������%
!�%
%�
"���
����
���
����
)��
�
*���
��
+�
�����
����
12�1���+���
����
�������������������
F
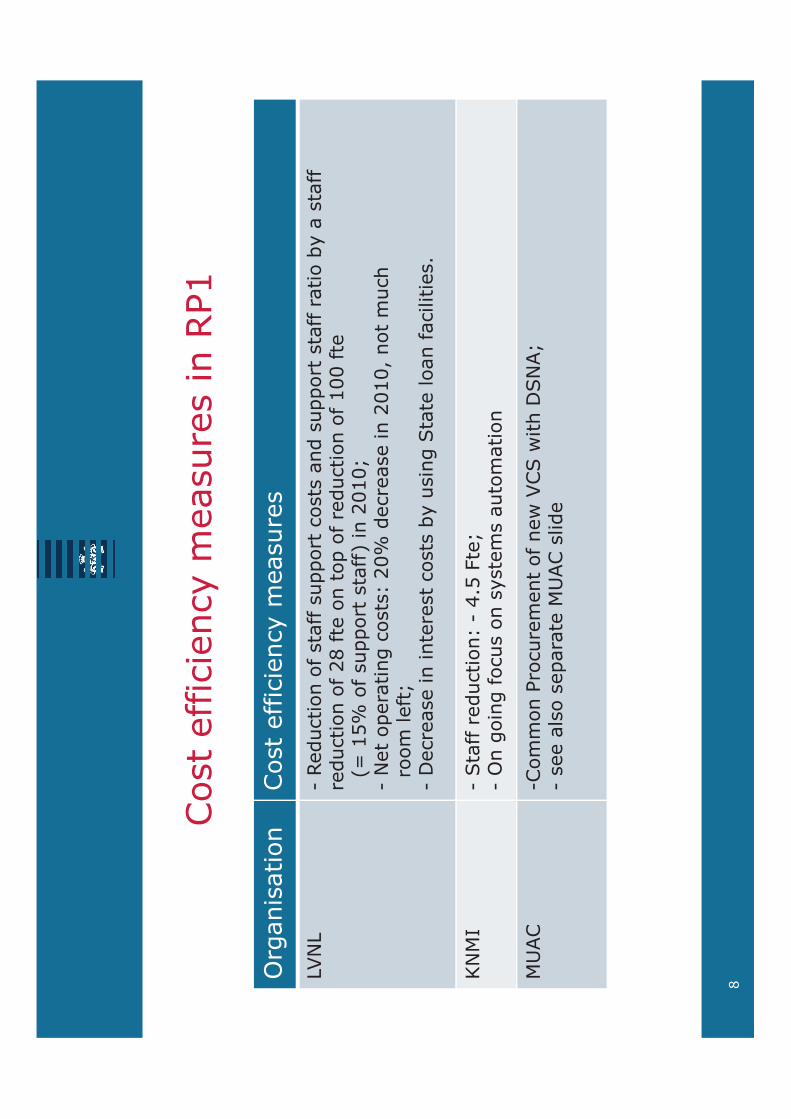
�������������#�
�����������
*���������
�������������#�
������
12�1
!�����������������������������������������������������/#�������
��������������<���������������������������� �������
-D� '>
���������������.������ �A�
!������������������(���>�������������� �,�������
��������A
��������A
!G�������������������������/#�������������������������&�
4���
!��������������(�!"&'����A�
!*������������������#������������
�3��
!�������������������:2���:�� G���A�
!��������������3��������
<
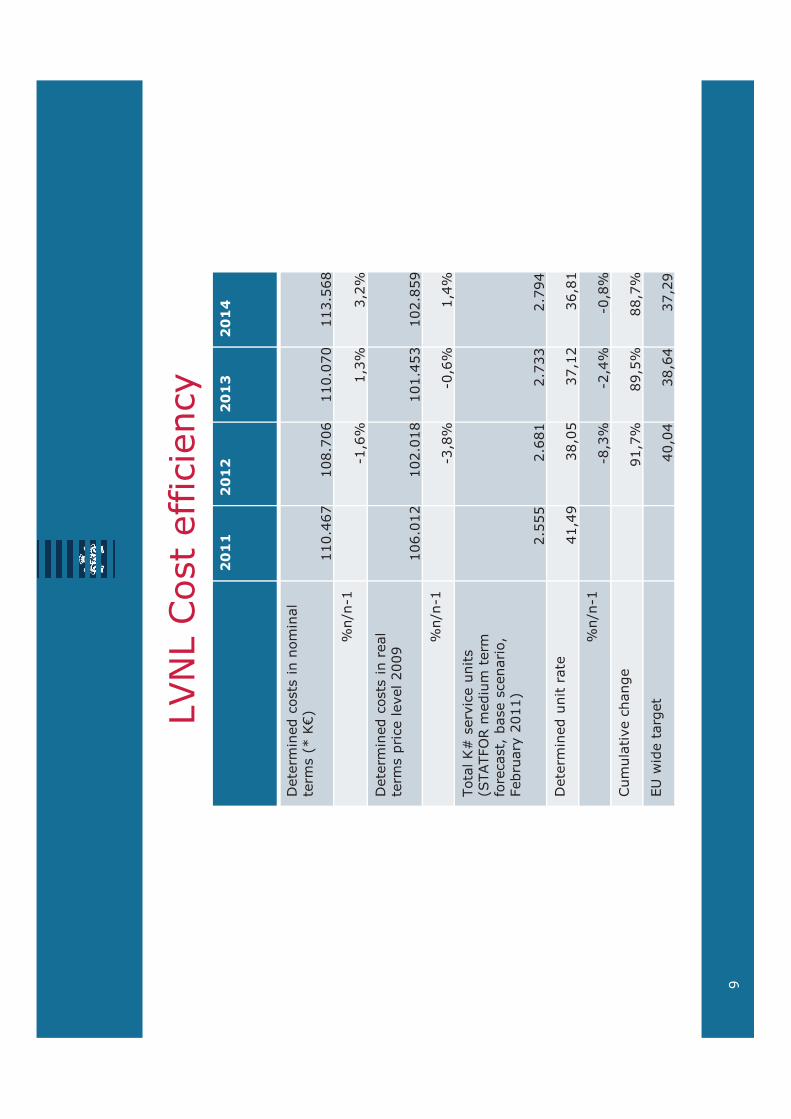
12�1���������������#
���
��
��
���
G����
��������������������
���
��-H�4C.
�&"EF�
�<&F�E�
�&�F��
0&'E<�
>�=�!
! ,E>
,0>
0,�>
G����
������������������
���
����������+������$
$
���
����������+������$
�E&� ��
��&� <�
� &"'0�
��&<'$�
>�=�!
!0,<>
!�,E>
,">
;����4I����+����������
-�;�;�*��
��������
��������,�/����������,�
��/���#��� .
�&'''�
�&E< �
�&F00�
�&F$"�
G����
�������������
" ,"$
0<,�'
0F, �
0E,<
>�=�!
!<,0>
!�,">
!�,<>
������+��� ���
$ ,F>
<$,'>
<<,F>
�3�:���������
"�,�"
0<,E"
0F,�$
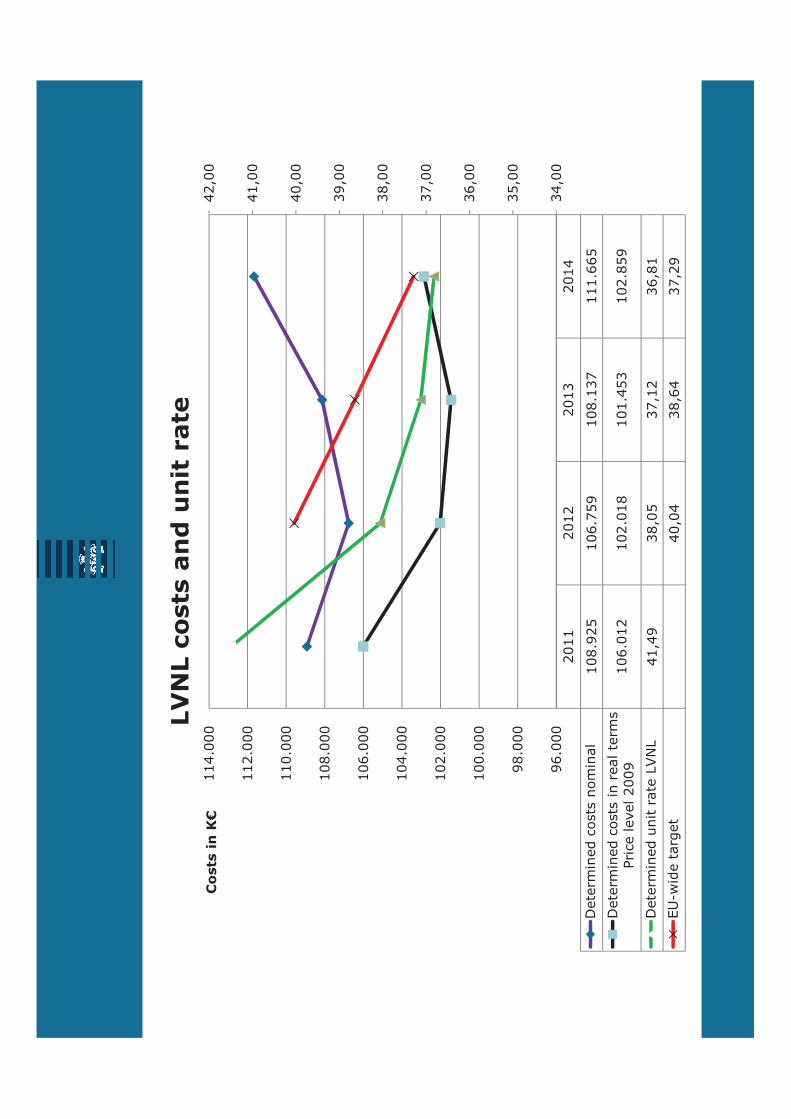
0<,��
0$,��
"�,��
" ,��
"�,��
�"&����
�E&����
�<&����
�&����
�&����
"&����
�����������
����������������������
��
�� �
�� 0
�� "
G����
����������������
�<&$�'�
�E&F'$�
�<& 0F�
&EE'�
G����
���������������������
��
��������+������$
�E&� ��
��&� <�
� &"'0�
��&<'$�
G����
��������������12�1
" ,"$
0<,�'
0F, �
0E,<
�3!:
���������
"�,�"
0<,E"
0F,�$
0",��
0',��
0E,��
0F,��
$E&����
$<&����
��&����
��&����
�"&����
�3�����+���
����
������������������
������������������
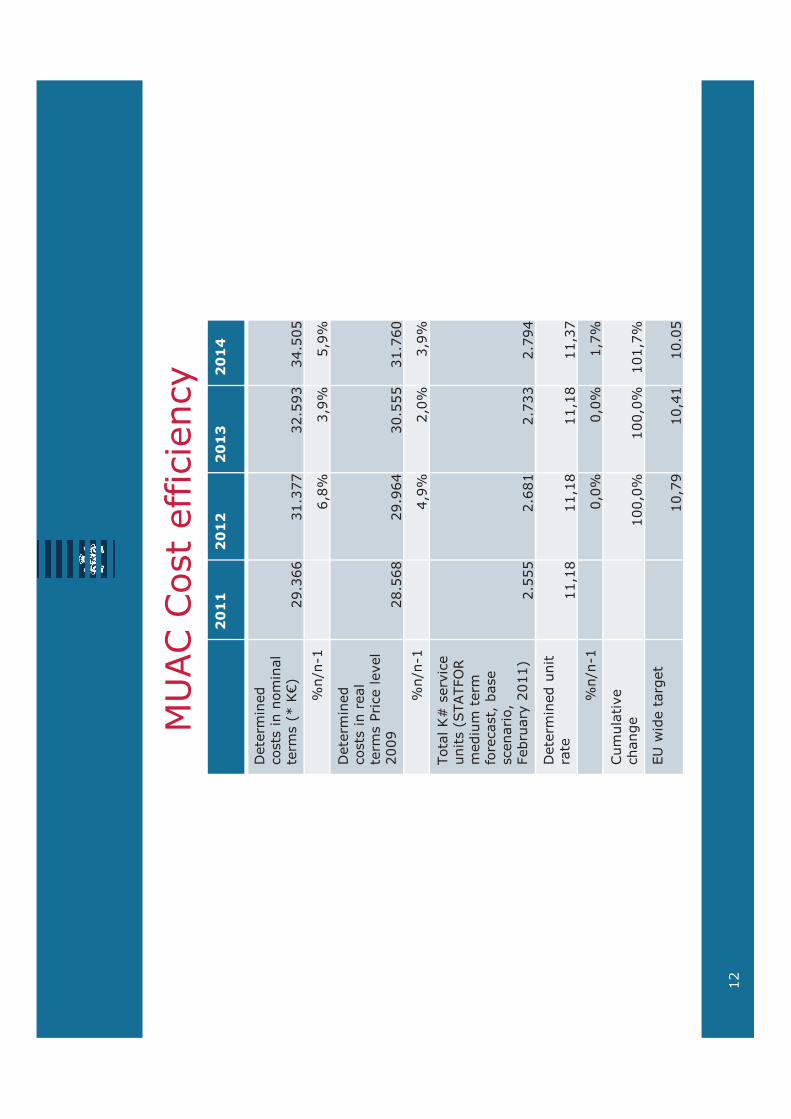
�3�����������������#
���
��
��
���
G����
�����
���������������
���
��-H�4C.
�$&0EE�
0 &0FF�
0�&'$0�
0"&'�'�
>�=�!
E,<>
0,$>
',$>
G����
�����
�������������
���
����������+���
���$
�<&'E<�
�$&$E"�
0�&'''�
0 &FE��
���$
�<&'E<�
�$&$E"�
0�&'''�
0 &FE��
>�=�!
",$>
�,�>
0,$>
;����4I����+����
������-�;�;�*��
��������
��������,�/���
�������,�
��/���#��� .
�&'''�
�&E< �
�&F00�
�&F$"�
G����
����������
���
, <
, <
, <
,0F
>�=�!
�,�>
�,�>
,F>
������+��
� ���
��,�>
��,�>
� ,F>
�3�:���������
�,F$
�,"
�&�'
�
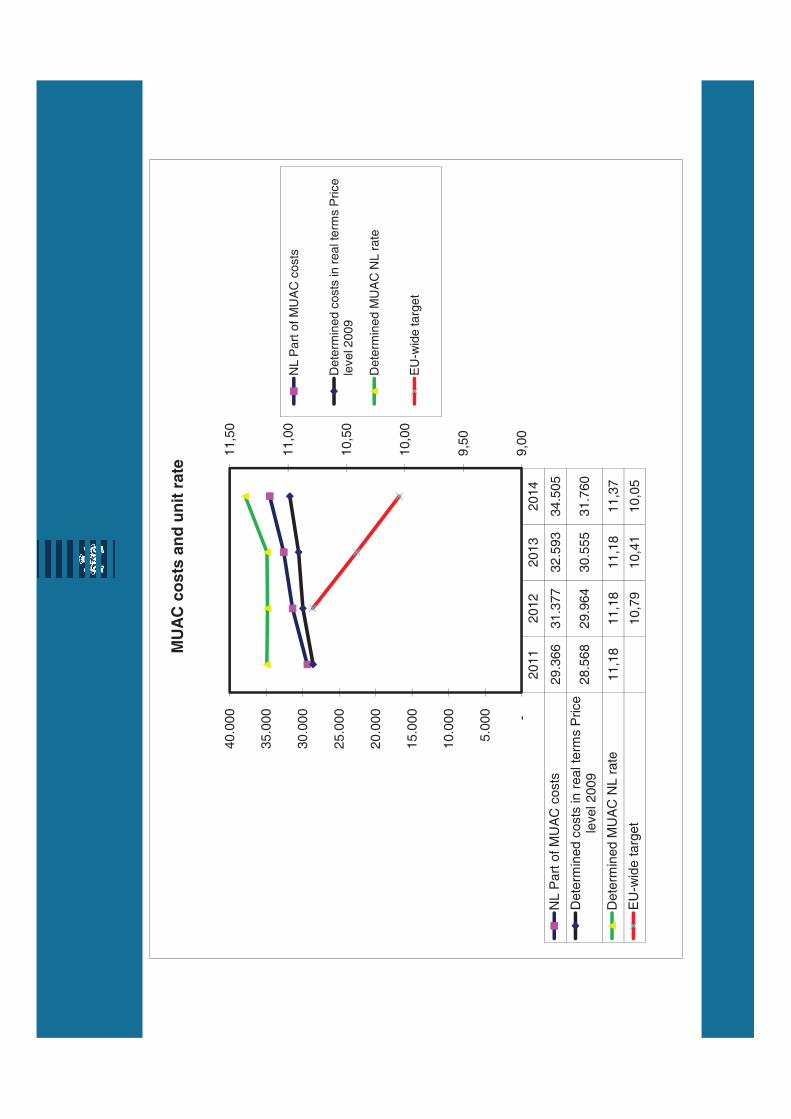
10,5
0
11,0
0
11,5
0
20.0
00
25.0
00
30.0
00
35.0
00
40.0
00
MU
AC
co
sts
an
d u
nit
ra
te
NL
Pa
rt o
f M
UA
C c
osts
De
term
ine
d c
osts
in
re
al te
rms P
rice
le
ve
l 20
09
De
term
ine
d M
UA
C N
L r
ate
2011
2012
2013
2014
NL P
art
of M
UA
C c
osts
29.3
66
31.3
77
32.5
93
34.5
05
Dete
rmin
ed c
osts
in r
eal te
rms P
rice
level 2009
28.5
68
29.9
64
30.5
55
31.7
60
Dete
rmin
ed M
UA
C N
L r
ate
11,1
811,1
811,1
811,3
7
EU
-wid
e t
arg
et
10,7
910,4
110,0
5
9,0
0
9,5
0
10,0
0
-
5.0
00
10.0
00
15.0
00
EU
-wid
e ta
rge
t
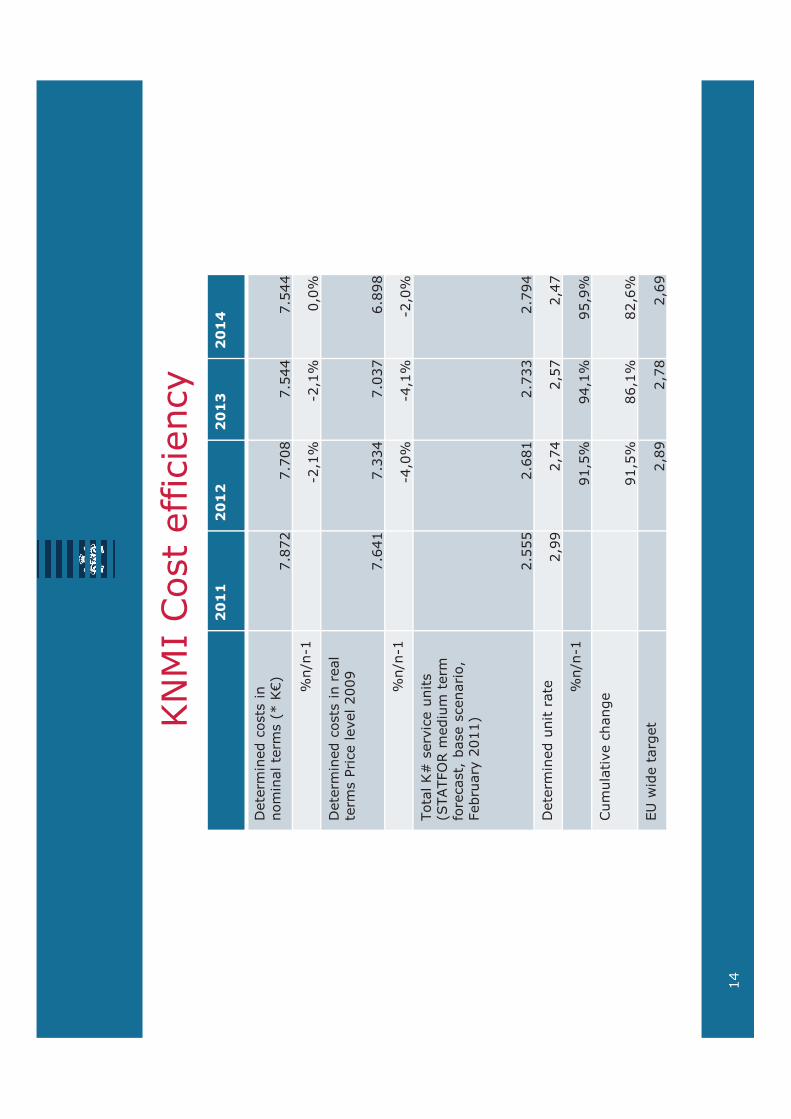
4������������������#
���
��
��
���
G����
��������������
���������
��-H�4C.
F&<F��
F&F�<�
F&'""�
F&'""�
>�=�!
!�, >
!�, >
�,�>
G����
������������������
���
����������+������$
F&E" �
F&00"�
F&�0F�
E&<$<�
>�=�!
>�=�!
!",�>
!", >
!�,�>
;����4I����+����������
-�;�;�*��
��������
��������,�/����������,�
��/���#��� .
�&'''�
�&E< �
�&F00�
�&F$"�
G����
�������������
�,$$
�,F"
�,'F
�,"F
>�=�!
$ ,'>
$", >
$',$>
������+��� ���
$ ,'>
<E, >
<�,E>
�3�:���������
�,<$
�,F<
�,E$
"
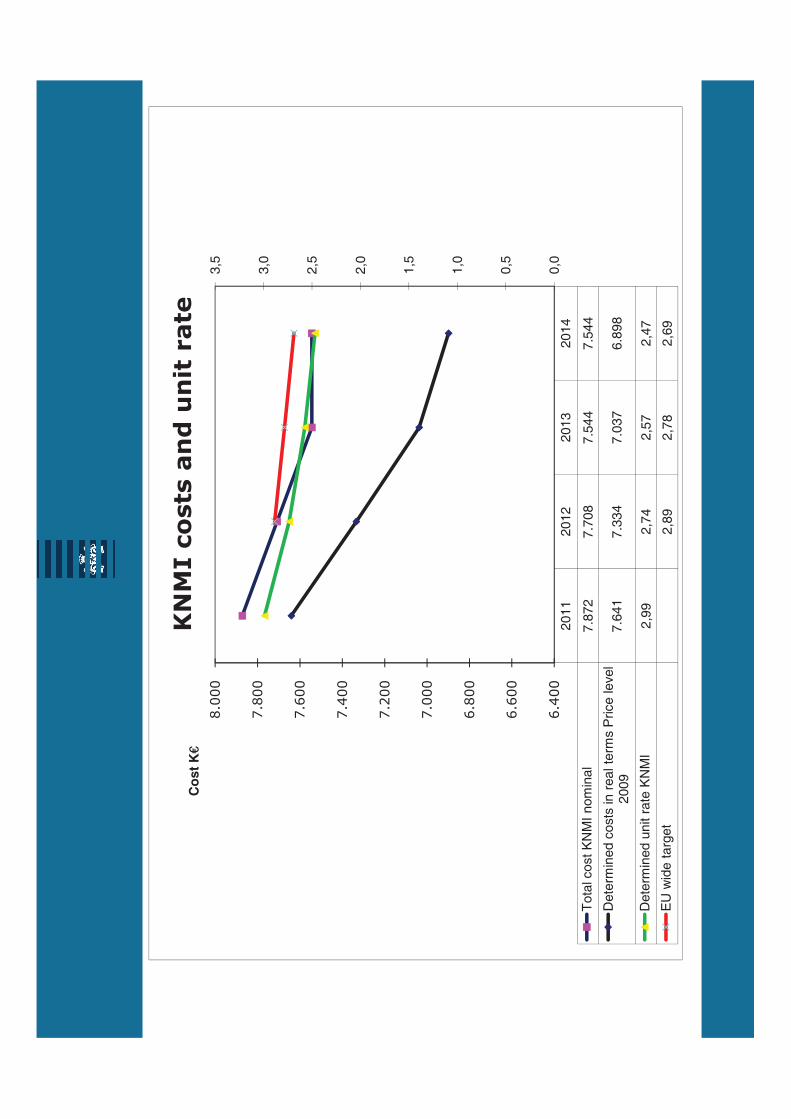
2,0
2,5
3,0
3,5
F&����
F&"���
F&E���
F&<���
<&����
Co
st
K€
����������������������
2011
2012
2013
2014
Tota
l cost K
NM
I nom
inal
7.8
72
7.7
08
7.5
44
7.5
44
Dete
rmin
ed c
osts
in r
eal te
rms P
rice level
2009
7.6
41
7.3
34
7.0
37
6.8
98
Dete
rmin
ed u
nit r
ate
KN
MI
2,9
92,7
42,5
72,4
7
EU
wid
e t
arg
et
2,8
92,7
82,6
9
0,0
0,5
1,0
1,5
E&"���
E&E���
E&<���
F&����
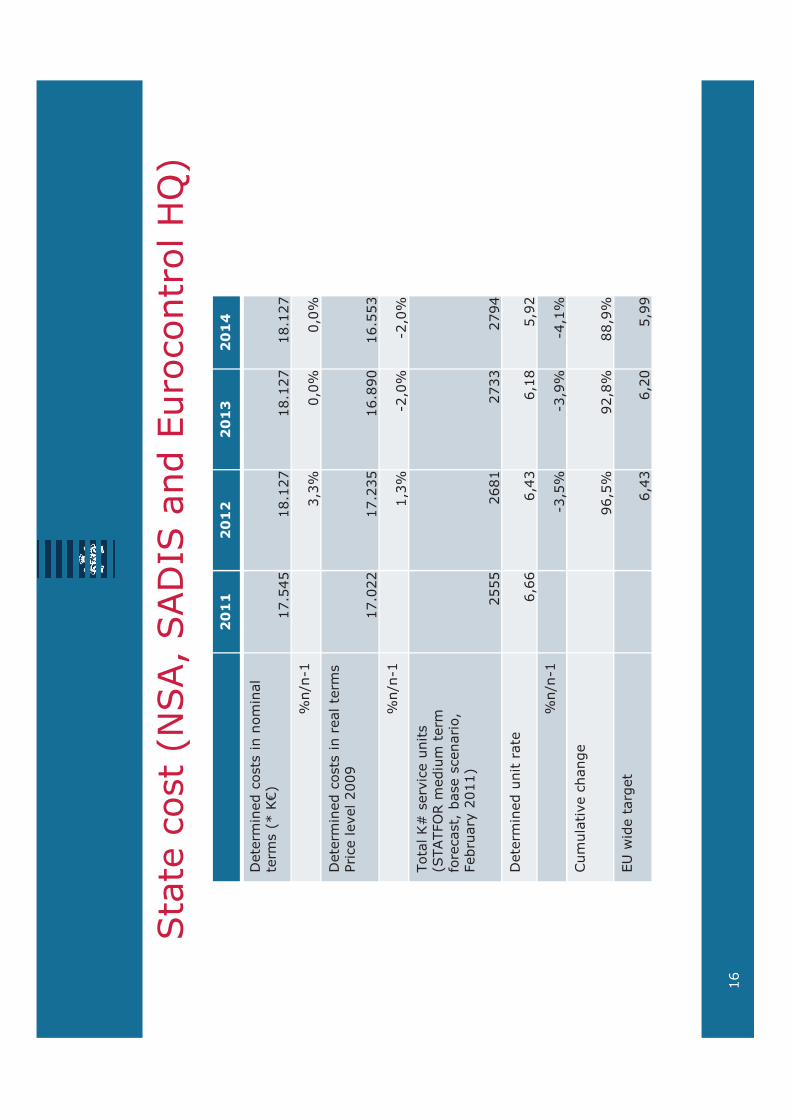
����������-���,���G������������������67.
���
��
��
���
G����
��������������������
���
��-H�4C.
F&'"'�
<& �F�
<& �F�
<& �F�
>�=�!
0,0>
�,�>
�,�>
G����
���������������������
��
��������+������$
F&����
F&�0'�
E&<$��
E&''0�
>�=�!
,0>
!�,�>
!�,�>
>�=�!
,0>
!�,�>
!�,�>
;����4I����+����������
-�;�;�*��
��������
��������,�/����������,�
��/���#��� .
�'''
�E<
�F00
�F$"
G����
�������������
E,EE�
E,"0�
E, <�
',$��
>�=�!
!0,'>
!0,$>
!", >
������+��� ���
$E,'>
$�,<>
<<,$>
�3�:���������
E,"0�
E,���
',$$�
E
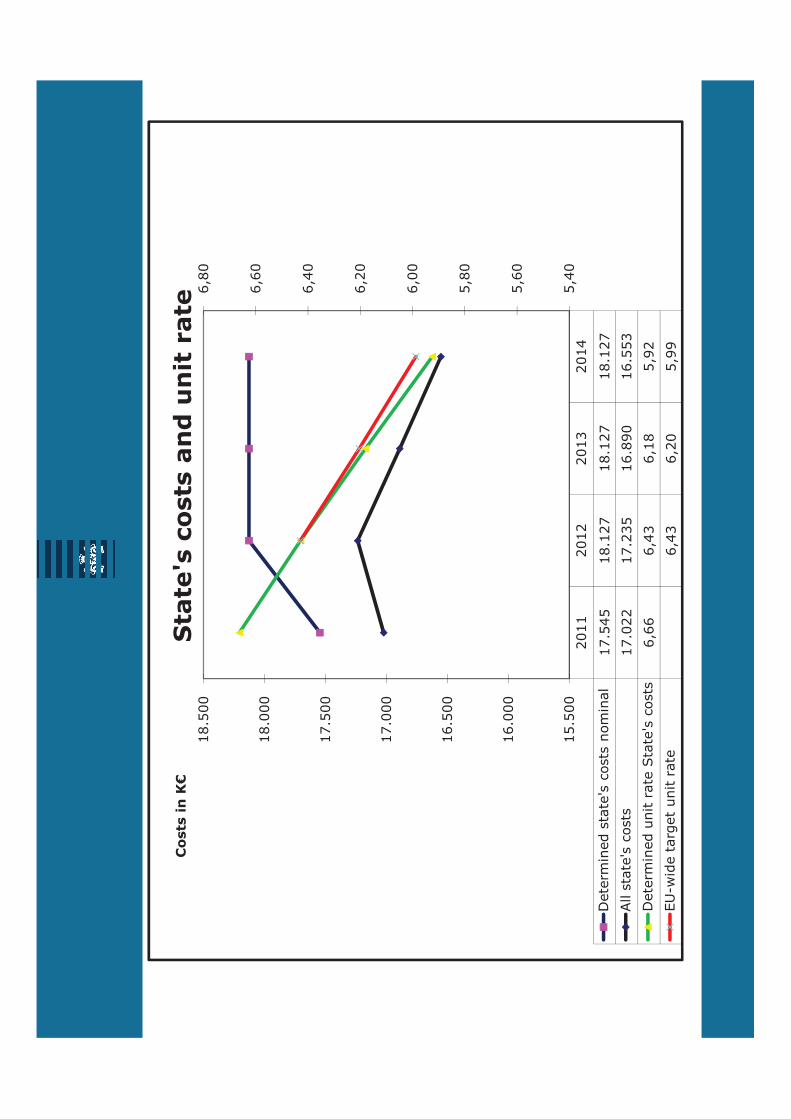
E,���
E,"��
E,E��
E,<��
F&����
F&'���
<&����
<&'���
����������
��������������������������
��
�� �
�� 0
�� "
G����
���������J�������������
F&'"'�
<& �F�
<& �F�
<& �F�
��������J��������
F&����
F&�0'�
E&<$��
E&''0�
G����
������������������J�������
E,EE�
E,"0�
E, <�
',$��
�3!:
������������������
E,"0�
E,���
',$$�
',"��
',E��
',<��
E,���
'&'���
E&����
E&'���
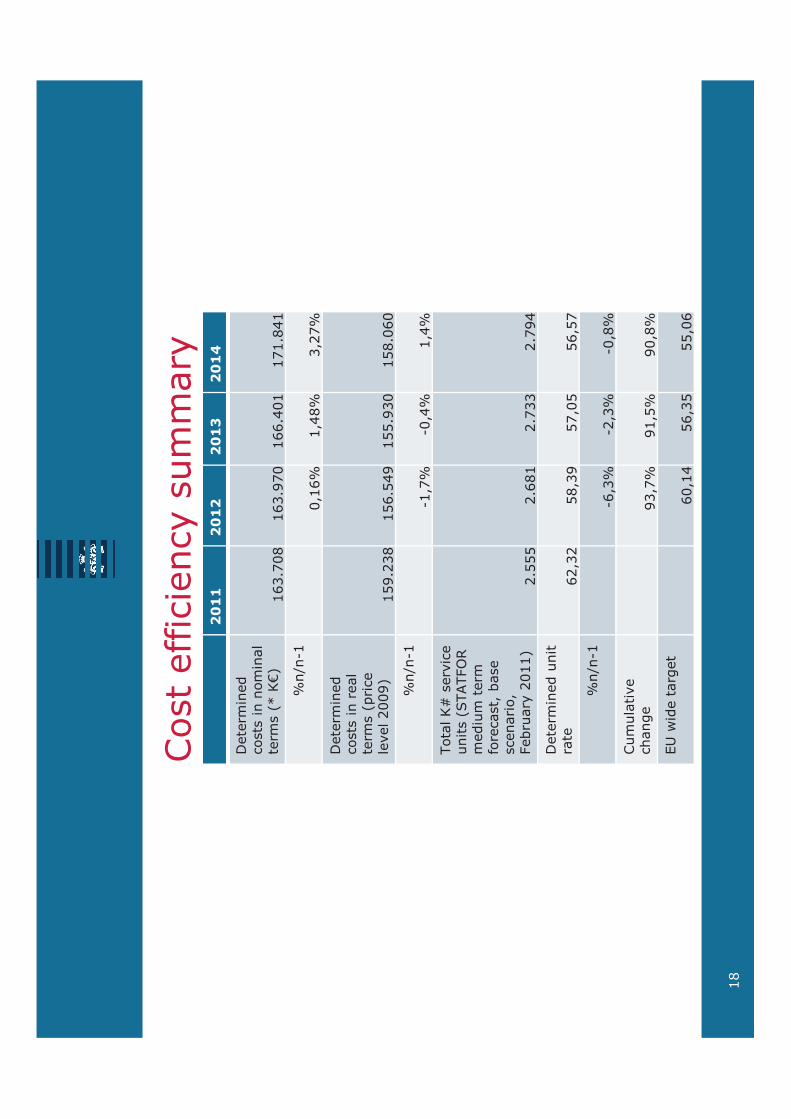
�������������#����#
���
��
��
���
G����
�����
���������������
���
��-H�4C.
E0&F�<�
E0&$F��
EE&"� �
F &<" �
>�=�!
�, E>
,"<>
0,�F>
G����
�����
�������������
���
��-������
��+������$.
'$&�0<�
'E&'"$�
''&$0��
'<&�E��
<
>�=�!
! ,F>
!�,">
,">
;����4I����+����
������-�;�;�*��
��������
��������,�/���
�������,�
��/���#��� .
�&'''�
�&E< �
�&F00�
�&F$"�
G����
����������
���
E�,0�
'<,0$
'F,�'
'E,'F
>�=�!
!E,0>
!�,0>
!�,<>
������+��
� ���
$0,F>
$ ,'>
$�,<>
�3�:���������
E�, "
'E,0'
'',�E

58,0
0
59,0
0
60,0
0
61,0
0
62,0
0
63,0
0
160.0
00
165.0
00
170.0
00
175.0
00
����������
��������������������������
2011
2012
2013
2014
Dete
rmin
ed c
osts
nom
inal
163.7
08
163.9
70
166.4
01
171.8
41
Dete
rmin
ed c
osts
in r
eal te
rms P
rice
level 2009
159.2
38
156.5
49
155.9
30
158.0
60
Dete
rmin
ed u
nit r
ate
FIR
Am
ste
rdam
62,3
258,3
957,0
556,5
7
EU
-wid
e t
arg
et
60,1
458,0
456,0
1
52,0
0
53,0
0
54,0
0
55,0
0
56,0
0
57,0
0
145.0
00
150.0
00
155.0
00
160.0
00
�8���#�����12�1
%@�� �� ������������������ ��������
������ �������������?�����������/�����������
�����������������������-����������������� (���!���������#.
%����������
����������������������������#����/�����������������������-�3�����������-�3�
���������� $F=�� �.(���������#�����8���#��������������
���������
���������������.
%9��������������(�
)��������������������������12�1���� ����������� ������������������
)���������������������/�������12�1�������������������������������������
%G����������/��:�����������#��K�����12�1���������������#��� ,������������������(
)����������������������� ������ ������������������
������������� �� ,���
)��8���������������8���#�������������
)��� ����������������8���#������
��

@����
%��+���
����
)�������������������
)1����������������������� ,�/�������������������������
%��������������#(
)�3������: ����������/����������������#�����3):������������������#������,�
�/������������� "A
�/������������� "A
)� ��������1��3��5�������� �������#��-�������.��������+������������
�1�������/������������������������ �
)G������12�15�����$���������������
��������������������������+��
)������������3!:���������
%�8���#������(
)����������#�
)G�������������/�������������
�
������
� ��!����"���
12�1
! ,0>
4���
! F&">
�3��
L &F>
����5������
! & >
;���
!$&�>
�3!:���
! �& >

Sta
keh
old
er C
on
su
ltati
on
Meeti
ng
LV
NL p
resen
tati
on
May 1
9th
, 2
01
1

Conte
nt
•Follow
up c
onsultation A
pril 12
th,
2011
•In
vestm
ent
pla
n 2
012 –
2016
•Perf
orm
ance
•Eff
ect
on s
afe
ty,
eff
icie
ncy a
nd e
nvironm
ent
perf
orm
ance
•Cost
eff
icie
ncy
•LVN
L b
udget
2012-2
016
•D
ete
rmin
ed c
osts
en-r
oute
Pre
senta
tion o
f Apri
l 12th
, 2011
Follow
up c
onsultation A
pril 12
th,
2011
•U
pdate
of
financia
l figure
s is r
equired
•Cla
rify
perf
orm
ance e
ffect
of
investm
ent
pla
n
•ATFM
dela
y a
nd s
usta
inability t
arg
ets
not
am
bitio
us e
nough (
KLM
)
•Rem
ark
ACE r
eport
2010:
•in
vestm
ents
are
very
hig
h c
onsid
eri
ng t
he fact
that
no p
roble
ms a
re f
ore
seen f
or
capacity
•ATCO
cost
incre
ased 4
4%
betw
een 2
005-2
010,
yet
pro
ductivity h
as o
nly
incre
ased b
y 8
%
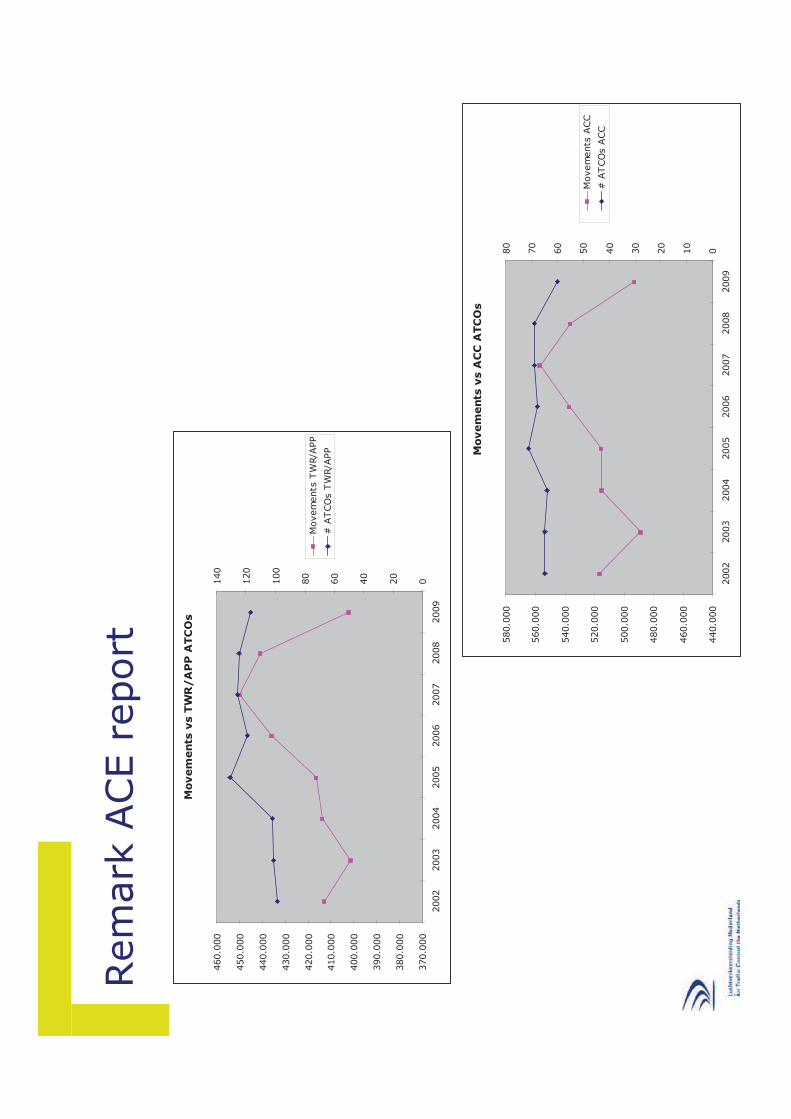
Rem
ark
ACE r
eport
Movem
ents
vs
TW
R/A
PP
ATC
Os
370.0
00
380.0
00
390.0
00
400.0
00
410.0
00
420.0
00
430.0
00
440.0
00
450.0
00
460.0
00
2002
2003
2004
2005
2006
2007
2008
2009
020
40
60
80
100
120
140
Movem
ents
TW
R/A
PP
# A
TCO
sTW
R/A
PP M
ovem
ents
vs A
CC
ATC
Os
440.0
00
460.0
00
480.0
00
500.0
00
520.0
00
540.0
00
560.0
00
580.0
00
2002
2003
2004
2005
2006
2007
2008
2009
010
20
30
40
50
60
70
80
Movem
ents
ACC
# A
TCO
s A
CC
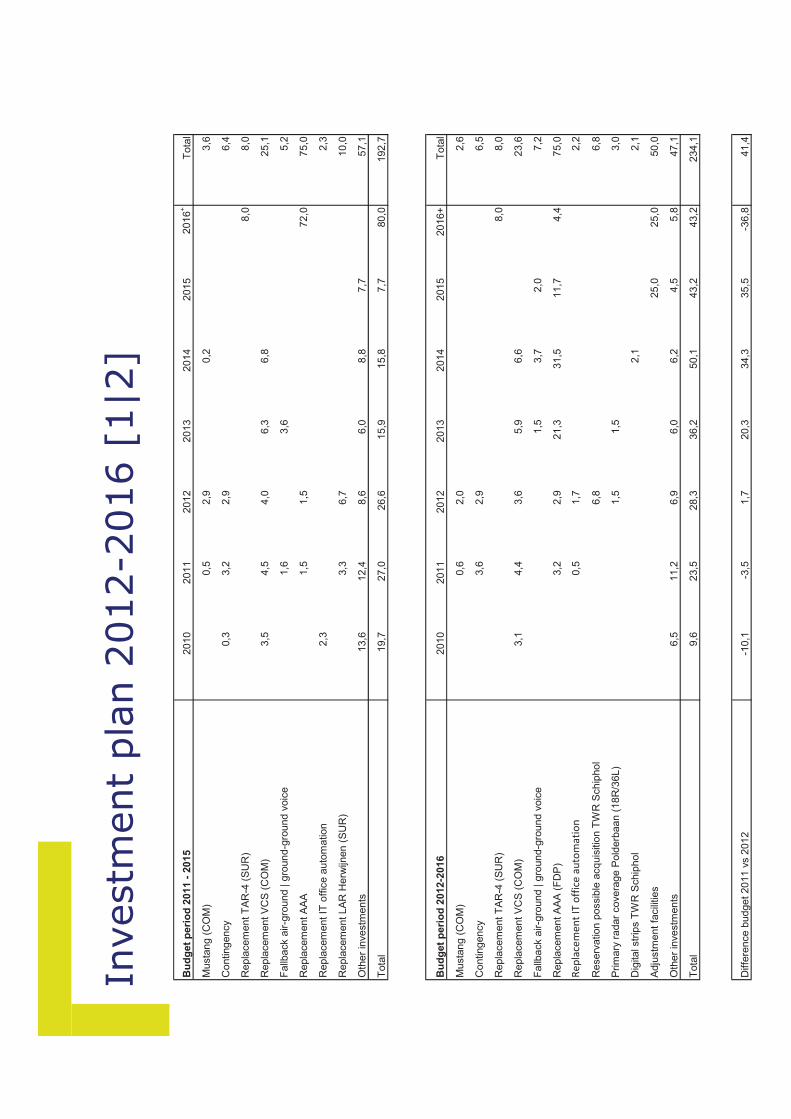
Investm
ent
pla
n 2
012-2
016 [
1|2
]
Bu
dg
et
peri
od
2011 -
2015
2010
2011
2012
2013
2014
2015
2016
+T
ota
l
Musta
ng (
CO
M)
0,5
2,9
0,2
3,6
Contingency
0,3
3,2
2,9
6,4
Repla
cem
ent T
AR
-4 (
SU
R)
8,0
8,0
Repla
cem
ent V
CS
(C
OM
)3,5
4,5
4,0
6,3
6,8
25,1
Fallb
ack a
ir-g
round | g
round-g
round v
oic
e1,6
3,6
5,2
Repla
cem
ent A
AA
1,5
1,5
72,0
75,0
Repla
cem
ent IT
off
ice a
uto
mation
2,3
2,3
Repla
cem
ent LA
R H
erw
ijnen (
SU
R)
3,3
6,7
10,0
Oth
er
investm
en
ts13,6
12,4
8,6
6,0
8,8
7,7
57
,1
Tota
l19,7
27,0
26,6
15,9
15,8
7,7
80,0
192,7
Bu
dg
et
peri
od
2012-2
016
2010
2011
2012
2013
2014
2015
2016+
Tota
l
Musta
ng (
CO
M)
0,6
2,0
2,6
Contingency
3,6
2,9
6,5
Repla
cem
ent T
AR
-4 (
SU
R)
8,0
8,0
Repla
cem
ent V
CS
(C
OM
)3,1
4,4
3,6
5,9
6,6
23,6
Fallb
ack a
ir-g
round | g
round-g
round v
oic
e1
,53,7
2,0
7,2
Repla
cem
ent A
AA
(F
DP
)3,2
2,9
21,3
31,5
11,7
4,4
75,0
ReplacementITofficeautomation
0,5
1,7
2,2
Reserv
ation p
ossib
le a
cquis
itio
n T
WR
Schip
hol
6,8
6,8
Prim
ary
radar
covera
ge P
old
erb
aan (
18R
/36L)
1,5
1,5
3,0
Dig
ital str
ips T
WR
Schip
hol
2,1
2,1
Adju
stm
ent
facili
ties
25,0
25,0
50,0
Oth
er
inve
stm
en
ts6,5
11,2
6,9
6,0
6,2
4,5
5,8
47
,1
Tota
l9,6
23,5
28,3
36
,250
,143
,243
,2234,1
Diffe
rence b
udget 2011 v
s 2
012
-10,1
-3,5
1,7
20,3
34,3
35,5
-36,8
41,4
Investm
ent
pla
n 2
012-2
016 [
2|2
]Facts
heets
investm
ents
•M
usta
ng (
CO
M)
•Contingency (
fall b
ack f
acility A
PP a
nd A
CC)
•Repla
cem
ent
term
inal appro
ach r
adar
(SU
R)
•Repla
cem
ent
voic
e c
om
munic
ation s
yste
m (
CO
M)
•Fallback a
ir-g
round |
gro
und-g
round v
oic
e
•Repla
cem
ent
AAA (
FD
P)
•Repla
cem
ent
IT o
ffic
e a
uto
mation
•Reserv
ation p
ossib
le a
cquis
itio
n T
WR S
chip
hol
•Prim
ary
radar
covera
ge P
old
erb
aan
(18R/3
6L)
•D
igital str
ips T
WR S
chip
hol
•Adju
stm
ent
facilitie
s
Musta
ng (
CO
M)
Descrip
tio
n
Hig
h b
and s
ignal netw
ork
hard
ware
and
application
Req
uir
em
en
t
The d
em
and f
or
transport
capacity o
f hig
h-b
and
sig
nals
is incre
asin
g.
To a
ccom
modate
these h
igh-
band s
ignals
, specific
hard
ware
needs t
o b
e
incorp
ora
ted in t
he e
xis
ting n
etw
ork
.
This
pro
ject
is a
pre
-requis
ite f
or
the
imple
menta
tion o
f th
e n
ew
voic
e c
om
munic
ation
syste
m (
VCS).
Perfo
rm
an
ce t
arg
ets
Cost
eff
icie
ncy:
realisation o
f cost
(rent
of
com
munic
ation lin
es)
savin
gs
Capacity:
enable
r fo
r fu
ture
gro
wth
and
imple
menta
tion o
f SESAR c
oncept
ATM
Maste
r p
lan
op
erati
on
al
imp
ro
vem
en
ts
n/a
Pla
nn
ed
op
erati
on
al in
use d
ate
June 2
012
Fin
an
cia
l d
ata
Capex:
€2.6
00.0
00
Sta
tus:
part
ly c
ontr
acte
d
Allocation t
o e
n-r
oute
charg
ing z
one:
54,5
%
Usefu
l life
: 15 y
ears

Contingency (
fall b
ack f
acility A
PP a
nd A
CC)
Descrip
tio
n
Mediu
m t
erm
fall b
ack a
ppro
ach a
nd a
rea c
ontr
ol
at
Rie
kerp
old
er
location (
exis
ting L
VN
L location)
Req
uir
em
en
t
Realise f
all b
ack f
acility f
or
appro
ach a
nd a
rea
contr
ol
Perfo
rm
an
ce t
arg
ets
Capacity t
arg
et:
within
48 h
ours
level of
serv
ice
pro
vis
ion is r
esto
red a
t 70%
-100%
of
curr
ent
peak h
our
capacity
ATM
Maste
r p
lan
op
erati
on
al
imp
ro
vem
en
ts
Contingency f
acility c
om
plies w
ith S
ES,
SESAR
and is r
ealised in b
ilate
ral FABEC c
oopera
tion.
Pla
nn
ed
op
erati
on
al in
use d
ate
2012
Fin
an
cia
l d
ata
Capex:
€6.5
00.0
00
Sta
tus:
not
contr
acte
d
Allocation t
o e
n-r
oute
charg
ing z
one:
100%
Usefu
l life
: 15 y
ears
Repla
cem
ent
term
inal appro
ach r
adar
(SU
R)
Descrip
tio
nRepla
cem
ent
of
term
inal appro
ach r
adar
Schip
hol
(TAR-4
)
Req
uir
em
en
t
Main
tain
the n
ecessary
level of situational
aw
are
ness in t
he t
erm
inal m
anoeuvring a
rea
Schip
hol. O
ne o
f th
e t
erm
inal appro
ach r
adars
Schip
holis
end o
f life
and n
eeds t
o b
e r
epla
ced.
Euro
contr
olguid
elines (
Radar
Surv
eilla
nce in E
n-
Route
Airspace a
nd m
ajo
r te
rmin
al are
as)
com
mis
sio
n p
rim
ary
radar
covera
ge in h
igh
density T
MAs
Perfo
rm
an
ce t
arg
ets
N/a
. N
ecessary
repla
cem
ent.
Ultim
ate
ly
pre
venting d
ecline in c
apacity d
ue t
o s
yste
m
failure
s.
ATM
Maste
r p
lan
op
erati
on
al
imp
ro
vem
en
tsn/a
Pla
nn
ed
op
erati
on
al in
use d
ate
2016
Fin
an
cia
l d
ata
Capex:
€8.0
00.0
00
Sta
tus:
not
contr
acte
d
Allocation t
o e
n-r
oute
charg
ing z
one:
90%
Usefu
l life
: 15 y
ears
Repla
cem
ent
voic
e c
om
munic
ation s
yste
m (
CO
M)
Descrip
tio
n
Repla
cem
ent
of
voic
e c
om
munic
ation s
yste
m
(VCS)
inclu
din
g t
ransm
itte
rs,
receiv
ers
, m
onitoring a
nd c
ontr
ol syste
ms,
etc
.
Req
uir
em
en
t
Safe
guard
com
munic
ation lin
k w
ith p
ilot
and
oth
er
ATCO
s.
Curr
ent
VCS is e
nd o
f life
and is n
ot
able
to a
ccom
modate
futu
re g
row
th (
more
fr
equencie
s)
Perfo
rm
an
ce t
arg
ets
Necessary
repla
cem
ent.
Ultim
ate
ly p
reventing
decline in c
apacity d
ue t
o s
yste
m failure
s.
Capacity:
accom
modate
s f
utu
re g
row
th
ATM
Maste
r p
lan
op
erati
on
al
imp
ro
vem
en
ts
Necessary
repla
cem
ent
date
is t
oo e
arly f
or
FABEC c
oord
ination
Pla
nn
ed
op
erati
on
al in
use d
ate
2014
Fin
an
cia
l d
ata
Capex:
€23.6
00.0
00
Sta
tus:
contr
act
Allocation t
o e
n-r
oute
charg
ing z
one:
54,5
%
Usefu
l life
: 15 y
ears
Fallback a
ir-g
round |
gro
und-g
round V
CS
Descrip
tio
n
Repla
cem
ent
of
fall b
ack n
ew
voic
ecom
munic
ation s
yste
m (
VCS)
Req
uir
em
en
t
Safe
guard
fall b
ack o
ption o
f com
munic
ation lin
k
with p
ilot
and o
ther
ATC
Os.
Curr
ent
fall b
ack
option o
f VCS is e
nd o
f life
Perfo
rm
an
ce t
arg
ets
Necessary
repla
cem
ent.
Ultim
ate
ly p
reventing
decline in c
apacity d
ue t
o s
yste
m failure
s.
Capacity:
incre
ased c
apacity d
uring d
egra
dation
mode
ATM
Maste
r p
lan
op
erati
on
al
imp
ro
vem
en
ts
Syste
m r
equirem
ents
were
develo
ped in b
ilate
ral
FABEC c
oopera
tion (
DFS)
Pla
nn
ed
op
erati
on
al in
use d
ate
2014
Fin
an
cia
l d
ata
Capex:
€7.2
00.0
00
Sta
tus:
not
contr
acte
d
Allocation t
o e
n-r
oute
charg
ing z
one:
54,5
%
Usefu
l life
: 15 y
ears
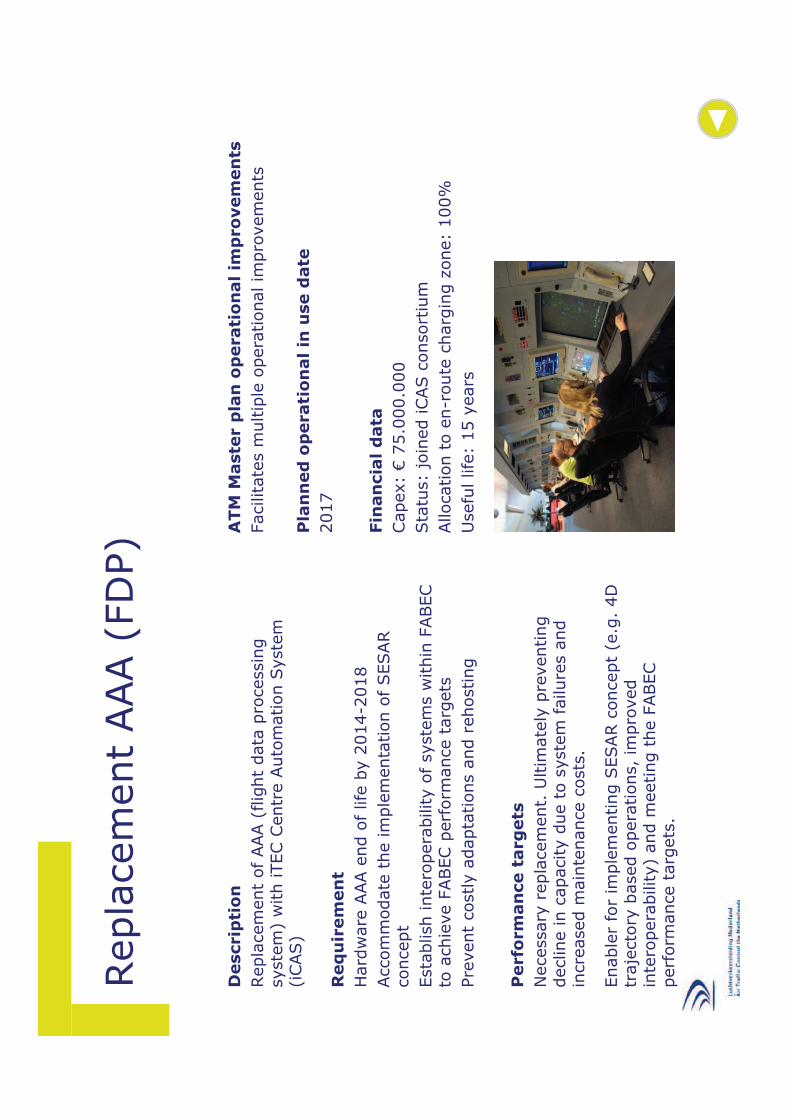
Repla
cem
ent
AAA (
FD
P)
Descrip
tio
n
Repla
cem
ent
of
AAA (
flig
ht
data
pro
cessin
g
syste
m)
with iTEC
Centr
e A
uto
mation S
yste
m
(iCAS)
Req
uir
em
en
t
Hard
ware
AAA e
nd
of
life
by 2
014-2
018
Accom
modate
the im
ple
menta
tion o
f SESAR
concept
Esta
blish inte
ropera
bility o
f syste
ms w
ithin
FABEC
to a
chie
ve F
ABEC
perf
orm
ance t
arg
ets
Pre
vent
costly a
dapta
tions a
nd r
ehosting
Perfo
rm
an
ce t
arg
ets
Necessary
repla
cem
ent.
Ultim
ate
ly p
reventing
decline in c
apacity d
ue t
o s
yste
m f
ailure
s a
nd
incre
ased m
ain
tenance c
osts
.
Enable
r fo
r im
ple
menting S
ESAR c
oncept
(e.g
. 4D
traje
cto
ry b
ased o
pera
tions,
impro
ved
inte
ropera
bility)
and m
eeting t
he F
ABEC
perf
orm
ance t
arg
ets
.
ATM
Maste
r p
lan
op
erati
on
al
imp
ro
vem
en
ts
Facilitate
s m
ultip
le o
pera
tional im
pro
vem
ents
Pla
nn
ed
op
erati
on
al in
use d
ate
2017
Fin
an
cia
l d
ata
Capex:
€75.0
00.0
00
Sta
tus:
join
ed iCAS
consort
ium
Allocation t
o e
n-r
oute
charg
ing z
one:
100%
Usefu
l life
: 15 y
ears
Repla
cem
ent
IT o
ffic
e a
uto
mation
Descrip
tio
n
Repla
cem
ent
of IC
T infr
astr
uctu
re,
deskto
ps,
lapto
ps,
soft
ware
lic
ences,
etc
.
Req
uir
em
en
t
ICT e
quip
ment
is e
nd o
f life
and f
ailure
rate
exceeds 1
0%
. Pro
fessio
nalise I
CT s
upport
function
Perfo
rm
an
ce t
arg
ets
N/a
. N
ecessary
repla
cem
ent.
ATM
Maste
r p
lan
op
erati
on
al
imp
ro
vem
en
ts
N/a
.
Pla
nn
ed
op
erati
on
al in
use d
ate
2012
Fin
an
cia
l d
ata
Capex:
€2.2
00.0
00
Sta
tus:
pre
paring E
uro
pean t
endering
Allocation t
o e
n-r
oute
charg
ing z
one:
90%
Usefu
l life
: 3 y
ears
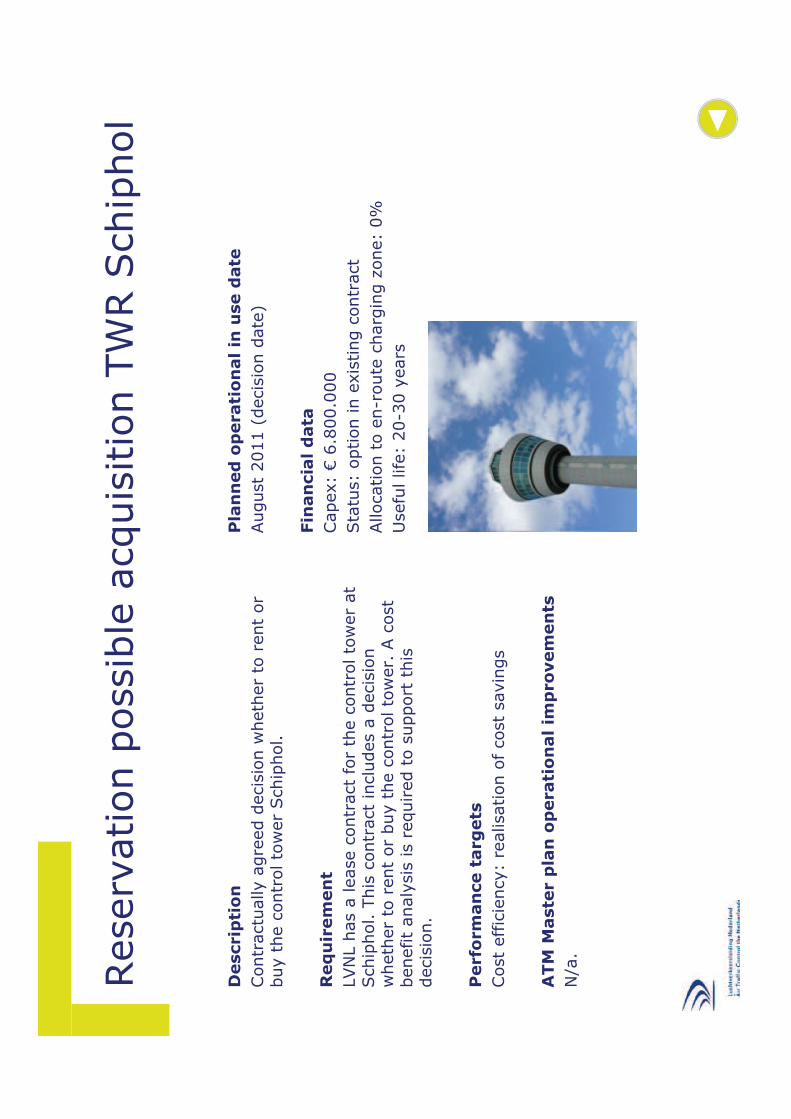
Reserv
ation p
ossib
le a
cquis
itio
n T
WR S
chip
hol
Descrip
tio
n
Contr
actu
ally a
gre
ed d
ecis
ion w
heth
er
to r
ent
or
buy t
he c
ontr
ol to
wer
Schip
hol.
Req
uir
em
en
t
LVN
L h
as a
lease c
ontr
act
for
the c
ontr
ol to
wer
at
Schip
hol. T
his
contr
act
inclu
des a
decis
ion
wheth
er
to r
ent
or
buy t
he c
ontr
ol to
wer.
A c
ost
benefit
analy
sis
is r
equired t
o s
upport
this
decis
ion.
Perfo
rm
an
ce t
arg
ets
Cost
eff
icie
ncy:
realisation o
f cost
savin
gs
ATM
Maste
r p
lan
op
erati
on
al
imp
ro
vem
en
ts
N/a
.
Pla
nn
ed
op
erati
on
al in
use d
ate
August
2011 (
decis
ion d
ate
)
Fin
an
cia
l d
ata
Capex:
€6.8
00.0
00
Sta
tus:
option in e
xis
ting c
ontr
act
Allocation t
o e
n-r
oute
charg
ing z
one:
0%
Usefu
l life
: 20-3
0 y
ears
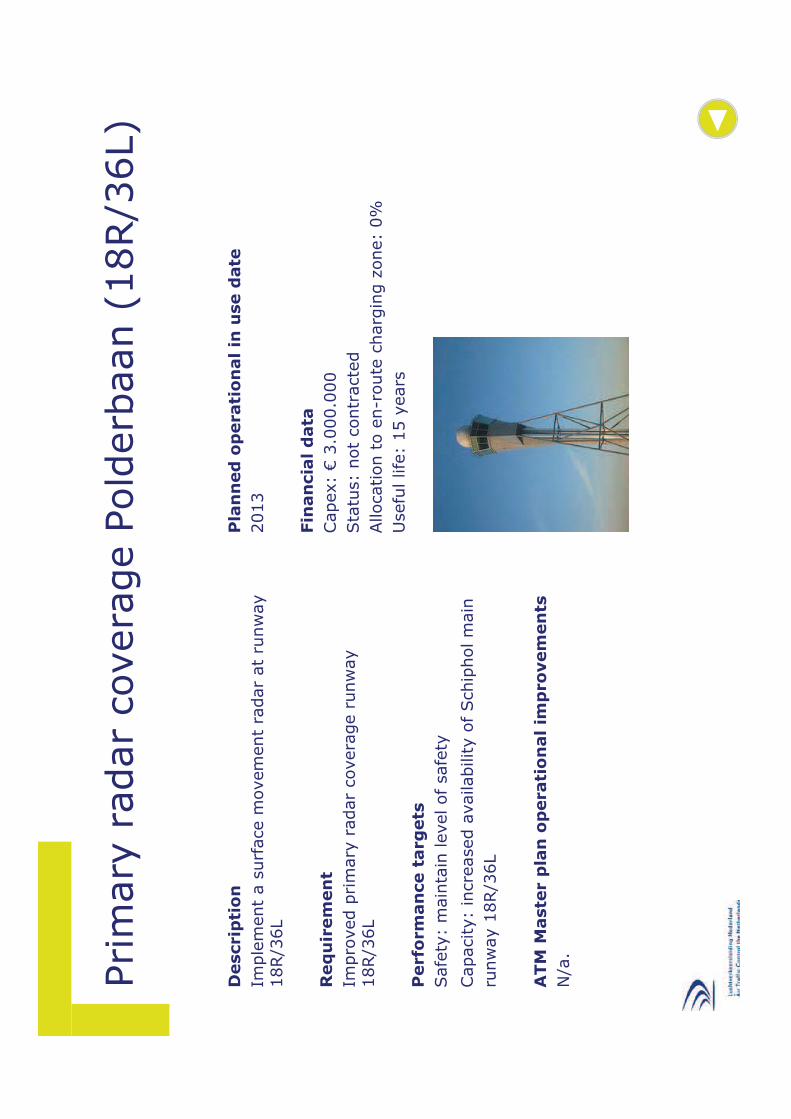
Prim
ary
radar
covera
ge P
old
erb
aan
(18R/3
6L)
Descrip
tio
n
Imple
ment
a s
urf
ace m
ovem
ent
radar
at
runw
ay
18R/3
6L
Req
uir
em
en
t
Impro
ved p
rim
ary
radar
covera
ge r
unw
ay
18R/3
6L
Perfo
rm
an
ce t
arg
ets
Safe
ty:
main
tain
level of
safe
ty
Capacity:
incre
ased a
vailability o
f Schip
holm
ain
runw
ay 1
8R/3
6L
ATM
Maste
r p
lan
op
erati
on
al
imp
ro
vem
en
ts
N/a
.
Pla
nn
ed
op
erati
on
al in
use d
ate
2013
Fin
an
cia
l d
ata
Capex:
€3.0
00.0
00
Sta
tus:
not
contr
acte
d
Allocation t
o e
n-r
oute
charg
ing z
one:
0%
Usefu
l life
: 15 y
ears
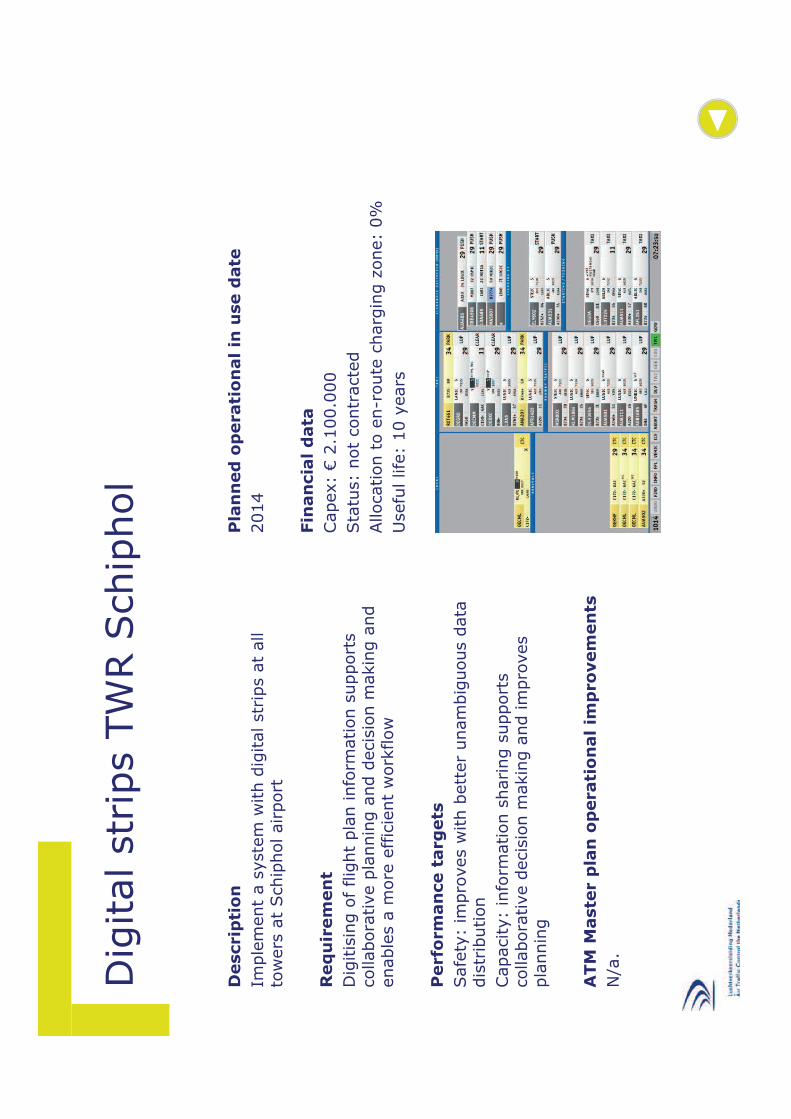
Dig
ital str
ips T
WR S
chip
hol
Descrip
tio
n
Imple
ment
a s
yste
m w
ith d
igital str
ips a
t all
tow
ers
at
Schip
holairport
Req
uir
em
en
t
Dig
itis
ing o
f flig
ht
pla
n info
rmation s
upport
scollabora
tive p
lannin
g a
nd d
ecis
ion m
akin
g a
nd
enable
s a
more
eff
icie
nt
work
flow
Perfo
rm
an
ce t
arg
ets
Safe
ty:
impro
ves w
ith b
ett
er
unam
big
uous d
ata
dis
trib
ution
Capacity:
info
rmation s
haring s
upport
scollabora
tive d
ecis
ion m
akin
g a
nd im
pro
ves
pla
nnin
g
ATM
Maste
r p
lan
op
erati
on
al
imp
ro
vem
en
ts
N/a
.
Pla
nn
ed
op
erati
on
al in
use d
ate
2014
Fin
an
cia
l d
ata
Capex:
€2.1
00.0
00
Sta
tus:
not
contr
acte
d
Allocation t
o e
n-r
oute
charg
ing z
one:
0%
Usefu
l life
: 10 y
ears
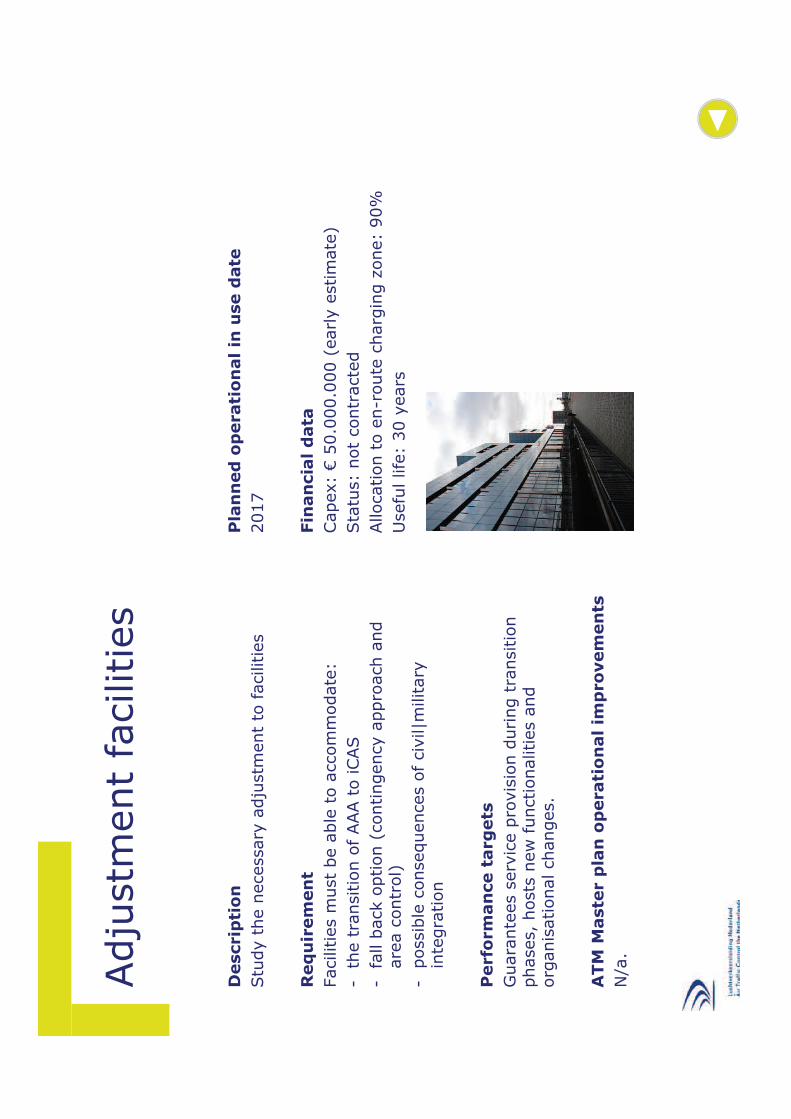
Adju
stm
ent
facilitie
s
Descrip
tio
n
Stu
dy t
he n
ecessary
adju
stm
ent
to f
acilitie
s
Req
uir
em
en
t
Facilitie
s m
ust
be a
ble
to a
ccom
modate
:
-th
e t
ransitio
n o
f AAA t
o iCAS
-fa
ll b
ack o
ption (
contingency a
ppro
ach a
nd
are
a c
ontr
ol)
-possib
le c
onsequences o
f civ
il|m
ilitary
inte
gra
tion
Perfo
rm
an
ce t
arg
ets
Guara
nte
es s
erv
ice p
rovis
ion d
uring t
ransitio
n
phases,
hosts
new
functionalities a
nd
org
anis
ational changes.
ATM
Maste
r p
lan
op
erati
on
al
imp
ro
vem
en
ts
N/a
.
Pla
nn
ed
op
erati
on
al in
use d
ate
2017
Fin
an
cia
l d
ata
Capex:
€50.0
00.0
00 (
early e
stim
ate
)
Sta
tus:
not
contr
acte
d
Allocation t
o e
n-r
oute
charg
ing z
one:
90%
Usefu
l life
: 30 y
ears
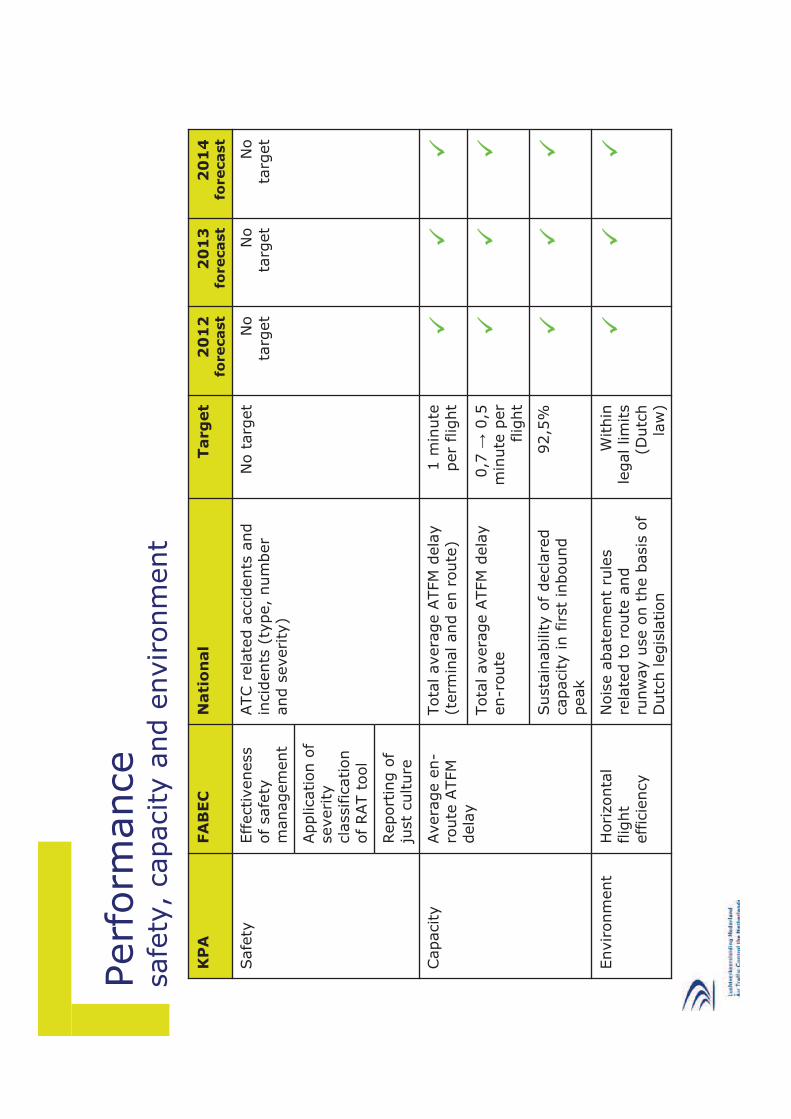
Perf
orm
ance
safe
ty,
capacity a
nd e
nvironm
ent
KP
AFA
BEC
Nati
on
al
Targ
et
20
12
forecast
20
13
forecast
No
targ
et
No
targ
et
Tota
lavera
ge
ATFM
dela
yen-r
oute
0,7
0,5
min
ute
per
flig
ht
1m
inute
per
flig
ht
No
targ
et
92,5
%
Within
legallim
its
(Dutc
hla
w)
ATC
rela
ted
accid
ents
and
incid
ents
(type,
num
ber
and
severity
)
Tota
lavera
ge
ATFM
dela
y(t
erm
inaland
en
route
)
Susta
inability
of
decla
red
capacity
infirs
tin
bound
peak
Nois
eabate
ment
rule
sre
late
dto
route
and
runw
ay
use
on
the
basis
of
Dutc
hle
gis
lation
Capacity
Avera
ge
en-
route
ATFM
dela
y
20
14
forecast
Eff
ectiveness
ofsafe
tym
anagem
ent
Application
of
severi
tycla
ssific
ation
ofRAT
tool
Safe
tyN
ota
rget
Report
ing
of
just
culture
Envir
onm
ent
Horizonta
lflig
ht
effic
iency
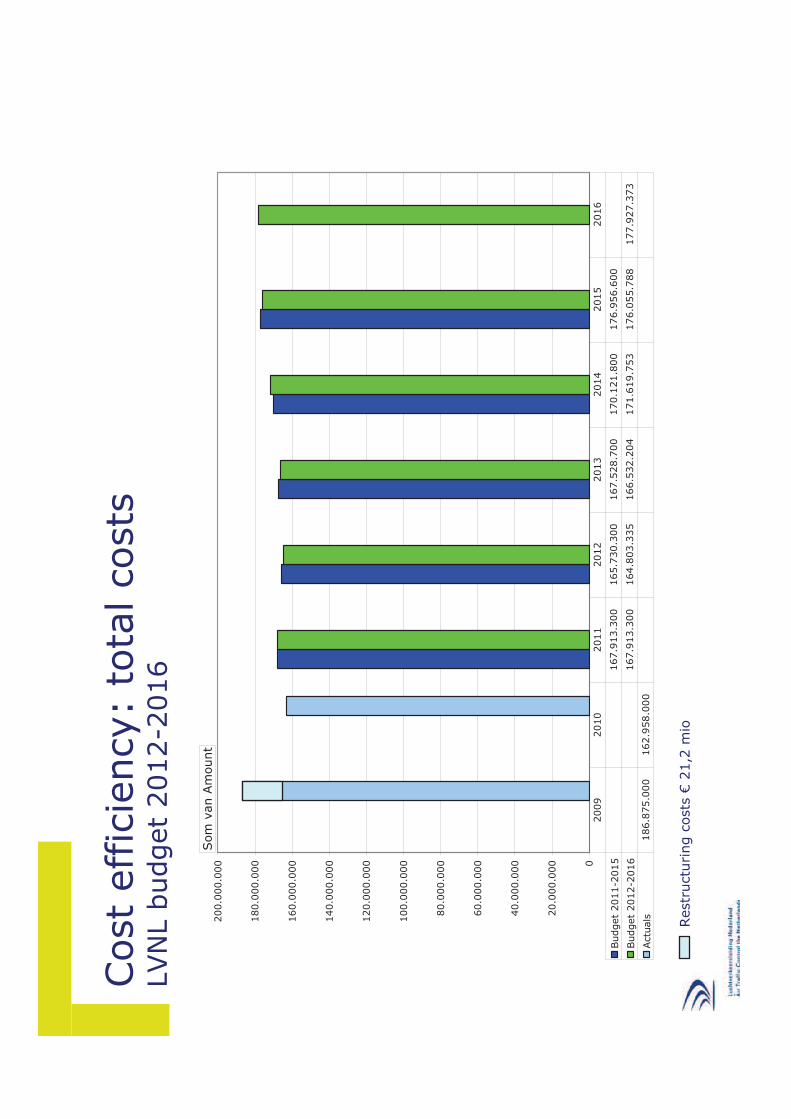
Cost
eff
icie
ncy:
tota
l costs
LVN
L b
udget
2012-2
016
0
20.0
00.0
00
40.0
00.0
00
60.0
00.0
00
80.0
00.0
00
100.0
00.0
00
120.0
00.0
00
140.0
00.0
00
160.0
00.0
00
180.0
00.0
00
200.0
00.0
00
Budget
2011-2
015
167.9
13.3
00
165.7
30.3
00
167.5
28.7
00
170.1
21.8
00
176.9
56.6
00
Budget
2012-2
016
167.9
13.3
00
164.8
03.3
35
166.5
32.2
04
171.6
19.7
53
176.0
55.7
88
177.9
27.3
73
Actu
als
186.8
75.0
00
162.9
58.0
00
2009
2010
2011
2012
2013
2014
2015
2016
Som
van A
mount
Restr
uctu
ring c
osts
€21,2
mio
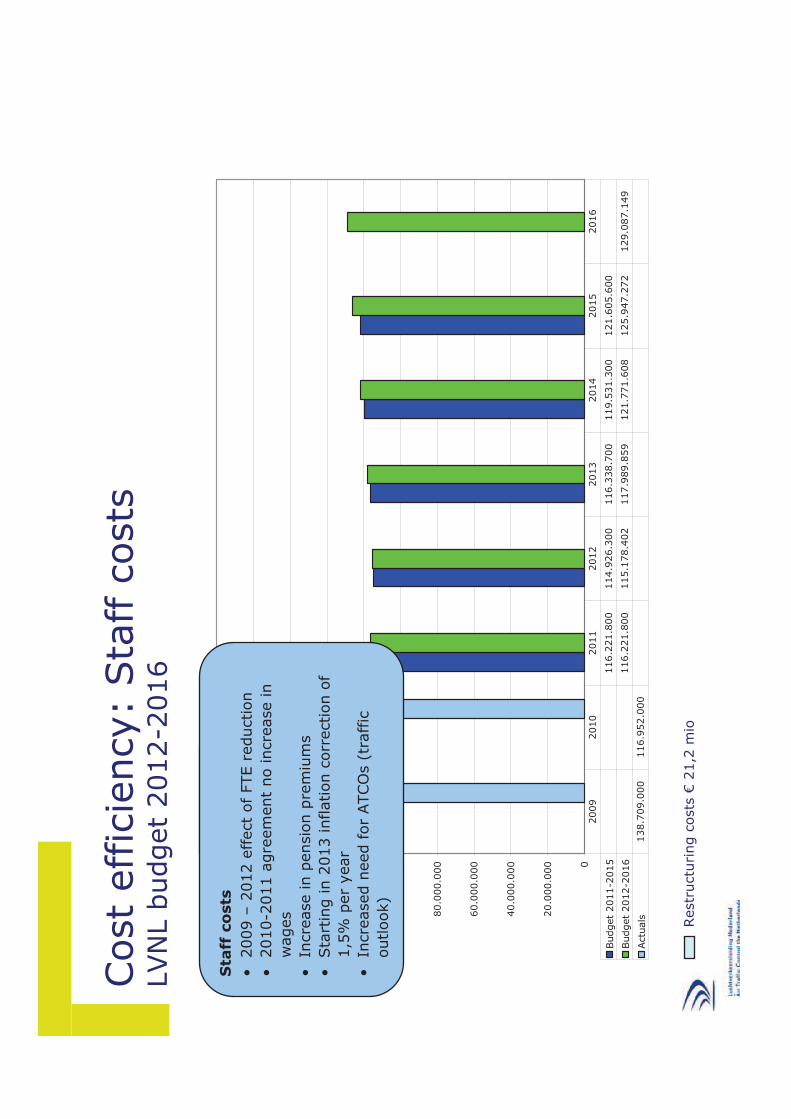
Cost
eff
icie
ncy:
Sta
ff c
osts
LVN
L b
udget
2012-2
016
0
20.0
00.0
00
40.0
00.0
00
60.0
00.0
00
80.0
00.0
00
100.0
00.0
00
120.0
00.0
00
140.0
00.0
00
160.0
00.0
00
180.0
00.0
00
200.0
00.0
00
Budget
2011-2
015
116.2
21.8
00
114.9
26.3
00
116.3
38.7
00
119.5
31.3
00
121.6
05.6
00
Budget
2012-2
016
116.2
21.8
00
115.1
78.4
02
117.9
89.8
59
121.7
71.6
08
125.9
47.2
72
129.0
87.1
49
Actu
als
138.7
09.0
00
116.9
52.0
00
2009
2010
2011
2012
2013
2014
2015
2016
Som
van A
mount
Sta
ff c
osts
•2009 –
2012
effect
of
FTE r
eduction
•2010-2
011 a
gre
em
ent
no incre
ase in
wages
•In
cre
ase in p
ensio
n p
rem
ium
s
•Sta
rtin
g in 2
013 inflation c
orr
ection o
f
1,5
% p
er
year
•In
cre
ased
need f
or
ATCO
s(t
raff
ic
outlook)
Restr
uctu
ring c
osts
€21,2
mio
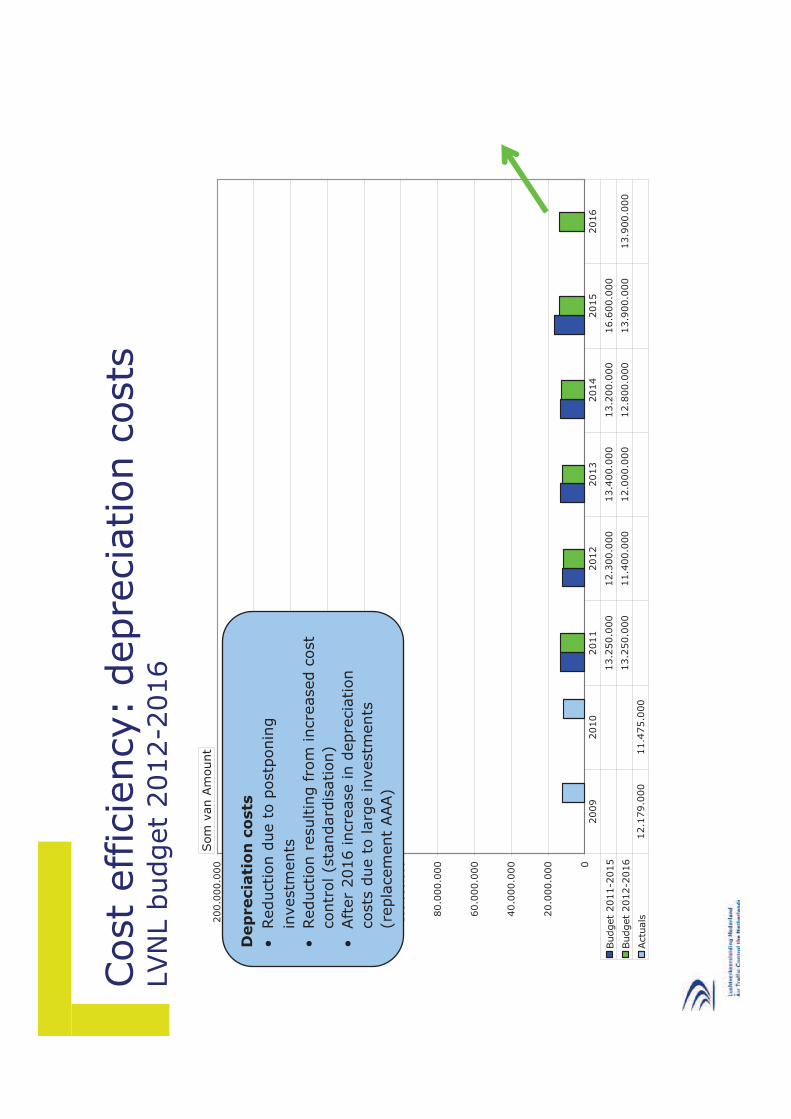
Cost
eff
icie
ncy:
depre
cia
tion c
osts
LVN
L b
udget
2012-2
016
0
20.0
00.0
00
40.0
00.0
00
60.0
00.0
00
80.0
00.0
00
100.0
00.0
00
120.0
00.0
00
140.0
00.0
00
160.0
00.0
00
180.0
00.0
00
200.0
00.0
00
Budget
2011-2
015
13.2
50.0
00
12.3
00.0
00
13.4
00.0
00
13.2
00.0
00
16.6
00.0
00
Budget
2012-2
016
13.2
50.0
00
11.4
00.0
00
12.0
00.0
00
12.8
00.0
00
13.9
00.0
00
13.9
00.0
00
Actu
als
12.1
79.0
00
11.4
75.0
00
2009
2010
2011
2012
2013
2014
2015
2016
Som
van A
mount
Dep
recia
tio
n c
osts
•Reduction d
ue t
o p
ostp
onin
g
investm
ents
•Reduction
resultin
g f
rom
incre
ased c
ost
contr
ol (s
tandard
isation)
•Aft
er
2016 incre
ase in d
epre
cia
tion
costs
due t
ola
rge
investm
ents
(repla
cem
ent
AAA)
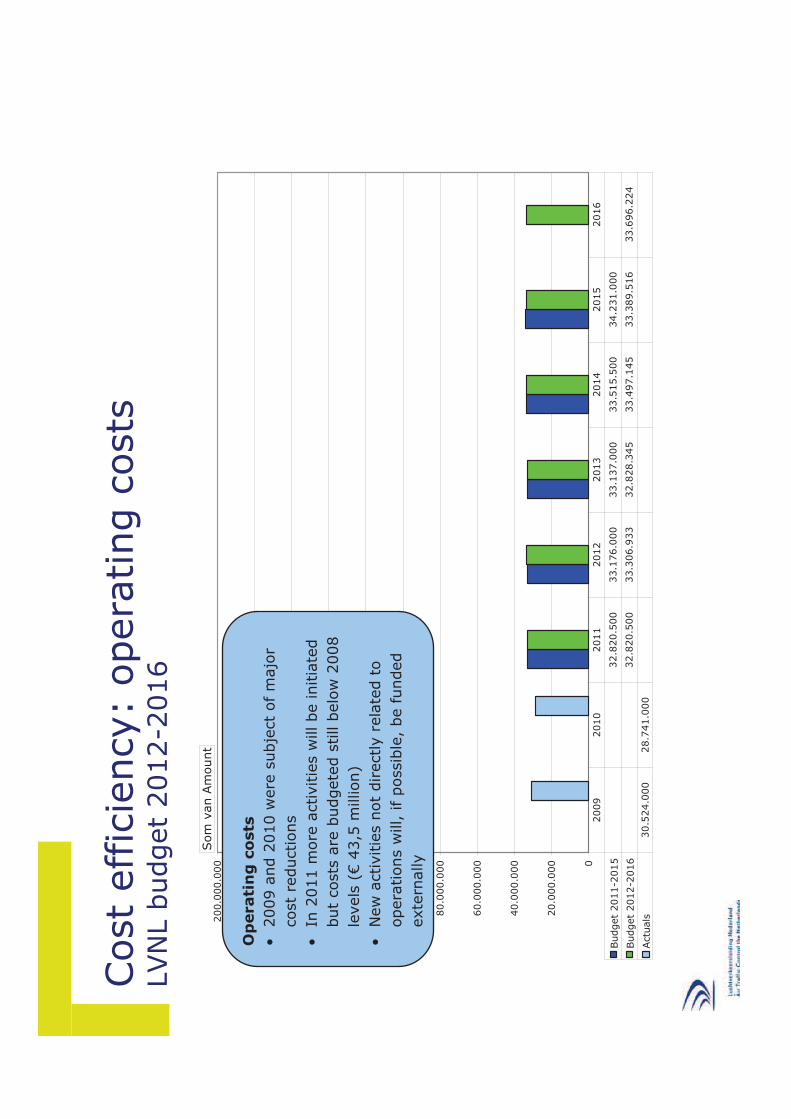
Cost
eff
icie
ncy:
opera
ting c
osts
LVN
L b
udget
2012-2
016
0
20.0
00.0
00
40.0
00.0
00
60.0
00.0
00
80.0
00.0
00
100.0
00.0
00
120.0
00.0
00
140.0
00.0
00
160.0
00.0
00
180.0
00.0
00
200.0
00.0
00
Budget
2011-2
015
32.8
20.5
00
33.1
76.0
00
33.1
37.0
00
33.5
15.5
00
34.2
31.0
00
Budget
2012-2
016
32.8
20.5
00
33.3
06.9
33
32.8
28.3
45
33.4
97.1
45
33.3
89.5
16
33.6
96.2
24
Actu
als
30.5
24.0
00
28.7
41.0
00
2009
2010
2011
2012
2013
2014
2015
2016
Som
van A
mount
Op
erati
ng
co
sts
•2009
and
2010 w
ere
subje
ct
of
majo
r
cost
reductions
•In
2011 m
ore
activitie
sw
ill be initia
ted
but
costs
are
budgete
d s
till b
elo
w2008
levels
(€
43,5
million)
•N
ew
activitie
s n
ot
directly
rela
ted t
o
opera
tions w
ill, if
possib
le,
be funded
exte
rnally
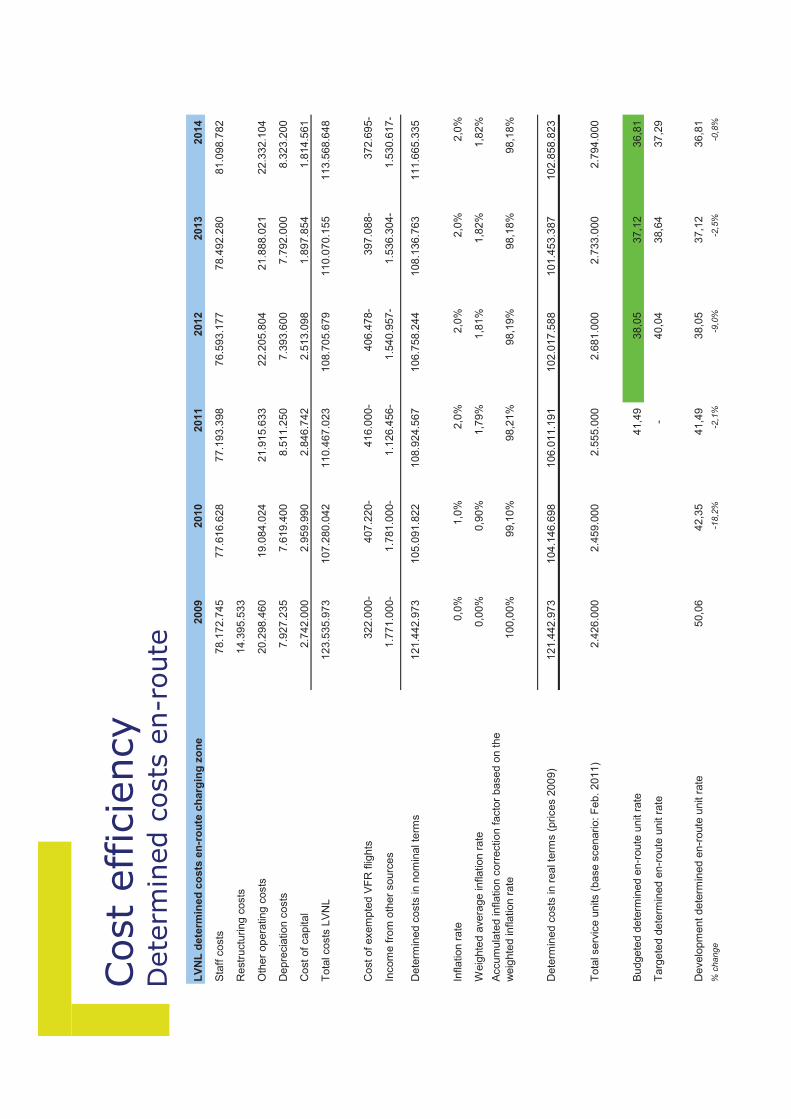
Cost
eff
icie
ncy
Dete
rmin
ed c
osts
en-r
oute
LV
NL
dete
rmin
ed
co
sts
en
-ro
ute
ch
arg
ing
zo
ne
2009
2010
20
11
2012
2013
20
14
Sta
ff c
osts
78.1
72
.745
77.6
16.6
28
77.1
93.3
98
76.5
93
.177
78.4
92.2
80
81.0
98.7
82
Restr
uctu
ring c
osts
14.3
95
.533
Oth
er
opera
ting c
osts
20.2
98
.460
19.0
84.0
24
21.9
15.6
33
22.2
05
.804
21.8
88.0
21
22.3
32.1
04
Depre
cia
tion c
osts
7.9
27
.235
7.6
19.4
00
8.5
11.2
50
7.3
93
.600
7.7
92.0
00
8.3
23.2
00
Cost o
f capital
2.7
42
.000
2.9
59.9
90
2.8
46.7
42
2.5
13
.098
1.8
97.8
54
1.8
14.5
61
Tota
l costs
LV
NL
123.5
35
.973
107.2
80.0
42
110.4
67.0
23
108.7
05
.679
110.0
70.1
55
113.5
68.6
48
Cost o
f exem
pte
d V
FR
flig
hts
322
.000-
407.2
20-
416.0
00-
406
.478-
397.0
88-
372.6
95-
Incom
e f
rom
oth
er
sourc
es
1.7
71
.000-
1.7
81.0
00-
1.1
26.4
56-
1.5
40
.957-
1.5
36.3
04-
1.5
30.6
17-
Dete
rmin
ed c
osts
in n
om
inal te
rms
121.4
42
.973
105.0
91.8
22
108.9
24.5
67
106.7
58
.244
108.1
36.7
63
111.6
65.3
35
Inflation r
ate
0,0
%1,0
%2,0
%2,0
%2,0
%2,0
%
Weig
hte
d a
vera
ge inflation r
ate
0,0
0%
0,9
0%
1,7
9%
1,8
1%
1,8
2%
1,8
2%
Accum
ula
ted inflation c
orr
ection f
acto
r base
d o
n t
he
weig
hte
d inflation r
ate
100
,00%
99,1
0%
98,2
1%
98
,19%
98,1
8%
98,1
8%
Dete
rmin
ed c
osts
in r
eal te
rms (
prices 2
00
9)
121.4
42
.973
104.1
46.6
98
106.0
11.1
91
102.0
17
.588
101.4
53.3
87
102.8
58.8
23
Tota
l serv
ice u
nits (
base s
cenario: F
eb. 2011)
2.4
26
.000
2.4
59.0
00
2.5
55.0
00
2.6
81
.000
2.7
33.0
00
2.7
94.0
00
Bu
dgete
d d
ete
rmin
ed e
n-r
oute
unit r
ate
41,4
9
38,0
5
37,1
2
36,8
1
Targ
ete
d d
ete
rmin
ed e
n-r
oute
unit r
ate
-
40,0
4
38,6
4
37,2
9
Develo
pm
ent
dete
rmin
ed e
n-r
oute
un
it r
ate
50,0
6
42,3
5
41,4
9
38,0
5
37,1
2
36,8
1
% c
ha
ng
e-1
8,2
%-2
,1%
-9,0
%-2
,5%
-0,8
%
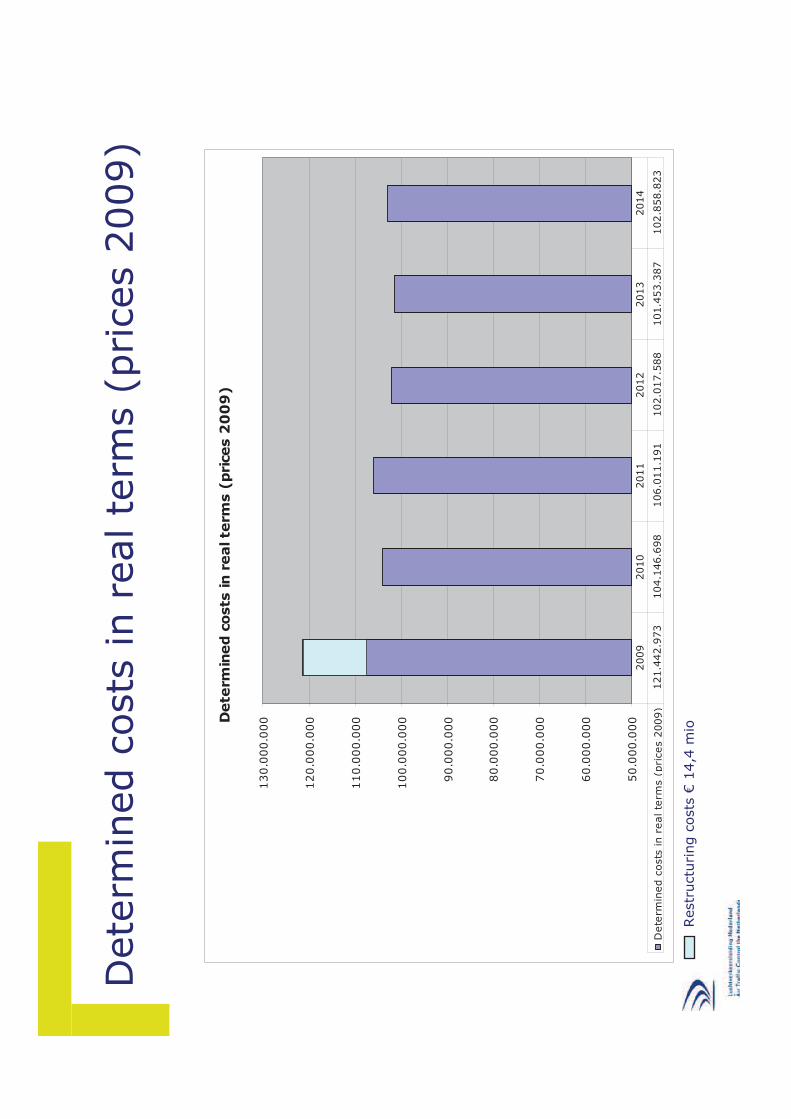
Dete
rmin
ed c
osts
in r
eal te
rms (
prices 2
009)
Dete
rmin
ed c
osts
in r
eal te
rms (
pri
ces
20
09
)
50.0
00.0
00
60.0
00.0
00
70.0
00.0
00
80.0
00.0
00
90.0
00.0
00
100.0
00.0
00
110.0
00.0
00
120.0
00.0
00
130.0
00.0
00
Dete
rmin
ed c
osts
in r
eal te
rms
(pri
ces 2
009)
121.4
42.9
73
104.1
46.6
98
106.0
11.1
91
102.0
17.5
88
101.4
53.3
87
102.8
58.8
23
2009
2010
2011
2012
2013
2014
Restr
uctu
ring c
osts
€14,4
mio
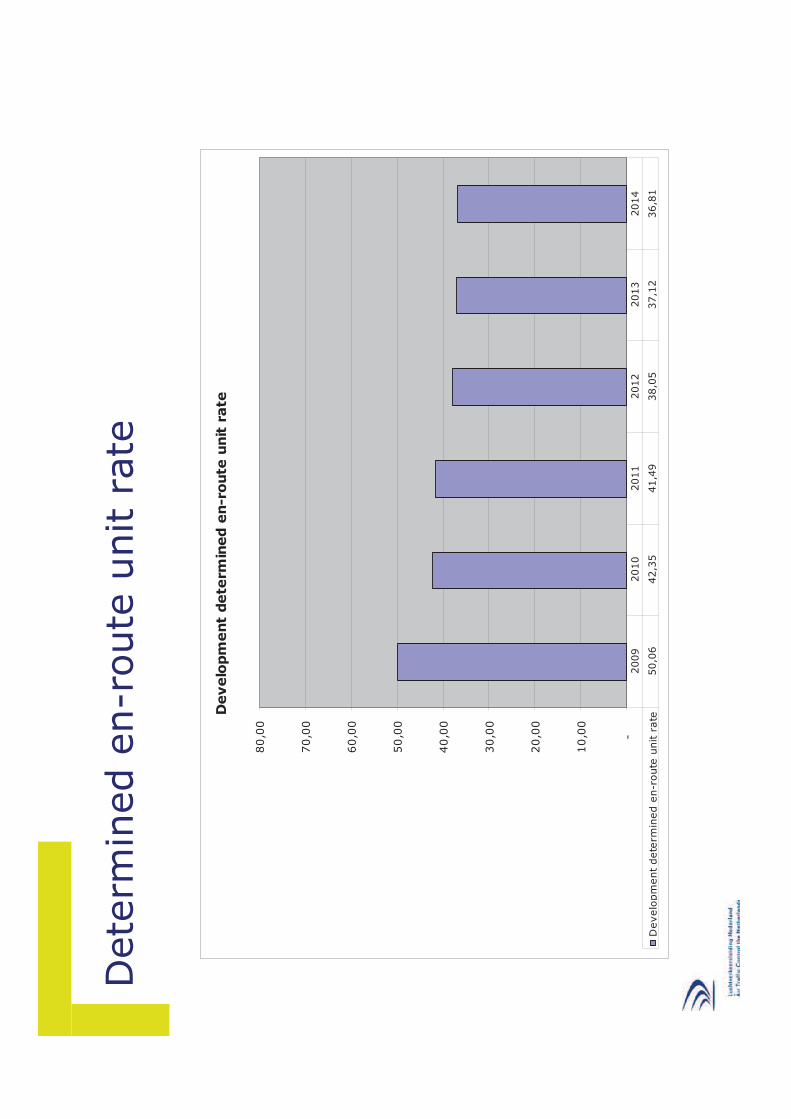
Dete
rmin
ed e
n-r
oute
unit r
ate
Develo
pm
ent
dete
rmin
ed e
n-r
oute
unit
rate
-
10,0
0
20,0
0
30,0
0
40,0
0
50,0
0
60,0
0
70,0
0
80,0
0
Develo
pm
ent
dete
rmin
ed
en-r
oute
unit r
ate
50,0
642,3
541,4
938,0
537,1
236,8
1
2009
2010
2011
2012
2013
2014
Questions
End o
f pre
senta
tion

Sta
keh
old
er
Co
nsu
ltati
on
Ste
en
okkerz
eel -
May 1
9, 2011
The E
uro
pean O
rganis
ation
for
the S
afe
ty o
f A
ir N
avig
ation
Maastr
ich
t U
pp
er
Are
a C
on
tro
l C
en
tre
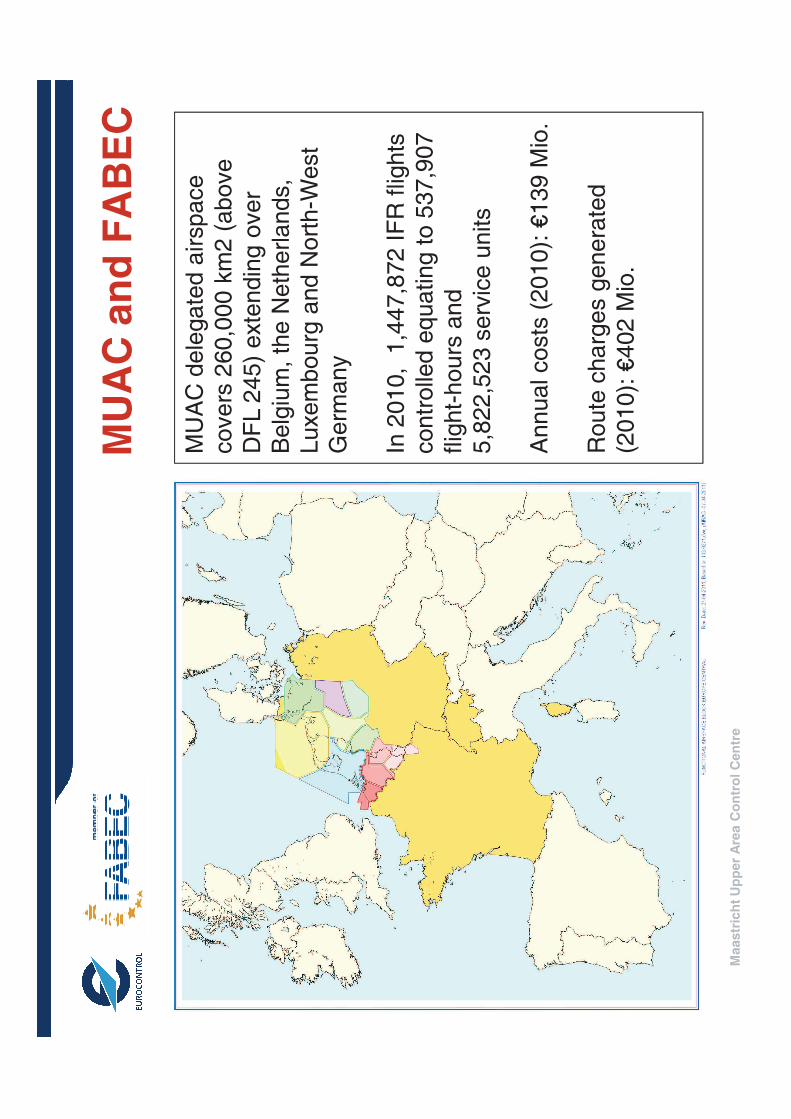
MU
AC
an
d F
AB
EC
MU
AC
dele
gate
d a
irspace
covers
260,0
00 k
m2 (
above
DF
L 2
45)
exte
ndin
g o
ver
Belg
ium
, th
e N
eth
erlands,
Luxem
bourg
and N
ort
h-W
est
Germ
any
In 2
010,
1,4
47,8
72 I
FR
flig
hts
Maastr
ich
t U
pp
er
Are
a C
on
tro
l C
en
tre
In 2
010,
1,4
47,8
72 I
FR
flig
hts
contr
olle
d e
quating t
o 5
37,9
07
flig
ht-
hours
and
5,8
22,5
23 s
erv
ice u
nits
Annual costs
(2010):
€139 M
io.
Route
charg
es g
enera
ted
(2010):
€402 M
io.
MU
AC
an
d S
ES
II
PE
RF
OR
MA
NC
E S
CH
EM
EM
UA
C p
erf
orm
an
ce
•S
afe
ty, C
ap
acity a
nd
En
vir
on
me
nt a
re p
art
of F
AB
EC
Pe
rfo
rma
nce
Pla
n
•C
ost e
ffe
ctive
ne
ss is p
art
of in
div
idu
al F
ou
r S
tate
s’ N
atio
na
l P
lan
s
•M
UA
C id
en
tifie
s a
dd
itio
na
l in
tern
al in
dic
ato
rs a
nd
ta
rge
ts
Maastr
ich
t U
pp
er
Are
a C
on
tro
l C
en
tre
MU
AC
Bu
sin
es
s P
lan
an
d A
nn
ua
l P
lan
•C
on
so
lida
te M
UA
C o
bje
ctive
s a
nd
im
pro
ve
me
nt p
lan
s
•C
om
plia
nt w
ith
SE
S I
I C
om
mo
n R
eq
uir
em
en
ts
MU
AC
is
co
mm
itte
d t
o
•sa
feg
ua
rdin
g it
s o
uts
tan
din
g o
pe
ratio
na
l p
erf
orm
an
ce
•e
nsu
rin
g tra
nsp
are
ncy in
Fo
ur
Sta
tes’ N
atio
na
l P
lan
s
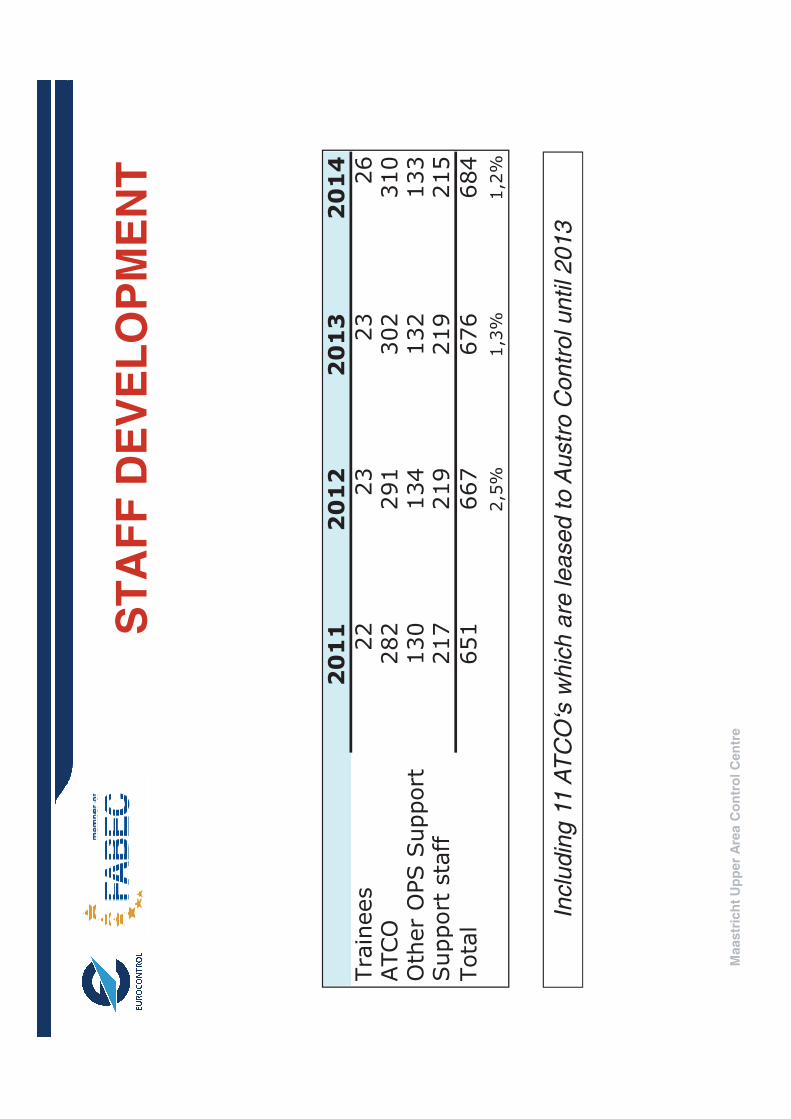
ST
AF
F D
EV
EL
OP
ME
NT
����
����
����
����
��������
��
�
�
�
���
���
���
��
��
Maastr
ich
t U
pp
er
Are
a C
on
tro
l C
en
tre
Inclu
din
g 1
1 A
TC
O‘s
whic
h a
re leased t
o A
ustr
o C
ontr
ol until 2013
���
���
���
��
��
����� ����������
��
��
��
�
�������������
���
���
���
���
�����
��
�
�
��
���
��
���
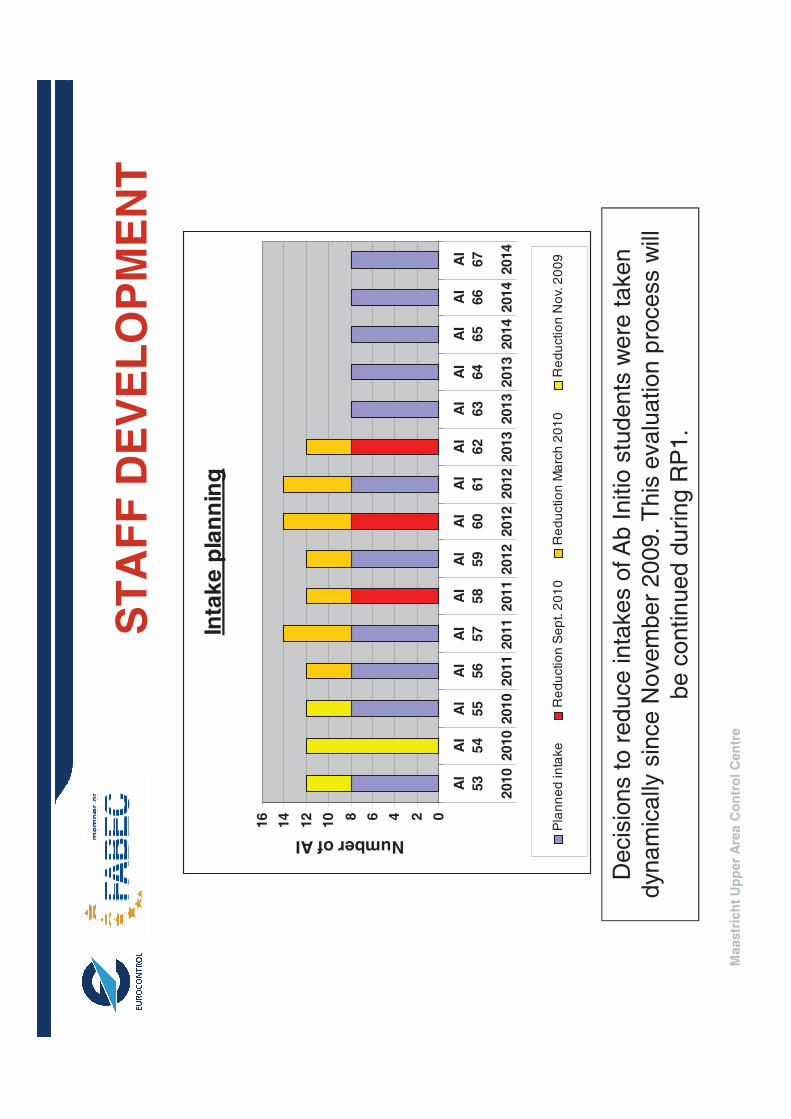
ST
AF
F D
EV
EL
OP
ME
NT
Inta
ke
pla
nn
ing
468
10
12
14
16
Number of AI
Maastr
ich
t U
pp
er
Are
a C
on
tro
l C
en
tre
024
AI
53
AI
54
AI
55
AI
56
AI
57
AI
58
AI
59
AI
60
AI
61
AI
62
AI
63
AI
64
AI
65
AI
66
AI
67
2010
2010
2010
2011
2011
2011
2012
2012
2012
2013
2013
2013
2014
2014
2014
Number of AI
Pla
nn
ed
in
take
Re
du
ctio
n S
ep
t. 2
01
0R
ed
uctio
n M
arc
h 2
01
0R
ed
uctio
n N
ov.
20
09
Decis
ions t
o r
educe inta
kes o
f A
b I
nitio
stu
dents
were
taken
dynam
ically
sin
ce N
ovem
ber
2009. T
his
evalu
ation p
rocess w
ill
be c
ontinued d
uring R
P1.
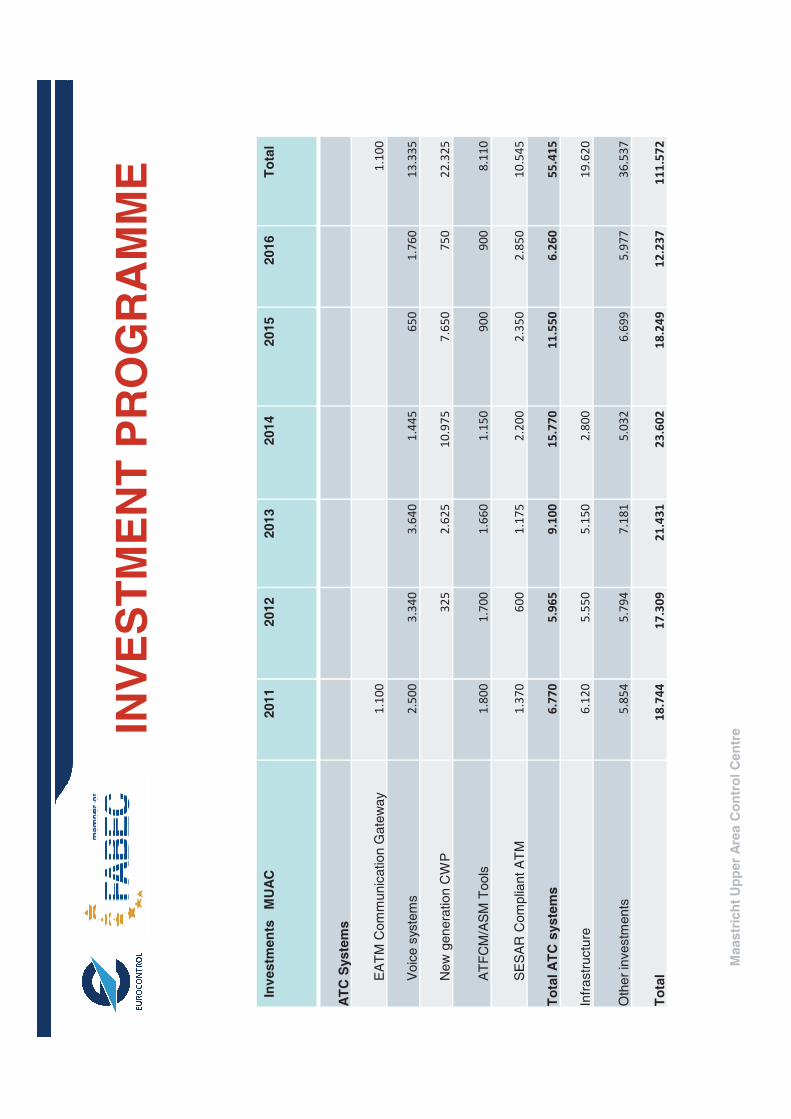
INV
ES
TM
EN
T P
RO
GR
AM
ME
Inv
estm
en
ts M
UA
C2011
2012
2013
2014
2015
2016
To
tal
AT
C S
yste
ms
EA
TM
Com
munic
ation G
ate
way
������
������
Maastr
ich
t U
pp
er
Are
a C
on
tro
l C
en
tre
Voic
e s
yste
ms
������
������
�����
������
���
����
�������
New
genera
tion C
WP
����
�����
������
����
���
�������
AT
FC
M/A
SM
Tools
������
�����
����
������
����
����
������
SE
SA
R C
om
plia
nt A
TM
�����
���
�����
������
������
������
�������
To
tal A
TC
syste
ms
������
������
������
�������
�������
�����
������
Infr
astr
uctu
re�����
������
������
������
������
Oth
er
investm
ents
������
�����
�����
������
����
����
�����
To
tal
�����
�������
�����
�����
�����
�����
�������
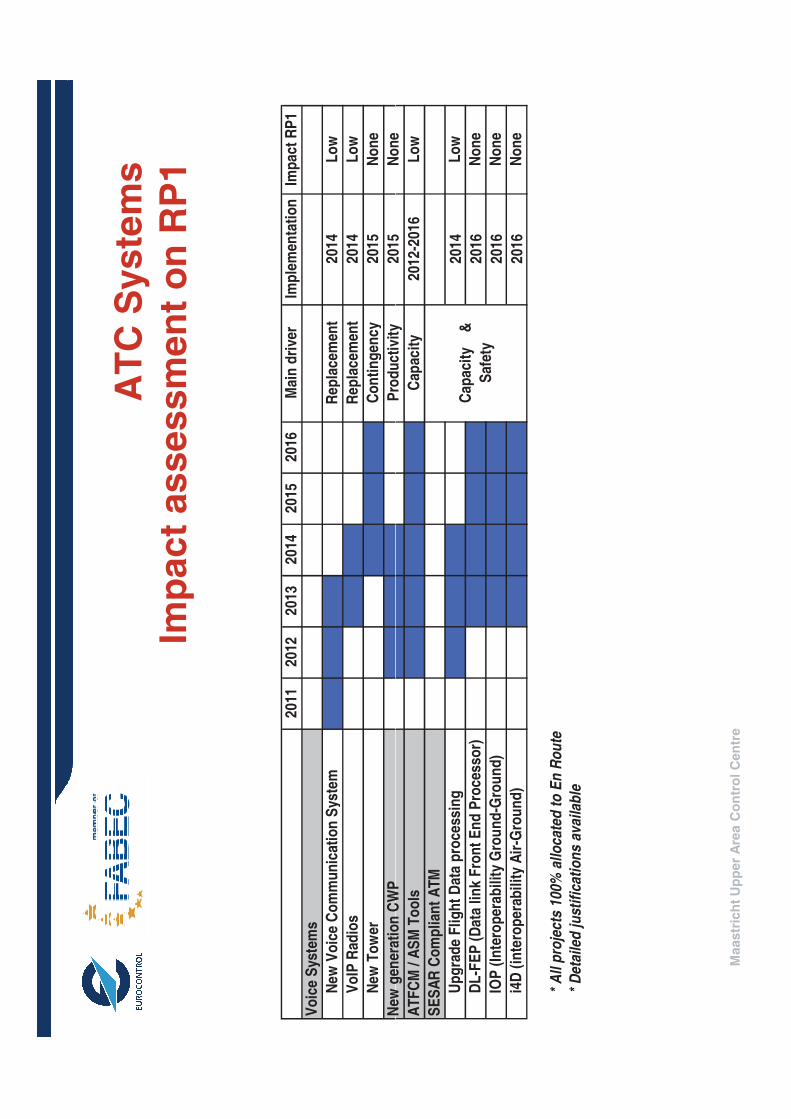
AT
C S
ys
tem
s
Imp
ac
t a
ss
es
sm
en
t o
n R
P1
20
112
012
20
132
014
20
152
016
Mai
n d
rive
rIm
ple
men
tati
on
Imp
ac
t R
P1
Vo
ice
Sys
tem
s
Ne
w V
oic
e C
om
mu
nic
atio
n S
yste
mR
ep
lac
em
ent
201
4L
ow
Vo
IP R
adio
sR
ep
lac
em
ent
201
4L
ow
Ne
w T
ow
erC
on
tin
ge
nc
y2
015
No
ne
New
gen
era
tio
n C
WP
Pro
du
cti
vity
201
5N
on
e
Maastr
ich
t U
pp
er
Are
a C
on
tro
l C
en
tre
New
gen
era
tio
n C
WP
Pro
du
cti
vity
201
5N
on
e
AT
FC
M /
AS
M T
oo
lsC
apac
ity
201
2-2
016
Lo
w
SE
SA
R C
om
pli
ant
AT
M
Up
gra
de
Fli
gh
t D
ata
pro
ce
ssin
g2
014
Lo
w
DL
-FE
P (
Da
ta l
ink
Fro
nt
En
d P
roc
ess
or)
201
6N
on
e
IOP
(In
tero
per
ab
ilit
y G
rou
nd
-Gro
un
d)
201
6N
on
e
i4D
(in
tero
pe
rab
ilit
y A
ir-G
rou
nd
)2
016
No
ne
* A
ll p
roje
cts
10
0% a
llo
ca
ted
to
En
Ro
ute
* D
eta
ile
d j
ust
ific
ati
on
s a
va
ila
ble
Ca
pa
city
&
Saf
ety
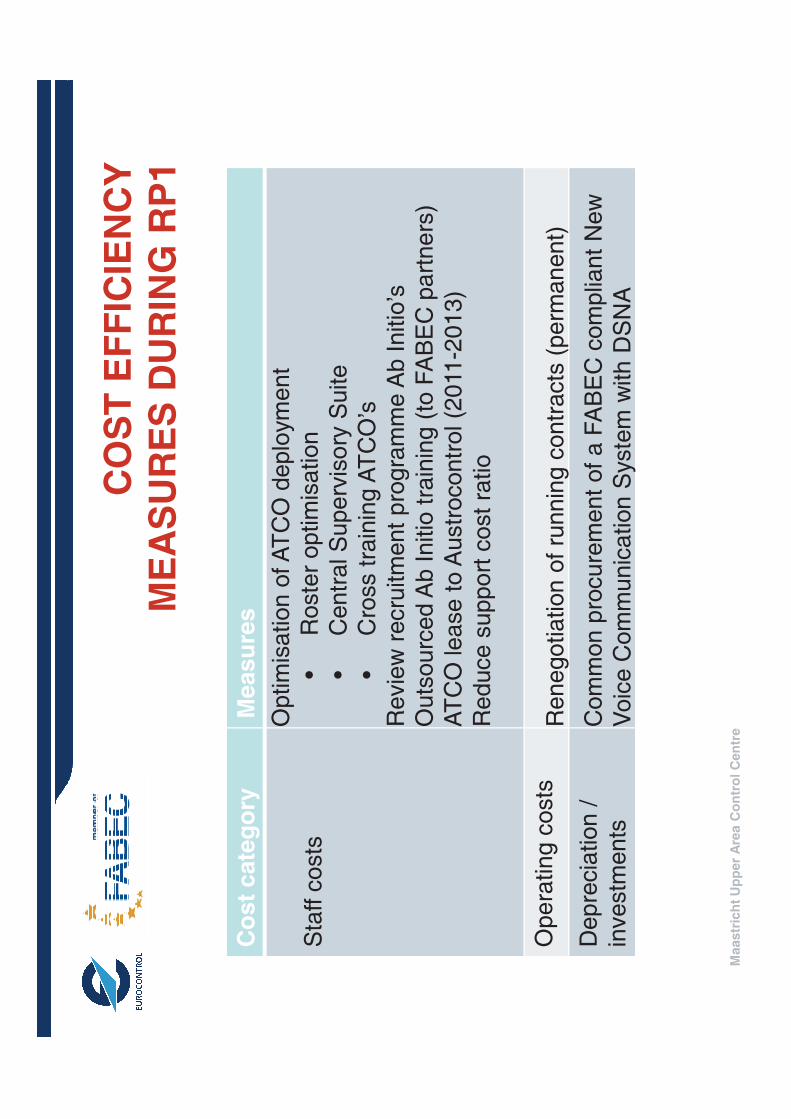
CO
ST
EF
FIC
IEN
CY
ME
AS
UR
ES
DU
RIN
G R
P1
Co
st
cate
go
ryM
easu
res
Sta
ff c
osts
Optim
isation o
f A
TC
O d
eplo
ym
ent
•R
oste
r optim
isation
•C
entr
al S
uperv
isory
Suite
•C
ross t
rain
ing A
TC
O’s
Revie
w r
ecru
itm
ent
pro
gra
mm
e A
b I
nitio
’s
Maastr
ich
t U
pp
er
Are
a C
on
tro
l C
en
tre
Revie
w r
ecru
itm
ent
pro
gra
mm
e A
b I
nitio
’s
Outs
ourc
ed A
b I
nitio
tra
inin
g (
to F
AB
EC
part
ners
)
AT
CO
lease t
o A
ustr
ocontr
ol (2
011-2
013)
Reduce s
upport
cost
ratio
Opera
ting c
osts
Renegotiation o
f ru
nnin
g c
ontr
acts
(perm
anent)
Depre
cia
tion /
investm
ents
Com
mon p
rocure
ment
of
a F
AB
EC
com
plia
nt
New
Voic
e C
om
munic
ation S
yste
m w
ith D
SN
A
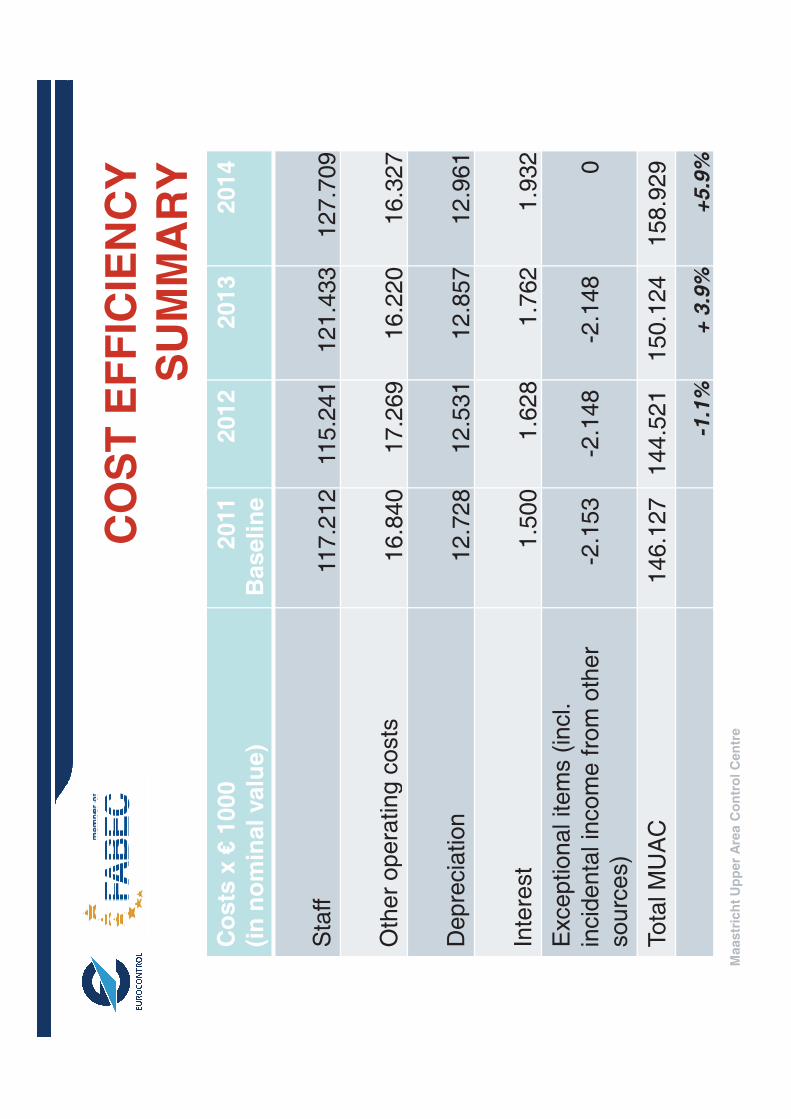
CO
ST
EF
FIC
IEN
CY
SU
MM
AR
YC
osts
x €
1000
(in
no
min
al valu
e)
2011
Baseli
ne
2012
2013
2014
Sta
ff117.2
12
115.2
41
1
21.4
33
127.7
09
Oth
er
opera
ting c
osts
16.8
40
17.2
69
16.2
20
16.3
27
Maastr
ich
t U
pp
er
Are
a C
on
tro
l C
en
tre
Oth
er
opera
ting c
osts
16.8
40
17.2
69
16.2
20
16.3
27
Depre
cia
tion
12.7
28
12.5
31
12.8
57
12.9
61
Inte
rest
1.5
00
1.6
28
1.7
62
1.9
32
Exceptional item
s (
incl.
incid
enta
l in
com
e f
rom
oth
er
sourc
es)
-2.1
53
-2.1
48
-2.1
48
0
Tota
l M
UA
C146.1
27
144.5
21
150.1
24
158.9
29
-1.1
%+
3.9
%+
5.9
%
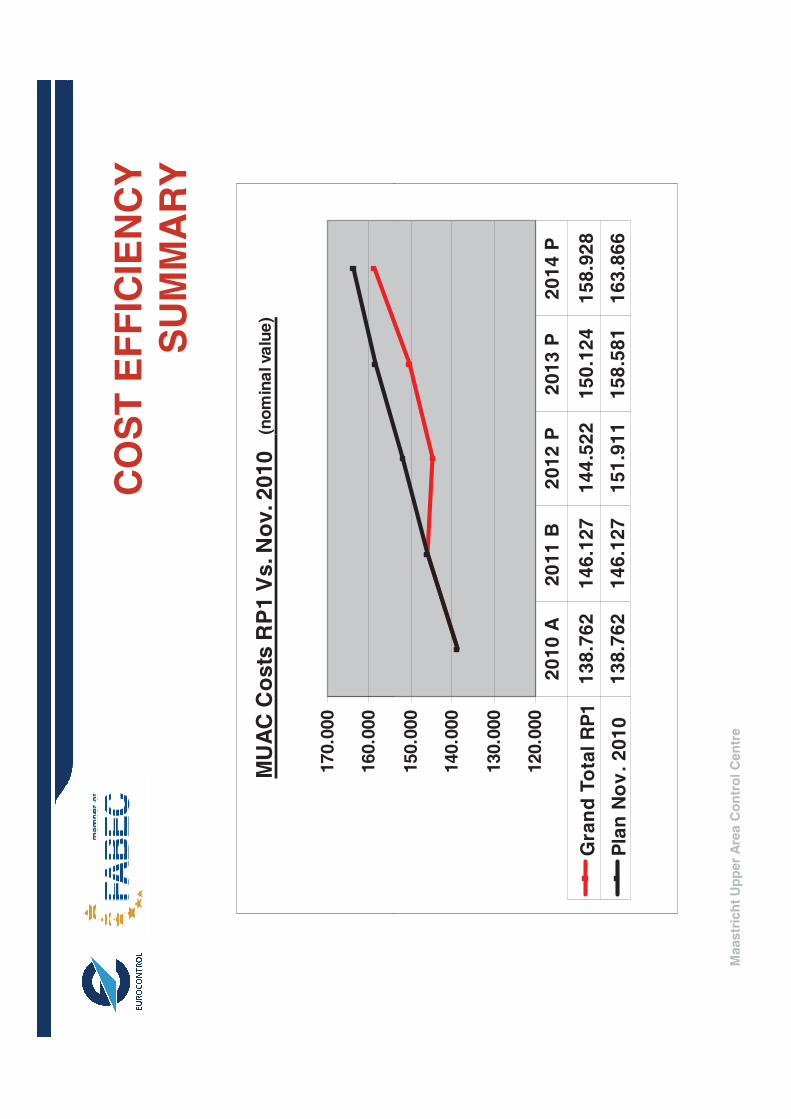
CO
ST
EF
FIC
IEN
CY
SU
MM
AR
Y
MU
AC
Co
sts
RP
1 V
s. N
ov
. 2
01
0 (
no
min
al va
lue
)
160.0
00
170.0
00
Maastr
ich
t U
pp
er
Are
a C
on
tro
l C
en
tre
120.0
00
130.0
00
140.0
00
150.0
00
Gra
nd
To
tal
RP
11
38
.76
21
46
.12
71
44
.52
21
50
.12
41
58
.92
8
Pla
n N
ov
. 2
01
01
38
.76
21
46
.12
71
51
.91
11
58
.58
11
63
.86
6
20
10
A2
01
1 B
20
12
P2
01
3 P
20
14
P
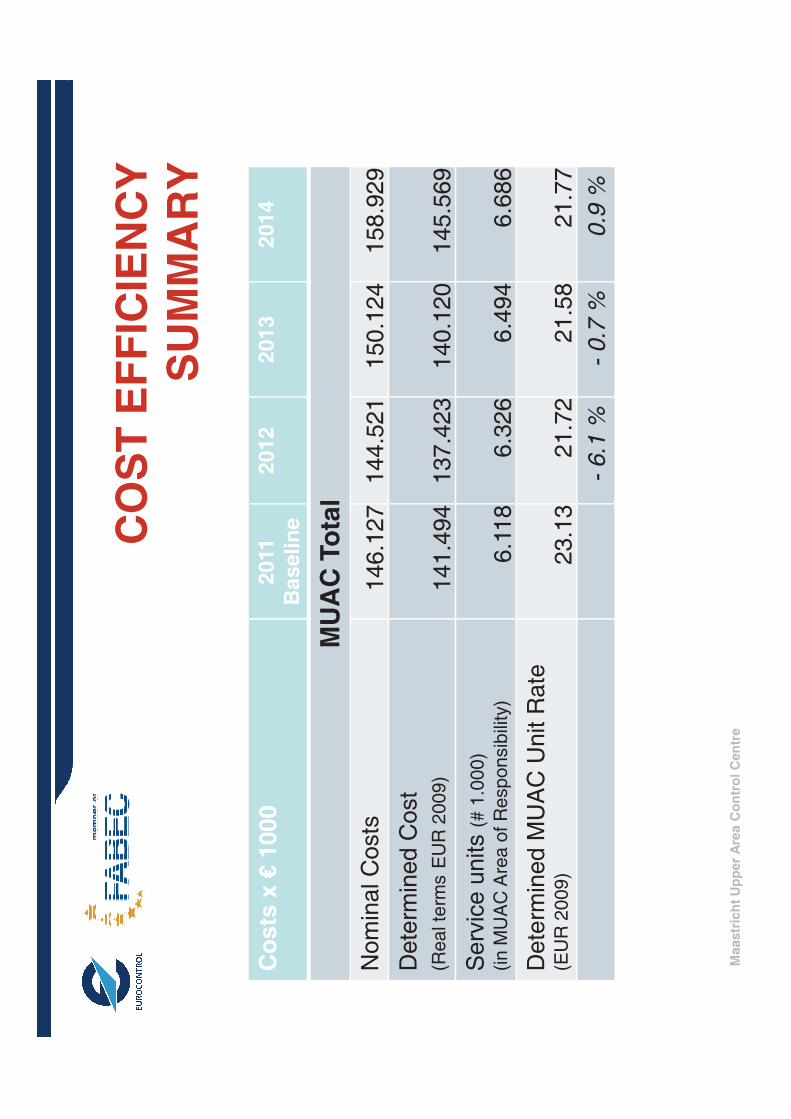
CO
ST
EF
FIC
IEN
CY
SU
MM
AR
Y
Co
sts
x €
1000
20
11
Ba
se
lin
e
20
12
20
13
20
14
MU
AC
To
tal
Nom
inal C
osts
146.1
27
144.5
21
150.1
24
158.9
29
Dete
rmin
ed C
ost
Maastr
ich
t U
pp
er
Are
a C
on
tro
l C
en
tre
Dete
rmin
ed C
ost
(Real te
rms
EU
R 2
009)
141.4
94
137.4
23
140.1
20
145.5
69
Serv
ice u
nits (
# 1
.000)
(in M
UA
C A
rea o
f R
esponsib
ility
)6.1
18
6.3
26
6.4
94
6.6
86
Dete
rmin
ed M
UA
C U
nit R
ate
(E
UR
2009)
23.1
321.7
221.5
821.7
7
-6.1
%-
0.7
%0.9
%
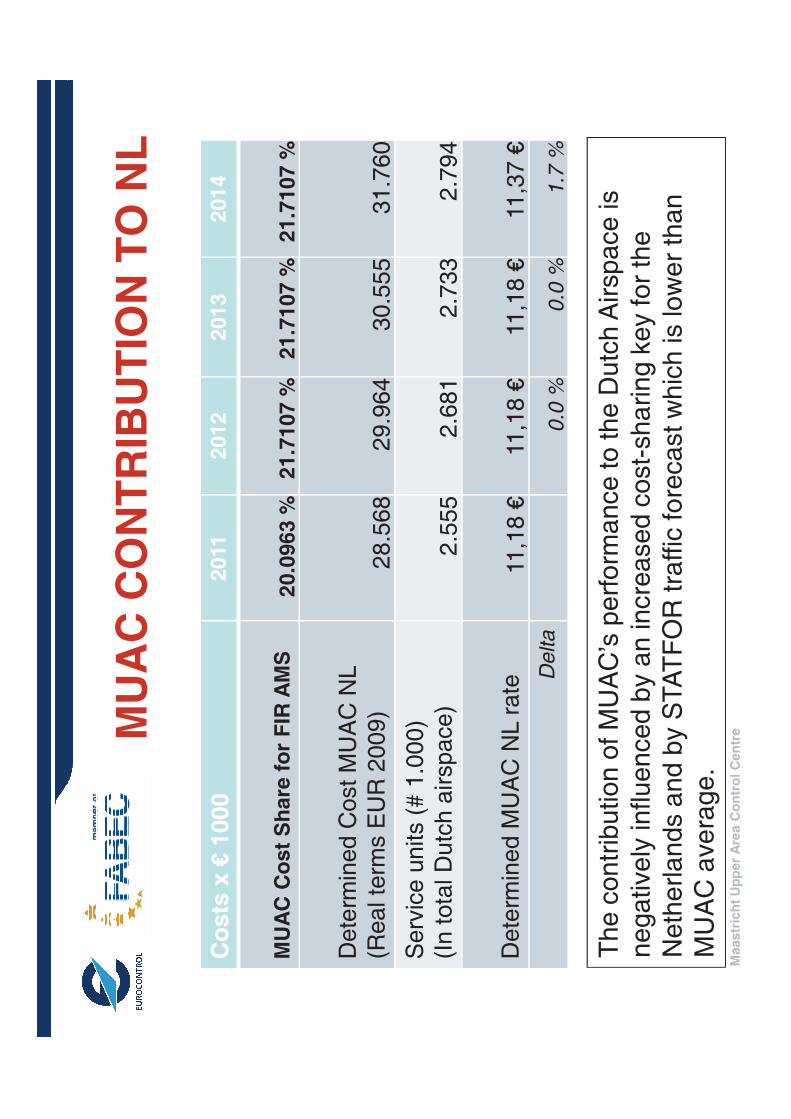
MU
AC
CO
NT
RIB
UT
ION
TO
NL
Co
sts
x €
1000
20
11
20
12
20
13
20
14
MU
AC
Co
st
Sh
are
fo
r F
IR A
MS
20
.09
63
%2
1.7
10
7 %
21
.71
07
%2
1.7
10
7 %
Dete
rmin
ed C
ost
MU
AC
NL
(Real te
rms E
UR
2009)
28.5
68
29.9
64
30.5
55
31.7
60
Maastr
ich
t U
pp
er
Are
a C
on
tro
l C
en
tre
Serv
ice u
nits (
# 1
.000)
(In tota
l D
utc
h a
irspace)
2.5
55
2.6
81
2.7
33
2.7
94
Dete
rmin
ed M
UA
C N
L r
ate
11,1
8 €
11,1
8 €
11,1
8 €
11,3
7 €
De
lta
0.0
%0
.0 %
1.7
%
Th
e c
on
trib
utio
n o
f M
UA
C’s
pe
rfo
rma
nce
to
th
e D
utc
h A
irsp
ace
is
ne
ga
tive
ly in
flu
en
ce
d b
y a
n in
cre
ase
d c
ost-
sh
arin
g k
ey fo
r th
e
Ne
the
rla
nd
s a
nd
by S
TA
TF
OR
tra
ffic
fo
reca
st w
hic
h is lo
we
r th
an
MU
AC
ave
rag
e.
EN
D
The E
uro
pean O
rganis
ation
for
the S
afe
ty o
f A
ir N
avig
ation
Maastr
ich
t U
pp
er
Are
a C
on
tro
l C
en
tre
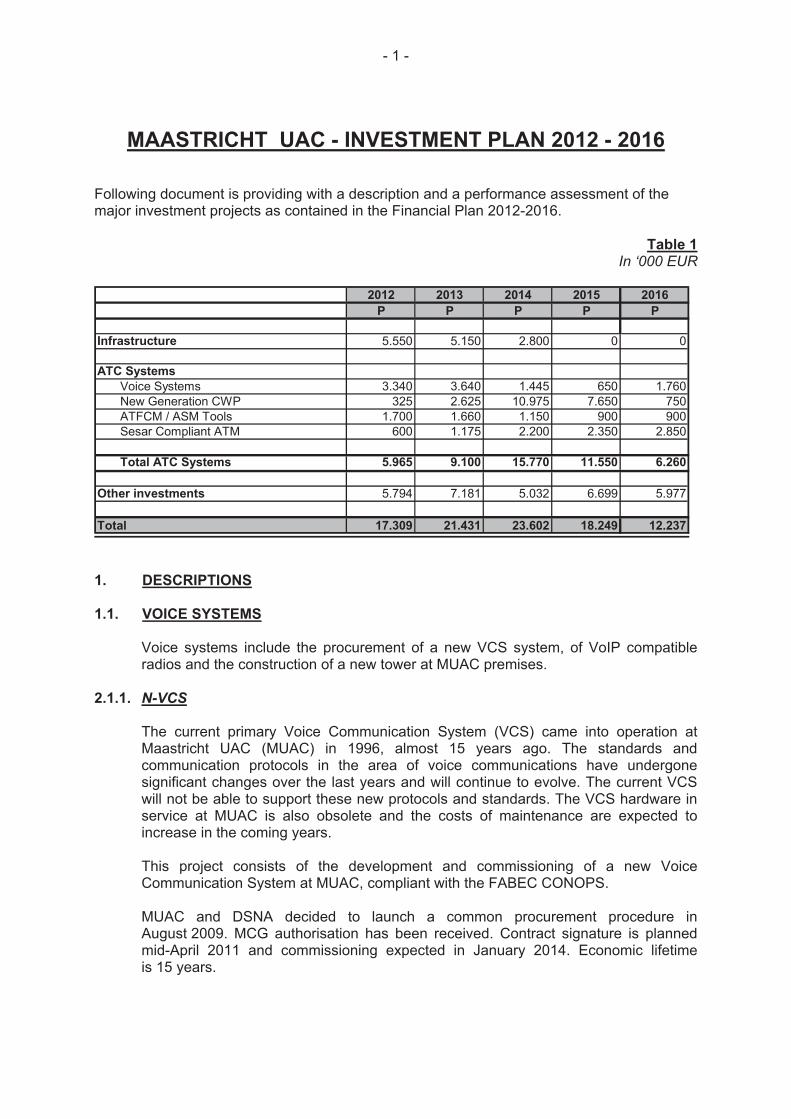
- 1 -
MAASTRICHT UAC - INVESTMENT PLAN 2012 - 2016
Following document is providing with a description and a performance assessment of the major investment projects as contained in the Financial Plan 2012-2016.
Table 1In ‘000 EUR
2012 2013 2014 2015 2016
P P P P P
Infrastructure 5.550 5.150 2.800 0 0
ATC Systems
Voice Systems 3.340 3.640 1.445 650 1.760New Generation CWP 325 2.625 10.975 7.650 750ATFCM / ASM Tools 1.700 1.660 1.150 900 900Sesar Compliant ATM 600 1.175 2.200 2.350 2.850
Total ATC Systems 5.965 9.100 15.770 11.550 6.260
Other investments 5.794 7.181 5.032 6.699 5.977
Total 17.309 21.431 23.602 18.249 12.237
1. DESCRIPTIONS
1.1. VOICE SYSTEMS
Voice systems include the procurement of a new VCS system, of VoIP compatible radios and the construction of a new tower at MUAC premises.
2.1.1. N-VCS
The current primary Voice Communication System (VCS) came into operation at Maastricht UAC (MUAC) in 1996, almost 15 years ago. The standards and communication protocols in the area of voice communications have undergone significant changes over the last years and will continue to evolve. The current VCS will not be able to support these new protocols and standards. The VCS hardware in service at MUAC is also obsolete and the costs of maintenance are expected to increase in the coming years.
This project consists of the development and commissioning of a new Voice Communication System at MUAC, compliant with the FABEC CONOPS.
MUAC and DSNA decided to launch a common procurement procedure in August 2009. MCG authorisation has been received. Contract signature is planned mid-April 2011 and commissioning expected in January 2014. Economic lifetime is 15 years.
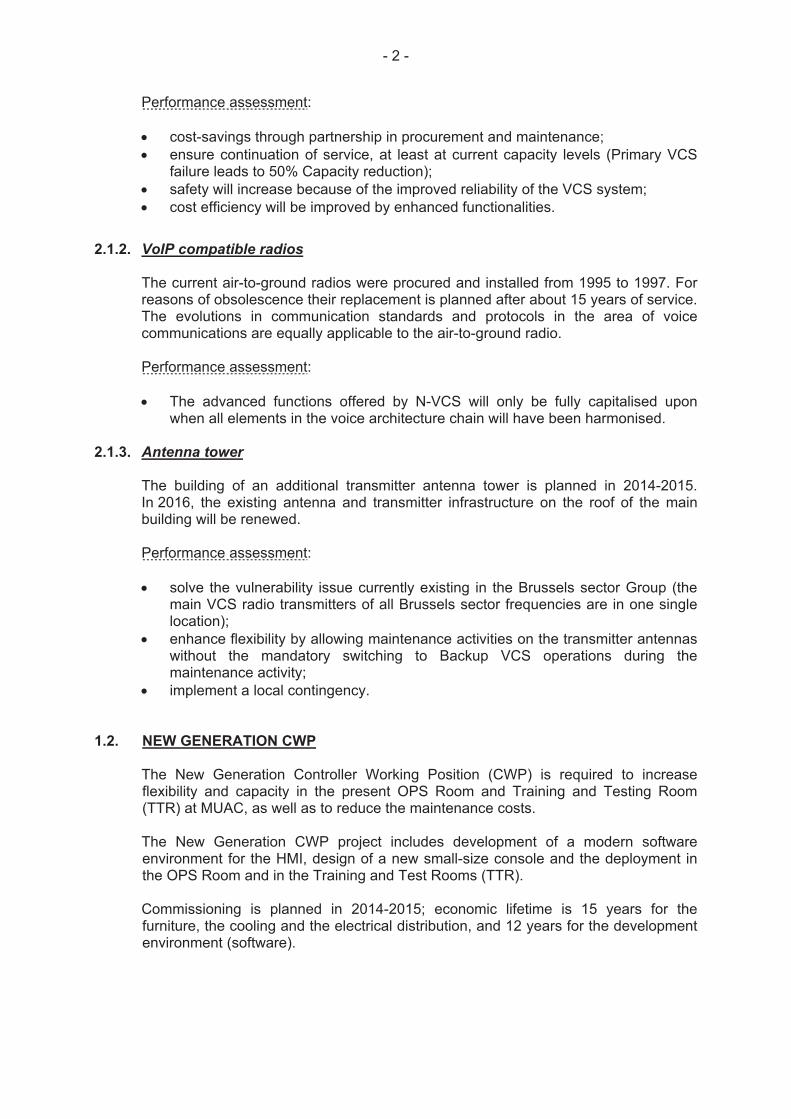
- 2 -
Performance assessment:
cost-savings through partnership in procurement and maintenance; ensure continuation of service, at least at current capacity levels (Primary VCS
failure leads to 50% Capacity reduction); safety will increase because of the improved reliability of the VCS system; cost efficiency will be improved by enhanced functionalities.
2.1.2. VoIP compatible radios
The current air-to-ground radios were procured and installed from 1995 to 1997. For reasons of obsolescence their replacement is planned after about 15 years of service. The evolutions in communication standards and protocols in the area of voice communications are equally applicable to the air-to-ground radio.
Performance assessment:
The advanced functions offered by N-VCS will only be fully capitalised upon when all elements in the voice architecture chain will have been harmonised.
2.1.3. Antenna tower
The building of an additional transmitter antenna tower is planned in 2014-2015. In 2016, the existing antenna and transmitter infrastructure on the roof of the main building will be renewed.
Performance assessment:
solve the vulnerability issue currently existing in the Brussels sector Group (the main VCS radio transmitters of all Brussels sector frequencies are in one single location);
enhance flexibility by allowing maintenance activities on the transmitter antennas without the mandatory switching to Backup VCS operations during the maintenance activity;
implement a local contingency.
1.2. NEW GENERATION CWP
The New Generation Controller Working Position (CWP) is required to increase flexibility and capacity in the present OPS Room and Training and Testing Room (TTR) at MUAC, as well as to reduce the maintenance costs.
The New Generation CWP project includes development of a modern software environment for the HMI, design of a new small-size console and the deployment in the OPS Room and in the Training and Test Rooms (TTR).
Commissioning is planned in 2014-2015; economic lifetime is 15 years for the furniture, the cooling and the electrical distribution, and 12 years for the development environment (software).
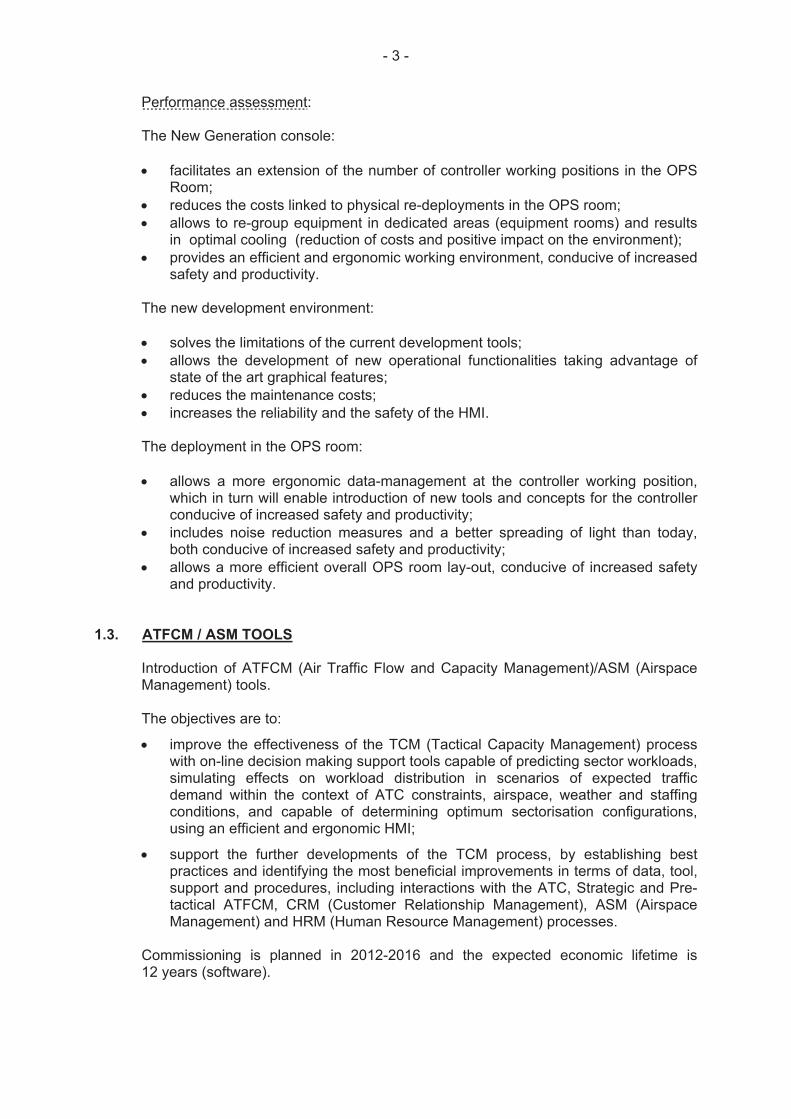
- 3 -
Performance assessment:
The New Generation console:
facilitates an extension of the number of controller working positions in the OPS Room;
reduces the costs linked to physical re-deployments in the OPS room; allows to re-group equipment in dedicated areas (equipment rooms) and results
in optimal cooling (reduction of costs and positive impact on the environment); provides an efficient and ergonomic working environment, conducive of increased
safety and productivity.
The new development environment:
solves the limitations of the current development tools; allows the development of new operational functionalities taking advantage of
state of the art graphical features; reduces the maintenance costs; increases the reliability and the safety of the HMI.
The deployment in the OPS room:
allows a more ergonomic data-management at the controller working position, which in turn will enable introduction of new tools and concepts for the controller conducive of increased safety and productivity;
includes noise reduction measures and a better spreading of light than today, both conducive of increased safety and productivity;
allows a more efficient overall OPS room lay-out, conducive of increased safety and productivity.
1.3. ATFCM / ASM TOOLS
Introduction of ATFCM (Air Traffic Flow and Capacity Management)/ASM (Airspace Management) tools.
The objectives are to:
improve the effectiveness of the TCM (Tactical Capacity Management) process with on-line decision making support tools capable of predicting sector workloads, simulating effects on workload distribution in scenarios of expected traffic demand within the context of ATC constraints, airspace, weather and staffing conditions, and capable of determining optimum sectorisation configurations, using an efficient and ergonomic HMI;
support the further developments of the TCM process, by establishing best practices and identifying the most beneficial improvements in terms of data, tool, support and procedures, including interactions with the ATC, Strategic and Pre-tactical ATFCM, CRM (Customer Relationship Management), ASM (Airspace Management) and HRM (Human Resource Management) processes.
Commissioning is planned in 2012-2016 and the expected economic lifetime is 12 years (software).
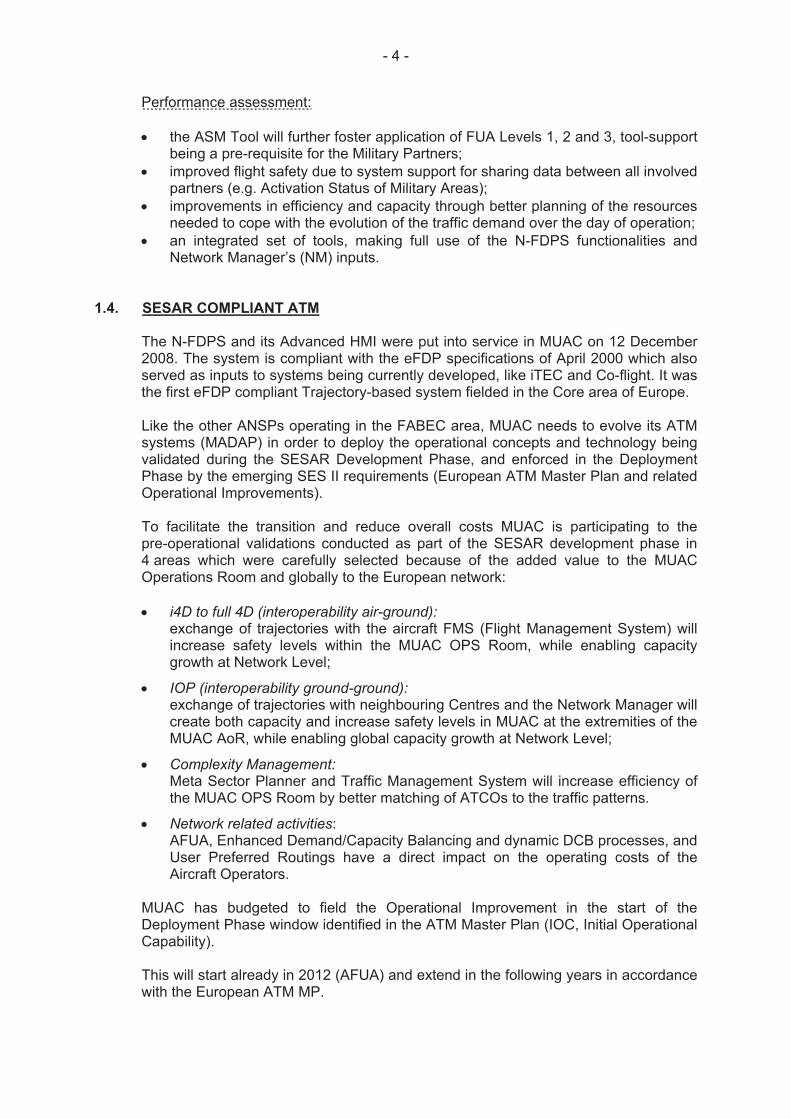
- 4 -
Performance assessment:
the ASM Tool will further foster application of FUA Levels 1, 2 and 3, tool-support being a pre-requisite for the Military Partners;
improved flight safety due to system support for sharing data between all involved partners (e.g. Activation Status of Military Areas);
improvements in efficiency and capacity through better planning of the resources needed to cope with the evolution of the traffic demand over the day of operation;
an integrated set of tools, making full use of the N-FDPS functionalities and Network Manager’s (NM) inputs.
1.4. SESAR COMPLIANT ATM
The N-FDPS and its Advanced HMI were put into service in MUAC on 12 December 2008. The system is compliant with the eFDP specifications of April 2000 which also served as inputs to systems being currently developed, like iTEC and Co-flight. It was the first eFDP compliant Trajectory-based system fielded in the Core area of Europe.
Like the other ANSPs operating in the FABEC area, MUAC needs to evolve its ATM systems (MADAP) in order to deploy the operational concepts and technology being validated during the SESAR Development Phase, and enforced in the Deployment Phase by the emerging SES II requirements (European ATM Master Plan and related Operational Improvements).
To facilitate the transition and reduce overall costs MUAC is participating to the pre-operational validations conducted as part of the SESAR development phase in 4 areas which were carefully selected because of the added value to the MUAC Operations Room and globally to the European network:
i4D to full 4D (interoperability air-ground): exchange of trajectories with the aircraft FMS (Flight Management System) will
increase safety levels within the MUAC OPS Room, while enabling capacity growth at Network Level;
IOP (interoperability ground-ground): exchange of trajectories with neighbouring Centres and the Network Manager will
create both capacity and increase safety levels in MUAC at the extremities of the MUAC AoR, while enabling global capacity growth at Network Level;
Complexity Management: Meta Sector Planner and Traffic Management System will increase efficiency of
the MUAC OPS Room by better matching of ATCOs to the traffic patterns.
Network related activities: AFUA, Enhanced Demand/Capacity Balancing and dynamic DCB processes, and
User Preferred Routings have a direct impact on the operating costs of the Aircraft Operators.
MUAC has budgeted to field the Operational Improvement in the start of the Deployment Phase window identified in the ATM Master Plan (IOC, Initial Operational Capability).
This will start already in 2012 (AFUA) and extend in the following years in accordance with the European ATM MP.

- 5 -
Performance assessment:
The performance objectives were documented in the deliverables of the SESAR Definition Phase.
��������
�
�
� ������������ ���������
������
���������� � ������
���������������
��������
��������������
����� !����������
���������������
"#�����$��%������&��'(�
)#*�����&��'(��
'� �+������,���
��-,�&�(����,�+.��
�$#���$�#������/�������#
���
�
� �*���0�� ����������$�)1��) )���0�������������
2���$�$����������3$� ������������
�,#,����#�����
��������� ��#�4#�"�����&)�����"�(��
�#�5#�*����������&6"1"7�
��#�)#�*�����&��'(�
�#�'#�*����&*���� �"���8�(��
�#�9#�*������&*�������"������(��
�#�:#������&�24�(7�
�#�2#�$��2��8�&" "(��
�#�:#�9��;�&��0� ����(��
��:#�:��������&)")(��
�#�)#�<������ =0��&��0� ����(�
�#� #�<�������&<��(��
�#�<��#�<�����&�>"1(7�
�#�)#���������&'�$��>������>"1(�
�#��#�����8�&6"'"(7�
��#�:#������&��'7�1 �������0�� ���������(7�
�#�?#�@�������&�>"1(7�
�#�*#�@�����A�&�24�(7�
�#��#�?B'�����&6"'"(7��
�#�*#�����$��%��3$���&<��(7�
�#�9#�����58������&�>"1(7�
�#�"#�����$��%������&��'(�
�
� ��
���������������
�
�
��������
�
�
� ������������ ���������
������
���������� � ������
���������������
��������
��������������
����� !����������
���������������
"#�����$��%������&��'(�
)#*�����&��'(��
'� �+������,���
��-,�&�(����,�+.��
�$#���$�#������/�������#
���
�
� �*���0�� ����������$�)1��) )���0�������������
2���$�$����������3$� ������������
�,#,����#�����
��������� ��#�4#�"�����&)�����"�(��
�#�5#�*����������&6"1"7�
��#�)#�*�����&��'(�
�#�'#�*����&*���� �"���8�(��
�#�9#�*������&*�������"������(��
�#�:#������&�24�(7�
�#�2#�$��2��8�&" "(��
�#�:#�9��;�&��0� ����(��
��:#�:��������&)")(��
�#�)#�<������ =0��&��0� ����(�
�#� #�<�������&<��(��
�#�<��#�<�����&�>"1(7�
�#�)#���������&'�$��>������>"1(�
�#��#�����8�&6"'"(7�
��#�:#������&��'7�1 �������0�� ���������(7�
�#�?#�@�������&�>"1(7�
�#�*#�@�����A�&�24�(7�
�#��#�?B'�����&6"'"(7��
�#�*#�����$��%��3$���&<��(7�
�#�9#�����58������&�>"1(7�
�#�"#�����$��%������&��'(�
�
� ��
���������������
�
�
�
�
�
�
�
�
�
�
�
�
�
�
�
��������������������
' ��� ��7���#�����7��C����� ��������������,#,�������$��������������)1��
C�����C����������������� ����������0���� ��*���������$�5��������������#�
' ������� �������$���� �)��A� ��$��1������������������������ ��) )�C�0���
�����C������� ���0��������������00������87���������������$��D���8���C���������$����
�C#�' ��� ���� ��A��*�����������0�� �������� ���������#��
�
��������
������C�������������� ��"���$�#�
�
�
�
�� �������,�������
�
�
�
�����������������������
��#��������$�������� ���� �����������0�� ��0����)1���0�"C������ ���������0�������$�
�8�����#�&4*E���������������� ����������������������������������������
��������������������������������
�
���������������
� !���������� ������"��#�$�#�������������������� �����������
�#�����$��%��������������� ���C��������������� �����������0�� ��0����)1��
� �� � ����������A��������������0����$�8F���������#�' ��0�����������������00��
�����8�0���24����$��>"1����<4�6���$�4)"������ ���������$�������� ������0�����
��8����� ��0����)1�#�' ������������������������ ���������$���� ����$#��
�
% !�����������&'���
�#��������$�������� ���� ��C�������������$�8��������$����� ������)1�#�' ��
0���������0����������C$���$G������8������������������� ��C�0��������00�����0�� ��
�����������7�� ����� ���������������8������� ���������$3����$������#�H���$��24��
���� ������������������������������0���H���� �� ���������$���C��#�9���������
� �����A���0���*������������� ����$����� �������������$������ ��$�0��"1 �
�C������������ ���������0�"'1?���������������0����������7��������
�IC������ ����24��$�������� �� ���������0�"'1?�����������������0���00������
���������$�$�������#��24�� �����C����8�������������� ���������������0�"'�
1?�����������&�����������8(7���������$������$3�������0�����������������00�����$�
� ��0�������7�����������$����� ��������������������������"'1?���I���$�8���00�
� �����00���$����������$���8����A�� ����$�8��� �����00�����������#��
�
�#������� ���C�������� ��������24��������������&"""��C��������7�5"@ !�
��$�������8(����� ��0�����0������C���$#�6�0��������C�C��������� ��0�� ��
������������ �����������������C����0�� ����0��������0��� ���)1�#�"��������$��
����$����� ������)1�����������������������C��������������������#�"���C ����
� ������� �� ��$���8��������������$��8���������8�����0������������ ��C����
8���#�������C����� �������D��������0�� ���8�����0���������� �� ��$���8�����
����������$�8���� ��������������87�� �� ������������,������$�������������#�6��
��������������������8����C������������������0�� ���������8�$���C�������0�� ��
�8����#���
�
�#�*������������$�������� ������C��$����� ��C�������)1��� �������0���������
������ �����������$���� � ����������������$� ������$���A������IC��������#��
�
�#�������IC������� ����24��������� ��C�������0���C�������� ��������"""�
� �� �$�����0�����..#�6�������$�����$�� ��7�����������8���#�' �� �$����
��� ���������$��0���0���8��������������$����$���������C����$#�1��C���������0�����
���� ���� ����0��������$�C��$�������� �� �$����0��������������7����� �� �$����
���$���������C����$��������#�6���$$������� ���8��������$��������) )"@����C������
��$������C���������9"* 1#�"�� �����������$�������������8�����E�1�0��� ����$�
6����#�' ������������ ������C��������0���24�#��
�
�#�*���������������������8���8����� ��� �� ���������$�� �������C��������������
9����������8��.� �����7������ ���)4"� ���� �������$�00������8����#�' ���
����������� ����������������$������ ������ ��24����$�)4"����9"* 1�C���
���#�' ���$���������������8�������00���������$���������������������0����������
����� ��#��
�

�
�� ���������������
�
�#��������$�����$���#�*���������F��C����7�������$�������� ����24�� ���� �����
���8������C������������������$�$�#�' �������������������0�$�00��������������� ��
$�00�����"4)������� ����8�"'���������$����#��24��$�������� ����C�C�����C�7�
������ ��� ������$��24��$�$�������������������A7��������������� ��������� ���
�����I����C�����������CC������00�0�� ��$������ �������C�#�����IC������ ������
���,��8���������"'������������� �������������$���$�����$�$���$#��
9�� ����7�� ��$�00������8�������������������C�����#�?����C��0�� ��7����C����
������������������������������0�������������������������������������IC��$��
����#��
�
�#�9��;�����$���A������IC���������0��� ��$�00��������������� ��0�������$����
����������IC��$�������0��24��&J�+���������(����$�9)�&�J�����������(#�' ���$����
��������������A�������������$�����9)������� �������� ����24�#��
�
�#��������8��� ������C������ �����F������������������0�����0��� ���������
������������������������$�����C����#�)��� ���0����������0������$�������#�6���������$����
� ���������C���������������0�"""#�' ���8��������������$�����C�$��8K0��" 4"7�
9)7�4"')���$��24�7���$�0����� ����C�������������8���������$�#�60������C��
��������$�����C�$�0������C�����7�� ����������$���$�$���������� ����C�����#�
?��8�� ������C���0������C���������$�����C�$�0������C��������C��87�� ���C��8�
��������H��0�� �������#��
�
�#�<���������$�������� ��� ������$���A�����A�����0���$� ���� ��������00�����������
�����A�������������������� �������������$��������#��
�
�#�������IC������� ���� ����������C���������8��0�� �������������*��$��0��24�#�
' ���C����������D��������������A����������������C�����0��� �������������7�
� �����D������������� �����������$����7�� ����0����� �����������K��$������
���������0�������8�����������$����7�������$�������C�������������������A�$��������$�
��C������7������$������A�����������7���������C#���
�
�#�$��2��8�����$���A��������������������� ������0������������������������
��$������� ����� ���9"* 1#��
�
�#�������IC������� ����24��������C���������� �9)#�6�' 1����C����0������$��
0����87������8�61")#�9)� ������ ��������������� ��$�����C�� ����8����#�"�$��0�
C��������4"')���$�" 4"����������������$#����� ��6�' 1�C����0�� ���) )"@�C��
�����#�' ���$��������� �������0������C�������������$#�?��8�� ������������$�$�
�����8�0��)� �C ����24����������������$���$����8����� ���������0����������������#��
�
�#�@�����A������C����������� ���� ������3���������������������C�0������$7�����
��������$��$������A����C�����#�?��8������� �8� �����������A���������C���
������������ �������������������C����0�� ��������������$�$�C����������������A��
C����#��
�
�#�<�����������$���A�����A����� �� ���24������$������$�������$�C��$����
������������8�����I������C��8���� ���������������������� ������0�����0�� ��
�������C������������ �9)7������������ �������A���$�4���8� ����$���#��
�
�#��������$�������� ���� ��"""��C����������������3��C�3����0���24����$�
� ���� �8�����$������$�� ������I�������IC�������$��� ����A���$����������I�
C�����#�������7��24������������0������0� �$������ ��$��������$��C������� ���
� �������8����K���C�������0�������������� ���IC���������K$��������$������� ��
��������IC����$#��
�
�� ���������������
�
�
�#�9��;���$�������� ���0��� �������� �����00���������� ���������C�����������
��$�� ��������C���� ���H#�6���$$�����7��$3��������0��������������IC����$�������
����������#��
�
�#�������IC������� ���� ����IC��$�������������$��������������� ���$��������0�
��A������ ���������������� �������8�������$�� ��C���������������������0��24����� �
� ��������8�C���$��� �� ���������������$��$���$���$�������������������� ��
������#��
�
�#�*����������������$���� ���� ������������ ������8���������8���C���$�������� ��
)1���0����"C��#�?��8�+��<���������������������0������������#�' ����������3��$���
�CC��������#����������$�������� ����24����������� ����C��������������� ��
��� ��8���$�� ��0���� ��C������������C������������������ ��������#��
�
�#�����������������8�C���������� �����00��������$��C������������0�������
����#��
)��00������������ ��������������������������,�$��������0���������������7�C�������
0��$����$��������$����$�0��"'1?�#��C�������������������8�����$������� ��
0����� ���"""� ��������$�C������$����C�����8#�������7�$�C�������������������
�������������� ���������������������������8����� ����������C�������$#���
�
�#�?F'�������$�������� �������$8�D����������0���������00��$�������� ������A���
C����#��
�
�#�������IC������� ������00����������$���$��8���.�9' ����� ����$��0�����#����
���������� ���� ���������0���CC������00��������0�� ���$���$��8��������$�
����������7������ ���������������8����#�' ����.�9' �����0�����$����� �����������7�
� ��C��������0�� ���$����������7�����������������8���A��8�� ���� ����������A��C�����
���@��#��
�
' ����#������C�������� ��$�������$�������������#�' ��0���������� �������
�����$������� ���� �� >���$���������������#��
�
"��0��� ���24��C����0�� ��� ������������������#���������A��� ��E���
• ������������������������$G��
• � ���00������0�� �����������������������������������������$�$G��
• � ������$�����C��0�����D���8���C��������$����$��������8��8���'�&5��(���$�
�24�G��
• � ��$�0�������0����.�&������������������(���$������&�+#+��������(� ����������
������$E��
�
"��$����������� ��0�����24��� �����������������������������������H����$���
�$����������� ���24����������� �����������������������8���H����� ��C���$�
������������&������$��0�� ������$��C��������������������0�-�H(������H����
��������C�������#�6��� ��8�������,���$������� ����������A�C������ �����������
��#�' ������ ������$�C��$���������00���$�����C�����#�6��������������0�����������
�����$���������0���� ���������������������� �����00������� ����������$�������$�
�����#��
�
�#�����8�����$���A�����A���� ���� ��������0���C�����������������$#���@�����A�
�IC������� ���� ���������� ���������0������������0������� �������#��
�
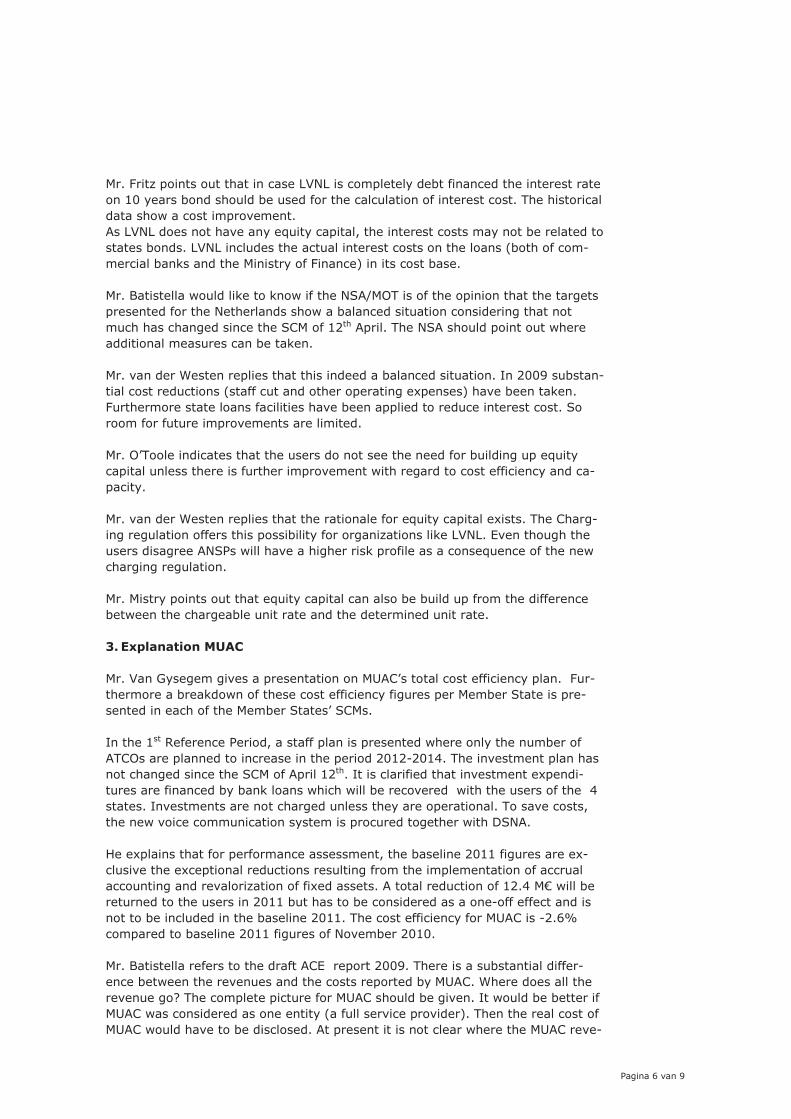
�
�� ���������������
�
�#�9��;�C����������� ������������24��������C�����8�$����0������$�� ��������������
������8�������$�� ���$�������$�0��� ���������������0�������������#�' �� ���������
$����� ������������C�������#���
"���24��$�������� ������8��D���8���C����7�� ������������������8�������������$����
����������$�#��24�������$���� ��������������������������� ��������&��� ��0�����
����������A����$�� ��������8��0�9������(�����������������#��
�
�#�*��������������$���A�����A�����0�� ��4)"K�?'�����0�� ���C������� ���� ���������
C������$�0��� ��4�� ����$��� ������������$����������������$������ �������
��� � ���� ����$�������� ��)1���0���� �"C��#�' ��4)"�� ���$�C���������� ���
�$$�������������������������A��#��
�
�#�����$��%�������C������ ���� �����$��$����������$����������#�6���������������
�����������$��������&���00�������$��� ���C��������IC�����(� �����������A��#�
9�� �����������������0���������� ����������CC���$�����$����������������#�)��
����0��0�������C������������������$#��
�
�#�?F'�������$�������� ���� �������$����������� �����$�0������$�����C��D���8�
��C������������� ������0�� ����C����������� ����$����������00������8���$����
C����8#��
�
�#�����$��%�������C������ ���� �����������0���D���8���C������I����#�' ��1 ���
���������������00���� ���C���������8�0�������;���������A���24�#� ����� ��� �� ��
�����$�������"4)�������� ������ �� ����A�C�0��������������D�������0�� ������
� ���������������#���
�
�#�����8�C����������� ����D���8���C���������������������$��C�0���� ��$�00������
��������� ��� �������������������$�� ��$�������$���������#��
�
( !���������� )����
�
�#�2���58��������������C���������������>"1F��������������00������8�C���#��9��
� ����������A$�����0�� ����������00������8�0������C��������)��������C��
�����$������� ��0�� ��������)�����F�)1��#���
�
6��� ������@�0����������$7������00�C�������C������$�� ������8�� ���������0�
"'1?�����C�����$���������������� ��C���$����������#�' �������������C���� ���
����� ����$�������� ��)1���0�"C������ #�6���������0��$�� ���������������IC��$��
��������0������$��8����A�������� �� ���������������$����� �� ��������0�� �����
������#�6������������������� ���$��������� �8�����C��������#�'������������7�
� ���������������������������8��������C����$������ ����� �)4"#��
�
����IC������� ���0��C�0�����������������7�� ����������������0����������I�
��������� ���I��C��������$�����������������0���� ����C�������������0��������
�������������$�������;�������0�0�I�$�������#�"��������$��������0���#���J���������
�����$����� ������������������� ��������������$��$�����������00��00������$����
���������������$�$����� ���������������#�' ��������00������8�0���>"1������#�H�
���C��$������������������0�������0�4�����������#��
�
�#�*�����������0������� ��$�0��"1 ���C�������#�' ��������������������$�00��
�������������� ������������$�� ���������C���$��8��>"1#�% ���$��������� ��
���������L�' �����C�����C������0���>"1�� ���$���������#�6������$�����������0�
�>"1����������$��$�������������8�&��0�����������C���$�(#�' ���� ������������0�
�>"1�����$� ����������$�������$#�"��C���������������������� ���� ���>"1�����
�
�� �������+�������
�
����$���CC������#�6�������������C�������$�����$�C��������3��C�$�;���>"1F��
0����#��
�
�#�2���58�������IC������� ����������8����$���CC����������� ����>"1��C������
���� ���CC�����C�������������������� ���� �������������������#�6��0���7�� ��$�0�
0������� ����0����������C���� ������������$8�0����CC������������������
���C���#�
�
�#�<�������$�������� ��7�����$�������� ��������� ��"�������7��>"1���������
��0�����������$����������������0����0�� ����0���� �����>"1��������&14)7�
"6)7�� '(#��>"1����C����0�� ���8����7�� ��0����>"1���������C����0�� ���8��
���#��
�
�#�*������������$�������� ���� ������ ������ ������7������ �����������������C����#�
"�$������������� ��� �����������������0���>"1�����������������0�����������������
�����$�$#��
�
�#�?F'�������������� ���� ��������������C��������������4��������������� �
���$������C����8���$�C�$�������87������������ ����$����������00������8#��24�7�
4)"���$�<4�6�������������������������8������� �������7����������>"1#��
�
�#�����$��%������C����������� ���� ������� �������D�������0�� �������� �����A�8�
� ��� ���������$���$�����������$���������������������������#�' ������� ��������
� 8��>"1����$���������������$������� ������$���������������������������� �����
$���$�������C�������� ��4�� ����$�#�60�� �������� ������00��������$� ���������
��A������7������ ����� �C���$�������$� ������������������ �������#��
�
�#�9��;���$�������� ���� ���������$���������0���>"1��������7���������������
����C����������� ���� ����������$��������$������ ����������#�6������������8����
� ���� ����>"1������������8����$�������$� ���� ���������$������������$���$�$�
����� ����������#��
�
�#�:������C����������� ���� ����$�������0�) )��������������00����������C�������#�*���
��0��������8�� ������������$������0�� ������� ���������0��>"1�"'1?�����8�
������������@��#��������$���A�����A����� �� ���>"1� �������8;�$� ������8�
"'1?������$� �������������$��0��>"1�����$�C���$���������������������������
�����CC������C����������$��0����CC�����C����#��
�
�#�<������������� ������ ��������8���� ����������������$����#�*�������������
$���������$�� �������������������8����������;�������00���0��������$�00��������
����������C�����&��$�� �������������C���(�����$��������C������������$�����
����$��0��������������$������ �� ����$����� �� ��C�$�������8���$������������0�
�����#�' ���������C��������� �� ��>)"�������7��I��C��0��� ������������$������7�
� �� �������C�����8�$�00����#���
�
�#�9��;�C����������� �����������������������$���H����������������$�����#�
)��00������������������$��8���H#��������� ���������������0����00�$�$���������
���C����8#�)���������������0�� ������8������������� �� ��� �����0������#��
�
�#�����58�������IC������� ���� ��C�������������C������0��� ������8���������
����#�H��������8�����@���� �������7�H���0����������0�������$#�)�7�� �����������
������������#�H��������8#�������7����������00���������������$������8�� ��������
������0����00�9' ������ ���C���$#�
�

�
�� �������.�������
�
�#�����8�C����������� ������������������� ����24����$��>"1����������$��C��D���8#��
�
�#�������C������ ����D���8���C�����������������$��C����� �������I���0E���
� @�$��������0�����G��
� '�00���$�����C�����&��������������C����(G��
� @�$��������0�� ��� ����������������G�
� "����������$���������� �������������00�����$�����������;�$���$�� ����������
���00�����$����������H���� �8��G��
� 6�����$��24��C�C���������$����� ������������������00���� ���H���$�� �����
��������00���� ���H�0��� ��0����8������@�����$�� ���������0���#��
�
�#�����8�C����������� ���� �������������$�����C��D���8���C������ ��� �����
� ����7�� ��0�����������$���������������$#������$�������� ���6"'"������� ��A�
��� �� �� 1����� ���������0��D���8#��
�
�#�������IC������� ���� ���������������������24����$���'��������8�����$�
������8�.� #�6�����C������$����� ���)1�#�9�� ������ ����������������$�������� �
���� ��:���� �����$����������7�� �� �������� ���00�������������������������#���
�
�#�����8���������$�������� ���� ����������$���������������$����� ���������������$�
�����C��0��D���8���C����#�*�� �� ����'���$�"4)�F�����$�����������C��������� ���
�����#��
�
�#�*������������$�������� ���� ��C��������� ����$�����D���8������ �������������
������ �$���� �� ����������C���������� �� ��4)"��������� ��#�' ���������������
C����#�' ��C������� ���$��������0��$#��
�
�#�������C������ ���� ��� ������������������������������$�$����� ���C������
�������0��� �� �1���������������:���7���$�� �����������������������$�� ��#��
�
�#�����$��%�������$$��� ���� ���)1��0����������C�0������7�� ������ ��
����$�����C��0��D���8���������$����� ��� ������������������ �� ���������$�������� �
������ ���8��#�%��������������C�������$�� �����������������������$#��
�
��������������$���� �����������8�������������0������8����������00������8#��
�
• �24�E��24�F��������$�C�0���������� ������C����8���$�������00������8�0��
� ������@�0������C���$�������$#�������7�� ������D������������ ����$����
� ��������������������������0������#���������C����8�������$�$����� ������
������������������� ���������0�� ������$�����C��0�� ���D���8���C����#�>�������$�
��������������$����� ��������7����� �8������C�8�0����#��
• ��>"1E�1��C��$����� ��4������������$���7���������C�������� �����A���
C�������� ����$������C����8���$�C�$�������87������������ ����$���������
�00������87�� ������24�7�<4�6���$�4)"������������������� �� >���$�����
�������#�6����� ��������A�����$��$�� ���� ������� ���������0�� ���CC����������0�
� �������� �����A�8�� �� ���C�$������ ��������00����������������$��8��>"1#�
��������C����8�������$�$����� ���������>"1�������&�����$����� �������0��
14)���0����������0�� ���� ��"4)������$��8��>"1�0����0�� ���(7�� ��$���
����������0�� ���������>"1������������ ����)��������$��>"1F����������
&�����������������$�C��)������0������(#��
�
• <4�6���$�4)"������ �������������$�������$����� �8�����$�������� ������0���
����8�$������ ��0����)1�#�<4�6����������������$�����I��C���0��� '�C���$�
����8��$����������������������� ���������+H��������#��
�
�� ���������������
�
• ��'����������������� ��A� ���� �������������������D���8������ ����������$����
��$��������������A����� ��C�����#���
�
'*+��
���������� �����������������������!��������� �����"������ ����!��#�$#������%
������������&������������ �������!���������������!�����������������'����
&��������(���������
�
���������� �������������������������)���$�������*�����������*�������(���
&����������+���������!���������������������������,�-&(�*�����������*������
�
�
Related Documents