eScholarship provides open access, scholarly publishing services to the University of California and delivers a dynamic research platform to scholars worldwide. Center for Tobacco Control Research and Education UC San Francisco Title: The Mississippi Social Climate of Tobacco Control, 2000-2001 Author: McMillen, Robert C PhD , Mississippi State University Frese, Wolfgang , Mississippi State University Cosby, Arthur G , Mississippi State University Publication Date: 12-01-2001 Series: Reports on Industry Activity from Outside UCSF Permalink: http://escholarship.org/uc/item/0w0811g4 Keywords: mississippi Abstract: The Social Climate Survey provides a method to monitor changes in social and environmental objectives, as well as an institutional framework to organize and interpret these results. This approach operationalizes the concept of social climate into a set of quantifiable social and environmental indicators - organized within an institutional framework. Social scientists typically conceptualize societal changes as occurring through changes in social institutions, such as the family, school, work place, and government. As a fundamental component

Welcome message from author
This document is posted to help you gain knowledge. Please leave a comment to let me know what you think about it! Share it to your friends and learn new things together.
Transcript

eScholarship provides open access, scholarly publishingservices to the University of California and delivers a dynamicresearch platform to scholars worldwide.
Center for Tobacco Control Research andEducation
UC San Francisco
Title:The Mississippi Social Climate of Tobacco Control, 2000-2001
Author:McMillen, Robert C PhD, Mississippi State UniversityFrese, Wolfgang, Mississippi State UniversityCosby, Arthur G, Mississippi State University
Publication Date:12-01-2001
Series:Reports on Industry Activity from Outside UCSF
Permalink:http://escholarship.org/uc/item/0w0811g4
Keywords:mississippi
Abstract:The Social Climate Survey provides a method
to monitor changes in social and environmental
objectives, as well as an institutional framework
to organize and interpret these results.
This approach operationalizes the concept of
social climate into a set of quantifiable social
and environmental indicators - organized within
an institutional framework. Social scientists
typically conceptualize societal changes as
occurring through changes in social institutions,
such as the family, school, work place,
and government. As a fundamental component

eScholarship provides open access, scholarly publishingservices to the University of California and delivers a dynamicresearch platform to scholars worldwide.
of a society, these social institutions emerge as
clusterings of beliefs, norms, and practices.
Moreover, beliefs, norms, and practices about
tobacco use and tobacco control have evolved
in each of these institutional areas which then
shape the status of tobacco use in the social
fabric of American society. The Social
Climate Survey consists of a set of questions
designed to measure the norms, practices, and
beliefs concerning tobacco within each of the
following institutions; 1) Family and Friendship
Groups, 2) Education, 3) Government and
Political Order, 4) Work, 5) Health and Medical
Care, 6) Recreation, Leisure, and Sports, and 7)
Mass Communication and Culture.
Tobacco control and tobacco use is not carried
out in a vacuum. Youth and adults make
choices about tobacco use in the social context
of institutional beliefs, norms, and practices.
Copyright Information:All rights reserved unless otherwise indicated. Contact the author or original publisher for anynecessary permissions. eScholarship is not the copyright owner for deposited works. Learn moreat http://www.escholarship.org/help_copyright.html#reuse

The Mississippi Social Climate ofTobacco Control,2000-2001
Robert Cameron McMillenWolfgang Frese
Arthur G. Cosby
SSRCSocial Science Research Center
www.ssrc.msstate.edu

ACKNOWLEDGMENT
The Mississippi Social Climate Survey of Tobacco Control was made possible through supportprovided by The Partnership for a Healthy Mississippi through The University of SouthernMississippi. The opinions expressed herein are those of the authors and do not necessarily reflectthe views of The Partnership for a Healthy Mississippi or The University of SouthernMississippi. Additional funds were provided by the Rural Health, Safety and Security Instituteof the Social Science Research Center at Mississippi State University through a grant from theOffice of Rural Health Policy, U.S. Department of Health and Human Services(1DIARH0000501), as well as the Mississippi Agricultural and Forestry Experiment Station.The survey is an attempt to contribute to the understanding of tobacco control through the intro-duction of an institutional-based perspective that stresses not simply individual variations inbehaviors and attitudes, but rather attempts to use cross-sectional survey data to monitor trendsfor societal norms, practices, and beliefs surrounding tobacco.
The origins of this report can be traced to research associated with the tobacco settlement inMississippi. Resolution of the State of Mississippi's tobacco fight allowed the state an opportu-nity to confront the leading cause of preventable death in America - tobacco use. According tothe CDC, tobacco use is responsible for one out of every five deaths and claims more lives everyyear than AIDS, alcohol, drug abuse, car crashes, murders, suicides, and fires combined. Theaddiction kills more than 4,000,000 worldwide each year. However, if a person can be prevent-ed from using tobacco before reaching the age of 18, then there is only a one in ten chance thathe or she will ever become addicted to tobacco.
By collectively harnessing the resources of the private and public sectors in the state, Mississippiis waging war against the single largest killer in our society. Organized as a non-profit corpora-tion composed of more than 60 statewide public and private organizations and over 600 localorganizations, The Partnership for a Healthy Mississippi and the Mississippi State Departmentof Health have implemented a comprehensive program to reduce youth tobacco use and promotehealthier lifestyles for Mississippi's young people. This public-private partnership has a goal ofcreating a healthier Mississippi and eliminating tobacco use among Mississippi youths throughadvocacy, education, evaluation, awareness, enforcement, research, and service.
We developed the social climate approach to help the Mississippi Tobacco Control Foundation- The Partnership for a Healthy Mississippi and the Mississippi State Department of Health -monitor the degree to which their efforts were impacting the social fabric of Mississippi. EllenJones and Sheila Keller, formerly of the Mississippi State Department of Health, and VivienCarver and Bonnie Reinert, at the Partnership for a Healthy Mississippi, worked closely withus in the development of a social climate survey. The design of the survey instrument was basedon an extensive review of extant instruments such as the Behavior Risk Factor SurveillanceSystem, the Current Population Survey - Tobacco Supplement, and the California AdultTobacco Survey for the purposes of data set comparisons, supplemented by additional itemsneeded to flesh out the social climate concept. The reliance on existing measurements was great-ly enhanced by the review and excellent advice from the Office of Smoking and Health of theCenters for Disease Control and Prevention (CDC).

TABLE OF CONTENTS
ACKNOWLEDGMENT . . . . . . . . . . . . . . . . . . . . . . . . . . . . . . . . . . . . . . . . . . . . . . 2
TABLE OF CONTENTS . . . . . . . . . . . . . . . . . . . . . . . . . . . . . . . . . . . . . . . . . . . . . 3
CHAPTER 1 . . . . . . . . . . . . . . . . . . . . . . . . . . . . . . . . . . . . . . . . . . . . . . . . . . . . . . 4Introduction and Methods
CHAPTER 2 . . . . . . . . . . . . . . . . . . . . . . . . . . . . . . . . . . . . . . . . . . . . . . . . . . . . . . 11Family and Friendship Groups
CHAPTER 3 . . . . . . . . . . . . . . . . . . . . . . . . . . . . . . . . . . . . . . . . . . . . . . . . . . . . . . 27Education
CHAPTER 4 . . . . . . . . . . . . . . . . . . . . . . . . . . . . . . . . . . . . . . . . . . . . . . . . . . . . . . 34Government and Political Order
CHAPTER 5 . . . . . . . . . . . . . . . . . . . . . . . . . . . . . . . . . . . . . . . . . . . . . . . . . . . . . . 43Work
CHAPTER 6 . . . . . . . . . . . . . . . . . . . . . . . . . . . . . . . . . . . . . . . . . . . . . . . . . . . . . . 53Health and Medical Care
CHAPTER 7 . . . . . . . . . . . . . . . . . . . . . . . . . . . . . . . . . . . . . . . . . . . . . . . . . . . . . . 62Recreation, Leisure, and Sports
CHAPTER 8 . . . . . . . . . . . . . . . . . . . . . . . . . . . . . . . . . . . . . . . . . . . . . . . . . . . . . . 77Mass Culture and Communication
CHAPTER 9 . . . . . . . . . . . . . . . . . . . . . . . . . . . . . . . . . . . . . . . . . . . . . . . . . . . . . . 86Conclusion
CHAPTER 10 . . . . . . . . . . . . . . . . . . . . . . . . . . . . . . . . . . . . . . . . . . . . . . . . . . . . . . 88References
ABOUT THE AUTHORS . . . . . . . . . . . . . . . . . . . . . . . . . . . . . . . . . . . . . . . . . . . . 89

INTRODUCTION
What We Know About Tobacco UseBeginning in 1964, a series of reports from theOffice of the U.S. Surgeon General have syn-thesized researched-based knowledge aboutthe health consequences of smoking and otherforms of tobacco use. Efforts to highlight thenegative effects of tobacco products com-menced, beginning immediately with theFederal Cigarette Labeling and AdvertisingAct of 1965 followed by the Public HealthSmoking Act of 1969. These activities initiat-ed one of the most successful campaigns in thehistory of public health. Over the last severaldecades, an impressive body of health researchhas defined the health impacts of tobacco useon the American population. Few topics havebeen as carefully and thoroughly researched,and even fewer research findings have con-verged on such a consistent set of results.
These findings bring with them a clear mes-sage that use of tobacco products bring majornegative health impacts. Cancer, cardiovascu-lar diseases, and a number of other healthproblems have been linked to tobacco use(U.S. Department of Health & HumanServices, 1982, 1983, 1984, 1985, 1990). Thelife span and quality of life of individualsthroughout the country who use tobacco prod-ucts - as well as nonsmokers in environmentsof second-hand smoke - have been substantial-ly decreased (CDC, 1993; Thun, Day-Lally,Calle, Flanders, & Heath, 1995; U.S.Department of Health & Human Services,1986). Perhaps most importantly, tobacco hasbeen recognized as the primary cause of pre-ventable death in the United States (U.S.Department of Health & Human Services,1989).
And yet, there remains a substantial subculturethat has remained untouched by theseadvances. Although there are some differenceswith respect to race/ethnicity, gender, andregion, the magnitude of tobacco use in thesesubpopulations is sufficiently large that practi-cally no sector of the U.S. population escapesthe impact of the problem.
The Social Climate ApproachNo single factor is likely to emerge as the"magic bullet" that will lead to the near or totalprevention of tobacco use among youths.Rather, the literature taken collectively arguesfor a broad-based strategy that incorporatesapproaches at the individual, organizational,and societal levels. In somewhat simplifiedterms the prevention strategy would involve achange in the social climate -- a strategy thatinvolves changes in beliefs and knowledge,that are incorporated into an individual's viewof appropriate and acceptable behavior, to therules and regulations that structure our organi-zations, and ultimately in the manner in whichwe see tobacco use as a part of the social envi-ronment. The impetus for our social climateapproach was derived, in part, from recentreports outlining these promising public healthstrategies to reduce and prevent the use oftobacco products (U.S. Department of Health& Human Services, 1989).
One suggested prevention strategy involveschanges in the knowledge, normative beliefs,behaviors, and institutional practices thatimpact a person's decisions about tobacco. Theultimate goals of these strategies are to denor-malize tobacco use and to improve the socialclimate of tobacco control through social andpolitical changes.
4SOCIAL SCIENCE RESEARCH CENTER, MISSISSIPPI STATE UNIVERSITY
CHAPTER 1INTRODUCTION AND METHOD

Prevalence rates and per capita consumptionmeasures are frequently the yardsticks withwhich tobacco control programs are evaluated.However, comprehensive tobacco control pro-grams have moved toward logic models thatincorporate intermediate desirable outcomesthat focus on attitude and behavior change. Toenhance the evaluation of progress towardthese goals, we designed the Social ClimateSurvey to measure, and ultimately monitor thefundamental position of tobacco control insociety.
The Social Climate Survey provides a methodto monitor changes in social and environmen-tal objectives, as well as an institutional frame-work to organize and interpret these results.This approach operationalizes the concept ofsocial climate into a set of quantifiable socialand environmental indicators - organized with-in an institutional framework. Social scientiststypically conceptualize societal changes asoccurring through changes in social institu-tions, such as the family, school, work place,and government. As a fundamental componentof a society, these social institutions emerge asclusterings of beliefs, norms, and practices.Moreover, beliefs, norms, and practices abouttobacco use and tobacco control have evolvedin each of these institutional areas which thenshape the status of tobacco use in the socialfabric of American society. The SocialClimate Survey consists of a set of questionsdesigned to measure the norms, practices, andbeliefs concerning tobacco within each of thefollowing institutions; 1) Family and FriendshipGroups, 2) Education, 3) Government andPolitical Order, 4) Work, 5) Health and MedicalCare, 6) Recreation, Leisure, and Sports, and 7)Mass Communication and Culture.
By asking this series of questions to a randomsample of American adults, we can measurethe extent to which tobacco control and tobac-co use are ingrained in the social institutions
that influence decisions about tobacco.Although we survey from an adult population,the Social Climate Survey is not intended as anadult tobacco survey of an individual. Eachindividual respondent serves as a proxy foreach social institution impacting his/her life byproviding information about the norms, prac-tices, and beliefs within these institutions. Toour knowledge, the present project is the mostcomprehensive survey of the extent to whichtobacco control impacts the daily lives ofAmericans.
Tobacco control and tobacco use is not carriedout in a vacuum. Youth and adults makechoices about tobacco use in the social contextof institutional beliefs, norms, and practices.The Social Climate Survey provides an annualcross-sectional assessment of these institution-al indicators in order to:
1. Categorize indicators by level of acceptance inorder to identify potentially modifiable socialclimate factors
2. Identify disparities in health risk factors, knowl-edge of health risks, and support for smokefreeenvironments
3. Identify successful tobacco control programimpacts, and approaches to make these compre-hensive programs better
4. Use of continuous response options allowsmore sophisticated analyses to detect relation-ships among social climate variables and con-textual factors
5. Assesses the impact that health care providershave upon active and passive smoking.1
5SOCIAL SCIENCE RESEARCH CENTER, MISSISSIPPI STATE UNIVERSITY
THE MISSISSIPPI SOCIAL CLIMATE SURVEY OF TOBACCO CONTROL, 2000-2001
1These assessments will appear in a later report

METHODS
Survey DesignThe Social Climate Survey measures socialand environmental indicators within an institu-tional framework. Specifically, the surveyassesses normative beliefs, health knowledge,and practices/policies within each of the fol-lowing social institutions: family and friend-ship groups; education; work-place; govern-ment and political order; health and medicalcare; recreation, leisure and sports; and massculture and communication.
The development of the survey was deter-mined not only from a review of extant meas-urement instruments in the tobacco preventionresearch, but also from a panel of consultantswho have substantial expertise in the variousareas of tobacco control research. Researchersat the SSRC worked closely with theMississippi State Department of Health andThe Partnership for a Healthy Mississippi (thetwo organizations responsible for statewidetobacco control programs in Mississippi) inthe development of the Social Climate Survey.The CDC's Office on Smoking and Health anda panel of consultants provided comments andreviews of the survey instrument as well.Scientists at the SSRC developed many of theitems included in the survey. Others wereselected from existing measurement instru-ments with established validity. Specifically,the Social Climate Survey includes items fromthe Behavioral Risk Factor SurveillanceSystem (to establish if respondent is a smoker,former smoker, or never smoker), the CurrentPopulation Survey - Tobacco Use Supplement,and California Adult Tobacco Surveys.
The SSRC conducted the first MississippiSocial Climate Survey in 1999, and subse-quently administered two series of social cli-mate surveys the following year - 1) the origi-nal survey, in order to enhance the evaluationof the Mississippi Tobacco Pilot Program and2) a revised survey. In 2000, the survey instru-ment was revised to 1) have more compatibil-ity with other national data sources and 2)include Likert-scale measurement on manyitems to allow more sophisticated inferentialanalyses. In July/August of 2000, the SSRCadministered the revised survey to representa-tive samples of Mississippi adults and U.S.adults; and subsequently administered a sec-ond annual survey in 2001. Data from thesesurveys are presented in this report. Note thatthe report released by the SSRC in March,2001, Tobacco Control in Mississippi, 1999-2000 presented data from the original, pilotsurvey is not based on the same data series asthe data presented here.
Sample DesignData were collected for the Mississippi andNational Social Climate Surveys of TobaccoControl via telephone interviews with a simplerandom sample of adults. The data were col-lected in late summer by the Survey ResearchUnit in the Social Science Research Center atMississippi State University. Households wereselected using random digit dialing proce-dures. (This includes households with unlistednumbers.) Within a household the adult to beinterviewed was selected by asking to speakwith the person in the household who is 18years of age or older, and who will have thenext birthday.
6SOCIAL SCIENCE RESEARCH CENTER, MISSISSIPPI STATE UNIVERSITY
THE MISSISSIPPI SOCIAL CLIMATE SURVEY OF TOBACCO CONTROL, 2000-2001

2000 MS Sample CharacteristicsOf the eligible respondents contacted, 803respondents completed the survey (85.0%) and142 (15.0%) refused to participate. The sam-pling error (binomial questions with 50/50split) for the total data set is no larger than ±3.5 (95% confidence interval). Of the 803respondents, 292 (36.4 percent) were male and511 (63.6 percent) were female. The racialcomposition of the sample is as follows: white= 577 (71.9 percent), African American = 196(24.4 percent), Asian or Pacific Islander = 3 (.4percent), American Indian or Alaskan Native= 1 (.1 percent), other races = 8 (1.0 percent),and unknown (i.e., did not answer the questionon race) = 18 (2.2 percent). The sample wasweighted by race and gender within each cen-sus region, based upon 1998 U.S. Census esti-mates to ensure that it is representative of theU.S. population.
2001 MS Sample CharacteristicsOf the eligible respondents contacted, 1,504respondents completed the survey (87.6%) and212 (12.4%) refused to participate. The sam-pling error (binomial questions with 50/50split) for the total data set is no larger than ±2.5 (95% confidence interval). Of the 1,504respondents, 569 (37.8 percent) were male and934 (62.1 percent) were female. The racialcomposition of the sample is as follows: white= 1,050 (69.8 percent), African American =415 (27.6 percent), Asian or Pacific Islander =6 (0.4 percent), American Indian or AlaskanNative = 2 (0.1 percent), other races = 12 (0.8percent), and unknown (i.e., did not answer thequestion on race) = 19 (1.3 percent). The sam-ple was weighted by race and gender, basedupon 1999 U.S. Census estimates to ensurethat it is representative of the Mississippi pop-ulation. In the few cases where race and/orgender was missing the respondents weregiven a weight of 1.0.
2001 US Sample CharacteristicsOf the eligible respondents contacted, 3,002respondents completed the survey (84.2%) and564 (15.8%) refused to participate. The sam-pling error (binomial questions with 50/50split) for the total data set is no larger than ±1.8 (95% confidence interval). Of the 3,002respondents, 1,188 (39.6 percent) were maleand 1,807 (60.2 percent) were female. Theracial composition of the sample is as follows:white = 2,473 (82.4 percent), AfricanAmerican = 282 (9.4 percent), Asian or PacificIslander = 35 (1.2 percent), American Indianor Alaskan Native = 36 (1.2 percent), otherraces = 115 (3.8 percent), and unknown (i.e.,did not answer the question on race) = 61 (2.0percent). The sample was weighted by raceand gender within each census region, basedupon 1999 U.S. Census estimates to ensurethat it is representative of the U.S. population.
7SOCIAL SCIENCE RESEARCH CENTER, MISSISSIPPI STATE UNIVERSITY
THE MISSISSIPPI SOCIAL CLIMATE SURVEY OF TOBACCO CONTROL, 2000-2001

8SOCIAL SCIENCE RESEARCH CENTER, MISSISSIPPI STATE UNIVERSITY
THE MISSISSIPPI SOCIAL CLIMATE SURVEY OF TOBACCO CONTROL, 2000-2001
Table 1.1 Comparison of Characteristics of the Original and Weighted Samples
MS 2000
MS 2001
U.S. 2001
Sample Characteristic Original Sample
Weighted Sample
Original Sample
Weighted Sample
Original Sample
Weighted Sample
Rural/Urban Rural
Urban
46.1 53.9
45.8 54.2
42.8 57.2
41.6 58.4
25.1 74.9
23.7 76.3
Smoking Status Non-Smoker Smoker
80.2 19.8
78.9 21.1
78.6 21.4
78.2 21.8
78.3 21.7
78.2 21.8
Gender Male
Female
36.4 63.6
48.3 53.3
37.8 62.1
46.5 53.5
39.6 60.2
48.3 51.5
Race White African American
Asian or Pacific Islander American Indian or Alaskan Native
Other Race
71.9 24.4
0.4 0.1 3.2
66.6 31.2 0.1
0.1 2.1
69.8 27.6
0.4 0.1 2.1
64.2 32.8 0.6
0.3 2.1
82.4 9.4 1.2 1.2 3.8
80.4 12.5 0.8
0.6 3.7
Age 18-24 years of age 25-44 years of age 45-64 years of age
65 years of age and older
14.1 36.0 32.3 17.7
13.9 36.9 32.4 16.8
12.7 38.6 34.4 11.1
12.8 39.1 34.3 13.8
14.8 38.0 31.9 15.3
14.9 38.8 31.5 14.8
Education Not a high school graduate High school graduate
Some college College graduate
15.7 33.5 24.8 26.0
16.8 34.1 24.0 25.2
12.3 33.6 26.7 27.5
12.2 33.8 26.7 27.2
6.7 30.3 27.3 35.7
6.5 29.7 27.3 36.5
Table 1.2 Weighted Sample Size and Maximum Sampling Error
MS 2000
MS 2001
U.S. 2001
Sample Characteristic
Weighted Sample
Size
Maximum Sampling
Error Weighted
Sample Size
Maximum Sampling
Error
Weighted Sample
Size
Maximum Sampling
Error
Rural/Urban Rural Urban
368 435
5.1 4.7
626 878
3.9 3.3
729 2,344
3.6 2.0
Smoking Status Non-Smoker Smoker
634 169
3.9 7.5
1176 328
2.9 5.4
2,404 669
2.0 3.8
Gender Male Female
375 428
5.1 4.7
699 804
3.7 3.5
1,484 1,582
2.5 2.5
Race White African
American
535 250
4.2 6.2
966 493
3.2 4.4
2,470 383
2.0 5.0
Age 18-24 years of age 25-44 years of age 45-64 years of age
65 years of age and older
111 296 260 135
9.3 5.7 6.1 8.4
192 589 516 207
7.1 4.0 4.3 6.8
458 1,193
967 455
4.6 2.8 3.2 4.6
Education Not a high school graduate High school graduate
Some college College graduate
131 265 187 197
8.6 6.0 7.2 7.0
181 502 396 404
7.3 4.4 4.9 4.9
196 899 827
1,106
7.0 3.3 3.4 2.9

PresentationThis report provides a substantial array ofdescriptive information that can be used todepict many important social and culturaldimensions of tobacco control. Each chapterprovides summary information on one socialinstitution and a series of detailed tables foreach indicator in that particular social institu-tion. Estimated percentages are provided forthe total sample population, and by rural/urbanstatus, regional status, smoking status, sex,race, age, and education. Note that estimatesexclude respondents who chose not to answerthe question or responded, "Don't know." Chi-Square tests were performed to detect sociode-mographic differences.
Respondents who described their place of res-idence as a) a farm, b) rural, but not on a farm,c) a town under 2,500 population were classi-fied as rural. Respondents who described theirplace of residence as a town or a city largerthan 2,500 were classified as urban. FIPScodes were used to determine the state inwhich a respondent resided. States were cate-gorized into the four census regions: northeast,midwest, south, and west. Smoking status wasdetermined by the protocol used by theBehavioral Risk Factor Surveillance System(BRFSS) and the National Health InterviewSurvey (NHIS). Respondents who reportedsmoking at least 100 cigarettes in their entirelifetime and currently smoked everyday orsome days were classified as current smokers.Finally, age and education categories mirrorthose used by the BRFSS.
Heuristic Classification SchemeTo facilitate the interpretation and applicationof the survey results, we have developed thefollowing heuristic classification scheme forassessing the social penetration of tobaccocontrol in American society. Some issues arefully ingrained into society, such as normsagainst smoking in day care centers, and arethus considered to be universally accepted.Other issues are strongly supported but contin-ue to be rejected by a small, but nontrivial seg-ment of society. These issues are considered aspredominant cultural norms, beliefs, andpractices. Contested issues, on the other hand,are areas of tobacco control in which thereremain substantial differences of opinionacross society. The support and opposition forthese controls are roughly matched acrosssociety. Finally, some tobacco control issues,such as norms against smoking in bars, aresupported by only a small segment of societyand are considered to be culturally marginalnorms, practices, or beliefs.
By identifying universal, predominant, con-tested, and marginal aspects of the social cli-mate, it becomes possible to develop moreinformed tobacco control efforts. To illustrate,it may not be necessary to target culturallyuniversal norms, practices, and beliefs becausethese aspects of tobacco control are alreadydeeply ingrained. Norms, practices, andbeliefs that are predominantly ingrained in thesocial climate may serve as anchors for cam-paign efforts to target contested aspects of thesocial climate. Finally, this approach can iden-tify those aspects of the social climate whichare only marginally ingrained and likely to bevery resistant to interventions.
9SOCIAL SCIENCE RESEARCH CENTER, MISSISSIPPI STATE UNIVERSITY
THE MISSISSIPPI SOCIAL CLIMATE SURVEY OF TOBACCO CONTROL, 2000-2001

10SOCIAL SCIENCE RESEARCH CENTER, MISSISSIPPI STATE UNIVERSITY
THE MISSISSIPPI SOCIAL CLIMATE SURVEY OF TOBACCO CONTROL, 2000-2001
The following classification scheme is used to categorize the degree to which these aspectsof tobacco control impact the daily lives of Americans.
Heuristic Classification Scheme for Assessing the Social Penetration of Normative Beliefs, Health Beliefs, and Practices
Universal Universal normative beliefs, health beliefs, and practices Held by the overwhelming majority of society members: 85-100%
Predominant Predominant normative beliefs, health beliefs, and practices Held by a predominance of society members: 65-84%
Contested Contested normative beliefs, health beliefs, and practices Held by half of society members: 35-64%
Marginal Marginal normative beliefs, health beliefs, and practices Held by 0-34% of society members

11SOCIAL SCIENCE RESEARCH CENTER, MISSISSIPPI STATE UNIVERSITY
CHAPTER 2FAMILY AND FRIENDSHIP GROUPS
1 Indicators endorsed by at least 85% of Mississippi adults2 Note that these numbers are based upon U.S. Census 2000 population estimates for residents 18 years of age and older. Numbers for
households are based upon U.S. Census 2000 estimates of households.3 All improvements are statistically significant, a< .05
Universal Norms, Beliefs and Practices1
· 2.0 million Mississippi adults2 (99.1 percent) believe that smoking should not beallowed in daycare centers
· 2.0 million Mississippi adults (98.0 percent) never allow children under 18 to smokein their homes
· 2.0 million Mississippi adults (96.9 percent) believe that it is important for parents whosmoke to keep their cigarettes out of reach of children
· 2.0 million Mississippi adults (95.7 percent) believe that smoke from a parent's ciga-rette harms children
· 1.9 million Mississippi adults (91.0 percent) believe that parents should not allow chil-dren under 18 to smoke
Significant Improvements from 2000 to 20013
· The percentage of Mississippi households that never allow smoking in the presence ofchildren increased from 77.5 to 85.9 percent
· The percentage of Mississippi households in which tobacco use is unacceptableincreased from 66.1 to 74.2 percent
· The percentage of Mississippi adults who believe that smoking should not be allowedin daycare centers increased from 93.2 to 99.1 percent
· The percentage of Mississippi adults who believe that parents should not allow childrenunder the age of 18 to smoke increased from 88.1 to 91.0 percent
· The percentage of Mississippi adults who recognize that smoke from a parent's ciga-rette harms children increased from 92.8 to 95.7 percent
Mississippi, 2001: A Step Ahead
· The percentage of Mississippi adults who reported that smoking is unacceptable infront of children within their household (83.6%) is greater than that of the nation(79.3%)

12SOCIAL SCIENCE RESEARCH CENTER, MISSISSIPPI STATE UNIVERSITY
THE MISSISSIPPI SOCIAL CLIMATE SURVEY OF TOBACCO CONTROL, 2000-2001
85.9
91.0
95.7
96.9
98.0
99.1
67.6
68.0
72.3
74.2
77.8
79.4
82.0
83.0
83.6
47.7
24.0
32.8
Smokers do not smoke in social settings with nonsmokers
Percent of respondents who report that no close friends aresmokers
Smoking is unacceptable among friends
Average percent of close friends who are nonsmokers
Percent of respondents who report that no household membersare smokers
Strict household rules against smoking
Smoking is unacceptable in the household
Recognize that smoking in a car affects the health of childreneither a lot or a great extent
Smoking is never allowed in respondent's vehicle with childrenpresent
Children are more likely to smoke if their parents smoke
Average percent of household members who are nonsmokers
Smoking is unacceptable in front of children
Smoking is never allowed in the presence of children
Parents should not allow children under 18 to smoke
Smoke from a parent's cigarette harms their children
It is important for parents who smoke to keep their cigarettes out of reach of their children
Children under 18 are never allowed to smoke
Smoking should not be allowed in daycare centers
Universal Predominant Marginal Contested
Percent of respondents who support normative beliefs, recognize health risks, orreport tobacco control practices

13SOCIAL SCIENCE RESEARCH CENTER, MISSISSIPPI STATE UNIVERSITY
THE MISSISSIPPI SOCIAL CLIMATE SURVEY OF TOBACCO CONTROL, 2000-2001
Mississippi, 2000 & 2001: Differences in the percent of respondents who support normative beliefs, recognize health risks, or report tobacco control practices
Family and Friendship Groups Year Percentage p2001 72.3 0.0752000 68.72001 85.92000 77.52001 74.22000 66.12001 99.12000 93.22001 83.62000 83.52001 91.02000 88.12001 95.72000 92.82001 82.02000 82.92001 96.92000 97.22001 24.02000 29.92001 47.72000 49.2
0.599
0.637
0.007
0.485
0.000
0.949
0.037
0.007
Children are more likely to smoke if their parents smoke
It is important for parents to keep their cigarettes out of reach of their children
Smokers do not smoke in social settings with nonsmokers
Tobacco use is unacceptable among close friends
Smoking should not be allowed in day care centers
Smoking is unacceptable in front of children
Parents should not allow children under the age of 18 to smoke cigarettes
Smoke from a parent's cigarette harms their children
Strict household rules against smoking
Smoking is never allowed in the presence of children
Tobacco use is unacceptable within household
0.000
0.000

14SOCIAL SCIENCE RESEARCH CENTER, MISSISSIPPI STATE UNIVERSITY
THE MISSISSIPPI SOCIAL CLIMATE SURVEY OF TOBACCO CONTROL, 2000-2001
Mississippi and the Nation: Differences in the percent of respondents who supportnormative beliefs, recognize health risks, or report tobacco control practices
Family and Friendship Groups Sample Percentage pMS 72.3US 74.1MS 85.9US 87.9MS 79.4US 79.6MS 77.8US 76.9MS 98.0US 96.8MS 74.2US 72.7MS 99.1US 98.6MS 83.6US 79.3MS 91.0US 90.5MS 95.7US 95.2MS 82.0US 83.3MS 96.9US 97.1MS 24.0US 25.7MS 47.7US 49.4
0.070
0.200
0.304
0.020
0.441
0.879
Smoking is never allowed in the presence of children
Strict household rules against smoking
0.268
0.229
0.650
0.279
0.419
0.583
0.000
0.144
Tobacco use is unacceptable within household
Children under 18 are never allowed to smoke in home
Recognize that smoking in a car affects the health of children
Smoking is never allowed in respondent's vehilce with children present
Smoke from a parent's cigarette harms their children
Parents should not allow children under the age of 18 to smoke cigarettes
Smoking is unacceptable in front of children
Smoking should not be allowed in day care centers
Tobacco use is unacceptable among close friends
Smokers do not smoke in social settings with nonsmokers
It is important for parents to keep their cigarettes out of reach of their children
Children are more likely to smoke if their parents smoke

15SOCIAL SCIENCE RESEARCH CENTER, MISSISSIPPI STATE UNIVERSITY
THE MISSISSIPPI SOCIAL CLIMATE SURVEY OF TOBACCO CONTROL, 2000-2001
Detailed Tables
· With the exception of smokers, the majority of Mississippi adults live in householdsthat do not allow smoking in the home or the family vehicle when children are present.
· Although most Mississippi households restrict cigarette smoking on the home and thefamily vehicle, some groups are more likely to place restrictions than others. To illus-trate, younger and older adults are more likely to restrict cigarette smoking than mid-dle ages adults, and adults with higher levels of education are more likely to placerestrictions as well.
· Mississippi adults reported that the majority of their household and close friends do notsmoke - again, smokers are the one exception.
· Although most Mississippi adults believe that youth should be restricted from smokingand protected from second-hand smoke in the home, these beliefs are stronger in non-smokers than smokers.
Table 2.1 Household Rules About Smoking “Which of the following best describes your household’s rules about smoking?” (Percent responding by rural/urban, smoking status, gender, race, age, and education.)
Sample Characteristic
Smoking is allowed in all
parts of the home
Smoking is allowed in some
parts of the home
Smoking is not allowed in any
part of the home p
Total 16.5 11.3 72.3
Rural Urban
18.8 14.8
10.1 12.2
71.1 73.0
.071
Nonsmoker Smoker
7.8 47.6
6.5 28.4
85.7 24.1
.000
Male Female
18.0 15.0
11.4 11.2
70.5 73.8
.270
White African American
16.9 15.8
10.9 12.8
72.3 71.4
.526
18-24 years of age 25-44 years of age 45-64 years of age 65 years of age and older
13.5 16.3 19.6 12.0
10.4 13.6 9.1
11.1
76.0 70.1 71.3 76.9
.043
Not a high school graduate High school graduate Some college College Graduate
24.3 15.6 19.2 11.1
14.9 13.0 11.4 7.9
60.8 71.5 69.4 81.0
.000
Note: 0.0 percent of respondents reported Don’t Know or refused. Percentages may not add to 100 due to rounding.

16SOCIAL SCIENCE RESEARCH CENTER, MISSISSIPPI STATE UNIVERSITY
THE MISSISSIPPI SOCIAL CLIMATE SURVEY OF TOBACCO CONTROL, 2000-2001
Table 2.2 Smoking in the Presence of Children “In your home, is smoking in the presence of children always allowed, sometimes allowed, or never allowed?” (Percent responding by rural/urban, smoking status, gender, race, age, and education.)
Sample Characteristic
Always allowed
Sometimes allowed
Never allowed
p
Total 4.8 9.3 85.9
Rural Urban
6.5 3.6
9.1 9.3
84.4 87.1
.035
Nonsmoker Smoker
1.3 17.9
4.0 28.8
94.7 53.4
.000
Male Female
4.2 5.3
9.9 8.7
85.9 86.0
.482
White African American
5.9 2.2
9.0 10.8
85.1 86.9
.005
18-24 years of age 25-44 years of age 45-64 years of age 65 years of age and older
4.2 4.8 5.9 2.9
5.8 11.4 9.8 4.9
90.0 83.8 84.3 92.2
.024
Not a high school graduate High school graduate Some college College Graduate
9.1 4.6 6.1 1.7
15.4 9.3
10.2 6.2
75.4 86.1 83.7 92.0
.000
Note: 1.4 percent of respondents reported Don’t Know or refused. Percentages may not add to 100 due to rounding.
Table 2.3 Smoking in Vehicles with Children Present “Please tell me which best describes how cigarette smoking is handled in your car when children are present?” (Percent responding by rural/urban, smoking status, gender, race, age, and education.)
Sample Characteristic
No one is allowed to
smoke in my car
Only special guests are allowed to
smoke in my car
People are allowed to smoke
in my car only if the windows are
open
People are allowed to
smoke in my car at any time p
Total 79.4 1.23 15.1 4.3
Rural Urban
78.9 79.7
1.0 1.4
16.0 14.4
4.1 4.6
.782
Nonsmoker Smoker
89.1 44.0
1.1 1.7
8.2 40.1
1.6 14.2
.000
Male Female
77.0 81.4
1.1 1.4
16.2 14.2
5.7 3.0
.043
White African American
78.1 82.0
1.2 1.4
15.8 13.3
4.9 3.3
.297
18-24 years of age 25-44 years of age 45-64 years of age 65 years of age and older
82.5 75.0 80.3 87.8
0.0 1.4 1.2 1.2
13.6 19.4 14.1 5.8
4.0 4.3 4.3 5.2
.006 Not a high school graduate High school graduate Some college College Graduate
68.5 77.7 76.8 87.8
0.7 1.1
1.0 1.5
21.0 17.1
17.4 8.6
9.8 4.2
4.7 2.3
.000 Note: 7.0 percent of respondents reported Don’t Know or refused or did not own a car. Percentages may not add to 100 due to rounding.

17SOCIAL SCIENCE RESEARCH CENTER, MISSISSIPPI STATE UNIVERSITY
THE MISSISSIPPI SOCIAL CLIMATE SURVEY OF TOBACCO CONTROL, 2000-2001
Table 2.4 How Much Does Smoking in a Car Affect the Health of Children “In your opinion, how much does smoking in a car affect the health of children?” (Percent responding by rural/urban, smoking status, gender, race, age, and education.)
Sample Characteristic Not at all A little bit Somewhat A lot
A great extent p
Total 3.5 5.6 12.9 30.6 47.4
Rural Urban
4.3 3.0
6.35.0
12.1 13.6
31.629.8
45.748.6 .352
Nonsmoker Smoker
2.8 6.4
3.812.4
9.5 26.2
31.028.5
52.926.5 .000
Male Female
4.0 3.1
8.13.3
16.3 10.2
30.530.6
41.252.8 .000
White African American
2.8 4.8
5.26.7
15.9 7.2
30.130.7
46.050.5 .000
18-24 years of age 25-44 years of age 45-64 years of age 65 years of age and older
4.4 3.1 3.0 5.3
6.15.46.04.8
13.8 12.5 13.9 11.1
32.630.230.230.7
43.148.946.848.1 .934
Not a high school graduate High school graduate Some college College Graduate
5.7 4.8 2.4 1.8
6.86.1
5.04.6
13.1 11.9
12.9 14.2
38.131.3
28.728.1
36.445.9
51.151.3 .025
Note: 4.1 percent of respondents reported Don’t Know or refused. Percentages may not add to 100 due to rounding.
Table 2.5 Household Rules About Youth Smoking “In your home, are children under the age of 18 always allowed, sometimes allowed, or never allowed to smoke cigarettes?” (Percent responding by rural/urban, smoking status, gender, race, age, and education.)
Sample Characteristic
Always allowed
Sometimes allowed
Never allowed p
Total 1.1 1.0 98.0
Rural Urban
0.61.4
1.00.9
98.497.7 .391
Nonsmoker Smoker
0.53.2
0.62.2
98.994.6 .000
Male Female
1.21.0
1.60.4
97.298.6 .051
White African American
1.21.0
1.20.6
97.798.4 .578
18-24 years of age 25-44 years of age 45-64 years of age 65 years of age and older
0.50.91.21.5
3.20.20.81.5
96.399.098.097.0 .016
Not a high school graduate High school graduate Some college College Graduate
0.60.82.10.8
2.80.4
1.50.5
96.698.896.498.7 .092
Note: 2.0 percent of respondents reported Don’t Know or refused. Percentages may not add to 100 due to rounding.
18SOCIAL SCIENCE RESEARCH CENTER, MISSISSIPPI STATE UNIVERSITY
THE MISSISSIPPI SOCIAL CLIMATE SURVEY OF TOBACCO CONTROL, 2000-2001
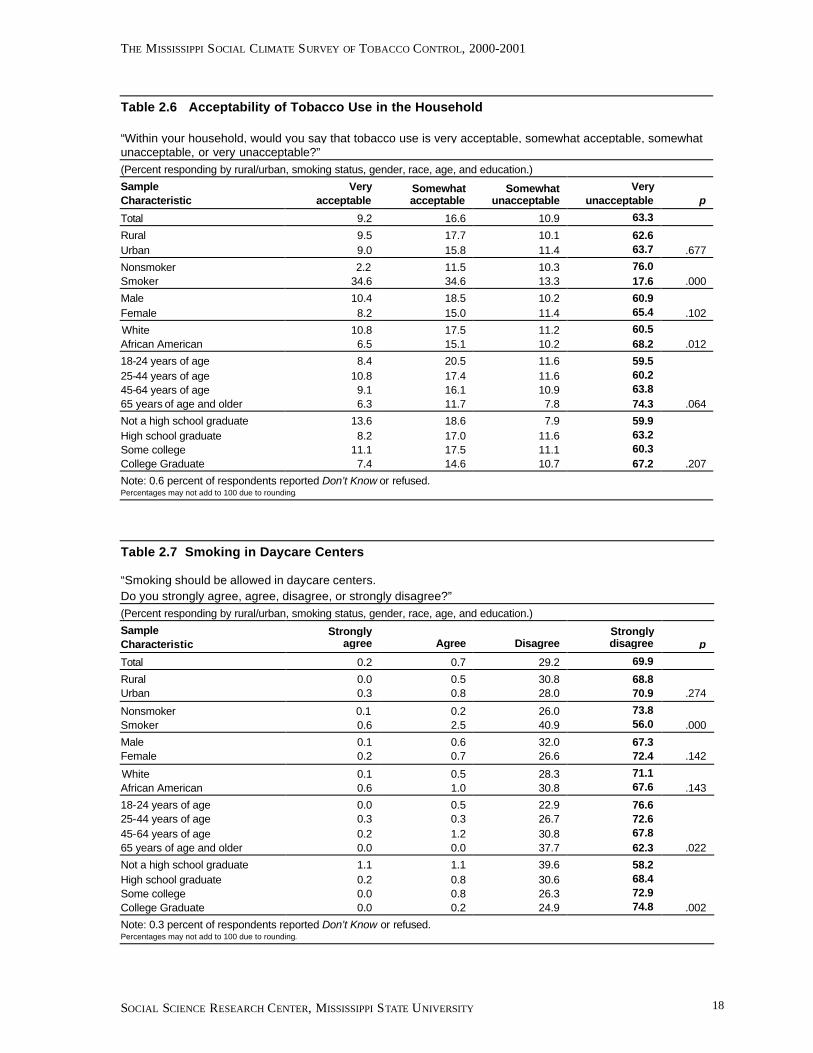
Table 2.6 Acceptability of Tobacco Use in the Household “Within your household, would you say that tobacco use is very acceptable, somewhat acceptable, somewhat unacceptable, or very unacceptable?” (Percent responding by rural/urban, smoking status, gender, race, age, and education.)
Sample Characteristic
Very acceptable
Somewhat acceptable
Somewhat unacceptable
Very unacceptable p
Total 9.2 16.6 10.9 63.3
Rural Urban
9.5 9.0
17.7 15.8
10.1 11.4
62.6 63.7
.677
Nonsmoker Smoker
2.2 34.6
11.5 34.6
10.3 13.3
76.0 17.6
.000
Male Female
10.4 8.2
18.5 15.0
10.2 11.4
60.9 65.4
.102
White African American
10.8 6.5
17.5 15.1
11.2 10.2
60.5 68.2
.012
18-24 years of age 25-44 years of age 45-64 years of age 65 years of age and older
8.4 10.8 9.1 6.3
20.5 17.4 16.1 11.7
11.6 11.6 10.9 7.8
59.5 60.2 63.8 74.3
.064
Not a high school graduate High school graduate Some college College Graduate
13.6 8.2
11.1 7.4
18.6 17.0
17.5 14.6
7.9 11.6
11.1 10.7
59.9 63.2
60.3 67.2
.207
Note: 0.6 percent of respondents reported Don’t Know or refused. Percentages may not add to 100 due to rounding.
Table 2.7 Smoking in Daycare Centers
“Smoking should be allowed in daycare centers. Do you strongly agree, agree, disagree, or strongly disagree?” (Percent responding by rural/urban, smoking status, gender, race, age, and education.)
Sample Characteristic
Strongly agree
Agree
Disagree
Strongly disagree
p
Total 0.2 0.7 29.2 69.9
Rural Urban
0.0 0.3
0.5 0.8
30.8 28.0
68.8 70.9
.274
Nonsmoker Smoker
0.1 0.6
0.2 2.5
26.0 40.9
73.8 56.0
.000
Male Female
0.1 0.2
0.6 0.7
32.0 26.6
67.3 72.4
.142
White African American
0.1 0.6
0.5 1.0
28.3 30.8
71.1 67.6
.143
18-24 years of age 25-44 years of age 45-64 years of age 65 years of age and older
0.0 0.3 0.2 0.0
0.5 0.3 1.2 0.0
22.9 26.7 30.8 37.7
76.6 72.6 67.8 62.3
.022
Not a high school graduate High school graduate Some college College Graduate
1.1 0.2 0.0 0.0
1.1 0.8
0.8 0.2
39.6 30.6
26.3 24.9
58.2 68.4
72.9 74.8
.002
Note: 0.3 percent of respondents reported Don’t Know or refused. Percentages may not add to 100 due to rounding.

19SOCIAL SCIENCE RESEARCH CENTER, MISSISSIPPI STATE UNIVERSITY
THE MISSISSIPPI SOCIAL CLIMATE SURVEY OF TOBACCO CONTROL, 2000-2001
Table 2.8 Acceptability of Parents Smoking in Front of Children
“It is acceptable for parents to smoke in front of children. Do you strongly agree, agree, disagree, or strongly disagree?” (Percent responding by rural/urban, smoking status, gender, race, age, and education.)
Sample Characteristic
Strongly agree
Agree Disagree Strongly disagree
p
Total 1.3 15.1 45.8 37.8
Rural Urban
1.7 1.2
15.1 15.0
45.6 45.9
37.6 37.9
.899
Nonsmoker Smoker
0.3 5.2
9.4 35.9
48.0 37.9
42.3 21.0
.000
Male Female
1.6 1.0
19.6 11.2
44.3 47.1
34.4 40.7
.000
White African American
1.3 1.1
17.8 10.3
45.5 46.9
35.4 41.7
.002
18-24 years of age 25-44 years of age 45-64 years of age 65 years of age and older
1.6 1.6 1.4 0.5
11.4 17.2 15.8 10.6
44.9 43.8 45.5 53.0
42.2 37.5 37.2 35.9
.244
Not a high school graduate High school graduate Some college College Graduate
2.3 0.8 2.1 0.8
17.7 14.3
16.4 13.5
49.1 49.3
43.6 41.9
30.9 35.6
37.9 43.8
.059
Note: 3.8 percent of respondents reported Don’t Know or refused. Percentages may not add to 100 due to rounding.
Table 2.9 Should Parents Allow Children to Smoke Cigarettes?
“Parents should not allow children under the age of eighteen to smoke cigarettes. Do you strongly agree, agree, disagree, or strongly disagree?” (Percent responding by rural/urban, smoking status, gender, race, age, and education.)
Sample Characteristic
Strongly agree Agree Disagree
Strongly disagree p
Total 45.3 45.7 5.7 3.3
Rural Urban
45.3 45.3
46.1 45.4
5.6 5.6
2.9 3.7
.872
Nonsmoker Smoker
47.3 38.2
43.7 52.6
5.3 6.7
3.6 2.4
.012
Male Female
41.1 48.9
49.1 42.7
6.4 5.1
3.5 3.3
.025
White African American
47.0 42.5
45.1 47.6
5.6 5.1
2.4 4.7
.063
18-24 years of age 25-44 years of age 45-64 years of age 65 years of age and older
44.7 49.4 43.9 37.1
43.1 41.1 49.9 50.5
8.0 5.5 3.5
10.4
4.3 4.1 2.7 2.0
.001
Not a high school graduate High school graduate Some college College Graduate
38.3 40.6 46.2 54.5
49.4 50.3
44.1 39.0
9.4 5.5
6.1 3.8
2.8 3.6
3.6 2.8
.001
Note: 1.0 percent of respondents reported Don’t Know or refused. Percentages may not add to 100 due to rounding .

20SOCIAL SCIENCE RESEARCH CENTER, MISSISSIPPI STATE UNIVERSITY
THE MISSISSIPPI SOCIAL CLIMATE SURVEY OF TOBACCO CONTROL, 2000-2001
Table 2.10 Beliefs about Health Effects of Parent’s Cigarette Smoke on Children
“Inhaling smoke from a parent’s cigarette harms the health of babies and children. Do you strongly agree, agree, disagree, or strongly disagree?” (Percent responding by rural/urban, smoking status, gender, race, age, and education.)
Sample Characteristic
Strongly agree
Agree
Disagree
Strongly disagree
p
Total 45.1 50.6 2.9 1.4
Rural Urban
44.3 45.6
52.6 49.3
2.8 2.9
0.3 2.2
.020
Nonsmoker Smoker
49.1 29.9
47.7 62.0
1.8 6.8
1.5 1.3
.000
Male Female
40.9 48.6
53.9 48.0
3.4 2.3
1.8 1.1
.018
White African American
46.8 42.1
49.7 52.4
2.6 2.9
0.9 2.7
.027
18-24 years of age 25-44 years of age 45-64 years of age 65 years of age and older
46.8 48.5 42.2 40.6
50.0 46.8 53.0 56.4
2.6 2.9 3.2 2.0
0.5 1.7 1.6 1.0
.373
Not a high school graduate High school graduate Some college College Graduate
34.5 43.4 44.0 54.5
62.1 52.5
51.6 41.4
3.4 3.0
2.1 2.5
0.0 1.0
2.4 1.5
.000
Note: 2.4 percent of respondents reported Don’t Know or refused. Percentages may not add to 100 due to rounding.
Table 2.11 Beliefs about Risk of Children Smoking if Parents are Smokers
“Children are more likely to smoke if parents are smokers. Do you strongly agree, agree, disagree, or strongly disagree?” (Percent responding by rural/urban, smoking status, gender, race, age, and education.)
Sample Characteristic
Strongly agree
Agree
Disagree
Strongly disagree
p
Total 29.2 52.8 15.4 2.5
Rural Urban
30.0 28.7
54.9 51.3
13.6 16.7
1.5 3.3
.052
Nonsmoker Smoker
31.7 20.1
53.6 49.8
12.8 25.6
2.0 4.5
.000
Male Female
28.7 29.9
55.4 50.4
14.3 16.5
1.6 3.2
.079
White African American
31.6 24.5
54.2 49.3
12.4 22.0
1.8 4.2
.000
18-24 years of age 25-44 years of age 45-64 years of age 65 years of age and older
29.3 30.5 28.7 26.6
51.6 48.0 55.1 61.8
14.9 17.9 14.8 10.6
4.3 3.5 1.4 1.0
.013
Not a high school graduate High school graduate Some college College Graduate
20.5 25.8 30.0 37.4
61.4 52.5
52.7 47.9
15.8 18.9
15.8 11.0
2.3 2.7
1.6 3.6
.000
Note: 3.9 percent of respondents reported Don’t Know or refused. Percentages may not add to 100 due to rounding.

21SOCIAL SCIENCE RESEARCH CENTER, MISSISSIPPI STATE UNIVERSITY
THE MISSISSIPPI SOCIAL CLIMATE SURVEY OF TOBACCO CONTROL, 2000-2001
Table 2.12 Importance of Keeping Cigarettes out of Children’s Reach
“It is important for parents who smoke to keep their cigarettes out of reach of their children. Do you strongly agree, agree, disagree, or strongly disagree?” (Percent responding by rural/urban, smoking status, gender, race, age, and education.)
Sample Characteristic
Strongly agree
Agree
Disagree
Strongly disagree
p
Total 44.7 52.2 2.4 0.7
Rural Urban
43.5 45.5
54.4 50.7
1.6 3.0
0.5 0.8
.197
Nonsmoker Smoker
47.1 36.1
50.0 60.2
2.1 3.4
0.8 0.3
.002
Male Female
42.3 46.8
54.2 50.4
2.4 2.4
1.0 0.5
.255
White African American
44.9 44.5
52.8 50.6
2.1 3.3
0.3 1.6
.000
18-24 years of age 25-44 years of age 45-64 years of age 65 years of age and older
45.0 50.7 40.6 37.1
49.7 46.8 55.3 62.0
4.2 1.5 3.5 1.0
1.0 1.0 0.6 0.0
.001
Not a high school graduate High school graduate Some college College Graduate
36.1 40.1 45.3 54.8
61.7 55.7
51.9 42.7
1.7 3.4
2.5 1.5
0.6 0.8
0.3 1.0
.000
Note: 0.3 percent of respondents reported Don’t Know or refused. Percentages may not add to 100 due to rounding.
Table 2.13 Do Friends Who are Smokers Smoke in Social Settings with Nonsmokers
“In social settings where there are smokers and nonsmokers, do your friends who are smokers always refrain from smoking, sometimes refrain from smoking, or never refrain from smoking?” (Percent responding by rural/urban, smoking status, gender, race, age, and education.)
Sample Characteristic
Always refrain
Sometimes refrain
Never refrain
p
Total 24.0 55.3 20.6
Rural Urban
25.0 23.4
55.4 55.3
19.7 21.3
.680
Nonsmoker Smoker
26.2 16.8
54.4 58.4
19.4 24.8
.001
Male Female
20.3 27.5
57.1 53.8
22.6 18.7
.005
White African American
25.2 21.4
56.4 54.2
18.4 24.4
.026
18-24 years of age 25-44 years of age 45-64 years of age 65 years of age and older
15.6 19.3 26.9 40.0
58.1 58.5 54.7 44.1
26.3 22.2 1.46 15.9
.000
Not a high school graduate High school graduate Some college College Graduate
18.8 24.7 23.4 25.7
53.8 51.9
57.9 58.4
27.5 23.4 18.7 15.9
.023
Note: 8.0 percent of respondents reported Don’t Know or refused. Percentages may not add to 100 due to rounding.

22SOCIAL SCIENCE RESEARCH CENTER, MISSISSIPPI STATE UNIVERSITY
THE MISSISSIPPI SOCIAL CLIMATE SURVEY OF TOBACCO CONTROL, 2000-2001
Table 2.14 Acceptability of Tobacco Use Among Friends “Among your friends, would you say that tobacco use is very acceptable, somewhat acceptable, somewhat unacceptable, or very unacceptable?” (Percent responding by rural/urban, smoking status, gender, race, age, and education.)
Sample Characteristic
Very acceptable
Somewhat acceptable
Somewhat unacceptable
Very unacceptable
p
Total 15.5 36.8 20.6 27.1
Rural Urban
15.6 15.5
37.4 36.4
18.6 22.0
28.4 26.2
.423
Nonsmoker Smoker
10.5 33.6
33.5 48.7
23.4 10.4
32.6 7.2
.000
Male Female
21.5 10.4
38.3 35.5
19.0 21.9
21.1 32.2
.000
White African American
17.4 12.7
39.3 31.8
21.2 18.9
22.1 36.6
.000
18-24 years of age 25-44 years of age 45-64 years of age 65 years of age and older
23.3 19.3 11.9 7.1
38.6 38.0 39.6 24.2
19.0 20.1 23.6 15.2
19.0 22.6 25.0 53.5
.000
Not a high school graduate High school graduate Some college College Graduate
18.1 17.9 15.1 12.6
27.5 38.7
40.3 35.3
18.1 16.1
19.5 28.2
36.3 27.3
25.1 23.9
.000
Note: 2.4 percent of respondents reported Don’t Know or refused. Percentages may not add to 100 due to rounding.

23SOCIAL SCIENCE RESEARCH CENTER, MISSISSIPPI STATE UNIVERSITY
THE MISSISSIPPI SOCIAL CLIMATE SURVEY OF TOBACCO CONTROL, 2000-2001
88.7
81.6
82.1
74.7
86.1
81.0
94.1
42.8
84.2
81.2
87.1
81.5
84.0
79.4
84.7
81.1
83.0
College degree
Some college
12th Grade
Less than 12th Grade
EDUCATION*
65+
45-64
25-44
18-24
AGE*
African American
White
RACE*
Female
Male
SEX*
Nonsmoker
Smoker
SMOKER*
Urban
Rural
RURAL/URBAN
TOTAL
Figure 2.1 Average Percent of Household Members Who are Nonsmokers
* p < .01

24SOCIAL SCIENCE RESEARCH CENTER, MISSISSIPPI STATE UNIVERSITY
THE MISSISSIPPI SOCIAL CLIMATE SURVEY OF TOBACCO CONTROL, 2000-2001
79.0
66.0
64.4
56.6
70.0
66.4
85.5
70.1
65.2
87.1
81.5
84.0
79.4
69.6
66.3
68.0
College degree
Some college
12th Grade
Less than 12th Grade
EDUCATION*
65+
45-64
25-44
18-24
AGE*
African American
White
RACE
Female
Male
SEX
Nonsmoker
Smoker (N/A)
SMOKER*
Urban
Rural
RURAL/URBAN*
TOTAL
Figure 2.2 Percent of Respondents Who Report That No Household Members areSmokers
* p < .01

25SOCIAL SCIENCE RESEARCH CENTER, MISSISSIPPI STATE UNIVERSITY
THE MISSISSIPPI SOCIAL CLIMATE SURVEY OF TOBACCO CONTROL, 2000-2001
76.2
63.6
66.3
56.7
71.3
65.6
74.0
45.3
68.5
66.2
81.4
69.8
65.6
56.9
72.3
62.3
67.6
College degree
Some college
12th Grade
Less than 12th Grade
EDUCATION*
65+
45-64
25-44
18-24
AGE*
African American
White
RACE*
Female
Male
SEX *
Nonsmoker
Smoker
SMOKER*
Urban
Rural
RURAL/URBAN
TOTAL
Figure 2.3 Average Percent of Close Friends Who are Nonsmokers
* p < .01

26SOCIAL SCIENCE RESEARCH CENTER, MISSISSIPPI STATE UNIVERSITY
THE MISSISSIPPI SOCIAL CLIMATE SURVEY OF TOBACCO CONTROL, 2000-2001
39.0
27.5
30.6
33.8
43.4
27.4
39.4
9.9
34.6
30.3
52.6
33.9
29.4
24.4
40.1
24.6
32.8
College degree
Some college
12th Grade
Less than 12th Grade
EDUCATION*
65+
45-64
25-44
18-24
AGE*
African American
White
RACE*
Female
Male
SEX*
Nonsmoker
Smoker
SMOKER*
Urban
Rural
RURAL/URBAN
TOTAL
Figure 2.4 Percent of Respondents who Report That No Close Friends are Smokers
* p < .01

27SOCIAL SCIENCE RESEARCH CENTER, MISSISSIPPI STATE UNIVERSITY
CHAPTER 3EDUCATION
Universal Norms, Beliefs and Practices
· 2.0 million Mississippi adults (96.3 percent) believe that students should be punishedfor violating school rules against smoking
· 1.9 million Mississippi adults (91.16 percent) believe that students should not beallowed to smoke on school grounds
Significant Improvements from 2000 to 2001
· The percentage of Mississippi adults who believe that schools should prohibit studentsfrom wearing clothing or bringing gear with tobacco logos to school increased from67.6 to 72.4 percent
Mississippi, 2001: A Step Ahead
· Believe that faculty and staff should not be allowed to smoke on school grounds --Mississippi: 65.6%; United States: 56.5%
· Believe that schools should prohibit clothing or gear with tobacco logos -- Mississippi: 72.4%; United States: 65.4%
· Support an increase in state tobacco taxes to fund education programs to prevent youthtobacco use -- Mississippi: 79.7%; United States: 73.9%
· Believe that students should be punished for violating school rules against smoking ---Mississippi: 96.3%; United States: 93.8%

28SOCIAL SCIENCE RESEARCH CENTER, MISSISSIPPI STATE UNIVERSITY
THE MISSISSIPPI SOCIAL CLIMATE SURVEY OF TOBACCO CONTROL, 2000-2001
91.1
96.3
65.6
72.4
79.7
Faculty and staff should notbe allowed to smoke on
school grounds
Schools should prohibitclothing and gear with tobacco
logos
Support a tax increase to fundanti-smoking education
Students should not beallowed to smoke on school
grounds
Students should be punishedfor violating school rules
against smoking
Universal Predominant Marginal Contested
Percent of respondents who support normative beliefs, recognize health risks, orreport tobacco control practices

29SOCIAL SCIENCE RESEARCH CENTER, MISSISSIPPI STATE UNIVERSITY
THE MISSISSIPPI SOCIAL CLIMATE SURVEY OF TOBACCO CONTROL, 2000-2001
Mississippi, 2000 & 2001: Differences in the percent of respondents who support normative beliefs, recognize health risks, or report tobacco control practices
Education Year Percentage p2001 91.12000 93.32001 65.62000 66.02001 72.42000 67.62001 79.72000 76.52001 96.32000 94.8
0.126
0.056
0.853
0.022
0.086
Students should be punished for violating school rules against smoking
Students should not be allowed to smoke on school grounds
Faculty and Staff should not be allowed to smoke on school grounds
Schools should prohibit clothing or gear with tobacco logos
Support a tax increase to fund anti-smoking education

30SOCIAL SCIENCE RESEARCH CENTER, MISSISSIPPI STATE UNIVERSITY
THE MISSISSIPPI SOCIAL CLIMATE SURVEY OF TOBACCO CONTROL, 2000-2001
Mississippi and the Nation: Differences in the percent of respondents who supportnormative beliefs, recognize health risks, or report tobacco control practices
Education Sample Percentage pMS 91.1US 89.6MS 65.6US 56.5MS 72.4US 65.4MS 79.7US 73.9MS 96.3US 93.8
0.000
0.098
0.000
0.000
0.000
Students should be punished for violating school rules against smoking
Students should not be allowed to smoke on school grounds
Faculty and Staff should not be allowed to smoke on school grounds
Schools should prohibit clothing or gear with tobacco logos
Support a tax increase to fund anti-smoking education

31SOCIAL SCIENCE RESEARCH CENTER, MISSISSIPPI STATE UNIVERSITY
THE MISSISSIPPI SOCIAL CLIMATE SURVEY OF TOBACCO CONTROL, 2000-2001
Detailed Tables
· The overwhelming majority of Mississippi adults believe that students should not beallowed to smoke on school grounds. However, only two-thirds of adults believe thatteachers should not be allowed to smoke on school grounds.
· Although the majority of Mississippi adults support restrictions on cigarette smokingin school, nonsmokers are more likely than smokers to support these restrictions, andfemales more so than males.
· Most adults believe that schools should prohibit students from wearing and bringinggear with tobacco brand labels to school.
· Although the majority of Mississippi adults support an increase in state tobacco taxesto fund prevention programs, there is substantial variation across sociodemographicgroups.
Table 3.1 Student Smoking on School Grounds “In schools, do you think that students should be allowed to smoke?“ (Percent responding by rural/urban, smoking status, gender, race, age, and education.)
Sample Characteristic
In allareas
Some, designated
areas
Not allowed
at all p
Total 0.0 8.9 91.1
Rural Urban
0.00.0
8.09.6
92.090.4 .282
Nonsmoker Smoker
0.00.0
7.414.3
92.685.7 .000
Male Female
0.00.0
12.45.7
87.694.3 .000
White African American
0.00.0
8.510.4
91.589.6 .244
18-24 years of age 25-44 years of age 45-64 years of age 65 years of age and older
0.00.00.00.0
15.38.76.4
10.1
84.791.393.689.9 .003
Not a high school graduate High school graduate Some college College Graduate
0.00.00.00.0
8.310.2 9.17.4
91.789.890.992.6 .530
Note: 0.5 percent of respondents reported Don’t Know or refused. Percentages may not add to 100 due to rounding.

32SOCIAL SCIENCE RESEARCH CENTER, MISSISSIPPI STATE UNIVERSITY
THE MISSISSIPPI SOCIAL CLIMATE SURVEY OF TOBACCO CONTROL, 2000-2001
Table 3.2 Faculty and Staff Smoking on School Grounds “In schools, do you think that faculty and staff should be allowed to smoke?“ (Percent responding by rural/urban, smoking status, gender, race, age, and education.)
Sample Characteristic
In allareas
Some, designated
areas
Not allowed
at all p
Total 0.1 34.3 65.6
Rural Urban
0.00.1
30.936.7
69.163.2 .044
Nonsmoker Smoker
0.10.3
26.761.5
73.338.2 .000
Male Female
0.00.1
41.228.2
58.871.6 .000
White African American
0.10.0
35.432.3
64.467.7 .364
18-24 years of age 25-44 years of age 45-64 years of age 65 years of age and older
0.00.00.20.0
38.239.529.727.1
61.860.570.172.9 .003
Not a high school graduate High school graduate Some college College Graduate
0.00.00.30.0
30.931.3
40.633.9
69.168.759.266.1 .049
Note: 0.3 percent of respondents reported Don’t Know or refused. Percentages may not add to 100 due to rounding.
Table 3.3 Students Wearing Clothing with Tobacco Logos “Schools should prohibit students from wearing clothing or bringing gear with tobacco logos to school. Do you strongly agree, agree, disagree, or strongly disagree?” (Percent responding by rural/urban, smoking status, gender, race, age, and education.)
Sample Characteristic
Strongly agree Agree Disagree
Strongly disagree p
Total 33.6 38.8 21.9 5.7
Rural Urban
36.031.8
38.838.7
19.923.4
5.36.1 .244
Nonsmoker Smoker
35.925.5
40.034.6
19.231.8
5.08.2 .000
Male Female
27.738.8
39.438.3
26.118.1
6.74.8 .000
White African American
32.835.2
40.635.0
22.021.9
4.67.8 .033
18-24 years of age 25-44 years of age 45-64 years of age 65 years of age and older
26.936.533.731.5
41.435.339.145.7
21.522.222.419.8
10.26.14.83.0 .025
Not a high school graduate High school graduate Some college College Graduate
28.030.033.441.3
35.439.8
38.638.5
29.722.6
23.316.6
6.97.6
4.73.6 .001
Note: 3.2 percent of respondents reported Don’t Know or refused. Percentages may not add to 100 due to rounding.

33SOCIAL SCIENCE RESEARCH CENTER, MISSISSIPPI STATE UNIVERSITY
THE MISSISSIPPI SOCIAL CLIMATE SURVEY OF TOBACCO CONTROL, 2000-2001
Table 3.4 Increase Taxes to Fund Anti-Smoking Education “State tobacco taxes should be increased to fund education to prevent young people from starting to smoke. Do you strongly agree, agree, disagree, or strongly disagree?” (Percent responding by rural/urban, smoking status, gender, race, age, and education.)
Sample Characteristic
Strongly agree Agree Disagree
Strongly disagree p
Total 32.0 47.7 16.3 4.1
Rural Urban
34.030.6
46.248.7
15.317.0
4.53.7 .414
Nonsmoker Smoker
35.220.5
49.640.7
12.729.3
2.69.5 .000
Male Female
31.432.6
45.749.5
17.714.8
5.13.1 .080
White African American
29.736.5
47.248.3
18.212.4
4.92.7 .002
18-24 years of age 25-44 years of age 45-64 years of age 65 years of age and older
32.134.731.624.6
54.546.145.551.3
8.615.518.320.9
4.83.74.63.1 .019
Not a high school graduate High school graduate Some college College Graduate
27.730.234.035.0
50.350.2
45.444.7
17.315.4
16.017.0
4.64.2
4.63.3 .680
Note: 3.3 percent of respondents reported Don’t Know or refused. Percentages may not add to 100 due to rounding.
Table 3.5 Students Should be Punished for Violating School Rules against Smoking “Students should be punished for violating school rules against smoking. Do you strongly agree, agree, disagree, or strongly disagree?” (Percent responding by rural/urban, smoking status, gender, race, age, and education.)
Sample Characteristic
Strongly agree Agree Disagree
Strongly disagree p
Total 36.6 59.6 3.1 0.6
Rural Urban
36.736.6
59.559.7
3.13.2
0.60.6 .998
Nonsmoker Smoker
38.231.2
58.463.9
2.94.0
0.50.9 .091
Male Female
35.737.6
61.058.3
2.8 3.5
0.60.6 .701
White African American
37.036.9
59.458.6
3.13.7
0.50.8 .816
18-24 years of age 25-44 years of age 45-64 years of age 65 years of age and older
35.443.031.831.3
60.353.764.364.1
3.22.83.43.6
1.10.50.61.0 .027
Not a high school graduate High school graduate Some college College Graduate
34.732.637.541.7
59.764.2
59.453.8
4.02.6
2.83.8
1.70.6
0.30.8 .109
Note: 2.1 percent of respondents reported Don’t Know or refused. Percentages may not add to 100 due to rounding.

34SOCIAL SCIENCE RESEARCH CENTER, MISSISSIPPI STATE UNIVERSITY
CHAPTER 4GOVERNMENT AND POLITICAL ORDER
Universal Norms, Beliefs and Practices
· 2.0 million Mississippi adults (96.4 percent) consider cigarette butts to be litter· 2.0 million Mississippi adults (96.4 percent) believe that stores should be penalized
for the sale of tobacco to minors
Significant Improvements from 2000 to 2001
· The percentage of Mississippi adults who believe that tobacco should be regulated asa drug increased from 67.9 to 75.9 percent
· The percentage of Mississippi adults who believe that store owners should need alicense to sell tobacco increased from 80.8 to 84.7 percent
· The percentage of Mississippi adults who believe that state taxes should be increasedto fund programs to enforce laws that prevent sales of tobacco products to minorsincreased from 75.3 to 79.9 percent
· The percentage of Mississippi adults who believe that taxes on tobacco are NOTunfair increased from 66.9 to 72.4 percent
· The percentage of Mississippi adults who believe that it is the responsibility of gov-ernment to regulate tobacco increased from 70.4 to 75.4 percent
Mississippi, 2001: A Step Ahead
· Believe that tobacco should be regulated as a drug -- Mississippi: 75.9%; United States: 66.0%
· Believe that stores should need a license to sell tobacco products -- Mississippi: 84.7%; United States: 74.6%
· Support an increase in state tobacco taxes to fund enforcement of tobacco laws --Mississippi: 79.9%; United States: 71.3%
· Believe that stores should be penalized for the sale of tobacco to minors -- Mississippi: 96.4%; United States: 94.0%
· Believe that youth should be penalized for the possession of tobacco -- Mississippi: 83.0%; United States: 76.0%
· Believe that it is the responsibility of government to regulate tobacco --Mississippi: 75.4%; United States: 66.0%

35SOCIAL SCIENCE RESEARCH CENTER, MISSISSIPPI STATE UNIVERSITY
THE MISSISSIPPI SOCIAL CLIMATE SURVEY OF TOBACCO CONTROL, 2000-2001
96.4
96.4
72.4
75.4
75.9
79.9
83.0
84.7
47.2Government should NOT limit fines from lawsuits againstthe tobacco companies
Taxes on tobacco are fair
It is the government's responsibility to regulate tobacco
Tobacco should be regulated as a drug
Tobacco taxes should be increased to fund enforcement oftobacco laws
Youth should be penalized for the possession of tobacco
Stores should need a license to sell tobacco products
Stores should be penalized for the sale of tobacco to minors
Consider cigarette butts to be litter
Universal Predominant Marginal Contested
Percent of respondents who support normative beliefs, recognize health risks, orreport tobacco control practices

36SOCIAL SCIENCE RESEARCH CENTER, MISSISSIPPI STATE UNIVERSITY
THE MISSISSIPPI SOCIAL CLIMATE SURVEY OF TOBACCO CONTROL, 2000-2001
Mississippi, 2000 & 2001: Differences in the percent of respondents who support normative beliefs, recognize health risks, or report tobacco control practices
Government Year Percentage p2001 75.92000 67.92001 84.72000 80.82001 79.92000 75.32001 96.42000 95.82001 83.02000 82.02001 72.42000 66.92001 75.42000 70.42001 47.22000 47.62001 96.42000 95.3
Taxes on tobacco are fair.
Youth should be penalized for the possession of tobacco
Stores should be penalized for the sale of tobacco to minors
Tobacco taxes should be increased to fund enforcement of tobacco laws
0.015
0.508
Consider cigarette butts to be litter
Government should NOT limit fines from lawsuits against the tobacco companies
It is the responsibility of government to regulate tobacco
0.585
0.009
0.015
0.881
0.231
Stores should need a license to sell tobacco products
Tobacco should be regulated as a drug 0.000
0.023

37SOCIAL SCIENCE RESEARCH CENTER, MISSISSIPPI STATE UNIVERSITY
THE MISSISSIPPI SOCIAL CLIMATE SURVEY OF TOBACCO CONTROL, 2000-2001
Mississippi and the Nation: Differences in the percent of respondents who supportnormative beliefs, recognize health risks, or report tobacco control practices
Government and Political Order Sample Percentage pMS 75.9US 66.0MS 84.7US 74.6MS 79.9US 71.3MS 96.4US 94.0MS 83.0US 76.0MS 72.4US 72.4MS 75.4US 66.0MS 47.2US 50.0MS 96.4US 95.7
Consider cigarette butts to be litter
Youth should be penalized for the possession of tobacco
Taxes on tobacco are fair.
It is the responsibility of government to regulate tobacco
Government should NOT limit fines from lawsuits against the tobacco companies
Tobacco should be regulated as a drug
Stores should need a license to sell tobacco products
Tobacco taxes should be increased to fund enforcement of tobacco laws
Stores should be penalized for the sale of tobacco to minors
0.285
0.095
0.000
0.983
0.000
0.000
0.000
0.000
0.000

38SOCIAL SCIENCE RESEARCH CENTER, MISSISSIPPI STATE UNIVERSITY
THE MISSISSIPPI SOCIAL CLIMATE SURVEY OF TOBACCO CONTROL, 2000-2001
Detailed Tables
· A majority of Mississippi adults believe that tobacco products should be regulated asa drug - although support varies across sociodemographic groups.
· The majority of adults support both penalizing stores that sell tobacco to minors andpenalizing minors caught possessing tobacco products. However, there is more sup-port for penalizing stores.
· In general, Mississippi adults support licensing requirements for stores to sell tobaccoproducts. The majority of adults also support increasing funds for the enforcement oflaws restricting the sell of tobacco to minors, although support varies across sociode-mographic groups.
· Almost all Mississippi adults consider cigarette butts to be litter.
Table 4.1 Tobacco Should Be Regulated as a Drug “Tobacco products should be regulated as a drug by a government agency such as the Food and Drug Administration. Do you strongly agree, agree, disagree, or strongly disagree?” (Percent responding by rural/urban, smoking status, gender, race, age, and education.)
Sample Characteristic
Strongly agree Agree Disagree
Strongly disagree p
Total 25.8 50.1 19.5 4.6
Rural Urban
28.4 23.9
47.6 51.9
19.3 19.7
4.7 4.6
.262
Nonsmoker Smoker
28.0 17.9
52.8 40.9
16.3 30.8
3.0 10.4
.000
Male Female
25.7 25.9
45.7 54.0
23.2 16.2
5.4 4.0
.002
White African American
24.4 28.6
47.5 55.9
22.0 13.4
6.1 2.1
.000
18-24 years of age 25-44 years of age 45-64 years of age 65 years of age and older
24.9 27.2 25.4 23.0
49.2 50.7 49.1 52.4
18.4 17.1 21.9 21.4
7.6 5.0 3.7 3.2
.318
Not a high school graduate High school graduate Some college College Graduate
22.5 23.7 29.8 26.5
54.3 53.3
46.1 47.1
18.5 18.0
19.8 21.7
4.6 5.0
4.3 4.8
.424
Note: 5.3 percent of respondents reported Don’t Know or refused. Percentages may not add to 100 due to rounding.

39SOCIAL SCIENCE RESEARCH CENTER, MISSISSIPPI STATE UNIVERSITY
THE MISSISSIPPI SOCIAL CLIMATE SURVEY OF TOBACCO CONTROL, 2000-2001
Table 4.2 Tobacco Licensing “Store owners should need a license to sell tobacco, just like they do to sell alcohol. Do you strongly agree, agree, disagree, or strongly disagree?” (Percent responding by rural/urban, smoking status, gender, race, age, and education.)
Sample Characteristic
Strongly agree Agree Disagree
Strongly disagree p
Total 30.0 54.6 13.6 1.8
Rural Urban
31.429.1
53.555.3
12.814.1
2.31.5 .473
Nonsmoker Smoker
32.022.9
55.452.0
11.620.7
1.04.3 .000
Male Female
26.732.9
52.456.6
18.1 9.6
2.80.9 .000
White African American
27.835.0
54.754.4
14.810.6
2.80.0 .000
18-24 years of age 25-44 years of age 45-64 years of age 65 years of age and older
33.533.625.926.3
51.852.255.861.9
12.012.616.610.3
2.61.71.61.5 .057
Not a high school graduate High school graduate Some college College Graduate
28.728.631.431.6
59.058.2
52.849.9
10.112.2
13.815.9
2.21.0
2.02.6 .230
Note: 2.2 percent of respondents reported Don’t Know or refused. Percentages may not add to 100 due to rounding.
Table 4.3 Increased Taxes to Fund Enforcement of Tobacco Laws “State tobacco taxes should be increased to fund programs to enforce laws that prevent sales of tobacco to minors. Do you strongly agree, agree, disagree, or strongly disagree?” (Percent responding by rural/urban, smoking status, gender, race, age, and education.)
Sample Characteristic
Strongly agree Agree Disagree
Strongly disagree p
Total 28.8 51.1 16.7 3.4
Rural Urban
30.927.3
48.952.5
15.917.2
4.32.9 .195
Nonsmoker Smoker
31.419.4
53.641.7
12.830.7
2.28.2 .000
Male Female
27.530.0
47.154.6
20.9 12.8
4.52.6 .000
White African American
27.331.5
48.755.7
19.510.9
4.41.9 .000
18-24 years of age 25-44 years of age 45-64 years of age 65 years of age and older
38.130.425.124.4
51.350.949.954.4
7.414.921.418.7
3.23.83.62.6 .001
Not a high school graduate High school graduate Some college College Graduate
27.927.031.229.5
55.253.6
48.248.2
14.515.7
17.018.7
2.33.7
3.63.5 .709
Note: 2.7 percent of respondents reported Don’t Know or refused. Percentages may not add to 100 due to rounding.

40SOCIAL SCIENCE RESEARCH CENTER, MISSISSIPPI STATE UNIVERSITY
THE MISSISSIPPI SOCIAL CLIMATE SURVEY OF TOBACCO CONTROL, 2000-2001
Table 4.4 Stores Should Be Penalized for the Sale of Tobacco Products to Minors “Stores should be penalized for the sale of tobacco products to persons under the age of 18. Do you strongly agree, agree, disagree, or strongly disagree?” (Percent responding by rural/urban, smoking status, gender, race, age, and education.)
Sample Characteristic
Strongly agree Agree Disagree
Strongly disagree p
Total 40.5 55.8 3.1 0.5
Rural Urban
42.939.0
53.657.4
3.23.1
0.30.6 .427
Nonsmoker Smoker
41.836.2
54.959.2
2.94.0
0.40.6 .271
Male Female
38.442.4
58.253.8
2.9 3.4
0.60.4 .340
White African American
40.541.0
55.955.5
3.12.9
0.50.6 .985
18-24 years of age 25-44 years of age 45-64 years of age 65 years of age and older
40.345.237.036.3
55.051.459.160.8
3.73.23.12.5
1.00.20.80.5 .159
Not a high school graduate High school graduate Some college College Graduate
42.234.144.944.1
53.961.7
52.851.6
3.34.0
2.03.2
0.60.2
0.31.0 .020
Note: 0.7 percent of respondents reported Don’t Know or refused. Percentages may not add to 100 due to rounding.
Table 4.5 Possession of Tobacco by Minors “Persons under the age of 18 should be penalized for the possession of tobacco products. Do you strongly agree, agree, disagree, or strongly disagree?” (Percent responding by rural/urban, smoking status, gender, race, age, and education.)
Sample Characteristic
Strongly agree Agree Disagree
Strongly disagree p
Total 26.1 56.8 15.6 1.4
Rural Urban
27.625.0
56.657.0
14.116.7
1.71.3 .454
Nonsmoker Smoker
27.022.8
58.451.1
13.423.5
1.22.6 .000
Male Female
25.626.7
54.658.7
18.2 13.4
1.71.2 .069
White African American
25.127.7
56.357.9
17.113.1
1.51.3 .225
18-24 years of age 25-44 years of age 45-64 years of age 65 years of age and older
30.830.121.721.1
55.156.157.858.3
10.812.918.720.6
3.20.91.80.0 .000
Not a high school graduate High school graduate Some college College Graduate
29.023.726.028.5
55.658.1
56.855.4
13.617.4
15.014.9
1.80.8
2.21.3 .617
Note: 5.4 percent of respondents reported Don’t Know or refused. Percentages may not add to 100 due to rounding.

41SOCIAL SCIENCE RESEARCH CENTER, MISSISSIPPI STATE UNIVERSITY
THE MISSISSIPPI SOCIAL CLIMATE SURVEY OF TOBACCO CONTROL, 2000-2001
Table 4.6 Are Taxes on Tobacco Fair “Taxes on tobacco are unfair. Do you strongly agree, agree, disagree, or strongly disagree?” (Percent responding by rural/urban, region, smoking status, gender, race, age, and education.)
Sample Characteristic
Strongly agree Agree Disagree
Strongly disagree p
Total 5.9 21.7 53.4 19.0
Rural Urban
6.35.6
21.721.6
50.755.4
21.217.4 .232
Nonsmoker Smoker
2.916.3
17.237.4
57.937.7
22.08.6 .000
Male Female
7.44.6
24.319.3
52.4 54.3
15.921.9 .001
White African American
5.86.4
18.925.2
54.553.0
20.815.5 .002
18-24 years of age 25-44 years of age 45-64 years of age 65 years of age and older
6.86.15.45.8
22.622.918.824.3
53.750.557.151.9
16.920.418.618.0 .667
Not a high school graduate High school graduate Some college College Graduate
7.97.25.83.4
38.422.2
18.816.5
39.055.2
53.857.0
14.615.4
21.523.1 .000
Note: 6.5 percent of respondents reported Don’t Know or refused. Percentages may not add to 100 due to rounding.
Table 4.7 Government Responsibility “It is the responsibility of the government to regulate tobacco. Do you strongly agree, agree, disagree, or strongly disagree?” (Percent responding by rural/urban, smoking status, gender, race, age, and education.)
Sample Characteristic
Strongly agree Agree Disagree
Strongly disagree p
Total 17.6 57.8 21.4 3.2
Rural Urban
18.517.1
57.158.2
21.221.5
3.13.1 .923
Nonsmoker Smoker
18.514.3
60.946.3
19.130.0
1.59.3 .000
Male Female
16.718.5
56.359.2
23.2 19.6
3.92.7 .181
White African American
16.819.5
55.662.1
23.017.7
4.60.6 .000
18-24 years of age 25-44 years of age 45-64 years of age 65 years of age and older
23.017.116.616.8
62.859.753.657.9
12.618.827.123.2
1.64.32.72.1 .001
Not a high school graduate High school graduate Some college College Graduate
16.018.018.117.2
64.256.8
58.255.6
17.922.6
20.522.5
1.92.5
3.24.7 .557
Note: 6.1 percent of respondents reported Don’t Know or refused. Percentages may not add to 100 due to rounding.

42SOCIAL SCIENCE RESEARCH CENTER, MISSISSIPPI STATE UNIVERSITY
THE MISSISSIPPI SOCIAL CLIMATE SURVEY OF TOBACCO CONTROL, 2000-2001
Table 4.8 Lawsuit Limit Against Tobacco Companies “The government should limit fines from lawsuits against the tobacco companies. Do you strongly agree, agree, disagree, or strongly disagree?” (Percent responding by rural/urban, smoking status, gender, race, age, and education.)
Sample Characteristic
Strongly agree Agree Disagree
Strongly disagree p
Total 10.8 42.0 36.3 11.0
Rural Urban
13.29.0
41.342.5
33.438.3
12.110.1 .030
Nonsmoker Smoker
9.814.1
39.351.7
39.524.5
11.49.7 .000
Male Female
10.411.1
41.742.2
36.1 36.5
11.910.3 .797
White African American
12.47.6
43.739.2
33.840.1
10.113.1 .004
18-24 years of age 25-44 years of age 45-64 years of age 65 years of age and older
9.711.310.112.3
44.940.343.340.9
33.536.935.538.6
11.911.511.18.2 .904
Not a high school graduate High school graduate Some college College Graduate
14.39.2
11.710.5
54.042.9
40.836.3
25.537.3
33.941.8
6.210.7
13.611.3 .002
Note: 8.3 percent of respondents reported Don’t Know or refused. Percentages may not add to 100 due to rounding.
Table 4.9 Cigarettes Butts as Litter “I consider cigarette butts to be litter. Do you strongly agree, agree, disagree, or strongly disagree?” (Percent responding by rural/urban, smoking status, gender, race, age, and education.)
Sample Characteristic
Strongly agree Agree Disagree
Strongly disagree p
Total 40.2 56.2 3.4 0.3
Rural Urban
40.839.7
56.656.0
2.44.0
0.20.3 .341
Nonsmoker Smoker
42.930.3
54.761.5
2.18.0
0.30.3 .000
Male Female
37.842.2
58.854.1
3.3 3.4
0.10.4 .256
White African American
41.438.0
55.257.5
3.13.9
0.20.6 .345
18-24 years of age 25-44 years of age 45-64 years of age 65 years of age and older
36.640.939.144.1
58.155.457.852.5
4.73.62.92.9
0.50.20.20.5 .812
Not a high school graduate High school graduate Some college College Graduate
36.337.740.745.8
55.958.1
56.852.0
7.33.6
2.52.3
0.60.6
0.00.0 .012
Note: 0.5 percent of respondents reported Don’t Know or refused. Percentages may not add to 100 due to rounding.

43SOCIAL SCIENCE RESEARCH CENTER, MISSISSIPPI STATE UNIVERSITY
CHAPTER 5WORK
Universal Norms, Beliefs and Practices
· 91.6 percent of employed Mississippi adults report that cigarettes are not available forsale at work place
Significant Improvements from 2000 to 2001
· The percentage of Mississippi adults who report that smoking is not allowed in indoorwork areas increased from 53.2 to 62.1 percent
· The percentage of employed Mississippi adults who report that their employer strict-ly enforces the smoking policy increased from 72.3 to 82.8 percent
· The percentage of employed Mississippi adults who report that their employer offereda cessation program within the past 12 months increased from 14.5 to 19.8 percent
Mississippi, 2001: A Step Ahead
· Report that tobacco use is unacceptable among co-workers -- Mississippi: 48.7%; United States: 53.6%
· Report that smoking is not allowed in any area at work -- Mississippi: 62.1%; United States: 68.5%
· Report that their employer offered a cessation program within the past 12 months --Mississippi: 19.8%; United States: 23.6%

44SOCIAL SCIENCE RESEARCH CENTER, MISSISSIPPI STATE UNIVERSITY
THE MISSISSIPPI SOCIAL CLIMATE SURVEY OF TOBACCO CONTROL, 2000-2001
91.6
82.8
46.4
48.7
58.4
62.1
63.4
17.7
19.8
Percent of workers who report that all coworkers arenonsmokers
Employer offered a cessation program in past 12 months
Employer does not accommodate smokers by providingsmoking areas
Smoking is unacceptable among coworkers
Average percent of coworkers who are nonsmokers
Smoking is not allowed in any area at work
Smoking in work areas should not be allowed
Strictly enforced tobacco policy at work
Cigarettes are not available for sale at work place
Universal Predominant Marginal Contested
Percent of respondents who support normative beliefs, recognize health risks, orreport tobacco control practices

45SOCIAL SCIENCE RESEARCH CENTER, MISSISSIPPI STATE UNIVERSITY
THE MISSISSIPPI SOCIAL CLIMATE SURVEY OF TOBACCO CONTROL, 2000-2001
Mississippi, 2000 & 2001: Differences in the percent of respondents who support normative beliefs, recognize health risks, or report tobacco control practices
Work Year Percentage p2001 63.42000 61.82001 48.72000 52.42001 62.12000 53.22001 82.82000 72.32001 53.62000 45.92001 91.62000 91.82001 19.82000 14.5
0.015
0.874
0.007
0.000
0.002
0.191
0.444Smoking in work areas should not be allowed
Tobacco use is unacceptable among co-workers
Employer offered cessation program in past 12 months
Smoking is not allowed in any area at work
Strictly enforced tobacco policy at work
Employer does not accommodate smokers
Cigarettes are not available for sale at work place

46SOCIAL SCIENCE RESEARCH CENTER, MISSISSIPPI STATE UNIVERSITY
THE MISSISSIPPI SOCIAL CLIMATE SURVEY OF TOBACCO CONTROL, 2000-2001
Mississippi and the Nation: Differences in the percent of respondents who supportnormative beliefs, recognize health risks, or report tobacco control practices
Work Percentage pMS 63.4US 61.8MS 48.7US 53.6MS 62.1US 68.5MS 82.8US 79.5MS 53.6US 50.3MS 91.6US 91.9MS 19.8US 23.6
0.024
0.001
0.051
0.055
0.792
Employer offered cessation program in past 12 months
Cigarettes are not available for sale at work place
Employer does not accommodate smokers
Strictly enforced tobacco policy at work
Smoking is not allowed in any area at work
Tobacco use is unacceptable among co-workers
Smoking in work areas should not be allowed 0.305
0.015

47SOCIAL SCIENCE RESEARCH CENTER, MISSISSIPPI STATE UNIVERSITY
THE MISSISSIPPI SOCIAL CLIMATE SURVEY OF TOBACCO CONTROL, 2000-2001
Detailed Tables
· Almost two-thirds of American adults believe that smoking should be restricted in allindoor work areas; although smokers are less supportive of restrictions than non-smokers and males are less supportive than females.
· Less than a third of employed adults reported that smoking is very unacceptableamong their coworkers. However, there is substantial variation across populations onthis issue.
· More than two-thirds of employed adults reported that their employer does not allowsmoking in any indoor work area. Again, there is substantial variation across popula-tions.
Table 5.1 Should Smoking Be Allowed in Work Areas “In indoor work areas, do you think smoking should be allowed in all areas, some areas, or not at all?” (Percent responding by rural/urban, smoking status, gender, race, age, and education.)
Sample Characteristic
In all areas
In some
areas
Not allowed
at all
p
Total 0.3 36.3 63.4
Rural Urban
0.3 0.3
38.3 34.8
61.3 64.8
.378
Nonsmoker Smoker
0.3 0.5
28.2 65.5
71.5 33.9
.000
Male Female
0.3 0.4
44.1 29.5
55.7 70.2
.000
White African American
0.4 0.2
38.0 32.4
61.6 67.4
.089
18-24 years of age 25-44 years of age 45-64 years of age 65 years of age and older
0.5 0.2 0.6 0.0
46.3 37.7 33.6 30.0
53.2 62.1 65.8 70.0
.012
Not a high school graduate High school graduate Some college College Graduate
0.0 0.2 0.8 0.2
40.8 35.2
43.3 28.5
59.2 64.6 56.0 71.2
.001
Note: 0.3 percent of respondents reported Don’t Know or refused. Percentages may not add to 100 due to rounding.

48SOCIAL SCIENCE RESEARCH CENTER, MISSISSIPPI STATE UNIVERSITY
THE MISSISSIPPI SOCIAL CLIMATE SURVEY OF TOBACCO CONTROL, 2000-2001
Table 5.2 Acceptability of Tobacco Use Among Coworkers “Among your coworkers, would you say that tobacco use is very acceptable, somewhat acceptable, somewhat unacceptable, or very unacceptable?” (Percent responding by rural/urban, smoking status, gender, race, age, and education.) Sample Characteristic
Very acceptable
Somewhat acceptable
Somewhat unacceptable
Very Unacceptable p
Total 18.1 33.3 16.2 32.5 Rural Urban
16.7 19.0
37.9 30.0
13.6 18.0
31.8 32.9
.068
Nonsmoker Smoker
15.4 27.1
30.0 44.9
16.8 14.3
37.9 14.3
.000
Male Female
23.4 12.5
35.7 30.5
17.6 14.7
23.2 42.3
.000
White African American
17.6 18.7
32.1 37.4
17.5 13.8
32.8 30.1
.300
18-24 years of age 25-44 years of age 45-64 years of age 65 years of age and older
28.6 21.8 9.7
16.7
41.7 34.1 31.1 11.1
9.5 13.8 21.7 11.1
20.2 30.2 37.5 61.1
.000
Not a high school graduate High school graduate Some college College Graduate
20.7 21.6 17.9 14.3
34.5 36.7
41.3 22.8
15.5 12.4
14.7 21.4
29.3 29.3
26.2 41.5
.000
Note: 41.9 percent of respondents reported Don’t Know or refused or did not work. Percentages may not add to 100 due to rounding.
Table 5.3 Employer Smoking Policy “Which of the following best describes your place of work’s official smoking policy for indoor work areas?” (Percent responding by rural/urban, smoking status, gender, race, age, and education.)
Sample Characteristic
Smoking is not allowed
in any area It is allowed
in some areas It is allowed in all areas
There is no official
policy
p
Total 62.1 26.9 2.6 8.4
Rural Urban
57.3 65.4
28.8 25.5
2.8 2.5
11.2 6.6
.038
Nonsmoker Smoker
64.9 52.2
26.3 29.1
1.9 4.9
6.8 13.8
.000
Male Female
55.8 68.6
30.3 23.4
3.4 1.9
10.5 6.1
.001
White African American
64.5 57.6
23.6 32.8
3.0 1.7
8.9 7.9
.030
18-24 years of age 25-44 years of age 45-64 years of age 65 years of age and older
43.9 63.5 66.0 44.4
34.1 26.7 24.5 38.9
4.9 1.9 3.3 0.0
17.1 7.9 6.2
16.7
.005
Not a high school graduate High school graduate Some college College Graduate
42.9 52.7 59.1 77.4
33.9 35.8
28.0 16.2
10.7 2.3
1.6 2.0
12.5 9.2
11.4 4.4
.000
Note: 41.8 percent of respondents reported Don’t Know or refused or did not work. Percentages may not add to 100 due to rounding.

49SOCIAL SCIENCE RESEARCH CENTER, MISSISSIPPI STATE UNIVERSITY
THE MISSISSIPPI SOCIAL CLIMATE SURVEY OF TOBACCO CONTROL, 2000-2001
Table 5.4 Enforcement of Smoking Policy “Would you say that this smoking policy is not enforced at all, poorly enforced, somewhat enforced, or strictly enforced?” (Percent responding by rural/urban, smoking status, gender, race, age, and education.)
Sample Characteristic
Not enforced at all
Poorly enforced
Somewhat enforced
Strictly enforced
p
Total 1.5 3.6 12.1 82.8
Rural Urban
1.6 1.5
2.9 4.0
13.9 10.9
81.2 83.0
.634
Nonsmoker Smoker
1.5 1.8
3.6 3.6
12.4 10.9
82.2 82.4
.676
Male Female
1.6 1.5
3.6 3.6
14.5 9.7
79.0 85.2
.043
White African American
1.0 2.3
3.0 4.6
12.7 11.5
82.3 81.7
.200
18-24 years of age 25-44 years of age 45-64 years of age 65 years of age and older
3.1 1.2 1.8 0.0
9.4 2.6 3.6 7.1
18.8 12.6 10.1 7.1
68.8 82.9 84.2 85.7
.223
Not a high school graduate High school graduate Some college College Graduate
7.0 1.7 1.4 0.4
2.3 4.8
3.6 2.5
11.6 17.8
10.4 8.7
79.1 75.7
84.2 87.4
.005
Note: 48.2 percent of respondents reported Don’t Know or refused or did not work. Percentages may not add to 100 due to rounding.
Table 5.5 Employer Accommodation of Smokers “Does your employer accommodate smokers by doing things like providing a covered area outside or an indoor smoke room?” (Percent responding by rural/urban, smoking status, gender, race, age, and education.)
Sample Characteristic Yes No p Total 53.6 46.4
Rural Urban
51.455.0
48.6 45.0
.296
Nonsmoker Smoker
52.059.3
48.0 40.7
.068
Male Female
56.150.8
43.9 49.2
.117
White African American
49.361.6
50.7 38.4
.001
18-24 years of age 25-44 years of age 45-64 years of age 65 years of age and older
48.256.750.258.8
51.8 43.3 49.8 41.2
.221
Not a high school graduate High school graduate Some college College Graduate
56.660.5
56.244.6
43.4 39.5 43.8 55.4
.001
Note: 42.4 percent of respondents reported Don’t Know or refused or did not work. Percentages may not add to 100 due to rounding.

50SOCIAL SCIENCE RESEARCH CENTER, MISSISSIPPI STATE UNIVERSITY
THE MISSISSIPPI SOCIAL CLIMATE SURVEY OF TOBACCO CONTROL, 2000-2001
Table 5.6 Availability of Cigarettes for Sale at Work “Are cigarettes for sale at your work place?” (Percent responding by rural/urban, smoking status, gender, race, age, and education.)
Sample Characteristic Yes No p Total 8.4 91.6
Rural Urban
8.98.1
91.1 91.9
.698
Nonsmoker Smoker
8.09.9
92.0 90.1
.405
Male Female
8.97.9
91.1 92.1
.607
White African American
6.511.4
93.5 88.6
.015
18-24 years of age 25-44 years of age 45-64 years of age 65 years of age and older
11.09.27.10.0
89.0 90.8 92.9
100.0
.333
Not a high school graduate High school graduate Some college College Graduate
6.810.3
11.04.7
93.2 89.7 89.0 95.3
.031
Note: 41.6 percent of respondents reported Don’t Know or refused or did not work. Percentages may not add to 100 due to rounding.
Table 5.7 Employer Cessation Program “Within the past 12 months, has your employer offered any stop smoking programs or any other help to employees who want to quit smoking?” (Percent responding by rural/urban, smoking status, gender, race, age, and education.)
Sample Characteristic Yes No p Total 19.8 80.2
Rural Urban
16.322.3
83.7 77.7
.032
Nonsmoker Smoker
21.015.9
79.0 84.1
.119
Male Female
20.219.4
79.8 80.6
.778
White African American
18.022.3
82.0 77.7
.138
18-24 years of age 25-44 years of age 45-64 years of age 65 years of age and older
17.321.619.05.6
82.7 78.4 81.0 94.4
.310
Not a high school graduate High school graduate Some college College Graduate
9.415.7
23.821.9
90.6 84.3 76.2 78.1
.024
Note: 44.9 percent of respondents reported Don’t Know or refused or did not work. Percentages may not add to 100 due to rounding.

51SOCIAL SCIENCE RESEARCH CENTER, MISSISSIPPI STATE UNIVERSITY
THE MISSISSIPPI SOCIAL CLIMATE SURVEY OF TOBACCO CONTROL, 2000-2001
66.2
55.0
51.8
51.2
45.7
60.4
62.5
45.5
59.9
54.5
58.7
54.0
65.3
56.1
52.5
60.2
57.4
67.3
54.8
59.4
55.2
College degree
Some college
12th Grade
Less than 12th Grade
EDUCATION*
65+
45-64
25-44
18-24
AGE*
African American
White
RACE*
Female
Male
SEX
Nonsmoker
Smoker
SMOKER*
West
South
Midwest
Northeast
REGION*
Urban
Rural
RURAL/URBAN*
TOTAL
Figure 5.1 Average Percent of Coworkers Who are Nonsmokers
p < .01

52SOCIAL SCIENCE RESEARCH CENTER, MISSISSIPPI STATE UNIVERSITY
THE MISSISSIPPI SOCIAL CLIMATE SURVEY OF TOBACCO CONTROL, 2000-2001
25.5
21.3
18.8
21.3
14.4
19.3
21.5
10.8
19.9
16.3
45.5
27.5
18.9
19.0
21.3
17.2
29.0
16.4
17.4
14.7
19.1
College degree
Some college
12th Grade
Less than 12th Grade
EDUCATION*
65+
45-64
25-44
18-24
AGE*
African American
White
RACE
Female
Male
SEX
Nonsmoker
Smoker
SMOKER*
West
South
Midwest
Northeast
REGION*
Urban
Rural
RURAL/URBAN
TOTAL
Figure 5.2 Percent of Respondents Who Report That No Coworkers are Smokers
p < .01

53SOCIAL SCIENCE RESEARCH CENTER, MISSISSIPPI STATE UNIVERSITY
CHAPTER 6HEALTH AND MEDICAL CARE
Universal Norms, Beliefs and Practices
· 2.0 million Mississippi adults (97.3 percent) do NOT believe the tobacco companies'claim that tobacco is not harmful to health
· 2.0 million Mississippi adults (96.7 percent) do NOT believe the tobacco companies'claim that second hand smoke is not harmful to health
· 2.0 million Mississippi adults (95.9 percent) do NOT believe the tobacco companies'claim that nicotine is not addictive
· 1.8 million Mississippi adults (85.1 percent) believe that smoking should not beallowed in hospitals
Significant Improvements from 2000 to 2001
· The percentage of Mississippi adults who believe that smoking should not be allowedin hospitals increased from 76.1 to 85.1 percent
Mississippi, 2001: A Step Ahead
· Support an increase in state tobacco taxes to fund adult cessation programs --Mississippi: 68.9%; United States: 58.7%
· Believe that smoking cigarettes is very dangerous -- Mississippi: 84.9%; United States: 81.0%
· Believe that smoking cigars is very dangerous -- Mississippi: 76.1%; United States: 65.2%

54SOCIAL SCIENCE RESEARCH CENTER, MISSISSIPPI STATE UNIVERSITY
THE MISSISSIPPI SOCIAL CLIMATE SURVEY OF TOBACCO CONTROL, 2000-2001
85.1
95.9
96.7
97.3
68.9
72.2
75.7
76.1
84.9
Support a tobacco tax increase to fund cessation programsfor adults
Believe that chewing tobacco is very dangerous
Believe that using snuff is very dangerous
Believe that smoking cigars is very dangerous
Believe that smoking cigarettes is very dangerous
Hospitals should be smokefree
Do not believe tobacco companies' claim that nicotine is notaddictive
Do not believe tobacco companies' claim that second-handsmoke is not harmful to health
Do not believe tobacco companies' claim that tobacco is notharmful to health
Universal Predominant Marginal Contested
Percent of respondents who support normative beliefs, recognize health risks, orreport tobacco control practices

55SOCIAL SCIENCE RESEARCH CENTER, MISSISSIPPI STATE UNIVERSITY
THE MISSISSIPPI SOCIAL CLIMATE SURVEY OF TOBACCO CONTROL, 2000-2001
Mississippi, 2000 & 2001: Differences in the percent of respondents who support normative beliefs, recognize health risks, or report tobacco control practices
Health and Medical Care Year Percentage p2001 85.12000 76.12001 68.92000 65.12001 95.92000 95.12001 97.32000 96.92001 96.72000 96.42001 72.22000 73.02001 84.92000 83.22001 75.72000 75.82001 76.12000 75.0
0.586
0.967
0.301
0.675
0.700
0.567
0.349
0.078
0.000Hospitals should be smokefree
Support a tobacco tax increase to fund cessation programs for adults
Do not believe tobacco companies' claim that nicotine is not addictive
Believe that using snuff is very dangerous
Believe that smoking cigars is very dangerous
Do not believe tobacco companies' claim that tobacco is not harmful to health
Do not believe tobacco companies' claim that ETS is not harmful to health
Believe that chewing tobacco is very dangerous
Believe that smoking cigarettes is very dangerous

56SOCIAL SCIENCE RESEARCH CENTER, MISSISSIPPI STATE UNIVERSITY
THE MISSISSIPPI SOCIAL CLIMATE SURVEY OF TOBACCO CONTROL, 2000-2001
Mississippi and the Nation: Differences in the percent of respondents who supportnormative beliefs, recognize health risks, or report tobacco control practices
Health and Medical Care Sample Percentage pMS 85.1US 83.9MS 68.9US 58.7MS 95.9US 96.0 0.868MS 97.3US 97.6MS 96.7US 95.7MS 72.2US 73.2MS 84.9US 81.0MS 75.7US 75.0MS 76.1US 65.2
Believe that using snuff is very dangerous
Believe that smoking cigars is very dangerous
0.325
0.000
0.626
0.097
0.484
0.001
0.633
0.000
Do not believe tobacco companies' claim that tobacco is not harmful to health
Do not believe tobacco companies' claim that ETS is not harmful to health
Believe that chewing tobacco is very dangerous
Believe that smoking cigarettes is very dangerous
Hospitals should be smokefree
Support a tobacco tax increase to fund cessation programs for adults
Do not believe tobacco companies' claim that nicotine is not addictive

57SOCIAL SCIENCE RESEARCH CENTER, MISSISSIPPI STATE UNIVERSITY
THE MISSISSIPPI SOCIAL CLIMATE SURVEY OF TOBACCO CONTROL, 2000-2001
Detailed Tables
· More than 85 percent of Mississippi adults reported that smoking should not be at allin hospitals. Practically everyone believes that there should be at some limitations onsmoking in hospitals.
· Almost 70 percent of adults support an increase in state tobacco taxes to fund adultcessation programs. However, support is stronger in females than males, nonsmokersthan smokers, and African Americans than white respondents.
· Approximately three-fourths of adults believe smoking cigars, chewing tobacco, andusing snuff to be very dangerous; while almost 85 percent of adults believe smokingcigarettes to be very dangerous. Note that there is considerable variation across demo-graphic groups in the recognition of the health risks of tobacco.
· Practically no Mississippi adults believe the claims that nicotine is not addictive,tobacco is not harmful, and second-hand smoke is not harmful.
Table 6.1 Should Smoking Be Allowed in Hospitals “In hospitals, do you think that smoking should be allowed in all areas, is some areas, or not at all?” (Percent responding by rural/urban, smoking status, gender, race, age, and education.)
Sample Characteristic All areas Some areas Not at all p Total 0.1 14.8 85.0
Rural Urban
0.0 0.2
15.9 14.0
84.1 85.8
.298
Nonsmoker Smoker
0.2 0.0
9.8 32.9
90.0 67.1
.000
Male Female
0.3 0.0
16.8 13.0
82.9 87.0
.036
White African American
0.1 0.0
18.1 8.6
81.8 91.4
.000
18-24 years of age 25-44 years of age 45-64 years of age 65 years of age and older
0.5 0.0 0.2 0.0
11.2 15.2 15.0 16.3
88.3 84.8 84.8 83.7
.445
Not a high school graduate High school graduate Some college College Graduate
0.0 0.0 0.3 0.0
19.4 14.5
14.9 13.4
80.6 85.5 84.8 86.6
.378
Note: 0.6 percent of respondents reported Don’t Know or refused. Percentages may not add to 100 due to rounding.

58SOCIAL SCIENCE RESEARCH CENTER, MISSISSIPPI STATE UNIVERSITY
THE MISSISSIPPI SOCIAL CLIMATE SURVEY OF TOBACCO CONTROL, 2000-2001
Table 6.2 Support for a Tax Increase to Fund Adult Cessation Programs “State tobacco taxes should be increased to fund programs to help adults quit smoking. Do you strongly agree, agree, disagree, or strongly disagree?” (Percent responding by rural/urban, smoking status, gender, race, age, and education.)
Sample Characteristic
Strongly agree Agree Disagree
Strongly disagree p
Total 23.0 45.9 25.0 6.1
Rural Urban
22.6 23.2
45.5 46.1
25.4 24.8
6.4 5.9
.958
Nonsmoker Smoker
24.9 16.2
49.5 33.0
21.2 38.0
4.3 12.8
.000
Male Female
20.2 25.6
42.2 49.2
30.2 20.3
7.4 5.0
.000
White African American
19.7 29.9
42.6 52.5
29.9 14.5
7.8 3.1
.000
18-24 years of age 25-44 years of age 45-64 years of age 65 years of age and older
26.2 25.3 20.6 19.5
54.6 45.2 44.8 42.1
12.0 23.9 28.7 30.8
7.1 5.7 5.9 7.7
.001
Not a high school graduate High school graduate Some college College Graduate
23.6 23.4 21.6 23.5
52.9 45.8
44.3 44.4
17.8 25.5
27.6 25.0
5.7 5.3
6.5 7.1
.481
Note: 3.2 percent of respondents reported Don’t Know or refused. Percentages may not add to 100 due to rounding.
Table 6.3 Believe Tobacco Companies’ Claim that Nicotine is Not Addictive “Tobacco companies are being truthful when they say that nicotine is not addictive. Do you strongly agree, agree, disagree, or strongly disagree?”
(Percent responding by rural/urban, smoking status, gender, race, age, and education.)
Sample Characteristic
Strongly agree Agree Disagree
Strongly disagree p
Total 0.6 3.5 53.3 42.7
Rural Urban
0.7 0.6
3.6 3.3
51.9 54.2
43.8 41.9
.838
Nonsmoker Smoker
0.5 0.9
3.0 5.0
53.7 51.9
42.8 42.2
.272
Male Female
1.2 0.1
4.0 2.9
54.9 51.8
39.9 45.1
.014
White African American
0.3 1.0
3.0 4.4
50.4 58.1
46.3 36.5
.002
18-24 years of age 25-44 years of age 45-64 years of age 65 years of age and older
1.6 0.2 0.6 1.5
0.5 4.5 3.7 2.5
61.8 50.5 52.3 55.3
36.0 44.8 43.4 40.7
.018
Not a high school graduate High school graduate Some college College Graduate
1.7 0.4 0.5 0.3
4.5 4.9
2.1 2.6
57.3 55.0
53.4 49.2
36.5 39.8
44.1 48.0
.027
Note: 2.5 percent of respondents reported Don’t Know or refused. Percentages may not add to 100 due to rounding.

59SOCIAL SCIENCE RESEARCH CENTER, MISSISSIPPI STATE UNIVERSITY
THE MISSISSIPPI SOCIAL CLIMATE SURVEY OF TOBACCO CONTROL, 2000-2001
Table 6.4 Believe Tobacco Companies’ Claim that Tobacco is Not Harmful to Health “Tobacco companies are being truthful when they say tobacco is not harmful to health. Do you strongly agree, agree, disagree, or strongly disagree?”
(Percent responding by rural/urban, smoking status, gender, race, age, and education.)
Sample Characteristic
Strongly agree Agree Disagree
Strongly disagree p
Total 0.4 2.3 53.5 43.8
Rural Urban
0.30.5
2.62.1
52.454.2
44.743.3 .811
Nonsmoker Smoker
0.20.9
2.12.8
53.155.3
44.640.9 .119
Male Female
0.60.3
3.01.6
54.9 52.2
41.545.9 .101
White African American
0.30.6
2.22.4
51.157.1
46.439.8 .103
18-24 years of age 25-44 years of age 45-64 years of age 65 years of age and older
0.00.00.80.5
2.72.42.31.5
56.850.354.358.2
40.547.342.639.8 .221
Not a high school graduate High school graduate Some college College Graduate
0.00.20.50.5
5.62.4
1.01.8
56.456.5
53.848.0
38.040.9
44.749.8 .007
Note: 1.3 percent of respondents reported Don’t Know or refused. Percentages may not add to 100 due to rounding.
Table 6.5 Believe Tobacco Companies’ Claim that Second-Hand Smoke is Not Harmful to Health “Tobacco companies are being truthful when they say second-hand smoke is not harmful to health. Do you strongly agree, agree, disagree, or strongly disagree?” (Percent responding by rural/urban, smoking status, gender, race, age, and education.)
Sample Characteristic
Strongly agree Agree Disagree
Strongly disagree p
Total 0.6 2.6 53.9 42.8
Rural Urban
0.70.6
2.82.5
55.053.2
41.643.7 .864
Nonsmoker Smoker
0.31.7
2.05.3
53.655.1
44.138.0 .000
Male Female
0.60.6
3.71.7
55.7 52.4
40.045.3 .032
White African American
0.50.8
2.52.7
52.456.2
44.640.2 .442
18-24 years of age 25-44 years of age 45-64 years of age 65 years of age and older
0.00.51.00.5
2.23.13.20.5
56.250.854.459.8
41.645.541.439.2 .250
Not a high school graduate High school graduate Some college College Graduate
0.60.60.50.8
3.52.9
2.91.8
59.556.6
53.148.6
36.439.9
43.548.9 .231
Note: 3.6 percent of respondents reported Don’t Know or refused. Percentages may not add to 100 due to rounding.

60SOCIAL SCIENCE RESEARCH CENTER, MISSISSIPPI STATE UNIVERSITY
THE MISSISSIPPI SOCIAL CLIMATE SURVEY OF TOBACCO CONTROL, 2000-2001
Table 6.6 Danger of Chewing Tobacco “Is chewing tobacco very dangerous, somewhat dangerous, or not very dangerous?” (Percent responding by rural/urban, smoking status, gender, race, age, and education.)
Sample Characteristic Very dangerous Somewhat dangerous Not very dangerous p
Total 72.2 25.1 2.7
Rural Urban
69.973.8
27.523.4
2.72.7 .219
Nonsmoker Smoker
76.157.3
22.435.4
1.57.3 .000
Male Female
65.677.8
30.320.5
4.11.7 .000
White African American
71.273.9
26.123.1
2.73.0 .470
18-24 years of age 25-44 years of age 45-64 years of age 65 years of age and older
74.370.072.375.9
21.327.225.720.9
4.42.82.03.2 .312
Not a high school graduate High school graduate Some college College Graduate
64.771.573.974.2
28.725.6
24.823.7
6.62.91.32.0 .014
Note: 4.4 percent of respondents reported Don’t Know or refused. Percentages may not add to 100 due to rounding.
Table 6.7 Danger of Smoking Cigarettes “Is smoking cigarettes very dangerous, somewhat dangerous, or not very dangerous?” (Percent responding by rural/urban, smoking status, gender, race, age, and education.)
Sample Characteristic Very dangerous Somewhat dangerous Not very dangerous p
Total 84.9 14.3 0.8
Rural Urban
84.785.1
14.414.2
1.00.7 .833
Nonsmoker Smoker
90.564.6
9.033.9
0.51.6 .000
Male Female
81.088.2
18.210.9
0.70.9 .000
White African American
85.085.4
14.214.0
0.80.6 .891
18-24 years of age 25-44 years of age 45-64 years of age 65 years of age and older
82.484.184.889.3
15.415.014.810.2
2.10.90.40.5 .178
Not a high school graduate High school graduate Some college College Graduate
80.683.186.387.5
17.216.1
13.212.5
2.20.80.50.0 .034
Note: 1.0 percent of respondents reported Don’t Know or refused. Percentages may not add to 100 due to rounding.

61SOCIAL SCIENCE RESEARCH CENTER, MISSISSIPPI STATE UNIVERSITY
THE MISSISSIPPI SOCIAL CLIMATE SURVEY OF TOBACCO CONTROL, 2000-2001
Table 6.8 Danger of Using Snuff “Is using snuff very dangerous, somewhat dangerous, or not very dangerous?” (Percent responding by rural/urban, smoking status, gender, race, age, and education.)
Sample Characteristic Very dangerous Somewhat dangerous Not very dangerous p
Total 75.7 22.4 1.9
Rural Urban
74.1 76.8
23.821.3
2.1 1.8
.498
Nonsmoker Smoker
79.9 59.5
19.135.2
1.1 5.3
.000
Male Female
69.0 81.5
28.317.2
2.6 1.3
.000
White African American
73.6 79.3
24.618.2
1.8 2.4
.024
18-24 years of age 25-44 years of age 45-64 years of age 65 years of age and older
78.1 71.2 76.7 84.4
19.127.221.612.3
2.8 1.6 1.7 3.4
.001
Not a high school graduate High school graduate Some college College Graduate
70.4 75.9 76.7 76.0
27.021.3
22.322.7
2.5 2.8 1.1 1.3
.329
Note: 7.2 percent of respondents reported Don’t Know or refused. Percentages may not add to 100 due to rounding.
Table 6.9 Danger of Smoking Cigars “Is smoking cigars very dangerous, somewhat dangerous, or not very dangerous?” (Percent responding by rural/urban, smoking status, gender, race, age, and education.)
Sample Characteristic Very dangerous Somewhat dangerous Not very dangerous p
Total 76.1 21.1 2.8
Rural Urban
75.976.2
21.520.9
2.62.8 .953
Nonsmoker Smoker
81.655.2
16.538.6
1.86.2 .000
Male Female
70.481.2
25.817.0
3.91.8 .000
White African American
73.481.7
23.216.8
3.41.5 .001
18-24 years of age 25-44 years of age 45-64 years of age 65 years of age and older
75.474.376.481.1
20.223.421.415.3
4.42.32.23.6 .185
Not a high school graduate High school graduate Some college College Graduate
72.275.277.477.0
24.920.9
20.321.2
3.03.92.31.8 .438
Note: 3.3 percent of respondents reported Don’t Know or refused. Percentages may not add to 100 due to rounding.

62SOCIAL SCIENCE RESEARCH CENTER, MISSISSIPPI STATE UNIVERSITY
CHAPTER 7RECREATION, LEISURE, AND SPORTS
Universal Norms, Beliefs and Practices
· 1.8 million Mississippi adults (85.3 percent) believe that indoor sporting events shouldbe smokefree
Significant Improvements from 2000 to 2001
· The percentage of Mississippi adults who report that indoor shopping malls in theircommunity are smokefree increased from 60.3 to 71.2 percent
· The percentage of Mississippi adults who report that convenience restaurants in theircommunity are smokefree increased from 38.9 to 45.8 percent
· The percentage of Mississippi adults who report that fast food restaurants in their com-munity are smokefree increased from 31.0 to 37.9 percent
· The percentage of Mississippi adults who report that indoor sporting events in theircommunity are smokefree increased from 75.6 to 80.5 percent
· The percentage of Mississippi adults who believe that indoor shopping malls shouldbe smokefree increased from 71.5 to 79.5 percent
Mississippi, 2001: A Step Ahead
· Report being very much bothered by other people's smoke -- Mississippi: 54.2%; United States: 48.1%
· Believe that indoor shopping malls should be smokefree -- Mississippi: 79.5%; United States: 75.3%
· Believe that restaurants should be smokefree -- Mississippi: 64.6%; United States: 61.4%
· Believe that bars and taverns should be smokefree -- Mississippi: 43.8%; United States: 33.2%
· Believe that indoor sporting events should be smokefree -- Mississippi: 85.3%; United States: 80.4%
· Believe that outdoor parks should be smokefree -- Mississippi: 38.9%; United States: 25.2%
· Believe it is unacceptable for tobacco companies to sponsor sporting or cultural events --Mississippi: 42.9%; United States: 36.8%
Mississippi, 2001: A Step Behind
· Report that indoor shopping malls in their community are smokefree -- Mississippi: 71.2%; United States: 77.0%
· Report that convenience stores in their community are smokefree -- Mississippi: 45.8%; United States: 73.7%
· Report that fast food restaurants in their community are smokefree -- Mississippi: 37.9%; United States: 57.8%
· Report that restaurants in their community are smokefree -- Mississippi: 12.4%; United States: 28.1%
· Report that bars and taverns in their community are smokefree -- Mississippi: 3.9%; United States: 12.4%
· Believe that convenience stores should be smokefree -- Mississippi: 82.8%; United States: 86.9%

63SOCIAL SCIENCE RESEARCH CENTER, MISSISSIPPI STATE UNIVERSITY
THE MISSISSIPPI SOCIAL CLIMATE SURVEY OF TOBACCO CONTROL, 2000-2001
85.3
71.2
75.4
76.2
77.5
79.5
80.5
82.8
37.9
38.9
42.9
43.8
45.8
54.2
64.6
3.9
8.3
12.4
Bars and taverns in community are smokefree
Outdoor parks in community are smokefree
Restaurants in community are smokefree
Fast food restaurants in community are smokefree
Outdoors parks should be smokefree
Unacceptable for tobacco companies to sponsor events
Bars and taverns should be smokefree
Convenience stores in community are smokefree
Very much bothered by other people's smoke
Restaurants should be smokefree
Shopping malls in community are smokefree
Request a non-smoking table when dining out
Request a non-smoking room when traveling
Fast food restaurants should be smokefree
Shopping malls should be smokefree
Indoor sporting events in community are smokefree
Convenience stores should be smokefree
Indoor sporting events should be smokefree
Universal Predominant Marginal Contested
Percent of respondents who support normative beliefs, recognize health risks, orreport tobacco control practices

64SOCIAL SCIENCE RESEARCH CENTER, MISSISSIPPI STATE UNIVERSITY
THE MISSISSIPPI SOCIAL CLIMATE SURVEY OF TOBACCO CONTROL, 2000-2001
Mississippi, 2000 & 2001: Differences in the percent of respondents who support normative beliefs, recognize health risks, or report tobacco control practices
Recreation, Sports, and Leisure Year Percentage p2001 54.22000 54.52001 71.22000 60.32001 45.82000 38.92001 37.92000 31.02001 12.42000 10.12001 3.92000 4.82001 80.52000 75.62001 8.32000 9.02001 79.52000 71.52001 82.82000 80.2 0.1292001 77.52000 77.1 0.8462001 64.62000 66.72001 43.82000 46.12001 85.32000 82.22001 38.92000 40.72001 75.42000 72.42001 76.22000 73.12001 42.92000 44.7
Restaurants in community are smokefree
Bars and taverns in community are smokefree
Indoor sporting events in community are smokefree
Outdoor parks in community are smokefree
Very much bothered by other people's smoke
Indoor shopping malls in community are smokefree
Convenience stores in community are smokefree
Fast food restaurants in community are smokefree 0.002
0.004
0.000
0.902
0.591
0.022
0.461
0.093
Fast food restaurants should be smokefree
Convenient stores should be smokefree
Indoor shopping malls should be smokefree 0.000
Outdoor parks should be smokefree
Indoor sporting events should be smokefree
Bars and taverns should be smokefree
0.325Restaurants should be smokefree
0.441
0.127
0.131
0.410
0.061
0.329
Unacceptable for tobacco companies to sponsor events
Request a non-smoking room when traveling
Request a non-smoking table when dining out

65SOCIAL SCIENCE RESEARCH CENTER, MISSISSIPPI STATE UNIVERSITY
THE MISSISSIPPI SOCIAL CLIMATE SURVEY OF TOBACCO CONTROL, 2000-2001
Mississippi and the Nation: Differences in the percent of respondents who supportnormative beliefs, recognize health risks, or report tobacco control practices
Recreation, Leisure, and Sports Sample Percentage pMS 54.2US 48.1MS 71.2US 77.0MS 45.8US 73.7MS 37.9US 57.8MS 12.4US 28.1MS 3.9US 12.4MS 80.5US 81.7MS 8.3US 7.9MS 79.5US 75.3MS 82.8US 86.9MS 77.5US 80.0MS 64.6US 61.4 0.034MS 43.8US 33.2MS 85.3US 80.4MS 38.9US 25.2MS 75.4US 72.8MS 76.2US 75.1MS 42.9US 36.8
0.000
0.434
0.068
0.000
0.000
0.000
0.054
0.000
0.001
0.712
0.396
0.000
0.000
0.000
0.000
0.000
0.000Very much bothered by other people's smoke
Indoor shopping malls in community are smokefree
Convenience stores in community are smokefree
Fast food restaurants in community are smokefree
Restaurants in community are smokefree
Bars and taverns in community are smokefree
Indoor sporting events in community are smokefree
Outdoor parks in community are smokefree
Indoor shopping malls should be smokefree
Convenient stores should be smokefree
Restaurants should be smokefree
Request a non-smoking room when traveling
Unacceptable for tobacco companies to sponsor events
Fast food restaurants should be smokefree
Bars and taverns should be smokefree
Indoor sporting events should be smokefree
Outdoor parks should be smokefree
Request a non-smoking table when dining out

Percent of respondents who report that recreational settings in their community aresmokefree and the percent of respondents who report that these settings should besmokefree
66SOCIAL SCIENCE RESEARCH CENTER, MISSISSIPPI STATE UNIVERSITY
THE MISSISSIPPI SOCIAL CLIMATE SURVEY OF TOBACCO CONTROL, 2000-2001
3.9
12.4
37.9
45.8
71.2
80.4
64.6
77.5
82.8
79.5
85.3
8.3
43.8
38.9Outdoor Parks*
Bars and Taverns*
Restaurants*
Fast FoodRestaurants*
ConvenienceStores*
Shopping Malls
Indoor SportingEvents
Percent of respondents whoreport that the setting should be smokefree
Percent of respondents whoreport that the setting issmokefree
* p<.001

67SOCIAL SCIENCE RESEARCH CENTER, MISSISSIPPI STATE UNIVERSITY
THE MISSISSIPPI SOCIAL CLIMATE SURVEY OF TOBACCO CONTROL, 2000-2001
Detailed Tables
· Slightly more than half of Mississippi adults reported that they are very much both-ered by other people's cigarette smoke. However, there is substantial variation acrosssociodemographic groups.
· Although more than two-thirds of Mississippi adults believe that restaurants, shoppingmalls, convenience stores, and indoor sporting events should be smokefree, publicpolicies do not reflect these attitudes.
· In general, females are more supportive of smoking restrictions in recreational settingsthan males, and nonsmokers are more supportive than smokers.
· When dining out, 75 percent of adults in Mississippi request a table in the non-smok-ing section. When traveling, about two-thirds request a non-smoking room.
Table 7.1 Tolerance for Second-Hand Smoke “How much does it bother you when you are exposed to other people’s cigarette smoke? Would you say it bothers you not at all, a little, moderately, or very much?” (Percent responding by rural/urban, smoking status, gender, race, age, and education.) Sample Characteristic
Not at all A little Moderately
Very much p
Total 16.0 12.9 16.8 54.2
Rural Urban
18.114.3
10.214.8
15.817.6
55.653.3 .012
Nonsmoker Smoker
6.350.8
10.222.8
16.617.8
66.98.6 .000
Male Female
20.312.1
16.210.1
17.3 16.5
46.261.4 .000
White African American
16.814.9
14.310.6
18.512.4
50.462.1 .000
18-24 years of age 25-44 years of age 45-64 years of age 65 years of age and older
16.512.817.421.1
19.714.511.26.9
21.318.514.314.2
42.654.357.057.8 .000
Not a high school graduate High school graduate Some college College Graduate
18.918.817.59.7
12.814.6
12.211.4
15.013.2
19.519.7
53.353.5
50.859.2 .002
Note: 0.5 percent of respondents reported Don’t Know or refused. Percentages may not add to 100 due to rounding.

68SOCIAL SCIENCE RESEARCH CENTER, MISSISSIPPI STATE UNIVERSITY
THE MISSISSIPPI SOCIAL CLIMATE SURVEY OF TOBACCO CONTROL, 2000-2001
Table 7.2 Smokefree Shopping Malls in Community “Indoor shopping malls in your community, are they completely smokefree, have designated smoking and nonsmoking, or permit smoking anywhere?” (Percent responding by rural/urban, smoking status, gender, race, age, and education.)
Sample Characteristic
Completelysmokefree
Designated areas
Permit smokinganywhere p
Total 71.2 22.8 6.0
Rural Urban
71.171.3
23.322.3
5.56.3 .801
Nonsmoker Smoker
67.583.4
25.215.0
7.41.7 .000
Male Female
69.972.2
22.722.9
7.44.9 .164
White African American
77.260.2
17.731.7
5.18.0 .000
18-24 years of age 25-44 years of age 45-64 years of age 65 years of age and older
69.071.571.372.6
24.422.622.223.3
6.55.96.54.1 .952
Not a high school graduate High school graduate Some college College Graduate
71.171.970.470.7
24.622.4
23.622.0
4.25.86.07.3 .899
Note: 15.8 percent of respondents reported Don’t Know or refused. Percentages may not add to 100 due to rounding .
Table 7.3 Should Shopping Malls be Smokefree “In indoor shopping malls, do you think smoking should be allowed in all areas, some areas, or not at all?” (Percent responding by rural/urban, smoking status, gender, race, age, and education.)
Sample Characteristic All areas Some areas Not at all p
Total 0.4 20.1 79.5
Rural Urban
0.60.3
19.820.3
79.5 79.4
.703
Nonsmoker Smoker
0.30.9
15.736.1
84.1 63.0
.000
Male Female
0.40.4
24.716.0
74.9 83.6
.000
White African American
0.50.2
22.315.3
77.2 84.5
.004
18-24 years of age 25-44 years of age 45-64 years of age 65 years of age and older
0.50.20.61.0
19.021.818.719.6
80.4 78.0 80.7 79.4
.646
Not a high school graduate High school graduate Some college College Graduate
1.70.20.50.0
20.420.6
20.319.2
77.9 79.2 79.2 80.8
.140
Note: 0.7 percent of respondents reported Don’t Know or refused. Percentages may not add to 100 due to rounding.

69SOCIAL SCIENCE RESEARCH CENTER, MISSISSIPPI STATE UNIVERSITY
THE MISSISSIPPI SOCIAL CLIMATE SURVEY OF TOBACCO CONTROL, 2000-2001
Table 7.4 Smokefree Convenience Stores in Community “Convenience stores in your community, are they completely smokefree, have designated smoking and nonsmoking, or permit smoking anywhere?” (Percent responding by rural/urban, smoking status, gender, race, age, and education.)
Sample Characteristic
Completely smokefree Designated areas
Permit smoking anywhere p
Total 45.8 10.9 43.4
Rural Urban
44.946.4
11.210.7
43.942.9
.869
Nonsmoker Smoker
43.054.5
11.210.1
45.835.4
.002
Male Female
48.942.7
9.112.7
42.044.7
.033
White African American
39.257.2
10.112.1
50.830.7
.000
18-24 years of age 25-44 years of age 45-64 years of age 65 years of age and older
44.046.846.143.8
13.710.310.410.9
42.342.943.545.3
.916
Not a high school graduate High school graduate Some college College Graduate
54.651.144.835.8
15.111.2 9.49.6
30.337.745.854.5
.000
Note: 17.2 percent of respondents reported Don’t Know or refused. Percentages may not add to 100 due to rounding.
Table 7.5 Should Convenience Stores be Smokefree “In convenience stores, do you think that smoking should be allowed in all areas, some areas, or not at all?” (Percent responding by rural/urban, smoking status, gender, race, age, and education.) Sample Characteristic All areas Some areas Not at all p
Total 4.4 12.7 82.8
Rural Urban
4.24.6
12.912.6
82.8 82.8 .941
Nonsmoker Smoker
2.910.2
10.022.7
87.1 67.1 .000
Male Female
6.52.7
15.310.4
78.2 86.9 .000
White African American
5.71.4
13.411.4
80.9 87.1 .000
18-24 years of age 25-44 years of age 45-64 years of age 65 years of age and older
3.83.15.65.5
16.813.612.08.5
79.3 83.3 82.5 85.9 .098
Not a high school graduate High school graduate Some college College Graduate
7.33.15.73.8
12.413.0
13.711.0
80.2 83.9 80.6 85.1 .177
Note: 2.9 percent of respondents reported Don’t Know or refused. Percentages may not add to 100 due to rounding.

70SOCIAL SCIENCE RESEARCH CENTER, MISSISSIPPI STATE UNIVERSITY
THE MISSISSIPPI SOCIAL CLIMATE SURVEY OF TOBACCO CONTROL, 2000-2001
Table 7.6 Smokefree Fast Food Restaurants in Community “Fast food restaurants in your community, are they completely smokefree, have designated smoking and nonsmoking, or permit smoking anywhere?” (Percent responding by rural/urban, smoking status, gender, race, age, and education.)
Sample Characteristic
Completely smokefree
Designated areas
Permit smoking anywhere p
Total 37.9 55.7 6.4
Rural Urban
35.2 39.2
59.7 52.8
5.0 7.3
.025
Nonsmoker Smoker
34.4 49.7
58.1 47.4
7.4 3.0
.000
Male Female
38.7 37.1
53.8 57.6
7.5 5.3
.160
White African American
37.8 37.9
54.3 58.4
7.9 3.7
.012
18-24 years of age 25-44 years of age 45-64 years of age 65 years of age and older
44.1 37.0 37.3 35.9
49.7 57.4 56.8 53.6
6.2 5.6 5.9
10.5
.213
Not a high school graduate High school graduate Some college College Graduate
37.7 37.3 38.3 38.1
57.1 57.0
56.1 53.2
5.2 5.8 5.6 8.7
.603
Note: 11.2 percent of respondents reported Don’t Know or refused. Percentages may not add to 100 due to rounding.
Table 7.7 Should Fast Food Restaurants be Smokefree “In fast food restaurants, do you think that smoking should be allowed in all areas, some areas, or not at all?” (Percent responding by rural/urban, smoking status, gender, race, age, and education.)
Sample Characteristic All areas Some areas Not at all p
Total 0.6 21.9 77.5
Rural Urban
0.6 0.6
23.1 21.1
76.2 78.3
.633
Nonsmoker Smoker
0.3 1.9
17.2 38.9
82.5 59.3
.000
Male Female
1.0 0.3
25.3 19.0
73.7 80.7
.002
White African American
0.6 0.6
22.8 20.2
76.5 79.2
.506
18-24 years of age 25-44 years of age 45-64 years of age 65 years of age and older
0.0 0.5 0.8 1.0
30.3 22.6 19.4 18.8
69.7 76.9 79.8 80.2
.051
Not a high school graduate High school graduate Some college College Graduate
0.6 0.8 0.8 0.3
22.3 21.4
25.8 18.0
77.1 77.8 73.4 81.8
.190
Note: 0.9 percent of respondents reported Don’t Know or refused. Percentages may not add to 100 due to rounding.

71SOCIAL SCIENCE RESEARCH CENTER, MISSISSIPPI STATE UNIVERSITY
THE MISSISSIPPI SOCIAL CLIMATE SURVEY OF TOBACCO CONTROL, 2000-2001
Table 7.8 Restaurants in Community “Restaurants in your community, are they completely smokefree, have designated smoking and nonsmoking, or permit smoking anywhere?” (Percent responding by rural/urban, smoking status, gender, race, age, and education.)
Sample Characteristic
Completely smokefree
Designated areas
Permit smoking anywhere p
Total 12.4 85.1 2.4
Rural Urban
13.3 11.9
84.0 85.9
2.7 2.3 .622
Nonsmoker Smoker
11.5 15.8
85.9 82.3
2.5 1.9 .122
Male Female
13.9 11.2
83.1 86.8
3.0 2.0 .133
White African American
9.7 17.9
87.6 80.0
2.7 2.2 .000
18-24 years of age 25-44 years of age 45-64 years of age 65 years of age and older
15.4 11.6 11.1 15.9
81.9 85.8 87.0 80.6
2.7 2.6 1.8 3.5 .373
Not a high school graduate High school graduate Some college College Graduate
22.0 13.2 10.6 8.4
75.5 84.9
86.5 88.7
2.5 1.9 2.9 2.8 .001
Note: 5.5 percent of respondents reported Don’t Know or refused. Percentages may not add to 100 due to rounding.
Table 7.9 Should Restaurants be Smokefree “In restaurants, do you think that smoking should be allowed in all areas, some areas, or not at all?” (Percent responding by rural/urban, smoking status, gender, race, age, and education.) Sample Characteristic All areas Some areas Not at all p
Total 0.4 35.0 64.6
Rural Urban
0.5 0.3
31.6 37.4
67.9 62.2
.061
Nonsmoker Smoker
0.3 0.9
28.7 57.9
71.1 41.2
.000
Male Female
0.7 0.3
39.7 30.8
59.6 69.0
.000
White African American
0.6 0.0
38.9 26.2
60.4 73.8
.000
18-24 years of age 25-44 years of age 45-64 years of age 65 years of age and older
0.0 0.3 0.6 0.5
41.6 37.8 31.1 30.4
58.4 61.8 68.3 69.1
.060
Not a high school graduate High school graduate Some college College Graduate
0.6 0.4 0.5 0.2
29.1 30.8
41.8 36.2
70.4 68.8 57.7 63.6
.018
Note: 0.8 percent of respondents reported Don’t Know or refused. Percentages may not add to 100 due to rounding.

72SOCIAL SCIENCE RESEARCH CENTER, MISSISSIPPI STATE UNIVERSITY
THE MISSISSIPPI SOCIAL CLIMATE SURVEY OF TOBACCO CONTROL, 2000-2001
Table 7.10 Smokefree Bars and Taverns in Community “Bars and taverns in your community, are they completely smokefree, have designated smoking and nonsmoking, or permit smoking anywhere?” (Percent responding by rural/urban, smoking status, gender, race, age, and education.)
Sample Characteristic
Completely smokefree
Designated areas
Permit smoking anywhere p
Total 3.9 16.9 79.2
Rural Urban
5.1 3.2
19.2 15.6
75.6 81.2
.117
Nonsmoker Smoker
4.2 3.0
18.5 12.4
77.3 84.5
.066
Male Female
4.2 3.6
16.0 17.9
79.8 78.6
.710
White African American
2.6 5.5
12.8 24.1
84.7 70.4
.000
18-24 years of age 25-44 years of age 45-64 years of age 65 years of age and older
6.5 3.1 2.8 6.5
13.5 16.7 19.1 16.1
80.0 80.1 78.0 77.4
.336
Not a high school graduate High school graduate Some college College Graduate
7.3 4.5 2.6 2.6
8.5 16.3
17.5 19.6
84.1 79.2 79.8 77.8
.000
Note: 41.7 percent of respondents reported Don’t Know or refused. Percentages may not add to 100 due to rounding.
Table 7.11 Should Bars and Taverns be Smokefree “In bars and taverns, do you think that smoking should be allowed in all areas, some areas, or not at all?” (Percent responding by rural/urban, smoking status, gender, race, age, and education.)
Sample Characteristic All areas Some areas Not at all p Total 28.3 27.9 43.8
Rural Urban
27.0 29.2
25.0 30.1
48.1 40.8
.024
Nonsmoker Smoker
22.3 49.2
26.2 34.1
51.5 16.7
.000
Male Female
34.6 22.6
27.5 28.4
37.9 49.0
.000
White African American
33.2 18.5
26.7 30.2
40.1 51.2
.000
18-24 years of age 25-44 years of age 45-64 years of age 65 years of age and older
35.2 29.7 26.9 19.8
34.6 32.2 23.0 19.8
30.2 38.1 50.1 60.5
.000
Not a high school graduate High school graduate Some college College Graduate
21.6 29.6 30.6 27.0
24.2 23.8
31.4 32.2
54.2 46.5 38.0 40.9
.004
Note: 11.1 percent of respondents reported Don’t Know or refused. Percentages may not add to 100 due to rounding.

73SOCIAL SCIENCE RESEARCH CENTER, MISSISSIPPI STATE UNIVERSITY
THE MISSISSIPPI SOCIAL CLIMATE SURVEY OF TOBACCO CONTROL, 2000-2001
Table 7.12 Smokefree Indoor Sporting Events in Community “Indoor sporting events in your community, are they completely smokefree, have designated smoking and nonsmoking, or permit smoking anywhere?” (Percent responding by rural/urban, smoking status, gender, race, age, and education.)
Sample Characteristic
Completely smokefree
Designated areas
Permit smoking anywhere p
Total 80.5 12.5 6.9
Rural Urban
78.6 81.8
14.4 11.3
7.0 6.9
.286
Nonsmoker Smoker
78.3 87.6
13.4 9.8
8.2 2.6
.001
Male Female
81.3 79.7
11.3 13.8
7.4 6.5
.417
White African American
81.8 78.7
12.6 12.7
5.6 8.7
.128
18-24 years of age 25-44 years of age 45-64 years of age 65 years of age and older
83.3 78.4 81.4 82.4
12.2 12.4 14.5 7.6
4.5 9.2 4.1
10.1
.020
Not a high school graduate High school graduate Some college College Graduate
74.5 83.4 79.0 79.9
15.5 11.8
14.5 10.9
10.0 4.9 6.5 9.1
.137
Note: 23.6 percent of respondents reported Don’t Know or refused. Percentages may not add to 100 due to rounding.
Table 7.13 Should Indoor Sporting Events be Smokefree “At indoor sporting events, do you think that smoking should be allowed in all areas, some areas, or not at all?” (Percent responding by rural/urban, smoking status, gender, race, age, and education.)
Sample Characteristic All areas Some areas Not at all p
Total 1.4 13.3 85.3
Rural Urban
2.0 1.1
12.5 13.9
85.5 85.1
.280
Nonsmoker Smoker
1.1 2.5
9.8 26.2
89.1 71.3
.000
Male Female
1.9 1.0
15.3 11.5
82.8 87.5
.031
White African American
1.9 0.6
14.9 9.7
83.2 89.7
.003
18-24 years of age 25-44 years of age 45-64 years of age 65 years of age and older
2.7 1.4 1.6 0.0
9.1 16.8 12.6 8.5
88.2 81.8 85.9 91.5
.005
Not a high school graduate High school graduate Some college College Graduate
1.7 0.2 2.3 1.5
14.9 12.0
14.4 13.5
83.4 87.8 83.3 85.0
.135
Note: 2.2 percent of respondents reported Don’t Know or refused. Percentages may not add to 100 due to rounding.

74SOCIAL SCIENCE RESEARCH CENTER, MISSISSIPPI STATE UNIVERSITY
THE MISSISSIPPI SOCIAL CLIMATE SURVEY OF TOBACCO CONTROL, 2000-2001
Table 7.14 Smokefree Outdoor Parks in Community “Outdoor parks in your community, are they completely smokefree, have designated smoking and nonsmoking, or permit smoking anywhere?” (Percent responding by rural/urban, smoking status, gender, race, age, and education.)
Sample Characteristic
Completely smokefree
Designated areas
Permit smoking anywhere p
Total 8.3 10.1 81.6
Rural Urban
9.7 7.3
10.5 9.9
79.9 82.7
.309
Nonsmoker Smoker
8.7 7.0
9.5 12.2
81.8 80.8
.302
Male Female
7.7 8.8
10.3 10.1
82.0 81.0
.761
White African American
7.0 10.9
7.9 13.9
85.1 75.2
.000
18-24 years of age 25-44 years of age 45-64 years of age 65 years of age and older
8.8 8.2 8.4 7.6
11.1 10.2 10.5 7.6
80.1 81.6 81.1 84.8
.963
Not a high school graduate High school graduate Some college College Graduate
7.9 10.1 6.8 7.4
6.4 13.2 9.8 8.6
85.7 76.7 83.3 84.0
.081
Note: 17.4 percent of respondents reported Don’t Know or refused. Percentages may not add to 100 due to rounding .
Table 7.15 Should Outdoor Parks be Smokefree “In outdoor parks, do you think that smoking should be allowed in all areas, some areas, or not at all?” (Percent responding by rural/urban, smoking status, gender, race, age, and education.)
Sample Characteristic All areas Some areas Not at all p
Total 31.5 29.5 38.9
Rural Urban
31.331.8
28.930.0
39.838.2 .811
Nonsmoker Smoker
26.250.8
28.433.6
45.415.6 .000
Male Female
40.124.1
27.731.1
32.244.8 .000
White African American
35.922.2
29.130.6
35.047.2 .000
18-24 years of age 25-44 years of age 45-64 years of age 65 years of age and older
26.730.134.533.2
32.131.127.826.5
41.238.837.740.3 .434
Not a high school graduate High school graduate Some college College Graduate
37.226.835.030.8
22.730.1
30.831.6
40.143.134.237.6 .021
Note:2.3 percent of respondents reported Don’t Know or refused. Percentages may not add to 100 due to rounding.

75SOCIAL SCIENCE RESEARCH CENTER, MISSISSIPPI STATE UNIVERSITY
THE MISSISSIPPI SOCIAL CLIMATE SURVEY OF TOBACCO CONTROL, 2000-2001
Table 7.16 Dining Preferences “When dining out, do you request a table in the non-smoking section, smoking section, or the first available?” (Percent responding by rural/urban, smoking status, gender, race, age, and education.)
Sample Characteristic
Non-smoking section Smoking section First available p
Total 75.3 10.7 13.9
Rural Urban
75.3 75.4
13.1 9.0
11.6 15.6
.009
Nonsmoker Smoker
89.5 22.8
1.3 46.0
9.2 31.2
.000
Male Female
71.1 79.1
11.8 9.7
17.1 11.2
.001
Whi te African American
71.2 83.1
13.4 5.7
15.3 11.2
.000
18-24 years of age 25-44 years of age 45-64 years of age 65 years of age and older
69.4 75.2 74.1 85.0
11.3 9.7
13.6 5.7
19.4 15.2 12.3 9.3
.002
Not a high school graduate High school graduate Some college College Graduate
67.1 75.6 72.5 81.3
19.4 11.1
13.1 5.0
13.5 13.3 14.4 13.7
.000
Note: 2.6 percent of respondents reported Don’t Know or refused. Percentages may not add to 100 due to rounding.
Table 7.17 Hotel Preferences “If you travel and stay in a hotel or motel, do you usually request a non-smoking room?” (Percent responding by rural/urban, smoking status, gender, race, age, and education.)
Sample Characteristic Yes No p
Total 76.2 23.8
Rural Urban
74.4 77.4
25.6 22.6 .197
Nonsmoker Smoker
90.8 24.5
9.2 75.5 .000
Male Female
71.9 80.0
28.1 20.0 .000
White African American
72.6 82.5
27.4 17.5 .000
18-24 years of age 25-44 years of age 45-64 years of age 65 years of age and older
73.2 75.8 76.4 80.1
26.8 24.2 23.6 19.9 .502
Not a high school graduate High school graduate Some college College Graduate
65.8 73.6
74.0 85.8
34.2 26.4
26.0 14.2 .000
Note: 5.5 percent of respondents reported Don’t Know or refused. Percentages may not add to 100 due to rounding.

76SOCIAL SCIENCE RESEARCH CENTER, MISSISSIPPI STATE UNIVERSITY
THE MISSISSIPPI SOCIAL CLIMATE SURVEY OF TOBACCO CONTROL, 2000-2001
Table 7.18 Is It Acceptable for Tobacco Companies to Sponsor Sporting or Cultural Events “It is acceptable for tobacco companies to sponsor sporting or cultural events like the Winston Cup. Do you strongly agree, agree, disagree, or strongly disagree?”
(Percent responding by rural/urban, smoking status, gender, race, age, and education.)
Sample Characteristic
Strongly agree Agree Disagree
Strongly disagree p
Total 12.2 44.8 31.2 11.7
Rural Urban
10.8 13.3
41.0 47.4
34.5 28.8
13.7 10.5 .011
Nonsmoker Smoker
8.7 24.0
40.8 58.3
36.3 14.1
14.2 3.5 .000
Male Female
16.4 8.2
48.2 41.5
26.1 36.1
9.3 14.2 .000
White African American
15.0 7.2
47.4 39.0
28.0 38.1
9.7 15.7 .000
18-24 years of age 25-44 years of age 45-64 years of age 65 years of age and older
13.7 13.7 10.9 9.6
42.3 47.1 45.1 39.5
29.7 28.3 32.0 40.1
14.3 10.8 12.0 10.8 .193
Not a high school graduate High school graduate Some college College Graduate
8.1 12.9 12.4 13.2
43.0 38.9
48.2 50.5
36.2 35.6
29.5 25.0
12.8 12.7 9.9 11.3 .015
Note: 9.0 percent of respondents reported Don’t Know or refused. Percentages may not add to 100 due to rounding.
77SOCIAL SCIENCE RESEARCH CENTER, MISSISSIPPI STATE UNIVERSITY
CHAPTER 8MASS CULTURE AND COMMUNICATION
Universal Norms, Beliefs and Practices
· 1.9 million Mississippi adults (93.2 percent) do NOT believe the tobacco companies'claim that they do not manipulate the level of nicotine in cigarettes
· 1.8 million Mississippi adults (86.6 percent) do NOT believe the tobacco companies'claim that ads do not encourage kids to smoke
Significant Improvements from 2000 to 2001
· The percentage of Mississippi adults who believe that tobacco advertising is notacceptable on billboards increased from 57.0 to 63.2 percent
· The percentage of Mississippi adults who believe that tobacco advertising is notacceptable at sporting or cultural events increased from 59.8 to 64.7 percent
Mississippi, 2001: A Step Ahead
· Believe that tobacco ads are not acceptable in grocery stores -- Mississippi: 54.8%; United States: 46.6%
· Believe that tobacco ads are not acceptable in magazines -- Mississippi: 52.0%; United States: 42.1%
· Believe that tobacco ads are not acceptable on billboards -- Mississippi: 63.2%; United States: 55.3%
· Believe that tobacco ads are not acceptable in direct mailers -- Mississippi: 65.4%; United States: 59.5%
· Believe that tobacco ads are not acceptable on internet sites -- Mississippi: 62.6%; United States: 53.5%
· Believe that tobacco ads are not acceptable at sporting or cultural events -- Mississippi: 64.7%; United States: 55.8%

78SOCIAL SCIENCE RESEARCH CENTER, MISSISSIPPI STATE UNIVERSITY
THE MISSISSIPPI SOCIAL CLIMATE SURVEY OF TOBACCO CONTROL, 2000-2001
86.6
93.2
65.4
84.8
52.0
54.8
62.6
63.2
64.7
Tobacco ads are not acceptable in magazines
Tobacco ads are not acceptable in grocery stores
Tobacco ads are not acceptable on Internet sites
Tobacco ads are not acceptable on billboards
Tobacco ads are not acceptable at sporting or culturalevents
Tobacco ads are not acceptable in direct mailers
Do not believe tobacco companies' claim that ads only targetadult smokers
Do not believe tobacco companies' claim that ads do notencourage kids to smoke
Do not believe tobacco companies' claim that they do notmanipulate the level of nicotine in cigarettes
Universal Predominant Marginal Contested
Percent of respondents who support normative beliefs, recognize health risks, orreport tobacco control practices

79SOCIAL SCIENCE RESEARCH CENTER, MISSISSIPPI STATE UNIVERSITY
THE MISSISSIPPI SOCIAL CLIMATE SURVEY OF TOBACCO CONTROL, 2000-2001
Mississippi, 2000 & 2001: Differences in the percent of respondents who support normative beliefs, recognize health risks, or report tobacco control practices
Mass Communication and Culture Year Percentage p2001 54.82000 51.32001 52.02000 50.22001 63.22000 57.02001 65.42000 61.42001 62.62000 60.4
2001 64.7
2000 59.8
2001 93.2
2000 92.7
2001 86.6
2000 86.9
2001 84.8
2000 85.10.868
0.855
0.647
0.024
0.321
0.058
0.005
0.412
0.129
Do not believe tobacco companies' claim that ads only target adult smokers
Do not believe tobacco companies' claim that they do not target kids
Do not believe tobacco companies' claim that they do not manipulate nicotine levels
Tobacco ads are not acceptable at sporting or cultural events
Tobacco ads are not acceptable in grocery stores
Tobacco ads are not acceptable on internet sites
Tobacco ads are not acceptable in direct mailers
Tobacco ads are not acceptable on billboards
Tobacco ads are not acceptable in magazines

80SOCIAL SCIENCE RESEARCH CENTER, MISSISSIPPI STATE UNIVERSITY
THE MISSISSIPPI SOCIAL CLIMATE SURVEY OF TOBACCO CONTROL, 2000-2001
Mississippi and the Nation: Differences in the percent of respondents who supportnormative beliefs, recognize health risks, or report tobacco control practices
Mass Communication and Culture Sample Percentage pMS 54.8US 46.6MS 52.0US 42.1MS 63.2US 55.3MS 65.4US 59.5MS 62.6US 53.5MS 64.7US 55.8MS 93.2US 93.5MS 86.6US 84.6MS 84.8US 83.3
0.000
0.071
0.000
0.000
0.000
0.000
Tobacco ads are not acceptable on internet sites
Tobacco ads are not acceptable in grocery stores
Tobacco ads are not acceptable in magazines
Tobacco ads are not acceptable on billboards
Tobacco ads are not acceptable in direct mailers
Do not believe tobacco companies' claim that ads only target adult smokers 0.192
0.768
0.000Tobacco ads are not acceptable at sporting or cultural events
Do not believe tobacco companies' claim that they do not manipulate nicotine levels
Do not believe tobacco companies' claim that they do not target kids

81SOCIAL SCIENCE RESEARCH CENTER, MISSISSIPPI STATE UNIVERSITY
THE MISSISSIPPI SOCIAL CLIMATE SURVEY OF TOBACCO CONTROL, 2000-2001
Detailed Tables
· More than 80 percent of Mississippi adults reject the tobacco companies' claims thattheir ads do not target youth.
· Although more than 80 percent of adults in Mississippi believe that tobacco ads targetyouth, adults are divided in their support for restrictions on tobacco advertising, andthere is considerable variation across demographic groups.
Table 8.1 Acceptability of Tobacco Advertisements in Grocery and Convenience Stores “Tobacco advertising is acceptable in grocery and convenience stores. Do you strongly agree, agree, disagree, or strongly disagree?” (Percent responding by rural/urban, smoking status, gender, race, age, and education.)
Sample Characteristic
Strongly agree Agree Disagree
Strongly disagree p
Total 6.3 39.0 42.3 12.4
Rural Urban
6.1 6.4
36.0 41.2
44.0 41.1
14.0 11.3 .156
Nonsmoker Smoker
4.4 12.8
32.9 60.7
48.3 21.2
14.4 5.3 .000
Male Female
6.6 6.0
44.5 34.1
37.5 51.2
11.6 14.5 .000
White African American
7.3 4.1
43.6 30.1
33.3 34.9
12.7 14.7 .056
18-24 years of age 25-44 years of age 45-64 years of age 65 years of age and older
9.3 6.6 5.0 5.9
40.4 42.1 39.0 29.1
39.9 38.7 43.6 51.2
10.4 12.6 12.4 13.8 .038
Not a high school graduate High school graduate Some college College Graduate
5.2 6.1 5.2 7.1
31.6 33.8
46.3 42.8
53.4 45.4
38.2 37.7
9.8 14.7
10.3 12.4 .001
Note: 2.7 percent of respondents reported Don’t Know or refused. Percentages may not add to 100 due to rounding.

82SOCIAL SCIENCE RESEARCH CENTER, MISSISSIPPI STATE UNIVERSITY
THE MISSISSIPPI SOCIAL CLIMATE SURVEY OF TOBACCO CONTROL, 2000-2001
Table 8.2 Acceptability of Tobacco Advertisements in Magazines “Tobacco advertising is acceptable in magazines. Do you strongly agree, agree, disagree, or strongly disagree?” (Percent responding by rural/urban, smoking status, gender, race, age, and education.)
Sample Characteristic
Strongly agree Agree Disagree
Strongly disagree p
Total 6.0 42.0 41.1 11.0
Rural Urban
5.6 6.2
39.6 43.6
41.6 40.8
13.2 9.4 .099
Nonsmoker Smoker
4.0 13.2
36.8 60.7
46.5 21.4
12.7 4.7 .000
Male Female
6.9 5.2
48.5 36.1
35.0 46.5
9.6 12.2 .000
White African American
6.7 4.4
46.1 34.9
36.9 48.3
10.3 12.3 .000
18-24 years of age 25-44 years of age 45-64 years of age 65 years of age and older
8.7 6.6 4.6 5.3
42.6 45.7 41.4 31.6
38.3 36.7 43.3 51.1
10.4 11.0 10.7 12.1 .018
Not a high school graduate High school graduate Some college College Graduate
5.3 5.7 5.6 6.4
33.5 37.0
50.3 45.0
51.2 44.4
35.1 38.4
10.0 12.9 9.0 10.2 .002
Note: 3.2 percent of respondents reported Don’t Know or refused. Percentages may not add to 100 due to rounding.
Table 8.3 Acceptability of Tobacco Advertisements on Billboards “Tobacco advertising is acceptable on billboards. Do you strongly agree, agree, disagree, or strongly disagree?” (Percent responding by rural/urban, smoking status, gender, race, age, and education.)
Sample Characteristic
Strongly agree Agree Disagree
Strongly disagree p
Total 4.7 32.1 49.6 13.6
Rural Urban
4.5 4.9
30.0 33.5
50.2 49.2
15.3 12.4 .303
Nonsmoker Smoker
2.9 11.5
27.7 47.7
53.8 34.7
15.7 6.2 .000
Male Female
5.3 4.2
39.1 25.7
44.3 54.3
11.3 15.8 .000
White African American
5.6 2.7
34.9 27.2
46.5 55.3
13.0 14.8 .001
18-24 years of age 25-44 years of age 45-64 years of age 65 years of age and older
6.4 5.5 3.3 4.5
34.2 34.2 31.7 25.1
45.5 47.4 51.8 54.3
13.9 13.0 13.2 16.1 .230
Not a high school graduate High school graduate Some college College Graduate
4.0 4.3 4.3 5.5
26.4 29.0
36.5 34.3
58.0 52.1
46.4 46.5
11.5 14.6
12.7 13.8 .159
Note: 1.7 percent of respondents reported Don’t Know or refused. Percentages may not add to 100 due to rounding.

83SOCIAL SCIENCE RESEARCH CENTER, MISSISSIPPI STATE UNIVERSITY
THE MISSISSIPPI SOCIAL CLIMATE SURVEY OF TOBACCO CONTROL, 2000-2001
Table 8.4 Acceptability of Tobacco Advertisements in Direct Mailers “Tobacco advertising is acceptable in direct mailers. Do you strongly agree, agree, disagree, or strongly disagree?” (Percent responding by rural/urban, smoking status, gender, race, age, and education.)
Sample Characteristic
Strongly agree Agree Disagree
Strongly disagree p
Total 4.5 30.0 50.8 14.6
Rural Urban
4.4 4.6
27.4 32.0
51.8 50.2
16.4 13.3 .161
Nonsmoker Smoker
2.7 11.4
23.9 52.4
56.6 29.7
16.8 6.6 .000
Male Female
5.1 4.1
34.8 25.7
26.2 55.0
13.8 15.2 .001
White African American
5.2 2.9
32.6 25.2
47.7 57.2
14.5 14.7 .002
18-24 years of age 25-44 years of age 45-64 years of age 65 years of age and older
5.9 5.0 3.4 5.0
28.2 33.4 31.2 18.9
51.1 47.2 50.8 61.2
14.9 14.4 14.6 14.9 .023
Not a high school graduate High school graduate Some college College Graduate
2.3 4.7 3.8 5.8
24.7 27.3
34.6 31.5
59.8 51.9
48.5 48.3
13.2 16.1
13.1 14.5 .092
Note: 2.2 percent of respondents reported Don’t Know or refused. Percentages may not add to 100 due to rounding.
Table 8.5 Acceptability of Tobacco Advertisements on Internet Sites “Tobacco advertising is acceptable on Internet sites. Do you strongly agree, agree, disagree, or strongly disagree?” (Percent responding by rural/urban, smoking status, gender, race, age, and education.)
Sample Characteristic
Strongly agree Agree Disagree
Strongly disagree p
Total 4.9 32.5 48.7 13.9
Rural Urban
4.6 5.0
30.0 34.4
49.3 48.2
16.1 12.4 .130
Nonsmoker Smoker
2.8 12.6
27.7 49.8
53.6 30.6
15.8 7.0 .000
Male Female
5.4 4.5
39.2 26.4
43.4 53.5
12.0 15.6 .000
White African American
5.7 3.2
36.4 25.6
44.2 57.0
13.7 14.2 .000
18-24 years of age 25-44 years of age 45-64 years of age 65 years of age and older
7.1 5.1 4.1 4.7
36.8 35.9 31.5 19.2
44.5 44.7 50.8 59.9
11.5 14.3 13.5 16.3 .004
Not a high school graduate High school graduate Some college College Graduate
3.7 4.6 4.8 5.7
22.2 27.8
38.1 37.2
61.7 52.1
45.3 42.9
12.3 15.6
11.7 14.2 .001
Note: 6.8 percent of respondents reported Don’t Know or refused. Percentages may not add to 100 due to rounding.

84SOCIAL SCIENCE RESEARCH CENTER, MISSISSIPPI STATE UNIVERSITY
THE MISSISSIPPI SOCIAL CLIMATE SURVEY OF TOBACCO CONTROL, 2000-2001
Table 8.6 Acceptability of Tobacco Advertisements at Sporting or Cultural Events “Tobacco advertising is acceptable at sporting or cultural events. Do you strongly agree, agree, disagree, or strongly disagree?” (Percent responding by rural/urban, smoking status, gender, race, age, and education.)
Sample Characteristic
Strongly agree Agree Disagree
Strongly Disagree p
Total 4.8 30.4 50.8 13.9
Rural Urban
5.0 4.7
27.7 32.4
52.2 49.8
15.2 13.1 .239
Nonsmoker Smoker
3.0 11.4
25.9 47.0
55.5 33.7
15.6 7.9 .000
Male Female
6.4 3.4
36.5 25.0
44.9 56.1
12.2 15.5 .000
White African American
6.0 2.3
35.4 21.3
46.0 59.6
12.7 16.9 .000
18-24 years of age 25-44 years of age 45-64 years of age 65 years of age and ol der
4.4 6.2 3.6 4.7
29.0 33.6 30.6 22.0
51.9 46.0 53.1 58.1
14.8 14.3 12.7 15.2 .056
Not a high school graduate High school graduate Some college College Graduate
2.9 4.1 4.9 6.0
25.7 23.4
37.1 34.5
60.2 56.6
46.1 44.8
11.1 15.8
11.9 14.8 .000
Note: 3.1 percent of respondents reported Don’t Know or refused. Percentages may not add to 100 due to rounding.
Table 8.7 Believe Tobacco Companies’ Claim that They do not Manipulate Levels of Nicotine “Tobacco companies are being truthful when they say they do not manipulate the level of nicotine in cigarettes. Do you strongly agree, agree, disagree, or strongly disagree?” (Percent responding by rural/urban, smoking status, gender, race, age, and education.)
Sample Characteristic
Strongly agree Agree Disagree
Strongly disagree p
Total 1.2 5.6 61.9 31.4
Rural Urban
1.6 0.9
6.0 5.3
59.6 63.5
32.8 30.3
.362
Nonsmoker Smoker
0.9 2.4
4.3 10.5
62.7 58.7
32.2 28.3
.000
Male Female
1.8 0.7
5.0 6.1
63.0 60.9
30.2 32.4
.192
White African American
1.5 0.7
4.9 6.3
61.7 62.2
31.8 30.8
.388
18-24 years of age 25-44 years of age 45-64 years of age 65 years of age and older
2.8 1.5 0.7 0.0
3.4 8.2 5.1 1.2
67.2 57.4 63.1 67.6
26.6 32.9 31.2 31.2
.001
Not a high school graduate High school graduate Some college College Graduate
1.2 1.1 2.0 0.3
7.9 5.4
4.8 5.5
62.8 63.9
62.8 58.2
28.0 29.6
30.4 36.0
.251
Note: 10.9 percent of respondents reported Don’t Know or refused. Percentages may not add to 100 due to rounding.

85SOCIAL SCIENCE RESEARCH CENTER, MISSISSIPPI STATE UNIVERSITY
THE MISSISSIPPI SOCIAL CLIMATE SURVEY OF TOBACCO CONTROL, 2000-2001
Table 8.8 Believe Tobacco Companies’ Claim that They do not Target Advertising to Encourage Kids to Smoke “Tobacco companies are being truthful when they say they do not target advertising to encourage kids to smoke. Do you strongly agree, agree, disagree, or strongly disagree?” (Percent responding by rural/urban, smoking status, gender, race, age, and education.) Sample Characteristic
Strongly agree Agree Disagree
Strongly Disagree p
Total 1.5 11.8 58.6 28.0
Rural Urban
1.7 1.4
11.5 12.2
56.3 60.3
30.5 26.1
.312
Nonsmoker Smoker
0.5 5.2
8.7 23.0
61.2 49.5
29.5 22.3
.000
Male Female
2.0 1.2
12.8 11.0
58.4 58.8
26.9 29.1
.401
White African American
1.7 0.8
13.2 9.5
56.1 63.2
29.0 26.5
.030
18-24 years of age 25-44 years of age 45-64 years of age 65 years of age and older
1.7 1.4 1.8 1.1
9.6 15.1 10.6 7.5
61.2 54.4 60.8 63.4
27.5 29.0 26.8 28.0
.134
Not a high school graduate High school graduate Some college College Graduate
2.4 1.3 2.4 0.8
11.8 14.4
11.6 8.8
60.0 59.6
58.7 57.2
25.9 24.7
27.2 33.2
.060
Note: 4.8 percent of respondents reported Don’t Know or refused. Percentages may not add to 100 due to rounding.
Table 8.9 Believe Tobacco Companies’ Claim that Advertising is Only Aimed at Getting Adult Smokers to Change Brands “Tobacco companies are being truthful when they say advertising is only aimed at getting adult smokers to change brands. Do you strongly agree, agree, disagree, or strongly disagree?” (Percent responding by rural/urban, smoking status, gender, race, age, and education.) Sample Characteristic
Strongly agree Agree Disagree
Strongly disagree p
Total 1.5 13.7 59.0 25.9
Rural Urban
1.7 1.2
12.7 14.4
57.8 59.9
27.8 24.5
.397
Nonsmoker Smoker
0.7 3.9
10.2 26.2
61.8 48.9
27.2 21.0
.000
Male Female
2.0 1.1
15.3 12.3
58.0 59.8
24.7 26.8
.167
White African American
1.9 0.2
14.2 13.0
57.6 61.3
26.3 25.5
.054
18-24 years of age 25-44 years of age 45-64 years of age 65 years of age and older
0.6 1.4 1.6 1.6
11.4 15.7 12.7 12.0
63.1 55.9 60.6 60.7
25.0 27.0 25.1 25.7
.700
Not a high school graduate High school graduate Some college College Graduate
0.6 1.1 2.7 1.0
13.9 15.2
12.9 11.6
58.4 60.3
58.4 59.4
27.1 23.5
26.0 28.0
.362
Note: 6.2 percent of respondents reported Don’t Know or refused. Percentages may not add to 100 due to rounding.

We released the first report on the SocialClimate of Tobacco Control in Mississippi in1999 (McMillen, Ritchie, Robinson, Frese, &Cosby, 1999). In 2000, we published a follow-up report that demonstrated substantialimprovement in the social climate followingthe first year in which Mississippi had a fully-implemented comprehensive tobacco controlprogram (McMillen, Yeager, Ritchie, Baird,Frese, & Cosby, 2000).
Cross-sectional comparisons of the 2000 and2001 Social Climate Surveys of TobaccoControl demonstrate that Mississippi has con-tinued to experience profound improvementsin the social climate of tobacco control. On thewhole, support in Mississippi increased signif-icantly for one-third of the tobacco controlindicators assessed by the Social ClimateSurvey (Table 9.1). The percentage ofMississippi adults who reported smoking bansin their communities increased significantly forseveral public settings. In 2001, more adultsreported that convenience stores, fast foodrestaurants, indoor shopping malls, indoorsporting events, and worksites were smokefree.Similarly, more adults supported smoking bansin indoor shopping malls, daycare centers, andhospitals. Support also increased for the gov-ernment regulation of the tobacco industry.More Mississippi adults reported that tobaccoshould be regulated as a drug, it is the respon-sibility of the government to regulate tobacco,taxes on tobacco are not unfair, and that storesshould need a license to sell tobacco.
These observed social climate improvementsin Mississippi are consistent with a growingbody of evidence from several states, includingOregon, Florida, Massachusetts, andMississippi, which have reported declines inyouth smoking after implementing statewide
comprehensive tobacco control programs.(Bauer, Johnson, Hopkins, & Brooks, 2000;CDC, 1993; MDPH, 2000; MSDH, 2002).However, we must draw tentative conclusionsabout the direct impact of the Mississippi com-prehensive tobacco control program on thesocial climate. It is hypothetically possiblethat these observed improvements result fromspurious factors rather than from statewidetobacco control programs. Perhaps thesechanges reflect a national trend related toadverse media attention and national pro-grams. Consistent with this alternative hypoth-esis, analyses reveal that both Mississippi andthe Nation experienced social climate improve-ments from 2000 to 2001 (see McMillen,Frese, & Cosby, 2001).
However, three aspects of the data suggest thatthe improvements in Mississippi do not simplyreflect a national trend. First, analyses revealedsubstantial variations across the social climatesof Mississippi and the Nations. Second, thesocial climate changes in Mississippi and theNation were not identical. Third, cross-sec-tional comparisons of data from the nationalsample support the hypothesis that states thatspend more on tobacco control programs expe-rience concomitant improvements in the socialclimate.
Mississippi and the Nation, 2001Analyses reveal substantial variations acrossthe social climates of Mississippi and theNation's. Data from the Social Climate Surveysreveal that Mississippi is a step ahead of theNation with regard to attitudes and knowledge(Table 9.2), but often a step behind with cleanair policies (Table 9.3). Cross-sectional com-parisons of data from the Mississippi andnational samples reveal that support for thegovernment regulation of the tobacco industry,
86SOCIAL SCIENCE RESEARCH CENTER, MISSISSIPPI STATE UNIVERSITY
CHAPTER 9CONCLUSION
Overview

increases in state tobacco taxes, smokefreepublic places, and limitations on tobacco mar-keting are greater among Mississippi adultsthan U.S. adults. Similarly, perceptions of thehealth risks of smoking cigars and cigarettesare also greater among Mississippi adults. Thesole exception was clean air practices outsideof the household. More U.S. adults report thatthe public places, including worksites, in theircommunity are smokefree.
Changes from 2000 to 2001, MississippiCompared to the NationCross-sectional comparisons of national andstate data reveal significant improvements inapproximately one-third of the 68 social cli-mate indicators assessed by the 2000 and 2001surveys. Although twelve of these observedchanges were detected in both the national andstate samples, eleven changes were unique toMississippi (see Table 9.4). These findingsindicate that the social climates in bothMississippi and the Nation are improving, insome similar ways and in other unique ways.The presence of these unique changes suggestthat the Mississippi current social climate doesnot simply reflect a national trend.
State Funding of Tobacco Control and theNational Social ClimateThe CDC's Best Practices for ComprehensiveTobacco Control Programs provides a mini-mum total funding recommendation forstatewide tobacco control programs for eachstate. The percentage of this minimum fundingrecommendation was assigned as an individualvariable to each respondent based on state res-idence. Respondents were then classified usingthe median funding percentage as residing ineither a state with a high or low funding levelfor tobacco control. If a national trend is theprincipal cause of state-level changes in thesocial climate, then social climate conditions
should not differ between respondents who livein states with higher levels of tobacco controlfunding. Cross-sectional comparisons of thesetwo groups, however, reveal that respondentsfrom states with higher levels of tobacco con-trol funding reported more desirable conditionsfor more than one-quarter of the social climateindicators (Table 9.5). On the other hand, nosocial climate indicators were found to be morefavorable among respondents who lived instates with lower levels of funding.
ConclusionAlthough we must draw tentative conclusionsabout the direct impact of the Mississippi com-prehensive tobacco control program on thesocial climate, the most parsimonious interpre-tation for these results is to conclude that thepeople of Mississippi have heard the tobaccocontrol message and that they are responding tothe efforts of The Partnership and theMississippi State Department of Health - intheir homes, at work, at school, and in a varietyof public settings. However, this research sug-gests that citizens continue to perceive at leastone critical area of need: putting teeth in thepublic policies that support changing beliefsabout the risks tobacco use poses. Despite sub-stantial public support for smokefree recre-ational and leisure settings, Mississippi lagsbehind the rest of the nation on clean air policyissues.
87SOCIAL SCIENCE RESEARCH CENTER, MISSISSIPPI STATE UNIVERSITY
THE MISSISSIPPI SOCIAL CLIMATE SURVEY OF TOBACCO CONTROL, 2000-2001

88SOCIAL SCIENCE RESEARCH CENTER, MISSISSIPPI STATE UNIVERSITY
THE MISSISSIPPI SOCIAL CLIMATE SURVEY OF TOBACCO CONTROL, 2000-2001
Table 9.1 Significant Improvements in Mississippi, 2000-2001 2000 2001 P ValueSmoke-Free Places 1. Smoking is never allowed in the presence of children 77.5 85.9 <.001 2. Convenience stores in community are smoke-free 38.9 45.8 .004 3. Fast food restaurants in community are smoke-free 31.0 37.9 .002 4. Indoor shopping malls in community are smoke-free 60.3 71.2 <.001 5. Indoor sporting events in community are smoke-free 75.6 80.5 .022 6. Smoking is not allowed in any area at work 53.2 62.1 .002 7. Strictly enforced tobacco policy at work 72.3 82.8 <.001 Knowledge and Attitudes About Smoke-free Places 8. Indoor shopping malls should be smoke-free 71.5 79.5 <.001 9. Smoking should not be allowed at daycare centers 93.2 99.1 <.001 10. Hospitals should be smoke-free 76.1 85.1 <.001 11. Smoke from parents’ cigarettes harms their children 92.8 95.7 .007 Attitudes and Normative Beliefs 12. Schools should prohibit clothing or gear with tobacco logos 67.6 72.4 .022 13. Stores should need a license to sell tobacco products 80.8 84.7 .023 14. Tobacco taxes should be increased to fund enforcement of tobacco laws
75.6 79.9 .015
15. Taxes on tobacco are fair 66.9 72.4 .009 16. Tobacco ads are not acceptable at sporting or cultural events
59.8 64.7 .024
17. Tobacco use is unacceptable within the household 66.1 74.2 <.001 18. Parents should not allow children under the age of 18 to smoke cigarettes
88.1 91.0 .037
19. Tobacco should be regulated as a drug 67.9 75.9 <.001 20. It is the responsibility of the government to regulate tobacco 70.4 75.4 .015 21. Employer does not accommodate smokers 45.9 53.6 .007 22. Employer offered cessation program in the last 12 months 14.5 19.8 .015 23. Tobacco ads are not acceptable on billboards 57.0 63.2 .005

89SOCIAL SCIENCE RESEARCH CENTER, MISSISSIPPI STATE UNIVERSITY
THE MISSISSIPPI SOCIAL CLIMATE SURVEY OF TOBACCO CONTROL, 2000-2001
Table 9.2 A Step Ahead MS US P Value Family and Friends
1. Smoking is unacceptable in front of children within the household 83.6 79.3 <.001 Education 2. Believe that faculty and staff should not be allowed to smoke on school grounds
65.6 56.5 <.001
3. Believe that schools should prohibit clothing or gear with tobacco logos 72.4 65.4 <.001 4. Support an increase in state tobacco taxes to fund education programs to prevent youth tobacco use
79.7 73.9 <.001
5. Believe that students should be punished for violating school rules against smoking
96.3 93.8 <.001
Government & Political Order 6. Believe that tobacco should be regulated as a drug 75.9 66.0 <.001 7. Believe that stores should need a license to sell tobacco products 84.7 74.6 <.001 8. Support an increase in state tobacco taxes to fund enforcement of tobacco laws
79.9 71.3 <.001
9. Believe that stores should be penalized for the sale of tobacco to minors 96.4 94.0 <.001 10. Believe that youth should be penalized for the possession of tobacco
83.0 76.0 <.001
11. Believe that it is the responsibility of the government to regulate tobacco
75.4 66.0 <.001
Health & Medical Care 12. Support an increase in state tobacco taxes to fund adult cessation programs
68.9 58.7 <.001
13. Believe that smoking cigarettes is very dangerous 84.9 81.0 .001 14. Believe that smoking cigars is very dangerous 76.1 65.2 <.001 Recreation, Sports & Leisure 15. Report being very much bothered by other people’s smoke 54.2 48.1 <.001 16. Believe that indoor shopping malls should be smoke-free 79.5 75.3 .001 17. Believe that restaurants should be smoke-free 64.6 61.4 .034 18. Believe that bars and taverns should be smoke-free 43.8 33.2 <.001 19. Believe that indoor sporting events should be smoke-free 85.3 8.4 <.001 20. Believe that outdoor parks should be smoke-free 38.9 25.2 <.001 Mass Culture & Communication 21. Believe that it is unacceptable for tobacco companies to sponsor sporting or cultural events
42.9 36.8 <.001
22. Believe that tobacco ads are not acceptable in grocery stores 54.8 46.6 <.001 23. Believe that tobacco ads are not acceptable in magazines 52.0 42.1 <.001 24. Believe that tobacco ads are not acceptable on billboards 63.2 55.3 <.001 25. Believe that tobacco ads are not acceptable indirect mailers 65.4 59.5 <.001 26. Believe that tobacco ads are not acceptable on internet sites 62.6 53.5 <.001

90SOCIAL SCIENCE RESEARCH CENTER, MISSISSIPPI STATE UNIVERSITY
THE MISSISSIPPI SOCIAL CLIMATE SURVEY OF TOBACCO CONTROL, 2000-2001
Table 9.3 A Step Behind MS US P Value Work 1. Report that tobacco use is unacceptable among co-workers 48.7 53.6 .015
2. Report that smoking is not allowed in any area at work 62.1 68.5 .001 3. Report that their employer offered a cessation program within the past 12 months
19.8 23.6 .024
Recreation, Sports & Leisure 4. Report that indoor shopping malls in their community are smoke-free 71.2 77.0 <.001 5. Report that convenient stores in their community are smoke-free 45.8 73.7 <.001 6. Report that fast food restaurants in their community are smoke-free 37.9 57.8 <.001 7. Report that restaurants in their community are smoke-free 12.4 28.1 <.001 8. Report that bars and taverns in their community are smoke-free 3.9 12.4 <.001 9. Believe that convenient stores should be smoke-free 82.8 86.9 <.001
Table 9.4 Significant Improvements Unique to Mississippi
2000 2001 P Value Smoke-free Places 1. Indoor shopping malls in community are smoke-free 6.3 71.2 <.001 2. Indoor sporting events in community are smoke-free 75.6 8.5 .022 3. Smoking is not allowed in any area at work 53.2 62.1 .002 4. Strictly enforced tobacco policy at work 72.3 82.8 <.001 Knowledge & Attitudes about Smoke-Free Places 5. Smoke from parents’ cigarettes harms their children 92.8 95.7 .007 Attitudes & Normative Beliefs 6. Parents should not allow children under the age of 18 to smoke cigarettes
88.1 91.0 .037
7. Tobacco should be regulated as a drug 67.9 75.9 <.001 8. It is the responsibility of the government to regulate tobacco 7.4 75.4 .015 9. Employer does not accommodate smokers 45.9 53.6 .007 10. Employer offered cessation program in past 12 months 14.5 19.8 .015 11. Tobacco ads are not acceptable on billboards 57.0 63.2 .005

91SOCIAL SCIENCE RESEARCH CENTER, MISSISSIPPI STATE UNIVERSITY
THE MISSISSIPPI SOCIAL CLIMATE SURVEY OF TOBACCO CONTROL, 2000-2001
Table 9.5 Social Climate Differences Between Respondents in States with High and Low Levels of Tobacco Control Funding Lower
Level of Funding
Higher Level of Funding
P Value
Family and Friendship Groups 1. Smoking is never allowed in the respondent’s vehicle with children present
77.4 81.6 .006
2. Tobacco use is unacceptable in the household 70.7 74.7 .014 3. Parents should not allow children under the age of 18 to smoke cigarettes
88.9 91.9 .005
4. It is important for parents who smoke to keep their cigarettes out of reach of their children
96.3 97.9 .005
5. Tobacco use in unacceptable among friends 47.4 51.4 .028 Government and Political Order 6. Government should NOT limit fines from lawsuits against the tobacco companies
48.0 51.9 .038
Work 7. Smoking in work area should not be allowed 59.4 64.1 .007 8. Smoking is not allowed in any area at work 65.5 71.1 .008 9. Employer offered a cessation program in past 12 months 21.1 25.9 .018 Recreation, Sports, and Leisure 10. Indoor shopping malls in community are smoke-free 73.4 80.4 <.001 11. Convenience stores in community are smoke-free 65.4 81.3 <.001 12. Fast food restaurants in community are smoke-free 48.8 66.3 <.001 13. Restaurants in community are smoke-free 18.9 36.9 <.001 14. Bars and Taverns in community are smoke-free 3.7 20.0 <.001 15. Indoor sporting events in community are smoke-free 79.5 83.7 .007 16. Outdoor parks in community are smoke-free 5.1 10.6 <.001 17. Convenience stores should be smoke-free 84.1 89.5 <.001 18. Fast food restaurants should be smoke-free 76.5 83.3 <.001 19. Restaurants should be smoke-free 58.9 63.8 .005 20. Request a non-smoking room when traveling 73.3 76.8 .026

Bauer, U., Johnson, T., Hopkins, R., & Brooks, R. (2000). Changes in youth cigarette use andintentions following implementation of a tobacco control program: Findings from theFlorida Youth Tobacco Survey, 1998-2000. JAMA, 284, 723-728.
Centers for Disease Control (1993). Cigarette smoking-attributable mortality and years ofpotential life lost - United States, 1990. MMWR, 85, 1223-1230.
Centers for Disease Control (1993). Effectiveness of school-based programs as a component ofa statewide tobacco control initiative - Oregon, 1999-2000. MMWR, 50, 663-666.
Massachusetts Department of Public Health. (2000). Adolescent tobacco use in Massachusetts:Trends among public high school students - 1996-1999. The Commonwealth ofMassachusetts, Office of Health and Human Services, Department of Public Health.
McMillen, R., Frese, W. & Cosby, A. (2001). The national social climate of tobacco control,2000-2001. Mississippi State University, Social Science Research Center.
McMillen, R., Ritchie, L., Robertson, A., Frese, W., & Cosby, A. (1999). The 1999 MississippiSocial Climate Survey of Tobacco Control and Tobacco Use: Establishing a benchmarkfor Mississippi. (Social Report Series 99-4, SSRC Publication). Mississippi StateUniversity, Social Science Research Center.
McMillen, R., Yeager, G., Ritchie, L., Baird, C., Frese, W., & Cosby, A. (2001). TobaccoControl in Mississippi, 1999-2000: A Report on the 1999 and 2000 Social ClimateSurveys. Mississippi State University, Social Science Research Center.
Mississippi State Department of Health. (2002). Study shows significant decreases inMississippi high school students' tobacco use. http://www.msdh.state.ms.us/
Thun, M. J., Day-Lally, C. A., Calle, E. E., Flanders, W. D., & Heath, C. W. (1995). Excessmortality among cigarette smokers: Changes in a 20-year interval. American Journalof Public Health, 85, 1223-1230.
U.S. Department of Health and Human Services (1982). The health consequences of smoking:Cancer. A report of the Surgeon General. U.S. Department of Health and HumanServices, Public Health Service, Centers for Disease Control.
U.S. Department of Health and Human Services (1983). The health consequences of smoking:Cardiovascular disease. A report of the Surgeon General. U.S. Department of Healthand Human Services, Public Health Service, Centers for Disease Control.
U.S. Department of Health and Human Services (1984). The health consequences of smoking:Chronic obstructive lung disease. A report of the Surgeon General. U.S. Department ofHealth and Human Services, Public Health Service, Centers for Disease Control.
92SOCIAL SCIENCE RESEARCH CENTER, MISSISSIPPI STATE UNIVERSITY
CHAPTER 10REFERENCES

U.S. Department of Health and Human Services (1985). The health consequences of smoking:Cancer and chronic lung disease in the workplace. A report of the Surgeon General.U.S. Department of Health and Human Services, Public Health Service, Centers forDisease Control.
U.S. Department of Health and Human Services. (1986). The health consequences of usingsmokeless tobacco: A report of the Advisory Committee to the Surgeon General. U.S.Department of Health and Human Services, Public Health Services, Nationals Institutesof Health, National Cancer Institute. DHHS Publication No. (NIH) 86-2874.
U.S. Department of Health and Human Services (1989). Reducing the health consequences ofsmoking: 25 years of progress. A report of the Surgeon General. U.S. Department ofHealth and Human Services, Public Health Service, Centers for Disease Control.
U.S. Department of Health and Human Services (1989). The health consequences of involun-tary smoking. A report of the Surgeon General. U.S. Department of Health and HumanServices, Public Health Service, Centers for Disease Control.
U.S. Department of Health and Human Services (1990). The health consequences of smoking:Cancer. A Report of the Surgeon General. U.S. Department of Health and HumanServices, Public Health Service, Centers for Disease Control.
93SOCIAL SCIENCE RESEARCH CENTER, MISSISSIPPI STATE UNIVERSITY
THE MISSISSIPPI SOCIAL CLIMATE SURVEY OF TOBACCO CONTROL, 2000-2001

94SOCIAL SCIENCE RESEARCH CENTER, MISSISSIPPI STATE UNIVERSITY
ABOUT THE AUTHORS
Dr. McMillen is an assistant research professor with a specialty in attitude research and health-relatedissues; with an applied emphasis on survey development, complex sampling and variance estimationmethods. His research projects address tobacco control, community health and health care coverage.Along with colleagues, Dr. McMillen has developed a social climate approach to monitor progresstowards social and environmental health promotion objectives. This approach has enhanced the state'scapacity to design, implement and evaluate its comprehensive tobacco control program. Dr. McMillenalso teaches courses in statistics, experimental design and social psychology in the Department ofPsychology at Mississippi State University. Dr. McMillen is a graduate of Rhodes College in Memphis,TN, and holds a master of science degree in experimental psychology from Mississippi State Universityand a doctoral degree in social psychology from the University of Georgia.
Dr. Frese has served as coordinator of survey research since the inception of the Survey Research Unit(SRU) in the SSRC in 1982. The SRU has gone from a six telephone interviewing station, paper-and-pencil operation, to a 20 station computerized (CATI) telephone survey operation. The SRU also per-forms several mail surveys. The SRU conducts between 10 and 15 local, statewide and national surveysa year for local, state and federal agencies as well as for private corporations and individuals. In addi-tion, the SRU helps fund an MSU student health practices survey every three years and a Mississippi pollat least every two years. The SRU facilities are also used for teaching purposes for both graduate andundergraduate students enrolled in sociology and political science research methods classes. Prior tocoming to MSU in 1972, Dr. Frese held professorial positions at Ithaca College and Alfred University.His research has been published in journals such as American Educational Research Journal, AmericanSociological Review, College Student Journal, Deviant Behavior, Journal of Criminal Justice, Journal ofMarriage and the Family, The Journal of Vocational Behavior, Social Psychology Quarterly, SociologicalForum, Sociology of Education, The Southern Journal of Educational Research, Southern RuralSociology and Urban Life. Dr. Frese is coauthor of two books, The Rendezvous: A Case Study of AnAfter-Hours Club and Making Life Plans: Race, Gender and Career Decisions. His current researchactivities are focused on why people own firearms, farm crime, gambling and student health practices.
Dr. Cosby has served as director of MSU's SSRC since 1985. During his term as director, the SSRC hasgrown into a research enterprise with over 43 research fellows, over 65 sponsored research projects andan annual budget of $4 to $6 million. Within the SSRC, he has provided administrative support in estab-lishing a state-of-the-art computer assisted telephone interview facility (Survey Research Unit or SRU),the Decision Support Laboratory (DSL), the Societal Monitor Laboratory (SML), a remote data facility(Delta Data Center) and the Secure Data Laboratory (SDL). Prior to his SSRC appointment, he was thehead of the Department of Sociology, Anthropology and Social Work at MSU and Bailey Professor ofSociology. He has also served as MSU's Director of University Centers and Institutes. He has held pro-fessorial positions at Louisiana State University and Texas A&M University. He has served as principalinvestigator or co-principal investigator on such research projects as the Southern Youth Study, theCareer Decisions and Development of Rural Youth, the Delta Project, the Mississippi Adult LiteracyAssessment, the Family Preservation and Support Services Project, the 1996 National Survey of Gamingand Gambling, the Commercial Geo-Spatial Electronic Journal and the Overall Evaluation of theMississippi Pilot Tobacco Control Project. He has served as associate editor of Rural Sociology and onthe editorial board of Sociological Spectrum. A member of numerous professional organizations, he ispast-president of the Mid-South Sociological Association. His research is published in SociologySpectrum, Rural Sociology, Sociology and Social Research, Deviant Behavior, Sex Roles, Social ScienceQuarterly, Sociology of Work and Occupations, Youth and Society, Integrated Education, Journal ofVocational Behavior, Adolescence, Human Mosaic, Journal of College and University Personnel and ina number of applied publications. Dr. Cosby is the executive director of the Rural Health, Safety andSecurity Institute.

THIS REPORT IS AVAILABLE ATwww.ssrc.msstate.edu/socialclimate
FOR FURTHER INFORMATION CONTACT
Arthur G. Cosby, [email protected]
Robert [email protected]
Social Science Research Center, www.ssrc.msstate.eduMississippi State University, www.msstate.edu
103 Research ParkMississippi State, MS 39762
Phone: 662.325.7127Fax: 662.325.7966
Mississippi State University does not discriminate on the basis of race, color, religion,national origin, sex, age, disability, or veteran status.
Related Documents