The Mining Boom and the Australian Dollar Real TWI Model Historically, the real trade-weighted index of the Australian dollar (RTWI) has displayed a close relationship with Australia’s goods terms of trade (ToT). However, in recent years there have been periods when movements in the RTWI have diverged from movements in the ToT. Moreover, these divergences have tended to coincide with particularly large movements in bulk commodity prices (as measured in the ToT). These observations raise two questions: (i) is the relationship between the RTWI and bulk commodity prices different to the relationship between the RTWI and other export prices?; and, if so, (ii) does Market Analysis’s (MA) existing RTWI model adequately capture the dynamics of the recent ToT boom, insofar as it was driven largely by increases in bulk commodity prices? This note provides a brief overview of MA’s existing RTWI model and presents a number of augmented versions that attempt to answer these questions, namely: a model that incorporates a ToT that is decomposed into its bulks and non-bulks components; a model that incorporates a forward-looking measure of the ToT; and a model that incorporates an investment-to-GDP ratio. The latter two appear to provide additional insight into movements in the RTWI, particularly over recent years. Consequently, they will be used on an ongoing basis to complement the existing model. 1. Background As is well known, the Australian dollar has been at a historically high level in recent years, with the RTWI reaching a post-float high in the March quarter of 2013. Although the RTWI has since depreciated by around 8 per cent, it remains around 30 per cent higher than its post-float average. Historically, the ToT has been a key determinant of Australia’s RTWI (e.g. Tarditi 1996; Beechey et al. 2000; Stone, Wheatley and Wilkinson 2005). 1 Consistent with this, the appreciation of the Australian dollar since the early 2000s coincided with a significant increase in Australia’s ToT, which almost doubled between the end of 2003 and September 2011 (Graph 1). 2 The increase in the ToT has largely been attributed to a significant increase in demand for bulk commodities from emerging market economies, which saw prices for these commodities almost quadruple over the same period (while prices of other, non-bulk, exports rose by around 40 per cent). At the same time, bulk commodities’ collective share of Australia’s exports rose from around 25 per cent to around 50 per cent. 3 Graph 1 Graph 2 1 This relationship has also been documented for other ‘commodity currencies’. See for example Chen and Rogoff (2003), and Cashin, Cespedes and Sahay (2004). 2 For more information on the boom and its implications for the Australian economy see for example Connolly and Orsmond 2011, Plumb, Kent and Bishop 2013, and Atkin, Caputo, Robinson and Wang 2014. 3 Bulks include metal ores, most importantly iron ore, and coal. Mineral fuels, such as LNG, are also often classified as bulks. 60 80 100 120 140 160 180 60 80 100 120 140 160 180 1983 1988 1993 1998 2003 2008 2013 Terms of Trade and the Australian Dollar TWI Post-float average = 100 Index Index Real TWI Nominal TWI Goods terms of trade Sources: ABS; RBA 0 50 100 150 200 250 0 50 100 150 200 250 1983 1988 1993 1998 2003 2008 2013 Terms of Trade and the Real TWI Post-float average = 100* Real TWI Bulk commodity exports terms of trade** Goods terms of trade excluding bulk commodity exports Goods terms of trade Index Index * Ratio of respective export implicit price deflators to the export implicit price deflator ** Bulk commodities are defined as metal ores and coal, coke and briquettes Sources: ABS; RBA 1

Welcome message from author
This document is posted to help you gain knowledge. Please leave a comment to let me know what you think about it! Share it to your friends and learn new things together.
Transcript

The Mining Boom and the Australian Dollar Real TWI Model
Historically, the real trade-weighted index of the Australian dollar (RTWI) has displayed a close relationship with Australia’s goods terms of trade (ToT). However, in recent years there have been periods when movements in the RTWI have diverged from movements in the ToT. Moreover, these divergences have tended to coincide with particularly large movements in bulk commodity prices (as measured in the ToT). These observations raise two questions: (i) is the relationship between the RTWI and bulk commodity prices different to the relationship between the RTWI and other export prices?; and, if so, (ii) does Market Analysis’s (MA) existing RTWI model adequately capture the dynamics of the recent ToT boom, insofar as it was driven largely by increases in bulk commodity prices?
This note provides a brief overview of MA’s existing RTWI model and presents a number of augmented versions that attempt to answer these questions, namely: a model that incorporates a ToT that is decomposed into its bulks and non-bulks components; a model that incorporates a forward-looking measure of the ToT; and a model that incorporates an investment-to-GDP ratio. The latter two appear to provide additional insight into movements in the RTWI, particularly over recent years. Consequently, they will be used on an ongoing basis to complement the existing model.
1. Background
As is well known, the Australian dollar has been at a historically high level in recent years, with the RTWI reaching a post-float high in the March quarter of 2013. Although the RTWI has since depreciated by around 8 per cent, it remains around 30 per cent higher than its post-float average.
Historically, the ToT has been a key determinant of Australia’s RTWI (e.g. Tarditi 1996; Beechey et al. 2000; Stone, Wheatley and Wilkinson 2005).1 Consistent with this, the appreciation of the Australian dollar since the early 2000s coincided with a significant increase in Australia’s ToT, which almost doubled between the end of 2003 and September 2011 (Graph 1).2 The increase in the ToT has largely been attributed to a significant increase in demand for bulk commodities from emerging market economies, which saw prices for these commodities almost quadruple over the same period (while prices of other, non-bulk, exports rose by around 40 per cent). At the same time, bulk commodities’ collective share of Australia’s exports rose from around 25 per cent to around 50 per cent.3
Graph 1 Graph 2
1 This relationship has also been documented for other ‘commodity currencies’. See for example Chen and Rogoff (2003), and Cashin, Cespedes and Sahay (2004).
2 For more information on the boom and its implications for the Australian economy see for example Connolly and Orsmond 2011, Plumb, Kent and Bishop 2013, and Atkin, Caputo, Robinson and Wang 2014.
3 Bulks include metal ores, most importantly iron ore, and coal. Mineral fuels, such as LNG, are also often classified as bulks.
60
80
100
120
140
160
180
60
80
100
120
140
160
180
1983 1988 1993 1998 2003 2008 2013
Terms of Trade and the Australian Dollar TWIPost-float average = 100
Index Index
Real TWI
Nominal TWI
Goods terms of trade
Sources: ABS; RBA
0
50
100
150
200
250
0
50
100
150
200
250
1983 1988 1993 1998 2003 2008 2013
Terms of Trade and the Real TWIPost-float average = 100*
Real TWI
Bulk commodity exports terms of trade**
Goods terms of trade excluding bulk commodity
exports
Goods terms of trade
Index Index
* Ratio of respective export implicit price deflators to the export implicit price deflator** Bulk commodities are defined as metal ores and coal, coke and briquettesSources: ABS; RBA
1

Interestingly, while bulks prices have garnered most of the attention in recent years, the RTWI appears to have had a stronger relationship with a measure of the ToT that excludes bulk commodity export prices (Graph 2, above). This reflects the fact that periods when movements in the RTWI and in the ToT have diverged have tended to coincide with particularly large movements in bulks prices, such as during the onset of the global financial crisis in 2008 and following the Queensland floods in 2010/11. This observation raises two key questions:
(i) Is the relationship between the RTWI and bulks prices (as measured in the ToT) different to the relationship between the RTWI and other export prices?; and, if so
(ii) Does MA’s existing model of the RTWI adequately capture the dynamics of the recent ToT boom, insofar as it was driven largely by increases in bulks prices?
This note begins with a brief review of MA’s ‘existing’ RTWI model, which incorporates the ToT as a key explanatory variable, before attempting to answer these questions using three augmented versions of the model. The first augmented version incorporates the ‘bulks ToT’ and the ‘ex-bulks ToT’ as separate explanatory variables, in place of the aggregate goods ToT. The second version replaces the aggregate goods ToT with a forward-looking measure of the ToT. This is motivated by the nature of bulks prices, which could be argued to be less reflective of market participants’ current expectations than other export prices given, for example, the use of ‘sticky’ long-term contracts. Finally, the third version incorporates measures of investment alongside the aggregate goods ToT. This is motivated by the observation that investment could be the main channel through which higher bulks prices affect the RTWI, given the relatively low level of domestic inputs used in the production of bulk commodities and the high level of foreign ownership in the industry both suggest that increased production and profits could have relatively little effect on the domestic economy (see Box A for more information).
2. A Brief Review of MA’s Existing RTWI Model
MA’s existing model of the RTWI is an error correction model (ECM), which estimates an ‘equilibrium’ co-integrating relationship between the (log) RTWI, the (log) goods ToT and the real policy rate differential between Australia and the G3. The estimated ‘equilibrium’ RTWI is the level which is estimated to be justified by these medium-term determinants and which should exert itself over time (Graph 3, below).4 The model also includes a number of short-run variables which are incorporated to account for shorter-term financial market influences (though these are not the focus of this note). These include the CRB index (a widely-followed market-based commodity price measure and a proxy for shorter-term developments in the ToT), and two factors that are intended to capture ‘risk sentiment’ in financial markets: the (real) US S&P500 equity index and the VIX (an index of option-implied expectations of volatility in the S&P500). All of the short-run variables enter in first differences (Equation 1).
∆𝑅𝑅𝑅𝑅𝑅𝑅𝑅𝑅𝑡𝑡 = 𝜇𝜇 + 𝛾𝛾𝑅𝑅𝑅𝑅𝑅𝑅𝑅𝑅𝑡𝑡−1 + 𝛼𝛼1𝑅𝑅𝑇𝑇𝑅𝑅𝑡𝑡−1 + 𝛼𝛼2𝑅𝑅𝑅𝑅𝑅𝑅𝑅𝑅𝑡𝑡−1 (1)
+𝛽𝛽1∆𝐶𝐶𝑅𝑅𝐶𝐶𝑡𝑡 + 𝛽𝛽2∆𝐶𝐶𝑅𝑅𝐶𝐶𝑡𝑡−1 + 𝛽𝛽3∆𝑆𝑆𝑆𝑆𝑆𝑆𝑡𝑡 + 𝛽𝛽4∆𝑉𝑉𝑅𝑅𝑆𝑆𝑡𝑡 + 𝜀𝜀𝑡𝑡
4 It is important to note that this type of model does not attempt to directly estimate the level of the exchange rate that is consistent with desired economic outcomes. Rather, it indicates the level that would be expected based on the RTWI’s historical relationships with variables which have, and theoretically should, determine the exchange rate over the medium-term.

Graph 3 Graph 4
The model is estimated over a sample beginning in 1986 and displays reasonable and consistent explanatory power over this period (with an R-squared of around 0.50).5 Although there have been periods of unusually large or sustained divergences between the observed RTWI and the estimated equilibrium level, in most cases these can be explained mainly by the short-run dynamics of the model, rather than the model residuals (Graph 4; Weltewitz and Smith 2013). Consequently, attempts to find variables other than the ToT (and the real interest rate differential) that consistently explain medium-term movements in the RTWI have been largely unsuccessful.
Still, there have been some periods when the residuals have explained a greater proportion of the divergence between the RTWI and the estimated equilibrium, and other variables have, at times, been found to be significant determinants of the RTWI. These observations suggest that the exchange rate can be affected by different factors and dynamics at different times. This is not entirely unexpected and could reflect the varying focus of financial market participants (Debelle and Plumb 2006). For example, during the technology boom in the early 2000s, the RTWI remained consistently below the estimated equilibrium term, apparently reflecting investors’ preference for currencies that were aligned with so-called ‘new’ economies. Similarly, during the early stages of the global financial crisis in the latter part of 2008, the RTWI depreciated sharply while the estimated equilibrium term (and the ToT) remained at a high level. More recently, in 2010/11, the RTWI was somewhat below its estimated equilibrium level, while in 2012 and early 2013 the RTWI remained high relative to its estimated equilibrium level. The latter three examples appear, at least in part, to reflect movements in bulk commodity prices which were not also reflected in the RTWI. Some possible reasons for this are discussed in Box A below.6
5 If a longer sample is used (e.g. starting in 1974) the current estimated equilibrium level is somewhat higher, while if a shorter sample is used (e.g. beginning in 2002) the current estimated equilibrium level is somewhat lower.
6 Other factors that are also reported to have contributed to the high level of the dollar in recent years include increased demand for AAA-rated CGS, which can be partly attributed to the introduction of quantitative easing by major foreign central banks. However, as MA’s existing model use a policy rate differential variable, the effect of quantitative easing is unlikely to be fully captured. Forthcoming work will examine this issue further.
60
100
140
60
100
140
1985 1989 1993 1997 2001 2005 2009 2013
'Equilibrium' Real TWIPost-float average real TWI = 100
Index Index
Observed real TWI
'Equilibrium' term(+/- 1 std. dev. of historical
deviations)
Source: RBA
-30
-20
-10
0
10
-30
-20
-10
0
10
1986 1990 1994 1998 2002 2006 2010 2014
Real TWI Decomposition of divergence from estimated 'equilibrium'
Divergence from 'equilibrium'
Short-run dynamics
Residual
ppt ppt
Source: RBA

Box A: Why might the RTWI be less responsive to movements in bulks prices?
There are two key reasons why the relationship between bulk commodity export prices (as measured in the ToT) and the RTWI could differ to that of other export prices.
Price Setting
Foreign exchange markets are forward-looking and so should ‘price in’ expected changes (and to some extent, ‘look though’ transitory changes) in the ToT and its constituent import and export prices (e.g. Chen, Rogoff and Rossi 2010). However, until relatively recently, prices for bulk commodities were predominantly set using ‘sticky’ long-term contracts (Jacobs 2011; Caputo 2012). Consequently, bulks prices (as measured in the ToT) would not react immediately to changes in the outlook for prices (unlike the exchange rate), and this could contribute to divergences between the ToT and the RTWI. This dynamic was particularly evident in late 2008, when a number of contracts for bulk commodity exports were signed just before the onset of the (unanticipated) global financial crisis. While the RTWI reacted immediately to the crisis (falling by around 25 per cent), bulk export prices, and therefore the ToT, could not immediately reflect the implications of the crisis for global demand.
More recently, the shift towards the use of shorter-term contracts and spot pricing for bulk commodities has reduced some of this price ‘stickiness’ (Connolly and Orsmond 2011, Caputo 2012). Nevertheless, bulks prices are still likely to be somewhat less reflective of expectations than some other prices – at least at certain points in time. This is because bulk commodities markets can be prone to transitory price shocks, reflecting relatively inelastic supply, as well as the tendency for natural disasters to cause supply disruptions. Market participants and, consequently, the exchange rate are likely to ‘look through’ price spikes that are believed to be transitory, which would contribute to temporary divergences between the ToT and the RTWI. One prominent example of this dynamic occurred in 2010/2011, when floods in Queensland pushed coal prices and the ToT higher, while the RTWI remained relatively unchanged.
Interaction with the rest of the economy
The reaction of the RTWI to movements in the ToT could differ based on which constituent export price(s) caused the change in the ToT (Amano and van Norden, 1995). This reflects the fact that individual industries could interact differently with the rest of the economy in terms of their use of domestic inputs, their use as an input into other industries and their overall effect on national income. Relative to other export sectors, the bulks sector uses fewer domestic inputs, exports most of its output and has a high level of foreign ownership (Plumb, Kent and Bishop 2013; Rayner and Bishop 2013). Consequently, the increased production and profits associated with higher bulks prices could have a more limited effect on the domestic economy and the RTWI (than increased production and profits in some other export sector).
Nevertheless, the investment in the bulks sector that has accompanied higher prices would still be expected to affect the economy, and consequently the RTWI, through increased employment, income and capital inflows. If this is the case, even if the ToT were to remain elevated, the exchange rate could still be expected to depreciate as the mining boom moves from its ‘investment’ phase to its (less labour intensive) ‘production’ phase, due to the associated easing in labour demand and reduction in real wages (Hall and Rees 2013).7
7 Debelle (2014) suggests a similar dynamic. As the investment phase ends, foreign firms will require fewer Australian dollars to pay for Australian inputs. While this could be offset somewhat by higher dividends and taxes associated with increased production in the production phase, net demand for Australian dollar is likely to be reduced.

3. Augmented Versions of MA’s Existing Model
Below, three augmented versions of MA’s existing model of the RTWI are presented. The models incorporate, respectively:
• a decomposed ToT measure (incorporating ‘bulks’ and ‘ex-bulks’ ToT measures separately)
• a forward-looking measure of the ToT
• an investment-to-GDP ratio
3.1 Incorporating a decomposed ToT measure
3.1.1 Overview
There are a number of reasons to suspect that the relationships between the RTWI and bulks export prices, and between the RTWI and other export prices, could differ. These include the pricing mechanisms used for bulk commodity exports, and the fact the bulks industry is somewhat less integrated with the rest of the economy than other export industries (see Box A).
To the extent that these relationships differ, more disaggregated measures of the ToT could provide additional insight into the behaviour of the RTWI. To examine these relationships, the aggregate goods ToT was decomposed into a ‘bulks ToT’ and an ‘ex-bulks ToT’ (see Appendix A for details on the construction of the series).8 These are included in the medium-run portion of the ECM separately, in place of the aggregate ToT (Equation 2).
∆𝑅𝑅𝑅𝑅𝑅𝑅𝑅𝑅𝑡𝑡 = 𝜇𝜇 + 𝛾𝛾𝑅𝑅𝑅𝑅𝑅𝑅𝑅𝑅𝑡𝑡−1 + 𝛼𝛼1𝑅𝑅𝑇𝑇𝑅𝑅𝐶𝐶𝑇𝑇𝑇𝑇𝑇𝑇𝑇𝑇𝑡𝑡−1 + 𝛼𝛼2𝑅𝑅𝑇𝑇𝑅𝑅𝑇𝑇𝑇𝑇𝐶𝐶𝑇𝑇𝑇𝑇𝑇𝑇𝑇𝑇𝑡𝑡−1 + 𝛼𝛼3𝑅𝑅𝑅𝑅𝑅𝑅𝑅𝑅𝑡𝑡−1 (2)
+𝛽𝛽1∆𝐶𝐶𝑅𝑅𝐶𝐶𝑡𝑡 + 𝛽𝛽2∆𝐶𝐶𝑅𝑅𝐶𝐶𝑡𝑡−1 + 𝛽𝛽3∆𝑆𝑆𝑆𝑆𝑆𝑆𝑡𝑡 + 𝛽𝛽4∆𝑉𝑉𝑅𝑅𝑆𝑆𝑡𝑡 + 𝜀𝜀𝑡𝑡
Four different specifications are considered, which vary along two dimensions:
• Weighting scheme: the bulks and ex-bulks ToT measures are calculated as both ‘unweighted’ and ‘weighted’ measures. The unweighted measures are simply the decomposed ToT series (see Appendix A), while the weighted measures are constructed by multiplying the unweighted bulks and ex-bulks ToT measures by the (time-varying) bulks and ex-bulks nominal export shares, respectively. The weighted measures account for the increasing share of bulk commodities in Australia’s export basket over the past decade.9
• Definition of ‘bulks’: the bulks and ex-bulks measures are calculated using two definitions of bulk commodities. The ‘narrow’ bulks measure includes ‘metal ores’, and ‘coal, coke and briquettes’, while the ‘broad’ bulks measure also includes ‘other mineral fuels’ (i.e. LNG).
3.1.2 Key Findings
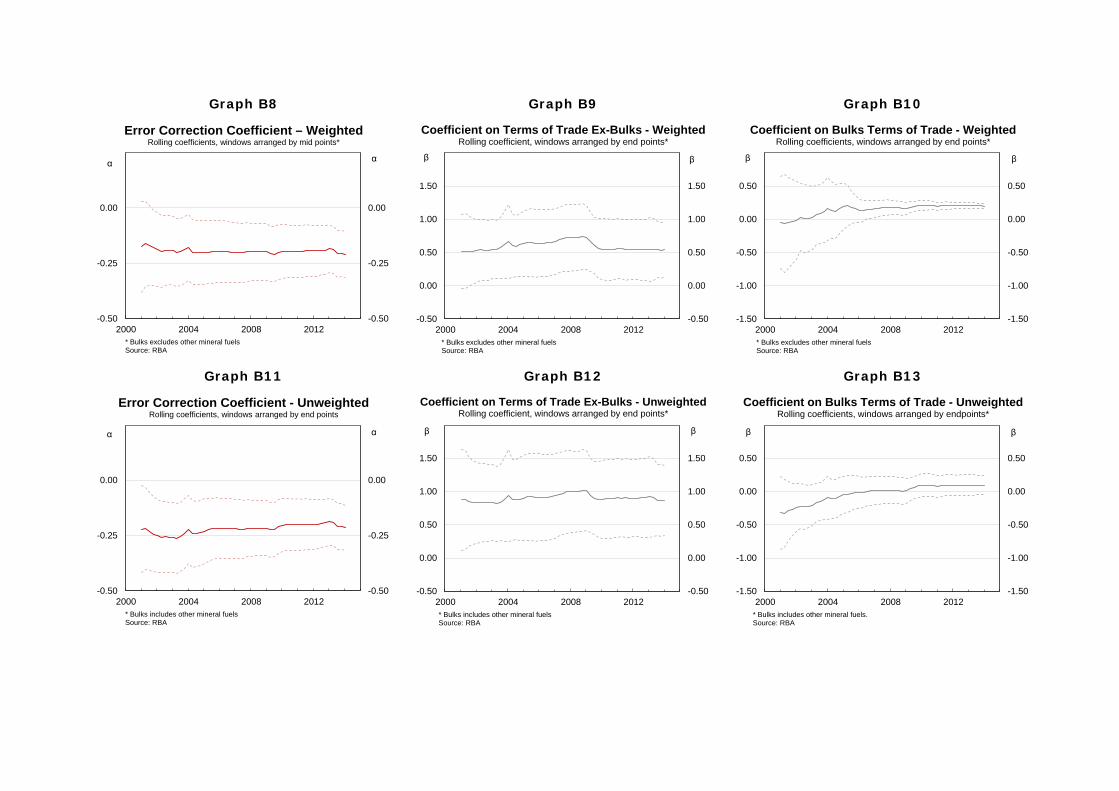
The results of these models are reported in full in Appendix B (Table B1). Consistent with the observation that the RTWI appears to have been less responsive to movements in bulks prices, the coefficient on the bulks ToT is smaller than the coefficient on the ex-bulks ToT in all four specifications (weighted/unweighted; broad/narrow). Further, the coefficient on the bulks ToT is only significant in the two specifications that use the weighted ToT measures. Nevertheless, the coefficients on the bulks and ex-bulks ToT are only statistically different from each other in the unweighted broad specification.10
8 Unit root tests indicate that the decomposed ToT series are non-stationary over the sample. Co-integration between the medium-run variables is evident in all specifications.
9 A similar approach was used to model the Canadian dollar in Maier and DePratto (2008). 10 Based on a Wald test, the coefficients are significantly different at the 5 per cent level.

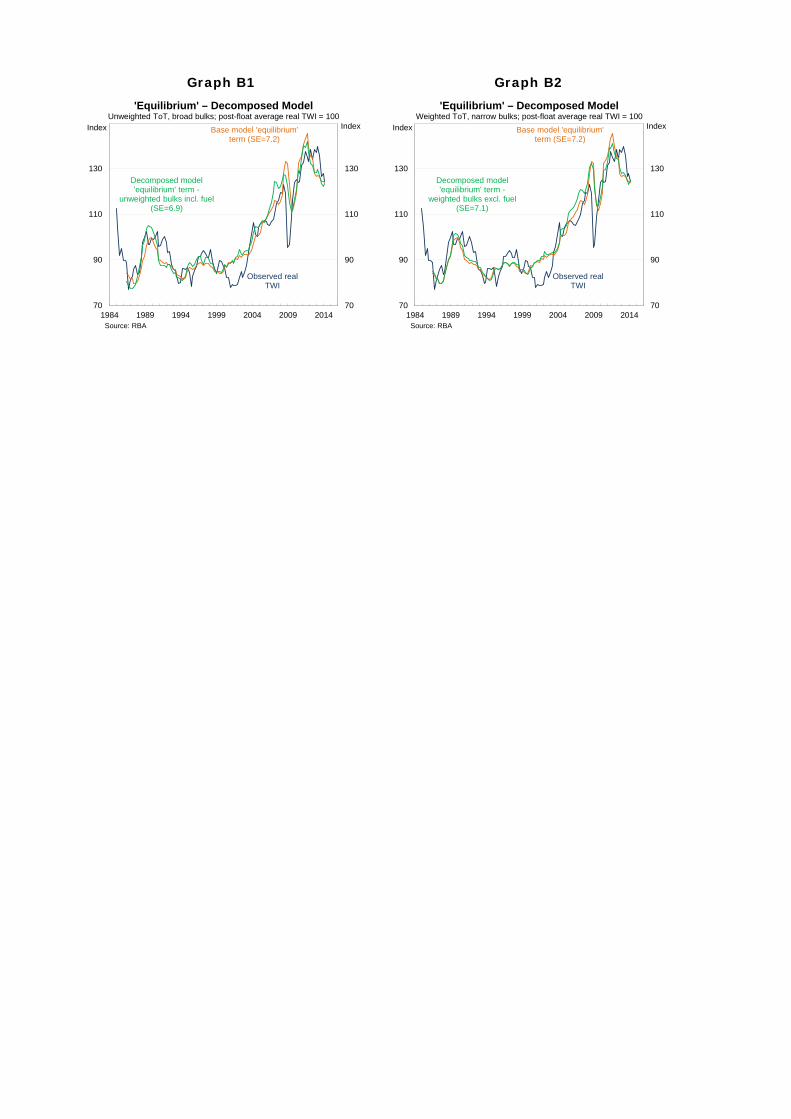
The estimated equilibriums from all four specifications follow fairly similar paths to each other, and to the existing model, for most of the sample, though they have diverged somewhat since 2003. The estimated equilibrium from the unweighted narrow and weighted broad specifications are shown below as they reflect the two extremes, both in terms of the ToT measures used and in terms of estimated equilibriums (Graph 5 shows the unweighted narrow specification and Graph 6 shows the weighted broad specification).11
Graph 5 Graph 6
The estimated equilibrium from the unweighted narrow specification follows the observed RTWI slightly more closely over the full sample than the estimated equilibrium from MA’s existing model, as evidenced by the lower standard error (SE; 6.9 compared to 7.2 for MA’s existing model) – a standardised measure of the deviations of the observed RTWI from the estimated equilibrium. In particular, it tracks the RTWI more closely in 2008, and since 2013. This specification suggests that the RTWI was 2 per cent below its estimated equilibrium, on average, in the March quarter of 2014, while MA’s existing model suggests the RTWI was in line with its estimated equilibrium.
In contrast, the weighted broad specification suggests the RTWI was 6 per cent above its estimated equilibrium in the March quarter of 2014. However, as this specification has a fairly poor fit over the entire sample (with an SE of 7.9), the estimated deviation in the March quarter was still within one standard error. While the higher SE indicates a poorer fit, the SE only provides a simple benchmark for assessing the models, and other factors – most crucially, the theoretical soundness of the model – should also be considered in evaluating their usefulness. In particular, this specification arguably provides the purest decomposition of the ToT into bulks and ex-bulks (in that it encompasses the full range of bulk commodities and accounts for changing export shares).
Finally, it should be noted that the coefficients in all four decomposed models are less stable than those from MA’s existing model (Appendix B, Graphs B3 to B16).12 In particular, in early 2009 there is a discrete downwards shift in the coefficient on the ex-bulks ToT and a discrete upwards shift in the coefficient on the bulks ToT. This broadly coincides with the introduction of more flexible (less sticky) price-setting mechanisms for bulk commodity exports (discussed above in Box A).13 Break-point tests were unable to identify a statistically significant break; however, this could reflect the relatively short sample during
11 The estimated equilibriums from the other two models are shown in Appendix B (Graphs B1 and B2). 12 Recursive regressions were used to assess the stability of the model coefficients over time. 13 While the shift is somewhat less pronounced in the models incorporate weighted ToT, suggesting that part of the increased
responsiveness of the RTWI to changes in bulks prices relates to bulk commodities exports’ increasing share of the export basket, it is still evident.
70
90
110
130
70
90
110
130
1984 1989 1994 1999 2004 2009 2014
'Equilibrium' – Decomposed ModelUnweighted ToT, narrow bulks; post-float average real TWI = 100
Index Index
Observed real TWI
Base model 'equilibrium' term (SE=7.2)
Decomposed model 'equilibrium' term -
unweighted bulks excl. fuel (SE=6.9)
Source: RBA
70
90
110
130
70
90
110
130
1984 1989 1994 1999 2004 2009 2014
'Equilibrium' – Decomposed ModelWeighted ToT, broad bulks; post-float average real TWI = 100
Index Index
Observed real TWI
Base model 'equilibrium' term (SE=7.2)
Decomposed model 'equilibrium' term -
weighted bulks incl. fuel (SE=7.9)
Source: RBA

which more flexible price-setting mechanisms have been in effect, as well as the fact that these mechanisms are likely to have continued to evolve gradually over time.
3.1.3 Assessment
Overall, these models provide some evidence that the RTWI has been less responsive to movements in bulk commodity prices (though the differences in the estimated coefficients on the various bulks and ex-bulks variables are generally not statistically significant). Consistent with this, incorporating separate bulks and ex-bulks ToT measures into the model does result in smaller divergences between the RTWI and the estimated equilibrium level in the 2008 and 2010/11 episodes. Nevertheless, this approach also produces less stable coefficients. Further, the estimated equilibriums are fairly sensitive to the precise methodology used to calculate the bulks and ex-bulks ToT measures, and there is no strong theoretical or empirical evidence to support one specification over another. Consequently, we do not propose to add these models to a suite of RTWI models for ongoing monitoring, although they could be examined occasionally as a cross-check.
3.2 Incorporating a forward-looking measure of the ToT
3.2.1 Overview
Foreign exchange markets are generally considered to be forward-looking. If this is true, they should ‘price in’ expected changes in the ToT and should respond more to changes in the ToT that are expected to be sustained.14 Consequently, a forward-looking terms of trade (FToT) measure could display a stronger and more consistent relationship with the RTWI than the backward-looking observed ToT (as used in MA’s existing ECM). While this is a general point, in the Australian context the significance of using an FToT measure is likely to have increased in recent years because bulks prices, which may be less reflective of current expectations (see Box A above), have underpinned much of the recent ToT boom.
To investigate the relationship between the RTWI and the FToT, past vintages of Business and Trade section’s (BAT) goods and services ToT forecasts were used to construct a number of FToT measures.15 The measures were constructed using forecast horizons of 4-8 quarters ahead for a sample beginning in 2003.16,17 The exercise assumes that BAT’s forecasts provide a reasonable proxy for the market’s forecasts, with the market’s expectations the relevant determinant of the exchange rate.18
14 Chen et al (2010) note that, so long as there are costs in moving factors of production between sectors, the exchange rate should contain a forward-looking component that incorporates future expected commodity prices.
15 The goods ToT is used in MA’s existing ECM due to concerns over endogeneity between the RTWI and the services ToT (see Stone et al. (2005) for details). However, this is unlikely to be an issue when using forecasts, as current movements in the RTWI should have little to no effect on expectations for the future ToT.
16 The average of the forecasts for the next t quarters (as well as the current quarter) was also considered. The results were broadly similar, though the fit was slightly worse. As such, the results are not reported.
17 A maximum of 8 quarters was used as longer term forecasts are not available for older vintages. While forecasts are available from the December quarter of 2001 onwards, the forward-looking measures were only constructed from the March quarter of 2003 onwards. This was done to avoid including the technology boom and bust period in the sample. Nevertheless, including this period does not materially affect the results.
18 A time-series of market forecasts of the ToT is not readily available.

These ToT forecasts have consistently underestimated the persistence of increases in the ToT during the recent boom (Graph 7). This finding is consistent with Rees (2013), which finds that a large portion of the rise in the ToT during the 2000s was considered, at the time, to be transitory. Further, consistent with the notion that the exchange rate should be more aligned with expectations for the future ToT, the FToT measure appears to track the RTWI somewhat more closely than the observed ToT. This is particularly evident in 2008, when both the FToT and the RTWI appear to have declined more quickly in response to the onset of the global financial crisis than the observed ToT. Similarly, both the FToT and the RTWI appear to have ‘looked through’ the Queensland flood-induced spike in the observed ToT in 2010/11.
In order to formally test the relationship between the FToT and the RTWI, various FToT measures are included in the medium-run portion of MA’s existing ECM in place of the observed ToT. The change in the FToT is also included in the short-run portion of the model to examine whether changes in expectations about the ToT exert an influence on the RTWI’s path back to its estimated equilibrium.19
3.2.2 Key Findings
The results from the model that includes an 8-quarter ahead ToT forecast are reported in Appendix B (Table B2).20 As expected, when the models are estimated over the post-2003 sample, the coefficient on the FToT variable (0.7) is larger than the coefficient on the observed ToT variable (0.5), as is the associated adjustment coefficient (in absolute terms).21 In addition, the coefficient on the change in the FToT variable is positive and significant, indicating that changes in expectations about the future ToT exert an influence on the RTWI’s path back to its estimated equilibrium.
19 The change in the observed ToT is not included in the short-run portion in MA’s existing model as its coefficient is not significant. 20 The results from the other specifications are very similar and so are not reported. 21 To an extent, the higher coefficient on the FToT measures could simply reflect the fact that movements in the ToT have been
larger. However, the somewhat different profiles of the two series suggest that this does not account for the entire difference.
Graph 7
80
100
120
140
160
180
200
80
100
120
140
160
180
200
2003 2005 2007 2009 2011 2013
ToT, Forecasts of the ToT and the RTWIMarch 2003 = 100
RTWI
Goods ToT
8-quarter ahead forecast goods
and services ToT
Index Index
Goods and services ToT
Source: RBA

The estimated equilibrium from the FToT model also tends to track the observed RTWI more closely than the estimated equilibrium from MA’s existing model, as evidenced by a much smaller SE (Graph 8). This is particularly evident in 2008 and also in the past two years. Meanwhile, the FToT model suggests that the RTWI was slightly below its estimated equilibrium level, on average, in the March quarter of 2014, while the existing model suggests that it was around 2½ per cent above its estimated equilibrium (when estimated over the shorter sample).
3.2.3 Assessment
Over the post-2003 sample period, the estimated equilibrium from the FToT model has tracked the level of the RTWI more closely than the estimated equilibrium from MA’s existing model (which instead uses the observed ToT as the explanatory variable).22 This suggests that the FToT model could be a useful complement to MA’s existing model.
Nevertheless, there are two major limitations associated with using FToT measures. Firstly, FToT measures can only be constructed for a fairly short sample, compared with observed ToT measures. Secondly, it is difficult to use the model to ‘forecast’ the RTWI, even one-quarter ahead, as this would require assumptions to be made regarding future forecasts.
3.3 Incorporating an Investment/GDP variable
3.3.1 Overview
Investment in the Australian mining sector has increased markedly over recent years, as firms have responded to the sizeable increase in demand for bulk commodities. This investment is one of the main channels through which higher prices for bulk commodities (and the consequent increase in Australia’s ToT) are likely to have affected the domestic economy and the RTWI. However, developments in bulk commodity prices and in the level of investment in the sector can diverge, in part reflecting the ‘lumpy’ nature of investment in the mining sector. For example, the ToT has declined somewhat over recent quarters, but the RTWI has remained elevated, possibly reflecting the continuing high levels of mining investment.
To test whether investment is a better indicator of the effect of higher bulks prices on the economy (and therefore on the RTWI) than the prices themselves, an investment-to-GDP ratio (I/GDP) variable is added to the model’s co-integrating relationship.
Two measures of I/GDP are considered. One is constructed using private business investment from the National Accounts (Graph 9).23 The other uses a forward-looking measure of non-residential construction work yet to be done (WYTBD), which is constructed using data from the ABS’s Building Activity and Engineering Construction Activity releases (Graph 10).
22 By using forecast vintages, the model also avoids issues related to data revisions, as discussed in Faust, Rogers and Wright (2003).
23 Two measures of mining investment were also considered, but the estimated coefficients had counterintuitive negative signs. It is possible that this reflects collinearity between the ToT and mining investment.
Graph 8
70
90
110
130
70
90
110
130
2003 2005 2007 2009 2011 2013 2015
'Equilibrium' – FToT ModelPost-float average real TWI = 100
Index IndexObserved real
TWI
Base model 'equilibrium' term
(SE=7.6)
8-quarter ahead model 'equilibrium'
term (SE=4.1)
Source: RBA
Graph 9 Graph 10
3.3.2 Key Findings
The results from incorporating the I/GDP variables into MA’s existing ECM are reported in Appendix B (Table B3).24 The coefficients on both of the investment variables have the expected positive sign, but only the coefficient on the forward-looking WYTBD variable is statistically significant. At the same time, the coefficient on the ToT is lower in both models, possibly reflecting the separation of the direct effect of higher bulks prices (and a higher ToT) on the RTWI from the effect via the investment channel (though there is some evidence of collinearity, which makes it difficult to interpret the individual coefficients).25
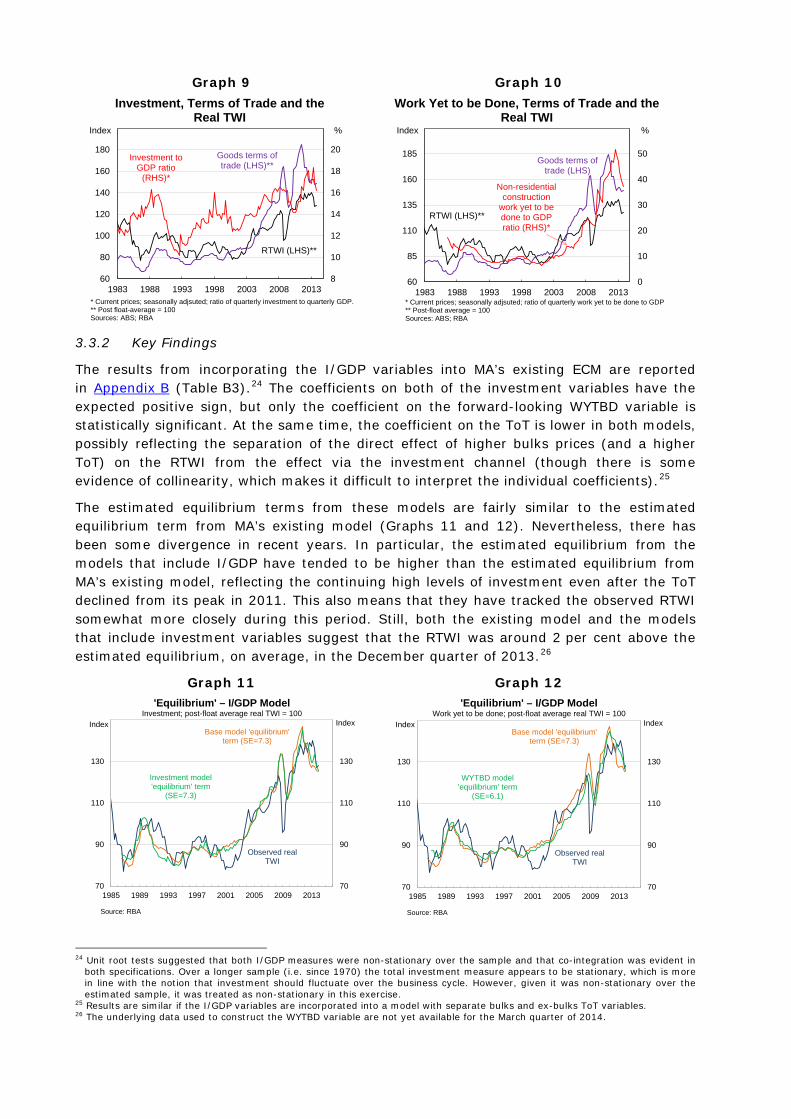
The estimated equilibrium terms from these models are fairly similar to the estimated equilibrium term from MA’s existing model (Graphs 11 and 12). Nevertheless, there has been some divergence in recent years. In particular, the estimated equilibrium from the models that include I/GDP have tended to be higher than the estimated equilibrium from MA’s existing model, reflecting the continuing high levels of investment even after the ToT declined from its peak in 2011. This also means that they have tracked the observed RTWI somewhat more closely during this period. Still, both the existing model and the models that include investment variables suggest that the RTWI was around 2 per cent above the estimated equilibrium, on average, in the December quarter of 2013.26
Graph 11 Graph 12
24 Unit root tests suggested that both I/GDP measures were non-stationary over the sample and that co-integration was evident in both specifications. Over a longer sample (i.e. since 1970) the total investment measure appears to be stationary, which is more in line with the notion that investment should fluctuate over the business cycle. However, given it was non-stationary over the estimated sample, it was treated as non-stationary in this exercise.
25 Results are similar if the I/GDP variables are incorporated into a model with separate bulks and ex-bulks ToT variables. 26 The underlying data used to construct the WYTBD variable are not yet available for the March quarter of 2014.
8
10
12
14
16
18
20
60
80
100
120
140
160
180
1983 1988 1993 1998 2003 2008 2013
Investment, Terms of Trade and the Real TWI
Investment to GDP ratio
(RHS)*
RTWI (LHS)**
Index %
Goods terms of trade (LHS)**
* Current prices; seasonally adjsuted; ratio of quarterly investment to quarterly GDP.** Post float-average = 100Sources: ABS; RBA
0
10
20
30
40
50
60
85
110
135
160
185
1983 1988 1993 1998 2003 2008 2013
Work Yet to be Done, Terms of Trade and the Real TWI
Non-residentialconstruction
work yet to be done to GDP ratio (RHS)*
RTWI (LHS)**
Index %
Goods terms of trade (LHS)
* Current prices; seasonally adjsuted; ratio of quarterly work yet to be done to GDP** Post-float average = 100Sources: ABS; RBA
70
90
110
130
70
90
110
130
1985 1989 1993 1997 2001 2005 2009 2013
'Equilibrium' – I/GDP ModelInvestment; post-float average real TWI = 100
Index Index
Observed real TWI
Base model 'equilibrium' term (SE=7.3)
Investment model 'equilibrium' term
(SE=7.3)
Source: RBA
70
90
110
130
70
90
110
130
1985 1989 1993 1997 2001 2005 2009 2013
'Equilibrium' – I/GDP ModelWork yet to be done; post-float average real TWI = 100
Index Index
Observed real TWI
Base model 'equilibrium' term (SE=7.3)
WYTBD model 'equilibrium' term
(SE=6.1)
Source: RBA

3.3.3 Assessment
There is some evidence that including a WYTBD/GDP variable in MA’s existing model of the RTWI provides some additional explanatory power, particularly over recent years. This suggests that the model could be a useful complement to the existing model, particularly as mining investment is expected to decline in coming years as the economy reaches the so-called ‘capex cliff’.
4. Conclusion
There is evidence to suggest that the relationship between the RTWI and bulks prices is different to the relationship between the RTWI and other export prices. This is consistent both with the nature of price-setting mechanisms for bulk commodity exports – and recent changes in these mechanisms – as well as the fact that the bulks industry is less integrated with the rest of the economy than other export industries. There is also evidence to suggest that the use of the aggregate goods ToT in MA’s existing model of the RTWI has contributed to relatively large and sustained divergences between the observed RTWI and the model’s estimated equilibrium term.
This note shows that extensions to MA’s existing model that attempt to account for the differences in these relationships can provide some additional insight into movements in the RTWI, particularly over recent years. Consequently, we propose to use variants of these models to complement the existing model on an ongoing basis. Specifically:
• Various specifications of the decomposed ToT model will be considered occasionally as a cross-check for the existing model. Issues with parameter stability, the sensitivity of the estimated equilibrium to the specification of the decomposed ToT, as well as the lack of clear theoretical or empirical guidance as to which specification is ‘best’, makes it difficult to use this model as a more regular complement to the existing model.
• The model that incorporates a forward-looking ToT measure will be added to MA’s suite of models. The model is tractable, has strong theoretical underpinnings, and has robust and intuitive results, despite the relatively short sample period available.
• The model that incorporates the WYTBD measure of I/GDP will also be added to the suite. Again, the model has reasonable theoretical underpinnings, and robust and intuitive results. Further, it is intended to capture dynamics that will continue to play out over the coming years (i.e. the ‘capex cliff’).
Nevertheless, none of the augmented models provide a particularly different estimate of the current deviation of the RTWI from its estimated equilibrium level, compared to MA’s existing model. All models indicate that the RTWI was within one standard error of the estimated equilibrium during the March quarter of 2014 (or, in the case of the model that incorporates I/GDP, in the December quarter of 2013).
Jonathan Hambur Market Analysis International Department 20 June 2014
Appendix A and B can be found here

References Amano, R. and van Norden, S., 1995, ‘Terms of trade and real exchange rates: the Canadian evidence’, Journal of International Money and Finance, Vol. 14, No. 1, pp. 83-104
Atkin, T., Caputo, M., Robinson, T. and Wang, H., 2014, ‘Macroeconomic consequences of terms of trade episodes, past and present’, Reserve Bank of Australia Research Discussion Paper No. 2014-01.
Beechey, M., Bharucha, N., Cagliarini, A., Gruen, D. and Thompson, C., 2000, ‘A small model of the Australian macroeconomy’, Reserve Bank of Australia Research Discussion Paper No. 2000-05.
Caputo, M., 2012, ‘An update on Australian iron ore price setting arrangements’, Internal note.
Cashin, P., Cespedes, L. and Sahay, R., 2004, ‘Commodity currencies and the real exchange rate’, Journal of Development Economics, vol. 75, pp. 239-268.
Chen, Y. and Rogoff, K., 2003, ‘Commodity Currencies’, Journal of International Economics, vol. 60, pp. 133-160.
Chen, Y., Rogoff, K. and Rossi, B., 2010, ‘Can exchange rates forecast commodity prices?’, The Quarterly Journal of Economic, August, pp. 1145-1194
Connolly, E. and Orsmond, D., 2011, ‘The mining industry: From bust to boom’, Reserve Bank of Australia Research Discussion Paper No. 2011-08.
Debelle, G. and Plumb, M., 2006, ‘The evolution of exchange rate policy and capital controls in Australia’, Asian Economic Papers, vol. 5, no. 2, pp. 7-29.
Debelle, G., 2014, ‘Capital flows and the Australian dollar’, speech to the Financial Services Institute of Australia, 20 May, Adelaide
Faust, J., Rogers, J. and Wright, J., 2003, ‘Exchange rate forecasting: the errors we’ve really made’, Journal of International Economics, vol. 60, pp. 35-59.
Hall, J. and Rees, D., 2013, ‘If our terms of trade forecasts are correct then the real exchange rate will depreciate’, Internal note.
Jacobs, D., 2011, ‘The global market for liquefied natural gas’, Reserve Bank of Australia Bulletin, September, pp. 17-28.
Maier, P. and DePratto, B., 2008, ‘The Canadian dollar and commodity prices: Has the relationship changed over time?’, Bank of Canada Discussion Paper No. 2008-15.
Plumb, M., Kent, C. and Bishop, J., 2013, ‘Implications for the Australian economy of strong growth in Asia’, Reserve Bank of Australia Research Discussion Paper No. 2013-03.
Rayner, V. and Bishop, J., 2013, ‘Industry dimensions of the resource boom: An input-output analysis’, Reserve Bank of Australia Research Discussion Paper No. 2013-02.
Rees, D., 2013, ‘Terms of trade shocks and incomplete information’, Reserve Bank of Australia Research Discussion Paper No. 2013-09.
Stone, A., Wheatley, T. and Wilkinson, L., 2005, ‘A small model of the Australian macroeconomy: An update’, Reserve Bank of Australia Research Discussion Paper No. 2005-11.
Tarditi, A., 1996, ‘Modelling the Australian exchange rate, long bond yield and inflationary expectations’, Reserve Bank of Australia Research Discussion Paper No. 9608.
Weltewitz, F. and Smith, P., 2013, ‘Regime changes in the Australian dollar model’, Internal note.
Appendices – The Mining Boom and the Australian Dollar Real TWI Model
Appendix A
The ToT is the ratio of the export implicit price deflator (IPD) to the import IPD. Similarly, the bulks and ex-bulks ToT were constructed as the ratios of relevant export IPD, to the aggregate import IPD. While the import IPD was available, the relevant export IPDs needed to be constructed. This was done using chain-volume data on bulk commodity and non-bulk exports, constructed using chain linking techniques.1
Note that non-seasonally adjusted data were used for chain linking. Nevertheless, no residual seasonality was evident in the final series and so the series were not adjusted. However, the findings are largely consistent if the series are seasonally adjusted, or if seasonally adjusted data are used for chain linking.
1 For more information on chain linking see Cagliarini (2003).

Appendix B
Table B1: Model results incorporating decomposed ToT measures
Base2 Unweighted(narrow)
Weighted (narrow)
Unweighted (broad)
Weighted (broad)
1986:2
2014:1
1986:2
2014:1
1986:2
2014:1
1986:2
2014:1
1986:2
2014:1
Variables
Constant 0.36*** 0.28 0.36* 0.03 0.16
(s.e.) (0.11) (0.18) (0.19) (0.20) (0.20)
Real exchange rate (t-1) –0.20*** –0.21*** –0.21*** –0.21*** –0.17***
(s.e.) (0.05) (0.05) (0.05) (0.05) (0.05)
Terms of trade (t-1) 0.12*** -- -- -- --
(s.e.) (0.03)
Bulks terms of trade (t-1) -- 0.03 0.04*** 0.02 0.04***
(s.e.) (0.02) (0.01) (0.02) (0.01)
Terms of trade ex-bulks (t-1) -- 0.12** 0.09** 0.19*** 0.09***
(s.e.) (0.06) (0.04) (0.06) (0.03)
Equilibrium relationships
Terms of trade 0.59*** -- -- -- --
(s.e.) (0.06)
Bulks terms of trade -- 0.13 0.20*** 0.09 0.26***
(s.e.) (0.09) (0.02) (0.07) (0.03)
Terms of trade ex-bulks -- 0.57** 0.43*** 0.87*** 0.54***
(s.e.) 0.25 0.15 0.26 0.21
Real interest rate differential 1.46 1.55 1.47 1.26 1.62
(s.e.) (1.03) (0.97) (0.97) (0.96) (1.17)
2 Results reported using seasonally-adjusted data. The results are similar if non-seasonally-adjusted data are used.
Graph B1 Graph B2
70
90
110
130
70
90
110
130
1984 1989 1994 1999 2004 2009 2014
'Equilibrium' – Decomposed ModelUnweighted ToT, broad bulks; post-float average real TWI = 100
Index Index
Observed real TWI
Base model 'equilibrium' term (SE=7.2)
Decomposed model 'equilibrium' term -
unweighted bulks incl. fuel (SE=6.9)
Source: RBA
70
90
110
130
70
90
110
130
1984 1989 1994 1999 2004 2009 2014
'Equilibrium' – Decomposed ModelWeighted ToT, narrow bulks; post-float average real TWI = 100
Index Index
Observed real TWI
Base model 'equilibrium' term (SE=7.2)
Decomposed model 'equilibrium' term -
weighted bulks excl. fuel (SE=7.1)
Source: RBA

Graph B3 Graph B4
Graph B5 Graph B6 Graph B7
-0.50
-0.25
0.00
-0.50
-0.25
0.00
2000 2004 2008 2012
Error Correction Coefficient - Base ModelRolling coefficients, windows arranged by endpoints
Source: RBA
α α
-1.00
-0.50
0.00
0.50
1.00
-1.00
-0.50
0.00
0.50
1.00
2000 2004 2008 2012
Coefficient on Terms of Trade - Base ModelRolling coefficients, windows arranged by endpoints
Source: RBA
β β
-0.50
-0.25
0.00
-0.50
-0.25
0.00
2000 2004 2008 2012
Error Correction Coefficient - UnweightedRolling coefficients, windows arranged by end points
* Bulks excludes other mineral fuels.Source: RBA
α α
-0.50
0.00
0.50
1.00
1.50
-0.50
0.00
0.50
1.00
1.50
2000 2004 2008 2012
Coefficient on Terms of Trade Ex-Bulks - UnweightedRolling coefficients, windows arranged by end points*
* Bulks excludes other mineral fuels.Source: RBA
β β
-1.50
-1.00
-0.50
0.00
0.50
-1.50
-1.00
-0.50
0.00
0.50
2000 2004 2008 2012
Coefficient on Bulks Terms of Trade - UnweightedRolling coefficients, windows arranged by endpoints*
* Bulks excludes other mineral fuelsSource: RBA
β β
Graph B8 Graph B9 Graph B10
Graph B11 Graph B12 Graph B13
-0.50
-0.25
0.00
-0.50
-0.25
0.00
2000 2004 2008 2012
Error Correction Coefficient – WeightedRolling coefficients, windows arranged by mid points*
* Bulks excludes other mineral fuelsSource: RBA
α α
-0.50
0.00
0.50
1.00
1.50
-0.50
0.00
0.50
1.00
1.50
2000 2004 2008 2012
Coefficient on Terms of Trade Ex-Bulks - WeightedRolling coefficient, windows arranged by end points*
* Bulks excludes other mineral fuelsSource: RBA
β β
-1.50
-1.00
-0.50
0.00
0.50
-1.50
-1.00
-0.50
0.00
0.50
2000 2004 2008 2012
Coefficient on Bulks Terms of Trade - WeightedRolling coefficients, windows arranged by end points*
* Bulks excludes other mineral fuelsSource: RBA
β β
-0.50
-0.25
0.00
-0.50
-0.25
0.00
2000 2004 2008 2012
Error Correction Coefficient - UnweightedRolling coefficients, windows arranged by end points
* Bulks includes other mineral fuelsSource: RBA
α α
-0.50
0.00
0.50
1.00
1.50
-0.50
0.00
0.50
1.00
1.50
2000 2004 2008 2012
Coefficient on Terms of Trade Ex-Bulks - UnweightedRolling coefficient, windows arranged by end points*
* Bulks includes other mineral fuelsSource: RBA
β β
-1.50
-1.00
-0.50
0.00
0.50
-1.50
-1.00
-0.50
0.00
0.50
2000 2004 2008 2012
Coefficient on Bulks Terms of Trade - UnweightedRolling coefficients, windows arranged by endpoints*
* Bulks includes other mineral fuels.Source: RBA
β β

Graph B14 Graph B15 Graph B16
-0.50
-0.25
0.00
-0.50
-0.25
0.00
2000 2004 2008 2012
Error Correction Coefficient – WeightedRolling coefficients, windows arranged by mid points
* Bulks includes other mineral fuelsSource: RBA
α α
-0.50
0.00
0.50
1.00
1.50
-0.50
0.00
0.50
1.00
1.50
2000 2004 2008 2012
Coefficient on Terms of Trade Ex-Bulks - WeightedRolling coefficient, windows arranged by end points*
* Bulks includes other mineral fuels.Source: RBA
β β
-1.50
-1.00
-0.50
0.00
0.50
-1.50
-1.00
-0.50
0.00
0.50
2000 2004 2008 2012
Coefficient on Bulks Terms of Trade - WeightedRolling coefficients, windows arranged by end points*
* Bulks includes other mineral fuels.Source: RBA
β β

Table B2: Model result incorporating an FToT measure
Base Eight-quarter
ahead
2003:1
2014:1
2003:1
2014:1
Variables
Constant 0.56*** 0.58***
(s.e.) (0.14) (0.14)
Real exchange rate (t-1) –0.25*** –0.46***
(s.e.) (0.06) (0.11)
Terms of trade (t-1) 0.12*** 0.32***
(s.e.) (0.04) (0.09)
d(Terms of trade) -- 0.37***
(s.e.) (0.11)
Equilibrium relationships
Terms of trade 0.50*** 0.70***
(s.e.) (0.07) (0.05)
Real interest rate differential 0.90 0.09
(s.e.) (1.80) (0.93)

Table B3: Model results incorporating I/GDP
Base Total
Investment WYTBD
1986:2
2013:4
1986:2
2013:4
1986:4
2013:4
Variables
Constant 0.34*** 0.38*** 0.53***
(s.e.) (0.12) (0.12) (0.17)
Real exchange rate (t-1) –0.19*** –0.20*** –0.20***
(s.e.) (0.05) (0.05) (0.05)
d(Total Investment/GDP) -- 0.73* --
(s.e.) (0.44)
d(Work yet-to-be-done/GDP) -- -- 0.26
(s.e.) (0.15)
Equilibrium relationships
Terms of trade 0.60*** 0.51*** 0.39***
(s.e.) (0.06) (0.07) (0.11)
Real interest rate differential 1.37 1.37 1.40
(s.e.) (1.07) (1.01) (1.01)
Total Investment/GDP -- 2.03 --
(s.e.) (1.26)
Work yet-to-be-done/GDP -- 0.47*
(s.e.) (0.25)

An Update on Global Foreign Exchange Reserves – March Quarter 2014
The IMF’s Currency Composition of Official Foreign Exchange Reserves (COFER) data show that global foreign exchange reserves totalled US$11.9 trillion, or 15.9 per cent of global GDP, as at the end of March 2014 (Graph 1). In exchange rate–adjusted terms, global reserve holdings increased by around 1½ per cent over the March quarter to be 5 per cent higher over the year.1 The growth over the quarter was mostly attributable to increased reserve holdings by emerging & developing economies (EMDEs), although reserve holdings for advanced economies also increased slightly.
Graph 1
The March 2014 COFER data contain currency composition information for 52 per cent of the global stock of reserves – known as ‘allocated reserves’ – down from 53 per cent in the December quarter. In exchange rate-adjusted terms, Australian dollar-denominated reserve holdings were little changed over the quarter. Reserves denominated in Australian dollars continued to represent 1.7 per cent of total ‘allocated reserves’ as at the end of March, with similar allocations held by advanced economies and EMDEs (Table 1). The Canadian dollar-denominated share of allocated global reserves increased slightly to 1.9 per cent, with reserve holdings denominated in Canadian dollars increasing by 6½ per cent in exchange rate-adjusted terms over the quarter.
Table 1
The share of allocated global reserves denominated in US dollars rose marginally over the quarter – to almost 61 per cent – though remains broadly unchanged over the past year (Table 1, Graph 2). The share of allocated reserves denominated in euros also rose slightly over the quarter – owing entirely to an increase in holdings by EMDEs – but remains slightly lower than a year ago (Graph 3). In exchange rate-adjusted terms, allocated reserve holdings denominated in UK pounds fell by 5 per cent over the March quarter, to be 8 per cent lower over the year. In contrast, yen-denominated
1 The COFER data are reported in US dollar terms so – to the extent that reserves are held in other currencies – will be affected by exchange rate movements. The exchange rate adjustments in this note are based on the currency composition of the reserve holdings for which the currency allocation is known (covering the euro, British pound, Japanese yen, Australian dollar, Canadian dollar and Swiss franc) and assumes that the exchange rate effect on ‘other’ currencies is zero. Prior to the December quarter 2012, movements in the Australian and Canadian dollars were included in the exchange rate adjustment for ‘other’ currencies.
0
5
10
15
0
5
10
15
1999 2001 2003 2005 2007 2009 2011 2013Sources: IMF; RBA
Global Foreign Exchange ReservesPer cent of global nominal GDP, quarterly
% %
Advanced economies
Emerging & developing economies
World
ShareQuarterly change
in share*Share
Quarterly change in share*
ShareQuarterly change
in share*Per cent Percentage points Per cent Percentage points Per cent Percentage points
USD 60.9 0.1 61.5 0.1 60.2 0.1EUR 24.5 0.1 24.7 -0.1 24.2 0.2GBP 3.9 -0.2 2.9 -0.2 5.1 -0.1JPY 4.0 0.0 4.6 -0.1 3.1 0.1AUD 1.7 0.0 1.7 0.0 1.8 0.0CAD 1.9 0.1 1.6 0.1 2.2 0.2CHF 0.3 0.0 0.4 0.0 0.2 0.0Other 2.8 -0.2 2.6 0.1 3.1 -0.5* Exchange-rate adjustedSources: IMF; RBA
Global Advanced economies Emerging/developing economies
Composition of Allocated Foreign Exchange ReservesMarch quarter 2014
2
reserve holdings were little changed over the March quarter but have increased by around ½ percentage point over the past year.
Graph 2
Graph 3
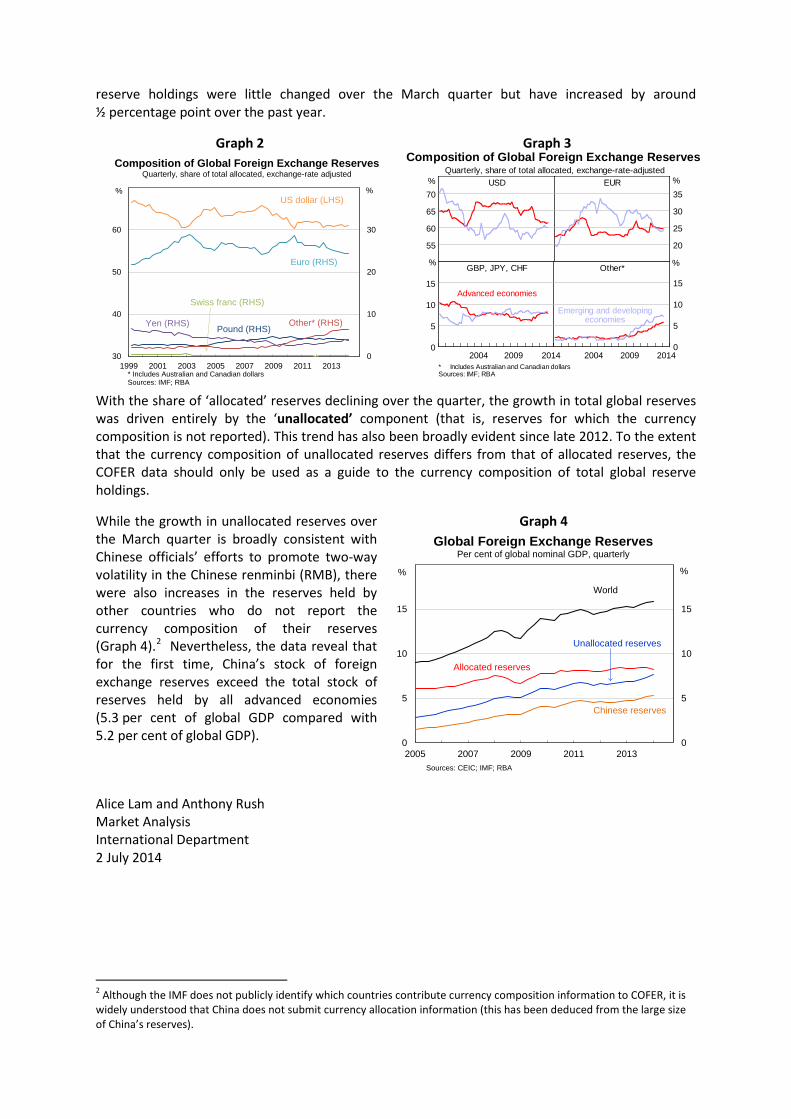
With the share of ‘allocated’ reserves declining over the quarter, the growth in total global reserves was driven entirely by the ‘unallocated’ component (that is, reserves for which the currency composition is not reported). This trend has also been broadly evident since late 2012. To the extent that the currency composition of unallocated reserves differs from that of allocated reserves, the COFER data should only be used as a guide to the currency composition of total global reserve holdings.
While the growth in unallocated reserves over the March quarter is broadly consistent with Chinese officials’ efforts to promote two-way volatility in the Chinese renminbi (RMB), there were also increases in the reserves held by other countries who do not report the currency composition of their reserves (Graph 4).2 Nevertheless, the data reveal that for the first time, China’s stock of foreign exchange reserves exceed the total stock of reserves held by all advanced economies (5.3 per cent of global GDP compared with 5.2 per cent of global GDP).
Graph 4
Alice Lam and Anthony Rush Market Analysis International Department 2 July 2014
2 Although the IMF does not publicly identify which countries contribute currency composition information to COFER, it is widely understood that China does not submit currency allocation information (this has been deduced from the large size of China’s reserves).
0
10
20
30
30
40
50
60
1999 2001 2003 2005 2007 2009 2011 2013* Includes Australian and Canadian dollarsSources: IMF; RBA
Composition of Global Foreign Exchange ReservesQuarterly, share of total allocated, exchange-rate adjusted
% %US dollar (LHS)
Euro (RHS)
Yen (RHS) Pound (RHS)
Swiss franc (RHS)
Other* (RHS)
0
5
10
15
0
5
10
15
20
25
30
35
55
60
65
70
Composition of Global Foreign Exchange ReservesQuarterly, share of total allocated, exchange-rate-adjusted
* Includes Australian and Canadian dollarsSources: IMF; RBA
2014
%EURUSD
GBP, JPY, CHF Other* %
%
%
2009200420142009
Advanced economies
Emerging and developingeconomies
2004
0
5
10
15
0
5
10
15
2005 2007 2009 2011 2013Sources: CEIC; IMF; RBA
Global Foreign Exchange ReservesPer cent of global nominal GDP, quarterly
World
Allocated reserves
Unallocated reserves
Chinese reserves
% %

INTERNATIONAL DEPARTMENT MONTHLY REVIEW JULY 2014
3

12
Australian Dollar
Consistent with the fact that the Australian dollar’s appreciation over 2014 has coincided with declining commodity prices, Market Analysis’s baseline model of the Australian dollar estimates that the Australian dollar was 6 per cent above the level justified by its medium-term determinants, on average, in the June quarter (in real trade-weighted terms).2
60
100
140
60
100
140
1985 1989 1993 1997 2001 2005 2009 2013
'Equilibrium' Real TWI*Post-float average real TWI = 100
Index Index
Observed real TWI
'Equilibrium' term(+/- 1 std. dev. of historical
deviations)
* Dots represent estimates for the June 2014 quarter.Source: RBA
2 Using forward-looking measures for the terms of trade implies that the Australian dollar is 3-5 per cent above the level suggested by its medium-term determinants. For more information on these models see Hambur (2014)

13
International Department
22 July 2014

UPDATE ON THE AUSTRALIAN DOLLAR
Since the previous testimony in March, the A$ has appreciated by around 3% on a nominal trade-weighted basis to be 7% above its January 2014 low. In a longer-run context, the nominal TWI has depreciated by 11% since its peak in April 2013, but remains 16% above its post-float average.
• Against the US$, the A$ has appreciated by 7% since its January low, though remains 12% below itsApril 2013 peak; it is 22% higher than its post-float average.
• Against the JPY, the A$ has appreciated by 7% since its January low, though remains 9% below itsApril 2013 peak; it is 3% higher than its post-float average.
• Against the euro, the A$ has appreciated by 10% since its January low, though remains 19% belowits historical peak (reached in August 2012); it is 10% higher than its average since the introductionof the single currency in 1999.
The appreciation in the Australian dollar since late January has occurred even though key commodity prices have declined, and interest rate differentials between Australia and a number of other advanced economies have narrowed. In broad terms, it has coincided with:
• an improvement in risk sentiment – and further declines in volatility across a number of assetmarkets – which has underpinned gains in most global equity markets and higher-yielding assets;
• broadly stronger domestic economic data and diminished expectations of a lower cash rate,though, there has been a partial reversal in both of these in recent weeks;
• reduced market concerns over the outlook for China; and
• weaker US economic data in the MQ14 – against expectations of better US growth, higher US yieldsand a stronger US$ over 2014 – though more recent US data has been broadly stronger.
In real terms, the TWI has depreciated by around 7% since its peak in the MQ13, but it remains around 30% above its post-float average.
The real TWI remains high by historical standards with a unit labour cost (ULC) based measure presenting a very similar picture to the standard CPI-based measure (though the ULC-based measure excludes a number of countries, including China). That said, the ULC-based measure has experienced a slightly larger depreciation over the past year, reflecting some improvement in Australia’s relative ULC.
0.3
0.6
0.9
1.2
50
100
150
200
1984 1989 1994 1999 2004 2009 2014
Australian DollarMonth average
Index,Yen
US$,Euro
US$ per A$ (RHS)
TWI (LHS)**Euro per A$ (RHS)*
Yen per A$ (LHS)
* Deutsche Mark splice for observations prior to 1999** Indexed to post-float average = 100Sources: Bloomberg; RBA; Thomson Reuters
-15
-10
-5
0
5
-15
-10
-5
0
5
MS
CI E
mer
ging
S&
P 5
00
Chi
na A
AU
D T
WI
MS
CI W
orld
AS
X 2
00
NZ
dolla
r
EM
cur
renc
ies
Wes
tpac
ICP
CR
B In
dex
Can
adia
n do
llar
Eur
o
Eur
o S
toxx
RB
A IC
P**
Australian Dollar and Other Assets*Percentage change since 27 January trough in TWI
% %
** Against US dollar or in US dollar terms except for Euro Stoxx.** RBA index of commodity prices with spot bulks
1
4

MA’s base model of the (CPI-deflated) real TWI is estimated from JQ86 to JQ14, and is based on its medium-term relationship with Australia’s goods ToT and the real policy rate differential with the G3 (and also some short-run variables). The model suggests that, in quarter-average terms, the real TWI was 8% above the level consistent with its medium-term determinants in the JQ14 (which is slightly outside the +/–1 standard deviation band). Estimates for the SQ14 to date suggest a slightly larger deviation.1
It should be noted that these estimates are sensitive to the estimation period:
• if the model is estimated using data since 1974, it suggests the A$ was 2% below the level consistent with its medium-term determinants in the JQ14; whereas
• if the model is estimated using data since MQ03, it suggests the A$ was 9% above the level consistent with its medium-term determinants in the JQ14.
MA‘s models of the real TWI that incorporate forward-looking measures of the ToT – based on the Bank’s internal ToT forecasts – are estimated from MQ03 to JQ14. They suggest that, in quarter-average terms, the real TWI was 3-5% above the level consistent with its medium-term determinants in the JQ14. Estimates suggest a slightly smaller deviation in the SQ14 to date.
External assessments also suggest that the A$ is overvalued:
• The IMF’s most recent assessment suggests the A$ real TWI was overvalued by 5-15% as of May 2014;
• A small sample of investment bank models generally point to overvaluation of around 10% on a TWI basis.
Table 1: Models of the Australian Dollar – Summary
1 The SQ14 estimates assume that: the nominal TWI remains unchanged for the rest of the SQ14; domestic and foreign inflation remains unchanged; domestic and foreign policy rates remain unchanged; and the terms of trade grows in line with BAT’s forecasts (which are for a 1½% decline in the SQ14).
60
80
100
120
140
160
60
80
100
120
140
160
1975 1980 1985 1990 1995 2000 2005 2010 2015
Real Exchange Rate MeasuresAustralian dollar TWI; post-float average = 100
Index Index
CPI real exchange rate -sample matched to ULC
data*
ULC real exchange rate*
* Sample includes USA, Japan, UK, New Zealand, Canada, Sweden, South Korea and the Euro zone. Trade weights for the included countries are scaled up to sum to 100.Sources: OECD; RBA
CPI real exchange rate -full sample
50
75
100
125
150
50
75
100
125
150
2000 2002 2004 2006 2008 2010 2012 2014
Unit Labour CostsMarch 2000 = 100
Index Index
Japan
GermanyEuro area*
Korea
UK
US
Canada
New Zealand
Australia
* GDP weighted index of Germany, France, Italy, the Netherland, Belgium and Spain Source: OECD
60
100
140
60
100
140
1985 1989 1993 1997 2001 2005 2009 2013
'Equilibrium' Real TWI*Post-float average real TWI = 100
Index Index
Observed real TWI
'Equilibrium' term(+/- 1 std. dev. of historical
deviations)
* Dots represent estimates for the June 2014 quarter.Source: RBA
2
Estimated exchange rate valuation
RBA Models (Real TWI) – June Quarter 2014 Under/over-
valuation % deviation Standard
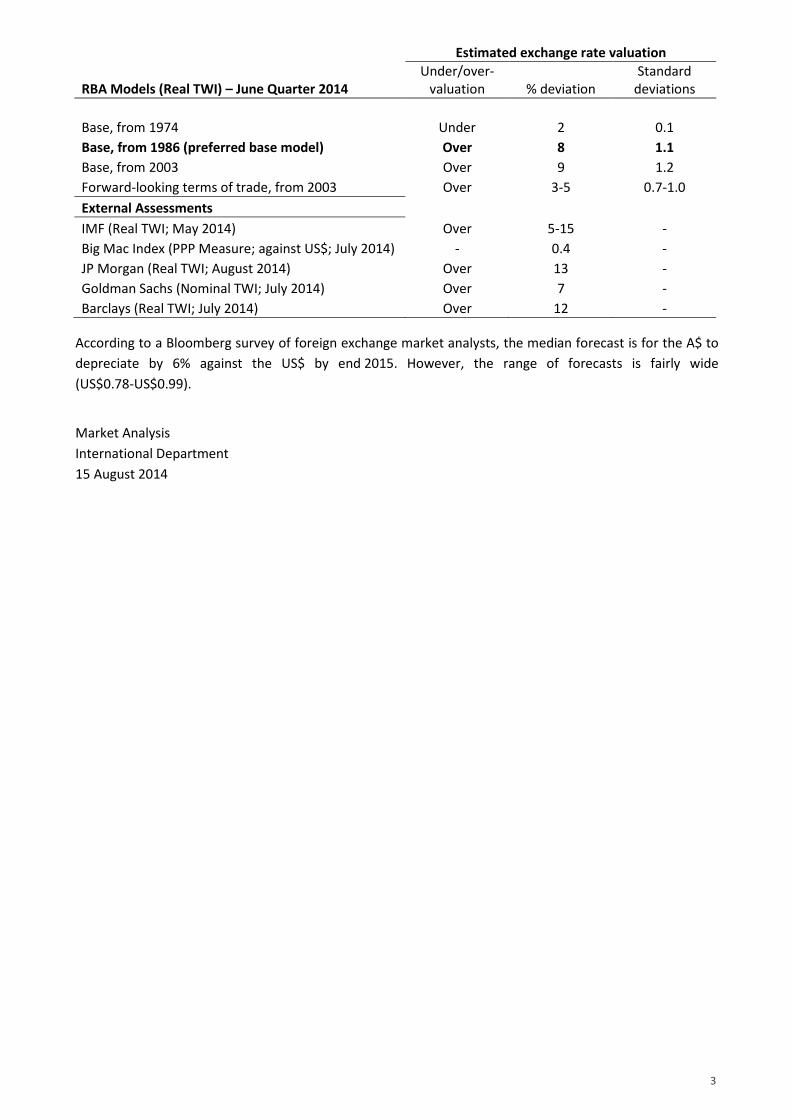
deviations Base, from 1974 Under 2 0.1 Base, from 1986 (preferred base model) Over 8 1.1 Base, from 2003 Over 9 1.2 Forward-looking terms of trade, from 2003 Over 3-5 0.7-1.0 External Assessments
IMF (Real TWI; May 2014) Over 5-15 - Big Mac Index (PPP Measure; against US$; July 2014) - 0.4 - JP Morgan (Real TWI; August 2014) Over 13 - Goldman Sachs (Nominal TWI; July 2014) Over 7 - Barclays (Real TWI; July 2014) Over 12 -
According to a Bloomberg survey of foreign exchange market analysts, the median forecast is for the A$ to depreciate by 6% against the US$ by end 2015. However, the range of forecasts is fairly wide (US$0.78-US$0.99).
Market Analysis International Department 15 August 2014
3

1
INTERNATIONAL DEPARTMENT MONTHLY REVIEW AUGUST 2014
5

9
Australian Dollar

10
The Australian dollar remains at a high level,
notwithstanding the fact that commodity prices
have fallen and interest rate differentials
between Australia and a number of advanced
economies have narrowed over recent months.
Accordingly, estimates based on Market
Analysis’s baseline model suggest that the
Australian dollar real TWI was 8 per cent above
the level consistent with its medium-term
determinants in the June quarter, while estimates
for the September quarter to date suggest a
slightly larger deviation.
International Department 19 August 2014

1
INTERNATIONAL DEPARTMENT MONTHLY REVIEW SEPTEMBER 2014
6

13
Australian Dollar

14
Notwithstanding the recent depreciation,
Market Analysis’s baseline model of the
Australian dollar real trade-weighted index
(RTWI) – which is based on a quarter-average
measure of the exchange rate – estimates that
the Australian dollar was 8 per cent higher than
the level justified by its medium-term
determinants in the September quarter. The
current level of the RTWI is around 2 ½ per cent
below its September quarter average.
60
100
140
60
100
140
1985 1989 1993 1997 2001 2005 2009 2013
'Equilibrium' Real TWI*Post-float average real TWI = 100
Index Index
Observed real TWI
'Equilibrium' term(+/- 1 std. dev. of historical
deviations)
* Dots represent estimates for the September quarter.Source: RBA
International Department
23 September 2014

An Update on Global Foreign Exchange Reserves – June Quarter 2014
• The IMF’s COFER data show that global foreign exchange reserves totalled US$12 trillion, or 15.9 per centof global GDP, as at the end of June 2014. In exchange rate-adjusted terms, global reserve holdingsincreased by around 1 per cent over the June quarter to be 6 per cent higher over the year.
• The growth in the quarter was attributable to increased reserve holdings by both advanced and emerging& developing economies (EMDEs) and was again due to an increase in ‘unallocated’ reserves – that is,reserves for which the currency composition is not reported – whereas the share of ‘allocated’ reservesdeclined. This trend has been broadly evident since late 2012 and the share of unallocated reserves nowaccounts for 47.4 per cent of the total. However, Chinese FX reserves – which are widely thought to makeup the majority of unallocated reserves – were little changed over the quarter at 5.3 per cent of globalGDP.
• Reserve holdings denominated in US dollars rose over the quarter to represent 60.7 per cent of totalallocated reserves. The share of yen-denominated allocated reserve holdings increased slightly over theJune quarter to 4.0 per cent. In contrast, the share of allocated reserves denominated in euros declinedby 0.6 per cent as holdings denominated in euros fell by 2 ½ per cent in exchange rate-adjusted termsover the quarter, entirely due to a decrease in holdings by EMDEs.
• Reserve holdings denominated in Australian dollars represented 1.9 per cent of total allocated reservesas at end June 2014 with a modest increase over the quarter primarily due to the appreciation of theAUD. The Canadian dollar-denominated share of allocated global reserves increased slightly to 2.0 percent, notwithstanding the depreciation of the Canadian dollar over the quarter.
7

Composition of Allocated Foreign Exchange Reserves
June quarter 2014
Global Advanced economies Emerging/developing
economies
Share Quarterly change in share* Share Quarterly change in
share* Share Quarterly change in share*
Per cent Percentage points Per cent Percentage points Per cent Percentage points USD 60.7 0.3 61.3 -0.2 59.9 1.0 EUR 24.2 -0.6 24.5 0.0 23.8 -1.3 GBP 3.9 0.0 3.0 0.0 5.0 -0.1 JPY 4.0 0.1 4.9 0.2 3.0 -0.1 AUD 1.9 0.0 1.7 0.0 2.2 0.0 CAD 2.0 0.1 1.7 0.0 2.4 0.1 CHF 0.3 0.0 0.4 0.0 0.2 0.0 Other 3.0 0.1 2.5 0.0 3.7 0.3 * Exchange-rate adjusted Sources: IMF; RBA
1 October 2014

1
INTERNATIONAL DEPARTMENT MONTHLY REVIEW OCTOBER 2014
8

12
Australian Dollar
The Australian dollar
has
been little changed on a trade-weighted basis.
This follows a relatively pronounced depreciation
over the month of September. The Australian
dollar nevertheless remains at a high level by
historical standards; in trade-weighted terms, it is
currently 2 per cent higher than its January 2014
low and 12 per cent higher than its post-float
average.

13
International Department 21 October 2014

1
INTERNATIONAL DEPARTMENT MONTHLY REVIEW NOVEMBER 2014
9
11
Australian Dollar
Market Analysis’s baseline model of the
Australian dollar real trade-weighted index
(RTWI) – which is based on a quarter-average
measure of the exchange rate – estimates that
the Australian dollar was 8 per cent higher than
the level justified by its medium-term
determinants in the September quarter.
Assuming that the Australian dollar were to
remain unchanged from its current level until the
end of the year, the model suggests that it would
be, on average, 6 per cent above the level

12
justified by its medium-term determinants for the
December quarter as a whole.
International Department
18 November 2014
60
100
140
60
100
140
1985 1989 1993 1997 2001 2005 2009 2013
'Equilibrium' Real TWI*Post-float average real TWI = 100
index index
Observed realTWI
'Equilibrium' term(+/- 1 std. dev. of historical
deviations)
* Dots represent estimates for the December quarter.Source: RBA

An Update on Global Foreign Exchange Reserves – September Quarter 2014
• The IMF’s COFER data show that global foreign exchange reserves declined to US$11.8trillion, or 15.5 per cent of global GDP, as at the end of September 2014. This representedthe first quarterly fall in reserves since March 2009. However the decline was entirely dueto exchange rate effects; in exchange rate-adjusted terms, global reserve holdings increasedby 0.8 per cent over the September quarter to be 3.3 per cent higher since the end of 2013.
• The increase over the quarter was attributable to increased reserve holdings by bothadvanced economies and emerging and developing economies (EMDEs). The share of“unallocated” reserves – reserves for which the currency composition is not reported –increased slightly over the quarter (while the share of “allocated” reserves declined) withunallocated reserves now accounting for 47.4 per cent of the total. This is despite a decreasein Chinese FX reserves - which are widely thought to make up the majority of unallocatedreserves – over the quarter to 5.1 per cent of global GDP.
• The most notable change in the currency composition of allocated reserves was a 1.6percentage point decline in the share of euro holdings to 22.6 per cent, its smallest
0
5
10
15
0
5
10
15
1999 2001 2003 2005 2007 2009 2011 2013Sources: IMF; RBA
Global Foreign Exchange ReservesPer cent of global nominal GDP, quarterly
% %
Advanced economies
Emerging & developing economies
World
0
5
10
15
0
5
10
15
2005 2007 2009 2011 2013Sources: CEIC; IMF; RBA
Global Foreign Exchange ReservesPer cent of global nominal GDP, quarterly
World
Allocated reserves
Unallocated reserves
Chinese reserves
% %
10

allocation since September 2002. However in exchange rate-adjusted terms the share fell by only 0.2 percentage points, with declines in holdings by both advanced economies and EMDEs. In unadjusted terms, reserve holdings in US dollars rose by 1.6 percentage points over the quarter to represent 62.3 per cent of total allocated reserves, however, when adjusted for exchange rate effects US dollar holdings were largely unchanged at 62.3 per cent. The unadjusted share of yen-denominated allocated reserve holdings declined by 0.1 percentage points over the September quarter to 4.0 per cent; although when adjusted for the depreciation of the yen over the quarter the share of yen holdings actually increased by 0.1 percentage points to 4.0 per cent.
• Although reserve holdings denominated in Australian dollars declined by 0.3 percentagepoints to 1.9 per cent of total allocated reserves over the quarter, the decline was entirely due to a depreciation of the AUD over the quarter. In contrast, in exchange rate-adjusted terms the share of Australian dollar holdings increased by 0.1 percentage points to 1.9 per cent of total holdings, with increased holdings by both advanced economies and EMDEs. The Canadian dollar-denominated share of allocated global reserves decreased slightly over the quarter to 1.9 per cent in both unadjusted and exchange rate adjusted terms.
Alice Lam/ Market Analysis/International Department/2 January 2015
Composition of GlobalForeign Exchange Reserves
Quarterly, share of total allocated, exchange-rate-adjustedUSD
55
60
65
70% EUR
20
25
30
35%
GBP, JPY, CHF
20082002 20140
5
10
15
%
Advanced economies
Other*
20082002 20140
5
10
15
%
Emerging and developingeconomies
* Includes Australianand CanadiandollarsSources: IMF; RBA
0
10
20
30
30
40
50
60
1999 2001 2003 2005 2007 2009 2011 2013* Includes Australian and Canadian dollarsSources: IMF; RBA
Composition of Global Foreign Exchange ReservesQuarterly, share of total allocated, exchange-rate adjusted
% %US dollar (LHS)
Euro (RHS)
Yen (RHS) Pound (RHS)
Swiss franc (RHS)
Other* (RHS)
ShareQuarterly change
in share*Share
Quarterly change in share*
ShareQuarterly change
in share*Per cent Percentage points Per cent Percentage points Per cent Percentage points
USD 62.3 0.0 63.1 0.0 61.4 0.0EUR 22.6 -0.2 22.9 -0.1 22.2 -0.3GBP 3.8 0.1 3.0 0.1 4.9 0.1JPY 4.0 0.1 4.7 0.1 3.1 0.2AUD 1.9 0.1 1.7 0.0 2.2 0.1CAD 1.9 0.0 1.7 0.1 2.2 -0.1CHF 0.3 0.0 0.4 0.0 0.1 0.0Other 3.2 0.0 2.6 -0.1 3.9 0.0* Exchange-rate adjustedSources: IMF; RBA
Global Advanced economies Emerging/developing economies
Composition of Allocated Foreign Exchange ReservesSeptember quarter 2014

1
LOMAS, Phil
From: HAMBUR, JonathanSent: Thursday, 15 January 2015 2:19 PMTo: EVANS, CraigCc: FRASER, SaschaSubject: RE: Exchange rate projections [SEC=UNCLASSIFIED]Attachments: Equilbrium Graph.pptx
Hi Craig,
The graph you wanted is below (I have also attached a PowerPoint).
I included RTWI observation for December 2014 and March 2015. For both I have assumed inflation differentials remained unchanged. For the March 2015 observation I assumed the nominal TWI remains the same for the rest of the quarter.
Please let me know if you need anything else.
Jonathan
From: EVANS, Craig Sent: Thursday, 15 January 2015 12:16 PM To: HAMBUR, Jonathan Cc: FRASER, Sascha Subject: RE: Exchange rate projections [SEC=UNCLASSIFIED]
Hi Jonathan,
Would it be possible to get an updated version of this graph using the data you sent through?
11

2
Much appreciated, Craig Evans | Senior Economist | Business and Trade RESERVE BANK OF AUSTRALIA | 65 Martin Place, Sydney NSW 2000
From: HAMBUR, Jonathan Sent: Wednesday, 14 January 2015 2:35 PM To: SAUNDERS, Trent Cc: EVANS, Craig; FRASER, Sascha Subject: RE: Exchange rate projections [SEC=UNCLASSIFIED] Hi Trent, I have attached the ‘forecast’ equilibrium and the ‘forecast’ based on the ToT profile you sent through. The profiles use coefficients estimated up to September 2014. As per usual the profiles assume that the short‐run variables revert immediately to their means. I have included profiles for 3 different RIRD assumptions (unchanged, returns to average by end of sample, and based on interest rate futures), but they all give pretty similar results. Please let me know if you need anything else. Jonathan
From: SAUNDERS, Trent Sent: Wednesday, 14 January 2015 1:05 PM To: HAMBUR, Jonathan Subject: RE: Exchange rate projections [SEC=UNCLASSIFIED] All the way to June 2017. Thanks.
From: HAMBUR, Jonathan Sent: Wednesday, 14 January 2015 1:03 PM To: SAUNDERS, Trent Subject: RE: Exchange rate projections [SEC=UNCLASSIFIED]

3
Hi Trent, How far out did you want the projection? All the way to June 2017, or just for the near term? Jonathan
From: SAUNDERS, Trent Sent: Wednesday, 14 January 2015 10:42 AM To: HAMBUR, Jonathan Cc: EVANS, Craig Subject: Exchange rate projections [SEC=UNCLASSIFIED] Hi Jonathan, Can I please have the exchange rate projections updated for our current terms of trade forecasts? Cheers, Trent

60
100
140
60
100
140
1986 1992 1998 2004 2010 2016
Forecast and Forecast Equilibrium of RTWI
* Assumes the real interest rate differential remains the same**December 2014 and March 2015 observations are estimates.Source: RBA
Index Index
Model 'equilibrium'*
Observed RTWI**

1
INTERNATIONAL DEPARTMENT MONTHLY REVIEW JANUARY 2015
12

15
Australian Dollar
Notwithstanding the recent depreciation, Market
Analysis’ baseline model of the Australian dollar
real trade-weighted index (RTWI) – which is
based on a quarter-average measure of the
exchange rate – estimates that the Australian
dollar was 6 per cent higher than the level
justified by its medium-term determinants in the
December quarter. The current level of the RTWI
is around 2 per cent below its December quarter
average.
60
100
140
60
100
140
1985 1989 1993 1997 2001 2005 2009 2013
'Equilibrium' Real TWIPost-float average real TWI = 100
index index
Observed realTWI
'Equilibrium' term(+/- 1 std. dev. of historical
deviations)*
* Average squared deviation of observed RTWI from model implied equilibrium. This is a standardised measure of the equilibrium's in-sample fit.
Source: RBA

16
International Department 20 January 2015
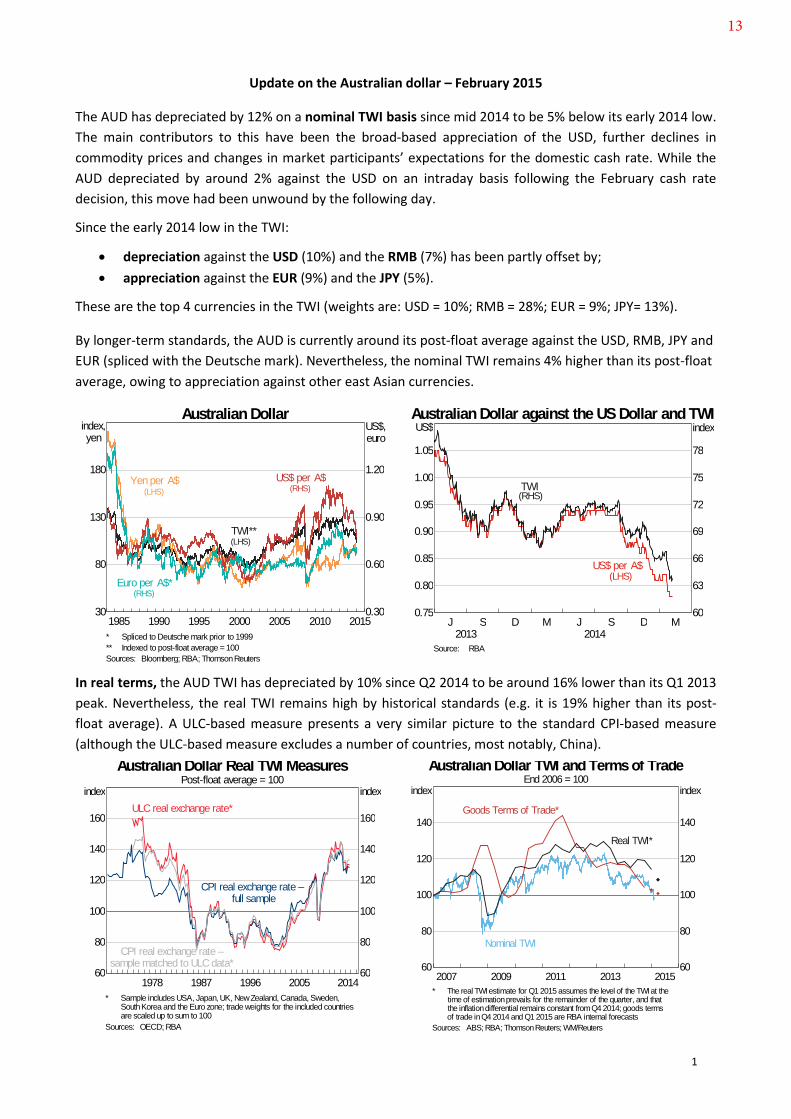
Update on the Australian dollar – February 2015
The AUD has depreciated by 12% on a nominal TWI basis since mid 2014 to be 5% below its early 2014 low. The main contributors to this have been the broad-based appreciation of the USD, further declines in commodity prices and changes in market participants’ expectations for the domestic cash rate. While the AUD depreciated by around 2% against the USD on an intraday basis following the February cash rate decision, this move had been unwound by the following day.
Since the early 2014 low in the TWI:
• depreciation against the USD (10%) and the RMB (7%) has been partly offset by;• appreciation against the EUR (9%) and the JPY (5%).
These are the top 4 currencies in the TWI (weights are: USD = 10%; RMB = 28%; EUR = 9%; JPY= 13%).
By longer-term standards, the AUD is currently around its post-float average against the USD, RMB, JPY and EUR (spliced with the Deutsche mark). Nevertheless, the nominal TWI remains 4% higher than its post-float average, owing to appreciation against other east Asian currencies.
In real terms, the AUD TWI has depreciated by 10% since Q2 2014 to be around 16% lower than its Q1 2013 peak. Nevertheless, the real TWI remains high by historical standards (e.g. it is 19% higher than its post-float average). A ULC-based measure presents a very similar picture to the standard CPI-based measure (although the ULC-based measure excludes a number of countries, most notably, China).
201020052000199519901985 201530
80
130
180
index,yen
0.30
0.60
0.90
1.20
US$,euro
Australian Dollar
(RHS)Yen per A$ US$ per A$
(RHS)
(LHS)
TWI**(LHS)
Euro per A$*
* Spliced to Deutsche mark prior to 1999** Indexed to post-float average =100Sources: Bloomberg; RBA; ThomsonReuters
M MJ JS SD D20142013
0.75
0.80
0.85
0.90
0.95
1.00
1.05
US$
60
63
66
69
72
75
78
indexAustralian Dollar against the US Dollar and TWI
TWI
US$ per A$(LHS)
(RHS)
Source: RBA
2005199619871978 201460
80
100
120
140
160
index
60
80
100
120
140
160
index
Australian Dollar Real TWI MeasuresPost-float average = 100
ULC real exchange rate*
CPI real exchange rate –full sample
CPI real exchange rate –sample matched to ULC data*
* Sample includes USA, Japan, UK, NewZealand, Canada, Sweden,SouthKorea and the Euro zone; trade weights for the included countriesare scaled up to sum to 100
Sources: OECD; RBA
2013201120092007 201560
80
100
120
140
index
60
80
100
120
140
index
Australian Dollar TWI and Terms of TradeEnd 2006 = 100
Real TWI*
Goods Terms of Trade*
Nominal TWI
* The real TWIestimate for Q1 2015 assumes the level of the TWIat thetime of estimationprevails for the remainder of the quarter, and thatthe inflationdifferential remains constant fromQ4 2014; goods termsof trade inQ4 2014 and Q1 2015 are RBA internal forecasts
Sources: ABS; RBA; ThomsonReuters; WM/Reuters
1
13

Based on data available for Q1 2015 to date and internal forecasts:
• Since the end of 2006: the (goods) ToT is estimated to have increased by around 1%, while the real TWI has appreciated by around 8% (though the nominal TWI has depreciated by 2%);
• Since the end of 2013: the (goods) ToT is estimated to have decreased by around 14%, while the real TWI is estimated to have depreciated by around 6%.
ID’s baseline model of the (CPI-deflated) real TWI is estimated from Q1 1986 to Q4 2014, and is based on its medium-term relationship with Australia’s goods ToT (coefficient is 0.61) and the real policy rate differential with the G3 (plus some short-run variables). The model suggests that, in quarter-average terms, the real TWI:
• was 5% above the level consistent with its medium-term determinants in Q4 2014, and;
• is a little less than 2% above the level consistent with its medium-term determinants in Q1 2015 to date, based on partial data and internal forecasts for the ToT.
In both quarters, the estimated ‘overvaluation’ is within 1 standard deviation of the model’s historical deviations. Even though the current value of the AUD appears to be largely ‘explained’ by the baseline model, it could still be considered to be ‘overvalued’ to the extent that it is judged to be too high to achieve desired domestic economic outcomes. It should also be noted that these estimates are sensitive to the estimation period (Table 1, has more detail on estimations from 1974 and 2003). This underscores the imprecise nature of exchange rate modelling.
External assessments typically suggest that the AUD remains somewhat overvalued (Table 1).
According to a Bloomberg survey of foreign exchange market analysts, the median forecast (as at 9 February) is for the AUD/USD exchange rate to be around US$0.77 by the end of 2015. However, the range of forecasts is fairly wide (US$0.68-US$0.92). According to Consensus, the median forecast range for the AUD/USD exchange rate is US$0.71-US$0.78 in January 2016 (as at 12 January 2015).
Table 1: Models of the Australian Dollar – Summary Estimated exchange rate valuation
RBA Models (Real TWI) – December Quarter 2014 Under/over-valuation
Per cent deviation
Standard deviations
Base, from 1974 Under 1 0.0 Base, from 1986 (preferred base model) Over 5 0.7 Base, from 2003 Over 7 0.9 Forward-looking terms of trade, from 2003 Under 1 0.3 Selected External Assessments Big Mac Index (PPP Measure; against the US$; January 2015) - 10 - JP Morgan (Real TWI; January 2015) Over 13 - Goldman Sachs (Nominal TWI; January 2015) Over 8 - Market Analysis/International Department/10 February 2015
20092004199919941989 201460
100
140
index
60
100
140
index
‘Equilibrium’ Real TWIPost-float average real TWI = 100
‘Equilibrium’ term
Observed real TWI
(+/- 1 std. dev. of historical deviations)*
* Average squared deviationof observed RTWI frommodel impliedequilibrium; this is a standardised measure of the equilibrium'sin-sample fit
Source: RBA
2

DRAFT- Central Bank Holdings of Australian Dollars
Of the 75 central banks investigated in this note, the following was ascertained regarding AUD holdings in foreign currency reserves:
• 24 central banks have publicly reported that they hold AUD (Table 1). However, thisinformation is typically based on Annual Report data – in most cases, for 2013 – so anyrecent changes in reserve composition will not be reflected.- 13 reported the actual share or benchmark weight of AUD in their reserve holdings,
which ranged from 0.2 to 10.0 per cent. - The remaining 11 explicitly included AUD within an “other currencies” category, or
otherwise acknowledged that AUD are held in reserves. • 15 central banks appear to hold AUD, even though they have not reported this officially
(Table 2). These include central banks that have been reported by the media to haveinvested in AUD and those that report a sizeable “other currencies” category but do notspecify which currencies are included.
• 14 central banks (including the Fed, ECB, BoJ and Bank of Canada) do not hold AUD (Table 3).These central banks have either provided the full composition of their foreign currencyreserves or made statements regarding which foreign currencies were included in theirreserves, with no reference to the AUD.
• For the remaining 22 central banks, we have been unable to uncover sufficient informationon the currency composition of the reserves (Table 4).
Notable changes
Table 1: Central Banks Holding AUD Region Country Date AUD Holdings Asia Hong Kong end 2012 Reference to AUD in reserves Asia Philippines end 2013 3.2 per cent of reserves Europe Czech Republic end 2013 Reference to AUD in reserves Europe Estonia end 2013 Reference to AUD in reserves Europe Finland end 2013 0.2 per cent of reserves Europe Georgia end 2013 Reference to AUD in reserves Europe Germany end 2013 Reference to AUD in reserves Europe Iceland end 2013 0.2 per cent of reserves
* Europe Italy end 2012 1.2b EUR Europe Macedonia 2013 average 10.2 per cent of reserves Europe Netherlands end 2013 Reference to AUD in reserves
* Europe Norway end 2013 Reference to AUD in reserves Europe Poland end 2013 Benchmark weight 10 per cent of reserves Europe Russia beg 2014 1.1 per cent of reserves Europe Slovenia 2014 Reference to AUD in reserves Europe Switzerland end 2013 Reference to AUD in reserves Europe Sweden end 2013 Approx 4.5 per cent of reserves
* Europe Ukraine 2014 Reference to AUD for intervention purposes
14

Latin America Brazil end 2012 3 per cent of reserves Latin America Colombia Jun-13 4 per cent of reserves Latin America Chile end 2013 5.9 per cent of reserves Other Israel end 2013 0.8 per cent of reserves Other Kazakhstan Oct-2012 3 per cent of reserves* Other Kyrgyz Republic end 2013 Reference to AUD in reserves
*Countries with no or unknown holdings of AUD in 2012
Table 2: Central Banks Possibly Holding AUD Region Country Evidence Asia China Asia Indonesia Asia India Asia Korea Asia Malaysia Large "other currencies" category Asia Singapore Large "other currencies" category Asia Thailand According to media reports Europe Romania Large "other currencies" category Latin America Argentina Holds 1.3 per cent in "other" currencies
* Latin America Costa Rica Reserves in Asia-Pacific Latin America Peru Large "other currencies" category Other Lithuania Holds "other" currencies
* Other Moldova Holds "other" currencies * Other Tunisia Holds "other" currencies - although only 0.05%
Other South Africa In 2013 CB mentioned diversifying into AUD *Countries with no or unknown holdings of AUD in 2012
Table 3: Central Banks Not Holding AUD Region Country Major Canada Major Euro area Major Japan Major United States Europe Austria Europe Bulgaria Europe Croatia Europe Denmark Europe Hungary Europe Ireland Europe Latvia Other Armenia Other El Salvador Other Morocco

Table 4: Central Banks with Unknown Foreign Currency Holdings Region Country Major United Kingdom Asia Vietnam Asia Taiwan Asia New Zealand Europe Belarus Europe Belgium Europe Cyprus Europe France Europe Greece Europe Portugal Europe Spain Europe Turkey Europe Uruguay Europe Luxembourg Latin America Mexico Other Egypt Other Ecuador Other Jordan Other Malta Other Nigeria Other Slovak Republic Other Venezuela
Related Documents