Two‐Way Immersion / Bilingual Students Performance Overview 2004‐2011 October, 2011 Berkeley Evaluation and Assessment (BEA)

Welcome message from author
This document is posted to help you gain knowledge. Please leave a comment to let me know what you think about it! Share it to your friends and learn new things together.
Transcript
Two‐Way Immersion / Bilingual Students Performance Overview
2004‐2011
October, 2011 Berkeley Evaluation and Assessment (BEA)
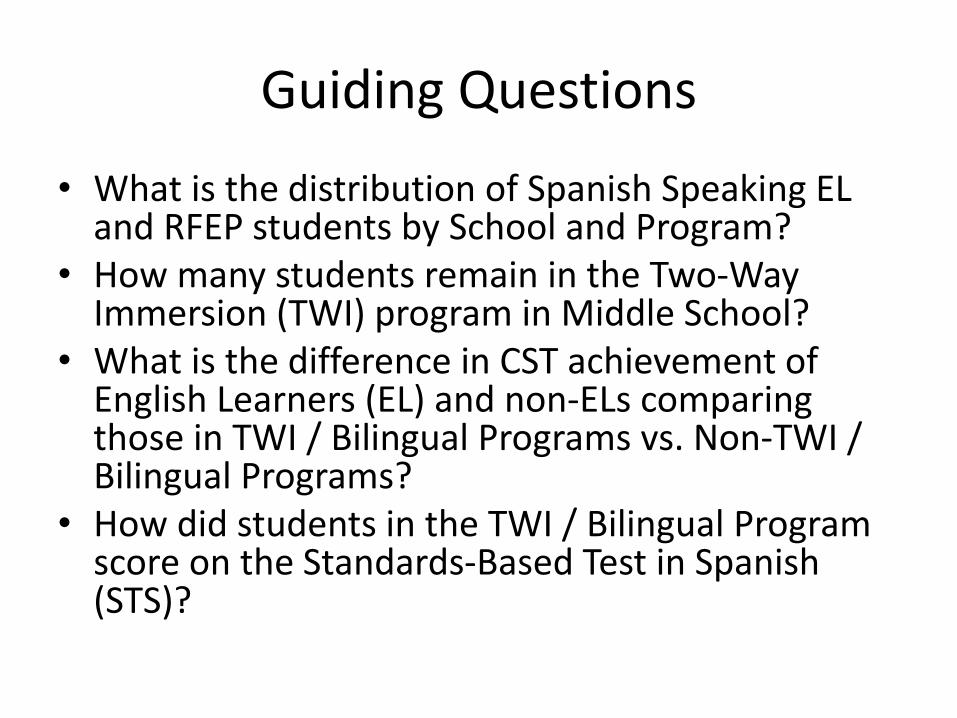
Guiding Questions • What is the distribution of Spanish Speaking EL and RFEP students by School and Program?
• How many students remain in the Two‐Way Immersion (TWI) program in Middle School?
• What is the difference in CST achievement of English Learners (EL) and non‐ELs comparing those in TWI / Bilingual Programs vs. Non‐TWI / Bilingual Programs?
• How did students in the TWI / Bilingual Program score on the Standards‐Based Test in Spanish (STS)?
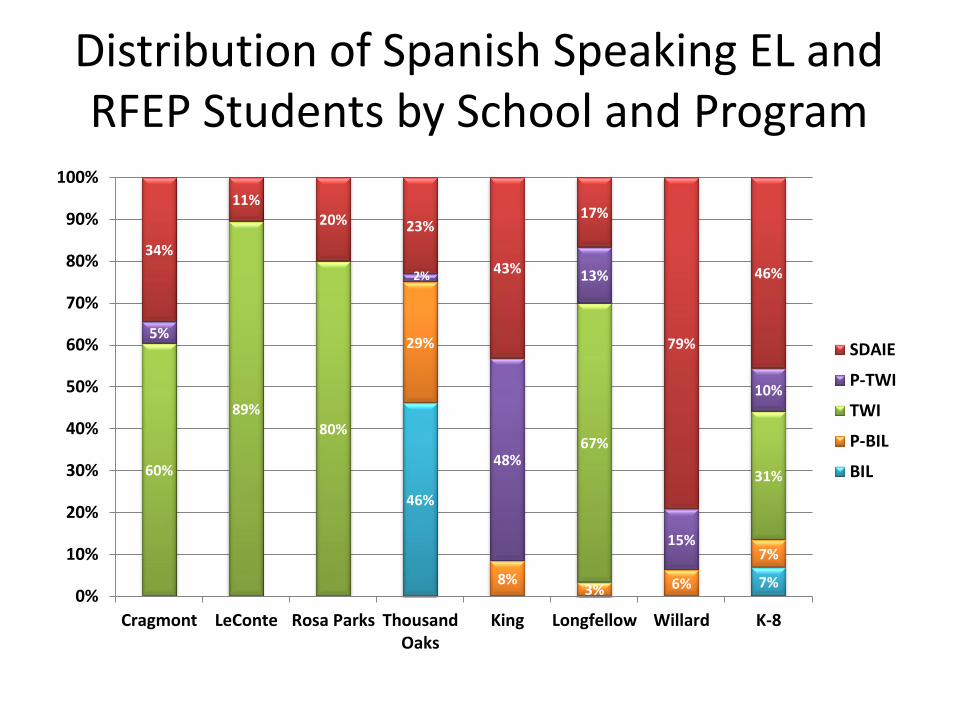
Distribution of Spanish Speaking EL and RFEP Students by School and Program
46%
7%
29%
8% 3% 6%
7%
60%
89% 80%
67%
31%
5%
2%
48%
13%
15%
10%
34%
11% 20% 23%
43%
17%
79%
46%
0%
10%
20%
30%
40%
50%
60%
70%
80%
90%
100%
Cragmont LeConte Rosa Parks ThousandOaks
King Longfellow Willard K‐8
SDAIE
P‐TWI
TWI
P‐BIL
BIL

TWI/BIL Program Participation 04‐05 to 10‐11
Grade in 04‐05 00 01 02 Total Cragmont Elementary 18 20 18 56 LeConte Elementary 20 19 19 58 Rosa Parks Elementary 20 17 19 56 Thousand Oaks Elementary* 21 19 18 58 Total 79 75 74 228
Elementary Level
Middle Level
TWI to Longfellow Non‐TWI Left BUSD
Grade in 10‐11 05* 06 07 08 Total Cragmont 12 12 7 31 LeConte 11 11 10 32 Rosa Parks 1 8 10 4 23 Thousand Oaks 7 3 10 Total 1 38 36 21 96
Grade in 10‐11 05* 06 07 08 Total Cragmont 4 4 1 9 LeConte 1 1 3 6 11 Rosa Parks 6 7 9 22 Thousand Oaks 1 6 12 14 33 Total 2 17 26 30 75
Grade in 10‐11 06 07 08 Total Cragmont 2 4 10 16 LeConte 7 5 3 15 Rosa Parks 5 0 6 11 Thousand Oaks 7 4 4 15 Total 21 13 23 57
* Bilingual, Gr. K‐3
* Retained in Grade 5

TWI/BIL Program Participation Summary 04‐05 to 10‐11
Grade in 04‐05 06 07 08 Total
Elem ‐ MS n % n % n % n %
TWI/BIL ‐ TWI 38 48% 36 48% 21 28% 96 42%
TWI/BIL – Non TWI 17 22% 26 35% 30 41% 75 33%
TWI/BIL – Left BUSD 21 27% 13 17% 23 31% 57 25%
42% of the Elementary TWI/BIL students continue with the MS TWI program.
33% of the Elementary TWI/BIL students move to an non TWI program in BUSD.
25% of the Elementary TWI/BIL students left BUSD.
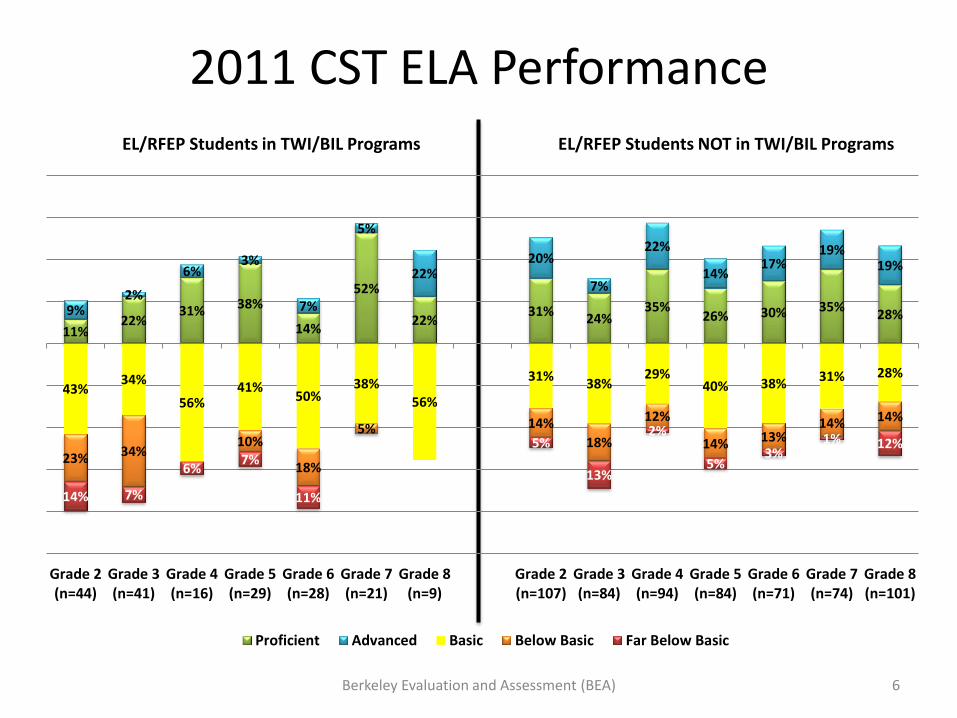
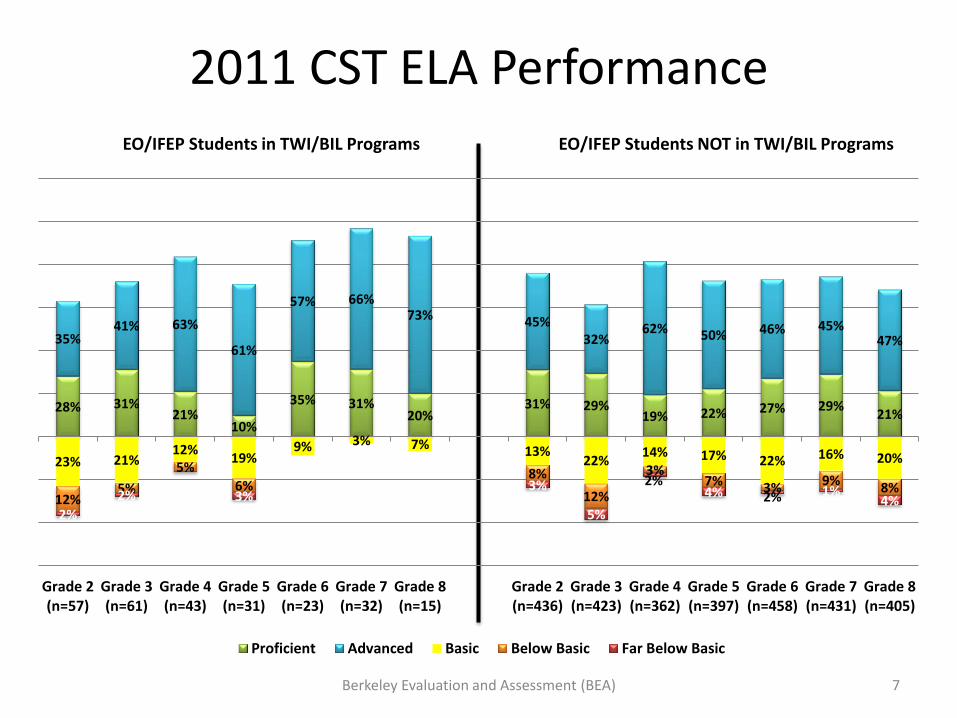
2011 CST ELA Performance
Berkeley Evaluation and Assessment (BEA) 6
EL/RFEP Students in TWI/BIL Programs EL/RFEP Students NOT in TWI/BIL Programs
11% 22%
31% 38%
14%
52%
22% 31% 24% 35%
26% 30% 35% 28% 9% 2%
6% 3%
7%
5%
22% 20%
7%
22%
14% 17%
19% 19%
43% 34%
56% 41% 50%
38% 56%
31% 38% 29%
40% 38% 31% 28%
23% 34% 10%
18%
5% 14% 18%
12%
14% 13% 14% 14%
14% 7%
6% 7%
11%
5%
13%
2%
5% 3%
1% 12%
Grade 2(n=44)
Grade 3(n=41)
Grade 4(n=16)
Grade 5(n=29)
Grade 6(n=28)
Grade 7(n=21)
Grade 8(n=9)
Grade 2(n=107)
Grade 3(n=84)
Grade 4(n=94)
Grade 5(n=84)
Grade 6(n=71)
Grade 7(n=74)
Grade 8(n=101)
Proficient Advanced Basic Below Basic Far Below Basic
2011 CST ELA Performance
Berkeley Evaluation and Assessment (BEA) 7
EO/IFEP Students in TWI/BIL Programs EO/IFEP Students NOT in TWI/BIL Programs
28% 31% 21%
10%
35% 31% 20%
31% 29% 19% 22% 27% 29% 21%
35% 41% 63%
61%
57% 66% 73% 45%
32% 62% 50% 46% 45%
47%
23% 21% 12% 19%
9% 3% 7% 13% 22% 14% 17% 22% 16% 20%
12% 5%
5% 6%
8% 12%
3% 7% 3% 9% 8%
2% 2% 3%
3%
5%
2% 4% 2% 1%
4%
Grade 2(n=57)
Grade 3(n=61)
Grade 4(n=43)
Grade 5(n=31)
Grade 6(n=23)
Grade 7(n=32)
Grade 8(n=15)
Grade 2(n=436)
Grade 3(n=423)
Grade 4(n=362)
Grade 5(n=397)
Grade 6(n=458)
Grade 7(n=431)
Grade 8(n=405)
Proficient Advanced Basic Below Basic Far Below Basic

2011 CST ELA Performance Summary Grade 2‐8
Berkeley Evaluation and Assessment (BEA) 8
25% 30% 26% 26%
6% 17%
52% 47%
43% 33%
16% 18%
18%
14%
5% 7%
8%
6%
1% 3%
EL and RFEP inTWI/BIL (n=188)
EL and RFEP NOT inTWI/BIL (n=615)
EO and IFEP inTWI/BIL (n=262)
EO and IFEP NOT inTWI/BIL (n=2912)
Far Below Basic
Below Basic
Basic
Advanced
Proficient
Berkeley Evaluation and Assessment
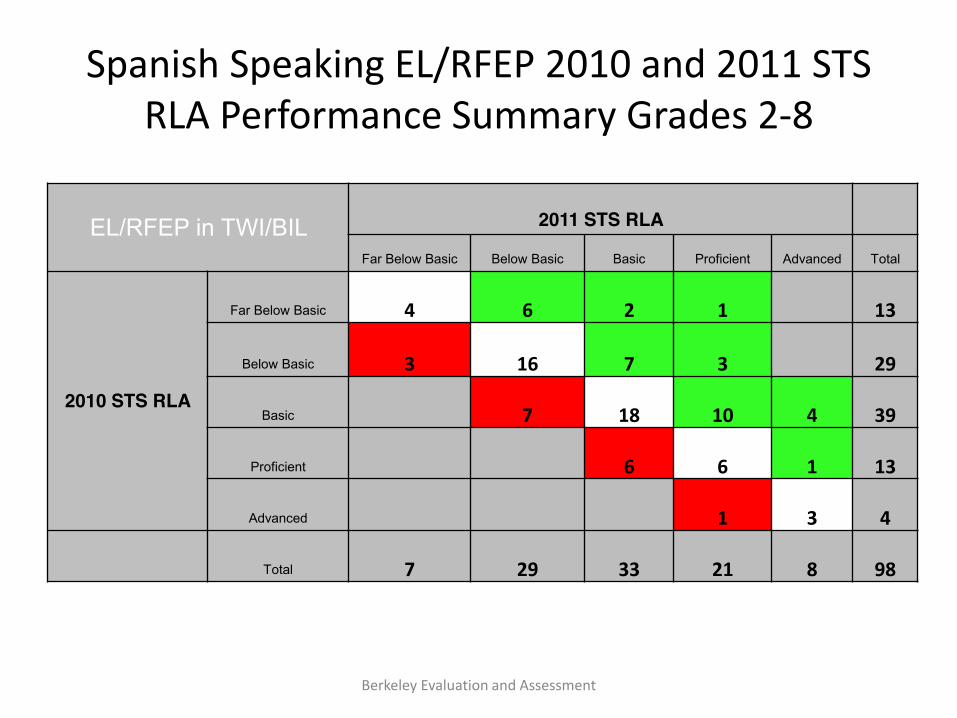
Spanish Speaking EL/RFEP 2010 and 2011 STS RLA Performance Summary Grades 2‐8
EL/RFEP in TWI/BIL 2011 STS RLA
Far Below Basic Below Basic Basic Proficient Advanced Total
2010 STS RLA
Far Below Basic 4 6 2 1 13
Below Basic 3 16 7 3 29
Basic 7 18 10 4 39
Proficient 6 6 1 13
Advanced 1 3 4
Total 7 29 33 21 8 98

FOLLOW UP SLIDES
Based on Questions from 10/18/11

2011 CST ELA Performance Spanish Speaking EL Students
Berkeley Evaluation and Assessment (BEA) 11
EL Students in TWI Spanish Speaking EL Students NOT in TWI
6% 15% 27%
41%
5%
42% 31% 25%
36% 27% 29% 27%
15% 6% 4%
7% 11%
3%
10% 9% 3% 4%
45% 37%
60% 41%
59% 50%
100%
33% 35% 36% 42% 46% 38% 33%
29% 37% 11%
23%
8% 20% 20% 16%
18% 17% 27% 24%
13% 7%
7% 7%
14%
4% 18%
2% 4% 6% 4% 27%
Grade 2(n=31)
Grade 3(n=27)
Grade 4(n=15)
Grade 5(n=27)
Grade 6(n=22)
Grade 7(n=12)
Grade 8(n=3)
Grade 2(n=45)
Grade 3(n=40)
Grade 4(n=50)
Grade 5(n=45)
Grade 6(n=35)
Grade 7(n=26)
Grade 8(n=33)
Proficient Advanced Basic Below Basic Far Below Basic

Berkeley Evaluation and Assessment (BEA) 12
2011 CST ELA Performance Spanish Speaking RFEP Students
55% 40%
25%
14%
20% 29%
9% 8%
RFEP in TWI Grade 2‐8 (n=20) RFEP not in TWI Grade 2‐8 (n=185)
Far Below Basic
Below Basic
Basic
Advanced
Proficient
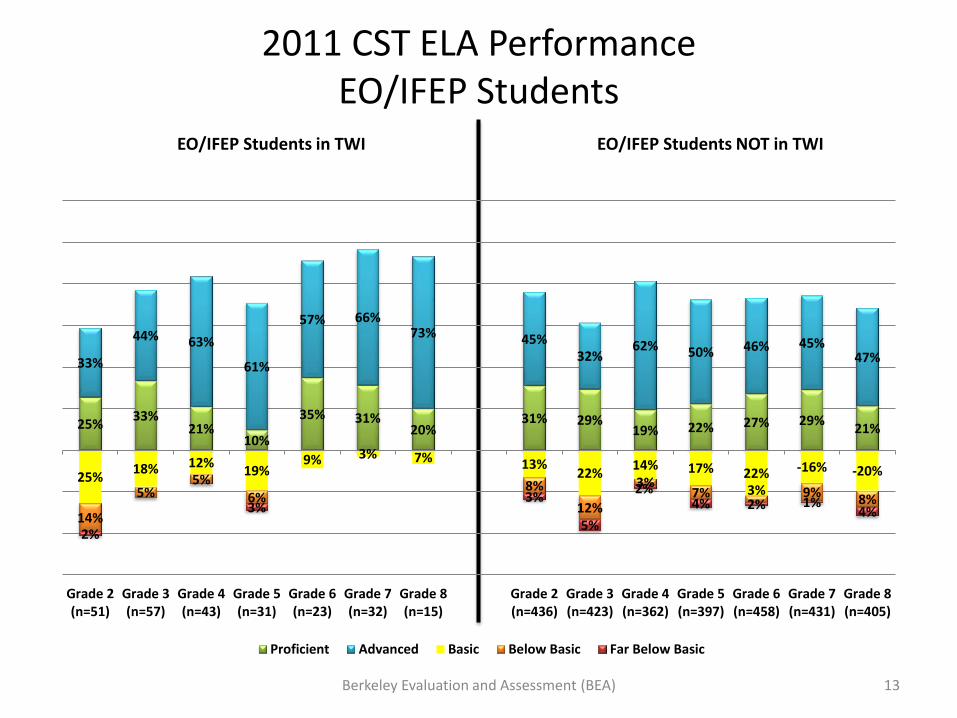
2011 CST ELA Performance EO/IFEP Students
Berkeley Evaluation and Assessment (BEA) 13
EO/IFEP Students in TWI EO/IFEP Students NOT in TWI
25% 33% 21%
10%
35% 31% 20%
31% 29% 19% 22% 27% 29% 21%
33%
44% 63%
61%
57% 66% 73% 45%
32% 62% 50% 46% 45%
47%
25% 18% 12% 19% 9% 3% 7% 13% 22% 14% 17% 22% ‐16% ‐20%
14%
5% 5%
6% 8%
12%
3% 7% 3% 9% 8%
2%
3% 3%
5%
2% 4% 2% 1%
4%
Grade 2(n=51)
Grade 3(n=57)
Grade 4(n=43)
Grade 5(n=31)
Grade 6(n=23)
Grade 7(n=32)
Grade 8(n=15)
Grade 2(n=436)
Grade 3(n=423)
Grade 4(n=362)
Grade 5(n=397)
Grade 6(n=458)
Grade 7(n=431)
Grade 8(n=405)
Proficient Advanced Basic Below Basic Far Below Basic
Related Documents