IZA DP No. 1553 The Labour Market Characteristics and Labour Market Impacts of Immigrants in Ireland Alan Barrett Adele Bergin David Duffy DISCUSSION PAPER SERIES Forschungsinstitut zur Zukunft der Arbeit Institute for the Study of Labor April 2005

Welcome message from author
This document is posted to help you gain knowledge. Please leave a comment to let me know what you think about it! Share it to your friends and learn new things together.
Transcript

IZA DP No. 1553
The Labour Market Characteristics andLabour Market Impacts of Immigrantsin Ireland
Alan BarrettAdele BerginDavid Duffy
DI
SC
US
SI
ON
PA
PE
R S
ER
IE
S
Forschungsinstitutzur Zukunft der ArbeitInstitute for the Studyof Labor
April 2005

The Labour Market Characteristics and Labour Market Impacts of Immigrants
in Ireland
Alan Barrett Economic and Social Research Institute, Dublin
and IZA Bonn
Adele Bergin Economic and Social Research Institute, Dublin
David Duffy
Economic and Social Research Institute, Dublin
Discussion Paper No. 1553 April 2005
IZA
P.O. Box 7240 53072 Bonn
Germany
Phone: +49-228-3894-0 Fax: +49-228-3894-180
Email: [email protected]
Any opinions expressed here are those of the author(s) and not those of the institute. Research disseminated by IZA may include views on policy, but the institute itself takes no institutional policy positions. The Institute for the Study of Labor (IZA) in Bonn is a local and virtual international research center and a place of communication between science, politics and business. IZA is an independent nonprofit company supported by Deutsche Post World Net. The center is associated with the University of Bonn and offers a stimulating research environment through its research networks, research support, and visitors and doctoral programs. IZA engages in (i) original and internationally competitive research in all fields of labor economics, (ii) development of policy concepts, and (iii) dissemination of research results and concepts to the interested public. IZA Discussion Papers often represent preliminary work and are circulated to encourage discussion. Citation of such a paper should account for its provisional character. A revised version may be available directly from the author.

IZA Discussion Paper No. 1553 April 2005
ABSTRACT
The Labour Market Characteristics and Labour Market Impacts of Immigrants in Ireland
The purpose of this paper is two-fold. We firstly produce a labour market profile of non-Irish immigrants who arrived in Ireland in the ten years to 2003. We then go on to use the labour market profile in estimating the impact of immigration (non-Irish) on the Irish labour market. Immigrants are shown to be a highly educated group. However, they are not all employed in occupations that fully reflect their education levels. The model of the labour market that we use to simulate the impact of immigration differentiates between low-skilled and high-skilled labour. This allows us to estimate the impact of immigrants (a) if they were employed at a level fitting their education and (b) if they were employed in occupations below their educational level. Our results show that under scenario (a) immigrants who arrived between 1993 and 2003 increased GNP by between 3.5 and 3.7%, largely by lowering skilled wages by around 6% and increasing Ireland’s competitiveness. Under scenario (b), the increase in GNP is reduced to 3% because the impact on skilled wages is lower. If we assume the immigration is primarily unskilled, the impact on earnings inequality is reversed. JEL Classification: J24, J31, J61 Keywords: immigrants, immigrant characteristics, immigrant impacts, Ireland Corresponding author: Alan Barrett Economic and Social Research Institute 4, Burlington Road Dublin 4 Ireland Email: [email protected]
Section 1: Introduction
The purpose of this paper is two-fold. We firstly produce a labour market profile of
non-Irish immigrants (as opposed to returning Irish migrants) who arrived in Ireland
in the ten years to 2003. In taking this period, we are essentially looking at
immigrants who arrived in Ireland in response to the economic growth of the “Celtic
Tiger” era. We then go on to use the labour market profile in estimating the impact of
immigration on the Irish labour market. This is done by running simulations in a
structural model of the Irish labour model. In particular, we look at the impact on
high-skilled and low-skilled wages and also at the impact on GNP and GNP per head.
As Ireland has only begun to experience large-scale immigration in the last decade, it
is clearly important that the nature and consequences of this phenomenon be analysed
and understood. From a broader international perspective, Ireland’s experience raises
important questions for economic research on the impact of immigration and also for
policy. As will be seen below, immigrants into Ireland have notably higher levels of
education relative to the domestic population. This in itself makes the Irish experience
of interest. However, immigrants in Ireland are not employed in occupations that fully
reflect their educational attainment. For this reason, in estimating labour market
impacts this “occupational gap” must be taken into account. In addition, policy with
regard to immigrants must address the issue of how to reduce the “occupational gap”
if the potential contribution of immigrants is to be maximised.
In an earlier paper, Barrett et al (2002) looked at the labour market impacts of all
immigration into Ireland in the mid-1990s (i.e. both non-Irish immigration and
returning Irish migrants). They used the educational levels of immigrants in
estimating impacts and so did not attempt to capture the possibility of immigrants
being employed in occupations below what their educations might suggest. As
immigration into Ireland at the time was made up primarily of returning Irish migrants
and other English speakers who were less likely to suffer any occupational
disadvantage, this approach was appropriate. But with an increase in non-Irish and
non-English speaking immigration into this decade, it is now important to take
account of the occupation issue.
1
The paper is structured in the following way. In Section 2, we begin by describing the
data that we use to develop the profile of the labour market characteristics of
immigrants in Ireland; we then present the profile. The core findings are that
immigrants in Ireland are highly educated relative to the native population but that
their occupational distribution does not fully reflect their educational attainment. In
Section 3, we take these findings and use them in estimating the impact of
immigration on variables such as output, earnings and unemployment. We conduct
the estimation through a simulation exercise using a model of the labour market. This
approach, used by Barrett et al (2002), follows Borjas, Freeman and Katz (1997). In
Section 4, we offer some policy conclusions based on the results.
Section 2: Data and Labour Market Profile
The data used to develop the labour market profile of immigrants in Ireland is the
Quarterly National Household Survey (quarter 2 of 2003). The survey is undertaken
by the Central Statistics Office and its main purpose is to produce quarterly labour
force estimates. Throughout the year 3,000 households are surveyed each week; hence
each quarterly sample contains 39,000 households. The CSO make the micro-data
available, although some of the collected data is omitted or aggregated. The sample
we use has 101,500 observations. We only look at the adult population (i.e. over the
age of 15) as our interest is in labour market characteristics. This still leaves a sample
of over 75,000.
Our next task is to set out precisely how we define “immigrants” and the groups of
“natives” against which we will compare them. We define immigrants in the
following way: people who describe their nationality as being other than Irish, were
not born in Ireland and have lived here for under 10 years. This residency restriction
is imposed by the data because individuals who were not born in Ireland are classified
as either being resident for more than ten years or less. While a more disaggregated
classification would have been useful, the “under ten year” category results in the
analysis being focused on immigrants who arrived after the emergence of Ireland’s
economic surge1. We compare this group with people who describe themselves as
1 It should be noted that the immigrants now resident in Ireland are more likely to have arrived in the last five years rather than being evenly distributed over the ten-year period. Between 1993 and 1999, net inflows averaged around 8,000 per annum; between 2000 and 2004 this figure was over 32,000.

2
Irish nationals and who say they were born here. This means we omit Irish nationals
who were born outside of Ireland. These selections produce two sub-populations –
71,995 natives and 3,530 immigrants.
We present the profile in the following way. We begin with the basic demographic
characteristics of age and gender. We then go on to look at the characteristics that will
feed into our simulation analysis in Section 3, namely, participation, education and
occupation. We then look at some additional characteristics that are of interest in
developing an overall labour market profile of immigrants – these include the sectoral
distribution of immigrants and a breakdown of education and occupation along gender
lines2.
Age and Gender
We now turn to developing the labour market profile of immigrants. We begin by
looking at the demographic variables age and gender as these are likely to impact
upon rates of labour force participation. In Table 1, we show the age distribution of
natives and immigrants, with the immigrant group subdivided into four categories, as
provided by the CSO in the data file.3 The picture that emerges is of an immigrant
population that is young relative to the native population. While 44.2 percent of the
native adult population is aged between 20 and 44, the corresponding figure for the
immigrant population is 81.5 percent. While this age distribution will impact
positively on rates of participation, it is also of interest in the context of Ireland’s
aging population since a younger inflow will offset aging.
Table 1: Age Distribution of the Native and Immigrant Populations (%s)
Irish UK
Rest of
EU-15 American Other
Total immigrant
Age Group 15-19 10.7 7.4 4.4 4.8 5.7 6.0
20-24 10.2 7.8 28.2 18.1 24.7 20.3
2 As the QNHS does not contain data on wages, we are unable to consider this variable. While this is clearly a limitation to the dataset, its advantage in terms of capturing a large enough number of immigrants to be considered representative is the reason for its use here. 3 Generally, in order for non-EEA citizens to work in Ireland they need a work permit. Based on the data arising from the issuing of such permits, the “other” category would include people from the following countries, amongst others, ranked according to the number of work permits issued between 1999 and 2003: Latvia, Lithuania, Philippines, Poland, South Africa, Romania, Ukraine, Czech Republic, Russia, Australia, Malaysia and Brazil. (Ruhs, 2003)

3
25-34 16.5 27.3 46.2 25.7 45.4 39.9
35-44 17.5 29.2 15.1 31.4 18.4 21.3
45-54 16.9 12.5 3.6 8.6 4.7 6.8
55-59 7.2 6.3 1.1 2.9 0.6 2.3
60-64 5.6 3.8 0.9 3.8 0.4 1.5
65+ 15.4 5.7 0.5 4.8 0.2 1.9
Total 100.0 100.0 100.0 100.0 100.0 100.0
N 71995 992 563 105 1868 3528
In Table 2, we look at the gender distribution. There is little difference between
natives and immigrants, or across the immigrant categories, with the immigrant
population having almost the same proportion of males as the native group.
Table 2: Gender Distribution of the Native and Immigrant Populations (%s) Irish UK Rest of EU-15 American Other Total immigrant
Male 49.0 50.9 47.1 48.6 52.7 51.2
Female 51.0 49.1 52.9 51.4 47.3 48.8
Total 100 100 100 100 100 100
N 71995 992 563 105 1868 3528
Participation, Education and Occupation
We now turn our attention to the variables that will feed into the simulation exercises
in Section 3 and ask what proportions of the native and immigrant populations are
employed, unemployed and non-participants. Table 3 shows the distribution of
immigrants and natives across ILO categories. The figures shown imply a labour
force participation rate of 63.2 percent for immigrants as against 58.1 percent for the
native population. It is likely that this difference is partly explained by the age
differences across the two groups.
The unemployment rates in Table 3 are 6.8 percent for immigrants and 4.2 percent for
natives and so in relative terms, there is a substantial divergence. This observation of
higher unemployment among immigrants is not unusual (Frijters et al 2003).
Generally, possible explanations would include a lack of local labour market
information that reduces job search efficiency and a lack of informal local contacts.
However, the higher unemployment rates amongst UK and US immigrants relative to

4
the “rest of the EU-15” do not fit well with these explanations. Many of the
immigrants in the “other” group are likely to need work permits to be in Ireland, so
the low unemployment rate among them is likely to be driven by that requirement.
We have no similar ready explanation for the UK, US/rest of EU-15 differential.
Table 3: ILO Labour Force Status Distributions of the Native and Immigrant Populations (%s)
Irish UKRest of EU-
15 American Other Total
ImmigrantIn Employment full-time 45.8 50.4 62.9 37.1 47.4 50.4In Employment part-time, not underemployed 9.8 9.0 9.2 3.8 7.9 8.3In Employment part-time, underemployed 0.1 0.0 0.2 0.0 0.2 0.1Unemployed, seeking full-time work 2.0 4.2 3.2 5.7 3.6 3.8Unemployed, seeking part-time work 0.4 1.2 0.5 0.0 0.2 0.5Marginally attached 0.4 0.3 0.5 1.9 0.5 0.5Others not economically active 41.5 34.9 23.4 51.4 40.1 36.3Total 100.0 100.0 100.0 100.0 100.0 100.0 Participation rate 58.1 64.8 76.0 46.7 59.3 63.1UE rate 4.2 8.4 4.9 12.2 6.4 6.8N 71995 992 563 105 1868 3528
Narrowing our focus to people who are labour force participants (i.e. the employed
plus the unemployed and excluding those marginally attached and not economically
active), we look at the education levels of immigrants relative to natives. It will be
recalled from the Introduction that immigrants in the mid-1990s were observed to
have had a high level of educational attainment (Barrett and Trace, 1998). While this
might have been the result of Ireland being an attractive destination for highly
educated people, it might also have been the result of an information effect, whereby
better educated people were the first to know about improving economic conditions in
Ireland. The presence of highly educated might also have been the result of the
working of the work permit system4, if permits had been restricted to high-skill
occupations. As the issuing of work permits expanded in the 2000s (from under 6,000
in 1999 to over 40,000 in 2002) and the permits during this time were mainly for
unskilled occupations (Ruhs, 2003), it would be possible that the average education
level of the immigrant population had fallen since the mid-1990s.
4 As mentioned above, work permits are required by non-EEA nationals.

5
In Table 4, we present the distribution of educational attainments and it can be readily
seen that the immigrant population in Ireland is still characterised by high educational
levels. This finding replicates that of Minns (2005) which was based on data derived
by the OECD from the 2002 Census. Over a half of immigrants (54.2 percent) have
third level qualifications, compared with just over a quarter (27.3 percent) of the
native population. At the other end of the educational distribution, while 32.9 percent
of the native population have only lower secondary qualifications or less, only 15.1
percent of the immigrant population have this low level of attainment. This means that
Ireland’s immigration experience continues to differ from that of the US where
immigration has been primarily low skilled.
Table 4: Distributions of Educational Attainment for the Native and Immigrant Populations (%s)5 Irish UK Rest of EU-15 American Other Total immigrants
No formal/ primary education 13.7 6.7 1.3 6.8 5.5
Lower secondary 19.2 19.6 2.5 4.3 5.8 9.6
Upper secondary 27.5 18.8 24.9 14.9 23.3 22.0
Post Leaving 12.3 10.5 8.1 8.3 8.8
Third level – non-degree 10.6 15.8 14.5 6.4 12.9 14.0
Third level - degree or above 16.7 28.4 48.6 74.5 42.8 40.2
Total 100.0 100.0 100.0 100.0 100.0 100.0
N 41612 626 393 47 878 1944
We can take an alternative, although less direct, look at the skills distribution across
the two populations by looking at the occupations held by both immigrants and
natives and so in Table 5 we show the occupational distributions of the different
groups. The figures on education presented in Table 4 would have led us to expect a
wider divergence in occupational distributions than we find in Table 5. While
immigrants are more heavily concentrated in professional/associate professional
occupations, this is only marginally the case. Also, immigrants are less well
represented in the management/administrator category. As the “other or not stated”
5 As we are now restricting the sample to labour force participants, cell sizes are getting smaller. For this reason, we need to be cautious in interpreting the figures within immigrant categories, especially the US category.

6
category captures the low skilled occupations, it appears that immigrants are slightly
more concentrated in this group relative to natives6.
Table 5: Occupational Distribution of Natives and Immigrants (%s) Irish UK Rest of EU-15 American Other Total ImmigrantsManagers and administrators 17.7 16.8 9.1 22.4 6.9 10.5Professional 10.5 14.5 15.2 22.4 10.7 12.9Associate professional and technical 8.7 10.9 10.7 18.4 11.6 11.4Clerical and secretarial 12.2 11.5 16.8 6.1 6.6 10.0Craft and related 13.6 13.5 5.6 0.0 10.4 10.1Personal and protective service 9.8 11.8 19.9 12.2 20.2 17.5Sales 8.2 5.9 9.3 8.2 6.4 6.9Plant and machine operatives 9.8 7.2 6.1 4.1 11.6 9.1Other (includes not stated) 9.6 7.9 7.2 6.1 15.6 11.6Total 100 100 100 100 100 100N 41831 643 428 49 1108 2228
While the education level of the immigrants should work to increase their
occupational level, the relative youth of the group (as shown in Table 1) should work
in the opposite direction. In order to isolate the effects of these variables and to
establish if there is an independent “immigrant” effect on occupational attainment, we
ran a probit model with the dependent variable equal to one if the individual’s
occupation is manager, professional or associate professional and zero otherwise. The
independent variables include age cohorts, education levels, time with the current
employer/self-employed, time since graduation and a dummy variable equal to one if
the individual is an immigrant and zero otherwise.
The results are shown in Table 6. In general, the signs and significance of the
coefficients are what would be expected. The omitted age category is 15 to 20 so the
positive coefficients on the age categories are sensible. Similarly, the omitted
education category is “no formal qualifications/primary education” so the positive
coefficients make sense. The model shows that the longer an individual is with their
current employer, the greater their probability of having a higher occupational level.
Neither marital status nor “time since graduation” are found to have significant
impacts.
6 Minns (2005) also points to this education/occupation discrepancy when comparing the education levels of immigrants from particular countries with their occupations, based on data arising from the issuing of work permits.

7
Turning to the immigrant dummy variable, the negative and significant coefficient
indicates that immigrants have lower levels of occupational attainment, controlling for
the other variables7. There are a number of possible explanations for this finding. It
could be that employers in Ireland discount educational qualifications earned outside
of Ireland and so will offer a lower occupational grade to an immigrant relative to a
similarly qualified Irish national. Alternatively, it could be the case that recently
arrived immigrants lack local labour market knowledge and so accept jobs below
those appropriate to their skill levels while they search for better jobs8. Minns (2005)
suggests that the work permit system might be responsible if high-skilled people
accept work permits for low-skilled jobs with a view to getting a foothold in the Irish
labour market.
Table 6: Probit Model of Occupational Attainment (Dependent variable: occupation is manager/professional/associate professional or otherwise) Variable Coefficient Stand. Err. Marginal Impact P>|z|
Age 20-24 0.44 0.09 0.17 0.00
Age 25-34 0.77 0.09 0.30 0.00
Age 35-44 0.91 0.10 0.35 0.00
Age 45-54 1.01 0.10 0.39 0.00
Age 55-59 1.06 0.11 0.39 0.00
Age 60-64 1.02 0.12 0.38 0.00
Age 65+ 1.51 0.13 0.50 0.00
Ed Lower secondary 0.06 0.04 0.02 0.12
Ed upper secondary 0.43 0.03 0.17 0.00
Ed post leaving 0.47 0.04 0.18 0.00
Ed third level non-degree 1.25 0.04 0.45 0.00
Ed third level degree 2.09 0.04 0.67 0.00
Time with current employ 0.04 0.00 0.02 0.00
Time since highest ed qual 0.00 0.00 0.00 0.18
Married -0.02 0.02 -0.01 0.45
Immigrant -0.18 0.05 -0.07 0.00
Constant -2.21 0.09 0.00
7 A similar observation has been made in the case of Israel which has also experienced high-skilled immigration (Eckstein and Weiss, 2004) 8 It should be recalled from footnote 3 that most of the immigrants will have arrived in the later part of the ten-year period under investigation rather than in the earlier part.

8
N 23587.00
LR chi2(16) 8240.88
Prob > chi2 0.00
Pseudo R2 0.26
In order to investigate this finding of an immigrant “occupational gap” more closely,
we re-ran the probit model but distinguished between the four groups of nationalities.
One question that can be answered using this approach is whether the work permit
system is responsible for the occupational gap. The results are presented in Table 7. It
can be seen that the occupational gap applies to both “rest of EU-15” immigrants and
to “others”. This would suggest that the work permit system is not solely responsible
since “rest of EU-15” immigrants are outside of this system. Also, the estimated gap
for “rest of EU-15” immigrants is stronger than that for “others”. The fact that UK
and US immigrants suffer no occupational disadvantage prompts a suspicion that the
occupation gap observed in Table 6 may be related to English language skills. If we
recall the findings on unemployment from Table 3, especially in the case of the rest of
EU-15, the result in Table 7 for this group may point to a greater willingness to accept
lower level jobs while searching for better jobs.
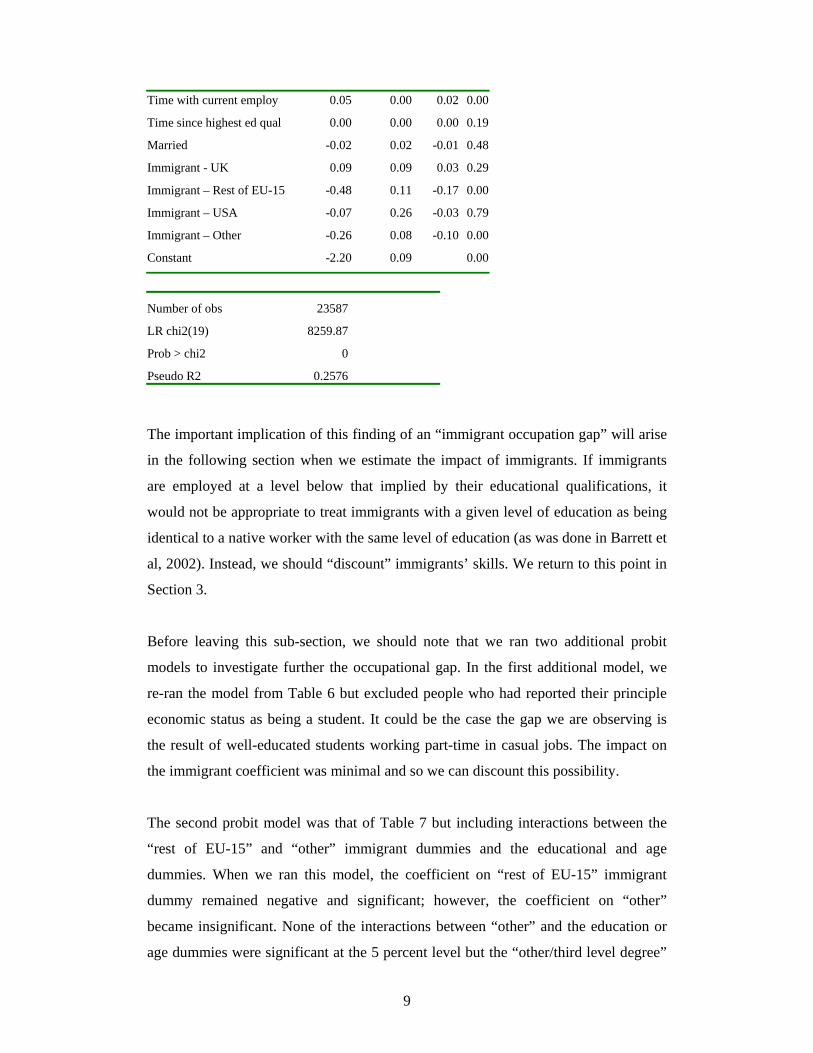
Table 7: Probit Model of Occupational Attainment, with Four Immigrant Categories (Dependent variable: occupation is manager/professional/associate professional or otherwise)
Variable Coefficient Stand. Err.
Marginal
Impact P>|z|
Age 20-24 0.44 0.09 0.17 0.00
Age 25-34 0.77 0.09 0.30 0.00
Age 35-44 0.91 0.10 0.35 0.00
Age 45-54 1.01 0.10 0.39 0.00
Age 55-59 1.05 0.11 0.39 0.00
Age 60-64 1.02 0.12 0.38 0.00
Age 65+ 1.51 0.13 0.49 0.00
Ed Lower secondary 0.06 0.04 0.02 0.14
Ed upper secondary 0.43 0.03 0.17 0.00
Ed post leaving 0.47 0.04 0.18 0.00
Ed third level non-degree 1.24 0.04 0.45 0.00
Ed third level degree 2.09 0.04 0.67 0.00
9
Time with current employ 0.05 0.00 0.02 0.00
Time since highest ed qual 0.00 0.00 0.00 0.19
Married -0.02 0.02 -0.01 0.48
Immigrant - UK 0.09 0.09 0.03 0.29
Immigrant – Rest of EU-15 -0.48 0.11 -0.17 0.00
Immigrant – USA -0.07 0.26 -0.03 0.79
Immigrant – Other -0.26 0.08 -0.10 0.00
Constant -2.20 0.09 0.00
Number of obs 23587
LR chi2(19) 8259.87
Prob > chi2 0
Pseudo R2 0.2576
The important implication of this finding of an “immigrant occupation gap” will arise
in the following section when we estimate the impact of immigrants. If immigrants
are employed at a level below that implied by their educational qualifications, it
would not be appropriate to treat immigrants with a given level of education as being
identical to a native worker with the same level of education (as was done in Barrett et
al, 2002). Instead, we should “discount” immigrants’ skills. We return to this point in
Section 3.
Before leaving this sub-section, we should note that we ran two additional probit
models to investigate further the occupational gap. In the first additional model, we
re-ran the model from Table 6 but excluded people who had reported their principle
economic status as being a student. It could be the case the gap we are observing is
the result of well-educated students working part-time in casual jobs. The impact on
the immigrant coefficient was minimal and so we can discount this possibility.
The second probit model was that of Table 7 but including interactions between the
“rest of EU-15” and “other” immigrant dummies and the educational and age
dummies. When we ran this model, the coefficient on “rest of EU-15” immigrant
dummy remained negative and significant; however, the coefficient on “other”
became insignificant. None of the interactions between “other” and the education or
age dummies were significant at the 5 percent level but the “other/third level degree”
10
coefficient had a P-value of 0.06 and a marginal impact estimate of –0.17. This
suggests that for the “other” category, the occupational gap may relate to third level
degree holders having lower occupational levels than might be expected.
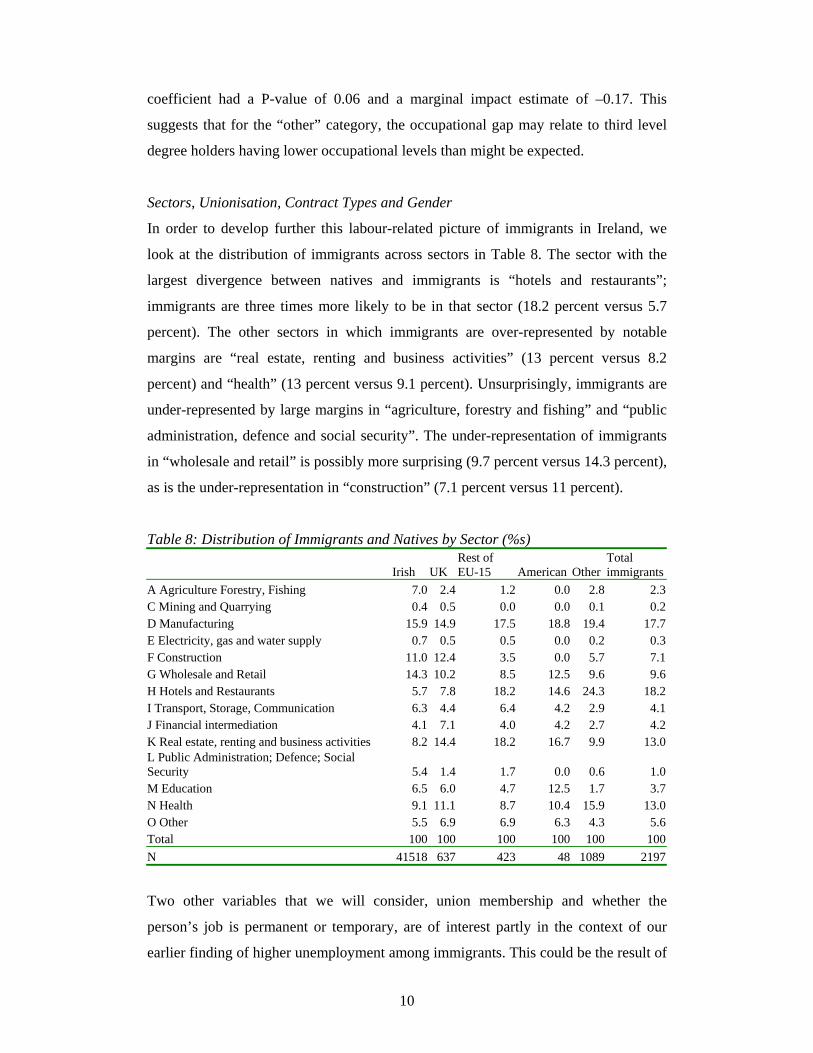
Sectors, Unionisation, Contract Types and Gender
In order to develop further this labour-related picture of immigrants in Ireland, we
look at the distribution of immigrants across sectors in Table 8. The sector with the
largest divergence between natives and immigrants is “hotels and restaurants”;
immigrants are three times more likely to be in that sector (18.2 percent versus 5.7
percent). The other sectors in which immigrants are over-represented by notable
margins are “real estate, renting and business activities” (13 percent versus 8.2
percent) and “health” (13 percent versus 9.1 percent). Unsurprisingly, immigrants are
under-represented by large margins in “agriculture, forestry and fishing” and “public
administration, defence and social security”. The under-representation of immigrants
in “wholesale and retail” is possibly more surprising (9.7 percent versus 14.3 percent),
as is the under-representation in “construction” (7.1 percent versus 11 percent).
Table 8: Distribution of Immigrants and Natives by Sector (%s)
Irish UK Rest of EU-15 American Other
Total immigrants
A Agriculture Forestry, Fishing 7.0 2.4 1.2 0.0 2.8 2.3C Mining and Quarrying 0.4 0.5 0.0 0.0 0.1 0.2D Manufacturing 15.9 14.9 17.5 18.8 19.4 17.7E Electricity, gas and water supply 0.7 0.5 0.5 0.0 0.2 0.3F Construction 11.0 12.4 3.5 0.0 5.7 7.1G Wholesale and Retail 14.3 10.2 8.5 12.5 9.6 9.6H Hotels and Restaurants 5.7 7.8 18.2 14.6 24.3 18.2I Transport, Storage, Communication 6.3 4.4 6.4 4.2 2.9 4.1J Financial intermediation 4.1 7.1 4.0 4.2 2.7 4.2K Real estate, renting and business activities 8.2 14.4 18.2 16.7 9.9 13.0L Public Administration; Defence; Social Security 5.4 1.4 1.7 0.0 0.6 1.0M Education 6.5 6.0 4.7 12.5 1.7 3.7N Health 9.1 11.1 8.7 10.4 15.9 13.0O Other 5.5 6.9 6.9 6.3 4.3 5.6Total 100 100 100 100 100 100N 41518 637 423 48 1089 2197
Two other variables that we will consider, union membership and whether the
person’s job is permanent or temporary, are of interest partly in the context of our
earlier finding of higher unemployment among immigrants. This could be the result of

11
greater insecurity in the jobs held by immigrants. Obviously, the nature of a job
contract is closely related to job security; however, union membership may also be
correlated with job security.
The proportions of immigrants and natives who are unionised are shown in Table 9
and it can be seen that immigrants are substantially less unionised. In Table 10, we
present data on the proportions of immigrants and natives reporting that their jobs are
permanent or temporary. A higher proportion of immigrants are in temporary jobs but
the percentage (5.6 percent) is small.
Table 9: Union Membership among Natives and Immigrants (%s) Irish UK Rest of EU-15 American Other Total Immigrants
Yes 40.3 22.3 8.9 12.8 11.9 14.0
No 59.7 77.7 91.1 87.2 88.1 86.0
Total 100.0 100.0 100.0 100.0 100.0 100.0
N 32220 484 381 985 39 1889
Table 10: Proportions of Immigrants and Natives with Temporary and Permanent Jobs (%s) Irish UK Rest of EU-15 American Other Total Immigrants
Permanent Job 96.2 98.1 94.9 94.1 92.2 94.4
Temporary Job 3.8 1.9 5.1 5.9 7.8 5.6
Total 100.0 100.0 100.0 100.0 100.0 100.0
N 30371 432 316 807 34 1589
The final element in this profiling exercise is to look at a number of the earlier
variables again but this time breaking them down by gender. As labour market
outcomes vary by gender for native Irish workers, it is possible that the incentives
facing potential immigrants also differ and so the characteristics of immigrants may
differ by gender. In order to explore this we look at ILO Labour Force Status by
gender for immigrants and natives; we then look at education and occupation
distributions for labour force participants by native/immigrant and gender. The results
are shown in Tables 11, 12 and 13.

12
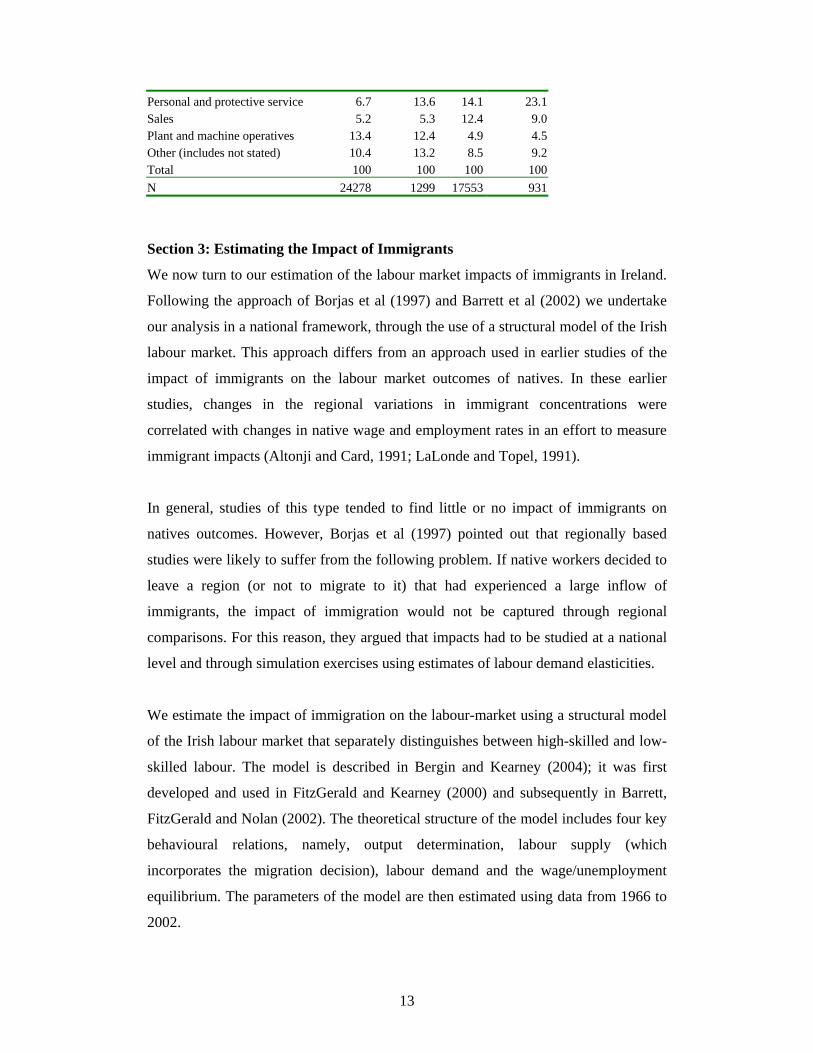
The patterns that emerged in the earlier tables are essentially repeated in the gender
breakdowns. In Table 11, it can be seen that both the participation rate and the
unemployment rate are higher for immigrant men relative to native men and for
immigrant women relative to native women. Higher education levels for both male
and female immigrants are seen in Table 12, while in Table 13 we see more similar
occupation distributions than might have been expected given the differences in
education attainment.
Table 11: ILO Status by Gender Males Females Irish Immigrants Irish Immigrants In Employment full-time 61.2 60.5 31.1 39.8 In Employment part-time, not underemployed 4.5 6.0 14.9 10.7 In Employment part-time, underemployed 0.1 0.1 0.1 0.2 Unemployed, seeking full-time work 2.9 5.0 1.1 2.4 Unemployed, seeking part-time work 0.2 0.2 0.6 0.9 Marginally attached 0.5 0.7 0.2 0.3 Others not economically active 30.6 27.5 52.0 45.6 Total 100.0 100.0 100.0 100.0 Participation rate 68.9% 71.8% 47.8% 54.1% Unemployment rate 4.5% 7.3% 3.6% 6.1% N 35243 1808 36752 1722 Table 12: Education by Gender Males Females Irish Immigrants Irish ImmigrantsNo formal/ primary education 16.8 6.4 8.9 4.0Lower secondary 22.2 10.6 14.9 8.1Upper secondary 25.9 21.3 29.9 23.1Post Leaving 11.4 9.5 13.7 8.0Third level 8.4 12.9 13.8 15.7Third level - degree or above 15.3 39.2 18.8 41.2Total 100.0 100.0 100.0 100.0N 23999 1102 17337 830 Table 13: Occupation Distribution by Gender Males Females Irish Immigrants Irish ImmigrantsManagers and administrators 21.7 11.5 12.1 9.1Professional 9.3 14.9 12.0 10.1Associate professional and technical 6.3 7.8 12.0 16.3Clerical and secretarial 4.9 4.9 22.2 17.0Craft and related 22.0 16.2 1.9 1.6
13
Personal and protective service 6.7 13.6 14.1 23.1Sales 5.2 5.3 12.4 9.0Plant and machine operatives 13.4 12.4 4.9 4.5Other (includes not stated) 10.4 13.2 8.5 9.2Total 100 100 100 100N 24278 1299 17553 931
Section 3: Estimating the Impact of Immigrants
We now turn to our estimation of the labour market impacts of immigrants in Ireland.
Following the approach of Borjas et al (1997) and Barrett et al (2002) we undertake
our analysis in a national framework, through the use of a structural model of the Irish
labour market. This approach differs from an approach used in earlier studies of the
impact of immigrants on the labour market outcomes of natives. In these earlier
studies, changes in the regional variations in immigrant concentrations were
correlated with changes in native wage and employment rates in an effort to measure
immigrant impacts (Altonji and Card, 1991; LaLonde and Topel, 1991).
In general, studies of this type tended to find little or no impact of immigrants on
natives outcomes. However, Borjas et al (1997) pointed out that regionally based
studies were likely to suffer from the following problem. If native workers decided to
leave a region (or not to migrate to it) that had experienced a large inflow of
immigrants, the impact of immigration would not be captured through regional
comparisons. For this reason, they argued that impacts had to be studied at a national
level and through simulation exercises using estimates of labour demand elasticities.
We estimate the impact of immigration on the labour-market using a structural model
of the Irish labour market that separately distinguishes between high-skilled and low-
skilled labour. The model is described in Bergin and Kearney (2004); it was first
developed and used in FitzGerald and Kearney (2000) and subsequently in Barrett,
FitzGerald and Nolan (2002). The theoretical structure of the model includes four key
behavioural relations, namely, output determination, labour supply (which
incorporates the migration decision), labour demand and the wage/unemployment
equilibrium. The parameters of the model are then estimated using data from 1966 to
2002.
14
The equation specifications and variable definitions can be found in Appendix 1 so
here we only present some of the key features of the model. Output determination is
based on a small open economy model where multinational enterprises select a
location for production on the basis of world demand and Ireland’s relative cost
competitiveness (Bradley and FitzGerald, 1988; Bradley et al, 1993; Bergin et al
2003). The labour market is modelled differently depending on the educational
qualifications of workers.9 As domestic production has become more technologically
advanced and the educational levels of the workforce have improved, high-skilled and
low-skilled workers have become less substitutable. Our estimates suggest that by the
mid to late 1990s there is essentially a zero elasticity of substitution between high-
skilled and low-skilled labour. High-skilled labour supply is very elastic because of
the ready availability of migration flows and those with high levels of education are
typically more mobile. It also reflects the relatively high skilled female labour supply
elasticity.10 High and low-skilled labour are assumed to be complements at the level
of the economy as a rise in the cost of either will serve to reduce Ireland’s
competitiveness and therefore output and employment of both types of labour. We
include two possible mechanisms for adjustment within the low-skilled labour market.
In one case, low-skilled wages are assumed to be a fixed mark up on social welfare
payments; this places a floor on low-skilled wages and so adjustment is through
changes in unemployment. In the other case, market clearing operates and adjustment
is through wages.
We base the simulations on the net inflow of non-nationals over the ten-year period to
2003. Over this period, net immigration of non-nationals was approximately 72,000.11
From Table 4, we can see that 85% of the immigrant population in Ireland who
arrived between 1993 and 2003 is high-skilled, compared with 67% of the native
population. We apply this percentage to the number of immigrants who arrived
9 We define high-skilled as those who have at least a higher secondary qualification and low-skilled as those with at most a lower secondary qualification. 10 See Doris (2001) for a discussion of the difference between male and female participation elasticities. 11This figure refers to non-national immigrants over the age of fifteen. Data on net migration flows (CSO, 2004) do not separately identify returning nationals so we take the proportion of non-nationals from the gross migration flows and apply the percentage to total net migration figures for each year.
15
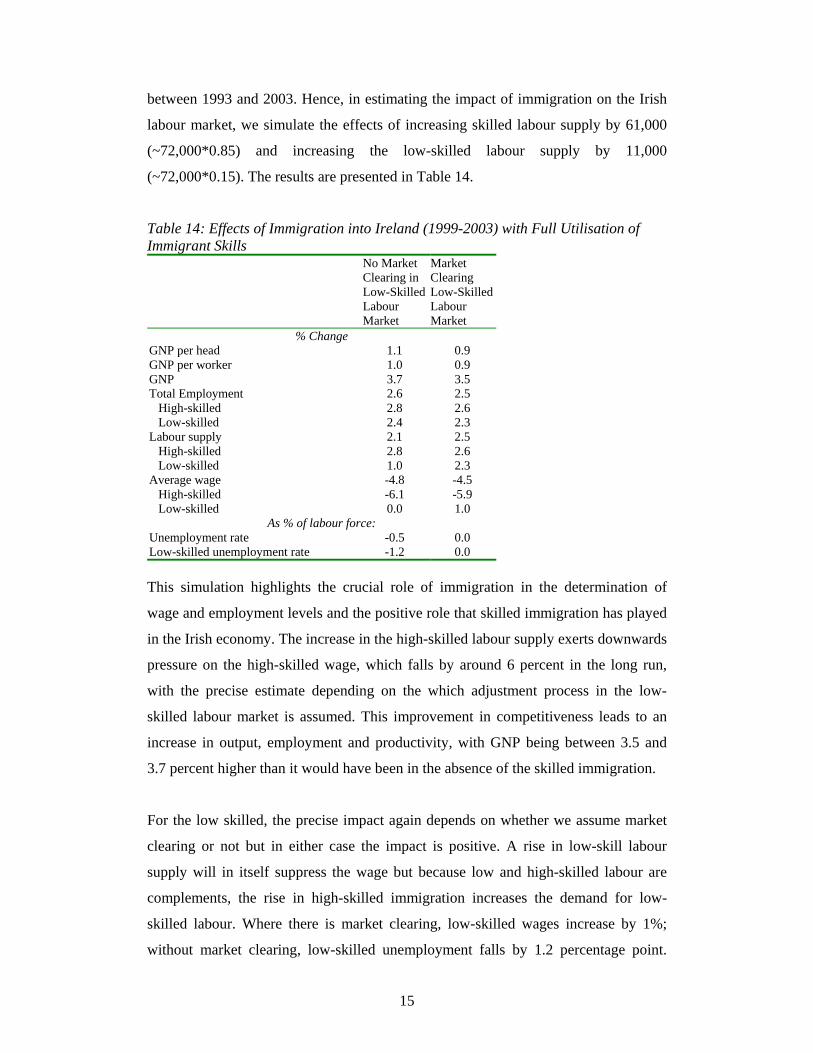
between 1993 and 2003. Hence, in estimating the impact of immigration on the Irish
labour market, we simulate the effects of increasing skilled labour supply by 61,000
(~72,000*0.85) and increasing the low-skilled labour supply by 11,000
(~72,000*0.15). The results are presented in Table 14.
Table 14: Effects of Immigration into Ireland (1999-2003) with Full Utilisation of Immigrant Skills
No Market Clearing in Low-Skilled Labour Market
Market Clearing Low-Skilled Labour Market
% Change GNP per head 1.1 0.9 GNP per worker 1.0 0.9 GNP 3.7 3.5 Total Employment 2.6 2.5 High-skilled 2.8 2.6 Low-skilled 2.4 2.3 Labour supply 2.1 2.5 High-skilled 2.8 2.6 Low-skilled 1.0 2.3 Average wage -4.8 -4.5 High-skilled -6.1 -5.9 Low-skilled 0.0 1.0
As % of labour force: Unemployment rate -0.5 0.0 Low-skilled unemployment rate -1.2 0.0 This simulation highlights the crucial role of immigration in the determination of
wage and employment levels and the positive role that skilled immigration has played
in the Irish economy. The increase in the high-skilled labour supply exerts downwards
pressure on the high-skilled wage, which falls by around 6 percent in the long run,
with the precise estimate depending on the which adjustment process in the low-
skilled labour market is assumed. This improvement in competitiveness leads to an
increase in output, employment and productivity, with GNP being between 3.5 and
3.7 percent higher than it would have been in the absence of the skilled immigration.
For the low skilled, the precise impact again depends on whether we assume market
clearing or not but in either case the impact is positive. A rise in low-skill labour
supply will in itself suppress the wage but because low and high-skilled labour are
complements, the rise in high-skilled immigration increases the demand for low-
skilled labour. Where there is market clearing, low-skilled wages increase by 1%;
without market clearing, low-skilled unemployment falls by 1.2 percentage point.
16
These findings replicates the results of Barrett et al (2002) who find that immigration
of skilled or experienced workers in the mid-1990s may have helped reduce earnings
inequality and unemployment of those with lower levels of education. The result
contrasts with that of Borjas et al (1997). They showed low skilled immigration into
the US lowering low-skilled wages and acting to increase earnings inequality.
This simulation treats immigrants and natives with the same level of educational
attainment as being identical. However, we found in Section 2 that the occupational
pattern of immigrants and natives differs in such a way that immigrants appear to
experience an “occupational gap”. Hence, if we treat immigrants and natives with the
same level of education as being identical we could well be over-estimating the
positive effects of immigration. For this reason, we will consider the estimates in
Table 14 to be upper bound estimates of the impacts.
In an attempt to capture this occupational gap we run the simulation assuming that
immigrants have the same skills mix as the native population. In essence, we assume
that immigrants have the same proportion of people in the no formal
qualifications/lower secondary category as the native population (see Table 4). We
make this assumption based on the similarity in the occupational distributions of
natives and immigrants (see Table 5) and in the absence of a reliable mapping
between education levels and occupation levels. It might be argued that this is too
strong an adjustment. We would argue in response that the results from this round of
estimation should be seen as a lower bound estimate on the impacts of immigration.
By combining these estimates with the upper bound estimates above, a good sense of
the magnitude of immigration impacts can be established. The results are presented in
Table 15.
The overall impact of immigration on the economy is now more muted when the
occupational gap is taken into account. The increase in GNP falls from 3.5-3.7% to
2.8-3.0%. This is because wages fall by less than in the previous simulation and so the
impact on Irish competitiveness is smaller. The smaller output effect means that the
demand impact on low-skilled workers is reduced. This leads to low-skilled wages

17
falling in this simulation, when market clearing is assumed (or low-skilled
unemployment rising, when market clearing is not assumed)12.
Table 15: Effects of Immigration Adjusting for Occupational Penalty
No Market Clearing in Low-Skilled Labour Market
Market Clearing Low-Skilled Labour Market
% Change GNP per head 0.5 0.4 GNP per worker 0.8 0.8 GNP 3.0 2.8 Total Employment 2.1 2.1 High-skilled 2.2 2.1 Low-skilled 1.9 1.9 Labour supply 2.2 2.0 High-skilled 2.2 2.1 Low-skilled 2.1 1.9 Average wage -3.9 -3.7 High-skilled -4.9 -4.6 Low-skilled 0.0 -0.2
As % of labour force: Unemployment rate 0.1 0.0 Low-skilled unemployment rate 0.2 0.0
Despite the “immigrant occupational gap” the overall estimated macro-economic
impact of immigration in Ireland remains positive. However the results are sensitive
to the educational distribution of the immigrants. To highlight this and to get a sense
of what the impact of immigration would be if there was a large inflow of unskilled
people, we reverse the skills mix of the immigrants and simulate what the impact on
the Irish economy would be if only 15% are high-skilled and the remaining 85% are
low-skilled. The results are presented in Table 16.
Table 16: Effects of Immigration Reversing the Skills Mix of Immigrants
No Market Clearing in Low-Skilled Labour Market
Market Clearing Low-Skilled Labour Market
% Change GNP per head -1.4 -1.2 GNP per worker 0.2 0.2 12 A similar result is obtained by Cohen and Hsieh (2000) when they look at the impact of high-skilled immigration in Israel. They argue that the Russian influx of the 1990s did not lower native skill-premia because the Russians experienced the type of occupational gap observed here and so did not change the relative supply of skilled workers in Israel.

18
GNP 0.7 0.8 Total Employment 0.5 0.6 High-skilled 0.5 0.6 Low-skilled 0.4 0.5 Labour supply 2.4 0.6 High-skilled 0.5 0.6 Low-skilled 5.5 0.5 Average wage -0.9 -1.1 High-skilled -1.1 -0.5 Low-skilled 0.0 -3.7
As % of labour force: Unemployment rate 1.8 0.0 Low-skilled unemployment rate 4.1 0.0
As with the earlier simulations, the immigration inflow increases GNP, albeit by a
smaller percentage. However, this hides some negative outcomes. In particular, low-
skill workers do badly whether we assume market clearing or not. With market
clearing, low-skilled wages fall by 3.7 percent. As this fall in low-skilled wages is
greater than the percentage fall in high-skill wages, the simulation suggests that low-
skilled immigration would increase earnings inequality. Without market clearing,
low-skill unemployment rises by 4.1 percentage points. More generally, GNP per
head falls. To the extent that GNP per head rather than GNP itself captures living
standards, it could be argued that low-skilled immigration has a negative impact.
Section 4: Conclusions
The labour market profile of immigrants in Ireland has shown them to be a young and
highly educated group. If it were the case that immigrants and natives were employed
in an identical manner in the Irish labour market, our estimation exercise suggests that
immigrants who arrived in the five years between 1993 and 2003 increased GNP by
between 3.5 and 3.7%. They may also have had another beneficial impact; by
reducing earnings of skilled workers and raising those of unskilled workers, the
immigrant inflow acted to reduce earnings inequality.
However, the analysis suggests that immigrants and natives with the same education
level are not employed in an identical manner and that immigrants experience an
occupational gap. This is an important finding because it alters the impact that
immigrants will have on the labour market, a point recognised by Cohen and Hsieh
(2000). By factoring this into the simulation exercise, we see that the positive impact
of immigration on GNP may have been closer to 3%. Similarly, the impact on

19
earnings inequality is reduced largely because the demand impact which acted to bid
up low-skilled wages (or reduce low-skilled unemployment) is lower when the skilled
immigrants are not “fully employed”.
Finally, we have shown that although an immigrant inflow that is largely unskilled
would increase GNP, the impact on unskilled labour would be very negative. Low-
skilled wages could fall by 3.7% or low-skilled unemployment rise by 4.1 percentage
points. Also, GNP per head would fall under this scenario, suggesting a decline in
living standards.
It should be noted that in focusing our estimation exercise on the direct labour market
impacts of immigration, there are a number of other potential impacts of immigration
that we are not modelling and hence not capturing. For example, if immigration
increases the profitability of firms and hence investment, there could be an outward
shift in the labour demand line and hence a second round of effects. Equally, if
immigrants put additional pressures on an inelastic housing stock, they could bid up
house prices and thereby shift the labour supply curve inwards. While these impacts
might be important, our results capture interesting first round impacts against which
any additional impacts would have to be assessed.
From a policy perspective, the lessons would appear to be two-fold. First, while
Ireland has benefited from a high-skilled inflow in recent times, there is no guarantee
that the inflow will continue to be high-skilled. For this reason, to the extent that
policy can impact upon the skill level of immigrants, it should aim to promote the
inflow of high-skill people. In truth, as Ireland is now a small region in a large area of
free labour movement (4 million out of an EU-25 population of 450 million), it is
questionable as to how much influence can be brought to bear on the nature of the
inflow into Ireland. However, to the extent that the demographic structure of many
non-EU countries will lead them to be major suppliers of immigrants in the future,
this is still an important policy consideration.
As regards the second policy lesson, the observation that high-skilled immigrants are
not employed at a level that reflects their educational attainment points to a potential
problem. The precise policy prescription depends on the reason for the occupational

20
disadvantage and also on whether it disappears over time as immigrants assimilate. As
our data do not allow us to identify the length of time each immigrant has been in
Ireland, we cannot say anything on this assimilation issue although clearly a degree of
assimilation is likely to occur. The cause of the occupation gap may relate to English
language skills. It may also relate to inefficient job search on the part on the
immigrants or an inability on the part of employers to evaluate non-Irish
qualifications. Each of these possibilities suggests a policy response but a more
precise understanding of immigrant placement would be needed before a definitive
recommendation could be made.

21
References
Altonji, J. and D. Card (1991), “The Effects of Immigration on the Labor Market Outcomes of Less-skilled Natives”, in J. Abowd and R. Freeman (eds.) Immigration, Trade and the Labor Market, Chicago, IL: University of Chicago Press. Barrett, A., J. FitzGerald and B. Nolan (2002), “Earning Inequality, Returns to Education and Immigration into Ireland”, Labour Economics Vol. 9 No. 5. Barrett, A. and F. Trace (1998), “Who Is Coming Back? The Educational Profile of Returning Migrants in the 1990s”, Irish Banking Review, Summer. Bergin, A., J. Cullen, D. Duffy, J. FitzGerald, I. Kearney, D. McCoy (2003), Medium Term Review 2003-2010, Dublin ESRI. Bergin, A. and I. Kearney (2004) “Human Capital, the Labour Market and Productivity Growth In Ireland”, ESRI Working Paper No. 158, The Economic and Social Research Institute, Dublin. Borjas, G., R. Freeman and L. Katz (1997), “How Much Do Immigration and Trade Affect Labour Market Outcomes?”, Brookings Papers on Economic Activity, Vol. 1 pp1-67. Bradley, J. and J. FitzGerald (1988), “Industrial output and factor input determination in an econometric model of a small open economy”, European Economic Review 32, 1227-1241. Bradley, J., FitzGerald, J., and I. Kearney (1993), “Modelling supply in an open economy using a restricted cost function”, Economic Modelling, 10 (1), 11-21 January. Cohen, S. and C.-T. Hsieh (2000), “Macroeconomic and Labour Market Impact of Russian Immigration in Israel”, mimeo, Princeton University. CSO (2003), Usual Residence, Migration, Birthplaces and Nationalities, Census 2002, Volume 4, Dublin: Stationery Office. CSO (2004), Population and Migration Estimates, Dublin: CSO. Doris, A. (2001), "Labour Supply Elasticity Changes during the 1990s", Quarterly Economic Commentary, December. Eckstein, Z. and Y. Weiss (2004), “On the Wage Growth of Immigrants: Israel 1991-2000”, Journal of the European Economic Association, Vol. 2 No. 4. Fanning, B., Loyal, S. and C. Staunton (2000), Asylum Seekers and the Right to Work in Ireland, Dublin: Irish Refugee Council.

22
FitzGerald, J. and I. Kearney (2000), "Convergence in Living Standards in Ireland: The Role of the New Economy?", ESRI Working paper No. 134, The Economic and Social Research Institute, Dublin. Frijters, P., M.A. Shields and S. Wheatley-Price (2003), “Immigrant Job Search in the UK: Evidence from Panel Data”, IZA Discussion Paper No. 902. LaLonde, R. and R Topel (1991), “Labor Market Adjustments to Increased Immigration”, in J. Abowd and R. Freeman (eds.) Immigration, Trade and the Labor Market, Chicago, IL: University of Chicago Press. Minns, C. (2005), “How Skilled Are Irish Immigrants? Evidence and Implications”, paper delivered to the Statistical and Social Inquiry Society of Ireland, 24 February. Ruhs, M. (2003), “Emerging Trends and Patterns in the Immigration and Employment of Non-EU Nationals in Ireland: What the Data Reveal”, Working Paper, The Policy Institute, Trinity College Dublin.
23
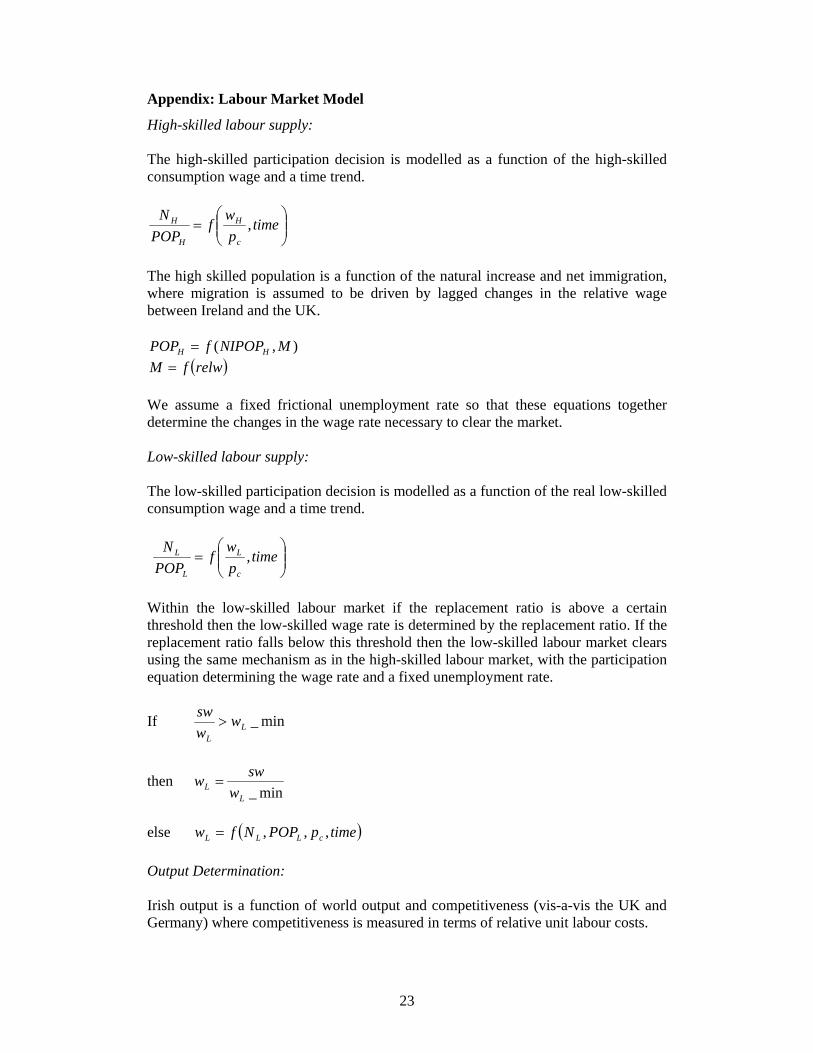
Appendix: Labour Market Model
High-skilled labour supply: The high-skilled participation decision is modelled as a function of the high-skilled consumption wage and a time trend.
⎟⎟⎠
⎞⎜⎜⎝
⎛= time
pwf
POPN
c
H
H
H ,
The high skilled population is a function of the natural increase and net immigration, where migration is assumed to be driven by lagged changes in the relative wage between Ireland and the UK.
),( MNIPOPfPOP HH = ( )relwfM =
We assume a fixed frictional unemployment rate so that these equations together determine the changes in the wage rate necessary to clear the market. Low-skilled labour supply: The low-skilled participation decision is modelled as a function of the real low-skilled consumption wage and a time trend.
⎟⎟⎠
⎞⎜⎜⎝
⎛= time
pw
fPOP
N
c
L
L
L ,
Within the low-skilled labour market if the replacement ratio is above a certain threshold then the low-skilled wage rate is determined by the replacement ratio. If the replacement ratio falls below this threshold then the low-skilled labour market clears using the same mechanism as in the high-skilled labour market, with the participation equation determining the wage rate and a fixed unemployment rate.
If min_LL
wwsw
>
then min_L
L wsww =
else ( )timepPOPNfw cLLL ,,,= Output Determination: Irish output is a function of world output and competitiveness (vis-a-vis the UK and Germany) where competitiveness is measured in terms of relative unit labour costs.

24
( )jiwi ulculcQfQ ,,=
Labour Demand: Labour demand for the composite labour input is a function of output and the real wage:
⎟⎟⎠
⎞⎜⎜⎝
⎛=
pcwQfL i ,
Within the total labour input bundle the relative demand for high-skilled labour is determined as a function of the relative wage and technical progress (time).
⎟⎟⎠
⎞⎜⎜⎝
⎛= time
ww
fLL
HH ,
Other equations which close the model:
LLwLww LLHH ** +
=
LH LLL +=
LH NNN +=
)( 1 tttt NIPOPHPOPHPOPHM −−= −
LLL MNIPOPPOP +=
HL POPPOPPOP +=
GNPYWNAULC =
LLHH LwLwYWNA ** +=
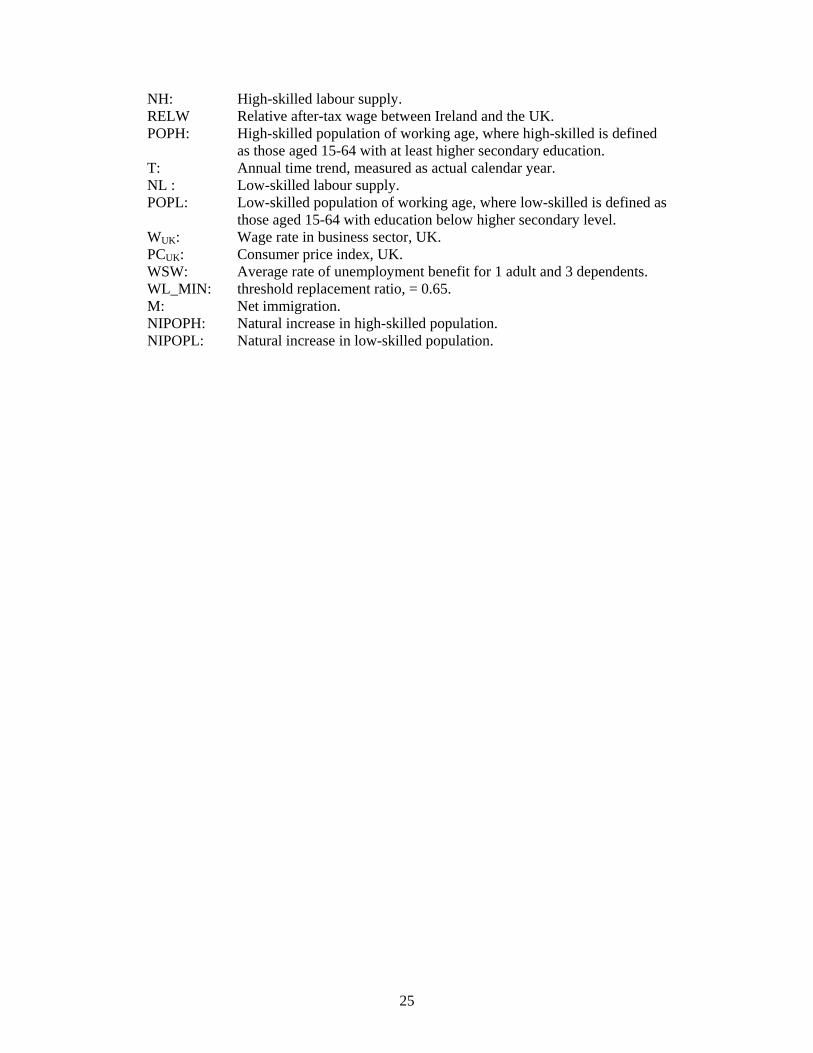
Variable definitions and Data Sources
All data from ESRI databank (Bergin and Fitz Gerald, 2003) unless otherwise stated. GNP: Constant price GNP. L: Non-agricultural employment, total. HK: Human capital index, see Appendix 1. PC: Personal consumption deflator. WL: Low-skilled wage, measured as average wage in clothing sector. WH: High-skilled wage, measured as average wage in non-agricultural
sector excluding clothing.
25
NH: High-skilled labour supply. RELW Relative after-tax wage between Ireland and the UK. POPH: High-skilled population of working age, where high-skilled is defined
as those aged 15-64 with at least higher secondary education. T: Annual time trend, measured as actual calendar year. NL : Low-skilled labour supply. POPL: Low-skilled population of working age, where low-skilled is defined as
those aged 15-64 with education below higher secondary level. WUK: Wage rate in business sector, UK. PCUK: Consumer price index, UK. WSW: Average rate of unemployment benefit for 1 adult and 3 dependents. WL_MIN: threshold replacement ratio, = 0.65. M: Net immigration. NIPOPH: Natural increase in high-skilled population. NIPOPL: Natural increase in low-skilled population.
Related Documents