The influence of substrate and electron acceptor availability on bioactive zone dynamics in porous media Irfan Yolcubal a,1 , Jonathan G. Dorn b , Raina M. Maier b , Mark L. Brusseau a,b, * a Department of Hydrology and Water Resources, University of Arizona, 429 Shantz, Tucson, AZ 85721, USA b Department of Soil, Water, and Environmental Science, University of Arizona, 429 Shantz, Tucson, AZ 85721, USA Received 4 June 2002; accepted 20 February 2003 Abstract Two approaches were used to investigate the influence of dissolved oxygen (DO) and substrate availability on the formation and dynamics of ‘‘bioactive zones’’ in a water-saturated porous medium. A bioactive zone is defined as a region where a microbial community is sufficiently active to metabolize bioavailable substrates. In the first approach, microbial activity was characterized by monitoring the spatial and temporal variability of DO and aqueous substrate (salicylate and naphthalene) concentrations during miscible-displacement experiments. In the second approach, microbial activity was monitored using multiple fiber optics emplaced in the porous medium to detect luminescence produced by Pseudomonas putida RB1353, a bio- luminescent reporter organism that produces light when salicylate (an intermediate of naphthalene degradation) is present. The results of both approaches show that the location and size of the bioactive zones were influenced by in situ DO and substrate availability. When DO was not a limiting factor (i.e., lower substrate input concentrations), the bioactive zone encompassed the entire column, with the majority of the microbial activity occurring between the inlet and midpoint. However, as the availability of DO became limiting for the higher substrate input 0169-7722/03/$ - see front matter D 2003 Elsevier Science B.V. All rights reserved. doi:10.1016/S0169-7722(03)00027-5 * Corresponding author. Department of Soil, Water, and Environmental Science, University of Arizona, 429 Shantz Building, 38 Tucson, AZ 85721, USA. Tel.: +1-520-621-3244; fax: +1-520-621-1647. E-mail address: [email protected] (M.L. Brusseau). 1 Now at Department of Geological Engineering, Kocaeli University, 41040, Izmit, Turkey. www.elsevier.com/locate/jconhyd Journal of Contaminant Hydrology 66 (2003) 219 – 237

Welcome message from author
This document is posted to help you gain knowledge. Please leave a comment to let me know what you think about it! Share it to your friends and learn new things together.
Transcript
www.elsevier.com/locate/jconhyd
Journal of Contaminant Hydrology 66 (2003) 219–237
The influence of substrate and electron acceptor
availability on bioactive zone dynamics in
porous media
Irfan Yolcubala,1, Jonathan G. Dornb,Raina M. Maierb, Mark L. Brusseaua,b,*
aDepartment of Hydrology and Water Resources, University of Arizona, 429 Shantz, Tucson, AZ 85721, USAbDepartment of Soil, Water, and Environmental Science, University of Arizona, 429 Shantz,
Tucson, AZ 85721, USA
Received 4 June 2002; accepted 20 February 2003
Abstract
Two approaches were used to investigate the influence of dissolved oxygen (DO) and substrate
availability on the formation and dynamics of ‘‘bioactive zones’’ in a water-saturated porous
medium. A bioactive zone is defined as a region where a microbial community is sufficiently
active to metabolize bioavailable substrates. In the first approach, microbial activity was
characterized by monitoring the spatial and temporal variability of DO and aqueous substrate
(salicylate and naphthalene) concentrations during miscible-displacement experiments. In the
second approach, microbial activity was monitored using multiple fiber optics emplaced in the
porous medium to detect luminescence produced by Pseudomonas putida RB1353, a bio-
luminescent reporter organism that produces light when salicylate (an intermediate of naphthalene
degradation) is present. The results of both approaches show that the location and size of the
bioactive zones were influenced by in situ DO and substrate availability. When DO was not
a limiting factor (i.e., lower substrate input concentrations), the bioactive zone encompassed
the entire column, with the majority of the microbial activity occurring between the inlet and
midpoint. However, as the availability of DO became limiting for the higher substrate input
0169-7722/03/$ - see front matter D 2003 Elsevier Science B.V. All rights reserved.
doi:10.1016/S0169-7722(03)00027-5
* Corresponding author. Department of Soil, Water, and Environmental Science, University of Arizona, 429
Shantz Building, 38 Tucson, AZ 85721, USA. Tel.: +1-520-621-3244; fax: +1-520-621-1647.
E-mail address: [email protected] (M.L. Brusseau).1 Now at Department of Geological Engineering, Kocaeli University, 41040, Izmit, Turkey.

I. Yolcubal et al. / Journal of Contaminant Hydrology 66 (2003) 219–237220
experiments, the size of the bioactive zone shrank and was ultimately limited to the proximity of
the column inlet.
D 2003 Elsevier Science B.V. All rights reserved.
Keywords: Bioactive zone; Biodegradation; Bioluminescence; Naphthalene; Dissolved oxygen; Reporter
organism
1. Introduction
Contamination of soil and groundwater by hazardous organic chemicals resulting
from improper disposal, accidental spills, or leaking underground storage tanks is
recognized as a major environmental and health concern. In situ bioremediation has
gained widespread interest for remediating organic-contaminated soils and aquifers due
to its cost effectiveness and applicability to a wide range of pollutants (National
Research Council (NRC), 1993). In situ bioremediation applications often involve the
addition of limiting nutrients and electron acceptors to stimulate biodegradative
processes. The injection of these essential substances into contaminated soils or aquifers
creates regions called bioactive zones wherein the microbial community becomes
sufficiently active to metabolize bioavailable substrates (Odencrantz et al., 1990;
Wookeun et al., 1990; Holden and Firestone 1997; Keijzer et al., 1999; Mahinthakumar
et al., 1999). Successful in situ bioremediation relies on the formation of these
microbially active zones (NRC, 1993). The location and size of these bioactive zones
are controlled by both physicochemical (e.g., subsurface heterogeneity, environmental
conditions, the nature and concentrations of substrates, electron acceptors, and nutrients)
and microbiological (e.g., the dynamics and physiological status of the microbial
community) factors. Because many of these factors are in a state of flux in the
subsurface environment, and because the subsurface environment is generally heteroge-
neous, the formation of bioactive zones is expected to be a temporally and spatially
variable process.
Despite their importance, relatively few studies have focused specifically on character-
izing the formation and dynamics of bioactive zones. For example, Odencrantz et al.
(1990) demonstrated that the location and size of bioactive zones can be successfully
controlled through the location-specific injection of electron acceptors. In an additional
study, Wookeun et al. (1990) showed that greater removal rates of halogenated
compounds are achieved with an increased contaminant residence time within the
bioactive zone. Keijzer et al. (1999) characterized the performance of in situ bioreme-
diation using an analytical model that incorporated both the contaminant removal rate and
biologically active zones. This study showed that a decrease in flow rate or the injected
electron acceptor concentration resulted in a smaller, more efficient bioactive zone and
therefore an improvement in bioremediation performance.
The primary goal of this research was to examine the spatial and temporal distribution
of a biologically active zone, as well as the degree of microbial activity within the zone,
in response to local changes in substrate and electron acceptor availability. Two methods
were employed to accomplish this goal. The first method involves monitoring of substrate
I. Yolcubal et al. / Journal of Contaminant Hydrology 66 (2003) 219–237 221
(salicylate and naphthalene) and dissolved oxygen concentrations at various locations
within a column system. The second method involves noninvasive, real-time monitoring
of in situ reporter gene activity in the column system. Reporter gene activity, reflecting
substrate (naphthalene) degradation, was monitored by employing a multiple fiber-optic
detection system to collect luminescence produced by Pseudomonas putida RB1353, a
bioluminescent reporter organism.
2. Materials and methods
2.1. Solutions and sorbent
Sodium salicylate (C7H5NaO3; Sigma, St. Louis, MO) and naphthalene (C10H8; EM
Science, Gibbstown, NJ) were chosen as the model substrates. Salicylate (160.1 g mol� 1)
has a low vapor pressure (0.44 Pa) and a high aqueous solubility (1100 g l� 1), which
allows investigation of the influence of a large range of substrate input concentrations on
system behavior. In addition, salicylate is not sorbed by the porous medium used in this
study, which eliminates bioavailability constraints. Conversely, naphthalene has a rela-
tively large vapor pressure (11 Pa), small aqueous solubility (31 mg l� 1), and is slightly
sorbed by the porous medium used in this study. Naphthalene was used as a representative
hydrocarbon contaminant.
Mineral salts broth (MSB) was used as a nutrient/electrolyte solution for the column
experiments. MSB contains (per liter): 1.5 g KH2PO4, 0.5 g Na2HPO4, 0.2 g MgSO4�7H2O, 2.5 g NH4Cl, 0.3 mg FeCl3, and 13.2 mg CaCl2�2H2O, and is adjusted to pH 7.0. A
well-sorted (20/30 mesh) quartz sand was used as the model porous medium (North
Kato Supply, Mankato, MN). Based on sieve analysis, 99% of the sand is comprised of
particle diameters in the range of 600–850 Am, with a mean particle diameter of 700
Am. The sand has an organic carbon content of 0.04% and a cation exchange capacity of
5.7 mEq kg� 1.
2.2. Bacterial strain
P. putida RB1353, provided by Dr. Robert Burlage (University of Wisconsin, Mil-
waukee, WI), was used in all experiments. This strain contains plasmids NAH7 and
pUTK9 (kanamycin resistance). The NAH7 plasmid contains the genes for naphthalene
degradation in two operons referred to as the upper and lower pathways, both regulated
by the nahR gene product. The upper pathway degrades naphthalene to salicylate while
the lower pathway is responsible for the degradation of salicylate to acetylaldehyde and
pyruvate (Schell, 1990; Yen and Serdar, 1988). In the presence of salicylate, the
regulatory protein NahR activates the upper and the lower pathways by binding to the
upper and lower pathway promoters (Burlage et al., 1990). Naphthalene does not directly
induce the upper or lower pathway. However, when naphthalene is present, constitutive
low levels of expression of the upper pathway result in conversion of naphthalene to
salicylate, at which time full induction occurs (Burlage et al., 1990; Schell, 1990; Yen and
Serdar, 1988).

I. Yolcubal et al. / Journal of Contaminant Hydrology 66 (2003) 219–237222
The reporter plasmid, pUTK9, contains a subclone in which the NAH7 upper-pathway
promoter is fused with the luxCDABE genes from Vibrio fischeri (Burlage et al., 1990).
When salicylate is present, induction of the lux genes results in production of lumines-
cence. Thus, naphthalene biodegradation can be monitored by measuring the lumines-
cence produced upon conversion of naphthalene to salicylate. Neilson et al. (1999)
indicated that the presence of the pUTK9 plasmid containing the lux genes does not
deleteriously impact the growth and biodegradation potential of the organism. In previous
studies, Burlage et al. (1990) demonstrated that light production by RB1351, an identical
sister clone to RB1353, was directly correlated to naphthalene catabolism. In addition,
Neilson et al. (1999) and Yolcubal et al. (2000) observed a linear relationship between
salicylate concentration and luminescence for RB1353 in batch and column studies,
respectively.
The bacterial strains were cultured and maintained in Luria Broth media (LB)
supplemented with kanamycin to select for pUTK9. LBK medium consists of (per liter):
10 g tryptone, 5 g yeast extract, 10 g NaCl, 100 mg kanamycin sulfate, and is adjusted to
pH 7. Agar plates were made by adding 15 g l� 1 Bacto-agar (Difco Laboratories,
Detroit, MI) to the LBK medium. The bacterial strains were stored frozen in 12%
glycerol. Fresh cultures were inoculated from a frozen stock for each experiment to avoid
plasmid loss. Precultures were inoculated in a 250-ml flask containing 25 ml of LB
media and 250 Al of filter-sterilized 10 mg ml� 1 kanamycin solution, and placed on a
shaker (120 rpm, 24 jC) for 24 h. Following serial dilutions, growth cultures were
prepared at a cell density of 105 colony forming units (CFU)/ml from the preculture,
placed on a shaker, and allowed to grow to stationary phase, which required approx-
imately 48 h (Neilson et al., 1999). A 20-ml aliquot of cell solution was taken from the
growth culture and centrifuged for 10 min at 9000 rpm to pellet the cells. The pelleted
cells were washed once with 20 ml of 0.85% NaCl and then resuspended in 20 ml of
sterile MSB solution. This resulted in a final suspension of approximately 109 CFU
ml� 1. Following cell harvesting, serial dilutions were prepared to obtain a final
concentration that would produce a cell density of approximately 107 CFU g� 1 dry
sand upon inoculation of the porous medium.
2.3. Column experiments
A stainless steel column (ModCol, St. Louis, MO) with dimensions of 5 cm inner
diameter by 10 cm in length was used for the column experiments. The column has ports
near the inlet and the midpoint of the column for collecting in situ aqueous samples for
measurement of substrate and DO concentrations. The column effluent was also
monitored for substrate, DO, and cell density. The column has five luminescence
measurement ports along the column axis (0.2, 2.1, 3.2, 5.0, and 7.5 cm from the inlet)
into which optical fibers were inserted for continuous data acquisition. The fibers were
inserted such that their tips were at the center of the column. The column was connected
to a single-piston pump (SSI Accuflow series II, Deerfield, IN) using stainless steel
tubing with a two-way valve to switch between MSB and substrate solutions (Fig. 1).
Prior to each experiment, a 2% bleach solution was used to sterilize the apparatus. After
treatment with bleach, the system was flushed with 0.01% sterile sodium-thiosulfate to

Fig. 1. Photograph of the multi-fiber-optic luminescence detection system.
I. Yolcubal et al. / Journal of Contaminant Hydrology 66 (2003) 219–237 223
neutralize the bleach. Finally, the system was flushed with sterile deionized, distilled
water. The glassware and solutions were also sterilized.
For each column experiment, 420 g of sterile sand was inoculated with P. putida
RB1353. The inoculated sand was mixed thoroughly under a laminar flow hood to
ensure a homogeneous distribution of bacteria. Subsamples were plated in triplicate on
LBK plates for determination of initial cell density. The column was then packed in
incremental steps with the inoculated sand under sterile conditions to obtain uniform bulk
density. After packing, the column was saturated from the bottom for 17 h (f 15 pore
volumes) with sterile MSB solution at a flow rate of 1 ml min� 1. The MSB and
salicylate solution reservoirs were continuously sparged with oxygen during both
saturation and substrate injection to reduce oxygen limitations. To prevent naphthalene
volatilization during the experiment, naphthalene solutions were prepared using a pre-
sparged MSB solution in a custom-made tedlar bag with no headspace. Following
saturation, a substrate pulse at the concentration of interest was injected into the column.
After the substrate pulse was completed, the column was flushed with two pore volumes
of MSB at a flow rate of 1 ml min� 1. Samples were collected from the reservoir prior to
and after each experiment to ensure that salicylate and naphthalene concentrations
remained constant.
Column experiments were conducted using salicylate input concentrations (Co) of 4.6,
19.3, 21.8, 62.4, 64.2, and 89.7 mg l� 1 and a naphthalene input concentration of 30 mg
l� 1, and an average pore-water velocity of approximately 9 cm h� 1 (Table 1). This
velocity is equivalent to a hydraulic residence time of about 1.2 h. Sterile column
experiments were conducted to characterize the retention and transport behavior of
salicylate and naphthalene in the porous medium. Pentafluorobenzoic acid (PFBA) was

Table 1
Summary of column experiments
Experiment
number
Input concentration
(mg l� 1)
Initial cell density
(CFU g� 1 dry soil)
Pore-water velocity
(cm h� 1)
1 4.6 2.3 (F 0.74)� 107 8.4
2 19.3 1.6 (F 0.33)� 107 9.0
3 21.8 2.0 (F 0.28)� 107 8.7
4 62.4 2.8 (F 0.59)� 107 8.5
5 64.2 1.4 (F 0.38)� 107 7.8
6 89.7 2.6 (F 0.27)� 107 8.8
7 30.0 1.3 (F 0.66)� 107 8.9
Salicylate was used for experiments 1–6 and naphthalene for experiment 7. The values in the parentheses
represent the standard deviation (1r) of 6–9 plate counts. Bulk density and porosity of the packed column for
these experiments were 1.75 g cm� 3 and 0.34, respectively.
I. Yolcubal et al. / Journal of Contaminant Hydrology 66 (2003) 219–237224
used as a nonreactive, conservative tracer to characterize the hydrodynamic properties of
the packed columns.
The initial total biomass was calculated as the product of the initial soil-phase cell
density (CFU g� 1 dry soil) and the mass of dry sand packed in the column. The amount of
biomass remaining in the sand before the substrate pulse was injected was calculated by
subtracting the total amount of cells eluted during initial MSB saturation from the initial
total soil-phase biomass. The total amount of cells eluted during the substrate pulse was
calculated by integrating the area under the cell elution curve. All this information was
used to calculate the population growth during substrate injection. An estimate of
population growth was also calculated based on the total mass of substrate degraded.
The mass degraded for each column experiment was calculated by subtracting the total
mass of substrate eluted from the total input mass. The estimated biomass produced was
determined using a cell yield coefficient of 0.22 g-cells-produced/g-salicylate-consumed
obtained from batch studies (Sandrin et al., 2001). This cell mass was then converted to
cell numbers (CFU) assuming an individual cell weight of 9.5� 10� 10 mg (Neidhardt
et al., 1990).
2.4. Quantification of luminescence and substrate and dissolved oxygen concentrations
Solution samples were periodically collected from the three sampling locations for
analysis of salicylate, naphthalene, and DO concentrations. The DO was measured using
an oxygen microelectrode connected to an oxygen meter (Microelectrodes, Bedford, NH).
Immediately after the DO measurements were taken, 100 Al of 2.75 M NaOH was added to
each 1 ml salicylate sample to inhibit microbial activity. Solution samples were stored at
4 jC until analyzed for salicylate. Prior to salicylate analysis, samples were centrifuged
at 10,000� g for 10 min to pellet cell debris. Naphthalene samples (2 ml) were collected
using a luer-lock glass syringe to prevent volatilization and then analyzed immediately.
Salicylate and naphthalene concentrations were determined using UV/VIS spectropho-
tometry (UV-1601, Shimadzu) at 231 and 276 nm, respectively.
Luminescence was measured using a multiple fiber-optic detection system that allows
noninvasive, real-time in situ monitoring of the spatial and temporal distribution of
I. Yolcubal et al. / Journal of Contaminant Hydrology 66 (2003) 219–237 225
microbial activity under dynamic conditions in porous media. The design, calibration,
and operation of the fiber optic system are described in detail elsewhere (Yolcubal et al.,
2000; Yolcubal, 2001). The setup of the luminescence detection system is shown in Fig.
1. The light collected by the optical fiber is routed to a gated photomultiplier tube (PMT)
that converts the light signal to an electrical signal. The current leaving the PMT is sent
to a conditioning circuit for noise filtration and signal amplification. The output current
from the conditioning circuit is then routed to a signal processor for data acquisition and
the processed data is stored on a PC.
2.5. Data analysis
Moment analyses of salicylate and naphthalene breakthrough curves were performed to
obtain the retardation factors of the compounds in the system (sterile experiments) and the
total amount of substrate degraded (inoculated experiments). To measure the retardation
factor, zeroth and first moments were calculated for salicylate and naphthalene break-
through curves obtained from the column experiments conducted using noninoculated
sand. The spatial and temporal distribution of salicylate and naphthalene biodegradation
was determined from the breakthrough curves obtained for each sampling location (near
the inlet and midpoint of the column, and in the effluent) during the experiments
conducted with the inoculated sand. Using these substrate breakthrough curves, the
percentage of total substrate degradation in the vicinity of the sampling locations was
calculated. In addition, the total amount of substrate degraded between sampling locations
was determined. For this calculation, the cumulative substrate degraded per pore volume
was first calculated using the zeroth moments of the breakthrough curves obtained at each
sampling location. The total amount of substrate degraded between sampling locations was
then taken as the difference between the results for the respective sampling locations.
3. Results and discussion
3.1. Hydrodynamic characterization of the system
Breakthrough curves obtained for PFBA, the nonreactive tracer, were sharp and
symmetrical, indicating ideal transport (Fig. 2). The results of sterile column experiments
conducted with salicylate and naphthalene are also presented in Fig. 2. Mass recovery was
complete, indicating no abiotic loss mechanisms. The retardation factors for salicylate and
naphthalene were 1.1 and 1.4, respectively. Therefore, sorption of both salicylate and
naphthalene is minimal in this system. Based on these results, it is unlikely that
biodegradation of these two compounds will be significantly influenced by substrate
bioavailability constraints.
3.2. Spatial variability of substrate biodegradation
For the first 15 pore volumes, salicylate biodegradation occurred throughout the entire
column for all experiments. This is indicated by the fact that the salicylate concentrations
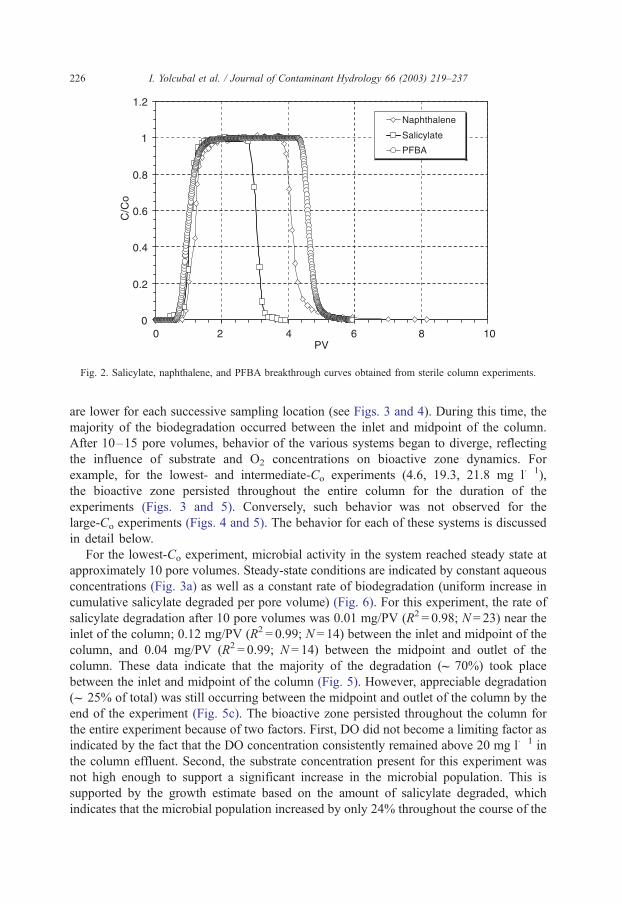
Fig. 2. Salicylate, naphthalene, and PFBA breakthrough curves obtained from sterile column experiments.
I. Yolcubal et al. / Journal of Contaminant Hydrology 66 (2003) 219–237226
are lower for each successive sampling location (see Figs. 3 and 4). During this time, the
majority of the biodegradation occurred between the inlet and midpoint of the column.
After 10–15 pore volumes, behavior of the various systems began to diverge, reflecting
the influence of substrate and O2 concentrations on bioactive zone dynamics. For
example, for the lowest- and intermediate-Co experiments (4.6, 19.3, 21.8 mg l� 1),
the bioactive zone persisted throughout the entire column for the duration of the
experiments (Figs. 3 and 5). Conversely, such behavior was not observed for the
large-Co experiments (Figs. 4 and 5). The behavior for each of these systems is discussed
in detail below.
For the lowest-Co experiment, microbial activity in the system reached steady state at
approximately 10 pore volumes. Steady-state conditions are indicated by constant aqueous
concentrations (Fig. 3a) as well as a constant rate of biodegradation (uniform increase in
cumulative salicylate degraded per pore volume) (Fig. 6). For this experiment, the rate of
salicylate degradation after 10 pore volumes was 0.01 mg/PV (R2 = 0.98; N = 23) near the
inlet of the column; 0.12 mg/PV (R2 = 0.99; N = 14) between the inlet and midpoint of the
column, and 0.04 mg/PV (R2 = 0.99; N = 14) between the midpoint and outlet of the
column. These data indicate that the majority of the degradation (f 70%) took place
between the inlet and midpoint of the column (Fig. 5). However, appreciable degradation
(f 25% of total) was still occurring between the midpoint and outlet of the column by the
end of the experiment (Fig. 5c). The bioactive zone persisted throughout the column for
the entire experiment because of two factors. First, DO did not become a limiting factor as
indicated by the fact that the DO concentration consistently remained above 20 mg l� 1 in
the column effluent. Second, the substrate concentration present for this experiment was
not high enough to support a significant increase in the microbial population. This is
supported by the growth estimate based on the amount of salicylate degraded, which
indicates that the microbial population increased by only 24% throughout the course of the
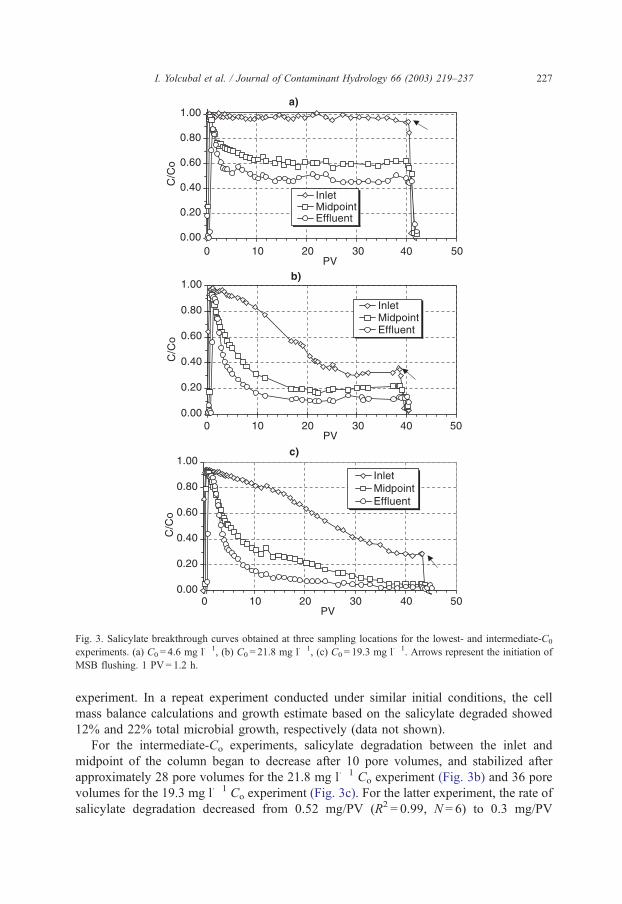
Fig. 3. Salicylate breakthrough curves obtained at three sampling locations for the lowest- and intermediate-C0
experiments. (a) C0 = 4.6 mg l� 1, (b) C0 = 21.8 mg l� 1, (c) C0 = 19.3 mg l� 1. Arrows represent the initiation of
MSB flushing. 1 PV= 1.2 h.
I. Yolcubal et al. / Journal of Contaminant Hydrology 66 (2003) 219–237 227
experiment. In a repeat experiment conducted under similar initial conditions, the cell
mass balance calculations and growth estimate based on the salicylate degraded showed
12% and 22% total microbial growth, respectively (data not shown).
For the intermediate-Co experiments, salicylate degradation between the inlet and
midpoint of the column began to decrease after 10 pore volumes, and stabilized after
approximately 28 pore volumes for the 21.8 mg l� 1 Co experiment (Fig. 3b) and 36 pore
volumes for the 19.3 mg l� 1 Co experiment (Fig. 3c). For the latter experiment, the rate of
salicylate degradation decreased from 0.52 mg/PV (R2 = 0.99, N = 6) to 0.3 mg/PV

Fig. 4. Salicylate breakthrough curves obtained at three sampling locations for larger-Co experiments. (a)
C0 = 64.2 mg l� 1, (b) C0 = 62.4 mg l� 1, (c) C0 = 89.7 mg l� 1. Arrows represent the initiation of MSB flushing.
1 PV= 1.2 h.
I. Yolcubal et al. / Journal of Contaminant Hydrology 66 (2003) 219–237228
(R2 = 0.99, N = 5) between 10 and 36 pore volumes (Fig. 6). After 36 pore volumes, the
majority of degradation (f 70%) was confined to the vicinity of the column inlet (Fig. 5a),
wherein the rate of salicylate degradation became 0.91 mg/PV (R2 = 1, N = 6). Conversely,
only about 20% of the total degradation was taking place between the midpoint and
outlet of the column at this time (Fig. 5c), and the rate of salicylate degradation in
this zone was 0.03 mg/PV (R2 = 0.99, N = 5) (Fig. 6). This change in the distribution
of microbial activity throughout the bioactive zone is related to population growth and
the resultant increased capacity for salicylate degradation near the inlet. Population
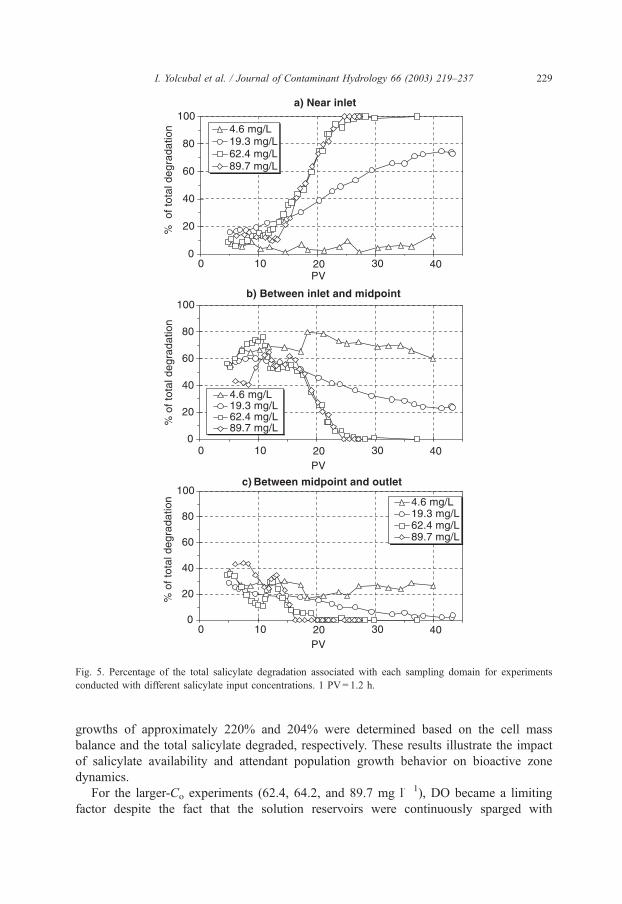
Fig. 5. Percentage of the total salicylate degradation associated with each sampling domain for experiments
conducted with different salicylate input concentrations. 1 PV= 1.2 h.
I. Yolcubal et al. / Journal of Contaminant Hydrology 66 (2003) 219–237 229
growths of approximately 220% and 204% were determined based on the cell mass
balance and the total salicylate degraded, respectively. These results illustrate the impact
of salicylate availability and attendant population growth behavior on bioactive zone
dynamics.
For the larger-Co experiments (62.4, 64.2, and 89.7 mg l� 1), DO became a limiting
factor despite the fact that the solution reservoirs were continuously sparged with

Fig. 6. Cumulative amount of salicylate degraded for each sampling domain for experiments conducted with
different salicylate input concentrations. 1 PV= 1.2 h.
I. Yolcubal et al. / Journal of Contaminant Hydrology 66 (2003) 219–237230
oxygen. As a consequence, the distribution of salicylate biodegradation in the column
was influenced by DO availability. For the first 15 pore volumes, the salicylate
concentration decreased between the inlet, midpoint, and effluent sampling locations
(Fig. 4). This indicates that biodegradation was occurring throughout the entire column.
However, after 15 pore volumes, the bioactive zone began to decrease in size due to
decreasing DO availability coupled with population growth (Fig. 5). After approximately
17–20 pore volumes, there was no measurable biodegradation occurring between the

I. Yolcubal et al. / Journal of Contaminant Hydrology 66 (2003) 219–237 231
midpoint and outlet of the column, as indicated by the coincident plateau concentrations
for the midpoint and effluent breakthrough curves (Fig. 4). After approximately 23–25
pore volumes, there was no measurable biodegradation occurring between the inlet and
midpoint, and essentially all salicylate biodegradation was taking place in the vicinity of
the column inlet. The growth estimates based on the total salicylate degraded for the
64.2 and 89.7 mg l� 1 experiments indicate that microbial population increased 460%
and 280%, respectively. This difference in the growth rate mainly results from
dissimilarity in the total biomass present in the column before the salicylate pulse
was initiated.
In the larger-C0 experiments, dissolved oxygen concentrations in the midpoint and
effluent samples decreased from approximately 40 to 2 mg l� 1 between approximately
12–15 PVs, and remained relatively constant thereafter (Fig. 7). The observed reduction
in oxygen concentration was due to increasing microbial activity near the inlet of the
column. The rebound in salicylate concentration observed for the midpoint and effluent
breakthrough curves for the larger-Co experiments is an indication of the influence of
oxygen constraints on salicylate degradation. The rebound of substrate concentrations
may have been caused by one of several processes. One hypothesis involves the
accumulation and degradation of an intermediate compound that competes for oxygen
in the system. This hypothesis may be valid for the naphthalene experiment, wherein a
significant amount of salicylate (f 3 mg l� 1), which is an intermediate in the degradation
pathway of naphthalene, was detected in the samples. However, in a batch experiment
conducted with salicylate, there was no evidence of intermediate compounds being
present at levels that would provide significant competition for oxygen utilization.
Another hypothesis involves temporal variability in the metabolic status of the microbial
population, which concomitantly may cause a change in metabolic oxygen requirements
with time. For example, it has been shown that substrate degradation to CO2 requires
more oxygen than production of biomass precursors (Bouchez et al., 1995). Thus, it is
possible that the oxygen requirements increased as biodegradation became more con-
strained as metabolic activity shifted from biomass production to CO2 production. The
salicylate-rebound behavior was not observed for the lower-Co experiments, most likely
because overall oxygen demand was lower, thus, preventing DO from becoming a
limiting factor.
For the larger-Co experiments where DO influenced the size of the bioactive zone, a
correlation between the rate of biodegradation and the size of the bioactive zone was
observed. As the bioactive zone decreased in size, the rate of biodegradation within the
bioactive zone initially increased and eventually reached a steady rate. For example,
between approximately 2 and 20 pore volumes, the average rate of biodegradation
increased from 0.24 to 1.4 mg/PV at the near-inlet location for the larger-Co experiments
(Fig. 6). After approximately 20 pore volumes, the average rate of biodegradation
remained the same (2.5 mg/PV). Furthermore, the larger-Co experiments all exhibited a
similar rate of biodegradation after 20 pore volumes, indicating that the maximum
biodegradation potential had been attained under the given conditions within the bioactive
zone (Fig. 6).
Comparable results were obtained for a naphthalene experiment conducted under
conditions equivalent to those of the salicylate experiments (Table 1). Fig. 8 shows the

Fig. 7. DO concentration profile near the inlet and midpoint of the column and in the effluent for the larger-C0
salicylate experiments. 1 PV= 1.2 h.
I. Yolcubal et al. / Journal of Contaminant Hydrology 66 (2003) 219–237232
naphthalene breakthrough curves obtained at all sampling locations. For the first 5 pore
volumes, 25% of the total naphthalene degradation (0.32 mg/PV, Fig. 9) in the column
occurred near the inlet of the column. During the same time, the percentage of naphthalene
degradation occurring between the inlet and midpoint of the column increased from
approximately 25% to 70%, while the percentage of total naphthalene degradation
between the midpoint and outlet of the column decreased from approximately 50% to
5% (Fig. 9).
After 5 pore volumes, naphthalene degradation between the inlet and midpoint of
the column began to decrease and eventually ceased after approximately 9 pore

Fig. 8. Naphthalene breakthrough curves obtained from all sampling locations. The figure insert shows the DO
profile at all sampling locations. 1 PV= 1.1 h.
I. Yolcubal et al. / Journal of Contaminant Hydrology 66 (2003) 219–237 233
volumes (Fig. 9a). Conversely, naphthalene degradation between the midpoint and
outlet of the column started to increase. This temporal variability in microbial activity
reflects the nonuniform distribution of DO within the column. For example, at 9
pore volumes, the DO concentrations at the midpoint sampling location and in the
effluent were approximately 2–3 and 14 mg l� 1, respectively (See Fig. 8 insert). After
the low concentration DO front reached the outlet of the column at approximately 13
pore volumes, naphthalene degradation ceased between the midpoint and outlet.
Thereafter, degradation occurred only near the column inlet at a steady rate of 0.48
mg/PV (Fig. 9).
3.3. Monitoring in situ microbial activity
As shown above for the larger-C0 experiments, the bioactive zone initially
encompassed the entire column, but after several pore volumes it decreased in size,
ultimately shrinking to the immediate vicinity of the column inlet (f 0.2 cm from
inlet). These results clearly illustrate that substrate and electron acceptor availability
influence the location and size of bioactive zones. Monitoring the formation of
bioactive zones in porous media requires intensive sampling and measurement of
substrate and DO concentrations at various locations. In addition, breakthrough curves
represent an integration of the impacts of microbial activity for the entire region
between sampling locations, rather than at a specific sampling location. In this study,
an additional approach that employs bioluminescent bacteria and a multiple fiber-optic
detection system was used to gain insight into the spatial and temporal distributions
of microbial activity in porous media in response to changes in environmental
conditions (e.g., DO and substrate concentrations). The advantages of this method

Fig. 9. Naphthalene degradation associated with each sampling domain (a) percentage of total naphthalene
degradation and (b) the total amount of naphthalene degraded. 1 PV= 1.1 h.
I. Yolcubal et al. / Journal of Contaminant Hydrology 66 (2003) 219–237234
are that it is rapid, noninvasive, and provides localized, in situ measurements of
microbial activity.
Luminescence was continuously measured at five locations (i.e., 0.2, 2.1, 3.1, 5.0,
and 7.5 cm from the inlet of the column) during the naphthalene experiment. The
spatial and temporal distribution of luminescence emitted by P. putida RB1353 in
response to changes in naphthalene and DO concentrations are shown in Fig. 10. The
luminescence response was greatest near the substrate source and decreased with
increasing distance from the inlet of the column, as would be expected given that
the microorganisms near the inlet of the column were exposed to higher naphthalene

Fig. 10. Luminescence emitted by P. putida RB1353 during naphthalene degradation for various monitoring
locations.
I. Yolcubal et al. / Journal of Contaminant Hydrology 66 (2003) 219–237 235
and DO concentrations. For the first 5 h (1 pore volume = 1.12 h), the luminescence
response was detectable at all fiber-optic locations, indicating that microbial activity was
occurring throughout the entire system. The magnitude of the light response at the 0.2-,
2.1-, 3.1-, and 5-cm locations were similar and approximately three times larger than
the light response at the 7.5-cm location. These results suggest that the majority of the
microbial activity occurred between the inlet and midpoint of the column for the first 5
h. This is consistent with the results discussed above for the substrate concentration
data.
After approximately 5 h, the light response started to drop at the 7.5-cm location, and
shortly thereafter at the midpoint of the column (5-cm location). The slow decrease in the
light response observed between 5 and 9 h at the 5-cm location correlates well with the
rebound in the naphthalene breakthrough curve observed for the column midpoint
location (Fig. 11). The decrease in naphthalene degradation rate (i.e., indicated by the
decrease in slope of the cumulative naphthalene degradation curve between 5 and 10
pore volumes, Fig. 9b), and therefore in microbial activity, at this location was a result of
the rapid decline in DO (16 to 2 mg l� 1) that occurred in this zone. The decrease in DO
concentration is attributed to an increase in microbial activity near the inlet of the column
(see Fig. 8 insert) as noted above.
The effect of the increase in DO demand near the inlet of the column was also
observed at upgradient locations (i.e., at 2.1and 3.1 cm), where the luminescence
response rapidly dropped to background levels between 6 and 7 h and remained
constant thereafter. Similarly, after a 1–2 h delay, the luminescence response at the 5-
and 7.5-cm locations rapidly completed their drop to background levels, indicating
that the low concentration DO front reached these measurement locations. This delay

Fig. 11. Comparison of luminescence emitted and naphthalene degraded.
I. Yolcubal et al. / Journal of Contaminant Hydrology 66 (2003) 219–237236
created a momentary nonuniform luminescence response distribution where lumines-
cence, and therefore microbial activity, was only observed at the sampling locations near
the inlet (i.e., 0.2 cm) and between the midpoint and outlet of the column (i.e., 5 and
7.5 cm).
At approximately 9–10 h, the luminescence response at the 5- and 7.5-m locations
reached background levels, while the luminescence response near the inlet of the column
(i.e., 0.2 cm) remained significantly above background. During this time, the rapid drop
in the luminescence response at the midpoint of the column corresponds well to the
convergence of plateau concentrations for the inlet and midpoint breakthrough curves
(Fig. 11). These results suggest that the microbial activity was confined to the vicinity of
the column inlet after approximately 15 h, and agree well with the conclusions drawn
using the substrate concentration data discussed above (Figs. 8 and 9).
4. Summary
Two approaches were used to characterize the formation and dynamics of bioactive
zones in response to changes in local substrate and DO concentrations. The first approach
involved frequent monitoring of the spatial and temporal variability of DO and aqueous
substrate (salicylate and naphthalene) concentrations. The second approach involved real-
time in situ monitoring of microbial activity via detection of the luminescence response
generated by a reporter organism at various locations in the porous medium. The results
obtained from both approaches illustrate that the location and size of bioactive zones in
porous media are influenced by substrate and DO availability. The application of
luminescent reporter organisms in real-time in situ monitoring of microbial activity in
porous media can provide insight concerning how microbial populations respond to

I. Yolcubal et al. / Journal of Contaminant Hydrology 66 (2003) 219–237 237
changes in local environmental conditions. The correlation of the luminescence response
with changes in DO and substrate availability suggest that this approach is useful for
monitoring changes in the specific environmental conditions necessary to maintain optimal
in situ biodegradation in bioactive zones.
Acknowledgements
This research was supported by grants provided by the U.S. EPA. Joint Bioremediation
Program and the National Institute of Environmental Health Sciences Superfund Basic
Research Program.
References
Bouchez, M., Blanchet, D., Vandecasteele, J.-P., 1995. Substrate availability in phenanthrene biodegradation:
transfer mechanisms and influence on metabolism. Microb. Biotechnol. 43, 952–960.
Burlage, R.S., Sayler, G.S., Larimer, F., 1990. Monitoring of naphthalene catabolism by bioluminescence with
nah-lux transcriptional fusions. J. Bacteriol. 172, 4749–4757.
Holden, P.A., Firestone, M.K., 1997. Soil microorganisms in soil cleanup. How can we improve our under-
standing? J. Environ. Qual. 26, 32–40.
Keijzer, H., van Dijke, M.I.J., van der Zee, S.E.A.T.M., 1999. Analytical approximation to characterize the
performance of in-situ aquifer bioremediation. Adv. Water Resour. 23, 217–228.
Mahinthakumar, G., Gwo, J.P., Moline, G.R., Webb, O.F., 1999. Subsurface biological active zone detection
using genetic search algorithms. J. Environ. Eng. 125, 1103–1112.
National Research Council, 1993. In-situ Bioremediation: When Does It Work? National Academy Press, Wash-
ington, DC.
Neidhardt, F.C., Ingraham, J.L., Schaechter, M., 1990. Physiology of the Bacterial Cell. A Molecular Approach.
Sinauer Associates, Sunderland, MA.
Neilson, J.W., Pierce, S.A., Maier, R.M., 1999. Factors influencing the expression of luxCDABE and NAH7
genes in Pseuodomonas putida RB1353 (NAH7, pUTK9). Appl. Environ. Microbiol. 65, 3473–3482.
Odencrantz, J.E., Wookeun, B., Valocchi, A.J., Rittmann, B.E., 1990. Stimulation of biologically active zones
(BAZ’s) in porous media by electron-acceptor injection. J. Contam. Hydrol. 6, 37–52.
Sandrin, S.K., Jordan, F.L., Maier, R.M., Brusseau, M.L., 2001. Biodegradation during contaminant transport in
porous media: 4. Impact of microbial lag and bacterial cell growth. J. Contam. Hydrol. 50, 225–242.
Schell, M.A., 1990. Regulations of the naphthalene degradation genes of plasmid NAH7: example of a gener-
alized positive control system in Pseuodomonas and related bacteria. In: Silver, S., Chakrabartym, A.M.,
Iglewski, B., Kaplan, S. (Eds.), Pseudomonas: Biotransformations, Pathogenesis, and Evolving Biotechnol-
ogy. American Society for Microbiology, Washington, DC, pp. 165–176.
Wookeun, B., Odencrantz, J.E., Rittmann, B.E., Valocchi, A.J., 1990. Transformation kinetics of trace-level
halogenated organic contaminants in a biologically active zone (BAZ) induced by nitrate injection. J. Contam.
Hydrol. 6, 53–68.
Yen, K., Serdar, C.M., 1988. Genetics of naphthalene catabolism in pseudomonads. Crit. Rev. Microbiol. 15,
247–268.
Yolcubal, I., 2000. In-situ monitoring of microbial activity and biodegradation during solute transport in porous
media. PhD thesis, University of Arizona.
Yolcubal, I., Piatt, J.J., Pierce, S.A., Brusseau, M.L., Maier, R.M., 2000. Fiber optic detection of in-situ lux
reporter gene activity in porous media: system design and performance. Anal. Chim. Acta 422, 121–130.
Related Documents