International Journal of Education and Research Vol. 9 No. 5 May 2021 55 THE INFLUENCE OF PRODUCT STRATEGY ON PERFORMANCE OF PEPSI-COLA (EA) LIMITED IN KENYA Simba Paul Arati* Department of Management and Economics School of Business and Economics Jaramogi Oginga Odinga University of Science and Technology (JOOUST) Rose Kisia** Department of Tourism and Hospitality School of Business and Economics Jaramogi Oginga Odinga University of Science and Technology (JOOUST) Caroline Sitienei Koech*** Department of Management and Economics School of Business and Economics Jaramogi Oginga Odinga University of Science and Technology (JOOUST) Abstract Marketing strategy is the fundamental goal of increasing sales and achieving a sustainable competitive advantage of a brand. Pepsi Cola (EA) Limited is an international food and beverage firm based in Kenya. However, despite several attempts to penetrate the local market, Pepsi has performed dismally and this is the ground on which this study is anchored. The study sought to establish the influence of product strategy on performance of Pepsi-Cola (EA) Limited in Kenya. The study wasguided by the following theories: Porter’s Competitive Business Strategy Typology, Ansoff’s Product-Market Strategies and Contingency theory in explaining the relationship between marketing strategy and performance. Stratified random sampling was used to select a sample size of 150 respondents. Primary data was obtained through questionnaires and interview schedule. Both descriptive and inferential statistics were used in the analysis of data. Cronbach’s Alpha of 0.85 was used to test instrument reliability. The findings showed that product strategy explains 60.3% (R 2 = 0.603) of the variation in performance of the organization. The findings also showed that the Product strategy was statistically significant: (F=225.103, p=0.000 b ). Thus, the null hypothesis that product strategy has no significant influence on performance is rejected. The above R 2 results show that, the model is stable for prediction. In conclusion, product strategy significantly affect performance of Pepsi Cola (EA) Limited. The study will be significant in the management of soft drink companies. Policy makers and regulators may use it. It can also form a basis for further research. 1.0 Introduction The contemporary business environment has been greatly affected by dynamic turbulence and competition which are highly influenced by globalization. This dynamism demands that organizations constantly review and modernize their approaches to management and keep their focus on the delivery of value. Enhanced competition requires increased efficiency and effectiveness to win the highly informed and empowered consumers who have easy access to global

Welcome message from author
This document is posted to help you gain knowledge. Please leave a comment to let me know what you think about it! Share it to your friends and learn new things together.
Transcript

International Journal of Education and Research Vol. 9 No. 5 May 2021
55
THE INFLUENCE OF PRODUCT STRATEGY ON PERFORMANCE OF PEPSI-COLA (EA) LIMITED IN KENYA
Simba Paul Arati* Department of Management and Economics
School of Business and Economics Jaramogi Oginga Odinga University of Science and Technology (JOOUST)
Rose Kisia**
Department of Tourism and Hospitality School of Business and Economics
Jaramogi Oginga Odinga University of Science and Technology (JOOUST)
Caroline Sitienei Koech*** Department of Management and Economics
School of Business and Economics Jaramogi Oginga Odinga University of Science and Technology (JOOUST)
Abstract Marketing strategy is the fundamental goal of increasing sales and achieving a sustainable competitive advantage of a brand. Pepsi Cola (EA) Limited is an international food and beverage firm based in Kenya. However, despite several attempts to penetrate the local market, Pepsi has performed dismally and this is the ground on which this study is anchored. The study sought to establish the influence of product strategy on performance of Pepsi-Cola (EA) Limited in Kenya. The study wasguided by the following theories: Porter’s Competitive Business Strategy Typology, Ansoff’s Product-Market Strategies and Contingency theory in explaining the relationship between marketing strategy and performance. Stratified random sampling was used to select a sample size of 150 respondents. Primary data was obtained through questionnaires and interview schedule. Both descriptive and inferential statistics were used in the analysis of data. Cronbach’s Alpha of 0.85 was used to test instrument reliability. The findings showed that product strategy explains 60.3% (R2 = 0.603) of the variation in performance of the organization. The findings also showed that the Product strategy was statistically significant: (F=225.103, p=0.000b). Thus, the null hypothesis that product strategy has no significant influence on performance is rejected. The above R2 results show that, the model is stable for prediction. In conclusion, product strategy significantly affect performance of Pepsi Cola (EA) Limited. The study will be significant in the management of soft drink companies. Policy makers and regulators may use it. It can also form a basis for further research. 1.0 Introduction The contemporary business environment has been greatly affected by dynamic turbulence and competition which are highly influenced by globalization. This dynamism demands that organizations constantly review and modernize their approaches to management and keep their focus on the delivery of value. Enhanced competition requires increased efficiency and effectiveness to win the highly informed and empowered consumers who have easy access to global

ISSN: 2411-5681 www.ijern.com
56
products and information. Various strategies including generic and brand strategies have been employed by firms for competitive advantage to outperform one another for customer satisfaction through dynamism in creativity and innovation (Faulkner & Segal-Horn, 2010; Newman et al., 2016; Pearce & Robinson, 2011). In an increasingly dynamic and information-driven environment, the quest by business leaders and management researchers for performance measures, which reflect competitive productivity strategies, quality improvements, and speed of service, is at the forefront of managing company performance. To be meaningful, company performance should be judged against a specific objective to see whether the objective is achieved. Without an objective, a company would have no criterion for choosing among alternative investment strategies and projects. For instance, if the objective of the company were to maximize its return on investment, the company would try to achieve that objective by adopting investments with return on investment ratios greater than the company's current average return on investment ratio (Burrell & Morgan, 2011). The selection of the most appropriate performance indicators is however, an area with no defining boundaries as there are a number of purposes to which performance measurement can be put, although not all performance measurement can be used for all purposes (Neely, 2002). There are several points of departure that can be used to assess performance of a business. These include, among others, accounting perspective that concern assessment of financial measures of performance, marketing perspective that concern assessment of marketing inputs and operations perspective that concern assessment of effectiveness and efficiency (Neely, 2002). Apart from purely accounting-based assessment, all the assessment systems are increasingly using non-financial indicators as to help analyses especially the concept of Balanced Scorecard by (Kaplan & Norton, 1992). Kotler (1999) emphasizes the position of marketing to even argue that, in the future, marketing has the main responsibility for achieving profitable revenue growth for the company. Today cost-efficiency does not provide long-term competitive advantage for companies whereas marketing, when well conducted, does. Especially in the field of strategic marketing, benefits are still largely waiting for realization. Marketing has traditionally been viewed and treated more as an operational rather than strategic function in companies. It has focused on decisions related to analysing and selecting target markets, product and brand development, promotion, and channels of distribution (Hunt & Morgan, 1995). 1.1 Statement of the Problem The Soft Drinks industry in Kenya is presently characterized by competition among firms of varying sizes, product ranges and business strategies. The industry is capital intensive and requires financial resources to ensure brand recognition (Wangechi, 2011). Such high initial costs are definite barrier to entry before the consideration of high marketing costs that include expensive advertising, hence being the main reason Softa bottling company in 1998 was out of the market within a year of entry (Baldridge, 2011). Currently, the industry is in the tight grip of global giant Coca-Cola although the US multinational Pepsi Cola and London based SAB Miller is also holding on. The stiff competition among companies and the entry of other players into the industry necessitate the design of effective marketing strategies to enhance performance (Owino, 2002). Pepsi is an international food and beverage firm based in Kenya; its products are similar to those of Coca-Cola however despite several attempts to penetrate the local market Pepsi has performed dismally. In the 70s, Pepsi Company introduced its products into the Kenyan market but failed to gain any substantial market share, the firm lost money and was forced to close shop and pull out of the Kenyan Market. Today Pepsi is back in Kenya four decades later and still struggling to compete effectively in the soft drinks industry. Under the prevailing circumstances, it is important to understand the factors that contribute to the challenges that the company is facing in the Kenyan

International Journal of Education and Research Vol. 9 No. 5 May 2021
57
market. This study therefore investigated the effect of marketing strategy on performance of Pepsi-Cola (EA) Limited in Kenya. 1.2 Objective of the Study To establish the influence of product strategy on performance of Pepsi-Cola (EA) Limited.
1.3 Research Hypotheses The following null hypotheses guided the study; Ho1: Product strategy has no significant influence on performance of Pepsi-Cola (EA) Limited
2.0 LITERATURE REVIEW
2.1 Theoretical Framework This study focuses on the following theories: Porter’s Competitive Business Strategy Typology, Ansoff’s Product-Market Strategies and Contingency theory in explaining the relationship between product strategy and performance of Pepsi Cola. 2.1.1 Porters Theory of Five Forces Michael Porter founded Porter’s competitive business strategy typology in 1980. Porter states that strategy target either cost leadership, differentiation or focus and that a firm must only choose one of the three strategies or risk waste of precious resources. According to Lu, Shen, & Yam, (2008), Porter’s theory is useful in understanding the competitiveness of organization suggesting that competitive advantage stems from the competitive strategies adopted to deal with strength, weaknesses, opportunities and threats facing an organization. Anupkuma, (2005) states that Porter’s (1980) strategic theory postulates that to succeed in business a firm need to adopt generic competitive strategies comprising of cost leadership, differentiation and focus. Kenya has adopted these strategies simultaneously unlike Porter’s assumption of exclusive application of these strategies. Similarly, it was notable that most of the manufacturing firms preferred to use differentiation strategy compared to that of cost leadership and focus respectively. The study implies that managers need to assess the main driving forces and find a competitive and marketing strategy that can match competition and influence driving forces in the actual market area. 2.1.2 Ansoff’s’ Product-Market Strategies Ansoff, (1965) presented a matrix that focused on a firm’s present and potential products and markets or customers. In market penetration, the firm seeks to achieve growth with existing products in their current market segments aiming to increase its market share. In market development, the firm seeks growth by targeting its existing products to new market segments. In product development, the firm develops new products targeted to its existing market segments. In diversification, the firm grows by diversifying into new businesses by developing new products for new markets. To portray alternative corporate growth strategies, Ansoff (1965), presented a matrix that focused on the firm's present and potential products and markets (customers). 2.1.3 Contingency Theory Contingency theory pre-supposes that under different circumstances different strategies may prove effective instead of propagating universally applicable organization-management principles, the

ISSN: 2411-5681 www.ijern.com
58
theory tries to demonstrate that different circumstances require different organizational structures. A fundamental idea behind contingency theory is that organizational viability is dependent on a fit between the organization and its environment. In order for the organization to be viable, it must be able to visualize and incorporate the ‘contingencies’ of its environment into its premises. Moreover, to have success in a rapidly changing and dynamic environment, the organization must be flexible, internally dynamic and have the capability to renew and innovate (Bakar, Tufai, Yusof, & Virgiyanti, 2011). 2.2 The Concept of Product Strategy and Firm Performance Kotler & Armstrong, (2013) noted that product is anything that can be offered to a market for attention, acquisition, use, or consumption hence satisfying customers want or need. Ferrell, (2005) assert that product is a marketing mix strategy in which organizations offers consumers symbolic and experiential attributes to differentiate products from competitors. Gbolagade, Adesol, & Oyewale, (2013) researched on impact of marketing strategy on business performance a study of selected small and medium enterprises SME’s in Oluyole local government, Ibadan, Nigeria. It was established that there was a significant influence between product and business performance. Quality is an important element in the design and manufacture of products which are considered superior to those of competitors and that customers increasingly expect products to be of high quality. Hence, product quality is often considered to contribute to the development of a firm’s competitive advantage (Poh, Ghazali, & Mohayidin, 2011). In a study of the effect of product quality on business performance in some Arab Companies. Mahmood & Fatimah, (2014) found that product extrinsic value influences external performance and product intrinsic value influences internal performance. Ampuero & Vila, (2006) argue that product package contains visual and sensual attributes which communicate to consumer and due to the fact that it has a direct contact with the product, it protects, preserves and identifies the product. Good package design therefore requires knowledge of materials, their properties, manufacturing methods and conversion process. Package design not only increases the visibility of the product it also helps in easy recognition of the product, revitalize the brand and lead to increase in sales (Immonen, 2010). Package designs has an effect on consumer belief about the products and consumption beliefs leading to higher purchase decision and increase in sales volume (Horsky & Honea, 2012). In a study of the influence of visual packaging design on perceived food product quality, value, and brand preference, Edward (2013) found that attitudes toward visual packaging directly influence consumer-perceived food product quality and brand preference. Holmes & Aswan (2012), in a research on consumer reaction to new package design, found that a combination of product quality and price influences customers purchase intention. Packaged goods that are priced low receive less attention than products that are high priced. In addition, studies have also suggested that customer attitude towards product package and quality influences their purchase decision to buy products that have low prices (Holmes et al., 2012). Yi, (2015) argues that brand identity influences band equity thus creating customer appeal and visual image about a particular brand. Deborah, (2016) conducted a research on the effect of consumer-based brand equity on firm’s financial performance. It was established that brand loyalty, awareness and image has a significant positive effect on profitability whereas brand quality has a negative effect on financial performance. In a study of the impact of sales promotion and product branding on company performance, in which, 60 employees were sampled and data collected using survey questionnaires and analysed using chi-square (x2), Musibau, Choi, & Oluyinka, (2014) found that product branding and sales promotion affect organizational growth. The findings reveal significant relationship between product strategy and performance, but very little if any research has been done on the influence of product strategy on performance of Pepsi brand.

International Journal of Education and Research Vol. 9 No. 5 May 2021
59
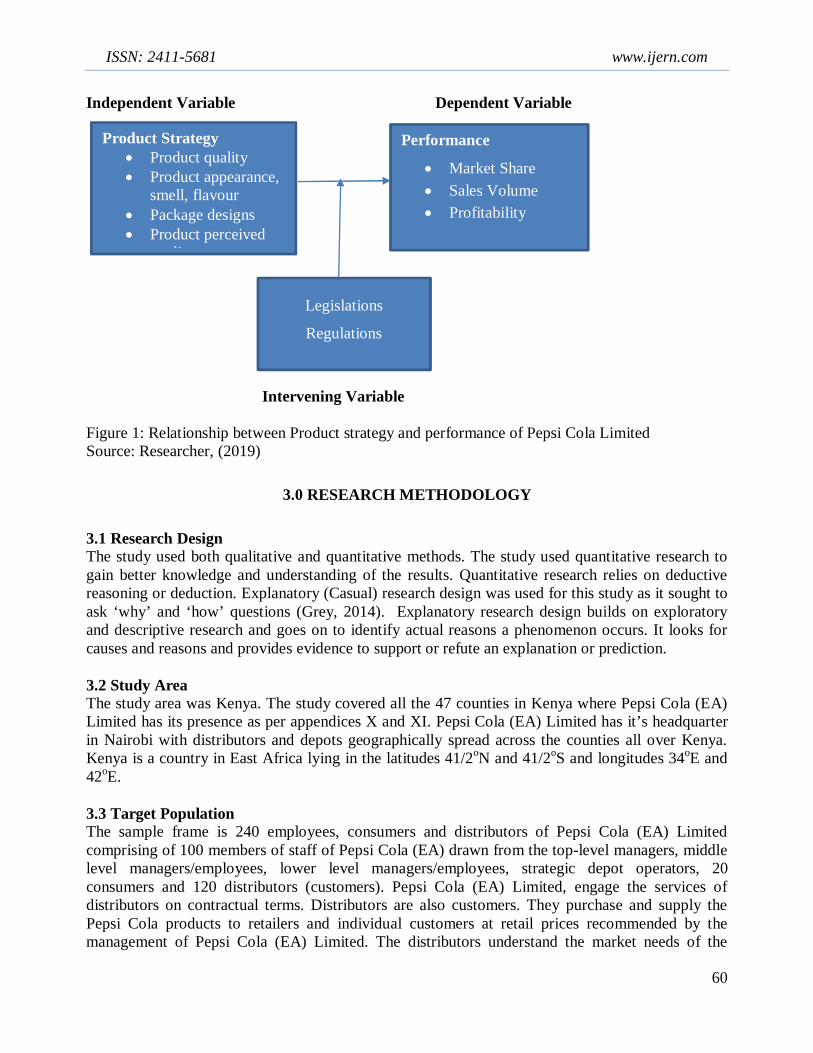
2.3 Performance (Market share; sales volume and profitability) As earlier stated, performance comprises the actual output or results of an organization as measured against its intended outputs (or goals and objectives). Strategic managers are concerned about success of a product as well as the financial results of market competition, which is reflected in profit, or market share. Performance outcomes result from success or market position achieved (Hooley et al., 2001). Performance can be determined in various ways. It might stand for financial performance, market performance, customer performance or overall performance, at least. The term business performance is mainly used as a general performance measure. Financial performance literally refers to financial measures, such as profit margin and return on investment (ROI). Market performance includes e.g. measures of market share and sales volume. Additionally, superior performance in this study refers to performance that exceeds that of its closest competitors (Hunt and Morgan, 2001). Specially, superior market performance probably, but not necessarily, results in superior financial performance (Hooley et al., 2001). Market size, growth rate and overall profitability are three economic indicators that can be used to evaluate the soft drink industry, while non-financial performance include market share, production innovation and technological efficiency, organizational learning and awareness of the product and firm. 2.4 Regulations and Legislations This Kenya Bureau of Standards was developed by the Technical Committee on Flavoured soft drink under the guidance of the Standards Projects Committee, and it is in accordance with the procedures of the Kenya Bureau of Standards. This standard covers all types of Flavoured soft drinks made from water, permitted sweetening agents either nutritive or non-nutritive sweeteners used singly or in combination and permitted food additives, natural or synthetic colourings, flavouring emulsions, among other permitted ingredients. Flavoured soft drinks shall be distinguished from carbonated soft drinks, fruit squashes, fruit juices fruit-based soft drinks and flavoured water through appropriate labelling. The standard stipulates the chemical, microbiological and other quality limits for flavoured soft drinks. Labelling requirements of Water-Based flavoured drinks have been incorporated in this standard to prevent any misrepresentations of the products through, say, fruit pictorials on the labels. In Kenya, parliament carries the legislative agenda on soft drinks while Kenya bureau of standards regulates. 2.5 Conceptual Framework This study was guided by the following theories: Porter’s Competitive Business Strategy Typology, Ansoff’s Product-Market Strategies and Contingency theory in explaining the relationship between marketing strategy and performance of Pepsi Cola. The independent variable was Product Strategy with dependent variable being Performance of Pepsi-Cola Limited in Kenya. Porter (1985) avers that the generic strategy of focus rests on the choice of a narrow competitive scope within an industry. The study implies that managers need to assess the main driving forces and find a competitive and marketing strategy that can match competition and influence driving forces in the actual market area. The development of new markets for the product may be a good strategy if the firm’s core competencies are related more to the specific product than to its experience with a specific market segment. The contingency theory of organizations holds that the organizational characteristics need to fit the level of the- contingency variables of the organization for that organization to have high performance (Donaldson, 2000).
ISSN: 2411-5681 www.ijern.com
60
Independent Variable Dependent Variable Intervening Variable Figure 1: Relationship between Product strategy and performance of Pepsi Cola Limited Source: Researcher, (2019)
3.0 RESEARCH METHODOLOGY
3.1 Research Design The study used both qualitative and quantitative methods. The study used quantitative research to gain better knowledge and understanding of the results. Quantitative research relies on deductive reasoning or deduction. Explanatory (Casual) research design was used for this study as it sought to ask ‘why’ and ‘how’ questions (Grey, 2014). Explanatory research design builds on exploratory and descriptive research and goes on to identify actual reasons a phenomenon occurs. It looks for causes and reasons and provides evidence to support or refute an explanation or prediction. 3.2 Study Area The study area was Kenya. The study covered all the 47 counties in Kenya where Pepsi Cola (EA) Limited has its presence as per appendices X and XI. Pepsi Cola (EA) Limited has it’s headquarter in Nairobi with distributors and depots geographically spread across the counties all over Kenya. Kenya is a country in East Africa lying in the latitudes 41/2oN and 41/2oS and longitudes 34oE and 42oE. 3.3 Target Population The sample frame is 240 employees, consumers and distributors of Pepsi Cola (EA) Limited comprising of 100 members of staff of Pepsi Cola (EA) drawn from the top-level managers, middle level managers/employees, lower level managers/employees, strategic depot operators, 20 consumers and 120 distributors (customers). Pepsi Cola (EA) Limited, engage the services of distributors on contractual terms. Distributors are also customers. They purchase and supply the Pepsi Cola products to retailers and individual customers at retail prices recommended by the management of Pepsi Cola (EA) Limited. The distributors understand the market needs of the
Product Strategy Product quality Product appearance,
smell, flavour Package designs Product perceived
quality
Performance
Market Share Sales Volume Profitability
Legislations
Regulations

International Journal of Education and Research Vol. 9 No. 5 May 2021
61
customers and the producers. According to Mugenda & Mugenda, (2003), a population is the entire set of relevant units or elements that a researcher tends to study. According to Cooper and Schindler (2014), a sampling frame is a list of elements from which a sample is drawn. A sampling frame is the source material from which a sample is drawn. It represents a list of all elements within a population that can be sampled (Zikmund & Babin, 2012).Pepsi cola (EA) distributors/customers in the 47 counties of Kenya were targeted for interviews using the interview schedules. 3.4 Sample Size and Sampling Technique The study used stratified random sampling. According to Kothari, (2004), sampling technique is the process of selecting a number of respondents for study. Stratified random sampling is the process of stratification hence creating a stratum based on income level, management level, and life stages (Sekaran & Bougie, 2013). Stratification is used to reduce standard error and provide some control over variance. The target population was divided into a stratum which included; top level managers, middle level managers and marketing representatives. Polit, Beck, & Hungler,, (2001), a sample size is a proportion of a population. A sample size is a smaller set of the larger population. Use of a sample enables a researcher to save time and money hence get more detained information for its respondents. Sample size was drawn using the Yamane formula (1967) given below:
푛 =( )
Where n = number of samples, N = total population and e = error margin / margin of error.
푛 =( . )
푛 = 150 Table 1: Sample Size Distribution Management Target Population Sample Size Percentage (%)
Top Level Managers 12 7 5
Middle Level Managers/employees
27 17 11
Lower Level Managers/employees
25 16 10
Strategic Depot Operators/Managers
36 22 15
Distributors/Customers 120 75 50
Consumers 20 13 9
Total 240 150 100
Source: Pepsi Cola Limited Nairobi, (2019)

ISSN: 2411-5681 www.ijern.com
62
Distributors are the main customers of the company. They purchase in bulk and sell to retailers and individuals who do not have direct access to the company. Pepsi cola (EA) has 120 distributors spread across the country. However, only 75 distributors/customers were sampled for the study. The distributors were sampled by applying the sample size of n (150) across the sample strata. Although according to Mugenda and Mugenda (2003), a sample size of 10%-20% is acceptable in a descriptive research. Applying the sample size of 150 on the sample strata, 13 consumers were picked and interviewed. The consumers were mainly from Nairobi, Mombasa, Machakos, Nakuru, Kisii, Eldoret and Kisumu. Consumers are the end users of the Pepsi products. They are individuals who get the Pepsi products from retailers and distributors. The strategic depot operators/managers are employees of Pepsi Cola (EA) Limited in charge of various Pepsi Cola (EA) Limited depots in Kenya. The distributors access the Pepsi Cola (EA) Limited products through these depots. 3.5 Data Collection Methods 3.5.1 Questionnaire According to Cooper and Schindler (2014), data collection is the systematic and calculated gathering of information based on research variables. Closed ended questionnaires was used to collect primary data. A questionnaire is a data collection tool that is designed to collect structured and unique data from respondents. Questionnaire is a powerful instrument that assists the researcher to collect data from non-public and non-personal way (Cooper et al., 2014). A letter of introduction was obtained to enable the researcher collect data. Questionnaires were self-administered. Ample time was provided to respondents to answer the questionnaire. Respondents were also informed that information received was confidential and only used for academic purpose. 3.5.2 Interview Schedule Data collection was also conducted using interview schedule. The interview schedule was used by the interviewer during the face-to-face interaction. The interview schedule captured the questions on product, price, promotion strategies as well as questions on the performance of Pepsi cola (EA) Limited. The interviewer recorded the answers to those questions. Essentially, the interview schedule was structured to probe the interviewees further on issues not captured in the questionnaire as well as to probe the interviewees on more details on the issues captured on the questionnaire. 3.6 Validity and Reliability of Data Collection Instrument Data collection instrument was exposed to research experts including research supervisors to critique for clarity and ability to collect data. The study used a pilot study to check for accuracy and clarity. (Mugenda & Mugenda, 2003) suggest that use of a pilot study enable a researcher to identify errors and make required changes. Pretesting was done for reliability. Pilot test was conducted on 10 distributors of Pepsi Cola (EA) Limited based in both Nairobi and Machakos counties who were not selected as respondents in the study and on 5 senior management staff members from Coca cola (Africa) also based in Nairobi who were not selected as respondents in the study. This was done to avoid bias. The results obtained during the pilot testing exercise was not meant for data analysis of this study. Feedback received from the pilot study was used to improve the questionnaire and the interview schedule before distributing the final copy to the actual respondents. To confirm the reliability of the instrument in this study, Cronbach’s Alpha (Cronbach, 1951) was used. The instrument was found reliable at Cronbach’s Alpha of 0.85, hence the instrument was accepted.
International Journal of Education and Research Vol. 9 No. 5 May 2021
63
3.7 Data Analysis Methods According to Cooper and Schindler (2014), data analysis is the process where collected data is reduced to a more controllable and convenient size, and a researcher can start to identify trends or patterns, apply statistical techniques and give a summary of the data. Collected data was sorted and coded. Statistical Package for Social Sciences (SPSS) aided data analysis. Descriptive and inferential statistics, was used to analyse data. Descriptive statistics show the summary of variable measurements presented in terms of central tendency, variability, frequency distribution (dispersion) and symmetry (normality). Central tendency measures include the mode, mean and median. Variability is expressed in terms of range, variance and standard deviation, while frequency distribution is expressed in terms of tables, graphs, bar charts and percentages, and symmetry is denoted by skewness and kurtosis (Gaurav & Kothari, 2014). Inferential statistics is а technique used by researchers to study samples and make generalizations about the population (Zulfiqar & Bala, 2016). Pearson correlation and regression analysis was used, since the study focused on the relationship between the variables: products, price, promotion, place and brand preference (independent variables) and performance (dependent variable). Bivariate analysis was done using Pearson correlation analysis (O’Connor, 2011) and as well as regression analysis. However, the variables were also individually analysed using linear regression analysis to assess their individual relationship with performance of Pepsi Cola (EA) Limited.The regression model that was used is presented below: Y=β0+β1X1 + ε β0- is constant β0- β5 coefficient of regression WhereY = Performance X1 = ProductStrategy ε = ErrorTerm 3.8 Regression Assumptions 3.8.1 Normality Normality is considered as one of the most fundamental assumptions in multivariate analysis and is characterized as the shape of the data distribution for an individual metric variable and its correspondence to the normal distribution, the benchmark for statistical methods. According to Tabachnick & Fidell, (2007), normality can occur both at the univariate and multivariate levels. In case of the univariate normality distribution of the individual variable is involved, whereas, in case of the multivariate normality distribution of two or more variables is involved. An odd distribution may affect the analyses and interpretation of the results. With regard to identifying the normality distribution, the researcher may analyze histogram and normal probability plots. The normal probability plot visually compares the actual cumulative data scores against a normal cumulative distribution. Tabachnick & Fidell, (2007) highlighted that in case of normal distribution, the line representing the actual data distribution strongly adheres to the diagonal lines. Further, skewness and kurtosis in a dataset need to be examined in order to identify non-normality (Tabachnick & Fidell, 2007). Thus, skewness and kurtosis in the dataset will be examined in order to identify non-normality or normality.
ISSN: 2411-5681 www.ijern.com
64
4.0 RESULTS AND DISCUSSIONS
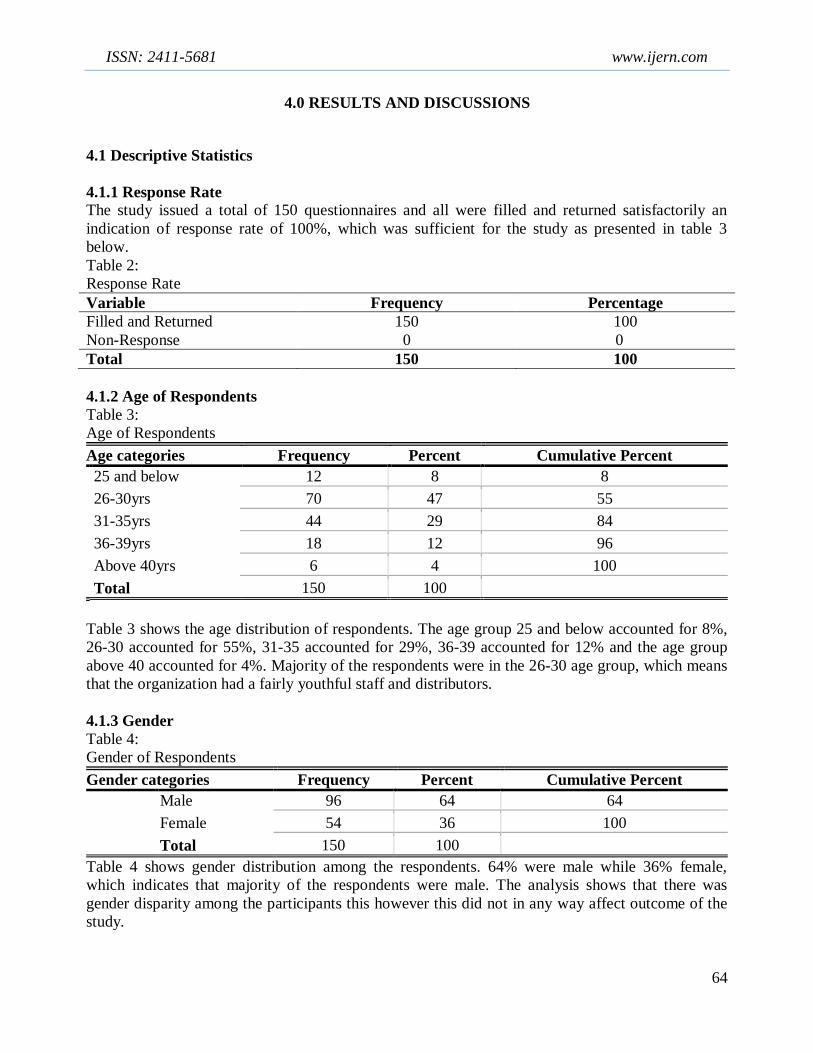
4.1 Descriptive Statistics 4.1.1 Response Rate The study issued a total of 150 questionnaires and all were filled and returned satisfactorily an indication of response rate of 100%, which was sufficient for the study as presented in table 3 below. Table 2: Response Rate Variable Frequency Percentage Filled and Returned 150 100 Non-Response 0 0 Total 150 100 4.1.2 Age of Respondents Table 3: Age of Respondents Age categories Frequency Percent Cumulative Percent 25 and below 12 8 8 26-30yrs 70 47 55 31-35yrs 44 29 84 36-39yrs 18 12 96 Above 40yrs 6 4 100 Total 150 100
Table 3 shows the age distribution of respondents. The age group 25 and below accounted for 8%, 26-30 accounted for 55%, 31-35 accounted for 29%, 36-39 accounted for 12% and the age group above 40 accounted for 4%. Majority of the respondents were in the 26-30 age group, which means that the organization had a fairly youthful staff and distributors. 4.1.3 Gender Table 4: Gender of Respondents Gender categories Frequency Percent Cumulative Percent
Male 96 64 64 Female 54 36 100 Total 150 100
Table 4 shows gender distribution among the respondents. 64% were male while 36% female, which indicates that majority of the respondents were male. The analysis shows that there was gender disparity among the participants this however this did not in any way affect outcome of the study.
International Journal of Education and Research Vol. 9 No. 5 May 2021
65
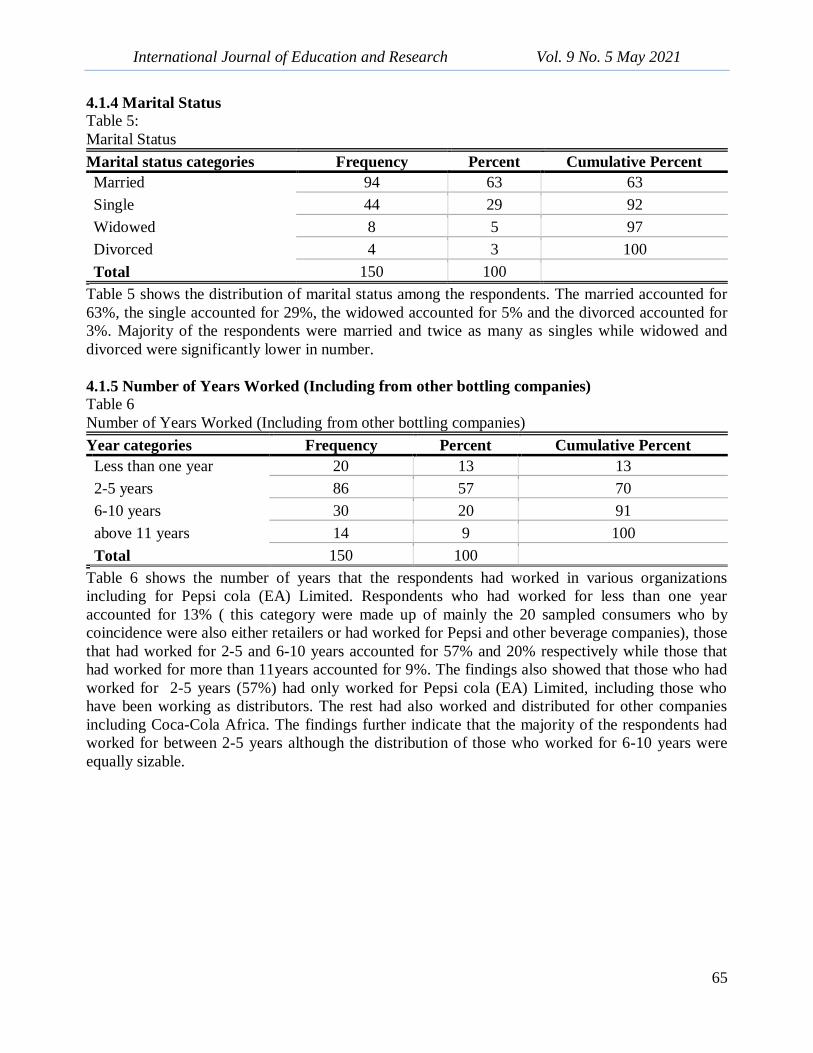
4.1.4 Marital Status Table 5: Marital Status Marital status categories Frequency Percent Cumulative Percent Married 94 63 63 Single 44 29 92 Widowed 8 5 97 Divorced 4 3 100 Total 150 100
Table 5 shows the distribution of marital status among the respondents. The married accounted for 63%, the single accounted for 29%, the widowed accounted for 5% and the divorced accounted for 3%. Majority of the respondents were married and twice as many as singles while widowed and divorced were significantly lower in number. 4.1.5 Number of Years Worked (Including from other bottling companies) Table 6 Number of Years Worked (Including from other bottling companies) Year categories Frequency Percent Cumulative Percent
Less than one year 20 13 13 2-5 years 86 57 70 6-10 years 30 20 91 above 11 years 14 9 100 Total 150 100
Table 6 shows the number of years that the respondents had worked in various organizations including for Pepsi cola (EA) Limited. Respondents who had worked for less than one year accounted for 13% ( this category were made up of mainly the 20 sampled consumers who by coincidence were also either retailers or had worked for Pepsi and other beverage companies), those that had worked for 2-5 and 6-10 years accounted for 57% and 20% respectively while those that had worked for more than 11years accounted for 9%. The findings also showed that those who had worked for 2-5 years (57%) had only worked for Pepsi cola (EA) Limited, including those who have been working as distributors. The rest had also worked and distributed for other companies including Coca-Cola Africa. The findings further indicate that the majority of the respondents had worked for between 2-5 years although the distribution of those who worked for 6-10 years were equally sizable.

ISSN: 2411-5681 www.ijern.com
66
4.1.6 Respondents Level of Education Table 7: Level of Education Education categories Frequency Percent Cumulative Percent PhD 6 4 4 Diploma 56 37 41 Degree 58 39 80 Masters 18 12 92 Certificate 12 8 100 Total 150 100
Table 7 shows the distribution of respondents based on certificate, diploma, degree, masters and PhD education level. Respondents with certificate level of education accounted for 8%, diploma accounted for 37%, degree accounted for 39%, masters accounted for 12% and PhD accounted for 4%. Majority of the respondents had degree and diploma levels of education at 39% and 37% respectively. 4.1.7 Respondents Work Department/Functions Table 8: Respondents Work Department/Functions Work department categories Frequency Percent Cumulative Percent
Finance 13 9 9 Production 14 9 18 Marketing 35 23 41 Distributors 75 50 91 Consumers 13 9 100 Total 150 100
Table 8 shows the distribution of respondents based on related department of work and activities or functions. 9% of the respondents worked for the production department, 23% worked for the marketing department, 9% were in the finance department while the distributors who are also the customers of Pepsi cola (EA) Limited accounted for 50%. 9% were consumers. Majority of the respondents worked in the production department followed by marketing, distributors, consumers and finance in that order. 4.2 Results for Hypothesis Testing: 4.2.1 Hypothesis 1: The product strategy has no significant influence on the performance of Pepsi-Cola (EA) Limited. The study sought to establish whether there is any significant influence of product strategy on performance of Pepsi-Cola (EA) Limited.
In establishing whether and if product strategy influences the performance of Pepsi-Cola (EA) Limited, the results in table 11 shows that of all the individuals interviewed, the majority made up of 72% agreed; 12.7% strongly agreed; 9.3% were neutral and only 4% disagreed and 2% strongly

International Journal of Education and Research Vol. 9 No. 5 May 2021
67
disagreed. All the same individuals when interviewed through interview schedule on face-to-face basis agreed that product strategy has strong influence on the performance of Pepsi-Cola (EA) Limited. These results agree with Gbolagade, Adesol, & Oyewale, (2013) who researched on the impact of marketing strategy on business performance a study of selected small and medium enterprises SME’s in Oluyole local government, Ibadan, Nigeria. It was established that there was a significant influence between product and business performance. However, it disagrees with the results of Mahmood & Fatimah, (2014) in a study of the effect of product quality on business performance in some Arab Companies that categorized the influence of product strategy on performance on the basis of extrinsic and intrinsic values. 4.2.1.1 Regression Equation With regard to the above objective, a linear regression model was performed as shown below. Table 9 Frequency table on Regression Equation -----------------------------------------------------------------------------------
Since the correlation coefficient, R is 0.777a and is closer to +1, then the two variables: product and performance are closely related. At the same time, since the R Square of the model is 0.603, then approximately 0.603 of the observed variations can be explained by the model’s inputs.

ISSN: 2411-5681 www.ijern.com
68
Since the p-value (0.000b) for the F-test (225.103) of overall significance test is less than the significance level, the null-hypothesis is rejected and the conclusion is that this model provides a better fit than the intercept only model.
The findings further show that the unstandardized beta coefficient value of product strategy is 0.495. This means that for every one-unit increase in product strategy (independent variable), performance (dependent variable) increases by 0.495 units. Subsequently the equation of the regression model is represented as follows: Y= 2.313 + 0.495X1 Where; Y = Performance X1 represents Product Strategy The p-value is less than 0.05, i.e. p≤0.05 which is statistically significant. Thus, a p-value of 0.000 indicates strong evidence against the null hypothesis. We therefore reject the null hypothesis and accept the alternative hypothesis. 4.3 Summary of Hypothesis Testing Results Table 10: Analysis of Research Hypothesis Research Hypothesis β t Sig. Comments Ho1 Product strategy has no
significant influence on performance of Pepsi-Cola (EA) Limited
0.216 3.923 0.000 Rejected/Alternative

International Journal of Education and Research Vol. 9 No. 5 May 2021
69
5.1 Summary of Findings In establishing whether product strategy influences the performance of Pepsi-Cola (EA) Limited, the results showed that of all the individuals interviewed, the majority made up of 72% agreed; 12.7% strongly agreed; 9.3% were neutral and only 4% disagreed and 2% strongly disagreed. The study therefore revealed that, product strategy has significant influence on the performance of Pepsi-Cola (EA) Limited. 5.2 Conclusion Objective one: The study provided evidence that the opinion of the distributors and customers is key in determining the success of the product in the market. They are the major influencers whose ideas about a product easily appeal to the entire consumer market. Their opinion therefore create demand and as such enhances product performance. 5.3 Recommendation This study recommends that Pepsi Cola (EA) should enhance product innovation, research and development strategy as it is a key influencer of performance. 5.4 Suggestion for Further Research The study recommends that; moderator or mediator studies should be considered in future to unravel the mixed results that have been obtained in this study. Secondly, it also recommends a study that will cover all the soft drinks and apply more advanced models of regression. Finally, scholars and other researchers should consider other contexts and synchronize secondary data and primary data to check on the missing links between the study variables.

ISSN: 2411-5681 www.ijern.com
70
REFERENCE
Ansoff, H. I. (1965). Corporate Strategy, McGraw-Hill, Maidenhead. Burton, R., & Obel, B. (2004). Strategic Organization Design (2 ed.). Boston: Kluwer. Burton, R., & Obel, B. (2004). Strategic Organization Design. Kluwer, Boston, 2nd Edition. Cheng, D. S. (2014). How to protect and increase brand equity? . Journal of Global Business Management, 10(1), 9-18. Christodoulides, & De-Chernatony. (2010). Consumer Based Brand Equity Conceptualization & Measurement: A Literature Review. Christodoulides, G., & De Chernatony, L. (2010). Consumer-based brand equity conceptualization and measurement: A literature review. International journal of research in marketing, 52(1), 43-66. Chu, C.-H. (2000). Buying behavior of consumers for soft drinks. Marketing Science, Vol. 27, No. 5. Gbolagade, A., Adesol, M. A., & Oyewale, I. O. (2013). Impact of Marketing Strategy on Business Performance. A Study of Selected Small and Medium Enterprises (SME’s) In OluyoleLocal Government, Ibadan, Nigeria. . Journal of Business and Management, , 11(9), 59-66. Kothari, C. R. (2004). Research Methodology: Methods and Techniques. 2nd Ed. USA, USA. New Age International Publishers. Kotler, P. (1999). Kotler on Marketing: How to Create, Win, and Dominate Markets. The Free Press. Kotler, P. (2015). Marketing Management.15th ed. NJ, PH: Pearson Education. Kotler, P., & Armstrong, G. (2010). Principles of marketing. New York: Pearson International.
Related Documents