International Journal of Economics, Business and Management Research Vol. 1, No. 03; 2017 ISSN: 2456-7760 www.ijebmr.com Page 67 INFLUENCE OF PRODUCT AWARENESS STRATEGY ON PERFORMANCE OF FAST MOVING CONSUMER GOODS COMPANIES IN THE BOTTOM OF THE PYRAMID MARKET James Gateru 1.PhD. Student, Department of Economic& Finance in the College of Human Resource Development, Jomo Kenyatta University of Agriculture and Technology Prof. Willy. M. Muturi 2.Chairman, Department of Economics and Finance in the College of Human Resource Development, Jomo Kenyatta University of Agriculture and Technology, Kenya. Dr.Thomas A. Senaji 3. Chairman, Department of Economics and Finance in the College of Business, Kenya Methodist (KEMU), Kenya. ABSTRACT Awareness has been identified as one of the key marketing components of Fast Moving Consumer Goods (FMCGs) at the Bottom of the Pyramid (BOP)market segment. This article presents a general synopsis of the impacts of awareness on the performance of FMCGs at the BOP and highlights the effect of various awareness tools on the sale of FMCGs. The BOP, the biggest market segment on the economic pyramid of the world, is made up of over 4 billion people and as such, albeit not always by choice, commands the attention of FMCGs industries. FMCGs industries are motivated to produce goods targeted for this market, often bearing in mind the financial muscle of this population. In this article, we explore the business potential of FMCGs at the BOP with particular focus on how Awareness strategies impact the movement of goods and from the findings, we conclude that the awareness tools impact the performance of FMCGs at the BOP as measured by profitability and sales volume. Another notable conclusion is that the awareness tools used to promote top of the pyramid (TOP) and middle income groups are the same tools which are very effective in promoting BOP market goods and services. Keywords: Awareness Strategy, Bottom of the Pyramid, FMCG, Performance INTRODUCTION The Bottom of the pyramid (BOP) is presumed to be the largest and fastest growing market in the world with 2/3 of the world population already in it and the BOP population will grow to 6 billion people in 40 years’ time with a commensurate purchasing power of $5 trillion (Chikweche, 2013). According to Gupta and Pirsch (2014), the total population of the world can be divided into three main categories based on the level of income one earns or spends per year. This categorization is referred to as the economic pyramid of the world. Figure 1.1 illustrates economic groups, the

Welcome message from author
This document is posted to help you gain knowledge. Please leave a comment to let me know what you think about it! Share it to your friends and learn new things together.
Transcript

International Journal of Economics, Business and Management Research
Vol. 1, No. 03; 2017
ISSN: 2456-7760
www.ijebmr.com Page 67
INFLUENCE OF PRODUCT AWARENESS STRATEGY ON
PERFORMANCE OF FAST MOVING CONSUMER GOODS COMPANIES
IN THE BOTTOM OF THE PYRAMID MARKET James Gateru
1.PhD. Student, Department of Economic& Finance in the College of Human Resource Development, Jomo
Kenyatta University of Agriculture and Technology
Prof. Willy. M. Muturi
2.Chairman, Department of Economics and Finance in the College of Human Resource Development, Jomo
Kenyatta University of Agriculture and Technology, Kenya.
Dr.Thomas A. Senaji
3. Chairman, Department of Economics and Finance in the College of Business, Kenya Methodist (KEMU), Kenya.
ABSTRACT
Awareness has been identified as one of the key marketing components of Fast Moving
Consumer Goods (FMCGs) at the Bottom of the Pyramid (BOP)market segment. This article
presents a general synopsis of the impacts of awareness on the performance of FMCGs at the
BOP and highlights the effect of various awareness tools on the sale of FMCGs. The BOP, the
biggest market segment on the economic pyramid of the world, is made up of over 4 billion
people and as such, albeit not always by choice, commands the attention of FMCGs industries.
FMCGs industries are motivated to produce goods targeted for this market, often bearing in mind
the financial muscle of this population. In this article, we explore the business potential of
FMCGs at the BOP with particular focus on how Awareness strategies impact the movement of
goods and from the findings, we conclude that the awareness tools impact the performance of
FMCGs at the BOP as measured by profitability and sales volume. Another notable conclusion is
that the awareness tools used to promote top of the pyramid (TOP) and middle income groups
are the same tools which are very effective in promoting BOP market goods and services.
Keywords: Awareness Strategy, Bottom of the Pyramid, FMCG, Performance
INTRODUCTION
The Bottom of the pyramid (BOP) is presumed to be the largest and fastest growing market in
the world with 2/3 of the world population already in it and the BOP population will grow to 6
billion people in 40 years’ time with a commensurate purchasing power of $5 trillion
(Chikweche, 2013).
According to Gupta and Pirsch (2014), the total population of the world can be divided into three
main categories based on the level of income one earns or spends per year. This categorization is
referred to as the economic pyramid of the world. Figure 1.1 illustrates economic groups, the

International Journal of Economics, Business and Management Research
Vol. 1, No. 03; 2017
ISSN: 2456-7760
www.ijebmr.com Page 68
approximate size and spread of the world population using three main classifications in terms of
per capita income various economic pyramids of the world.
Annual spending per capita income in $Tiers Population in millions
1
2
75-100
1,500
4,000 <$1,500
$1,500-20,000
>$20,000
3 & 4
Figure 1.1: Economic Pyramid of the Bottom of the pyramid
Adopted from Jun, Lee and Park (2013).
Top of the pyramid (TOP) is marked as (1) and has a population of between 75-100 million,
middle income group marked as (2) has 1.5 billion people while the last income group marked as
(3&4) has a population of over 4 billion people.
The Kenya Economic Survey (2014) defines the Bottom of the Pyramid as that group of
consumers who earn less than Ksh.23, 670/ - per month or approximately ksh.780/- per day. This
definition is very close to the World Bank categorization of consumers who earn $ 2,500 per
year.
Prahalad (2010) summarized this concept by contending that while multinationals and private
companies have all through invested in the middle and top of the pyramid groups in the
production of goods and services and ignored the bottom of the pyramid segment, there is indeed
a fortune at the bottom of the pyramid and that private companies and multinationals should
invest in this segment through the production of affordable goods and services.
According to Prahalad (2010), there are approximately 5 billion consumers in the world. This 5
billion can be the engine for growth in trade and prosperity in the 21st century. Karnani (2007)
supported this view and claimed that bottom of the pyramid potential customers present a vast
untapped and unexploited opportunity.
International Journal of Economics, Business and Management Research
Vol. 1, No. 03; 2017
ISSN: 2456-7760
www.ijebmr.com Page 69
One of the main reasons why companies invest in BOP market is the untapped market with many
opportunities (Chikweche, 2013). The Bottom of the Pyramid segment is however faced with
very many challenges such as corruption, poor infrastructure, non-existent distribution channels,
religious and racial conflicts, low incomes, high inflation, foreign exchange shortages and
reduced private capital inflows which all call for unique solutions to tackle this challenge of
global poverty (Anderson & Billou,2007; Chikweche, 2012).
1.1.1 Fast Moving Consumer Goods Industry (FMCG)
Shafayet and Rozario (2012) define fast moving consumer good industry (FMCG) as an industry
where low involvement and convenient products such as food, beverage, personal hygiene and
household cleaning utensils are traded. The products sell very quickly, are relatively affordable,
have low margins but due to the relatively high turnover on volumes, cumulative profits are
normally high. Fast moving consumer goods industry is characterized by companies which
supply low-cost products that are in constant high demand (KPMG, 2013).
These goods can further be divided into food and personal hygiene and require extensive
distribution networks due to their high turnover (Shafayet & Rozario 2012). While some FMCG
companies only concentrate on either food or personal hygiene, some manufacture and market
products for other companies. Nestle Foods; Coca Cola and Pepsi Cola only sell food products
while others like Reckit and Benckser and Colgate Palmolive only sell personal hygiene
products. Unilever (K) Ltd. is an example of a company that manufactures and sells both food
and personal hygiene products while some companies like Haco Tiger Ltd manufacturer and sell
personal hygiene products but markets food products for a company in South Africa (Kenya
Association of manufacturers, 2014).
According to KPMG (2015) the total household expenditure on fast moving consumer goods in
2010 was $ 240 billion for a sample of 39 African countries. The leading in terms of revenue
from the top to the bottom are Nigeria, South Africa, Morocco, Ethiopia, Kenya, DRC, Ivory
Coast and Tanzania. The total market share for fast moving consumer goods industry for the
consumers earning less than $3 per day (BOP) was 59% on the total consumption.
In Kenya, the BOP market stands at approximately 57% of the total population (Tetra Pak Ltd in
2013). The findings of the Tetra Pak Ltd in 2013 research also showed that the BOP population
is on the rise due to the ever-rising cost of goods and services in Kenya. Consequently, the
FMCG companies need to target and come up with new products that will appeal to this ever-
increasing population. This study sought to answer two research questions: First, How does
awareness strategy influence performance of FMCG firms at the bottom of the pyramid? (RQ1)

International Journal of Economics, Business and Management Research
Vol. 1, No. 03; 2017
ISSN: 2456-7760
www.ijebmr.com Page 70
and Second, Does taxation have a significant moderating effect on the relationship between
awareness strategy and performance of FMCG companies at the bottom of the pyramid? (RQ2)
2.0 MATERIALS AND METHODS
2.1 Research Design
This research used the survey approach. Survey research is used by social scientists to collect
primary data because it is feasible in terms of time and resources (Dooley, 2007).Survey research
was used to collect a representative sample; which represented the rest of the population and
hence allowed the findings to be generalized. Angoitia and Ramirez (2009) used survey method
in a similar study on strategic use of mobile telephony at the BOP.
This was an exploratory survey where responses were examined to detect the relationship
patterns |between the variables (Bryman, 2004), where data was collected on both the awareness
strategy descriptors and performance measures namely sales revenue and market share. In
keeping with the objectives of this study, the effect of awareness strategies on performance of
FMCGs at the bottom of the pyramid market, cross-sectional survey research was appropriate as
it was not possible to collect data from all the FMCGs companies operating in Kenya.
2.2 Target Population
In this study, the target population comprised two categories namely, all the FMCGscompanies
in Kenya as listed by Kenya Association of Manufacturers directory of 2014 (KAM, 2014) and
BOP consumers from the five informal dwellings (slums) of Nairobi County: Mathare, Sinai,
Soweto, Kibera and Kwanjenga/Pipeline. Chikweche and Fletcher (2012) used similar
populations namely FMCGs firms dealing in foodstuff and personal hygiene products and BOP
consumers in a related study in Zimbabwe. While the Sales and Marketing managers were the
most suitable FMCGs respondents due to their knowledge of strategies used in addressing BOP
consumer needs, the BOP consumers were well suited to provide information on the products
they purchase and consume.
2.3 Sampling Frame
The sampling frame for FMCG companies was a list from the Kenya Association of
Manufacturers (KAM) directory of 2014. It was however difficult to get a sampling frame for
BOP consumers and as stated by Zikmund et al. (2010) and Babbie (2010), where the sampling
list does not exist then one can be prepared using the most appropriate data. In this study, a list
was prepared using information availed by Tetra Pak International who are the market leaders in
food packaging who carried out a retail audit on the total number of kiosks in Nairobi in the year
2012.

International Journal of Economics, Business and Management Research
Vol. 1, No. 03; 2017
ISSN: 2456-7760
www.ijebmr.com Page 71
2.4 Sampling Size and Sampling Techniques
A cross-sectional census survey (Table 2.1) of all the 130 fast moving consumer goods
companies operating in Nairobi County was conducted
Table 2.1: Fast Moving Consumer Goods Companies -Across the Country
Region Number of Firms
Nairobi Region 130
Other regions outside Nairobi 46
Total Number 176
Source: KAM Directory (2014)
2.4.1 Sampling Techniques
This study utilized cluster sampling and specifically area sampling and purposive sampling.
According to Mugenda and Mugenda (2003) and Kothari (2013), area sampling is ideal when the
population of study is scattered over a large geographical area. Kothari (2013) stated that Area
sampling, which is a special type of cluster sampling, is primarily used when the unit of analysis
is based on a geographic area.
Purposive sampling was used to select Nairobi County because it is cosmopolitan and most
FMCGs companies and BOP consumers are found in Nairobi County and being the capital city,
it has representation from all other counties in Kenya.
According Zickmund (2010) purposive sampling is used where the researcher wishes to isolate a
sample that has qualities or characteristics required for the study. Nairobi County having 74.7%
of all the fast-moving consumers’ companies in Kenya was therefore an appropriate setting for
this study. Fast moving consumer goods companies are scattered all over the country and as
Mugenda and Mugenda (2003) stated, cluster sampling is used when the population is scattered
over a large geographical area
For the BOP consumers, the sampling technique was multi-stage sampling which combined
cluster sampling and purposive sampling. According to Zikmund et al. (2010), purposive
sampling involves deliberate selection of a particular unit of the population and is normally used
when a researcher wishes to isolate a sample that has qualities or characteristics which are
required for the study and that only a small sample is required if the population is homogeneous.
In such a case, a small sample size with similar characteristic was used gave an objective
representation of the population.

International Journal of Economics, Business and Management Research
Vol. 1, No. 03; 2017
ISSN: 2456-7760
www.ijebmr.com Page 72
In this study, the BOP consumers buying characteristics were very much similar because their
limitation was the wage or disposable income which was normally paid daily and the consumer
ought to have bought the basic goods which met their family daily requirement based on the
money at their disposal. This is what is referred to as single serve purchase because the consumer
only buys a basket of goods which are supposed to last for one day only. By selecting Nairobi
County to represent the 47 counties in Kenya, purposive sampling was invoked. This sampling
was also used to select the BOP consumers in Nairobi
In the second stage, the five major slums in Nairobi which represent the main urban BOP
consumers were selected. These slums are Kibera, Sinai, Mathare, Kwanjenga/Pipeline and
Soweto slums. In stage three, the prepared sampling frame was used at random to select 150
respondents/BOP consumers who buy from the kiosks/shops in each of the five slums identified
above. Purposive sampling gave the researcher the opportunity to pick a BOP consumer who
bought goods from a specific kiosk/shop through the assistance of the owner of the business who
identified the BOP consumer.
The kiosk/shop owners were requested to identify the BOP consumers and clarify to them the
purpose of the study. This was to cultivate trust and enable the researcher to conduct the
interview without suspicion from the BOP consumers. This is in line with Creswell (2009), who
stated that the respondents are purposefully selected because they can inform an understanding
of the research problem and central phenomenon in the study. Anderson and Billow (2007) and
Ireland (2008) used the same technique to select the sample size and the sample in their studies
on BOP research.
2.5 Data Collection Methods and Instruments
Two self-administered semi-structured questionnaires were used for data collection: one the
Sales and Marketing managers in the FMCGs and the other for the BOP consumers. This
approach is supported by Chikweche (2010) who noted that having more than one group of
respondents is good in studies involving consumers and firms because they have a dyadic
relationship.
2.5.1 Administration of Research Instruments
Sales and Marketing managers are easy to identify and are key persons who develop the sales
and marketing strategies for their companies. The strategies were used to develop the market
share and improve sales for the companies they work for.
According to Yang (2008), the questions in a study should be directly related to the research
objectives. In the development of the questionnaires, the four variables namely acceptability,

International Journal of Economics, Business and Management Research
Vol. 1, No. 03; 2017
ISSN: 2456-7760
www.ijebmr.com Page 73
affordability, availability and awareness were identified and operationally defined. The
procedure for issuing the questionnaires to the respondents was through self-introduction. A self-
introduction letter and an authority letter for data collection from the Jomo Kenyatta University
accompanied the questionnaire.
2.5.2 Pilot Testing
Zikmund et al. (2010) defined pilot testing as a small-scale research project that collects data
from respondents similar to the full study. Piloting of the questionnaire was done using the 15
sales managers from FMCGs companies and 15 BOP consumers from the five slums of Nairobi,
namely, Kwanjenga, Mathare, Kibera, Sinai and Soweto. This was 10% of the total sample
population and according to Babbie (2010), this is a good representation to test the reliability and
validity of the research instruments. This helped the researcher to identify any ambiguous and
unclear questions in the questionnaire before administering it to the selected population.
2.5.3 Reliability
Reliability test for the data collection instruments was done using the Cronbach’s formula to
measure the internal consistency of the instrument. According to Mugenda and Mugenda (2003)
and Zimund et.al (2010) this is a better test of reliability and the higher the coefficient the better
the results in terms of and a coefficient of 0.7 and above is considered a good measure of
reliability.
2.5.4 Validity
Validity is the degree to which results obtained from the analysis of the data actually represent
the phenomenon under the study. According to Zikmund et al. (2010), good measures should be
both consistent and accurate and validity is the extent to which a score truthfully represents a
concept. Creswell (2009) asserted that validity is the strength of qualitative research and it exists
when the knowledge sought is arrived at through descriptions that make possible an
understanding of the meanings and essence of experience. Validity was achieved during the pilot
testing of the research instruments using the 15 Sales Managers from the FMCG sector.
To ensure that the instrument produced valid data attention was taken while designing the
questionnaire. The objective was to ensure that the questionnaires were measuring what was
intended and collected what was intended to be collected. This is what is known as content
validity and is normally improved through the use of an expert or a professional in a certain field
(Mugenda & Mugenda, 2003).

International Journal of Economics, Business and Management Research
Vol. 1, No. 03; 2017
ISSN: 2456-7760
www.ijebmr.com Page 74
2.5.5 Data Processing and Analysis
Descriptive statistics such as mode, median, mean, standard deviation were used to achieve the
first objective of getting a feel for the data while the second objective of testing the goodness of
data was achieved through test of reliability using the Cronbach’s Coefficient alpha formula and
finally, the third objective of hypothesis testing was achieved through multiple regression
analysis.
Data was processed using the SPSS (Statistical data processing for Social Sciences) version 20 to
obtain results using linear regression and correlation analysis models. The use of classic linear
regression model is preferred due to its ability to show relationships between the independent
and the dependent variables (Castillo, 2009). Multiple regression analysis and correlation
analysis were carried out with the aim of analysing the relationships between strategies used by
FMCGs, awareness strategy and bottom of the pyramid market performance. Martin and Hill
(2012) used a similar model when they carried out a BOP research on life satisfaction, self-
determination and consumption adequacy in 51 countries. Shafayet and Rozario (2012) used
multivariate model in a similar study on purchase decisions regarding FMCGs companies in
Bangladesh while Nguyen and Mohamed (2011) used multiple regression in their research on
leadership behaviours.
2.5.6 Quantitative Analysis
The descriptive statistics were employed in the analysis of quantitative data in terms of
frequency distribution tables, pie charts, mean and standard deviation on the strategies used by
the FMCGs to respond to the bottom of the pyramid market. The study also utilized multiple
regressions to determine the relationship between BOP strategies and the BOP market. The effect
of the moderating variable was also tested using regression analysis. The t-test was carried out to
test the hypotheses.
2.5.7 General Multiple Regression Analysis
a) The general multiple regression models for this study were as follows;
Y = β0 +β1χ1+e
Where
Y = BOP market performance
β0 = Model intercept
β1,coefficient of regression

International Journal of Economics, Business and Management Research
Vol. 1, No. 03; 2017
ISSN: 2456-7760
www.ijebmr.com Page 75
χ= Awareness strategye = is the error term
Nguyen and Mohamed (2011) stated that multivariate regression allows prediction of a single
dependent variable from more than one independent variable and also the determination of the
influential dependent variable; linear regression with OLS was used to estimate the relationship
between awareness strategies employed and BOP performance among FMCG firms in Nairobi
County, Kenya.
2.5.8 Moderated Multiple Regression Analysis
The government normally has a lot of influence on the strategies developed by the FMCGs
especially on BOP consumption through taxation such as the value added tax (VAT) which was
used as a moderator variable in this study
The general multiple regression model with a moderator for this study will be; y = βo +
β1X1+β1X*Z +e
Where Y = BOP market performance
X = independent variable – Awareness strategy
βo = constant or intercept
β1 = are regression coefficients for X Z = moderating variable (VAT at
16%).
e = error term
XZ = Interaction term of taxation with Awareness strategy (X)
2.6 Variable Definition and Measurement
In this study, variable measurements were based on a mix of tools because the questionnaire had
both qualitative and quantitative measures and therefore the variables of study had different
measurement levels, some with nominal, ordinal, interval and some with ratio scales.
According to Zikmund at al. (2010), interval and ratio scales are used frequently in social
science studies when a researcher collects product rating information. The independent variable
awareness, while the 16% VAT that was introduced on the BOP goods was the moderating
variable. The BOP market performance was the dependent variable

International Journal of Economics, Business and Management Research
Vol. 1, No. 03; 2017
ISSN: 2456-7760
www.ijebmr.com Page 76
Awareness refers to the extent the customer knows and perceives the brand. There are various
ways in which companies promote their brands. These are word of mouth, sales promotion,
corporate social responsibility, personal selling and advertising. A five point Likert scale was
used to measure their usage as follows 5=used most frequently, 4-often used, 3= slightly used,
2=not used and 1=planning to use it in future.
Similarly, brand information refers to the channels used to create awareness of the brands and
this will be in relation to their particular cost and in terms of number of consumers who receive
the information. Brand impact was measured using the five point Likert scale testing how
effective the channel was in terms of cost and the number of consumers who receive the
information as follows: 5- very effective, 4- effective, 3- moderately effective, 2= slightly
effective and 1= not effective. Similarly, brand awareness impact and cost effectiveness were
measured using a five point scale with where 5 represented very effective or impactful while 1
represented not effective/not impactful. The total amount of budget utilized on BOP market was
measured using % of the total promotion budget.
Taxation refers to the government levy on the goods and services sold; this was the moderating
variable. Bottom of the Pyramid market consumers are highly price sensitive to any review in
price of the final consumer. If taxation increases due to increases in the value-added tax (VAT),
FMCGs companies immediately pass this price increase to consumers through a price increase
and this affects both the independent variables and the consumption. Taxation in this study was
measured by a five point Likert scale. It was used to evaluate how VAT affects consumption of
goods targeted to BOP consumers using a scale of 1 to5 where, 5=very high, 4=high,
3=moderate, 2=very low and 1=not effective.
Bottom of the pyramid marked performance refers to the change in consumption of goods due to
the implementation of the 4As strategies by the FMCGs. This was measured using two
indicators, namely the % change in sales and size of BOP market share occasioned by the
implementation of the awareness strategy Auclair (2008) supported this view by stating that the
urban BOP consumer if properly targeted creates new markets which increase consumption of
goods and increases market share.
Growth in consumption was measured using % growth in sales. A 5-point scale was used where;
5=81-100%, 4=61-80%, 3=41-60%, 2=21-40% and 1=0-20% was used. Market share was
measured using the proportionate market share of BOP as a % of the total market. A five-point
scale was provided where; 5=81-100%, 4=61-80%, 3=40-61%, 2=21-40% and 1= 0-20%. The
Table 2.2 below summarizes how each variable was measured.
International Journal of Economics, Business and Management Research
Vol. 1, No. 03; 2017
ISSN: 2456-7760
www.ijebmr.com Page 77
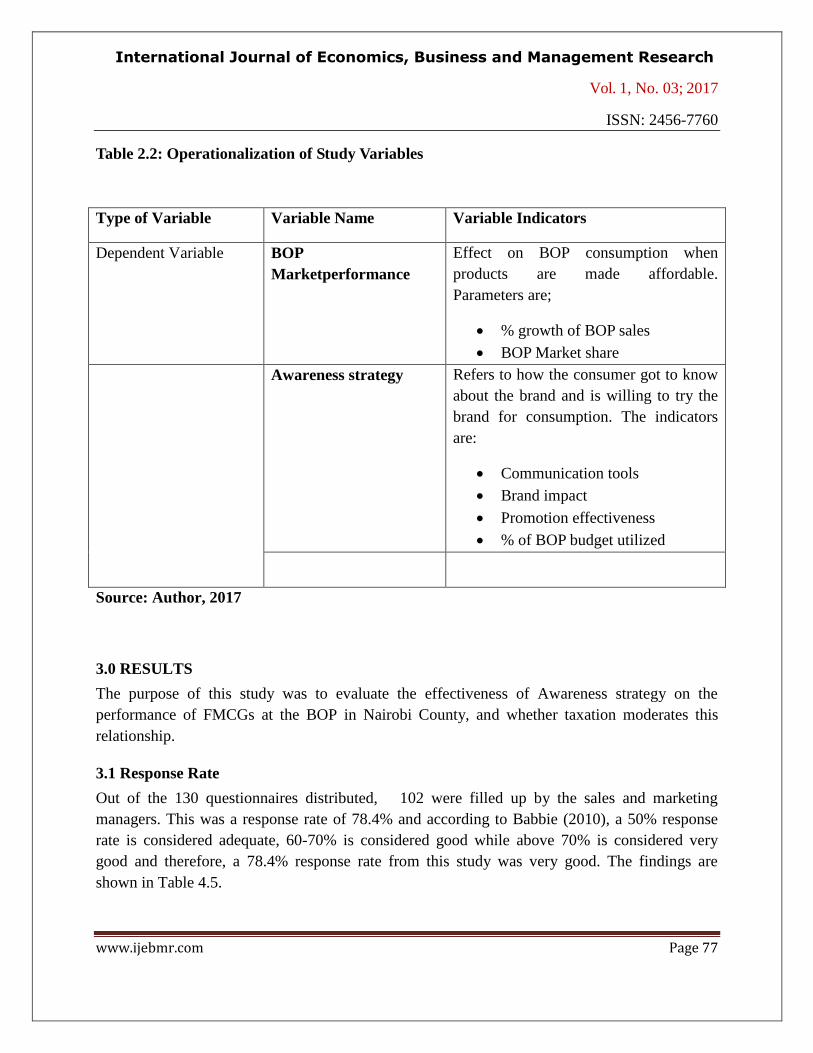
Table 2.2: Operationalization of Study Variables
Type of Variable Variable Name Variable Indicators
Dependent Variable BOP
Marketperformance
Effect on BOP consumption when
products are made affordable.
Parameters are;
% growth of BOP sales
BOP Market share
Awareness strategy Refers to how the consumer got to know
about the brand and is willing to try the
brand for consumption. The indicators
are:
Communication tools
Brand impact
Promotion effectiveness
% of BOP budget utilized
Source: Author, 2017
3.0 RESULTS
The purpose of this study was to evaluate the effectiveness of Awareness strategy on the
performance of FMCGs at the BOP in Nairobi County, and whether taxation moderates this
relationship.
3.1 Response Rate
Out of the 130 questionnaires distributed, 102 were filled up by the sales and marketing
managers. This was a response rate of 78.4% and according to Babbie (2010), a 50% response
rate is considered adequate, 60-70% is considered good while above 70% is considered very
good and therefore, a 78.4% response rate from this study was very good. The findings are
shown in Table 4.5.

International Journal of Economics, Business and Management Research
Vol. 1, No. 03; 2017
ISSN: 2456-7760
www.ijebmr.com Page 78
During inferential statistics analysis, a number of respondents’ questionnaires were removed
from the model because they were found to be affecting the model adversely due to the effect of
outliers. This therefore reduced the actual frequency in the model from 102 to 84 questionnaires,
this is in line with Hair, Black and Babin (2010); and Abbott and McKinney (2013) who stated
that cases or observations showing characteristics or values that are markedly different from the
majority of cases in a data set should be dropped. This is because they distort the true
relationship between variables, either by creating a correlation that should not exist or
suppressing a correlation that should exist.
Table 3.1: Response Rate
Response Rate Frequency Percent
Responded 102 78.4%
No Response 28 21.6%
Total 130 100%
3.2 Diagnostic Tests
3.2.1 Reliability Testing
Reliability refers to the degree to which a research instrument yields consistent results after
repeated trials. According to Zikmund et.al (2010), Cronbach coefficient is often used to test
reliability. Cronbach’s Alpha test was carried out on the three variables so as to a certain their
reliability. The measure ranges from 0 to 1 and the higher the coefficient, the more reliable or
consistent the construct is. The reliability results are presented in Table 3.2
Table 3.2: Reliability Test of Constructs
Construct No. of Items Cronbach’s Alpha Status
Awareness 19 0.734 Acceptable
Taxation 20 0.701 Acceptable
Bottom of the Pyramid 20 0.888 Acceptable

International Journal of Economics, Business and Management Research
Vol. 1, No. 03; 2017
ISSN: 2456-7760
www.ijebmr.com Page 79
The reliability statistics were 0.734 for awareness, .701 for taxation and 0.888 for the BOP
performance. All the three variables passed the minimum threshold of 0.70 and this meant that
they were reliable and therefore full data collection commenced.
3.2.2 Tests of Normality
According to Farrel and Rogers (2006); Indiana (2011) normality tests are used to determine if a
data set is well modeled by a normal distribution, and to compute how likely it is for a random
variable underlying the data set to be normally distributed. Ghasemi and Zahediasl (2012) stated
that many of the statistical procedures including correlation, regression, t tests, and analysis of
variance, namely parametric tests, are based on the assumption that the data follows a normal
distribution. The normality tests supplement the graphical assessment of normality.
To test normality, skewness and kurtosis statistics were used. Skewness is the extent to which a
distribution of values deviates from symmetry around the mean (Norusis, 1994). A value of zero
means that the distribution is symmetric, while a positive skewness is shown by a greater number
of smaller values, and a negative value indicates a greater number of larger values. A kurtosis
value near zero indicated the shape of data was close to normal. A negative value indicates a
distribution which is more flat than normal, and a positive kurtosis indicates a shape peaked than
normal. According to Creswell (2008), statistic values of +/- 2 for Kurtosis and Skewness are
adequate for statistical analysis.
The results of normality test are presented in Table 3.3
Table 3.3: Test of Normality
Variable Mean Std. Dev Skewness Kurtosis
Awareness Strategy -.0717 0.97781 -0.249 .456
Bottom of the Pyramid
Market performance -.1319 0.72869 -0.190 0.179

International Journal of Economics, Business and Management Research
Vol. 1, No. 03; 2017
ISSN: 2456-7760
www.ijebmr.com Page 80
As seen from Table 4.9, the awareness construct had a mean of -0.0717, standard deviation of
0.978, skewness of -0.249 and kurtosis of 0.456, while the bottom of the pyramid performance
construct had a mean of- 0.1319, standard deviation of 0.72869, and skewness of 0.190 and
finally a kurtosis of 0.179.
For all variables, skewness and kurtosis coefficients were well within +/-2 and hence a
conclusion that the data was normally distributed. This therefore meant that the assumption of
normality in linear regression analysis was satisfied. Data can be considered to be normal if the
skewness and kurtosis is between +1 and -1. According to Cunningham (2005), data results
values of between +1and –1 in skewness and kurtosis are normal but values +2 and -2 are still
acceptable.
3.3 Demographic Statistics
3.3.1 Period Worked in the Company
The distribution of responses according to the period that the managers in the organisation is
presented in Table 3.4
Table 3.4: Period Worked in the Company
Frequency Percentage
<3 years 23 23.5
3-5 years 35 35.7
6-10 years 32 32.7
more than 10 years 8 8.1
Total 98 100.0
The findings show that majority of the respondents,77%, had worked with the fast moving
consumer goods companies for more than 3 years, a period long enough to be conversant with
the way the companies develop and implement their strategies especially for the BOP consumers
International Journal of Economics, Business and Management Research
Vol. 1, No. 03; 2017
ISSN: 2456-7760
www.ijebmr.com Page 81
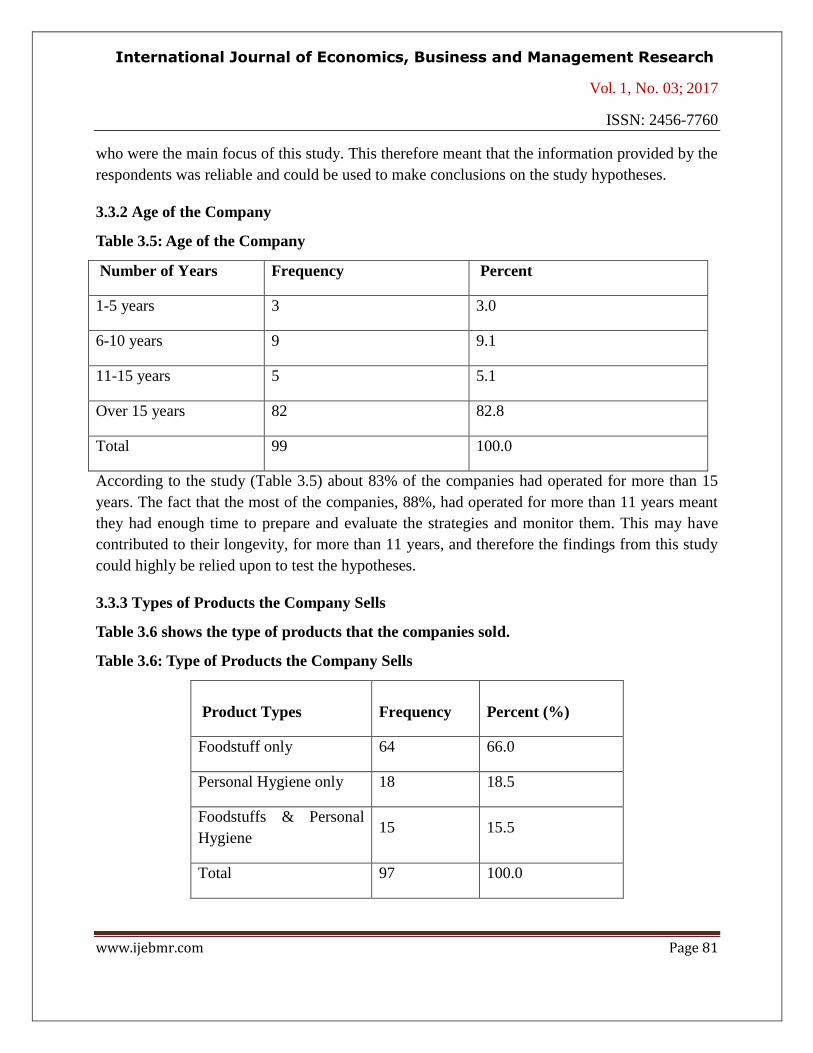
who were the main focus of this study. This therefore meant that the information provided by the
respondents was reliable and could be used to make conclusions on the study hypotheses.
3.3.2 Age of the Company
Table 3.5: Age of the Company
Number of Years Frequency Percent
1-5 years 3 3.0
6-10 years 9 9.1
11-15 years 5 5.1
Over 15 years 82 82.8
Total 99 100.0
According to the study (Table 3.5) about 83% of the companies had operated for more than 15
years. The fact that the most of the companies, 88%, had operated for more than 11 years meant
they had enough time to prepare and evaluate the strategies and monitor them. This may have
contributed to their longevity, for more than 11 years, and therefore the findings from this study
could highly be relied upon to test the hypotheses.
3.3.3 Types of Products the Company Sells
Table 3.6 shows the type of products that the companies sold.
Table 3.6: Type of Products the Company Sells
Product Types Frequency
Percent (%)
Foodstuff only 64 66.0
Personal Hygiene only 18 18.5
Foodstuffs & Personal
Hygiene 15 15.5
Total 97 100.0

International Journal of Economics, Business and Management Research
Vol. 1, No. 03; 2017
ISSN: 2456-7760
www.ijebmr.com Page 82
According to the findings, 66% of the companies were selling foodstuffs only, 19% were selling
personal hygiene products and beauty care products only, while 15% of the companies were
selling both foodstuffs and personal care products.
3.4 Descriptive Statistics on the Awareness Strategies
The awareness strategies are important in the FMCG market because the variety of goods
available for selection is quite wide and therefore companies must ensure that their brands are
always the first ones to be picked by the consumer when they visit the retail outlets. This is done
through the creation of top of mind awareness of the brands in the consumers’ mind through
promotion using the available promotion channels and tools.
3.4.1 Brand Impact on the Various Tools of Promotion
Respondents were asked to rate the level of impact a promotion tool has on their brands and the
results are shown in Table 3.7.
Table 3.7: Brand Awareness Impact on the Various Tools of Promotion
Brand Awareness Impact
Very
low
impact
(%)
Slightly
impactful
(%)
Moderately
impactful
(%)
Quite
impactful
(%)
Very
big
impact
(%)
Mean Std.
Deviation
Word of mouth (e.g.
partnership like social
groups)
2 13 26 36 22 3.64 1.04
Sales promotion 1
8 26 65 4.54 0.73
Philanthropy(CSR) 12 17 56 7 7 2.82 0.99
Personnel selling 6 6 28 42 18 3.6 1.05
Advertising (Print &
electronic (e.g. radio, TV &
N/papers etc.
2 2 21 26 49 4.18 0.97
Below the line advertising
(e.g. poster-shirts etc.,) 3 1 22 40 34 4 0.94
Road shows and billboards 12 18 28 25 18 3.18 1.27

International Journal of Economics, Business and Management Research
Vol. 1, No. 03; 2017
ISSN: 2456-7760
www.ijebmr.com Page 83
Social media (mobile phone
and internet) 5 13 50 17 16 3.25 1.04
In summary therefore, the ranking of the tools according to the most to the least impactful were
sales promotion, advertising, below the line advertising, word of mouth, personal selling, social
media, roadshows and corporate social responsibility with means of 4.54, 4.18, 4.0, 3.64, 3.6,
3.25, 3.18 and 2.82 respectively. This supports the conclusion that all the awareness tools are
impactful apart from the corporate social responsibility whose mean was 2.82 just slightly above
threshold; meaning that it is not a good tool to use when promoting BOP products. These
findings are in line with most BOP theories which contend that the most common channels of
promotion used by FMCG companies to promote products meant for the upper and middle
income groups are also effective in promoting goods meant for the BOP consumers.
3.4.2 Effectiveness of the Promotion Tools
Respondents were also asked to rate the effectiveness of the various promotion tools, that is cost
efficiency per unit of promotion tool using % and mean. The results are shown in Table 3.8.
Table 3.8: Cost Effectiveness of the Promotion Tools
Cost Effectiveness Hardly
Effective
Slightly
Effective
Moderately
Effective
Quite
Effective
Very
Effective Mean
Std.
Deviation
Word of mouth (e.g.
partnership like social
groups)
4 6 29 33 28 3.77 1.05
Sales promotion 1 5 15 39 40 4.15 0.86
Philanthropy(CSR) 11 21 50 11 7 2.85 1.03
Personnel selling 5 7 30 35 22 3.63 1.07
Advertising-i.e. print &
electronic (e.g. radio, TV
& N/papers etc.
7 5 29 38 21 3.59 1.10
Below the line advertising
(e.g. poster-shirts etc.) 2 8 24 44 22 3.75 0.96

International Journal of Economics, Business and Management Research
Vol. 1, No. 03; 2017
ISSN: 2456-7760
www.ijebmr.com Page 84
Roadshows and billboards 18 30 27 17 8 2.7 1.21
Social media (mobile
phone and Internet) 4 10 36 28 22 3.54 1.07
The effectiveness of the various promotion tools in terms of ranking from the best to the lowest
are sales promotion, word of mouth, below the line, personal selling, formal advertising, social
media, corporate social responsibility and road shows with scores of
83%,75.4%,75%,72%,71.8%,70.8%,57% and 54% respectively.
The most effective and affordable channels of promotion which the FMCG companies should
take into consideration while choosing the best channels of promotion are, in order of effect and
cost, sales promotion, below the line advertisement, formal advertising, word of mouth, personal
selling, social media, road shows and billboards and finally corporate social responsibility with
average means of 4.3, 3.9, 3.7, 3.7, 3.6, 3.4, 2.9 and 2.8 respectively. Companies planning to
implement the right awareness strategies may opt to use the results of this study as they
implement the right preferred awareness strategies.
3.4.3 Proportion of the Total Promotion Budget Allocated to BOP Segment
Respondents were asked to state the proportion of the total promotion budget which is allocated
to the BOP market segment. The results are shown in Table 3.9.
Table 3.9: Proportion of the Total Promotion Budget Allocated to BOP Market
Frequency Percent (%)
0-10% 10 10
>10-20% 22 23
>20-30% 37 38
>30-40% 23 24
More than 50% 5 5
Total 97 100

International Journal of Economics, Business and Management Research
Vol. 1, No. 03; 2017
ISSN: 2456-7760
www.ijebmr.com Page 85
66% of the companies stated they allocated between 20-50% of the total promotion budget to
promote the BOP products. This is an indication that the FMCG companies have realized the
importance of BOP market in their endeavour to realize their overall company objectives of
growing market share and profitability.
3.4.4 Test of Hypothesis
H01 – Awareness Strategies have no significant influence on the bottom of the pyramid market
performance in Kenya.
First, the association between awareness strategy and BOP market performance was examined
using a scatter diagram (Figure 2.2)
Figure 2.2 shows a scatter graph of awareness strategies and bottom of the pyramid market in
Kenya. The diagram indicates a positive gradient which is an indication that awareness strategies
affect the bottom of the pyramid market. Based on the scatter graph and the t-statistics, the null
hypothesis was thence rejected since the graph indicates a positive linear relationship.
Figure 2.2: Scatter Diagran of the Bottom of the Pyramid Market Versus Awareness Strategies
From the scatter plot, it is discerned that there is a positive correlation between awareness
strategy and the BOP market performance among FMCGs in Nairobi County, Kenya. Based on
this finding, the hypothesis was tested using linear regression analysis.

International Journal of Economics, Business and Management Research
Vol. 1, No. 03; 2017
ISSN: 2456-7760
www.ijebmr.com Page 86
Secondly, to hypothesize that awareness strategies have no significant effect on the bottom of the
pyramid market performance in Kenya, a linear regression F-test was carried out using ANOVA
to determine whether there was a significant relationship between awareness strategies and the
bottom of the pyramid market in Kenya. The results of the linear regression indicate that r =
0.374 and R² = 0.140. This is an indication that there is a moderate significant effect of
awareness strategies on the bottom of the pyramid market performance among FMCG companies
in Kenya. This relationship is explained in Table 3.10.
Table 3.10: Awareness Strategies and Bottom of the Pyramid Market Share Model
R R Square Adjusted R Square Std. Error of the Estimate
0 .374 0.140 0.129 0.67807
a. Dependent Variable: BOP Market
Predictors: (Constant), Awareness
Table 3.11 shows results of ANOVA. F-test results of 13.311 and the critical values of F-test (1,
83 degrees of freedom) at 0.05 is 3.84 < 13.311. The null hypothesis was rejected and a
conclusion that there is a linear relationship between awareness strategies and bottom of the
pyramid market performance in Kenya was made. The findings also revealed that awareness
strategies have a significant influence on the bottom of the pyramid market in Kenya since P-
value is .000 which is less than 5% level of significance.
Table 3.11: ANOVA (b)
Model Sum of
Squares
df Mean Square F Sig.
1 Regression 6.12 1 6.12 13.311 .000(b)
Residual 37.702 82 0.46
Total 43.822 83
Predictors: (Constant), X-Awareness Strategy
Dependent Variable: Y-Bottom of the Pyramid Market

International Journal of Economics, Business and Management Research
Vol. 1, No. 03; 2017
ISSN: 2456-7760
www.ijebmr.com Page 87
performance
To test this hypothesis, the beta coefficient was computed and t-test used to test the significance
of the coefficient associated with the awareness strategies and bottom of the pyramid market
performance in Kenya. This was tested at 5% significant level. The t-test results showed that the
β coefficient was statistically significant since t-value at 5% is 4.09>critical t=1.96. The null
hypothesis was rejected as the t-test indicated that β coefficient was different from zero, at 5%
significant level. Table 4.90 shows a positive gradient which reveals that an improvement of
awareness through awareness strategies increases the bottom of the pyramid market performance
by a ratio of 0.226.
Table 3.12: Model Awareness versus BOP Market
Model Coefficients t Sig
B Std Error
1 (Constant) -0.170 .073 -2.333 .022
Awareness strategy .226 .055 4.090 .000
a Dependent Variable: Y
The equation, Y = βo + β1X1+e now becomes y= -0.170+0.2260X1
4.0 DISCUSSION
Awareness is the degree to which customers are knowledgeable about a product. According to
Chikweche and Fletcher (2012), BOP markets require integrated marketing communication
which is key for any product to succeed especially on the existing and new products meant for
the BOP market. All the eight awareness tools were found to be impactful, effective and efficient
because they all scored a mean of 2.5 and above out of the maximum of 5. However, the top
three channels in terms of impact on awareness were sales promotion, formal advertising such as
electronic media and below the line advertising e.g. wall branding and as confirmed by the BOP
consumers/respondents, 33.6% of them did affirm that they came to know the products they use
thorough the T.V. advertisements.
The findings concur with most BOP studies which proclaim that BOP market does not require
special awareness tools different from the TOP and middle income consumers but rather the
awareness tools should be aligned to the specific consumer needs because BOP consumers are

International Journal of Economics, Business and Management Research
Vol. 1, No. 03; 2017
ISSN: 2456-7760
www.ijebmr.com Page 88
exposed to the same media channels of promotion especially the ones living in the urban centers.
According to Chikweche & Fletcher (2013), most BOP consumers imitate what the other groups
of consumers are buying; that is the TOP and middle income consumers and therefore the same
channels of awareness used to create awareness on the TOP and middle income group can also
be used to promote BOP products. These results were confirmed by the Anova tests which rated
awareness as significant. The R2 value of 14.0% also showed that awareness strategies have
moderate effect on the bottom of the market share in Kenya.
REFERENCES
Abbott, M. L., & McKinney, J. (2013). Understanding and applying research design (1st ed.).
Somerset, NJ: John Wiley & Sons.
Anderson, J., & Billou, N. (2007). Serving the world’s poor: innovation at the base of the
economic pyramid. Journal of Business Strategy, 28(2), 14-21.
Anderson, J., & Markides, C. (2007) Strategic innovation at the base of the pyramid. European
School of Management and Technology Review, 49(1), 83–88.
Angoitia. D. R., & Ramirez, F. (2009). Strategic use of telephony at bop: The case Mexico.
Journal of Information Technology & International Development, 5(3), 35-53.
Ansaris, S., Munir, K., & Gregg, T. (2012). Impact at the bop: the role of social capital in
capability development & community empowerment. Journal of management studies,
49(4), 813-843.
Arora, S., & Romijn, H. (2011). The empty rhetoric of poverty reduction at the base of the
pyramid. Organization Journal, 19(4), 481-505.
Azmat, F., & Samaratunger, R. (2013). Exploring customer loyalty at the bottom of the pyramid
south Asia. Social Responsibility Journal, 9(3), 397-394.
Babie, E. (2010). The practice of social research (11th ed.). California: Thomson Wadsworth.
Benevides, G., Carlos, A. (2015). Product innovation and the market at the bottom of the
pyramid: Study at the capital of Sao Paulo. International journal of Humanities social
sciences and Education, 2(4), 29-42.
Berg, B. (2001). Qualitative Research Methods for the Social Science (4thed.). Boston: Pearson
Education.

International Journal of Economics, Business and Management Research
Vol. 1, No. 03; 2017
ISSN: 2456-7760
www.ijebmr.com Page 89
Bikram, M. (2013). Exploring branding strategies of fast moving consumer goods services and
durable goods: Evidence from India.Journal of product and brand management, 22(1), 6-
17.
Bryman, A. (2004). Social research methods (2nded.). New York: Oxford University Press.
Chattananon, A. (2003). The impact of societal marketing programs, customer attitudes toward
corporate image in Thailand (Doctoral Thesis). University of Southern Queensland.
Chikweche, T. (2013). Revisiting the business environment at the bottom of the pyramid (BOP):
From theoretical considerations to practical realities. Journal of Global Marketing, 26(5),
239-257.
Chikweche, T., & Stanton, J., & Flecher, R. (2013). Family purchase decision making at the
bottom of the pyramid. Journal of Consumer Marketing, 20(3), 202-213.
Chikweche, T., & Flecher, R. (2011). Branding at the base of pyramid: A Zimbabwean
perspective. Journal of Marketing Intelligence and Planning, 29(3), 247-263.
Chikweche, T., & Flecher, R. (2011). Franchising at the bottom of the pyramid: An alternative
distribution approach. Journal of the International Review of Retail, Distribution and
Consumer Research,24(4), 343-360
Chikweche, T., & Flecher, R. (2012). Revisiting the business environment at the bottom of the
pyramid (BOP): From theoretical considerations to practical realities. Journal of
Consumer Marketing, 29(7), 507-520.
Christensen, C.M. (1997). Innovators dilemma: When technologies cause great firms to fail.
Boston: Library of Congress cataloging.
Clow, K. E., & Back, R. (2002). Integrated advertising and marketing communication (2nded.).
India: Prentice Hall.
Cooper, D. R., & Schindler, P. S. (2008). Business research methods (10th ed.). Singapore:
McGraw-Hill.
Cooper, D.R., & Emorly, C. W. (2005). Business research methods. New York: McGraw Hill
International.
Creswell, J.W., (2009). Research design: Qualitative, quantitative and mixed methods
approaches (3rded.). California/USA: Sage publications.

International Journal of Economics, Business and Management Research
Vol. 1, No. 03; 2017
ISSN: 2456-7760
www.ijebmr.com Page 90
Dey, L.B., Prendergast, R., & Saren, M. (2013). A qualitative enquiry into the appropriation
of mobile telephony at the BOP. International marketing review, 30(3), 297.
Dooley, D. (2007). Social research methods (4thed.). New Delhi, India: Prentice Hall.
Farrel and Rogers (2006). Comprehensive study of tests for normality and symmetry: Extending
the Spiegel Halter test. Journal of Statistical Computation and Simulation, 76(9), 803-
816
Gateru, J. W. (2012). Strategic response to environmental changes within cooperative societies
in Kenya: A case study of Githunguri Dairy Farmers cooperative society Limited.
Unpublished thesis,United States International University, Kenya.
Gathara, M. (2010, July 2012). Why SA creams Kenya. Retrieved January 2014, 10th, from
Kenya Dairy Board: http://Kenyadairy.com/news/why-SA-Creams-Kenya.
Gathenya, J. (2012). Entrepreneurial strategic planning practices and firm performance among
women led small and medium enterprises in Kenya (PhD Thesis). Jomo Kenyatta University
of Agriculture and Technology, Kenya.
Gebauer, R., & Reynoso, J. (2013). An agenda for service management at the base of the
pyramid. Journal of Service Management, 24(5), 482-501.
Ghasemi, A & Zahediasl,S. (2012). Normality tests for statistical analysis: A guide for non-
statisticians. International Journal EndocrinolMetab., 10(2), 486-9.
Gikenye, W. (2012). The diffusion of information and communication technology in the informal
sector in Kenya (Doctorate dissertation). University of Zululand, South Africa.
Githunguri Dairy Farmers Cooperative society Ltd. (2011). Company documents.
Gujarati, D. N. (2004). Basic econometrics, (4thed.). Front matter: McGraw-Hill.
Gupta, S., & Pirch, J. (2014). Consumer evaluation of target marketing to the bottom of the
pyramid. Journal of International Consumer Marketing, 26(14), 58-74.
Hair, J. F., Black, W. C., & Babin, B. J. (2010). Multivariate data analysis: A global
perspective. Upper Saddle River, NJ: Pearson Prentice-Hall.
Hammon, T. (2009). The ethical rational of business for the poor: Integrating the concepts
bottom of the pyramid, sustainable development and corporate citizenship. Journal of
Business, 84,313-324.

International Journal of Economics, Business and Management Research
Vol. 1, No. 03; 2017
ISSN: 2456-7760
www.ijebmr.com Page 91
Hoetker, G. (2007). The use of logit and probit models in strategic management research:
Critical issues. Illinois, U.S.A: John Wileys & Son, Ltd.
Ireland, D.R. (2008). Lessons for successful BOP marketing from Caracas slums. Journal of
Consumer Marketing, 25(7), 430-438.
Jose, S., & Buchanan, R.F. (2013). Marketing at the bottom of the pyramid: Service quality
sensitivity of captive microfinance borrowers. Journal of Consumer Marketing, 30 (7),
573-582.
Jun, S., Lee, D., & J. (2013). Determining business models in the bottom of the pyramid markets.
Industrial Management and Data Systems Journal, 113(7), 1064-1082.
Kamala, G., Bork, K. (2010). Reaching customers at the base of the pyramid: A two stage
business strategy. Thunderbird International Business Review, 52(5), 355-367.
Karamchandani, A., Kubzansky, M., & Lalwani, N. (2011). Is the bottom of the pyramid really
for you? Havard business review, 8(24), 107-112.
Karnani, A. (2007). The mirage of marketing to the bottom of the pyramid: How the private
sector can help alleviate poverty. California management review, 49(4), 90-111.
Kenya Dairy Board website http: //www.kdb.co.ke, October 2010 on 3 August.
Kenya Association of Manufacturers (2014). Kenya Association of Manufacturers Directory
2014. Nairobi: Kenya Association of Manufacturers.
Kenya Dairy Board (2014). Status of the dairy industry. Retrieved from http://www.kdb.co.ke/
Kenya Dairy Board, (2009). Facts and figures. Retrieved from http://www.kdb.co.ke/facts.htm.
Kenya Dairy Board, (2011). Facts and figures. Retrieved from http://www.kdb.co.ke/facts.htm.
[15th December].
Kenya-Vision 2030. (2007). Globally Competitive and Prosperous Kenya. Nairobi: Government
Printers
Kim, C.W & Mauborgne, R. (2005). Blue Ocean Strategy: From theory to practice.
California Management Review, 47(3), 106-121.

International Journal of Economics, Business and Management Research
Vol. 1, No. 03; 2017
ISSN: 2456-7760
www.ijebmr.com Page 92
Kiriinya, S. N. (2014). Influence of Children on Family Purchase Decisions of Households in
Kenya. Unpublished PhD Thesis, Jomo Kenyatta University of Agriculture and
Technology.
Kistruck, G.M., Webb, W., Sutter, C.J., & Ireland, D.R. (2011). Micro franchising in base of the
pyramid markets: Institutional challenges and Adaptations to the franchise model.
Enterprise Theory and Practice, 503-531.
Kolk, A., Rivera, M., & Riffin, C. (2013). Reviewing a decade of research on the “base/bottom
of the pyramid” BOP concept. Business and Society, 20(10), 1-40.
Kombo, D. K., & Tromp, D.A. (2009). Proposal and thesis writing: An introduction. Kenya:
Paulines Publications Africa.
Kothari, C. R. (2004). Research methodology: Methods and techniques (2nded.). Nairobi, Kenya:
New Age International Publishers.
Kotler, P. (1997). Marketing management: Analysis, planning, implementation & control
(9thed.). U.S.A: Prentice Hall.
Kotler, P. (2008). Marketing Management, 13th Edition, India, Prentice Hall.
KPMG (2015). Fast moving consumer goods in Africa.
https://www.kpmg.com/Africa/en/IssuesAndInsights/Article.Publications/General.Industr
ies.Publications/Documents/FastMoving%20Consumer%20Goods%20sector%20report%
20 2015.pdf.
Kvale K. (2007). Doing interviews: Thousand oaks. California: Sage publishing.
Lee, N. & Lings, I. (2008). Doing business research: A guide to theory & practice (8thed.).
London: Sage publications Ltd
Majunder, M. (2012). A Critical Approach in understanding bottom of the pyramid proposition.
Journal of management & public policy, 3(2), 18-25
Mardal, P., & Coreja, T. (2013). Marketing Mix strategies towards the bottom of the pyramid. A
study of the Brazilian market: Uppsala University.
Martin, D .K. & Hill, P. R. (2012). Life satisfaction, self-determination and consumption
adequacy at the bottom of the pyramid. Journal of Consumer Research, 38, 78-91.
Martinez, J. L. (2007). Value at the bottom of the pyramid. Business Strategy Review, 50-54.

International Journal of Economics, Business and Management Research
Vol. 1, No. 03; 2017
ISSN: 2456-7760
www.ijebmr.com Page 93
Mason, K., Chakrabarti, R., & Singh, A. (2013). Markets and marketing at the bottom of the
pyramid. Journal of marketing theory, 13(3), 405-407.
Mintzberg, H. Ahlstrand, B. & Lampel, J. (1998). Strategy Safari: A guided tour through the
wilds of Strategic Management. New York: Prentice Hall.
Mouborgne, R. & Kim, W .K. (2005). Blue Ocean Strategy: From theory practice. California
management Review, 47(3)105-121.
Mugenda, O., & Mugenda, A. (2003). Research methods: Quantitative and qualitative
approaches (2nd Ed.). Nairobi, Kenya: Acts Press.
Nakata, C., & Weider, K. (2012). Enhancing New Products Adoption at the Bottom of the
pyramid: A contextualized model. Journal of Production and innovation management,
29(1), 21-32
Murray, C.E., (2009). Diffusion of innovation theory: A bridge for the research practice gap in
counseling. Journal of Counseling and Development, 87,108-116.
Ngamkroeckjoti, C. S. (2007). Technology turbulence and environment scanning in Thailand:
new product development. Asia Pacific Journal of Marketing and Logistics, 3(16), 413-
342.
Nyaga, J. (2014). Factors affecting distribution of fast moving consumer goods in Kenya.
International Journal of Social Sciences and Entrepreneurship, 1(12), 290-312.
Ngugi, J. K. (2012). Challenges hindering sustainability of Small and Medium Family
Enterprises after the exit of the founders in Kenya (Doctorate Thesis). Jomo Kenyatta
University of Agriculture and Technology, Kenya.
Njuru, S.G., Ombuki, C., Wawire, N. & Okeri, S. (2013). Taxation and private investment:
Evidence for Kenya. International Journal of Economics and Management Sciences, 2
(11) 78-93.
Nguyen, H. N., & Mohamed, S. (2011). Leadership behaviours, organizational culture and
knowledge management practices: An empirical investigation. Journal of Management
and Development, 30(2), 206-221.
Olsen, M., & Boxenbaum, M. (2009). Bottom of the pyramid: Organizational barriers to
implementation. California Management Review, 51(4) 100-125.

International Journal of Economics, Business and Management Research
Vol. 1, No. 03; 2017
ISSN: 2456-7760
www.ijebmr.com Page 94
Pallant, J. (2005). SPSS Survival manual: A step to guide to data analysis using SPSS for
Windows. Maidenhead: Open University Press.
Payaud, M. (2014). Marketing strategies at the bottom of the pyramid: Examples from Nestle,
Danone, and Proctor & Gamble. Journal Global Business and Organization Excellence,
29(10), 51-63.
Petrescu, M., & Bhatl, .D. (2013). Consumer behavior in flea markets and marketing to bottom
of the pyramid. Journal of Management Research, 13(1)55-63.
Prahalad, C.K. (2010). The fortune at the bottom of the pyramid: Eradicating poverty through
profit (5thed.). New Jersey: Pearson Education Ltd.
Rangan, V. K., Michael, C.M., & Petkoski, D. (2011). Segmenting the Base of the Pyramid.
Harvard Business Review, June 2011.
Rangnerkar, S. (2010). Nano strategy: Focusing on the bottom of the pyramid. Journal of
Management, 6(2), 55-58.
Republic of Kenya (ROK) (2014). The Economic Survey 2014. Kenya National Bureau of
Statistics, Nairobi: Government Printer.
Republic of Kenya (ROK) (2008). Kenya Vision 2030. Nairobi: Government Printer.
Robinson, R., Pearce, J., & Mital, A. (2008). Strategic Management: Formulation,
implementation and control. New Delhi; McGraw Hill Education.
Saunders, M., Lewis, P., & Thorn hill, A. (2008). Research methods for business students.
London: Pearson Education.
Schrader, C., Freimann, J., & Seuring, S. (2012). Business Strategy at the base of the pyramid.
Business Strategy and Environmental Journal, 21(5), 281-298.
Seidman, I. (2006). Interviewing in qualitative research: A guide for researchers in education
and social sciences (3rd ed.). New York: Teachers College Press.
Sekaran, U. & Bougie, R. (2010). Research Methods for Business: A skill building
approach. UK: John Wiley & Sons.
Shafayet, G. M., & Rozario, P. (2012). Factors influencing the Bangladeshi consumers’ purchase
decision regarding Fast Moving Consumer Goods: An exploratory study. The IUP
Journal of Brands Management. 9(4), 451-478.

International Journal of Economics, Business and Management Research
Vol. 1, No. 03; 2017
ISSN: 2456-7760
www.ijebmr.com Page 95
Simanis, E. (2012). Reality check at the bottom of the pyramid. Harvard Business Review. June
2012.
Stephani, S. (2006). Housing the poor by engaging the private sector and citizen sectors: social
innovations and ‘Hybrid Value Chain.’ Paper submitted by Ashoka: Innovators for the
Public. Vancouver: World Urban Forum.
Strickland, T.A.A., & Gamble, J.E. (2008). Crafting and executing strategy: The quest for
competitive advantage, concepts & cases (7thed.). New York: McGraw-Hill.
Tarafdar, M., Anekal, P. & Sing, R. (2012). Market development at the bottom of the pyramid:
examining the role of information and communication.
Tetra Pak (2013). Internal research: Tetra pack bottom of the pyramid in the developing Markets.
Unpublished.
Tykesso, D., & Mikael, A. (2011). The Uppersala Model: Applicability on internationalization
processes of the European SME. Lunds University
Vachani, S., & Smith, N. C. (2014). Social responsible distribution: Distribution strategies for
reaching the bottom of the pyramid. California Management Review, 50(2), 52-84.
Varman, S., & Belk, S. N. (2012). Conflicts at the Bottom of the Pyramid: Profitability, Poverty
Alleviation, and Neoliberal Governmentality. Journal of public policy and government,
32(1), 19-35.
Waburi, N. (2013). Research and Marketing Services (RMS). Retrieved December 2013.
Waiganjo, E. W., (2013). Effect of competitive strategies on the relationship between strategic
human resource management and firm performance of Kenya’s corporate organizations
(Doctoral Thesis). Jomo Kenyatta University of Agriculture and Technology, Kenya.
Whittaker, D.H., Fall, B.P. & Fiedler, A. (2016). Assembling capabilities for innovation:
evidence from New Zealand SMEs. International Journal of small Business, 34(1), 123-
143.
Williams, R.L., Omra, M., & Ensor, J. (2010). Sourcing or selling: The value flame at the base
of the pyramid. Marketing Intelligence & Planning, 29(3), 233-246.
World Bank (2013). Mobile usage at the base of the pyramid: Research findings from Kenya
and South Africa. New York: World Bank.
International Journal of Economics, Business and Management Research
Vol. 1, No. 03; 2017
ISSN: 2456-7760
www.ijebmr.com Page 96
Yang, L., Guohui, S., & Eppler, M. (2008). Making strategy work: A literature review on the
factors influencing strategy implementation. ICA Working Paper 2/2008. Lugano,
Switzerland Institute of Communication.
Zikmund, W. G., Babin, B.J., Carr. C. J., & Griffin, M. (2010). Business research methods
(8thed.). Mason: Cengage Learning.
Related Documents