The impact on mortality of heat waves in Budapest, Hungary R Sari Kovats, Shakoor Hajat, London School of Hygiene and Tropical Medicine, London, United Kingdom Anna Páldy, Fodor Jozsef National Center for Public Health, National Institute of Environmental Health, Budapest, Hungary János Bobvos Capital Institute of State Public Health Service, Budapest, Hungary

The impact on mortality of heat waves in Budapest, Hungary R Sari Kovats, Shakoor Hajat, London School of Hygiene and Tropical Medicine, London, United.
Dec 13, 2015
Welcome message from author
This document is posted to help you gain knowledge. Please leave a comment to let me know what you think about it! Share it to your friends and learn new things together.
Transcript

The impact on mortality of heat waves in Budapest, Hungary
R Sari Kovats, Shakoor Hajat, London School of Hygiene and Tropical Medicine,London, United Kingdom
Anna Páldy, Fodor Jozsef National Center for Public Health, National Institute of Environmental Health,
Budapest, Hungary
János Bobvos Capital Institute of State Public Health Service,Budapest, Hungary
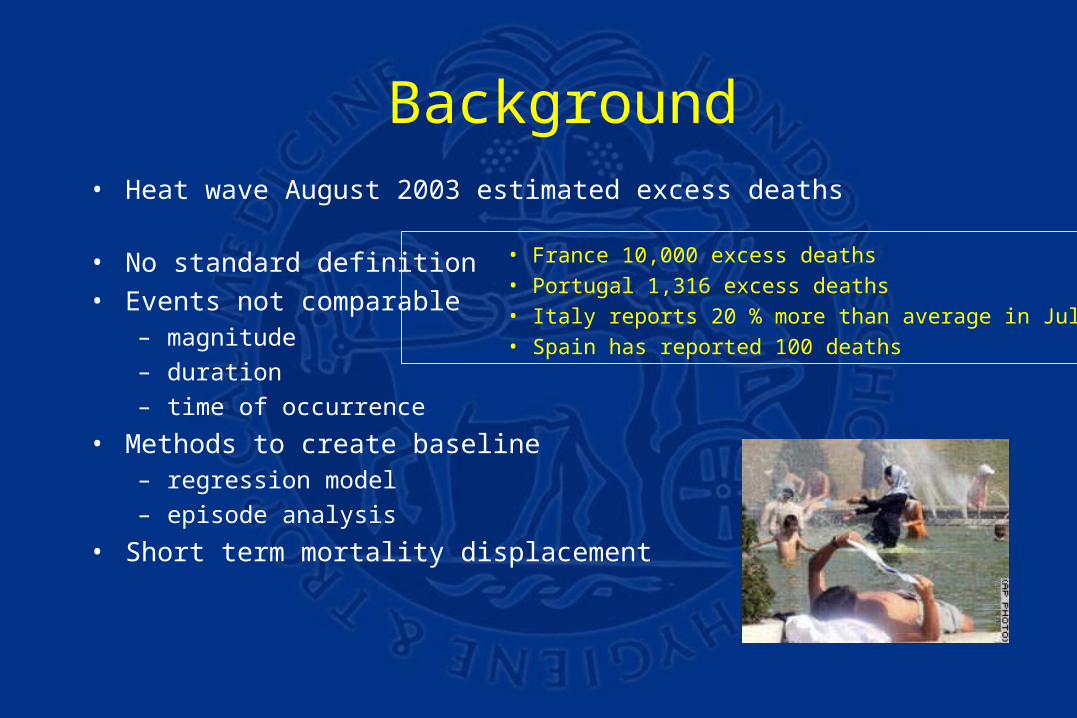
Background• Heat wave August 2003 estimated excess deaths
• No standard definition• Events not comparable
– magnitude– duration– time of occurrence
• Methods to create baseline – regression model– episode analysis
• Short term mortality displacement
• France 10,000 excess deaths• Portugal 1,316 excess deaths• Italy reports 20 % more than average in July/Aug• Spain has reported 100 deaths

Objectives• Describe and quantify the
relationship between daily temperature extremes and mortality in Budapest
• Describe any differences between subgroups (by age and cause)
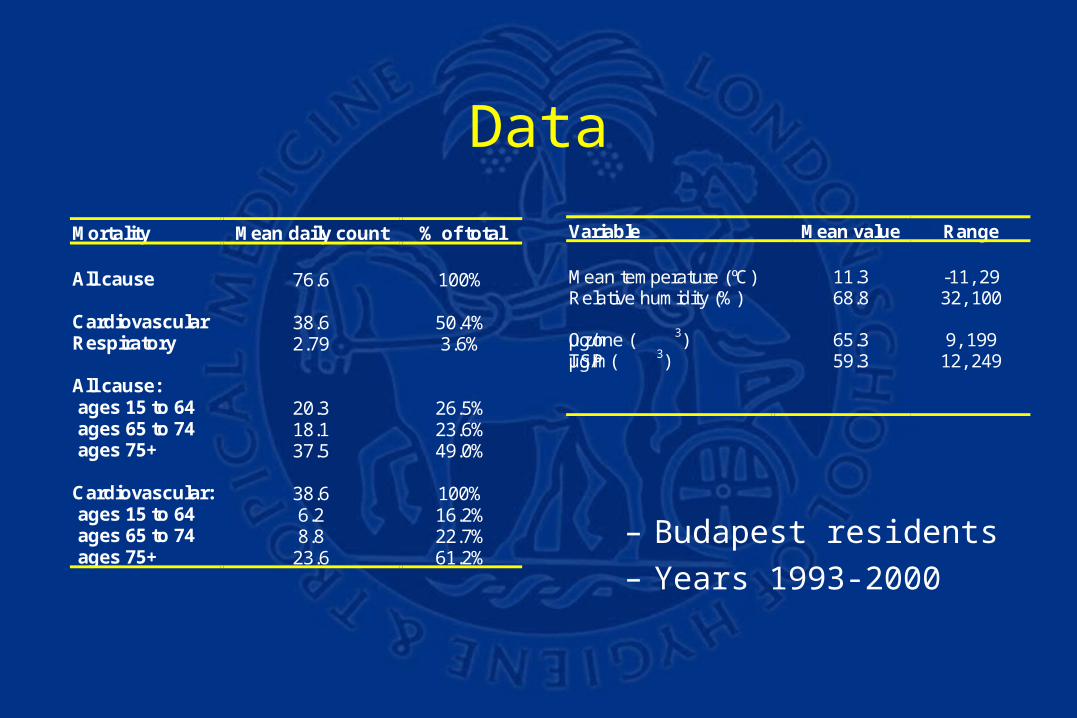
Mortality Mean daily count % of total
All cause 76.6 100%
Cardiovascular 38.6 50.4%Respiratory 2.79 3.6%
All cause: ages 15 to 64 20.3 26.5% ages 65 to 74 18.1 23.6% ages 75+ 37.5 49.0%
Cardiovascular: 38.6 100% ages 15 to 64 6.2 16.2% ages 65 to 74 8.8 22.7% ages 75+ 23.6 61.2%
Variable Mean value Range
Mean temperature (ºC) 11.3 -11, 29Relative humidity (%) 68.8 32, 100
Ozone (μg/m 3) 65.3 9, 199TSP (μg/m 3) 59.3 12, 249
Data
– Budapest residents– Years 1993-2000
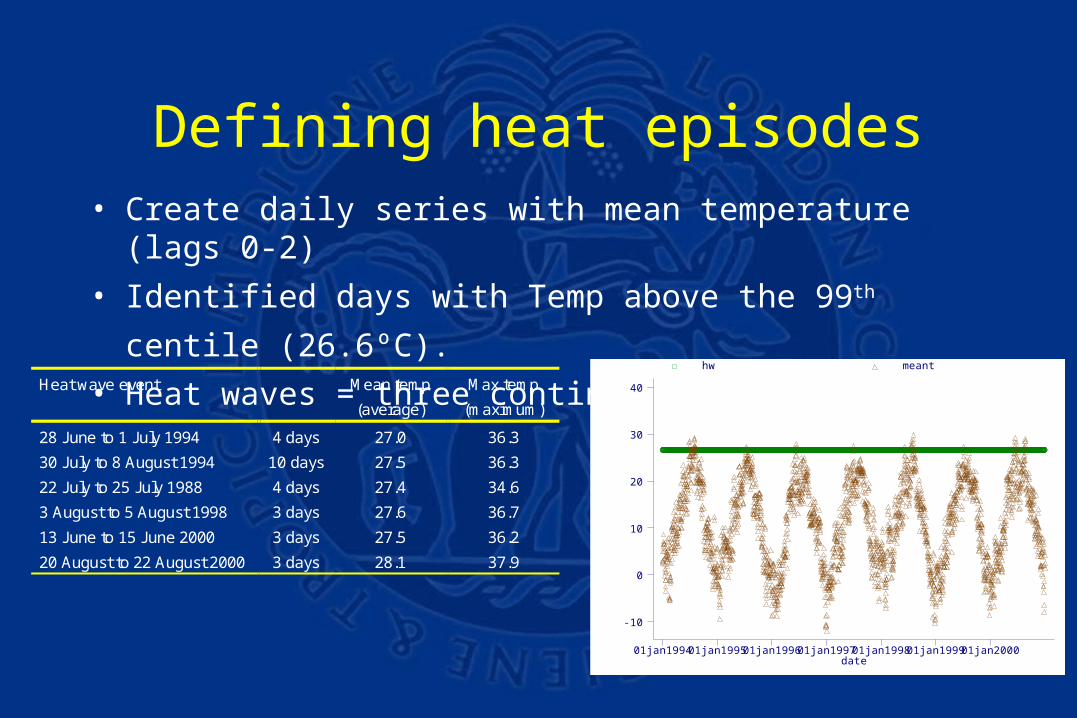
Defining heat episodes• Create daily series with mean temperature (lags 0-2)
• Identified days with Temp above the 99th centile (26.6ºC). • Heat waves = three continuous days
Heat wave event Mean temp
(average)
Max temp
(maximum)
28 June to 1 July 1994 4 days 27.0 36.3
30 July to 8 August 1994 10 days 27.5 36.3
22 July to 25 July 1988 4 days 27.4 34.6
3 August to 5 August 1998 3 days 27.6 36.7
13 June to 15 June 2000 3 days 27.5 36.2
20 August to 22 August 2000 3 days 28.1 37.9
date
hw meant
01jan1994 01jan1995 01jan1996 01jan1997 01jan1998 01jan1999 01jan2000
-10
0
10
20
30
40
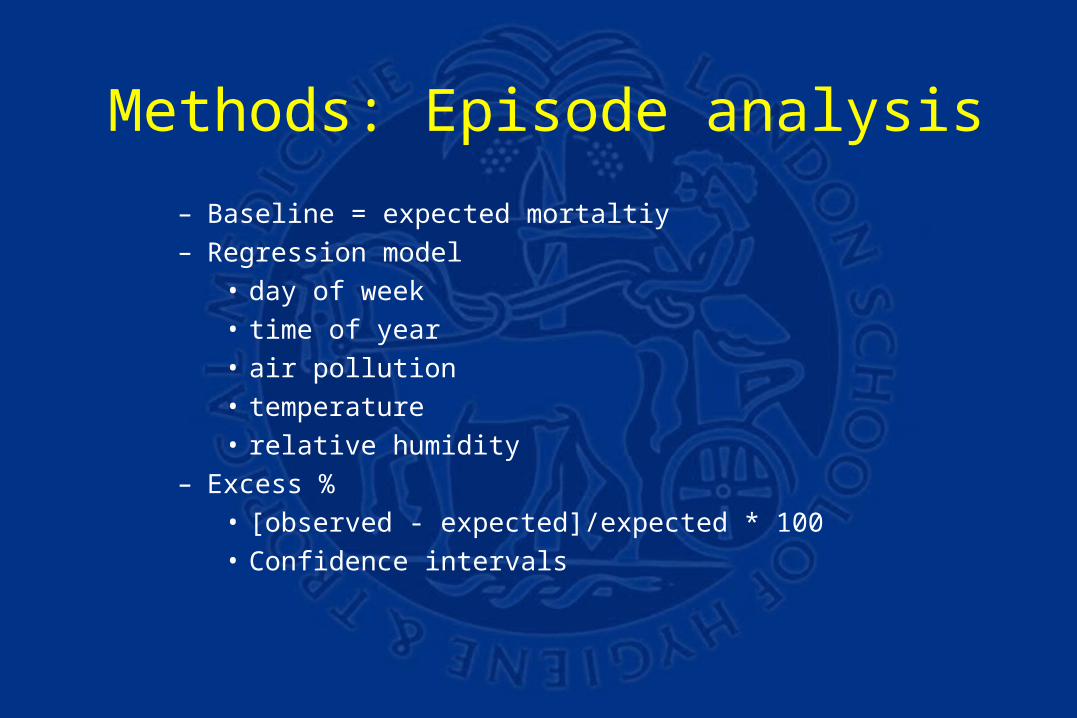
Methods: Episode analysis
– Baseline = expected mortaltiy – Regression model
• day of week • time of year• air pollution • temperature • relative humidity
– Excess %• [observed - expected]/expected * 100• Confidence intervals
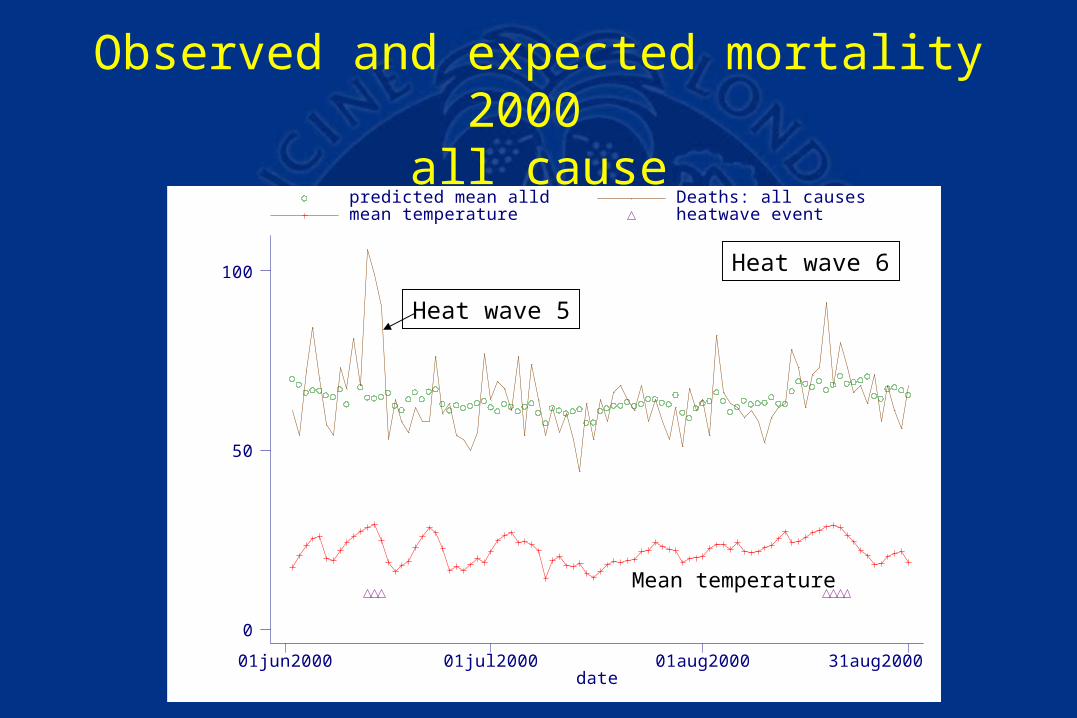
Observed and expected mortality 2000
all cause
date
predicted mean alld Deaths: all causes mean temperature heatwave event
01jun2000 01jul2000 01aug2000 31aug2000
0
50
100
Mean temperature
Heat wave 5
Heat wave 6
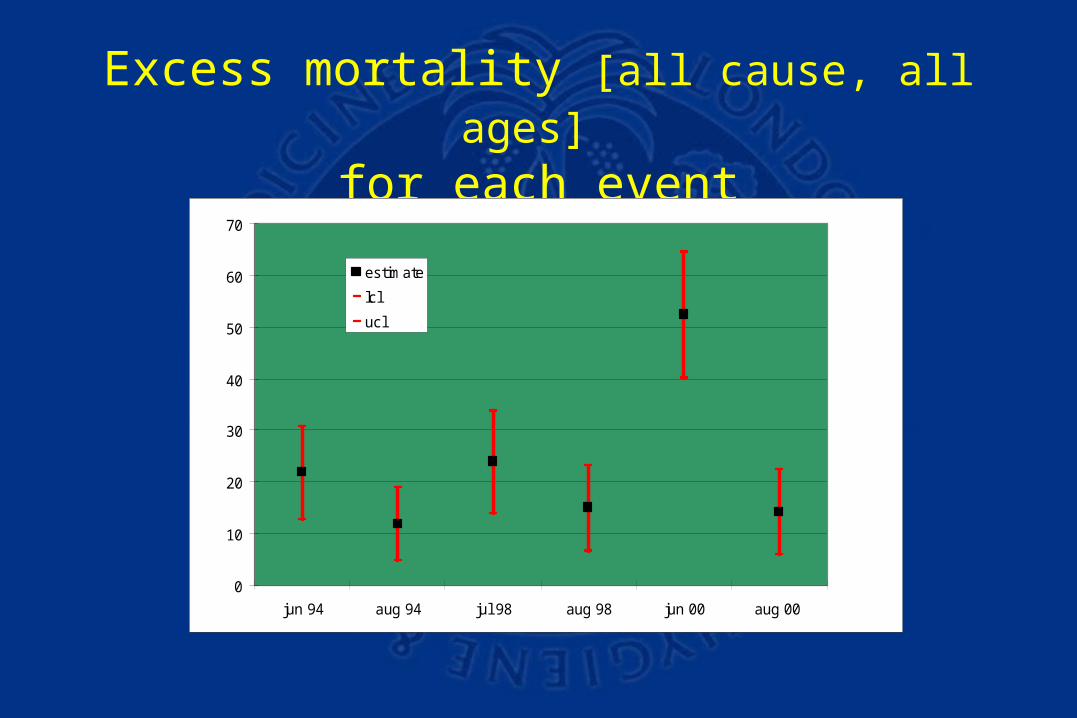
Excess mortality [all cause, all ages] for each event
0
10
20
30
40
50
60
70
jun 94 aug 94 jul 98 aug 98 jun 00 aug 00
estimate
lcl
ucl
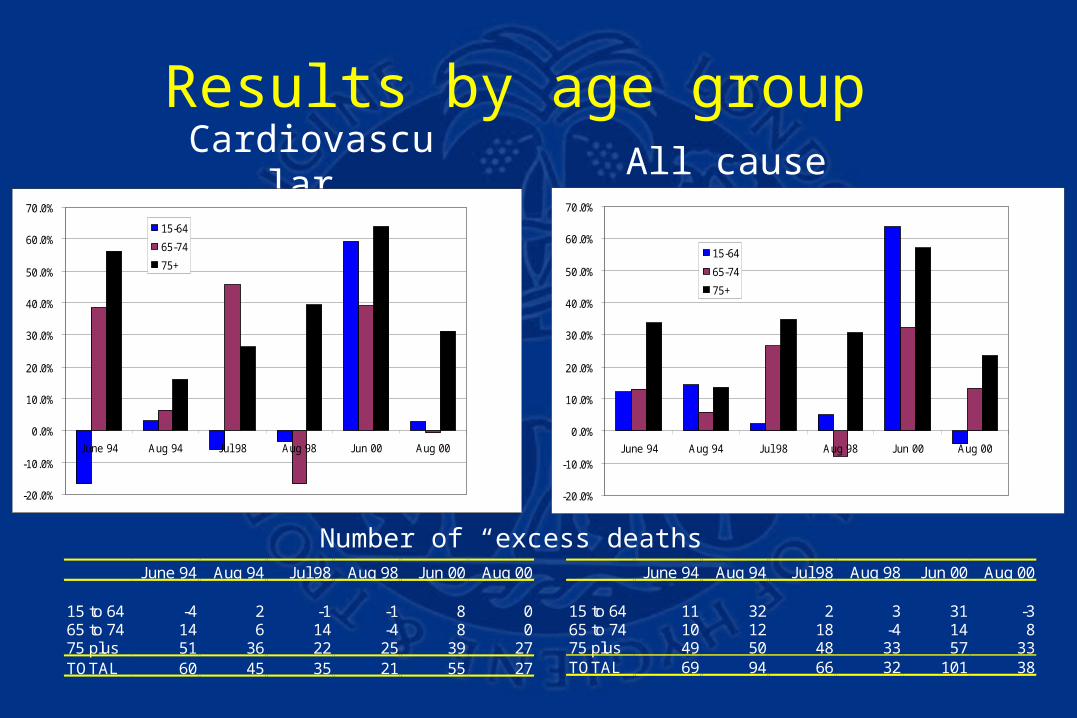
Results by age groupAll cause
Cardiovascular
June 94 Aug 94 Jul 98 Aug 98 Jun 00 Aug 00
15 to 64 11 32 2 3 31 -365 to 74 10 12 18 -4 14 875 plus 49 50 48 33 57 33TOTAL 69 94 66 32 101 38
June 94 Aug 94 Jul 98 Aug 98 Jun 00 Aug 00
15 to 64 -4 2 -1 -1 8 065 to 74 14 6 14 -4 8 075 plus 51 36 22 25 39 27TOTAL 60 45 35 21 55 27
Number of “excess deaths”
-20.0%
-10.0%
0.0%
10.0%
20.0%
30.0%
40.0%
50.0%
60.0%
70.0%
June 94 Aug 94 Jul 98 Aug 98 Jun 00 Aug 00
15-64
65-74
75+
-20.0%
-10.0%
0.0%
10.0%
20.0%
30.0%
40.0%
50.0%
60.0%
70.0%
June 94 Aug 94 Jul 98 Aug 98 Jun 00 Aug 00
15-64
65-74
75+
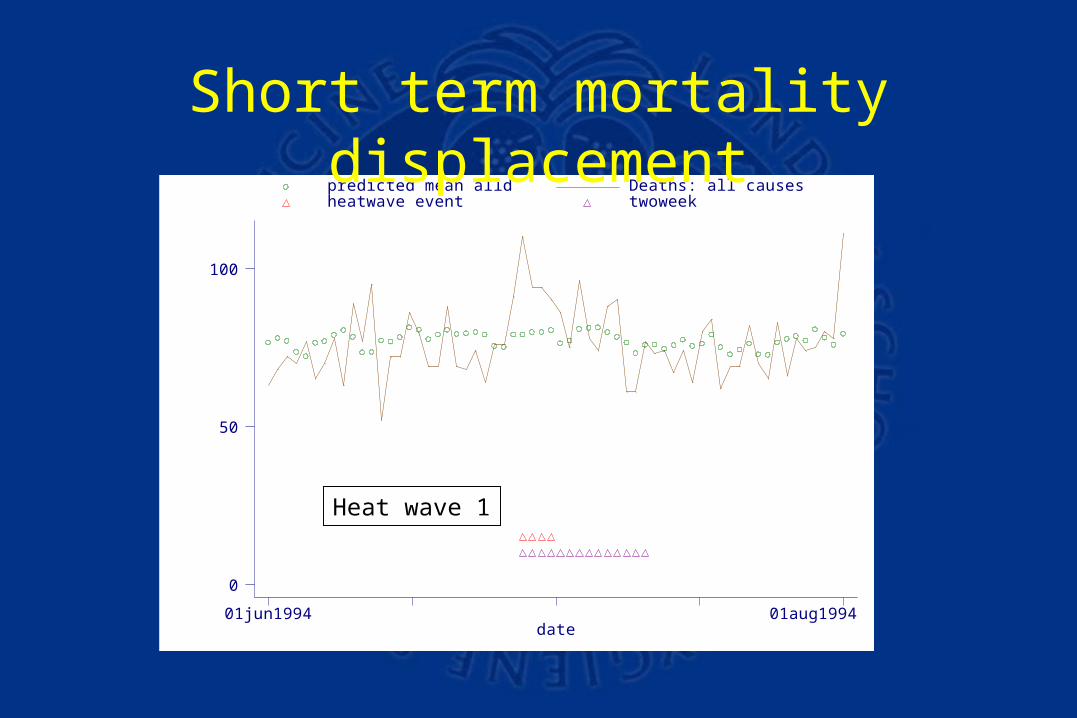
date
predicted mean alld Deaths: all causes heatwave event twoweek
01jun1994 01aug1994
0
50
100
Short term mortality displacement
Heat wave 1
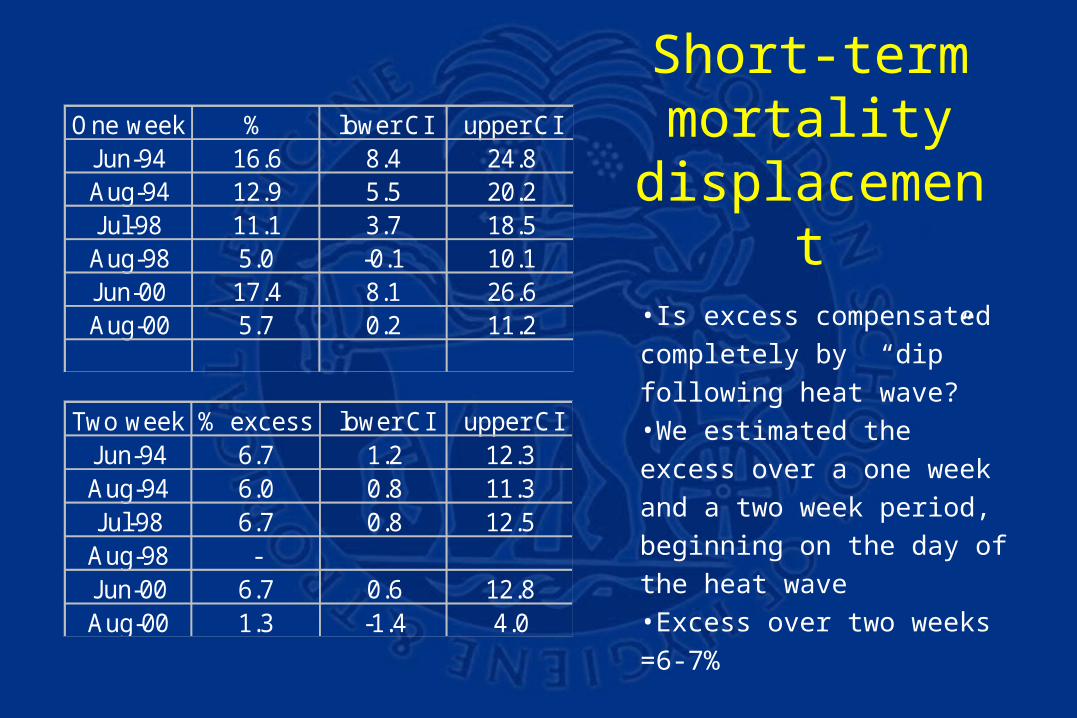
Short-term mortality
displacement
Two week % excess lower CI upper CIJun-94 6.7 1.2 12.3Aug-94 6.0 0.8 11.3Jul-98 6.7 0.8 12.5
Aug-98 -Jun-00 6.7 0.6 12.8Aug-00 1.3 -1.4 4.0
•Is excess compensated completely by “dip” following heat wave? •We estimated the excess over a one week and a two week period, beginning on the day of the heat wave•Excess over two weeks =6-7%
One week % lower CI upper CIJun-94 16.6 8.4 24.8Aug-94 12.9 5.5 20.2Jul-98 11.1 3.7 18.5Aug-98 5.0 -0.1 10.1Jun-00 17.4 8.1 26.6Aug-00 5.7 0.2 11.2
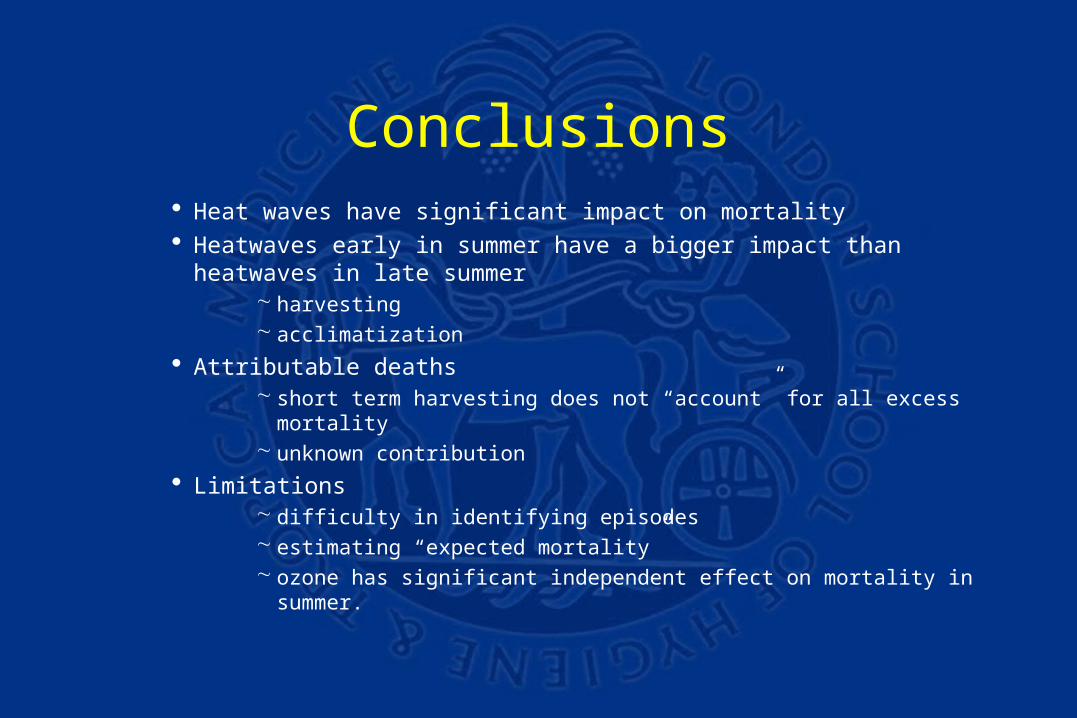
Conclusions Heat waves have significant impact on mortality Heatwaves early in summer have a bigger impact than heatwaves
in late summer harvesting acclimatization
Attributable deaths short term harvesting does not “account” for all excess mortality unknown contribution
Limitations difficulty in identifying episodes estimating “expected mortality” ozone has significant independent effect on mortality in summer.
Related Documents