THE IMPACT OF AN ALTERNATIVE CERTIFICATION PROGRAM ON TEACHER RETENTION IN SELECTED TEXAS PUBLIC SCHOOL DISTRICTS AS REPORTED BY PERSONNEL IN EDUCATION SERVICE CENTER, REGION 20, TEXAS A Dissertation by JEFFERY L. GOLDHORN Submitted to the Office of Graduate Studies of Texas A&M University in partial fulfillment of the requirements for the degree of DOCTOR OF PHILOSOPHY August 2005 Major Subject: Educational Administration

Welcome message from author
This document is posted to help you gain knowledge. Please leave a comment to let me know what you think about it! Share it to your friends and learn new things together.
Transcript

THE IMPACT OF AN ALTERNATIVE CERTIFICATION PROGRAM ON
TEACHER RETENTION IN SELECTED TEXAS PUBLIC SCHOOL
DISTRICTS AS REPORTED BY PERSONNEL IN EDUCATION
SERVICE CENTER, REGION 20, TEXAS
A Dissertation
by
JEFFERY L. GOLDHORN
Submitted to the Office of Graduate Studies ofTexas A&M University
in partial fulfillment of the requirements for the degree of
DOCTOR OF PHILOSOPHY
August 2005
Major Subject: Educational Administration

THE IMPACT OF AN ALTERNATIVE CERTIFICATION PROGRAM ON
TEACHER RETENTION IN SELECTED TEXAS PUBLIC SCHOOL
DISTRICTS AS REPORTED BY PERSONNEL IN EDUCATION
SERVICE CENTER, REGION 20, TEXAS
A Dissertation
by
JEFFERY L. GOLDHORN
Submitted to the Office of Graduate Studies ofTexas A&M University
in partial fulfillment of the requirements for the degree of
DOCTOR OF PHILOSOPHY
Approved by:
Chair of Committee, Clifford L. WhettenCommittee Members, Homer Tolson
John R. HoyleCaroline Pryor
Head of Department, Jim Scheurich
August 2005
Major Subject: Educational Administration
iii
ABSTRACT
The Impact of an Alternative Certification Program on Teacher Retention in Selected
Texas Public School Districts as Reported by Personnel in Education Service
Center, Region 20, Texas. (August 2005)
Jeffery L. Goldhorn, B.A., University of Northern Iowa;
M.Ed., Trinity University
Chair of Advisory Committee: Dr. Clifford L. Whetten
The purpose of this study was to determine the impact of an alternative
certification program on the retention of teachers in Region 20, Texas, as reported by
Education Service Center, Region 20, Texas. Demographic variables were used to
determine association with retention rates. Additionally, the study provided qualitative
data and information that assisted in explaining the retention rates of Teacher
Orientation and Preparation Program (TOPP) participants.
A mixed methods research, utilizing logistic regression and a survey interview
instrument, was used to determine retention rates as well as variables that influence
retention rates of TOPP participants. A total of 537 TOPP participants were analyzed.
Additionally, a sub-sample of 10 participants was interviewed.
The study provides an analysis of the following demographic variables:
ethnicity, gender, current grade type (elementary–PK-5, middle school–6-8, and high
school–9-12), and current socioeconomic level (as determined by the percent of
children who qualify for free and reduced lunch programs). Of the four demographic
variables analyzed, none was found to have an association with retention rates.

iv
A number of other variables were found to have an impact on the retention of the
teachers interviewed in the sub-sample. Those variables included personal commitment
to the field of education or the kids, a mentor, team support, administrative support,
and new teacher induction programs.
The implications from the findings of this research study are numerous and can
have an effect in areas such as teacher hiring practices, teacher retention practices, and
teacher preparation programs. It is important to note that the researcher recommends
that expert opinions be sought and further research be conducted on teacher retention
and teacher preparation programs before any recommendations for change are made.

v
DEDICATION
This dissertation is dedicated to my loving, understanding, and supportive
family. This dream could not have become a reality without their love and
encouragement. This project is for them as much as it is for me.
To my wife, Veronica, for the unending support and encouragement. With
two babies at home, it was not an easy road. For all she has done to allow
me to pursue my dream, I say, “thank you, amor.”
To my girls, Ally and Sophia, for allowing me to hide away in my office.
Their random visits to the office with dollies in tow gave me excuses to take
breaks. No more school for daddy, girls!
To my parents, Neil Goldhorn and Nancy Dutler, for providing the love and
support throughout my life. I thank both of them for the encouragement and
positive thoughts from Iowa. I needed them.

vi
ACKNOWLEDGEMENTS
The completion of this dissertation would not have been possible without the
guidance of many people. I am grateful for the varying levels of support and guidance
from each of them. Thank you for the advice, expertise, and support.
Dr. Clifford Whetten, my chair, for his expert guidance and encouragement
along the way. I could not have done it without him.
Dr. John Hoyle, Dr. Caroline Pryor, and Dr. Homer Tolson, for sharing
their time and expertise as members of my committee. Each of you
provided me with guidance and assistance along the way.
Steve Peterson, who gave unselfishly of his time and talents to assist me
with my data collection and statistical analysis. He is undoubtedly one of
the brightest men I have ever known. Thanks, Steve.
Ed Vara, who was patient, but persistent that I finish this thing. I appreciate
the support and encouragement.
Dr. Rick Alvarado and Dr. Terry Smith, for allowing me to pursue my study
and providing words of encouragement along the way.
Donna Newman, who helped me to collect all of the PEIMS data necessary
to make my study a success.
Dr. Phillip Linerode, for his words of advice and willingness to help out.
I truly appreciate the support of many family members and friends: Veronica,
Ally, Sophia, Mom and Kim, and Dad and Nancy, for the “shots in the arm” I needed
along the way. For many of my friends who continually asked about my progress along

vii
the way–Billy, Doreen, Ed, Shaun, and many of my colleagues at Region 20 and
Northside ISD. Thanks to each of you.
viii
TABLE OF CONTENTS
Page
ABSTRACT ....................................................................................................... iii
DEDICATION ................................................................................................... v
ACKNOWLEDGEMENTS ............................................................................... vi
TABLE OF CONTENTS ................................................................................... viii
LIST OF TABLES ............................................................................................. x
LIST OF FIGURES............................................................................................ xii
CHAPTER
I INTRODUCTION .......................................................................... 1
Background of the Study............................................................ 1Statement of the Problem ........................................................... 3Purpose of the Study .................................................................. 4Research Questions .................................................................... 5Operational Definitions .............................................................. 5Assumptions ............................................................................... 7Limitations ................................................................................. 7Significance of the Study ........................................................... 8Organization of the Dissertation................................................. 8
II REVIEW OF THE LITERATURE ................................................ 10
Teacher Shortage........................................................................ 10Teacher Retention ...................................................................... 22Teacher Certification.................................................................. 25
III METHODOLOGY ......................................................................... 45
Population................................................................................... 46Instrumentation........................................................................... 47Procedures .................................................................................. 52Data Analysis ............................................................................. 53

ix
TABLE OF CONTENTS (continued)
CHAPTER Page
IV RESULTS OF THE STUDY.......................................................... 55
Demographic Data...................................................................... 56Demographic Data: Crosstabulations......................................... 62Demographic Data: Sub-Sample................................................ 80
V SUMMARY, CONCLUSIONS, ANDRECOMMENDATIONS................................................................ 91
Summary .................................................................................... 91Conclusions ................................................................................ 94Recommendations ...................................................................... 99
REFERENCES................................................................................................... 103
APPENDIX A .................................................................................................... 110
APPENDIX B .................................................................................................... 112
APPENDIX C .................................................................................................... 114
APPENDIX D .................................................................................................... 116
APPENDIX E..................................................................................................... 118
VITA .................................................................................................................. 120

x
LIST OF TABLES
TABLE Page
2.1 One-Year Attrition Rates for Texas Public School Teachers(1995-1996 through 2001-2002) ...................................................... 20
2.2 Attrition Rates: Alternative Route vs. Traditional Route..................... 21
4.1 Frequencies and Percentages of Grade Types of Population(Year 1) ................................................................................................ 57
4.2 Frequencies and Percentages of Grade Types of Population(Year 3) ................................................................................................ 58
4.3 Frequencies and Percentages of Socioeconomic Level ofCampus (Year 1) .................................................................................. 59
4.4 Frequencies and Percentages of Socioeconomic Level ofCampus (Year 3) .................................................................................. 60
4.5 Frequencies and Percentages of Demographic InformationRegarding Gender ................................................................................ 60
4.6 Frequencies and Percentages of Demographic InformationRegarding Ethnicity.............................................................................. 61
4.7 Frequencies and Percentages of Retention Data .................................. 62
4.8 Frequencies and Percentages of Participants by Intern Year andGender .................................................................................................. 63
4.9 Frequencies and Percentages of Participants by Intern Year andEthnicity ............................................................................................... 63
4.10 Frequencies and Percentages of Participants by Intern Year andSocioeconomic Status of Campus (Year 1).......................................... 65
4.11 Frequencies and Percentages of Participants by Intern Year andGrade Types (Year 1) ........................................................................... 66
4.12 Frequencies and Percentages of Participants by Gender andSocioeconomic Status of Campus (Year 1).......................................... 67

xi
LIST OF TABLES (continued)
TABLE Page
4.13 Frequencies and Percentages of Participants by Gender andGrade Type (Year 1) ............................................................................ 68
4.14 Frequencies and Percentages of Participants by Gender andGrade Type (Year 3) ............................................................................ 69
4.15 Frequencies and Percentages of Participants by Ethnicity andSocioeconomic Level of Campus (Year 1) .......................................... 70
4.16 Frequencies and Percentages of Participants by Ethnicity andGrade Type (Year 1) ............................................................................ 71
4.17 Frequencies and Percentages of Participants by Ethnicity andGrade Type (Year 3) ............................................................................ 73
4.18 Frequencies and Percentages of Participants by Teacher Retentionand Gender ........................................................................................... 74
4.19 Frequencies and Percentages of Participants by Teacher Retentionand Ethnicity ........................................................................................ 75
4.20 Omnibus Tests of Model Coefficients ................................................. 77
4.21 Model Summary................................................................................... 78
4.22 Classification Tablea............................................................................. 78
4.23 Variables in the Equation ..................................................................... 79
4.24 Frequencies and Percentages of Participants in Sub-sampleby Gender, Ethnicity, Grade Type, and Socioeconomic Status ofCampus................................................................................................. 80

xii
LIST OF FIGURES
FIGURE Page
2.1 Student Population and Projected Student Population inthe United States................................................................................... 15

1
CHAPTER I
INTRODUCTION
Background of the Study
Fielder and Haselkorn (1999) estimated that over the next ten years,
approximately 200,000 new teachers will need to enter the field to meet the demands of
the educational system in the United States. Some of the factors that are creating this
great need include increasing school enrollments, attempts to reduce teacher-to-student
ratios, and an alarmingly high increase in teacher attrition and retirement rates (Cortez,
2001). Between 1997 and 2009, the enrollment in public schools is projected to increase
by 4% to 48.1 million (Olson, 2000a). The average age of a teacher in America today is
44 years (Olson, 2000a). According to Olson, districts are anticipating high rates of
retirement in the near future as a result of this increasingly high average age.
The teacher demand in Texas is particularly alarming. The State Board for
Educator Certification (SBEC) indicated in 1998 that Texas had a 44,000-teacher
shortage at the start of the school year (Huling, 1998). During the 2000-2001 school
year, personnel from the Texas A&M Institute for School-University Partnerships (1999)
reported that Texas schools needed to hire 39,652 teachers. Fuller (2002) predicted a
shortage of 50,000 teachers by 2010. However, Texas universities produce
approximately 15,000 teachers per year (Linton & Kester, 2002).
The result of the demand for certified candidates in Texas requires creative
recruitment and retention tactics. Through a review of the literature, researchers have
_______________The style for this dissertation follows that of The Journal of Educational Research.

2
Identified several effective recruitment and retention tactics that include increased
salaries and/or benefits, induction programs, mentor programs, scholarship and loan
opportunities, signing bonuses, and alternative certification programs (Cortez, 2001;
Olson, 2000b, 2000c; Scherer, 1999). Each of these recruitment and retention tactics has
some degree of effectiveness. Alternative certification programs have been effective in
recruiting people to the field of education. This is supported by the fact that 41 states are
now utilizing such approaches to attract teachers (Berry, 2001). Olson (2000c) estimated
that approximately 80,000 individuals have been licensed nationally to teach through
alternative certification programs.
There are numerous variations of alternative certification programs. Darling-
Hammond (1990) reported that the alternatives to traditional certification can fall into
one of three categories. First, alternative certification can mean alternative ways to meet
teacher certification requirements. An example of this type of certification might consist
of a graduate level master’s degree. A second type of alternative certification might
consist of alternative standards for certification. This type of certification might involve
the completion of certification simultaneously during a teaching career or a reduced
level of training. The final type of alternative certification Darling-Hammond discussed
was alternative state certification. This last type of certification permits the state to allow
the local employees or school districts to train and certify their own candidates.
Berry (2001) maintained that while there is a need for alternative certification
programs due to teacher shortages, there is also a need to assure that these programs are
of a high standard. Berry suggested that high quality alternative certification programs

3
contain several key elements. First, they must provide a strong academic and
pedagogical component. Secondly, they must include an intensive field experience in an
internship or student teaching. Next, a high quality alternative certification program
requires all teachers to meet all of the state’s standards for subject matter and teaching
knowledge. Lastly, all teachers must meet the state’s teacher quality standards.
In Texas, the Teacher Orientation and Preparation Program (TOPP) is a State
Board of Educator Certification approved alternative certification program that is
coordinated by Education Service Center 20, in San Antonio (Texas Region 20
Education Service Center, 2002). The objective of TOPP is “to provide for the
certification of individuals who meet specific requirements and who complete an
internship in a public or charter school in the region and to provide certified teachers a
means to gain additional certification(s)” (Texas Region 20 Education Service Center,
2002, p. 1).
The program is field-based and emphasizes the integration of theory and practice
(Texas Region 20 Education Service Center, 2002). The four major components of the
program include university courses, classroom observations, professional development
sessions, and a one-year paid supervised internship. The TOPP components identified by
Region 20 personnel certainly align with the qualities Berry (2001) suggests must be
present in a high-quality alternative certification program.
Statement of the Problem
The State Board of Educator Certification reported that there is a 44,000-teacher
shortage in the state of Texas (Huling, 1998). Texas universities are currently producing

4
15,000 teachers per year (Linton & Kester, 2002). The result is a shortage of teachers
that must draw on recruitment efforts as well as alternative certification programs
(Berry, 2001). An alternative certification program is one that offers alternate routes to
teacher certification for individuals who “possess a bachelor’s degree, pass a
competency examination and a background check, and complete a compressed training
program that includes intensive, hands-on experience” (Finn & Madigan, 2001, p. 29).
Alternative certification programs in Texas were authorized in 1984 by the 68th
Legislature in House Bill 72. One such program coordinated by Education Service
Center, Region 20, is the Teacher Orientation and Preparation Program (TOPP). The
objective of TOPP is to provide for the certification of individuals who meet state
requirements and complete an internship in a public or charter school in the region
(Texas Region 20 Education Service Center, 2002).
There is a need to determine if alternative certification programs such as TOPP
impact teacher retention. Additionally, there is a need to identify the demographic
characteristics that are associated with high rates of retention.
Purpose of the Study
The purpose of this study was to determine the impact of an alternative
certification program on the retention of teachers in Region 20, Texas, as reported by
personnel and records from Education Service Center, Region 20, Texas. Demographic
variables and retention rates were analyzed using logistic regression. Additionally,
qualitative data and information that assisted in explaining the retention rates of TOPP
participants were provided.

5
Research Questions
The following questions were addressed in the study:
1. Do selected demographic variables predict the retention of teachers in Region
20, Texas, who are certified through the TOPP as reported by personnel in
Education Service Center, Region 20, Texas?
2. What variables influence the retention of teachers who are certified through
the TOPP as reported by selected teachers who have completed the TOPP in
Region 20, Texas?
Operational Definitions
Alternative certification program: A program that offers alternate routes to teacher
certification for individuals who “possess a bachelor’s degree, pass a competency
examination and a background check, and complete a compressed training
program that includes intensive, hands-on experience” (Finn & Madigan, 2001,
p. 29).
Education Service Center, Region 20: An organization that serves one of 20
geographically delineated areas of Texas, Region 20 located in San Antonio
whose primary responsibilities include: (a) assisting school districts in improving
student performance in each region in the system; (b) enabling school districts to
operate more efficiently and economically; and (c) implementing initiatives
assigned by the legislature or the commissioner (Texas Education Code, 1997).
Grade type: The grade spans assigned to specific campuses: elementary (E):
prekindergarten–5, middle school (M): 6-8, high school (H): 9-12.

6
Impact: The effect or impression of one thing upon another (Berube, 1985).
Selected demographic variables: The participants’ ethnicity, gender, grade type
(elementary–PK-5, middle school–6-8, and high school–9-12), and
socioeconomic level (as determined by percent of children who qualify for free
and reduced lunch programs) of campus at which currently employed.
Selected Texas public school districts: The public school districts identified through a
data query identifying TOPP participants through the use of Region 20 TOPP
databanks and Public Education Information Management System (PEIMS). The
school districts in which the identified teachers are working will be identified as
the “selected districts.”
Socioeconomic level of campus: A high poverty campus is one with 50% or more
economically disadvantaged students as determined by qualification for free and
reduced school lunch program. Low poverty campus is one with less than 50%
economically disadvantaged students as determined by qualification for free and
reduced school lunch program.
Teacher: The individual responsible for guiding and directing students in the general
educational subject matter in school (Texas Education Agency, 1991).
Teacher Orientation and Preparation Program (TOPP): A State Board of Educator
Certification approved alternative teacher certification program coordinated in
Education Service Center, Region 20 (Texas Region 20 Education Service
Center, 2002).

7
Teacher retention: The intern who is teacher of record in the fall of year 1 and is still
employed as teacher of record in the fall of year 3.
Texas Education Agency: A state governed education regulatory agency in Texas.
Assumptions
For the purpose of this study, the following assumptions were made:
1. The researcher was impartial in collecting and analyzing the data.
2. The respondents surveyed understood the scope of the study and the language
of the interview, were competent in self-reporting, and responded objectively
and honestly.
3. Interpretation of the data collected accurately reflected the intent of the
respondent.
4. The methodology proposed and described offered the most logical and
appropriate design for this particular research project.
Limitations
The following limitations were identified:
1. The scope of this study was limited to the independent school districts in
Region 20, Texas, that employed teachers who were certified through the
Teacher Orientation and Preparation Program in Region 20, Texas.
2. The study was limited to the information acquired from literature review and
survey instruments.

8
3. The findings from this study may not be generalized to any group other than
the independent school districts in Region 20, Texas, employing participants
of the Teacher Orientation and Preparation Program in Region 20, Texas.
Significance of the Study
Nearly 30% of teachers nationwide leave the profession within the first three
years (Scherer, 1999). For this reason, it is essential that the field of education develop
strategies to attract and retain people in the field (Berry, 2001). One such approach is
that of alternative certification programs (Darling-Hammond, 1990). Berry (2001)
indicated that 41 states are currently utilizing alternative certification programs. With the
large number of states currently utilizing alternative certification programs, there is a
need to determine if teachers who complete alternative certification programs are staying
in the field of education and what the attitudes and perceptions are of those who stay.
The retention rate of teachers who completed an alternative certification program
was examined. The examination of selected demographic variables offered some insight
into the existence of specific demographic variables that tended to positively and
negatively impact teacher retention rates. Information from the data collection and
analysis provided insight into the retention rate of alternatively certified teachers.
Additionally, information related to the attitudes and perceptions of alternatively
certified teachers in regards to their retention in the field of education was provided.
Organization of the Dissertation
This dissertation is divided into five major chapters. Chapter I contains an
introduction, statement of the problem, purpose of the study, operational definitions,
9
assumptions and limitations, and the significance of the study. A review of the literature
is found in Chapter II. In Chapter III, the researcher describes the methodology
employed, including the population, instrumentation, procedures, and data analysis.
Chapter IV contains the analysis and comparison of the data collected in the study.
Finally, in Chapter V, the researcher provides a summary of the findings from this study
and conclusions and implications from those findings. Recommendations for practices
and directions for future research are addressed in this chapter as well.

10
CHAPTER II
REVIEW OF THE LITERATURE
A review of the current literature that supports the study of the impact of
alternative certification programs on teacher retention is provided in this chapter. The
literature is organized into the following categories: teacher shortage, teacher retention,
and teacher certification.
Teacher Shortage
No Child Left Behind Act: A National Perspective
The Elementary and Secondary Education Act of 1965 as amended by Public
Law 107-110–No Child Left Behind (NCLB) Act, provides the guidance and legal
requirements for ensuring that all children achieve the same high standards, (Texas
Education Agency, 2002). The U.S. Department of Education identifies five goals that
focus on student achievement. The goals include the following:
1. By 2013, all students will reach high standards, at a minimum attaining
proficiency or better in reading/language arts and mathematics.
2. All limited English proficient students will become proficient in English and
reach high academic standards, at a minimum attaining proficiency or better
in reading/language arts and mathematics.
3. By 2005-2006, all students will be taught by highly qualified teachers.
4. All students will be educated in learning environments that are safe, drug-
free, and conducive to learning.
5. All students will graduate from high school (Texas Education Agency, 2002).

11
Components of the No Child Left Behind Act of 2001 that impact teacher
certification include Title I, Part A and Title II, Part A. Embedded throughout each of
these pieces of the legislation is reference to “highly qualified teachers.” The emphasis is
placed on not only recruiting, but also retaining highly qualified teachers.
The No Child Left Behind Act requires states and Local Education Agencies to
have a plan for all teachers in core academic subject areas to become “highly qualified”
by the end of the 2005-2006 school year. Teachers hired after the first day of instruction
of school year 2002-2003 who teach in the core academic subject areas in a Title I, Part
A program must meet the “highly qualified” standard when hired (Texas Education
Agency, 2003a). In order to meet the “highly qualified” standard set forth by the No
Child Left Behind Act, a teacher must have: (a) at least a bachelor’s degree, (b) full state
certification, and (c) demonstrated competency in the core academic subject area
assigned (Texas Education Agency, 2003b). The only exception to this rule concerns
charter schools where the No Child Left Behind Act defers to state law concerning
certification requirements for charter schools.
The purpose of Title I, Part A is to ensure that all children, particularly low-achieving children in the highest-poverty schools, have a fair, equal, andsignificant opportunity to obtain a high-quality education and reach, at aminimum, proficiency on challenging State academic achievement standardsand state academic assessments. (Texas Education Agency, 2002, p. 8)
The No Child Left Behind Act of 2001 states that any teacher hired after the first day of
the 2002-2003 school year to teach in a Title I, Part A program must be highly qualified
(Texas Education Agency, 2002). In addition, the law requires all local education
12
agencies to have a plan to ensure that all teachers in the local education agency teaching
in core academic subjects are highly qualified by the end of the 2005-2006 school year.
TitleII, Part A is referred to as “Teacher and Principal Training and Recruiting”
and according to the Texas Education Agency (2002):
The purpose of Title II, Part A, is to increase the academic achievement of allstudents by helping schools and school districts improve teacher and principalquality and ensure that all teachers are highly qualified. Through the program,local educational agencies receive funds on a formula basis. Local educationagencies that receive funds are held accountable to the public for improvementsin academic achievement. Title II, Part A provides local education agencies withthe flexibility to use these funds creatively to address challenges to teacher andparaprofessional quality, whether they concern teacher preparation andqualifications of new teachers and paraprofessionals, recruitment and hiring,induction, professional development, teacher retention, the need for more capableprincipals and assistant principals to serve as effective school leaders, orreducing class size. (p. 190)
National Teacher Shortage and Teacher Attrition
As indicated, one of the goals identified through the No Child Left Behind
legislation requires that all students “be taught by highly qualified teachers” (Texas
Education Agency, 2002). This requirement adds additional strain to an already strained
pool of potential teachers. A review of the data suggests that a teacher shortage is
eminent. Nationally, the number of teachers who are produced is adequate to fill the
need (Berry, 2000). However, only 60% of newly prepared teachers actually enter the
teaching profession after graduation (Berry, 2000). Researchers’ estimates suggest that
over the next ten years, there will be a demand for over two million teachers nationwide
(Howard, 2003). That amounts to approximately 200,000 teachers per year for ten years
(Hope, 1999).

13
Hope also stated that there will only be approximately 100,000 new teachers
entering the field each year over the next ten years and that a percentage of them will not
stay in the education field. Hope suggested that as many as 40% of those 100,000
entering the teaching field will leave within the first two years. Other researchers have
suggested that between 20 and 50% of all teachers will leave the profession within their
first five years in the profession (Colley, 2002). The possibility of placing a highly
qualified teacher in every classroom in America is diminished due to projected shortages
that are associated with large numbers of retiring teachers, projected enrollment
increases, teacher attrition, and new classroom policies (Howard, 2003; Ingersoll, 2003b;
Lucksinger, 2000).
Retiring Teachers
Lucksinger (2000) stated that, “the Baby Boom generation, born between 1940
and 1960, has impacted teaching forces in a variety of ways over the years” (p. 11). The
high number of births that occurred after World War II increased the number of students
entering the public schools in 1950s, 1960s, and 1970s by millions of children. As this
generation ages, its impact is evident throughout the education system. According to
Lucksinger (2000), this population moved through the education system as students and
then many eventually continued in the education system as teachers and administrators.
Many of the people in this generation are now at retirement age and the impact is
evidenced through the current teacher shortage. Howard (2003) reported that as teachers
of the baby boom generation reach their 40s and 50s and begin to retire, the nation will
inevitably face the largest number of teacher retirements.

14
According to Howard (2003), approximately 25% of public school teachers are
over the age of 50 and nearly 50% are expected to retire within the next decade.
Ingersoll (2003b) stated that currently retirement accounts for approximately 13% of the
total teacher turnover. Howard contends that the baby boom generation will likely
increase this percentage.
Projected Enrollment Increases
Howard (2003) stated that while an expected increase in teacher retirement is
eminent, it will coincide with an increase in student enrollment. In 1990, there were 41.2
million students enrolled in elementary and secondary schools and in 2000, there were
47.2 million students enrolled in the same grade levels (National Center for Educational
Statistics [NCES], 2002). According to the National Center for Educational Statistics,
the student enrollment in elementary is projected to increase to 53.7 million by 2012.
Howard (2003) stated that the increases in student populations are most prevalent in
California, Nevada, Florida, New York, and Texas, where a greater percentage of the
students are culturally and linguistically diverse and attending schools in larger urban
settings. Figure 1 depicts data related to the growing student population in the United
States.

15
Figure 1. Student population and projected student population in the United States.
0
20
40
60
1990 2000 2012*
Student Population and Projected Student Population in theUnited States
student enrollement (inmillions)
Teacher Attrition
Attrition is another contributing factor of the current teacher shortage. The
annual departure rate for teachers is between 14 and 17%, while other professions
average approximately 11% per year (Howard, 2003; Ingersoll, 2003b). Howard (2003)
reported that high attrition rates can be attributed to high levels of stress, unsatisfactory
organizational conditions, lack of administrative support, perceived discipline problems,
cultural mismatches with students, and a variety of sociocultural factors. Ingersoll’s
(2003b) research attributed the attrition rates to school staffing action, family or personal
reasons, the desire to pursue other career opportunities, and job dissatisfaction.
According to Ingersoll (2003a), approximately one-third of America’s teachers
leave teaching sometime during their first three years of teaching, while almost half
leave within the first five years. Ingersoll (2001) suggested that attrition rates are highest
in low-income urban schools. In the same study, Ingersoll (2001) found the turnover rate
for teachers in high-poverty schools was 50% higher than in low-poverty schools.
Darling-Hammond (2000) attributed higher attrition rates in high-poverty schools to the

16
following factors: lower salary, access to fewer resources, poorer working conditions,
higher stress levels associated with working with students and families with a wide array
of needs, and higher percentage of teachers who are underprepared and unsupported.
Classroom Policies
According to Howard (2003), a number of states have mandated smaller class
sizes in an attempt to improve the quality of education for students. As a result, schools
were forced to hire a number of teachers who, in many cases, were unprepared and non-
certified. One ramification of the mandate for smaller class sizes, was an increase in the
demand for teachers. This, too, has contributed to the current teacher shortage.
Another classroom policy that contributed to the attrition rate of teachers is
related to classroom discipline and lack of support by the campus administration
(Ingersoll, 2003b). The data suggested that increased support from school administration
and a reduction of discipline problems both positively impacted the retention of teachers
(Ingersoll, 2003b).
The factors outlined are major contributors of the current teacher shortage. Some
additional contributing factors included changes in technology, more women in the
workforce, more job opportunities for talented individuals, and cultural changes
(Lucksinger, 2000).
No Child Left Behind as It Relates to Texas
While the No Child Left Behind Act requires “highly qualified” teachers, the
United States Department of Education allows each state to define “highly qualified.”
17
As previously outlined, in order to meet the “highly qualified” standard set forth by the
No Child Left Behind Act, a teacher must have: (a) at least a bachelor’s degree, (b) full
state certification, and (c) demonstrated competency in the core academic subject area
assigned (Texas Education Agency, 2003b). In the state of Texas, the State Board for
Educator Certification (SBEC) is responsible for overseeing the certification process. In
October of 2003, the Texas Education Agency published the state’s interpretation of the
NCLB requirements in the NCLB Bulletin (Texas Education Agency, 2003b).
New elementary teachers are required to demonstrate competency by passing the
Elementary Comprehensive Examination for Certification of Educators in Texas
(ExCET) or the grade-level appropriate Texas Examination of Educator Standards
(TExES). New secondary teachers must demonstrate competency by passing the
applicable ExCET or TExES content exam for a certification area appropriate to the
teaching assignment or have an academic major in the core academic subject areas in
which they teach (Texas Education Agency, 2003b).
No Child Left Behind legislation does not allow for exceptions or alternatives in
meeting the requirement for a bachelor’s degree or full state certification. However, each
state is allowed to establish a “high, objective, uniform standard of evaluation (HOUSE)
by which teachers that are not new to the profession can demonstrate competency in the
core academic subject areas” (Texas Education Agency, 2003b, p. 1). According to the
Texas Education Agency (2003b), the alternative approach that the state of Texas has
adopted includes two options for elementary teachers (grades PK-6) and one option for
secondary teachers (grades 7-12).

18
The first option experienced elementary teachers can utilize to demonstrate
competency includes the following: The teacher has at least one creditable year of
teaching experience; and the teacher has a minimum of 24 points derived from teaching
experience (1 year = 1 point with a maximum of 12 points); college coursework in
English/Language Arts, Math, Science, and/or Social Studies (1 college hour = 1 point);
and/or professional development that meets the standards set by the State Board for
Educator Certification Continuing Professional Education (CPE) requirements (15 CPE
clock hours = 1 point); and each of the subjects (English/Language Arts, Math, Science,
and/or Social Studies) is represented in the 24 hours.
The second option experienced elementary teachers can utilize to demonstrate
competency requires the teacher to have one creditable year of teaching experience and
college coursework equivalent to a college major in the subject to be taught.
Experienced secondary teachers can demonstrate competency in the core subject
areas by demonstrating one creditable year of teaching experience in the subject area to
be taught, or a closely related field, and having a minimum of 24 points (with at least 6
in the subject to be taught). The 24 points can be accrued through the following: (a)
experience teaching at the secondary level in the subject to be taught or a closely related
field (1 year = 1 point with a maximum of 12 points), (b) college coursework in the
subject to be taught or in a closely related field (1 college hour = 1 point); and/or (c)
professional development that meets the standards set by the State Board for Educator
Certification Continuing Professional Education (CPE) requirements (15 CPE clock
hours = 1 point).

19
The state of Texas requires each State Education Agency to assure that all
teachers meet the highly qualified criteria. Additionally, each State Education Agency
must submit this data annually. This requirement went into effect beginning with the
2004-2005 school year (Texas Education Agency, 2003c).
Texas Teacher Shortage and Attrition
In the state of Texas, approximately 75% of the demand for new teachers is a
result of teacher attrition (State Board of Educator Certification, 2001). In the same
study, State Board for Educator Certification personnel indicated that in the year 1996,
47% of the demand for new teachers was attributed to teacher attrition associated with
beginning teachers. According to the State Board of Educator Certification (2001)
personnel, Texas’ demand for teachers averaged approximately 32,000 per year for the
years 1996-2001. Each year of this five-year period showed a slight increase, with the
most recent year of 2001 demanding 38,000 new teachers to fill the teacher vacancies in
the state of Texas (State Board of Educator Certification, 2001). In Texas, the beginning
teacher turnover rate is higher than the average for all teachers (Texas Center for
Educational Research, 2000).
School industry turnover models based on teacher salaries indicate that Texas
may be spending between $329 million to $2.1 billion on teacher turnover each year
(State Board of Educator Certification, 2001). Turnover costs associated with more
experienced teachers are higher than the costs associated with beginner and novice
teachers. However, since the state is losing beginning teachers at higher rates, the result
is high costs for the state (Texas Center for Educational Research, 2000). While these
20
costs may never be eliminated, they can be reduced through the implementation of
practices that encourage teachers to remain in the profession. Such practices include
teacher support systems, stipends associated with participation in professional support,
and advanced teaching certificates (State Board of Educator Certification, 2001). Most
alternative certification programs have some sort of induction program and mentoring
component (Roach & Cohen, 2002). Jorissen (2003) stated that while the literature
shows mentoring relationships improve teacher retention, it is particularly important in
alternative certification program routes to certification.
The State Board for Educator Certification conducted a number of attrition
studies in 2002. One-year attrition rates for the 2001-2002 academic year were reported
at 10.3% (State Board for Educator Certification, 2002a). The study outlined in Table
2.1 clearly indicates an increase in attrition rates over time.
Table 2.1. One-Year Attrition Rates for Texas Public School Teachers (1995-1996through 2001-2002)
Academic 1995- 1996 1997 1998 1999 2000 2001 ChangeYear 1996 1997 1998 1999 2000 2001 2002 1996-
% % % % % % % 2002
AllTeachers 8.3 8.6 8.9 9.9 9.8 10.5 10.3 2.0
In a series of studies conducted by Ed Fuller, the former Co-Director of the State
Board for Educator Certification in Texas, the attrition rates of alternatively certified

21
teachers were examined in relation to traditionally certified teachers (Fuller, 2002).
Fuller’s findings are outlined in Table 2.2.
Table 2.2. Attrition Rates: Alternative Route vs. Traditional Route
Attrition Rate % Attrition Rate %Program Type 1998-1999 1998-2002
Alternative Certification ProgramAll Schools 11.3 18.7
Traditional University ProgramAll Schools 7.2 12.2
Alternative Certification ProgramHigh Poverty Schools 11.0 17.6
Traditional University ProgramHigh Poverty Schools 6.3 9.3
Alternative Certification ProgramHigh Minority 11.0 18.4
Traditional University ProgramHigh Minority 6.6 9.9
The teachers represented in the data are those who obtained initial certification in
1999 from a Texas educator preparation program, were employed in Texas public
schools in the 1999-2000 academic year, and employed in only one Texas public school
in the 1999-2000 academic year. The data clearly indicate that the attrition rate for
teachers who completed an alternative certification program is higher than the attrition
rate for teachers who completed a traditional university program.

22
Teacher Retention
Hunt and Carroll (2003) stated, “teacher shortages will never end and that quality
teaching will not be achieved for every child until we change the conditions that are
driving teachers out of too many of our schools” (p. 3). Based on national teacher
attrition rates, Colley (2002) stated that between 20 and 50% of all teachers leave the
profession within their first five years in the profession. According to Ingersoll and
Smith (2003), the turnover rate in the teaching profession is attributed to two
components: attrition, those who leave all together; and migration, those who move to
teaching jobs in other schools. The number of teachers who leave due to migration make
up slightly less than half of the turnover rate while attrition accounts for slightly more
than half (Hunt & Carroll, 2003; Ingersoll & Smith, 2003).
As indicated, attrition of teachers is most prevalent among beginning teachers.
Beginning teachers who leave the profession after one year indicate that they do so
because of a number of reasons (Ingersoll & Smith, 2003). In a study by Ingersoll and
Smith (2003), approximately 19% of the teachers in the study left as a result of school
staffing action such as teacher cutbacks, layoffs, termination, school reorganization, or
school closings. In the same study, 42% left the profession due to personal reasons such
as pregnancy, childrearing, health problems, and family moves. Nearly 39% left the
profession to pursue another job or career. Twenty-nine percent indicated that they left
due to dissatisfaction with the teaching career or with their job.
In Texas, nearly 60% of teachers leave the profession within the first five years
(Patterson, 2002). According to Patterson, 60% of those who leave do so as a result of

23
student disciplinary issues and working conditions. Less than 25% site pay as the
primary reason for leaving the profession.
State Board for Educator Certification (as cited on Patterson, 2002) statistics
indicated that there are nearly 420,000 individuals in Texas who are certified to teach,
but decline to teach in Texas public schools. This indicates that the issue does not exit
with the supply of teachers, but their willingness to enter and stay in the teaching
profession.
Retention Strategies
While researchers revealed a number of strategies to improve teacher retention
rates, the most prevalent included induction and mentor programs, compensation
programs, and adjustments to working conditions (Darling-Hammond, 2003; Feiman-
Nemser, 2003; Hope, 1999; Jacobson, 1995; Morice & Murray, 2003; Olson, 2000a;).
Induction and Mentor
The most prevalent retention strategies include induction and mentor programs
where veteran teachers provide new teachers with structured support (Olson, 2000a).
According to Olson, first-year teachers who do not participate in such programs are
nearly twice as likely to leave the teaching profession after their first three years. A
number of researchers have found that mentoring programs raise retention rates for new
teachers by improving their attitudes, feelings of efficacy, and instructional skills
(Darling-Hammond, 2003). Darling-Hammond warned that induction programs will
only produce such results if they are well designed and well supported. Currently, only
22 of the 33 states that have induction programs provide funding support for these

24
programs (Darling-Hammond, 2003). The provision for funding may increase the
likelihood of effective implementation of such a program.
Effective induction programs provide mentor training for the mentors (Feiman-
Nemser, 2003). Mentoring is a skill that must be taught and practiced. According to
Feiman-Nemser, mentors need opportunities (a) to clarify their vision of good teaching,
to see and analyze effective models of mentoring; (b) to develop skills in observing and
talking about teaching in analytic, nonjudgmental ways; and (c) to learn to assess new
teachers’ progress and their own effectiveness as mentors. Hope (1999) contended that
induction programs involve systematic contact with the intention of assisting in the new
teacher’s professional growth and development and of engaging in collegial
conversation about the work of teaching. Hope went on to state that, “while the
orientation phase of the process may conclude after the first year, induction should
continue in order to develop teachers’ repertoires of skills and to inculcate teaching as a
career” (p. 54).
Compensation
Darling-Hammond (2003) contended that the field of education must compete
with other occupations for the most talented graduates. In order to do so, personnel
responsible for hiring must be able to compete in terms of wages and working
conditions. Currently, personnel responsible for hiring are not fulfilling this challenge.
Teacher salaries are approximately 20% below the salaries of other professionals with
comparable education and training (Darling-Hammond, 2003).

25
Jacobson (1995) stated that monetary incentives affect recruitment, retention, and
attendance. Incentive pay programs that provide salary increases for teachers on the
basis of performance evaluations have been proven to work in some instances (Morice &
Murray, 2003). Morice and Murray contended that while teachers tend to enter the field
for the intrinsic satisfaction of working with students, they can still be motivated by
extrinsic factors such as incentive pay.
Working Conditions
Working conditions have a significant impact on teacher satisfaction (Darling-
Hammond, 2003). According to Darling-Hammond (2000), teacher feelings related to
administrative support, resources for teaching, and teacher input into decision-making
play an important role in their staying in the profession.
Schools serving lower-income or lower-achieving students have higher attrition
rates which are influenced by the poorer working conditions typically found in those
schools (Darling-Hammond, 2003). Poorer working conditions include larger class sizes,
poor facilities, and low administrative support (Darling-Hammond, 2003). When these
conditions are paired with low salaries, they have a greater affect on teacher turnover
than do the demographic characteristics of the students (Darling-Hammond, 2003).
Teacher Certification
History
Teacher qualifications can be traced back as far as 1837 when Horace Mann
addressed teacher competency in The First Annual Report (Compayre, 1907; Cremin,
1957). In 1836, Mann was elected state senator of Massachusetts and was appointed

26
president of the senate his first day of service (Compayre, 1907). While serving as
president of the Massachusetts Senate, Mann recognized the need for a focus on
educational issues. In April of 1837, Mann signed an official act that resulted in the
formation of a board of education (Compayre, 1907). The board would serve to “study
and investigate the moral and material condition of the schools, in order, subsequently to
discover and apply the best methods of improving them, the board being thus both an
examining and a reforming body” (Compayre, 1907, p. 23). Mann was elected as
secretary of the Massachusetts State Board of Education.
Mann served as the secretary for 12 years (Cremin, 1957). During this time,
Mann published 12 annual reports to the Board. According to Cremin (1957), Mann
recognized the potential destructive possibilities of religious, political, and class discord
and sought to establish a common set of values through the common school. Mann’s 12
reports were guided by the quest for “a public philosophy, a sense of community which
might be shared by Americans of every variety and persuasion” (Cremin, 1957, p. 8). It
was through the common school that Mann hoped to provide a universal education for
all students. Mann referred to his theory of universal education as the “great equalizer”
of human condition (Cremin, 1957).
The First Annual Report was published in 1837 and addressed four essential
needs of the public schools. The four needs included (a) the need for school buildings
that were physically conducive to learning, (b) effective local school boards, (c) public
commitment to universal education, and (d) competent teachers (Compayre, 1907;
Cremin, 1957). The issue of teacher quality would surface again, three years later, in

27
Mann’s work. The Fourth Annual Report (1840) involved the need to consolidate small
school districts, private schools, attendance, disciplinary issues, graded classes, and
teacher qualifications (Compayre, 1907; Cremin, 1957). Mann firmly believed that
teachers should be viewed as professionals who: (a) have a knowledge of the content, (b)
have the ability to impart knowledge onto others, (c) have the ability to manage and
govern a group of students, and (d) have the responsibility of teaching good behavior
and moral character (Compayre, 1907).
The first teacher education preparation program can be traced back to the
establishment of the first state normal school, which opened in Lexington, Massachusetts
in July 1839 (Spring, 2001). The early normal schools prepared teachers to teach in
today’s equivalent of the elementary school. Normal schools did not require high school
diplomas for admittance. Teachers who taught in secondary institutions, high schools,
and academies were generally college and university graduates (Spring, 2001).
By the 1930’s, most normal schools required a high school diploma for
admittance (Spring, 2001). Teacher preparation programs continued to progress
throughout the early 1900’s. According to Spring, four-year teacher colleges began to
grow in popularity throughout the early 1900’s. By 1933, there were a mere 30 normal
schools and 146 teacher colleges (Spring, 2001). Additionally, many colleges and
universities began to add departments and colleges of education.
During the 20th century, teacher certification requirements evolved from the use
of oral exams to written exams to written examinations paired with mandatory

28
completion of a prescribed set of courses (DeYoung & Wynn, 1972). It was also during
this time that the certification of teachers was assumed by individual states.
Traditional Certification
Today, in the United States, certification and licensing of teachers continues to
be the responsibility of the individual state (National Center for Education Information,
2003). Typically, the college or university submits a plan for a teacher preparation
program for each discipline and/or grade level(s) for which the institution wishes to offer
a certification. The state must approve each certification program. Candidates wishing to
seek certification apply directly to the college or university, take the required
coursework, and meet other required criteria such as student teaching and coursework.
Upon completion of the program, the candidate is granted certification or a teaching
license (National Center for Education Information, 2003).
State programs vary tremendously. Some require passing tests and field-based
observations prior to student teaching. The amount of time required for student teaching
varies from program-to-program. Some states require one initial certification while
others require second and third stage certificates. Some certificates require continuing
education, while others are life or permanent certificates (National Center for Education
Information, 2003).
The state of Texas requires teacher candidates to complete teacher training
through an approved program discipline (State Board for Educator Certification, 2004a).
Texas institutions do not offer a degree in education. Every teacher must have an
academic major and complete a teacher-training course. The teacher-training component

29
must be done through an approved program. These programs are housed at colleges and
universities, school districts, regional service centers, community colleges, and other
locations throughout the state.
In addition to obtaining an academic major and completing a teacher-training
course, candidates must also complete the appropriate teacher certification test for the
subject and grade level they are seeking certification. The Texas State Board for
Educator Certification (SBEC) is divided into four distinct areas: (a) educator
preparation, (b) assessment and accountability, (c) certification, and (d) professional
discipline (State Board for Educator Certification, 2004a). Each component is outlined
below:
Educator Preparation
In the area of educator preparation, the certification board works primarily withentities preparing educators for certification in Texas. The work includesguidance in program development, approval, and implementation. The boardcurrently serves 70 universities, 16 community colleges, 30 alternative teachercertification programs of which 7 are private companies and 11 alternativeadministrator certification programs. The board also advises entities interested ininitiating educator preparation programs.
The certification board is involved in reviewing program approval procedures tostreamline the process while maintaining the integrity of program review.
Assessment
State law requires that individuals pass examinations in the areas in which theyseek certification. The certification board manages the development andadministration of the Examination for the Certification of Educators in Texas(ExCET), Texas Examinations for Master Teachers (TExMaT), TexasExaminations of Educator Standards (TExES), Texas Oral Proficiency Test(TOPT), and Texas Assessment of Sign Communication (TASC) and (TASC-ASL) testing programs. Individuals typically take the TExES Pedagogy andProfessional Responsibilities test and additional tests in the academic disciplinesin which they seek certification after completing a program of preparation for the

30
specific certificate(s). These tests assess the prospective educator’s knowledge of academic content and teaching, including understanding of learners.
Test development and review of current tests is ongoing. Passing standards arereviewed periodically and recommendations from these reviews are presented tothe Board. The Board sets the minimum score required to pass each certificationtest. Assessment professionals work with school district and educator preparationprogram staff to identify committee members for these activities.
Accountability
The certification board monitors the quality of educator preparation at universityand alternative certification programs through the Accountability System forEducator Preparation (ASEP). The certification board uses assessment data(TExES, ExCET, TExMaT, TOPT, TASC, and TASC-ASL) and, in the future,the performance of beginning teachers to determine program quality and issueannual accreditation reports according to minimum acceptable performancelevels established by the Board.
Certification
The certification board is responsible for ensuring that educators are qualified toserve in the Texas public school system through the following:
Issuing educator credentials to applicants who have completed theappropriate degree and have a standard credential from another state oranother country.
Issuing educator credentials to applicants who have completed requirementsfor certification at a Texas educator preparation program.
Certifying applicants adding certification based on completion of theappropriate examination(s).
Certifying applicants adding certification based on completion of theappropriate examination(s).
Issuing educator credentials to educational aides.Issuing emergency and nonrenewable permits to school districts and
reviewing and approving hardship permits.Analyzing and disseminating data on certificate and permit activityCoordinating applicant criminal investigations.Advising school district staff on assignment criteria for hiring appropriately
certified individual.

31
Professional Discipline
The certification board ensures that Texas educators meet the highest standardsof professionalism and ethical behavior. Through its enforcement of disciplinaryrules and the Educators’ Code of Ethics, the board investigates allegations of educator misconduct to guarantee the safety and well being of Texas schoolchildren and fellow educators. When determining if sanctions against a certificateare warranted, the board conducts a thorough investigation and provides theeducator the opportunity to be heard. Cases that are not resolved informallythrough agreed orders may result in informal hearings before the State of Officeof Administrative Hearings (SOAH). Such hearings are open to the public.Copies of any final decision by an Administrative Law Judge or an Agreed orderbetween the parties resolving the case are open records and may be obtainedupon request. (¶ 8)
According to SBEC (2004b), Texas implemented a new teacher certification
examination program in the fall of 2002. The new examination program is called the
Texas Examinations of Educator Standards (TExES). It is replaces the Examination for
the Certification of Educators in Texas (ExCET), which had been Texas’ teacher
certification exam since 1986. The development of the TExES is the result of five years
of work in collaboration with the Texas Education Agency and the Texas Higher
Education Coordinating Board. The goal of the re-design was a kindergarten through
college, or a K-16 curriculum alignment. According to the State Board for Educator
Certification (2004b):
The redesign of the educator certification structure is an integral part of the K-16 Initiative. The first step in this process was the development of newstandards for beginning Texas public school teachers. These standards are basedon the state’s required curriculum for public school students, the Texas EssentialKnowledge and Skills (TEKS). Developing the new standards and introducingnew teacher certificates has been a cooperative process involving numerouscommittees, each comprised of as many as 25 experts from all educationalarenas, from classroom teachers to deans of education, as well as interestedcitizens.

32
The work of these committees is guiding the development of the new TExEStesting program, which is based on the new standards. Twenty-five newstandards-based certificates were introduced in the fall of 2002. Five newcertificates were introduced in the fall of 2003. SBEC has a goal of replacing allexisting ExCET tests and certificates by 2005.
The certificate structure itself also is being streamlined. There will be areduction in the types of certificates offered, but each new certificate willrequire a greater breadth and depth of knowledge on the part of the beginningteacher. For example, there no longer will be individual certificates offered forphysics and chemistry. Instead there will be a single certificate for physicalscience, which requires the beginning teacher to have adequate contentknowledge to teach either, or both.
SBEC and the committees creating the new standards recognize that childrenlearn differently at different grade levels. The new certificate structure takesthese developmental differences into account. The new certificates will alsobring greater focus to preparing middle school teachers. New certificates havebeen issued for early childhood through grade four, grades four through eight,and grades eight through twelve. These are replacing current certificates thatcover early childhood through grades six or eight, and grades six throughtwelve. There are also new certificates that are considered all level (i.e., earlychildhood through grade twelve). (¶ 5)
For teachers from states outside of Texas wishing to gain certification in the
state of Texas, there are several options (SBEC, 2004a). An applicant who holds a
certificate in another state or United States territory may apply for a Texas certificate.
In 2001, the 77th Texas Legislature passed House Bill 1721, which allows SBEC to
issue a Texas teaching certificate to any candidate who holds a valid certificate from
another state or country and who has passed a certification exam equivalent to the
appropriate Texas exam. The credential must be equivalent to a certificate issued by
SBEC and must not have been revoked, suspended, or pending such action.

33
Alternative Certification
Emily Feistritzer defined alternative certification programs as:
Every avenue of becoming licensed to teach, from emergency certification tovery sophisticated and well-designed programs that address the professionalpreparation needs of the growing population of individuals who already have atleast a baccalaureate degree and considerable life experience and want to becometeachers. (Feistritzer & Chester, 2000, p. 3)
Sara Wright (2001) defined alternative certification programs as: “accreditation
programs designed to allow individuals with a significant subject-area background to
complete their teacher preparation education while teaching full time in a participating
school district” (p. 24). Perhaps the broadest and most encompassing definition is the
one proposed by Virginia Roach and Benjamin Cohen:
Pathways to a teaching certificate that fall outside of a full-time, four- or five-year teacher preparation program. They can include programs for mid-careerswitchers, programs to prepare paraprofessionals to become teachers, andprograms for new college graduates who decide after graduation to enterteaching. (Roach & Cohen, 2002, p. 2)
Alternative certification programs offer a number of benefits to individuals
wishing to obtain teacher certification. Some of the benefits include less demanding time
commitments for training, reduced financial costs, academic and social support services,
and assistance with existing certification requirements (Ng, 2003). Alternative
certification programs vary greatly in design and scope and can be found in 44 states and
the District of Columbia (Blair, 2003). The design of an alternative certification program
can range from a two-week training requirement to a two-year post-baccalaureate
program with integrated coursework and up to three years of mentoring support
(Jorissen, 2003).

34
Alternative certification programs began to gain popularity in the mid-1980s and
grew quickly throughout the 1990’s. Between 1985 and 1990, there were approximately
20,000 people certified through alternative routes. By the year 1992, that number
increased to nearly 40,000 people in 40 states (Feistritzer, 1993).
New Jersey was one of the first states to call a lot of attention to alternative
certification programs when it enacted legislation for such in 1984. The state of Texas
soon followed with its first alternative certification program in the Houston Independent
School District in 1985. Both were developed to assist in meeting the demands of
teacher shortages (National Center for Education Information, 2003).
While the number and type of alternative certification programs vary greatly,
there are a number of authors who have identified key components of effective
programs. Berry (2001) suggested that high quality alternative certification programs
contain several key elements. First, they must provide a strong academic and
pedagogical component. Secondly, they must include an intensive field experience in an
internship or student teaching. Next, a high quality alternative certification program
requires all teachers to meet all of the state’s standards for subject matter and teaching
knowledge. Lastly, all teachers must meet the state’s teacher quality standards.
Alternative Certification Programs in Texas
The Texas Alternative Teacher Certification Program was established in 1984 by
the 68th Legislature in House Bill 72. The Texas Education Code 21.049 provides a
provision that requires the State Board for Educator Certification to establish rules for
the establishment of alternative certification programs (Texas Education Code, 2004).

35
Under this rule, persons who hold degrees from regionally accredited institutions of
higher education and who meet prerequisites for admission to an approved alternative
certification program may be recommended to the Commissioner of Education for
teacher certification upon satisfactory completion of specified requirements of the
approved program (Texas Region 20 Education Service Center, 2003). Alternative
teacher certification programs were first implemented in Texas during the 1985-1986
school year. There are 52 State Board of Education approved alternative certification
programs in the state of Texas (National Center for Education Information, 2003). These
programs are based in regional education service centers, universities, school districts,
and private entities.
Teacher Orientation and Preparation Program (TOPP)
Regional Education Service Centers were established in the state of Texas in
response to Title III of the Elementary and Secondary Education Act passed by Congress
in 1965. The 20 media centers were established by the Texas Legislature to provide
services for Title III. Since the establishment of the 20 Regional Education Services
Centers, their role in education has evolved. The Regional Education Service Centers
have played an integral role in the provision of services to school districts and charter
schools in the implementation of school reform and school improvement. The Education
Service Centers have carried out mandates set forth by the Texas Legislature and the
Commissioners of Education to assist school districts and charters in achieving the goal
of improved student performance. Education Service Centers are organizations that serve
one of 20 geographically delineated areas of Texas whose primary responsibilities

36
include: (a) assist school districts in improving student performance in each region in the
system, (b) enable school districts to operate more efficiently and economically, and (c)
implement initiatives assigned by the legislature or the commissioner (Texas Education
Code, 1997).
Education Service Center, Region 20, located in San Antonio, is the site of one of
the state approved alternative certification programs in the state of Texas. The Teacher
Orientation and Preparation Program (TOPP) allows persons who hold degrees from
accredited institutions of higher education an opportunity to complete the state required
certification within a 13- to 15-month period (Texas Region 20 Education Service
Center, 2003).
The program requirements include participation in seminars, training, college
coursework, a mentorship component, and an internship. Each component has been
carefully planned so as to provide a comprehensive overview of the teaching process and
up-to-date information on effective teaching practices, classroom management and
organization, and behavior management (Texas Region 20 Education Service Center,
2003). Participation in each component is critical to the success of the candidates and is
required for completion of the program, and ultimately certification. Each component is
described in detail in the next section.
Seminars. Seminars are scheduled for full days on Saturdays throughout the
school year. Topics range from child growth and development to content specific
instructional strategies. The seminars are conducted by TOPP staff and adjunct TOPP
staff members.

37
Training. The training component includes a summer institute as well as
specialized training during the school year. Topics include working with diverse student
populations, technology integration, behavior and classroom management, and a variety
of other topics specific to each certification area. The trainings are conducted by TOPP
staff and adjunct TOPP staff members.
College coursework. Candidates are required to take 12-15 hours of college
coursework. All coursework is completed through a local university. Required classes
are varied and depend on the specific certification the candidate is seeking.
Mentorship component. The mentorship component consists of a structured
mentor program that includes mentor training, formal observations, and constructive
feedback. The school principal identifies mentor teachers. Mentors are provided release
time during the school day to fulfill their mentor responsibilities. According to Texas
Region 20 Education Service Center (2003) TOPP staff, mentor responsibilities include
the following:
Accept the teacher intern as a professional.Acquaint the teacher intern with materials and resources available in the
school.Encourage the teacher intern to be creative and the try new teaching
strategies.Review lesson plans from the teacher intern and submit written feedback to
the TOPP office.Conduct observations of the teacher intern in the classroom a minimum of 45
minutes during six designated months, complete a Mentor Feedback Report,debrief each observation with the teacher intern, and provide a copy of theMentor Feedback Report to the intern.
Conduct regular cooperative planning sessions with the teacher intern.Attend Region 20 seminars conducted for mentors.Provide TOPP coordinator with written feedback of intern progress once a
semester and provide copies of the feedback to the principal and the intern.

38
Perform other duties as assigned by the principal. (p. 15)
Internship. The internship requires each TOPP candidate to secure a teaching
position in a public or charter school and maintain the position for the duration of the
school year. The position obtained must match the certification area sought by the
candidate. Once employed, the candidate must comply with all policies and procedures
established by the school district or charter. If a candidate leaves a position, voluntarily
or otherwise, the candidate is no longer permitted to attend the Region 20 TOPP
training. The candidate is, however, expected to complete the college coursework. All
candidates are considered the teacher of record and must comply with Chapter 247
Educators’ Code of Ethics: Rule §247.2 Code of Ethics and Standard Practices for Texas
Educators.
Each candidate must meet the state’s definition of “highly qualified” in order to
be in compliance with the requirements set forth by the 2001 No Child Left Behind
legislation. In order to do so, each candidate must pass the Texas Examinations of
Educator Standards (TExES) prior to the start of the school year.
According to Region 20 personnel, TOPP leads to certification in the following
certification areas (Texas Region 20 Education Service Center, 2002):
Early Childhood through Grade 4 Generalist
Early Childhood through Grade 4 Bilingual Generalist
Grades 4-8 Generalist
Grades 4-8 Bilingual Generalist
Grades 4-8 Single Subject

39
Grades 4-8 Dual Subject
Secondary Grades 8-12 Single Subject
Secondary Grades 8-12 Dual Subject
Secondary Composite Science Grades 4-8 and 8-12
Secondary Composite Social Studies Grades 4-8 and 8-12
Secondary Composite English Language Arts Grades 4-8 and 8-12
Generic Special Education Pre-Kindergarten-12
English as a Second Language Pre-Kindergarten-12
Region 20 TOPP personnel also consider other certification areas based upon
applicant qualifications and personnel vacancies in the region.
According to the State Board for Educator Certification (2002b), Education
Service Center, Region 20, has the following approved programs and certification areas:
Bilingual/ESL-Spanish, Computer ScienceElementary Self-ContainedEnglish Language Arts and ReadingEnglish Language Arts and Reading/Social StudiesEnglish as a Second LanguageGeneralistGeneric Special EducationHistoryLife SciencesMaster Reading TeacherMathematicsPhysical SciencesPrincipalScienceSecondary ArtSecondary Basic BusinessSecondary BiologySecondary Business Administration

40
Secondary Business CompositeSecondary ChemistrySecondary Computer Information SystemsSecondary DanceSecondary Earth ScienceSecondary EconomicsSecondary EnglishSecondary English Language ArtsSecondary FrenchSecondary GeographySecondary GermanSecondary GovernmentSecondary Health EducationSecondary HistorySecondary Industrial TechnologySecondary JournalismSecondary LatinSecondary Life-Earth ScienceSecondary MathematicsSecondary MusicSecondary Physical EducationSecondary Physical ScienceSecondary PhysicsSecondary Psychology,Secondary ReadingSecondary Science CompositeSecondary Secretarial BusinessSecondary Social Studies CompositeSecondary SociologySecondary SpanishSecondary Speech CommunicationsSecondary Theatre ArtsSocial StudiesTechnology ApplicationsVocational Agriculture Ornamental HorticultureVocational Agriculture ProductionVocational Home Economics Education.
Accordingly, Education Service Center, Region 20, Teacher Orientation and
Preparation Program can offer certification in these areas.

41
Candidates interested in completing certification through Teacher Orientation
and Preparation Program must meet specific eligibility requirements. Eligibility
requirements for all areas of the program include:
Bachelor’s degree from a regionally accredited college or university with a
2.5 overall GPA on a 4.0 scale.
Foreign transcript evaluation if required (Foreign transcripts must be
evaluated by an approved credential evaluation service. Evaluation must
include semester hours and grades and confirmation of the degree being
equivalent to a degree conferred by a regionally-accredited college or
university in the United States.).
Satisfactory scores on the TASP/THEA (Texas Higher Education
Assessment) basic skills test. Minimum passing scores for the 2004-2005
cycle are: Reading = 250, Math = 230, and Writing = 220.
Evidence of English language proficiency. This can be met with the
completion of an undergraduate or graduate degree at an institution in the
United States or verification of satisfactory scores on the Test of Spoken
English.
Satisfactory results on a proficiency test in the target language for those
candidates seeking certification in EC-Grade 4 Bilingual Generalist, Grades
4-8 Bilingual Generalist, Grades 4-8 and Secondary Grades 8-12 in Spanish,
German, or French prior to application deadline.
Required block of semester hours for the desired certification.

42
Required classroom observation hours (two full days of shadowing a teacher
in the certificate area being sought and 1/2 day of observation in special
education classroom).
Completed application, official transcripts from each college and university
attended, foreign transcript evaluation (if required), addendum for the release
of criminal history, satisfactory scores on TASP/THEA (Reading = 250,
Math = 230, and Writing = 220), and a $60 application fee.
All candidates must be recommended for certification by the TOPP staff. In
making recommendations to the State Board for Educator Certification (SBEC) for
certification of a candidate, the following areas are considered (Texas Region 20
Education Service Center, 2003):
Satisfactory completion of all training and college course requirements as
prescribed by the state-approved program.
Satisfactory Examination for the Certification of Educators in Texas
(ExCET) or Texas Examinations of Educator Standards (TExES) scores as
required for certification.
Recommendation of TOPP staff.
Submission of all mentor/intern monthly observations, preliminary and final
assessments by mentor and principal, lesson plan feedback by mentor,
philosophy of education by candidate, and portfolio rubric.
Evaluation of the portfolio that documents instructional efforts during the
internship year to include: ability to plan with grade-level teachers and/or

43
departmental colleagues, use of educational technology in the classroom,
utilization of school and community resources to enhance learning,
demonstration of sample lessons using a variety of techniques directed at
teaching to each student’s learning style, documentation of lesson plan
modifications made for special needs students, design of a unit to be used
across the curriculum, and application of instructional methodology provided
during pre-service and ongoing training.
Recommendation of district, based on: overall rating of teacher’s
performance in the classroom, input from the candidate’s principal and
mentor teacher, satisfactory appraisal scores, any other criteria established by
the employing district/charter school, and ability to maintain an internship as
a teacher of record for one school year.
According to TOPP staff, completion of the requirements outlined does not
guarantee recommendation for certification. If the TOPP staff determines that the
candidate has not demonstrated the professional qualities outlined in the criteria above or
that the candidate has demonstrated attitudes or behaviors that detract from the learning
environment of a classroom or campus, recommendation for certification will be
withheld (Texas Region 20 Education Service Center, 2003). An extension of an
internship may be granted for a period not to exceed one year. The candidate may use
the additional year to complete the requirements necessary to complete the program.
In summary, information provided in this chapter included the literature pertinent
to the study of the impact of alternative certification programs on teacher retention. In

44
the review of the literature, information relevant to the use of alternative certification
programs within the context of the federal No Child Left Behind Act as well as state
responsibilities and requirements was examined. It is clear that there is, and will
continue to be, a need for certified and highly qualified teachers. This need is due to a
variety of factors, but most notably retiring teachers, projected enrollment increases,
teacher attrition, and new classroom policies (Howard, 2003; Ingersoll, 2003b;
Lucksinger, 2000). As a result, it is crucial to appropriately evaluate the impact of
current alternative certification programs in combating this public education crisis. This
study was undertaken to complement the existing body of knowledge related to this
crisis so as to offer potential solutions to this problem.

45
CHAPTER III
METHODOLOGY
The major purpose of this study was to determine the impact of an alternative
certification program on the retention of teachers in Region 20, Texas, as reported by
Education Service Center, Region 20, Texas. The alternative certification program from
which data were reviewed was the Teacher Orientation and Preparation Program
(TOPP). Demographic variables from TOPP completers were analyzed to determine
their association with retention rates. Additionally, survey interviews were conducted to
provide additional information related to retention rates of TOPP completers.
A proposal for the research study was submitted to and approved by the students’
graduate committee and the Institutional Review Board (IRB) at Texas A&M
University. Permission to conduct this study was granted by the Executive Director of
Education Service Center, Region 20, in March of 2004.
The study focused on two specific research questions:
1. Do selected demographic variables predict the retention of teachers in Region
20, Texas, who are certified through the TOPP as reported by personnel in
Education Service Center, Region 20, Texas?
2. What variables influence the retention of teachers who are certified through
the TOPP as reported by teachers who have completed the TOPP in Region
20, Texas?
This researcher used a combination of data sources to obtain information related
to the retention rates of TOPP educators. The data sources included Education Service
46
Center, Region 20 databanks, Public Education Information Management System
(PEIMS) data, and Texas Education Agency Academic Excellence Indicator System
(AEIS) databanks. Additionally, the researcher conducted survey interviews with ten
TOPP educators to obtain supplementary qualitative information related to retention
rates.
In this chapter, the researcher elaborated on procedures that were followed in
order to accomplish the purpose of the study. Sections contained in this chapter include:
population, instrumentation, procedures, data analysis, and survey interview.
Population
The population for this study included 537 teachers who completed the Teacher
Orientation and Preparation Program in Education Service Center, Region 20, from
1999-2004. The population consisted of five TOPP cohorts. The cohorts included TOPP
classes from 1999-2000, 2000-2001, 2001-2002, 2002-2003, and 2003-2004. Each
TOPP class represented the year that they were involved in the TOPP program,
including the internship. The internship year was considered year one of teaching
experience.
The researcher chose ten participants who mirrored the demographic variables
identified in the population to serve as the sub-sample. The sub-sample of ten was
identified through purposeful selection. The sub-sample included representation for each
of the selected demographic variables: ethnicity, gender, current campus placement, and
current socioeconomic level of campus. The researcher conducted a survey interview
with each member of the sub-sample. The researcher was able to schedule and interview

47
ten respondents from six different school districts. At the beginning of each interview,
the researcher reviewed the purpose of the study while explaining the Informed Consent
Document (Appendix A) and obtaining the signature of the respondent. The signature
indicated both an understanding of the researcher’s intent as well as consent to proceed
with the interview. Both the researcher and the respondent retained a copy of the
Informed Consent Document.
Instrumentation
The names and social security numbers of all TOPP completers identified as
having completed the program within the dates identified were provided to the
researcher by Education Service Center, Region 20. This data were provided in a variety
of electronic formats. The researcher transferred all files and data to Microsoft Office
Excel files.
The data in the Microsoft Office Excel files were then cross-referenced with the
PEIMS 090 Data File. The PEIMS 090 Data File was generated from data submitted to
the Education Service Center, Region 20, by all school districts and charter schools
within the region on an annual basis. The cross-reference was completed using a SPSS
statistical analysis software package. The data were matched on social security numbers.
The following data were obtained from the 090 Data File: first name, last name, year,
district number, campus number, and role ID. In order to determine retention, the 1999-
2000 TOPP cohort data were matched with the 2001-2002 090 Data File. This served to
identify all cohort year 1999-2000 TOPP completers who were retained three years in

48
Region 20 in the role of a teacher as well as completers who were not retained three
years in Region 20 in the role of a teacher.
The same process was repeated using the 2000-2001 TOPP cohort data and the
2002-2003 090 Data File and again with the 2001-2002 TOPP cohort data and the 2003-
2004 090 Data File. The same match was then used to obtain first name, last name, year,
district number, campus number, and role ID for the intern years of 1999-2000, 2000-
2001, and 2001-2002.
This researcher then used the PEIMS 040 Staff Data File to obtain demographic
information related to gender and ethnicity. The social security numbers were matched
using the existing data and the 040 Staff Data File. This information was captured in the
SPSS statistical analysis software package.
In order to obtain information related to the socioeconomic level of the campus,
the grade span, and the grade type, the researcher accessed the Texas Education Agency
website and searched the Academic Excellence Indicator System (AEIS) reports. The
campus number obtained from the 090 Data File was used to retrieve this data.
Campuses identified as “low socioeconomic” are those with a rate of 50% or more of
their students being identified as such. “Grade span” refers to the grades served by the
campus. “Grade type” refers to type of grades the campus serves. Grade type includes
elementary, middle school, high school, and both (those that serve a combination of
elementary, middle and secondary grades).
For each of the 537 TOPP completers in the population, a campus number,
district number, and role ID were determined and reported for their first year of

49
employment, or intern year, as well as their third year of employment. For the purpose of
this study, the third year data were utilized to describe retention information related to
grade type. In other words, the campus on which participants were employed on year
three of employment was used to describe the grade type in which the completer was
currently assigned. Conversely, first year data were used to describe retention
information related to the socioeconomic level of the campus. The researcher wanted to
determine if the socioeconomic level of the campus during the first year of experience
impacted retention.
The last step in compiling the data for the population involved the removal of
social security numbers. Social security numbers were replaced with identification
numbers 1 through 537 to protect the identity of the participants.
The end data set included the following information:
First name
Last name
District number (year 1 and year 3)–Unique state assigned district
identification number.
Campus number (year 1 and year 3)–Unique state assigned campus
identification number.
Gender–Male or female.
Ethnicity–African American (3), Asian/Pacific Islander (2), Hispanic (4),
Native American (1), White (5)

50
Role ID (year 1 and year 3)–The capacity in which a person serves. All
participants with role ID 025, 029, and 054 have teaching responsibilities.
Campus name (year 1 and year 3)
Grade span (year 1 and year 3)–Grades served by the campus.
Grade type (year 1 and year 3)–The type of grades the campus serves. Grade
types include elementary, middle school, secondary school, and both (those
that serve a combination of elementary, middle and secondary schools).
Socioeconomic level–Low socioeconomic level is 50% or greater
economically disadvantaged students as determined by qualification for free
and reduced school lunch program. Yes (1) or no (2).
Retained–Yes (1) or no (0).
Identification number–Unique number 1 through 537 assigned to each
subject in the population.
A researcher-developed survey interview was used to collect additional data
related to the attitudes of TOPP completers in regards to their retention in the field. The
survey interview followed the suggested sequence for instrument development by Gall,
Borg, and Gall (1996) and Patton (1990). The researcher followed the suggested steps
for preparing and conducting research interviews as identified in Educational Research:
An Introduction (Gall et al., 1996). The development of the interview process was based
on these factors:
1. Defining the purpose of the interview;
2. Selecting a sample;

51
3. Designing the interview format;
4. Developing questions;
5. Conducting the interview;
6. Analyzing the interview data.
The purpose of the interviews was to supplement and inform the data that the
researcher had been collected through the quantitative method. The researcher sought to
gain more qualitative information from conducting interviews with individuals.
The purposeful sample of respondents is discussed in detail in the Population
section of this chapter. All respondents participated voluntarily and were located by
cross-referencing the Education Service Center, Region 20, Teacher Orientation and
Preparation Program databanks and the Public Education Information and Management
System databanks and the Academic Excellence Indicator System databanks. The
researcher interviewed one respondent at a time.
A semi-structured interview technique was used. The researcher developed a list
of core questions to initiate the conversations with the respondents (Appendix B). An
interview guide, such as predetermined questions, helps the researcher with the
necessary continuity between interviews.
The interviews were conducted using the researcher as a human instrument. The
interview format was conversation with a purpose. As the researcher conducted the
research, he used the following qualitative techniques: (a) participant observation, (b)
structured interviewing, (c) unstructured interviewing, and (d) non-verbal
communication. As suggested by Lincoln and Guba (1985) in Naturalistic Inquiry, the

52
researcher used cues and probes to keep the respondent talking to further develop the
essential themes. All interview data were recorded with an audio tape recorder.
Permission to record was obtained through the Informed Consent Document (Appendix
A).
The analysis of the interview data are discussed briefly in the Data Analysis
section of this chapter and in more depth and detail in Chapter IV.
Procedures
The procedure used consisted first of contacting the Executive Director of
Education Service Center, Region 20, to secure his permission to perform the study in
the region. A letter was drafted, submitted, and approved by the Internal Review Board
at Texas A&M and submitted and signed by the Executive Director (Appendix C). The
letter assured subject confidentiality, as well as a detailed explanation of the researcher’s
intent. Additionally, an open records request was submitted to the Executive Director
(Appendix D). Permission to proceed with the study was granted by the Executive
Director on March 10, 2004. Following the request, the researcher was provided with the
data needed for the study. All data were secured by November 1, 2004.
The data provided by Education Service Center, Region 20 included the names
and social security numbers of all TOPP candidates identified as having completed the
program from 1999 through 2004. Education Service Center, Region 20 staff also
provided the PEIMS 040 and 090 records for all districts and charter schools in Region
20 for the following school years: 1999-2000, 2000-2001, 2001-2002, 2002-2003, 2003-
2004.

53
Next, the researcher, through a telephone call, contacted the participants in the
sub-sample. Individual survey interviews with each of the TOPP completers identified in
the sub-sample were arranged and conducted. Interview participants received a letter
assuring subject confidentiality, as well as a detailed explanation of the intent of the
research. Consent to participate in the study was assumed by the willingness to
participate in the survey interview as well as the participant’s signature on the Informed
Consent Document (Appendix A).
Data Analysis
Results from this study were analyzed using numerical and graphical techniques.
Data analysis and interpretation followed the principles identified by George and
Mallery (2002). The data were analyzed using a personal computer and the software
package SPSS Version 11.0, specifically the sub-routine logistic regression. A number
of analyses were conducted. The analyses included Logistic Regression: Case Processing
Summary, Dependent Variable Encoding, Categorical Variables Codings; Block 0
Beginning Block: Classification Table (a,b), Variables in the Equation, Variables not in
the Equation; and Block 1 Method=Enter: Omnibus Tests of Model Coefficients, Model
Summary, Classification Table (a), and Variables in the Equation.
The survey interview data were analyzed through the use of appropriate
techniques as identified by Gall et al. (1996), Mertler and Vannatta (2002), and Patton
(1990). The audio recordings and researcher notes were examined and reviewed by the
process of unitizing. After being reviewed, major topics were identified and delimited
into single pieces of stand-alone data. These data were captured in researcher notes. All

54
notes and audiotapes were labeled so they could be tracked back to the original interview
and correct respondent (Appendix E).
The researcher then sorted the notes by emerging themes. The themes were then
used to draw inferences related to research question number two. Details of the data
analysis for the two research questions in this research study are presented in the
following chapter.

55
CHAPTER IV
RESULTS OF THE STUDY
The purpose of this study was to determine the impact of an alternative
certification program on the retention of teachers in Region 20, Texas, as reported by
Education Service Center, Region 20, Texas. It sought to identify demographic variables
associated with retention rates. Specifically, the demographic variables the researcher
examined included ethnicity, gender, current grade type (elementary–PK-5, middle
school–6-8, and high school–9-12), and current socioeconomic level (as determined
by percent of children who qualify for free and reduced lunch programs) of campus.
Additionally, the researcher sought to provide qualitative data and information that could
assist in explaining the retention rates of TOPP participants. Those data were retrieved
through one-on-one survey interviews.
The findings of the study are reported in this chapter. In Chapter IV, the
researcher provides analysis of the data resulting from the statistical procedure logistic
regression as well as an analysis of the data obtained through survey interviews. The
researcher begins the chapter with a review of the demographic data of the population
through an analysis of the data and crosstabulation of the data. Next, research question
number one is addressed with the corresponding data. The procedures for analyzing the
data and a summary of the findings are included. In the next section of Chapter IV, the
researcher reviews the demographic data of the sub-sample used in the survey interview
portion of the study. Finally, research question number two is addressed through an
analysis of the individual survey interview responses.

56
The results presented in this chapter address two research questions:
1. Do selected demographic variables predict the retention of teachers in Region
20, Texas, who are certified through the TOPP as reported by personnel in
Education Service Center, Region 20, Texas?
2. What variables influence the retention of teachers who are certified through
the TOPP as reported by teachers who have completed the TOPP in Region
20, Texas?
Demographic Data
A total of 537 Teacher Orientation and Preparation Program participants who
completed the program between the years of 1999 and 2004 were identified as the
population for this study. This included five TOPP cohorts: 1999-2000, 2000-2001,
2001-2002, 2002-2003, and 2003-2004. The 537 participants represent the total number
of TOPP candidates who met all requirements, completed the TOPP certification
program, and obtained Texas certification enabling them the ability to teach in Texas
public schools.
The independent variables were analyzed using data related to the socioeconomic
status of the campus on which the teacher was teaching in year one and the grade type
the teacher was teaching in year one. The gender and ethnicity were the same for years
one and three. For the purpose of this portion of the analysis, the researcher conducted a
thorough analysis of all data sets in year one and year three.
Of the 537 participants in the population, 526 were included in the analysis. This
was due to the fact that in year one, 11 of the 537 participants could not be classified as

57
teaching in one of the grade types identified by the researcher–elementary, middle, and
secondary. The 11 participants who could not be classified appeared as grade type
“both” or those campuses that are made up of a combination of elementary, middle, and
secondary. As a result, the 11 participants were not included in the analysis.
In year three, there were four additional participants who appeared as grade type
“both.” These four teachers moved to a campus type “both” some time in their three
years of tenure. The researcher included the four in several of the data analyses.
However, for the purpose of this study, they were not considered “retained” due to the
factthat they did not fall within the operational definition used to define “grade type.”
Table 4.1 represents the frequencies and the percentages related to grade type of
the 537 participants in year one.
Table 4.1. Frequencies and Percentages of Grade Types of Population (Year 1)
Grade Type Number Percent
Elementary 258 48.0
Middle 137 25.5
Secondary 131 24.4
Both 11 2.1
Total 537 100.0

58
The majority of the population, 258, fell in the elementary grade type, which
accounted for 48% of the population. There were 137, or 25.5% in the middle school
grade type, followed by 131, or 24.4% in the secondary school grade type. There were
11, or 2.1% in the both grade type.
Table 4.2 depicts the frequencies and the percentages related to grade type of the
420 of the 537 participants who were retained and still teaching in year three.
Table 4.2. Frequencies and Percentages of Grade Types of Population (Year 3)
Grade Type Number Percent
Elementary 209 49.8
Middle 108 25.7
Secondary 99 23.5
Both 4 1.0
Total 420 100.0
In year three, the majority of the population, 209, fell in the elementary grade
type, which accounted for 49.8% of the population. There were 108, or 25.7% in the
middle school grade type, followed by 99, or 23.5% in the secondary school grade type.
There were 4, or 1% in the both grade type.
The researcher also coded the data by the socioeconomic level of the campus. If
the campus contained 50% or more students who qualified for the free and reduced

59
lunch program, the campus was considered a high poverty, low socioeconomic campus.
If the campus contained less than the 50% student population that qualified for the free
and reduced lunch program, the campus was not considered a low poverty campus.
Table 4.3 illustrates the frequency and percentage of the 526 participants who
taught on campuses that fell into the high and low socioeconomic categories in year one.
Table 4.3. Frequencies and Percentages of Socioeconomic Level of Campus (Year 1)
Socioeconomic Level Number Percent
High SocioeconomicLow Poverty 134 25.5
Low SocioeconomicHigh Poverty 392 74.5
Total 526 100.0
The results reflect nearly 50% higher participation rate in low socioeconomic,
high poverty campuses as opposed to high socioeconomic, low poverty. The data show
that 392, or 74.5%, of the participants secured teaching positions in low socioeconomic,
high poverty schools. Conversely, 134, or 25.5% of the participants secured teaching
positions in high socioeconomic, low poverty schools.
Table 4.4 reflects the frequency and percentage of the 526 participants who
taught on campuses that fall into the high and low socioeconomic categories in year
three.

60
Table 4.4. Frequencies and Percentages of Socioeconomic Level of Campus (Year 3)
Socioeconomic Level Number Percent
High SocioeconomicLow Poverty 99 23.6
Low SocioeconomicHigh Poverty 321 76.4
Total 420 100.0
Table 4.5 portrays the frequency and percentage regarding the gender of the 526
participants included in the analysis. A great majority, 71.9%, or 378 of the participants
in the study, were females. The total number of males was 148, or 28.1% of the
population.
Table 4.5. Frequencies and Percentages of Demographic Information Regarding Gender
Gender Number Percent
Female 378 71.9
Male 148 28.1
Total 526 100.0
The data were analyzed in regard to the ethnicity of the respondents. Table 4.6
refers to the frequencies and percentages of ethnicity data. The categories include Native
American, Asian/Pacific Islander, African American, Hispanic, and White.

61
Table 4.6. Frequencies and Percentages of Demographic Information RegardingEthnicity
Ethnicity Number Percent
Native American 1 .1
Asian/Pacific Islander 6 1.1
African American 43 8.3
Hispanic 197 37.5
White 279 53.0
Total 526 100.0
The participants who were classified as Native American ethnicity category were
1, or .1%. Asian/Pacific Islander ethnicity accounted for 1.1% or 6 of the participants
while African American ethnicity accounted for 8.3% or 43 of the total 526. White and
Hispanic ethnicities accounted for over 90% of the population. Hispanic ethnicity totaled
197 or 37.5%, while White ethnicity accounted for 279, or 53% of the total.
The dependent variable for this study reflects data associated with whether or not
the participant was retained in the role of teacher in year three. Table 4.7 reflects the
frequencies and percentages of retention data. Of the total 526 participants in the
population, 416, or 79.1%, were retained in the field of education in the role of a teacher
for three years. Conversely, 110, or 20.9%, were not retained in the field of education in
the role of a teacher for three years.
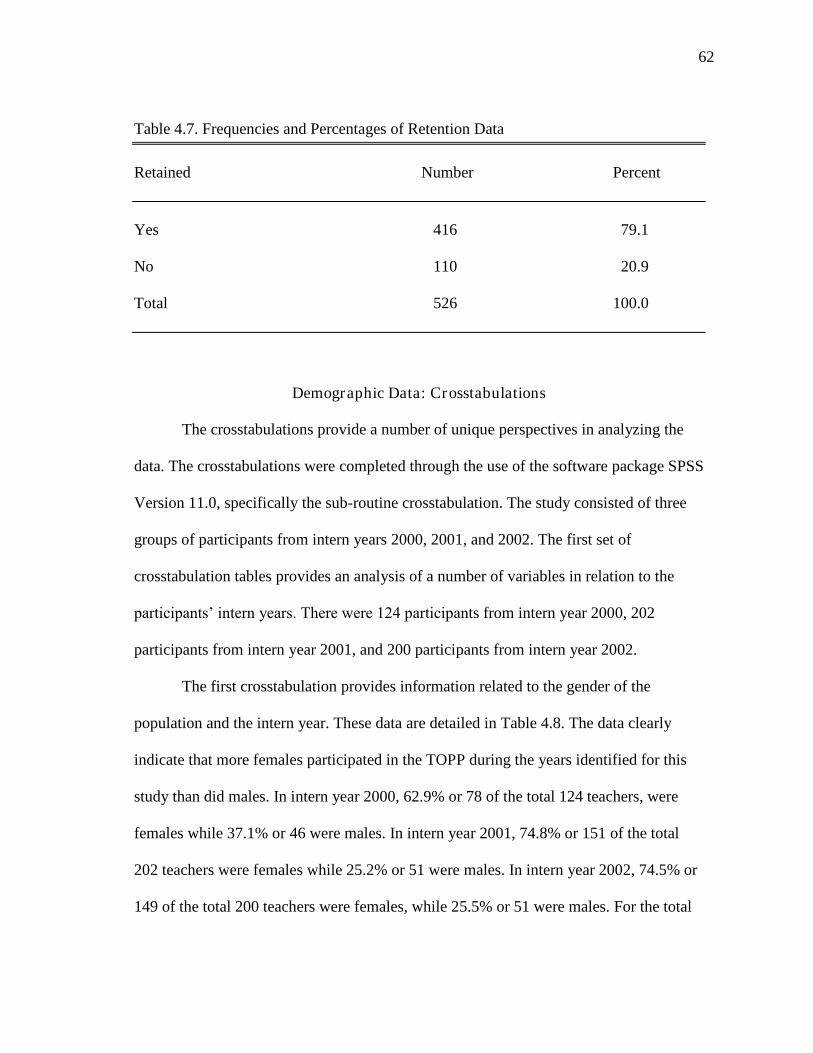
62
Table 4.7. Frequencies and Percentages of Retention Data
Retained Number Percent
Yes 416 79.1
No 110 20.9
Total 526 100.0
Demographic Data: Crosstabulations
The crosstabulations provide a number of unique perspectives in analyzing the
data. The crosstabulations were completed through the use of the software package SPSS
Version 11.0, specifically the sub-routine crosstabulation. The study consisted of three
groups of participants from intern years 2000, 2001, and 2002. The first set of
crosstabulation tables provides an analysis of a number of variables in relation to the
participants’ intern years. There were 124 participants from intern year 2000, 202
participants from intern year 2001, and 200 participants from intern year 2002.
The first crosstabulation provides information related to the gender of the
population and the intern year. These data are detailed in Table 4.8. The data clearly
indicate that more females participated in the TOPP during the years identified for this
study than did males. In intern year 2000, 62.9% or 78 of the total 124 teachers, were
females while 37.1% or 46 were males. In intern year 2001, 74.8% or 151 of the total
202 teachers were females while 25.2% or 51 were males. In intern year 2002, 74.5% or
149 of the total 200 teachers were females, while 25.5% or 51 were males. For the total

63
population, 71.9% or 378 of the participants were females, while 28.1% or 148 were
males.
Table 4.8. Frequencies and Percentages of Participants by Intern Year and Gender
Female MaleIntern Year N % N % Total
2000 78 62.9 46 37.1 124
2001 151 74.8 51 25.2 202
2002 149 74.5 51 25.5 200
Total 378 71.9 148 28.1 526
The next crosstabulation provides an examination of the ethnicity of the
participants in each intern year. These data are depicted in Table 4.9.
Table 4.9. Frequencies and Percentages of Participants by Intern Year and Ethnicity
EthnicityIntern Native. Asian, Pacific AfricanYear American Islander American Hispanic White Total
N % N % N % N % N %
2000 0 0.0 4 3.2 16 12.9 41 33.1 63 50.8 124
2001 0 0.0 2 1.0 15 7.4 79 39.1 106 52.5 202
2002 1 .5 0 0.0 12 6.0 77 38.5 110 55.0 200
Total 1 .1 6 1.1 43 8.3 197 37.5 279 53.0 526

64
For intern year 2000, individuals of Native American ethnicity accounted for 0%
of the population, while Asian/Pacific Islander ethnicity accounted for 3.2% or 4 of the
total 124 participants. African American ethnicity reflected 12.9% or 16 of the
participants, Hispanic ethnicity reflected 33.1% or 41 of the participants, and White
ethnicity accounted for 50.8% or 63 of the participants in intern year 2000.
For intern year 2001, individuals of Native American ethnicity accounted for 0%
of the population while Asian/Pacific Islander ethnicity accounted for 1% or 2 of the
total 202 participants. African American ethnicity reflected 7.4% or 15 of the
participants, Hispanic ethnicity reflected 39.1% or 79 of the participants, and White
ethnicity accounted for 52.5% or 106 of the participants in intern year 2001.
For intern year 2002, individuals of Native American ethnicity accounted for .5%
or 1 of the population while Asian/Pacific Islander ethnicity accounted for 0% of the
total 200 participants. African American ethnicity reflected 6% or 12 of the participants,
Hispanic ethnicity reflected 38.5% or 77 of the participants, and White ethnicity
accounted for 55% or 110 of the participants in intern year 2002.
Table 4.10 provides a crosstabulation related to the socioeconomic status of the
campus in year one and the intern year of the participant.
These data indicate that the majority of the TOPP interns were hired on campuses
that serve students from low socioeconomic, high poverty areas. In intern year 2000,
65.3% or 81 of the 124 participants secured teaching positions at low socioeconomic,
high poverty campuses, while 34.7% or 43 participants’ secured positions at high
socioeconomic, low poverty campuses. In intern year 2001, 76.2% or 154 of the 202

65
participants secured teaching positions at low socioeconomic, high poverty campuses,
while 23.8% or 48 participants secured positions at high socioeconomic, low poverty
campuses. In intern year 2002, 78.5% or 157 of the 200 participants secured teaching
positions at low socioeconomic, high poverty campuses, while 21.5% or 43 participants’
secured positions at high socioeconomic, low poverty campuses.
Table 4.10. Frequencies and Percentages of Participants by Intern Year andSocioeconomic Status of Campus (Year 1)
Intern Year Low Poverty High Poverty TotalN % N %
2000 43 34.7 81 65.3 124
2001 48 23.8 154 76.2 202
2002 43 21.5 157 78.5 200
Total 134 25.5 392 74.5 526
Table 4.11 provides a crosstabulation related to the grade type in which each
participant secured a teaching position in year one and the intern year. Grade types
included elementary (prekindergarten-grade 5), middle school (grade 6-grade 8), and
high school (grade 9-grade 12).
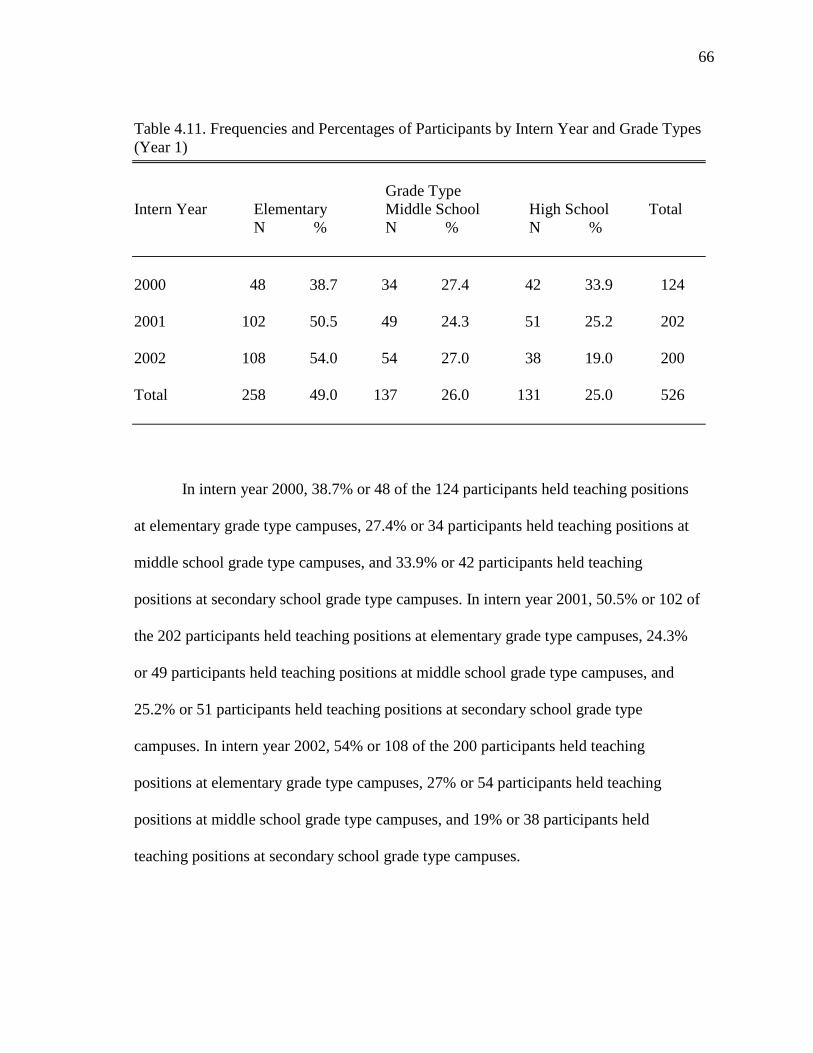
66
Table 4.11. Frequencies and Percentages of Participants by Intern Year and Grade Types(Year 1)
Grade TypeIntern Year Elementary Middle School High School Total
N % N % N %
2000 48 38.7 34 27.4 42 33.9 124
2001 102 50.5 49 24.3 51 25.2 202
2002 108 54.0 54 27.0 38 19.0 200
Total 258 49.0 137 26.0 131 25.0 526
In intern year 2000, 38.7% or 48 of the 124 participants held teaching positions
at elementary grade type campuses, 27.4% or 34 participants held teaching positions at
middle school grade type campuses, and 33.9% or 42 participants held teaching
positions at secondary school grade type campuses. In intern year 2001, 50.5% or 102 of
the 202 participants held teaching positions at elementary grade type campuses, 24.3%
or 49 participants held teaching positions at middle school grade type campuses, and
25.2% or 51 participants held teaching positions at secondary school grade type
campuses. In intern year 2002, 54% or 108 of the 200 participants held teaching
positions at elementary grade type campuses, 27% or 54 participants held teaching
positions at middle school grade type campuses, and 19% or 38 participants held
teaching positions at secondary school grade type campuses.
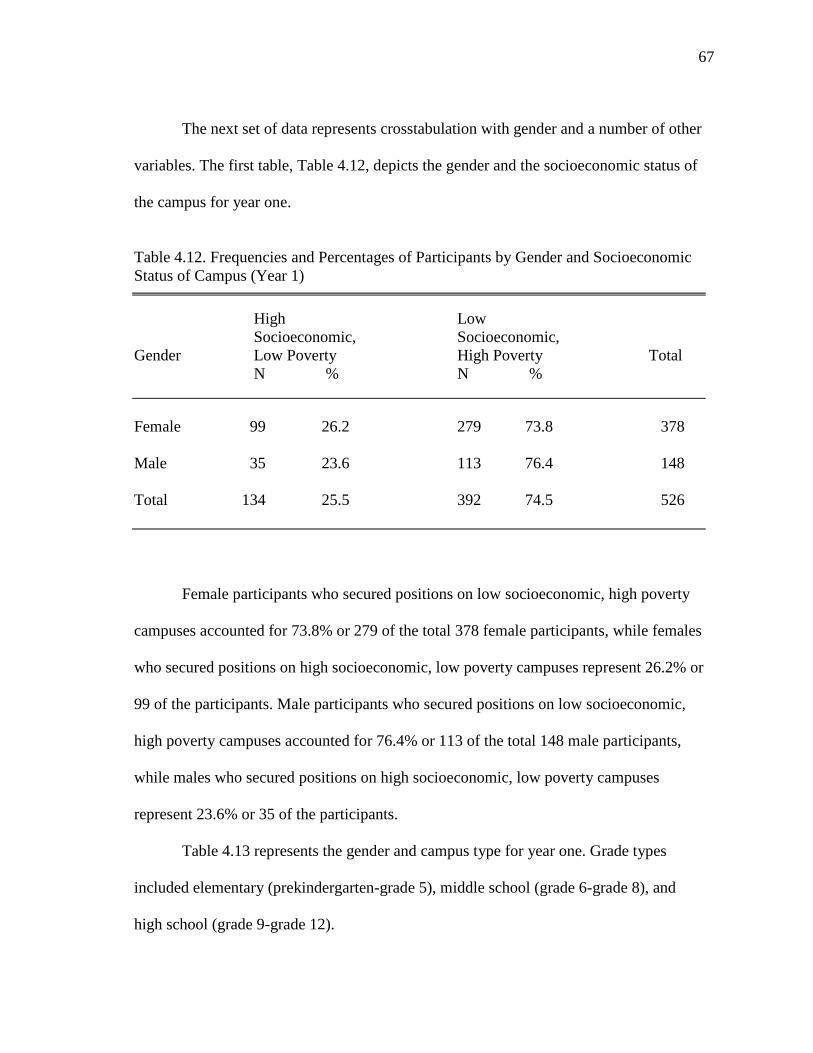
67
The next set of data represents crosstabulation with gender and a number of other
variables. The first table, Table 4.12, depicts the gender and the socioeconomic status of
the campus for year one.
Table 4.12. Frequencies and Percentages of Participants by Gender and SocioeconomicStatus of Campus (Year 1)
High LowSocioeconomic, Socioeconomic,
Gender Low Poverty High Poverty TotalN % N %
Female 99 26.2 279 73.8 378
Male 35 23.6 113 76.4 148
Total 134 25.5 392 74.5 526
Female participants who secured positions on low socioeconomic, high poverty
campuses accounted for 73.8% or 279 of the total 378 female participants, while females
who secured positions on high socioeconomic, low poverty campuses represent 26.2% or
99 of the participants. Male participants who secured positions on low socioeconomic,
high poverty campuses accounted for 76.4% or 113 of the total 148 male participants,
while males who secured positions on high socioeconomic, low poverty campuses
represent 23.6% or 35 of the participants.
Table 4.13 represents the gender and campus type for year one. Grade types
included elementary (prekindergarten-grade 5), middle school (grade 6-grade 8), and
high school (grade 9-grade 12).

68
Table 4.13. Frequencies and Percentages of Participants by Gender and Grade Type(Year 1)
Grade TypeGender Elementary Middle School High School Total
N % N % N %
Female 217 57.4 83 22.0 78 20.6 378
Male 41 27.7 54 36.5 53 35.8 148
Total 258 49.0 137 26.0 131 25.0 526
Female participants who secured positions on elementary grade type campuses
accounted for 57.4% or 217 of the total 378 female participants in year one. Female
participants who secured positions on middle school grade type campuses accounted for
22% or 83 of the participants and females who secured position on high school grade
type campuses represented 20.6% or 78 of the total 378 female participants in year one.
Male participants who secured positions on elementary grade type campuses accounted
for 27.7% or 41 of the total 148 male participants in year one. Male participants who
secured positions on middle school grade type campuses accounted for 36.5% or 54 of
the participants and males who secured position on high school grade type campuses
represented 35.8% or 53 of the total 148 male participants in year one.
Table 4.14 represents the gender and campus type for year three. Four
participants who fit into the “both” category were included. These four participants were
classified as elementary, middle school, or high school in year one and later moved to a

69
campus that served a mixture of grades, and therefore, no longer fit into one of the
established categories of elementary, middle school, or high school.
Table 4.14. Frequencies and Percentages of Participants by Gender and Grade Type(Year 3)
Grade TypeGender Elementary Middle School High School Both Total
N % N % N % N %
Female 176 59.4 68 23.0 50 16.9 2 .7 296
Male 33 26.6 40 32.3 49 39.5 2 1.6 124
Total 209 49.7 108 25.7 99 23.6 4 1.0 420
Female participants who secured positions on elementary grade type campuses
accounted for 59.4% or 176 of the total 296 female participants in year three. Female
participants who secured positions on middle school grade type campuses accounted for
23% or 68 of the participants and females who secured positions on high school grade
type campuses represented 16.9% or 50 of the total 296 female participants in year three.
There were .7% or 2 female participants who moved to a “both” grade type in year three.
Male participants who secured positions on elementary grade type campuses accounted
for 26.6% or 33 of the total 124 male participants in year three. Male participants who
secured positions on middle school grade type campuses accounted for 32.3% or 40 of
the participants, and males who secured position on high school grade type campuses
represented 39.5% or 49 of the total 124 male participants in year three. There were
1.6% or 2 male participants who moved to a “both” grade type in year three.

70
The next set of data provides crosstabulations that examine the population with
the common variable of ethnicity. Table 4.15 depicts the ethnicity and the
socioeconomic status of the campus in year one.
Table 4.15. Frequencies and Percentages of Participants by Ethnicity and SocioeconomicLevel of Campus (Year 1)
High LowSocioeconomic, Socioeconomic,
Ethnicity Low Poverty High Poverty TotalN % N %
NativeAmerican 1 100.0 0 0.0 1
Asian, PacificIslander 2 33.3 4 66.7 6
AfricanAmerican 10 23.3 33 76.7 43
Hispanic 21 10.7 176 89.3 197
White 100 35.8 179 64.2 279
Total 134 25.5 392 74.5 526
In year one, 100% or 1 of 1 of the Native American ethnicity secured a teaching
position on a high socioeconomic, low poverty campus. Asian/Pacific Islander ethnicity
had 33.3% or 2 participants on a high socioeconomic, low poverty campus, and 66.7%
or 4 of the total 6 Asian/Pacific Islander ethnicity participants on a low socioeconomic,
high poverty campus. African American ethnicity had 23.3% or 10 participants on a high
socioeconomic, low poverty campus, and 76.7% or 33 of the total 43 African American

71
ethnicity participants on a low socioeconomic, high poverty campus. Hispanic ethnicity
had 10.7% or 21 participants on a high socioeconomic, low poverty campus and 89.3%
or 176 of the total 197 Hispanic ethnicity participants on a low socioeconomic, high
poverty campus. White ethnicity had 35.8% or 100 participants on a high
socioeconomic, low poverty campus and 64.2% or 179 of the total 279 White ethnicity
participants on a low socioeconomic, high poverty campus.
Table 4.16 provides a representation of the ethnicity and campus type for year
one. Grade types included elementary (prekindergarten-grade 5), middle school (grade
6-grade 8), and high school (grade 9-grade 12).
Table 4.16. Frequencies and Percentages of Participants by Ethnicity and Grade Type(Year 1)
Grade TypeEthnicity Elementary Middle School High School Total
N % N % N %
NativeAmerican 1 100.0 0 0.0 0 0.0 1
Asian, PacificIslander 1 17.7 2 33.3 3 50.0 6
AfricanAmerican 17 39.5 10 23.3 16 37.2 43
Hispanic 104 52.8 50 25.4 43 21.8 197
White 135 48.4 75 26.9 69 24.7 279
Total 258 49.0 137 26.0 131 25 526

72
In year one, 100% or 1 of 1 of the Native American ethnicity secured a teaching
position at elementary grade type. Asian/Pacific Islander ethnicity had 17.7% or 1
participant at the elementary grade type, 33.3% or 2 at the middle school grade type, and
50% or 3 of the total 6 Asian/Pacific Islander ethnicity participants were represented at
the high school grade type. African American ethnicity had 39.5% or 17 participants at
the elementary grade type, 23.3% or 10 at the middle school grade type, and 37.2% or 16
of the total 43 African American ethnicity participants were represented at the high
school grade type. Hispanic ethnicity had 52.8% or 104 participants at the elementary
grade type, 25.4% or 50 at the middle school grade type, and 21.8% or 43 of the total
197 Hispanic ethnicity participants were represented at the high school grade type.
White ethnicity had 48.4% or 135 participants at the elementary grade type, 26.9% or 75
at the middle school grade type, and 24.7% or 69 of the total 279 White ethnicity
participants were represented at the high school grade type.
Table 4.17 provides a rendering of the ethnicity and campus type for year three.
Grade types included elementary (prekindergarten-grade 5), middle school (grade 6-
grade 8), and high school (grade 9-grade 12). Table 4.17 includes four participants who
fit into the “both” category. These four participants were classified as elementary,
middle school, or high school in year one and later moved to a campus that served a
mixture of grades and, therefore, no longer fit into one of the established categories of
elementary, middle school, or high school.

73
Table 4.17. Frequencies and Percentages of Participants by Ethnicity and Grade Type(Year 3)
Grade TypeEthnicity Elementary Middle School High School Both Total
N % N % N % N %
NativeAmerican 0 0.0 0 0.0 0 0.0 0 0.0 0
Asian, PacificIslander 1 33.0 2 67.0 0 0.0 0 0.0 3
AfricanAmerican 13 37.1 10 28.6 12 34.3 0 0.0 35
Hispanic 86 51.2 40 23.8 40 23.8 2 1.2 168
White 109 50.9 56 26.2 47 22.0 2 .9 214
Total 209 49.8 108 25.7 99 23.6 4 .9 420
In year three, 0% the Native American ethnicity secured a teaching position at
any of the established grade types. Asian/Pacific Islander ethnicity had 33% or 1
participant at the elementary grade type, 67% or 2 at the middle school grade type, and 0
of the total 3 Asian/Pacific Islander ethnicity participants were represented at the high
school grade type. African American ethnicity had 37.1% or 13 participants at the
elementary grade type, 28.6% or 10 at the middle school grade type, and 34.3% or 12 of
the total 35 African American ethnicity participants were represented at the high school
grade type. Hispanic ethnicity had 51.2% or 86 participants at the elementary grade type,
23.8% or 40 at the middle school grade type, 23.8% or 40 at the high school grade type,
and 1.2% or 2 of the total 168 Hispanic ethnicity participants were represented at the

74
“both” grade type. White ethnicity had 50.9% or 109 participants at the elementary grade
type, 26.2% or 56 at the middle school grade type, 22% or 47 at the high school grade
type, and .9% or 2 of the total 214 White ethnicity participants were represented at the
“both” grade type.
The next set of crosstabulations examines the dependent variable of teacher
retention. For the purpose of this study, retention was defined as an intern who is teacher
of record in the fall of year 1 and is still employed as teacher of record in the fall of year
3.
Table 4.18 represents data related to teacher retention and gender. Male
participants were retained at a higher rate than were female participants. The data show
that 83.8% or 124 of the 148 male participants were retained, while 16.2% or 24 males
were not retained. The data show that 77.2% or 292 of the 378 female participants were
retained, while 22.8% or 86 females were not retained.
Table 4.18. Frequencies and Percentages of Participants by Teacher Retention andGender
RetainedGender No Yes
N % N % Total
Female 86 22.8 292 77.2 378
Male 24 16.2 124 83.8 148
Total 110 20.9 416 79.1 526

75
Table 4.19 depicts data related to teacher retention and ethnicity. Hispanic
participants were retained at a higher rate than were other participants. The researcher
found that 0% Native American ethnicity participants were retained. Asian/Pacific
Islander ethnicity had 66.7% or 4 participants out of a total of 6 retained and 33.3% or 2
participants not retained. African American ethnicity had 81.4% or 35 participants out of
a total of 43 retained and 18.6% or 8 participants not retained. Hispanic ethnicity had
84.3% or 166 participants out of a total of 197 retained and 15.7% or 31 participants not
retained. White ethnicity had 75.6% or 211 participants out of a total of 279 retained and
24.4% or 68 participants not retained.
Table 4.19. Frequencies and Percentages of Participants by Teacher Retention andEthnicity
RetainedEthnicity No Yes
N % N % Total
NativeAmerican 1 100.0 0 0.0 1
Asian, PacificIslander 2 33.3 4 66.7 6
AfricanAmerican 8 18.6 35 81.4 43
Hispanic 31 15.7 166 84.3 197
White 68 24.4 211 75.6 279
Total 110 20.9 416 79.1 526
76
Research Question One
The first research question reads, “Do selected demographic variables predict the
retention of teachers in Region 20, Texas, who are certified through the TOPP as
reported by personnel in Education Service Center, Region 20, Texas?”
In order to answer the first question, the researcher examined the data provided
through the collection of data related to the independent variables and the dependent
variable. The independent variables included the socioeconomic status and grade type of
the campuses on which participants were teaching, the gender of the participants, and the
ethnicity of the participants. The dependent variable was retention. Specifically, the
dependent variable determined whether or not the participants were retained as teachers
in Region 20, Texas.
The statistical procedure logistic regression was utilized. Logistic regression is an
extension of the statistical procedure multiple regression, utilized in situations where the
dependent variable is not a continuous or quantitative variable (George & Mallery,
2000). The value being derived through logistic regression is a probability ranging from
0 to 1 that specifies the likelihood of a particular outcome (Mertler & Vannatta, 2002).
Logistic regression produces a regression equation that predicts the probability of
whether an individual will fall into one category or the other. In the case of this study,
the researcher aimed to predict whether or not the independent variables could be used to
predict the retention of TOPP interns.
Table 4.20 depicts a model that the researcher used to evaluate the goodness-of-
fit test. This test compares the actual values for cases on the dependent variable with the

77
predicted values of the dependent variable. This test determines the joint predictive
ability of all the covariates in the model. A significance value of < .001 is needed for the
researcher to state that the model is significant (Mertler & Vannatta, 2002). In this case,
the significance level was found to be .191. As a result, the researcher concluded that the
model is not suited for retention prediction when using the dependent variables that were
utilized in this study.
Table 4.20. Omnibus Tests of Model Coefficients
Chi-Square df Sig.
Step 1 Step 6.114 4 .191
Block 6.114 4 .191
Model 6.114 4 .191
Table 4.21 provides information related to the overall model fit. The -2 Log
likelihood indicates that the model does not fit the data. A perfect fit has a value for this
measure equal to 0 (George & Mallery, 2000). The Cox & Snell R Square and the
Nagelkerke R Square indicate the proportion of variability in the dependent variable that
may be accounted for by all predictor variables included in the equation (Mertler &
Vannatta, 2002). The model summary clearly indicates that the model is not a good fit.

78
Table 4.21. Model Summary
-2 Log Cox & Snell NagelkerkeStep Likelihood R Square R Square
1 533.347a .012 .018
aEstimation terminated at iteration number 4 because parameter estimates changed by less than.001.
Table 4.22 provides information specifically related to the dependent variable,
teacher retention. The classification table compares the predicted values for the
dependent variable, based on the logistic regression model, with the actual observed
values from the data (Mertler & Vannatta, 2002). This indicates that the statistical
calculations associated with this data suggest that these dependent variables are not
suited for determining retention. The model predicts that all 526 participants will be
retained. In other words, there is no difference in the characteristics of those who were
retained versus those who were not retained.
Table 4.22. Classification Tablea
PredictedRetained 3 years in ESC-20 Percentage
Observed No Yes Correct
Step 1 Retained 3 years No 0 110 .0In ESC-20 Yes 0 416 100.0
Overall Percentage 79.1
aThe cut value is .500.

79
Table 4.23, the last table analyzed, is the table of Variables in the Equation. This
is the table of coefficients for variables included in the model. The values labeled B are
Beta values which are the standard regression coefficients, or the weights for each
variable used in the equation. The Wald statistic, along with the associated significance
value, is used to test the significance of each predictor, or independent variable. The
Exp(B) is an odds ratio that provides a method for interpreting the regression
coefficients (Mertler & Vannatta, 2002). An odds ratio of 1 equates to no association.
The greater this number, the greater the odds of association between variables.
The selected demographic variables analyzed in this study cannot be used to
predict the retention of teachers in Region 20, Texas, who are certified through the
TOPP in Education Service Center, Region 20, Texas. The significance values are all
greater than .05. The significance value for gender is .068. The significance value for
ethnicity is .367. The significance value for socioeconomic status is .797. The
significance value for grade type is .165. This data are presented in Table 4.23.
Table 4.23. Variables in the Equation
B S.E. Wald df Sig. Exp (B)
Step a 1 GENDER_N(1) -.482 .264 3.334 1 .068 .617
Ethnicity -.145 .161 .813 1 .367 .865
LowSES1(1) -.067 .260 .066 1 .797 .935
GRTYPE13 -.196 .141 1.929 1 .165 .822
Constant 2.700 .807 11.188 1 .001 14.873
aVariable(s) entered on step 1: GENDER_N, Ethnicty, LowSES1, GRYTPE13.

80
Demographic Data: Sub-Sample
The sub-sample for this study consisted of ten teachers who completed the TOPP
program and were classified as retained in the field of education. Purposeful selection
was utilized in order to obtain a sub-sample that was representative of the population.
The sub-sample consisted of: (a) 60.0% or 6 females and 40.0% or 4 males; (b) 30.0% or
3 Hispanic ethnicity participants and 70.0% or 7 White ethnicity participants; (c) 40.0%
or 4 of the participants worked in an elementary (prekindergarten-grade 5) setting,
40.0% or 4 worked in a middle school (grade 6-grade 8) setting, and 20.0% or 2 worked
in a high school (grade 9-grade 12) setting; and (d) 90.0% or 9 participants worked in a
high poverty, low socioeconomic school setting and 10.0% or 1 worked in a low
poverty, high socioeconomic school setting. This information is detailed in Table 4.24.
Table 4.24. Frequencies and Percentages of Participants in Sub-sample by Gender,Ethnicity, Grade Type, and Socioeconomic Status of Campus
Identification Low SES/Number Gender Ethnicity Grade Type High Poverty
138 F W E N
209 M W H Y
173 F W M Y
205 F H H Y
210 M H M Y
239 M H M Y
240 M W M Y
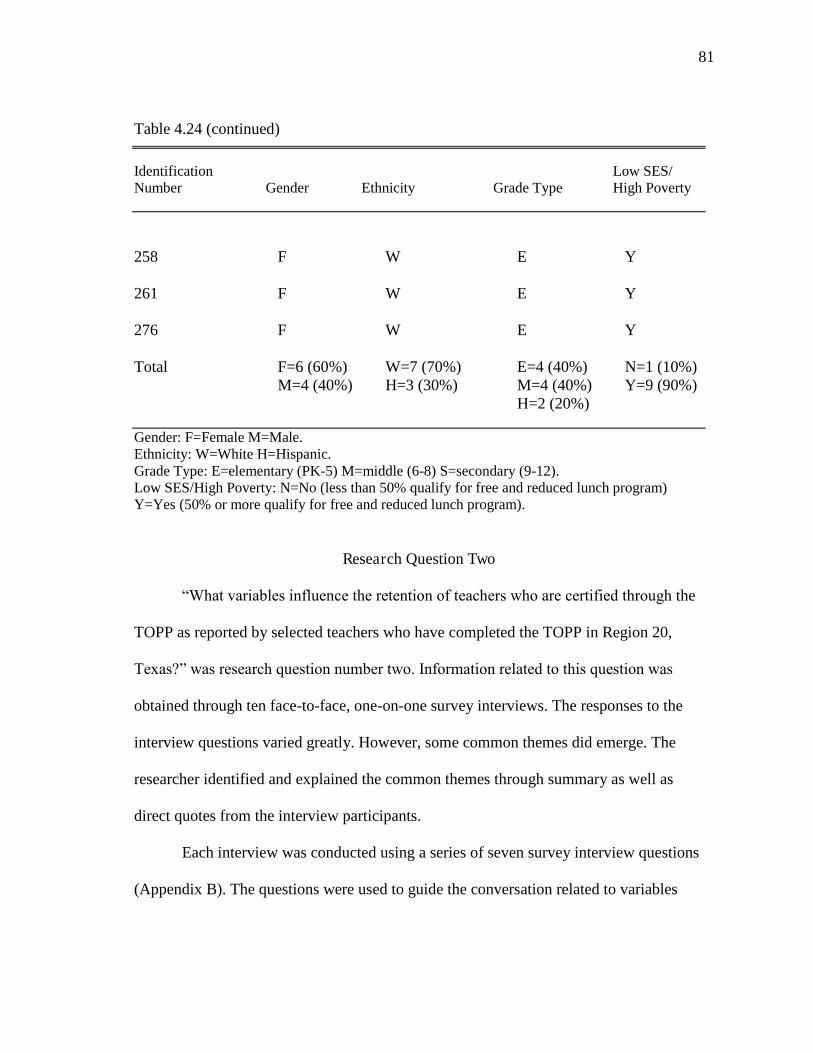
81
Table 4.24 (continued)
Identification Low SES/Number Gender Ethnicity Grade Type High Poverty
258 F W E Y
261 F W E Y
276 F W E Y
Total F=6 (60%) W=7 (70%) E=4 (40%) N=1 (10%)M=4 (40%) H=3 (30%) M=4 (40%) Y=9 (90%)
H=2 (20%)
Gender: F=Female M=Male.Ethnicity: W=White H=Hispanic.Grade Type: E=elementary (PK-5) M=middle (6-8) S=secondary (9-12).Low SES/High Poverty: N=No (less than 50% qualify for free and reduced lunch program)Y=Yes (50% or more qualify for free and reduced lunch program).
Research Question Two
“What variables influence the retention of teachers who are certified throughthe
TOPP as reported by selected teachers who have completed the TOPP in Region 20,
Texas?” was research question number two. Information related to this question was
obtained through ten face-to-face, one-on-one survey interviews. The responses to the
interview questions varied greatly. However, some common themes did emerge. The
researcher identified and explained the common themes through summary as well as
direct quotes from the interview participants.
Each interview was conducted using a series of seven survey interview questions
(Appendix B). The questions were used to guide the conversation related to variables

82
that influenced the retention of the ten participants interviewed. Several themes emerged
as a result of the purposeful conversation with participants. All responses associated with
individuals will be denoted through the use of a participant number rather than name, so
as to protect the identity of the interview participant.
The need for teachers and the ability to retain highly qualified teachers in the
field of education has been an area of debate receiving a lot of attention sine the 1980’s.
The use of alternative certification programs has been one solution to this, sometimes,
controversial topic. While alternative certification programs vary greatly in structure and
quality, the TOPP program is arguably one of the better, higher quality programs
possessing many of the standards Berry (2001) determined that high quality alternative
certification programs should possess. Berry suggested that high quality alternative
certification programs contain several key elements. First, they must provide a strong
academic and pedagogical component. Secondly, they must include an intensive field
experience in an internship or student teaching. Next, a high quality alternative
certification program requires all teachers to meet all of the state’s standards for subject
matter and teaching knowledge. Lastly, all teachers must meet the state’s teacher quality
standards.
The intent of this study was twofold: first, to determine whether or not there were
specific demographic variables associated with retention rates, and secondly, to identify
variables that impacted the retention of TOPP completers who were retained. What
factors, other than demographic variables, play a role in retaining teachers who complete
an alternative certification program? What can we do and/or provide to teachers who

83
complete an alternative certification program so as to retain them in the field? What are
we doing that works and has proven to impact their retention?
When I visited with the ten participants who participated in the survey interview
portion of the study, I always started the interview with the same prompt:
Describe any variables that played a role in your being retained in the field ofeducation as a teacher. This might include, but is not limited to, new teacherinduction programs, mentors, financial incentives, location of school, teachingassignments, administrative support, and professional growth opportunities.
Seven of the ten participants replied with a statement related to their personal
commitment to the field of education or the kids.
Participant number 138 stated, “It is something I’ve always wanted to do. I like
it.” Participant number 209 replied by saying, “I’ve always wanted to be in education.
Personal and professional growth.” The teacher continued later in the interview that he
had grown up in the area and was a product of the district and wanted to give back to the
community. Participant number 173 indicated that she wanted to “go where my heart
really was.” She continued by saying, “My heart wasn’t there. I wanted to do something
I enjoy– where my creativity comes out.” Participant number 205 stated, “I like working
with kids. Kids need consistency–especially at-risk kids.” Participant number 239, a
teacher in a Life Skills unit, also supported this notion of the internal drive related to
working with kids. He stated, “I have a couple of cousins with downs. My love for them
is profound. Seeing them grow and develop–to see that reward and that happiness in
their eyes. Working with these kids is very rewarding.” Participant number 210 stated,
“These kids are our future. The enjoyment of helping kids.” Participant number 240
relayed a message related to the love of teaching as well as a personal connection when

84
he stated, “The love of teaching. I enjoy teaching. My son was in special education –a
speech delay. I decided special education would be a good field.”
Additional responses related to variables that played a role in the participant’s
retention in the field of education were varied. Six major themes emerged as a result of
this question. The first theme, personal commitment to the field of education or the kids,
is described in the previous paragraph. The other themes include a mentor, team support,
administrative support, new teacher induction, and teaching calendar/schedule.
The TOPP requires each participating school to provide a mentor for each intern
during their first year of teaching. This requirement also has some parameters that
involve teacher observations with feedback opportunities. Eight of the ten interviewed
participants indicated that a mentor played an important role in their being retained. In
some cases, it was the formal, assigned mentor who was required through TOPP. In
other cases, it was an informal mentor who the participant found on his or her own.
Participant number 239 stated, “The mentor program required by TOPP was a lot of
help. Showing me the ropes, the ARD paperwork, and help with problems.” Participant
number 276 felt that the mentor was a critical component related to her retention and
success the first year. She stated,
I had a good mentor. Some people didn’t have a good mentor –they were ondifferent grade levels. Mine was across the hall, on the same grade level; weplanned together, observed one another. We are still friends to this day. She nolonger teaches.
Participant number 240 gave a very thoughtful response related to his mentor. He
stated, “My predecessor was my mentor. He helped me a lot. Helped me to understand
others perspective related to special education. We did some planning together. We

85
discussed planning options. He helped me a lot–brainstorming, ARD paperwork, the
laws.”
Two of the ten participants interviewed felt that the mentor had no impact on
their retention in the field of education. Participant number 138 stated, “The mentor was
not a factor.” Participant number 210 stated, “It was not mentoring. It wasn’t much
help.”
The notion of overall team support was evident in a number of the responses
provided by the ten participants. Six of the participants mentioned team or grade-level
support as a variable that played a role in their being retained in the field. Participant
number 138 stated that the third grade team helped and that they were a “tight” team.
Participant number 173 reported that while her mentor was very available, additional
support came from the librarian, the instructional specialists, and the whole campus. She
went on to say, “That is why I plan to stay here.” Participant number 205 worked in a
classroom with two other teachers, supporting students who were in credit recovery for
various content areas. She alluded to the fact that the three of them have supported one
another and that another benefit of this model was the fact that she always had
experienced teachers readily available to her for advice and guidance. Participant
number 276 stated that her grade-level team was instrumental in her retention. She
explained that they “plan together and vacation together.” She went on to state, “We are
very close. If you work well together, it makes work fun. You can vent, brainstorm. It
makes it easier to problem solve and intervene with students.” Participant number 258
stated that her team was helpful because some of them had also gone through TOPP.

86
Many of the participants commented on the support of the campus
administration. Participant number 138 lives a considerable distance from the school and
school district in which she is teaching. In fact, she travels through three school districts
to get to her school. She stated, “The principal and vice principal are the main reason I
stay here.” Participant number 276 commented, “The principal was very supportive. She
arranged for observations and provided for coverage.” Participant number 258 stated that
both her principal and vice principal had gone through TOPP. As a result, “they were
both very supportive and helpful.”
A number of the participants commented that their school or school district had a
new teacher induction program at the start of the school year. These programs ranged
from a weeklong institute to a three-day workshop to nothing at all. Comments related to
the effectiveness of the induction program were mixed. Participant number 138 stated
that the one-week institute was “extremely helpful” and provided a number of resources
for her. Participant number 209 stated that the three-day workshop provided an overview
of the handbook, policies/procedures, and showed him “the ropes.” Participant number
205 reported that the three-day new teacher induction program at her district was,
“overwhelming and a lot of information.”
While the teaching calendar and schedule was the primary response for only one
of the ten participants, three others did mention this as being a factor in their being
retained in the field of education. Participant number 205 stated that the scheduling,
specifically, the hours and days off, did play a role in her retention. Participant number
239 reported, “the time off compensates for the pay. Vacation time helps. I was thrown

87
into the teaching field with no student teaching. So the time off was helpful.” Participant
number 276 reported that being on the same calendar as her kids was a factor for her.
Participant number 261 stated that one of the factors that impacted her retention was the
summers off. She went on to state, “We work hard when we work. Christmas and spring
break too. The time with my kids.”
When I asked participants to talk to me about the least significant variable in
their being retained in the field of education, responses varied. One common answer
related to the pay. Three participants commented that the pay did not impact their
decision to stay in the field of education. Participant number 173 stated that while the
salary was lower in her district than a neighboring district, “all of the positive things
outweighed that– there were too many other positives.” Participant number 240 also
supported this notion when he stated, “Probably themoney. I do have two kids–13 and
15, and a wife, but money has never been a big issue.” Perhaps participant number 239
said it best when he stated, “Pay – money isn’t everything.”
Two of the ten participants stated that the location of their school did not play a
role in their being retained in the field. In other words, as long as they were comfortable
in their school, they were willing to drive a distance to get there. Participant number 205
stated, “Location does not play a role. I drive some distance.” I later determined that she
lived approximately 20 miles from the school.
When asked which variable played the most significant role in their being
retained, responses varied. Six of the ten participants commented that something related
to their personal commitment to the field of education or the kids has played the most

88
significant role. One participant commented that the administrative support was most
instrumental. One participant concluded that their mentor was most instrumental in their
retention. Another participant stated that the calendar or schedule was the main reason
they have been retained. The last of the ten participants associates her retention with a
concept that is broader in nature–relationships. Participant number 258 stated,
A lot of commonalities with others in the profession. I enjoy being around otherteachers. I love working with the kids. Having a good administration is huge. Weenjoy each other’s company. We work well as a team. We are friends outside of work too–we go to movies and happy hour.
I want to springboard on this notion of relationships. While a number of factors
impacted the retention of the ten participants interviewed, relationships may be the
broader concept that links many of the factors discussed in the interviews. The
relationships that I discovered included team and grade-level relationships, relationships
with administration, and relationships with other TOPP interns as well as TOPP staff.
But, perhaps most critical in retaining teachers is the relationship they have fostered
within their grade-level team or department. This is evident in a number of the responses
provided by the participants.
Participant number 138 stated that the third grade team is “tight.” Participant
number 209 worked on a high school campus as a coach and special education teacher.
A number of the other coaches were also special education teachers. He stated, “We
spend a lot of time together.” Participant number 173 explained that the support of the
administration was the most critical variable in her being retained. She went on to
explain that, “Their door is always open. They are there for you. It is an open, positive
environment. I’ve translated this to the classroom.” Participant number 240 credits his

89
retention, partly, to the relationships he has built with the parents in the community. As a
special education teacher, he has a lot of opportunities to communicate with parents. He
commented, “The parental support was not here when I got here. I’ve been able to build
rapport. I talked with the kid’s parents a lot. I’ve seen a change in parental attitudes. The
parent growth is another reason I am still here.” Participant number 276 associates her
retention with the relationships she has built with her team. She stated,“We plan
together and vacation together. We are very close. If you work well together, it makes
work fun.” She went on to state, “The work environment keeps me here. Once you find a
good spot and you’re comfortable, you don’t want to change it and start over.”
Many of the comments and insights provided by the participants in the ten survey
interviews I completed align with the current literature and research related to teacher
retention. Their retention is impacted more by support mechanisms than it is by pay and
other incentives. Regardless of the type of certification program a teacher completes, this
type of support is instrumental in retaining teachers. It is through such support
mechanisms that relationships are fostered.
A review of ten studies related to mentoring and teacher retention conducted by
Ingersoll and Kralik (2004) provide empirical support that providing teacher support,
particularly mentoring, has a positive impact on teachers and retention. Relationships
can serve to help new teachers learn the ropes and have a positive experience from the
start (Villani, 2002). Villani’s research identified several studies that determined the
positive impact that these initial relationships can have on new teachers’ orientation to

90
the school system and socialization to the school culture. As described in Chapter II,
mentor relationships can have a positive impact on teacher retention.

91
CHAPTER V
SUMMARY, CONCLUSIONS, AND RECOMMENDATIONS
This chapter contains a summary of the study as well as conclusions. Chapter V
is divided into three major sections. The first section presents a summary of the study,
the procedures, and the author’s findings based upon the research questions that were
posed. The second section presents the conclusions and implications that were derived
from the data as well as the review of the literature. The third section includes the
recommendations for further study.
Summary
The primary purpose of this study was to determine the impact of an alternative
certification program on the retention of teachers in Region 20, Texas, as reported by
Education Service Center, Region 20, Texas. Demographic variables from the Teacher
Orientation and Preparation Program (TOPP) completers were analyzed to determine
their association with retention rates. Additionally, survey interviews were conducted to
provide additional information related to retention rates of TOPP completers.
Through the examination of the data obtained through the statistical analysis, as
well as survey interviews, the following research questions were addressed:
1. Do selected demographic variables predict the retention of teachers in Region
20, Texas, who are certified through the TOPP as reported by personnel in
Education Service Center, Region 20, Texas?

92
2. What variables influence the retention of teachers who are certified through
the TOPP as reported by selected teachers who have completed the TOPP in
Region 20, Texas?
This study was conducted during the spring of 2004, fall of 2005, and spring of
2005. The population of the study was teachers who completed the Teacher Orientation
and Preparation Program in Education Service Center, Region 20 from 1999-2004. The
population consisted of five TOPP cohorts. The cohorts included TOPP classes from
1999-2000, 2000-2001, 2001-2002, 2002-2003, and 2003-2004.
Following a review of the literature, contact was made with the Executive
Director of Education Service Center, Region 20, and he was informed of the interest in
conducting a study on the alternative certification program, TOPP, in Region 20. After
discussing the study, the Executive Director granted permission to conduct the study. A
letter outlining the data request for the study (Appendix C) was developed and an open
records request (Appendix D) was completed and both were presented to the Executive
Director. Permission to move forward with the study was obtained after securing the
signature of the Executive Director.
Data relating to the demographic variables and retention rates of the population
being examined were obtained. The population for the study consisted of 537
participants, who completed the TOPP from 1999-2004. The data were analyzed using a
personal computer and the software package SPSS Version 11.0, specifically the
subroutine logistic regression.

93
A sub-sample of ten from this population of 537 was identified. The ten were
chosen based on demographic characteristics. The sub-sample that was chosen was
representative of the total population. The researcher contacted each participant from the
sub-sample by phone and arranged for one-on-one survey interviews. All interviews
were conducted before and after school as well as during teacher planning periods on the
campus on which the participant worked. The interview data were analyzed and themes
and commonalities were identified.
As described in Chapter II, the need for teachers in the United States continues to
be an issue of great concern. Lucksinger (2000) has found that estimates indicate that in
the next ten years, nearly two million new teachers will be needed to meet the increasing
enrollments in America’s schools. Lucksinger further points out that our current system
will produce half that amount or one million new teachers. And of those one million new
teachers over the next ten years, 20 to 40% will leave within their first two years in the
profession. Other data suggest that between 40 and 50% will leave within the first five
years (Ingersoll & Smith, 2003). Lucksinger (2000) also points out that the majority of
this need will be in low-wealth urban and rural school districts.
Compounding the issue of teacher retention is the associated cost to school
districts and taxpayers. Researchers from a study in Texas reported that the state’s
annual turnover rate of 15% costs the state approximately $329 million a year (Texas
Center for Educational Research, 2000). The study also showed that the state had a 40%
turnover rate for teachers in their first three years. The cost to the state equates to
approximately $8,000 per recruit who leaves in the first few years of teaching. A report

94
compiled by Strayhorn (2004) estimates that the cost of teacher turnover for 2003-2004
to be $13,161 per teacher. The number of teachers who did not return to teaching in
2003-2004 in the state of Texas was 36,322 (Strayhorn, 2004). This equates to a total
teacher turnover cost of $478 million for the 2003-2004 academic year.
It is for the reasons noted above that it is essential that states such as Texas
recruit and retain teachers. One avenue to do such is through alternative certification
programs such as TOPP. As a result, an attempt was made to determine if specific
demographic variables were associated with TOPP completers who were retained in the
field. Such information could be helpful in recruiting TOPP interns as well as informing
retention efforts. The observed demographic variables could not be found to be
associated with retention. In addition, the researcher hoped to identify other variables
that impacted the retention of the TOPP completers. While this data cannot be
generalized to the population, the data were insightful and oftentimes aligned with
current research findings. This will be detailed in the Conclusions portion of this chapter.
Conclusions
Research Question One
“Do selected demographic variables predict the retention of teachers in Region
20, Texas, who are certified through the TOPP as reported by personnel in Education
Service Center, Region 20, Texas?”

95
Conclusions
The statistical procedure, logistic regression was utilized to address question one.
The model was first tested using an Omnibus Test of Model Coefficients. A significance
value of < .001 was needed for the researcher to state that the model was significant
(Mertler & Vannatta, 2002). In this case, the significance level was found to be .191. As
a result, the researcher concluded that the model was not a good fit. The next procedure
the researcher used was the -2 Log likelihood. This, too, indicated that the model does
not fit the data. A perfect fit has a value for this measure equal to 0 (George & Mallery,
2002) while the model for this research produced a value of 533.347. The Cox & Snell R
Square and the Nagelkerke R Square both indicate that the model is not a good fit.
The classification table provides a comparison of the predicted values for the
dependent variable, based on the logistic regression model, with the actual observed
values from the data (Mertler & Vannatta, 2002). The model shows that there is no
difference in the 110 participants who were not retained when compared to the 416
participants who were retained. The model predicts that, based on the demographic
characteristics analyzed by this researcher, all 526 participants would be retained. This
indicates that the statistical calculations associated with this data suggest that the
dependent variables are not suited for determining retention.
The model indicates that the selected demographic variables analyzed in this
study cannot be used to predict the retention of teachers in Region 20, Texas, who are
certified through the TOPP in Education Service Center, Region 20, Texas. The
significance values were all greater than .05. The significance value for gender was .068.

96
The significance value for ethnicity was .367. The significance value for socioeconomic
status was .797. The significance value for grade type was .165.
Implications
Based on this study, the researcher concluded that the demographic variables
analyzed cannot be used to predict teacher retention. As a result, the recruitment efforts
of the TOPP staff and Education Service Center, Region 20, should not be limited to or
adjusted to potential candidates who possess these demographic characteristics. The
likelihood of a TOPP intern being retained in the field relies more heavily on variables
other than those identified in this study.
The research literature associated with retention indicates that the variables that
impact teacher retention align less with gender, ethnicity, socioeconomic status of the
campus, and grade type than they do with other variables. Other variables that align with
retention rates might include mentor relationships, ongoing support, and internal rewards
associated with relationships and making a difference (Feiman-Nemser, 2003; Hope,
1999; Williams, 2000).
According to Olson (2000a), first-year teachers who do not participate in mentor
programs are nearly twice as likely to leave the teaching profession after their first three
years when compared to those who do participate in such programs. According to
Darling-Hammond (2003), a number of researchers have found that mentoring programs
raise retention rates for new teachers by improving their attitudes, feelings of efficacy,
and instructional skills.
97
It is recommended that TOPP and other alternative certification programs
continue to determine effective avenues to address retention of teachers who complete
their programs that are aligned with those identified in the research to have positive
effects. The research clearly indicates that implementation of support programs, such as
mentor programs and purposeful and systemic support, can positively impact retention
rates.
While approximately 74.5% of the TOPP interns worked at low socioeconomic,
high poverty campuses their first year, 76.4% remained on such campuses their third
year. This would suggest that this factor did not play a role in their retention. As a result,
TOPP staff need not consider the socioeconomic status of the campus when seeking
employment opportunities for participants because it likely will not be a factor in their
retention.
Research Question Two
“What variables influence the retention of teachers who are certified through the
TOPP as reported by selected teachers who have completed the TOPP in Region 20,
Texas?”
Conclusions
The study determined that the variables that impacted the retention rate of the
participants who participated in the survey interview are closely aligned with those that
the researcher found in the literature. A common theme that emerged was that of the
impact of relationships on an individual’s decision to stay inthe field of education and,
more specifically, to stay at a particular campus. A number of the participants indicated

98
that an individual or group of individuals and the relationship associated with that
individual or group of individuals was a critical factor associated with their still being
employed as a teacher. Hope (1999) reported that collegiality is an important element
that can enhance retention. Hope goes on to state that when new teachers and peers are
given opportunities to connect, the relationships that develop are mutually beneficial to
the teachers involved.
Retention is impacted when teachers are “able to fulfill strong personal needs for
autonomy and creativity in their classrooms, and their rewards are meaningful
relationships and the knowledge that they are making a difference in the lives of their
students” (Williams, 2000, p. 74). This concept of relationships and personal
commitment to the field of education or the kids surfaced time and again in the survey
interviews.
In addition to relationships and making a difference in the lives of children, other
common indicators that the interview participants associated with their retention
included mentor support, team support, administrative support, new teacher induction
programs, and the advantages related to the teaching calendar/schedule. Each of these
variables can be found in the literature related to teacher retention (Linton & Kester,
2002; Renard, 2003; Rowley, 1999; Sargent, 2003; Williams, 2000).
Implications
Regardless of the path to certification, whether it be through a traditional
university program or an alternative certification program, the need to support beginning
teachers is relevant. While the teachers who participated in the survey interview for this

99
study were all alternative certification participants, their needs, while unique in some
ways, mirrored the needs of many beginning educators. Their responses indicated the
need for support from colleagues and administration and the need for someone to show
them the ropes and for someone to listen to them vent. Other needs included the
provision for a person to act as a sounding board and a person with whom to brainstorm
and share ideas.
Staffs in teacher preparation programs as well as school districts need to
understand and value the unique needs of new teachers. In response to this unique set of
needs, teacher preparation programs and school districts need research-based support
mechanisms to support beginning educators. These support mechanisms need be
systemic and provide for support of all beginning educators for a minimum of one year,
with three years being optimal (Olson, 2000a). Such programs should be immediate,
based on the developmental needs of the new teachers, systemic in nature so that they fit
into the big picture, and align with the school system (Steffy, Wolfe, Pasch, & Enz,
2000). Effective programs of this nature are designed within the context of the school’s
culture and are part of the larger staff development program (Brock & Grady, 2001).
Recommendations
The major purpose of this study was to determine the impact of an alternative
certification program on the retention of teachers in Region 20, Texas. A secondary
purpose of this study was to determine if selected demographic variables predict the
retention of teachers in Region 20, Texas, who are certified through the TOPP. An
additional purpose of this study was to determine what variables influence the retention

100
of selected teachers who are certified through the TOPP. Based upon review of the
literature, the findings of this study, and the conclusions drawn from this research, the
following recommendations are provided:
Recommendations Based on This Study
1. Since the collected data indicated that the select demographic variables do
not influence the retention of teachers in the TOPP program, the program
coordinators should not focus their recruitment or retention efforts on groups
of individuals possessing these demographic characteristics.
2. Since the current literature and the collected data indicated that variables such
as personal commitment to the field of education or the kids, providing for a
mentor, team support, administrative support, and new teacher induction
programs impact the retention of teachers, the program coordinators should
focus efforts, attention, and resources on the development of programs that
support these variables.
3. Since the current literature and the collected dated from the sub-sample
indicated that the variables that impact the retention of teachers are similar
for traditional university certification programs and TOPP, program
coordinators as well as district and university staff should focus efforts,
attention, and resources on the development of programs that support all
beginning educators, regardless of certification path.
4. Since the collected data indicated that this program served the unique needs
of 526 TOPP completers between the years of 1999 and 2004, it is

101
recommended that the program coordinators continue to provide this path to
certification to help in addressing the teacher shortage in the Region 20 area.
5. Sine the collected data indicated that this program had an overall retention
rate of 79.1%, it is recommended that the program coordinators continue to
seek out and build upon strategies and ideas to increase the retention rate of
educators who complete certification through this program.
6. Since the current literature and the state of Texas have identified the attrition
of teachers as one of the reasons for the current teacher shortage, the
appropriate state officials should re-examine current practices to consider
funding research-based practices, such as the ones indicated in this study, to
increase teacher retention, thereby reducing high costs associated with
recruitment efforts.
Recommendations for Further Research
The following are recommendations for further research related to this area:
1. Longitudinal research that tracts alternative certification program participants
in regards to performance.
2. Research that reflects the perceptions of superintendents, central office staff,
and campus administrators regarding the effectiveness of alternative
certification programs.
3. Research that reflects the retention rate of alternative certification program
participants statewide as well as nationwide.

102
4. Further study on demographic in addition to other variables that may predict
the retention of teachers who participate in an alternative certification
program.

103
REFERENCES
Berry, B. (2000). Quality alternatives in teacher preparation: Dodging the “silver bullet”
and doing what is right for students. The State Education Standard, 1(1), 21-25.
Berry, B. (2001). No shortcuts to preparing good teachers. Educational Leadership,
58(8), 32-35.
Berube, M.S. (Ed.). (1985). The American heritage dictionary (2nd ed.). Boston:
Houghton Mifflin.
Blair, J. (2003, January). Skirting tradition. Education Week, 22(17), 35-38.
Brock, B.L. & Grady, M.L. (2001). From first-year to first-rate: Principals guiding
beginning teachers. Thousand Oaks, CA: Corwin Press.
Colley, A.C. (2002). What can principals do about new teacher attrition? Principal,
81(4), 22-24.
Compayre, G. (1907). Horace Mann and the public school in the United States. New
York: Crowell.
Cortez, A. (2001). Teacher shortages–Implications for reform and achievement for all
students. IDRA Newsletter, 28(7), 5-7, 13-16.
Cremin, L.A. (1957). The republic and the school: Horace Mann on the education of
free man. New York: Columbia University, Teachers College Press.
Darling-Hammond, L. (1990). Teaching and knowledge: Policy issues posed by alternate
certification for teachers. Peabody Journal of Education, 67(3), 123-154.
Darling-Hammond, L. (2000). Solving the dilemmas of teacher supply, demand, and
quality. New York: National Commission on Teaching America’s Future.

104
Darling-Hammond, L. (2003). Keeping good teachers: Why it matters, what leaders can
do. Educational Leadership, 60(8), 6-13.
DeYoung, C. & Wynn, R. (1972). American education (7th ed.). New York: McGraw-
Hill.
Feiman-Nemser, S. (2003). What new teachers need to learn. Educational Leadership,
60(8), 25-29.
Feistritzer, C.E. (1993). National overview of alternative teacher certification. Education
and Urban Society, 26(1), 18-28.
Feistritzer, C. E. & Chester, D. (2000). Alternative certification: A state-by-state
analysis. Washington DC: National Center for Education Information.
Fielder, E.F. & Haselkorn, D. (1999). Learning the ropes: Teacher induction programs
and practices in the United States. Belmont, MA: Recruiting New Teachers.
(ERIC Document Reproduction Service No. ED434879)
Finn, C.E. & Madigan, K. (2001). Removing the barriers for teacher candidates.
Educational Leadership, 58(8), 29-31, 36.
Fuller, E. (2002, June). Estimates of the shortage of Texas public school teachers in
2001 and 2002. Austin, TX: State Board for Educator Certification.
Gall, M., Borg, M., & Gall, J. (1996). Educational research: An introduction (6th ed.).
New York: Longman.
George, D. & Mallery, P. (2002). SPSS for windows step by step: A simple guide and
reference, 11.0 update (4th ed.). Upper Saddle River, NJ: Pearson Allyn &
Bacon.

105
Hope, W.C. (1999). Principals’ orientation and induction activities as factors in teacher
retention. The Clearing House, 73(1), 54-56.
Howard, T.C. (2003). Who receives the short end of the shortage? Implications of the
U.S. teacher shortage on urban schools. Journal of Curriculum and Supervision,
18(2), 142-160.
Huling, L. (1998, November). Texas Board for Educator Certification: Panel on novice
teacher induction support system: Final report. Austin, TX: Texas State Board
for Educator Certification.
Hunt, J.B. & Carroll, T.G. (2003).No dream denied: A pledge to America’s children.
Washington, DC: National Commission on Teaching and America’s Future.
Ingersoll, R.M. (2001). Teacher turnover and teacher shortages: An organizational
analysis. American Education Research Journal, 38(3), 499-534.
Ingersoll, R.M. (2003a). The teacher shortage: A case of wrong diagnosis and wrong
prescription. NASSP Bulletin, 86, 16-31.
Ingersoll, R.M. (2003b). The teacher shortage: Myth or reality? Educational Horizons,
146-152.
Ingersoll, R.M. & Kralik, J.M. (2004). The impact of mentoring on teacher retention:
What the research says. Washington, DC: Education Commission of the States
Research Review.
Ingersoll, R.M. & Smith, T.M. (2003). The wrong solution to the teacher shortage.
Educational Leadership, 60(8), 30-33.

106
Jacobson, S.L. (1995). Monetary incentives and the reform of teacher compensation: A
persistent organizational dilemma. International Journal of Educational Reform,
4(1), 29-35.
Jorissen, K.T. (2003). Successful career transitions: Lessons from urban alternate route
teachers who stayed. High School Journal, 86(3), 41-52.
Lincoln, Y. S. & Guba, E. G. (1985). Naturalistic inquiry. Newbury Park, CA: Sage.
Linton, T. & Kester, D. (2002, Winter).Keeping your new teachers: Do’s and don’ts for
principals. TEPSA Journal, 26-31.
Lucksinger, L. (2000). Can we get them and keep them? Delta Kappa Gamma Bulletin,
67(1), 11-15.
Mertler, C.A. & Vannatta, R.A. (2002). Advanced and multivariate statistical methods:
Practical application and interpretation. Los Angeles: Pyrczak.
Morice, L.C. & Murray, J.E. (2003). Compensation and teacher retention: A success
story. Educational Leadership, 60(8), 40-43.
National Center for Education Information. (2003). Overview. Retrieved February 6,
2003, from www.ncei.com/2003/overview.htm
National Center for Educational Statistics. (2002). Digest of Educational Statistics,
2002. Retrieved January, 10, 2004, from http://nces.ed.gov/pubs2003/digest02
Ng, J. C. (2003). Teacher shortages in urban schools: The role of traditional and
alternative certification routes in filling the voids. Education and Urban Society,
35(4), 380-398.

107
Olson, L. (2000a). Finding and keeping competent teachers. Education Week, 19(18),
12-18.
Olson, L. (2000b). Sweetening the pot. Education Week, 19(18), 28-34.
Olson, L. (2000c). Taking a different road to teaching. Education Week, 19(18), 35.
Patterson, C. (2002). Eight facts about teacher pay and teacher retention in Texas public
schools. Austin, TX: Texas Public Policy Foundation.
Patton, M. (1990). Qualitative evaluation and research methods (2nd ed.). Thousand
Oaks, CA: Sage.
Renard, L. (2003). Setting new teachers up for failure…or success. Educational
Leadership, 60(8), 62-64.
Roach, V. & Cohen, B.A. (2002). Moving past the politics: How alternative certification
can promote comprehensive teacher development reforms. Alexandria, VA:
National Association of State School Boards.
Rowley, J. (1999). The good mentor. Educational Leadership, 56(8), 20-22.
Sargent, B. (2003). Finding good teachers–and keeping them. Educational Leadership,
60(8), 44-47.
Scherer, M. (1999). A better beginning: Supporting and mentoring new teachers.
Alexandria, VA: Association for Supervision and Curriculum Development.
Spring, J. (2001). The American school: 1642-2000 (5th ed.). New York: McGraw-Hill.
State Board for Educator Certification (SBEC). (2001). Texas beginning educator
support system (Executive Summary Findings from the Pilot Year, 1999-2000).
Austin, TX: Charles A. Dana Center.

108
State Board for Educator Certification (SBEC). (2002a). One year attrition rates for
Texas public school teachers and administrators by race/ethnicity and sex (1995-
1996 through 2001-2002). Austin, TX: Fuller.
State Board for Educator Certification (SBEC). (2002b). Texas beginning educator
support system. Austin, TX: Fuller.
State Board for Educator Certification (SBEC). (2004a). Approved programs. Retrieved
January 10, 2004, from
http://www.sbec.state.tx.us/SBECOnline/approvedprograms.asp?s=3&sid=
State Board for Educator Certification (SBEC). (2004b). Elementary comprehensive
Examination for Certification of Educators in Texas (ExCET) and the grade-
level appropriate Texas Examination of Educator Standards (TExES). Retrieved
March 7, 2004, from http://www.excet.nesinc.com/TE_aboutTExES.htm
Steffy, B.E., Wolfe, M.P., Pasch, S.H., & Enz, B.J. (Eds.). (2000). Life cycle of the
career teacher. Indianapolis: Kappa Delta Pi & Corwin Press.
Strayhorn, C.K. (2004). The cost of underpaying Texas teachers (Special Report: Texas
Comptroller). Austin, TX: Author.
Texas A&M Institute for School-University Partnerships. (1999). Texas teacher
recruitment and retention study. Austin, TX: Texas Education Agency.
Texas Center for Educational Research. (2000). The cost of teacher turnover. Austin,
TX: Author.
Texas Education Agency. (1991, April). Alternative teacher certification in Texas
(Publication No. GE1-611-02). Austin, TX: Author.

109
Texas Education Agency. (2002, September 30). Policy guidance for No Child Left
Behind: Public Law 107-110. Austin, TX: Author.
Texas Education Agency. (2003a, May 7). NCLB Bulletin 1(1), 1-10.
Texas Education Agency. (2003b, October 21). NCLB Bulletin 1(2), 1-3.
Texas Education Agency. (2003c). NCLB parent notification requirements related to
highly qualified teachers. Retrieved February 6, 2004, from
http://www.tea.state.tx.us/taa/
Texas Education Code. (1997). TEC 8.002 (Chap. 8). Retrieved November 4, 2003, from
http://www.capitol.state.tx.us/statutes/edtoc.html
Texas Education Code. (2004). TEC 21.049a (Chap. 21). Retrieved March 10, 2005,
from http://www.capitol.state.tx.us/cgi-bin/cqcgi
Texas Region 20 Education Service Center. (2002). Teacher Orientation and
Preparation Program (TOPP). Retrieved February 6, 2002, from
http://www.esc20.k12.tx.us/topp/
Texas Region 20 Education Service Center. (2003). Teacher Orientation and
Preparation Program (TOPP) handbook. Retrieved January 10, 2004, from
http://www.esc20.net/topp/PDFs/0304handbook.pdf
Villani, S. (2002). Mentoring programs for new teachers. Thousand Oaks, CA: Corwin
Press.
Williams, J. (2000). Why great teachers stay. Educational Leadership, 60(8), 71-74.
Wright, S. (2001). The alternative route to certification. Techniques: Connecting
Education & Careers, 76(5), 24-27.

110
APPENDIX A
INFORMED CONSENT DOCUMENT

111
Informed Consent Document
The Impact of an Alternative Certification Program on Teacher Retentionin Selected Texas Public School Districts as Reported by Personnel in
Education Service Center, Region 20 Texas
I will participate as an interview respondent in a doctoral research project, supervised by Dr.
Clifford Whetten. This study will explore retention rate of teachers who complete an alternative
certification program in selected public school districts in Education Service Center, Region 20, Texas. All
teachers interviewed will have successfully completed the Teacher Orientation and Preparation Program
(TOPP) alternative certification program through Education Service Center, Region 20. Additionally, all
teachers interviewed will have been retained in the field of education for three or more years. Data on all
TOPP participants for the years of 1999–2004 will be analyzed. To complete this study, ten teachers will
be individually interviewed during the spring of 2005.
I give my consent for the data from my interview to be used to complete the course requirements.
I understand the interview will take about one hour to complete. All information about me will remain
confidential and my responses will be coded. I understand my participation in this study is voluntary, and I
can withdraw from the study at any time without negative consequences. I understand there is no
compensation for my participation.
I voluntarily agree to be audio taped during the survey interview. I understand that the tapes will
be used only for the review and analysis of survey interview information. These tapes will be identified
through a coding system. The tapes will be kept for three years and stored and secured at the researchers
residence.
I understand that this research study has been reviewed and approved by the Institutional Review
Board–Human Subjects in Research, Texas A&M University. For research-related problems or questions
regarding subjects’ rights, I can contact the Institutional Review Board through Dr. Michael W. Buckley,
Director of Support Services, Office of Vice President for Research at (979) 458-4067
I understand the explanation provided to me and all of my questions have been answered to my
satisfaction. I have read this consent form and I voluntarily agree to participate in this study. I have been
given a copy of this consent form.
Signature of Respondent Date
Jeffery Lee Goldhorn, M.Ed. Date(210) 363-8024 [email protected]. Clifford Whetten(210) 208-9308 [email protected]

112
APPENDIX B
SURVEY INTERVIEW QUESTIONS

113
Survey Interview Questions
1. Describe any variables that played a role in your being retained in the field ofeducation as a teacher. This might include, but is not limited to, new teacherinduction programs, mentors, financial incentives, location of school, teachingassignments, administrative support, and professional growth opportunities.
2. Of the variables described, which were provided through the school or schooldistrict?
3. Of the variables described, which were provided through other means such asyour own initiative?
4. What do you believe to be the most significant variable in your being retained inthe field of education? Why?
5. What do you believe to be the least significant variable in your being retained inthe field of education? Why?
6. What, if any, variables do you wish your school or school district would haveprovided, but did not?
7. Do you believe there to be a difference in retention rates between alternativelycertified and traditionally certified teachers? Why?

114
APPENDIX C
ESC-20 LETTER

115
February 16, 2004
Dear Dr. Terry Smith:
I am a doctoral student at Texas A&M University working under the supervision of Dr. Clifford Whettenin Educational Administration. I am conducting a study exploring retention rate of teachers who completean alternative certification program in selected public school districts in Education Service Center, Region20. This study will hopefully provide insight into the existence of specific demographic variables that tendto positively and negatively impact retention rates of alternatively certified teachers. Additionally, thestudy will offer information related to the attitudes and perceptions of alternatively certified teachers inregards to their retention in the field of education.
This research study has been reviewed and approved by the Institutional Review Board–Human Subjectsin Research, Texas A&M University. For research-related problems or questions regarding subjects’ rights, you can contact the Institutional Review Board through Dr. Michael W. Buckley, Director ofSupport Services, Office of Vice President for Research at (979) 458-4067 ([email protected]).
The population for this study will be teachers who completed the Teacher Orientation and PreparationProgram in Education Service Center, Region 20 from 1992–2002. The Public Education Informationand Management System (PEIMS) will be used to collect demographic data on all teachers identified inthe population. This data will be cross-referenced with other databanks available through EducationService Center, Region 20 to acquire additional information related to current grade placement and currentsocioeconomic level of campuses. A sub-sample will be identified from the population. The researcherwill conduct a survey interview with the sub-sample. The sub-sample will include teachers from eachgrade placement category (elementary, middle school, and high school). All identifying data related toTOPP participants will be coded so an to ensure subject confidentiality.
I would like to obtain permission to access the Education Service Center, Region 20 TOPP and PEIMSdatabanks noted above. I will be happy to share my research findings with you and your TOPP staff uponthe conclusion of my research. Your willingness to support this research is vital to the success of thisstudy.
Please check one of the blanks below, sign and date, and return to Jeff Goldhorn in the attached self-addressed envelope. I have enclosed a copy of the letter for your records. Please contact me at (210) 363-8024 or Dr. Clifford Whetten at (210) 208-9308 should you need additional information.
Sincerely,
Jeffery Lee Goldhorn
____ Yes, I agree to allow access to the Education Service Center, Region 20 TOPP and PEIMS databanksnoted.____ No, I do not agree to allow access to the Education Service Center, Region 20 TOPP and PEIMSdatabanks noted.
Signature Date

116
APPENDIX D
OPEN RECORDS REQUEST

117
Jeff Goldhorn212 Aero AvenueSchertz, TX 78154(210) 363-8024
March 24, 2004
Dear Officer of Public Records:
This request is made under the Texas Open Records Act, Article 6252-17a, whichguarantees the public’s access to information in the custody of governmental agencies. In accordance with Sec. 4 of the law, which requires that the “Officer of Public Recordsshall promptly produce such information for inspection or duplication, or both, in theoffices of the governmental body,” I respectfully request access to the following information:
A list of Teacher Orientation and Preparation Program (TOPP) completersfrom 1992–2002 (names only)
Public Education Information and Management System (PEIMS)–demographic data of TOPP completers referenced above
Thank you for your time and attention to this matter.
Sincerely,
Jeffery L. Goldhorn

118
APPENDIX E
AUDIT TRAIL

119
Audit Trail
Key:I = Interview numberF = FemaleM = MaleH = Hispanic ethnicityW = White ethnicityE = ElementaryMS = Middle SchoolHS = High School1 = low SES2 = high SEST = tape number
Participants:138 =I1-F-W-E-2-T1209 =I2-M-W-HS-1-T1173 =I3-F-W-MS-1-T1205 =I4-F-H-HS-1-T1210 =I5-M-H-MS-1-T2239 =I6-M-H-MS-1-T2240 =I7-M-W-MS-1-T3258 =I8-F-W-E-1-T3261 =I9-F-W-E-1-T3276 =I10-F-W-E-1-T3

120
VITA
JEFFERY L. GOLDHORN194 Elk Hollow
Bulverde, Texas 78163
EDUCATION
2005 Doctor of Philosophy, Educational AdministrationTexas A&M University, College Station, Texas
1998 Master of Education, Educational AdministrationTrinity University, San Antonio, Texas
1994 Bachelor of Arts, Elementary Education/Middle School EducationUniversity of Northern Iowa, Cedar Falls, Iowa
CERTIFICATIONS (State of Texas)
Texas Educator Certificate: Mid-Management Administrator(Grades PK-12)
Texas Educator Certificate: Supervisor Grades (PK-12)
Texas Educator Certificate: Elementary Self-Contained (Grades 1-8)
Texas Educator Certificate: Elementary Life-Earth Science(Grades 1-8)
EXPERIENCE
2002-Present Curriculum CoordinatorEducation Service Center, Region 20San Antonio, Texas
1998-2002 Vice PrincipalNorthside Independent School DistrictSan Antonio, Texas
1995-1998 Grade 5 TeacherNorthside Independent School DistrictSan Antonio, Texas
This dissertation was typed and edited by Marilyn M. Oliva at Action Ink, Inc.
Related Documents