'-.. :- : ',,' ',' . .. ... " , : • , . THE HYDROELASTIC VIBRATION OrA - HYDRAULIC CHECK VALVE " , .. . "' \- .,

Welcome message from author
This document is posted to help you gain knowledge. Please leave a comment to let me know what you think about it! Share it to your friends and learn new things together.
Transcript

'-.. :-: ',,' ',' .
.. ... " , :
•
, . THE HYDROELASTIC VIBRATION OrA -
HYDRAULIC ~WING CHECK VALVE "
,
.. .
"' \-
.,
,. ,
,
Th~s thcsis is dedicatcd to my mother .a.
" ':
.'
'.
•
. ,
, .. THE HYDROELASTIC VIBRATION OF A
HYDRAULIC SItING CHE.CK VALVE
by
i •
• , !
.'
• J- '" , j .
Francis Ajibola Ajiboye' Adubi, M.A.St.
A Thesis.
Submitted to the School of Graduate Studies
in Partial Fulfilment of the Requirements
for the Degree of
Doctor of Philosophy
~lcMaster Universi ty
December 1974 1,.... , .
...... . '
© FRArlcfs AJIBOLA AJIBOYE ADUBI 1977
. " 'J .
C
"
. J •
, . ,
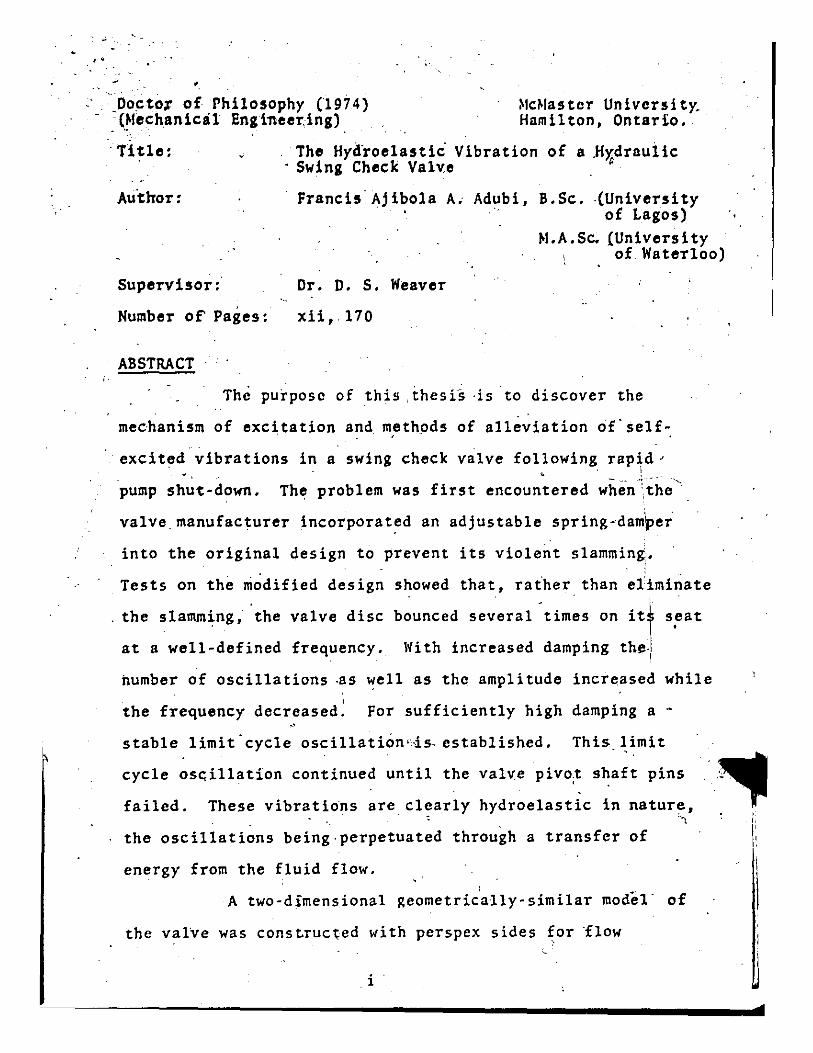
OoctoT of Philosophy (1974) . (,~Iechanicil Eng lneedng)
McMaster Universit~ Hamilton, Ontario.
. Title:
Au'tnor:
Supervisor:
Number o~ Pages:
ABSTRACT
The Hyd'roelastic Vibration of a ,Hy,:draulic . Swing Check Valv,e ~
Francis'Ajibola Ai Adubi,
Dr. O. S. Weaver
xii, 170
B. Sc. ·(Universi ty of Lagos)
~1.A.Sc. (University of Waterloo)
Th~ pu~pose of this ,~hesi~ ,is to discover the
mechanism of excitation and methods of alle~iation of'self-. .
excited vibrations in a swing check valve following rapid' 10 • __ + .• L- -- "'1
pump shut-down. The problem was first encountered when '.,the .
valve, manufacturer incorporat~d an adjustable spring-'damper'
into the original design to prevent its violent slammin~.
Tests on the ~odified design showed that, raiher,than eiiminate
, the slamming, the valve disc bounced several times on it~ s~at
at a well-defined frequency. IH th increased damping the.!
number of oscillations ·as well as the amplitude increased while i
the frequency decreased. For sufficiently high damping a -
stable limit'cycle oscillati6n"i~ established. This limit . "
cycle oscillation continued until the valve pivot shaft pins . , . failed. These vibratidns are,cl~arly hydroelastic in natur~,
.. .. ..,. the oscillations being,perpetuated through a transfer of
energy from the fluid flow. :
A two-dimensional geometrically-similar model' of
the valve was const.ructed with perspex sides for 'flow
i
,
I:
d
! ,
visualization. A central'portion along the base of the model
wa's a150 lall!inated with perspex to al~o,.; the projection of a
collimated sheet of light. Aluminium powder tracer preparation
wa~ injected into the flow and cine-photography, of t~' f~ow
duriJ1g v-ibration carried out. In addition, dyn~mic ~urements of upstream and downstream pressures, valve ~ngular
displacement and the load on the d~mper arm were synchronized
with the films. The data collect~din th.is way'for a number,
of,r~straining spring rates and initial,spring deflection
angles allowed a detailed stability map of the valvo's dynamic,
behaviour to'be plotted. The essential characteristics of the
instability observed in th~ model arc the same as those found,
in the prototype valve tes~s although the model 'wa~ not
scaled dynamically. This was neces~ary in order to ~uarantee , the structural integrity of the model overfthe long period
,of tests.
The results of the research show that there is a
sudden increase in the hydrodynamic closing lo~d as th~ valve
approaches its seat, primarily as a result of the changing
discharge characteristics. Althoug~upstream and downstream
waterhamm'er waves are produced as the valve, slams onto its . .... . '
,seat, the valve responds .only toth«;. pressure ~ifference
•
" I
acro~s it. ' It remains closed until this pres~uredifference
reduces to the point where it either c~ack~ the valv~ open
or, allows' the damper spr ing to pull it open. On the opening
part of,' the vibration cycle the, hydrodynamic closing 'load ~
is substantially lower than the-load at the, same angle during / ' ~
i -..
..
closing. This hysteretic effect shows that tbere is a net
energy input from the fluid during each cycle and the 'motion
is perpetuated •.
Tests on the model further show that if the
damp,ing 'sprin~ is stiff enough to eliminate the slamming,
ei ther ,the valve will never close or it will exhibit ,limi t
cycle oscillations. Clearly, neither alternative is acceptable.
Based on the aforementioned results, it was realised that ·c " •
another possible ~ans of alleviating the problem is to alter
the discharge characteristics of the valve at small angles
of closure by suitable changes in geometry. In the second
part of the thesis, a number of .such changes were made in the
mod~l' and.the experiments repeated. It was discovered that
by making the rate of change of discharge a more gradual
function ot the valve closure angle, the dynamic instability
in .. ~he model could be entirely eliminated.
iii

/
/ ACKNOWI.EDGE~fENTS
The author wishes to ekpress his sincere gratitudo )
tq his supervisor and friend, Dr. D. S. Weaver, for suggest-
ing the problem and for his advice, assistance and
encouragement throughout the course of this work. \
The author would also like to thank Dr. N. Kouwen
of the University of Waterloo and Professors J. I.. Tlusty
and~f. II. 1. Baird of Mc~faster University for the loan of
part of his experimental equip~ent.
Appreciation is extended to the Canadian Common
wealth Scholarship and Fellowship Committee and to McMaster
University for financial assistance.
Thl~ encouragement of my family and friends is also
gratefully acknowledged.
iv
ABSTRACT
ACKNOWLEDGEMENTS
CHAPTER 1
1.1
1.2
1.3
1.4
1.5
1.6
CHAPTER 2
2.1
\ 2.2
2.3
2.4
2.5
CHAPTER 3
3.1
3.2 .
3.3
3,4
3.4.1
TABL.E 01',/ CONTENTS . I
INTRODUCTION
Introduction
Check Valves
"
Closure of Check Valves
Oscillation or "Hu'ntlng"o: Valves
Backgr·ound
Purpose of
of the Present Problem ./
the Investigation
BASIC CONCEPTS OF FLOW-INDUCED ST~UCTURALVIBRATIONS
Introduction
Classification of Flow-Induced Vibrations .<.
Use of Mathematical Models
Virtual Mass of Submerged Structures
I
Vibrations of Hydraulic Gates and Valves
EXPERIMENTAL APPARATUS
Introduction
Experimental Circuit
The Valve Model
Instrumentation for Dynamic Measurements
Introduction
v
1
1
3
4
5
6
9
12
12
17
19
20
23
30
30
31
37
39
39 (
"""
\
\
3.4.2 Thc Read-Out System
3.4:3 Valv~ Drsplacemont
3.4.4 Hydrodynamic Torque
3.4.5 Prcssures
3.5 Flow Visualization
)
3.5.1 Flow Visualization in Water: A Brief Survey
3.5.2 The Optical Arrangement
3.5.3 Al~minium Tracer Injection
3:5.4 Photography
3.6
3.7
Determination of Spring Stiffnosses
Experimental Procedure
CHAPTER 4
4.1
4.2
4.3
FREE VIBRATIONS - NO FLOW
Introduction
Theoretical Formulation
Approximate Theory: Reduction to a Single-Degree-of-Freedom System
4.4
4.5
4.6
CHAPTER 5
5.1
5.2
5.3
Experimental Procedures and Typical Results
Determination of an Approximate Added Mass
Discussion and Conclusions
THE DYNAMIC BEHAVIOUR OF TIfE VALVE
Introduction
Static System Characteristics
Variable Parameters
5.4 Parametric Vibration Tests
5.4.1 Spring Stiffness Kept Constant; Initial Angle of Opening Varied
vi
39
40 .
42
44
46
4.6
51
54
54
56
56
60
60
60
63
64
71
72
74
74
75
79
79
79
CHAPTER
I
5.4. 2
5.5
5.6
5.7
5.8 l'
5.8.1
5.8.2 ,
\ 5,1l.:'
5.8,4
5.9
5. 10
5,11
6
6.1
6,2
6,3
6,4
6,5
6,6
6,7
6,8
6.9
(,.10
Initial Angle of Oponlng Kept Constant~ Spring Stiffnosn Varied
Dynamic ~tabillty Diagram of the Valve
Closer Examination of tho Dynamic Instability
Parametric Studios
Flow Visualization Studios
E~'pectations from the Plow Vl.sualiza c tll9n Programme
Photographic Method
f.gUl tg and fli :1C:US~ ion
Special Effects
Fluid ~ohaviour during Vibration
Revorse Discharge Characteristics of the V"lve
Summary of Results: Mechanism of Instabi Ii ty
INVESTIGATION OF DESIGN CHANGES TO ELIMINATE VALVE VIBRATION
Introduction
Criterion for an Effective Solution
Series B Experiments.,and Results
Series C Experiments and Results
Series C1 Experiments and Results
Series B-Cl Experiments and Results
Series B-C2 Experiments and-ResuI ts
Series R-D Experiments and Results
Series B-Dl Experiments and Results "
Series B-CI-Dl Experiments and Results
vii
...
80
81
83
99
104
104
105
106
114
119
122
124
127
127
128
129
131
133
136
139
142
144
147
. "
6.11
6."12
6.13
CHAPTER 7
REFERENCES
APPENDIX A
APPENDIXB
• . "
Sorlo~ 'ci-n! Ex~orlrn(lnt9 and J((l~U!t~l"
SorJos E nxp~rlmonts und RO~lllts
Suggestion for Practical Implemontation of the Solution
CONCLUSIONS
Experimental Results
Design Data for the Modol
..
viii
';' •
u
164
167
/

.fI Gu;t 1.1
1.2
1.3
2.1
3.1
3.2
3.3
3.4
3.5
-
LIST OF ILLUSTRATIONS 'Q!
Inner Contours of Hydraulic Swing Check Valv~
Check Valve'with Hydraulic Oil Cy1inder Arrangement
... Preliminary ~est ~Iodified DesigQ
Results on Manuf~cturer's
A Reduced Hydroelastic Triangle
S'chematic of Closed-Loop Experimental Cit"cuit r
General View of ~xperimen~~l Apparatus \ .~ .. Close-Up View of Te;t Section~_
Transition Pieces fl., .
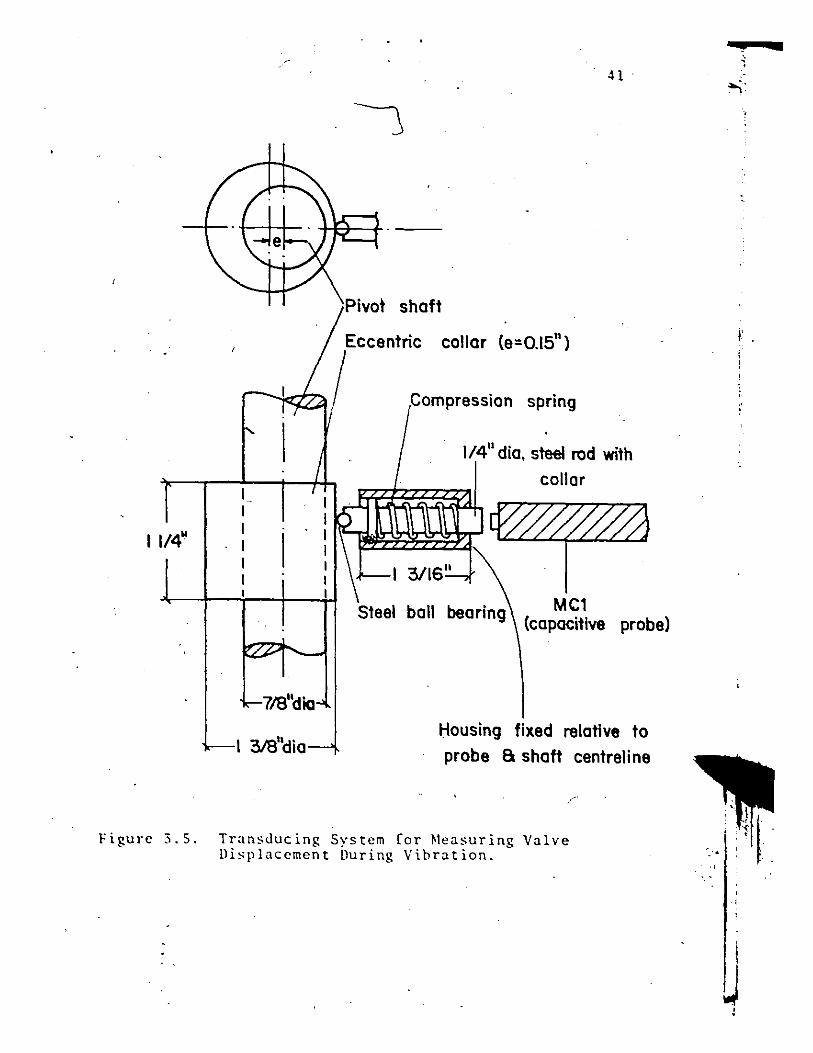
Transducing Syst:em:;i'or ~feasuring Valve Disp1ac~ment During· Vibrnion
3.6 View Showing Remainder of Experimental Equip-ment
.., 3.7 Load Cell Calibration
3.8 'Determination of Spring Stiffnesses
4.1 Schematic Representation of Valve System·
4. 2
4.3-
5.2
5.3
5.4
5.5
Free Vibrations in Air
Free Vibrations in Water
Limiting Condition of Equilibrium of the Val",e
Static System Characteri.stic of the vi::i:e .' Stability Map of the Valve's Dynamic Behaviour
,
Dynamic ~Ieasurements : K ~ 10.305 kN/m; eo ~
4 1/20 eq ~ - -
",_r-."r-
Dynamic ~Iea su reme n t s ; K = eq 14.1$8 kN/m; e ~
0
,
40
5.6 Dynamic ~Icasurements , K = 28.85 kN/m; eo = 30 eq
,5.7 .
70 Dynamic ~Ieasu.remcnts ; K = 14.168 kK/m; e ~
eq 0
5.8 Dynamic ~Ieasurements ; K = 28.85 kN/m; e ~ 4 1/20
eq 0
ix
-
J
, :J
5.9, , '" Subsystem Excited into Free Vibrations while Valve
5.10 .. Remains Closed
Pressuf'e Difference vs Angle of Opening, Keq • 10~305 kN/m; 8
0,. 4 1/20
5.11 PressoreDifference vs Angle of Opening, K~q • 14.168 kN/m; 8
0 = 4
5'.12 Pressure Difference vs Angle of, Opening,
5.13
5,.14
5. IS
Keq = 28.85 kN/~, 8 0 = 30
Pressure Difference vs Angle ~t Opening, K = 14 168 kN/m' 8 • 70 eq' " 0
Pressure Difference vs Angle of Opening, Keq = 28.85 kN/m; 8 0 = 4 1120 •
Results of Para~~tric Tests: 'Frequency NS Stiffness Ratio for Constant Applied
v
Ra t io Pressure
5.16 Results of Pat;ametric Tests:, ~Iaximum Angle of Opening vs Equivalent Spring :Stiffness
, , 5.l7~ Results of Parametric Te~ts: Initial Angle of
Setting vs Max~mum Valve Dis~lacement \
5.18 (a) Flow Visu?llzation 'of Full Vie~ of Valve During Vibration .
5.18 ,,(b) Flow thrOU&'h~tatiC Valve at Various An,gles
5.19 Flow Pattern Variation over One Cycle of Valve Vibration: Frami gRate = 12 fps; K;q = 14.168 kN/m\ ,~o = 6
0 ~ 5.20 SyncltTon,lsed Dynamic ~lea5urement of Vibra t ign
Recorded, :in Fig. 5\,19 '
5.21 Dtfferences in ~10~ Pattern between Closing and Opening Parts of t~e Vibration Cycle: , F:raming Rate = 64 fps; K = 11.95,6 kN/m 8 = 5.50 \ eq ,
a 5.2~ Special Effects: Vqrtex Action: graming rate =
64 fps, K = 14.16~ kN/m; 8 = 6 ' eq "" a 5.23 Special Effects: "Tadpoles" at Closure and at
Opening'of Valve
5.24 Velocity Measurements Across a Section of the ValVe Apron During a Typical Cycle of Vibration
x
,,'
"
I'
5.ZS· Static Reverse Discharge Characteristics of thj Va 1 ve·
5.Z6 Actual Reverse Discharge Coefficient vs Fixed Angle of Closure .
6.1 Series B EXperiments: Design ~odification and Stab i 1 ity ~Iap
6.Z Series B Experiments: Static Reverse Discharge Characteristics of the Modified Valve
6.3
6.4
6 . 5
Series C Experiments: Design Modification and Stability. Map
Series Cl Experiments: Design Modification and Stability Map
Comparison of Series Cl and 8 = 6 0
o
Vibration Records of Series B-D for K = eq
Series .'I, 11.956 kN/m;
6.6 Series B-C! experiments: Design ~Iodification and Stability Map , i
6.7 Series B-CZ Experiments: Design Modification and Stability Map •
6.8 Comparison of Static Reverse Discharge Characteristics of Series A and Series B-CZ
6.9 •
6.10
Series B-D Experiments: Design Modification and Stability Map
Series B-Dl Experiments: Design Modification and Stability Map
6.11 Comparison of Static Reverse Discharge Character" istics of Series A and SeriesB-pl
6.12 Series B-C1-Dl Experiments: Design Modification' and ~tability Map
6.13 Scries B-CI-D1: Dynamic Bchaviour of Valve at K = 10.305 kN/m; e = 4 1/20
cq 0
6.14 S'crics B-CI-Dl: Dynamic Behaviour bf Valve at K = 28.85 k~/m' e = 30
6.15
6. 16
cq , 0
Scries B-C1-DI: Dynamic Behaviour of Valve at K . = 28.85 kN/m· 8 = 4 1/2 0
cq , 0
Scries B-CI-DI.: nvnamic Behavlour of Valvc at K = 11.168 kN/m;'so= 70
eq
xi
/'
6.17
6.18
f Series B-C1-Dl: Static Re~erse Discbarge Characteristics Compared to Series A
Series Cl-Dl Experimen~s: Design Modification and Stability Map
6.19~ .Comparison of Static Reverse Discharge Characteristics of Series Cl-Dl and Series A.
6.20
6. Z1
Series E Experiments: Design Modification and . Stability'Map
Suggested Vibration-Free Design of the ~wing Check Valve with Spring Damper
"
xii
/
I i • t
CHAPTER 1
INTRODUCTION
1.1 Introduction
Fluids may be classified as liquids, gases, or
vapours. Each class presents its own handling problems. More-
over, it is sometimes required to transport-sol:ids in suspension.
This problem of controlling fluids has always taxed man's'
ingenuity.
The tapered plug appears to have been the earliest
method of arresting fluid flow; indeed historians tell u~ that
two galleys df the Emperor Caligula (AD 12-41) were equipped
with taper-plug cocks to enable the vessels to be scuttled
in the event of imminent capture. This common stop cock
retained its form and importance for many centuries while valve
d~sign waited for the development of technology in other fields.
For example, the screw-down stop valve as ~e know it today
depended on the introduction of the modern screw-cutting lathe
about 1790.
Modern conditions of application'have become more
exacting and valve designs may now be quite complex [1)1.
Simple mechanical principles while still indispensable are
1 Numbers in square brackets refer to references given at the end of this thesis.
1
, . z
being suppl~mented by electric, hydraulic ~nd pneumatic aids, , and th~ modern valve designer has t~ utilise' his knowledge,
, ~
not only of mechanics and physics but also of new materials.
As operating conditions have become more 'ardUou~ valve
design has changed, inevitably becoming more complex and
sophisticated. Today, the greater emphasis on public safety
~nd the enVironment, the d~velopment of more sophisticated
sensing devices and the demand for more automatic control, all
contribute to influence design. Phenomenal rises in tempera
tures and pressutes, for example, have compelled the abandon
ment of long-standing designs and techniques; a·fundamental
example being the replacement of the spring-loaded safety valve
method of relieving pressure by the torsion-bar loaded, piston
assisted and thermal element types [1]. " •
Valve selection for a particular application is
determined by such factors as size of partiCUlate matter in
flow, viscosity, velbcity, pressure, temperature and whether
the fluid's state remains constant throughout the 'system.
The type of service required of the valve is also an important
factor in valve selection: for example whether the valve is
required for isolating or regulating· service, and if shut
off service is needed whether it be quick and bubble tight.
Each type of valve has its own characteristics that determine
its suitability for particular kinds of service.
Today there are a great number of different types ~.
of valves on the market. For reasons of space the applications
to which ~ach type of valve can be put will not be enumerated
, I I ·1
L
I I i I ,
I
3
here. The book by the British Valve )Ianufacturers Association
[2J describes a v'ariety of vah-es in industrial use. Glickman
and Hehn [3) have also written a general paper on "this .' subject. Suffice it to say that the most common types are
the globe, check, gate, slide, relief, plug, butterfly,
diaphragm, cone, and pinch valves. The subclassifications
are also numerous. For example the lub~icated plug valve
may have a tapered or parallel plug, or it may be a simple
gland cock.
1.2 Check Valves
Swing-check and lift-check valves act automatically
and are used in systems where flow in one direction only is
desired. Selectio~ of the most suitable pattern and siz~ is ,
determined by parameters such as working temperature and I
pressure, flow velocity and allowable friction losses.
Other types of check valves [2), [3) on the market
include the simple flap, tAlting disc, mUlti-door, recoil, , , I
V-ring and cone check valyes_ In essence they are all merely I
devices which permit flow in only one direction.
In the simplest form, a check valve compri!es a
casing containing a hinged flap which is sensitive to small
differences between upstream and downstream pressure. As long
as the downstream
the valve remains
pressure is less~~ the upstream pr~ssure,
open, the degree 6f opening depending on
the pressure difference_ However, any drop in upstream
pressure below downstream pressure will cause valve closure
4
and hence prevent reverse flow.
Various forms of swing-check va-lves range from the
single hinged pattern in pipelines a few ilTChes in diameter, •
to the large multi"-door patterns fOT large pipe systems
several feet in diameter. Lift check valves are normally
associated with smaller pipelines up to about twelve'inches
diameter in high prrssure systems. , /
1.3 Closure of Check Valves /
The action of a simple check valve, installed in a . ".
centrifugal pumping installation, is basically as follows. Q
• The valve door is normally held open by impinging flow. If
;
the redu~tion in flow velocity (following pump ~hut-down) is slow
as in the case of a centrifugal pump which continues to
rotate for a short· time after being shut down - the valve
closes slowly.
When the pump is provided with a brake and therefore
shuts down very Tapidly, the pressure at the pump is suddenly ,;':: ..
reduced below that of the fluid downstream of the valve,
and reverse flow may be established. The resulting pressure
on the valve disc slams it heavily onto its seat. This leads
to the generation of dangerous pressure surges which can cause
damage to pipework and associated equipment or at the very
least, ca~se a loud startling noise which may not be acceptable
in commercial appli·cation.
.'
5
1.4 Oscillation or "Bunting" of Valves
. Under certain conditions of operation, almost all
valves display a tendency to .. chatter.... Problems of this
kind generally occur when the valve is operating partially
clo~ed, or more nearly fully closed. They are caused by
the slight but rapid movements of the valve elemen~which
change the flow area,.·giving rise to pressure fluctuations.
For example, the spTing type pressure relief valve is prone
to chatter, and here oscillations can ~uild up to such a
degree as to calise mechanical failure of the seat. Sluice
valves can also produce undesirable Rressure fluctuafions. In
this case the nature of the connection between valve spindle
and wedge is generally such as to permit'small movements
of the wedge which result in changes in flow and pressure.
f In modern pumping installations the valve most liable to
oscillate is the/terminal float-operated valve [4). In ~his
case, wave motion in the tank or reservoir can directly affect
the float and cause repeated closing and opening of the valve.
In the case of pressure-reducing valves, oscillations
are sometimes ·inadvertently initiated. Normally, this valve
is sensitive to charigesin downstream pressure and by automatic
adjustment, endeavours to maintai.n a reasonably constant outlet .,
pressure. A change in the downstream conditions, for example
due to reduced draw-off,.causes the valve to moVe in the
closin& direCtion. If the valve over-corrects in its attempt
to settle at the ne\; required position, "hunting" may be
initiated unless sufficient damping is incorporated in the
.,
6
servo-system.
In all the cases mentioned, if the period of valve ~
vibration falls in phase with the perio~ of the fluid-mass
oscillation in the pipe~-Fepeating pressur~ pattern occurs
[8J, [9J. Such resonance is usually avoided by introducing
damping to the valve arrangements. With float-pperated valves,
the float is usually arranged to operate within an auxiliary !
container,'thereby shielding it from wave motion.
These examples indicate that valve oscillation can
be a very real problem and if engineers and manufacturers are
conscious of this fact, they ,can design and specify the
inclusion df appropriate preventive features.
1.5 Background of the Present Problem
•
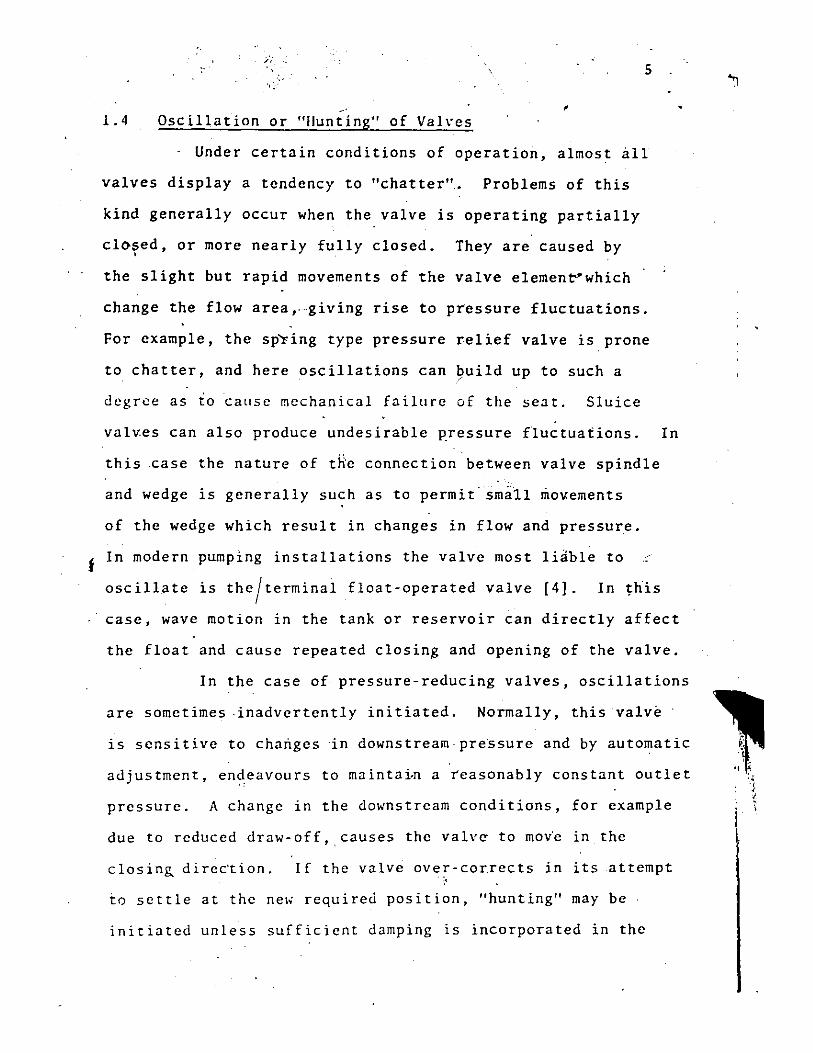
The swini check valve detailed in Fig. 1'.1 is typical
of a variety of valves manufactured and marketed by the Darling
Valve and Manufacturing Company. of Williamsport, Pa., U.S.A.
Under conditions of rapid pump shut-down in service, the
disc was'found to slam so hard on th,e seat that it often led
to shearing of the pivot pins connecting the swing arm to
the pivot shaft. In adciition, i.t created a. very real noise
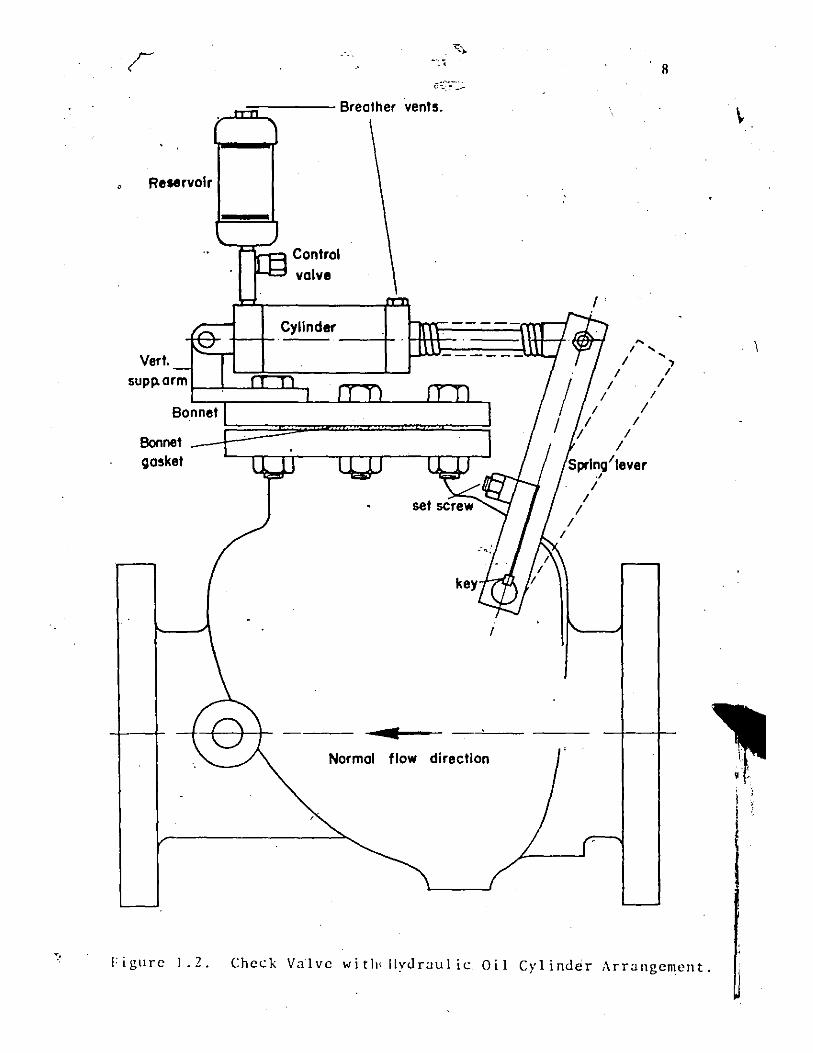
annoyance problem to customers. An external hydraulic oil
damper, shown in Fig. 1,2, was then incorporated into the
original design, thc aim being to reduce the slamming force
on the scat. The results of this modification; shown in the
form of gross pressure traces (which may be taken to indicate
valve displacement), obtained in tests of a 12 inch diameter
\ "
- ~,-' -- -.---
'-'-'-r ~
=-:
:;
::;
;..
,.. '-o u: ;..
c -::: ;.. G
::; ::..".
. I
:' \ :;". I
u
r
Reservoir
Vert.
--""~---- Breather vents.
-'q-~ Control valve
Cylinder +--+- --I-
sup p. arm f--!--..l..l'--'-'-,
Bonnet
Bonnet _-T gasket L..-rr-r...--rr-r-r---.,--rr ........
I
.. Normal flow direction
8
I '
~
I .... / .... ~
/ I / /
/ I /
/ /
/ ,<,,-, ... 'lever
Figure 1.2. Check Valve with< Ilyc.lraulic Oil C}'linc.ler Arrangement.
\
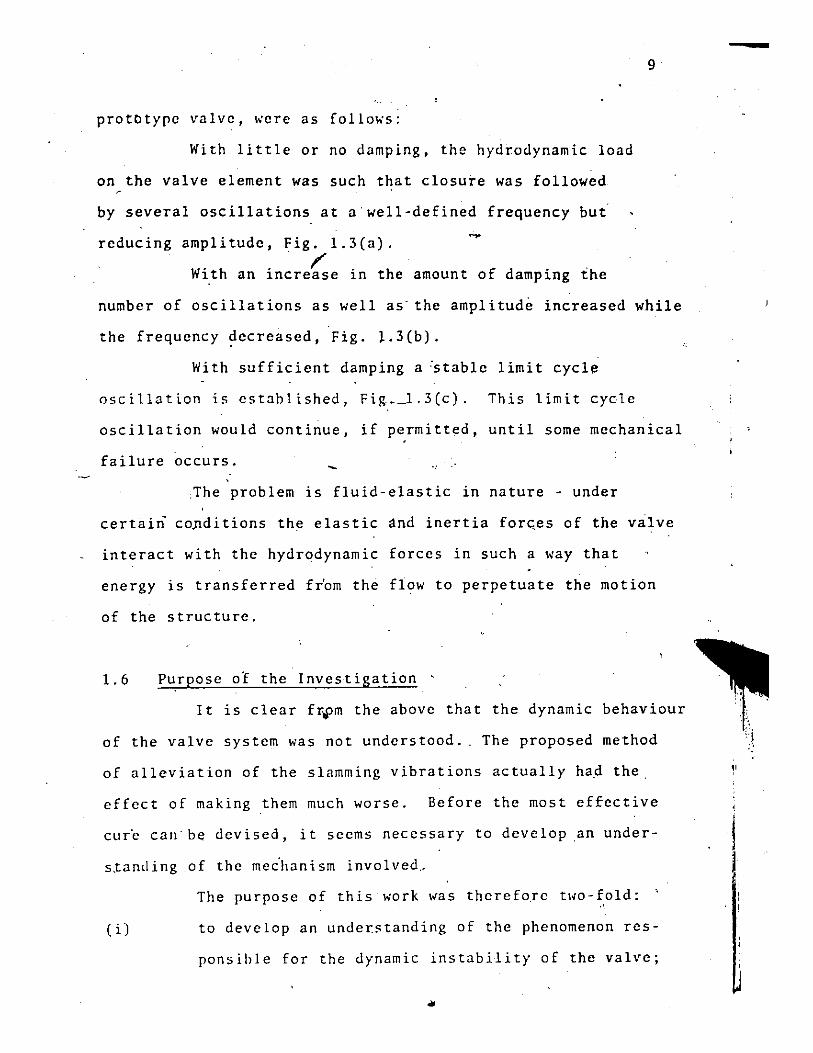
prototype valve, were as follows:
With little or no damping, the hydrodynamic load
on the valve element was such that closure was followed
by several oscillations at a'well-defined frequency but'
reducing amplitude, Fig. 1.3(a).
W· h .' ~ . h It an Increase In t e amount of damping the
9
number of oscillations as well as' the amplitud~ increased while
the frequency ~ecreased, Fig. J.3(b).
With sufficient damping a ~table limit cycle
oscillation is estahlished, Fig_..J.3(c). This limit cycle
oscillation would continue, if permitted, until some mechanical
failure occurs. -,The problem is fluid-elastic in nature - under
certain co~ditions the elastic and inertia for~es of the valve
interact with the hydrodynamic forces in such a way that
energy is transferred fr'om the flow to perpetuate the motion
of the structure.
1.6 Purpose 01 the Inves~igation
It is clear fr~m the above that the dynamic behaviour
of the valve system was not understood. , The proposed method
of alleviation of the slamming vibrations actually ha~ the,
effect of making them much worse. Before the most effective
cur~ can'be devised, it seems necessary to develop an under
s.tanding of the mec'hanism involved,.
( i)
The purpose of this work lias therefore two-fold:
to develop an understanding of the phenomenon res
ponsi\lle for the dynamic instability of the valve;
-
l'
I
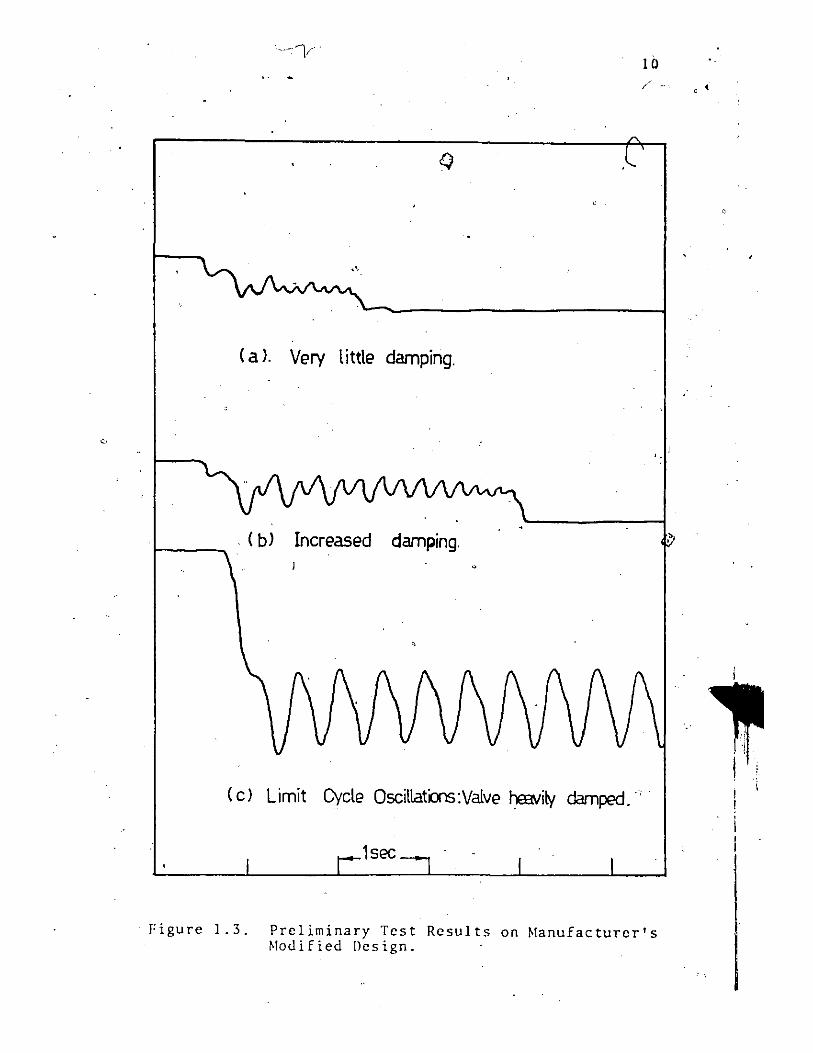
10
,',
(a), Very little damping.
, .
. (b) Increased damping.
( c) Limit Cycle Oscillato-as :Valve heavily damped.'
1sec
Figure 1,3. Preliminary Test Results on Manufacturer's ~Iodified Design.

11
(iil to conduct an exhaustive . L· .~_
investi'"!'ation ~ . into the
dynamic behaviour of the ~alve ~ith the object of
devising a means of improving its performance.
/
I \
.~
•
'-)
I CHAP1;ER 2
BASIC CONCEPTS OF FLOW-INDUCED STRUCTURAL VIBRATIONS
,
2.1 Introduction
The vibration of structural members when exposed
to a'flow field has long bee~ of interest and concern to the .~---: -~ ,
engineer; ,:Even though structural engineers have experienced
these ?he~ohena .fo!" hundreds of ';:ears ~r,1 ha,·e cone to
recognise their general nature at le~st since the suspension
bridge failures of the 1800's, the metho~s developed for their
study are largely a contribution of the aerodynamicist. The
onset of powered flight early in this century brought the
aerodynamicist an empirical familiarity with the problems .' .
arising from the mutual interaction between aerodynamic and
elastic forces. Frequent disastrous consequences oj aero
elastic phenomena now known by such names as "flutter", "buffet·
ing", and "divergence" stlmulated their analytical study
beginning in the' 1920's, thus assuring their prominent role
in both theOretical and exp~rimental aerodynamics to the
present time.
Flutter is defined by the aerodynamicist [10) as the
dynamic instability of an elastic body in a fluid stream, the
only forces necessary to produce it being those caused by
deflections of the elastic structu're from its' undeformed
state. If the system is linear in its response to loading, its'
12
13
stab.r'1ity to infinitesimal motion provides the complete
defi~ition of its flutter propertips
forces producing this motion becomes
and the origin of the
unimJortan t. If, on the
other hand, the svstem is nonlinear such that dynamic stability . ,
is dependent on the degree of elastic deformation, it is ,
clear that the origin of the forcing function is of vital
importance' [11). When the magnitude of the force increases
with the amplitude of the motion it provides, the phenomena
are called "self-excited", [12).
Buffeting, as usually defined represents the elastic
response of a structure to forces which are little affected
by the body motion. These forces may result from the presence
of the body in the fluid flow field, such as the alternating
forces accompanying the vortex street in the wake of a bluff f
body, but as long as the torces are not altered by the result-
ing elastic deflection, the phenomenon is considered as forced
vibration, [13), [14).
Following the failure'of the Tacoma Narrows bridge
in 1940, structural engineers have made significant progress
'in applying the theories of aerodynamic stability to the
qnalysis of bridge oscillations. But while it is generally
accepted that both flutter a~buffeting may be
these bridge motions, the comp~x nature of the
geometry and stiffness of the prototype bridges .
involved in
structural
usually demand
model studies of the structural behaviour which leave the
true nature'of the dynamic excitation unresolved.
In the very recent past, the term hydroelasticity
has become increasingly popular in discussions of~problems
,\
i
\ !
14
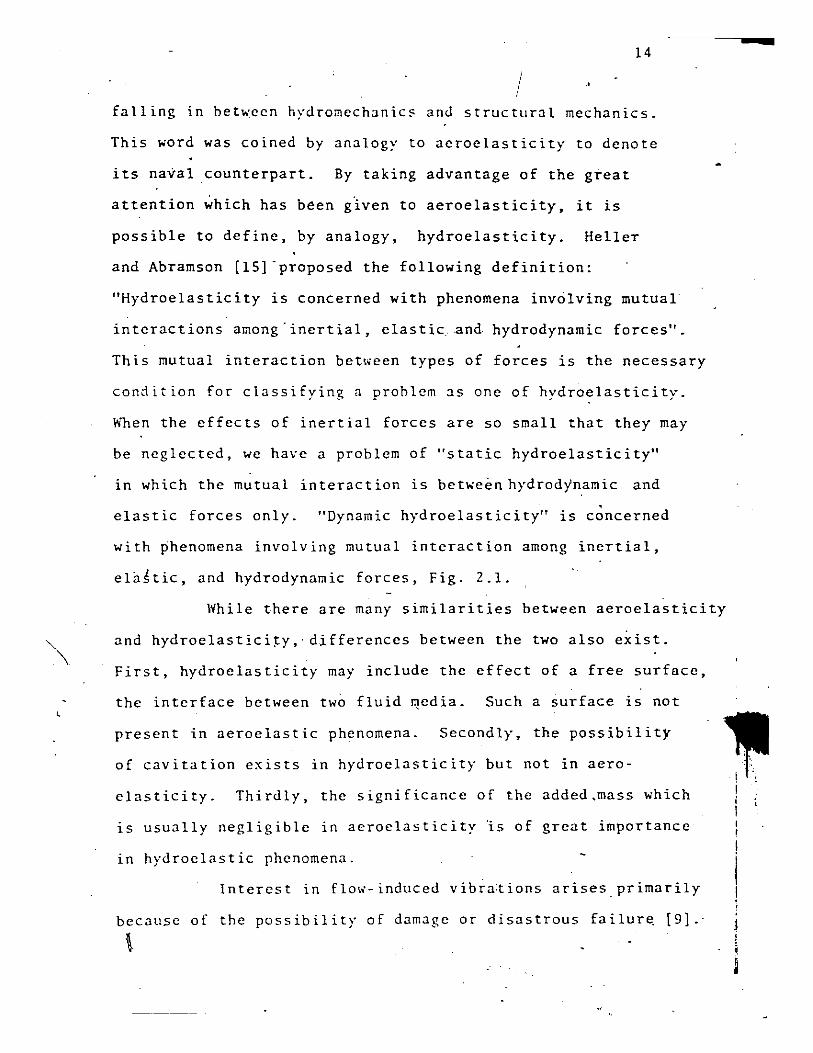
I falling in bet~een hydromechanic5 and structural mechanics.
This word was coined by analogy to aeroelasticity to denote
its na~alcounterpart. By taking advantage of the great
attention which has been g~ven to aeroelasticity, it is
possible to define, by analogy, hydroelasticity. Heller
and Abramson [15) 'proposed the following definition:
"Hydroelasticity is concerned with phenomena involving mutual
interactions among' inertial, elastic and- hydrodynamic forces".
This mutual interaction between types of forces is the necessary
condition for classifying a problem as one of hydroelasticity.
When the effects of inertial forces are so small that they may
be neglected, we have a problem of "static hydroelasticity"
In which the mutual interaction is between hydrodynamic and
elastic forces only. "Dynamic hydroelasticity" is concerned
with ~henomena involving mutual interaction among inertial,
elaStic, and hydrodynamic forces, Fig. 2.1.
While there are many similarities between aeroelasticity
and hydroelastici~y,- differences between the two also exist.
First, hydroelasticity may include the effect of a free surface,
the interface between two fluid ~edia. Such a surface is not
present in aeroelastic phenomena. Secondly, the possibility
of cavitation exists in hydroelasticity but not in aero-
elasticity. Thirdly, the significance of the added,mass which
IS usually negligible in aeroelasticity is of great importance
in hydroelastic phenomena.
Interest in flow-induced vibr~tions arises. primarily
because of the possibility of damage or disastrous failur~ [9).-
\
u
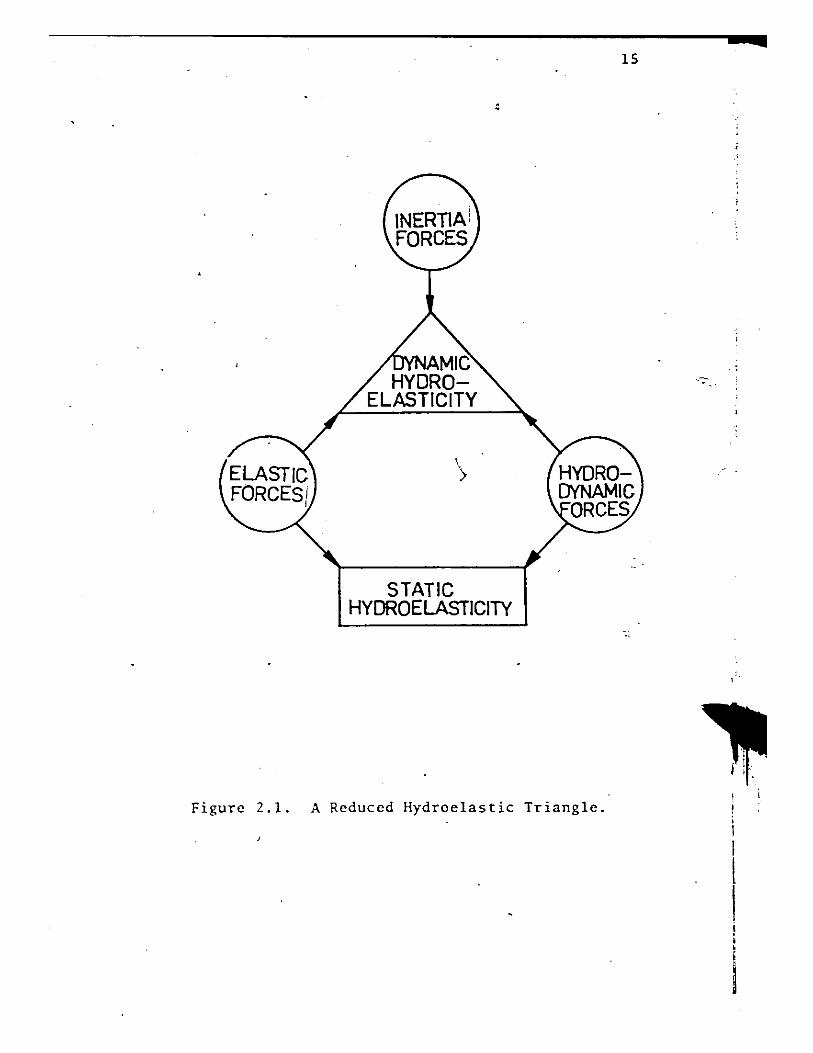
STATIC HYDROELASTICITY
Figure 2.1. A Reduced Hydroelastic Triangle.
IS
I
I , I I l I ! • • t
I
<

16
An equally important reason in many cases is that undesirable
noise levels 'are sometimes produced. This occurs, for example,
in the case of propeller blades which can "sirrg" in water owing
to high-frequency vibrations induced by vortex shedding, [25].
Research efforts in the field of flow-induced ~
" structural vibrations have yielded abundant data on specific
vibration problems encountered with structures in service and
some of the cut and-try measures used to improve design, [16],
[17], [18],. [19]. Other ~esults in the literature illustrate
the dynamic behaviour of highly idealized structures, [13],
[14], [20], [25]. However, relatively little has been done
to synthesize the accumulated information. The multitude
of geometric and dynamic parameters as well as- the complexity
of the phenomena involved seem to have discouraged the search
for a common conceptual frame-work.
Relatively few papers have been devoted to developing
an understanding of ~he mechanism of the vibration excitation
although there have been a few recent-attempts to remedy this
situation, [21], [22J, [23], [24]. In design-oriented research,
the objective has usually been the solution of some immediate
and specific problems. But without proper understanding of the
basic flow features and mechanisms, a detailed knowledge of
specific or idealized vibration problems is of little help
to an engineer whose job is to design a structure that will
safely withstand flow-induced forces.
c
1.
;
I I I ; i
I
17
2.2 Classifications ~f Flow-Induced Vibrations
Flow-induced structural vibrations may be classi
fied as one of th,r"types:' (a) Forced vibrations induced
by turbulence irt'the flow; (b) Self-controlled vi~rations
induced by flow periodicity, and (c) Self-excited vibrations
induced by a fluid-elastic\phenomenon.
Structural motion induced by turbulence ·in the flow
is usually of a random nature and is called "forced" since the
motion of the structure usually has no appreciable effect on
the fluid forces. This cl'lss cf.proble:ns usually does not
represent a source of great concern to designers since the
analysis of these problems is relatively straight-forward.
In the case of selfcc~ntrolled vibrations, some
periodicity already exists in the flow field (26). If this
periodicity coincides with one.of·the natural frequencies of
the structure, the amplitude of vibration builds up to the . I .
point where the magnitude and frequency of the fluid forces
are now controlled by the structural motion. A dynamic feed-
back mechanism develops. Two.possibilities exist for preventc
ing such vibration or severely limiting its amplitude -
either the addition of stiffening and damping to the
structure, or some geome~ry change which eli~inates the
original periodicity in the flow. I.
In self-excited vibration problems, the motion of
structure creates the periodic forces which ampLify the " structural motion. These vibrations are different from self-
controlled vibrations in that the periodic forces disappear
,.
Ii I; I! I> I.
i , . i
, , I. , ' :',
18
in the absence of structural motion. For this class of
problems, a change in structural geometry may be the only
effective means of p~eventing destructive vibrations.
Both self-controlled and self-excited vibrations
are termed fluid-elastic vibrations (aeroelastic or hydro-
elastic) since they involve mutual interactions of elastic,
inertial and fluid-dynamic forces.
" In a recent paper, Naudascher (231, sugzested a
class~fication of the tomplex flow phenomena, and defined . ,
~he "basic control ::lechanislns", underlying all nOli-induced
vibrations arising from shear-layer instabilities. Asserting
that "most flow-induced vibrations can be traced to an
{nstab~lity of the flow", he demonstrated that the most common
.flow instabilities associated with shear layers result in
random flow fluctuations when they aTe combined with random
disturbances at higher-than-critical Reynolds numbers. 'only "'-
when these disturbances (and the fluctuations of velocity
and pressure which they generate) become modified by means
of control mechanisms can the inevitable trend toward
disorder (turbulence) be diminished or delayed. These control
mechanisms may b~external (periodic finite-amplitude .~
disturbance, imposed from outside the flO\; system) or interna:l
(regular, self-generated disturbance, resulting from the inter-
action of the flow with i.ts boundaries). Internal control
mechanisms represent the important form of control regarding
flO\;- induced exc i tation. Here, a distinction exists between
phenomena involving rigid flow boundaries and those involving
: j
19
... ; ~~--,;-". -....
"e'ia:stic'or elastically-restrained flow boundaries. In these
cases the control mechanisms are termed fluid-dynamic a~d
fluid-elastic, respectively. Both fluid-dynamic and fluid
elastic control mechanisms are described in terms of feedback
mechanisms.
The simplest feedback mechanism is the fluid'-dynamic
control in which velocity and pressure fluctuations caused
by some disturbance are amplified as they are convected down
str~am; they interact with the rigid boundaries of the flow
field, giving rise to new disturbances which, when transmitted
back to the origin of the shear layer, will trigger the
development of new fluctuations. However, fluid-elastic
resonance is significantly more complex: physically, because
energy transfer from the flow to the structural motion takes
place as well as energy transfer from the basic to the
fluctuating components of the flow; analytically, because the
dynamic characteristics of the structure are needed in
addition to the flow parameters for describing the flow.
In a later' paper, Naudascher anq Locher [24] showed
that the flow past· a protruding\wall without flo~ re
attachment is highly sensitive to fluid-elastic control. They
concluded that flow- induced structural vibrations in this
case can only be determined by a detailed study of the complete
system including the dynamic characteristics of the structure.
2.3 Use of Mathematical Models
Because the mechanisms of many hydroelastic phen-
omena are not yet fully understood, difficulties have been
.:.
i ,
20
encountered in trying to model them mathematically. Tile
e~sence'of most structural. vibrqtions induced by fluid flow
is that structural deformation and fluid-dynamic loadi~g are
interdependent. The general mathematical approach to the
" analysis of the vibrations consists of the determination of
the so-called structural operators, inertial operators and
fluid-dynamic operators. Weaver [32J, [26J has shown that the
energy transfer from the fluid to the structure is the result
of nonconservative hydrodynamic forces which manifest them-
selves in the form of no~-sclf-adjoint operators in the
differential equation of motion~ The solutions to these
special o:lass of mathematical problems exhibit tliQ unique
characteristics. First, such equations admit complex
eigenvalues or, in physical terms, oscillatory types of instability.
Secondly, the eigenvectors are generally not the normal modes
of free v~bration but coupled modes which do not satisfy the
usual orthogonality conditions. It is therefore quite clear
that, regardless of the specific'mechanism of instability
involved, hydroelastic problems form a class which is distinct
from free and forced vibration, and conservative stability
problems.
It is pertinent to add that the mathemaXics needed
to deal \;ith these pr9blems is still being developed [~IJ.
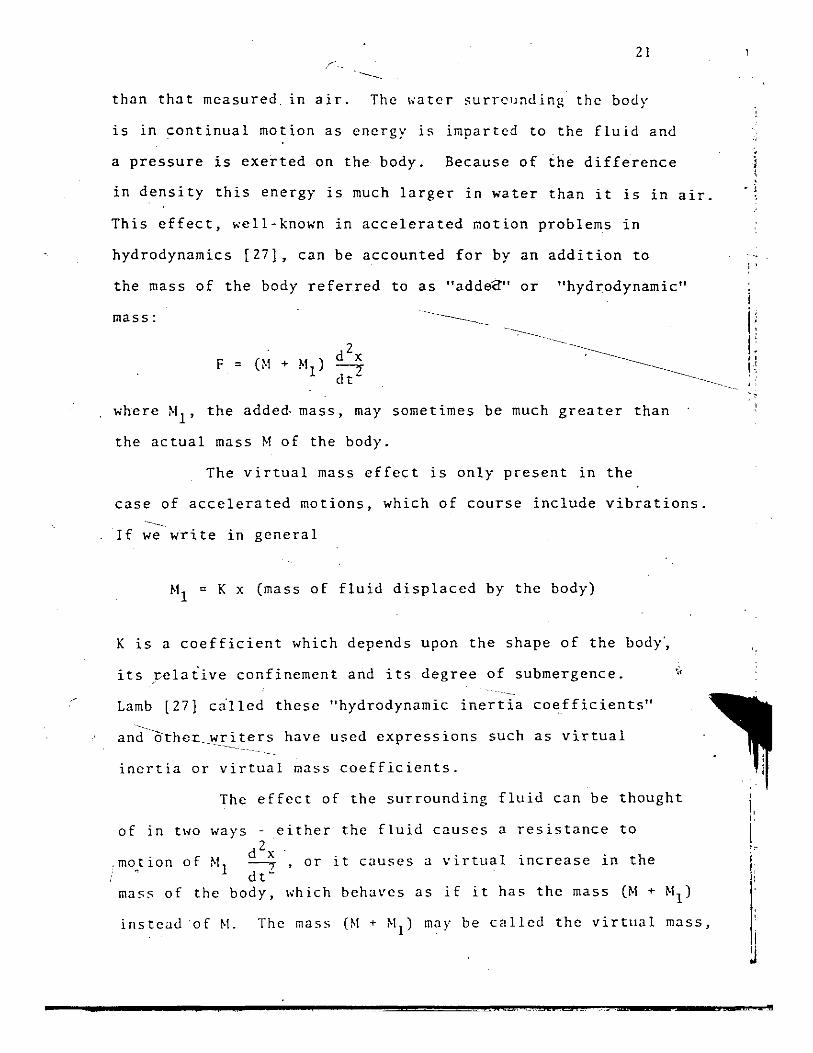
z . 4 Virtual ~Iass of Submerged Structures
When a vibrating body is immersed in water, its
natllral frequency is reduced to a value considerably lower
i'
;
I I
21
than that measured. in air. The ~ater surrcI,nding the body
is in continual motion as energy is imparted to the fluid and
a pressure is exerted on the body. Because of the difference
in density this energy is much larger in water than it is in air. .,
This effect, well-known in accelerated motion problems in
hydrodynamics [27], can be accounted for by an addition to
the mass of the body referred to as "addoo" or "hydrodynamic"
mass:
F = (~1 +
where MI , the added mass, may sometimes be much greater than
the actual mass M of the body.
The virtual mass effect IS only present in the
case of accelerated motions, which of course include vibrations.
If we write in general
Ml = K x (mass of fluid displaced by the body)
K is a coefficient which depends upon the shape of the body~
its relative confinement and its degree of submergence. , ----~
Lamb [27] called these "hydrodynamic inertia coefficients"
and---othel:_writers have used expressions such as virtual -----
------- --
inertia or virtual mass coefficients.
The effect of the surrounding fluid can be thought
of in two ways - either the fluid causes a resistance to 2 .
,motion of ~11 ~,or it causes a '"irtual increase in the dt-
mass of the body, ~hich behaves as if it has the mass (M + MI )
instead of M. The mass (M + MI ) may be called the virtual mass,
-
: '
i I: L I' I~ , .
I:
I
1, I,
I , -
J
22
whil~ ~II is ·the "added virtual mass".
A considerable amount of experimental work has
been carried out on the added mass of beams vibrating jn
water, [27), [28), [29), [30). Moullin et a1. [28) carried
out exhaustive experiments over a period of years o~ the
vibration of beams in water. They found that the added mass
was not dependent to any great extent upon the mode of vibration
or the frequency. This finding has recently been confirmed
by Blake [29). However Todd [30) has shown that flexural
mode shapes may be affected by three-dimensional flow around
the ends of relatively short beam-like bodies because of
the subsequent redistribution of effective"mass. F~r more ~
difficult geometries it may be necessary to determine the
added mass experimentally.
Todd [30) discusses in his book an extensive review
of research on added mass effects, especially res~lts concern-
ing amplitude, frequency, submergence, and relative confinement.
When a ship moves from deep to shallow water her vibration
characteristics change, the natural frequencies being lowered.
If a natural frequency in deep water is just above that of
some periodic disturbing"fo;ce in engi~es, propeller or
,auxiliaries, resonant vibrations may result when she moves
,over shallow water. This reduction in natural frequency is
due to an increase in the added virtual mass in the presence of
restricting boundaries.
When the confining surfaces are within about two
characteristic dimensions of the vibrating hody, the added
a
.1 I ~
I!
• 23
( mass increases considerably a d values froc! five to ten or more
;, , "
are not unusual. The importance of this in lowering the " 0 •
• nafural frequency is demonstrated by the problems encountered
in trying to reduce the vibrations of hollow-cone valves
[~l]. An attempt t9 stiffen the valve by increasing the ",
nU.l)lber of vanes from four-· to six resul ted in an increase in
confinement of the fluia-between the vanes \Vhich more than
offset the increase in stiffness. The natural freAuency was
lowered rather than increased, and the vibration amplitude
\'.3.5 incrc:]scd.
For ship hull vibrations, t~e added mass does not
depend to any great extent on the mode of vibration or the
frequency. This result appears to be generally applicable as ."
long as the amplitudes are small - of the order of about five . . percent of a charac~eri~tic dimension of the structure. As
the amplitude is inc'teased, the add~d.mass becomes both
amplitude and frequency dependent [32]. It is still not clear,
howevet, that added mass always in~reases with frequency at
large amplitudes.
" 2.5 Vibrations of Hydraulic Gates and Valves r
The physical situations in which flow-induced:
vibrations a~ise are so diverse that·it is impossible to cover, , I
all known cases in the course of a brief survey. In fact, in
the last two years, two different symposia have been organized
solely on ElOlo/-induced structural vibrations, [33], [34]. The
purpose of this secti~n is.to briefly review current knowledge
•
\ .
24
related tp vibrations of flow-control structures such as
hydraulic gates and valves by critically evaluating the
existing literature.
Violent chattering of household taps when.'Cnearly
fully closed has been experienced by most people occaiionally.
Such self-excited vibrations have also been encountered with
sink and bathtub plugs\of particular designs when operating
nearly fullY closed. Although these phenomena have been
experienced for many years, to the author's knowledge only
one paper, that of Weaver, Kouwen and ~ansour [SO], has given
a lead towards develuping an adequate explanation of the
mechanism of excitation of these vibration~. \7;'
While the .
vibrations subside on full opening of these devices or closing
them compl~tely, and failure very rarely occurs, the unpleasant \
noise generated is a source of nuisance.
Various papers have reported on vibration problems
encountered with hydraulic structures in service and the cut
and try methods by which partial orc.omple-te solutions to these
problems have been attained. [16],
[ 56] . In none of these papers has
[18]; [53], [54], [55], \ \
a clearly defined mechanism
of the vibration excitation emerged. However~ in the last tw6 "
years a fel; papers have appeared in -the literature attempting
to foster. a better understanding of the various phenomena.
Abelev and Dolnikov [52] classified the self-excited
vibrations of hjd~aulic gates into two basic categories.
The first category involves vertical vi~ratrons due to the kind
of unstable flow reattachmerit when vortex formation in the
.;
I '. I . ~-
• . . ../'
-
,
.. • 25
"ake past the gate IS synchroni=ed hi;:h :'nJ cClntrolled hy the
gate motion. This they called the "eddy mechanism of
excitation".
The second category involves self-excitation which
may res~t'from high velocities of the jet-flow directe~ along
the vertical face of the gate. This they termed the "jet-
flOl; mechal)ism of excitation". This simplified classification
is useful only in so far as 'it may serve as a background against
which various problems reported in the literature Tay be
exaraineJ.
Among the flow features which playa significant
part in the excitation of structural vibrations are those /
involving flow separation and reattachment. Whene~er flow
separates from a boundary, a free shear layer is produced.
At certain critical values qf the Reynolds number,any lateral
perturbation of the ~nstable shear layer causes the la;er
to roll up into vortices which grow in size as they move
downstream.
vibration of
\~hen theJj1eral perturbations
the solid boundary on which the
result from
separation point
is located, a regular two-dimensional vortex train'with a
frequency of formation equai ,to that of the solid boundary
is produced. ~audascher and Locher [24] discussed three
possible cases of flow separation from a protruding boundary,
such 3S a gate; ei) the case of no subsequent reattachment
of the free shear layer, (ii) the case of an unstable
reattachment and (iii) ,the case ofa stable reattachment.
In the case of no reattachment, increased excitation
: .. ;'
results from gate ~ibration. The frequency of vortex formation
..,
"
, I
I
-----------------------------. .. 27
gate during thc ~ibration re~3in5 ~irtllallv unchanoed and , ' 0
that thc mution is sir.lple harinanic. Ho/cl'cr, during operation '/ '
at very small gate openings, ~ibrations lead to repeated
openiqg and closing of the gate. In such cases the flow is
very unsteady, thc fluid ~elocity being zero during a fraction •
of 'the cycle of vibration. Thus Hardwick'~ explanation is
not valid for the case where closure occurs during the cycle.
Stible fl~w reattachment will occur for large gate .
widths. This case is of little interest because the massive-
fluctuating forces. All the cases 50 far discussed ~ay be
put into the classification "eddy mechanism of excitation" as
defined by Abele~ and Dolnikov [52];
These writers' classification "jet-flow mechanism,of
excitation" was used to describe conditions when I;ater flows
o~er a partially open gate which is provided with a skimmer
wall. Flo~ between ,the g~te and its skimmer wall' occurs as a
high velocity jet which lowers the pressure in the gap so that
the gate is drawn towards the wall. This reduces the discharge
through the gap, setting up inertia pressures which force the
gate away from the wall. The resulting horizontal gate
vibrations are thus clearly self-excited. The seal problems
H',ported ,by Schmidgall [161 and by Chepajkin and Lyssenko [22)
as I.;ell as the "chattering" of valves and sink stoppers dis-
cussed earlier are p~enomenologically similar and are related
to the "jet- flol; mechanism".
In n recent paper, Chepajkin and Lysienko [22]
attempted a positi~e idcntification of the physical mechanism"
I / 28
of self-excited oscillations of gate seals.
negle'cted the large variations in mean >,fluid velocities in
the gap between seal and sill during the \'ibration cycle.
Large variations do occur in the discharge coefficient as . ,
the gap is alternately closed and opened during the vibration.
This fact was demons.!T:ated in the paper by \I'eaver et a1. [SO).
Thus, the larger propor~ion of the energy transferred from the
flow to the vibrating structure may in fact result from the
hysteretic effect of the diffe:'cnt flow velocities during
closing and opening as well as inertia pressures generated
from acceleration and deceleration of the flow past the closure
device (whether it be seal, gate or valve). Hence Chepajkin
and Lyssenko's theoretical development based on small simple
harmonic motions and negative damping appears incapable of
accounting for the flow phenomenon. which must occur during a
cycle which involves closure.
Abelev and Dolnikov [52) in their mathematical
model for the jet-flow mechanism assumed a simple linear
variation in discharge whlch again reduces to a negatively
damped simple harmonic oscillator. Such a model is reasonable
as long as the amplitudes are small and no closure occurs
which causes a rapid reduction in discharge. It seems quite
cle~r that the problem being considered in this thesis is
most closely related to this phenomenon.
The only paper appearing in the literature which
seems to appreciate the importance of the large variation
In discharge is that of Weaver, Kouwen and Mansour [SO].
-
29
~lo~e~crJ the discussion prc~cntcd is qualitative only, being
based on preliminarv experiments to determine the static
discharge characteristics. It remains to establish through
dynamic experiments and flow visualization the exact nature
of these phenomena when oscillations involve closure.
.~ ..

~----------------------------~--.
CHAPTER 3
EXPERINE~TAL APPARATUS
3.1 Introduction
In many problems of applied fluid dynamics there
are situations in which it is difficult to picture the exact
nature of the flow field. In the planning for this research
programme the need for flow visualization was recognized
early. For studying complicated time-dependent flows,
investigators have employed visual methods to observe the
general qualitative features of complex flow patterns, and to
determille the limits of flow reglmes. Among the earliest
examples are the work of Osborne Reynolds (1883), [36J on
transition to turbulent flows,and the studies of L. Prandtl
and co-workers (1926), [37J on production of vortices down-
stream of a stationary cylinder.
In order to observe the flow of transparent fluids,
the usual procedure is to observe the motion of tracer
particles that are placed in the fluid. For successful
visualization these tracers should contrast sharply with the
background. In addition itis desirable to be able to control
both the concentration and the position of the tracers. The
method used in this thesis involved suspending tracer particles /
th·roughout the fluid medium and illuminating only the region of
in teres t.
30
...•. ~:
...
31
This suggested the design and construction of a
tl;o-dimensional model of the prototype check valve_ il.s the
valve behaviour is dependent on the maximum pressure
difference across the valve, some means of pressure control is
also necessary. This chapter describes the development of
.the model, and the instrumentation used for the required
measurement.
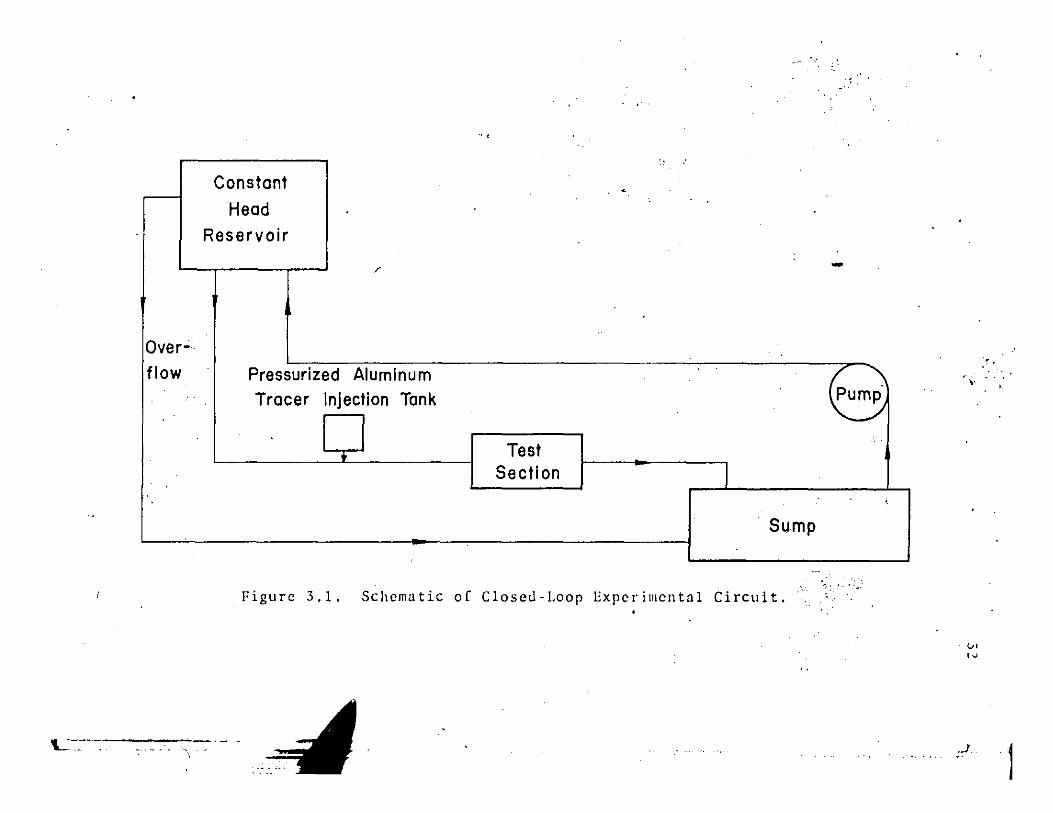
3.2 Experimental Circuit ,
The main parts of the experimental circuit are shown
in Figs_ 3.1 and 3.2. The required pres$ure" control could be
obta ined us ing the exis t ing cons tant- head \<a te"r tank and its
associated equipment. This tank provides a head of 11 feet of
water and a capacity of about 900 gallons. A six-inch diameter
stee\ pipeline was laid and connected to, the constant head
reservoir and a gate valve was used to regulate discharge.
Water was discharged through the test section into an under
ground' reservoir from where the water was recirculated through
the high level tank by a centrifugal pump. The overflow from
the constant-head tank was discharged directly into the under-
ground reservoir.
At the entrance into the pipeline from the high level
reservoir, a short cruciform, shown inset in Fig. 3.2, was
inserted to prevent the development of a vortex and hence
the suction of air into the pipeline from the free surface
of water in the tank.' Also downstream of the gate valve a
longer cruciform was inserted into the pipeline to prevent
-.,
"
d
» ,
>.
Constant <
Head .
Reservoir
/ -
Over"; -
flow Pressurized Aluminum Tracer Injection Tank Eump·
_/
Test Section
J
,
Sump
I >
. Figurc 3.1. Scllcmatic of Closed-Loop Expcrimental Circuit. "
L._ . "
,.
", '"
J
1
• . .
42"
58"
10 1/2" ,,> L
r Cruclform(36"lg) Troclr
---r-------94"
U'
Cruciform
1'- 36" --t-'-I 1 51" ,...--11 ... Tnl .--. IIclion
T S· Tl'IIIlIItfon MOtion (drcular 10 l'ICIong.)
,.
12" J..- \ !- 24" ] j.J 12" L 42" TS TS
" " 6 x9 Reolongular IIcllo,.
Fi!:ur.c 3.2. C;cllcrul View of Expcrimclltal Appuratus.
. -, -;- - ~ ..
'" '"
J "'1
34
the development of secondary flOl<s in the pipellne ..
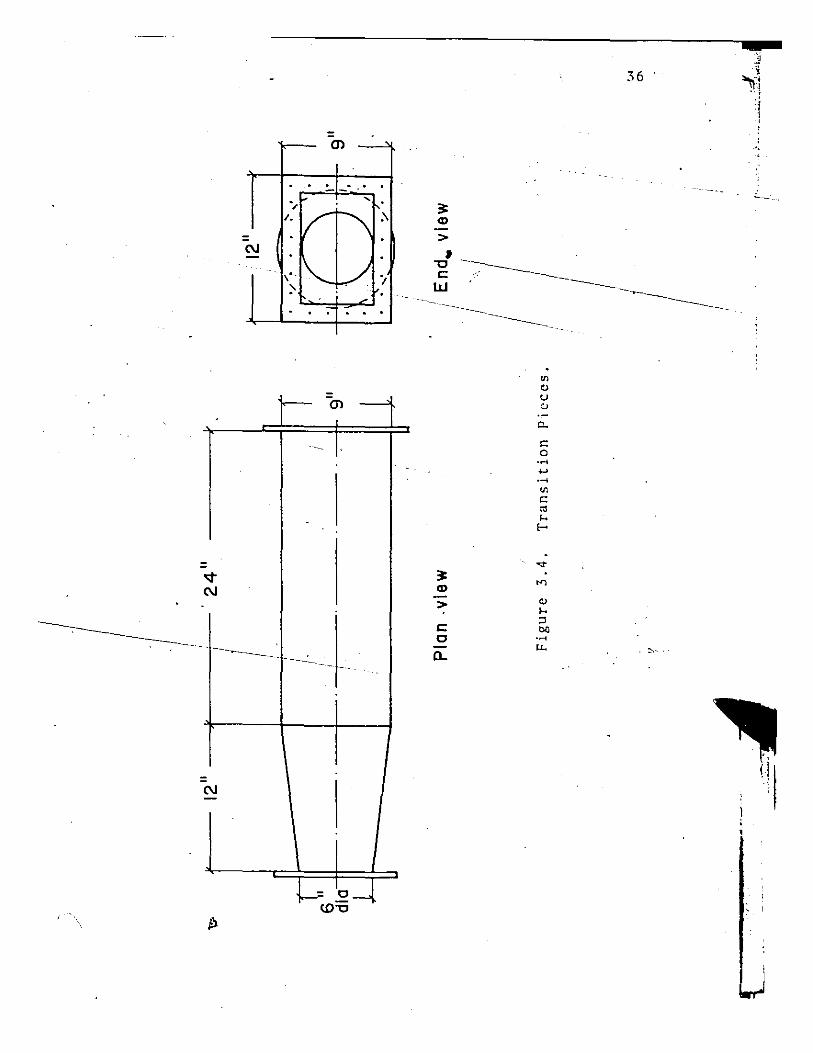
Two identical transition sections, shown in plan
view In Fig. 3.4 were used to transform the six· inch diameter
circular pipeline .cross· section into the 6" x 9" rectangular
cross· section of the test section. The cross-sectional
geometry transformation was effected over a length of 12
inches and the flow was allowed to develop over the remaining
24 inches of rectangular pipeline. This ensured that the
flow ente~ing the ~alve very closely approximated two-dimensional
flow and was free of secondary flows. A double-screen filter
was installed about 20 inches from the test section inlet to
provide a uniform turbulent flow field and also to prevent
unwanted foreign bodies from appearing in the test section
during filming. This filter could be cleaned and replaced
through a cover plate which was ~crewed to the top of the
pipeline.
At the downstream end the pipeline rises a total
of 16.5 inches as shown in Fig. 3.2. This was to provide
enough reverse hydrostatic head under no-flow conditions to
permit expulsion of air from the test section. The entire
pipeline was freely supported at a height of 17 inches above
the laboratory floor.
For flow visualization the aluminium tracer particles
were injected into the pipeline at a point 18 inches upstream
of the test-section. A transparent pressurized tank, described
elsewhere, was designed [or this purpose.
I L f
I: . ,
I
U .J
i I
I 1 .)
I ,
3S
c o .~ ..., u
'" (fJ
-
-v C\I
C\I
CTl
~ CD
>
36
1. -,~ _______ ~_ w
" ._--------------
~ CD
> c: c a..
'" <> u
"
. :-.-.
'J ";
:i 1 , ,
,',
II
37
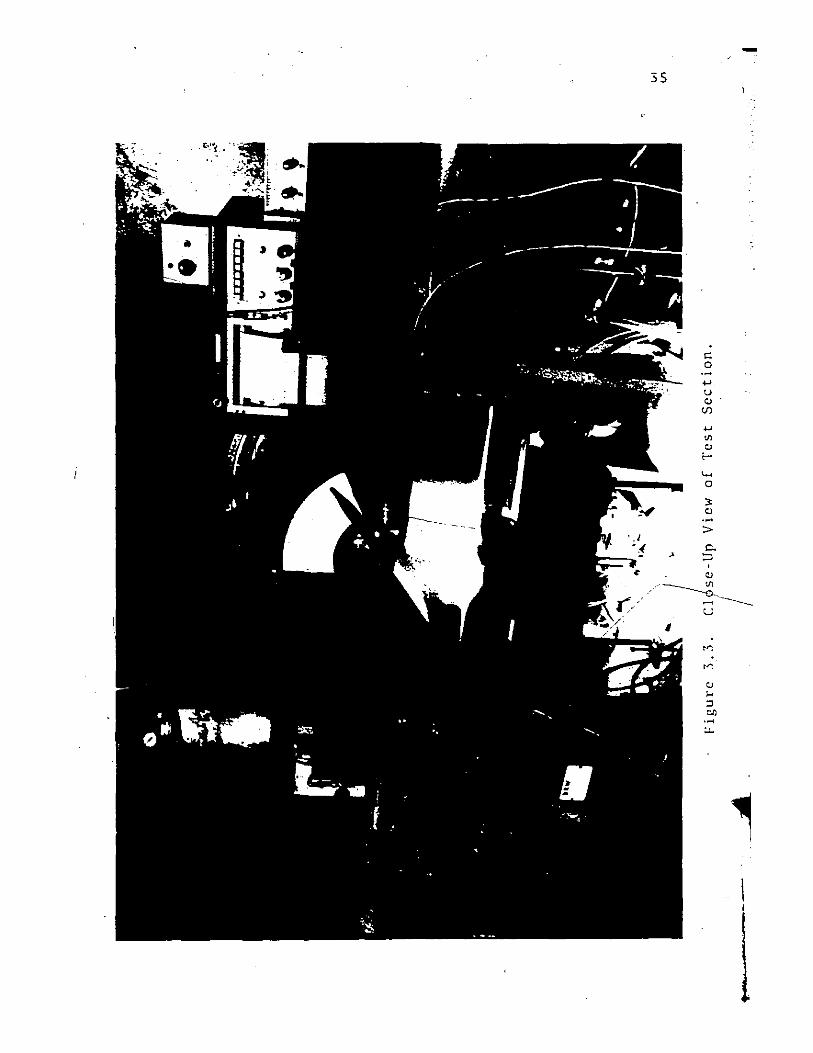
3.3 The Valve Model.
The purpose of the two-dimensional mod~l was to
permit flow visualization. It was felt that. the vibration
experienced with the prototype was not predominantly dependent
on three-dimensional fluid-flow effects. Also, the flow at the
vertical longitudinal centr~line through the valve should be
two dimensional because of symmetry. It follows that the
essential character of the dynamic instability will be preserved
in a two-dimensional model. This assUmption was justified by
,subsequent experiments in which the essential nature of the
vibration observed with the prototype valve was also observed
with its geometrically similar two-dimensional model.
It was appreciated from preliminary eXperiments on the
prototype that the relatively large mass of the disc and the
high spring rate of' its .elastic system led to very large
hydrodynamic closing loads and slamming forces. To assure
model integrity, a low-mass disc model and relatively weak
springs were therefore required. The relatively weak springs
also, meant low frequencies of vibration and large amplitudes.
Practical·considerations dictated the choice of the
6 inch diameter valve for the study although the phenomenon had
been ob~erved with larger diameter valves of the. same design.
The model was therefore a two-dimensional geometrical replica
of the 6 inch diameter prototype. The scale ratio was 1:1.
The test section width was one and a half times the diameter
of the valve. The central one sixth wa~ made transparent.
The choice of test-section width was based on making the flow
i ; .
38
through this central transparent section free from edge effects,
so that the flow.~as truly two-dimensi6nal.
The valve disc was modelled by a one-inch thick
perspeic plate, nine inches "ide b.y 7 1/8 inches .long so that
a cross-section through the model was essentially identical
to that of the prototype. The pivot shaft diameter was 7/8
inch, the same as in the prototype. The prototype swing arm
was used in the mode~ The model pivot shaft was supported
symmetrically in hlo 3 in.ch long cyl indrical brass bushings.
The prototvpe seat ring was modelled ~Y L-shaped sheet metal
pieces screwed to the seat. The pivdt shaft "as extended
4 1/2 inches at ~ither end. Three inches from one end of this
shaft a steel bar 14 inches long, 2 inches "ide and 3/4 inch
thick was welded to the shaft. Two inches from the free end of
the bar, 1 1/4 inch diameter grooves were machined to support
an assortment of compression springs. This spring arm and the
movable 7 inch long receptacle holding the compression springs
" are shown in Fig. 3.3. This receptacle is bolt~d to a one
inch thick quadrant-shaped aluminium plat~ which was itself
rigidly bolted to the laboratory floor.
At the other end of the pivot shaft a pointer was
attached to the shaft to indicate the displacement ot;(:;~he . -.. ''',
valve on a protractor attached to the body of the valve. The
protractor scale was graduated in degrees.
The ~ront and back of the model were covered "ith
3/4 inch thick perspex plate. A bleed va~ve, sho"n in Fig. 3.3,
was fitted to the bonnet to rid the valve of air bubbles "hich
I • ,
...
'39
wouldotherwisf prevent complete liquid fill,inj of the valve. ". - ·Reverse flow was simulated by se~tingthe model u~
in. the pipeline such that the flow ten~ed t6 close the valve.
3.4 Instrumentation for Dynamic Measurements
3.4.1 . Introduction
Three basic quantities were chosen for direct ,
measurement, namely the valve displacement, the dy~amic ,~. ' ~
pre_,s'ure fluctuations and i·' indication' of ,the load on the
val~~. A fourth quantity, the fiuid velocity fluctuations '"
was to be obtained or observed from streak len~ths of stream'
line patterns on the flo", visualization films. ,....
3,4.2 The Readout System •
A 12 channel Honeywel~ Visicorder Oscillograph,
model 2106 with its galvanometers driven by an Accudata 117 , ;".
mul ti-chann.el direct coupled amplif(er was chosen as the
readout system. One ·reason was its facility for the simultaneous
recording of many signals. Th~s was very i~portant in iiving
a total picture of the eve.nts taking place simultaneously at
the valve during the vibration. Another attractive feat;ure
was its ability to automatically draw time-base lines of up
to one-hundredths of a second across the ,s~nal traces, A ,. '\;..1"
third reason wa~.that, because its,"pen" is a b<2am of light
reflected from a mirror .controlled by'a galvanometer, it do~s
not suffer from t_he disadvanta&.e of poor frequency response
doc to pen inertia experienced with some cpnventional pen
.~. -. . .'
"".
, . i .
-
40
recorders. Its \·ery high frequency ~esponse (up to 13kHz) ,~
guaranteed faithful reproduction of signals as picked up by
the various transducers.
3.4.3 Valve Displacement
The design of a system for measuring valve dis-
placement during vibration presented an interesting challenge.
These ~ibrations are of rather large amplitudes and low,
freque~cies. Impact of the valve disc on the seat was involved
arid the.re was a substantial fraction of the period of vibration , /"
Juring which the ¥al¥c remained closed. It was highly desirable
to have a cleirly defined'point of closure of the valve as well
as a sharply marke~ point of departure of the disc from its seat.
A capacitive displacement probe was chosen principally
because of its excellent frequency response, its reliability
in terms of' repeatability of results and its availabili~y.
A transducing system for converting purely angular rotation of
the pivot shaft into straIght line motion of a detector rod, , ,
was designed as shown in Fig. 3.5. An eccentric collar was
rigidly attached to the pi¥ot shaft by a number of set-screws.
A spring-loaded detector rod picked up the rotation of this
e~"centric collar and con¥erted it 'into straight line axial
motion. Contact between detector rod and eccentri'c collar
was maint~ined through a steel ball bearing. ,
The MCI capacitive probe was used to monitor the
motion of the detector rod. The signal was amplified uslng
a Wayne Kerr'Vibration/Distance meter, model B731B, filtered
and fed into the Visicorder. This dbrat'io"n meter is a
I 1/4"
41·
Eccentric collar (e=O.l5")
~I Compression spring
Steel
718''c!ia
318''c!ia
1/4" dia, steel rod with collar
Me1 (capacitive probe)
Housing fixed relative to probe a shaft centreline
Figure 3.5. Transducing System for Measuring Valve Displacement During Vibration. . .
. ,
4 C 1
I' .
42
portable instrumen* for the accurate measurement of distance
and vibration amplitude from 50 micro inches to 100 thousa~ths
of an inch over the frequency range 1 Hz to 10 kHz. This
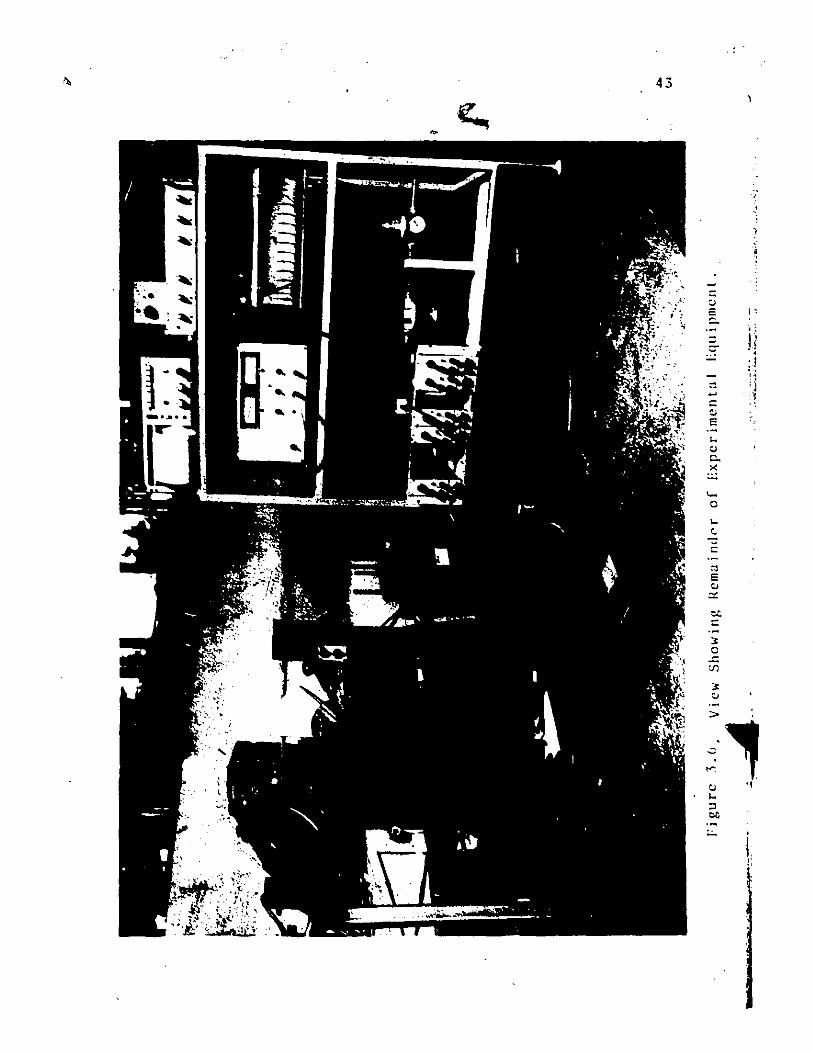
system is shown in parts in Figs. 3.3, 3.5 and 3.6. The low
pass filter (Wayne-Kerr model F73lA) had a cut-off frequency
of 100 kHz. Its purpose was to remove ripple voltage resulting
from higher order harmonics of the modulated 50 kHz signal
which'was the output from the distance socket of the amplifier.
This transducer was calibrated by noting the pen ) .
deflection on the 'Visicorder cscillograph for angular displace-
ments measured on the protractor. It was found that de~ector
rod displacement varied linearly with angUlar displacement of
the valve.
3.4.4 Hydrodynamic Torque
An indication of the variation of the hydrodynamic
load.on the valve was obtained by using a piezo-electric load
cell to detect the variation in the compressive force in the
springs. The load cell is a force transducer, its purpose
being to convert a mechanical force into an electrostatic
charge signal which can be transformed in a charge amplifier
to an electr.ic output voltage and transmitted to a recording
device. A Kistler quartz load cell Type 903A having a resbnant
frequency of 60 kHz "as used for" the experiments. It ,,,as
installed in a groove machined into the spring supports.
Its sensitivity having been matched to the charge
amplifier, it "as calihrated hy applying accurately known loads
• • 1 ~
,
43
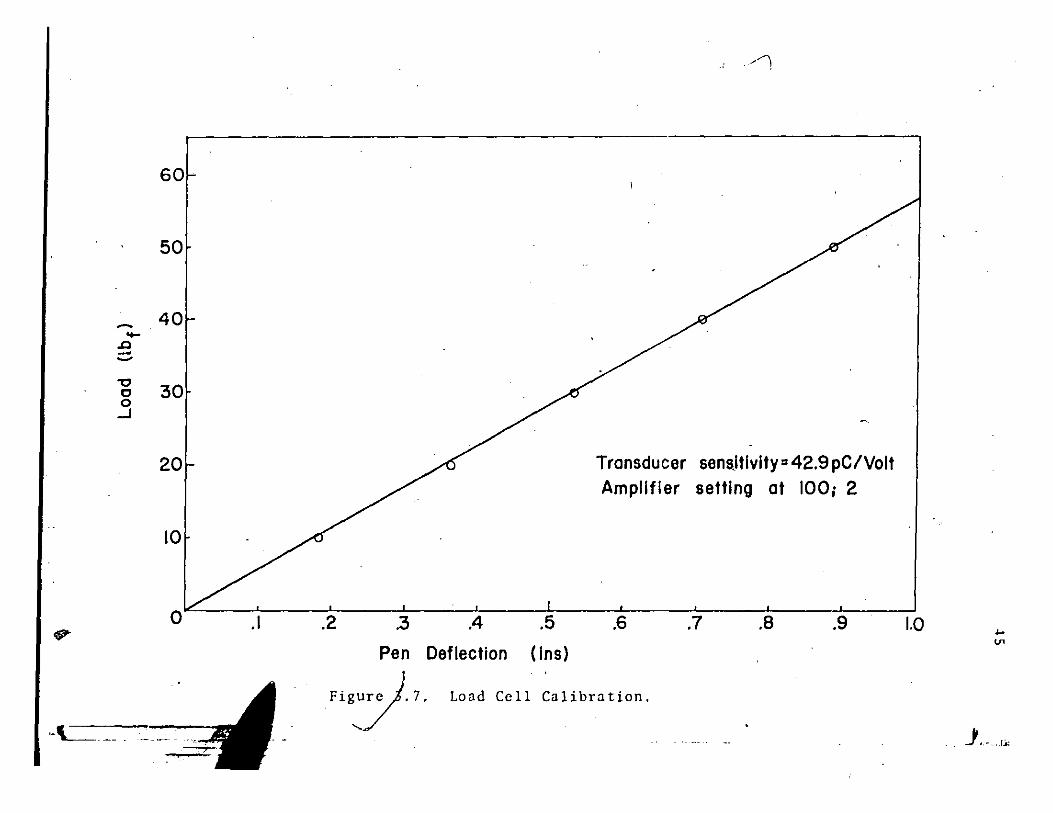
E ::..
=
'o
:::
" E
" :::::
:::
:. o
UJ
:. " >
"
:, " " ...
:l ot

-44
on the transducer and measuring the pen deflection on the
Visicorder corresponding to these loads. The ~alibration
curve is shown in Fig. 3.7.
3.4.S Pressare
It was desired to measure the upstream and downstream
pressures in order to determine the effective pressure ••
difference across the valve at any instant during the vibration.
Two''home-made''strain-gauge type diaphragm pressure transducers
using a Hewlett-Packard Carrier Preamplifier model 880SA for
bridge-excitation and signal-modulation were available at the
beginning of the experiments. Almost immediately, problems
were encountered over the presence in the modulated signal, of , 60 Hz line frequency noise. Although the ideal filter to use
in such cases is a narrow band-reject filter, the prohibitive
cost of such a unit led to the decision to use a low-pass
filter (cut-off frequency, 60 Hz) of cheap cons~ruction. ,~
Pressure wave shape was preserved in each case but four
undesirable effects were noticed during analysis of the results.
First, there was a distortion of signal rise time; secondly,
a frequency-dependent phase shift made results computed for
instantaneous values of pressure difference across the valve
from the two different transducet-s inaccurate. Thirdly, the
signals were severely attenuated an~ finally, there was the
inevitable suppress~on of components-of the signal of
frequencies higher than about IS Hz. The difficulties led to
the search for a different pressure transducer.
-
~ ..... .Ll -~
60
50
40
-g 30
v
o ...J
~,-- .
20
10
a .1 .2 .3
Pen
Fig:). 7.
.4 .5 Deflection ( Ins)
/1
Transducer senaltlvlty = 42.9 pC/Volt Amplifier setting at 100i 2
.6 .7 .8 .9
Load Cell Calibration.
1.0 ..... '"
. . Y ... J:.
46
The pressure transducer used for the final results was
a variable reluctance pressure transducer made by Whittaker
Corporation, model P7. It was operated with the PAC model
CD25 meter readout type carrier system. The
transducer indicator was flat to 1000 Hz, and the n ural fre
quency of the stainless steel diaphragm was 14 kHz. It was
found that there was no need to filter the outp t signal
because the excitation frequency was quite high, of the order
of 1000 Hz to 3000 Hz. ,
This transducer was used both as a single pressure
transducer and as a differential pressure transducer. Measure·
ments were taken very close to the point of valve action thus
permitting the use of short connection lines. Excellent
results were obtained with this pressure transducer.
The transducer was calibrated by applying known
pressures and measuring the signal tracers corresponding to
these pressures on the Visicorder oscillograph. The rated
transducer linearity was: 1/2\.
3.5 Flow Visualization
3.5.1 Flow Visualization in Water: Brief Review of Technigues
Many techniques have been developed for the
visualization of water flow. Methods of indicating flow
patterrys may be broadly classified into two groups: static
methods those applied to bound~ry surfaces; and kinetic
methods those applied in the fluid itself, either in the
stream or in the boundary layer. Static methods illustrate
(} 47
. the pattern of'velocity gradient and therefore of shear stress
at a solid boundary and may involve tne deposition of solids
or liquids on the bouri~~ry surfaces. Kinetic methods may be
used to investigate the flow in either a boundary layer or in
the main stream itself, and generally involve injecting tracer
material into the fluid. Care is necessary to ensure that
neither the tracers nor the injection tubes modify the flow in
the boundary layer because interferen~e with the flow pattern
may render incorrect, deductions based on it. Injecting
tracers into the main stream is less cr~ical.
For quantitative results and those from which time
dependent flow characteristics are to be deduced, kinetic
techniques must be used. The oldest of these, applicable to
flow in an open channel consists of scattering on the liquid
surface a light powder (such as aluminium or lycopodium) and
illuminating the particles. Morris a~Jd Haythornthwaite' [38]
used the technique to illustrate two-dimensional flow into a
model of a compressor intake and improved a poor pressure dis
tribution there directly as a result of their observations.
Difficulties assoc~ated with a free surface may be resolved
by submerging the model and introducing tracers below the free
surface. Highly reflective particles in suspension may be
illuminated from an intense light source through a narrow slit
approximately parallel to the main flow. The flow may then be
examined by viewing the illuminated "slice" along a direction
approximately perpendicular to it. Such an aqueous suspensio:l
is readily made from small spherical particles of aluminium
which have first been wetted with alcohol. Chester, Halliday
( 48
and Howes [~7] show in their hook that aluminium particles
ShOk ~Q. particular advantage in a channel of rectangular
section because t"he angle of optimum reflection is about 900
to, the incoming light. Where the main flow is horizontal
and the slit is vertical the par~icles may be viewed from the
side without significant optical distortion of th.e flow pattern. ,
The method is well suited to photography and accurate results
are obtainable if th* specific gravity of the tracers is close
to unity.
is that
spheres
A drawback to the prolonged use of aluminium particles
Jhey soon become tarnished by an oxide film. Small
hf polystyrene were successfully used by, among others,
McEachern and Bowker [39] and Winter [40]. Winter and a number
of other workers also. experimented on a limited scale with air
bubbles as tracers. It was found that optically, air bubbles
are unsatisfactory because they reflect incident light only
slightly. The ideal angle of r~flection is 900 because tracers
may then be viewed in a dir~ction normal to the incident beam
and distortion of the flow pattern by opti~al refraction is
eliminated. An even more serious drawback to air bubbles is
their low density.
In general the velocity at any point of a two
dimensional flow field can be determined from a photograph of
the pattern made by the tracers provided the exposure time is
In steady two-dimensional flow a qualitative indication
of the streamline pattern can be obtained by allowing a fairly.
long exposure.
\ 1
: , I ; • < I ,
n
•
49
For many years injecting streak3 of dyes has heen
a popular method of introducing discrete tracer filamenrs into
a fluid stream. The technique is especially useful in water
tunnels where the flow around a model at various depths can •
be indicated. A critical drawback, -however, is the disturbance
of the flow caused by the tubes which dispense the dye. The
'method, moreover, is unsuitable for highly turbulent flow
because dye filaments are then rapidly ,dispersed and broken up.
A further drawback to using dye filaments in closed water
circuits is that the dye is recirculated and increasingly
contaminates the water. In short runs this may not seriously
affect the clarity of observation but for l'nger runs the
contamination may be enough to render the new dye filaments
indistingui~hable from the hulk fluid. Dye filaments cannot
be pulsed accurately enough to give direct velocity measure
ments. The use of dyes is therefore better confined to
boundary layer work or steady flows with low turbulence.
The hydrogen bubble technique, appirently first used
by Geller [41] to study low-speed water flow through a duct,
has been improved upon by a host of other Iwrkers, notably
Clutter, Smith and Brazier [42]. These workers developed the
techniqlle of using a crimped cathode to generate well-defined
filaments of bubbles_ The bubbles arc generated from the whole
.of the wire hut if the apexes arc closely spaced the bubbles
arc swept towards the apexe~ before he~~g shed into the flow.
By pulsing the supply to the cathode they.determined the main
stream velocity about an airfoil from photographs showing rows
so
of bubbles released from the cathode at known intervals of
time. With sufficient power input, the hydrogen-bubble tech
nique is not restricted to low velocities. Illumination
of the bubbles is fairly critical. They are best seen against
a dark background and Clayton and Massey [43] as well as
Schraub et al. [44] discovered that a parallel beam of light
should be so positioned that the light is deviated through
'bout 65 0 into the viewing direction.
The principal objection to the method lies in the
difference between the densities of bubbles and water. However,
the bubbles are usually small enough for their rate of rise to
be only a small proportion of the main-stream velocity of the
water.
For reasons of space, only the principal methods
of flow visualization in water have been briefly discussed
h.ere. A discussion of techniques not mentioned here as well
as an extensive bibliography, is contained in References
[ 4 2], [ 4 3] and [45].
The purpose of the flow visualization in the present
work was to give a clear picture of the nature of the unsteady
flow field during the vibration process. It was also desired
to obtain a good idea of the fluid and valve disc ve~ocity
variations.
Aluminium tracer injection was chosen over all other
methods for this work because of a nu~ber of outstanding
advantages it possesses over the other prin~ipal methods, given
the aim~ and conditions of the present experiment. It is
r
51
relatively simple to inject enough aluminium tracers into the . ,
closed circuit system to keep the quality of the cine-photo-,
graphy reasonably constant from test to test. The aluminium
tracers also possess the optimum light reflecting angle of 90 0•
~Ioreover. it was believed that aluminium tracer injection offered
the least expensive a'nd most easily controlled of all the
techniques 'considered. Finally, previous experienc~ by other
workers had shown that excellent photography was possible
with this method.
3.5.2 The Optical Arrangement --
The most successful lighting for photographing flow
lines beneath the water surfac~ is a thin slit of intense light
that illuminates only the flow region of in~erest. Financial
considerations called for the design of -a'71'i'l:h-ting system - - ..
which was both simple and inexpensive. The type of lighting
required for the pho·tography contemplated had to be a narrow . . "
vertical plane beam ~t least 12 i~ches long. This ~illed for
eithe.r a long pencil-thin sourc;e of-light "capable of being
focussed Id th a parabol ic reflector, 01: a series of point
sources arranged in' a straight line.. A survey of the •
intensity ana efficiency of various light. sources lias carried
out before flio al ternat.e sources were chosen. The first
system was a Westinghouse 1500 Watt, 208 Volt tungsten
halogen lam~ equipped with a parabolic polished-aluminium
reflec,tor. Its filament Ims 9 inches l6ng and the light
intensity c~lUld be ,varied liith th~, op~rating voltage. The'
second light source used wasco series arrangem~nt 0 300
..
,
I; l! Ii
\1 "
52 ,
Watt, 120 Volt K6dak Carousel projector lamps each of which was
equipped .with its aIm polished glass reflector. '~j..co,6l\n:g of both systems was carried oUJ .with a 20 inch fan. '
. ' Pr,eliminary experiments were carried out .to deter-
mine the feasibility of u.sing a cylindrical plano-convex
perspex lens to foCus the light be~m before it reached the
transparent portion of the valve-apron. Based on the result
of several expe'riments '~d previous work [46], a plano- r
I convex cylindrical lens was cut out of a 5 inch diamet~r
solid stock o( cast acrylic rod, 12 inches lO~~iS lens
was carefully polished to high transpare'ncy and proved quite
adequate.
heat from
melting.
Cooling the lens presented a real problem as the
either of the lighting systems could easily cause"
A special ~OUsing for the lens"wa-S' desikned com~lete with a 1/4 inch thick heat resistantJglass ~late 12 inches long
and 4 inches wid"e. This cut down the amount of. heat radiated ,
to the lens but unfortunately it also reduced the amount of
light reaching the lens. , j
The housing for the lens and heat-~esistant glass
was made of sheet aluminium and painted flat black to minimize '.j
reflection. Two perforated pipes ,were used to di~tribute
cooling air over the entire length of the lens. The air l /
was tapped from a 20 psi laboratory supply. Even with all these
pr~cautions, experience, showed that further care was required
to prevent the lens, from warping under the effect' of prolonged
heating, even ,at moderate temperatures. The lights w~re .
therefore turned on only when required and even then not for
.. \ It'
4
,;
I.
I /
./ 0-
5:5 ,-
--'\ prolonged periods of tIme. The optical system js shown in
Figs. 3.:5 and 3.6.
With these light so"ces the tracer particles could 'Cl be photographed at shutter speeds up to 1/1000 second depend-
• ing on aluminium particle concentration and film rating.
3.5.3 Aluminium Tracer Injection
A pressurized transparent tank was used ~o inject
the aluminium tracer into the system-upstream ~f the test
\a1\',', This inie..:tion tank "as made from 6 inch diameter . ~.
perspex piping 50 that the level_of} the tracer preparation ,
could be visually monito~ed in the course of an experi~ent.
Its design was based on calculated injection rate and
pressure which would eliminate the need for replenishing the
preparation ,during the normal course of s~ooting abo~t 100
,feet of film. Calculation showed that the tank material'
could safely withstand up to 60 psi without rupturing. 'Mowever,
there was never 'a need to operate the system above a pre-
set pressure of IS psi. A Bourdon gauge indicated' the injection
pressure and a_ safct.y-relief' valve kept this pressure constant.
This tunk is shown in Fig. 3.3.
The tracer was injected into the pip~line about
30 inches upstreum of the valve sea~. A 1/4 inch steel tube
was inserted into the celltre-top of the rectangular duct,
touching the hottom of the duct. A number \'f 3/32 inch dia
mcter holes w<,re drilled into the bottom three inches of the
dDwnstream side of this tube. A valve fitted to the outside
•
--,
,
54
~
extension of this tube controlled the rate of tracer injection.
The aluminitim powder was made into an aqueous sus-
pension by wetting a measured quantity of the powder with'
methyl alcohol and then·vigorously shaking the m~xture before
transferring it into the ihjection' tank. The tank was then
. made up to volume by addition of water-alcohol mixture.
Experience showed that the.make-up of water-alcohoi prevented
the tracers, once injected into the system, from staining
the sides of the transparent plexiglasi of the test section.
3.5.4 Photography /
Still or movie cameras were mounted on a stand i~
front of the test s~ction as shown in figs. 3.3 and 3.6.
Two different cine-cameras were procured for the
expe~iments. The first was a Hycam high-speed camera capable
of speeds raniing from 50 to 3000 frames per second full frame.
Difficulties were encountered because of the lack of a suitable
. wide-angle lens to use with this camer,a .. This resulted in the
camera having to be moved a considerable distance from the
test section to focus the lens. The light reaching the film
decreases with the distance of the camera from the object being
filmed. Thus to obtain enough light for filming at this
relatively far camera position, more concentration of tracer
was al~ays required. This resulted in streamlines of the flow
around the valve being indistinguishable from one another.
The other camera available was a Bolex Hl6 ~eflex
16mm cine-crimera capable' of speeds ranging from single frame
to 64 framel per second. It was fit~ed with a 25mm fl.1 wide-
'-'
<
'-- .
55 'r angle lens and it pro\-ed excellent for all the cine-photography
att6mpted. This camera ~as slightly modified by the installa-
tion of a microswitch and trigger circuit to synchronize the
operation of both the camera 4~d the Visicorder oscillograph.
Provision was made for boltinK the camer; to its ~tand so that - . vibrat'on of the c,amera \,'as eliminated. The camera was also
operated with a remote control s~itch to ensure camera
stability ..
Still photography was done with an Asahi-Pentax
Spotmatic 35mm single lens reflex camern. , Primarily two types of films were used although
a third type was briefly experimented with. First, for
preliminary experiments, Kodak 4-X Negative film, Type 7224
having a speed rating ,in sunlight of 400 ASA was used. This
was a very fast film ~ut it also had a disadvantage of being
,or"ather grainy;'so that the prints obtained from this film
lacked the excellent definition that was desired. For all the
permanent movies shot in these experiments, Kodak Plus-X
Negative film Type 72S1'having a speed rating in sunlight of .. . 64ASA has been used. For all sti~l photography Kodak Tri-X
Ektachrome 35mm black and ~hite film having a speed rating in
sun)ight bf 125 ASA has been used.
Special problems encountered in Cine-photography
involved the effect of fluid flow velocity and valve disc
speed on the quality oE picture obtained at different filming
speeds. At the higher framing speeds (mainly a',t Mfps, 1/180
second shutter speed) ,the film stopped both the flow and the
.;: ...
S6
disc. At low filming speeds a better flow definition was
obtained but the disc became blurred during those parts of its
oscillation where its velocity was greatest.
3.6 Determination of Spring Stiffnesses
Five different sets of compression springs were
assembled for the experiments. All had uncompressed lengths of
4 inches. Differences in spring coil diameter allowed insertion
of some into others. In this way eighteen different combina
tions could be made. The springs were arbitra.l'ily designated
as A, B, C, D and E for identification purposes.
Their stiffnesses were accurately determined on an
Instron Tester machine by plotting a load-deflection character-.;
ist·ic curve for each spring. Th.e .sl~pe of each curve yielded
the value of the individual spring stiffnesses. These curves,
shown in Fig. 3.8, indicate that.all the springs ·except E . exhibit excellent linearity even for large ~eflections. Under
• •
the influence of large loads· spring E tended to b~nd as a beam
as well as deflect axially, resulting in· larger apparent
deflections.
3.7 Experimental Procedure
A typical vibration test was carried out in the
following manner. Complete liquid filling of the pipeline
was effected by opening t~e upstream gate valve and bleeding
uir out of the system by opening the bleed valve on top of the
test section. The gate and bleed valves were then closed.
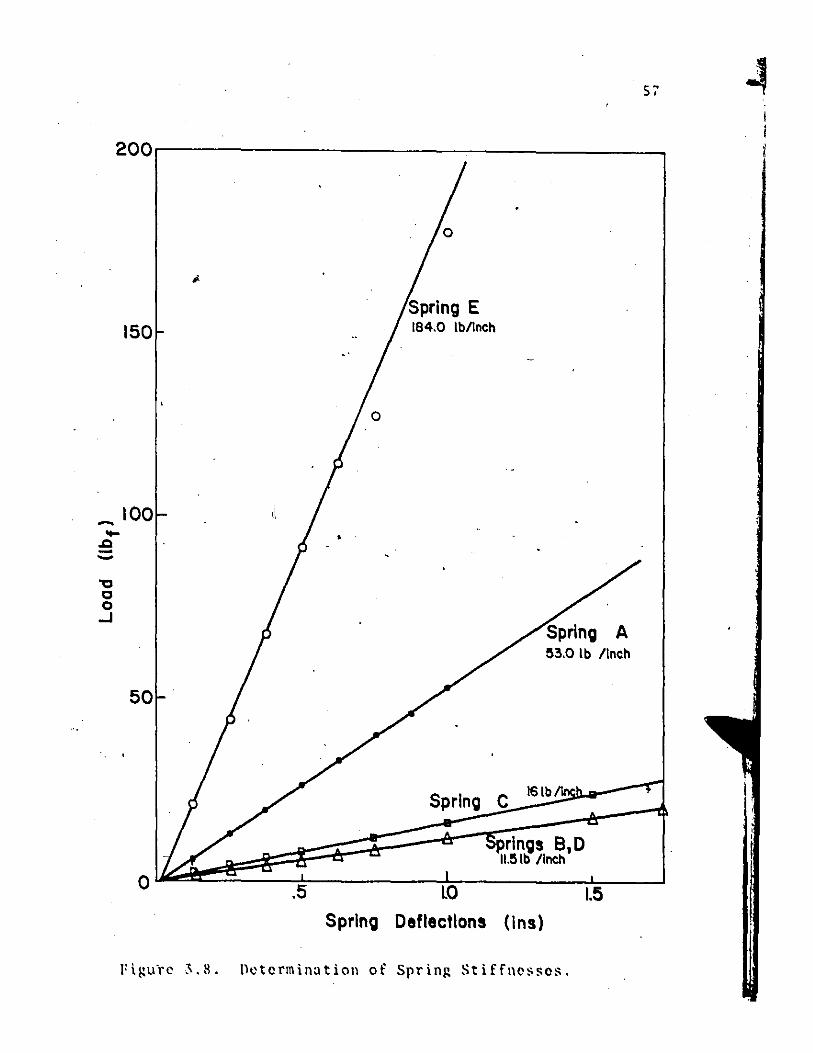
57
200.---------------------------------~
150
..... 100 ....
.Q -..... '1:) c o
...J
50
;.
.5
•
Spring E 184.0 Ibllnch
~3.0 Ib linch
Spring C I6lb
LO
rings B,D II.~ Ib linch
Spring Deflections (ins) 1.5
l'iRutc 3.8. Dctcrminatioll of SprinG Stiffncsscs.
58
Any tests under no-flol conditions could now be perform~d.
Next, a spring combination of known tatal stiffness
was inserted into the spring arm and the test valve opened
to a predetermined initial angle using the pratractor. A
~ecord of the displacement, pre~sure and torque transducer
outputs under no-flow conditions was then made. The upstream
gate valve was opened completely, and depending on the initi,al
angle and spring stiffness, the valve either closed without -
vibration, did not close at an, or went into spontaneous
~bration. It was found that in some marginal cases vibration
CrUld be induced by giving the spring arm a jolt.
Where shooting a film was contemplated the camera'
light meter reading was taken to determine the exposure time
at a desired film speed. At least nine variables must be
considered in obtaining th~ optimum photograph with an available
light source:
(i) exposure time
(li) water velocity
( iii) film type
(iv) developer
(v) developing time
(vi) particle size
(vii ) particle 'type
(viii) particle concentrntion
(x i) nperture
In order to keep particle concentration constant from test to
test enough trace~ was injected to obtain a given light meter
reading and then injection was stopped, the camera was
synchronized with the visicorder oscillograph and the film
was shot.
S9
The film was then developed in the darkroom using
Microdol-X developer with an average developing time of 8 1/2
minutes, as specified for average contrast by the film
manufacturer.
•
.>
CHAPTER 4
FREE VIBRATIONS - NO FLOW
4.1 Introduction
In.this chapter, the equations governing the small
amplitude free vibration of the model valve in air and in
quJ,escent water are derived. These linear differential equa-~ ~
tions. are solved analyt'lcally and a computer has been used
to obtain numerical data. Experiments to determine. the first
natural frequency of the system in air and in quiescent water
are described. Comparison of the experimental results with
the theoretical predictions shows, among other things, that
the assumptions made i deriving the theory are fully justified. ,
L
4.2 Theoretic 1 Formulation ! schematic representation of the
valve
Consider the system for the purposes of "exact"
analysis as a two-degree-of-freedom system, the two masses
being the mass of the spring arm and the combined mass of the
valve plate and swing arm. The two stiffnesses are the
torsional-stiffne$s Ke of the pivot shaft and the combined
stiffness Ks of the compression springs. ~
Taking moments about the centre of the pivot shaft,
60
; , ,
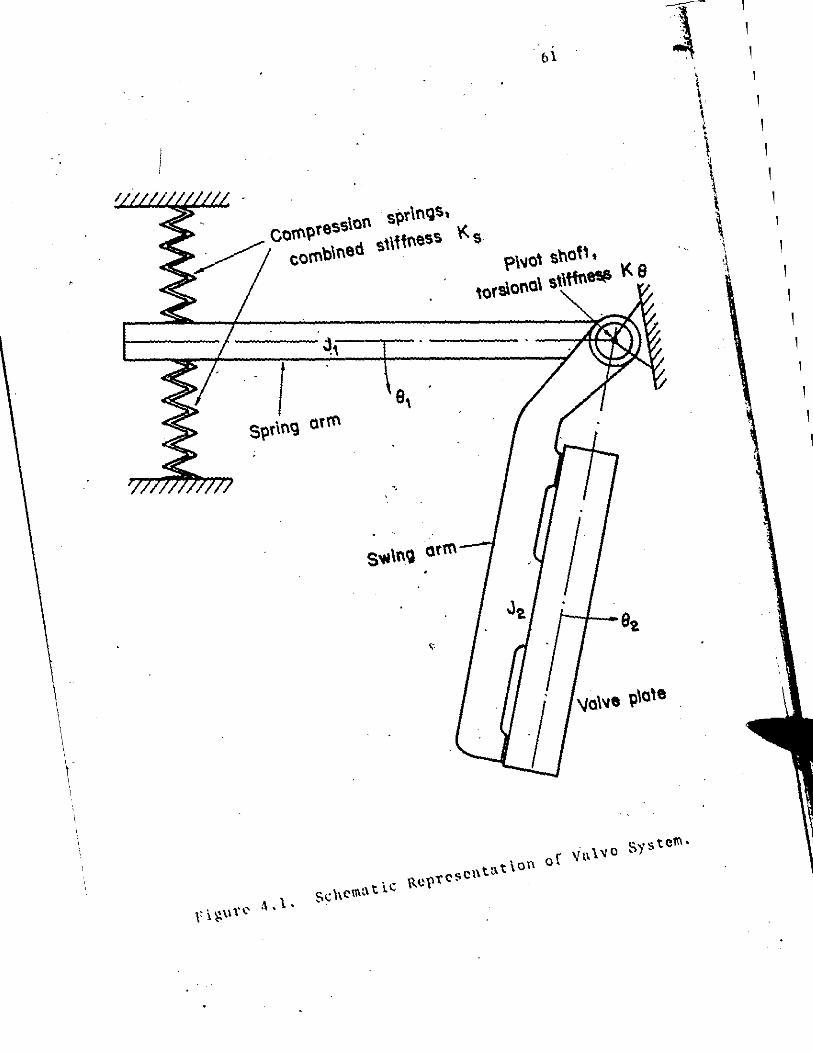
P\~O' st\of' t \ors\Of\Q\ s\\ttn~ \<. e
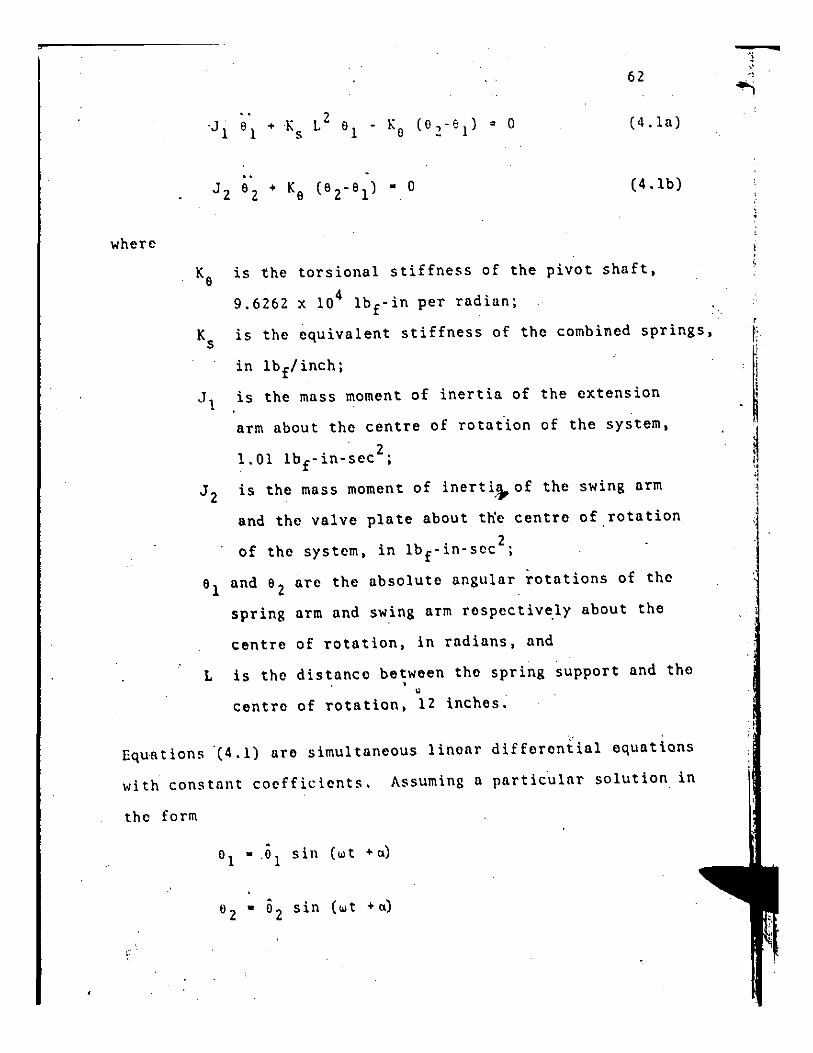
•
where
62
(4.1a)
(4.1b)
K6 is the torsional stiffness of the pivot shaft,
9.6262 x 10⁴ Ibf-in per radian;
Ks is the equivalent stiffness of the combined springs,
in Ibf/inch;
J1
is the mass moment of inertia of the extension
arm about the centre of rotat~on of the system,
1.01 Ib f -in-sec 2 ;
J2
is the mass moment of inerti.!).. of the swing arm
and the valve plate about t~e centre of rotation
of the system, in Ib f -in-sec 2;
61
and 62
are the absolute angular rotations of the
spring arm and swing arm respectively about the
centre of rotation, in radians, and
L is the distance between the spring support and the , ,
c
centre of rotation, 12 inches;
Equntions '(4.1) are simultaneous linear differenfial equations
with constant coefficients. Assuming a partic~lar solution in
the form
. 0
1 .,0
1 sin (ol t + (1)
. 6 2 • O2 sin (Olt + (1)
.. 'j "
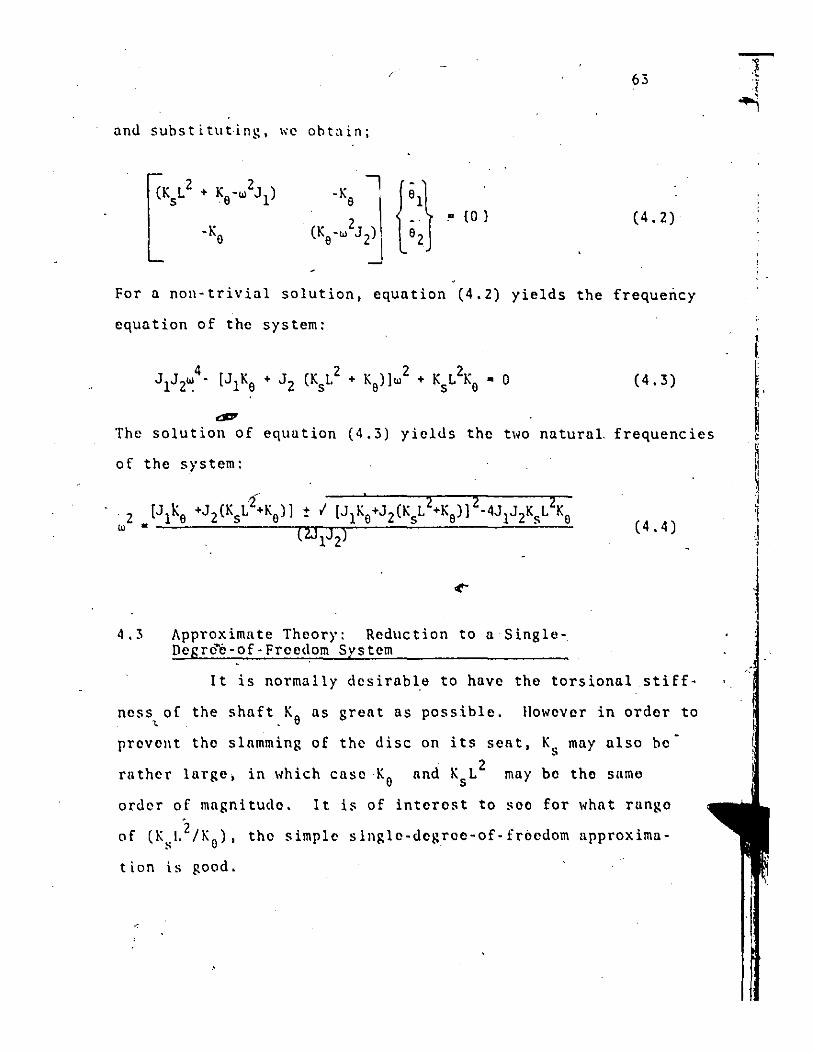
63
and subst i tut·ing. \,'C obtain;
(K L 2 + K - .. h) -K I
{::) 56 I
[K'.:J,J ~ {O } (4.2) -K
0
For a non-trivial solution, equation (4.2) yields the freque~cy
equation of the system:
(4.3)
dl1'
The solution of equution (4.3) yields the two natural frequencies
of the system:
4.3 Approximate Theory: Reduction to a SingleDegre"'il-of - Freedom System
(4.4)
It is normally desirable to have the torsional stiff-
ness of the shaft K , . 6 us great as possible. However in order
prevent the slamming of the disc on its seat, K s may also bc
rather lurge, in which case K 0
and K L2 s may be the sume
order of magnitude. It is of intcrcst to seo for what runge
of (K s I.2/Ko)' tho simple slngle-degrco-of-froedom approxima
tion is good.
to
, , .
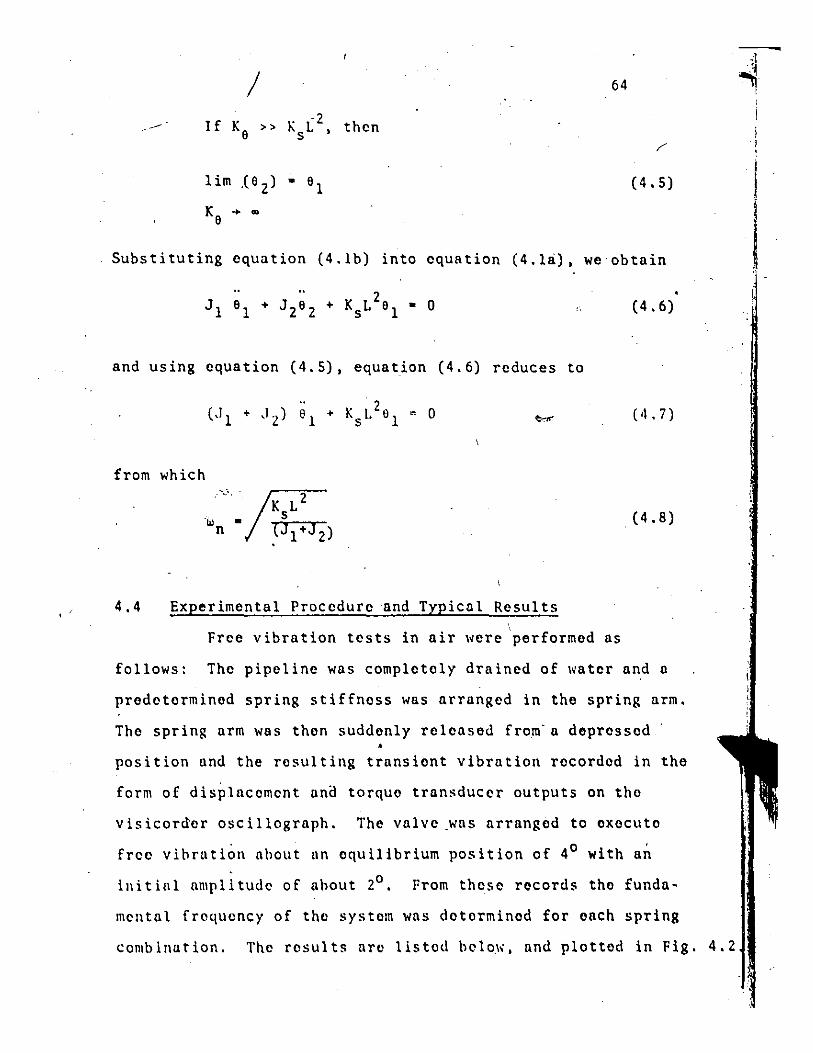
/ 64
~ If Ke » K L2 then s •
(4.5)
Substituting equation (4.lb) into equation (4.la). we'obtain
(4.6)
and using equation (4.5), equation (4.6) reduces to
(<I • 7)
from which
,(4.8)
4.4 Experimental Procedure and Typical Results \
Free vibration tests in air were performed as
follows: The pipeline was completely drained of water and a
predetermined spring stiffness was arranged in the spring arm.
The spring arm was then suddenly released from'a depressed
position and the resulting transient vibration recorded in the
form of displacement ana torque transducer outputs on the
visicorder oscillograph. The valve ~as arranged to execute
free vibration about an equilibrium position of 40 with a~
illitial amplitude of about 2°. From these records the funda
mental frequency of the system was determined for each spring
combination. The results are listed below. and plotted in Fig. 4.2
-.1 ,
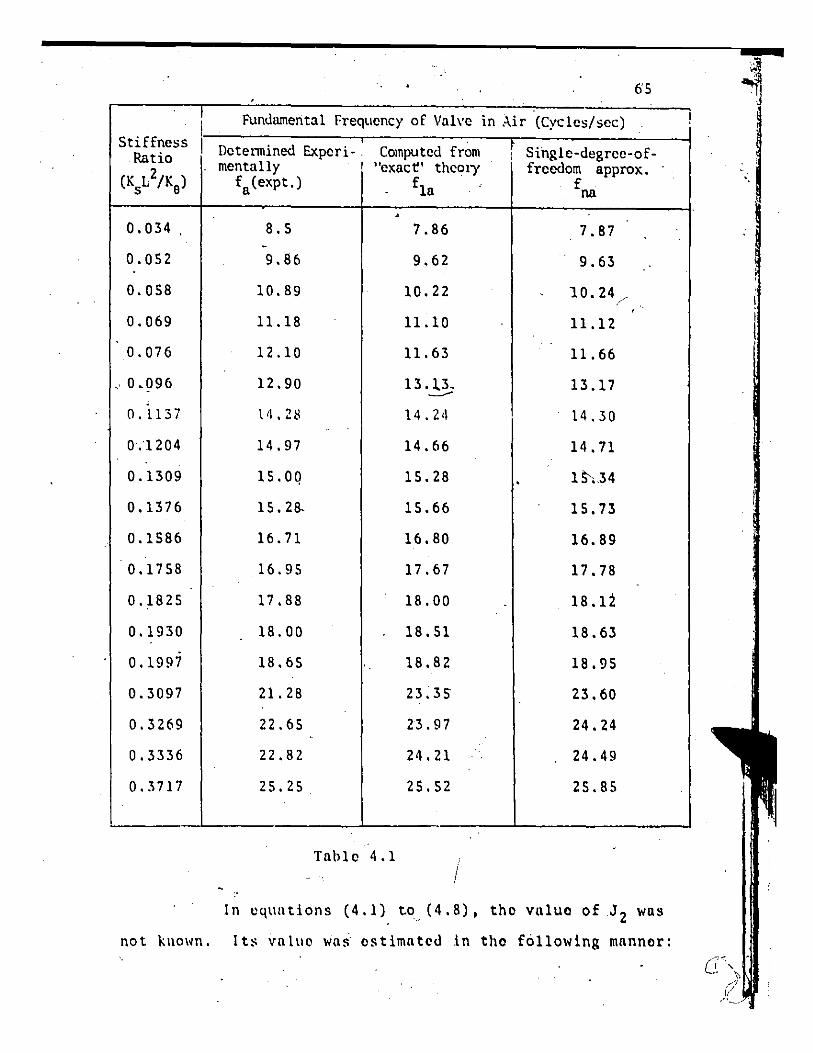
65
T Fundamental Frequency of Vah'e in Air (Cycles/sec) Stiffness I Determined Experi- , Computed from r Single-degrec-of-Ratio ,
(K L2/K ) mentally "exact!' theo!), freedom approx.
fa(expt.) f1a fna s e -
• 0.034 , 8.5 7.86 7.87
-0.052 9.86 9.62 9.63
0.058 10.89 I 10.22 10.24/, ' . .
0.069 11.18 11.10 11.12
0.076 12.10 11.63 11.66
, 0.096 12.90 13.l.3. -----
13.17
0.1137 t ,\ • 28 14.24 14.30
0.1204 14.97 14.66 14.71
0.1309 15.0q 15.28 . 15;.34
0.1376 15.28- 15.66 15.73
0.1586 16.71 16.80 16.89
0.1758 16.95 17.67 17.78
0.1825 17.88 18.00 18.12
0.1930 18.00 18.51 18.63
0.1997 18.65 18.82 18.95
0.3097 21.28 23.35 23.60
0.3269 22.65 23.97 24.24
0.3336 22.82 24.21 24.49
0.3717 25.25 25.52 25.85
Table 4.1 I
In equations (4.1) to (4.8), tho vu1ue of J 2 was
not known. Its valuo wai ostimatod in tho f6110wing manner:
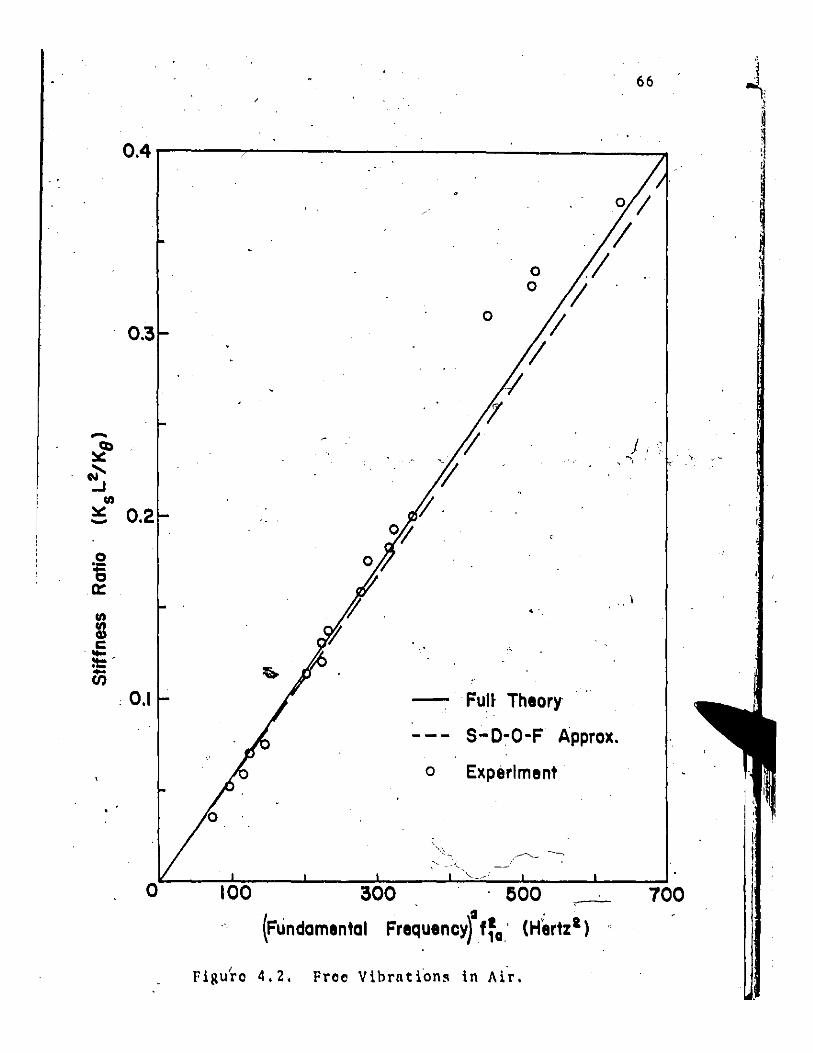
66
c ,,~~ ~-----........ ---,
-:--- -,'" -~/
o 100 700 300 . 500 ,---
(Fundamental FreqUencyr f~Q' (H~rtzl)
Figu~o 4.2. Froe Vibrnti~n~ in Air.
•
I:ro~ c4untlon (4.3)
~ -Using. th~ known. v~lue~ of J 1 ,
omentally measured values of w
(K"s,l. z IK;l, J Zwas -calculated and an average taken. This average
value of JZ for free vl~ration in air is 0,.45 lbrin-sec2.,
Using. the averQgo VQluo of J and the appropriQte theory the . Z • <>
I'tlsults ill columns 3 Qnu 4 of Tu.blo.4.1 lire cillculu.ted.
io ·det~rmine the fun,c;lamentlll fr~qucincy of the ".
system in water, the pipeline was completely filled with
wllter lind the upstrellm gate valve was then sh~t so that no
flow occurred. The spring. IIrm was kept depressed for a few
,seconds and then rtiltlilsed. Th'e 'vlllve displacement .. and spring
f~r()e were recorded' 01\'\ ~ho visicord.er oscillograph. Ag.ain
the valve"'was arrang.o·d to vibrate freely about lin e,\~ili~rium' . . , . positiQn of 40 with an Initilll IImplitude of IIpp.roximately
I:> Zo: From the records, the fundamentlll £requoncy of the
. '.. .' I , ;J.;.- system under this condition. was determine<\ for ollch spring
'r combInation. The> re>sults 111'0 listed be~ow, lind plotted in
r
~" :to
o .~
.' " •
, . I . , '
.•
,',
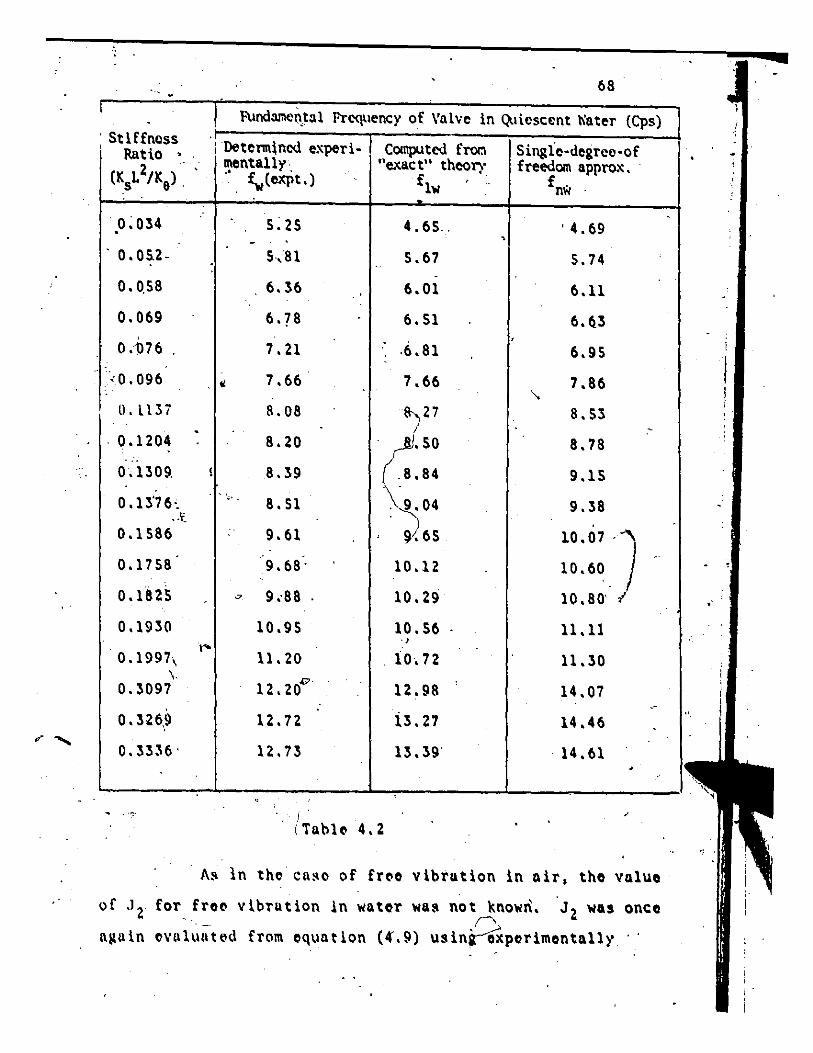
".. ."
68
tund:unei"t:ll Frequency of Valve in Q.liesccnt "'ater (Cps) , Stiffnoss
iDetenntned experi- Computed fTOr.l Single-degrce-of ,
Rntio , 2 mentally "exact" theory freedOl1\ appro;~ ..
(l\sL /Ke) . ". ~(exPt.) fbi f nw
.0; 034 5;25 4.65 .. ' 4.69 , . 0.05.2- 5,81 5.67 S.74
0.0,58 6.36 6.01 6.11
0.069 6·78 6.51 6.6.3 ,
0.1>76 7.21 ,6.81 6.95
'<0.096 . t! 7.66 7.66 7.86 "-
0.1137 B.08 ~27 8.53 /
·0.1204 8.20 ~.50 8.78
0,1309, 8.39 ( .8.84 9.15
0.13'76: . "~'-8.51 \~04 9.38 .. \'.
0.1586 9.61 ~.65 lO,,,oJ 0.1758 9.68' 10.1Z 10.60
0.1825 '" 9 .. 88 10.29 10.80' I
0.1930 10.95 10.56 11.11
0.1997, I'"
11.20 . J
. 10.7Z 11.30 \.
12.20'" 0.3097 12.98 14.07
0.326,9 12.72 i3.27 14.46
0.33J6' 12.73 13.39' . 14.61
. I .
iTablt' 4.2
A~ in theca~o of frt'o vibration in air, tho va1uo
of J~ for froe vibration 1n wator wa~ not knowri. JZ was onco .. /, I\!lain oVI\l\;;tl'd from equation (4'.9) usinroxporimonta11y
C
{
•
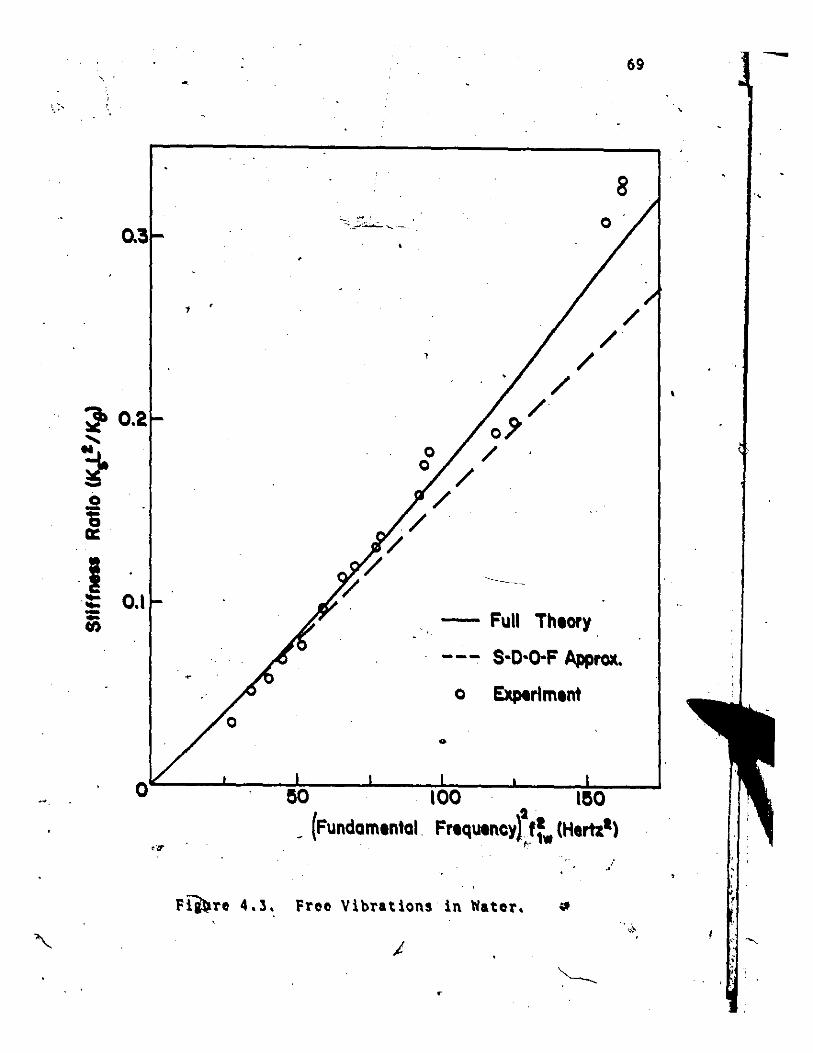
69 , -
8
1 /
/ 1 /
/ ~ 0.2 oJ'
/ ...... g. 0 -b a:
-I ::: --en
/ /
/ /
/ /"
~ -~
0.1 - Full Theory
--- S-O·o-F Approlt. ~
0 Experiment
.. O~--~~~~~--~--~IO~O--~--~I~e~o--~
2 _ (Fundamental. Frequency} f~w (Hertzl )
".
/
F~re 4.3.. Free Vibrations in Wator. ..
--,
-,
70
mensured values of III for a number of small (l(sl.2/1\0). An
average value of JZ obtained from this procedure {2.80Z lbf-in
sec 2) was then used with the appropriate theory to calculate •
the results in columns 3 and 4 of Table 4.2.
Values of the damping
from the oscillographic records
factor were also determfned
for both free vibratiorl in
ail' and in quiescent water. In the case of free vibratio~ in
water, only a few cycles could be recorded for the lower spring
stiffness as the vibrltion decayed very rapidly.
The dnmping factors wore calculated from men5ured
values of the logarithmic decrement of transient vibrations.
Substantial variation~i in t'he mCQSured values of the damping
factor resulted ,from t.hree sources ,of errol'. First, chafing , .
. occurred in the coil~ of the different springs. This problem
, .
, , "
could not be avoi~ because spring stiffn~ss was varied by
inserting one spring into another. Secondly, the cont'ribution
" to the damping factor by the sealing compound introduced into,
,the bushing;s on e\\herside of the pivot shaft, could not be
estimnted. It np~ quite clenr thnt this contribution is
different for vibration in
woro 01'1'01'5 in monsuromont
cnSo.
nil' and In wAtor.' Thirdly, th01'/o
which cannot be equnl hed in e~ry
Howovor, in spite .of. tho vo.rintions. " cloo.r trend
was ostablished in the results. The rosults show thnt tho
damping is suhstantinlly groater in water ,(by " f"ctor of
"bout 2) thnn it is in air • •
•
/~'''' /, .
71
./ 01.5 Determinution of un Approximnte Added Mnss
A structure submorged in water cAlts different
dynamic charactoristics from one vhichvibratos in air.
Theoreti-cnl 'analysis IlS 101011 as laboratory tosts indi.cate that
a system hIlS a longor peri'od of vibration when .vibrating in
water compared to that in air. For small amplitude vibrations,
tho stiffness of a structure submerged in water does not
chango appreciably compared to the stiffness in air. Honce
the increaso in the poriod of vibration of such a'system is
llnly :It~le
systom ~ to ~he to un incronso~lll tho npparent ~uss of the
participation of the surrounding'wator in
the motion. This npparont ndditional mass duo to the motion
of the surrounding wator is termed "virtunl mass" 01' "added
mnss" of the water.
Tho magnitude of the added mass certairily depends
on the goometry,'pC the s tructur'o, its rela ti vo confinemcmt and ,I
tho lovel of s,ubl~erllenco. For ship hull vibrations, Todd PO}
hns shown that th\e added mass ,is not dopondent to any marked
oxtont on the mod~ 6f vibrution 01' frequency. Apparently this \ . '
result is npplica~lo provided tho amplitudes are smnll • '
gonornlly not groator than about S\ of n characteri~tic
dimonsion of'the ~ ructuro. l~wover, I,ogvinovich and
Savchonko 13S} havo domonttrated that as tho amplitudo is
inc roa!ted, the addcHmuss becomes hoth ampli tudo und froquenc'y
dopendent. Nevortholess, it has still not b~en clearly
ostablishod that' the ~dded mass always increuses with frequency
• ut ~uige umplitllul"s. Tho rutio of tho addod mus to actuul
( t
r
I I
\,
•
72
mass of thCl structure is knO\in as the "dr-tunl muss factor".
From the results of the experimonts,
"Added imrtia" due to the presence of fiuid .. • (2.~02 - 0.45) Ib f -in-sClc 2
• 2.352 Ibf-~sec2
"Added inert~ factor" Q is Iliven by
Q • J 2 (wa tel') -
Also, Jz(water) Z 802 • • 6.23 J2(alr) • 0.4s
This_ ~ans that even for small amplitude free vibration in
water-the effective mass of the disc increased by a factor ' .. ;"
of about 6.23.
4.6 Discussion and Conclusions
The small discropancy betweon computed and experi
mental rosults evident in FillS. 4.2 and 4.3 for stiffnoss - -
ratios greator than 0.3 aro likely duo, at least in pArt, to
tho 01'1'01' in dotormining tho eXAct VAlue of the stiffness of
sprlngiB reported in ChApter 3. This particular spring was
involvod in all ~ho_:.combinatioris u~Cld to obtain stiffnoss
rntios above this value.
The following major conclul\ionl\, may be duwn from
tho results of tho work roported-in t~is chipter:_
(i) Tho nddod mUll of wllter pllrticipatinit in any vibra-
tions of the valvo is much larger than the mllss of the disc
~ .-
::r .. : .. .~~
nnd must therefore --h(' tllkc.'n into account in an)' vihration
analysis o£ tho sy~tem.
(U) Within the range 0 «KsL~O:e) < 0.2 the valve system
may roasonably be approximated by II single-degree-of-freedom
system, provided nlso that (J 2/J 1) < 1. In the case of £ree
vihration in water (J2/J11 > I, and the range of stiffness
ratio over which the system behaves like a single-degree-
of-freedom system, shrinks nppreciably. fI!
(iii) Over the ranae where the system behaves approximately
;t~ a ~in!:le-degrc.'Q·of·froudoln ,ystom, the auded Ina~s of I
fluid uppe~rs to he little affected by frequency. This is in
• ngreement with the findings of provious workers, notably
Todd [30 J •
(iv) The vibrlltion experienced with the valve is not a
resonance phenomenon. In preliminary vibration tests the
observed frequlncy of vihration has always boen much lower
thnn tho natural frequency of tho system in water foi the
rolevllnt spring stiffness.
(v) The damping in the ,ysteIR when vibrati.ng in water
appears to huve inc rea sod by a facto~ of about 2 comparod
to tho cllse of froo vibrntions in nir.
.,
CHAPTER 5
THE Dy'NAMIC BEHAVIOUR OF TilE VALVE '>
5.1 Introduction
In this chapter, the dyn~mic behaviour of the
check v~lve as desiined oriain~lly by the m~nufacturer is
studied, its limits of st~bility ~re determined ~nd the
influonco of change of parumotors In the rogion of in~tubility
is oxamined. B~sod on thoso o~porimental studios the koy
paramo tors apparently govornina tho instabllity are dotorminod.
Valvo vibration is shown to bo soif-,oxcited; and tht' rogion of
self-excitation on a stability m~p is chown to h~vo two tonos /
with slightly differont chur~ctoristics. A mochanism of
instability is then postul~tod.
Before procoeding with the work in this ch~ptor, tho
uso of sprinis without ~n oxtorn~l d~mpor on tho mo~el must bo
justifiod. Thosianific~nt conclusion dr~wn from tho pro
limin~ry oxperiments carriod out on tho oxtornally damped pro
totypo valvo i~th~t f~r high enough damping tho dampor
becamo inoporativo and tho dynamic hohaviour of tho valvo bocamo
dep~nd~nt o'nly on tho olutic dofloction of tho pivot shaft and
hydruulic oil dnmporconnoctions. It was this olasticity "-
plus tho initial anglo of vulvo.oponing which doterminod·thr
froquoncy and amplitudo of tho observod valvo vibration.
74
:( I
7S
5.2 Static System Charactl'ristics
As part of the programme to derolop an understanding
of tho valva's bohaviour, tho thoorotical hydrodynamic
torque roquirod to just ovorcomo tlfc---spring arm rostoring
torque at the point of closure was calculatod.
It wns nssumed that in this limiting condition, the
equilibrium of the vulve is ~etermined solely by the restoring
force in the spring and the effective pressuro difference
across th~ valve. The equilibrium equation is determined by
in rig. 5.1. The momont duo to the submerged weight of the
disc and swing nrm were found t6 be negligiblo'comparod to tho
molnontsduo to tho spring und hydrodynamic forcos in the systom.
The resulting oquation is:
(5.1 )
(5.2)
and Ks • kl + k2
o • initial unglo of vulve oponing, In radians o
Pu • avorago pressuro (30.34 kPa) acting on upstroam
vulve fuco Au (0.04137 m2),
I'd • IIVlHtlgll pressuro (4.09\1 kPII) acting on dONnstroam
vllivo [IICO Ad (0.0348 m2),
r • effectivo rlldlu! IIrm from tho contro of prossuro o
to tho contro of ro~"tion (0.1222 metros).
" o ,'-I
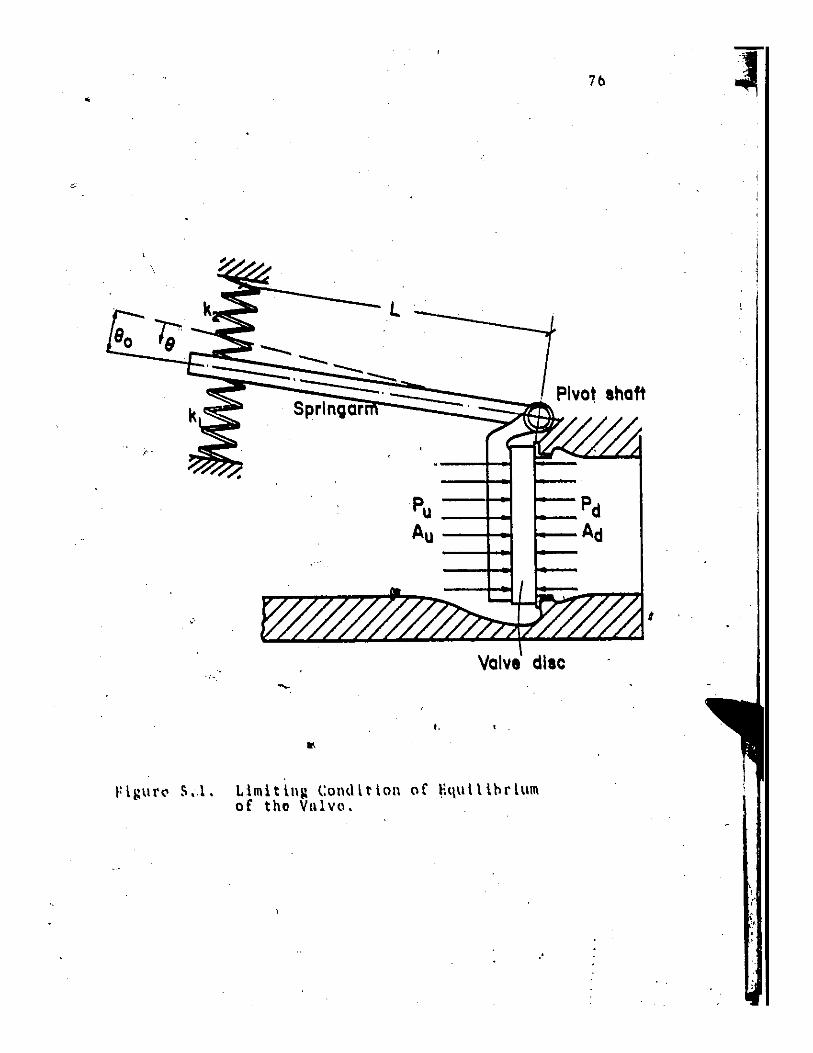
•
k ...... l 90 7;-...... .... -------'- ~ '- -'-
Sprlnoar -, ,,~ .
Valve disc ....
t,
II<
Limitln~ Condltlon or Hqulllhrlum of tho VlIlvll.
"
76

,
, .....
-y • 77
L • di~tunce from the ~prlnK supporJ to tho contro
of rotutlon (0.3048 motre~) und
~ is the stiffness of the pi~ot 'shuft, (10.876147
kN-m/rlldilln) •
As long liS the hydrodynumic torque exceeds the spring ), ~orque (Keq 0Q)' the vlllve remllins closed. The
-vulve cun open up only if the hydrodynamic torque reduces below
this critical vnlue.
A stntic chuructori.tic for the vnlvo hus beon
,lol'lVt,J ll~lnlt equlltion (5.1) nnd tho ilpPl'opritlto tlrOus, rnJius
nnd hydrostuttc pressures, 1.0.,
o • o (5.3)
Tho rosult Is plottod ill l'lg. 5.2. The 'shupe of this
chnructorlstic is dependent on tho 'hydrostatic pressure nnd
will move up or dOI~I'40pendillll on I~ht'ther the prelsuro is
higher or lower. This curve is bnsed on the uvnilublo hydro~
stntlc hend nnd is of signlficnnt importnnce in understnndinlt
the vnlve's dynamic ,behaviour.
All poillts to the left of· the curve idoally should "
'be stable In the lOllse of the valve closing nnd remaining
1/CIOSOd
l !lystom
To tht'
bocause tho nvnilnb10 hydrostlltic pressuro In the ,
is sufficient to overcome the spring restoring force.
rlgllt of this curve, tho restoring torquo from the
!lpr lng tit closuro is grl'utl'r thun tIlt' torquo t,xerted by the
uvullublo hydrostlltl~ pros51lro. Hen~~ in this regime tht'
vulvo will not closo Ulllt'S5 tho hydrodynnmic pressure exceeds
" .
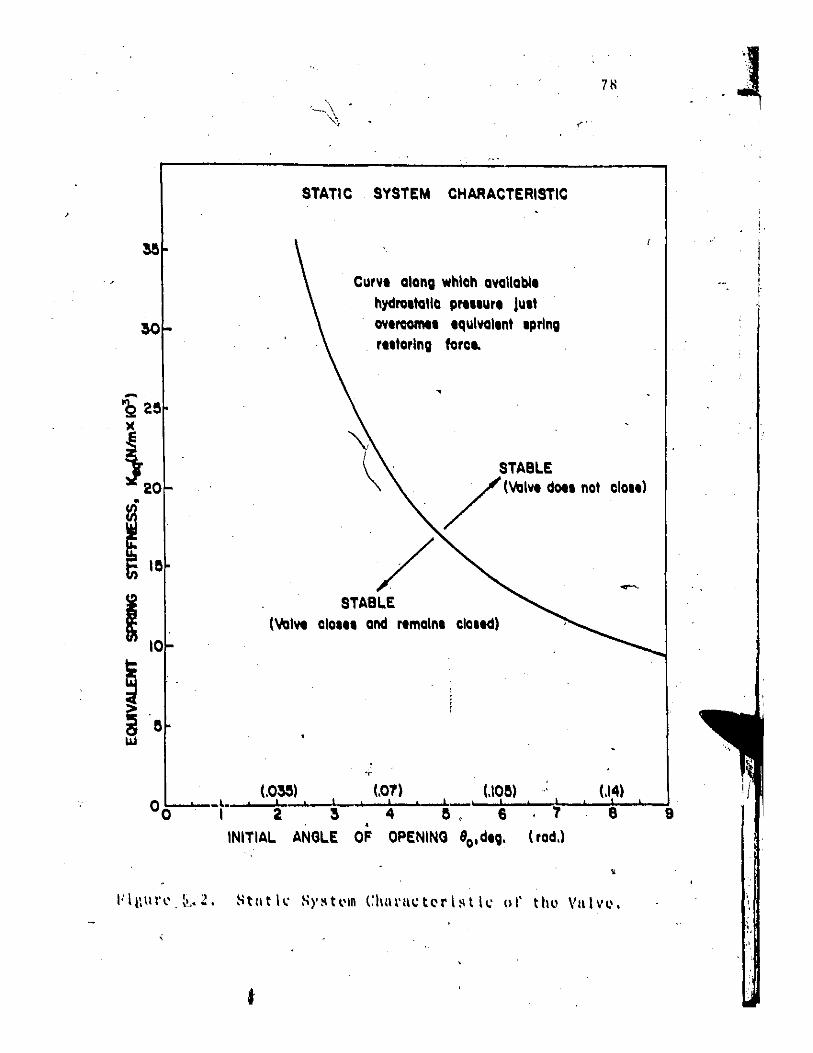
STATIC SYSTEM CHARACTERISTIC
Curvt alan; whloh avallablt hydratlallo prellurt Ju.1 OVtrcome. tqulvaltnl .prln; r"torln; foro ..
. .
7H
STABLE / (valve dot. nol 01011)
STABLE (valve 010'" and remain. clo"d)
(.01) (.Ioa) l I I !
S 4 a , 6 7 •
INITIAL ANGLE OF OPENING 80,dt;. (rod.)
(.14)
8 9
/
,.'
7 !) "
"
tho hydrcr~tnt\c,pl'u~~\lro.
5.3 Vnriublo Pnrllmetor~
For st\ldyin~ thl' dynllmic b'ohllv\o{lr of tho vlllvo,
tho 'llllrnmotor~ thlit cnn be vnrio,d, nre thl' ~pring ~tiffnoss ,
lind tho initinl nnglo of ollonina~ Honce tho nil turlll f,roqullncy
of froo vibrlltion lind r09tori~1l torquo II''; closuro cnlt bo
controllod. Whilo the ~nlvo dynnmics ure nlso
tho totll1 IIvnillihlo hydrostlltic pro!!osu.rrl.'thls
VIlt'1 (HI ldo t h . t htl ('.X I s,t. Inll t' xpl1dllllln t al ~t ' .. u P ,
·5.4 fnrumotric Vibrntioti Tosts
dopendont on
could not bo
In tho~o tosts, tho pipolinl' wus compl~toly filled . , with wutor nnd tho upstrollrn gnte vnlvo wus shut so thut no
fiow occurrod. A prudoturllllnud spring stiffn~ss wns nrrnnged
in tllo spring nrm, nnd tho vnlve oponl'd to n desirod inltiul
nng10. The upstr'l'nm. ~nto vllive WtH' thon opened fully nnd tho
vnlvo nllowod to clolo from this inltinl IInglo.
5.4.1 Spring Stlffnoss kept Constllnt, Inltlnl ~s.!l' of ()/ll.'lilng. V"r~~0.-, _____ _
Thosti oXporlmont9 hlwo tho'sllmo uffuct liS h~lng . ,
thu llntu~lIl froquuncy of tho vlllvo const~nt lind incroasing
tho rostol'lng tO~(IUe nt closure.
At smll!1 lnitlnl nngle!!, dUpolldlng ,on tho sprinj
'~tlrfnugg. thl' Vilivo ~llll1ll1lud ~hllt, h()uhcud wtHlkly OIlCO or
twlcu nnd rUlllnlllud shut.
80
,
A!o tho inItial un&lu wu~ IncrClu~Otl'; tlw VlllvQ
suc.ldon,ly begun to o!lcillutu \dtho whut npPollruc.l to bt' constant
"oJ <'<_ ,. • ,
ampli tuc.le. Fur.ther incroase in initial anale lec.l to lurllor
amplituda, low~r rrequency~ limit cycle o~cillutions.
A lirge enough initiul unRle wns ovontu~ll~ rouchoc.l
at which the valvo slummqc.l shut, bouncec.l back onco and
remllinod opon at II ~mall angle. Ari~further' increase in i
initilll anale beyonc.l this point morely increased the unal~ at
which tho vulvo finally ~tIlYllc.lopon. For thosa InrilO~. In.ltial
ungiu!\ thll hydrQ!\tutlc pro'~"ro In thD' ~y~tum.wll!\ InM~frlclont
to 'k'oop the vulva closod against t.ho pllrti"culur. !lprlnll Combinu-
tion u~oc.l •.
5 .4. Z Initial Analo· of Oponina kopt C~nstnnti . Spring Stgfnosll VArl.~ .
In thill lIorie!!; noto~ly it! the' rO!ltorln[l torquo , . lit clo!lure'increll~inll wlth incroa!l\nll.lItl£fnoS8,- but tho
nlltur"l froquoncyof tho v.iyo i8 alsd Incrolllllnil.
flor lIu££iciontly small ~prinll stlffno!l~oll, tho - .
'- vulvCI 1I1ummCld !llnit unu rClmnlneu clo!lad.
A~&!lprlnl\ !I:~lrrno!ls wA~il\l~roulHj(1 tho vlllvo lIuddonly
-bullun .to oxocutolimlt cycle o~clliutlon!l. Purthor -lncrClu!lo
In !lprlnll .tlrfnolll lncrou!lodtho ~lolonco or thCl o!lcillution!l.
A hIgh onough !I~rlnll 8t~ffnoM~ WUK oVClntuully
In!lortodfor whIch tho vulva illlmmCld shut, bouncoc.l buck ~nc.
und romulnod opon ut " lImull unillo. Any furthor lncroll!!o In
!itlffllO!l!l morely lncrou!llltl tho IInillo lit whlch tho VII'V(l finQlly'
~ tnYIHI 0P(lI\.
, ' , . I ! '
) 81
5.5 Ilynom\<.: Stahility llJ..:!Jlram of the Vah'c
Stahility data'irom !he ahove parametric studies is
'-plot~ed on{s graph of stiffness against initial angle to . .
form the stability map shown in Fig. 5.3. The curve
r,epresented hy thc broken line is the stat'i'l:- characteristic
,of Fig. 5.2.' Points on the diagram where vibrat'lon was
ohserved experimentally are repres'entedas dynamically unstable. ~-' .
It appears that the region of instability is. almost evenly
d i v i ded on oJ ther side ·of the s ta t ic sys tem 'charac ter i s tic • . ~
The symbolic division of the unstable region illto' -two sub-jegions is not artificial. In the.lower sub-region
the ~alve is expected to close and remain closed since the
available hydrostatic pressure is large enough to overcome
the restoring force of the spring. This is shown further by
experiments in which the valve was held shut for a few seconds
and then released. ,-,
It remained shut and no vibratioJ!s·: ensued. , ; . :
It follows that the cause of valve opening in this sub~' I •• .
region includes dynamic as well as static forces in the system . •
In the upper sub-region the valve is expected to
remain open since the available hydrostatic pressure is not
sufficient to close it. The fact that it did close indicates
that closure ~n this portion is effected by the addition of a
hydrodynamic component to the availahle hydrostatic pressure
bringing the total closing pressure to a value sufficient to
overcome the ~pring restoring force. This additional hydro-"
dYllamic pressure component must be the result of the rate of
change of discharge and local flow effects. Once the valve
I
i I
. . <
i.
I
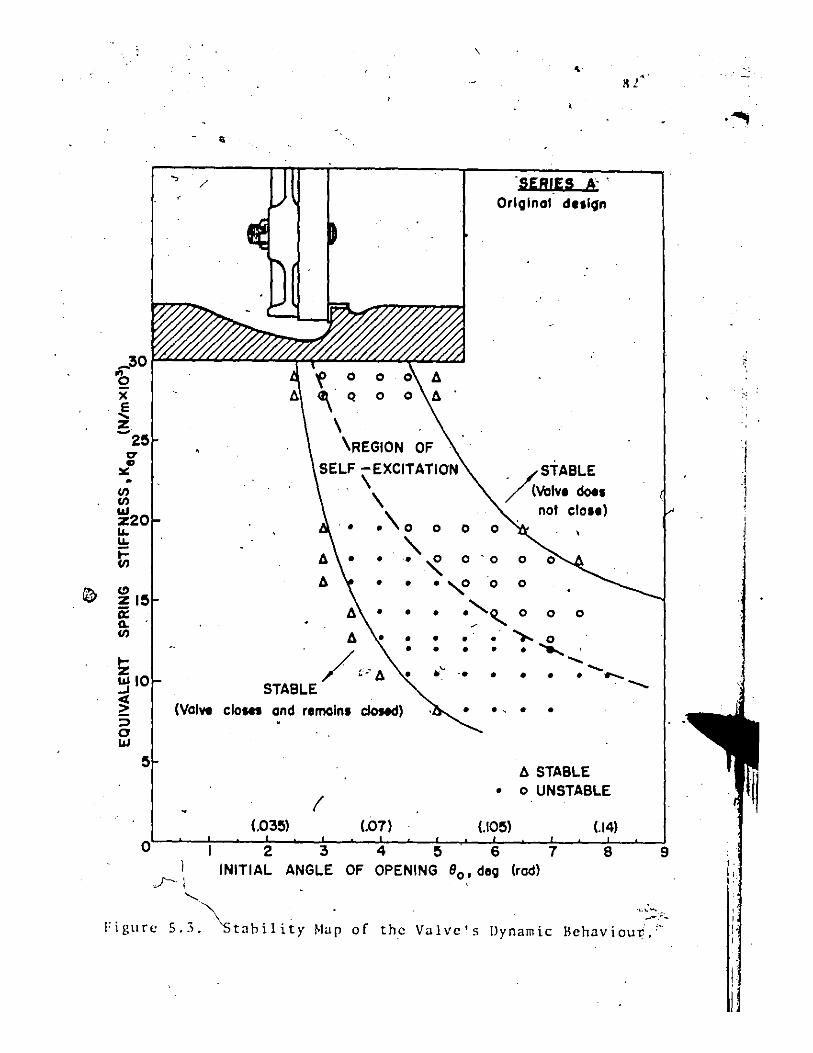
IQ
_30 "b x ~ Z -.,. .. :.: •
(I) (I)
~20 .... .... i= (I)
f!' zi ii: CL (I)
!Z ~ 10
~ :::I a w
/
(Valve
1 J-'i
"-
clo,"
'(> 0 0 , Q 0
\ \REGION OF
SELF -EXCITATION ,\
\ .. .\0 0
• '\. .~
0
'SERIES A" Original dulqn
STABLE
/<vaIV' do .. not clo .. )
0 , o '0 0
• • • ,-0 0 0
• • • .~'1... 0 0 0
f> • • • • "').. ~
/ ~,' f>
• • • • • -.~ .. • • • • --STABLE
and remains cIoHd) • · , • •
f> STABLE
I • 0 UNSTABLE
1.03~) (.07) tlO~) (.14)
2 4 ~
INITIAL ANGLE OF OPENING 80 , dell (rad)
-
Figure S.3.~tahilii:y ~Ia'p of the
' ........ ...-:;'"
Valvc's Dynamic 8chavioui.~
.--.;
! I·
I 1
i •
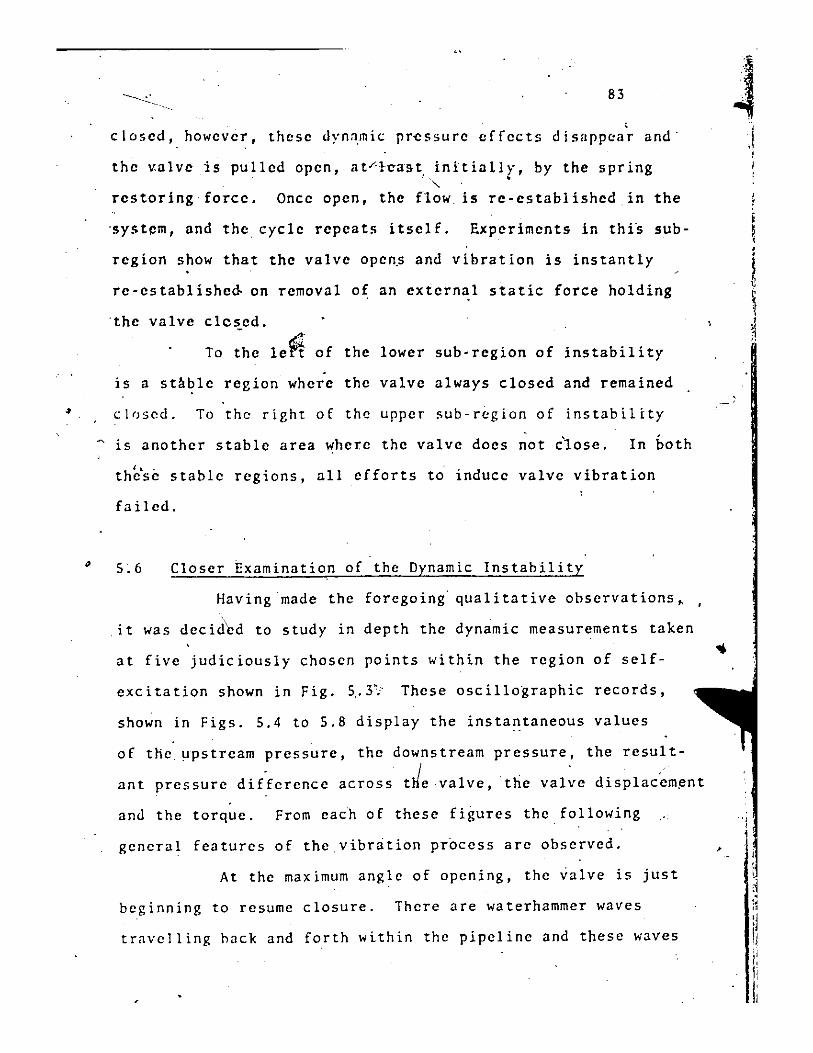
•
83
, closed, however, these dyn~mic pressure effects disappear and'
the v.alve is pulled open, at/·t~st. initiall>", by the spring .. , "
restor ing' force. Once open, the now is re - established in the
'system, and theeycle repeats itself. axpcriments in thi's sub
region show that the valve open.s and vibration is instantly
re-establishe~ on removal of an external static force holding
'the valve c1c~ed.
To the le~ of the lower sub-region of instability .
is a stllble region where the valve always closed and remained
closed. To the right of the upper sub-region of instability
~ is another stable area where the valve docs not c'lose. In both
'. ' these stable regions, all efforts to induce valve vibration
failed .
Closer Examination of the Dynamic Instahility
Having made the foregoing qualitative observations, \
,it was decided to study in depth the dynamic measurements taken
at five judiciously chosen points within the region of self
excitation shown in Fig. 5,.3'/ These oscillo'graphic records,
shown in Figs. 5.4 to 5.8 display the insta~taneous values
of the, upstream pressure, the downstream pressure, the result
ant pressure dif"ference across tJevalve, tlie val~e displac"ement
and the torque" From each of these figures the, following
general features of the,vibration process arc observed.
At the maximum angle of opening, the valve is just
beginning to resume closure. There are waterhammer waves
travelling hack and forth within the pipeline and these waves
~ i ., ,
., I
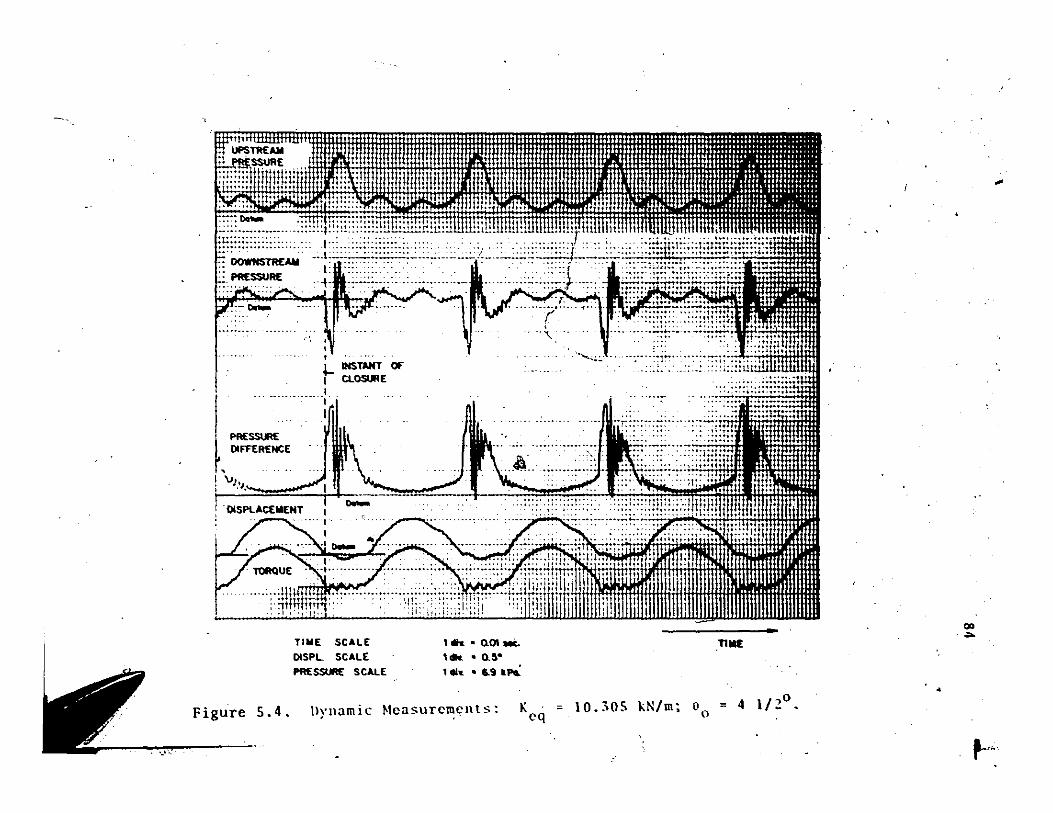
. -',
~ IHSTNIT OE" I CLOSURE
__ •.•. _ .• _. __ .1
PRESSURE OIFffRENCE
,
, , ;:v ... f,fh" ., ':;l"W~' ":":.': ':-l1ffi!HT, ,'"
T'''E SCALE OISPL SCALE
PRESSURE SCALE
'" • Q.0I..c. TillE , ..... 0.&-
1 "' .... 6..9 'PIL
Figure 5.4. IlYJlamic ~lcasurcmCJlts: K ~ 10 lOS "N/m' 0 = 4 1/?o cq • . ." • 0 - •
•
QO
""
~'"
...
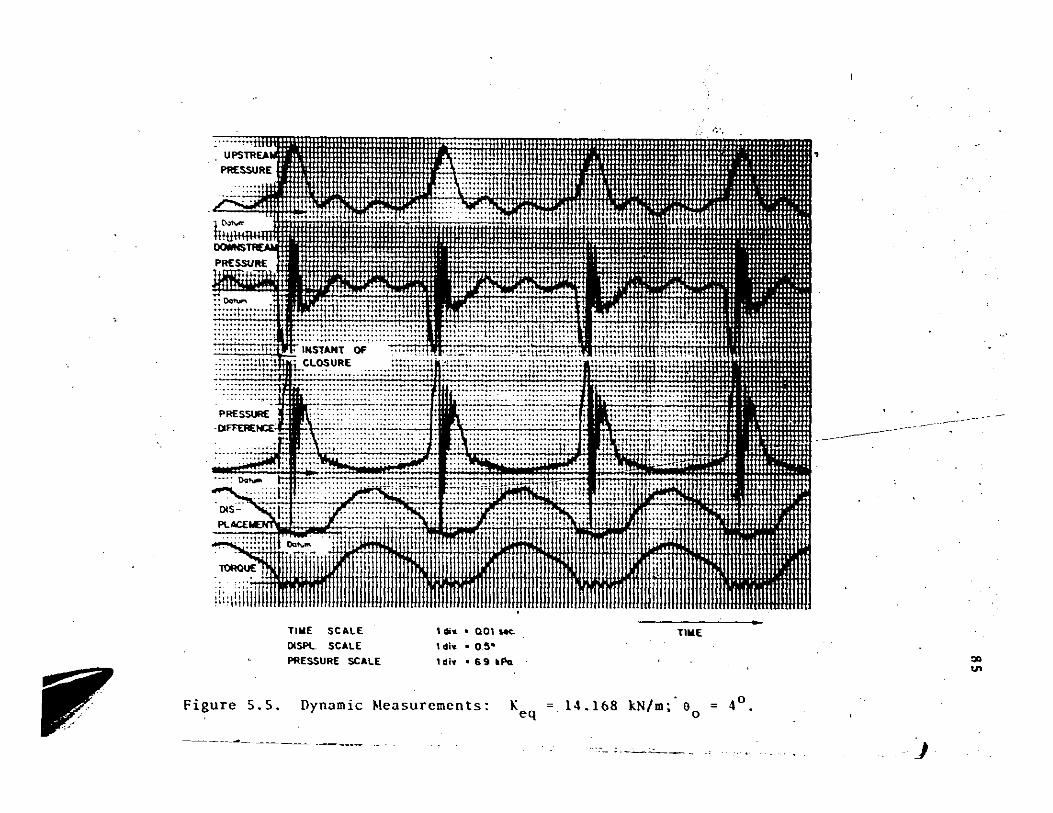
TIME SCALE
DlSPL SCALE
PRESSURE SCALE
, dill. • Q01 MC..
1 dill. • 0_5·
1di ... 691kPa.
Figure 5.5. Dynamic Measurements: K eq ~~--- --~~- _____ a __
TIME
- 0 14.168 kN/m; 0 = 4 . o
.~ .. _~------. .J
"" '"
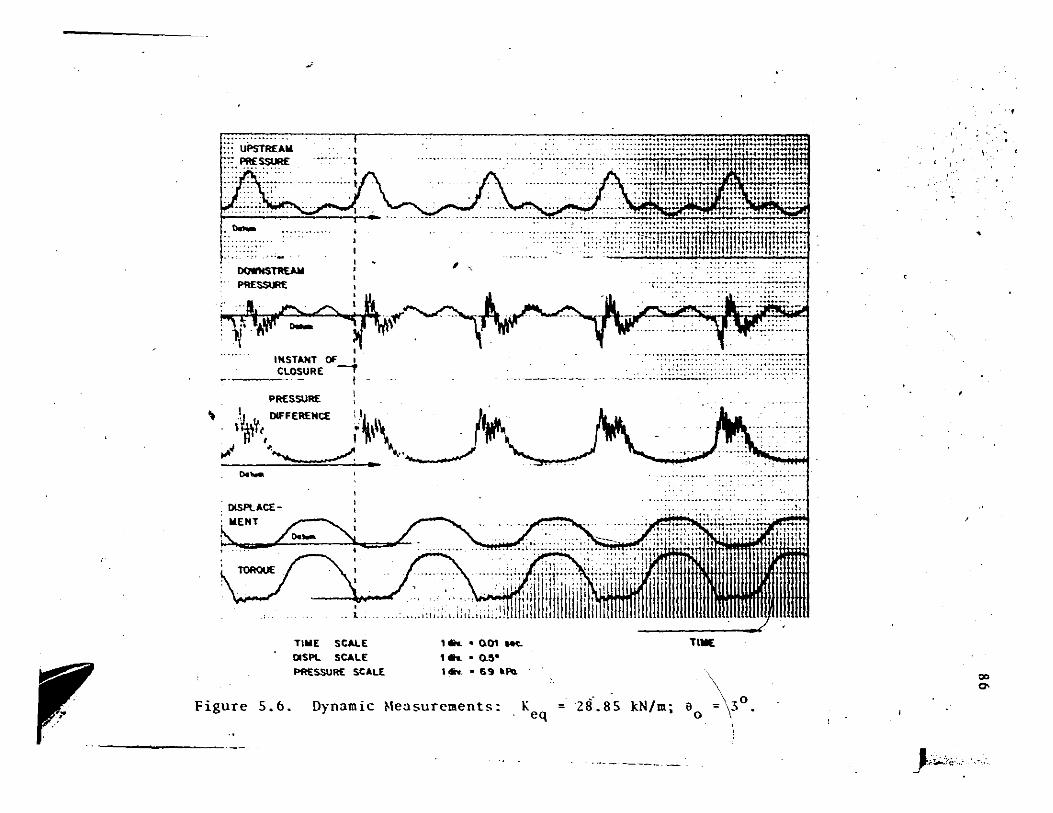
\
-'
""'-
DOWNS1REAM
PRESSURE I 'Wl.< DIFFERENCE . , ·;t ..
I I "'~ .~
0._
OtSl't.ACE -
TIME SCALE IlISPL SCALE
PRt:SSURE SCALE
, -,
, ..... 0.01 ~
1 ... ·0.5· 1 .... ·69 "fQ.
Figure 5.6. Dynamic Measurements: K eq
'r. --•.• __ ••. ;:::'::;::::::;(
·.::;~:;7T:;;~C:::;;7Em71
=28.85 kN/m;
TIllIE
,
a ~ 3 0 o = \ •
};,.;.}o
\
•
00 0-
•
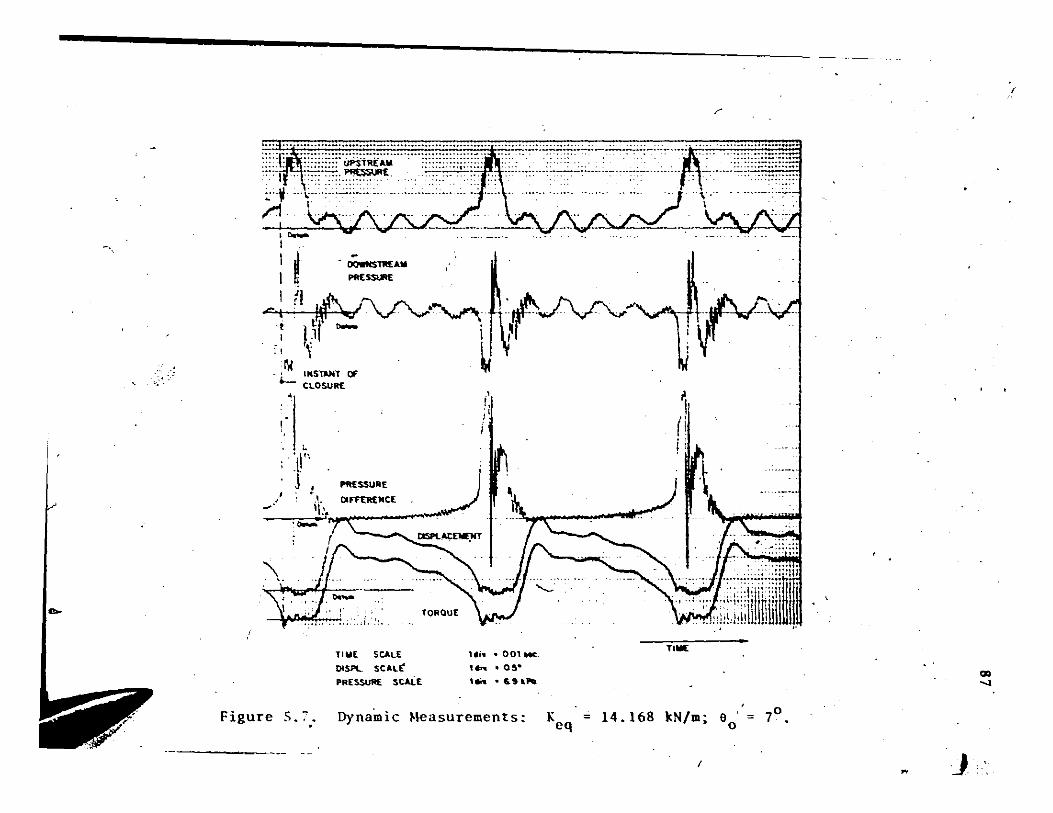
.... ; ... {" ........................ -............................... , ......... :;.;:~~~--.-.-. -'':'':';;_._ ... _ ..
. ~ .. rx~~:·::~:~~fm·:···:fm:::~:;::iJt!E:::::: .... ;L:.L .. n:.:._ .. : ... ~ ..... .
,rL I
,0.-j
I d OOWKST1t£UI
I g tl'~ /\ "'. '" ") !Il':::~~ \f '-/ .. v "-
_SSUR£
1\1 '.StaHl ~ . L CLOSURE
•
!,
"
.1 I, i'
'\" .
J, _SSURE ~' / 0- ,\. DlfTUt[NtE .
-' 'I' 'r, ,04~ .0-: ~
\. 0.-
vNH! :: :;: , ...... ..;1.
tORQUE
TIW£ SCALE
DfSPL SCAl£"
PRESSURE SCALE
'--
Ui" • 001 Me
,."'- O~·
1M -&.9,,,,
1 ( i f l
lll'£
r-
..- ..... -....•.... . _ •......•• _.u .... . ... -.-...... -.......... ~. ,- .... _ ...... .
~.
-.. ';;~~:jm
Figure 5.:. Dynamic ~~asurements: Keq = 14.168 kN/m; eo 70
I ~ 1
CIO ...,
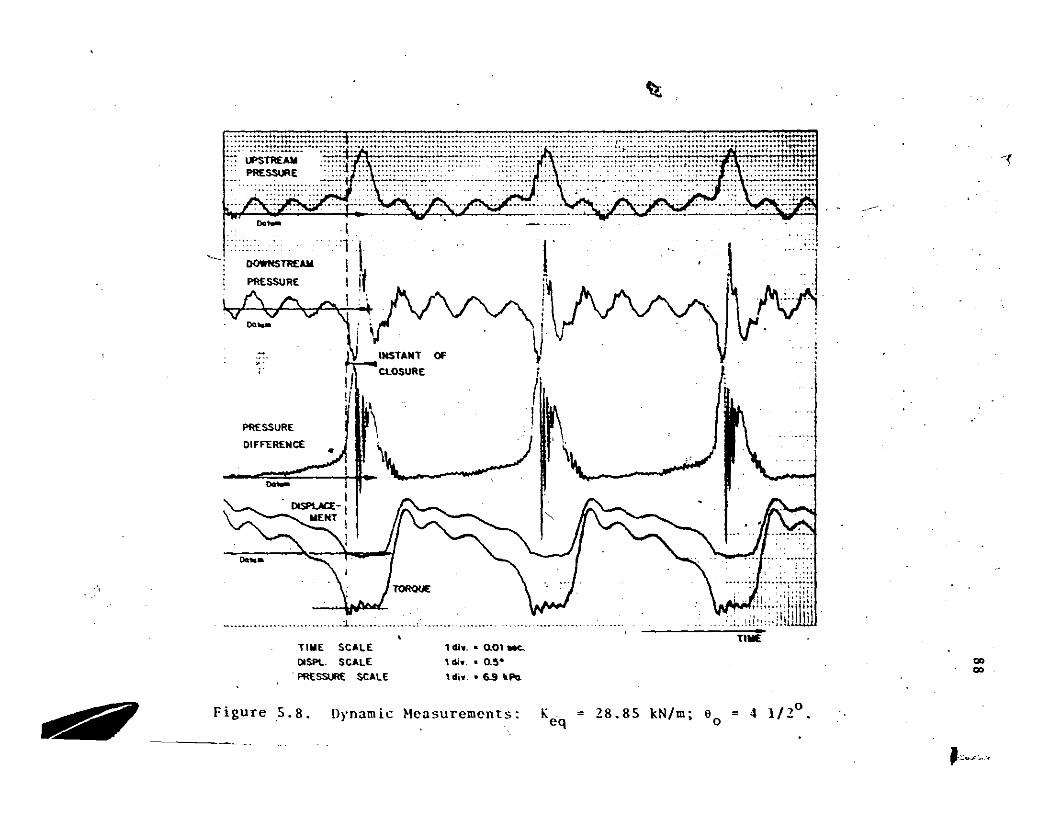
. .,
~
::~::~~1?:!:~:~::;!p.~;:~\;ii::~;;;~:;fl:::~[[::[:E2. ::j~:;;;l~~; ::2·mS~:::~:,\~&~~~!~~HW1.f ::~E:Y::;'E
I .
'1 I '--; o<lWNSTRE.... I
i PRESSURE I it I t\ /\. "'" I ~,
00... . • , \ I I
v~~. ::. I INSTANT 01' , .
Ii CLOSURE
PRESSURE
DIFFERENCE
1/
\ oa_
TillE SCALE
illsPt-. SCALE
\1
. PRtSSURE SCALE
TOROUE
, dl., .• not 11K..
'diy .• 0.5-
, di., .• 6.9 Ulo.
Figure S.8. Dynamic Heasurements:
(~\
..! ,'- .':~
M
~·:··:·.:·:·':::::i!r ' ,,·11 ,1'lj'" . ,.'1:' ,::q II --: 1:/"::, .h, ',., '" i
TIME
K =?8 85 LN/mo 0 =' 1/ 10 eq -. " • 0 .. -.
~
0> 0>
J,~,.,
-~
• 89
cun be Hecin in the upstream and downHtreD~ prcs51lTe traCDS.
flowcvcr, thc valvc responds only to the effective pressure
difference which can bc seen at this point to be rclatively .. smooth. The valve begins to drift close under }he influencc
of ,this prcssurc diffcrencc, which is suffic icnt to just ) .
ovcrcome the spring force. As the disc nears the scat it
\
begins to accelcrate as the pressure difference'begins to rise.
~his process is an interactive onc. A smill increase in the \
pressurc diffcrence advances the disc a small distance towards
the scat. This reduces the flow area, lending to an
increasing head loss and reduction in the discharge, and hencc . .: ',~ ,
a further fisc in.prcssurc difference. This risc in pressure
is cvident i~ the upstream pressure trace where the decaying
waterhammer waves arc superimposed on an' increasing mean
upstream pressure. Atthe same time the mean downstream
pressure is dccreasing. At rather small'angles the preS',llre
difference is relatively large and the disc acce1erates rapidly
towards the seat. ~
At closurc thc valve impacts heavily on the seat.
Instantly there is a sharp incrcase~in upstream pressure and
a sharp drop in downstream pressure as the velocity head of
the fluid is converted into a pressure head. The resulting
pressure wavcs travel independently in the\pipeline While the
valye remains closcd - the upstream pbsitive pressure wave
travelling back to the high level ~eservoir to be reflected
as a rarefaction wave, and the downstream pressure wave
travelling to the ,open end of the pipeline to be reflected as
•

90
• r a pO!litiye prt:%lIr,t: wa\'t:. Tht: rec.:ord~ of upstream and dowll-
stream pressure show that while the valve remai~s cloied the
downstream pressure w~ve performs approximately one complete
cycle while the upstream pressure complet,es only one-half a
cycle~ This i-s 'hecau~e the length of the pipel ine downstream , ,
of the valve is approximately half tne upstream pipe length.
Interestingly the flexib~lity of the transition section reduces .' the average waterhammer wave speed ,to about 500 feet per second
and leaves the wave ~hape nearly stnusoidal.
The t.orqlle recoTe!' intiic<.Jtes that the impact of the
disc on the seat excites free vihrations CJi the sub-system
of the torque arm, shaft, and springs ahout the seat,as shown
schematica,lly -in l'ig. 5.9. ,Analysis shows that the natural
frequency of this system,is given by'
/
3CKe + fn • l/Zn ' 2
ml.
where m is the mass of the torque arm. By substituting the
'/elevant values into this equation the calculated values of
the natural frequrincy may be compared with those shown on the
torque records. The calculated and- experimental values were
found to be in close agreement at be~wden 51 and 56.7 Hz.
The small disturbances seen on the pressure tfaces
could be attributed to two independent factors - the\--influence
of pipeline moti0!lwhich Wood [48J (1969) showed would
result in jagged pressure response, and the possibility of
cavitation which Duc [49) (1965) claimed would lead to the
'"
(
-
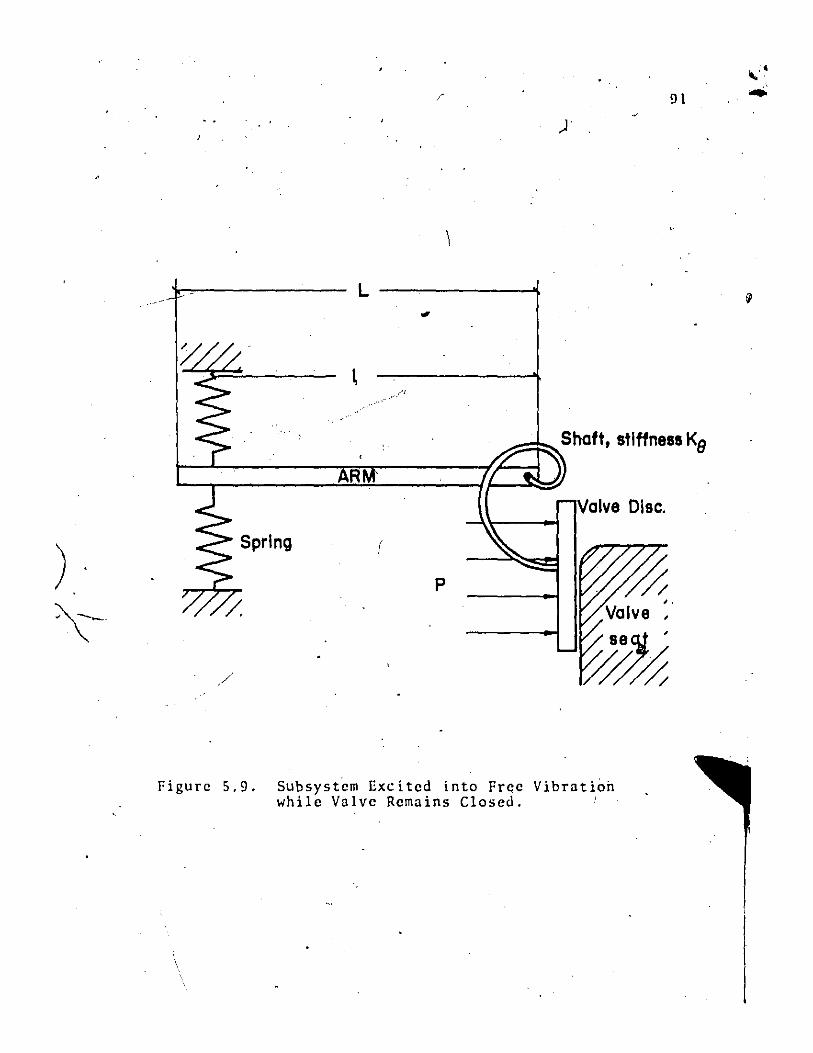
/ PI
)
\
L -------'l
/1
.. ~~ Shoft, stiffness Ke
Valve Disc.
Spring (
p ~ , .
Valve ,
/
Figure 5.9. SUbsystem Excited into Free Vibration while Valve Remains Closed. '
\
/
.'
,11l"IC effect. Since bo~h the·'dD"n~trc:l1O PI'C:I:lllre t.ruce unci
the pressure difference.ucro9K the vulva in(licnte theRD
pre!l!lure values close to the vapour pressure of ,water ut 'the
prevailing temperature over a very small time Interval, it i~
impo~sIble t6 disiount the possibility of cuvltution.
Moreover, the pipeline wa~ freely ~upported and was observod
to move quite substantially during the eXperiments which
involved valve vibration.· It 1s thorefore suggested that the
high frequ'C/,ncy peakjf the pre~-~';'e ;\'s;~nse may be a
c()n~;equencc of hoth of' t.hc~c Factors.
T6e pressure difference records show conclusively
that for those points chosen In the sllh-region where the
hydrostatic pressure is sufficient to overcome the spring
force, (Figs. 5.4 and 5.5), the valve opens only after the
pressure difference falls helow the value required to close
i~. flence in this sub-region the dynamic pressure wave action
is solely responsible for opening the valve. Once the valve
is partially open, flow is re-established, the prossuro
difference ~ontinues to decrease and opening continues.
For points to the right'of the static system
characteristic, (Figs. 5.6, 5.7 and 5.~) closure of the ,
valve depends on the hydrodynamic pressure exceeding the
maximum availafle hydro~tatic pressure by an amount sufficient
to o~ercome the spring force. The valve remains closed until
the pressure difference drops below that necessary to overcome
the spring forces. Thus in this SUb-region of instability it·
is the combined effect of the spring force and the pressure
-
}
Q.
,
.I
/
wavo nctlon thnt cnu~ell' the vulvo t.o rll-opun. ,\p,ulnt)110
vuLvo LN noon to opon vary quickly. D Onco tha muxlmum dIn-
placomont is reached, the cycle ·of aventll in repoutod ••
PLg~. 5.10 to 5.14 give pre~9u~e dlfferance ucro~!I
the vulvo disc plottod agaln~t anglo of opanlng. Thoflo
'rallult~, obtoined from Figs. 5.4 toS.B, indlcato that tho
pro1l5uro differonce is greator during closing than during
oponing for tho. sarno angle. Thus, more enor~y was added to
the system during the clo~lng part of tho cycle than wns taken • .
out of the !lYlltern during tho oponinp, purr of tho cycle. Thl!1
hystoretic effact is on indication of tho nonlinenr nature
of tho phenomenon and the limit cycle o~cillation ~uggo~t~
thot this net bnergy oddition per cycle is exoctly balanced
by the energy dissipated~y the damping Corco!! in the sY9tom.
Any excess energy addition beyond that dissipated by damping
would hove resU1tod in oscillations of continuously increosing
amplitude., On the other hand~ if tho work dono by·the damping
." to exceed the net energy input por cycle, thello
would have boen damped out.
e value~ of the available hydrostatic pressuro,
and the ap roximato theoretical prossure difference
K 0 (lip· nO)
required /0 just o:orcorne the sl'rlng Ilrm re!ltorlng torq~le Ilre indiclted on ellch dillgrllm hy the brokon lines. Tho
1:l f
relative position of the two lines is an indiclltion of the part
of the stability diagram which the curve repregent~. As
(:
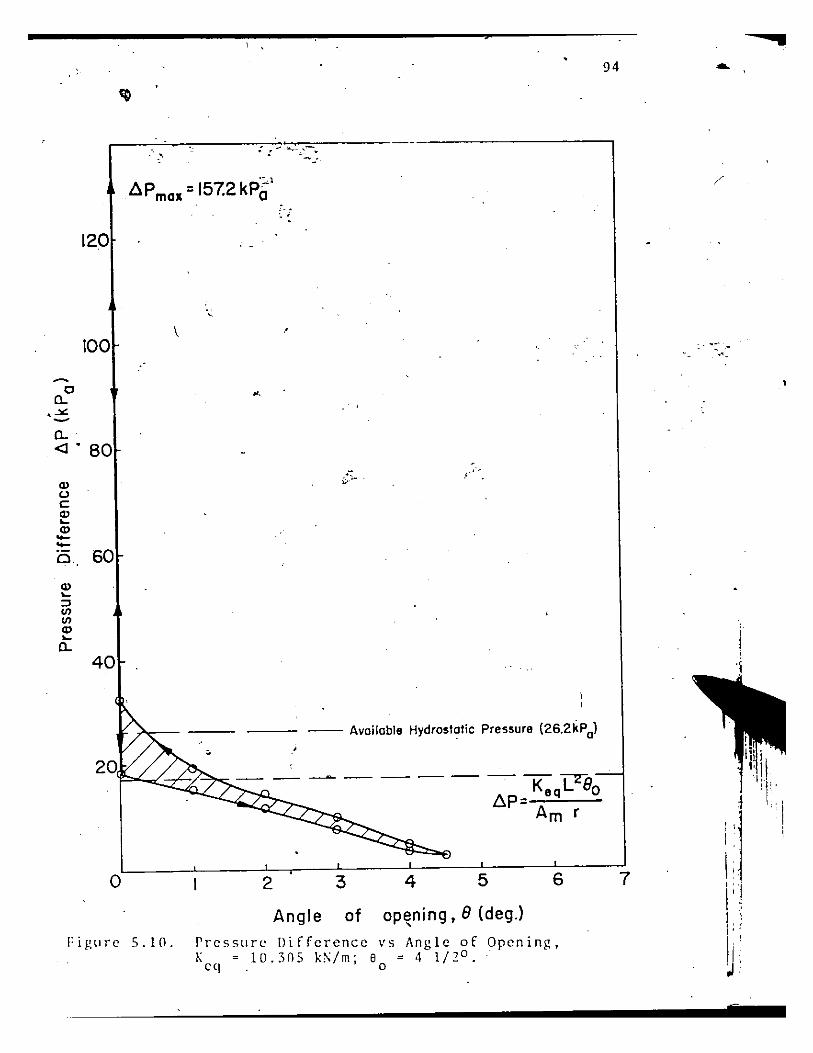
, , . 94 &.
.' .~ ·1
~Pmax = 157.2kPa /"
120
'.
\ 100 .'
~
c .. a.. , .><: -a.. <l . 80
" Ql
;:::'-
" C Ql ... Ql --is 60
Ql ... ::J <II <II Ql ... a..
40
-- Available Hydrostatic Pressure (26.2kPal
20 ·1
t \ ! I :
a 5 6 2 3 4 I, " .
7
Angle of op~ning, 8 (deg.) , . I:igllre 5.10. Pressllre IJifference vs Angle of Opening.
Keg = 10.305 k\/m; 80
= 4 1/2°. ~;
5
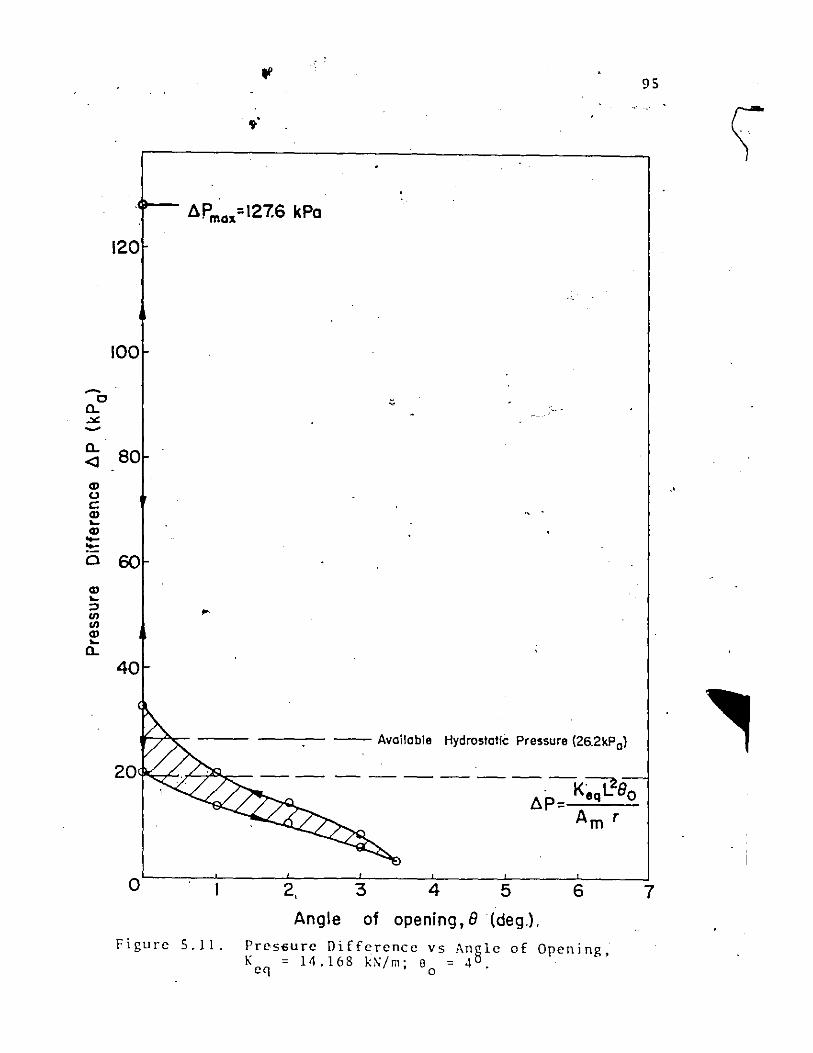
~
c a.. .:>&. ~
a.. <l a> u c a> ~
a> -:!:: 0
a> ~
:l
'" '" a> ~
a..
120
100
"
80
60
40
-- Available Hydrostatic Pressure (26.2kPo)
20'~"L. >'--7"'''-c-- -- --
a 2, 3 4 5 6
Angle of opening, 8 (deg.).
Figure S.II. Pres6ure Difference Vs Angle of Opening, K = 14.168 k~/m; e = 40.
eq 0
9S
.'
7
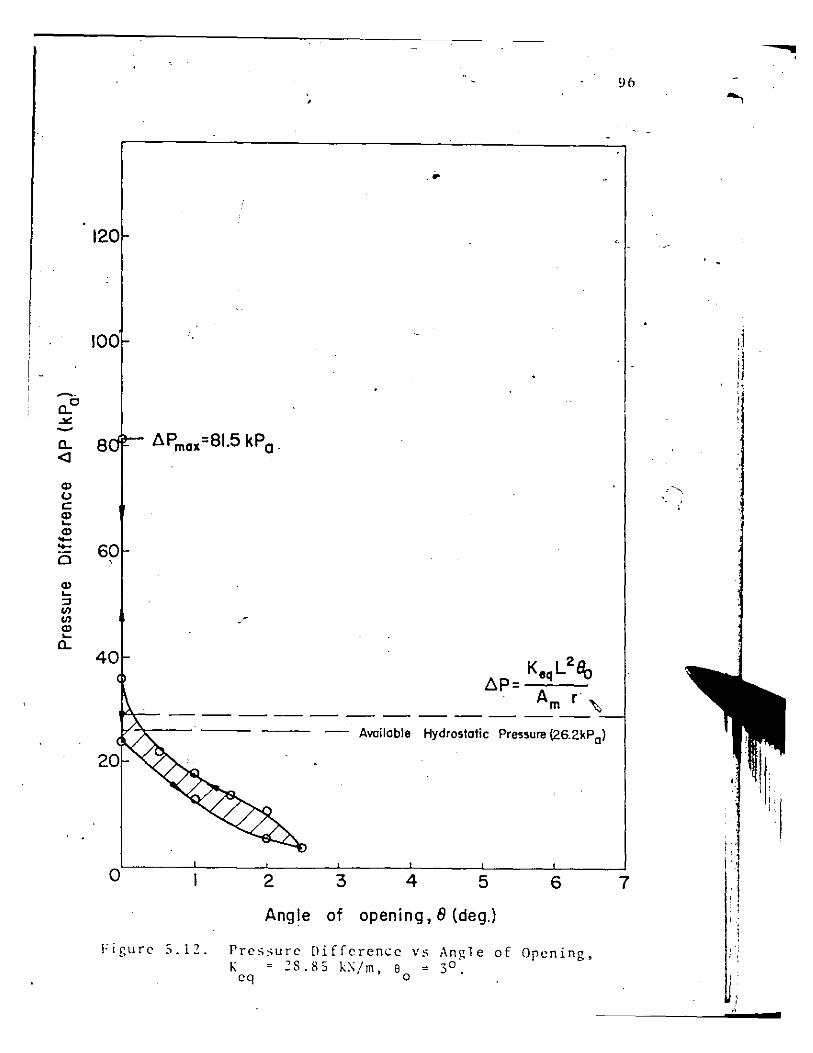
~.
O-C .>0:: ~
0-<I
CI> 0 C CI> ... CD --0
CI> ... ~ V> V> CI> ... 0-
•
120
100
S
60
40
----------- -- ------ ----Available Hydrostatic Pressure (26.2kP 0)
o 2 3 4 5 6
Angle of opening, f) (deg.)
Figure 5.12. Pressure Difference vs Angle of Opening, K = 28.85 k~/m, 8 = 30.
cq °
96
:-.......
7
,": . ,
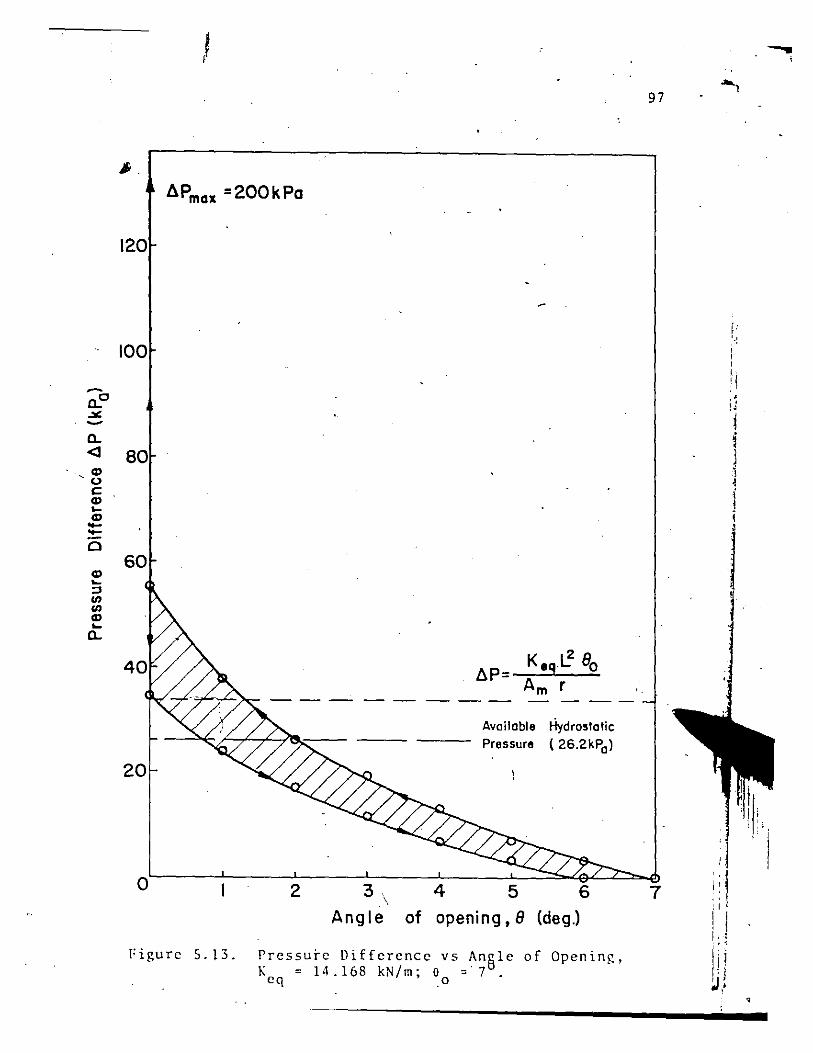
~
a.C
.><: -a. <I
, Q) 0 c: Q) .... Q) --0
Q) .... ::J IJ> IJ> Q) .... a.
~Pmax =200kPa
120
100
80
60
20
o
r:igure s.n.
~P=
--- -- --- - - ---
2 3, \
Angle
Available Hydrostatic Pressure (26.2kPal
4 5 of opening, 8
6
(degJ
Pressure Difference vs Angle of Opening, K = 14.168 kN/m; 0 =' 7 .
eq .0
97
, ,
7 I ~
i '. c· , I , II • , ,
t J
j
-
,
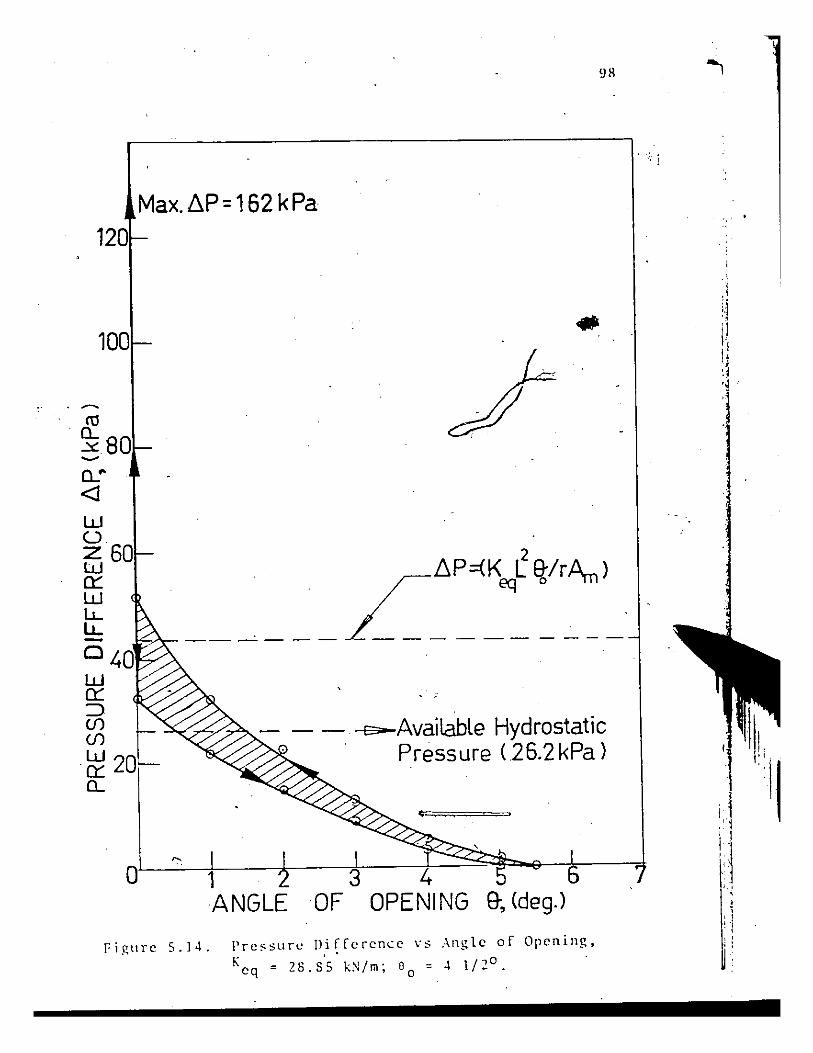
98 -,
Max.~P= 162 kPa 120
100
ctl
. ~.80 .......
, ,
.....::...,~-'>- - - -. --r::-Available Hydrostatic . . Pressure (26.2kPa)
" 01L-~+1--~~~3~--4~~~~~6~~
r-igllre 5.14.
ANGLE OF OPENING 9-, (deg.)
Pre~Sllre Difference vs Angle of Opening.
Keq = 28.S·S·kN/m; 00 = -11/2°.
I
..
,
------------------------..............
99
indicated in Figs. 5.10 and 5.11, the availahle hydrostatic
pressure'is higher than the theoretical static pressure
difference, required to overcome'the s.prings a',t closure so
that the valve should close and stay closed. The t~o points I
on ~he stability diagram represented by these curves therefore
are from the region of instability to the left of the static
system characteristic. In Figs. 5.12, 5.13 and 5.14 the . available hydrostatic pressure is lower than the theoretical
static pressure difference required to overcome the spring at
closur~ indic~ting that th~ valve should not close. The points
on the stability<diagram represented by these diagrams are from
the region of instability to the right of the static system
characteristic. Both of these observat~ons are to be expecte
in light of the results. The pressure difference during
the closing pa'rt of the cycle increases sharply as the valve
approaches its seat especially for closing, angles less thm •
The 'enclosed area in each diagram is proportional to
the net energy input to' the system per cycle of vibration.
The size of each area, 'as well as the maximum pressure difference
attained subsequent to closure, appear to be related to the
maximum angle of opening, and therefoie the violence of the
vibration. Experimental observationS,;sho\; that the'larger
the~,enclosed area the more violent I<as the vibration.
5.7 ' Parametric Studies
Experiments I<ere conducted to determine the influence
of change of parameters (stiffness and initial angle of valve
setting) on the frequency ~nd ampiitude of vibr~tid~ at con-
stant. upstream pressure. •
These experiments were carried out as described in
sections 5.4.1 and 5.4.2.
Both the frequency of oscillation and the maximum
displacement of the valve were determJned from the Visicorder
strip chart records of these ~xperim~nts. These results are
summarized in Figs. 5.15, 5.16 and 5.17. In Fig. 5.15 the
" ratio of freq·ency of vibration to the fundamental frequency·
of the valve i for ea~h sprini combination
is plotted against the stiffness ratio, CKsL2/Ko). All the
curves are for full upstream hydrostatic pressure and each
curve represents a different initial setting of the valve.
In Fig. 5.16 the maximum displac'E\ment of the valve is plotted , against the equivalent spring stiffness Keq given by equation
(5.2). In Fig. 5.17 the initial angle of valve opening 60
is plotted against the,~aximum dynamic displace~ent of the
valve for different st~ffness ratios.
Figs. 5.15 and 5.16 show that for a constant available
hydrostatic head and initial angle of opening, the amplitude
of vibration of the valve increases while the freq,uency decreases
as spring stiffness increases. This is, of course, contrary
to the effect ~ increased stiffness on free vibratiqns. The
appar~nt explanation for this phenomenon is that the
increased spring force meant increased resistance to valve
closure, This slows down the closing part of the cycle
considerahly, thus changing the form of the hydrodynamic ~I 'J
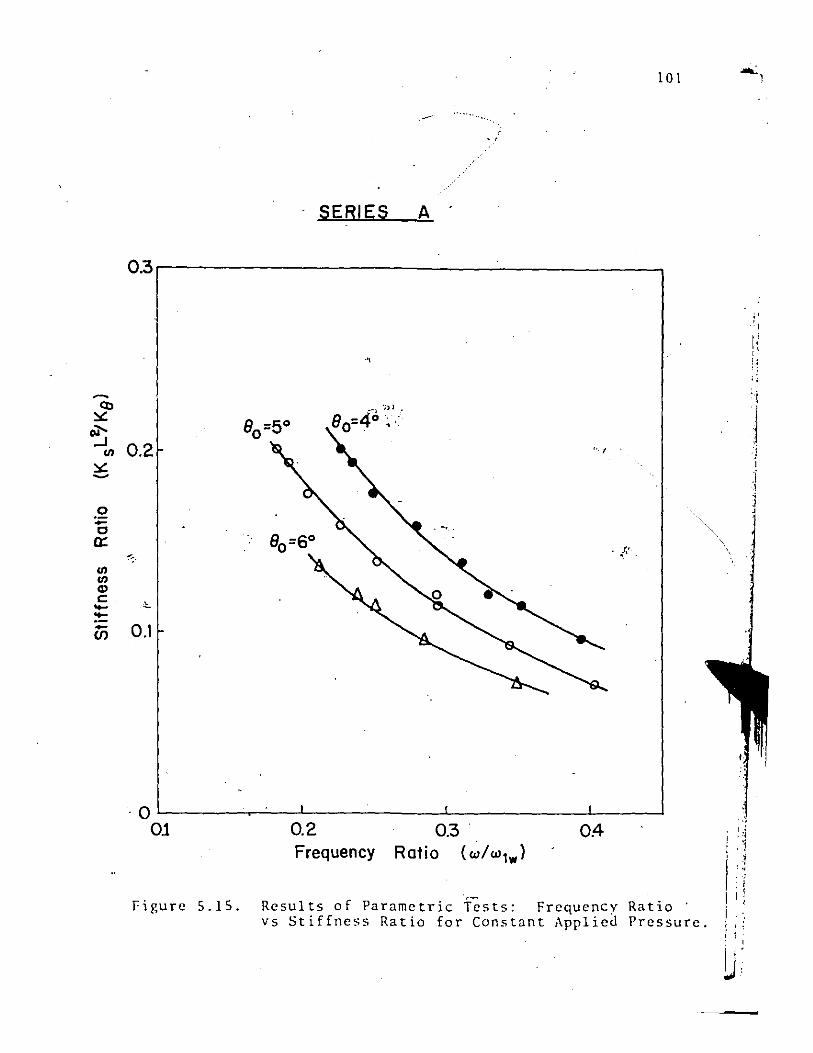
101 -':1
SERIES A
0.3,---------------------,
o ~ o a::
<II <II Q) c: ..... ~ -U5 0.1
",
. P' .
OL---__ ~~--L-------____ L_ __ ~ ______ L_ __ ~
0.1
Figure 5.15,
0,2 0.3 04-Frequency Ratio {wi W1W}
Results of Parametric"-;;sts: Frequency Ratio' vs Stiffness Ratio for Constant Applied Pressure,
'j
1 '. I j
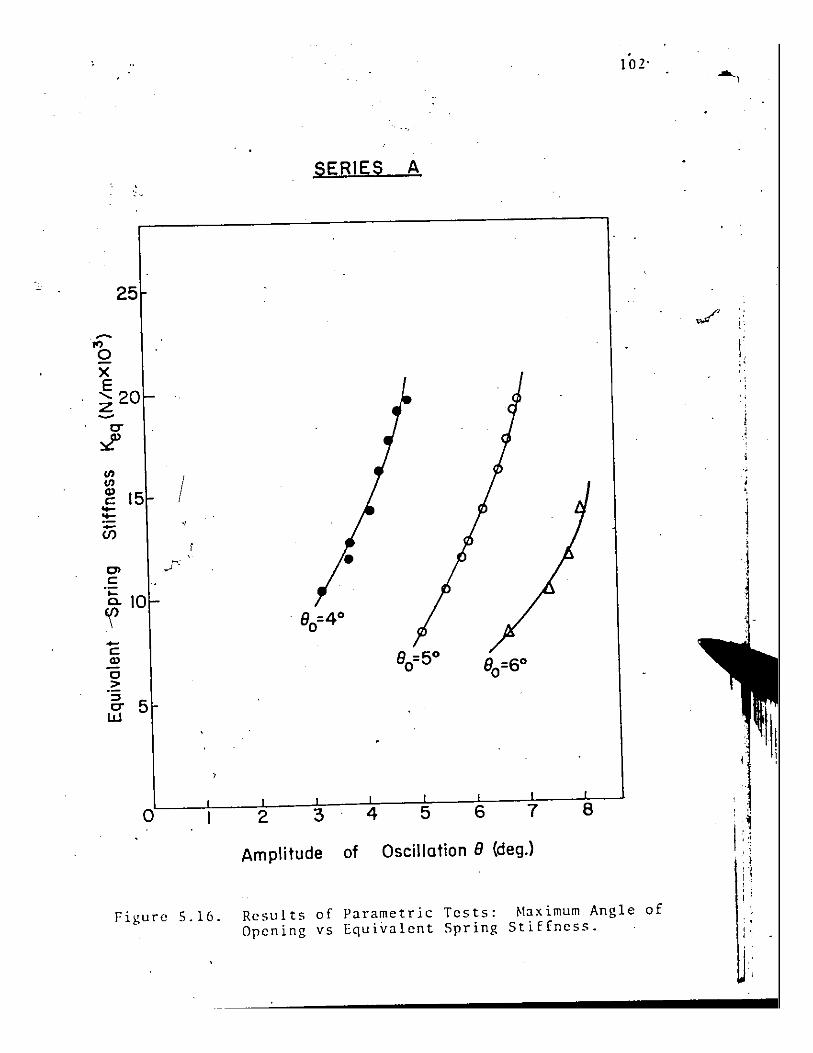
. 102'
SERIES A
25
~ .., 0 x E
...... 20 z ~
0-
~ en
I en Q)
15 c --- " (/)
0- .F c 'C
10 c.
'f -c Q)
0 > => 5 0-W
o 2 3 4 5 6 7 8
Amplitude of Oscillation 8 (deg.)
Figure 5.16. Results of Parametric Tests: Maximum Angle of Opening vs Equivalent Spring Stiffness.
/ !'.
j , .,
I·
. . , . , .
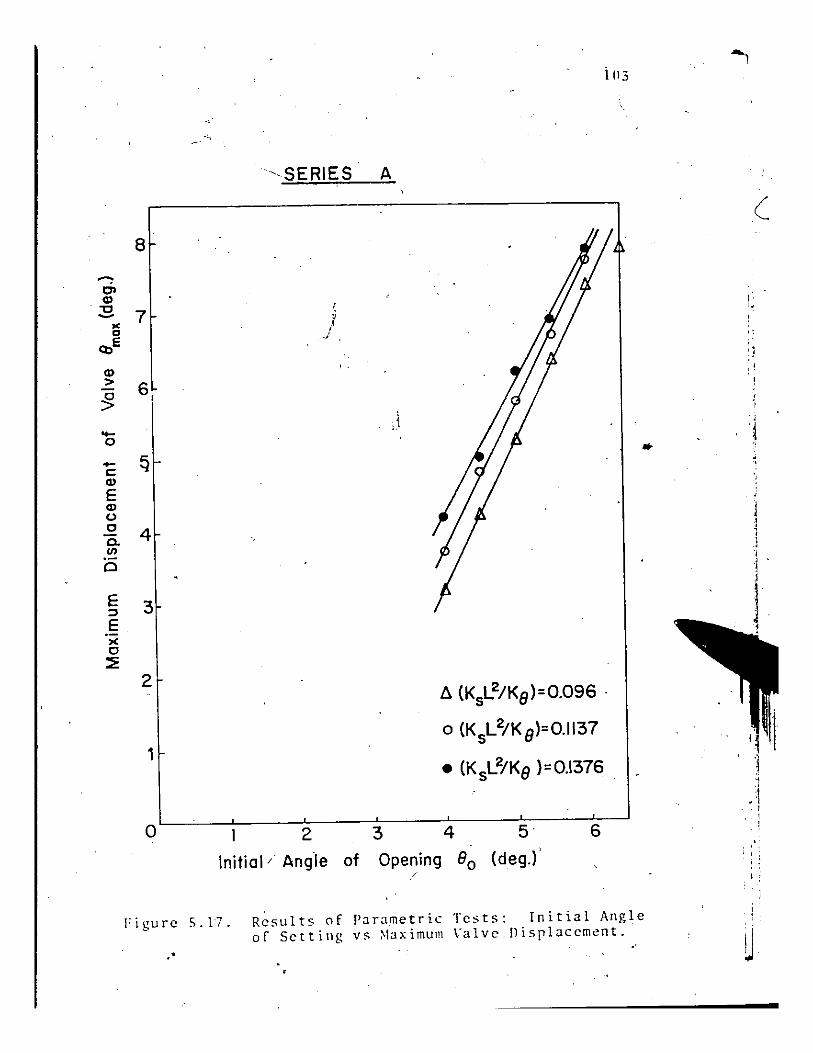
~
co Q) "0 ~
JC 0
t:l)E
Q)
>
~ -0
.... c Q)
E Q) (.)
0 Co III
0
E ::::I
E >< 0 ~
8
7
6
q
4
3
2
1
o
'~-SERIES A
, i .J
2 3
iIJ:;
6. (KsL2/Ke)=0.096 .
o (KsL2/Ke)=0.1137
• (Ks~/Ke )=0.1376
4 5 6
Initial/Angle of Opening eo (deg.)'
...
Figure S.17. Results ()f Parametric Tests: Initial Angle of Settillg vs Maximum ValveOisplaccment .
. '
(
I: "
'l . '
j
j 1 1 .1
.1 . , I
I
.. Ii
104
closing load whicH is a path-dependent, non-conservative force.
The net result is a lo~ering of the frequency of vibration with
'increasing spring force. Fig. 5.17 shows that foF. constant
hydrostatic head and valve stiffness the maximum valve
displacement is linearly· dependent on the initial angle, at
least in the range, of .all the measurements.
Thus, the effect of increasing stiffness and initial
angle od frequency and amplitude of vibration are qualitatively
the same. Both increase the violence of th~ vibration,
thereby threatening the structural. intcgr i tYI'0f th(! model ..•. -
at the larger values of both parameters.
5.8 Flow Visualization Studies
5.8.1 Expectations from the Flow Visualization Programme
The main reason for the considerable emphasis in
this research programme on flow visualization was. the
expectation that the vibration phenomenon would be accompanied
by observable variations in flow pattein and fluid behaviour •
in the valve
resu.l ts were
t'ron during valve vibration. Quant.itative
obt-ained from the flow visualization films for
the vibrating valv'e, while only qualitative results ,,\.e re
obta1ned from fluid flow through the valve open and held r!.:f.:'
stationary at particular angles.
T~ oscillation frequency for the unstea?y tests
was made low, and the amplitude of oscill~tion large. The
best photographic results were obt~ined for large ~mplitude,
low frequency oscillations.
--1
I

105
5-.8.2 Photographic ~Ietho_':!.
As discu~sed in (hapter 3, scction,3.5.4, the , ,
Bolex H16 Reflex l6mm C:·ine-camera was \ .' uscd for all the cinc-
photography described in this thesis.
A scrics of muitiple picturc sequcnces on l6mm,
plus-X Ncgative film was taken using this cine-camera, which
could bc operatcd up to a maximum of 64 frames p~r second.
Using either of the light sources describcd in
sc.tion 3.5.2 at full power, enough aluminium tracer was injected
into the closcd·circuit experimental system to obtain a
light meter rcading of bctween 9.5 and 10 on the Bolex camera
light meter. This value was arrived at on the bhsis of 'II.,
numerous experiments wh ich gave th.c .best photographic resul ts
for this amount of light entering thc camera. Injection of
aluminium tracer was stripped 0 this light meter reading
was obtained, thus climinating rticle conccntration from
photographic considerations.,
In order to make comparisons possible
between opening and closing portions of the vibration cycle,
the same vibration sequence was filmed at )2, 24, 32, 48 and
64 frames per second. Closcups were also filmed to focus on
some important details of thc flow. Thesc films were synchronised
with the records obtained on the Visicorder oscillograph
through a common trigger mechanism.
For the steady flow tests, still photography was
done with an Asahi-Pentax Spotmatic 35 mm single lens reflex
camera. Kodak Tri-X Ektachrome 35mm black and while film
, I.
, i 1 l .
'j 1
l :; I' -!
i ~
I'
\
having a speed ratillg in sunlight of l25 ASA wu't, used. By
injecting more aluminium tracer than was uscd for cine-,
photography, it was possible to,obtain reasonably good ~
photographs of the POl'. at the different angles of valve
opening at shutter speeds up to 1/250 second.
5.S.3 Results and Discussion
106
Fig. 5.1S shows a full view of the valve during
a vibration cycle taken with the still camera using a wide
angle lens. This picture shows the flow both upstream and
downstream of the valve and also shows the valve in the last
stages of its acceleration towards the scat. It shows that
the f-low entering the valve from the transition section is
reasonably two-dimensional. This is true whenever0the stream-
lines of flow do not cross one another and it is evident
from the picture that the streamlines 'are reasonably parallel
as the flow ent~rs the valve. The flow downstream of the
valve is seen to be quite turbulent.
Steady flow through the valve at different angles
1S featured in the next sequence of photographs up to around
So, Figs. 5.1S(b). An attempt was made in these photographs
,.,
to eliminate the three-dimensional viel, seen in Fig. 5.lS(a)., "
This resulted in loss of part of the field of view. The
increase in fluid velocity in the v<ii've apron as the angle
increased is evident from these photographs taken at the same
shutter speed. Again the turbulent natur~ of the flow in the'
valve wake is ohvious.
...
.i
, ~, " ' I,
~ ',J 'J
~
i

107
c: o .~
-,
....
o ., c:;
::
co c: o
" ~ :G ~
.r.
'" .... ~
OIl .~
j. "'~'.(
\ : I , , .1
J '.
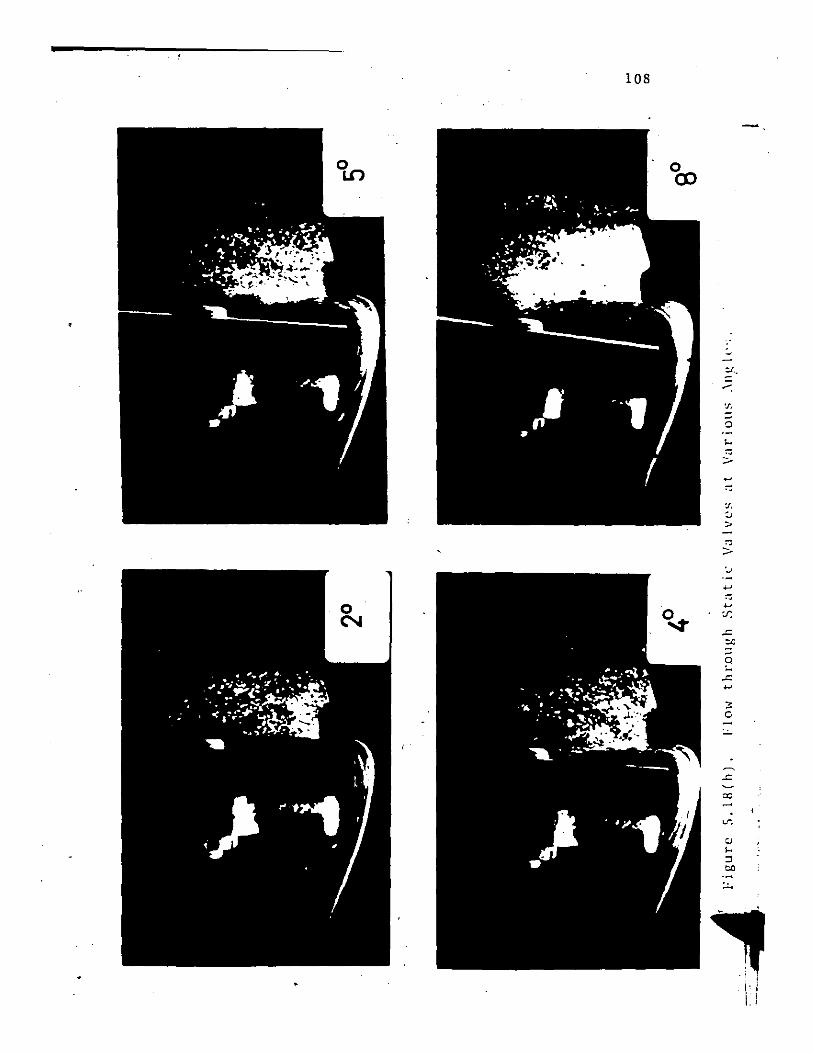
108
01I)
:. :J :: --: 'f.
a
'" >
'-'f.
" >
" > 'J
.... '-.... 0
~ :r. N
-= ",
:: 2 -.... :. ::
-
.c
'" or.
e:> .... ::1 co .~
-
., I !
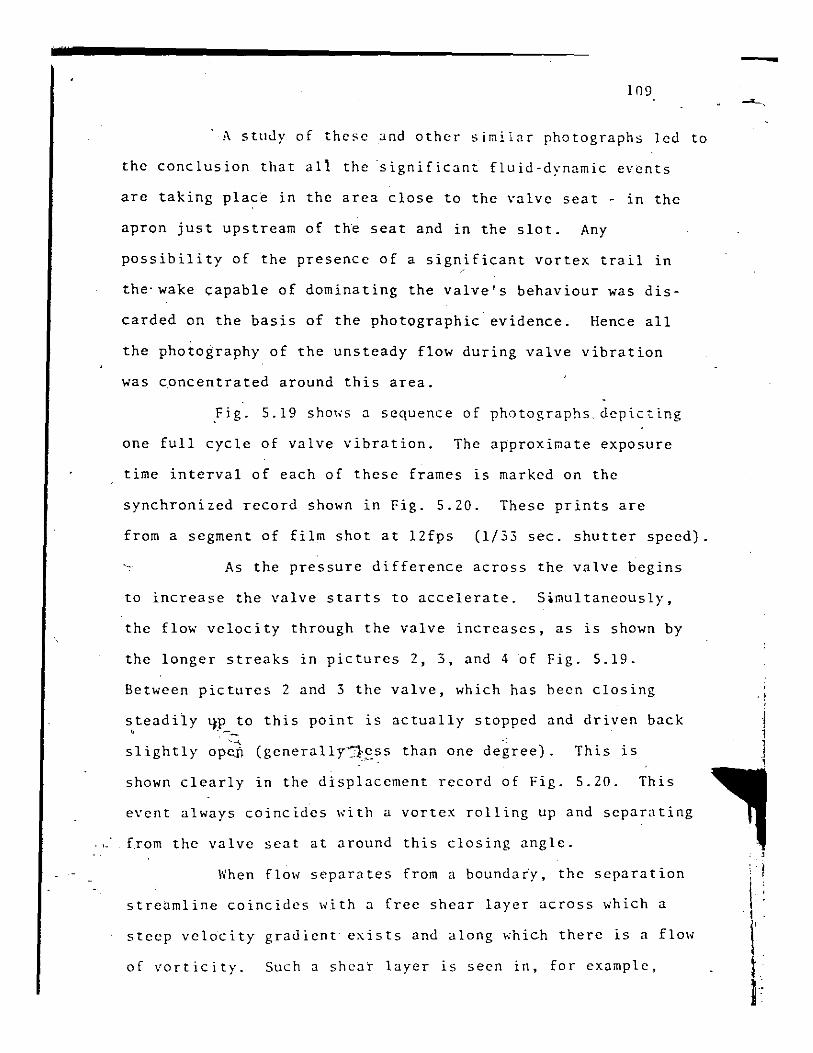
. >-
109
- A study of these and other simi lar photographs led to
the conclusion that all the 'significant fluid-dynamic events
are taking place in the area close to the valve seat - in the
apron just upstream of the seat and in the slot. Any
possibility of the presence of a significant vortex trail in
the· wake capable of dominating the valve's behaviour was dis
carded on the basis of the photographic evidence. Hence all
the photography of the unsteady flow during valve vibration
was concentrated around this area.
Yig. 5.19 shows a sequence of photographs depicting
one full cycle of valve vibration. The approximate exposure
time interval of each of these frames is marked on the
synchronized record shown in Fig. 5.20. These prints are
from a segment of film shot at 12fps (1/33 sec. shutter speed).
As the pressure difference across the valve begins
to increase the valve starts to accelerate. Simultaneously,
the flow velocity through the valve increases, as is shown by
the longer streaks in pictures 2, 3, and 4 ~f Fig. S.19.
Between pictures 2 and 3 the valve, which has been closing
~teadily qp __ to this point is actually stopped and driven back
'-' slightly open (generally~.ss than one degree). This is
shown clearly in the displacement record of Fig. S.20. This
event always coincides with a vortex rolling up and separating
from the valve scat at around this closing angle .
When flow separates from a boundafy, the separation
streamline coincides with a free shear layer across which a
steep velocity gradient exists and along h"hich there is a flO\;
of vorticity. Such a shcat layer is seen in, for example,
-
I
I r
·, 110
picture 1 of f'ig. 5.19 :.r.J in 311 the pic;:ures of Figs. 5.21
and 5.22, as a result of flo~ sep3ration from the do~ns[ream
edge of the valve disc. As the valve closes, the motion of
the disc generates a disturbance of this free shear layer.
. : The vorticity of the free shear layer becomes concentrated in
I~·
" ~. . ~.:.~ "the growing disturbance as shown in picture 3 of Fig .. 5.21
and pictures 11 to 16 of Fig. 5.22 and leads to the formation
of the vortex shown in these pi.ctures. This vortex groHs
in size as it entrains fluid from the valve wake.
As the rc13tivcly large ~ortcx leaves the SC3t
(pictures 14 and IS, Fig. 5.22), the downstream pressure
momentarily increases, thereby arresting the closing motion.
The closing motion resumes as the vortex is swept into the
wake flow.
As flow area decreases, the fluid velocity increases
and this can be seen from pictures 3, 4 and 5 of Fig. 5.19.
BetHeen pictures 4 and 5 there is a radical increase in pressure
difference across the valve, Fig. 5.20. This causes the valve
to begin its sudden acceleration to~ards the seat. This
acceleratjon IS clearly evident in picture 5 of Fig. 5.19
",hich sho",s the disc ~urred and the fluid moving at a
relatively high VClOCit~. As the disc slams on the seat, this
fluid velocity .~ reduced suddenly to zero. The main effect ,_>./1"~ , observed on the films is the appearance of "tad-pole" like
streaks, "hich are sho,,-n in the pictures of Fig. 5.23. The
occurrence of very high waterhammer pr~ssure ~aves and thei.
reflections results in the high pressure difference seen in
Fig. 5.20, keepil)g the \,<!h'c closed against the seat. The
, : !
&
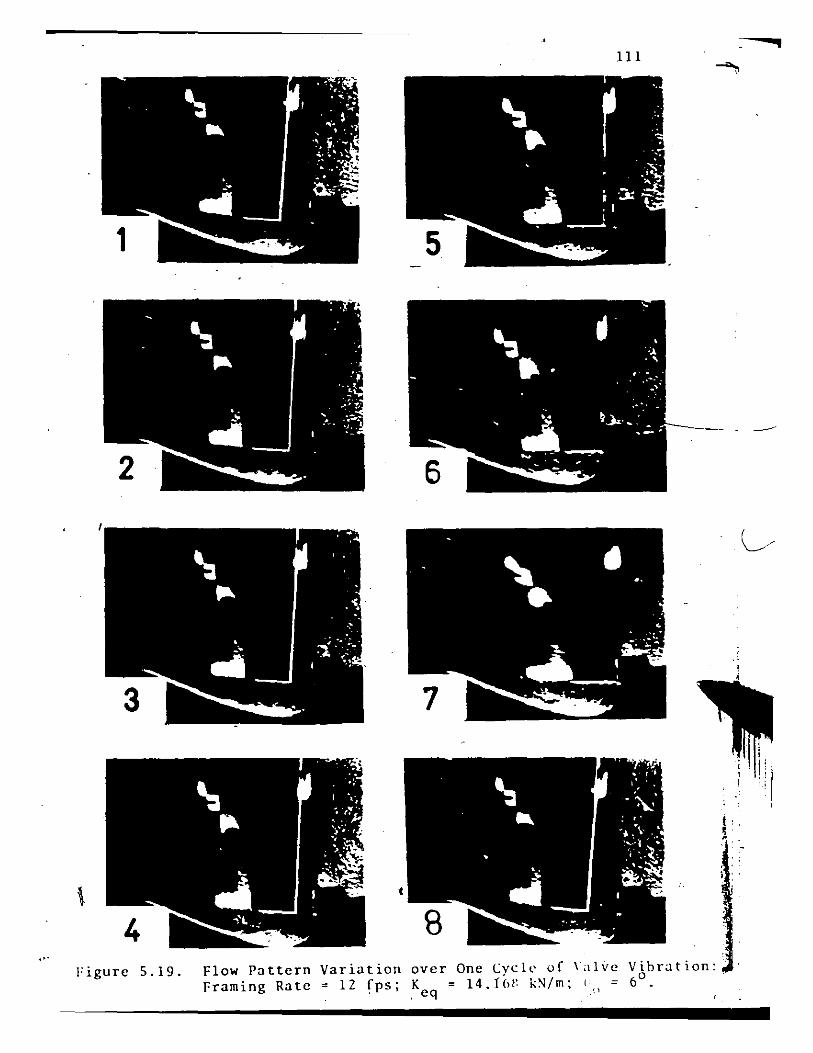
Figure 5.19. Flow Pattern Variation Framing Rate = 12 Cps;
III
over One Cvcle oC "'live Vibration: 6°. K = 14.fC,f: k:-l/m; (
. eq "
'1

.>
PRESSURE DIFFERENCE
Datum" -_ .. -.
1 ....... .."_.
TORQUE,
Fi!\ure S.20.
• H.'I" .. ..:f1,.;..;.;-·y· ..... ·j·...,- .~~ •. -
"s-
; -- -"-----.
. -- ·r··--~l ~---r-h--~ I I I . ,., • ' I I 'j " , ! ','
Synchroniscu Dynamic ileasurcmcnt or Vihration Reconlcd ill
Figure s.~ .. ,. '- --c-)
.-'
)
~
Iv
I
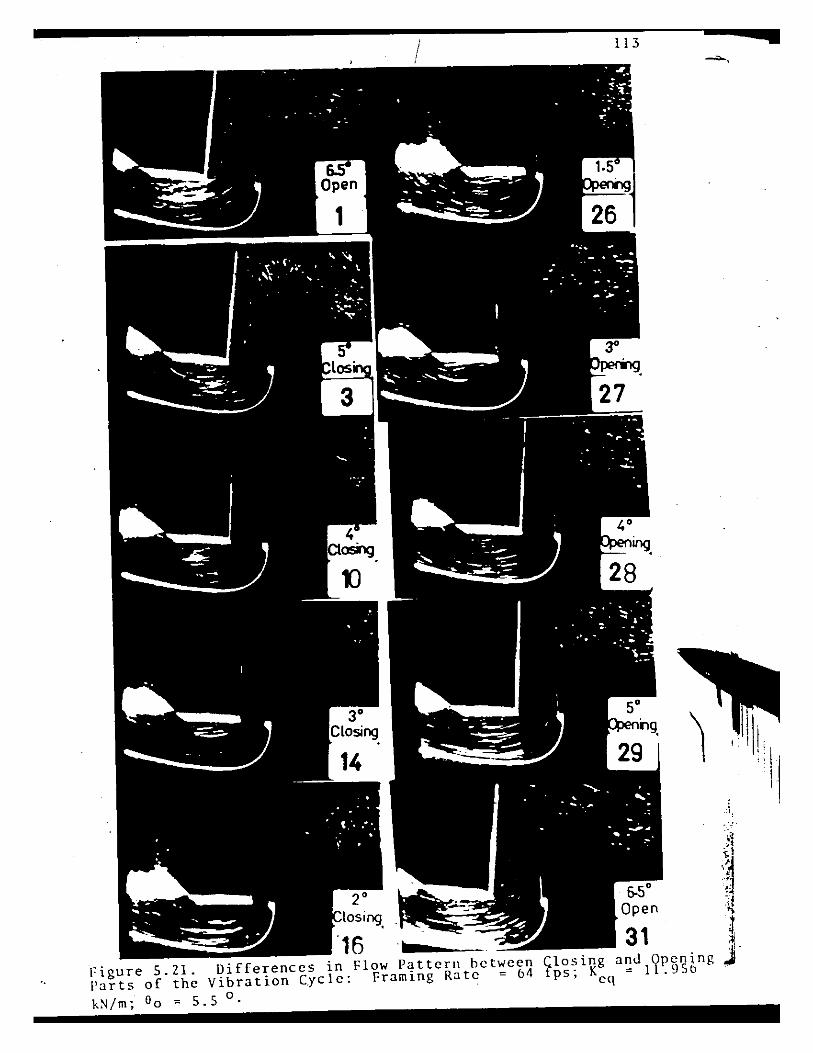
Figure 5.21. Differences in Flow Patter!! between Parts of the Vibration Cycle: Framing Rate = 04
k!'l/m; 00 = 5.5 0
113
.. .'" .:\1
111 .~
l .; Closing and Opening J. fps· K = 11.95b , eq
a
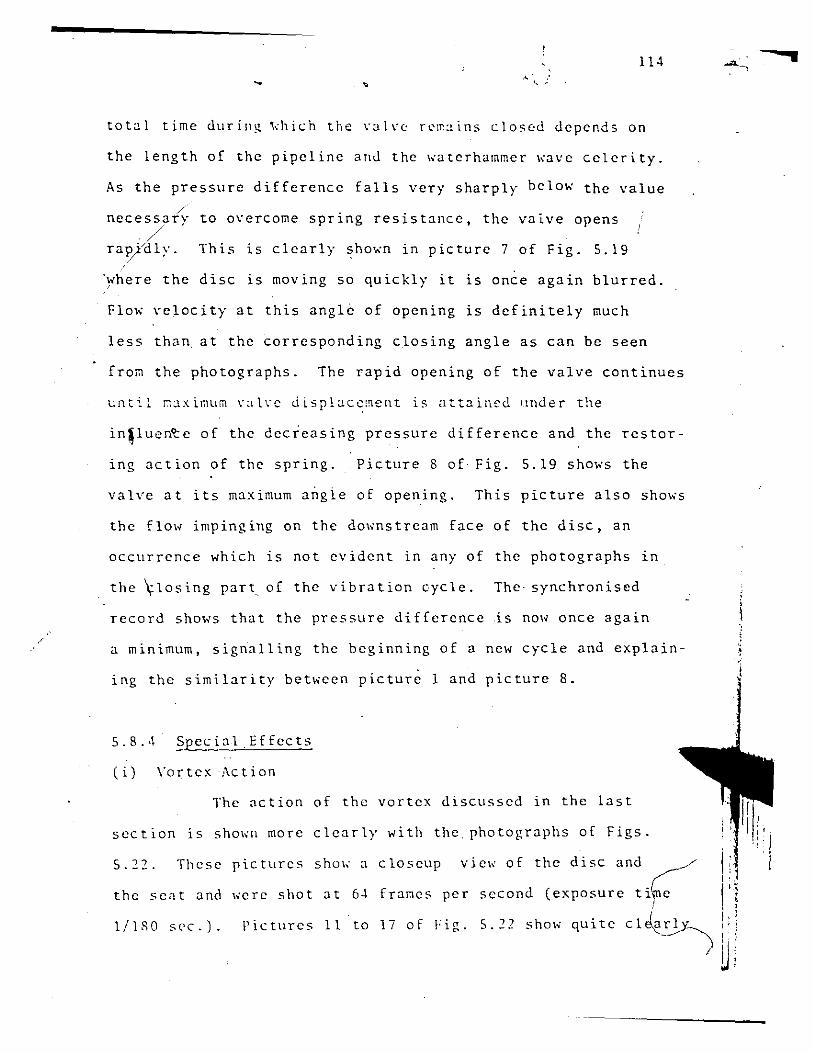
114
total time durillR ~hich the valve remaIns closed depends on
the length of the pipeline alld the ~aterhammer ~ave celerity.
As the pressure difference falls very sharply below the value
/ necessary to overcome spring resistance, the valve opens
ra~-a;y.· This 1S clearly shown in picture 7 of Fig. 5.19
'~here the disc 1S moving so quickly it is once again blurred.
Flo~ velocity at this angl~ of opening 1S definitely much
less than. at the corresponding closing angle as can be seen
from the photographs. The rapid opening of the valve continues
until. n:.lxir.1ufTI val\"c J.ispl:.lc~ment is attained 1lnder the
inpucn'Ce of the decreasing pressure difference and the restor-
ing action of the spring. Picture 8 of Fig. 5.19 shows the
valve at its maximum a~gie of opening. This picture also sho~s
the flow impinging on the downstream face of the disc, an
occurrence which 1S not evident in any of the photographs 1n
the \losing part of the vibration cycle. The synchronised
record shows that the pressure difference is now once again
a minimum, sigrialling the beginning of a new cycle and explain
ing the similarity between picture I and picture 8.
5.8.4 Special Effects
(i) VortexAction
The action of the vortex discussed in the last
section is sho~n more clearly with the photographs of Figs.
5.22. These pictures sho~ a closeup V1ew of the disc and I: the seat and were shot at 6.\ frames per second (exposure ti~ I;
Pictures 11 to 17 of Fig. 5.22 shoh' quite ClJe!j~ i: ) 'I
lJ
I/lRO Sl'C.).
1
Figure S.ZZ. Special Effects: Vortex fps. Keq = 14.168 kN/m;
Action: Framing o = 60
o .
115
Rate = 64
\

Figure 5.22. Continued.
~ 116
-'. 117
that the motion of the d{sc is arrested as the vortex rolls
up and leaves, (Fig. 5.2", picture 16).
(ii) Appearance of "Tadpoles"
Pictures 1 and 2 of Fig. 5.23 show the effect
produced when the fluid motion is suddenly stopped by the
valve closure. The effect on fluid mot.ion of the rapid
opening of the valve is shown in picture 3. Both rapid
deceleration and acceleration produce "tadpole"-like streaks, o
the body el.d resulting from the longer pl.otographic exposure
• of the stationary aluminium particle. Of course, the tail of
these "tadpoles" 'are produced when the fluid is moving. Hence,
the tails point upstream when the valve shuts, and point down-
stream when the valve suddenly opens.
In summary the following g~neral comments are offered
on the difficulties of the flow-visualization f~r this problem.
(a) At lower framing rates (be!J"eenI2 and 24 frames/sec)
the flow in the valve apron appears as well-defined long
streaks making reasonably precis~ flow-v~l~city measurements
possible. However, the flow in the slot is not so well-defined
because the high flow velocity does not allow suffici~nt time
for film exposure of the particles. Also, the high velocity
of the valve disc near closure and opening results in its
blurred appea~ance.
(b) At higher framing rates (between 32 and 64 frames/sec),
the flow in the apron appears as shorter streaks because of the
smaller exposure time. Velocity measurements at these framing
rates are therefore more susceptible to error. However, a much
-
llS
Figure 5.23. Special Effects: "Tadpoles" at Closure and at Opening of Valve.
I
I , b
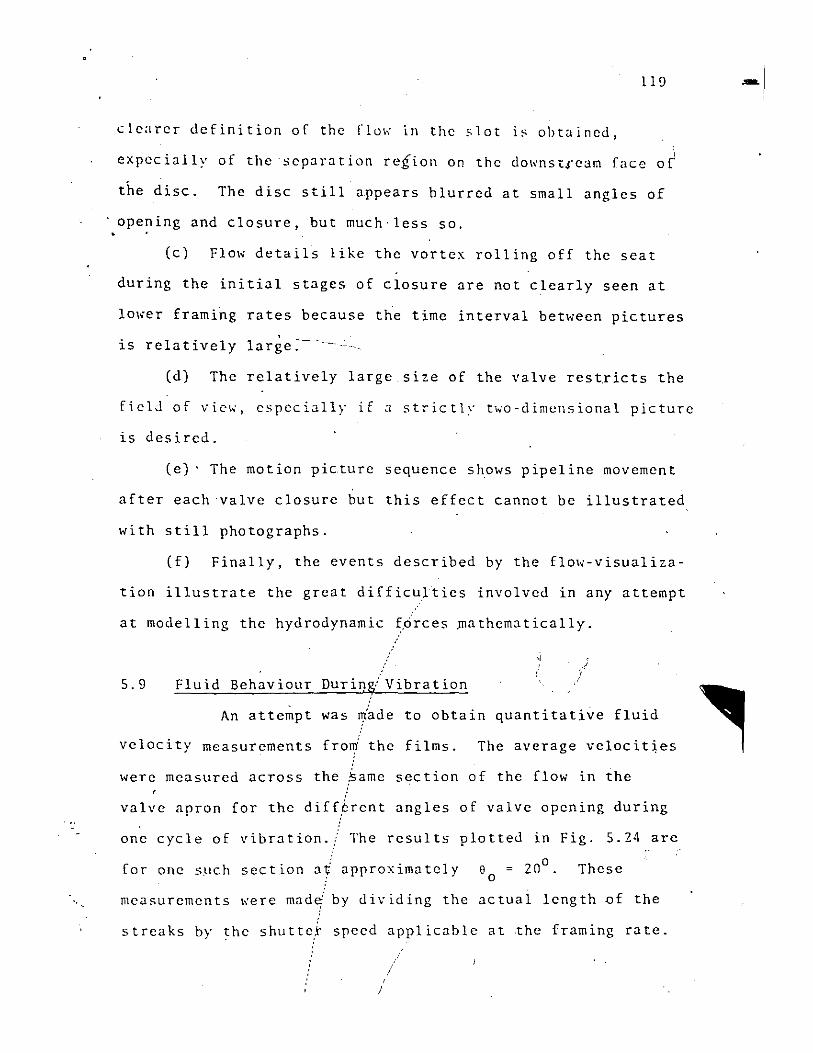
119
ete'lrer definition of the rlu~ in the slot is o\Jtained,
expecially of the separation reiiOll on the do~nst,eam face o~
the disc. The disc still appears blurred at small angles of
opening and closure, but much,less so.
(c) Flow details like the vortex rolling off the seat
during the initial stages of closure are not clearly seen at
lower framing rates because the time interval between pictures
is rela t ivel y large ~~'- ,'"
(d) The relatively large size of the valve restricts the
field of vic~, especially if a strictlv t~o-dimellsional picture
1S desired.
(el' The motion picture sequence shows pipeline movement
after each valve closure but this effect cannot be illustrated
with still photographs.
(fl Finally, the events described by the flow-visualiza-
tion illustrate the great difficulties involved in any attempt
at modelling the hydrodynamic ~,circes .mathematically.
5.9 Fluid Behaviour Duriq~Vibration
An attempt was Iliade to obtain quantitative fluid
velocity measurements fro~ the films. The average velocit~es
were measured across the ~ame section of the flow in the
valve apron for the diff/rent angles of valve opening during
one cycle of vibration.,' The results plotted in Fig. 5.24 are
[or one sllch section at approximately 60
= ZOo. These
measurements ~ere mad~ by dividing the actual length of the
streaks by the shutter speed applicable at ~he framing rate.
/ , !
~I
,
0.6
0.5
"0.4
<..> o ~
ill > ~o. o ~
LL ...
ill en C1J L-g: 0.1 <!
o
I I
o 00
o '0 e • ---........ -- .
/ . A '0,.~ 0 / AD.- "-I, A "
-J " ·0 I ~
I t.. f; '\
I f
•
\ q
\ l:q . /
121l
I ( 0 o /~ 8
0 - ..... 7 I - ...-I
, - ........ 0....../
0
/. ~/ 0
0/ 6
./ /" 6 "
/ A 12 tp.s '" '"
0 r .
. 24 tp.s • \ \
, \ 0 48 f.p.s
7 AngLe of opgning, 9-CdegJ
Figure S .. Z4~ Velocity ~1eDsurclncnts Across a Section of the Valve Apron fluring D Typic:a1 Cycle of Vibration.
•
, I . , , .
I' :
I

')
An avera~~ for a numher of sucl. measurements ~as taken across 'I
the section on each frame and the va h'e angular displacement
represented on the frame ~*s also, determined, ~ •
. ') 'In Fig. 5.24, the same v,ibration sequ'ence was
filme-~-at 12, 24 and 48 frames pel'second, and the measurements
were made across the same section in th~ valve-apron. The
results indicate quite clearly that at the same valve angular ,
displacement, fluid velocities are much greater during closing
than during the opening Ptrt of the cycle.
~ho"h in,Ag. 5.19 confirms
A visual.examinatign
of the pic tares this. In the ~:"!J
closing part of the cycle the flow v&locity incieases t~ some
maximum value around 30 valve angular displacement and ther~:
after drops rapidly towards zero as the disc accelerates
towards its seat.
Because the flow is unst;ady, a change in the
total pressure drop across the valve is needed to accelerat~
and decelerate the fluid within the ~ystem. The conjugate
pair of variables, P,.Q, used to describe such unsteady flow
must satisfy the equation
I ~ ~ liP (5.5)
where I is the pipeline inertance,
Q is the discharge, and
liP is the pressure difference,
"
The development of the inertia pressure becomes conceptually
,'. r -
'{
obvious from this equation as the flow passage diminishes very
II ,
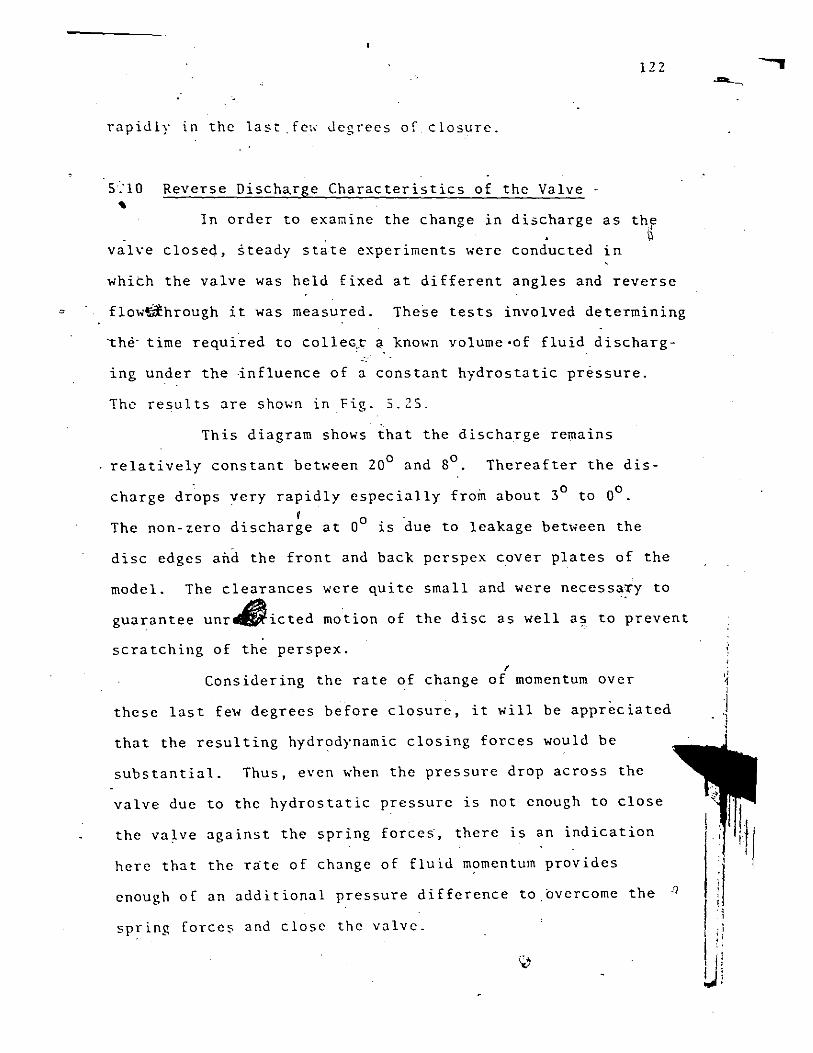
122
rapidly in thc last .fCh dcgrees of closurc.
S~IO Reverse Discharge Characteristics of thc Valve -
In order to exaQine the change in discharge as the ~
val~e closed, iteady state experiments were conducted in
which the valve was held fixed at different angles and reverse
~ flow~hrough it was measured. These tests invo lved determining
-the· time required to colleG,:t a known volume ·of fluid discharg-
ing under the influence of a constant hydrostatic pr~ssure.
The results are shown in Fig. 5.25.
This diagram shows that the discharge remains
relatively constant between 20° and So. Thereafter the dis
charge drops very rapidly especially from about 30 to 0°. r
The non-zero discharge at 00 is due to leakage between the
disc edges arid the front and back perspex cover plates of the
model. The clearances were quite small and were necessa:x-y to
guarantee unr~icted motion of the disc as well as to prevent
scjatching of the perspex. {
Considering the rate of change of momentum over
these last few degrees before closure, it will be appreciated
that the resulting hydrodynamic closing forces would be
substantial. Thus, even when the pressure drop across the
valve due to the hydrostatic pressure is not enough to close
the valve against the spring force~, therc is an indication
here that the rate of change of fluid momentum provides
cnough of an additional pressure difference to.overcome the
spring forces and closc thc valve. ! i I ' U
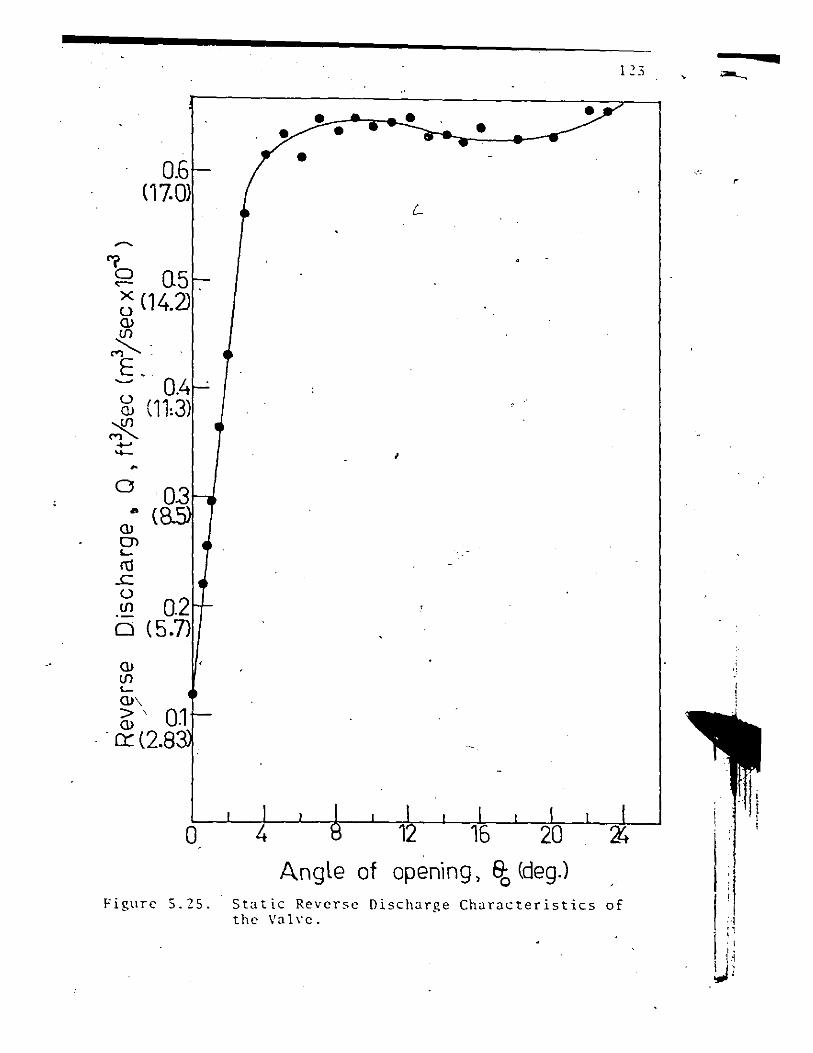
0.6 (17.0)
o '0.3 ,. (
OJ O"l L..
1'1::1 ..c:: u til 0.2 o (5.7)
OJ til L-
OJ\ ~ \ 01
.. a:: (2.8
o
123
• • •
,
Angle of opening) 80 (deg.) Figure 5.25. Static Reverse Discharge Characteristics of I !
the Valve. . ;;
I U
a
124
It is ~mphasized here that the static discharge
characteristic of Fig. 5.25 does not apply quantitatively
under the unsteady flow conditions of valve vibration. However,
it provides a qualitative indication of the reverse discharge
during valve closure.
It appears that the sudden drop in discharge flccurs
at slightly smaller angles while the increase in discharge
occurs at larger angles under dynamic conditions.
For these-experiments the pressurefdifference across
the valve ~as also measured at each fixed angle. Based on
the equation
(5.6)
a curve of the reverse _discharge coefficient against angle of
closur~ was plotted as shown in Fig. 5.26. This curve is based
on the actual minimum -area available -to the flow. Thjs
behaviour agrees very well with that of the prototype valve
reported by Weaver, Kouwen and Mansour [SO].
5.11 Summary 0f Results: Mechanism of Instability
~ By summarizing the main results of the work reported
in this chapter, it is possible to deduce the mechanism by
which the dynamic instability observed with this valve is
generated.
Analysis of the records of the valve vibration •• indicate that there is a sudden increase in hydrodynamic
I
I u
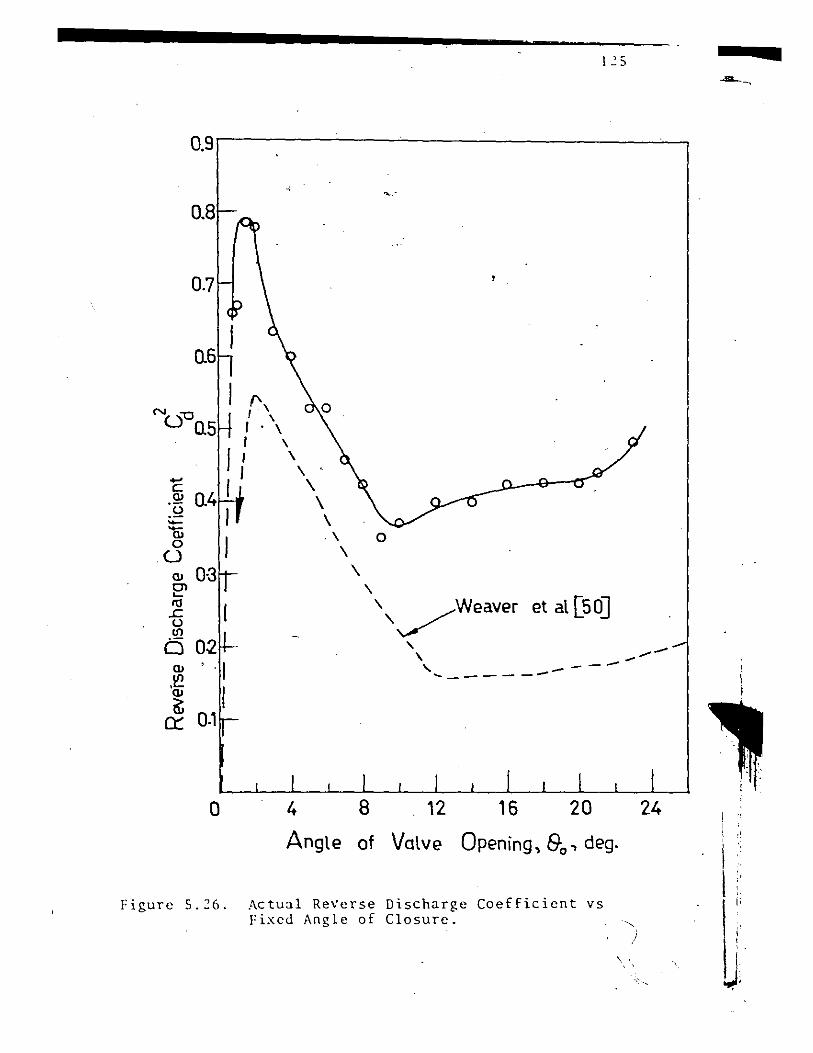
0.9.--------'----------'--,
0.8
0.7
0.6
f'\ N ~ I U~o.5 I \
I \ , I: \ j 0.4 : t \, J I '\
o 4
o
\
'\
8
'\ '--
12
------ ---
16 20
Angle of Valve Opening, &o~ deg.
Figure S.c6. Actual ReVerse Discharge Coefficient vs Fixed Angle of Closure.
..... --
24
'" ) \' , ,
a
: ~
( , , ,

126
/
closing load as the \-al\-e :lpproaches its SC:lt, Figs. 5.4 to
5.S and Figs. 5.10 to 5.14. The cause of this sudden increase
in closing load is· the changing disch:lrge characteristic of the
valve especially in the last few degrees of closure .
As the valve slams onto its seat waterhammer .\ 1t. pressure waves are_generated upstream and downstream of
The valve, responding only to the pressure difference across
it, remains on its seat until this pressure difference reduces
to a point where it ei ther forces the val v.e_ open, or alloHs
the spring restoring forc~s to initiate opening. As Figs.
5.10 to 5.14 ShOI', the hydrodynamic closing load is substantially
less . ~ -f h h" h during the open1ng part 0 t e cycle t an 1t 1S at t e
same angle during the closing part. This hysteretic effect
indicates that there is a net energy transfer 'from the fluid
during each cycle and the vibration is perpetuated.
Thus the mechanism of excitation of the valve
vibration 1S governed mainly by the nature of the hydrodynamic
closing load which is closely controlled by the reverse
discharge characteristics of the valve.
a
!
I u
CHAPTER 6
INVESTIGATIO:\ O-F DESIG:\ CHANGES TO ELHIINATE VAL\'E VIBR.\TION
6.1 Introduction
I
The vibration experienced with the valve was self-
excited. Its mechanism of excitation was found to depend
mainly on the dynamic discharge characteristics during the
last stages of closure. ·It was therefore reali~ed thJt the
vibration could not be eliminated by adjustments of damping or
other structural parameters and that only a change in valve
geometry, which changed the discharge characteristics, could
~rovide relief from the dynamic instability. In particular,
it is necessary to reduce the discharge over a much greater
angle of closure so that there ii no sudden rise in closing
pressure difference across the valve.
Various changes to the design of the valve were
evolved; each design change was capable of generating a more
gradual reduction in reverse discharge at small angles of
valve opening than the original design. However, it could not
be known beforehand precisely how each modification to the
valve geometry would modify the flow rate to achieve the
desired result. In order to determine the most effective and
economical measure to eliminate the valve vibration, a number
of changes
( i) to the valve apron geometry,
(ii) to the valve plat0, and
12"
" "
" ,. I
U
, '
128
( iii) to the v31ve seat
were tested on the model to determine their ef.fectiveness·
singly and in various combinations. The results of this
experimental investigation leading to a practical solution
of the vibration problem are repor~ed in this chapter.
A major design ~riterion specified by the manu
facturer was that it must be possible to pass, through the
valve, a steel sphere of the same'diameter as the pipe for
which the valve is used. This criterion was fulfilled in all
the design modific3tions tested.
6.2 Criterion for an Effective Solution
A completely successful solution of the vibration
problem requires that the dy~amic behaviour of the modified
valve must match the static system characteristic of Fig. 5.1 .
. This means that the valve must be stable at all points on its
stability map. Below the static system characteristic the
valve must close without vibration and remain closed; above
the static system characteristic the valve should remain open
at a small angle determined by the differe.nce between spring
force and available hydrostatic pressure. The degree of
effectiveness of a given design modification is indicated by
how closely the dynamic behaviour of the modified valve
conforms to the ahove.
In evaluating a design modification, the stability
diagram has been chosen as the sale indication of its effective-
ness. In a number of cases the static reverse diSCharge
-
,
129
characteristic ~as determined for com~'2ri~0n ~itl1 that of the
original d~sigIl and to fo~t~r an llnJcrst3n~iilg .of the renson
for their ~ffectiveness or lack of same.
The modified designs tested ~ere arbitraril~ labelled
series B, C, D, E or some comhination of these for identifica-
tion purposes. On this basis the series of experi~ents on the
original design was called series A. Series B generally /
involved valve body geometry modification; series C involved
the use of appendages to the valve plate, and series D
irtvolved a change in the valve seat geometry.
6.3 Series B Experiments and Results
Series B experiments involved tests carried out on
the valve with only the valve apron modified. The principle
of't~e design modification was to reduce the discharge at
·small angles before the valve reached i~s seat. This was
carried out by filling the apron as sho~n in Fig. 6.1 with a
perspex p.late attached to it with silicone sealant adhesive. -~
Shown on the valve drawing in dotted line is the actual
shape desired. It was observed that the limiting streamline
very closely conformed to the desired geometry~ The approxi-
mation had the advantage of being much less expensive to make
as well as being easily removable.
Also shown on Fig. 6.1 is the stability map for the
valve modified in this way. Th~ static system characteristic
o[ Fig. 5.2 is shown in dashed lines on the graph.
Comparison witl, Fig. 5.3 shows that the region of
self-excitation both.ahove and helow the static svstem
-
\ I ..
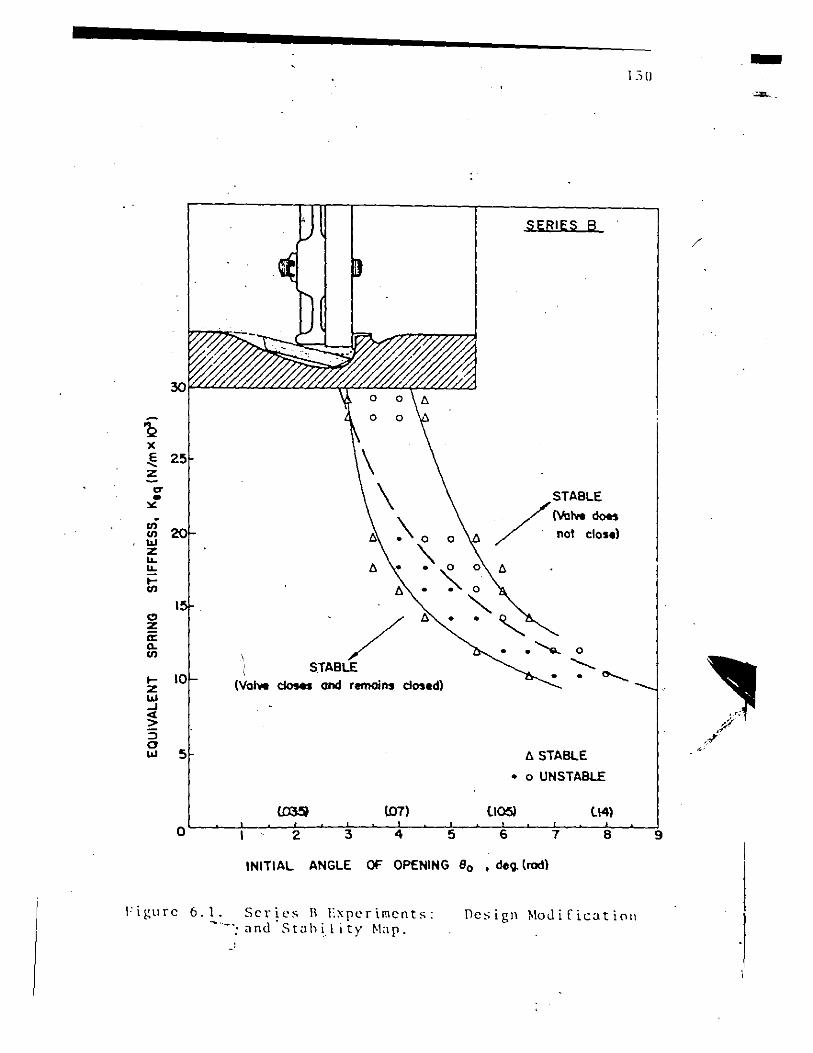
en UI ... Z IL U.
ti <:I Z a: Q. UI
IZ ... ~ :::l a ...
o
/ \ STABLE
(VoM doMs and remains cloud)
lO7)
2
SERIES B
STABLE
/
I\'olw does
not closel
•
11 STABLE
• 0 UNSTABLE
tl4)
130
INITIAL ANGLE OF OPENING 80 • deQ.lrod)
Figure 6.1. Series B Experiments: -'-'; and' St<lh i.I i ty ~Iap.
Design Mouificatiol\
.-.~-
/
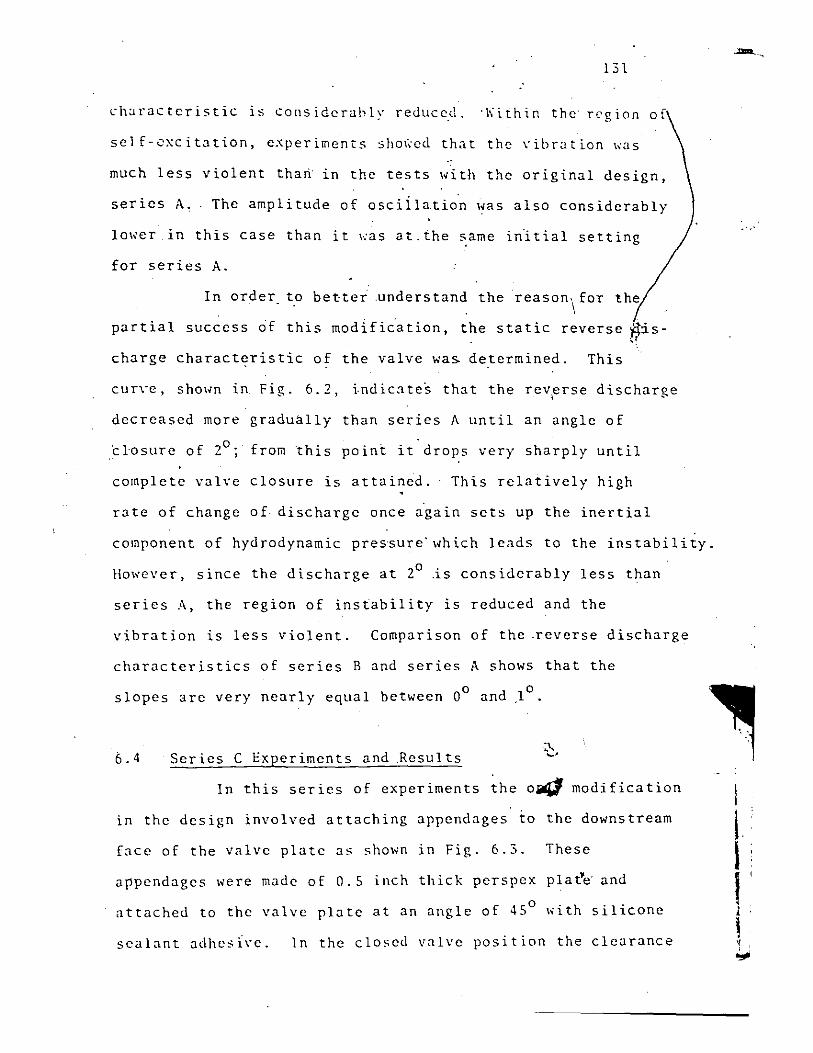
131
characteristic is considerahlr reduced. 'Kifhin the' region of
scI f-excitati.on, experiments shol;'ed that the vibration "as
much less violent tha~ in the tests with the origi.nal design,
series A. The amplitude of osciilatio~ was also considerably
lo"er in this case than it ~as at.the same initial setting
for series A.
In order to be~terunderstand the reason\for the
partial success of this modl.fic'ation, the static reverse ~s'~!
charge characteristic of the valve was determined. This
curve, shown in Fig. 6.2, indic3te~ that the reVerse discharge ,
decreased more gradublly than series A until an angle of
,'cl-osure of 20; from this point it drops very sharply until
complete valve closure is attained. This relatively high
rate of change of, discharge once again sets up the inertial
component of hydrodynamic pres'sure' \~hich leads to the instability.
However, since the discharge at 20 ~s considerably less than
series A, the region of instability is reduced and the
vibration is less violent. Comparison of the ,reverse discharge
characteristics of series B and series A shows that the
o 0 slopes are very nearly equal between 0 and.l .
6.4 Series C Experiments and .Results
In this series of experiments the o~ modification
in the design involved attaching appendages ~o the downstream
face of the valve plate as shown in Fig. 6.3. These
appendages ,;ere made of 0.5 inch thick perspex plat'e' and o attached to the valve plate at an angle of 4S ,;ith silicone
sealant adhcslve. In the closed valve position the clearance
1
I , I' j
~ 'I
~
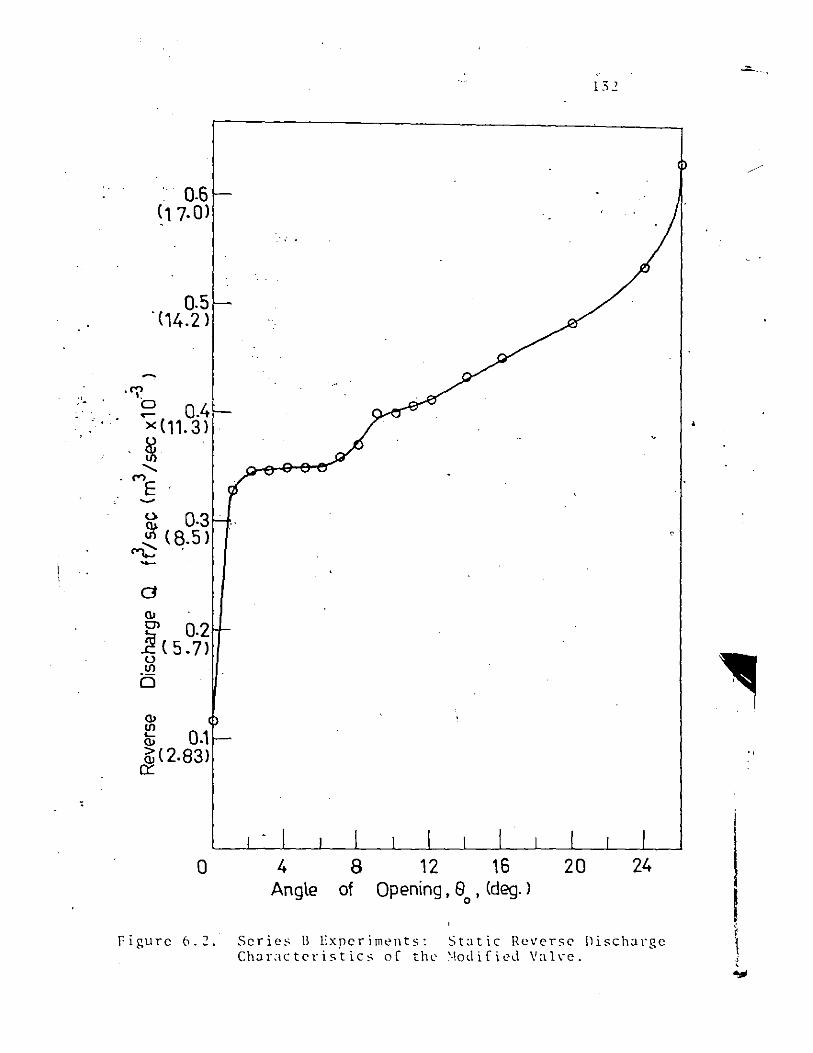
., ..
•. 0.6 (1 7· 0)
0.5 '(14.2)
~ 0·3 ~ (8.5)
-<l> 01 0.2 ~ ( 5.7) u <f)
o <l> <f)
Ii; 0.1 6; (2·83)
0::
o
-'" .
4 8 Angle of
...::::....--, 132
"
12 16 20 24 Opening. e . (deg. )
o ,
Figure 6.2. Series 8 Experiments: Static Reverse Oischargc \ Char:lctcristics of the ~odifieJ Valve. i ....
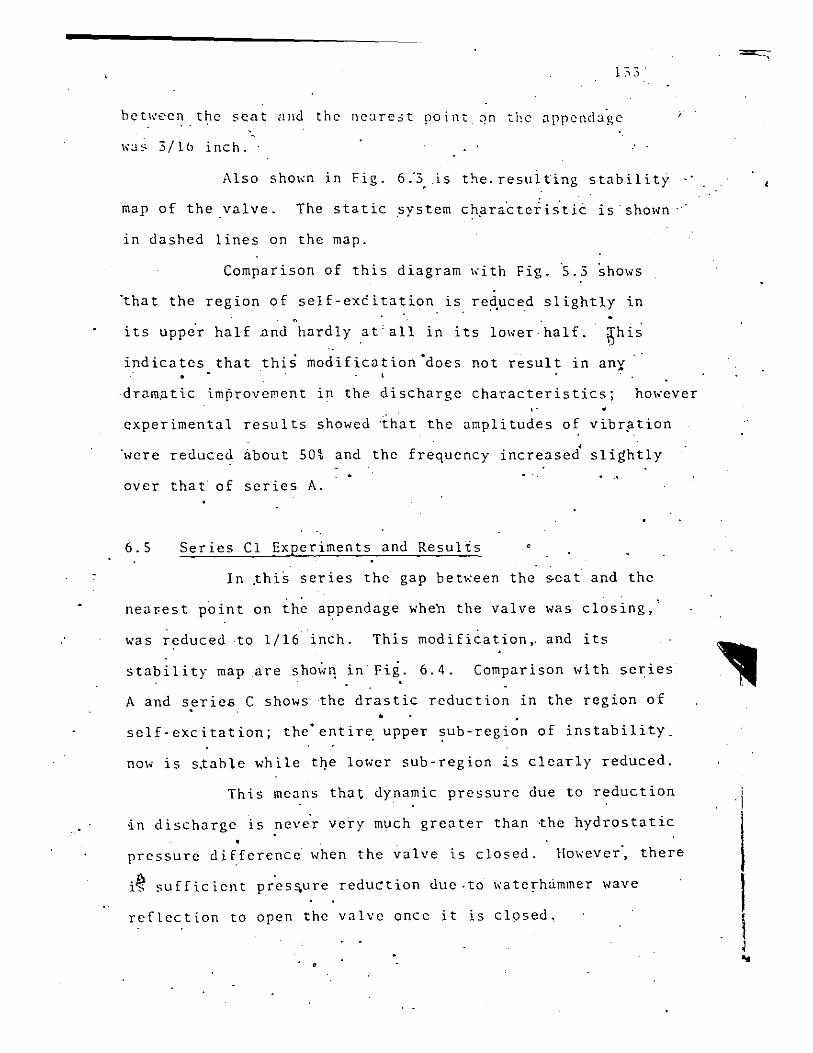
beth'een the scat illld the nearest po i nt qn the ilppcncl'q~e '-1<,,,, 3/1" inch. .' .
Also shol<n in Fig. 6:3 .is the. resulting stilbility
map of the valve. The static system ch~ra~tciiiti~ is shown .
in dashed lines on the map.
Comparison of this diagram I<ith Fig. ~.3 ~hows
'that the region of self-excitation is red.uced slightly in . .
its upper half and hardly at'all in its lower·half. ~his ..
indicates that this modification'does not result in anx
dram~tic im~rovement in the discharge characteristics; however " •
Gxperimental results showed ihat the amplitudes o~ vibr~tion ,
were reduced ~bout 50% and the frequency increased slightly .. ,
over that of series A.
6.5 Series Cl Experiments and Results •
In lhi~ series the gap betl<een the seat and the
near-est point on the appendage when the valve was closing,
was reduced to 1/16 inch. This modification,. and its
stability map are sho~q in Fii. 6.4. Comparison with series
A and s~rie& C shows the drastic reduction in the region of •
self-excitation; the'entir~ upper ~ub-region of instability.
now is sXable while t~e lower SUb-region is clearly reduced.
This means that dynamic pressure due to reduction
in discharge is never very much greater than ~he hydrostatic
pressure difference when the valve is closed. tlol<ever~ there
i~ sufficient pres,;ure redUCtion due.to I<ate,hammer wave
reflection to open the valve once it is closed,
. .
i
I I ..
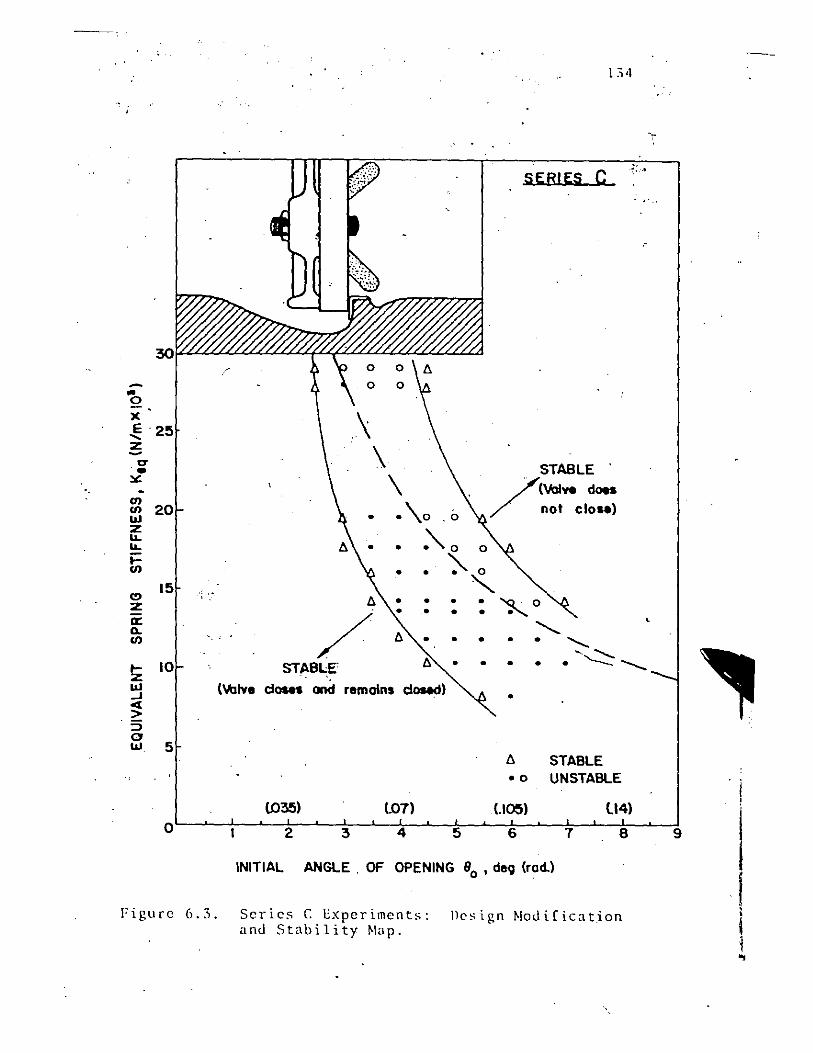
1~4
SERIES C
INITIAL ANGLE. OF OPENING 90
• d89 (rod.)
Figure 6.3. Series C Experiments: Ilesign Modification and Stability Map.
-.
~. :"
.....
I j 1 .,
0 ~
'" Q x E ~ -<T .. :.: -00
00 w Z LL LL
t-oo
(!)
z a: n. 00
t-Z W -' « > ::::l 0 w 5
,
/ STABLE
(Valve closes ond remoins closed)
l035) l07)
4 5
SEAlES' Cl
STABLE . /<VOIV8 does "not close)
•
• • •
•
" ,,'
t; ~ABLE • UNSTABLE
1.105)
6 7
INITIAL ANGLE OF OPENING 80 , de9 (rod)
8
I:igllrl' 6..1. Sl'ric,.; CI Experilllcnt": \lcsign ~loJiricatinl1 alld Stabilit;, '1:1)1.
\~
I~S
, ('\
\ ';
9
13h
/ This modification \w itself do.:s not appear c:.Jp?,ble
of effectillg a large enough reduction in th" rate of change
of discharge to provide complete relief from the vihration.
Once again the amplitude of vibration in this case was reduced.
by ~ore than 50\ compared to series A and the frequency
increased slightly, (see Appendix'A) and Fig, 6.5. Fig. 6.5
shows the comparison bet",een vihration records for series A ,.---- .
--~aa-H-Hq, series [1 f~r-H;e·sa.m~·initial angle of valve setting,
..
spring stiffness and upstream head.' The record shOl,s that the
\'ibration IS much less \'iolcllt in the C:lse of series Cl than
in series A.
6.6 Series B"CI Experiments and Results
Series B-CI experiments invo}ved the combination of ,
the modifications carried out for series Band Cl. It is
·sho",n in Fig. 6.6, togeth~r with its stability map.
Apparently tpe addition of the apron filler does
not improve the behaviour over the disc appendage of modifica
tion C1. In fact', it seems to be a little \<orse. This is
not surprising since in the case of series B-CI the path of
flow through the valve is less tortuous than in the case of ",
series Cl, and hence the pressure'dtop is less at larger "
angles. This apparently results ~n more reverse discharge
and less pr~~sure drop at a given angle of ,opening. Examina-
tion of Appendix A shows that Q.o-th the valve maximum dis-
placem~nt and frequency of vibrat~on are very similar
series 8·Cl and series Cl.
for q
~.'
•
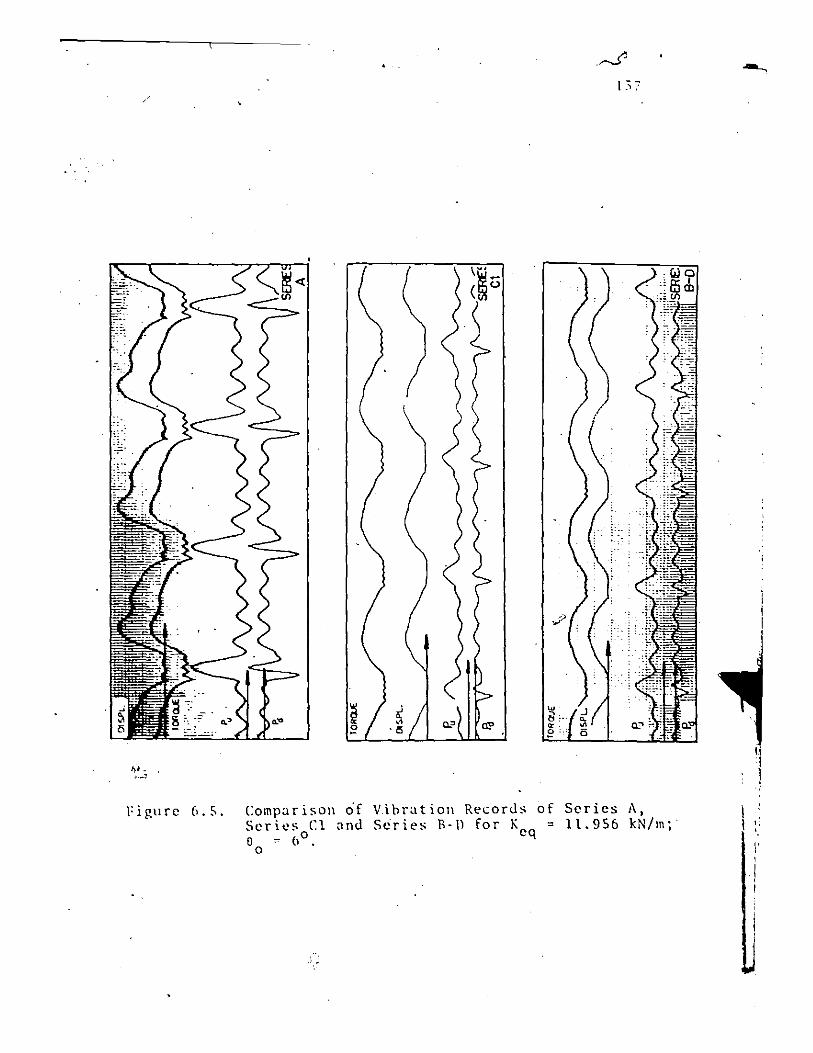
/
Figure 6.5.
..
Comparison o"f Series (l and o = 6°. °
Vibration Records of Series A, S~ries B-D for K = 11.956 kN/m; eq '. ,
\, , I , I
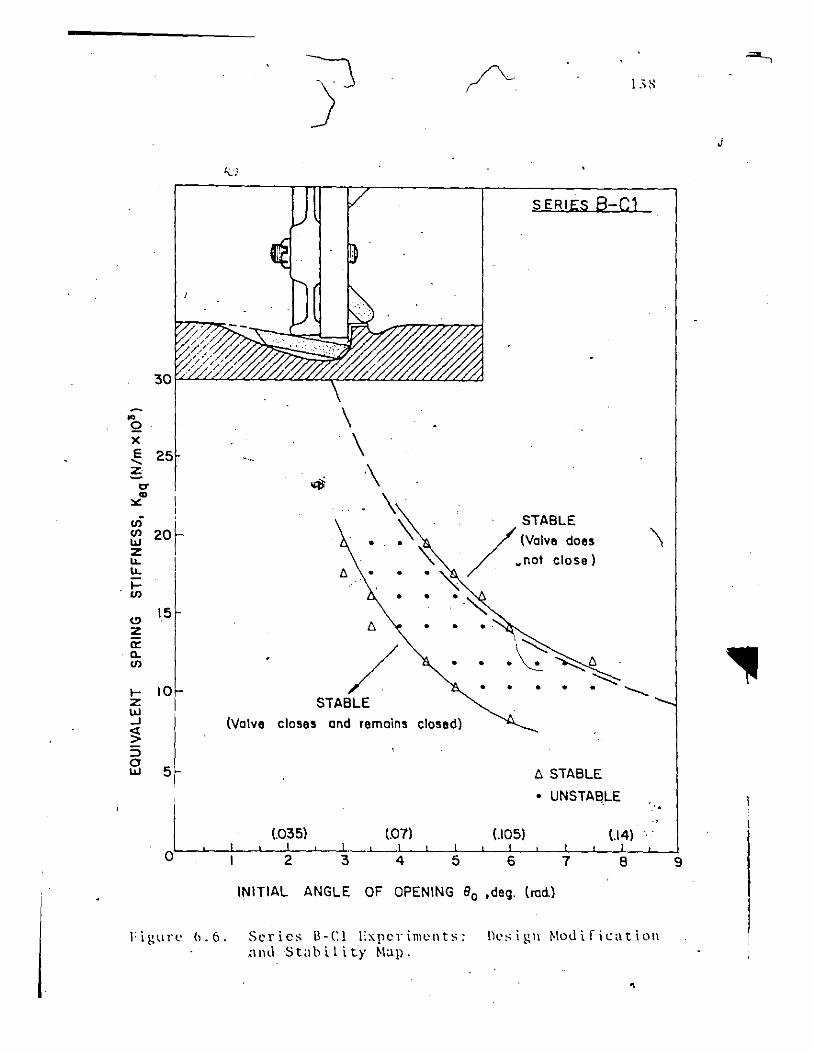
SERIES 8-C1
30
.. \ Q x \ E 25 "- -.-3
.$ \ tT ., I \ :.:: I
. en
20r '\ STABLE (/l
/ (Valve daes \ w • • z "\ wnot close) u. ! u. l> • • .~ I-
(/l • • • .~ 15
Cl l> • • · . Z II::
/ .~~l> Cl. (/l • •
• • • • ~ I- lOr • ---....
z STABLE w
.l ..J (Volve closes and remains closed) :; ::J 0 w l> STABLE I
, • UNSTABLE
I ' . . ,
(.035) (.07) (.105) <'14) I I ) ) ) ) )
0 2 3 4 5 6 7 8
INITIAL ANGLE OF OPENING 80 ,deg. (rod.)
Figure 6.6. Series Il-Cl Experiments: lll'sign ~toJirication ~nJ ~tability Map.
J
9
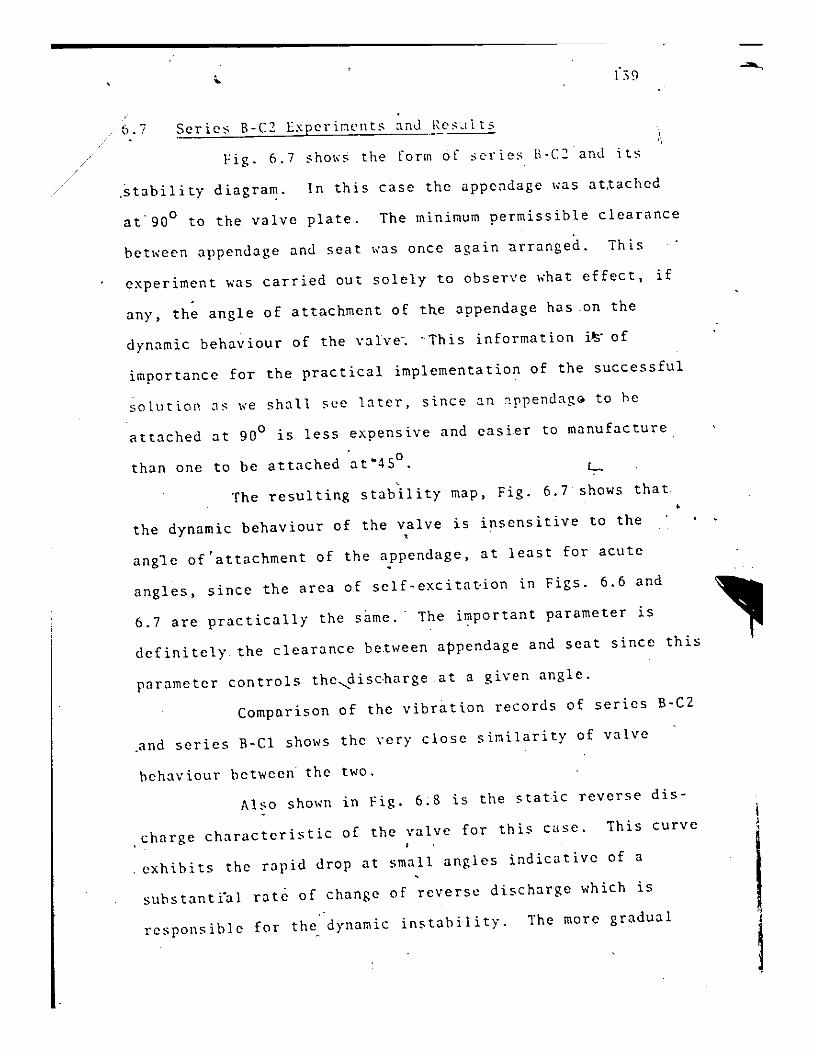
139
6.7 SCTie~ 8-(2 ExpcrincIlts anJ l~cSJlt5 , "
Fig. 6.7 sho~~ the form of series B·C2and its
,~tability diagra~. In this case the appendage was atxached
at'90 0 to the valve plate. The minimum permissible clearance
between appendage and seat was once again arranged. This
experiment was carried out solely to observe what effect, if
any, the angle of attachment of the appendage has ,on the
dynamic behaviour of the valve·. -This information i~· of
importance for the practical implementation of the successful
solution as we shall ~ee later, since an gprendag~ to he
attached at 900 is less expensive and easier to manufacture
than one to be attached at"45°. ,
The resulting stability map, Fig. 6.7 shows that
the dynamic behaviour of the valve is insensitive to the , angle of ' attachment of the appendage, at least for acute
angles, since the area of self-excita~ion in Figs. 6.6 and
6.7 are practically the s~me. The i~portant parameter is
definitely the clearance between appendage and seat since this
parameter controls the,disc,harge at a given angle.
Comparison of the vibration records of series B-C2
~nd series R-Cl shows the very close similarity of valve
behaviour between the two.
Also shown in Fig. 6;8 is the ~tatic reverse dis-
,charge characteristic of the valve for this case. This curve
,exhibits the rapid drop at small angles indicative of a
suhstanti"al ratc of change of reverse discharge which is
responsihle for the dynamic instability. The more gradual
i )
I ~

, ,
I ;:;-
~ 25 z -C' .. ~
(/) (/) 20 w Z
.Il.. Il..
t-(/)
Cl 15
z a: 0.. (/)
t-Z W " -l
~ ::> 0 w 5
1 ·111
SERIES 8-C2
\ \ \ '\ . . . ~
. . .~ STABLE
/
!Valve does nol 'close)
I:l • • • ~ -......:
ll. • • • • ~ l:J.
6, • • • • ~ . . . ., / • • • •
STABLE (Valve closes and remains closed)
r:, STABLE
o • UNSTABLE
(.035) (.07) (.105)
INITIAL ANGLE OF OPENING Bo deg. (rad.)
Figure 6.7. Series II-C2 Experimcnb: ilesign Nouification anu St~l,i\ity ~l"r.
,
, .
I ;i I " :1 :1
'1 I,
I: ',.
i I
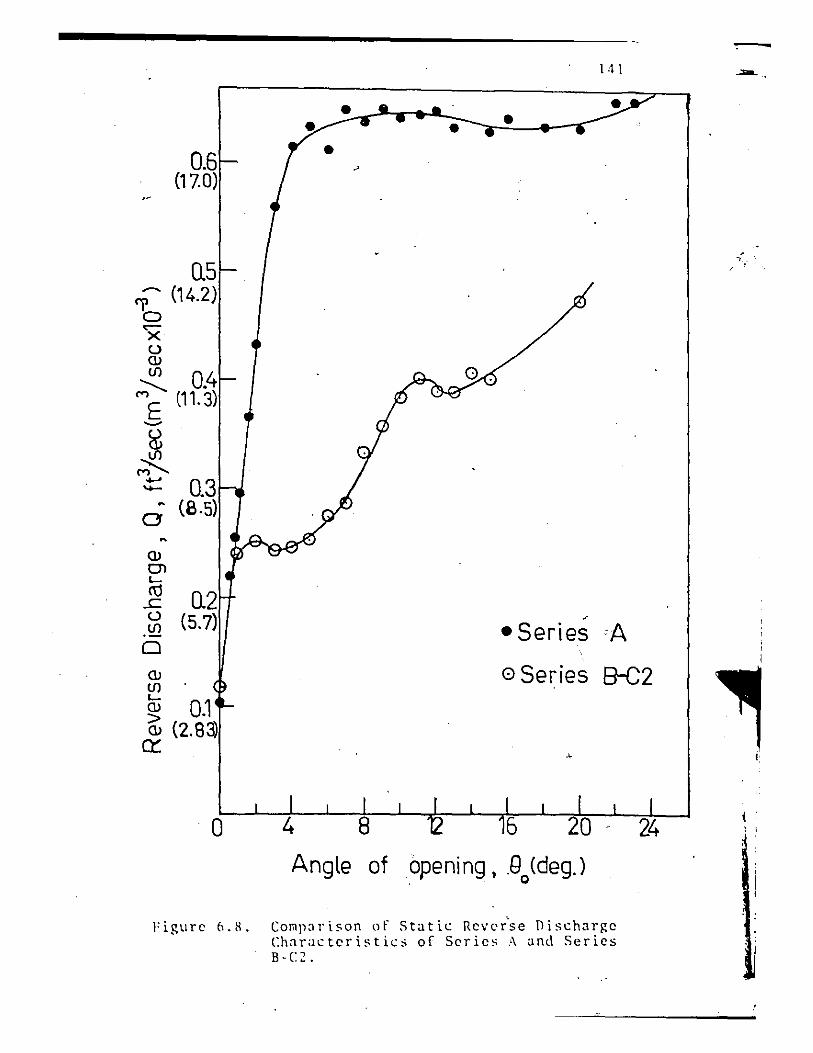
0.6 (17.0)
0.5 ..p (14.2) a x u ill
~ 0.4 ME (11.3)
-g ~
.:::= 0.3 a (8.5)
ill en L-ro
..c u .~ o
0.2 (5.7)
ill UJ L-
~ 0.1 ill (2.83)
0::
o
HI
• •
~
• Series A
o Series 8-C2
Angle of opening, ,9 (degJ , 0
Figllrc 6.S. Comparison of Static Rcvcr"se Dischargc Charactcristics of Scrics A and Series B-C2.
i : : , ,
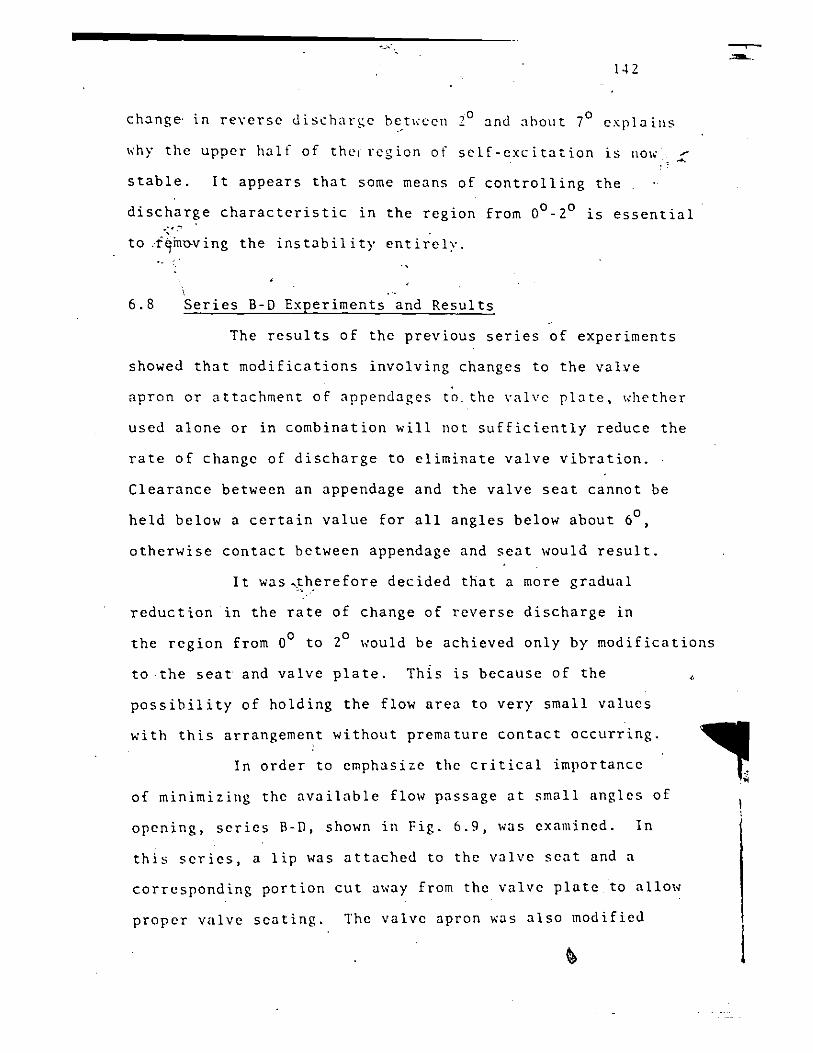
142
change- in reverse uischarge bet"ccn 20 and about 70 explains
"hy the upper half of thcjrcgion of self-excitation is llQ\..... .,-. ~ ,......
stable. It appears that some means of controlling the
discharge characteristic in the region from 00 _2 0 is essential
to .. t'qino-ving the instability entirely.
\ 6.8 Series B-D Experiments and Results
The results of the previous series of experiments
showed that modifications involving changes to the valve
apron or attachment of appendages to. the valvc plate, whether
used alone or in combination will not sufficiently reduce the
rate of change of discharge to eliminate valve vibration.
Clearance between an appendage and the valve seat cannot be
held below a certain value for all angles below about 60,
otherwise contact between appendage and seat would result.
It was "therefore decided that a more gradual "', "
reduction in the rate of change of reverse discharge in
the region from 00 to 20 would be achieved only by modifications
to the seat and valve plate. This is because of the
possibility of holding the flow area to very small values
with this arrangement without premature contact occurring.
In order to emphasize the critical importance
of minimizing the available flow passage at small angles of
opening, series B-D, shown in Fig. 6.9, was examined. In
this series, a lip was attached to the valve scat and a
corresponding portion cut away from the valve plate to allow
proper valve seating. The valve apron was also modified
!
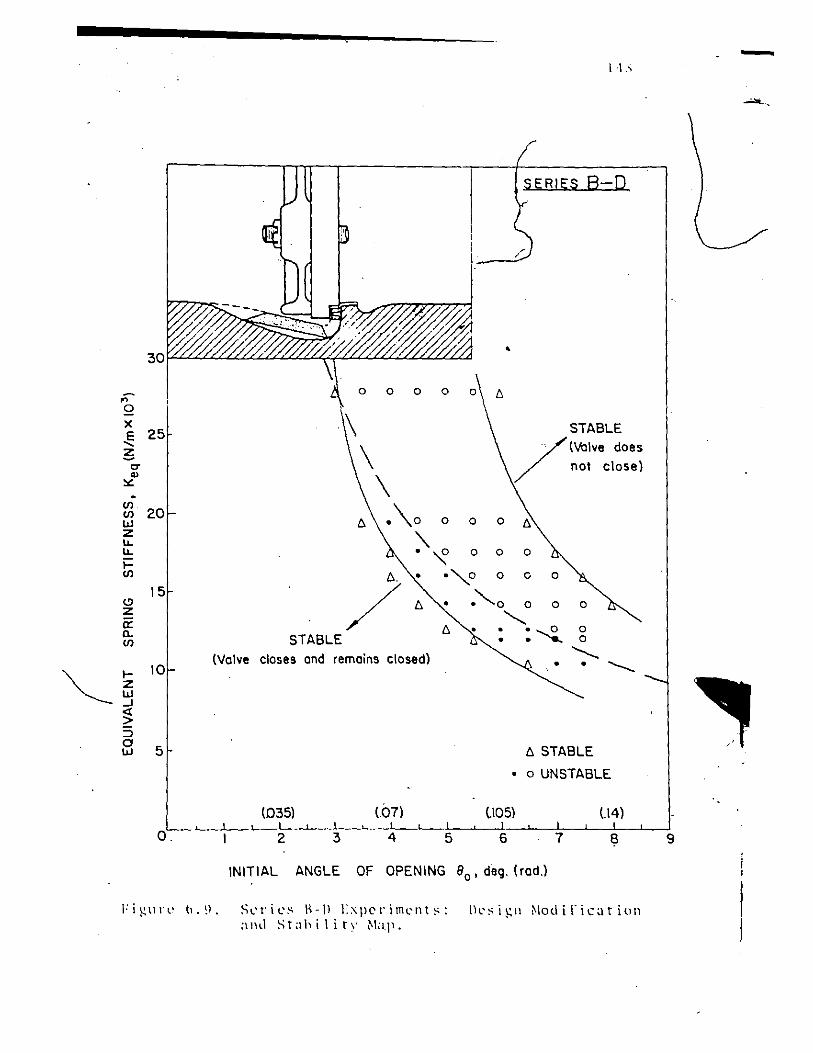
,;:;-Q x ~ 25
~ C" .,
:><:
-en 20 en
w z lJ.. lJ..
i= en 15
<!) z oc a. en
10
5
O.
•
000 0
STABLE lValve closes and remains closed)
(035) li)7)
II .,
SERIES 8-0
/
STABLE
/
- lValve does not close)
•
o
o o
............. •
t:. STABLE
• 0 UNSTABLE
INITIAL ANGLE OF OPENING 80 , deg. l rod.)
Figure' t1.~l" Sl'l'iL'~ I\-Ill:~pcriml'nt~: Ih'~i~1I ~Iodi("ic;ltilln and Stah iii t\" ~I"I'.
-
. ,.
144
as shOlm in Fig, 6.9 .. ,\ clcaran'ce of ill6 inch at complete • • •
valve closure ·b·etwcc!l the cut-away porti'on of the valve plate
and the li~ was used in 1his ,e~ies of experiments. The
resulting <iynamic behaviour of the valve"is s'hown on the
stability map of .Eig. 6,9.
•
Comparison of results of series B-P with,those of
se.ries A shows that the onl,r. 'i~provement has oc,curred in the .' :: .
10lier half of 'the ·region of self-·excitation. However at . .", .
th.ose po~nt;s where- vibratOion o&urred, the oscillations 'were
less vinJent, the -:mplitl,ldc of vibration bein:< redu.c:ed by an
average of more than SOt, ~his is shown for one point of the . .
stability map in Fig. 6.5. G v
.6.9 Ser1es B-Dl Experiments and Results
."",- .
/i /
Series B-D was improved by reducing the clearance /
~ between the lip and the cut-away portion of the valve plate /
to a little less than 1/32 inch. This modification is Sh~ in Fig. 6.10. Except for small leakage the valve is ~ ~ essentially closed at around 20
• ///
The size of the lip used was not arbi~~ry. The /
reverse discharge characteristics of serieS/A shows a high . /
slope be~ween about 60 and 00• Examinat,{on of the vibration
, /
records of series A showed that th~dden acceleration of
/ 0 0 the valve towards its seat occu7d between 1.5 and about 3
depending on the initial se~i1g. The choice of lip size lias
based on preventing the 7dden reduction ~ discharge in the
last 20 as seen in s~/ies B, (Fig.6.2) and B-C2, (Fig. 6.8).
/
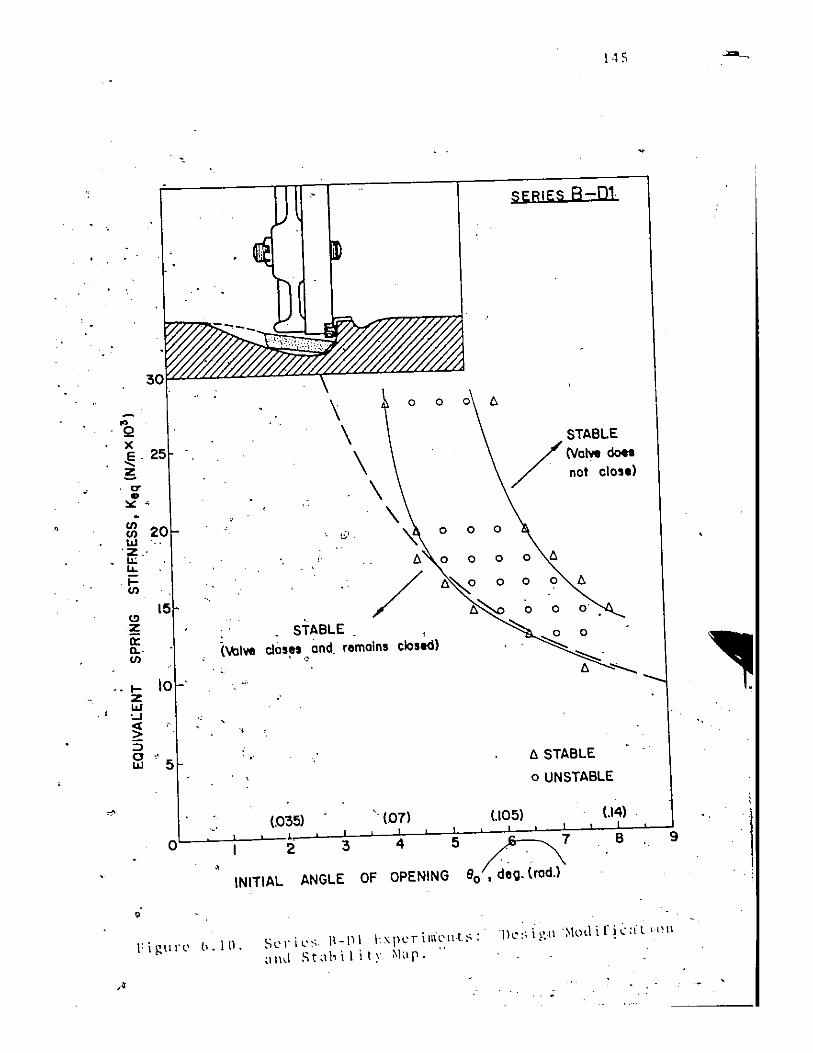
J
•
, ,
.. Q x ~' ~
C' .. :.:: • . en en w , ffi' l>-t::: en
15 (!)
z ii2 a.' en
" l- \0 z W '-1
~ ::> ~ 5
-.
(\tIlve
-
"
'.'
•
HS
SERIES 8-01
\ 0 0 0 t;
\ STABLE
\ /(Valve doH
\ nol clos.)
\ t) ~
0 0 0
" t; 0 0 0 0 t;
/ t;~o 0 0 0 t;
~ 0 0 0'
STABLE , closes and remains closed) ~o
, 0 ~.
(; "'--'
t; STABLE
o UNSTABLE
(.035) (07) (.105) (.14)
:3 4 5 £5 B 9
INITIAL ANGLE OF OPENING 90 • deQ. (rod.!
• l'i~lIl'l' b.IO.
SL'r iL's 1\-\11 \"IH;rimL'II,t,,:' 'ne,; igll '~ILHl i q":'il "'II
"lid St,,], iIi t Y M"p ...
,.
146
A figure of 20 was also chosen to safeguard the structural
integ~it~ of the valve plate as it slams onto the seat. This
meant a cut-away of 1/4 inch by 1/4 inch by 9 inches in the
present experiments. To further ensure the structural
integrity of the model, the lip was lowered by 1/16 inch to
allow contact of the valve plate with both the seat and the
lip.
The dynamic behaviour of the valve modified in
this way is shown in Fig. 6.10. The lower half of the
region of self-excitation is now completely stable but a
considerable area of instability remains in the upper half.
This nevertheless represents a remarkable improvement in the ~
dynamic behaviour of the valve. For the first tim~ a modifica-
tion"in design was demonstrated to guarantee that if the
spring stiffness us~d in the valve design is not stiffer than
what the hydrostatic, pressure in its system can overcome, no
matter the initial angle of openi~g, the valve would be
stable. Thi~ suggests ~hat even if the dynamic pressure due
to waterhammer wave reflection is sufficient to dislodge the
valve from the seat by some small angle, the flow is not
reestablished and the valve, settles down on the scat again.
Normally if a valve is to be prevented from slamming
by inclusion of, springs in the valve system, rational design
practice would ensure that'the included springs would not be "
so stiff, that the available hydrostatic pressure cannot close
the valve against the spring force. However, as shown by the
remaining area of in~abi"lity this modification does not (

147
represent a fool-proof practical solution of thb vibration "
problem. If, due to changes in o~~ating conditions the
availabl;(hydrostati~ head dropped, tl:le valve could become.
unstable due to opening. caused by the spring.
To understand why the'valve was dynamically unstable
at the larger angles, the static reverse discharge character
istic was determined. This curve is shown in Fig. 6.11. It
shows a much gentler slope between 20 and 00. However the
slope is relatively steep between 20 ~ 40• This enables the
generation of an additional hydrodynamic pressure component
dUe to fluid inertia which forces the valve shut against the
spring. Once the valve is closed however, the dynamic pressure
due to fluid inertia disappears whereupon the spring restoring
force initiates valve opening. It follows that a combination
of B-Dl and B-Cl should eliminate the unstable region
entirel y",-
6.10 Series B-CI-DI Experiments and Results
The results of series B-Dl showed that the only
region of instability left was the top half. It was relatively
synthesize a complete practical eas~is point to
solution ~f the ,valve problem by combining series .B-Dl with
either -series Cl or series C2. One such combin,ation is shown
as series B-CI-Dl in Fig. 6.12. Also shown in Fig. 6.12 is
its dynamic stability characte~istics.
Clearly this' represents a complete practical solution
of the vibration problem. Its dynamic stability characteristic
7
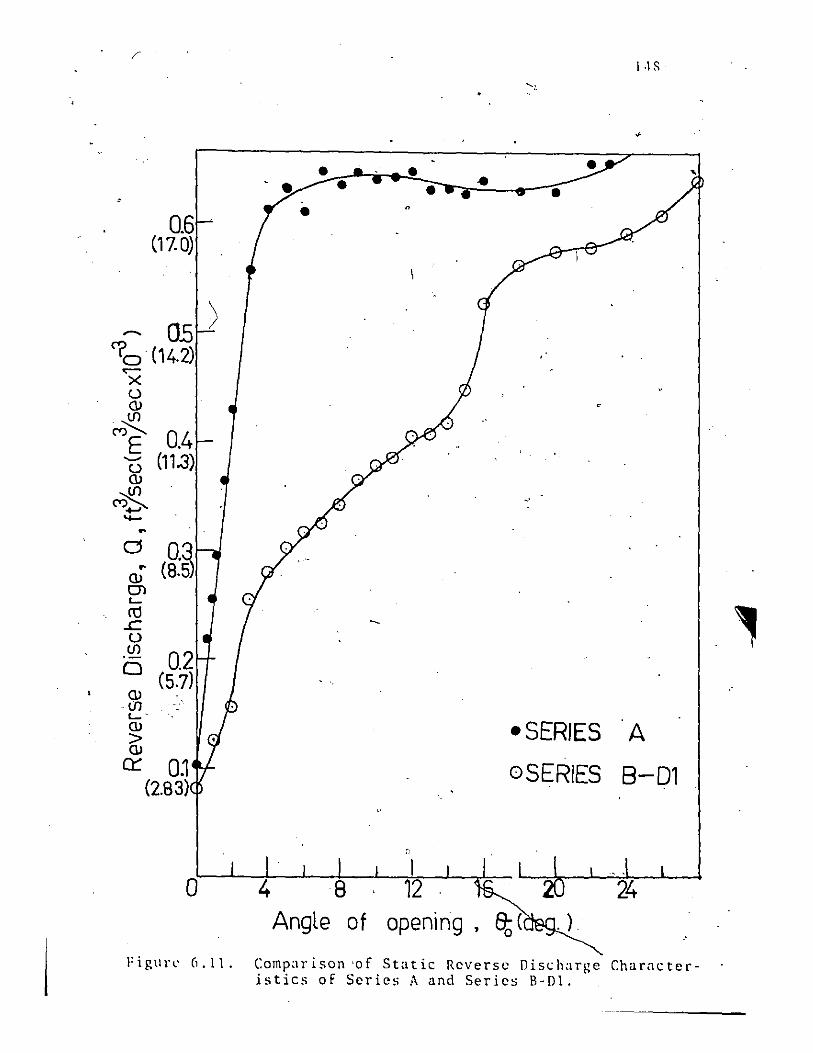
0.6 (17.0)
..... 05) 70 , (14.2)
..--x u (l) tJl
C')E' 0.4 u (11.3) (l) tJl ~ --o
(l) ·tJl '-- .
(l)
> (l)
0::: D:I (2.83)
a
• • •
. '.
• ..
-SERIES
oSERIES
Angle of opening, tt ( . ).
1·\ B
A
8-01
Figure- (,.11. Comparison 'of Static Reverse Discharge Characteristics of Series A and Series 8-01.
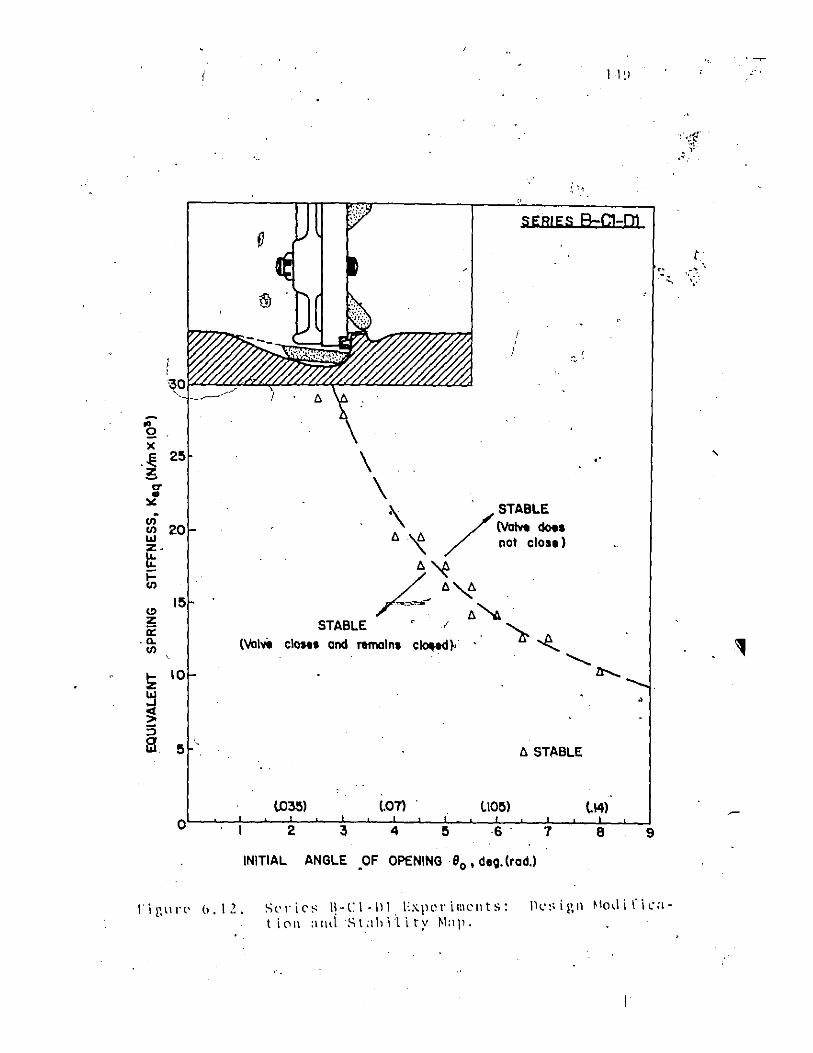
II!I
SERIES B=C1-Dl
I
;' '"
-Q X
,~ -a • :>0:
en en w z· It i= en
C> z 0:
,0. (\lal~ en
!z
~ :5 IiI
I'iglln' b.12.
0. STABLE
(.07) tIO~)
2 4
INITIAL ANGLE OF OPfNING 90 • diO. (rod.)
S('ri('~ I\-CI-ill l:xpl"'iml'llts: t i('lll :lll,i 'SLthi't i ty ~I:tp.
tl4)
B
I
" '~
9
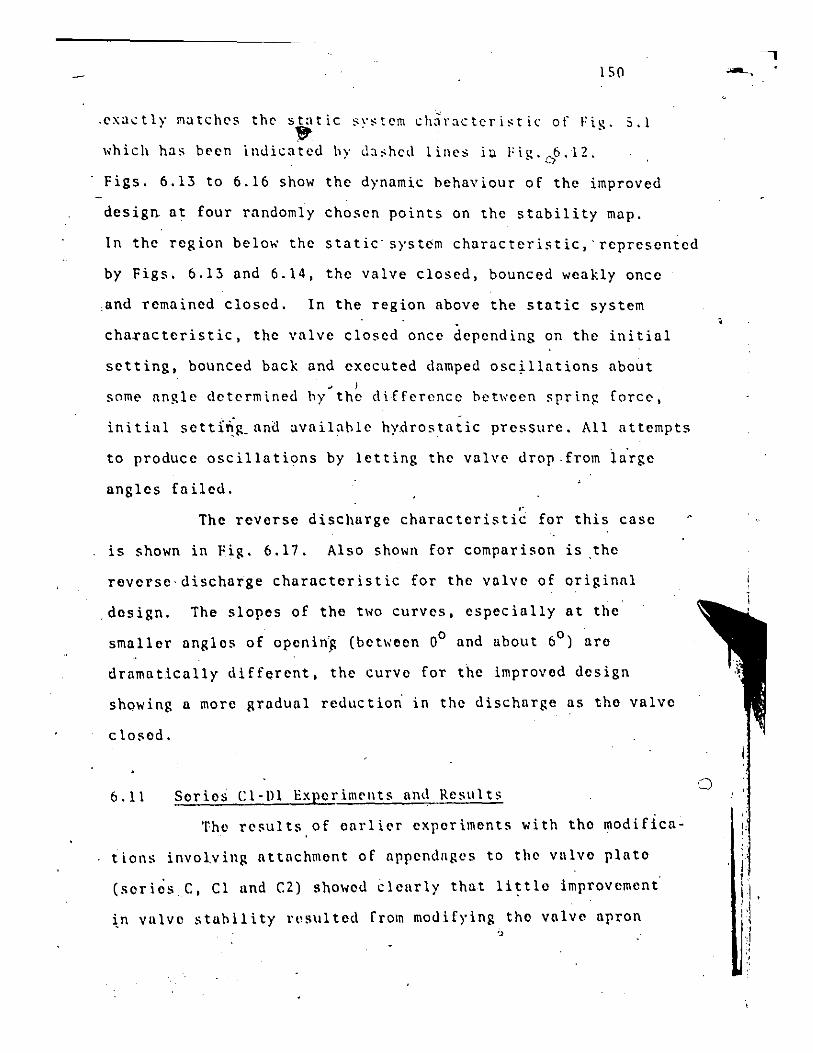
150 ---.
. exactlv matches the static ~v~tem chiracteri~tic of Fl· .•.• I . .. ~ .. which has been indicated by da~hed lines iu I:i~. 6.12. • .. 1:.)
Figs. 6.13 to 6.16 show the dynamic behaviour of the improved
design at four rnndomly chosen points on the stability map.
In the region below the static'system characteristic,'represented
by Figs. 6.13 and 6.14, the valve closed, bounced weakly once
,and remained closed. In the region above the static system
cha~acteristic, the valve closed once depending on the initial
setting, bounced back and executed damped osc~llations about - I snme nngle determined hy the difference hetween spring force,
initiul settlri:IL anll available hydrostatic pressure. All attempts
to produce oscillations by letting the valve drop.from large
angles fa iled.
" The reverse discharge characteristic for this case
is shown in Fig. 6.17. Also shown for comparison is the
reverse· discharge characteristic for the valve of original
,design. The slopes of the two curves, especially at the
smaller anglos of openin}: (bet\\oen 00 and about 60) aro
dramatically different, the curvo for the improved design
showing a more gradual reduction in the discharge as the valve
closed.
6.11 Series CI-DI Experimellts and Results
Tho results.of oarlier experiments with the modifica
t ions invo1.ving attachment of appendllgos to the vulve plate
(seri~sC, Cl und C2) showed cleurly that li~tlo improvement'
~n vulve stubility rusulted from modifying tho valve upron ~
,
o
;
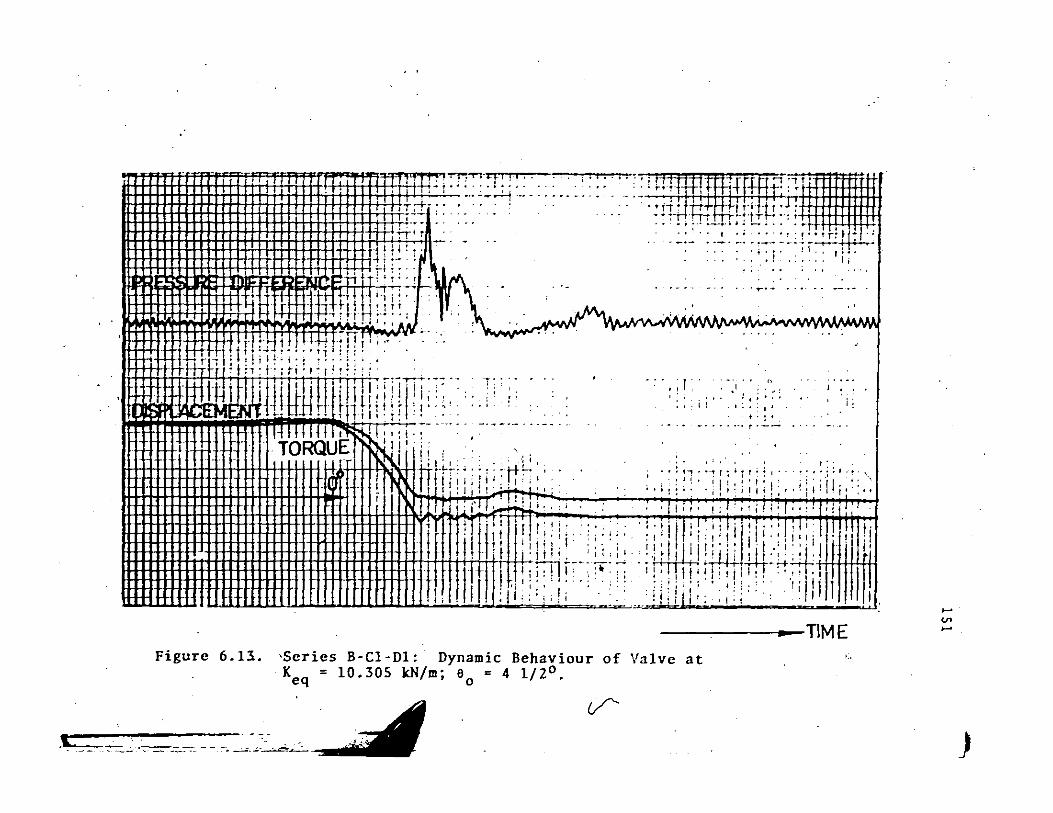
11 II
f 1; ~ .. i -. , l"~rF;'T"!'""'"-''''''''''''''''''''''''~ t-'. 1 ." . : ! t-! •• ,~:.:~' : ............. ". f'}'" -.+ d. ::d.: :. .·:c "'HI! Hm
""'''' , .... . . "t liH1" . , .. fT.
r
': .,' .:tT~~~.~·H!It! i: • ' , , _ . . r> ~ 1 .~ , , :. . • . . .. ",,' .;., •. ·tT .. ,; ':_: . ..' ::~: ~~ ~~ >,~~ .. r;r;~ ~;
f~ ~ ; .
, , , .~
~, ' !; .
. .,.....-
~V-"-""."'''I'Yv. • ~. ;AAAAAA~~ ... .A'..;..:. ... ·.A" .... II .,. ...... ,"' .......
, 1 "
i:
. , .. , ~ .. ' ; , . : ; :' '::: .\; t,.·: r, "!' I' I' j! J" . I (, I!; ~ i I I ; ! ;; , . i IitlUl,:;:;. ' . 'I
_ •••• '"0 t ._-
: : ; " . : i !! , . '. '. '. 111'1
: : . : : .j ~ ,
L!..
--...,---.. -T1ME Figure 6.l~. -Series B-Cl-Dl: Dynamic Behaviour of Valve at
K = 10 305 kN/m' 6 : 4 1/20 eq' • 0 •
v ,~~~, _. __ c-., - - c, ~.~.~.:: *1
' ..
... <n ...
)
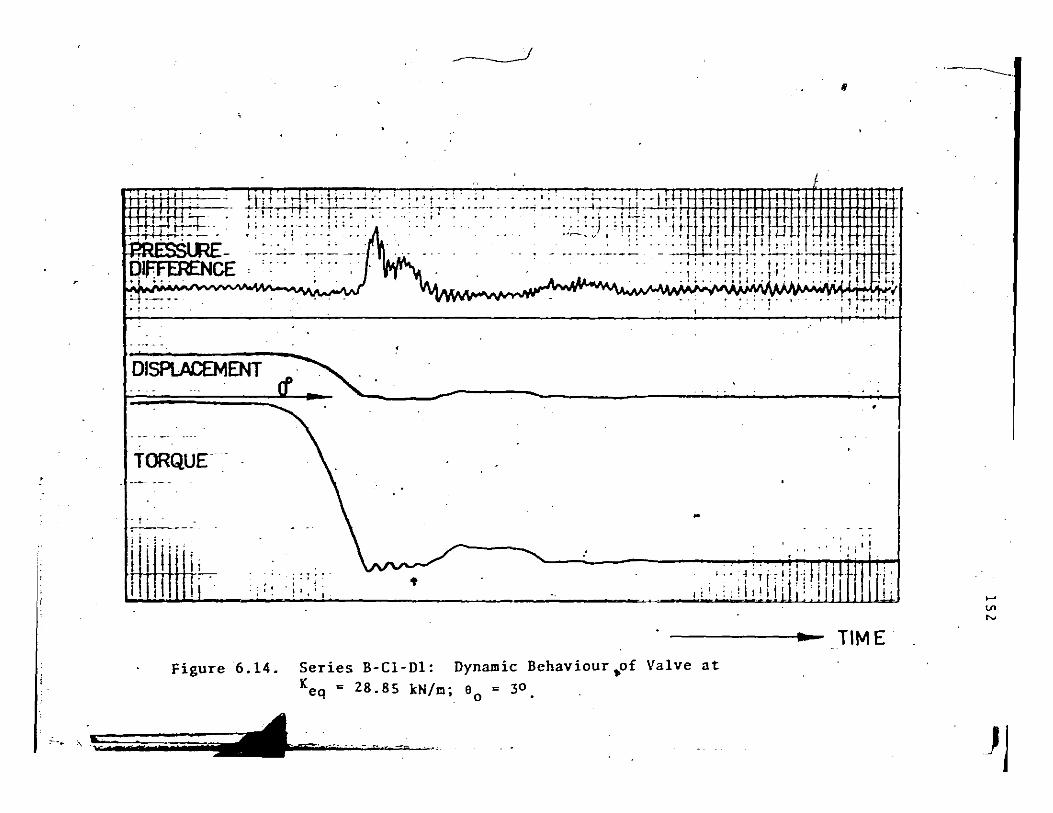
i . , .
r
,! II
{~'iT i+J:_' . I ,-'
~ QIfFEFENCE ~. ... .
'-. : ...
---------.-J ,
tri ~t r-H-+-:-H...;-:·J ~<. :.: T'~ . ~ I •• I; q;!-'··1 i! ~ rt r+----+ ...... +H+H+lI++l4-H t; rr;:-H-! ;~-:-: T" ---, -' •. --! _. --t-·-l-t-----H-+ f---M-I;: ": ;., •. 'i;: " : , : ::; : :)" : ,; .-t:' 1 i~' tPTtt. ttftt1:tnt:tt,·
, ., ,. _ _ , , . . .. ~ . " i ' ' 'j t i 1 L! ITO lJ~rt f-. ___ -"_ ~_:..: _ . .It, :" : .::.:,.:: i,Flj '.'I'I',t., ,. 1 I I ~!!·I'lr:m· :... .;.. r~ .. 1A.. .- "' •.. ---- - ...--r.---i ........ .4-0-...... II' ' : . , . .. t : ~ • , , 1 : :; t':" I . ; ,J j 1 f11
. . . ,. .. ~ I I . • . '" j • • • I : - '" -.~ ... +,I.:~,l.;.I.: .,~.:,;, HH
I -,-_.t' . 1 .1.--' "1-",. I ""1'
DISPlACEMENT
TORQUE
• T' "
.'
: , -• , '
Figure6.l4. Series B-Cl-Dl: Dynamic Behaviour ,,of Valve at
Keq = 28.85 kN/m; 80
= 30
I l
i: I'
TIME
~'- \ '!:: t:;; = ~ .. - u ' -.,
.,----,.
..... vo '"
)J

,
I i I I 1!' .. ··~t:!.i·· ::j- ~!l
~'"
~_.o-: .. L
SPLACEtJENT
-~---::~:'-'-':'; i: ~+'-:;:: :::~:.: .. '
~/
~ .. ---.~----~ --7 .-"1-...... r-~ ......... • I' ••••• I·
I'
I ',Vo
.> ...e ________ _ -----------
TORQUE
!"tR'e.!'.~&-:'1
It:. -:.. L"'''' ':"::4it.1,,--,5
Figure 6.15. Series B-CI-Dl: Dynamic Behaviour of Valve at Keq = 28.85 kN/m; 60 = 4 1/ 20
•
~ . __ .- --. ~
;... - '''''
TIME
}-
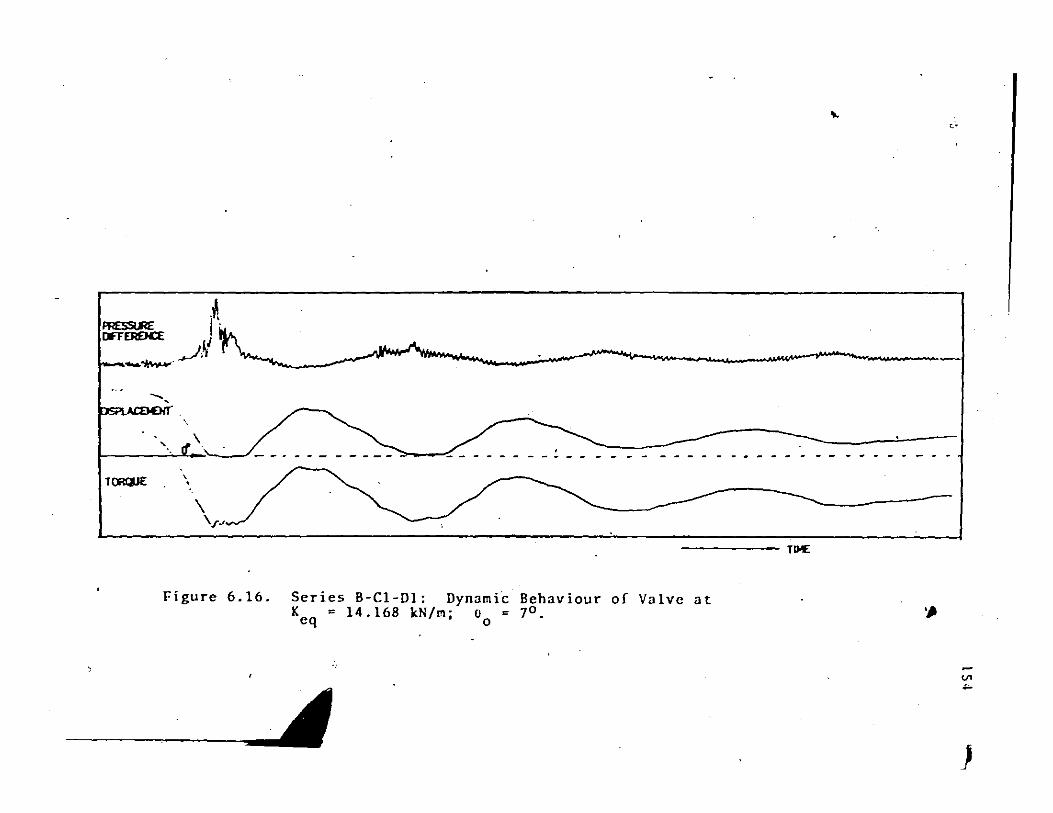
~ I~' _____ .A
...... ,
, \ I--___ -'--'u ...... -'~ __ • ________ --"" ~ _______ _
1()RgJE , ,
\ \.rJ
Figure 6.16. Series B-C1-Dl: Dynami~ Behaviour of Valve at K = 14.168 kN/m· 0 : 70.
eq • °
...
11K:
."
c'·
<I' "-
}
155
geometry .. In faci whenrver the apr~n was modified, a
relatively less tortuous .pathof flow resulted; the fluid
was discharged more or less as a hori:ontal jet so that no
substantial improvement in the rate of change of discharge
at very small angles was achieved. It followed that ,the
solution achieved in series B-CI-DI owed little to the
modification of the valve apron. Besides, a modifi.cation to
the apron constitutes the m9st difficult and expensive of all .".
the improvements in design suggested. It was felt that
removal of the valve apron modification Silould not aEfect the
dynamic stability behaviour adversely; moreover, it represented
a simplification of the final solution and a real cost-saver
with respect to possible practical implementation in the
prototype valve.
Thus, series CI-Dl, shown in Fig. 6.18 was examined.
The results, shown on the stability map of Fig. 6.18 confirmed
the expected valve behaviour. It shows the valve stable at all
points on its stability map and therefore represents a
complete practical solution of the vibration problem.
Its reverse discharge~acteristic, shown in
Fig. 6.19 is practically identical to that of series D-CI-DI
between 00 and 60. This is the critical zone where a very
gradual reduction in the rate of change of reverse discharge
is imperative if dynamic instability is to be avoided. Also
shown on Fig. 6.19 for purposes of comparison is the reverse
discharge characteristics of the original design.
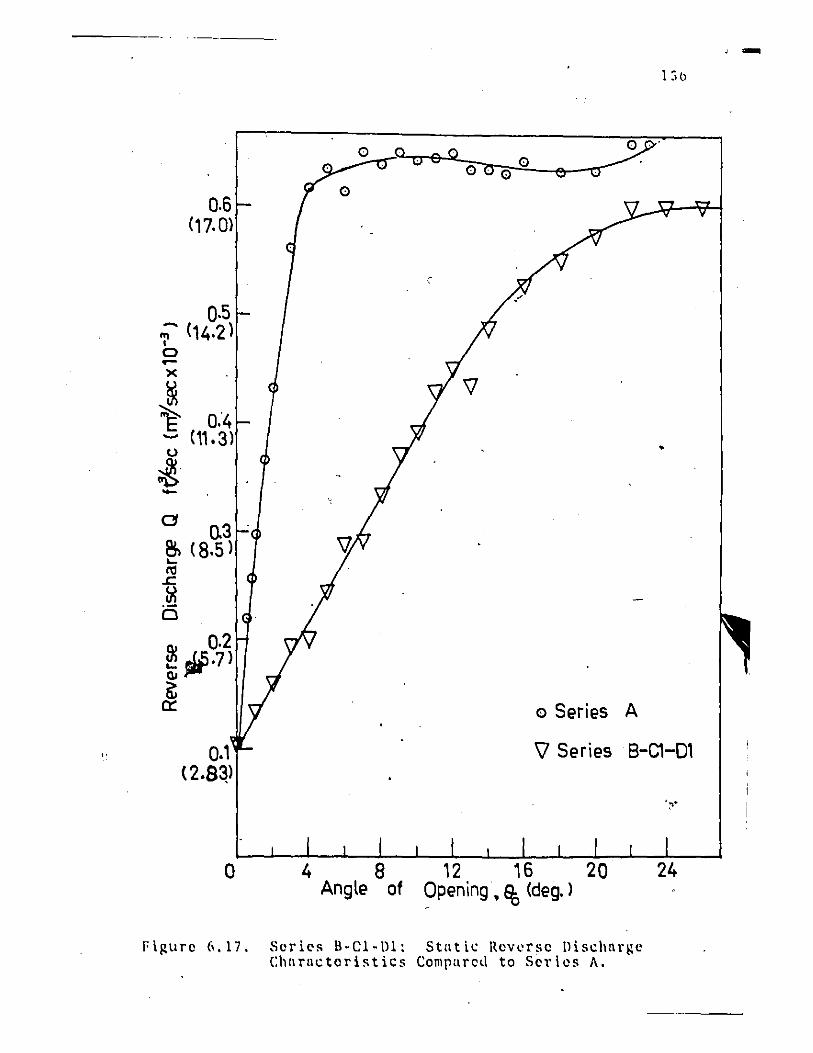
,.
(
0·5 :: (14.2) I 0 0-
X
~ 't 0:4 ~ (11.3) 0 •
~. -0
0.3 6, (8.5) ~
ra .c;
~ i5
$ 0.2 Q;~.7) fi;
0:: <:) Series A
0.1 \1 Series B-C1-D1 ( 2.8~)
o 4 8 12 16 20 Angle of ~pening • % (deg. )
Figure 6.17. Seri~s B-CI-D1: Static Revurse Disc}lnrKe Charactoristics ComparcJ to Serlos A.
'~ ..
24
, -

. ,
'" Q x .!: z -.,. .. :lo: . I/)
:a z L1. L1. ~ I/)
C) 15
z a: Il. I/)
\
STABLE
\ \ \
1 57
SERIES Cl-Dl
STABLE
/
(\\JIve do •• not close)
(Valva clo ... and remain. closed)
!z 10 UJ ..J
~ :l @
F i !~ \Il'l' h, I H ,
t:. STABLE
(.035) (.07) (.105) " (.14)
4 6 7
INITIAL ANGLE OF OPENING 90 ;, deQ, (rod)
Sl'I'I,'~; CI -Ill t:XPl'I'illl"llt~:·. Ih',;-igll ~Ioll I 1'1,'at iOIl lind St :11, iii t Y ~1,lp,
)
-
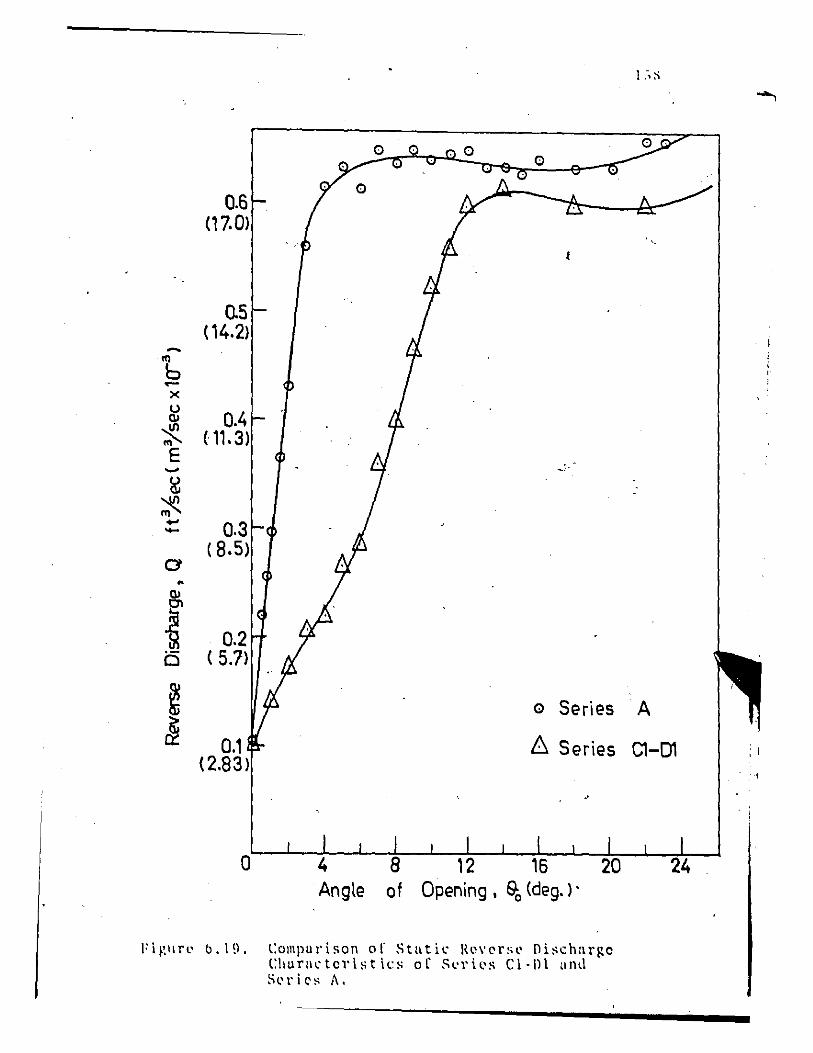
-ftl b .... x u ClI
~ E
-.J
~ ~ --CJ
~
f i:S
~ ~
0.6 (17.
0.5 (1
0.4 ( 1'.
0.3 ( 8.5
0.2 ( 5.7>
0.1 (2.83
0
F i f', II fl' (). 1 9 •
o 0
-.. '
0 Series
8 Series
,
, 16 Angle of Opening I 90 (deg. > .
l:ompurison of Stati~ R~vers~ ni~chnrRc Chufal'tcl'btilcs or Sl'1'il'S Cl·nl (lllll Sl'l'i~s II.
i i
" ,
A
Cl-01 : i
, I
. i
'~
6.12 Series E Experiments inJ'Rcsult~' .6
"
, " 1 S!l
"
An attempt·to reduce ihe reverse di~thargc at small
angles of valve opening involving the usc of counter-Jet's .t9
the flow in th'e slot area was !nade. Eleven, 3/16 inch dfamet.er
, holes '~ere drilled at 60 0 to the downs'n'e'am face, of the disc , .
and positioned in such a way tha tthe hole's 'were cover'cd by
the valve seat at complete val veclosure. At small'aniles, . , \ - . 0 . \ ~ .
flqw through the~e,holes was expected to reduce the flow , '.
velocity in the s~ot as it formed a counter-jet to the normal
reverse di5charge~ This modifi~ation. together with its
stability map, is shown as seri~ E in Fig. 6.20.
Comparison with series A shows that the area of self"
excitation was slightly extended. Results sholin in Appenc.lix A.
also indicate that the amplituc.les of vibration were comparable
to those of series A. The vibrations were observed to be,very
violent at the l~rger angles of initial setting and no attempt
was made to determine the outer limits of the region of self
excitation as the structural integrity of the model was
,threatened.
Evidently the pressure difference across the vnlve
disc is not sufficient to induce nn npprecinble flow through
the slots. In addition, when the dynamic pressure forcos
the valve off the soat, the flow is npparontlymore easily
estnblishec.l and hence. the lowor stability region is extonded.
6.13 Suggestion for Prncticnl Implementntion of the Solution ,
Tho Implementntlon of tho flnnl solution ropresonted
by clthcrsori~5 i·CI·Dl or spries CI·Dl shDuld be n rolntively
..
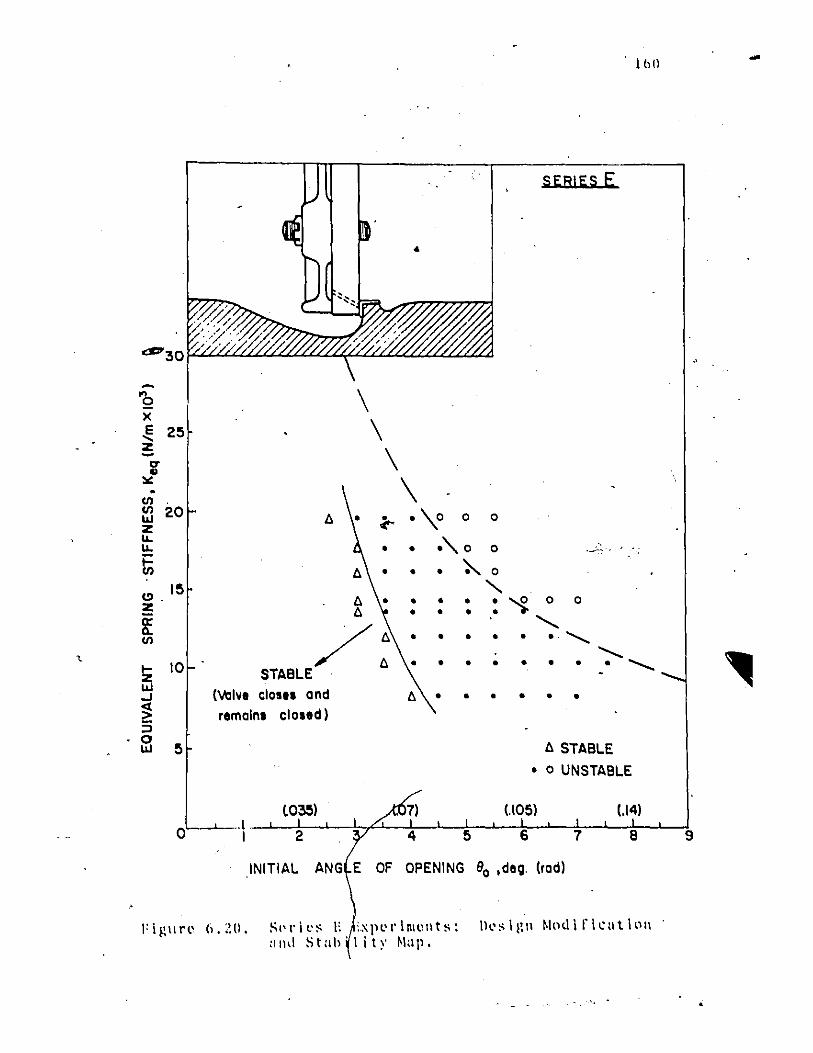
~
'Q )(
E 25 .... z -.,. ., :.: . en en 20 IIJ Z IL IL
ti CI. 15 ~
8: en
~ 10 IIJ oJ
~ ::J 0
5 IIJ
A
\
A A
\ \
(0-
o
SERIES E
\ 0,\0 0 0
o
o
o o
o
0' 0 0
o ~ 0
"-:::'{oo ..........
.--.~' ,
. . . . .. '" ..........
lbO
. . . . . . . .............. /: STABLE
o
(valve clo... and
remain. cloltd)
INITIAL
l:! • • • • • •
A STABLE
o 0 UNSTABLE
OF OPENING 80 ,deo. (rod)
Sl'rll'~ E . pl'rlnll'llt~: !ll'~l!lll Modiflcutlllll :llId Stah Ii ty ~Iap.
-".
-
161
simpl~ and inexpensive exercise. Basically it involves the
addition of two rings, (one to the valve scat, the other
to the downstTeam face of the valve disc) and the Temoval
of a pOTtion of the downstTeam face of the disc. No nltera-.. tion to ~he valve casing geometTY is necessaTY but it may
well be quite helpful in Teducing the dynamic pTessuTe when
the valve swings thTough laTge angles as in closing dU-Ting ~
TegulaT seTvice: The pToposed solution, for the 6 inch diamcter ",.,..
prototype modelled in this thesis, is shown in Fig.6.21 .
• 0 r
f
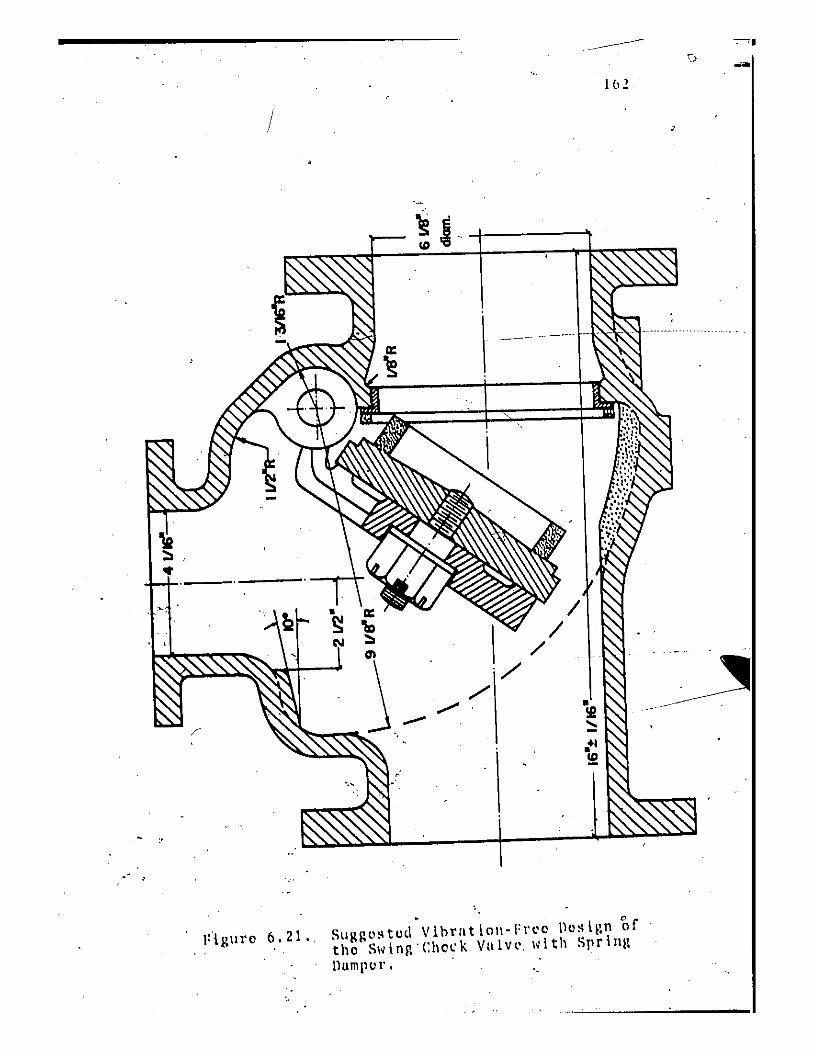
/
-, "
"
1112
-'
.. _ .. ···jH,Y"""-"II····· .......... '. . .. . .
/ /
/
SlIlIlll'~tod Vllnllt 101\-1'1'00 no~I~ln 'Of tho swlnR'(:hock Vulv~, with SprlllB \lumpur. '.
/
CHAPTER 7
CONCLUSIONS·
The dynamic behaviour of a hydraulic check vulve
which was found to vibrato violently upon rapid shut-down.
of the pump has been sl1ccessfuliy mod.clled in two dimensions.
In order to experimonta1ly inv.estigate the hydroelastic vibru-,
tion Of,. the ·valve i,ts two-dtmens~onal geometr·1~\lY similar
model and II wator tunncl"tost facility \~OH dllsignod' untl built.
Using this modol,~a technique, more generally used
~or the visualizution of steady flows, has beon demonstrated
to be adaptable to the study of unsteady' flow, yielding vnlunblo
information.
As a result of both thearetlcal and experllnontul
studies carried out o~ the trunsient behuviour of tho vulve ~
model vibrnting with smllil amplitude in lIir and in quiescent
water, a number of important effects have boen demenstrated.
Firsti the effect of close confinoment on the dynamic bohaviour
of II bQdy vibrating in a heavy fluid such as water" has boen
shewn to be a remarkable increase in Its added muss factor
which in turn dramatically lowers its fundamental frequuncy.
This agrees wbll with thu work of Todd [301 who showed that
the vibration behaviour 6f n ship in open wuter is quito
diffuront .from its bohuvlour in u ~h~llow channol becuuso of
AU) appnl'ent Increaso In its IIddo.<1 IIIIlSS amI a corru~pondl.ng
du(~rcllstl In Its Ililturill fro(\lIoncl('s .. S(lcondly, dlllnplnfl, w.hich
, .
'"
., ltlol
'1'0(\(1. (:'iij u!i~l"rt~ rel~Hd1i\'J drtllully \I1l<.:lV11l!!l,tI for sma:ll
"C\scillutlon:!' of poule:! In rl'lat.iycly un~ollfilll'll ~lirro'lnulll!!S,
h!I'lI, heen' sho'~n to il\crea~e quite suhstantially for a body,
".
-1 ' . such ns this vUlve, vlhru~in~ in a clo!lely confined environ-
ment. " Aclenr undor~tnnd{ng ~f the dYnamic hehaviour of
.< : •. -
the valv(l systell) has emer,l1od from t,hCl ro~ul ts of this work
which shC\w that there i~ 0 sudd(ln incrCloso in the hydrodynamic
clos:-\nll lood as th.e volve' approaches its sent. The cause of
chorlle characterlstlc'of the valve,. especinlly in,the la~t
'fe,~ ~el1'~e't~s hefore clos\l1'e. As thei.vnlve slums onto its i
sent,""wllterhnmmer prellMlros nrc produced upstronm and dowlIlItruum
of the·vlllve. lIowever, us th.1>,'vol\le.,re~pond!l only to the
preMS\lr(l differunc(I ncro.s It, it r~mnins ~n it, sent until the
pr~oS!lur(l dlff(lr(lnce l'oducos to n point ,~h<'l'O 'tt either forces
tho vnlvu open, ~rnllows th(ls~rin!l rl1s~orinll,forces to
pu \l it open. ,The 'h)'lh'oll)'I\l\l!lit:,cros;n~ lond h loss durll\!l
~f. the vlhrlltiol\ cycle thnn it is lit the slime
the
-41.n!llQ durln~ the. \:;'O!l-l~~tll'e. ,This hysteretic (I£f~ct mOllns thllt,
there I,S,II.Mt ol\o.rl1Y tnllisf(lr from tho fluid durinl1 ellc,h ~, ',-'
cycll' nnd tho. vih't;n'ilC\n ill pc.>rpet\H\tl'd,. ,The phC'l\omenon h
clollrly hydfoe,~t'lc \n nntuft'. > . "
'fhe'I\lIthof hu\,. contr.1.butod. to the <stlfte-or-tho-art Th . • .
tochnQ~ollY or flo'~:lnd\lC\ll~S~f,ucturl\l Vl.hrOtl~s, and fUl,s,zllcd
.. tho ,1Itntl)(J purpo~~' of th~~ thosl!l fly, devc.>\optnll lin und{.rstandlna
of thd dyollmic ~uhn'iour of th, VI\\vo sy~tom, d~mDo~trnt\nll v
'? • ", ,
i'- ,. ") , , )
- " ... ~ ..
.,
. J
thl' mechanism by \,hkh thl" ~':'\"ll iat I('n~ 1I.fC.'- .ill<lllc('d ;I1l<l,'nlOrl'
Imponnnt from 1\ :l)lll'clypra~ti'cul ~lC'~l!:n ~cnso. dl'\'~lopll\!:
chang~s in tho basic vulvo do~ign to C'liminnte t6e valvo
vibration.
'~. Economical design of :hydrutll ic struct\lro~ pre-
supposos n~curn-tc knowledge 0 ( the 10nd1'ngs \hich .occur)n
prnctico and awnreness of, tho possibility of flow-induced ~
vibrution. , •. N
Tho work of this thosis em~hnsi:os the advillability . -...... '
oJ more !requont usc of m6dels at the dosign stagof)Q...dotormi~e
p'ro!totyPt' hllhnv:iour offV~I"doSii!ns~ It i~ not nlW'llYs - .
pos.si,\llo to 8ntici pnto\tho hydroolnst.ic probloms which C8n
d~velop. When -they d~ ~ur: modol studios to ~J{ertl\'in tho
nu ture of the phonomenon 8S well 8S thli ef'fects 01 modi£i~ations ofCer mnny ndvnntages over tho usuul cut nnd try/modifications
v • I to the prototype.
,
, , '
\
'"' ," .". ,'r
'. I
•
.-;T
1
.',!. ltoll
Rl:H,\W"CE& . -:::-,--:;~ '- - ..
1. Poarson, G. II., "VlIlve Design in Recent ,Years", The, ChaTtercd.~tochaniclll t:nginecr, Vol. 87, Mny 1974.
2 •
3.
British .Vlllvo ~tuntlrtil.'turors Allsociation, "Vul;"o~ for tho Control of Fluids", Pergam~n Press, London, Englund, 1964. '.
Gl icknlan, ~I. and II eM" A. II., "VIII vcs", Chemical Engineering, Doskbo~Isllue, April 14, 1969.
4. I.lvingston, A. C., and .Wilson, J. N:, "Ilffects' of VlIlve Operation", Proc. lnstn. Mech. Bngrs. ,. Vol. 180. Pt. 311,
. "1965'-66,.
5. hourson,' (i.~ 11., "V,lln, \ll'si~l\:' ~t<lnu:\U}'Op\)l'nt(l\1 \'attl!l'l\~", Pltmnn Publishing Co.,' 1972. ~
6. BOllrd, C. S., "Finnl Con"t)-ol liloments: Vnlvos lind Actuntors", Rimbnch l'ublicutions Division, Chilton Co., 1969.
7. '''Finnl Control Elements: Control VlIlv~s of the SllVent!es", Proceedillall of the Illt; ISA Symposium on Con~rol'lllcments,
',' 1970.
8.
~ 9.
10.
11.
12.
D. ~
14.
Ana".lI, R. W., "Air Chnmbors and VlllvOll In Relation to Watorl\o.mmer","'Trnn8. ASMIl, lIyn-59-S, 1937.
Jaoaor, C., "The Theory of Rosonance in lIydropowor SY!ltomll. Discu!l!lion of lncidont!l and A~c.idontsOccurrina in I'rossuro Syuoms", J. B.a!lic Englnoering, Doc. 1963.
~ ,
. '. ---BilIpl1nahoff, R. L., ~hley, II., o.nd'lIalfman, R.· L.', . "Aoroolatlticlty", Addlson·Wosley Publl.~ution Co., 1955.
BolotIn, V. V., "Nonconservutivo Problems of tho Theory of Hla!ltie StabUity", Porllilmon I'ress, Now York, 1963.
'. '
1)011 II111'tog, J. 1'., '\Meehllllicni Vihrution!l", McGraw·lIlll Book Co., Inc., New York, 1947., .
,
llalllo!lon, P. S., NO\l!ltopou10s, G. K., III1~i Ilaily; J. W., "Tho Naturo of SolE·llxcltutilln ill the Flow·lnlluced Vibra· tion of Flat "htIlS", .T. I\usic l\nlll~oorinll, Trllnll. ASMH, Sopt. 1964.
j , • , !'rotos, A., Gohllichmillt, V. ·W. ,lind Toobo!l, G. tI., "Hydro' olu!ltlc Ilorco~ 01\ BlllrfCyltndor!l";,J. Ball!e Ilnlllnlloring, '\'rlln~. ASMll, Sopt. I !leS. ---...
, II
\
1 S.
16.
17.
18.
19.
20.
21.
. 22.
23.
24.
25.
26.
. 1 (\ 7
lIeUor, S. IL, and t\hrlln~on, II. :\., "lIyJroelu~ti"ity _ A Now NllvlIl Scienco", Journal of the "mer Il:un Sodety of NllvlIl Engineors, Vol. 71, So. 2, 1959.
Schmidgall, T., "SpillwllY Gil te Vibrll t ions on the Arkanslls Rivor Dllms", J. Hyd. D.1\'15ion, Proc. ASCE, Jlln. 1972 • . Simmons, W. P., "Experiencos Idth Flow-lnd.ucodVibration~'" J. lIydrllulics Division, Proc. AS,CE, 11'1'4, 1965.
Climpbell, F. B., "Vibrlltion Probl~ms in Hydrllulic ·Structlolros", J. lIyd. Div., Proc. ASCE, Vol. 87, Mllrch 1961.
Abbott, H. F., Gibson, \~. L., and ~lcL:llig, 1. W., "Moasuro-ments of Auto-Oscillation in a Hydrooloctric Supply , Tunnel lind Penstock Systom", .T. Bll5ic Engineering, Dec. 1963.
Hoskostad, G., and Olborts, O. R., "Influonce of TrIIUina-Bdlle Goomotry on Hydraulic-Turbino-Slude Vibration Resul t ina from Vortox Exc itn t ion", Journll 1 of ling ineer ina" for Powor, Trlln~. ASMB, April 1960.
GilonwllY, M. B. lind Wood, C: J., "Tho Effoct of a Bovellod Trallina Bdao on Vortox Sheddina lind V~brntion", J. Fluid Mechanics, Vol. 61(2), 1973.
Lyuonko, P. 1\. lind Chopnjldn, G. A., "On Sol£-Exci>tod Oscillntion~ of Sel\l!! Concerning the Gato~ of lIydrot~~~:~111 Structurell", llITA~I-li\IIR Symposium on FlowI'~ StructuTill. VibTlltions, Knrl!lruhe, Gormany, 1972.
Petrikllt, K., "Vibrntion Tost~ on Weirs nn~ottom Gates", Wllter Power, Fob.-May 1958 •.
Nlludnschor, B., nnd I.ochor, F. A., "F~ow- ucod Forces on Protruding Willis", J. Hyd. lJivlsion, Pro. ASCE, HY2, 1974. .
Gonawor, C. 11.., "A Study of \'ano!' Sinlling in Wlltor", J. App. Moch., Vol. 19, 1952.
WOllvor, D. S., "On Flo~-Inducod Vibrlltions in Hydrllulic Structuros lind their Allovilltion", Paper pro~ontod nt . tho 2nd Symposium on Appllclltions of Solid Mochanics, McMaster Univorsity, July 1974. '
27. 1.11mb, II., "lIydrodynamics", t;llmbrldae Unlv. Proll' , Bnalllnd.
28. Moullin, Il. S., an(\ Browne, A. D., "On the Periods of II Free-Preo Blir Immersed in Wllter", Cambridae Philosophical Society, 1927.
, I
1\ 2g. Illuh'. \~. K .• "Thl' Ra.lia.tion from l,'rl·c·FrCl' Ilcnm~ in Air
llml in \~utcr" • .l. SOUIl.! and Vibratron. Vol. :;:;(.\1. 1970\.
30, Todd, .F. II., "Ship lIull Vibrlltions", Edwurd Arnold Puhlishers I 'London, 1961.
31. Wllng, C., "Anulysis of Vibration of Hollow-cone Valves", ASCE Journul of the Engineering Mechllnics Division, miG, 1973.
32. Weavor, D. S. ,. "The lIydroelastic Stubilityof a Flat Plate", Ph.D Thosis, University of Waterloo, 1969.
33. IUTAM/IAHR Symposium on Plow-Induced Struct~ral VibratAons,' Karlsruhe, Ger~uny, 1972, lProceedings published by
\;pringor-verlag , 1974). \
34.. internutional Symposium on Vibration Probloms in IndUstry, I(l'~ldck. 1:1I~I!lnd. 197:\. (U.K. AtoPII, Enor!:!>, Authorlt), at Wlndsculo, N.r.I .. )
~5. l.OIl/inovich, G. V. and Snvchenko, Yu. N., "A Study of l\ydrodynamic rorces Attl'ndinll Sinusohlul Vihrutions of a Disk", Fluid ~'ochllnics - Soviet Resoarch, Vol. ·2, No.4, 1!l73.
36. Reynolds, 0., Philosophicul Transactions of the Royul Society, l.ondon, 1883.
37.
:'>8.
I'randtl, I .. , lind Tietjens, O. J., Fundamentah of Hydro lind Aero Mechanics, Dovor Publiclltions Inc., New York, 1957.
Morris, .R. ii. and tlllythornthwaite,' B., "Wllter' Flow Anulogues for GIlS Dynamics" .. HnRineering, 1.0ndon, Vol. 1960, pnges 261-263. .
39.. Mcnllchern, N. V., lind 1I0wker, A. J., "Wa tel' Tunno 1 Flow V!sulllhution HxperimC'nts in II 2" Squllre Duct", NRC NAB I.lIboratory Memo AB-117, National Research Council oi Cllnada, Ottawa, Apl)ll 1960. .
40. Winter, H. F., "Flow Visullli:ntion Techniques Applied to Combustion Problems", .1. ROYlll Ael'onll\lticlIl Sociuty, Vol. 62, 1958, pllges 268-276.
41. Geller, H. N., Journal of Aeronautical Sciences, Vol •. 22, 1955, pages 869-870.
42. Clutter, D. W., Smith, A. M. O. and BratiGr, J. G., "Techniques of FlO. w Visull(!itlltion using Wlltor as the Working Modium", Roport ~ Dougll1s Aircrllft Co. No. BS29D7S, 1959.
_ .. )- .' ... ,'-.-, "'-"_.
44.
45.
46.
47.
48.
,169
Clayton, 1\. 1\., and ~Iassr>", Il. S., "1'101\' Vi~\I;lI'i~allon in \~nter: ,\ Rcvll'l, of Tcchniqll'''s''', .1. Sl'i\'ntll'\~ Instruments, \'01. ,\4, 1!l67. " ,
SChrauh,~: A., Kline, A. J., lIenry, J., R~tnstlldler, P. W., and Lith.~, A., "Usc of lIydrol!en Bubbles EoI' Quuntitntive Determination of Time-Dependent Velocity Fields in LowSpeed Wnter Flows", .1. Busic Engineering, Vol. 87, 1965, pages 429-444.
, Dobrodzicki, G. A., "Floli Visuulilontion in the NAB Wnter Tunnel", NRC Aeronnuticul Report LR-SS7, Feb. 1972. ~ ~
Dobrodzicki, G. A., Privnte communicnti~~973. "----.
Chesters, 'J. H., Hnllidny, 1. M. D.nnd 1I01~es, R. 5., ~ Some Aspects of Fluid Flow (London: Arnold), l!lSI, ' puges 176-193. ' ~
Wood', D. J., "Influence of Line Motion on WnterhnlnlMlr Pressures", J. Itydruulics Division, Proc. MiCE, ~Iny 1!l69. '
49. Duc, J., "Negntive Pressure Phenomenn in Pump I'ipelines", Puper presented nt the International Symposlum on Wnterhnmmer in Pumpod Storage Projects, Chicngo, Illinois, Nov. 1965.
50, Wellver, .D. S., KOllwlln, N., nnd ~Inn~our, W. ~I., "On the llydroelnstic.Vibrlltlon of n Swing Check Vnlv(,", Symposium on Flow-Induced Structurnl Vihrlltions, Kllrlsruhe, G e rmn ny, 197 2 •
Sl. Hllrdwick, J. D., ','}:low-Induced Vibration of VerticnlLift Gnte", J. lIydruulics Division, Proc. ASCE, IIYS, M~y 1974.
52. Abelov, A. S., lind Dolnikov, 1.. L., "Bxperimentlll , Invostigntions of Self-Excited Vihrntions of Submerged Verticnl-Lift lIydrllulic Gnte!!", IUTMI-IAIIR Symposium on Flow-Inducod S-tructuul Vibrntions, Knrlsruhe, Germnny, 1972~ ~ • I
,:~, . 5~. Nuudnscher, E., "Vibrutilm of" t,lItes During Overflow
und Underflo,~", JO\lrnlll' of thl". lIydrllulics Ilivision, Proc. ASCE, Vol. 87, Murch 1961
54. Silnmons,' W. 1'., "lixpllrionces witli IIloH-Induced Vlhrut1on~" • • J. lIydrllu\ll:~ llivl~ion, Prol·. ASCIl, IIY4, 1905.
55. Prico, J. T., "Flo\,/-lriducedVibrnt1ons - Ilxpurillnces'of . TVA ,doth lIycll'(luUc, nnd other Structures", Clvil I1nllino!lr-. ing.ASCU, I\prll 19(1S.
:.'
-

5f>. \louma • .J. 11. ... l'ldoi, E;\.pcril)n~l·" Idth 1l~'dnl\llic Strllcturc~". lUT,\~I/l;\IlH S)'lI\po~lm\ on 1'101\ llluu~l·,l Structurnl Vlhrutlolll. Kurlsrubc. C;crmnll)'. 1972.
\
/ /
1 7 II
'. I ... ~. ',' '.' .' .. ,-., '._
.,
•
Al'l'r~'ln 1 X A
llXl'llR l~lliNTAL RBSUL 1'5 \-
/ . I
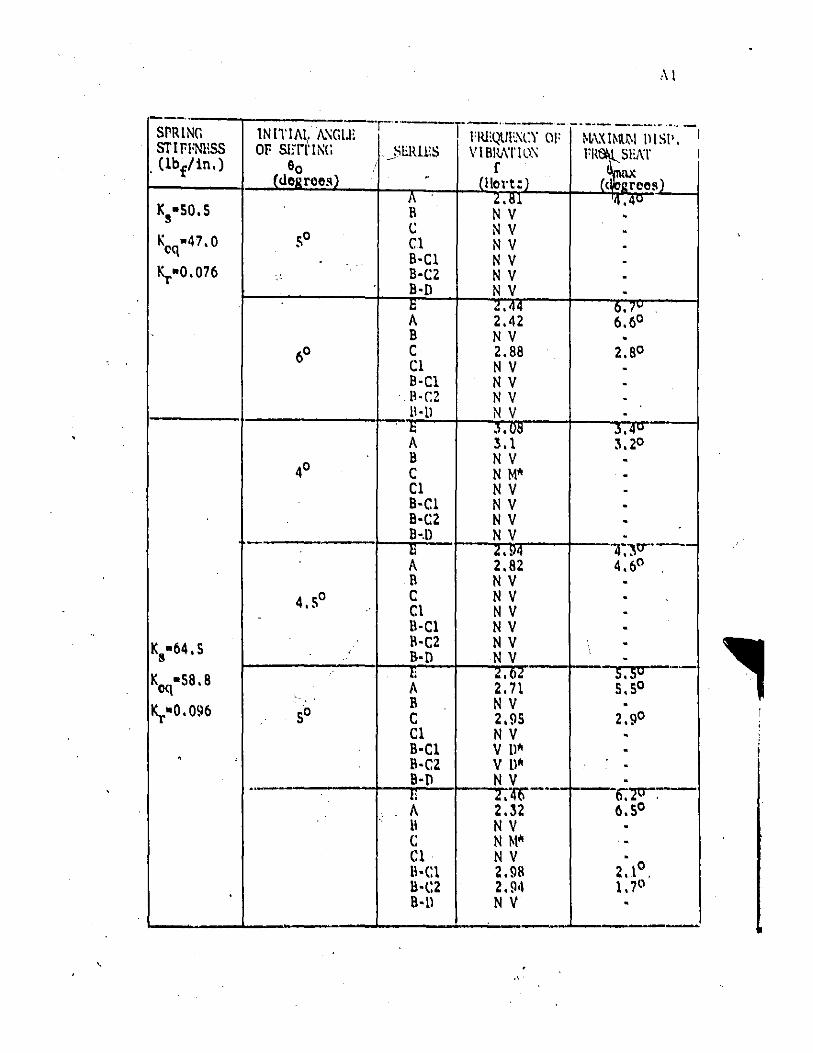
Al
---.. IN IT IAI. A.'\GlJl-r -- r-·---- ----- --.-,--.. -SPRING l'IU;~'l\.m\CY OF ~L\XIMlN IllSI', I
STIPFNlISS OP S1rrl'U\(; --,"E1U,US V I BIlJ\T 1l1:\ FI~ SEAT I , (lbf/in,) 90 f ~
-'-dl)iirel)~) - (IIOl't;l ((liolZrCtlS)
I(S·SO.S ~ ~.~l 'Q.4V . C; N V -I\cq·47.0 ~O Cl N V -B-Cl NV -
~·O.O76 B-C;2 N V -.' B-O N V -X ~:~~ ~. I':' '
6.60 , B N V -
60 C 2.88 2.80 Cl N V -B-Cl N V -
',8-r.2 N V -1\-(1 N V -, t ,\. ~!! .).qw
A 3.1 3.20 B N V -40 C N WI -Cl NV -B-Cl NV -B-C2 N V -B-,ll N V -~ t~~
:-:\0----4:60 ,
1\ N V -0 C N V -4.5 Cl NV -,
lI-Cl N V -I\-C2 N V \ -1(8.64 •5 s-O NV -
I((l(\ ·58.8 c;
t~f U~ A , B NV -~"O.O96 SO C 2.!lS 2.90
Cl N V -B-Cl V D'" -. B-C2 V D" -B-O N V --I,:
qr-- 6:20
, II t32 6.50
1\ N V -C N M'" '-Cl N V
Z.lo . 11-(:1 2.98 1HZ 2.94 1. 70
8-11 N V . -
, ,', .
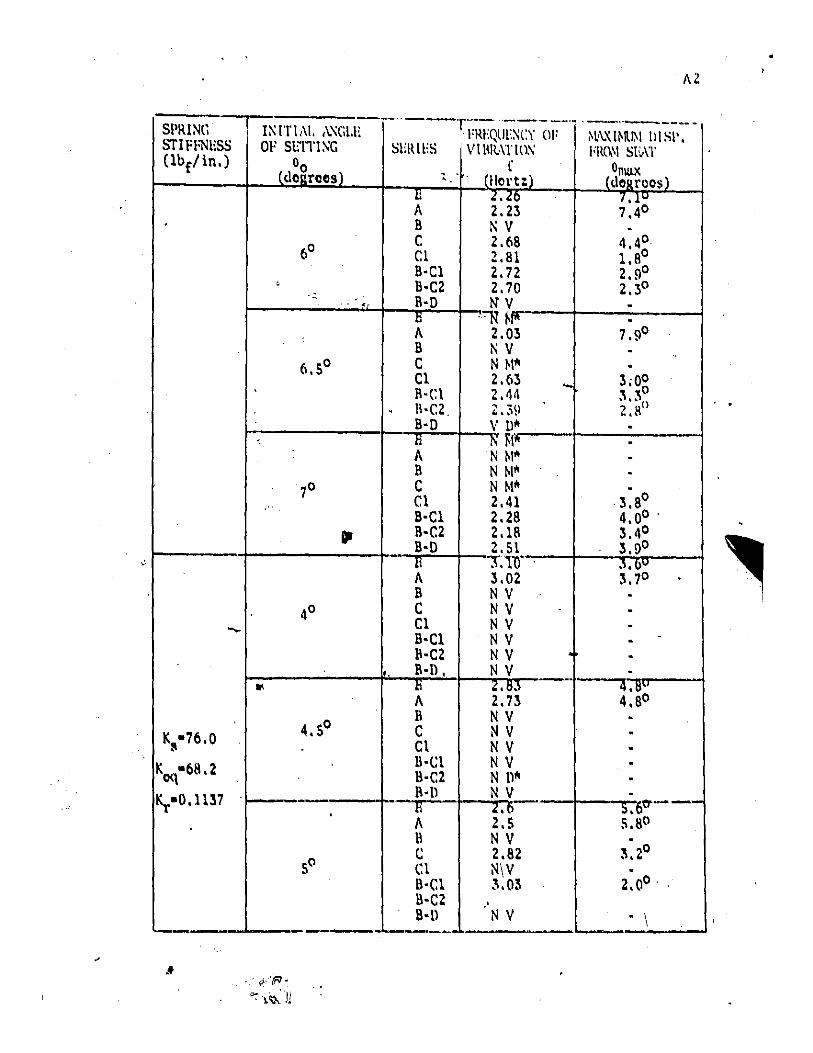
. .
SI'RIN(~ ~iIFFNliSS (lb£1 in.)
-
0
---
Kl\-76.0
Koq-68.2 .
~-0.1l37
1:\ IT!'\\. ,\',GLH OF SL"m:\G
°0 ldoG.roo~)
60
, -.
6.50
-,
70 ..
40
11\
4. SO
5°
--, (':- '/R.
"'.~Jj
-- ' ~(
•
• AZ
--'---T-'----· .. - '---------1 I'REQUE:\CY OF ~l'\',( I~R~I III SI'.
StiR lliS ' V lllR,\ r In\, Flto.ll S[V\T r °mux , - _ (Hertz) (dogroos}
~ U~ 7.1U 7.40
B t;V -C 2.68 4.4~ C1 2.81 1.8 B-Cl Z.72 2.90
B-C2 2.70 2.:30
B-D NV -A
-.~ ~I" -2.0:3 7.':P
B t; V -C N M'" -Cl 2.6:3 ... :3.og !l-C1 2.44 :\.~ . 1I-C2, ~.39 2.R" B-D V U'" -~
N ~I. -'N M'" -
B N M'" -C N ~I'"
0 Cl 2.41 3.8 B-Cl 2.28 4.00 . IH2 2.18 3.40
B-D 2.51 3.90
~ J".11l- , J.o::, 3.02 3.70 .
B N V -C N V -Cl NV -B-Cl N V - .
1\-C2 NV -• B-1) • NV --- 4.~~
A l. ~~~ 2.13 4.So
B N V -C N V -C1 N V -B-t:t N V -B-C2 N n'" -1\-\1 N V -~----rr ~.~- t~~, II 2.S II N V
3.20 t: 2.82 C1 N\V -B-Cl :\.03 2.00 ' II-C2 . B-ll N V - \ -
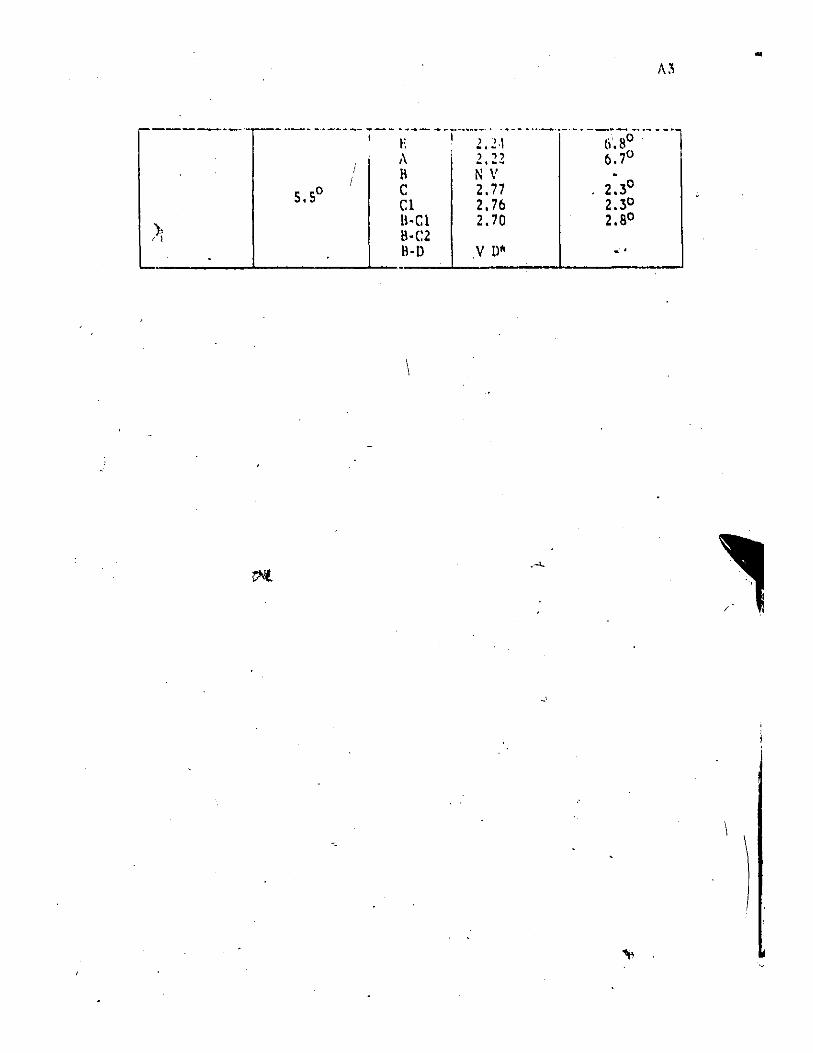
-_._-- - .---- j-- ~:-- -T-·--i:·2.\ --- ... -.--. -~i;.80-·~- -_.
o 5.5
I I
t\ 2.22 (:).7° 1\ NV • C 2.77 2.30
C1 2.76 2.30
IHI 2.70 2.80
I\·C2 II-D .V Dft
. -'-
..
'I,
..

SPRING STII'R-o'F.SS (lbf/in.)
.... --:1'0 ,--
..
Ks-SO.5
Koq-71.9
~-0.1204
-
-.\ "..,\ .,
INITIAL ANGLE 01' Slil-I'INl;
. (. 00 . . do~rClos)
60
6. SO .
)-\
40
4.50
50
•
,
5.50
-. .
• 1
"---- -_._------_._---FREQLJIi~CY OF ~l'\,\ l~llJ.\t LJ I St'.
SIHUliS V 11IR'\'\' \(1:\ FI\(),\\ SEA'l r omW(
(Hurn) (tlogrcEl~)
~ 2.09 1.2u, 2.14 7.n° -
~ N ~l~ -2.54 3.10 .
3.10 Cl 2.38 B·Cl 2.41 3.20
IH2 2.42 2.80
B·D 2.76 3.10
~ ~ ~: -· - B N M~ ·
S 2.39 4.20
Cl 2.33 3.80
B-Cl 2.23 3.90 11·(;2 N M~ · B·D N M'II ·
J.o'll --.--1\ ~.l A 2.92 ~;74° B N V -C N V · Cl NV · B-Cl N V · B-C2 NV · B·n N V ·
. 1l 'ffNA- - .--A N M~ · II NV , · , C N M~ · Cl N V._
1.60 B·Cl 3.1~ ·B·C2 / :
B·n N V t---6:0~ 1l 4!.5! ~:--
A 2.57 5.90 II N V · . C N M~
2.00 Cl 2.88 n·Cl 2.85 2.20
Il·C2 lI·ll N V
1--'6:,0 X
t--"T,"2q--.-N M~ · B N W" ·
C N ~I~ , Cl 2.69 2.50
B·Cl 2.48 2.80
B-G2 2.10 . lI·n 2.86 - _.-.
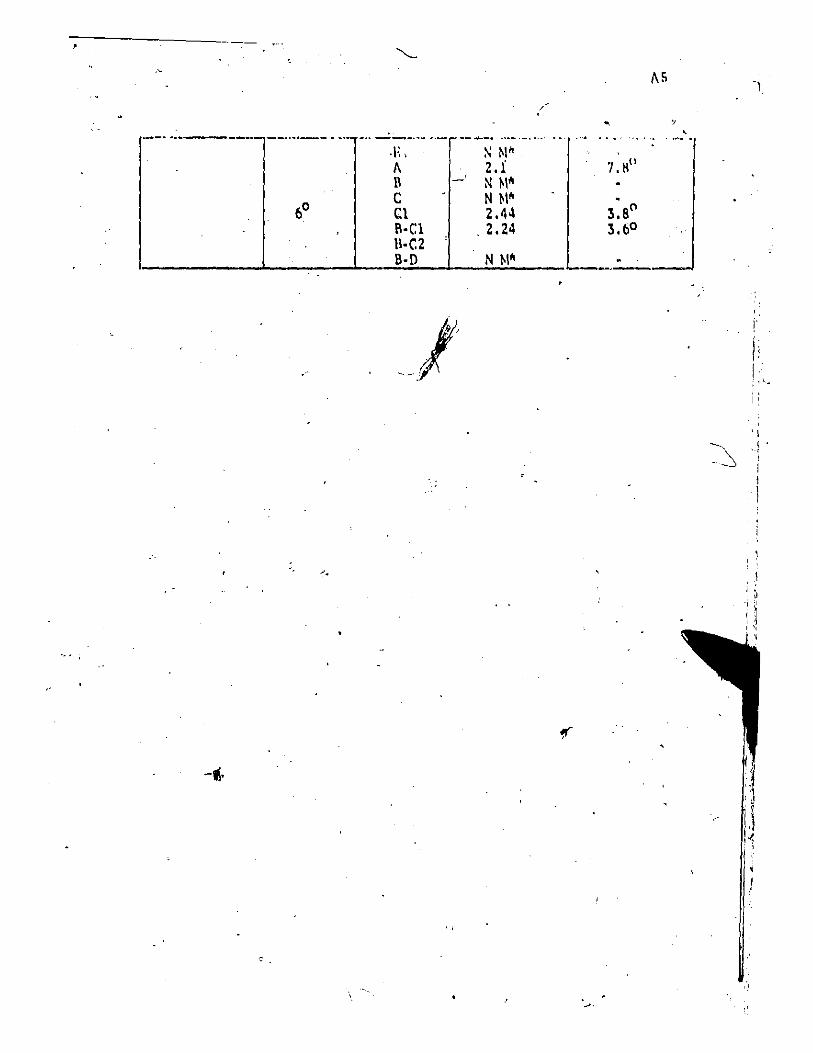
,
. _----.. - -_ .... _- .. ,- '" _._ ...... -.-._--....•. - ... . .E, ~ N" A 2.i II - , N M~
6° C N M~ CI 2.44 !I·CI 2.24 II·C2 B·D N M~
.'
' .
I: ,
I , , i'
, '\ - ,.
- ~ 'j
, I f
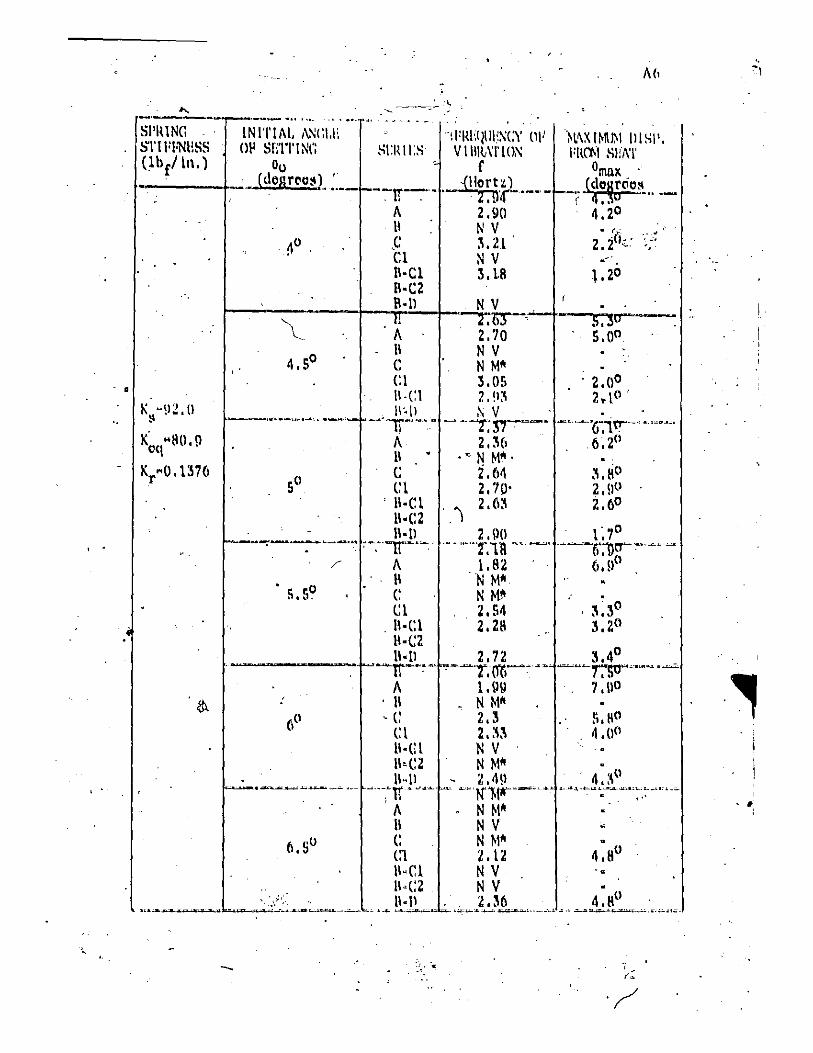
..
, .
...
C' ~\)" (I (\~ • to I
K~(t" 8ll. !l
":r"O.lm
" .
I
. ~o
• 0 S. S.
-.
. . . ', 7
I',,,"
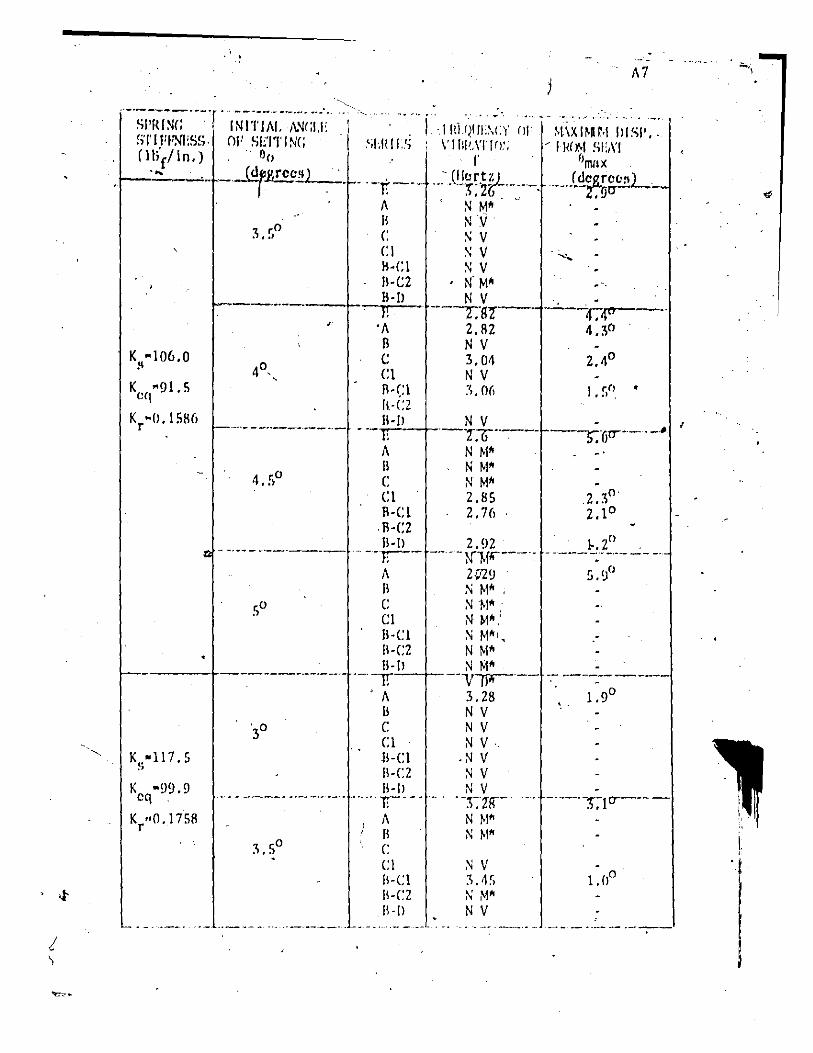
I '>
.' . !
A7
-'Si:;;-iN-(; ·--·INI;~iA'~·~\'~(;-i,i(·' ...... fll(](I'JJ .. \~:)' (;1 ,\t\x'l~nr,i i)ISI'.-: !>I'II'I::f1(SS. Of'SE'ITIN(; ,';I,HII.S : \,1 1I1',\lIfJ.'; 'II{C)'.I SI:,\'I (1I;·C/ lo .) .' 00 f' ('mil X
.... ' .. _~y,rcc~ 1 . + .. -·Tt --c' ·"-·(Ur~~-.. ··--... .. J dt:-g~~L,-
K "91. 5 eq
Krh{).15H6
K •. -1l7.5 ,. K -99.9 cq
K "0.1758 r
A N M" " 1\ N V c: S V CI S V II·CI S V 11·(;2 N' W .'.
---_._-- B·ll N V l! -'-z.'g!--j-'--'4.~-"
'A 2.A2 4.~o B N V C 3.04 Cl N V 1\-(:1 :1. Oil 1 r{J "
•• 1.
IH:2 · .. -.... -----.. - ---H·!l-t--~f .. ~--- ---T.'(ju---'-~ I
A N ~I' -'
II N M' C N M' • 4 ,,0
.. > (;1 2.85 .2.~ o·
B-CI 2.76 2.10
.B-C2 0
B-ll 2.92 1-.2 -.. --- .. -_.---- '--r:--- --·"}f1.f.----- "-""-".'-"---"
,,0 "
A Z.Q'Z~ 5. ~o fl ..... M' , (; .'J N. : (;1 N W'.' B-CI ..... MO" II-C2 N ~I' B-ll N M' ------------- '-' -v. --'1/ h~
• A 3.28 Il N V
, . C N V (;1 N V .
'0 3
H-CI . N V II-C2 N V 11-1) N V .. ------ .. ---.---..... 1:"-- .... -Tlff-" ------:DO----
o 3.5
A N ~I· II NW (;
(;1 II-CI II-CZ IH)
N V 3A" NW N V
_ •.. ___ .. ___ .. _ .. __ .. ____________ .L ___ ._ . ___ . __ ._.
! 'j

~-,.,
" .'
•
j,
r-'-~ ---------" SI'RINei INITIN. ANea.l: STt rFNt~"S ew SEWING (lbf/ln.) 00 ' :"
-( degrco~ J _
< . . - -40 ..
"
r--. . . -_. ~
.
4'.50
-.
SO
,
IE:? 30
Ks-129.0
Kcq-lOB.l
Kr-0.l930
" 3.50 ,
..
--'---,---•
.. ~o
.\
-: ... ~. "~-'T ·';;"Q!JI:.7c;);· ~»;-r ~;'\X~\f~;' SI!R 115 V '1I'~\TTo.\ FUll" Sf'
f -. Jllort~
, 1:-U~ A
o' B j N W" c: 2.98 • C:l -3.03 IHl 2.98 1l:C2 B-D NV
2.56 -I: , A .N M~ II N M~ 0, . N Mir Cl 2.79 IHI 2,57 ,,\-(,2 11-1) 2.88 yr- , N ~rr-:--,-
A 2.17 B N ~11r .
• C 2.38 Cl 2.45 S-Cl 2.23 S-C2 11-1) 2.7 , t: ,'~--
A 3.22 . B N V C' N V Cl NV B-cr NV I
B-C2 N V ,
11-0 N V -". H! I,:
A NM~
l! N V C N Mir -CI N V 8-Cl 3.30 Il-C2 S:D N V
1--1: T.f(;---A 2.62 l! N ~11r c: 2.B7 C1 2.98 B-CI 2.85 1\-(2 . - 1I-f)
(1 11111 )(
~ 4.50
2 ,0 •• 1
1.60
'1. SO
, -T,R"
---2,5 7..1
o o
2. z' f--.----:-
~-
6.7 o -.
3.7 o o o
. 3,.2 2,4
-2. ( ~, ' -
2.4 o
----
./ --
3.3 cr--'-,-0
---
1.1 o
--_. ~ . -
2. 2. e 1.
, ___ ~_03 _____ . 1. _ •• __ __ ~ _ L..- ____ •. -. ______ , _ • ________ ----
, j
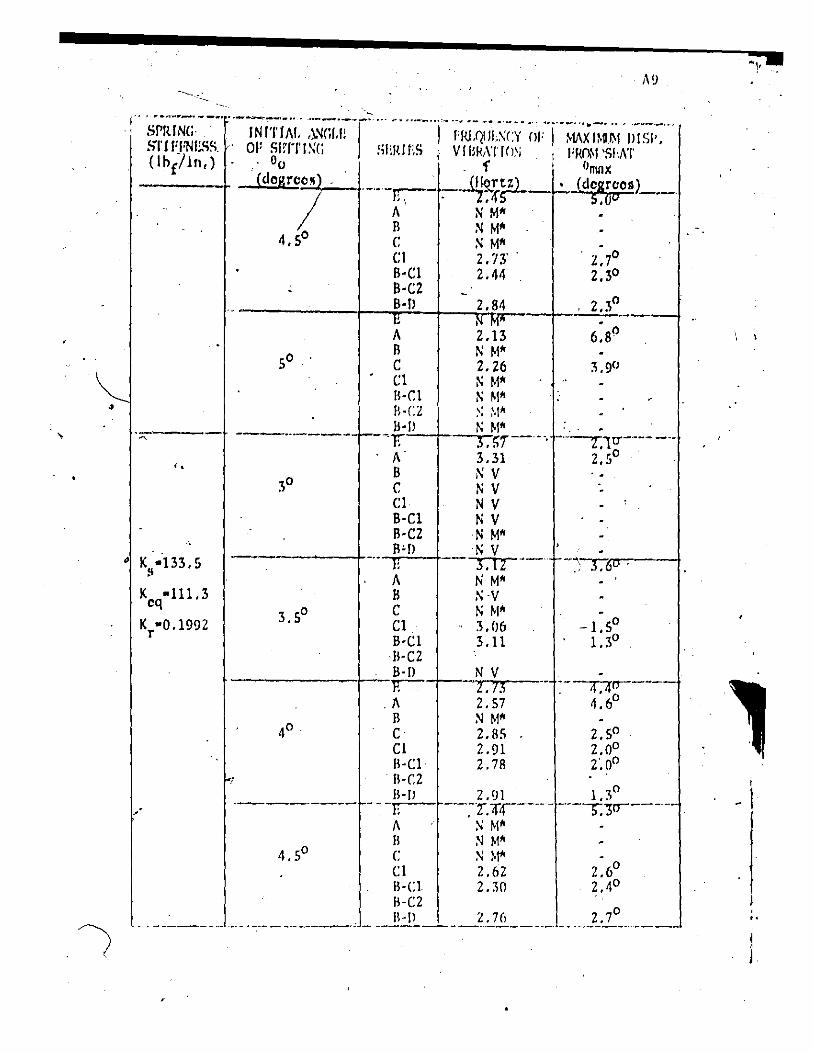
, .::;---- _. __ .. -----, ,
.. • K -133 5 , .
Kcq-111.3
Kr -O.1992
A Il C Cl IHI H·CZ 11-1)
--F-A B C (;1 S'Cl B'C2 B'll
A B C C1 B·Cl n'C2 B·ll
----------~-~
.A B C Cl IHl·
·IH2 n·lJ ---" A II C Cl B·CI IH2 11-1)
, 2.13 6.8C) N M~ 2.26 3.90 N M~ N ~I~ >; ~·11f N ~I~ .
-"-r;'T _ .... ----r:1lT---- -" ;'J.. • 0 ' 3.31 2.5 . N V .• N V N V NV N M~ N V 3.12 N M~ N·V
-";:-r-,m-:--.;, ,).0""'
N ~I~ 3.()6 3.11
N V -.;,;.~..;",--.. -----nrr----
•• 73 . • 0 2.57 4.6 :oJ M~
2.85 2.50
2.91 2.00
2.78 r.oo
2.76 2.7 o -_ ... _-----_. -- ... _---_ .. _--
,
) , ..
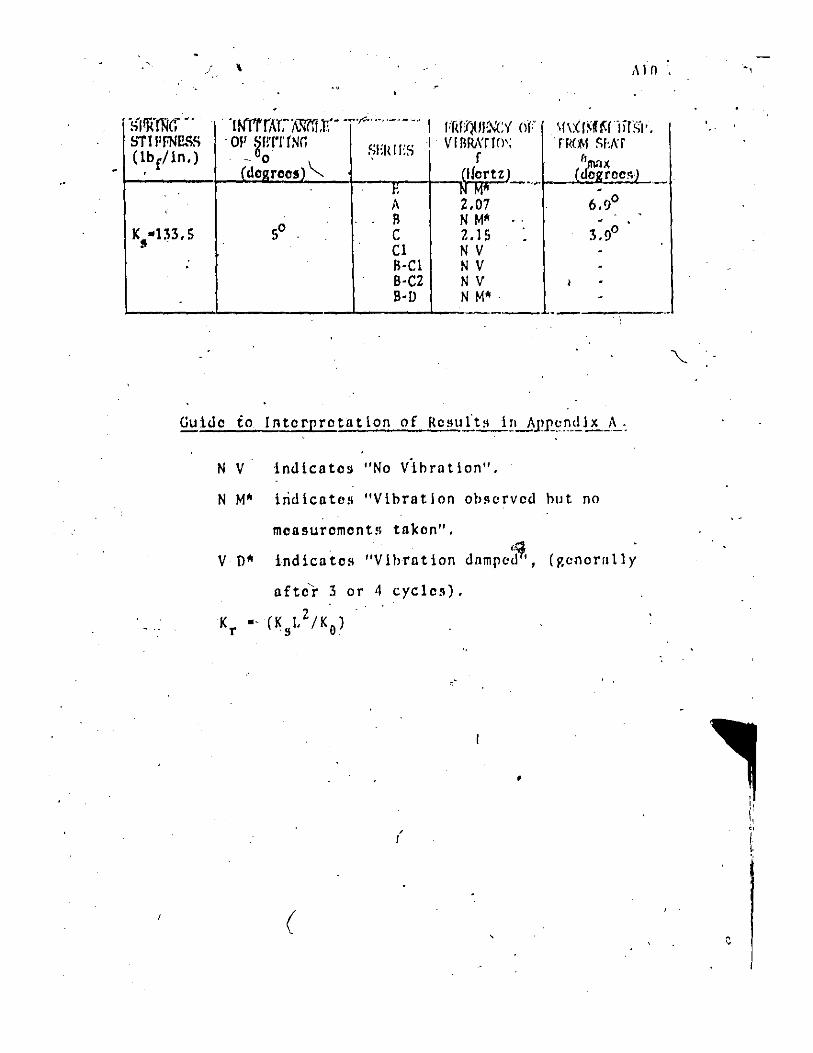
, SI!H'!'Nr. .. bil !iFNI!SS (lbe/ In.)
,
,
K ·B3.5 II .
.
J \
. ·[NrrrAT,-i\.w.t:r.'- -~. _ ... -._-- I I'fdf~fI~\'CY . OJ! ~Irl'!' rNr.
~ElliES I V IIIR,\T 10\
- 0 f (dearees) ~ Mertz)
r. N Mft A 2.07 B N M~
50 C 2.15 Cl N V IHl N V B-C2 N V B-D N 101 ft .
N V indicates "No V·lhratlon".
of
a, ...
,\10
\r\:(r~H;nHi;I' . f RCt>1 Sf'./\T
"lMJ( (degrec~l __ .
6.<,P - o 3,9
N 101 ft iridicatoH "Vihratlon oh~crvcd hut no
measurement!! tllken".
V D~ indicates "Vlhrlltion dnmpc;]1" (p.cnorfilly
lifter 3 or 4 cycles).
2 Kr •. (Kg" IKo)
.. '
(
"
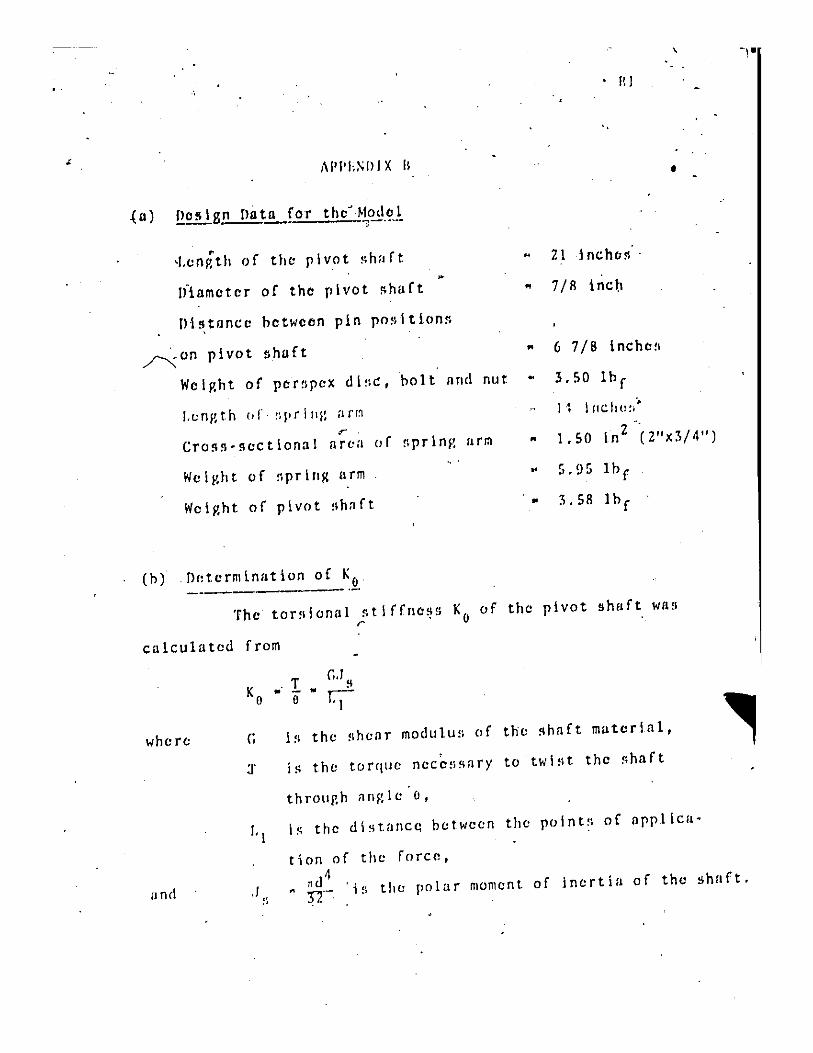
.. ,
• l! J
"
•
~u) ~£.!lgn !lutu for thc-'~lod(ll ~-.~-.-
• ,I.enp,th of the pivot ~hn ft H 211nchC1r.' ~
Ifiamoter of the pivot ~huft .. 7/R Inch
!llstance between pin positions
~on pivot !lhuft .. 6 7/8 Inche!1
Wclp,ht of pcr~pex dln~, bolt und nut • 3.50 lb f
11 lllcho!:-I.t:Tlp,th oi'· !Ipr llif! arm or
Cro9~-sectlonal aren of nprlnr. nrm LSD 1n2 (2"1:3/4")
Welr.ht of nprlllR arm
Wcllht of pivot Rhaft
5.95 lh f
3.S8 Ib f
(b) . [lr,terminatlon of _K~
The tor!lionul ;.t! ffTle~!l Ko of the pivot shaft was
calculated from
where
find
K . T
o • 0 • G.I
~
rt G 19 the shear modulun of the shaft material,
~ i9 the torrille necessary to twiRt the shaft
throup,h nnf!le'o,
1.1 19 the d\ stnncq between the polnt!1 of oppllcu-
.J " "
tlon of the force,
nd 4 " 3"2'- 'is the polar moment of inert in of the shuft.
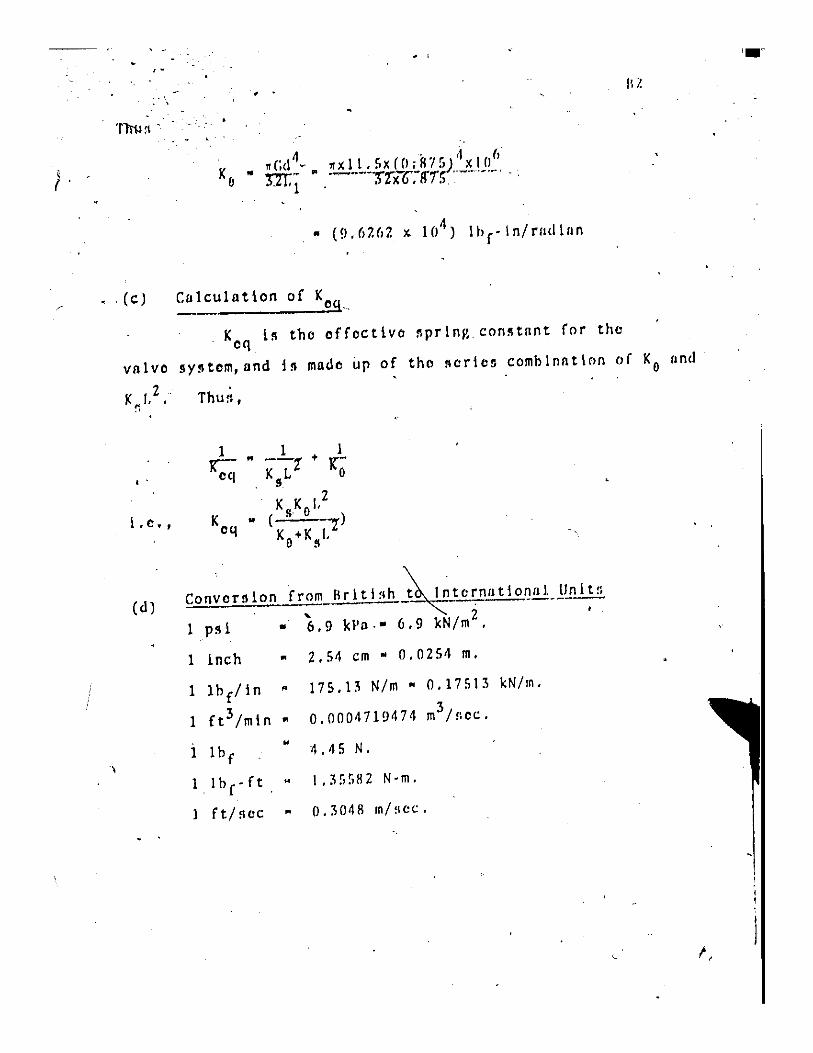
(, .
\
, .
K .. o
. , ,
, (C) Culculation of Keq~
Koq i~ tho effoctivo ~prln~con~tnnt for the
valvo sy§tom,and l~ mado ~p of tho ~orlen comhlnatlon of Ko nnd
K 12 '
"' . Thu!l, "
I "
I 1
~ --'[ + r-.. KsL 0
, K K 1,2 i . c .. , Keq
.. ( so) Ko+K ,7 s
(d) ConvOT9ion from_Brltl~h ~ 'ntornfitlor.l!!l.l1.1llli
." -~ 2 •. 1 psi • 6.9 kPn.· 6.9 kN/m .
1 Inch .. 2.54 em .. 0.0254 m .
1 1 h fl In .. 175.13 N/m .. 0.17513 kN/rn.
1 ft 3/mln .. 0.0004719474 m3 IlICC.
.. 1\.45 N. 1 Ih f
1 Ihr-ft M 1.35582 N-m,
1 ft/sec .. 0,3048 rn/~cc,
Related Documents


![Vol 39 - [Swing, Swing, Swing]](https://static.cupdf.com/doc/110x72/55cf8f5a550346703b9b7709/vol-39-swing-swing-swing-5699adb3c742c.jpg)
