UC Riverside UC Riverside Previously Published Works Title The Habitability of Proxima Centauri b: Environmental States and Observational Discriminants. Permalink https://escholarship.org/uc/item/7v73n0cm Journal Astrobiology, 18(2) ISSN 1531-1074 Authors Meadows, Victoria S Arney, Giada N Schwieterman, Edward W et al. Publication Date 2018-02-01 DOI 10.1089/ast.2016.1589 Peer reviewed eScholarship.org Powered by the California Digital Library University of California

Welcome message from author
This document is posted to help you gain knowledge. Please leave a comment to let me know what you think about it! Share it to your friends and learn new things together.
Transcript

UC RiversideUC Riverside Previously Published Works
TitleThe Habitability of Proxima Centauri b: Environmental States and Observational Discriminants.
Permalinkhttps://escholarship.org/uc/item/7v73n0cm
JournalAstrobiology, 18(2)
ISSN1531-1074
AuthorsMeadows, Victoria SArney, Giada NSchwieterman, Edward Wet al.
Publication Date2018-02-01
DOI10.1089/ast.2016.1589 Peer reviewed
eScholarship.org Powered by the California Digital LibraryUniversity of California

The Habitability of Proxima Centauri b:Environmental States and Observational Discriminants
Victoria S. Meadows,1,2 Giada N. Arney,1,2,3 Edward W. Schwieterman,1,2,4,5 Jacob Lustig-Yaeger,1,2
Andrew P. Lincowski,1,2 Tyler Robinson,2,6 Shawn D. Domagal-Goldman,2,7 Russell Deitrick,1,2 Rory K. Barnes,1,2
David P. Fleming,1,2 Rodrigo Luger,1,2 Peter E. Driscoll,2,8 Thomas R. Quinn,1,2 and David Crisp2,9
Abstract
Proxima Centauri b provides an unprecedented opportunity to understand the evolution and nature of ter-restrial planets orbiting M dwarfs. Although Proxima Cen b orbits within its star’s habitable zone, multipleplausible evolutionary paths could have generated different environments that may or may not be habitable.Here, we use 1-D coupled climate-photochemical models to generate self-consistent atmospheres for severalevolutionary scenarios, including high-O2, high-CO2, and more Earth-like atmospheres, with both oxic andanoxic compositions. We show that these modeled environments can be habitable or uninhabitable atProxima Cen b’s position in the habitable zone. We use radiative transfer models to generate syntheticspectra and thermal phase curves for these simulated environments, and use instrument models to explore ourability to discriminate between possible planetary states. These results are applicable not only to ProximaCen b but to other terrestrial planets orbiting M dwarfs. Thermal phase curves may provide the first constrainton the existence of an atmosphere. We find that James Webb Space Telescope ( JWST) observations long-ward of 10 mm could characterize atmospheric heat transport and molecular composition. Detection of oceanglint is unlikely with JWST but may be within the reach of larger-aperture telescopes. Direct imaging spectramay detect O4 absorption, which is diagnostic of massive water loss and O2 retention, rather than a pho-tosynthetic biosphere. Similarly, strong CO2 and CO bands at wavelengths shortward of 2.5 mm wouldindicate a CO2-dominated atmosphere. If the planet is habitable and volatile-rich, direct imaging will be thebest means of detecting habitability. Earth-like planets with microbial biospheres may be identified by thepresence of CH4—which has a longer atmospheric lifetime under Proxima Centauri’s incident UV—andeither photosynthetically produced O2 or a hydrocarbon haze layer. Key Words: Planetary habitability andbiosignatures—Planetary atmospheres—Exoplanets—Spectroscopic biosignatures—Planetary science—Proxima Centauri b. Astrobiology 18, 133–189.
1. Introduction
The discovery of a possibly terrestrial-mass planet sittingsquarely in the habitable zone of the Solar System’s
nearest neighbor (Anglada-Escude et al., 2016) is a remark-able opportunity to further our understanding of the evolution
of terrestrial planets and the distribution of life in the Uni-verse. If confirmed, Proxima Cen b is the closest potentiallyhabitable planet and one of the most accessible examplesorbiting a late-type M dwarf host. M dwarfs comprise 70% ofall stars, and habitable planets orbiting M dwarfs may be themost common environment for life in the Universe. However,
1Astronomy Department, University of Washington, Seattle, Washington.2NASA Astrobiology Institute—Virtual Planetary Laboratory Lead Team, USA.3Planetary Systems Laboratory, NASA Goddard Space Flight Center, Greenbelt, Maryland.4NASA Postdoctoral Program, Universities Space Research Association, Columbia, Maryland.5Department of Earth Sciences, University of California at Riverside, Riverside, California.6Department of Astronomy and Astrophysics, University of California, Santa Cruz, California.7Planetary Environments Laboratory, NASA Goddard Space Flight Center, Greenbelt, Maryland.8Department of Terrestrial Magnetism, Carnegie Institution for Science, Washington, DC.9Jet Propulsion Laboratory, California Institute of Technology, Pasadena, California.
ª Victoria S. Meadows et al., 2018; Published by Mary Ann Liebert, Inc. This Open Access article is distributed under the terms of theCreative Commons Attribution Noncommercial License (http://creativecommons.org/licenses/by-nc/4.0/) which permits any non-commercial use, distribution, and reproduction in any medium, provided the original author(s) and the source are credited.
ASTROBIOLOGYVolume 18, Number 2, 2018Mary Ann Liebert, Inc.DOI: 10.1089/ast.2016.1589
133

although Proxima Cen b has several promising attributes,including its possibly small size (minimum mass of 1.3 M4)and its position in the conservative habitable zone (Koppar-apu et al., 2013) with an effective instellation (i.e., stellarirradiation) 65% that of Earth’s (Anglada-Escude et al.,2016), its habitability is not guaranteed. A determination ofthe degree to which this planet is habitable, or any otherinsights into the fate of terrestrial planets orbiting M dwarfs,awaits follow-up information on its orbit, the planet’s phase-and time-dependent photometry, and on spectra of theatmosphere and surface. Conversely, Proxima Cen b willultimately provide an excellent observational laboratory forour current understanding of terrestrial planet evolution,which will in turn inform our knowledge of the prevalence ofhabitability and life in our galaxy.
In advance of these data, we can synthesize what has beenlearned over the past several decades on star-planet andplanetary environmental interactions for terrestrial planetsto make a broad, preliminary assessment of plausible evo-lutionary processes and current environmental states forProxima Cen b. This assessment will also be highly relevantto other terrestrial planets found in M dwarf habitable zones,such as the recently discovered TRAPPIST-1 planets (Gillonet al., 2016, 2017) and LHS1140 b (Dittmann et al., 2017).In our companion paper (Barnes et al., 2018), we exploredlikely evolutionary paths for Proxima Cen b, as it coevolvedwith the Galaxy, companion stars and planets, and itshost star. In this paper, we model several of these possibleplanetary environmental outcomes with coupled climate-photochemical models that are self-consistently forced bythe spectrum of Proxima Cen. We then use radiative transferand instrument simulation models to generate syntheticphase-dependent light curves, and transmission and directimaging spectra, which are relevant to missions such as theJames Webb Space Telescope ( JWST1; e.g., Cowan et al.,2015), ground-based extremely large telescopes (ELTs;e.g., Kasper et al., 2008), the Wide-Field Infrared SurveyTelescope (WFIRST2; Spergel et al., 2015), the HabitableExoplanet Imaging Mission (HabEx3; e.g., Mennesson et al.,2016), and the Large UltraViolet Optical Infrared Surveyortelescope (LUVOIR4; e.g., Kouveliotou et al., 2014;Dalcanton et al., 2015). These spectra can be used to predictpossible attributes and necessary measurements to identifydiscriminants for habitable and uninhabitable environments,and to explore the potential detectability of environmentalsigns of habitability and life.
We consider scenarios for atmospheric composition dri-ven by stellar, orbital, and planetary evolution, and use ourmodels to explore the photochemical and climatic outcomes,and observable attributes. Our first scenario is an oxygen-dominated atmosphere, generated by the loss of oceans ofwater during Proxima Cen’s pre-main sequence phase(Luger and Barnes, 2015). In this scenario, the planet can beeither desiccated or have retained some of its initial waterinventory. In the second class of scenario, the atmosphere isCO2-dominated and progressively desiccated, and is formed
when the majority of O2 from ocean loss is either lostto space or sequestered in the planetary crust or interior(Schaefer et al., 2016), while CO2 is outgassed from themantle. In this case, O2/CO2-dominated atmospheres couldform and potentially evolve to more CO2-rich Venus-likestates as the O2 is lost or sequestered. Ultimately, with ex-treme desiccation, CO2-dominated atmospheres could pho-tolyze to stable CO2/CO/O2 atmospheres (Gao et al., 2015).In the final set of scenarios explored here, the planet ispotentially habitable, having evolved as a ‘‘Habitable Eva-porated Core’’ (Luger et al., 2015), where an early hydrogenenvelope protected a terrestrial or volatile-rich core fromwater loss. Alternatively, a terrestrial planet initially orbitingfarther from the star could have moved to the current orbitof Proxima Cen b via orbital instabilities, possibly trig-gered by a close passage of Proxima Cen to a Cen A and B(Barnes et al., 2018). Two cases are presented for thishabitable scenario: an oxidizing, modern Earth-like atmo-sphere, and a more reducing Archean (3.8–2.5 billion yearsago) early Earth-like atmosphere.
In Section 2, we review the possible evolutionary scenariosfor Proxima Centauri b and briefly discuss observable pa-rameters for identification of habitability and biosignaturesfor terrestrial planets. In Section 3, we describe the radiativetransfer, instrument, climate, and photochemical models,along with their model inputs. In Section 4, we present ourresults. In Section 5, we discuss the implications of ourmodeling, including an assessment of the scenarios that mightlead to habitability for Proxima Cen b. We also identify futureobservations that will help discriminate between the proposedevolutionary paths, and potentially identify signs of habit-ability and life. These results are summarized in our conclu-sions in Section 6.
2. Review of Habitability and Detectability
In this section, we briefly review the factors that can affectterrestrial planet habitability and the plausible evolutionarypaths for Proxima Cen b as explored in our companion paperby Barnes et al. (2018). We describe how characteristics ofthe planet and planetary system could affect Proxima Cen b’scurrent climate. To motivate the detectability simulation re-sults and discussion that follow, we will also briefly re-view relevant knowledge on observations to identify signs ofhabitability and life for terrestrial planets.
2.1. Evolutionary processes and the possiblehabitability of Proxima Cen b
Although Proxima Cen b is possibly small enough to beterrestrial and sits in the habitable zone of its parent star,many factors other than planetary mass and star-planetdistance affect a planet’s volatile inventory, atmosphere, andsurface environment. These factors, in conjunction with theevolution of the star and planet, can maintain or destroyhabitability. Classically, exoplanet habitability is defined asthe ability to maintain liquid water on the surface of a rocky,terrestrial planet, and the habitable zone is that range ofdistances from the star over which an Earth-like planet canmaintain surface liquid water (Kasting et al., 1993). How-ever, if Proxima Cen b formed in situ, then planet formationmodels suggest that it may be water-poor (Lissauer et al.,2007; Raymond et al., 2007); but if it migrated in from
1http://www.jwst.nasa.gov2http://wfirst.gsfc.nasa.gov3http://www.jpl.nasa.gov/habex4https://asd.gsfc.nasa.gov/luvoir
134 MEADOWS ET AL.
further out in the system, then it may have been morevolatile-rich at formation (Luger et al., 2015). Proxima Cenb’s close-in orbit (a = 0.0485 AU; Anglada-Escude et al.,2016) also leaves it particularly vulnerable to the effects ofstellar evolution and longer-term radiative and gravitationalinteraction between star and planet. These interactions coulddrive volatile and atmospheric loss processes and orbitalchanges that could preclude habitability for this planet.These processes are examined in more detail in our com-panion paper, and an overview of the scope of plausiblescenarios is given here to motivate the climate and spectralmodeling work that follows.
Perhaps the greatest threat to Proxima Cen b’s habitabilityis the luminosity evolution of its M dwarf host (Luger andBarnes, 2015; Barnes et al., 2018; Ribas et al., 2016).Lower-mass M dwarfs can experience extended pre-mainsequence phases of up to a billion years, in which they aremore luminous than they will ultimately be when they settleon to the main sequence (Baraffe et al., 1998, 2015). Duringthis superluminous pre-main sequence phase, any terrestrialplanet that forms in what will become the main sequencehabitable zone is subjected to extremely high levels of ra-diation, which can vaporize and photolyze oceans and striplighter elements from the atmosphere (Luger and Barnes,2015). Simulations performed in our companion paper in-dicate that, had Proxima Cen b formed at its current loca-tion, then its host star would have taken as long as 169 – 13million years after formation to dim sufficiently to allow theplanet to enter the habitable zone for the first time (Barneset al., 2018). Consequently, if Proxima Cen b is a terrestrialplanet, it may have been in a runaway greenhouse state forthe first 169 million years. The vaporized ocean would havebeen photolyzed by UV from the host star, with subsequentloss of H to space; and between *3 and 10 terrestrial oceanequivalents of water could have been lost, depending on theefficiency of oxygen sinks, photochemical shielding, and theplanet’s initial water endowment (Barnes et al., 2018).
Since loss of one Earth ocean equivalent of water canpotentially produce up to 240 bar of atmospheric oxygen(Kasting, 1997), the remaining atmosphere may be stronglyoxygen-dominated (Luger and Barnes, 2015) but may tran-sition to being more CO2-dominated with time as the freeoxygen reacts with the surface. The final amount of oxygenwill depend on the initial water inventory, the stellar XUVflux, atmospheric losses through hydrodynamic escape andother top-of-atmosphere processes (Collinson et al., 2016;Airapetian et al., 2017; Dong et al., 2017), and the efficiency ofplanetary sequestration processes (e.g., Schaefer et al., 2016).However, if the atmosphere is retained and oxygen loss andsequestration is efficient—and CO2 outgassing proceeds viaterrestrial geological activity—then the atmosphere may tran-sition from O2-dominated, through O2/CO2-dominated, toa more Venus-like, CO2-dominated atmosphere, if largequantities of outgassed CO2 are present (Chassefiere, 1996a,1996b). Note that Barnes et al. (2018) found that the mantletemperature of Proxima Cen b could be maintained at highvalues due to either tidal heating or increased radiogenic heat-ing, so a high outgassing rate may be likely. If the planet alsooutgasses SO2, photochemical processes can result in the for-mation of a planetwide sulfate cloud and haze deck. If theatmosphere is desiccated, with H2O abundances of the order oftens of parts per million, HDO may be enhanced as an indicator
of early water loss, as is also the case for Venus (de Bergh et al.,1991). Should such a CO2-dominated planet become signifi-cantly more desiccated than Venus—with atmospheric hy-drogen inventories <1 ppm—then photochemical processescan split CO2 while the lack of hydrogen-bearing species in-hibits its recombination, resulting in a stable equilibriummixture of CO2, CO, O2, and O3 (Gao et al., 2015).
However, Proxima Cen b may be more likely to be hab-itable if it formed at its current position with a dense hy-drogen envelope, or formed in a region of the protoplanetarydisk rich in ices—and then migrated inward. For thesescenarios, rather than stripping water from the planet, thesuperluminous pre-main sequence phase of the star mayhave removed enough of the primordial hydrogen (Owenand Mohanty, 2016) to reveal a habitable evaporated core—a potentially volatile-rich planet without the dense hydrogenenvelope that may otherwise preclude habitability (Lugeret al., 2015). Our calculations suggest that, if Proxima Cen bstarted with 0.1–1% of its planetary mass in hydrogen, itcould have survived the pre-main sequence phase and re-mained habitable (Barnes et al., 2018). The extreme UVradiation from Proxima Cen would have caused H2 loss—protecting the water vapor beneath—for the *170 millionyears required for the star to dim and the planet to enter thehabitable zone. At this point, the planet would have beensafe from further H2O loss if atmospheric water vapor werecold trapped in the troposphere by a sufficient inventoryof noncondensable gases, such as N2 (Wordsworth andPierrehumbert, 2014). Even if sufficient N2 were not ini-tially available, the buildup of O2 (also a noncondensablegas) from the loss of H2O could potentially reestablish thecold trap and inhibit subsequent water loss (Wordsworth andPierrehumbert, 2014). Another potential path to habitabilityof Proxima Cen b is a later, large-scale dynamical instabilityof its planetary system possibly caused by Proxima Centauripassing close to a Cen A and B (Barnes et al., 2018). If theplanet formed beyond the habitable zone, orbital disruptioncould have allowed it to arrive in its current orbit after thepre-main sequence phase. In this scenario, the planet wouldnot need an initial thick hydrogen envelope to protect itfrom desiccation and could start off as a terrestrial body.
Over the 3.5- to 6-billion-year age of the system (Bazotet al., 2007), Proxima Cen’s activity levels may have alsoaffected the planet’s habitability. Despite its relatively longrotation period (83.5 days, Benedict et al., 1998), whichoften correlates with lower activity levels, Proxima Cen is amoderately active star with many strong flares per year(Davenport, 2016), and the stellar magnetic field which drivesstellar activity is *600 times stronger than that of our sun(Reiners and Basri, 2008). Earlier modeling suggested thatEarth-mass planets in the habitable zones of M dwarf starswould suffer continuous exposure to strong stellar windsoriginating from coronal mass ejection events with a subse-quent rapid loss of planetary atmosphere (Lammer et al.,2008). This loss could be exacerbated by the shutdown ofmagnetic dynamo production due to tidal heating of the planet(Driscoll and Barnes, 2015) or higher initial radiogenicabundances than Earth (Barnes et al., 2018). Ribas et al.(2016) also argue that ion pickup processes could remove upto 100 bar of N2, which would enhance stratospheric watervapor concentrations and potentially lead to the loss of up to21 Earth ocean equivalents of hydrogen over the age of the
PROX CEN B: HABITABILITY AND OBSERVABILITY 135

system. Airapetian et al. (2017) pointed out that ion lossprocesses from the early active star could remove oxygen andnitrogen from planets orbiting active M dwarf stars, althoughthis rate is subject to the strength of the planet’s magneticfield, and replenishment rates from outgassing and volatiledelivery. Garraffo et al. (2016) used magentohydrodynamicmodels of the stellar wind pressure and conclude that ProximaCen b’s magnetospheric standoff distance undergoes signifi-cant stellar wind–induced changes on daily timescales, thatare important to consider when calculating atmospheric lossprocesses. Dong et al. (2017) also modeled atmospheric lossfrom a CO2-dominated 1 bar atmosphere for Proxima Cen band concluded that such a planet may undergo significantatmospheric erosion over billion-year timescales in both themagnetized and unmagnetized cases but that the ionosphericprofiles of heavier ions such as O2
+ and CO2+ are mostly
unaffected by the stellar wind conditions above 200 km.Garcia-Sage et al. (2017) explored enhancement of polarwind losses for a magnetized planet and showed that a 1 barEarth-like atmosphere could be lost within 365 million yearsat Proxima Cen b’s position, although the current calculatedloss rate of H2
+ and O2+ did not exceed Earth’s current re-
plenishment rate via outgassing and volatile delivery (Hol-land, 2002), so that maintenance of the atmosphere might bepossible. Garcia-Sage et al. (2017) concluded that the habit-ability of Proxima Cen b requires a different atmospherichistory to that of Earth, and indeed none of the above studiesconsidered lifetimes for atmospheres significantly moremassive than the current Earth’s.
Other processes that may inhibit atmospheric loss alsoneed to be considered, such as cooling to space from upper-atmosphere CO2 (Tian, 2009) or shielding via formation ofozone from high-O2 atmospheres. In all cases for atmo-spheric loss, the resultant atmosphere is dependent on anumber of factors including the initial atmospheric in-ventory, and atmospheric replenishment processes, such ascometary volatile delivery and volcanic outgassing, overthe planet’s lifetime. In the case of Earth, 80–95% of ourvolatiles outgassed within the first 50–500 million years(Turner, 1989), but an ocean of water may have remainedin the mantle (Albarede, 2009; Sleep et al., 2012), which isbeing more slowly outgassed. If a similar process works forterrestrial planets orbiting M dwarfs, then these planetswould be susceptible to significant loss of water and at-mosphere early on, but may, over billions of years, accu-mulate a surface ocean and atmosphere from volcanicoutgassing, after the M dwarf has settled into its morebenign main sequence phase.
However, if enough atmosphere is lost via interactionwith the star, then the entire atmosphere could potentiallybe removed by condensation on the cold nightside. This ismore likely if the planet is synchronously rotating, andatmospheric transport processes are weak or inefficient( Joshi et al., 1997; Wordsworth, 2015). However, Turbetet al. (2016) used 3-D climate models to show that, ifProxima Cen b retained an ocean, this form of atmosphericcollapse into nightside or polar ice is highly unlikely, evenif the planet is synchronously rotating. In the worst pos-sible case on a dry, synchronously rotating planet, 4 bar ofCO2 would be required to avoid atmospheric collapse andonly 0.1 bar of CO2 for the asynchronously rotating case.Significantly less CO2 (as low as a few hundred parts per
million) is required if a plausible background gas such asN2 were present (Turbet et al., 2016).
If, however, the atmosphere survived and is currentlyEarth-like, protons released via repeated flaring eventswould destroy any incipient ozone layer, resulting in highsurface UV fluxes during flare activity (Segura et al., 2010;M. Tilley, private communication). For even the strongestflares exhibited by Proxima Cen b, which are comparableto the great AD Leo flare (Hawley and Pettersen, 1991;Hawley et al., 2003), previous calculations suggest that UVdamage to life can be avoided on an ocean-bearing worldat water depths of 9 m or more, while still allowing pho-tosynthesis (Kiang et al., 2007). The resultant flux ofphotosynthetically active radiation would still be severalorders of magnitude above the lower limit for useful lightlevels set by red algae, but the productivity of such abiosphere would be significantly lower than on Earth, withan estimated 4% of Earth’s productivity for a star with ADLeo–type flares (Kiang et al., 2007).
Proxima Cen b’s close-in orbit also makes the planetmore vulnerable to gravitational tidal interaction with thestar ( Jackson et al., 2008), which falls off rapidly withsemimajor axis, as a-7.5. Over time, the star could havecircularized Proxima Cen b’s orbit, trapped it into syn-chronous rotation, reduced the semimajor axis, and set theobliquity to zero (Barnes et al., 2008, 2009; Heller et al.,2011). However, if Proxima Cen b’s orbit has even a smalleccentricity, possibly due to a companion planet or a recentperturbation due to a stellar encounter, then the gravita-tional interaction with the star can induce ‘‘tidal heating’’due to friction as the body of the planet is flexed due todifferential gravitational fields at different points in itsorbit (Barnes et al., 2009). Sufficiently high levels of tidalheating could result in surface heat fluxes on the planet thatcould evaporate oceans of water on the planetary surface(Barnes et al., 2013). Our initial simulations suggest thatby 3 billion years ago, for a starting eccentricity close to0.1, the orbit should have evolved to be currently close tocircular (unless it is being perturbed by another planet), inwhich case the planet is experiencing very little internalheating from tidal forces (Barnes et al., 2018). However,these forces would have been much more significant in thepast, exceeding that of the volcanically active Io for thefirst billion years of the planet’s existence (Barnes et al.,2018). However, these heat fluxes fall far short of thoserequired to trigger a runaway greenhouse (Barnes et al.,2013). Instead, the heat deposited into the mantle of theplanet may have reduced circulation in the planet’s interiorand shut down the generation of a protective magnetic field(Driscoll and Barnes, 2015), which could have left theatmosphere more vulnerable to erosion.
Additional considerations for factors that could affect thehabitability of Proxima Cen b include the fact that the orbitof Proxima Cen, in relation to a Cen A and B, is very poorlyconstrained (cf. Wertheimer and Laughlin, 2006; Matvienkoand Orlov, 2014). If this orbit takes Proxima Cen closer toits two companions, then the orbit of Proxima Cen b couldhave been significantly perturbed, resulting in large changesin eccentricity. The existing RV data allows for eccentricityvalues up to 0.35 for Proxima Cen b’s orbit (Anglada-Escude et al., 2016), which could be the result of the abovemechanism or an unseen companion planet (Barnes et al.,
136 MEADOWS ET AL.

2018). Tidally locked exoplanets with eccentric orbits havea much higher probability of being captured into orbitalresonance than synchronous rotation (e.g., Rodrıguez et al.,2012; Ribas et al., 2016), with eccentricities as low as 0.07making resonances extremely likely (Ribas et al., 2016;their Fig. 4). In our solar system, Mercury, which is tidallylocked with e = 0.21, is in a 3:2 spin-orbit resonance. Aneccentric orbit would have made Proxima Centauri b vul-nerable to climatic swings (Williams and Kasting, 1997;Williams and Pollard, 2002; Dressing et al., 2010), cata-strophic tidal heating (Barnes et al., 2013), and the shut-down of the magnetic field (Driscoll and Barnes, 2015),which could have made atmospheric escape more likely.This disruption of Proxima Cen b’s orbit could have oc-curred at any time in the past and is difficult to predict fromthe current position of the three stars. On the other hand, asdiscussed above, orbital instabilities caused by close passageto a Cen A and B may protect extreme water loss during itsstar’s pre-main sequence phase if these instabilities trans-ferred the planet into its current orbit from a more distantone after the pre-main sequence phase ended. Perturbationsfrom stellar encounters could also enhance habitability viaimpacts, which may generate atmospheric blowoff of a denseH2 envelope, or deliver volatiles to the planet after formationor after the pre-main sequence phase.
In summary, based on our current knowledge of Mdwarf–planet interactions, there are several plausible sce-narios for the environmental state of Proxima Cen b: anabiotic O2-rich atmosphere, a CO2-rich atmosphere, and ahabitable terrestrial environment. Note that early total lossof an atmosphere—without generation or retention of asecondary atmosphere from outgassing—may also be apossible outcome, but we do not consider it for our at-mospheric modeling activities. In the abiotic O2-rich sce-narios, Proxima Cen b formed at or close to its currentposition and suffered catastrophic water loss during thestar’s superluminous pre-main sequence phase. The re-sulting steam atmosphere was photolyzed, and H was lostto space. O2, and possibly remnant water, was left behind,so there could be two cases from this scenario: O2-richwithout water and O2-rich with water (Luger and Barnes,2015). Similarly, if massive water loss occurs, and O2 islost either via hydrodynamic escape or sequestration in theplanet’s crust or mantle, or via a magma ocean, then CO2
may be the dominant gas that persists in the atmosphere. Inthis case, the atmosphere may consist of remnant O2 andoutgassed CO2, CO2-rich and largely desiccated (Venus-like), or a CO2-dominated, highly desiccated planet (H < 1ppm)which produces a stable CO/CO2/O2 atmosphere (Gao et al.,2015). Finally, in the habitable terrestrial environment sce-nario, Proxima Cen b was a terrestrial body that migrated toits current orbit after the pre-main sequence phase throughinstability processes, or formed with a protective H2 layer ofno more than 1% of the solid mass of the object, eitherbecause a terrestrial planet formed in situ with that envelopeor because a more volatile and H2-rich planet migrated in-ward from beyond the snowline. That H2 envelope couldhave been sufficiently thick to protect the volatile-rich pla-net underneath during the superluminous pre-main sequencephase but not thick enough to remain and compromise theplanet’s habitability (Owen and Mohanty, 2016). For thesecases, the resultant planet could have had a strongly oxi-
dizing atmosphere, or one that was more reducing, de-pending on where in the planetary system it formed and howit evolved. Much of the analysis of these scenarios presentedhere is applicable not just to Proxima Cen b but to poten-tially habitable worlds orbiting other M dwarfs like thoserecently found in the TRAPPIST-1 (Gillon et al., 2017) andLHS 1140 (Dittmann et al., 2017) systems.
2.2. Impact of planetary characteristics and star-planetinteractions on climate
A planet in the habitable zone can be impacted by the hoststar’s incident spectrum, activity levels, and orbital and tidalinteractions. Each of these agents, when interacting with theplanet’s environment, can strongly impact the current en-vironmental state of the planet, including its atmosphericcomposition, climate, and potential habitability. For exam-ple, the planet’s current climate and potentially enhancedability to maintain surface liquid water are strongly im-pacted by the interaction of the spectral energy distribution(SED) of the M dwarf star with the planet’s atmospheric andsurface composition (Shields et al., 2013), any clouds or ha-zes (Arney et al., 2016, 2017), and the planet’s orbital pa-rameters and obliquity (Barnes et al., 2013; Armstrong et al.,2014). In particular, the UV spectrum of the star is criticallyimportant for understanding the planet’s photochemistry—and therefore the atmospheric composition and climate(Segura et al., 2005; Rugheimer et al., 2015). It is also thekey to interpretation of any spectra obtained from the planet.The stellar UV also affects whether or not a UV-absorbinghaze will form in a reducing atmosphere (Arney et al., 2017)or an ozone layer in an oxidizing atmosphere (Segura et al.,2005; Domagal-Goldman et al., 2014). The presence andstrength of these UV shields will affect the resultant surfaceUV flux, which could in turn strongly impact habitability.Sufficiently high UV flux could potentially sterilize the landsurfaces, although life may still be adequately shielded in anocean as previously mentioned (Kiang et al., 2007). Stellarflaring activity can also greatly increase stellar UV flux andeject protons, which collide with the planet’s atmosphere anddrive NOx chemistry in the stratosphere, potentially damagingor destroying an ozone layer (Segura et al., 2010; M. Tilley,private communication), though the extent to which O3 isdestroyed would be dependent on the activity level (Grenfellet al., 2012). Additionally, HOx chemistry driven by stellarcosmic rays may efficiently destroy methane and, in combina-tion with NOx chemistry, generate potentially detectable quan-tities of HNO3 (Tabataba-Vakili et al., 2016). Consequently,to assess the current environmental state of the planet, andto interpret any spectra obtained of this object, one of thefirst steps in planet characterization will be to observe andmonitor the UV characteristics and activity of the host star.
Due to the gravitational tidal interactions describedabove, a terrestrial planet in the habitable zone around an Mdwarf star should be tidally locked, and if it has a circularorbit, may be synchronously rotating, with one side of theplanet constantly facing the star. This was originally hy-pothesized to preclude planetary habitability, as the planet’satmosphere would eventually freeze out on the eternalnightside of the planet (Kasting et al., 1993); however,subsequent modeling showed that the presence of a plane-tary atmosphere of sufficient density would protect against
PROX CEN B: HABITABILITY AND OBSERVABILITY 137

atmospheric collapse onto the dark side ( Joshi et al., 1997;Goldblatt, 2016). Leconte et al. (2015) discussed howthermal tides in the planetary atmosphere may cause asyn-chronous rotation of tidally locked planets. However,Proxima Cen b is currently observationally constrained tohave an eccentricity <0.35 (Anglada-Escude et al., 2016),which does not yet discriminate between a circular orbitwith a likely synchronous rotational state and an eccentricorbit with a likely asynchronous rotational state. Whilemodels of Proxima Cen b’s interaction with its star suggestthat the planet is still more likely to be synchronously ro-tating under most assumptions for orbital position and at-mospheric mass, existence in an asynchronous 3:2 spin-orbitresonance (similar to Mercury’s) is also possible (Ribaset al., 2016; Turbet et al., 2016), and this possibility isincreased if Proxima Cen b has companions in its planetarysystem (Barnes et al., 2018).
2.3. Identifying planetary habitability
Given the diversity of plausible evolutionary scenariosdiscussed above, and the star-planet interactions that maysculpt the current environment of the planet, one of thebiggest questions posed for Proxima Cen b is, ‘‘How do wedetermine whether or not this planet is habitable?’’ Habit-ability can be assessed most straightforwardly by detectingliquid water on the planetary surface. This could be done byusing photometric measurements of the distant planet atvisible or near-infrared (NIR) wavelengths to search forsigns of enhanced reflectivity near crescent phase due to thepresence of ocean ‘‘glint’’ (Williams and Gaidos, 2008;Robinson et al., 2010, 2014). Glint is specular reflectance atglancing angles from a smooth surface (Cox and Munk,1954), which on a terrestrial planet is most likely to comefrom a liquid—since rock, snow, and snow-covered ice tendto have nonspecular scattering properties.
Robinson et al. (2010) used a sophisticated 3-D spectralmodel of Earth (Robinson et al., 2011), validated against theEPOXI mission (Livengood et al., 2011) and Earthshine(Palle et al., 2003) observations of the disk-averaged Earth,to show that Earth deviates strongly from Lambertian (i.e.,isotropic) scattering behavior at phases crescent-ward ofquadrature. While a similar deviation from Lambertian be-havior can occur due to forward scattering from clouds,Robinson et al. (2010) were able to show that an Earth-likeplanet with realistic (*50% coverage) forward-scatteringwater clouds and a specularly reflecting ocean is up to a factorof two brighter than an Earth-like planet with forward-scattering clouds and a Lambertian ocean near crescent phase.This increase in relative brightness due to ocean glint is mostapparent between phase angles of 90 and 130 degrees, and ismost readily observable at wavelengths between 0.8 and0.9 mm where Earth’s atmosphere is relatively transparent(Robinson et al., 2010, 2014). Consequently, glint fromEarth’s ocean is potentially detectable as a deviation in theobserved reflectivity of the planet near crescent phase, even inthe presence of forward-scattering clouds. A potential falsepositive for ocean glint may occur if the observer is prefer-entially sounding ice- and/or cloud-covered portions of theplanet near crescent phases (Cowan et al., 2015), althoughthis effect may be distinguishable with spectroscopic mea-surements. Glint may also polarize incident starlight, which
could potentially induce a signal in the planet’s polarimetriclight curve. Williams and Gaidos (2008) used idealizedmodels to show that cloud-free ocean planets with non-polarizing atmospheres may exhibit a strong (30–70%) po-larization signal over an orbit. However, Rayleigh scatteringand clouds are also a source of polarization, possibly over-whelming the signal due to a surface ocean (Zugger et al.,2010, 2011) and making it difficult to use polarization toidentify water under an atmosphere.
Note that glint is far less ambiguous for surface waterdetection than the presence of water vapor in the planetaryatmosphere, as a planet may maintain a steam atmospherewithout being habitable. ‘‘Anti-ocean’’ signatures may alsobe present in the form of highly soluble gases, for example,SO2, that would dissolve in an ocean and would not accu-mulate in the atmosphere unless there was no ocean (or theocean was already saturated with that gas). Conversely, falsenegatives for the detection of water can occur, especially intransmission observations, if the water is cold-trapped in thetroposphere of a habitable planet, resulting in an appropri-ately drier stratosphere. Water that is kept near the surface ismost valuable for habitability and less susceptible to lossprocesses. In this case, clouds and refraction in transmis-sion (Betremieux and Kaltenegger, 2013, 2014; Misra andMeadows, 2014; Misra et al., 2014b) limit our ability toprobe into the relatively water-rich troposphere, where wateris more likely to be detected. Drier stratospheres are lesslikely to affect direct imaging observations, however, exceptin the presence of high-altitude, planetwide clouds. Even inthe presence of broken cloud cover, or some planetwidehazes, direct imaging observations can still sample the loweratmosphere and surface to detect water vapor (Arney et al.,2016).
Another means to assess habitability is to constrain thesurface temperature and pressure to determine whether sur-face liquid water is feasible. This is best assessed withspectra of the planet in the visible and NIR and/or pho-tometry or spectra in the mid-infrared (MIR). While aRayleigh scattering slope from atmospheric molecules hasbeen proposed as a means of determining atmospheric pres-sure for a terrestrial planet (Arnold et al., 2002; Woolf et al.,2002; Benneke and Seager, 2012) this method—like allmethods for atmospheric pressure assessment—is not robustin the presence of cloud or haze cover, either complete orpartial. At best it will return the pressure at the top of theclouds in the former and an average of the cloud top alti-tudes and surface in the latter. This is graphically demon-strated in our solar system by Venus, which has a 93 barsurface pressure but exhibits extremely weak Rayleighscattering, because the line of sight into the atmosphere istruncated by sulfuric acid haze at an altitude of 70 km and apressure near 30 mbar. In direct imaging, which looks atplanetary reflectivity, attempts to measure Rayleigh scatter-ing are additionally vulnerable to the spectral properties of theunderlying aerosols and surfaces. On Mars, strong absorptionby surface iron oxide absorbs Rayleigh scattering in the blue.Similarly, for a CO2- and CH4-rich early-Earth-like atmo-sphere, the formation of a hydrocarbon haze results in strongabsorption in the UV and blue, strongly altering the Rayleighsignature (Arney et al., 2016, 2017).
A potentially more promising means for determining at-mospheric pressure comes from measurements of collisional
138 MEADOWS ET AL.

absorption from molecules such as N2 (Schwietermanet al., 2015b) and O2 (Tinetti et al., 2006; Palle et al.,2009; Misra et al., 2014a), which are both seen in Earth’sdisk-averaged spectrum. Unlike Rayleigh scattering, whichis degenerate in terms of characterizing the mix of gasesthat are producing the scattering, observations of colli-sional absorption can provide a direct measurement of theatmosphere’s bulk constituents. However, this method isalso subject to path length truncation due to clouds and sowill return a composite pressure depending on the availablepath lengths to clouds and the surface. In the case of O2,observations of the O2 molecule can be compared to thestrength of the absorption band produced by the O2-O2
collisional pair (also referred to as O4)—which is sensitiveto density squared—to quantify the partial pressure of ox-ygen in the atmosphere (Misra et al., 2014a). The pres-ence of strong O4 bands in the visible (0.35–0.65 mm) isdiagnostic of massive O2 atmospheres (Schwietermanet al., 2016).
In addition to searching for oceans and determining sur-face temperature and pressure, habitability could be assessedby undertaking a spectroscopic survey of greenhouse gasesand other planetary characteristics that affect climate. Inparticular, retrieving abundances for greenhouse gases suchas CO2, CH4, H2O, SO2, O3, and N2O; obtaining pressureestimates using observations of O4 and N4 (the N2-N2 col-lisional pair); and searching for and characterizing hazes andclouds will provide important constraints on planetary cli-mate. These observations could then be used as input tocoupled climate and photochemistry models (e.g., Seguraet al., 2005) to understand the composition of the atmo-sphere, and the surface temperature and pressure.
It is important to note that, for terrestrial planets with CO2
(distinct from Titan, whose atmosphere is extremely re-ducing), methane and organic hazes could also be a sign ofeither habitability or life (Arney et al., 2016). Methane in aplanet’s atmosphere can produce organic haze if the CH4/CO2 ratio exceeds 0.1, and these hazes dramatically impacttheir planet’s spectrum. Higher carbon dioxide levels makehaze formation more difficult, so larger fluxes of methane areneeded to produce haze in the atmospheres of planets withlarger CO2 inventories compared to very reducing atmo-spheres like Titan. Hazes in Earth-like atmospheres contain-ing CO2 can therefore be a sign of a high methane productionrate. Methane can be sourced from either biological or abi-otic processes, but even abiotic methane is a potential habit-ability marker, as its dominant source on an Earth-like planetis serpentinization—which are liquid water/rock reactions(Kelley et al., 2005). Serpentinization requires freshly ex-posed seafloor minerals to react, and while a limited areacould be obtained from cracking, new seafloor crust wouldlikely be needed for the maintenance of robust serpentiniza-tion on long timescales. Consequently, atmospheric methaneconcentrations requiring large surface fluxes on a terrestrialplanet may indicate both liquid water and plate tectonics, twohallmarks of habitability. More intriguingly, existing mea-surements and models suggest that the presence of an organichaze on an Earthlike exoplanet with >1% CO2 in the atmo-sphere may require more vigorous methane production ratesthan occur on Earth from abiotic processes alone (Kharechaet al., 2005; Etiope and Sherwood Lollar, 2013; Guzman-Marmolejo et al., 2013), so organic haze in an Earth-like
atmosphere could also be suggestive of life if the CO2
abundance can also be constrained (Arney et al., 2016).
2.4. Biosignature considerations for planetsorbiting M dwarfs
Exoplanet biosignatures are biological modifications of aplanet’s global environment that are potentially observableover interstellar distances. On Earth, biosignatures can beclassified into three major groups: atmospheric gases thatare produced by life, such as Earth’s abundant photosyn-thetically generated O2 (Hitchcock and Lovelock, 1967);surface reflectivity signatures like the enhanced ‘‘red edge’’reflectivity at wavelengths longward of 0.7 mm from vege-tation (Gates et al.,1965) or nonphotosynthetic pigmentsfrom other organisms (Schwieterman et al., 2015a); and time-dependent phenomena, such as seasonal changes in surfacecoverage or atmospheric gases (Meadows, 2008).
For planets orbiting M dwarfs, the UV spectrum andstellar activity of the star can work via photochemistry toeither enhance or destroy the detectability of potential at-mospheric biosignatures. Segura et al. (2005) showed that,for Earth-like surface fluxes of the biogenic gases CH4 andN2O, extremely large abundances of these gases can buildup in a terrestrial planet atmosphere. In particular, the life-time and abundance of atmospheric methane is increasedfrom 10–12 years and 1.6 ppm for an Earth-like atmosphereorbiting a Sun-like star to over 200 years and over 300 ppmfor a planet orbiting the M3.5V star AD Leo. This is due inlarge part to the slope of the M dwarf’s UV spectrum, whichhas smaller relative amounts of NUV radiation, and itssubsequent relative inefficiency at photolyzing ozone toproduce reactive O(1D) that generates the OH from watervapor that ultimately destroys CH4 (Segura et al., 2005). Ona related note, Segura et al. showed that for the same at-mospheric O2 abundance, ozone column density could belarger or smaller than Earth’s by roughly a factor of 2, againdepending on the UV spectrum of the star. However, thesecalculations were performed for quiescent versions of Mdwarf spectra. Segura et al. (2010) explored the effect on aplanetary atmosphere of large flares, looking at both UV andproton flux on the thickness of an Earth-like planet’s ozonelayer. For the single flare that they studied, they found thatthe UV flux had negligible effect on the thickness of theozone layer, dropping it by of order 1%. However, if theplanet intercepted the proton beam from the coronal massejection, and did not have a protective magnetic field, theeffect on the ozone was devastating, as proton-driven NOx
chemistry from this single flare resulted in a 94% depletionof the ozone layer over a 2-year period (Segura et al., 2010).Consequently, both the stellar spectrum and activity levelsneed to be well-characterized as an adjunct to interpretingpotential biosignatures from planets orbiting M dwarfs.
Other important considerations when interpreting bio-signatures of M dwarf planets are the likely detectabilityof the biosignature gas in question, as well as the likelihoodthat the planetary environment could produce the biosig-nature gas without life being present, and thereby exhibit afalse positive for the biosignature. Oxygen is a particularlygood gas for this discussion, as it has been well studied asa potential biosignature (see Meadows, 2017, for a com-prehensive review). Oxygen is produced by photosynthetic
PROX CEN B: HABITABILITY AND OBSERVABILITY 139

organisms on Earth and is particularly attractive as a bio-signature gas because it is present in high abundance, isevenly mixed throughout the atmosphere—and so can po-tentially be detected in the stratosphere by transmissionobservations—and has strong absorption bands at UV andNIR wavelengths where the first generation of exoplanettelescopes will observe. More exotic potential biosignatures,including organic sulfur compounds (e.g., Domagal-Goldman et al., 2011) are likely to be at lower abundances andbe more sensitive to photolysis, so that they are confinedcloser to the planetary surface. These molecules also tend toabsorb predominantly in the MIR, which may be challengingto access for terrestrial planets with upcoming telescopes.However, to offset its advantages as a biosignature, oxygen isnow known to have false-positive production mechanisms—abiotic processes that can also produce O2 in a planetaryenvironment—and the majority of those mechanisms cur-rently known are thought to be more likely to occur for planetsorbiting M dwarfs (Domagal-Goldman and Meadows, 2010;Domagal-Goldman et al., 2014; Tian et al., 2014; Gao et al.,2015, Harman et al., 2015; Luger and Barnes, 2015). For thesemechanisms, carbon dioxide and water vapor serve as keysources of abiotic oxygen, and the spectrum of the host starand the resultant photochemistry play a significant role,leaving telltale signs in the planetary atmosphere that can besought to discriminate between biological and abiotic sourcesfor oxygen (Meadows, 2017). In particular, two of the pos-sible atmospheres for Proxima Cen b discussed above—including the massive O2 atmospheres generated from waterloss (Luger and Barnes, 2015) and the CO2-rich, desiccatedatmospheres that may contain large, stable O2 fractions (Gaoet al., 2015)—are both potential false positives for biologi-cally produced oxygen. However, both may be discrimi-nated by searching for either O4 absorption or both CO andCO2 absorption in the planetary spectrum (Schwietermanet al., 2016). These studies show the importance of obtaining
contextual information about the planetary environment andprovide a guide to increasing our confidence in biosignaturedetection by searching for additional gases and planetarycharacteristics.
3. Models
We use a suite of planetary climate and photochemistrymodels to simulate the current environmental state for theevolutionary scenarios described in Sections 1 and 2. Wethen use a radiative transfer model to predict the potentiallyobservable photometric and spectral parameters that wouldhelp discriminate between these environmental states. Thesemodels and the stellar and surface albedo inputs are de-scribed in the sections below. Table 1 shows a summary ofall models used in this study.
3.1. SMART—direct imaging synthetic spectra
The SMART (Spectral Mapping Atmospheric RadiativeTransfer) code is a 1-D line-by-line, multistream, fully mul-tiple scattering radiative transfer model (described in detail inMeadows and Crisp, 1996, and Crisp, 1997) that computesaccurate synthetic planetary spectra. SMART combines amultilevel, multistream discrete ordinate algorithm (Stamneset al., 1988) with a new class of high-resolution spectral map-ping techniques to increase computational speed. SMART isused in this study to generate synthetic planetary spectra forboth direct imaging and, through the SMART-T modification,for transmission spectroscopy. It also serves as the radiativetransfer engine for phase curve generation and for the VPLClimate model. We have validated SMART against observa-tions of Solar System planets, including Mars, Earth, andVenus (Tinetti et al., 2005; Robinson et al., 2011; Arney et al.,2014). SMART requires a number of user inputs, which aredescribed in detail in Section 3.7, such as a pressure/altitude-temperature grid, gas mixing ratios, molecular absorption
Table 1. Models Used to Simulate Proxima Centauri b
Model name TypeModel subcomponents/
dependencies Use References
LBLABC Absorption coefficientsfor SMART
n/a Generate SMARTinputs from linelists
Meadows and Crisp, 1996
SMART 1-D radiative transfer LBLABC Reflected light spectra Meadows and Crisp, 1996;Crisp, 1997
VPL Climate Climate model LBLABC, SMARTradiative transfer core
Climate simulations This paper; Ty Robinsonand David Crisp,private communication
Atmos 1-D photochemical-climate model
Photochemical model,climate modelcomponents
Climate and/orphotochemicalsimulations
Arney et al., 2016
SMART-T 1-D radiative transfer–transits
LBLABC, SMARTradiative transfercore pairedwith ScaTransmodule
Transit spectra Robinson, 2017
SMART PhaseCurves
Phase curve model LBLABC, SMARTradiative transfer core
Phase curves This paper
Coronagraphnoise model
Instrument simulator n/a Add realistic noisefor simulatedobservationsto spectra
Robinson et al., 2016
140 MEADOWS ET AL.

coefficients, collision-induced absorption data, UV-visibleabsorption cross sections, a stellar spectrum, and wavelength-dependent surface albedo data. The absorption coefficientsfor SMART are generated with a separate program calledLBLABC (see Section 3.7.4, below) from input line lists (i.e.,HITRAN 2012, Rothman et al., 2013; HITEMP 2010, Roth-man et al., 2010; and Ames, Huang et al., 2014). SMART canalso incorporate the radiative impact of aerosols such as hazesand clouds, by specifying the altitude-dependent optical depthsas well as the particle asymmetry parameter and the extinction,scattering, and absorption efficiencies (Qext, Qscat, and Qabs).SMART can generate spectra at any arbitrary spectral resolu-tion, and its results are valid from the UV to the far-infrared.
3.2. SMART-T—transit transmission spectra
Although Proxima Cen b may not transit (Kipping et al.,2017), the simulations provided here for its plausible envi-ronments are potentially relevant to habitable zone planetsorbiting late-type M dwarfs that do transit, including the re-cently discovered TRAPPIST-1 system (Gillon et al., 2016,2017), where TRAPPIST-1e occupies a similar position in itshabitable zone to Proxima Centauri b. Consequently, wesimulate transmission as well as direct imaging observationsfor Proxima Centauri b. To generate the transit transmissionspectra, we use the SMART-T model, which updates ouroriginal refraction transmission model (Misra and Meadows,2014; Misra et al., 2014b) by pairing SMART with the full-physics transmission code ScaTrans (Robinson, 2017), whichincludes the effects of both refraction and transmission. Ournew version of SMART-T uses the normal-incidence opticaldepths of SMART to calculate transmission for a grid of limb-traversing atmospheric paths, which are then integrated overthe planetary disk to produce a transit spectrum. The modeltakes into account the effects of refraction by using the pathintegration method of van der Werf (2008). Starlight refractedout of the beam of an observer sets a limit on the tangentaltitudes at which the atmosphere can be probed (Sidis andSari, 2010; Garcıa Munoz et al., 2012; Misra and Meadows,2014; Misra et al., 2014b). SMART-T requires the same in-puts as the standard SMART code but additionally requiresthe radius of the host star, the offset of the planet center fromthe middle of the star (i.e., the impact parameter), and thealtitude-dependent refractivity of the atmosphere. For alltransmission spectra presented here, an impact parameter of0 is assumed, implying the planet is centered on the hoststellar disk. We did not use the multiple-scattering cap-abilities of SMART-T for the spectra presented here, as aninitial investigation into the geometry of the problem and thescattering properties of our included aerosols showed that amultiple-scattering calculation was unwarranted.
3.3. SMART phase curves
We use the SMART Phase Curve model (developed byT. Robinson and D. Crisp) to calculate the multiband, orbitalphase-variability of a planet in reflected and emitted light.This model uses n-point Gaussian quadrature to generate aphase-dependent, disk-integrated spectrum of the planet.Wavelength-dependent radiances at a grid of solar and ob-server zenith and azimuth angles at Gaussian quadrature arecomputed by SMART, where the zenith angles form theabscissa for a Gaussian integral computed over the surface
of a sphere. The corresponding weights for the integrationare determined based on the longitudes of the planetary diskthat are visible and illuminated as seen by the observer. Weapply this disk integration over a grid of observed planetaryphase angles to simulate high-resolution, phase-dependentspectra, which are convolved with JWST/MIRI broadbandphotometric filters to determine the detectability of theplanet’s phase variability against the bright stellar back-ground in the MIR.
Our focus is on the phase dependence of the planet dueto the vertically resolved atmospheric structure atop a re-flecting and emitting surface, and not on the spatially re-solved features accessible with a General Circulation Model(GCM). Therefore, the distinguishing observables from oneplausible planetary state to another are limited to bulk sur-face and atmospheric characteristics, such as deviationsfrom Lambertian scattering due to the presence of forward-scattering aerosols or the presence of ocean glint (Robinsonet al., 2010, 2014), modulations in the peak amplitude ofphase curves as a function of wavelength due to molecularfeatures (Selsis et al., 2011; Stevenson et al., 2014), andthermal phase curve amplitudes due to a day-night tem-perature contrast. We are not using a GCM in this study, andwe have not made self-consistent predictions for the day-night temperature contrast. To simulate phase curves with athermal emission contribution from the nightside of theplanet, we use our self-consistent globally averaged surfacetemperature, assuming no day-night temperature contrastand extremely efficient heat redistribution (e.g., Venus). Wealso simulate cases where we assume no thermal contributionfrom the nightside of the planet to simulate the maximum day-night temperature contrast, and severely inefficient heat re-distribution more appropriate for an airless body (Maurinet al., 2012). In this way, we assess the extreme end-membercases for the phase curve amplitude. We also simulate anintermediate case where the nightside surface temperatureand temperature-pressure profile is 20 K lower than the day-side to emphasize a plausible phase curve amplitude.
3.4. Instrument simulators and noise model
We use a general coronagraph instrument noise model tosimulate directly imaged reflectivity spectra for the atmo-spheric states considered in this work. We refer the readerto Robinson et al. (2016) for a thorough description of themodel. In brief, the coronagraph instrument noise modelcomputes wavelength-dependent photon count rates on thedetector due to the planet, zodiacal and exozodiacal light,dark current, read noise, speckles, and thermal emissionfrom the mirror. The model also considers the CCD quan-tum efficiency of assumed detectors, the dependence of darkcurrent on the NIR detector due to detector temperature, anda factor of O2 increase in the shot noise due to the spacecraftroll maneuver required for background subtraction (seeBrown, 2005). With the coronagraph noise model, we simu-late observations using three future telescope concepts: aspace-based 16 m LUVOIR, a space-based 6.5 m HabEx, anda ground-based 30 m telescope assumed to be located in theAtacama Desert, Chile.
To model ground-based observations, we modified thecoronagraph noise model to account for transmission throughand downwelling emission from Earth’s atmosphere. The
PROX CEN B: HABITABILITY AND OBSERVABILITY 141

wavelength-dependent transmissivity of the Earth atmo-sphere is calculated with the SMART model (see Fig. 1) and isused to model the effect of telluric absorption such that in-cident exoplanetary photons are attenuated at high-opacitywavelengths. The sky brightness noise term makes use of theESO SkyCalc Sky Model Calculator5, which is based on theCerro Paranal Advanced Sky Model (Noll et al., 2012). Skybrightness includes contributions from molecular emissionfrom the lower atmosphere, emission lines from the upperatmosphere, airglow, and scattered starlight, but neglectsscattered moonlight, which is dependent on time of obser-vation, and zodiacal light, which is already included in thenominal coronagraph model (Robinson et al., 2016). Thedownwelling thermal emission from the sky begins to dom-inate at wavelengths beyond 2.5 microns. For a 30 m tele-scope, the continuum sky brightness is only *2% of theplanetary brightness in the PSF core (Hanuschik, 2003).We approximate a sub-optimal Strehl ratio by lowering theplanetary flux inside the PSF core by an additional 50% toaccount for the effects of atmospheric turbulence. We assumea cold planetary surface temperature (269 K) and an observ-ing zenith angle of 30�, which corresponds to the altitudeof Proxima Centauri crossing the meridian at La Silla Ob-servatory, Chile. The telescope, instrument, and astrophysicalparameters used to simulate coronagraph observations areidentical to those given in Robinson et al. (2016; astrophys-ical in their Table 2, telescope and instrument in theirTable 3), except for telescope diameter, detector temperature,raw contrast, and telescope plus instrument throughput, whichare presented here in Table 2.
3.5. VPL Climate model
Our new 1-D radiative-convective equilibrium (RCE)climate model (Ty Robinson and David Crisp, privatecommunication) incorporates our physically comprehensive,validated radiative transfer model, SMART, which is coupled
with a variety of convection and time-stepping methods todetermine the equilibrium pressure-temperature structure ofan atmosphere. Since our radiative fluxes are computed byusing SMART’s multistream solver, we avoid inaccuraciesthat can impact models that use d 2-stream approximations(Kitzmann et al., 2013). Note that VPL Climate, at pres-ent, does not include integration with atmospheric chemistrytools. Therefore, we present results from this model only forcases for which our other 1-D climate model, Atmos (seeSection 3.6), lacks key capabilities, such as for high-pressureatmospheres.
Net radiative fluxes in VPL Climate are computed byusing a first-order linearized flux-adding approach (Robinsonand Crisp, private communication). Full line-by-line, mul-tistream, multiscattering solar and thermal radiative fluxesare computed by SMART, as well as a set of Jacobians thatdescribe the response of the radiative fluxes to changes inkey elements in the atmospheric state vector (e.g., layerand surface temperatures). These Jacobians consist of de-rivatives of the layer-by-layer, wavelength-dependent stellarand thermal source terms, as well as derivatives of layerreflectivity, transmissivity, and absorptivity. This informa-tion is used in a linear flux-adding approach to determine theupwelling and downwelling solar and thermal flux profilesat each timestep. If during timestepping the evolved atmo-spheric state (e.g., the temperature in any given layer) isoutside the linear range of the Jacobians, additional
FIG. 1. Earth’s atmospheric transmittance calculated by SMART and used for simulations of ground-based observations.
Table 2. Parameters Used for the Coronagraph
Noise Model
Parameter description HabEx LUVOIR 30 m
Telescope diameter 6.5 m 16 m 30 mMirror/System temperature 270 K 270 K 270 KContrast 10-10 10-10 10-10
Telescope + InstrumentThroughput
20% 20% 20%
See Robinson et al. (2016) for a complete list of baselinetelescope and astrophysical parameters.
5http://www.eso.org/observing/etc/bin/gen/form?INS.MODE=swspectr+INS.NAME=SKYCALC
142 MEADOWS ET AL.

iterations of computing Jacobians can be required. Thetolerance for the perturbation for computing Jacobians is setby the user, which can be large when starting from an iso-thermal atmosphere (e.g., 50%) or small when near con-vergence (e.g., <1%). Since VPL Climate uses SMART tocompute fluxes at extremely high spectral resolution, spec-tral quantities in our flux-adding approach are degraded to alower resolution (typically 10 cm-1) by convolution with aslit function, which still provides thousands of wavelengthintervals.
Our VPL Climate model can implement convection in anumber of ways; here, we use mixing length theory (e.g.,Gierasch and Goody, 1968), which uses fundamentalphysical properties for each layer of the atmosphere andrequires few assumptions. The required assumptions includesurface wind speed U0 and mixing length zmix(z), which wecalculate for each layer using the asymptotic mixing lengthcalculation from Blackadar (1962):
k¼ fzRT(z)
g(z)
zmix(z)¼ jz
1þ jzk
where R is the specific gas constant (ideal gas constant/molecular weight of gas), z is altitude, T(z) is temperature,g(z) is the acceleration due to gravity, j is von Karman’sconstant, and fz is the mixing length proportionality con-stant, which must be specified. Convective heat transport iscomputed at every layer from eddy diffusion rates in con-vectively unstable layers. Convective stability is determinedby using the Schwarzchild criterion:
� dT
dz<
g(z)
cP(T(z))¼Gad
where g(z) is the acceleration of gravity, cP(T(z)) is thespecific heat of the atmospheric layer, and Gad is the dryadiabatic lapse rate. For moist cases (comparing to the re-sults of Turbet et al., 2016), we use the moist adiabatic lapserate for the troposphere, to simulate the effect of conden-sation and rainfall:
� dT
dz< g(z)
1þ Hvr(z)RT(z)
cP(T(z))þ H2v r(z)
Rw T(z)½ �2¼Gw
where Hv is the latent heat of vaporization of water(2.5 · 106 J K-1), r(z) is the layer-dependent mixing ratio of
water, and Rw is the specific gas constant of water vapor(461.5 J kg-1 K-1). The specific heat for common moleculesis used from laboratory data6 (water vapor, CO2, N2O, CO,CH4, O2, N2, NO, SO2, NO2, NH3, HCl, N2, C2H2, C2H6,H2S, C2H4, CH3OH, and H2). Specific heat for molecules forwhich data is not available is computed by using an idealgas law approximation and assuming cP is temperature-independent:
cP¼Rf
2þ 1
� �
where f is the number of degrees of freedom (i.e., 3 for atoms,5 for diatomic molecules, and 6 for polyatomic molecules).The eddy diffusivity from Gierasch and Goody is
K¼ 1:32 zmix(z)½ �2ffiffiffiffiffiffiffiffiffiffiffiffiffiffiffiffiffiffiffiffiffi� S(z)g(z)
T(z)
r
where S(z) is the difference from Schwarzchild’s criterion.Convective heat flux for each layer is calculated as
Fsh(z)¼ �P(z)g(z)K(z)S(z)
G(z)RT(z)
Condensation and evaporation are taken into ac-count by adjusting layer mixing ratios of condensableconstituents and calculating the heating rate. We as-sume sufficient condensation nuclei for rapid and efficientcondensation in supersaturated layers. Layers are as-sumed to be supersaturated when the partial pressure of acondensable is above its saturation vapor pressure. Therequired inputs for this optional feature are the saturationvapor temperature, pressure, and corresponding enthalpyof formation.
The timescales at which we resolve our mixing lengthmodel are small, consistent with the time it takes for an airparcel to rise one layer. Since radiative flux calculationsare more computationally expensive, we employ a timestepsplitting approach where many convective timesteps are re-solved within each radiative timestep. Here, we use adaptivemethods to calculate the maximum radiative and convectivetimesteps to more rapidly iterate the temperature-pressureprofile to equilibrium. The limit for the radiative timestepis simply an allowed change in temperature for any given
Table 3. Data Sources for Proxima Centauri Spectrum
Wavelength Range [A] Platform/Instrument Observation ID/References
1200–1215,1216–1691 HST/STISa o5eo01010[20,30], o5eo02010[20,40]1215–1216 HST/STIS Ly a reconstruction MUSCLESb
1691–4569 HST/STIS MUSCLESb
4569–8499 HST/FOD/RDa Y2WY0705T, Y2WY0305Tk > 8499 PHOENIX 2.0 Model Husser et al. (2013)
aData obtained from MAST (https://archive.stsci.edu/).bData obtained from MUSCLES Treasury Survey (http://cos.colorado.edu/*kevinf/muscles.html).
6http://www.engineeringtoolbox.com, http://www.kayelaby.npl.co.uk/chemistry/3_10/3_10_3.html
PROX CEN B: HABITABILITY AND OBSERVABILITY 143

layer per timestep (e.g., 0.1 K), while mixing length theoryprovides for a maximum stable convective timestep in asingle layer:
dtc¼1
2
dz2
K
We take the smallest of these from all layers as the max-imum convective timestep in the convective region.
The model atmosphere constructed for VPL Climate sim-ulations generally consists of 64 plane-parallel layers in hy-drostatic equilibrium, spanning from the surface pressureto 10-7 bar. Half the layers starting at the surface are spacedlinearly and comprise 90% of the atmospheric pressure.Coarser, log-spaced layers span the upper atmosphere. Fluxesare computed for the entire stellar spectral energy distri-bution, divided into *8600 intervals, and thermal flux fromthe planet is computed for the wavelength range*1–200 mm,divided into *1000 intervals, all spaced at 10 cm-1. Gasabsorption is computed in all intervals for which cross sec-tions, collision-induced absorption, or line data are availablefrom HITRAN.
Validations of VPL Climate for Earth, Mars, and Venushave been conducted by Robinson and Crisp (privatecommunication). In particular, our capability to produceVenus-like high-CO2 atmospheres is validated by the ex-cellent match to the Venus International Reference At-mosphere by Robinson and Crisp (private communication),with a surface temperature of 732 K, compared to Venus’observed global average surface temperature of 733 K.These validations provide confidence that this model canbe applied to a variety of planetary climates, includingthose we discuss for Proxima b. As a further validation, inSection 4.1 we also provide a cross comparison betweenthe VPL Climate model and the LMDz model used byTurbet et al. (2016) for a subset of similar Proxima Cen bcalculations.
3.6. Atmos: a coupled climate-photochemical model
We use a 1-D photochemical-climate model, Atmos, tosimulate photochemistry and climate of terrestrial planetenvironments. Atmos generates atmospheres that are bothchemically and climatically self-consistent with the at-mospheric composition, temperature profile, and incidentstellar spectrum. To use Atmos, the photochemical model(which can include particle microphysics) is run first togenerate an initial atmospheric state based on user-specified boundary conditions (i.e., gas mixing ratios orfluxes and deposition velocities, the stellar spectrum, thetotal atmospheric pressure, the initial temperature-pressureprofile). The model is described in detail in Arney et al.(2016), and it is publicly available at https://github.com/VirtualPlanetaryLaboratory/atmos. Templates for atmo-spheres modeled in this paper (including their completereaction rate lists and species lists) can be found in thisrepository. The modern Earth photochemical template(which we also use as the basis for our high-O2 simulationsand template, although with different atmospheric boundaryconditions) has 233 chemical reactions and includes 50chemical species, 9 of which are short-lived (meaning at-mospheric transport between layers is not considered). Our
Archean Earth template includes 392 chemical reactions and76 chemical species, 11 of which are short-lived. In bothbase templates, N2 and CO2 are assumed to have isoprofiles.Both templates include chemistry for sulfur aerosol forma-tion, and the Archean template includes hydrocarbon hazeformation chemistry.
Once the photochemical model reaches a converged state,the photochemical model feeds its outputs into the Atmosclimate model. These outputs include the altitude-dependentabundances of H2O photochemically produced in, or trans-ported to, the stratosphere (tropospheric H2O is calculatedby the climate model), CO2, O3, CH4, O2, N2, and C2H6.The climate model uses the photochemical model’s finalstate as its initial condition, and the models iterate in thismanner until global convergence is reached. These couplingand convergence criteria are described in more detail in thework of Arney et al. (2016).
The photochemical portion of Atmos is based on the 1-Dphotochemical code originally developed by Kasting et al.(1979). The version we use here has been significantlymodernized as described in the work of Zahnle et al. (2006)and can simulate a wide range of planetary redox statesranging from extremely anoxic (pO2 = 10-16) to 100 bar ofO2 (Schwieterman et al., 2016). An organic haze formationscheme is in place for reducing, methane-rich atmospheresas described in the works of Pavlov et al. (2001), Zerkleet al. (2012), and Arney et al. (2016). For the simulationspresented here, the model atmosphere is divided into 200plane-parallel layers up to 100 km in altitude with a layerspacing of 0.5 km. Hydrostatic equilibrium is assumed. Avertical transport scheme includes molecular and eddy dif-fusion. Boundary conditions can be set for each species atthe top and bottom of the atmosphere, including gaseousmixing ratios and/or fluxes in or out of the atmosphere.Radiative transfer in the photochemical model is done via ad 2-stream method (Toon et al., 1989). The primary equa-tions solved by the model are the continuity and fluxequations, which are, in order,
qni
qt¼Pi� lini�
qFi
qz
and
Fi¼ �Knqfi
qz�Dini
1
ni
qni
qzþ 1
Hi
þ 1þ aTi
T
qT
qz
� �
where z is altitude (cm), t is model time (s), ni is the numberdensity (cm-3) of species i, Pi is chemical production rate (inmolecules cm-3 s-1), li is the chemical loss frequency (s-1),Fi is the flux of species i (cm2 s-1), fi is the mixing ratio ofthe species i (ni/n), K is the eddy diffusion coefficient (cm2
s-1), n is the total density, Di is the diffusion coefficientbetween the background atmospheres and species i, and aTi
is the thermal diffusion coefficient between species i and thebackground atmosphere. Hi is the scale height of species i(note H = kT/mig). These equations are integrated by a var-iable timestep reverse Euler method appropriate for stiffsystems. This method relaxes to the steady state solutionwhen timesteps are large.
The climate portion of Atmos is based on the 1-D climatemodel originally developed by Kasting and Pollack (1983),
144 MEADOWS ET AL.

Kasting et al. (1984a, 1984b), and Kasting and Ackerman(1986), but the version we use here has been significantlymodernized and was recently used to simulate habitablezones around different stellar spectral types (Kopparapuet al., 2013). The model uses correlated-k coefficients tocompute absorption by the spectrally active gases in themodel, which include O2, O3, CO2, H2O, CH4, and C2H6.The effects of pressure broadening (e.g., by N2) are includedin the model. The KSPECTRUM7 program was originallyused to calculate the correlated-k coefficients using theHITRAN 2008 line lists (Rothman et al., 2009) and updatedin the work of Kopparapu et al. (2013) with the HITEMP2010 line lists (Rothman et al., 2010). As in the photo-chemical model, this climate model uses a d 2-streammultiple scattering algorithm (Toon et al., 1989). Theshortwave (absorbed stellar radiation) wavelength grid spansfrom l = 0.2 to 4.5 mm in 38 spectral intervals; to computeoutgoing longwave IR radiation, there is a separate set ofcorrelated-k coefficients in 55 spectral intervals for each gasincluded in our scheme for wavenumbers 0–15,000 cm-1
(l > 0.67 mm). The density structure of the atmosphere iscalculated assuming hydrostatic equilibrium. The tropo-spheric temperature profile is calculated by following a wetadiabatic lapse rate to the altitude at which the stratospherictemperature is reached (Kasting, 1988), except in desiccatedcases, for which a dry adiabat is assumed. The water vapordistribution with altitude is determined by a Manabe andWetherald (1967) profile with a surface relative humidity of80% (Kasting and Ackerman, 1986). Gases in the upper at-mosphere can have a heating or cooling effect on the tem-perature profile depending on the relative abundance of gasesin the upper atmosphere and the extent of shortwave heating.
Note that we have been unable to run this climate modelto a converged state using the same top-of-atmosphere pres-sure that the photochemical model has. The photochemicalmodel grid extends to 100 km in altitude, but for 1 bar atmo-spheres, we are typically unable to run this climate model withpressures above 80 km in altitude at the top of the pressure griddue to model instabilities. Therefore, when this climate modelpasses its temperature and water profiles to the photochemicalmodel, they are fixed at their values at the top of the climategrid, and they become isoprofiles above the top of this grid.Previous tests (Arney et al., 2016) suggest that this treatmentdoes not strongly impact the resultant photochemistry.
Organic haze particles, which are relevant to some of oursimulations, form initially in the model with radii of 0.001mm.In each layer, the particles are treated as monomodal dis-tributions with the particle size determined by comparingthe coagulation lifetime to the particle removal lifetimefrom the layer by sedimentation and diffusion processes.Particle growth in a layer occurs when the particle growthtimescale is shorter than the timescale for particle removal.
Our model’s organic haze particles are treated as fractal(rather than spherical) in shape in both the photochemicaland climate portions of the Atmos model (Arney et al.,2016). Fractal particles are agglomerates of spherical par-ticles, and studies of organic hazes in the laboratory (e.g.,
Trainer et al., 2006) and from observations of Titan (e.g.,Rannou et al., 1997) suggest that fractal particles are morerealistic for organic hazes compared to spherical particles.In particular, we treat our fractal particles as agglomeratesof 0.05 mm spherical ‘‘monomers.’’ This size of monomerwas chosen because it is similar to the size of the monomersof Titan’s haze particles (Rannou et al., 1997; Tomaskoet al., 2008), and it was the size used in the first study tosimulate fractal hazes in an Earth-like atmosphere (Wolfand Toon, 2010), which our haze input files are based on.Haze scattering and absorption properties are calculated withMie scattering for our sub-monomer particles (r < 0.05mm),and the fractal mean-field approximation (Botet et al., 1997)for fractal particles (r > 0.05 mm). Our fractal haze scheme isbased on that of Wolf and Toon (2010), and the fractal di-mension of our particles varies from 1.5 to 2.4, with largerfractal particles having a larger fractal dimension to accountfor folding as the particles coagulate. Note that a fractal di-mension of 1 describes a linear chain of monomers, and afractal dimension of 3 describes a perfectly spherical particle.Titan’s haze particles have a fractal dimension of about 2(Rannou et al., 1997). The model includes a grid of opticalproperty files for 51 particle sizes, and particle properties withradii in between grid sizes are defined by interpolating be-tween the nearest grid size properties. A detailed descriptionof our model’s haze formation scheme can be found in thework of Arney et al. (2016).
3.7. Model inputs
To simulate planetary environments and observable prop-erties, our models require information on the planetary andstellar characteristics, including stellar parameters and spec-trum, planetary physical and orbital parameters, as well asenvironmental information such as the surface albedo, aerosoland atmospheric molecular absorption properties.
3.7.1. Planetary and stellar parameters. We use thebest-fit minimum mass of 1.3 M4 from the work of Anglada-Escude et al. (2016) and adopt the silicate planet scaling lawfrom the work of Sotin et al. (2007) to obtain a planetaryradius of 1.074 R4 (6850 km). Note that this assumes an edge-on, or nearly edge-on, inclination for the system, which iscurrently unknown. We adopt the best-fit semimajor axis forProxima Centauri b of 0.0485 AU. We also assume the stellarradius is 0.141 R1 (Boyajian et al., 2012). While the samestellar fluxes are used across our suite of models, the solarzenith angles (SZAs) used in each model were selected to bestrepresent globally averaged behavior resulting from each.The standard SZAs used for Atmos modeling are SZA = 50� inthe photochemical model (e.g., Kharecha et al., 2005; Zahnleet al., 2006, Segura et al., 2007) and SZA = 60� in the climatemodel (e.g., Kopparapu et al., 2013; Arney et al., 2017), andwe use these values in our coupled approach here.
3.7.2. The stellar energy distribution of Proxima Centauri.To self-consistently model the photochemistry, climate, andthe expected reflectance and transmission spectra fromProxima Centauri b, an EUV to MIR input spectrum is re-quired. Since Proxima Centauri is the nearest star to our Sun,many spectra have been recorded over the years, though nosingle source provided a calibrated, normalized spectrum
7Eymet, V., Coustet, C., and Piaud, B. (2016) Kspectrum: Anopen-source code for high-resolution molecular absorption spectraproduction. Journal of Physics: Conference Series 676. doi:10.1088/1742-6596/676/1/012005.
PROX CEN B: HABITABILITY AND OBSERVABILITY 145

for all necessary wavelengths at the time of this work. To fa-cilitate our simulations, we compiled a self-consistent, pan-chromatic stellar spectrum representative of ProximaCentauri (Fig. 2) combining publicly available data down-loaded from the Mikulski Archive for Space Telescopes(MAST)8 and MUSCLES9, with PHOENIX spectral libraryv2.0 models10 at wavelengths where calibrated observationsare not yet publicly available (Husser et al., 2013).
For UV wavelengths, we combined calibrated HSTSpace Telescope Imaging Spectrograph (STIS) observationsand additional observations processed and compiled bythe MUSCLES Treasury Survey. The STIS contribution(l = 1200–1691 A) was calculated as the median point at eachwavelength of six available calibrated observations (HSTProposal ID: 8040). We used a reconstructed Lyman-a lineand calibrated observations for l = 1691–4569 A, which wereprocessed and compiled by the MUSCLES Treasury Surveyand available on MAST, including details on their calibrationmethods (v2.1, see also France et al., 2016, and Youngbloodet al., 2016). For the visible spectrum (l = 4569–8499 A), weused observations from the HST Faint Object Spectrograph(FOD/RD) (HST Proposal ID: 6059). The IR spectrum (l >8499 A) was computed by a linear interpolation of PHOENIXspectral library v2.0 models (Husser et al., 2013) with Teff ={3000 K, 3100 K} and [Fe/H] = {0.0, 0.5}. The PHOENIXspectrum terminates at 5.5 mm; to extend the spectrum deeperinto the MIR for climate modeling and thermal phase curve
analysis, we fit a blackbody from the tail of the PHOENIXspectrum to 30mm. There is little stellar atmospheric ab-sorption in this range and it is well-fit with a blackbody(Roellig et al., 2004; Mainzer et al., 2007). The combinedspectrum was normalized to match Proxima Centauri’s bo-lometric luminosity of L/L1 = 0.00155 (Boyajian et al.,2012). Table 3 provides a summary of the sources for ourcombined spectrum. An important limitation to note for thisspectrum is that it is a static representation of the star in itsquiescent state and does not account for flare activity (i.e.,Davenport, 2016). We have made our compiled spectrumpublicly available in the Virtual Planetary Laboratory Spec-tral Database11.
3.7.3. Input line lists. Our models use a variety of sourcesto compute gas absorption from line lists, collision-inducedabsorption coefficients, and UV-visible cross sections. Theline lists are primarily from HITRAN 2012 (Rothman et al.,2013) for all species except for high-temperature applicationsfor CO2 and H2O, for which we use Ames (Huang et al., 2014)and HITEMP 2010 (Rothman et al., 2010), respectively.Collision-induced absorption is used for CO2-CO2, O2-O2,and N2-N2. The CO2-CO2 absorption data, which are includedin high-CO2 models and cover a range of temperatures upto 700 K, are sourced from Moore (1971), Kasting et al.(1984a), Gruszka and Borysow (1997), Baranov et al. (2004),Wordsworth et al. (2010), and Lee et al. (2016). N2-N2
collision-induced absorption coefficients are calculated based
FIG. 2. The spectrum of ProximaCentauri (at the distance of planet b)compared to the solar spectrum. ProximaCentauri b receives about 0.66 times theinsolation Earth receives at 1 AU fromthe Sun.
8https://archive.stsci.edu9http://cos.colorado.edu/*kevinf/muscles.html10http://phoenix.astro.physik.uni-goettingen.de
11https://depts.washington.edu/naivpl/content/spectral-databases-and-tools
146 MEADOWS ET AL.

on the empirical model from Lafferty et al. (1996) as de-scribed in Schwieterman et al. (2015b). The O2-O2 absorptioncoefficients are taken from C. Hermans12 (Hermans et al.,1999) for the 0.333–0.666 mm range and from Greenblattet al. (1990) and Mate et al. (1999) for the O2-O2 absorption at1.06 mm and 1.27 mm, respectively. UV-visible cross sectiondata is sourced from primary references available from theMPI-Mainz UV/VIS Spectral Atlas of Gaseous Molecules ofAtmospheric Interest13.
3.7.4. LBLABC. A companion to SMART, the Line-By-Line Absorption Coefficients (LBLABC) code gen-erates pressure- and temperature-dependent, line-by-lineabsorption coefficients using input line lists as describedabove (e.g., HITRAN) for given gas mixing ratio profiles(Meadows and Crisp, 1996). LBLABC fully resolves thenarrow line cores and wings as far as 1000 cm-1 from theline center and is designed and validated for a wide rangeof pressures (10-5 to 100 bar) and temperatures (130–750 K). Unless otherwise specified, a maximum line profilewidth of 1000 cm-1 is used.
3.7.5. Surface spectral albedo inputs. For Lambertianscattering planetary surfaces, we chose surface spectral al-bedos to be consistent with the likely surface conditions forthe type of atmosphere modeled: basalt, desert, ice, seawa-ter, martian global average, or a composite surface albedospectrum. The pairing of surface and atmosphere for ourexperimental scenarios is given in Table 7 in Section 4.2.
For modern Earth-like cases, a weighted composite spec-trum was used that consists of 65.6% seawater, 13.6%grassland/brush, 4% conifer forest, 5.5% soil/desert (kao-linite), and 11.3% snow/ice, based on a diurnally averagedequatorial Earth view during spring equinox (composite 1;Robinson et al., 2011). For early Earth-like cases, we used asimilar composite spectrum with land vegetation removed:65.6% seawater, 23.1% soil/desert, and 11.3% snow/ice(composite 2). The globally averaged Mars spectrum wascompiled by Crisp (1990), who used available observationsand laboratory measurements of Mars analog surface ma-terials. The forest spectrum was taken from the ASTERspectral library (Baldridge et al., 2009), while all othersurface spectra were taken from the USGS spectral library(Clark et al., 2007). In the subset of cases that includedglint, we used the Cox and Munk (1954) glint model asdescribed by Robinson et al. (2010, 2011). Figure 3 showseach of the spectral albedo inputs used over the wavelengthrange 0.2–2.5 mm.
3.7.6. Aerosol inputs. Aerosols such as hazes andclouds are incorporated into SMART by providing inputcontaining the altitude-dependent opacities as well as thephase function or particle asymmetry parameter (g) and theextinction, scattering, and absorption efficiencies (Qext,Qscat, and Qabs). For spherical particles, a full Mie phasefunction is used; otherwise we use a Henyey-Greensteinphase function (Henyey and Greenstein, 1941). We simulateaerosols in several of our planetary atmospheres: these in-clude organic hazes, sulfuric acid clouds and haze, andwater vapor clouds. Table 4 summarizes the aerosol typesused in simulated atmospheres.
FIG. 3. Input spectral surface albedos for modeled planetary scenarios. Composite 1 is a weighted average of 65.6%seawater, 13.6% grassland/brush, 4% conifer forest, 5.5% soil/desert (kaolinite), and 11.3% snow/ice. Composite 2 is 65.6%seawater, 23.1% soil/desert, and 11.3% snow/ice. All surface spectral albedos are sourced from the USGS spectral library(Clark et al., 2007), except for the conifer forest, which is from the ASTER spectral library (Baldridge et al., 2009).
12http://spectrolab.aeronomie.be/o2.htm13http://satellite.mpic.de/spectral_atlas
PROX CEN B: HABITABILITY AND OBSERVABILITY 147

Where we simulate organic hazes, particles of radii>0.05 mm are treated as fractal aggregates of 0.05 mmmonomers using the fractal mean-field approximation (Botetet al., 1997), and we use the hydrocarbon refractive indicesmeasured by Khare et al. (1984). The particle sizes, numberdensities, and vertical distributions for organic hazes used asinputs to the SMART model are derived from our Atmossimulations. Atmos calculates a monomodal size distributionof particles in each layer. The particle size is determined bycomparing the particle coagulation lifetime to the timescalefor removal from the layer by sedimentation and diffusionprocesses. Growth occurs when the timescale for coagula-tion is shorter than the timescale for particle removal. Todecrease model run-time for SMART, we bin the manydozens of particle sizes generated by Atmos into 19 particlesize bins. Spherical mode particles have radii of 0.001,0.005, 0.01, and 0.05 mm. Fractal modes particles have ra-dii of 0.06–2mm: this includes four modes between 0.06and 0.1 mm, 10 equally spaced modes between 0.1 and 1 mm,and 2 mm.
We also simulate sulfuric acid clouds and hazes in ourVenus-like spectral models. Our nominal venusian cloudprofiles and particle size populations are based on an em-pirical Venus cloud model from Crisp (1986). Sulfuric acidrefractive indices are derived from Palmer and Williams(1975). The sulfuric acid cloud particle populations aremodeled with log-normal size distributions, and the opticalefficiencies are calculated by using the code ‘‘Miescat’’adapted from the code by Wiscombe (1980). Table 5 showsthe properties of the Venus cloud particle populations usedhere. Four particle size populations (called ‘‘Modes’’ inTable 5) are assumed.
Water vapor (stratocumulus) clouds are modeled by usingrefractive indices from Hale and Querry (1973). Stratocu-mulus clouds are modeled with a two-parameter gammadistribution with a = 5.3, b = 1.1, and a mean particle radiusof 4.07 mm. Cirrus cloud properties are modeled by usingdata from B. Baum’s Cirrus Optical Property Library (Baum
et al., 2005)14. The optical properties of the cirrus clouds orig-inate from a 45-bin size distribution of three types of ice particleshapes including a weighting of 50% solid columns, 35% plates,and 15% 3-D bullet rosettes. The distribution of cloud particlesizes ranges from 2 to 9500mm, but the cross-section weightedeffective diameter of the distribution used is 100mm. Patchyclouds on a disk-integrated spectrum are included in the 1-DSMART model by using a weighted average of 50% clear-sky,25% cirrus cloud, and 25% stratocumulus cloud.
4. Results
To explore possible current environmental states forProxima Cen b, we present self-consistent atmospheres withconstituent vertical mixing ratios and temperature-pressureprofiles for the planetary states discussed in Section 2. Mostof the simulations presented here are photochemically andclimatically self-consistent unless otherwise noted. Follow-ing generation of these atmospheres, we simulate phasecurves and direct imaging and transmission spectra for thesecases. We then outline observational considerations anddiscuss detectability of spectral features that may be able todiscriminate evolutionary histories, current habitability, andbiosignatures.
4.1. Comparison with existing 3-D GCM simulations
Our 1-D climate models are computationally efficientand radiatively rigorous but can only approximate the 3-Dfeedbacks and heat transport processes that can be modeledin detail with 3-D GCMs. Additionally, although we havevalidated our models on planets in our solar system, thelikely evolution of Proxima Centauri b may result in currentconditions that differ from those of Earth and Venus. Toprovide further validation for our model, we compare ourresults with existing 3-D studies for both Earth-like and non-Earth-like atmospheres. A summary of these comparisons isgiven in Table 6.
We compare our new VPL Climate model with the recentwork by Turbet et al. (2016), who used a 3-D GCM in asimilar study examining the climate of Proxima Centauri b.Although our study’s companion paper and the companionpaper of Turbet et al. (2016) argue for synchronous rotationas a likely scenario for Proxima Centauri b (Barnes et al.,2018; Ribas et al., 2016), they also note that if ProximaCentauri b has an eccentricity >0.06 or has a companionplanet perturbing its orbit, the planet would likely be in a 3:2
Table 4. Summary of Aerosols Used in Our Models
Aerosol type Optical constants Particle shape Particle size (lm) References
H2SO4 Palmer and Williams, 1975 Spherical 0.49–3.85 Crisp, 1986Organic haze Khare et al., 1984 Fractal 0.001–0.5 Botet et al., 1997Stratocumulus cloud Hale and Querry, 1973 Spherical 4.07 Wiscombe, 1980;
Crisp, 1986Cirrus cloud Heymsfield et al., 2002 Columns, plates,
rosettes100a Baum et al., 2005
aCross-section weighted mean diameter.
Table 5. Venus Cloud Particle Properties
(from Crisp, 1986)
Mode Effective radius (lm) Variance
1 0.49 0.221.4 1.05 0.162 1.4 0.2073 2.85 0.262
14http://www.ssec.wisc.edu/*baum/Cirrus/Solar_Spectral_Models.html
148 MEADOWS ET AL.

spin-orbit resonance. Turbet et al. (2016) demonstrated thisresonance results in a longitudinally uniform atmosphere.Since 1-D models implicitly assume a rapidly rotating pla-net, to calculate a globally averaged surface temperature, themost appropriate comparison for our 1-D models is with the3:2 spin-orbit results of the 3-D models, although we havealso provided their 3-D modeling results for synchronousrotation for comparison, when these were available. First,we assume a rapidly rotating Proxima Cen b and compare ourresults with the asynchronous 3:2 spin-orbit resonance resultsfrom Turbet et al. (2016). The atmospheres selected forcomparison include pure CO2 atmospheres and N2-dominatedatmospheres with trace CO2. The pure CO2 cases are for 1, 4,and 6 bar atmospheres. The N2 cases consist of 1 bar N2 with376 ppm CO2, either without or with water. For the lattercase, we begin with the water mixing profile provided by M.Turbet (personal communication) to enable a close compar-ison. We use a surface albedo of 0.20 from 0–5mm (CO2
cases) or the idealized wavelength-dependent snow/ice al-bedo taken from Turbet et al. (2016, their Fig. 2, lower panel)(N2 cases), and a solar zenith angle of 60 degrees, whichapproximates the diurnal average in our 1-D model.
Our VPL Climate model appears to be in reasonableagreement with the LMDz model used by Turbet et al.(2016) for the test cases chosen, with at most a discrepancyof 5 K between the surface temperatures derived by themodels for similar inputs. However, thin atmospheres de-pend very strongly on the surface albedo and water vaporprofile assumptions. For the pure CO2 cases, our resultsagree well with the 3:2 spin-orbit resonance cases of Turbetet al. (2016). We find global average surface temperatures of264, 306, and 320 K, compared with 266, 305, and 325 Kfrom Turbet et al. (2016) for 1, 4, and 6 bar of CO2, re-spectively. For CO2 cases, these temperatures agree betweenthe models to within 5 K. For the dry 1 bar N2, 376 ppm CO2
atmosphere, we agree with Turbet et al. (2016) that this CO2
amount is insufficient to maintain a globally averaged sur-face temperature above freezing (we found this initially withan albedo of 0.20 as well, representative of a warm surface).Before comparing the Earth-like (N2) cases, it is importantto point out that surface albedo has a drastic impact onsurface temperatures. For example, Godolt et al. (2016) usedan updated version of the 1-D Atmos climate model under
Earth-like assumptions, and depending on the surface albedoand humidity profile, they produced a range of climatesincluding glaciation and moist greenhouse, spanning 196.4–354.2 K. With VPL Climate, we have also found a strongdependence on surface albedo and water profile. When weuse the same albedo assumptions as Turbet et al. for the dryN2 case with 376 ppm CO2 we obtain a surface temperatureof 238 K, the same as Turbet et al. (see their Fig. 3; privatecommunication, M. Turbet). For the 1 bar N2 case with376 ppm CO2 and H2O, we calculate a globally averagedsurface temperature of 249 K using a fully saturated moistadiabat and 257 K using the globally averaged water mixingratios from Turbet et al., which compares to 253 K fromTurbet et al. (private communication, M. Turbet). Conse-quently, our surface temperatures are all within *5 K ofTurbet et al.’s results for the 3:2 spin-orbit cases, and we canreasonably reproduce the global average temperatures of theLMDz GCM for the nonsynchronously rotating planets.
We also show for comparison the globally averagedsurface temperatures for the synchronously rotating resultsof Turbet et al. (2016; M. Turbet, private communication).Our 1-D globally averaged results for dry planets are sys-tematically warmer than the 3-D synchronously rotatingcases by 11–18 K. However, our comparison with the wet,Earth-like planet shows only a 3 K difference between the 1-D model and the synchronously rotating case, although,again, for these 1 bar atmospheres, the surface temperatureis strongly dependent on water vapor profiles and surfacealbedos. These results show that the 1-D models are a rea-sonable match for the 3-D asynchronous result and typicallysit between the synchronous and asynchronous 3-D results,which are systematically cooler. Comparable results forexoplanets with 1-D and 3-D models for relatively rapidrotators have been previously shown (Yang et al., 2014) andalso for synchronously rotating planets (Godolt et al., 2016),although the latter results are strongly dependent on theassumed surface albedo and water vapor profile. It is alsoimportant to note that many 3-D GCM results do not useocean heat transport, which can be very efficient at reducingday-night temperature differences and potentially degla-ciating the nightside of tidally locked planets (Hu and Yang,2014). Three-dimensional models with ocean heat transportmay produce results closer to 1-D results.
Table 6. A Comparison of Global Average Surface Temperatures of Our 1-D Climate
to 1-D and 3-D Model Results in the Literature
Atmosphere Our model Our result (K)
Comparison result (K)
Asynchronous (3:2) Synchronous (1:1)
1 bar CO2 (snow) VPL Climate 264 266a 247a
4 bar CO2 VPL Climate 306 305a 289a
6 bar CO2 VPL Climate 320 324a 309a
1 bar N2, 376 ppm CO2 VPL Climate 238 238a 220a
1 bar N2, 376 ppm CO2, water VPL Climate 249 (moist adiabat)257 (fixed H2O)
253a 252a
2% CO2, 0.02% CH4, water Atmos 282 287b
6% CO2, water Atmos 285.3 287.9c
aTurbet et al. (2016), provided by M. Turbet (private communication).bCharnay et al. (2013).cWolf and Toon (2013).
PROX CEN B: HABITABILITY AND OBSERVABILITY 149

We have also previously compared our 1-D Atmos cli-mate model to the temperatures produced by the LMDzGCM and the CAM GCM for Archean Earth-like planets inthe work of Arney et al. (2016). For a planet with 2% CO2,0.02% CH4, and a surface albedo of 0.33, the LMDz modelproduces a global average temperature of 287 K (Charnayet al., 2013), which is 5 K warmer than our model’s 282 Kfor this type of planet. For a planet with 6% CO2, no CH4,and an average albedo of 0.317, the CAM model produces aglobal average temperature of 287.9 K (Wolf and Toon2013), and our model produces an average temperature of285.3 K, a difference of 2.6 K. These comparable casessuggest that our 1-D Atmos climate model can producesimilar temperatures to GCM models, at least for non-synchronously rotating planets.
4.2. Temperatures and atmospheres
In this section, we show the simulated atmospheres andresulting temperature profiles for the end states of the evo-lutionary scenarios described in the work of Barnes et al.(2018), including stages throughout the possible evolutionarysequence from O2-rich to CO2-rich atmospheres, and possiblehabitable planetary environments. A summary of the plane-tary states considered, including atmospheric composition,surface pressure, and surface albedo, is given in Table 7.
4.2.1. O2-rich atmospheres. If Proxima Centauri b formedin situ, the extended pre-main sequence phase of its star may
have driven substantial water loss and the buildup of poten-tially hundreds of bar of O2 (Luger and Barnes, 2015; Barneset al., 2018). The total O2 generated depends on several pa-rameters, including the initial volatile inventory of the planetand the rate of destruction or sequestration by geological pro-cesses, but plausible scenarios exist where substantial quanti-ties of abiotic oxygen remain in the planet’s atmosphere eitheralongside a remnant liquid water ocean or after completedesiccation of the planet (Barnes et al., 2018).
We used Atmos to self-consistently model the climate andtrace gas abundance for two post-runaway, high-O2 sce-narios. In both cases the total pressure of the atmosphere is10 bar, with 95% O2 and 0.5% CO2 by volume (N2 is a fillergas, constituting the remaining atmospheric volume at eachaltitude level once all other major and trace gas species areaccounted for). In the first high-O2 case, we assume anocean remains on the surface with a water vapor profile asdescribed in Section 3.6 (i.e., it is ‘‘wet’’). In the secondcase, we assume complete desiccation of the atmosphereand no surface ocean. The choice of 10 bar is motivated by aconservative compromise between the prediction of up toseveral hundreds of bar of O2 (Barnes et al., 2018), un-certainties regarding the capacity of effects such as ozoneshielding to arrest O2 buildup, and the extent to which amagma ocean may assimilate that O2 (Schaefer et al., 2016).A 0.5% CO2 mixing ratio is assumed for consistency in totalCO2 abundance (mixing ratio times surface pressure) withthe modern and Early Earth scenarios described below,which have 5% CO2 in a 1 bar atmosphere.
Table 7. A Summary of Our Modeled Planetary States, Their Environmental
Parameters, and Derived Surface Temperatures
Planet Surface albedoType(s) of
haze/clouds Atmospheric gasesSurface
pressure (bar)Surface
temperature (K)
‘‘wet’’ high O2 Composite 2 None 95% O2, 0.5% CO2 + H2O,N2, trace CO, trace O3
10 318
‘‘dry’’ high O2 Desert None 95% O2, 0.5% CO2, N2,trace CO, trace O3
10 256
Evolved O2/CO2 Desert None 45% CO2, 45% O2, N2,trace CO, trace O3
10 383
Evolved O2/CO2 Desert None 45% CO2, 45% O2, N2,trace CO, trace O3
90 569
Venus-like 10 bar Basalt H2SO4 CO2, 20 ppm H2O 10 379Venus-like 90 bar Basalt H2SO4 CO2, 20 ppm H2O 90 640Desiccated
CO2-dominatedMars average None CO2, O2, CO, trace O3 1 254
PreindustrialPhanerozoic Earth
Composite 1 25% water, 25%ice clouds
78% N2, 21% O2, 280 ppmCO2, 53 ppb H2, 500 ppbCH4, 50 ppb CO, 260 ppbN2O, H2O, O3
1 288
Earth-like ProximaCentauri b
Composite 1 25% water, 25%ice clouds
73% N2, 21% O2, 5% CO2,53 ppb H2, 2330 ppm CH4,194 ppm CO, 2.3 ppmN2O, H2O, O3
1 273
Haze-freeArchean analogue
Composite 2 water, ice clouds 5% CO2, 1% CH4 1 278
Hazy Archeananalogue
Composite 2 water and iceclouds, organichaze
5% CO2, 1.5% CH4 1 277
A more detailed description of the surface albedo types is given in Section 3.7.5. Details of the aerosols used are given in Tables 3 and 4.The surface temperature results are presented in Section 4.2. Note the ‘‘Preindustrial Phanerozoic Earth’’ case represents a fiducialcomparison case of actual Earth and was not simulated for a world orbiting Proxima Centauri.
150 MEADOWS ET AL.

Figure 4 shows the temperature and gas mixing ratio pro-files for these two cases. The primary differences between the‘‘wet’’ and desiccated cases, other than the presence and ab-sence of water vapor, are the surface temperatures and O3
profiles. The surface temperature for the ‘‘wet’’ case is 318 Kversus 256 K for the desiccated scenario due to the significantgreenhouse impact of water vapor, which is enhanced bypressure broadening effects in the 10 bar atmosphere (e.g.,Goldblatt et al., 2009). The presence of water vapor alsosignificantly impacts the O3 profile, because OH radicals thatare primarily formed via interactions between O1D and watervapor (O1D + H2O / 2OH) are efficient at O3 destruction.Thus, O3 can build up to significantly higher levels in thedesiccated atmosphere, especially near the surface where theH2O mixing ratio would otherwise be high.
4.2.2. CO2-rich atmospheres. Although a remnant O2
atmosphere from massive H escape is possible, if the planetis volcanically active, and lacks a large surface reservoir ofwater, then the atmosphere may evolve so that significantamounts of both CO2 and O2 exist simultaneously in the at-mosphere (Section 4.2.2.1). The O2 would originate fromwater loss during the pre-main sequence (Luger and Barnes,2015) and the CO2 from outgassing from the planetary inte-rior. In the absence of liquid water, the outgassed CO2 wouldbe unlikely to be dissolved into bodies of water, bound intocarbonates, and returned to the mantle, as sequestration by thecarbonate-silicate cycle (Walker et al., 1981) requires anactive hydrological cycle. In our own solar system, it has beensuggested that Venus could have had an O2- and CO2-
dominated atmosphere today if it had formed with a largerwater inventory (Chassefiere et al., 1996a). However, if thatwater inventory is not initially present, or if sufficient time haselapsed that the planet has been able to sequester or lose itsO2, then the planet may be more Venus-like (Section 4.2.2.2)with a CO2-dominated and largely desiccated atmosphere(< 40 ppm of H). Ultimately, the atmosphere may becomeheavily H depleted, and in that case, a photochemical equi-librium will develop between O2, CO, and CO2 (Gao et al.,2015; Section 4.2.2.3). We model these three cases below forProxima Centauri b using the VPL Climate model, which isable to simulate massive high-CO2, high-temperature atmo-spheres, coupled with the Atmos photochemistry model.
4.2.2.1. Evolved O2/CO2 atmospheres. We calculate thephotochemistry and climate for 10 and 90 bar mixed CO2 andO2 cases. These atmospheres consist of 45% CO2, 45% O2,with the remainder comprised of N2 and photochemicallygenerated trace gases (primarily CO and O3). We assume adesiccated atmosphere and an initial vertical profile for watervapor consistent with Venus’ (*30 ppmv at the surface). Wecoupled the photochemical component of Atmos to the VPLClimate model to calculate the self-consistent gas mixingratios and temperature profiles given in Fig. 5. The photo-chemically modeled species shown in Fig. 5 (O2, O3, CO2,H2O, and CO) and the resultant temperature profile from theclimate model were passed between the models until globalconvergence was achieved. Here, the hypothetical 10 bar O2-CO2 atmosphere for Proxima Centauri b would produce asurface temperature of 383 K, while the 90 bar case has a
FIG. 4. Temperature (top x axes; black dashed) and gas mixing ratio profiles (bottom x axes) for the self-consistent high-O2 (95%), post-runaway atmospheres with a surface ocean remaining (left) and completely desiccated (right). Differences intemperature and O3 profiles are primarily driven by the presence or absence of water vapor.
PROX CEN B: HABITABILITY AND OBSERVABILITY 151

surface temperature of 569 K. Neither of these atmosphereswould be habitable due to the high surface temperature andthe lack of surface water.
4.2.2.2. Venus-like atmospheres. Venus is our nearestplanetary neighbor and represents a class of worlds that maybe common throughout the Galaxy (Kane et al., 2014).Studies have suggested that Venus was more Earth-like inits past, possibly with liquid water as inferred from its highD/H ratio (McElroy et al., 1982; Donahue and Hodges,1992). However, the interpretation of Venus with earlyliquid water has been called into question by other studies(Grinspoon, 1993; Hamano et al., 2013). Still, desiccation ofexoplanets with liquid water by the runaway greenhousemechanism (Ingersoll, 1969; Kasting and Pollack, 1983;Kasting et al., 1984b; Kasting, 1988; Goldblatt and Watson,2012; Goldblatt et al., 2013) is likely a common process.This may have occurred on Proxima Centauri b during itsstar’s pre-main sequence phase (Luger and Barnes, 2015) asdiscussed above. If Proxima Centauri b underwent a run-away greenhouse and lost both its hydrogen and oxygen(e.g., Schaefer et al., 2016; Airapetian et al., 2017), or if itformed without liquid water in the first place (Hamanoet al., 2013), then outgassed CO2 over the last several billionyears would have remained in and dominated the atmo-sphere, and it may be Venus-like.
VPL Climate was used to generate temperature pressureprofiles for 10 and 90 bar CO2 atmospheres with the Venuswater vapor vertical mixing ratio profile (e.g., Pollack et al.,1993; Chamberlain et al., 2013; Arney et al., 2014). As in
the work of Lee et al. (2016), we also include trace gasesSO2 and OCS (200 ppmv and 35 ppmv at the surface, re-spectively), which are active greenhouse gases in spectralregions between CO2 lines. Figure 6 shows the compositionsof our Venus-like atmospheres. We specified these gasesinitially consistent with Venus. Note that the climate sim-ulations in this case are not photochemically self-consistent,nor do they include self-consistent cloud formation or theunknown UV absorber, but they are useful as a first-orderapproximation of a Venus-like atmosphere for ProximaCentauri b. Our simulations indicate that if Proxima Cen-tauri b had a 10 bar Venus-like atmosphere, its surfacetemperature would be 385 K; for a 90 bar Venus-like at-mosphere, the surface temperature climbs to 654 K. Both areunlikely to be habitable.
If Proxima Centauri b outgasses volcanic SO2, it may beable to produce sulfuric acid (H2SO4) haze and cloud. InVenus’ atmosphere, H2SO4 aerosols are generated photo-chemically through reactions such as (Yung and DeMore,1982)
SO2þOþM! SO3þM
SO3þH2OþM! H2SO4þM
Note that the formation of H2SO4 requires the presence ofH2O to react with SO3. Sulfuric acid aerosols thereforecannot form if the atmosphere is completely water-free.Sulfuric acid is an efficient desiccant, so water in the Venuscloud deck gets trapped in the H2SO4 droplets, producing a
FIG. 5. Temperature (top axes; black dashed) and gas mixing ratio profiles (bottom axes) for a 10 bar (left) and 90 bar(right) O2-rich and CO2-rich atmosphere with 45% CO2, 45% O2, and *10% N2.
152 MEADOWS ET AL.

concentrated solution of H2SO4 and H2O. To estimate wherea cloud deck could form in our Venus-like atmospheres,we calculated a H2SO4 saturation vapor pressure curvefollowing the method described in the work of Gao et al.(2014). We assume an H2SO4 vapor mixing ratio of 4 ppmin the lower atmosphere, similar to measurements in Venus’atmosphere (Parkinson et al., 2015), and a cloud dropletacid concentration of 85%, also similar to Venus’ (e.g.,Barstow et al., 2012).
The intersection of the saturation vapor pressure curvesand the temperature-pressure profiles in Fig. 6 shows whereH2SO4 condensation would occur; a similar technique hasbeen used before to predict cloud condensation in the con-text of other exoplanets, such as GJ 1214b (Miller-RicciKempton et al., 2012). In the 10 bar CO2 atmosphere, we findthat H2SO4 condensation can potentially occur throughout theatmosphere, including at the surface. In a 90 bar CO2 atmo-sphere, cloud condensation would occur at a pressure of about5.5 bar, or 25 km in altitude. Since we are not computingphotochemistry for these Venus-like atmospheres, we adjustthe H2O, SO2, and OCS mixing ratios to be consistent withwhere the cloud deck forms (i.e., all three of these trace gaseshave lower abundances above the cloud deck than below).
To implement these sulfuric acid cloud decks in our model,we applied a scaling to the Venus cloud model of Crisp (1986)to move the base of the cloud deck to our predicted pressure,
shifting the pressures of the entire cloud deck accordingly.However, this procedure does not include feedbacks on theatmospheric temperature structure from the formation of thisH2SO4 deck. The clouds and haze of Venus reflect over 70%of the total incident solar radiation back to space, and theresidual insolation passing through the cloud deck is stronglyabsorbed. The SMART model shows that only about 3% ofthe incident radiation at the top of the cloud deck ever reachesthe surface of this atmosphere. The clouds themselves areeffective absorbers of reradiated longwave radiation forwavelengths longer than 2.7 mm, contributing to the Venusgreenhouse (Crisp, 1986). These effects would combine tochange the temperature structure of the atmosphere with acloud deck in place, compared to the temperature profilesshown in Fig. 6.
Future studies of the possibility of H2SO4 clouds onProxima Centauri b should include self-consistent coupledclimate-photochemical modeling of the processes that pro-duce H2SO4 to determine the efficiency of H2SO4 productionunder Proxima Centauri’s UV SED. Our photochemicalmodel cannot currently simulate Venus-like atmospheres, sowe were unable to do this here. However, we ran a test ofphotochemical H2SO4 production in an Earth-like atmo-sphere with the photochemical model for the net reactionSO3 + H2O / H2SO4. We find that Proxima Centauri’sspectrum is less efficient at forming H2SO4 by about a factor
FIG. 6. Temperature (top x axes; black dashed) and gas mixing ratio profiles (bottom x axes) for a 10 bar (left) and a90 bar (right) Venus-like, CO2 atmosphere. The H2SO4 saturation mixing ratio profile is shown as the black dotted curve,which traces the true H2SO4 mixing ratio for much of the atmosphere, indicating that H2SO4 is fully saturated and cloudscould condense. The differences in gas mixing ratio profiles between these two atmospheres are due to adjustments made tocoincide with the regions of cloud formation. Like Venus, H2SO4 aerosols are present down to approximately 10 bar in bothcases. The temperature profiles are similar above 0.1 bar, where atmospheres are generally optically thin, but the 90 baratmosphere reaches much hotter temperatures at the surface due to the longer dry adiabat.
PROX CEN B: HABITABILITY AND OBSERVABILITY 153
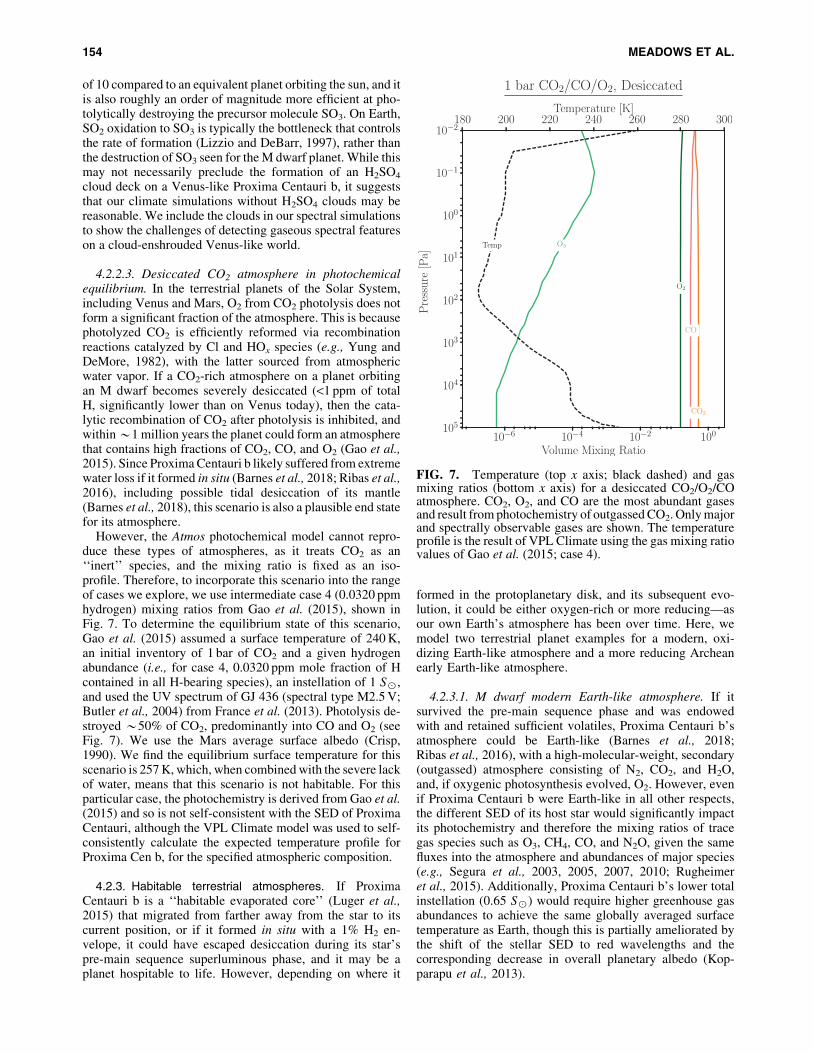
of 10 compared to an equivalent planet orbiting the sun, and itis also roughly an order of magnitude more efficient at pho-tolytically destroying the precursor molecule SO3. On Earth,SO2 oxidation to SO3 is typically the bottleneck that controlsthe rate of formation (Lizzio and DeBarr, 1997), rather thanthe destruction of SO3 seen for the M dwarf planet. While thismay not necessarily preclude the formation of an H2SO4
cloud deck on a Venus-like Proxima Centauri b, it suggeststhat our climate simulations without H2SO4 clouds may bereasonable. We include the clouds in our spectral simulationsto show the challenges of detecting gaseous spectral featureson a cloud-enshrouded Venus-like world.
4.2.2.3. Desiccated CO2 atmosphere in photochemicalequilibrium. In the terrestrial planets of the Solar System,including Venus and Mars, O2 from CO2 photolysis does notform a significant fraction of the atmosphere. This is becausephotolyzed CO2 is efficiently reformed via recombinationreactions catalyzed by Cl and HOx species (e.g., Yung andDeMore, 1982), with the latter sourced from atmosphericwater vapor. If a CO2-rich atmosphere on a planet orbitingan M dwarf becomes severely desiccated (<1 ppm of totalH, significantly lower than on Venus today), then the cata-lytic recombination of CO2 after photolysis is inhibited, andwithin *1 million years the planet could form an atmospherethat contains high fractions of CO2, CO, and O2 (Gao et al.,2015). Since Proxima Centauri b likely suffered from extremewater loss if it formed in situ (Barnes et al., 2018; Ribas et al.,2016), including possible tidal desiccation of its mantle(Barnes et al., 2018), this scenario is also a plausible end statefor its atmosphere.
However, the Atmos photochemical model cannot repro-duce these types of atmospheres, as it treats CO2 as an‘‘inert’’ species, and the mixing ratio is fixed as an iso-profile. Therefore, to incorporate this scenario into the rangeof cases we explore, we use intermediate case 4 (0.0320 ppmhydrogen) mixing ratios from Gao et al. (2015), shown inFig. 7. To determine the equilibrium state of this scenario,Gao et al. (2015) assumed a surface temperature of 240 K,an initial inventory of 1 bar of CO2 and a given hydrogenabundance (i.e., for case 4, 0.0320 ppm mole fraction of Hcontained in all H-bearing species), an instellation of 1 S1,and used the UV spectrum of GJ 436 (spectral type M2.5 V;Butler et al., 2004) from France et al. (2013). Photolysis de-stroyed *50% of CO2, predominantly into CO and O2 (seeFig. 7). We use the Mars average surface albedo (Crisp,1990). We find the equilibrium surface temperature for thisscenario is 257 K, which, when combined with the severe lackof water, means that this scenario is not habitable. For thisparticular case, the photochemistry is derived from Gao et al.(2015) and so is not self-consistent with the SED of ProximaCentauri, although the VPL Climate model was used to self-consistently calculate the expected temperature profile forProxima Cen b, for the specified atmospheric composition.
4.2.3. Habitable terrestrial atmospheres. If ProximaCentauri b is a ‘‘habitable evaporated core’’ (Luger et al.,2015) that migrated from farther away from the star to itscurrent position, or if it formed in situ with a 1% H2 en-velope, it could have escaped desiccation during its star’spre-main sequence superluminous phase, and it may be aplanet hospitable to life. However, depending on where it
formed in the protoplanetary disk, and its subsequent evo-lution, it could be either oxygen-rich or more reducing—asour own Earth’s atmosphere has been over time. Here, wemodel two terrestrial planet examples for a modern, oxi-dizing Earth-like atmosphere and a more reducing Archeanearly Earth-like atmosphere.
4.2.3.1. M dwarf modern Earth-like atmosphere. If itsurvived the pre-main sequence phase and was endowedwith and retained sufficient volatiles, Proxima Centauri b’satmosphere could be Earth-like (Barnes et al., 2018;Ribas et al., 2016), with a high-molecular-weight, secondary(outgassed) atmosphere consisting of N2, CO2, and H2O,and, if oxygenic photosynthesis evolved, O2. However, evenif Proxima Centauri b were Earth-like in all other respects,the different SED of its host star would significantly impactits photochemistry and therefore the mixing ratios of tracegas species such as O3, CH4, CO, and N2O, given the samefluxes into the atmosphere and abundances of major species(e.g., Segura et al., 2003, 2005, 2007, 2010; Rugheimeret al., 2015). Additionally, Proxima Centauri b’s lower totalinstellation (0.65 S1) would require higher greenhouse gasabundances to achieve the same globally averaged surfacetemperature as Earth, though this is partially ameliorated bythe shift of the stellar SED to red wavelengths and thecorresponding decrease in overall planetary albedo (Kop-parapu et al., 2013).
FIG. 7. Temperature (top x axis; black dashed) and gasmixing ratios (bottom x axis) for a desiccated CO2/O2/COatmosphere. CO2, O2, and CO are the most abundant gasesand result from photochemistry of outgassed CO2. Only majorand spectrally observable gases are shown. The temperatureprofile is the result of VPL Climate using the gas mixing ratiovalues of Gao et al. (2015; case 4).
154 MEADOWS ET AL.

We construct a hypothetical, ‘‘modern Earth’’ atmospherefor Proxima Centauri b that is consistent with the spectrumfrom the M5.5V host star, following the methodology ofSegura et al. (2005). We determined the fluxes of trace gasspecies, like CH4, required for the photochemical model toproduce the ‘‘modern’’ preindustrial (assuming no anthro-pogenic sources) mixing ratios for an Earth-Sun case andthen applied those gas surface fluxes to determine themixing ratios for the Proxima Centauri b atmosphere, giventhe substantially different UV spectrum of the star. CO2 andH2 mixing ratios were fixed at 280 ppm and 53 ppb, and thepreindustrial mixing ratios from which we derived the sur-face fluxes were 500 ppb (CH4), 50 ppb (CO), and 260 ppb(N2O), all based on ice core data (Haan and Raynaud, 1998;Fluckiger et al., 2002; Solomon et al., 2007). (The modern-day mixing ratios—which include anthropogenic sources—are considerably higher, being 1834, *100, and 328 ppb,respectively [Blasing, 2016]). The fluxes required to repro-duce the lower, preindustrial mixing ratios in our model formodern Earth orbiting the Sun are 5.6 · 1010 molecules/cm2/s(CH4), 1.91 · 1011 molecules/cm2/s (CO), and 8.8 · 108
molecule/cm2/s (N2O), respectively. These molecular fluxescorrespond to yearly mass fluxes of 272 Tg/yr for CH4
(about half the modern value of *600 Tg/yr), 1620 Tg/yrfor CO, and 11.8 Tg/yr for N2O. These values are consistentwith independent estimates of the fluxes of these gases be-fore the industrial era (Etheridge et al., 1998; Kroeze et al.,1999), though we note that the sources and sinks for thesegases also varied naturally through time. In both the modern,preindustrial Earth and Proxima Centauri b cases, we as-sume a volcanic flux of H2S of 1.0 · 108 molecules/cm2/sand a flux of SO2 of 1.0 · 109 molecules/cm2/s.
We applied these fluxes self-consistently to ProximaCentauri b with the coupled Atmos model described inSection 3.6, assuming that the biological and abiotic flux ofthese gases scales with surface area. We also prescribed asurface pressure of 1 bar, an O2 mixing ratio of 21%, a CO2
mixing ratio of 5% (to warm the planet and partially com-pensate for lower instellation), and an N2 mixing ratio of73%. This prescription produced surface mixing ratios of2330 ppm (CH4), 194 ppm (CO), and 2.3 ppm (N2O). Weused Atmos to calculate self-consistent profiles for H2O, O3,and temperature, and obtained a surface temperature of273 K, which is at the freezing point of water. However, 3-DGCM studies have shown that Archean Earth can maintain anopen ocean fraction of >50%, and thereby remain habitable,for globally averaged surface temperatures as low as 260 K(Wolf and Toon, 2013; Arney et al., 2016), and an equatorialbelt of open ocean may also be possible for globally averagedsurface temperatures as low as *250 K (Charnay et al.,2013). The spectral output of late-type M dwarfs is concen-trated in the NIR, where water ice is strongly absorbing, andthis interaction can also work to maintain open ocean at coolertemperatures (Shields et al., 2013). Figure 8 compares the gasand temperature mixing ratio profiles for preindustrial con-centrations of biogenic trace gas species on modern Earth(Fig. 8, left panel) with those expected for Proxima Centauri bgiven similar bulk atmospheric constituents (N2, O2) andfluxes of trace gas species into the atmosphere, but with 5%CO2 (Fig. 8, right panel).
A notable difference compared to Earth is the elevatedmethane abundance on Proxima Centauri b, which is in-
creased by a factor of *4760 (2330 ppm vs. 0.5 ppm), forthe same surface flux. This effect was described in the workof Segura et al. (2005) and in Section 2, and it is due toProxima Centauri’s low 200–300 nm flux levels that are lessefficient at driving the photochemical reactions that destroymethane. This reaction sequence is (Segura et al., 2005)
O3þ h�(k < 310 nm)! O2þO(1D)
O(1D)þH2O! 2OH
CH4þOH! CH3þH2O
CH3þO2þM! CH3O2þM! . . .! CO2þH2O
Because this reaction primarily takes place in the lowerstratosphere and troposphere, overlying O2 absorbs photonswith wavelengths less than 200 nm. The CH4 content isfurther enhanced by the lower temperature of this relativelylow-instellation planet (compared to Earth), which alsolowers H2O mixing ratios and OH radicals (sourced fromH2O) that would destroy methane. N2O is enhanced, butonly by a factor of *10 (2.3 ppm vs. 0.26 ppm). This is alsodue to the relative lack of >200 nm photons, where N2O hasa significant photodissociative cross section. The climaticeffect of enhanced N2O was not included in the Atmos cli-mate calculations. However, this is unlikely to produce asignificant impact, as previous results indicate that increas-ing the N2O mixing ratio from 0.3 to 2.3 ppmv in a 1 baratmosphere would produce a warming effect of *1 K(Roberson et al., 2011, their Fig. 3). The water vaporabundance in the stratosphere of Proxima Centauri b wouldbe elevated, 20 ppm at 30 km vs. *10 ppm for the Earth-Sun (see Fig. 8 for profiles). This is due to the enhancedmethane abundance in its upper atmosphere. The oxidationof methane by molecular oxygen produces additional watervapor through the reaction CH4 + 2O2 / CO2 + 2H2O (Se-gura et al., 2005). The difference in surface water mixingratio is due wholly to the 15 K difference in surface tem-perature between the Earth-Sun analogue and ProximaCentauri b. Additionally, the temperature profile in the up-per atmosphere of Proxima Centauri b is lower primarilydue to the lower near-UV fluxes and consequential lack ofheating, despite a comparable ozone column. Overall, theseresults are consistent with those of Segura et al. (2005); andminor differences are due to the different UV spectrum ofProxima Centauri b, our choice of CO2 mixing ratio, and theuse of preindustrial fluxes for biogenic trace gases. It shouldbe noted that our O3 abundances here are calculated withoutconsidering ozone depletion from flares (e.g., Segura et al.,2010), which will be a key consideration for future work.
4.2.3.2. M dwarf Archean Earth-like atmospheres. EarlyEarth represents another type of habitable planet whosespectral appearance and atmospheric composition are dif-ferent from modern Earth. In particular, the Archean (roughly4–2.5 billion years ago) atmosphere is generally believed tohave been anoxic (e.g., Farquhar et al., 2000) and may havecontained more CO2 than the modern atmosphere (e.g., Dri-ese et al., 2011), likely on the order of at least about 1% of thetotal atmosphere—and possibly more (Kanzaki and Mur-akami, 2015), although there is disagreement in the literature
PROX CEN B: HABITABILITY AND OBSERVABILITY 155

on this point (e.g., Rosing et al., 2010). Early Earth’s atmo-sphere may also have contained a substantial amount ofmethane before the rise of atmospheric O2, as there is evi-dence that methane-producing metabolisms evolved as earlyas 3.5 billion years ago (Ueno et al., 2006). Because methanecan be produced by a number of nonbiological processes aswell (Etiope and Sherwood Lollar, 2013), methane-rich, an-oxic Earth-like worlds may occur frequently elsewhere in theGalaxy, especially given the propensity for methane to ac-cumulate in Earth-like atmospheres around M dwarfs (Sec-tion 4.2.3.1). Earth-like methane-rich atmospheres may alsoform photochemically induced organic hazes if the CH4/CO2
ratio exceeds 0.1 (e.g., Trainer et al., 2006; Domagal-Goldman et al., 2008; Haqq-Misra et al., 2008; Zerkle et al.,2012), cooling the planetary surface environment through theantigreenhouse effect and dramatically altering the spectralappearance of the planet.
We generated 1 bar Archean-like atmospheres with 5%CO2 in the Atmos climate-photochemical model. This CO2
amount is reasonable for an Earth-like planet based onconstraints on the CO2 abundance of the Archean atmo-sphere (Driese et al., 2011; Kanzaki and Murakami, 2015),and it is the same CO2 amount used to model our modernEarth analog planet. One of these atmospheres contained 1%CH4 (CH4/CO2 = 0.2), and the other contained 1.5% CH4
(CH4/CO2 = 0.3) at the surface. Figure 9 shows the gas andtemperature profiles of these two atmospheres. Note thelarge abundance of CO in these atmospheres from CO2
photolysis that increases with increasing altitude. Figure 2shows the UV spectrum of Proxima Centauri compared tothe Sun, and it produces excess radiation compared to theSun for l< 170 nm, which overlaps with the peak of the CO2
UV cross section. For an atmosphere with 5% CO2 and 1%CH4, the global average surface temperature of the planet is278 K. For an atmosphere with 5% CO2 and 1.5% CH4, aTitan-like organic haze forms, and the surface temperaturedecreases only slightly to 277 K. Titan-like hazes can coolplanetary surface temperatures by 20–25 K on Archean-likeplanets orbiting solar-type stars (Arney et al., 2016), butthese hazes produce less cooling on planets orbiting Mdwarfs because M dwarf luminosity is mostly produced atwavelengths where these hazes are more transparent (Arneyet al., 2017). The hazy planet’s temperature compared to thehaze-free world is a function of both the haze and the in-creased quantity of CH4 in its atmosphere.
Haze formation depends on the atmospheric CH4/CO2
abundance ratio, and more reducing conditions enhance hazeproduction. On an Archean-like planet orbiting a solar-typestar, the CH4/CO2 ratio needed to initiate haze formation is*0.2 (e.g., Trainer et al., 2006), and smaller CH4/CO2 ratios
FIG. 8. Temperature (top x axes; black dashed) and gas mixing ratio profiles (bottom x axes) for the preindustrial modernEarth orbiting the Sun (left) and a photochemically self-consistent Earth-like atmosphere for Proxima Centauri b (right).The mixing ratios of trace gas species CH4, N2O, and CO for Proxima Centauri b are determined from the flux required toproduce their preindustrial concentration in Earth’s atmosphere (see Section 4.2.3.1). Given the same fluxes as Earth, CH4,CO, and N2O would exist in Proxima Centauri b’s atmosphere in much greater abundance. Note that a CO2 abundance of5% was used for the Earth-like Proxima Centauri b planet, as that abundance is required to raise the globally averagedsurface temperature to 273 K.
156 MEADOWS ET AL.

are needed for planets around quieter M dwarfs (e.g., CH4/CO2 = 0.12 to form haze for an Archean analogue orbiting GJ876 as discussed in Arney et al. [2017]), but around ProximaCentauri, a CH4/CO2 ratio of *0.3 is needed to initiate or-ganic haze formation in an Archean-like atmosphere. Thishigher CH4 level is easier to achieve compared to a planetaround a solar-type star given that the host star spectrum re-sults in a longer atmospheric lifetime for CH4. Our previouswork (Arney et al., 2017) shows that haze formation itself ismore difficult on planets that generate larger quantities ofphotochemical oxygen radicals because these oxygen speciesconsume haze-forming hydrocarbon gases. Therefore, plan-ets with larger amounts of oxygen species in their atmo-spheres require higher CH4/CO2 ratios to form organic hazes.We find that the hazy Archean-like planet around ProximaCentauri produces 1.8, 2.9, and 3.2 times as much O, O2, andOH, respectively, compared to a similar Archean-like planetaround the Sun. This is due to photolysis of CO2 and watervapor. Thus, the higher CH4/CO2 ratio needed to generate hazearound Proxima Centauri is consistent with our previous results.
Figure 10 shows the haze particle number density andparticle radii for the Archean analog haze particles. Arneyet al. (2016) showed that similar number density and par-ticle sizes are obtained for Archean Earth. Haze formationinitiates high in the atmosphere, with the peak of the hazeparticle number density occurring at around 90 km in alti-
tude. The photolysis of methane that initiates haze formationis apparent in the methane profiles in Fig. 9 that decrease athigher altitudes. Haze shields methane (and other gases)from photolysis once it is produced, so the hazy 1.5% CH4
plot shows photolysis of gases occurring at higher altitudesthan the haze-free 1% CH4 plot. At these high altitudes,however, the particles are very small (*0.001mm). Fractalparticles begin to form at about 60 km in altitude when theparticle radius reaches 0.05mm. The coagulation of thesesmall, simple spherical particles into fractals causes the de-cline in particle number density and the increase in particleradius at this altitude. The particles grow to a maximumradius of 0.55 mm through coagulation processes before theyfall from the atmosphere.
4.3. Simulated planetary phase curves
If Proxima Centauri b is not transiting, then observationsof the planet’s reflected and thermal phase variations may beour only option for detecting and characterizing its atmo-sphere before a next-generation ground or space-based di-rect imaging coronagraph is built. Thermal phase curveshave been used to study the atmospheric dynamics, ther-mal structure, and molecular composition of hot, thermallybright exoplanets (Cowan et al., 2007, 2012; Knutson et al.,2007, 2012; Crossfield et al., 2010; Zellem et al., 2014).
FIG. 9. Temperature (top x axes; black dashed) and gas mixing ratio profiles (bottom x axes) for Archean analog planetsorbiting Proxima Cen b. The moderate temperature inversion seen in the right (1.5% CH4) plot is due to UV absorption bythe haze. UV shielding by the haze in the 1.5% CH4 plot (right) prevents photolysis of gases such as methane and ethane athigher altitudes than in the 1% CH4 plot (left). Note the temperature profile becomes an isoprofile above the top of theclimate model grid when passed into the photochemical model.
PROX CEN B: HABITABILITY AND OBSERVABILITY 157

Below, we estimate idealized thermal phase curve variationsand planet-star contrast ratios through the MIR.
Simulated phase curves comparing the thermal emissionfrom the planet to the stellar background flux are shown inFig. 11. In each panel the main plot shows the difference instar plus planet flux between when the planet’s dayside isfully visible (superior-conjunction; full phase) and when theplanet’s nightside is fully visible (inferior-conjunction; newphase), divided by the average star plus planet flux. Fol-lowing the work of Selsis et al. (2011), we refer to this typeof spectrum as a variation spectrum. The upper-left insetshows the planetary phase evolution for two different as-sumed day-night temperature contrasts in the Mid-InfraredInstrument (MIRI) photometric filter bands longward of8 mm to avoid detector saturation. Note that neither nightsidetemperature case is uniquely modeled, but rather, nightsidetemperatures are assumed to provide conceptual under-standing and order-of-magnitude estimates. The case withno thermal flux from the nightside of the planet resemblesthe expected signal from an airless body, yet here it containsthe spectral features from our modeled atmospheres toemphasize the maximum expected signal for the variationspectrum considering the self-consistent globally averageddayside atmospheric structures that we do rigorously model.Similarly, the case with a 20 K day-night temperature con-trast is provided to emphasize a more realistic temperaturecontrast for a planet with an atmosphere and to depict howthe detectability of the variation spectrum scales with theunknown day-night temperature contrast.
The top panel of Fig. 11 shows the modeled phase curvesand variation spectrum for the self-consistent Earth-likeplanet, with the presence of a deep CO2 feature at 15 mm,numerous H2O features between 18 and 30mm, and strongbut low-contrast O3 absorption at 9.6 mm. The second panelof Fig. 11 shows phase curves and the variation spectrum forthe hazy, partially cloudy Archean Earth-like planet, withvery similar observables to the modern Earth-like case. Thethird panel of Fig. 11 shows phase curves and the variationspectrum for the desiccated O2-rich planet, with deep butlow-contrast O3 absorption, relatively weak CO2 absorp-tion, and no water features. The bottom panel of Fig. 11shows phase curves and the variation spectrum for the 90 barcloudy Venus-like planet, with exceptionally strong andbroad CO2 absorption spanning *11–22.5mm. The plotsshown in Fig. 11 share the common trend of a general rise incontrast with longer wavelengths, exceeding 10-4 longwardof 20 mm. Our planet-star contrast ratios are in agreementwith those computed in the works of Turbet et al. (2016) andKreidberg and Loeb (2016). Deviations from this steady risein contrast are due to molecular absorption and emission inthe planetary atmosphere and afford the potential for de-tectability (Selsis et al., 2011). However, the actual detect-ability of these features ultimately depends on the amplitudeof the phase curve (the planet flux is not independentlydiscriminated from the star) and the magnitude of the stellarvariability at these wavelengths. In the MIR, the amplitudeof the phase curves depends on the day-night temperaturecontrast.
4.3.1. Thermal phase curve detection with JWST. Wecompute the detectability of thermal phase curves with theJWST MIRI that operates between 5 and 28mm. In Section4.3, we model thermal phase curves for four archetypalplanet scenarios assuming two possible day-night tempera-ture contrasts. Following the generalized JWST noise cal-culations from Greene et al. (2016) and the photon countrate formalism of Robinson et al. (2016), we estimate theintegration times required to detect the quoted contrast ra-tios in each broad spectral band at a signal-to-noise ratio(SNR) of 10 at each phase, assuming photon-limited ob-servations. Such a measurement is likely to be sufficientto resolve the shape of the phase curve, but ultimately theability to resolve the shape will depend on the amplitudeof the phase variations. In an idealized case, resolving theplanet at both full and new phase can constrain the ampli-tude and a day-night brightness temperature contrast.
Using a wavelength-independent combined instrumentplus JWST throughput of 0.27 (e.g., Greene et al., 2016), wefind that an integration time of 21 h at full phase can detectthe planetary emission above the stellar flux with a signal-to-noise of 10 at 8.6 mm after binning to R = 3. These esti-mates are in agreement with the integration times adoptedby Kreidberg and Loeb (2016). For our case with a nightside20 K cooler than the dayside, we find that an integrationtime of 62 h is required to resolve the planetary signal atnew phase.
Due to the rise of the planet-star contrast ratio towardlonger wavelengths in the MIR and the presence of thestrong 15mm CO2 band in many of our simulated planetarystates, it would be advantageous to use the Medium-Resolution Spectrograph (MRS) on JWST/MIRI, which is
FIG. 10. Archean analog haze particle number density(bottom x axis; solid line) and particle radius (top x axis;dashed line) for a hazy planet orbiting Proxima Centauri b.Note the sharp decrease in particle number density (andcorresponding increase in particle size) at about 60 km inaltitude where fractal particle formation begins to occur.
158 MEADOWS ET AL.

FIG. 11. Synthetic thermal phasecurve variation spectrum of the pho-tochemically self-consistent Earth-likeatmospheric case with 50% cloudcoverage (top panel), the hazyArchean-like atmospheric case with50% cloud coverage (second panel),the desiccated O2-rich atmosphericcase (third panel), and the 90 barcloudy Venus-like atmospheric case(bottom panel). The solid and graylines show the emitted flux from thedayside of the planet (observed at 0�)minus the emitted flux from thenightside of the planet (observed at180�), divided by the average flux re-ceived from the star plus planet. Thesolid line depicts the maximum pos-sible signal strength for a phase curvespectrum of the planet in the case thatthere is no flux emitted from thenightside, while the gray line showsthe signal strength for a case with anightside 20 K cooler than the dayside.The colored horizontal lines show thehigh-resolution model spectrum con-volved with the 7 JWST/MIRI fil-ter bands longward of where ProximaCentauri exceeds the instrument bright-ness limit. Each upper-left inset showsthe phase-dependent planet-to-star fluxcontrast ratios in the MIRI filter bandsfor the cases with no flux from thenightside (solid lines) and with a 20 Kcooler nightside (dotted lines).
PROX CEN B: HABITABILITY AND OBSERVABILITY 159

the only option for spectroscopy beyond 12mm. However,slit losses and/or imaging slicing with the integral fieldspectrometer may impede precision exoplanet atmosphericcharacterization with MRS (e.g., Beichman et al., 2014;Kreidberg and Loeb, 2016). Nonetheless, given that thermalphase curve signals (as well as secondary eclipse signals) fortemperate terrestrials increase toward longer wavelengths,significantly improving the planet-to-star contrast, it may beworth revisiting the performance of MRS when on-orbitstability and pointing for JWST are known.
The presence of CO2 in all the planetary states exploredin this paper, and the existence of the strong molecularabsorption band at 15mm, makes it a weak discriminantbetween the different atmospheric cases, but a strong dis-criminant between a terrestrial planet with an atmosphereand one without. The variation spectrum of an airless bodywill appear smooth and consistent with blackbody radiationfor the day- and nightsides, while a terrestrial atmospherewill deviate from a blackbody at 15 mm where CO2 absorbs.Furthermore, 15 mm is well suited for MIRI imaging. TheF1500W filter centers on the CO2 band with a full-widthcomparable to the full-width of the spectral band. For ourEarth-like case with the largest possible day/night temper-ature contrast, an integration time of 10 h at both full andnew phase would be sufficient for a 5s detection of CO2. Ifinstead the nightside is only 20 K cooler, 100 h at both fulland new would provide a 3.5s detection. Additional expo-sures in neighboring MIRI filter bands (e.g., F1130W andF1800W) will be necessary to measure the slope of thevariation spectrum and determine if the 15 mm point is lowerthan the expected continuum value. The integration timesnecessary to detect CO2, or any features in a variation spec-trum, will strongly depend on the actual day/night temper-ature contrast. Simply measuring the day/night temperaturecontrast could provide strong constraints of the presence orlack of an atmosphere that would act to recirculate heat fromthe dayside to the nightside.
However, there are several caveats for these proposedobservations, including possible saturation, systematics, andstellar variability due to flaring. Due to the brightness ofProxima Centauri in the MIR, thermal phase curves withJWST/MIRI will likely run into the brightness limits of theinstruments. All MIRI filters will saturate for full frameimages, but 64 · 64 subarray photometry should be acces-sible for short exposures (less than 1 s) using filters longerthan 10 microns (F1280W, F1130W, F1500W, F1800W,F2100W, and F2550W). The Low-Resolution Spectrograph(LRS) in ‘‘FAST’’ readout mode will saturate at all wave-lengths based on the published saturation curves (Glasseet al., 2015), but shorter exposures or alternate readoutmodes may salvage LRS data for the longest wavelengths itcan access (Kreidberg and Loeb, 2016). The MIRI MRSescapes saturation across its entire wavelength range (4.9–28.8 mm), but its low throughput (2–20%) may requireprohibitively long exposures and co-adds. JWST’s ability tomeasure thermal phase curves for terrestrial exoplanets mayalso be limited by to-be-determined systematics, whichcould raise the noise floor. Therefore, our performance es-timates are likely idealized.
Stellar variability and the effect of flaring in the MIR mayalso complicate thermal phase curve observations withJWST. Tofflemire et al. (2012) observed NIR ( J, H, Ks)
counterparts to optical flares on the order of *1% in flux formid M-dwarfs. Knutson et al. (2007) observed variability ofabout 5 · 10-4 in the 8 mm phase curve of HD189733b withSpitzer. Although it is unclear how much of the scatter isstellar versus systematic in origin, rotational variability willbe seen at these wavelengths and longer, at the known rotationperiod of the star. For example, considering a starspot with aneffective temperature 500 K cooler than the photosphere andwith filling factors large enough to get 3–8% optical fluxmodulations as seen for Proxima Centauri (Davenport, 2016),the MIR variability will be *1%. For stars later than mid-Mtype, cloudlike modulation may become appreciable too ( J.Davenport, 2016, personal communication). Proxima Cen-tauri MIR variability is likely to have a greater amplitude thanthe thermal phase curves. Observations and rigorous model-ing of the MIR variability of Proxima Centauri are needed tounderstand and mitigate its impact on observations of thermalphase curves. Disentangling stellar from planetary modula-tions will be highly important. Pioneering work in obtainingterrestrial exoplanet phase curves in the MIR and M dwarfvariability in the MIR may both be enabled by observingProxima Cen with JWST.
Further work is needed that combines photochemicallyand climatically self-consistent potential atmospheres forProxima Centauri b with a full GCM treatment. Such mod-eling is necessary for making accurate phase curve predic-tions that are self-consistent between the altitude-dependentvertical structure and the longitude- and latitude-dependentspatial structure.
Additionally, this study is limited to nearly edge-on in-clinations. As the inclination shifts from edge-on to face-on,the phase curve amplitude decays. More work is needed toexplore the detectability of thermal phase curves over acomplete range of possible inclinations.
4.3.2. Detecting ocean glint in phase curves. Detectionof ocean glint in a reflected-light phase curve from ProximaCen b would provide strong evidence for the presence ofsurface liquid water. Here, we outline the requirements forglint detection and determine whether it might be feasible todetect using JWST, ground-based telescopes, or future di-rect imaging missions. As shown in the work of Robinsonet al. (2010), strong glint signatures only occur for a subsetof all possible orbital inclinations, as orbits near face-ondo not allow for crescent-phase viewing geometries. Thus,only inclinations within –30 degrees of edge-on have thepotential to show strong signatures of glint. For this rangeof inclinations, the glint signature would be strongest atreflected-light wavelengths outside of Rayleigh scatteringand gas absorption features. While the atmospheric com-position of Proxima Cen b is currently unknown, keywavelength ranges of interest for glint detection would bebetween the 0.94, 1.1, 1.4, and 1.9 mm water vapor bands. Atthe phase angles of peak glint contributions for Earth (i.e.,120–165 degrees; Robinson et al., 2010), the planetaryphase function will likely decrease the planet-to-star fluxratio by an order of magnitude from its full-phase value(Robinson et al., 2010) to near 10-8 (Turbet et al., 2016).Since glint could cause up to a 100% increase (i.e., dou-bling) in planet brightness at these phase angles and wave-lengths, the precision of any phase curve measurementsaimed at detecting a glint signature at reasonable SNRs
160 MEADOWS ET AL.

would need to be several times smaller than 10-8. This es-timate puts glint detection firmly outside the range of fea-sibility for JWST, whose systematic noise floor is usuallypredicted to be in the range of 10-5 (Greene et al., 2016).
Direct imaging offers better prospects, as noise floors forthese types of missions or instruments are typically an orderof magnitude below the design contrast for the coronagraphor starshade, which would imply floors near 10-10 to 10-11
for next-generation instruments. Here, the challenge forglint detection on Proxima Centauri b becomes angularseparation—the planet-star separation at a phase angle near150 degrees will be roughly 20 milliarcseconds (mas).Imaging the planet at this separation between the 0.94 and1.1 mm water vapor bands would require an inner workingangle (IWA) of better than 1.5l/D for a 16 m class telescopeor 3l/D for a 30 m class telescope.
4.4. Simulated planetary spectra
To predict the spectral observables of the planets simu-lated in our study, in this section, we present simulated di-rect imaging (Section 4.4.1) and transit transmission spectra(Section 4.4.2). Direct imaging observations will be possiblewith future starlight suppression technologies such as co-ronagraphs and starshades. Proxima Centauri b is not knownto transit (Kipping et al., 2017), but the transit spectra ofour simulated worlds show several key diagnostic featuresthat would help discriminate between habitable and unin-habitable scenarios and are applicable not only to ProximaCen b but also to other terrestrial planets orbiting M dwarfs.
4.4.1. Direct imaging spectra. To anticipate the spectralobservables of Proxima Centauri b in reflected light
FIG. 12. Reflected light spectra of the 10 bar, high-O2 (95%) atmospheres (cloud free) with a surface ocean remaining(top) and completely desiccated (bottom). We define the reflectivity (pI/F) of the planet as the outgoing top of atmosphereflux (pI), where I is the radiance, divided by the stellar flux incident at the top of the atmosphere (F). Note the strong O4
bands present in the UV/VIS/NIR. Both atmospheres were simulated with 0.5% CO2.
PROX CEN B: HABITABILITY AND OBSERVABILITY 161

observations that may become possible with future tele-scopes, we show simulated reflected light spectra generatedwith SMART in this section. In Section 4.6, we presentthese same spectra run through coronagraph noise modelsfor several telescope configurations to predict which fea-tures will be observable with future technology.
4.4.1.1. Direct imaging spectra for high-O2 atmospheres.Figure 12 shows clear-sky reflectance spectra for 10 bar, O2-dominated ‘‘wet’’ and desiccated cases. For the case with asurface ocean remaining, we assumed the second compositealbedo described in Section 3.7.5 (ocean and continents withno vegetation), while we assumed a desert surface for thedesiccated case. The spectra are dominated by O4 bands inthe UV-visible part of the spectrum at 0.345, 0.36, 0.38,0.445, 0.475, 0.53, 0.57, and 0.63mm, and O4 absorptionin the NIR at 1.06 and 1.27 mm (the latter overlaps with the1Dg 1.27 mm O2 band). The case with an ocean includesH2O bands that have been significantly pressure-broadenedby the 10 bar atmosphere. Both scenarios contain signifi-cant UV absorption by O3, O2, and CO. Increased O3 in thedesiccated case produces stronger ozone absorption at0.3 mm. At short wavelengths there is significant Rayleighscattering from the large atmospheric mass seen in clear sky,which enhances the albedo even at relatively long wave-lengths (*1 mm). This increases the contrast of the visibleO4 bands with their surrounding continua. The desiccatedcase is brighter overall at NIR wavelengths due to combi-nation of a higher surface albedo at these wavelengths anda lack of H2O absorption. Unlike the wet case, the desic-cated case shows CO absorption at 2.35 mm that is not ob-scured by deep H2O absorption.
4.4.1.2. Direct imaging spectra for high-CO2 atmo-spheres. Figure 13 shows direct imaging reflectance spectraof desiccated, clear O2-CO2 atmospheres (45% CO2, 45%O2, 10% N2) with surface pressures of 10 and 90 bar atquadrature (half illuminated). In this environment, we as-sume Venus levels of water vapor (*30 ppm), and a desertsurface albedo but no H2SO4 aerosols. The resulting spec-trum is rich in O4 absorption features like Fig. 12 but withadditional strong CO2 absorption throughout the NIR.Rayleigh scattering contributes to a high planetary albedo atwavelengths shorter than 1 mm, but this high albedo is onlyseen in the narrow-continuum regions. The absence of high-altitude aerosols and consequent clear-sky paths createsmuch stronger CO2 absorption than in the simulated Venusspectrum, particularly in the NIR.
Figure 14 shows reflected light spectra of Venus-likeplanets for our 10 bar and 90 bar simulations with an H2SO4
cloud deck. There are prominent CO2 bands—particularlyat 1.5 and 2 mm, with weaker CO2 bands visible near 0.78,0.87, 1.05, and 1.2 mm. Water vapor, present at 32 ppm atthe surface, is observable at 1.35 and 1.85 mm. This unin-habitable planet shows that water in a spectrum is not anunambiguous sign of habitability. An absorption featurefrom the unknown UV absorber (Moroz et al., 1985), whichis responsible for the absorption of most of the incidentsunlight in the upper cloud deck in the Solar System’s Ve-nus (Pollack et al., 1980), is included in our cloud modeland is visible near 0.4 mm. Conspicuously absent are Earth-like absorption features from oxygen, ozone, and methane.
Figure 15 (top panel) shows the reflectance spectrum ofthe case of a desiccated CO2/O2/CO atmosphere in photo-chemical equilibrium (Section 4.2.2.3; Gao et al., 2015). Incalculating the reflectance spectrum, we used the globallyaveraged Mars albedo (Crisp, 1990) to simulate a Mars-likeoxidized surface. No clouds are included because the des-iccation of this atmosphere is almost complete (0.03 ppmH2O). The spectrum contains strong absorption features fromCO2, O2, O3, and CO. The strength of the CO2 and CO fea-tures is notably stronger than for an Earth-like case due to thehigher abundance of these gases and is also stronger than theVenus case due to clear paths through the atmosphere that arenot truncated by sulfuric acid clouds. As noted by Gao et al.(2015), the lack of H2O absorption bands would be an indi-cator that the O2 is unlikely to be from a biological source.
4.4.1.3. Direct imaging spectra for Earth-like atmo-spheres. Figure 15 (middle panel) shows the reflectancespectrum of our photochemically self-consistent modernEarth case using the Earth composite surface spectrum inSection 3.7.5 as our surface spectral albedo. This reflectancespectrum is for a planet with a 50% cloud cover fraction.The composite spectrum is calculated by a weighted averageof 50% clear-sky, 25% cirrus (ice) clouds placed at 8.5 kmaltitude (0.331 bar) with an optical depth of t = 10, and25% stratocumulus (liquid) clouds placed at 1.5 km altitude(0.847 bar) also with t = 10. (The cloud optical propertiesare fixed and provided in Section 3.7.6). This weightedconfiguration has been shown to produce a good approxi-mation of Earth’s disk-averaged spectrum (Robinson et al.,2011). The synthetic spectrum is rich with molecular fea-tures including H2O, O2, O3, CH4, and CO2. These includethe O3 Hartley bands at UV wavelengths <0.38mm and O3
Chappuis bands from *0.5 to 0.7 mm; Rayleigh scattering atblue wavelengths; O2 absorption at 0.63, 0.69, 0.76, and1.27 mm; H2O absorption at 0.65, 0.7, 0.73, 0.8, 0.95, 1.1,1.4, and 1.8–2.0 mm; CH4 absorption at 0.9, 1.08, 1.35–1.41,1.6–1.8, and 2.2–2.4 mm, and CO2 at 1.6 and 2.0 mm. Thespectral slope near 0.7 mm is partly due to the vegetation rededge present in the composite albedo spectrum used asinput to the model. Note that N2O lacks strong absorptionbands at these short wavelengths and CO is not abundantenough to make a spectral impact.
The primary differences between the reflectance spectraof an Earth analog planet orbiting Proxima Centauri b andthe Earth-Sun case are substantially stronger CH4 bands forthe M dwarf planet. For comparison with this case, Fig. 16(top panel) shows a simulated Earth-Sun case with that ofProxima Centauri b. Both spectra have the same surfacefluxes and 50% cloud cover, but the host star’s spectrumchanges the photochemical lifetime of gases in the atmo-sphere, altering its composition and spectral features. Otherdifferences include weaker H2O bands due to a lower sur-face temperature and stronger CO2 bands at 1.6 and 2.0 mmdue to higher CO2 concentrations in the Proxima case.
Figure 15 (bottom panel) shows reflected light spectra ofArchean Earth-like planets with and without organic haze.The haze is a strong blue and UV wavelength absorber,causing the broad and deep decrease in reflectivity forwavelengths shorter than about 0.55 mm. However, despiteits prominence, this feature would be more difficult to detectfor a planet like Proxima Centauri b compared to a planet
162 MEADOWS ET AL.

orbiting the Sun (Section 4.5.2) because the star itself pro-duces little flux at these wavelengths. The haze also pro-duces back-scattering at longer wavelengths, which is thecause of the increase in brightness of the hazy spectrumrelative to the haze-free spectrum at wavelengths longerthan 0.55 mm.
Water, carbon dioxide, and methane all produce absorp-tion bands for wavelengths less than 2.5 mm. Several of theprominent CH4 and H2O bands overlap, including the onesnear 1.15 and 1.4 mm. H2O absorption is present at severalwavelengths including 0.65, 0.7, 0.73, 0.8, 0.95, 1.1, 1.4,and 1.8–2.0 mm; CH4 absorption is present at 0.62, 0.73, 0.8,0.9, 1.08, 1.35–1.41, 1.6–1.8, and 2.2–2.4 mm; CO2 ispresent at 1.6 and 2.0 mm and weakly near 1.25 mm.
4.4.2. Transmission spectra. Although no conclusiveevidence that Proxima Centauri b transits have been found(Kipping et al., 2017), strong planetary evolution driven bythe star’s pre-main sequence phase is likely to be common
for other planets orbiting M dwarfs. We therefore presenttransit transmission spectra of our simulated atmospheres,which may be relevant to transiting habitable zone planetsorbiting other M dwarfs, including the recently discoveredTRAPPIST-1 system (Gillon et al., 2016, 2017) and espe-cially TRAPPIST-1e, which occupies a similar position inits habitable zone to Proxima Centauri b.
Our simulations are intended to demonstrate the size ofthe signal expected for each atmosphere type, which canbe used to determine the required noise floor needed todetect features of interest for terrestrial planets orbiting astar like Proxima Centauri b. For JWST, if the systematicnoise floor at the >10 ppm level proposed by Greene et al.(2016) is verified after launch, then it will be difficult tocharacterize many of the types of planets we simulate forProxima Centauri b (and small planets in general) withJWST, as some of the features we simulate would not bedetectable. However, for similar-sized planets orbitingeven smaller stars, such as for the TRAPPIST-1 system
FIG. 13. Similar to the reflected light spectra of Fig. 12, but for the clear O2-CO2 (45% O2, 45% CO2, 10% N2, 20 ppmH2O) atmospheres with surface pressures of 10 bar (top) and 90 bar (bottom) for comparison with O2-only and Venus cases.
PROX CEN B: HABITABILITY AND OBSERVABILITY 163

(Gillon et al., 2016, 2107) the signals may be even largerthan presented here.
4.4.2.1. Transmission spectra for high-O2 atmospheres.Figure 17 shows the transmission spectra of the modeled10 bar, O2-dominated post-runaway atmospheres for thecases of water remaining and complete desiccation. Thespectra are in general very similar with strong O3 and CO2
features and broad O4 features at 1.06 and 1.27 mm. The NIRO4 bands at 1.06 and 1.27 mm may be observable with theJWST NIRISS15 instrument, which may confirm the exis-tence of an O2-dominated atmosphere (Schwieterman et al.,2016). For the ‘‘wet’’ 10 bar O2 case, the 6.3 mm water bandis present, although water is not seen at shorter wavelengths,and there is significantly less O3 absorption at 0.5–0.7 and
9.7 mm. This is due to the presence of H2O water vapor inthe upper atmosphere. Hydroxyl (OH) radicals sourcedfrom H2O can efficiently remove O3 from the atmosphere(Segura et al., 2005). O3 can build up to higher concen-trations at most altitudes in the desiccated case. The strong0.2–0.3 mm O3 band is sensitive to ozone higher in the at-mosphere and is seen in both the desiccated and wet cases.The presence of both strong absorption in the Chappuisband (0.5–0.7 mm) in conjunction with O4 features in theNIR is indicative of a high-O2, desiccated atmosphere, withO3 also present lower in the atmosphere. Detection of O4
without the Chappuis band suggests lower abundances orabsence of O3 deeper in the atmosphere, which would be thecase if water, and associated O3-destroying OH radicals, arepresent. Weak O4 features are apparent at 0.57 and 0.63 mmfor the ‘‘wet’’ case, which are otherwise overwhelmed bythe Chappuis band.
FIG. 14. Similar to the reflected light spectra of Fig. 12, but for the Venus-like worlds with 10 bar (top) and 90 bar(bottom) CO2 atmospheres. Strong CO2 absorption features are present at several wavelengths. The two spectra are similarbecause the cloud decks in both atmospheres occur at roughly the same pressure, so about the same amount of totalatmosphere is sensed in each spectrum.
15http://www.stsci.edu/jwst/instruments/niriss
164 MEADOWS ET AL.

FIG. 15. Similar to the reflected light spectra of Fig. 12, but for the 1 bar desiccated CO2/O2/CO atmosphere with awavelength-dependent Mars average surface albedo (top panel), preindustrial Earth (middle panel), and Archean Earth(bottom panel). The top panel shows a desiccated planet with an outgassed CO2 atmosphere, which can support a stableCO2/O2/CO/O3 atmosphere without life (Gao et al., 2015). The lack of H2O is an indicator of the abiotic nature of theatmospheric O2. The middle panel shows Proxima Centauri b simulated as an Earth-like planet with 21% O2 and 5% CO2,and 50% cloud cover. The UV to NIR spectrum contains features from Rayleigh scattering, O3, O2, H2O, CO2, and CH4.The bottom panel shows Archean Earth-like planets with a photochemically self-consistent organic haze (orange) andwithout a haze (purple). Note the overlap of some H2O and CH4 absorption bands and the strong haze absorption feature atshort wavelengths. The surface albedo assumes the composite albedo described in Section 3.7.5 with no vegetation.
PROX CEN B: HABITABILITY AND OBSERVABILITY 165

4.4.2.2. Transmission spectra for high-CO2 atmospheres.Figure 18 shows the synthetic transit transmission spec-trum for 10 and 90 bar mixed O2-CO2 atmospheres. Thesespectra are similar to Fig. 17, though additional weakerCO2 bands appear that partially overlap with the 1.06 and1.27 mm O4 bands, which are also weaker because theirdensity has been halved at the refraction limit. There areonly slight differences in the spectra between the 10 and90 bar cases because the portion of the atmosphere probedby transmission is almost entirely above 10 bar pressures,though the atmosphere is optically thick at higher altitudesfor the 90 bar case.
Transit transmission spectra of our 10 bar and 90 bar CO2-rich atmospheres with sulfuric acid cloud decks are shown inFig. 19. The transit transmission spectra of these Venus-like
worlds exhibit flat, featureless spectra at visible wavelengthsreminiscent of similar spectra observed on exoplanets thatlikely have cloud or haze layers of various compositions (e.g.,Knutson et al., 2014; Kreidberg et al., 2014).
As discussed in the work of Ehrenreich et al. (2012), aVenus-like transmission spectrum is dominated by H2SO4
Mie scattering at l < 2.7 mm and by H2SO4 absorption atl > 2.7 mm. Because of this, a broad ‘‘V’’ shape can be seenin the Venus spectrum centered near 2.7 mm, especially inthe 90 bar atmosphere with a thicker cloud deck. An almoststepwise increase in the H2SO4 imaginary refractive index byabout 2 orders of magnitude occurs near 2.7 mm, allowing itsabsorption to dominate at longer wavelengths. This behaviorallows H2SO4 absorption features to be apparent in Venus’transit transmission spectrum at wavelengths longer than
FIG. 16. The effect of the host star’s SED on the planet’s composition and spectrum. For comparison, the Earth orbitingthe Sun (orange) and the photochemically self-consistent Earth orbiting Proxima Centauri (purple) are shown in reflectedlight (top) and in transmission (bottom). For the transmission spectra, the Earth-Sun case is adjusted so that its maximumtangent pressure matches that expected for an Earth-like planet in orbit around Proxima Centauri at Proxima Centauri b’sorbital position. The surface fluxes were kept constant in both cases. These plots illustrate the strong impact of the star’sspectrum on atmospheric photochemistry and composition, and that Earth itself cannot be used to represent a planet withEarth-like surface fluxes orbiting an M dwarf. The primary differences in the spectra are in the NIR and are due todifferences in total methane concentration, which is much higher for Proxima Centauri b. Absorption from O3 is alsosensitive to the host star spectrum, and this is most prominent in the transmission spectrum. Note that differences in thestellar SEDs have been divided out. A cloud cover fraction of 50% is simulated for both cases.
166 MEADOWS ET AL.

2.7 mm, providing a means to directly identify sulfuric acidaerosols in the spectrum of a transiting exoplanet. Spectralfeatures from the sulfuric acid clouds are present near 3, 5.8,8.6, 9.7, and 11.2mm that correspond to peaks in the H2SO4
extinction coefficients. Despite the opacity of Venus-likeH2SO4 clouds, there are also CO2 absorption features visiblenear 2, 2.7, 4.5, and 15 mm. The strongest of these featuresmay be observable at about a 20–30 ppm level.
Figure 20 (top panel) shows the transit transmissionspectrum of a 1 bar CO2/CO/O2 atmosphere assuming verylow hydrogen abundances (*0.03 ppm total H from all H-bearing species). In contrast to other high-CO2 cases, thisspectrum contains significant CO bands at 2.35 and 4.6 mm,
which, together with strong CO2 bands, suggests active CO2
photolysis (Harman et al., 2015; Schwieterman et al., 2016).For this high-CO case, when computing the CO absorptioncoefficients with LBLABC, we specify a wing cutoff of50 cm-1, because LBLABC treats CO wings as Lorentzian,but the extreme wings have been measured to be sub-Lorentzian (Burch and Gryvnak, 1967). Transmission spectraare especially sensitive to line-shape assumptions of strongabsorption bands.
4.4.2.3. Earth-like transmission spectra. Figure 20 (mid-dle panel) shows a simulated transmission spectrum ofthe photochemically self-consistent modern Earth orbiting
FIG. 17. Transmission spectra of the 10 bar, 95% O2 atmospheres with a surface water ocean (purple) and with completedesiccation (orange). The effective radius of the atmosphere (in km) is shown on the left y axis to emphasize the verticalextent of the absorption features, while the transit depth is shown on the right y axis to emphasize the strength anddetectability of spectral features if Proxima Cen b were observed to transit. The contrasts in O3 absorption stem from theextent to which O3 remains abundant deep in the atmosphere, which is ultimately due to the presence or absence of watervapor.
FIG. 18. Similar to the transmission spectra of Fig. 17, but for the O2-CO2 atmospheres with surface pressures of 10 bar(purple) and 90 bar (orange). The two spectra are almost identical except that the pressure at which the atmosphere becomesoptically thick, while the same for both planets, occurs at a higher altitude in the 90 bar case.
PROX CEN B: HABITABILITY AND OBSERVABILITY 167

Proxima Centauri, as described in Section 4.2.3.1. Thesimulated spectrum does not contain clouds and aerosols,although refraction limits altitudes probed to those above*12 km, and the majority of clouds are below this altitudeand so would not affect the spectrum even if they werepresent. Strong, broad features from ozone (0.2–0.3, 0.5–0.7, 4.8, and 9.7 mm), CH4 (0.9, 1.1, 1.4, 2.4, 3.5, 7.5 mm),and CO2 (1.6, 2.0, 2.7, 4.3, and 15 mm) are present. Thewater bands are weak because stratospheric water vaporabundance is low (even though it is significantly higherthan for the Earth-Sun; see Fig. 8). Additionally, H2Obands overlap significantly with CH4, but CH4 abundancesare higher at stratospheric altitudes. This figure panel alsoillustrates the impact of CH4 and H2O on the transmissionspectrum by individually removing their contributions, andprovides additional evidence that the 1.1 and 1.4 mm fea-tures are due to CH4 and not H2O in these transmissionspectra. For comparison, the lower panel of Fig. 16 showsthe differences in the transmission spectra of terrestrialplanets with Earth-like surface fluxes, but with the Sun andProxima Centauri driving their photochemistry. The spec-tra are markedly different, due primarily to the muchstronger absorption from CH4, which has a longer atmo-spheric lifetime under Proxima Centauri’s spectrum (cf.,Segura et al., 2005).
Figure 20 (bottom panel) shows the transit transmissionspectra for Archean-like planets with and without organichaze. Gaseous spectral features become weaker in thepresence of a haze, and the depth probed into the atmo-sphere is reduced. The absorption features near 1mm arepresent at about 15–42 ppm in the haze-free spectrum, and at5–23 ppm in the hazy spectrum. The haze becomes moretransparent at longer wavelengths, so the difference betweenthe hazy and haze-free spectra diminishes as wavelengthincreases. A spectral slope caused by Rayleigh scattering isapparent at wavelengths shorter than 0.5 mm in the clear-skyspectrum. The hazy spectrum exhibits a spectral slope thatcontinues into the NIR, which is caused by wavelength-dependent haze extinction. Features from CH4 (0.62, 0.73,
0.8, 0.9, 1.2, 1.4, 2.4, 3.5, 7.5 mm) and CO2 (2.0, 2.7, 4.3,and 9.5, 10.5, and 15 mm) may be detectable with a missionlike JWST (Arney et al., 2017). A haze absorption featurethat occurs near 6 mm, which overlaps with C2H6 (6.5,12 mm), may also be detectable with the JWST MIRI in-strument (Arney et al., 2017), if the JWST noise floor weresufficiently low to allow these types of measurements.
4.5. Observational considerations for direct imaging
In this section, we describe the types of observations thatmay be possible to make with direct imaging telescopes inthe coming decades. We discuss the challenges of makingthese observations and show simulated spectra of ProximaCentauri b using our direct imaging coronagraph noisemodel in Section 4.5.2.
4.5.1. Inner working angle constraints. Observations ofProxima Centauri b will be constrained by the IWAs ofthe observatories that may come online in the next decades.The IWA defines the angular distance from the center of thefield-of-view within which starlight suppression worsensenough to make planet observations unfeasible. The IWA istypically expressed as nl/D, where n is a small-valuedconstant (here, we assume n = 1–3) and D is the telescopediameter. The diffraction limit, which is the smallest angularseparation a telescope mirror can resolve, is represented byn* 1. The angular separation between Proxima Centauriand planet b is 37 mas, which is the minimum IWA requiredto see this planet at quadrature. Note that to observe theplanet at any other phase a smaller IWA will be required.
Note also that the IWA is wavelength-dependent, so forthe same mirror size, the IWA is larger for a longer wave-length. For a given star-planet separation with a giventelescope diameter, this means that there is a maximumwavelength beyond which the wavelength-dependent IWAis larger than the planet-star separation, meaning that thetarget is effectively unobservable. Table 8 presents long-wavelength cutoffs for IWAs for seven different telescope
FIG. 19. Similar to the transmission spectra of Fig. 17, but for the Venus-like worlds with 90 bar (orange) and 10 bar(purple) CO2 atmospheres. H2SO4 absorption features can be seen at IR wavelengths, and the spectrum is flat at wavelengthsshorter than 1 mm.
168 MEADOWS ET AL.

FIG. 20. Similar to the transmission spectra of Fig. 17, but the top panel is for the heavily H-depleted CO2/O2/COatmosphere in photochemical equilibrium from Section 4.2.2.3 (also see Gao et al., 2015). Note the strong CO bands at 2.35and 4.6 mm compared to other cases. The middle panel shows the photochemically self-consistent modern Earth (black) withpreindustrial biological fluxes of CH4, CO, and N2O orbiting Proxima Centauri b. It also shows Earth’s spectrum with CH4
(orange) and H2O (blue) removed, to show the relative contributions of each to the spectrum. The weak H2O features resultfrom transmission probing higher, drier altitudes down to about 10 km, but water being mostly concentrated in the lowerportion of the troposphere, below *12 km. In addition to their intrinsic weakness, the H2O features are also swamped byCH4 absorption, which also raises the effective tangent height to drier altitudes. The bottom panel shows the Archean Earth-like planets with (orange) and without (purple) organic haze orbiting Proxima Centauri. A haze absorption feature is presentnear 6mm, and haze produces the spectral slope continuing into the NIR for the hazy spectrum.
PROX CEN B: HABITABILITY AND OBSERVABILITY 169

sizes ranging from a 2.4 m telescope such as WFIRST(Spergel et al., 2015) to a 40 m ground-based observatorysuch as the European ELT (39 m). These IWAs make noassumptions about starlight suppression technologies; theyinstead only show the wavelength cutoffs for three potentialIWAs.
The ability to characterize Proxima Centauri b varieswidely with telescope diameter, and Proxima Centauri b isunlikely to be directly imaged with the current generation of8–10 m telescopes. Among the mirror diameters simulatedhere, the best-case scenario is the 40 m ground-based ob-servatory if an IWA*l/D is achievable: this configurationcan reach a wavelength of 7.22 mm. However, observing outto this wavelength is difficult in practice due to the thermalbackground of the sky and telescope (see Section 4.5.2),and constructing a coronagraph with IWA*l/D may inpractice be hindered by technical challenges. However,we think it is valuable to consider what could be observ-able with this most optimistic IWA, and also to considerwhat would be lost if the smallest achievable IWA is largerthan this. Large ground-based telescopes have the potentialto characterize Proxima Centauri b at shorter wavelengthswhere the atmospheric background and transmission aremore favorable. Even without optimistic assumptions aboutthe IWA, a 30 m ground-based telescope can still reach1.8 mm for IWA = 3l/D, and a 40 m ground-based telescopecan reach 2.4 mm for the same IWA. However, these Earth-bound observatories must contend with atmospheric turbu-lence and the limitations of adaptive optics to counteractthis. These adaptive optics systems generally perform betterat longer wavelengths (e.g., Bouchez et al., 2014), where theIWA is not favorable for Proxima Cen b. Nonetheless, theEuropean Extremely Large Telescope (E-ELT)’s first-generation adaptive optics (AO) instrumentation is plannedto function for wavelengths 0.8–2.4 mm16, and the GMT’splanned adaptive optics wavelength range is 1–25mm(Lloyd-Hart et al., 2006). However, the extreme adaptiveoptics (ExAO) required to image exoplanets is currentlyunder development at several sites, with the SCExAO in-strument serving as a test bed on the Subaru telescope(Guyon et al., 2012), the EPICS (ELT-PCS) instrumentbeing developed as part of the planned suite for the E-ELT(Verinaud et al., 2010), and current work on the MagellanTelescope MagAO-2K and MagAO-X systems (Males et al.,
2016), with the goal to deliver Strehl ratios of over 80% near0.67mm and push ExAO into the visible, where the oxygenA band near 0.76mm, for example, could be accessible.
The most optimistic scenario simulated here for space-based telescopes is a 16 m class LUVOIR (Dalcanton et al.,2015) telescope with IWA = l/D, which would provide ac-cess out to 2.89 mm. This could allow measurement of the2 mm CO2 feature, which is the strongest CO2 feature atwavelengths shorter than 4mm and may provide the bestchance of constraining CO2 abundance in Earth-like atmo-spheres that lack strong CO2 bands elsewhere.
For smaller telescopes, a starshade may be advanta-geous, potentially allowing measurement of redder wave-lengths than the IWA spectral cutoffs shown in Table 8. ForWFIRST, the baseline coronagraph design will likely havedramatic throughput losses inside about 2.5 l/D, corre-sponding to 120 mas at V band (Traub et al., 2016), which issignificantly larger than Proxima Cen b’s 37 mas maximumseparation from its star. Thus a starshade, with an IWA lessthan 37 mas, would be required to observe Proxima Cen bwith this mission. Note that an effective IWA better than theprimary mirror’s diffraction limit could be achieved for astarshade-telescope system because most of the starlightnever reaches the primary mirror, so the star’s central pointspread function is strongly suppressed. For a starshade, theIWA can be expressed as IWA = F ·l/R or IWA = (F ·l/z)1/2,where R is the starshade radius, z is the telescope-starshadeseparation, and F is the Fresnel number. A large starshade-telescope separation distance would probably be requiredto observe Proxima Centauri b in the NIR where thereare the strongest absorption bands in the atmospheres wesimulate. For instance, for a given wavelength and IWA,the telescope-starshade separation distance, z, is given byz = F · l/IWA2. To observe out to 1 mm, Fresnel numbersgreater than a factor of a few require starshade-telescopeseparations that are a large fraction of the distance betweenEarth and the Moon. The radius of the starshade scalesas R = F · l/IWA, so Fresnel numbers of a factor of a fewimply a starshade that is tens or hundreds of meters across inorder to reach 1 mm. At a fixed IWA, F/IWA = R/l = con-stant, so the required size of the starshade to reach a givenwavelength scales linearly with l. An additional challengeis that observations with a starshade and a small telescopewould have a large telescopic PSF (on the order of the sizeof the star’s habitable zone) due to the small size of themirror. This is especially problematic given that ProximaCentauri is near the plane of the Milky Way galaxy, so theproblem of background contamination will likely besignificant. A large PSF in a crowded field may make dis-entangling the photons from Proxima Centauri b and back-ground sources difficult.
Due to the small angular separation between ProximaCentauri b and its parent star, it will be important to pushtechnology toward as small an IWA as possible for thebest chance of characterizing this interesting system. Notethat if there are Earth-like worlds orbiting nearby, earlierspectral type M dwarfs, the planet-star angular separa-tions may be more favorable for observing the planet outsidethe IWA.
4.5.2. Coronagraph model simulations. In this section,we show simulated spectra from the previous sections
Table 8. Inner Working Angles for Future
Telescopes and Mission Concepts
Casek
(IWA = 3k/D)k
(IWA = 2k/D)k
(IWA = 1k/D)
Ground (40 m) 2.41 mm 3.61 mm 7.22 mmGround (30 m) 1.80 mm 2.71 mm 5.42 mmLUVOIR (16 m) 0.96 mm 1.44 mm 2.89 mmLUVOIR (10 m) 0.60 mm 0.90 mm 1.81 mmLUVOIR (8 m) 0.48 mm 0.72 mm 1.44 mmHabEx (6.5 m) 0.39 mm 0.59 mm 1.17 mmHabEx (4 m) 0.24 mm 0.36 mm 0.72 mmWFIRST (2.4 m) 0.14 mm 0.21 mm 0.43 mm
16http://www.eso.org/public/teles-instr/e-elt/e-elt-instr/maory
170 MEADOWS ET AL.

convolved with our coronagraph noise model for differenttelescope mirror sizes to illustrate the challenges and op-portunities for observing Proxima Centauri b with possiblefuture observatories. We show simulated observations forthe 10 bar O2 planet with an ocean (Fig. 21), the desiccatedO2 planet (Fig. 22), the Venus-like planet (Fig. 23), thedesiccated CO2/O2/CO planet (Fig. 24), the self-consistentmodern Earth-like planet (Fig. 25), and the hazy ArcheanEarth-like planet (Fig. 26). All the spectra in this section aresimulated with spectral resolution (l/Dl) of R = 70. In thefigures below, we choose an IWA of l/D for our nominalsimulations to show what may be theoretically possible.
However, in our coronagraph noise model figures, we alsoindicate where the 2l/D and 3l/D cutoffs occur. Note thatcoronagraph performance tends to decrease with proximityto the IWA, so larger error bars than shown here would beexpected at wavelengths near the IWA cutoff. Note also, asmentioned in Section 4.5.1, that a starshade could theoreti-cally observe a smaller IWA than the diffraction limit of theprimary mirror and could allow observations to longerwavelengths than shown here.
Figures 21–26 show simulated observations for telescopesizes corresponding to HabEx (6.5 m; top panels), LUVOIR(16 m; middle panels) and a large ground-based observatory
FIG. 21. Simulated coronagraph spectrum (left column) and the SNR in each spectral element (right column) for the10 bar O2-rich planet with an ocean surface using three different future telescope concepts: a 6.5 m HabEx (top row), a 16 mLUVOIR (middle row), and a 30 m ground-based telescope (bottom row). The simulated observations, showing 1s errors,and the SNR calculations assume an integration time of 10 h per nulling bandwidth. Dashed vertical lines are placed atIWA = 1l/D (red), 2l/D (green), and 3l/D (blue) to show the long-wavelength limit for the given telescope diameter andplanet-star angular separation. All spectra are shown for a spectral resolution of R = 70.
PROX CEN B: HABITABILITY AND OBSERVABILITY 171

(30 m; bottom panels). Signal-to-noise calculations assume a20% throughput for a coronagraph and telescope instru-ments. This is an improvement on WFIRST (Robinsonet al., 2016) that could occur with off-axis telescope ar-chitectures or if the coronagraph has fewer reflections.
Direct imaging of terrestrial exoplanets may becomepossible from the ground (e.g., Males et al., 2014; Quanzet al., 2015). For the 30 m ground-based telescope simula-tions, although we include the atmospheric transmittance(Fig. 1), thermal emission from the telescope mirror, andsky brightness, our simulations are optimistic because theydo not include wavelength-dependent performance of adap-tive optics, and they assume that absorption features fromthe planet can be perfectly separated from absorption fea-tures in Earth’s atmosphere. This latter issue will make itdifficult to definitively detect gases in any exoplanet’s at-
mosphere if they overlap with strong telluric features. Thisissue could be resolved by going to very high resolution(e.g., R = 100,000) to disentangle individual planetary spec-tral lines from Earth’s atmosphere’s absorption by using theDoppler shift of the planet’s motion relative to Earth and atemplate-matching technique (Snellen et al., 2015).
The right panels of each figure show the SNR in eachresolution element for an integration time of 10 h. The leftpanels of each figure show the simulated spectrum and er-rors assuming that the planet was observed for 10 h. Toretrieve the abundance of an absorbing gas will requireSNR* 20 at the bottom of the band (Robinson et al., 2016),although we could also assess concentration from the widthof the feature or from combinations of features that appearat different concentrations. As a result, planets with strongoxygen absorption (e.g., Figs. 21 and 22), and consequently
FIG. 22. Similar to the coronagraph simulations of Fig. 21, but for the desiccated 10 bar O2-rich planet.
172 MEADOWS ET AL.

lower planet-star flux contrasts in the oxygen A band, willrequire longer integration times to achieve a SNR of 20 inthat spectral element than a planet with little to no oxygenabsorption (e.g., Fig. 23). In practice, the full visible to NIRspectrum will be constructed from independent exposuresfor each coronagraphic nulling bandwidth, and differentintegration times will be selected for each null based on theexpected contrast at that wavelength. In all simulations,there is poorer signal-to-noise at visible wavelengths com-pared to NIR wavelengths, because the star is dim at visiblewavelengths compared to the NIR. The vertical bars illus-trate the IWA cutoffs corresponding to l/D (red), 2l/D(green), and 3l/D (blue).
For the 30 m ground-based simulations, the thermalbackground from Earth’s surface and atmosphere makesobservations longward of about 2.5 mm difficult at this low
spectral resolution, so IWA = l/D may not actually mean-ingfully increase our ability to characterize Proxima Cen-tauri b compared to a more modest IWA of 2l/D for thistype of observatory. In the optimistic scenario where theatmosphere can be cleanly corrected for, the base of theoxygen A band for the modern Earth analog planet could bedetected with SNR *30 in 10 h. Even if the true observingtime is longer in reality, this short integration time for a veryhigh-confidence detection suggests that such an observationmay be possible for more conservative scenarios.
For a 16 m LUVOIR-class space-based telescope, goodsignal-to-noise is achievable for the entire wavelength rangecaptured by wavelengths shorter than the l/D cutoff exceptfor the shorter visible wavelengths where the host star isdim. The base of the oxygen A band on the modern Earthanalog could be observed at SNR = 20 in *1 h with such an
FIG. 23. Similar to the coronagraph simulations of Fig. 21, but for the 90 bar cloud-covered Venus-like planet.
PROX CEN B: HABITABILITY AND OBSERVABILITY 173

observatory, which is comparable to the 30 m ground-basedobservatory in the moderately turbulent atmospheric con-ditions we simulate. If the IWA was as small as l/D, thiscould theoretically allow observations out to 2.89 mm. Oursimulations assume a mirror temperature of 270 K. Excit-ingly, because the planet is bright relative to its star, thetelescope thermal emission does not swamp the planet signalexcept for wavelengths longer than about 2.5 mm; by com-parison, the signal for an Earth twin orbiting a solar-twinstar at 10 pc is swamped by telescope thermal emission forwavelengths longer than about 1.8 mm except when ob-serving with very long integration times on the order ofhundreds or thousands of hours. Because the current work-ing design of the LUVOIR NIR detector cuts off at 2.5 mm(M. Bolcar, personal communication), the entire availabledetector range could obtain useful data from Proxima
Centauri b for large telescopes if this optimistic IWA of l/Dcould be achieved. This would, for example, allow access tothe strong CO2 band near 2 mm to help constrain the effi-ciency of Proxima Centauri b’s greenhouse and its atmo-spheric redox state. On the other hand, if an IWA of only 2l/D is possible, this would still allow access to wavelengths<1.44 mm. If an IWA of only 3l/D is possible, a 16 m LU-VOIR telescope could observe out to 0.96 mm. This wouldstill allow access to the oxygen A band, but a large fractionof this wavelength range would occur at wavelengths wherethe star is dim and the spectrum lacks strong absorptionfeatures.
Observing Proxima Centauri b is naturally more difficult,but still possible, with a smaller telescope like the HabExconcept. A 6.5 m HabEx telescope could observe the deepestpart of the oxygen A band in the habitable Earth-like
FIG. 24. Similar to the coronagraph simulations of Fig. 21, but for the desiccated CO2/O2/CO planet.
174 MEADOWS ET AL.

planetary cases at SNR = 20 in over 10 h. However, theoxygen A band is not accessible with a 6.5 m telescope ifthe IWA achievable is not better than 2l/D, which cuts offthe spectrum longward of 0.59 mm. On the other hand, ifHabEx were to fly with a starshade, this could make it pos-sible to observe a smaller IWA and achieve a wider coverageof wavelength space. However, the ability to discriminate thelight of the planet from background sources will still behampered by the PSF of the smaller mirror, and integrationtimes will be longer compared to a larger mirror.
The exposure time necessary to achieve a given signal-to-noise for the flux in the bottom of a band is distinct from theexposure time needed to detect that band itself. As noted inRobinson et al. (2016), for shallow bands, it is relativelysimple to measure the flux at the bottom of the band, but it is
more difficult to measure the drop in flux due to the bandrelative to the continuum. Conversely, for strong absorptionfeatures, a precise measurement of the bottom-of-band fluxmay be quite difficult compared to a determination that thereis an absorption band at that wavelength.
For atmospheres with high O2 abundances, the 0.76 mmoxygen A band will be extremely strong and amenable todetection. Following Robinson et al. (2016; Eq. 7), wecalculate the exposure time necessary to detect the oxygenA band with a SNR of 5. We find that the oxygen A bandcan be detected in all the high O2 atmospheres (Figs. 21, 22,24) with approximately 1 min exposures for the 16 m LU-VOIR and 30 m concepts, while the 6.5 m HabEx conceptwould require up to 30 min (if the stringent IWA constraintis met). Detecting the oxygen A band for the habitable
FIG. 25. Similar to the coronagraph simulations of Fig. 21, but for the photochemically self-consistent modern Earth-likeplanet.
PROX CEN B: HABITABILITY AND OBSERVABILITY 175

Earth-like case would require approximately 1 h with the6.5 m HabEx concept and approximately 3 min with both the16 m LUVOIR concept and the 30 m ground-based concept.The Archean Earth-like and the Venus-like cases do notcontain sufficient oxygen to exhibit detectable oxygen ab-sorption features. Despite having a mirror nearly twicethe diameter, the 30 m ground-based telescope and the 16 mLUVOIR concept have comparable performance in the vis-ible due to the sky brightness faced by the ground-basedmeasurements. The advantage of the space-based telescopeis further increased beyond 1 mm.
The specific values for the telescope and instrument pa-rameters used here represent notional LUVOIR and HabExparameters and should be considered preliminary, as thesetelescope designs are still under early study. Therefore, theintegration times and SNR calculations presented here
should likewise be understood as notional estimates pendingchanges to the telescope designs studied by their respectiveScience and Technology Definition Teams.
4.6. What might Proxima b look like to the human eye?
In addition to all our spectral simulations, we used thePython package ColorPy17 to visualize the apparent visualcolor of the range of possible atmospheric states for ProximaCentauri b examined here. ColorPy uses the 1931 Com-mission Internationale de l’Eclairage (CIE) color matchingfunctions (Smith and Guild, 1931) to calculate the appar-ent, human-perceived color from an intensity spectrum. We
FIG. 26. Similar to the coronagraph simulations of Fig. 21, but for the hazy Archean Earth-like planet.
17ªMark Kness: http://markkness.net/colorpy/ColorPy.html
176 MEADOWS ET AL.

modified ColorPy to take our top-of-atmosphere planetaryspectra (Section 4.4) as inputs for these color calculations.Figure 27 shows the visual spectra (380–720 nm) and cal-culated colors for the star, Proxima Centauri, and ourmodern Earth-like case with 50% cloud cover, Archean(early) Earth, O2-dominated, and Venus-like scenarios. Forthe O2-dominated cases with substantial (10 bar) atmo-spheres, the blue color reflectivity enhancement overwhelms
the redness of the star in the human visual range, resulting ingreen planets. The modern Earth case appears yellow be-cause Rayleigh scattering and ocean reflection enhance theblue, but reflection by continents and clouds enhances re-flection of red light. The haze-covered Archean Earth andthe Venus-like cases are redder than modern Earth: both ofthese planets have blue wavelength absorbers in their at-mospheres and appear orange. Therefore, for plausible sets
FIG. 27. Optical spectra and the corresponding colors that the human eye would perceive for Proxima Centauri and five ofour simulated planetary states. From upper left to lower right: the M5.5V red dwarf star Proxima Centauri, Earth-like withno clouds, hazy Archean with no clouds, O2-dominated with an ocean, desiccated O2-dominated, and cloudy Venus-like.The background of each plot is colored as it would appear to the human eye. The shaded area under the curve represents theindividual color of each wavelength at the simulated spectral resolution. Each planetary spectrum represents a convolutionof the stellar spectrum with the planetary albedo, which is dictated by the planet’s surface and atmospheric composition.Furthermore, each perceived color represents a convolution of the planetary spectrum with the human eye.
PROX CEN B: HABITABILITY AND OBSERVABILITY 177

of both habitable and uninhabitable atmosphere states,Proxima Centauri b might appear as a pale green, pale yel-low, or pale orange dot.
5. Discussion
The discovery of Proxima Cen b provides a truly re-markable opportunity to learn about the evolution of ter-restrial planets orbiting M dwarfs, as well informing ourunderstanding of the range of habitable environments in theUniverse. However, although it sits in the habitable zone,which confers a higher probability of being able to sup-port liquid water on its surface, the evolution of the starand planet can work to maintain or destroy habitability forProxima Cen b (Barnes et al., 2018; Ribas et al., 2016).Consequently, even though Proxima Cen b has the advan-tages of size and current position in the habitable zone, itshabitability is by no means certain and will depend stronglyon the evolutionary path taken by the planet and its currentinteraction with its parent star. Our study has simulatedseveral possible planetary states for Proxima Centauri b thatshow both habitable and uninhabitable environments.
5.1. The habitability of Proxima Centauri b
We find that Proxima Cen b inspires three fundamentalscientific questions: What are the evolutionary paths forProxima Cen b and for terrestrial planets around other late-type M dwarfs? Is Proxima Cen b currently habitable? Howcan we best discriminate between possible environmentalstates for Proxima Cen b and for other M dwarf planets?
The first question was explored in detail in our companionpaper by Barnes et al. (2018), which shows that despite theplanet’s location in its star’s habitable zone, this world maynot be water-rich, or habitable. The star’s luminous pre-main sequence phase represents the biggest barrier to theplanet’s habitability, and if the planet formed in situ, it mayhave been desiccated early in its history. However, if theplanet retained some of its initial water inventory or mi-grated to its current orbit from the outer planetary systemafter the pre-main sequence phase, it may yet be hospitable tolife. As formulated here, we identified planetary environmen-tal states that spanned the post-runaway, oxygen-dominatedworlds of Luger and Barnes (2015) through terrestrialplanet evolution that would lose or sequester the O2, in-crease atmospheric CO2 from geological processes, andprogressively desiccate the planet. Habitable scenarios arealso possible, especially if H2 envelopes protect terrestrialplanets that formed in situ, or volatile-rich bodies migrate infrom beyond the snowline (Luger et al., 2015). We notehowever that although these scenarios are representative,they are still likely to be a small sample of the possibleconfigurations for M dwarf planet environments.
But is Proxima Centauri b currently habitable? To start toaddress that question, our climate-photochemical modelingof the possible end-state atmospheres for the evolutionarypaths shows environmental states (Table 7) ranging fromuninhabitable due to water loss and/or surface temperaturesthat are too high or low, to worlds that could support liquidwater. The uninhabitable planet environments for ProximaCen b include the desiccated, 10 bar high-O2 planet with0.5% CO2, which has a globally averaged surface temper-ature of only 256 K and so would be cold and dry. Other
uninhabitable planets fell into the hot and dry category, withthe evolved, desiccated O2/CO2 atmospheres exhibitingsurface temperatures of 383–569 K. The Venus-like planets,with a larger atmospheric CO2 fraction and pressures up to90 bar, also showed extremely high surface temperatures of385–654 K at Proxima Centauri b’s position within itshabitable zone. These results highlight the considerableimpact of planetary evolution and atmospheric compositionon habitability, even for planets in the habitable zone. Forthe desiccated (<1 ppm H) atmospheres that initially have1 bar of CO2, but then photochemically produce O2 and CO,which remain stable in their desiccated atmosphere, a tem-perature of 254 K was obtained. This extremely desiccatedplanet would not be habitable due to its lack of water andcold conditions. In this case it is interesting to note that thephotochemical destruction of CO2 had a significant impacton the planetary climate. Because of the importance ofgreenhouse gas abundance for the final climate state, futurework should concentrate on understanding the likely out-gassing history and plausible atmospheric compositions forterrestrial exoplanets.
The habitable planetary states were also quite varied. Ifthe runaway process halts before all the planetary waterinventory is lost, then even a 10 bar O2 planet with 0.5%CO2 and an ocean exhibits a globally averaged surfacetemperature of 320 K, primarily due to the greenhouse effectof the atmospheric water vapor. This is significantly warmerthan Earth’s current 288 K globally averaged surface tem-perature, but still potentially habitable. However, it is de-batable whether life could start on this planet, as the stronglyoxidizing atmosphere would be challenging for the stabilityof the organic molecules required for the origin of life. Wealso considered more Earth-like cases, including a modernbut photochemically self-consistent Earth-like planet whoseatmospheric composition is consistent with the UV radiationfrom the parent star. The star’s UV spectrum resulted inlonger lifetimes for, and a buildup of, greenhouse gases suchas CH4 and N2O, as was previously seen by Segura et al.(2005). This emphasizes the need for both photochemicalmodels and knowledge of the UV spectrum of the host starwhen trying to model and interpret information on the en-vironments of planets orbiting M dwarfs. For this simulatedenvironment we can obtain cold but habitable surface con-ditions (273 K) for CO2 abundances near 5%, with likelyopen ocean fractions in this case (Charnay et al., 2013;Shields et al., 2013). For the Archean Earth analogue, 5%CO2 was also specified, but the higher methane fractionresulted in a warmer surface temperature of 278 K in thehaze-free case with 1% CH4, and when CH4 was increasedto 1.5% a haze formed but only modestly cooled the planetto 277 K because hydrocarbon hazes are relatively trans-parent at the longer wavelengths emitted by late-type Mdwarfs (Arney et al., 2017).
Our climate models are 1-D and produce globally aver-aged results that are most relevant to Proxima Centauri bif the planet is found to be in an asynchronous 3:2 spin-orbit resonance. Since Proxima Cen b’s eccentricity is onlyobservationally constrained to be <0.35 (Anglada-Escudeet al., 2016), we cannot discriminate between a circularorbit with a likely synchronous rotational state and an ec-centric orbit with a likely asynchronous rotational state.However, it is interesting to discuss under what conditions
178 MEADOWS ET AL.

the asynchronous state is likely for Proxima Centauri b andthe consequences to our atmospheric results if the rotationstate is not asynchronous. If Proxima Cen b is the onlyplanet in its system, then synchronous rotation may belikely, although the eccentricity data do not rule out asyn-chronous rotation. While tidal damping of the planetary spinis likely rapid, and for this nominally *5-billion-year-oldsystem would result in tidal circularization (Barnes et al.,2018; Ribas et al., 2016), Ribas et al. (2016) also found asignificant probability that the planet is in a 3:2 spin-orbitresonance, especially if the planet’s eccentricity is >0.1,agreeing with similar results by Rodrıguez et al. (2012).There are several mechanisms that would produce a nonzeroeccentricity for Proxima Cen b today, including a recentclose encounter between Proxima Centauri and a Centauri Aand B. However Kepler statistics suggest that at least half ofM dwarf systems contain five or more closely packed, co-planar planets (Ballard and Johnson, 2016), and compactplanetary systems may be marginally stable, with instabilitiesthat may produce eccentric orbits occurring billions of yearsafter formation (Volk and Gladman, 2015; Ballard andJohnson, 2016). This may result in apparent (to transit) single-planet systems that are the result of a close-packing insta-bility, at least some of the time (Ballard and Johnson, 2016).In both scenarios, other, as yet undetected, planets in theProxima Cen system could potentially induce significant ec-centricities in Proxima Cen b’s orbit, which could makecapture into the 3:2 resonance much more likely. Barnes et al.(2018) also show that if a currently undetectable companionplanet exists in the Proxima Centauri system, such as theputative planet with an orbital period near 200 days (Anglada-Escude et al., 2016), it could drive an eccentricity in ProximaCen b’s orbit that could be maintained at e > 0.1, even after 7billion years, and force the planet into supersynchronous ro-tation (Barnes et al., 2018). Clearly, observations and im-proved constraints on the current orbit of Proxima Cen b, andthe presence and orbital parameters of any companions, areextremely important for our understanding of Proxima Cenb’s current orbital state and climate.
However, even if Proxima Centauri b were synchronouslyrotating, 3-D GCMs of terrestrial exoplanets now routinelyshow that atmospheric rotation can transfer heat from thedayside to nightside of the planet, and habitable conditionsare possible for planets with as little CO2 as 1 ppm near theinner edge (Kopparapu et al., 2016). Additionally, while 3-D GCMs suggest that reflective clouds could form across thesubstellar hemisphere of slowly rotating planets and coolthem, this effect is likely ameliorated for Proxima Cen b. IfProxima Cen b is synchronously rotating, its relatively short11-day period could result in some of the substellar clouddeck being advected to the antistellar side of the planet. Thisprocess would thin and reduce cloud coverage on the day-side and thereby warm the planet by dropping the daysidealbedo from that expected from complete cloud coverage(Yang et al., 2014; Kopparapu et al., 2016). This effectwould be even more pronounced if the planet was in a 3:2spin-orbit resonance with a rotational period close to 7 days,when the reduction in dayside cloud cover due to zonalbanding could be larger (Kopparapu et al., 2016).
Atmospheric collapse is another aspect of synchronousrotation that could strongly impact planetary surface tem-perature and habitability. If the planet is synchronously ro-
tating, the probability that there are significant day-nightcontrasts—and atmospheric collapse—is strongly dependenton the atmospheric mass, composition, and the presence ofan ocean. Turbet et al. (2016) using the LMDz 3-D GCM,for synchronous rotators, showed that one Earth ocean ofwater is enough to avoid atmospheric collapse for all CO2
partial pressures above 0.1 bar without a background gas,and 0.01 bar of CO2 with a background gas such as N2 or O2
(their Fig. 1). This is also assuming no ocean heat transport,which would work to equalize day-night temperatures.Three-dimensional modeling work by Hu and Yang (2014)demonstrated that when dynamic ocean heat transport isconsidered, this process can raise the minimum temperatureof the planet when compared to a nondynamic ocean, furtherprotecting the atmosphere from collapse and leading todeglaciation on the nightside. For the case of desiccatedworlds, Turbet et al.’s 3-D GCM modeling shows that forocean-free synchronously rotating worlds, 1 bar of CO2 isunstable and collapses; but despite large day-night temper-ature contrasts (<*75 K), 4 bar of CO2 does not collapse. Sothe true atmospheric CO2 mass required to prevent collapseis probably between 1 and 4 bar. Six bar of CO2 is sufficientto provide for a world entirely above freezing.
Based on these 3-D GCM results of Turbet et al. (2016),our simulated atmospheres are all likely robust against at-mospheric collapse if Proxima Cen b is asynchronouslyrotating, and most will also avoid collapse even in syn-chronously rotating situations. Specifically, our 10 and 90 barCO2-dominated Venus-like planets and evolved CO2/O2
atmospheres (containing 4.5 and 40 bar of CO2) are stableagainst collapse for synchronous rotation. Our modern andArchean Earth-like worlds have oceans and 1 bar N2-dominated atmospheres with 5% CO2 (so 0.05 bar CO2,which is greater than the 0.01 bar CO2 limit with back-ground gas) and so based on the results of Turbet et al.(2016) are also stable against collapse even if synchronouslyrotating. In other words, a synchronously rotating planetwith an Earth-like, N2-dominated atmosphere would need25 times Earth’s current CO2 abundance to avoid collapse.Less CO2 may be required to avoid collapse if there is strongocean heat transport between the day-night hemispheres (Huand Yang, 2014). Similarly, our O2-dominated planets withremnant ocean were given the same amount of CO2 forcomparison with the Earth-like cases and have 0.5% CO2 ina 10 bar atmosphere, and so 0.05 bar of CO2 overall, with anocean, and so are safe from collapse.
However, our desiccated 1 bar CO2/O2 atmosphere andthe 10 bar O2-dominated (0.05 bar CO2) desiccated cases aremore susceptible to collapse, but this it is not conclusive andwould require further modeling to explore. In the 1 bar case,we have 0.5 bar of CO2, and Turbet et al. (2016) showedregions of CO2 condensation for a 1 bar synchronously ro-tating CO2 planet. However, an atmosphere with 0.5 bar ofCO2 is more robust to condensation and according to theClausius-Clapeyron relation will not condense unless theminimum temperature falls below 187 K at the surface,and our atmosphere has an average temperature of 254 K.However, carbon dioxide may begin to condense if parts ofthe surface drop below 187 K. Again, this would only applyto the synchronously rotating case. In the case of the 10 barO2 planet, with 0.05 bar of CO2, and a background gas,condensation would occur at 164 K, and we find an average
PROX CEN B: HABITABILITY AND OBSERVABILITY 179

surface T of 256 K. We cannot state categorically that theseatmospheres would collapse, but it may be possible, al-though the reduction in condensation temperature with thereduction in partial pressure of CO2 would need to bemodeled to give a more conclusive answer. Turbet et al.(2016) show that all the comparable asynchronous cases aresafe from collapse. So if Proxima Cen b was synchronouslyrotating, these thinner, desiccated atmospheres may be indanger. However, if the planet is asynchronously rotating,these atmospheres would be likely to survive.
So, how should we best use observations to discriminatebetween these possible environmental states, not only forProxima Cen b but for other M dwarf planets as well? Thepost-runaway O2-dominated worlds are best discriminatedby the presence of strong O4 bands in the visible and NIRfor direct imaging, and in the NIR for transmission. Sincethe atmosphere is strongly oxidizing, and if desiccation hasoccurred, the presence of aerosols other than dust may beunlikely, making the planet quite bright in the Rayleighscattering tail. The desiccated case also shows strong ozoneabsorption because the HOx products that would destroy itare not present. Water may also be detected in direct im-aging, in the case where some of the remnant ocean is re-tained, but the strong O4 would sound a warning that the O2
was most likely formed post-runaway and not from a pho-tosynthetic biosphere (Schwieterman et al., 2016). As theplanet evolves to also include abundant CO2 in addition tothe O2, strong CO2 bands are seen in both the direct imagingand transmission spectra. Venus-like worlds are dominatedby CO2 features, especially near 1.5 and 2.0 microns, al-though weaker bands can also be seen even into the visibleat 0.78, 0.87, 1.05, and 1.2 microns. In our simulations, weakwater vapor was also seen in the spectrum, because thereis still water above the cloud deck. In the real venusianatmosphere, there is 6 ppm above the cloud tops on thenightside (Schofield et al., 1982). These planets were alsoable to form sulfuric acid hazes that increase the planetaryalbedo and can be spectrally identified by NIR absorptionfeatures that may visible in transit transmission spectra(Figs. 14 and 19). The presence of an H2SO4 haze may alsoimply active volcanism on an exoplanet and may hint at in-ternal or tidal energy driving volcanic activity. The amountof SO2 in the venusian atmosphere required to maintain thesulfuric acid cloud deck has been estimated to be in excessof equilibrated conditions by a factor of 100, implying asource within the past 20 million years (Bullock and Grin-spoon, 2001) or possibly within 2 million years (Fegley andPrinn, 1989). Detection of H2SO4 would therefore likely bea sign of some level of geological activity. For the highlydesiccated, photochemically stable CO2/CO/O2 atmospheres,no H2O would be detectable, but CO2 and CO would beprominent at 2.35 mm, and O4 would be absent. The strongCO2 and CO would also be a useful indication that the O2
in the atmosphere was likely not biologically produced(Schwieterman et al., 2016).
For the habitable planets, water dominates the simulateddirect imaging spectra, with strong bands starting at 0.95 mmand continuing through the NIR. O2 is also seen, but O4 isnot significant. The other strong discriminant in these casesis the presence of CH4, which is not seen in the stronglyoxidizing, post-runaway terrestrial atmospheres. CH4 hasits strongest bands in the NIR, and interestingly, water ab-
sorption features frequently overlap with stronger methanebands. Figures 16 and 20 show how the strong NIR waterfeatures at 1.15 and 1.4 mm overlap with methane features.This is particularly problematic given that the UV spectrumof the parent M5.5V star drives the significant photochem-ical accumulation of CH4 in the atmosphere of even themodern Earth. In transmission, water is not readily seen forthese habitable planets. This is largely due to the fact thathabitable planets have cold traps that keep water in thetroposphere and desiccate the stratosphere. Due to the ef-fects of refraction and opacity (e.g., Misra et al., 2014b),transmission observations predominantly probe the strato-sphere of habitable terrestrial planets where water is scarce.Strong water vapor bands in a transit transmission spectrumwould indicate a planet with a wet stratosphere, which mayindicate a planet undergoing a moist or runaway green-house. Additionally, the photochemically favored buildup ofCH4 works to ‘‘cover’’ the weak stratospheric water signalspectrally and also provides additional opacity to make itmore difficult to see into the troposphere. In direct imaging,water vapor can still be seen due to the more direct line ofsight, potentially to the planetary surface. Quantifying waterand methane abundances in these types of atmosphereswithout degeneracy will require access to ‘‘clean’’ methaneand water bands that do not overlap. The water band near0.95mm is relatively clean, as is the methane band near 1.7mm.
5.2. Potential for future observations
Because Proxima Cen b is so close to Earth, it offers usthe unprecedented opportunity to characterize a potentiallyterrestrial exoplanet that orbits within its star’s habitablezone. The proximity of this target offers obvious majoradvantages, including shorter integration times and a largerIWA relative to more distant planets orbiting M dwarfs—but there are still difficulties.
Because Proxima Cen b orbits so close to its dim hoststar, the angular separation between it and its star is only 37mas at maximum elongation. This narrow separation meansthat to be able to directly image this target out to longerwavelengths, larger telescope apertures are favored to over-come IWA limitations, and they can shorten the requiredintegration times to obtain a good signal relative to smallertelescopes. However, although the angular separation ischallenging, for direct imaging Proxima Centauri b providesa relatively high contrast (planet-to-star flux ratio) of tens ofparts per billion for a planet with Earth-like brightness or-biting a star significantly fainter than the Sun. This makesProxima b nearly 100 times more favorable to observe di-rectly than an Earth-Sun analog system, even before con-sidering the advantage of its proximity to our solar system.Large ground-based telescopes may be able to measure theplanet’s spectrum with the aid of coronagraphy and adaptiveoptics, but the thermal signature from the telescope andatmosphere will make ground-based direct imaging obser-vations more challenging at wavelengths longer than about2.5 mm. However, the wavelengths between 1 and 2.5 mmare still extremely useful for atmospheric characterizationdue to absorption signatures from potentially diagnosticgases, including CO2 and CH4.
Since it is unlikely that Proxima Cen b transits (Kippinget al., 2017), one of the most promising observations
180 MEADOWS ET AL.

achievable in the near-term will be thermal phase curvesof Proxima Centauri b taken with JWST. The size of anyday-night temperature contrasts observed may reveal thepresence of an atmosphere. Larger day-night temperaturedifferences indicate poor heat transport, with smaller tem-perature differences expected for denser atmospheres (Ste-venson et al., 2014; Cowan et al., 2015). Because ProximaCentauri b is probably nontransiting, detecting an atmo-sphere will likely require phase-resolved photometry (e.g.,Knutson et al., 2007) or high-dispersion spectroscopy (e.g.,Brogi et al., 2013, 2014). Thermal phase curves with JWSTmay provide our first opportunity to probe the atmosphericcomposition of Proxima Centauri b. Luger et al. (2017)proposed to leverage the stellar activity and flaring to ouradvantage and look for sharp oxygen auroral emission fromthe planetary atmosphere. However, these observationswould require the use of high-spectral-resolution, high-contrast coronagraphy, which is still many years away. Themost promising effort in that regard may be the coupling ofhigh-resolution imaging and spectroscopy on ground-basedtelescopes over the 0.6–0.78 mm visible range, which may beachievable over the next 5 years on the Very Large Tele-scope (Lovis et al., 2017). Kreidberg and Loeb (2016) in-vestigated the detectability of ozone at 9.8 mm with theLRS mounted on JWST/MIRI. Although an ozone detectionwould be a significant step forward in exoplanet atmosphericcharacterization, ozone is not an unambiguous biosignature,as it is predicted to accompany abiotically produced O2 viaphotochemistry during the super luminous pre-main se-quence phase. Detecting ocean glint would also be extremelydiagnostic for surface water, but is beyond the capabilities ofJWST for Proxima Cen b. Ocean detection will need to waitfor a larger-aperture space-based coronagraph or starshademission, or possibly a large-aperture ground-based telescopewith coronagraphic capabilities.
To understand Proxima Cen b’s atmosphere, it will alsobe important to thoroughly characterize its host star.Through photochemical reactions, the star’s UV SED canchange the atmospheric state of Proxima Cen b sufficientlyto distinguish it from an analog planet orbiting the Sun(Section 4.2.3.1). As discussed above, methane builds up toconsiderably higher amounts detectable in the spectrum of amodern Earth analog planet around Proxima Centauri, butthis does not occur around a solar-type star. To study an-ticipated effects such as this, it is critical to examine po-tential atmospheres of this planet by using photochemicalmodels with the correct stellar parameters for ProximaCentauri. Additionally, Proxima Centauri is an active star,and our study here has not examined the impact of stellarflares on planet b’s atmosphere and photochemistry. Futurework will examine the impact of flares on the photochem-istry, habitability, surface environment, and detectability ofspectroscopic signatures.
6. Conclusions
Proxima Cen b provides an exciting opportunity to learnabout the evolution of terrestrial planets orbiting M dwarfsand the nature and extent of habitable environments in theUniverse. However, we find that its evolutionary history andcurrent volatile inventory will strongly impact its habit-ability, even though it resides in the habitable zone. We used
coupled climate-photochemistry models to simulate severalplausible states for the current environment of Proxima Cenb, for possible scenarios driven by dynamical and stellarevolution. We find several post-runaway states that are un-inhabitable either due to extreme water loss or inclementsurface temperatures. In particular, a dense Venus-like CO2
atmosphere will result in extremely high surface tempera-tures at Proxima Cen’s current semimajor axis. However,several evolutionary scenarios may lead to possibly habit-able planetary environments, including O2-rich atmospheresthat retain a remnant ocean after extreme water loss, andother, more Earth-like scenarios. These later scenarios in-clude a possible terrestrial planet or volatile-rich corehaving been protected against the bright early star by ahydrogen envelope, or the late migration via orbital in-stabilities of a terrestrial world from exterior to the habitablezone. In these more Earth-like cases, only modest amountsof carbon dioxide (0.05 bar) or methane (0.01–0.03 bar) arerequired to warm the planetary surface. These differentscenarios can be discriminated between using observationsof thermal phase curves, ocean glint, and spectroscopic di-agnostics including O2, O3, O4, CO, CO2, H2O, and CH4, allof which absorb in the 0.3–2.5 mm region. Further infor-mation on its planetary characteristics will provide a crucialopportunity for comparative planetology—by broadeningour understanding of how terrestrial planetary evolution andprocesses that operate in our own solar system may be im-pacted by a very different host star. Upcoming observationswith large ground- and space-based telescopes may helpilluminate the intriguing environment of our nearest exo-planetary neighbor.
Acknowledgments
We thank Guillem Anglada-Escude and his team forsharing their discovery results with us. We are grateful totwo anonymous referees whose thoughtful, thorough re-views helped us significantly improve the paper. This workwas supported by the NASA Astrobiology Institute’s VirtualPlanetary Laboratory Lead Team, funded through the NASAAstrobiology Institute under solicitation NNH12ZDA002Cand Cooperative Agreement Number NNA13AA93A. Thiswork was facilitated through the use of advanced compu-tational, storage, and networking infrastructure provided bythe Hyak supercomputer system at the University of Wa-shington. E.W. Schwieterman is grateful for support fromthe NASA Postdoctoral Program, administered by the Uni-versities Space Research Association. T. Robinson grate-fully acknowledges support from NASA through the SaganFellowship Program executed by the NASA ExoplanetScience Institute. D.P. Fleming is supported by an NSFIGERT DGE-1258485 fellowship.
Author Disclosure Statement
No competing financial interests exist.
References
Airapetian, V.S., Glocer, A., Khazanov, G.V., Loyd, R.O.P.,France, K., Sojka, J., Danchi, W.C., and Liemohn, M.W.(2017) How hospitable are space weather affected habitablezones? The role of ion escape. Astrophys J 836:L3.
PROX CEN B: HABITABILITY AND OBSERVABILITY 181

Albarede, F. (2009) Volatile accretion history of the terrestrialplanets and dynamic implications. Nature 461:1227–1233.
Anglada-Escude, G., Amado, P.J., Barnes, J., Berdinas, Z.M.,Butler, R.P., Coleman, G.A., de la Cueva, I., Dreizler, S.,Endl, M., Giesers, B. Jeffers, S.V., Jenkins, J.S., Jones, H.R.,Kiraga, M., Kurster, M., Lopez-Gonzalez, M.J., Marvin, C.J.,Morales, N., Morin, J., Nelson, R.P., Oritz, J.L., Ofir, A.,Paardekooper, S.-J., Reiners, A., Rodrıguez, E., Rodrıguez-Lopez, C., Sarmiento, L.F., Strachan, J.P., Tsapras, Y.,Tuomi, M., and Zechmeister, M. (2016) A terrestrial planetcandidate in a temperate orbit around Proxima Centauri.Nature 536:437–440.
Armstrong, J.C., Barnes, R., Domagal-Goldman, S., Breiner, J.,Quinn, T.R., and Meadows, V.S. (2014) Effects of extremeobliquity variations on the habitability of exoplanets. Astro-biology 14:277–291.
Arney, G., Meadows, V., Crisp, D., Schmidt, S.J., Bailey, J.,and Robinson, T. (2014) Spatially resolved measurements ofH2O, HCl, CO, OCS, SO2, cloud opacity, and acid concen-tration in the Venus near-infrared spectral windows. J Geo-phys Res: Planets 119:1860–1891.
Arney, G., Domagal-Goldman, S.D., Meadows, V.S., Wolf, E.T.,Schwieterman, E., Charnay, B., Claire, M., Hebrard, E., andTrainer, M.G. (2016) The pale orange dot: the spectrum andhabitability of hazy Archean Earth. Astrobiology 16:873–899.
Arney, G.N., Meadows, V.S., Domagal-Goldman, S.D., Dem-ing, D., Robinson, T.D., Tovar, G., Wolf, E.T., and Schwie-terman, E. (2017) Pale orange dots: the impact of organichaze on the habitability and detectability of Earthlike exo-planets. Astrophys J 836, doi:10.3847/1538-4357/836/1/49.
Arnold, L., Gillet, S., Lardiere O., Riaud, P., and Schneider, J.(2002) A test for the search for life on extrasolar planets:looking for the terrestrial vegetation signature in the Earth-shine spectrum. Astron Astrophys 392:231–237.
Baldridge, A.M., Hook, S.J., Grove, C.I., and Rivera, G. (2009)The ASTER spectral library version 2.0. Remote Sens En-viron 113:711–715.
Ballard, S. and Johnson, J.A. (2016) The Kepler dichotomyamong the M dwarfs: half of systems contain five or morecoplanar planets. Astrophys J 816, doi:10.3847/0004-637X/816/2/66.
Baraffe, I., Chabrier, G., Allard, F., and Hauschildt, P.H. (1998)Evolutionary models for solar metallicity low-mass stars:mass-magnitude relationships and color-magnitude diagrams.Astron Astrophys 337:403–412.
Baraffe, I., Homeier, D., Allard, F., and Chabrier, G. (2015)New evolutionary models for pre-main sequence and mainsequence low-mass stars down to the hydrogen-burning limit.Astron Astrophys 577:A42.
Baranov, Y.I., Lafferty, W.J., and Fraser, G.T. (2004) Infraredspectrum of the continuum and dimer absorption in the vi-cinity of the O2 vibrational fundamental in O2/CO2 mixtures.J Mol Spectrosc 228:432–440.
Barnes, R., Raymond, S.N., Jackson, B., and Greenberg, R.(2008) Tides and the evolution of planetary habitability. As-trobiology 8:557–568.
Barnes, R., Jackson, B., Greenberg, R., and Raymond, S.N.(2009) Tidal limits to planetary habitability. Astrophys J 700:L30–L33.
Barnes, R., Mullins, K., Goldblatt, C., Meadows, V.S., Kasting,J.F., and Heller, R. (2013) Tidal Venuses: triggering a climatecatastrophe via tidal heating. Astrobiology 13:225–250.
Barnes, R., Deitrick, R., Luger, R., Driscoll, P.E., Quinn, T.R.,Fleming, D.P., Guyer, B., McDonald, D.V., Meadows, V.S.,
Arney, G., Crisp, D., Domagal-Goldman, S.D., Lincowski,A., Lustig-Yaeger, J., and Schwieterman, E. (2018) Thehabitability of Proxima Centauri b I: evolutionary scenarios.arXiv:1608.06919v2.
Barstow, J.K., Tsang, C.C.C., Wilson, C.F., Irwin, P.G.J., Taylor,F.W., McGouldrick, K., Drossart, P., Piccioni, G., and Tellmann,S. (2012) Models of the global cloud structure on Venus derivedfrom Venus Express observations. Icarus 217:542–560.
Baum, B.A., Yang, P., Heymsfield, A.J., Platnick, S., King, M.D.,Hu, Y.-X., and Bedka, S.T. (2005) Bulk scattering propertiesfor the remote sensing of ice clouds. Part II: Narrowbandmodels. Journal of Applied Meteorology 44:1896–1911.
Bazot, M., Bouchy, F., Kjeldsen, H., Charpinet, S., Laymand, M.,and Vauclair, S. (2007) Asteroseismology of a Centauri A—evidence of rotational splitting. Astron Astrophys 470:295–302.
Beichman, C., Benneke, B., Knutson, H., Smith, R., Lagage,P.O., Dressing, C., Latham, D., Lunine, J., Birkmann, S.,Ferruit, P., and Giardino, G. (2014) Observations of transitingexoplanets with the James Webb Space Telescope ( JWST).Publ Astron Soc Pac 126, doi.org/10.1086/679566.
Benedict, G.F., McArthur, B., Nelan, E., Story, D., Whipple,A.L., Shelus, P.J., Jefferys, W.H., Hemenway, P.D., Franz,O.G., Wasserman, L.H., Duncombe, R.L., van Altena, W.,and Fredrick, L.W. (1998) Photometry of Proxima Centauriand Barnard’s star using Hubble Space Telescope Fine Gui-dance Sensor 3: a search for periodic variations. Astrophys J116, doi:10.1086/300420.
Benneke, B. and Seager, S. (2012) Atmospheric retrieval forsuper-Earths: uniquely constraining the atmospheric compo-sition with transmission spectroscopy. Astrophys J 753, doi:10.1088/0004-637X/753/2/100.
Betremieux, Y. and Kaltenegger, L. (2013) Transmissionspectrum of Earth as a transiting exoplanet from the ultravi-olet to the near-infrared. Astrophys J 772:L31.
Betremieux, Y. and Kaltenegger, L. (2014) Impact of atmo-spheric refraction: how deeply can we probe exo-Earth’s at-mospheres during primary eclipse observations? Astrophys J791, doi:10.1088/0004-637X/791/1/7.
Blackadar, A.K. (1962) The vertical distribution of wind andturbulent exchange in a neutral atmosphere. J Geophys Res67:3095–3102.
Blasing, T.J. (2016) Recent Greenhouse Gas Concentrations,Carbon Dioxide Information Analysis Center, doi:10.3334/CDIAC/atg.032.
Botet, R., Rannou, P., and Cabane, M. (1997) Mean-field ap-proximation of Mie scattering by fractal aggregates of iden-tical spheres. Appl Opt 36:8791–8797.
Bouchez, A.H., Acton, D.S., Biasi, R., Conan, R., Espeland, B.,Esposito, S., Filgueira, J.M., Gallieni, D., McLeod, B.A.,Pinna, E., Santoro, F., Trancho, G., and van Dam, M.A.(2014) The Giant Magellan telescope adaptive optics pro-gram. Proc SPIE 9148, doi:10.1117/12.2057613.
Boyajian, T.S., von Braun, K., van Belle, G., McAlister, H.A.,ten Brummelaar, T.A., Kane, S.R., Muirhead, P.S., Jones, J.,White, R., Schaefer, G., Ciardi, D., Henry, T., Lopez-Morales, M., Ridgway, S., Gies, D., Jao, W.-C., Rojas-Ayala,B., Parks, J.R., Sturmann, L., Sturmann, J., Turner, N.H.,Farrington, C., Goldfinger, P.J., and Berger, D.H. (2012)Stellar diameters and temperatures. II. Main-sequence K- andM-stars. Astrophys J 757, doi:10.1088/0004-637X/757/2/112.
Brogi, M., Snellen, I.A.G., de Kok, R.J., Albrecht, S., Birkby,J.L., and de Mooij, E.J.W. (2013) Detection of molecularabsorption in the dayside of exoplanet 51 Pegasi b? AstrophysJ 767, doi:10.1088/0004-637X/767/1/27.
182 MEADOWS ET AL.

Brogi, M., de Kok, R.J., Birkby, J.L., Schwarz, H., and Snellen,I.A.G. (2014) Carbon monoxide and water vapor in the at-mosphere of the non-transiting exoplanet HD 179949 b. As-tron Astrophys 565:A124.
Brown, R.A. (2005) Single-visit photometric and obscurationalcompleteness. Astrophys J 624, doi:10.1086/429124.
Bullock, M.A. and Grinspoon, D.H. (2001) The recent evolu-tion of climate on Venus. Icarus 150:19–37.
Burch, D.E. and Gryvnak, D.A. (1967) Strengths, widths, andshapes of the lines of the 3n CO band. J Chem Phys 47:4930–4940.
Butler, R.P., Vogt, S.S., Marcy, G.W., Fischer, D.A., Wright,J.T., Henry, G.W., Laughlin, G., and Lissauer, J.J. (2004) ANeptune-mass planet orbiting the nearby M dwarf GJ 436.Astrophys J 617, doi:10.1086/425173.
Chamberlain, S., Bailey, J., Crisp, D., and Meadows, V. (2013)Ground-based near infrared observations of water vapour inthe Venus troposphere. Icarus 222:364–378.
Charnay, B., Forget, F., Wordsworth, R., Leconte, J., Millour,E., Codron, F., and Spiga, A. (2013) Exploring the faintyoung Sun problem and the possible climates of the ArcheanEarth with a 3-D GCM. J Geophys Res: Atmospheres 118:10414–10431.
Chassefiere, E. (1996a) Hydrodynamic escape of oxygen fromprimitive atmospheres: applications to the cases of Venus andMars. Icarus 552:537–552.
Chassefiere, E. (1996b) Hydrodynamic escape of hydrogenfrom a hot water-rich atmosphere: the case of Venus. JGeophys Res 101, doi:10.1029/96JE01951.
Clark, R.N., Swayze, G.A., Wise, R., Livo, E., Hoefen, T.,Kokaly, R., and Sutley, S.J. (2007) USGS Digital SpectralLibrary splib06a, Digital Data Series 231, U.S. GeologicalSurvey, Reston, VA. Available online at http://speclab.cr.usgs.gov/spectral.lib06
Collinson, G.A., Frahm, R.A., Glocer, A., Coates, A.J., Gre-bowsky, J.M., Barabash, S., Domagal-Goldman, S.D., Fe-dorov, A., Futaana, Y., Gilbert, L.K., Khazanov, G.,Nordheim, T.A., Mitchell, D., Moore, T.E., Peterson, W.K.,Winningham, J.D., and Zhang, T.L. (2016) The electric windof Venus: a global and persistent ‘‘polar wind’’-like ambi-polar electric field sufficient for the direct escape of heavyionospheric ions. Geophys Res Lett 43:5926–5934.
Cowan, N.B., Agol, E., and Charbonneau, D. (2007) Hot nightson extrasolar planets: mid-infrared phase variations of hotJupiters. Mon Not R Astron Soc 379:641–646.
Cowan, N.B., Machalek, P., Croll, B., Shekhtman, L.M., Bur-rows, A., Deming, D., Greene, T., and Hora, J.L. (2012)Thermal phase variations of WASP-12b: defying predictions.Astrophys J 747, doi:10.1088/0004-637X/747/1/82.
Cowan, N.B., Greene, T., Angerhausen, D., Batalha, N.E.,Clampin, M., Colon, K., Crossfield, I.J.M., Fortney, J.J.,Gaudi, B.S., Harrington, J., Iro, N., Lillie, C.F., Linsky, J.L.,Lopez-Morales, M., Mandel, A.M., and Stevenson, K.B., onbehalf of Exo PAG SAG-10. (2015) Characterizing transitingplanet atmospheres through 2025. Publ Astron Soc Pac 127,doi:10.1086/680855.
Cox, C. and Munk, W. (1954) Measurement of the roughness ofthe sea surface from photographs of the Sun’s glitter. J OptSoc Am 44:838–850.
Crisp, D. (1986) Radiative forcing of the Venus mesosphere: I.Solar fluxes and heating rates. Icarus 67:484–514.
Crisp, D. (1990) Infrared radiative transfer in the dust-freemartian atmosphere. J Geophys Res: Solid Earth 95:14577–14588.
Crisp, D. (1997) Absorption of sunlight by water vapor incloudy conditions: a partial explanation for the cloud ab-sorption anomaly. Geophys Res Lett 24:571–574.
Crossfield, I.J., Hansen, B.M., Harrington, J., Cho, J.Y.K.,Deming, D., Menou, K., and Seager, S. (2010) A new 24 mmphase curve for u Andromedae b. Astrophys J 723, doi:10.1088/0004-637X/723/2/1436.
Dalcanton, J., Seager, S., Aigrain, S., Battel, S., Brandt, N.,Conroy, C., Feinberg, L., Gezari, S., Guyon, O., Harris, W.,Hirata, C., Mather, J., Postman, M., Redding, D., Schimino-vich, D., Stahl, P.H., and Tumlinson, J. (2015) From cosmicbirth to living Earths: the future of UVOIR space astronomy.arXiv:1507.04779
Davenport, J.R.A. (2016) The Kepler Catalog of Stellar Flares.Astrophys J 829, doi:10.3847/0004-637X/829/1/23.
de Bergh, C., Bezard, B., Owen, T., Crisp, D., Maillard, J.P.,and Lutz, B.L. (1991) Deuterium on Venus: observationsfrom Earth. Science 251:547–549.
Dittmann, J.A., Irwin, J.M., Charbonneau, D., Bonfils, X.,Astudillo-Defru, N., Haywood, R.D., Berta-Thompson, Z.K.,Newton, E.R., Rodrıguez, J.E., Winters, J.G., Tan, T.-G.,Almenara, J.-M., Bouchy, F., Delfosse, X., Forveille, T.,Lovis, C., Murgas, F., Pepe, F., Santos, N.C., Udry, S.,Wunsche, A., Esquerdo, G.A., Latham, D.W., and Dressing,C.D. (2017) A temperate rocky super-Earth transiting anearby cool star. Nature 544:333–336.
Domagal-Goldman, S.D. and Meadows, V.S. (2010) Abioticbuildup of ozone. In Pathways Towards Habitable Planets, Vol.430, edited by V. Coude du Foresto, D.M. Gelino, and I. Ribas,Astronomical Society of the Pacific, San Francisco, p 152.
Domagal-Goldman, S.D., Kasting, J.F., Johnston, D.T., andFarquhar, J. (2008) Organic haze, glaciations and multiplesulfur isotopes in the Mid-Archean Era. Earth Planet Sci Lett269:29–40.
Domagal-Goldman, S.D., Meadows, V.S., Claire, M.W., andKasting, J.F. (2011) Using biogenic sulfur gases as remotelydetectable biosignatures on anoxic planets. Astrobiology 11:419–441.
Domagal-Goldman, S.D., Segura, A., Claire, M.W., Robinson,T.D., and Meadows, V.S. (2014) Abiotic ozone and oxygen inatmospheres similar to prebiotic Earth. Astrophys J 792, doi:10.1088/0004-637X/792/2/90.
Donahue, T.M. and Hodges, R.R., Jr. (1992) Past and present waterbudget of Venus. J Geophys Res: Planets 97:6083–6091.
Dong, C., Lingam, M., Ma, Y., and Cohen, O. (2017) IsProxima Centauri b habitable? A study of atmospheric loss.Astrophys J 837:L26.
Dressing, C.D., Spiegel, D.S., Scharf, C.A., Menou, K., and Ray-mond, S.N. (2010) Habitable climates: the influence of eccen-tricity. Astrophys J 721, doi:10.1088/0004-637X/721/2/1295.
Driese, S.G., Jirsa, M.A., Ren, M., Brantley, S.L., Sheldon,N.D., Parker, D., and Schmitz, M. (2011) Neoarchean pa-leoweathering of tonalite and metabasalt: implications forreconstructions of 2.69 Ga early terrestrial ecosystems andpaleoatmospheric chemistry. Precambrian Res 189:1–17.
Driscoll, P.E. and Barnes, R. (2015) Tidal heating of Earth-likeexoplanets around M stars: thermal, magnetic, and orbitalevolutions. Astrobiology 15:739–760.
Ehrenreich, D., Vidal-Madjar, A., Widemann, T., Gronoff, G.,Tanga, P., Barthelemy, M., Lilensten, J., Lecavelier desEtangs, A., and Arnold, L. (2012) Transmission spectrum ofVenus as a transiting exoplanet. Astron Astrophys 537:L2.
Etheridge, D.M., Steele, L.P., Francey, R.J., and Langenfelds,R.L. (1998) Atmospheric methane between 1000 A.D. and
PROX CEN B: HABITABILITY AND OBSERVABILITY 183

present: evidence of anthropogenic emissions and climaticvariability. J Geophys Res: Atmospheres 103:15979–15993.
Etiope, G. and Sherwood Lollar, B. (2013) Abiotic methane onEarth. Rev Geophys 51:276–299.
Farquhar, J., Bao, H., and Thiemens, M. (2000) Atmospheric in-fluence of Earth’s earliest sulfur cycle. Science 289:756–758.
Fegley, B., Jr. and Prinn, R.G. (1989) Estimation of the rate ofvolcanism on Venus from reaction rate measurements. Nature337:55–58.
Fluckiger, J., Monnin, E., Stauffer, B., Schwander, J., Stocker, T.F.,Chappellaz, J., Raynaud, D., and Barnola, J.-M. (2002) High-resolution Holocene N2O ice core record and its relationship withCH4 and CO2. Global Biogeochem Cycles 16:10-1–10-8.
France, K., Froning, C.S., Linsky, J.L., Roberge, A., Stocke,J.T., Tian, F., Bushinsky, R., Desert, J.-M., Mauas, P.,Vieytes, M., and Walkowicz, L. (2013) The ultraviolet radi-ation environment around M dwarf exoplanet host stars. As-trophys J 763, doi:10.1088/0004-637X/763/2/149.
France, K., Loyd, R.O.P., Youngblood, A., Brown, A.,Schneider, P.C., Hawley, S.L., Froning, C.S., Linsky, J.L.,Roberge, A., Buccino, A.P., Davenport, J.R.A., Fontenla,J.M., Kaltenegger, L., Kowalski, A.F., Mauas, P.J.D., Miguel,Y., Redfield, S., Rugheimer, S., Tian, F., Vieytes, M.C.,Walkowicz, L.M., and Weisenburger, K.L. (2016) the Mus-cles Treasury Survey. I. Motivation and overview. AstrophysJ 820, doi:10.3847/0004-637X/820/2/89.
Gao, P., Zhang, X., Crisp, D., Bardeen, C.G., and Yung, Y.L.(2014) Bimodal distribution of sulfuric acid aerosols in theupper haze of Venus. Icarus 231:83–98.
Gao, P., Hu, R., Robinson, T.D., Li, C., and Yung, Y.L. (2015)Stability of CO2 atmospheres on desiccated M dwarf exo-planets. Astrophy J 806, doi:10.1088/0004-637X/806/2/249.
Garcıa Munoz, A., Zapatero Osorio, M.R., Barrena, R., Montanes-Rodrıguez, P., Martın, E.L., and Palle, E. (2012) Glancing viewsof the Earth: from a lunar eclipse to an exoplanetary transit.Astrophys J 755, doi:10.1088/0004-637X/755/2/103.
Garcia-Sage, K., Glocer, A., Drake, J.J., Gronoff, G., and Co-hen, O. (2017) On the magnetic protection of the atmosphereof Proxima Centauri b. Astrophys J 844, doi:10.3847/2041-8213/aa7eca.
Garraffo, C., Drake, J.J., and Cohen, O. (2016) The spaceweather of Proxima Centauri b. Astrophys J 833:L4.
Gates, D.M., Keegan, H.J., Schleter, J.C., and Weidner, V.R.(1965) Spectral properties of plants. Appl Opt 4:11–20.
Gierasch, P. and Goody, R. (1968) A study of the thermal anddynamical structure of the martian lower atmosphere. PlanetSpace Sci 16:615–646.
Gillon, M., Jehin, E., Lederer, S.M., Delrez, L., de Wit, J.,Burdanov, A., Van Grootel, V., Burgasser, A.J., Triaud,A.H.M.J., Opitom, C., Demory, B.-O., Sahu, D.K., BardalezGagliuffi, D., Magain, P., and Queloz, D. (2016) TemperateEarth-sized planets transiting a nearby ultracool dwarf star.Nature 533:221–224.
Gillon, M., Triaud, A.H., Demory, B.O., Jehin, E., Agol, E., Deck,K.M., Lederer, S.M., de Wit, J., Burdanov, A., Ingalls, J.G.,Bolmont, E., Leconte, J., Raymond, S.N., Selsis, F., Turbet, M.,Barkaoui, K., Burgasser, A., Burleigh, M.R., Carey, S.J.,Chaushev, A., Copperwheat, C.M., Delrez, L., Fernandes, C.S.,Holdsworth, D.L., Kotze, E.J., Van Grootel, V., Almleaky, Y.,Benkhaldoun, Z., Magain, P., and Queloz, D. (2017) Seventemperate terrestrial planets around the nearby ultracool dwarfstar TRAPPIST-1. Nature 542:456–460.
Glasse, A., Rieke, G.H., Bauwens, E., Garcıa-Marın, M., Re-ssler, M.E., Rost, S., Tikkanen, T.V., Vandenbussche, B., and
Wright, G.S. (2015) The Mid-Infrared Instrument for theJames Webb Space Telescope, IX: predicted sensitivity. PublAstron Soc Pac 127, doi:10.1086/682259.
Godolt, M., Grenfell, J.L., Kitzmann, D., Kunze, M., Langematz,U., Patzer, A.B.C., Rauer, H. and Stracke, B. (2016) Assessingthe habitability of planets with Earth-like atmospheres with 1Dand 3D climate modeling. Astron Astrophys 592:A36.
Goldblatt, C. (2016) Tutorial models of the climate and habit-ability of Proxima Centauri b: a thin atmosphere is sufficientto distribute heat given low stellar flux. arXiv:1608.07263
Goldblatt, C. and Watson, A.J. (2012) The runaway greenhouse:implications for future climate change, geoengineering andplanetary atmospheres. Philos Trans A Math Phys Eng Sci370:4197–4216.
Goldblatt, C., Claire, M.W., Lenton, T.M., Matthews, A.J.,Watson, A.J., and Zahnle, K.J. (2009) Nitrogen-enhancedgreenhouse warming on early Earth. Nat Geosci 2:891–896.
Goldblatt, C., Robinson, T.D., Zahnle, K.J., and Crisp, D.(2013) Low simulated radiation limit for runaway greenhouseclimates. Nat Geosci 6:661–667.
Greenblatt, G.D., Orlando, J.J., Burkholder, J.B., and Ra-vishankara, A.R. (1990) Absorption measurements of oxygenbetween 330 and 1140 nm. J Geophys Res: Atmospheres 95:18577–18582.
Greene, T.P., Line, M.R., Montero, C., Fortney, J.J., Lustig-Yaeger, J., and Luther, K. (2016) Characterizing transitingexoplanet atmospheres with JWST. Astrophys J 817, doi:10.3847/0004-637X/817/1/17.
Grenfell, J.L., Grießmeier, J.M., von Paris, P., Patzer, A.B.C.,Lammer, H., Stracke, B., Gebauer, S., Schreier, F., andRauer, H. (2012) Response of atmospheric biomarkers toNOx-induced photochemistry generated by stellar cosmicrays for Earth-like planets in the habitable zone of M dwarfstars. Astrobiology 12:1109–1122.
Grinspoon, D.H. (1993) Implications of the high D/H ratio for thesources of water in Venus’ atmosphere. Nature 363:428–431.
Gruszka, M. and Borysow, A. (1997) Roto-translationalcollision-induced absorption of CO2 for the atmosphere ofVenus at frequencies from 0 to 250 cm-1, at temperaturesfrom 200 to 800 K. Icarus 129:172–177.
Guyon, O., Martinache, F., Cady, E., Belikov, R., Kunjithapa-tham, B., Wilson, D., Clergeon, C., and Mateen, M. (2012)How ELTs will acquire the first spectra of rocky habitableplanets. Proc SPIE 8447, doi:10.1117/12.927181.
Guzman-Marmolejo, A., Segura, A., and Escobar-Briones, E.(2013) Abiotic production of methane in terrestrial planets.Astrobiology 13:550–559.
Haan, D. and Raynaud, D. (1998) Ice core record of CO vari-ations during the last two millennia: atmospheric implicationsand chemical interactions within the Greenland ice. Tellus BChem Phys Meteorol 50B:253–262.
Hale, G.M. and Querry, M.R. (1973) Optical constants of water inthe 200-nm to 200-mm wavelength region. Appl Opt 12:555–563.
Hamano, K., Abe, Y., and Genda, H. (2013) Emergence of twotypes of terrestrial planets on solidification of magma ocean.Nature 497:607–610.
Hanuschik, R.W. (2003) A flux-calibrated, high-resolution atlasof optical sky emission from UVES. Astron Astrophys 407:1157–1164.
Haqq-Misra, J.D., Domagal-Goldman, S.D., Kasting, P.J., andKasting, J.F. (2008) A revised, hazy methane greenhouse forthe Archean Earth. Astrobiology 8:1127–1137.
Harman, C.E., Schwieterman, E.W., Schottelkotte, J.C., andKasting, J.F. (2015) Abiotic O2 levels on planets around F, G,
184 MEADOWS ET AL.

K, and M stars: possible false positives for life? Astrophys J812, doi:10.1088/0004-637X/812/2/137.
Hawley, S.L. and Pettersen, B.R. (1991) The great flare of 1985April 12 on AD Leonis. Astrophys J 378:725–741.
Hawley, S.L., Allred, J.C., Johns-Krull, C.M., Fisher, G.H.,Abbett, W.P., Alexseev, I., Avgoloupis, S.I., Deustua, S.E.,Gunn, A., Seiradakis, J.H., Sirk, M.M, and Valenti, J.A.(2003) Multiwavelength observations of flares on AD Leonis.Astrophys J 597:535–554.
Heller, R., Leconte, J., and Barnes, R. (2011) Tidal obliquityevolution of potentially habitable planets. Astron Astrophys528:A27.
Henyey, L.C. and Greenstein, J.L. (1941) Diffuse radiation inthe Galaxy. Astrophys J 93:70–83.
Hermans, C., Vandaele, A.C., Carleer, M., Fally, S., Colin, R.,Jenouvrier, A., Coquart, B., and Merienne, M.F. (1999) Ab-sorption cross-sections of atmospheric constituents: NO2, O2,and H2O. Environmental Science and Pollution Research 6:151–158.
Heymsfield, A.J., Bansemer, A., Field, P.R., Durden, S.L., Stith,J.L., Dye, J.E., Hall, W., and Grainger, C.A. (2002) Ob-servations and parameterizations of particle size distributionsin deep tropical cirrus and stratiform precipitating clouds:results from in situ observations in TRMM field campaigns. JAtmos Sci 59:3457–3491.
Hitchcock, D.R. and Lovelock, J.E. (1967) Life detection byatmospheric analysis. Icarus 7:149–159.
Holland, H.D. (2002) Volcanic gases, black smokers, and theGreat Oxidation Event. Geochim Cosmochim Acta 66:3811–3826.
Hu, Y. and Yang, J. (2014) Role of ocean heat transport inclimates of tidally locked exoplanets around M dwarf stars.Proc Natl Acad Sci USA 111:629–634.
Huang, X., Gamache, R.R., Freedman, R.S., Schwenke, D.W., andLee, T.J. (2014) Reliable infrared line lists for 13 CO2 iso-topologues up to E¢ = 18,000 cm-1 and 1500K, with line shapeparameters. J Quant Spectrosc Radiat Transf 147:134–144.
Husser, T., von Berg, S.W., Dreizler, S., Homeier, D., Reiners,A., Barman, T., and Hauschildt, P.H. (2013) A new extensivelibrary of PHOENIX stellar atmospheres and syntheticspectra. Astron Astrophys 553:A6.
Ingersoll, A.P. (1969) The runaway greenhouse: a history ofwater on Venus. J Atmos Sci 26:1191–1198.
Jackson, B., Barnes, R., and Greenberg, R. (2008) Tidal heatingof terrestrial extrasolar planets and implications for theirhabitability. Mon Not R Astron Soc 391:237–245.
Joshi, M.M., Haberle, R.M., and Reynolds, R.T. (1997) Simu-lations of the atmospheres of synchronously rotating terres-trial planets orbiting M dwarfs: conditions for atmosphericcollapse and the implications for habitability. Icarus 129:450–465.
Kane, S.R., Kopparapu, R.K., and Domagal-Goldman, S.D.(2014) On the frequency of potential Venus analogs fromKepler data. Astrophys J 794:L5.
Kanzaki, Y. and Murakami, T. (2015) Estimates of atmosphericCO2 in the Neoarchean–Paleoproterozoic from paleosols.Geochim Cosmochim Acta 159:190–219.
Kasper, M.E., Beuzit, J.-L., Verinaud, C., Yaitskova, N., Baudoz,P., Boccaletti, A., Gratton, R.G., Hubin, N., Kerber, F., Roelf-sema, R., Schmid, H.M., Thatte, N.A., Dohlen, K., Feldt, M.,Venema, L., and Wolf, S. (2008) EPICS: the exoplanet imagerfor the E-ELT. Proc SPIE 7015, doi:10.1117/12.789047.
Kasting, J.F. (1988) Runaway and moist greenhouse atmospheresand the evolution of Earth and Venus. Icarus 74:472–494.
Kasting, J.F. (1997) Habitable zones around low mass stars andthe search for extraterrestrial life. In Planetary and Inter-stellar Processes Relevant to the Origins of Life, edited byD.C.B. Whittet, Springer, Dordrecht, the Netherlands, pp291–307.
Kasting, J.F. and Ackerman, T.P. (1986) Climatic consequencesof very high carbon dioxide levels in the Earth’s early at-mosphere. Science 234:1383–1385.
Kasting, J.F. and Pollack, J.B. (1983) Loss of water from Venus.I—Hydrodynamic escape of hydrogen. Icarus 53:479–508.
Kasting, J.F., Liu, S.C., and Donahue, T.M. (1979) Oxygenlevels in the prebiological atmosphere. J Geophys Res 84,doi:10.1029/JC084iC06p03097.
Kasting, J.F., Pollack, J.B., and Crisp, D. (1984a) Effects ofhigh CO2 levels on surface temperature and atmosphericoxidation state of the early Earth. J Atmos Chem 1:403–428.
Kasting, J.F., Pollack, J.B., and Ackerman, T.P. (1984b) Responseof Earth’s atmosphere to increases in solar flux and implicationsfor loss of water from Venus. Icarus 57:335–355.
Kasting, J.F., Whitmire, D.P., and Reynolds, R.T. (1993) Habitablezones around main sequence stars. Icarus 101:108–128.
Kelley, D.S., Karson, J.A., Fruh-Green, G.L., Yoerger, D.R.,Shank, T.M., Butterfield, D.A., Hayes, J.M., Schrenk, M.O.,Olson, E.J., Proskurowski, G., and Jakuba, M. (2005) Aserpentinite-hosted ecosystem: the Lost City hydrothermalfield. Science 307:1428–1434.
Khare, B.N., Sagan, C., Thompson, W.R., Arakawa, E.T., Suits,F., Callcott, T.A., Williams, M.W., Shrader, S., Ogino, H.,Willingham, T.O., and Nagy, B. (1984) The organic aerosolsof Titan. Adv Space Res 4:59–68.
Kharecha, P., Kasting, J., and Siefert, J. (2005) A coupledatmosphere-ecosystem model of the early Archean Earth.Geobiology 3:53–76.
Kiang, N.Y., Segura, A., Tinetti, G., Govindjee, Blankenship,R.E., Cohen, M., Siefert, J., Crisp, D., and Meadows, V.S.(2007) Spectral signatures of photosynthesis. II. Coevolutionwith other stars and the atmosphere on extrasolar worlds.Astrobiology 7:252–274.
Kipping, D.M., Cameron, C., Hartman, J.D., Davenport, J.R.,Matthews, J.M., Sasselov, D., Rowe, J., Siverd, R.J., Chen, J.,Sandford, E., Bakos, G.A., Jordan, A., Bayliss, D., Henning,T., Mancini, L., Penev, K., Cxubry, Z., Bhatti, W., Da SilvaBento, J., Guenther, D.V., Kuschnig, R., Moffat, S.M.R., andWeiss, W. (2017) No conclusive evidence for transits ofProxima b in MOST photometry. Astron J 153, doi:10.3847/1538-3881/153/3/93.
Kitzmann, D., Patzer, A.B.C., and Rauer, H. (2013) Clouds inthe atmospheres of extrasolar planets-IV. On the scatteringgreenhouse effect of CO2 ice particles: numerical radiativetransfer studies. Astron Astrophys 557:A6.
Knutson, H.A., Charbonneau, D., Allen, L.E., Fortney, J.J.,Agol, E., Cowan, N.B., Showman, A.P., Cooper, C.S., andMegeath, S.T. (2007) A map of the day–night contrast of theextrasolar planet HD 189733b. Nature 447:183–186.
Knutson, H.A., Lewis, N., Fortney, J.J., Burrows, A., Showman,A.P., Cowan, N.B., Algol, E., Aigrain, S., Charbonneau, D.,Deming, D., Desert, J.-M., Henry, G.W., Langton, J., andLaughlin, G. (2012) 3.6 and 4.5mm phase curves and evi-dence for non-equilibrium chemistry in the atmosphere ofextrasolar planet HD 189733b. Astrophys J 754, doi:10.1088/0004-637X/754/1/22.
Knutson, H.A., Benneke, B., Deming, D., and Homeier, D.(2014) A featureless transmission spectrum for the Neptune-mass exoplanet GJ 436b. Nature 505:66–68.
PROX CEN B: HABITABILITY AND OBSERVABILITY 185

Kopparapu, R., Wolf, E.T., Haqq-Misra, J., Yang, J., Kasting,J.F., Meadows, V., Terrien, R., and Mahadevan, S. (2016)The inner edge of the habitable zone for synchronously ro-tating planets around low-mass stars using general circulationmodels. Astrophys J 819, doi:10.3847/0004-637X/819/1/84.
Kopparapu, R.K., Ramirez, R., Kasting, J.F., Eymet, V.,Robinson, T.D., Mahadevan, S., Terrien, R.C., Domagal-Goldman, S., Meadows, V., and Deshpande, R. (2013)Habitable zones around main-sequence stars: new estimates.Astrophys J 765, doi:10.1088/0004-637X/765/2/131.
Kouveliotou, C., Agol, E., Batalha, N., Bean, J., Bentz, M., Cor-nish, N., Dressler, A., Figueroa-Feliciano, E., Gaudi, S., Guyon,O., Hartmann, D., Kalirai, J., Niemack, M., Ozel, F., Reynolds,C., Roberge, A., Straughn, K.S.A., Weinberg, D., and Zmuid-zinas, J. (2014) Enduring quests—daring visions (NASA as-trophysics in the next three decades). arXiv:1401:3741
Kreidberg, L. and Loeb, A. (2016) Prospects for characterizingthe atmosphere of Proxima Centauri b. Astrophys J 832:L12.
Kreidberg, L., Bean, J.L., Desert, J.-M., Benneke, B., Deming,D., Stevenson, K.B., Seager, S., Berta-Thompson, Z., Sei-fahrt, A., and Homeier, D. (2014) Clouds in the atmosphereof the super-Earth exoplanet GJ 1214b. Nature 505:69–72.
Kroeze, C., Mosier, A., and Bouwman, L. (1999) Closing theglobal N2O budget: a retrospective analysis 1500–1994.Global Biogeochem Cycles 13:1–8.
Lafferty, W.J., Solodov, A.M., Weber, A., Olson, W.B., andHartmann, J.M. (1996) Infrared collision-induced absorptionby N2 near 4.3 mm for atmospheric applications: measure-ments and empirical modeling. Appl Opt 35:5911–5917.
Lammer, H., Kasting, J.F., Chassefiere, E., Johnson, R.E., Ku-likov, Y.N., and Tian, F. (2008) Atmospheric escape andevolution of terrestrial planets and satellites. Space Sci Rev139:399–436.
Leconte, J., Wu, H., Menou, K., and Murray, N. (2015) Asyn-chronous rotation of Earth-mass planets in the habitable zoneof lower-mass stars. Science 347:632–635.
Lee, Y.J., Sagawa, H., Haus, R., Stefani, S., Imamura, T., Titov,D.V., and Piccioni, G. (2016) Sensitivity of net thermal fluxto the abundance of trace gases in the lower atmosphere ofVenus. J Geophys Res: Planets 121:1737–1752.
Lissauer, J.J. (2007) Planets formed in habitable zones of Mdwarf stars probably are deficient in volatiles. Astrophys J660:L149–L152.
Livengood, T.A., Deming, L.D., A’Hearn, M.F., Charbonneau, D.,Hewagama, T., Lisse, C.M., McFadden, L.A., Meadows, V.S.,Robinson, T.D., Seager, S., and Wellnitz, D.D. (2011) Propertiesof an Earth-like planet orbiting a Sun-like star: Earth observed bythe EPOXI mission. Astrobiology 11:907–930.
Lizzio, A.A. and DeBarr, J.A. (1997) Mechanism of SO2 re-moval by carbon. Energy Fuels 11:284–291.
Lloyd-Hart, M., Angel, R., Milton, N., Rademacher, M., andCodona, J. (2006) Design of the adaptive optics systems forGMT. Proc SPIE 6272, doi:10.1117/12.672444.
Lovis, C., Snellen, I., Mouillet, D., Pepe, F., Wildi, F.,Astudillo-Defru, N., Beuzit, J.-L., Bonfils, X., Cheetham, A.,Conod, U., Delfosse, X., Ehrenreich, D., Figueira, P., For-veille, T., Martins, J.H.C., Quanz, S., Santos, N.C., Schmid,H.-M., Segransan, D., and Udry, S. (2017) Atmosphericcharacterization of Proxima b by coupling the SPHERE high-contrast imager to the ESPRESSO spectrograph. Astron As-trophys 599:A16.
Luger, R. and Barnes, R. (2015) Extreme water loss and abioticO2 buildup on planets throughout the habitable zones of Mdwarfs. Astrobiology 15:119–143.
Luger, R., Barnes, R., Lopez, E., Fortney, J., Jackson, B., andMeadows, V. (2015) Habitable evaporated cores: transform-ing mini-Neptunes into super-Earths in the habitable zones ofM dwarfs. Astrobiology 15:57–88.
Luger, R., Lustig-Yaeger, J., Fleming, D.P., Tilley, M.A., Agol,E., Meadows, V.S., Deitrick, R., and Barnes, R. (2017) Thepale green dot: a method to characterize Proxima Centauri busing exo-aurorae. Astrophys J 837, doi:10.3847/1538-4357/aa6040.
Mainzer, A.K., Roellig, T.L., Saumon, D., Marley, M.S.,Cushing, M.C., Sloan, G.C., Kirkpatrick, J.D., Leggett, S.K.,and Wilson, J.C. (2007) Moderate-resolution Spitzer InfraredSpectrograph observations of M, L, and T dwarfs. AstrophysJ 662:1245–1253.
Males, J.R., Close, L.M., Guyon, O., Morzinski, K., Puglisi, A.,Hinz, P., Follette, K.B., Monnier, J.D., Tolls, V., Rodigas,T.J., Weinberger, A., Boss, A., Kopon, D., Wu, Y.-L.,Esposito, S., Riccardi, A., Xompero, M., Briguglio, R., andPinna, E. (2014) Direct imaging of exoplanets in the habitablezone with adaptive optics. Proc SPIE 9148, doi:10.1117/12.2057135.
Males, J.R., Close, L.M., Guyon, O., Morzinski, K.M., Hinz, P.,Esposito, S., Pinna, E., Xompero, M., Briguglio, R., Riccardi,A., Puglisi, A., Mazin, B., Ireland, M.J., Weinberger, A.,Conrad, A., Kenworthy, M., Snik, F., Otten, G., Jovanovic,N., and Lozi, J. (2016) The path to visible extreme adaptiveoptics with MagAO-2K and MagAO-X. Proc SPIE 9909, doi:10.1117/12.2234105.
Manabe, S. and Wetherald, R.T. (1967) Thermal equilibrium ofthe atmosphere with a given distribution of relative humidity.J Atmos Sci 24:241–259.
Mate, B., Lugez, C., Fraser, G.T., and Lafferty, W.J. (1999)Absolute intensities for the O2 1.27mm continuum absorp-tion. J Geophys Res: Atmospheres 104:30585–30590.
Matvienko, A.S. and Orlov, V.V. (2014) Dynamic status of thewide multiple system a Centauri + Proxima. AstrophysicalBulletin 69:205–210.
Maurin, A.S., Selsis, F., Hersant, F., and Belu, A. (2012)Thermal phase curves of nontransiting terrestrial exoplanets-II. Characterizing airless planets. Astron Astrophys 538:A95.
McElroy, M.B., Prather, M.J., and Rodrıguez, J.M. (1982) Es-cape of hydrogen from Venus. Science 215:1614–1615.
Meadows, V. and Crisp, D. (1996) Ground-based near-infraredobservations of the Venus nightside: the thermal structure andwater abundance near the surface. J Geophys Res: Planets101:4595–4622.
Meadows, V.S. (2008) Planetary environmental signatures ofhabitability and life. In Exoplanets: Detection, Formation,Properties, Habitability, edited by J. Mason, Springer, Berlin,pp 259–284.
Meadows, V.S. (2017) Reflections on O2 as a biosignature inexoplanetary atmospheres. Astrobiology 17:1022–1052.
Mennesson, B., Gaudi, S., Seager, S., Cahoy, K., Domagal-Goldman, S., Feinberg, L., Guyon, O., Kasdin, J., Marois, C.,Mawet, D., Tamura, M., Mouillet, D., Prusti, T., Quirrenbach,A., Robinson, T., Rogers, L., Scowen, P., Somerville, R.,Stapelfeldt, K., Stern, D., Still, M., Turnbull, M., Booth, J.,Kiessling, A., Kuan, G., and Warfield, K. (2016) The Habi-table Exoplanet (HabEx) Imaging Mission: preliminary sci-ence drivers and technical requirements. Proc SPIE 9904,doi:10.1117/12.2240457.
Miller-Ricci Kempton, E., Zahnle, K., and Fortney, J.J. (2012)The atmospheric chemistry of GJ 1214b: photochemistry andclouds. Astrophys J 745, doi:10.1088/0004-637X/745/1/3.
186 MEADOWS ET AL.

Misra, A., Meadows, V., Claire, M., and Crisp, D. (2014a)Using dimers to measure biosignatures and atmosphericpressure for terrestrial exoplanets. Astrobiology 14:67–86.
Misra, A., Meadows, V., and Crisp, D. (2014b) The effects ofrefraction on transit transmission spectroscopy: application toEarth-like exoplanets. Astrophys J 792, doi:10.1088/0004-637X/792/1/61.
Misra, A.K. and Meadows, V.S. (2014) Discriminating betweencloudy, hazy, and clear sky exoplanets using refraction. As-trophys J 795:L14.
Moore, J.F. (1971) Infrared absorption of carbon dioxide at highdensities with application to the atmosphere of Venus. PhDthesis, Columbia University, New York.
Moroz, V.I., Ekonomov, A.P., Moshkin, B.E., Revercomb,H.E., Sromovsky, L.A., and Schofield, J.T. (1985) Solar andthermal radiation in the Venus atmosphere. Adv Space Res 5:197–232.
Noll, S., Kausch, W., Barden, M., Jones, A.M., Szyszka, C.,Kimeswenger, S., and Vinther, J. (2012) An atmosphericradiation model for Cerro Paranal-I. The optical spectralrange. Astron Astrophys 543:A92.
Owen, J.E. and Mohanty, S. (2016) Habitability of terrestrial-mass planets in the HZ of < dwarfs I. H/He-dominated at-mospheres. Mon Not R Astron Soc 459:4088–4108.
Palle, E., Goode, P.R., Yurchyshyn, V., Qiu, J., Hickey, J.,Montanes Rodrıguez, P., and Koonin, S.E. (2003) Earthshineand the Earth’s albedo: 2. Observations and simulations over3 years. J Geophys Res: Atmospheres 108, doi:10.1029/2003JD003611.
Palle, E., Osorio, M.R.Z., Barrena, R., Montanes-Rodrıguez, P.,and Martın, E.L. (2009) Earth’s transmission spectrum fromlunar eclipse observations. Nature 459:814–816.
Palmer, K.F. and Williams, D. (1975) Optical constants ofsulfuric acid: application to the clouds of Venus? Appl Opt14:208–219.
Parkinson, C.D., Gao, P., Schulte, R., Bougher, S.W., Yung,Y.L., Bardeen, C.G., Wilquet, V., Vandaele, A.C., Mahieux,A., Tellmann, S., and Patzold, M. (2015) Distribution ofsulphuric acid aerosols in the clouds and upper haze of Venususing Venus Express VAST and VeRa temperature profiles.Planet Space Sci 113:205–218.
Pavlov, A., Brown, L., and Kasting, J. (2001) UV shielding ofNH3 and O2 by organic hazes in the Archean atmosphere. JGeophys Res: Planets 106:23267–23287.
Pollack, J., Toon, O., Whitten, R., Boese, R., Ragent, B., To-masko, M., Eposito, L., Travis, L., and Wiedman, D. (1980)Distribution and source of the UV absorption in Venus’ at-mosphere. J Geophys Res 85:8141–8150.
Pollack, J., Dalton, J., Grinspoon, D., Wattson, R., Freedman,R., Crisp, D., Allen, D., Bezard, B., de Bergh, C., Giver, L.,Ma, Q., and Tipping, R. (1993) Near-infrared light fromVenus’ nightside: a spectroscopic analysis. Icarus 103:1–42.
Quanz, S.P., Crossfield, I., Meyer, M.R., Schmalzl, E., andHeld, J. (2015) Direct detection of exoplanets in the 3–10mmrange with E-ELT/METIS. International Journal of Astro-biology 14:279–289.
Rannou, P., Cabane, M., Botet, R., and Chassefiere, E. (1997) Anew interpretation of scattered light measurements at Titan’slimb. J Geophys Res 102:10997–11013.
Raymond, S.N., Scalo, J., and Meadows, V.S. (2007) A de-creased probability of habitable planet formation around low-mass stars. Astrophys J 669:606–614.
Reiners, A. and Basri, G. (2008) The moderate magnetic field ofthe flare star Proxima Centauri. Astron Astrophys 489:L45–L48.
Ribas, I., Bolmont, E., Selsis, F., Reiners, A., Leconte, J.,Raymond, S., Engle, S., Guinan, E., Morin, M., Turbet, M.,Forget, F., and Anglada-Escude, G. (2016) The habitability ofProxima Centauri b. I. Irradiation, rotation, and volatile in-ventory from formation to the present. Astron Astrophys 596:A111.
Roberson, A.L., Roadt, J., Halevy, I., and Kasting, J.F. (2011)Greenhouse warming by nitrous oxide and methane in theProterozoic Eon. Geobiology 9:313–320.
Robinson, T.D. (2017) A theory of exoplanet transits with lightscattering. Astrophys J 836, doi:10.3847/1538-4357/aa5ea8.
Robinson, T.D., Meadows, V.S., and Crisp, D. (2010) Detectingoceans on extrasolar planets using the glint effect. AstrophysJ 721:L67–L71.
Robinson, T.D., Meadows, V.S., Crisp, D., Deming, D.,A’Hearn, M.F., Charbonneau, D., and Hewagama, T. (2011)Earth as an extrasolar planet: Earth model validation usingEPOXI Earth observations. Astrobiology 11:393–408.
Robinson, T.D., Ennico, K., Meadows, V.S., Sparks, W., Bus-sey, D.B.J., Schwieterman, E.W., and Breiner, J. (2014)Detection of ocean glint and ozone absorption using LCROSSEarth observations. Astrophys J 787, doi:10.1088/0004-637X/787/2/171.
Robinson, T.D., Stapelfeldt, K.R., and Marley, M.S. (2016)Characterizing rocky and gaseous exoplanets with 2 m classspace-based coronagraphs. Publ Astron Soc Pac 128, doi:10.1088/1538-3873/128/960/025003.
Rodrıguez, A., Callegari, N., Jr., Michtchenko, T.A., andHussmann, H. (2012) Spin–orbit coupling for tidally evolvingsuper-Earths. Mon Not R Astron Soc 427:2239–2250.
Roellig, T.L., Van Cleve, J.E., Sloan, G.C., Wilson, J.C., Sau-mon, D., Leggett, S.K., Marley, M.S., Cushing, M.C., Kirk-patrick, J.D., Mainzer, A.K., and Houck, J.R. (2004) SpitzerInfrared Spectrograph (IRS) observations of M, L, and Tdwarfs. Astrophys J Suppl Ser 154:418–421.
Rosing, M.T., Bird, D.K., Sleep, N.H., and Bjerrum, C.J. (2010)No climate paradox under the faint early Sun. Nature 464:744–747.
Rothman, L.S., Gordon, I.E., Barbe, A., Benner, D.C., Bernath,P.F., Birk, M., Boudon, V., Brown, L.R., Campargue, A.,Champion, J.-P., Chance, K., Coudert, L.H., Dana, V., Devi,V.M., Fally, S., Flaud, J.-M., Gamache, R.R., Goldman, A.,Jacquemart, D., Kleiner, I., Lacome, N., Lafferty, W.J.,Mandin, J.-Y., Massie, S.T., Mikhailenko, S.N., Miller, C.E.,Moazzen-Ahmadi, N., Naumenko, O.V., Nikitin, A.V., Or-phal, J., Perevalov, V.I., Perrin, A., Predoi-Cross, A., Rins-land, C.P., Rotger, M., Simeckova, M., Smith, M.A.H., Sung,K., Tashkun, S.A., Tennyson, J., Toth, R.A., Vandaele, A.C.,and Vander Auwera, J. (2009) The HITRAN 2008 molecularspectroscopic database. J Quant Spectrosc Radiat Transf 110:533–572.
Rothman, L.S., Gordon, I.E., Barber, R.J., Dothe, H., Gamache,R.R., Goldman, A., Perevalov, V.I., Tashkun, S.A., andTennyson, J. (2010) HITEMP, the high-temperature molec-ular spectroscopic database, J Quant Spectrosc Radiat Transf111:2139–2150.
Rothman, L.S., Gordon, I.E., Babikov, Y., Barbe, A., ChrisBenner, D., Bernath, P.F., Birk, M., Bizzocchi, L., Boudon,V., Brown, L.R., Campargue, A., Chance, K., Cohen, E.A.,Coudert, L.H., Devi, V.M., Drouin, B.J., Fayt, A., Flaud,J.-M., Gamache, R.R., Harrison, J.J., Hartmann, J.-M., Hill,C., Hodges, J.T., Jacquemart, D., Jolly, A., Lamouroux, J.,LeRoy, R.J., Li, G., Long, D.A., Lyulin, O.M., Mackie, C.J.,Massie, S.T., Mikhailenko, S., Muller, H.S.P., Naumenko,
PROX CEN B: HABITABILITY AND OBSERVABILITY 187

O.V., Nikitin, A.V., Orphal, J., Perevalov, V., Perrin, A., Po-lovtseva, E.R., Richard, C., Smith, M.A.H., Starikova, E., Sung,K., Tashkun, S., Tennyson, J., Toon, G.C., Tyuterev, Vl.G., andWagner, G. (2013) The HITRAN2012 molecular spectroscopicdatabase. J Quant Spectrosc Radiat Transf 130:4–50.
Rugheimer, S., Kaltenegger, L., Segura, A., Linsky, J., andMohanty, S. (2015) Effect of UV radiation on the spectralfingerprints of Earth-like planets orbiting M stars. Astrophys J809, doi:10.1088/0004-637X/809/1/57.
Schaefer, L., Wordsworth, R.D., Berta-Thompson, Z., andSasselov, D. (2016) Predictions of the atmospheric compo-sition of GJ 1132b. Astrophys J 829, 63. doi: 10.3847/0004-637X/829/2/63.
Schofield, J.T., Taylor, F.W., and McCleese, D.J. (1982) Theglobal distribution of water vapor in the middle atmosphereof Venus. Icarus 52:263–278.
Schwieterman, E.W., Cockell, C.S., and Meadows, V.S.(2015a) Nonphotosynthetic pigments as potential bio-signatures. Astrobiology 15:341–361.
Schwieterman, E.W., Robinson, T.D., Meadows, V.S., Misra, A.,and Domagal-Goldman, S. (2015b) Detecting and constrainingN2 abundances in planetary atmospheres using collisional pairs.Astrophys J 810, doi:10.1088/0004-637X/810/1/57.
Schwieterman, E.W., Meadows, V.S., Domagal-Goldman, S.D.,Deming, L.D., Arney, G.N., Luger, R., Harman, C.E., Misra,A., and Barnes, R. (2016) Identifying planetary biosignatureimpostors: spectral features of CO and O4 resulting fromabiotic O2/O3 production. Astrophys J 819:L13.
Segura, A., Krelove, K., Kasting, J.F., Sommerlatt, D., Mea-dows, V., Crisp, D., Cohen, M., and Mlawer, E. (2003) Ozoneconcentrations and ultraviolet fluxes on Earth-like planetsaround other stars. Astrobiology 3:689–708.
Segura, A., Kasting, J.F., Meadows, V., Cohen, M., Scalo, J.,Crisp, D., Butler, R.A.H., and Tinetti, G. (2005) Biosignaturesfrom Earth-like planets around M dwarfs. Astrobiology 5:706–725.
Segura, A., Meadows, V., Kasting, J., Crisp, D., and Cohen, M.(2007) Abiotic formation of O2 and O3 in high-CO2 terrestrialatmospheres. Astron Astrophys 472:665–679.
Segura, A., Walkowicz, L.M., Meadows, V., Kasting, J., andHawley, S. (2010) The effect of a strong stellar flare on theatmospheric chemistry of an Earth-like planet orbiting an Mdwarf. Astrobiology 10:751–771.
Selsis, F., Wordsworth, R.D., and Forget, F. (2011) Thermalphase curves of nontransiting terrestrial exoplanets—I.Characterizing atmospheres. Astron Astrophys 532:A1.
Shields, A.L., Meadows, V.S., Bitz, C.M., Pierrehumbert, R.T.,Joshi, M.M., and Robinson, T.D. (2013) The effect of hoststar spectral energy distribution and ice-albedo feedback onthe climate of extrasolar planets. Astrobiology 13:715–739.
Sidis, O. and Sari, R. (2010) Transits of transparent planets—atmospheric lensing effects. Astrophys J 720:904–911.
Sleep, N.H., Bird, D.K., and Pope, E. (2012) Paleontology ofEarth’s mantle. Annu Rev Earth Planet Sci 40:277–300.
Smith, T. and Guild, J. (1931) The C.I.E. colorimetric standardsand their use. Transactions of the Optical Society 33:73–134.
Snellen, I., de Kok, R., Birkby, J.L., Brandl, B., Brogi, M.,Keller, C., Kenworthy, M., Schwarz, H., and Stuik, R. (2015)Combining high-dispersion spectroscopy with high contrastimaging: probing rocky planets around our nearest neighbors.Astron Astrophys 576:A59.
Solomon, S., Qin, D., Manning, M., Chen, Z., Marquis, M.,Averyt, K.B., Tignor, M., and Miller, H.L., editors. (2007)Contribution of Working Group I to the Fourth Assessment
Report of the Intergovernmental Panel on Climate Change,Cambridge University Press, New York.
Sotin, C., Grasset, O., and Mocquet, A. (2007) Mass–radiuscurve for extrasolar Earth-like planets and ocean planets.Icarus 191:337–351.
Spergel, D., Gehrels, N., Baltay, C., Bennett, D., Breckinridge, J.,Donahue, M., Dressler, A., Gaudi, B.S., Greene, T., Guyon, O.,Hirata, C., Kalirai, J., Kasdin, N.J., Macintosh, B., Moos, W.,Perlmutter, S., Postman, M., Rauscher, B., Rhodes, J., Wang, Y.,Weinberg, D., Benford, D., Hudson, M., Jeong, W.-S., Mellier, Y.,Traub, W., Yamada, T., Capak, P., Colbert, J., Masters, D., Penny,M., Savransky, D., Stern, D., Zimmerman, N., Barry, R., Bartusek,L., Carpenter, K., Cheng, E., Content, D., Dekens, F., Demers, R.,Grady, K., Jackson, C., Kuan, G., Kruk, J., Melton, M., Nemati, B.,Parvin, B., Poberezhskiy, I., Peddie, C., Ruffa, J., Wallace, J.K.,Whipple, A., Wollack, E., and Zhao, F. (2015) Wide-Field In-frarRed Survey Telescope—Astrophysics Focused TelescopeAssets WFIRST-AFTA 2015 Report. arXiv:1503.03757.
Stamnes, K., Tsay, S.C., Wiscombe, W., and Jayaweera, K.(1988) Numerically stable algorithm for discrete-ordinate-method radiative transfer in multiple scattering and emittinglayered media. Appl Opt 27:2502–2509.
Stevenson, K.B., Desert, J.M., Line, M.R., Bean, J.L., Fortney,J.J., Showman, A.P., Kataria, T., Kreidberg, L., McCullough,P.R., Henry, G.W., and Charbonneau, D. (2014) Thermalstructure of an exoplanet atmosphere from phase-resolvedemission spectroscopy. Science 346:838–841.
Tabataba-Vakili, F., Grenfell, J.L., Grießmeier, J.-M., andRauer, H. (2016) Atmospheric effects of stellar cosmic rayson Earth-like exoplanets orbiting M-dwarfs. Astron Astrophys585:A96.
Tian, F. (2009) Thermal escape from super Earth atmospheresin the habitable zones of M stars. Astrophys J 703:905–909.
Tian, F., France, K., Linsky, J.L., Mauas, P.J.D., and Vieytes,M.C. (2014) High stellar FUV/NUV ratio and oxygen con-tents in the atmospheres of potentially habitable planets.Earth Planet Sci Lett 385:22–27.
Tinetti, G., Meadows, V.S., Crisp, D., Fong, W., Velusamy, T.,and Snively, H. (2005) Disk-averaged synthetic spectra ofMars. Astrobiology 5:461–482.
Tinetti, G., Meadows, V.S., Crisp, D., Kiang, N.Y., Kahn, B.H.,Bosc, E., Fishbein, E., Velusamy, T., and Turnbull, M. (2006)Detectability of planetary characteristics in disk-averagedspectra II: synthetic spectra and light-curves of Earth. As-trobiology 6:881–900.
Tofflemire, B.M., Wisniewski, J.P., Kowalski, A.F., Schmidt,S.J., Kundurthy, P., Hilton, E.J., Holtzman, J.A., and Hawley,S.L. (2012) The implications of M dwarf flares on the de-tection and characterization of exoplanets at infrared wave-lengths. Astron J 143, doi:10.1088/0004-6256/143/1/12.
Tomasko, M.G., Doose, L., Engel, S., Dafoe, L., West, R.,Lemmon, M., Karkoschfka, E., and See, C. (2008) A modelof Titan’s aerosols based on measurements made inside theatmosphere. Planet Space Sci 56:669–707.
Toon, O.B., McKay, C.P., Ackerman, T.P., and Santhanam, K.(1989) Rapid calculation of radiative heating rates and pho-todissociation rates in inhomogeneous multiple scatteringatmospheres. J Geophys Res: Atmospheres 94:16287–16301.
Trainer, M.G., Pavlov, A.A., DeWitt, H.L., Jimenez, J.L.,McKay, C.P., Toon, O.B., and Tolbert, M.A. (2006) Organichaze on Titan and the early Earth. Proc Natl Acad Sci USA103:18035–18042.
Traub, W.A., Breckinridge, J., Greene, T.P., Guyon, O., Kasdin,N.J., and Macintosh, B. (2016) Science yield estimate with the
188 MEADOWS ET AL.

Wide-Field Infrared Survey Telescope coronagraph. J AstronTelesc Instrum Syst 2, doi:10.1117/1.JATIS.2.1.011020.
Turbet, M., Leconte, J., Selsis, F., Bolmont, E., Forget, F.,Ribas, I., Raymond, S., and Anglada-Escude, G. (2016) Thehabitability of Proxima Centauri b II. Possible climates andobservability. Astron Astrophys 596:A112.
Turner, G. (1989) The outgassing history of the Earth’s atmo-sphere. Journal of the Geological Society 146:147–154.
Ueno, Y., Yamada, K., Yoshida, N., Maruyama, S., and Isozaki,Y. (2006) Evidence from fluid inclusions for microbial me-thanogenesis in the early Archaean era. Nature 440:516–519.
van der Werf, S.Y. (2008) Comment on ‘‘Improved ray tracingair mass numbers model’’. Appl Opt 47:153–156.
Verinaud, C., Kasper, M., Beuzit, J.L., Gratton, R.G., Mesa, D.,Aller-Carpentier, E., Fedrigo, E., Abe, L., Baudoz, P., Boc-caletti, A., Bonavita, M., Dohlen, K., Hubin, N., Kerber, F.,Korkiakoski, V., Antichi, J., Martinez, P., Rabou, P., Roelf-sema, R., Schmid, H.M., Thatte, N., Salter, G., Tecza, M.,Venema, L., Hanenburg, H., Jager, R., Yaitskova, N., Preis,O., Orecchia, M., and Stadler, E. (2010) System study ofEPICS: the exoplanets imager for the E-ELT. Proc SPIE7736, doi:10.1117/12.857096.
Volk, K. and Gladman, B. (2015) Consolidating and crushingexoplanets: did it happen here? Astrophys J 806, doi:10.1088/2041-8205/806/2/L26.
Walker, J.C.G., Hays, P.B., and Kasting J.F. (1981) A negativefeedback mechanism for the long-term stabilization of theEarth’s surface temperature. J Geophys Res 86:9776–9782.
Wertheimer, J.G. and Laughlin, G. (2006) Are Proxima and aCentauri gravitationally bound? Astrophys J 132:1995–1997.
Williams, D.M. and Gaidos, E. (2008) Detecting the glint ofstarlight on the oceans of distant planets. Icarus 195:927–937.
Williams, D.M. and Kasting, J.F. (1997) Habitable planets withhigh obliquities. Icarus 129:254–267.
Williams, D.M. and Pollard, D. (2002) Habitable planets oneccentric orbits. In The Evolving Sun and Its Influence onPlanetary Environments, ASP Conference Proceedings Vol.269, edited by B. Montesinos, A. Gimenez, and E.F. Guinan,Astronomical Society of the Pacific, San Francisco, p 201.
Wiscombe, W.J. (1980) Improved Mie scattering algorithms.Appl Opt 19:1505–1509.
Wolf, E.T. and Toon, O.B. (2010) Fractal organic hazes providedan ultraviolet shield for early Earth. Science 328:1266–1268.
Wolf, E.T. and Toon, O.B. (2013) Hospitable Archean climatessimulated by a general circulation model. Astrobiology 13:656–673.
Woolf, N.J., Smith, P.S., Traub, W.A., and Jucks, K.W. (2002)The spectrum of Earthshine: a pale blue dot observed fromthe ground. Astrophys J 574, doi:10.1086/340929.
Wordsworth, R. (2015) Atmospheric heat redistribution andcollapse on tidally locked rocky planets. Astrophys J 806, doi:10.1088/0004-637X/806/2/180.
Wordsworth, R. and Pierrehumbert, R. (2014) Abiotic oxygen-dominated atmospheres on terrestrial habitable zone planets.Astrophys J 785:L20.
Wordsworth, R., Forget, F., and Eymet, V. (2010) Infraredcollision-induced and far-line absorption in dense CO2 at-mospheres. Icarus 210:992–997.
Yang, J., Boue, G., Fabrycky, D.C., and Abbot, D.S. (2014)Strong dependence of the inner edge of the habitable zone onplanetary rotation rate. Astrophys J 787:L2.
Youngblood, A., France, K., Loyd, R.O.P., Linsky, J.L., Red-field, S., Schneider, P.C., Wood, B.E., Brown, A., Froning,C., Miguel, Y., Rugheimer, S., and Walkowicz, L. (2016) The
Muscles Treasury Survey. II. Intrinsic Ly a and extreme ul-traviolet spectra of K and M dwarfs with exoplanets. Astro-phys J 824, doi:10.3847/0004-637X/824/2/101.
Yung, Y.L. and DeMore, W.B. (1982) Photochemistry of thestratosphere of Venus: implications for atmospheric evolu-tion. Icarus 51:199–247.
Zahnle, K., Claire, M., and Catling, D. (2006) The loss of mass-independent fractionation in sulfur due to a palaeoproterozoiccollapse of atmospheric methane. Geobiology 4:271–283.
Zellem, R.T., Lewis, N.K., Knutson, H.A., Griffith, C.A.,Showman, A.P., Fortney, J.J., Cowan, N.B., Agol, E., Bur-rows, A., Charbonneau, D., and Deming, D. (2014) The4.5mm full-orbit phase curve of the hot Jupiter HD 209458b.Astrophys J 790, doi:10.1088/0004-637X/790/1/53.
Zerkle, A.L., Claire, M.W., Domagal-Goldman, S.D., Farquhar,J., and Poulton, S.W. (2012) A bistable organic-rich atmo-sphere on the Neoarchaean Earth. Nat Geosci 5:359–363.
Zugger, M.E., Kasting, J.F., Williams, D.M., Kane, T.J., andPhilbrick, C.R. (2010) Light scattering from exoplanet oceansand atmospheres. Astrophys J 723, doi:10.1088/0004-637X/723/2/1168.
Zugger, M.E., Kasting, J.F., Williams, D.M., Kane, T.J., andPhilbrick, C.R. (2011) Searching for water earths in the near-infrared. Astrophys J 739, doi:10.1088/0004-637X/739/1/12.
Address correspondence to:Victoria S. Meadows
Astronomy DepartmentUniversity of Washington
Box 951580Seattle, WA 98195
E-mail: [email protected]
Submitted 30 August 2016Accepted 4 September 2017
Abbreviations Used
E-ELT¼European Extremely Large TelescopeELTs¼ extremely large telescopes
ExAO¼Extreme Adaptive OpticsGCM¼General Circulation Model
HabEx¼Habitable Exoplanet Imaging MissionIWA¼ inner working angle
JWST¼ James Webb Space TelescopeLBLABC¼Line-By-Line Absorption Coefficients
LRS¼Low-Resolution SpectrographLUVOIR¼Large UltraViolet Optical Infrared
Surveyor Telescopemas¼milliarcseconds
MIR¼mid-infraredMIRI¼Mid-Infrared InstrumentMRS¼Medium-Resolution SpectrographNIR¼ near-infraredSED¼ spectral energy distribution
SMART¼Spectral Mapping Atmospheric RadiativeTransfer
SNR¼ signal-to-noise ratioSTIS¼Space Telescope Imaging SpectrographSZAs¼ solar zenith angles
WFIRST¼Wide-Field Infrared Survey Telescope
PROX CEN B: HABITABILITY AND OBSERVABILITY 189
Related Documents


