Geosci. Model Dev., 6, 1941–1960, 2013 www.geosci-model-dev.net/6/1941/2013/ doi:10.5194/gmd-6-1941-2013 © Author(s) 2013. CC Attribution 3.0 License. Geoscientific Model Development Open Access The GREENROOF module (v7.3) for modelling green roof hydrological and energetic performances within TEB C. S. de Munck 1 , A. Lemonsu 1 , R. Bouzouidja 2,3,4 , V. Masson 1 , and R. Claverie 3 1 Météo France, CNRM-GAME, CNRS UMR3589, Centre National de Recherches Météorologiques, Toulouse, France 2 NIDAPLAST, Thiant, France 3 Centre d’Études Techniques de l’Équipement de l’Est, Tomblaine, France 4 Université de Lorraine, LEMTA UMR7563, Vandoeuvre-les-Nancy, France Correspondence to: C. S. de Munck ([email protected]) Received: 21 December 2012 – Published in Geosci. Model Dev. Discuss.: 20 February 2013 Revised: 13 September 2013 – Accepted: 17 September 2013 – Published: 8 November 2013 Abstract. The need to prepare cities for climate change adaptation requests the urban modeller community to im- plement sustainable adaptation strategies within their mod- els to be tested against specific city morphologies and sce- narios. Greening city roofs is part of these strategies. In this context, the GREENROOF module for TEB (town energy balance) has been developed to model the interactions be- tween buildings and green roof systems at the scale of the city. This module, which combines the ISBA model (Inter- action between Soil Biosphere and Atmosphere) and TEB, allows for one to describe an extensive green roof composed of four functional layers (vegetation – grasses or sedums; substrate; retention/drainage layers; and artificial roof lay- ers) and to model vegetation-atmosphere fluxes of heat, water and momentum, as well as the hydrological fluxes through- out the substrate and the drainage layers, and the thermal fluxes throughout the natural and artificial layers of the green roof. TEB-GREENROOF (SURFEX v7.3) should therefore be able to represent the impact of climate forcings on the functioning of green roof vegetation and, conversely, the in- fluence of the green roof on the local climate. An evaluation of GREENROOF is performed for a case study located in Nancy (France) which consists of an instrumented extensive green roof with sedums and substrate and drainage layers that are typical of this kind of construction. After calibra- tion of the drainage layer hydrological characteristics, model results show good dynamics for the substrate water content and the drainage at the green roof base, with nevertheless a tendency to underestimate the water content and overesti- mate the drainage. This does not impact too much the green roof temperatures, which present a good agreement with ob- servations. Nonetheless GREENROOF tends to overestimate the soil temperatures and their amplitudes, but this effect is less important in the drainage layer. These results are encour- aging with regard to modelling the impact of green roofs on thermal indoor comfort and energy consumption at the scale of cities, for which GREENROOF will be running with the building energy version of TEB – TEB-BEM. Moreover, with the green roof studied for GREENROOF evaluation be- ing a type of extensive green roof widespread in cities, the type of hydrological characteristics highlighted for the case study will be used as the standard configuration to model ex- tensive green roof impacts at the scale of cities. 1 Introduction In the literature, green roofs (roofs with a vegetated surface and a growing medium have been credited with a large num- ber of environmental benefits. Many experiments conducted on green roofs have highlighted their potential to reduce roof runoff entering the storm water systems through retention and evapotranspiration. This has been demonstrated at the site scale (Berghage et al., 2009 and Voyde et al., 2010, are two good examples) as well as at the city (Mentens et al., 2006) and landscape (Oberndorfer et al., 2007) scales. Re- duced roof runoff also implies reduced rain water pollutants entering storm water systems (Berndtsson et al., 2009), al- though this benefit may slightly be counterbalanced by the additional source of pollution represented by the green roof Published by Copernicus Publications on behalf of the European Geosciences Union.

Welcome message from author
This document is posted to help you gain knowledge. Please leave a comment to let me know what you think about it! Share it to your friends and learn new things together.
Transcript

Geosci. Model Dev., 6, 1941–1960, 2013www.geosci-model-dev.net/6/1941/2013/doi:10.5194/gmd-6-1941-2013© Author(s) 2013. CC Attribution 3.0 License.
GeoscientificModel Development
Open A
ccess
The GREENROOF module (v7.3) for modelling green roofhydrological and energetic performances within TEB
C. S. de Munck1, A. Lemonsu1, R. Bouzouidja2,3,4, V. Masson1, and R. Claverie3
1Météo France, CNRM-GAME, CNRS UMR3589, Centre National de Recherches Météorologiques, Toulouse, France2NIDAPLAST, Thiant, France3Centre d’Études Techniques de l’Équipement de l’Est, Tomblaine, France4Université de Lorraine, LEMTA UMR7563, Vandœuvre-les-Nancy, France
Correspondence to:C. S. de Munck ([email protected])
Received: 21 December 2012 – Published in Geosci. Model Dev. Discuss.: 20 February 2013Revised: 13 September 2013 – Accepted: 17 September 2013 – Published: 8 November 2013
Abstract. The need to prepare cities for climate changeadaptation requests the urban modeller community to im-plement sustainable adaptation strategies within their mod-els to be tested against specific city morphologies and sce-narios. Greening city roofs is part of these strategies. In thiscontext, the GREENROOF module for TEB (town energybalance) has been developed to model the interactions be-tween buildings and green roof systems at the scale of thecity. This module, which combines the ISBA model (Inter-action between Soil Biosphere and Atmosphere) and TEB,allows for one to describe an extensive green roof composedof four functional layers (vegetation – grasses or sedums;substrate; retention/drainage layers; and artificial roof lay-ers) and to model vegetation-atmosphere fluxes of heat, waterand momentum, as well as the hydrological fluxes through-out the substrate and the drainage layers, and the thermalfluxes throughout the natural and artificial layers of the greenroof. TEB-GREENROOF (SURFEX v7.3) should thereforebe able to represent the impact of climate forcings on thefunctioning of green roof vegetation and, conversely, the in-fluence of the green roof on the local climate. An evaluationof GREENROOF is performed for a case study located inNancy (France) which consists of an instrumented extensivegreen roof with sedums and substrate and drainage layersthat are typical of this kind of construction. After calibra-tion of the drainage layer hydrological characteristics, modelresults show good dynamics for the substrate water contentand the drainage at the green roof base, with neverthelessa tendency to underestimate the water content and overesti-mate the drainage. This does not impact too much the green
roof temperatures, which present a good agreement with ob-servations. Nonetheless GREENROOF tends to overestimatethe soil temperatures and their amplitudes, but this effect isless important in the drainage layer. These results are encour-aging with regard to modelling the impact of green roofson thermal indoor comfort and energy consumption at thescale of cities, for which GREENROOF will be running withthe building energy version of TEB – TEB-BEM. Moreover,with the green roof studied for GREENROOF evaluation be-ing a type of extensive green roof widespread in cities, thetype of hydrological characteristics highlighted for the casestudy will be used as the standard configuration to model ex-tensive green roof impacts at the scale of cities.
1 Introduction
In the literature, green roofs (roofs with a vegetated surfaceand a growing medium have been credited with a large num-ber of environmental benefits. Many experiments conductedon green roofs have highlighted their potential to reduce roofrunoff entering the storm water systems through retentionand evapotranspiration. This has been demonstrated at thesite scale (Berghage et al., 2009 and Voyde et al., 2010, aretwo good examples) as well as at the city (Mentens et al.,2006) and landscape (Oberndorfer et al., 2007) scales. Re-duced roof runoff also implies reduced rain water pollutantsentering storm water systems (Berndtsson et al., 2009), al-though this benefit may slightly be counterbalanced by theadditional source of pollution represented by the green roof
Published by Copernicus Publications on behalf of the European Geosciences Union.

1942 C. S. de Munck et al.: The GREENROOF module for TEB
substrates themselves (Oberndorfer et al., 2007). Consider-ing energy aspects, green roofs have the ability to moder-ate temperature changes within buildings (Castleton et al.,2010), with beneficial consequences on building energy con-sumption (Getter and Rowe, 2006; Castleton et al., 2010;Jacquet, 2011) due to increased thermal mass, shading andevaporative cooling (compared to standard roofs). As for en-ergy savings, it may vary with the season and green roof de-sign (materials and thicknesses), although it seems stronglyinfluenced by the level of insulation of the structural roof(Jaffal et al., 2012). Jacquet (2011) observed for a green roofplot in Montréal a reduction in air conditioning demand insummer of 98.9 and 90.8 % (respective of when the greenroof was irrigated and not) and a milder reduction in heatingdemand in winter (38.3 and 27.4 %, depending again on ir-rigation). All this site-based evidence for green roof benefitshas now contributed to promoting the use of city-scale greenroof infrastructure as a sustainable adaptation strategy for cli-mate change (Bass and Baskaran, 2003; EEA, 2012; Foster atal., 2011; Giguère, 2009; Lawlor et al., 2006; Penney, 2008;USEPA, 2008). The implementation of green roofs as op-posed to urban forests and street trees may represent a morerealistic and efficient greening strategy at the heart of cities,where the building fraction is high (and the ground-base sur-face available for greening scarce) and the initial evapotran-spiration potential low.
The need for taking this research from the building scaleto that of the city is clear, especially in the light of climatechange. A modelling approach is the only realistic way anadaptation strategy such as roof greening can be evaluatedcitywide and for various seasons or long time series, hencethe need for green roof models.
So far, very few studies have attempted to quantify the po-tential of green roof infrastructures at city scale. Three suchstudies were found, but these do not represent green roofs(nor buildings) explicitly. In these studies, building roofsare replaced by natural evaporating surfaces (grass, groundlevel), and energy and hydrological transfers are simulatedwith very simple parameterizations and calibrations. Bass etal. (2003) attempted to quantify the potential of green roofsfor urban heat island (UHI) mitigation using this kind ofmodelling approach. They simulated the greening of 50 %of the available roof surfaces throughout the city of Toronto(by replacing roof surfaces with grass), and predicted a mildcooling over part of the city of the order of 0.5◦C without ir-rigation, and a greater and spatially wider cooling (2◦C) withirrigation of the “green roofs” and the ground-level grass ofthe densest areas of Toronto. Gill et al. (2007) compared theimpact of green roofs on surface temperatures (based on asimple energy balance equation) and runoff (via a standardrunoff curve number approach) for various urban morphol-ogy classes (UMC) for the conurbation of Greater Manch-ester in the UK. They showed that “greening” all roofs madethe most significant contribution to maximum surface tem-perature and runoff reduction in the most urbanized UMCs
(respectively 6.6◦C and 17.6 % for the town centre). Fol-lowing the approach of Bass et al. (2003), Rosenzweig etal. (2009) suggested that a “green roof” infrastructure forNew York City could reduce urban air temperatures by 1.4◦Con average and 3.2◦C at best, which may lead to a reductionin UHI amplitude.
More detailed models are needed for city-scale applica-tions that can explicitly describe green roofs and the ther-mal and hydrological behaviours associated with them, sothat their impacts in terms of building energetics, comfort,UHI and runoff can be more accurately evaluated. With thisaim, a detailed green roof model should be integrated intoan urban canopy model in order to be run under imposed(present or future) climatic conditions or coupled to a mete-orological model. This way the environmental benefits high-lighted at the building scale could be studied and quanti-fied more widely, more accurately and under various climaticconstraints.
In order to set up a strategy for implementing green roofswithin our town energy balance (TEB) urban canopy model(Masson, 2000; Hamdi and Masson, 2008), a review of thetypes of green roof implemented in cities nowadays was pri-marily undertaken (Sect. 2). This allowed for us to deter-mine the main design and functions that a green roof modelshould describe, and consequently the physical processes as-sociated that need to be captured. There followed a reviewof green roof modelling studies to establish an inventory ofexisting green roof models, with regard to both their com-plexity and their research objectives. On these bases, a greenroof parameterization has been developed for TEB. The im-plementation of this GREENROOF module was part of awider effort to implement various types of urban vegetationwithin the model TEB (Lemonsu et al., 2012). The hypothe-sis and the parameterization of GREENROOF are presented(Sect. 3). Then GREENROOF is run for an instrumented ex-tensive green roof plot in the northeast of France (Sect. 4).Within Sect. 4, prior to the actual evaluation, a calibrationexercise is undertaken and presented in order to determinethe hydrological behaviour (and the associated hydrologicalproperties) of the experimental plot drainage layer. Indeed,through this case study we aim to establish from which soiltype the standard materials which form green roof drainagelayers are closest to in terms of their hydrological behaviour.Evaluation results are presented both with regard to the hy-drological and thermal performances of the green roof.
2 Strategy for modelling green roofs within TEB
2.1 Generic design of a green roof and physicalprocesses associated
Green roofs of two types can be found in cities. Those called“rooftop gardens” support fairly large shrubs or trees. Due tothe intensive care needed at implantation and management,
Geosci. Model Dev., 6, 1941–1960, 2013 www.geosci-model-dev.net/6/1941/2013/

C. S. de Munck et al.: The GREENROOF module for TEB 1943
they are commonly called “intensive green roofs”, and aregenerally implemented for recreational use. Those contain-ing only one or two low-profile plant species, and thereforerequiring a minimal growing medium, are called “extensive”.They are often used for improved thermal and hydrologicalperformances (Wark and Wark, 2003), and are thus interest-ing to model as an adaptation strategy.
Based on the technical and scientific literature (Wark andWark, 2003; Lazzarin et al., 2005), a generic design for ex-tensive green roofs can be reached. From top to bottom, theessential components are a layer of vegetation; a layer ofsoil-forming material called substrate, which is the growingmedium for the vegetation; a different soil-forming-materiallayer which helps to control the moisture status of the over-laying substrate (drainage or retention function depending onthe plant species/climate association); and a mandatory wa-terproofing sheet to prevent water damage to the structuralroof. Therefore, the final green roof design can be consideredas the superposition of a “natural” compartment (vegetationand different soil-forming-material layers) and of an artificialcompartment (waterproof and structural roof materials).
In addition, experimental studies on pilot green roofs (forexample Bass and Baskaran, 2003; Berghage et al., 2009;Jacquet, 2011; Jim and He, 2010; Jim 2011; Jim and Peng,2011; Nardini et al., 2012) have highlighted heat and watertransfers within these “natural” layers which are similar tothose which establish themselves within ground-level natu-ral surfaces except for specific limit conditions. The transfersinvolved in a natural surface, be it at ground or roof level, areenergetic, thermal and hydrological. The energy balance re-sults in the balance between the surface net radiation and thelatent, sensible and storage heat fluxes. Heat conduction andstorage occur and can be strongly influenced by soil moisturecontent. But unlike open ground natural surfaces, for greenroof natural surfaces, the heat gains or losses from the ther-mal contact with the bearing roof should be considered. Interms of hydrological transfers, a green roof surface behaveslike any other natural surface (vertical water fluxes dependon soil moisture gradients, drainage occurs if super-saturatedconditions appear and surface runoff may establish duringrainfall events) except that the hydrological characteristicsof green roof soil-forming materials are very different fromthose of natural soils, and that the water drained out of agreen roof base is lost “in favour of” the rainwater network.These differences do not change the nature of the transfers in-volved, but act rather as boundary conditions for these trans-fers.
Therefore, it seems realistic to make the hypothesis thatthe natural layers of green roofs could be simulated by a stan-dard soil–vegetation model incorporating the boundary con-ditions presented and, i.e. the finite dimension of the greenroof and the presence of a structural built roof at its base.
2.2 The state of the art in green roof modelling
The current state of the art in green roof models highlightstwo modelling topics: that of the energy performance, andthat of the hydrological performance; the modelling of bothis rarely combined. The simple thermal and hydrological ap-proaches are not presented here because they do not meet thecriteria defined in the objectives presented.
All the detailed models of heat transfer (Alexandri andJones, 2007; Del Barrio, 1998; Kumar and Kaushik, 2005;Ouldboukhitine et al., 2011; Sailor, 2008 – also known as theEcoroofmodule forEnergyPlus) have in common an explicitdescription of green roofs, which takes into account a struc-tural roof model, a soil model and a canopy model. Whilethe energy balance at the green roof surface is performedin a more or less complex way (especially with regard tomodelling the behaviour of the vegetation), the heat trans-fer is subsequently simulated by all these models based ona standard conduction equation. As far as modelling vegeta-tion behaviour is concerned, all models parameterize vegeta-tion transpiration as a function of the meteorological condi-tions and the gaseous equilibrium which establishes betweenthe outside and the inside of the plant (via the plant stom-atal resistance) – except that of Ouldboukhitine et al. (2011),which uses a simpler formulation (Penman–Monteith). Al-though these models account for the hydrological status ofthe green roof, it is with the sole purpose of computing soileffective thermal characteristics (as in function of soil mois-ture). Soil moisture status is either measured or estimated viaa simple or a mixed form of Richards equation, but hydro-logical performance is generally not evaluated.
Most of the studies aimed at modelling the hydrology ofgreen roofs (Hilten et al., 2008; Palla et al., 2009, 2012) haveused the HYDRUS software (Simunek et al., 1994, 2005),whose most recent version also takes into account the heattransfer (Yu and Zheng, 2010). This calibrated model relieson the Richards equation and on the hydraulic functions ofVan Genuchten (1980) and Mualem (1976) to simulate theprocesses of infiltration, lateral flow and surface runoff andpredict moisture content profiles. Although very detailed,this model needs user-input evapotranspiration rates, whichmust therefore be estimated by other means. For numericalreasons (finite element method), HYDRUS works at very finespatial resolutions. The work of Palla et al. (1999) is a goodexample of this resolution: they used 3695 grid elements tosimulate a roof of 215 cm long by 46 cm thick. Consequently,a model such as HYDRUS is used to evaluate the hydrolog-ical performance of individual green roofs at small temporalscales such as a hydrological event (generally a few hours),but its computing cost due to its fine spatial resolution is notappropriate for city-scale applications.
In summary, even if most models are able to capture thedominant processes involved in green roof soil and structuralcompartments, none of them currently couple a combinedmodelling of thermal and hydrological processes that could
www.geosci-model-dev.net/6/1941/2013/ Geosci. Model Dev., 6, 1941–1960, 2013

1944 C. S. de Munck et al.: The GREENROOF module for TEB
be used on the scale of a city and for long time periods. Thepresence and impact of drainage or retention layers are alsonot simulated, even though these layers play a major role,not only with regard to hydrological performance but also interms of thermal performance, as evidenced in the work ofJim and Tsang (2011). Finally, the difficulty encountered byall models remains the calibration, as is the case for all mod-els with these levels of complexity.
2.3 Strategy for the inclusion of green roofs within TEB
As established previously, the heat and water transfers in-volved in the natural layers of green roofs (atmosphere, vege-tation, and substrate and hydrological control layers) are sim-ilar to those of perfectly natural surfaces. They can thereforebe simulated, as is the case in the models previously exam-ined, by a standard soil and vegetation model, provided that itis calibrated to reflect the peculiar characteristics of the soil-forming materials used for the construction of green roofs.Therefore, the strategy proposed and ultimately retained forthe inclusion of green roofs within TEB is to use a soil andvegetation model that can not only be calibrated for a spe-cific soil but would also have the ability to overcome thelimitations of existing models. The ideal model should allowfor a coupled modelling of green roof hydrological and ener-getic performances, employ sufficiently detailed parameter-izations to describe the physical processes involved (includ-ing evapotranspiration and soil water flows), and at the sametime have spatial resolutions (i.e. time calculations) suitablefor modelling applications at city scale.
3 A green roof module for TEB
3.1 Current modelling of the urban climate with TEB
Urban climate modelling at the National Centre for Meteo-rological Research (CNRM-GAME) of Météo France relieson the use of the SURFEX land surface modelling system(Masson et al., 2013). It characterizes a study area based onfour land use types (urban, natural, freshwater, and sea andocean surfaces), and computes the exchange of heat, waterand momentum between each type of surface and the atmo-sphere. More specifically, SURFEX features TEB (Masson,2000) for solely urban surfaces and the ISBA model (Inter-action between Soil Biosphere and Atmosphere) developedby Noilhan and Planton (1989) for natural and agriculturalsurfaces.
For TEB, the urban landscape is simplified as a networkof street canyons of infinite length. Within each surface re-solved by the model (also called mesh), it is possible to spec-ify the geometric, radiative and thermal characteristics of anaverage street canyon represented (for equiprobable streetorientations) or to fix these features street canyon by streetcanyon (for different street directions). TEB simulates theexchange of heat and water for three generic surfaces (roof,
wall and road) and computes the urban microclimate vari-ables at street level, as well as energy and water budgets fromthe neighbourhood to the city scale (Lemonsu et al., 2004,2010; Offerle et al., 2005; Pigeon et al., 2008) and the feed-back on the meteorological variables, when it is coupled toan atmospheric model (de Munck et al., 2013; Lemonsu andMasson, 2002). Recently, to better describe the finer scaleinteractions between artificial surfaces and natural surfacesfound within cities, the ISBA model used for natural andagricultural surfaces has been integrated within TEB (result-ing in the TEB-Veg configuration) and evaluated by Lemonsuet al. (2012). Given the modelling strategy retained and theaim to optimize source code development while retaining themodular structure of the SURFEX tool, an approach similarto Lemonsu et al. (2012), relying on ISBA, was consideredwell adapted and detailed enough to characterize and simu-late water, energy and momentum fluxes within the naturallayers of green roofs.
3.2 Using ISBA-DF coupled with TEB for modellinggreen roofs
Beyond being part of the SURFEX platform and being usedin the weather forecast model of Météo France, the advan-tages of ISBA are numerous: since 1989, the year of its ini-tial formulation by Noilhan and Planton (1989), it has beenconstantly enriched with detailed representations of physicalprocesses (including surface atmosphere processes and hy-drological and thermal transfers within the soil) as well asevaluated (Masson et al., 2013). Using ISBA for the naturallayers of roofs makes it possible to have a model that offersa good compromise in terms of accuracy and computationalcosts for local- to global-scale applications, while allowingfor the opportunity to benefit from various other options (e.g.carbon sequestration) and future improvements.
3.2.1 Estimation of evapotranspiration
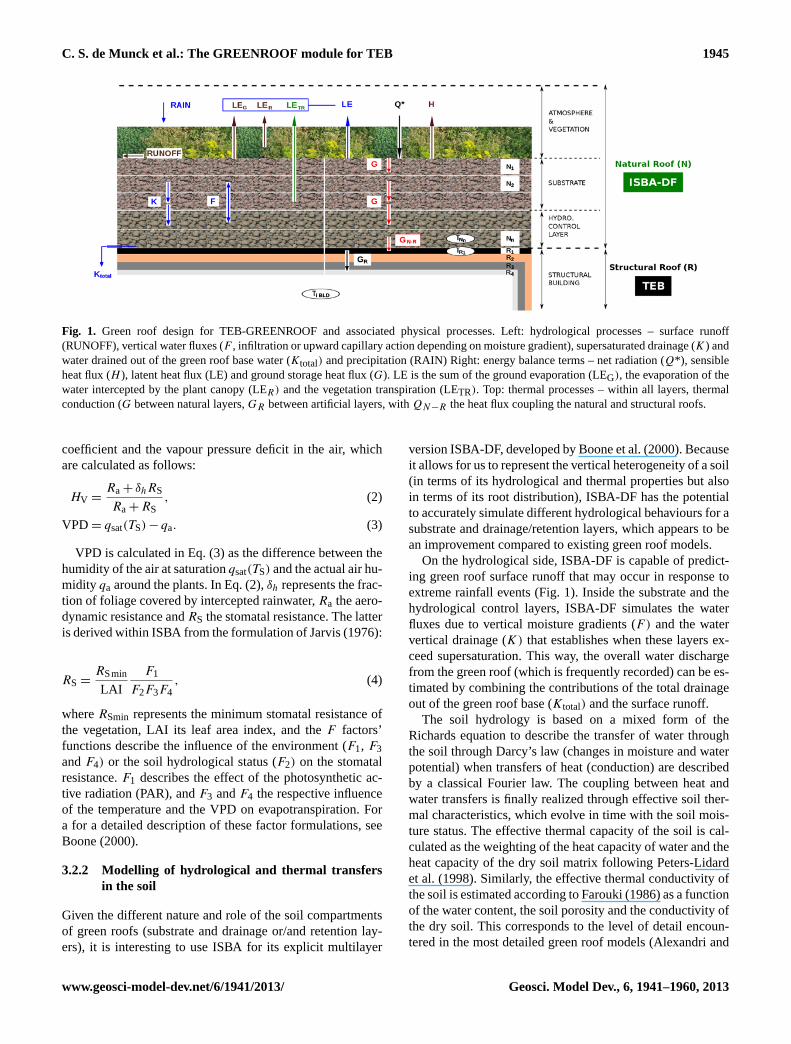
Whatever the version, ISBA uses a detailed parameteriza-tion for the estimation of evapotranspiration, which is an es-sential component of green roof water balance. The trans-fer of heat and water between the atmosphere, the vegetationand the soil compartments of the green roofs is simulatedthrough surface fluxes (Fig. 1), which are connected to eachother through the latent heat flux (LE), which is the sum ofthe plant transpiration (LETR), the soil evaporation (LEG),and the evaporation of the water intercepted by plant foliage(LEV). These fluxes are estimated by detailed parameteriza-tions, especially plant transpiration (LETR), which is, in theISBA standard version, estimated as follows:
LETR = FvegρaCHVaHV(VPD), (1)
whereFveg is the fraction of vegetation covering the ground;ρa the air density;CH the turbulent exchange coefficient;Vathe wind speed; andHV and VPD respectively the Halstead
Geosci. Model Dev., 6, 1941–1960, 2013 www.geosci-model-dev.net/6/1941/2013/
C. S. de Munck et al.: The GREENROOF module for TEB 1945
Fig. 1. Green roof design for TEB-GREENROOF and associated physical processes. Left: hydrological processes – surface runoff(RUNOFF), vertical water fluxes (F , infiltration or upward capillary action depending on moisture gradient), supersaturated drainage (K) andwater drained out of the green roof base water (Ktotal) and precipitation (RAIN) Right: energy balance terms – net radiation (Q*), sensibleheat flux (H ), latent heat flux (LE) and ground storage heat flux (G). LE is the sum of the ground evaporation (LEG), the evaporation of thewater intercepted by the plant canopy (LER) and the vegetation transpiration (LETR). Top: thermal processes – within all layers, thermalconduction (G between natural layers,GR between artificial layers, withQN−R the heat flux coupling the natural and structural roofs.
coefficient and the vapour pressure deficit in the air, whichare calculated as follows:
HV =Ra+ δhRS
Ra+RS, (2)
VPD = qsat(TS)− qa. (3)
VPD is calculated in Eq. (3) as the difference between thehumidity of the air at saturationqsat(TS) and the actual air hu-midity qa around the plants. In Eq. (2), δh represents the frac-tion of foliage covered by intercepted rainwater,Ra the aero-dynamic resistance andRS the stomatal resistance. The latteris derived within ISBA from the formulation of Jarvis (1976):
RS =RSmin
LAI
F1
F2F3F4, (4)
whereRSmin represents the minimum stomatal resistance ofthe vegetation, LAI its leaf area index, and theF factors’functions describe the influence of the environment (F1, F3andF4) or the soil hydrological status (F2) on the stomatalresistance.F1 describes the effect of the photosynthetic ac-tive radiation (PAR), andF3 andF4 the respective influenceof the temperature and the VPD on evapotranspiration. Fora for a detailed description of these factor formulations, seeBoone (2000).
3.2.2 Modelling of hydrological and thermal transfersin the soil
Given the different nature and role of the soil compartmentsof green roofs (substrate and drainage or/and retention lay-ers), it is interesting to use ISBA for its explicit multilayer
version ISBA-DF, developed by Boone et al. (2000). Becauseit allows for us to represent the vertical heterogeneity of a soil(in terms of its hydrological and thermal properties but alsoin terms of its root distribution), ISBA-DF has the potentialto accurately simulate different hydrological behaviours for asubstrate and drainage/retention layers, which appears to bean improvement compared to existing green roof models.
On the hydrological side, ISBA-DF is capable of predict-ing green roof surface runoff that may occur in response toextreme rainfall events (Fig. 1). Inside the substrate and thehydrological control layers, ISBA-DF simulates the waterfluxes due to vertical moisture gradients (F) and the watervertical drainage (K) that establishes when these layers ex-ceed supersaturation. This way, the overall water dischargefrom the green roof (which is frequently recorded) can be es-timated by combining the contributions of the total drainageout of the green roof base (Ktotal) and the surface runoff.
The soil hydrology is based on a mixed form of theRichards equation to describe the transfer of water throughthe soil through Darcy’s law (changes in moisture and waterpotential) when transfers of heat (conduction) are describedby a classical Fourier law. The coupling between heat andwater transfers is finally realized through effective soil ther-mal characteristics, which evolve in time with the soil mois-ture status. The effective thermal capacity of the soil is cal-culated as the weighting of the heat capacity of water and theheat capacity of the dry soil matrix following Peters-Lidardet al. (1998). Similarly, the effective thermal conductivity ofthe soil is estimated according to Farouki (1986) as a functionof the water content, the soil porosity and the conductivity ofthe dry soil. This corresponds to the level of detail encoun-tered in the most detailed green roof models (Alexandri and
www.geosci-model-dev.net/6/1941/2013/ Geosci. Model Dev., 6, 1941–1960, 2013

1946 C. S. de Munck et al.: The GREENROOF module for TEB
Fig. 2.Source code organization of GREENROOF within TEB-Veg and SURFEX.
Jones, 2007; Del Barrio, 1998; Sailor, 2008). In ISBA-DF, allthe soil intrinsic characteristics, be they thermal or hydrolog-ical, are estimated based on a set of pedotransfer functionsand prognostic equations described in Boone et al. (2000)and Decharme et al. (2011).
The added value of the ISBA-DF version with regard toevapotranspiration comes from a better calculation of theF2factor (Eq.4). Indeed, contrary to the standard version ofISBA, which estimates a uniform stress factor for the entirecolumn of soil, ISBA-DF uses the vertical profiles for rootdistribution and water content to compute a vertical distribu-tion for F2:
F2(j)=w(j)−wwilt (j)
wfc(j)−wwilt (j), (5)
wherewwilt (j) andwfc(j) are respectively the water contentsat wilting point and field capacity of the layerj of soil. Us-ing ISBA-DF for green roof natural layers allows for us tospecify a root distribution profile only within the substrate
layers (and not beyond within the drainage or retention lay-ers).
This constitutes a good level of detail considering the spa-tial scale aimed at, and should assist in accurately simulatingthe energy balance at the surface of the green roof, and con-sequently the heat conduction (G) into the substrate and thelayers beyond, which is essential to ensure a good predictionof heat transfers within the entire green roof system.
3.2.3 Coupling ISBA-DF with TEB
The green roof design retained for GREENROOF allows forfour distinct compartments or layers to be modelled (Fig. 1):from top to bottom, a compartment for vegetation which in-teracts with the atmosphere, a layer of substrate (in whichlies the root system of the vegetation), a layer that con-trols the hydrological exchange with the substrate above (re-tention/drainage layer) and a compartment to represent thestructural building and any artificial roof layers installed
Geosci. Model Dev., 6, 1941–1960, 2013 www.geosci-model-dev.net/6/1941/2013/
C. S. de Munck et al.: The GREENROOF module for TEB 1947
(waterproofing or thermal insulation membranes and layersof the bearing roof).
Modelling this physical design within GREENROOF im-plies a configuration with two models: ISBA-DF to simulatethe exchange of heat and water in the natural layers of theroof, and TEB to simulate heat exchange within the artificiallayers of the roof which have no biological role and withinwhich no transfer of water is involved. The structure of theresulting source code is presented in Fig. 2. This two-schemeconfiguration requires implementation of a thermal couplingbetween the base of the hydrological control layer (managedby ISBA-DF) and the artificial layers of the roof (managedby TEB). This coupling is realized in two ways – one waythrough the interfacial heat conduction flux, the other wayvia the temperatures of the layers in contact. TEB is coupledto ISBA through the interfacial heat conduction flux (GN−R)
that establishes between the deepest sub-layer (referred to aslayern) of the natural green roof and the top sub-layer (layer1) of the artificial roof with which the natural roof is in con-tact:
GN−R = λN−R
(TNn − TR1
), (6)
TNn andTR1 are, respectively, the temperatures of the deepestsub-layer of the natural roof and the top layer of the artificialroof. λN−R is the interfacial thermal conductivity betweenthe two layers, approximated by
λN−R =2λNn1zNn
, (7)
with λNn the effective thermal conductivity of the bottomlayer of the natural roof and1zNn its thickness. This modi-fies the equation predicting the temperature evolution of thetop layer of the structural roof (Eq. 1a of Masson, 2000):
CR1
∂TR1
∂t=(1− fGR)
dR1
(Q∗
R1−HR1 − LER1 −GR1−R2
)+fGR
dR1
(GN−R −GR1−R2
), (8)
whereCR1 is the thermal capacity of the artificial layer incontact with the natural roof;fGR the fraction of roof vege-tated; andQ∗
R1,HR1, LER1,GR1−R2 the terms of the surface
energy balance for the fraction of roof not vegetated.Then, to ensure the continuity in temperature, ISBA is cou-
pled to TEB by recalling the temperature of the deepest layerof the green roof to that of the top artificial layer of the struc-tural building at each time step.
Due to the presence of waterproofing membranes, no hy-drological coupling is required between the soil–vegetationmodel and the building model, and the excess water and thewater that percolates leaves the system and are collated as the“green roof outlet drainage”. This will allow for connectionto urban drainage systems when these are developed withina future version of TEB.
3.3 GREENROOF input parameters
For a given green roof design, the three natural compart-ments implemented in the GREENROOF module (vegeta-tion, substrate and hydrological control layers) can be initial-ized (Table 1). The study of the scientific and technical liter-ature shows that the plant species the most commonly usedon green roofs are grasses (Gramineae) or sedums (Sedum)or a mixture of both. However, sedums are more frequentlyused for green roofs implemented under a dry climate dueto their ability to stand the conditions inherent in this typeof climate. Sedums are low-growing succulent plants of theCrassulaceae family, and are categorized as crassulacean acidmetabolism (CAM) plants, CAM being one of three mecha-nisms for the uptake of CO2 (photosynthesis) with C3 andC4. Under the CAM photosynthesis pathway, sedums canwithstand long periods of heat and water stress (Carter andButler, 2008; Durhman et al., 2006; Van Woert et al., 2005;Wolf and Lundholm, 2008) by partially closing their stomataduring the day (hence reducing or inhibiting transpiration),and opening them at night to fix CO2 for later use in photo-synthesis. Many sedums are facultative CAM, meaning thatthey can switch to a C3 photosynthetic pathway when wateris again available. This ability makes them very water-use-efficient, which is why they are well adapted for extensivegreen roofs (thin layer of growing medium). However thisphotosynthetic pathway CAM (or CAM-C3) is not parame-terized in standard vegetation models (including ISBA), andeven providing standard input values for this type of vegeta-tion is a delicate task because few data have been published.Even if the lack of data did not allow for a parameteriza-tion of sedum transpiration mechanisms to be establishedand implemented in GREENROOF, an attempt to charac-terize sedums for ISBA-DF has been undertaken, bearingin mind the objective to eventually simulate the differencesin characteristics and functioning inherent to the two typesof vegetation commonly found on green roofs. To this end,two options for green roof vegetation have been establishedin GREENROOF and are provided to the user: theGRASSoption (herbaceous lawn) and theSEDUM option (sedumlawn). Default characteristics forGRASSwere already avail-able in the standard version of ISBA-DF. A set of values wasfinally collected in the literature to characterize the typeSE-DUM (Table 2).
Ultimately, it is mainly the characterization of the sub-strate and hydrological layers which is a crucial and chal-lenging step as the soil-forming materials implemented ongreen roofs are very different from the standard soils. Thisis discussed further in the next paragraph via a case study.The characterization of the artificial layers (Table 1) whichmay be added to the initial roof upon green roof implanta-tion (such as insulation or waterproofing layers) is performedwithin the TEB model.
www.geosci-model-dev.net/6/1941/2013/ Geosci. Model Dev., 6, 1941–1960, 2013

1948 C. S. de Munck et al.: The GREENROOF module for TEB
Table 1.GREENROOF model input parameters (T and H refer respectively to a thermal and a hydrological parameter).
Parameter (unit)
Design Fraction of structural roof vegetated (–)Number of green roof sub-layers used for calculation and their respective depths (m)
Vegetation Type (herbaceous lawn or sedum lawn)Fraction of vegetation covering the vegetated ground (–)LAI (–)Albedo (–)Emissivity (–)Minimum stomatal resistance (s m−1)
Roughness length for momentum (m)
Substrate and hydrologicalcontrol sub-layers
Initial soil moisture (soil water index) for surface, root layers and hydrological sub-layersInitial soil-forming-material temperature for surface, root layers and hydrological sub-layers
Substrate and hydrological con-trol sub-layers
T: Dry soil thermal conductivity (W m−1 K−1)
T: Dry soil heat capacity (J m−3 K−1)
H: Porosity (m3 m−3)
H: Saturated hydraulic conductivity (m s−1)
H: Matrix potential at saturation (m)H: b coefficient for water retention curve (–)H: Water content at field capacity (m3 m−3)a
H: Water content at wilting point (m3 m−3)a
Artificial layers added to thestructural roof (TEB)
Total number of layers of the artificial roof and their respective thicknesses (m)Albedo of the top artificial layer (–)Emissivity of the top artificial layer (–)Thermal conductivity (W m−1 K−1)
Heat capacity (J m−3 K−1)
a for hydrological control sub-layers, only used to initialize water contents.
Table 2.Vegetation characteristics for SEDUM compared to those of GRASS (defined according to the default values proposed by Massonet al., 2003).
GREENROOF parameter (unit) Value (GRASS) Value (SEDUM) Method for SEDUM (Source)
Fraction of vegetation covering the ground (–) 0.9 0.9 Chosen identical to that of GRASSLeaf area index (–) 2 3 Measured (CRITT Horticole, 2012)Longwave albedo (–) 0.300 0.154 Measured (Doya, 2011)Shortwave albedo (–) 0.100 0.154 Measured (Doya, 2011)Emissivity (–) 0.95 0.83 Measured (Feng et al., 2010)Minimal stomatal resistance (s m−1) 40 150 Chosen higher than that for GRASS (Sect. 3.3)Roughness length for momentum (m) 0.01 0.01 Chosen identical to that of GRASS
4 Calibration and evaluation of GREENROOF for astandard case study
For standard applications of ISBA to natural soils, the ther-mal characteristics for dry soil and the hydrological char-acteristics are deduced from empirical formulations, calledpedotransfer functions, which connect these characteristicsto the user-input soil texture properties (sand and clay frac-tions, Decharme et al., 2011). But the pedotransfer func-tions derived for natural soils are not really adapted to
the soil-forming materials constituting the substrate or thedrainage layers of a green roof. Consequently, whenever pos-sible, it is better to directly input GREENROOF with green-roof-specific thermal and hydrological characteristics. How-ever, when thermal characteristics for green roof materialsare available, hydrological characteristics are not only hardto find but also consist in lab measurements which do not re-flect in situ conditions such as soil compaction or root pres-ence/growth. Indeed, root growth results in the formation of
Geosci. Model Dev., 6, 1941–1960, 2013 www.geosci-model-dev.net/6/1941/2013/

C. S. de Munck et al.: The GREENROOF module for TEB 1949
Fig. 3. Location (top) and design (bottom) of the green roof exper-imental plot modelled, showing the positions of the various sensors(red squares for temperature sensors, blue circle for water contentand matrix potential sensor and star for drainage water gauge).
soil microstructures, which modifies the intrinsic soil hydro-logical behaviour. Consequently, a calibration exercise is un-dertaken to best fit green roof hydrological characteristics toin situ conditions as well as to the GREENROOF module.
4.1 Case study experimental data
The GREENROOF module is evaluated against observationsat a single site. This exercise is based on the experiment con-ducted by the Centre d’Etudes Techniques de l’Equipementde l’Est [CETE] in the northeast of France near the city ofNancy. The research team at the CETE has designed an ex-periment with the aim of studying the relations between thethermal and hydrological characteristics of green roof sys-tems and their thermal and hydrological behaviours for a setof vegetation/substrate/drainage layer combinations (Fig. 3).Due to their location, the plots are exposed to a temperateoceanic climate.
The green roof plot studied, whose surface is 75 m2, iscomposed of three natural layers of significant thicknesses(Fig. 3): a vegetation layer, a manufactured growing medium(substrate) and a drainage layer underneath. In addition, thetransfer of fine substrate particles into the drainage layer isprevented by a 1.9 mm thick filter sheet which lets the waterpass (geotextile material with high hydrological conductiv-ity). In order to improve the energy performance of the build-ing, an insulating layer of 60 mm has been installed betweenthe base of the green roof compartment and the structuralroof. Finally, two 3 mm thick waterproofing membranes oneither side of the insulating layer prevent water damage to theinsulator and the structural roof. The vegetation is a freshly
established (2-month old) sedum lawn consisting of a mix-ture of seven species (Sedum album, Sedum reflexum larix,Sedum reflexum germanium, Sedum spurium, Sedum sexan-gulare, Sedum floriferum, and Sedum hispanicum: Fig. 3).The substrate, manufactured by the firm Falienor, is widelyused in extensive green roof implementations. The drainagelayer consists of expanded clay granules (2–10 mm grainsize) manufactured by the firm Leca®. Therefore, this greenroof plot is fairly representative of the green roofs which arenowadays implemented in cities.
The evolution of the thermal and hydrological statuswithin the green roof is recorded as shown in Fig. 3. Soiltemperatures are recorded using PT100 sensors at differentdepths, including the soil surface, near the centre of the plot(0, 10, 96, 105 and 148 mm). Soil water content and ma-trix potential are provided by a TDR probe at a single depth(66 mm), and the excess water which is drained out of thesubstrate and drainage layers is measured with a tipping-bucket water gauge at the base of the green roof (wateroutlet). In addition, a weather station situated on the roofat 1.40 m above green roof surface provides air tempera-ture, wind speed and relative humidity as well as global in-coming solar radiation at a 10 min temporal resolution. Thetime series available for all of these data run from 4 July to29 November 2011.
4.2 Numerical setup for the case study
This study focuses on the green-roofed plot and its surround-ing environment, the scale at which observations are avail-able. Consequently, simulations are carried out on one gridpoint. To simulate atmospheric conditions to which the greenroof is exposed, a series of locally observed meteorologicalfields are prescribed hourly to the GREENROOF module: at-mospheric pressure, shortwave incoming solar radiation (di-rect and diffuse), longwave incoming radiation, air tempera-ture and relative humidity, average wind speed and precipi-tation (rain and snow). The weather station installed on thegreened roof provides air temperature and relative humidity,as well as average wind speed and global incoming solar ra-diation. The global incoming solar radiation is assumed to beabout 80 % direct and 20 % diffuse. Precipitation and atmo-spheric pressure are provided by the nearest Météo Franceweather station (which is about 130 m from the green roofplot; see Fig. 3). Finally, since the infrared incoming radi-ation (LW↓) which must be prescribed to the model is notavailable at any of the two stations, it is firstly establishedfor clear sky conditions (LW↓CS) according to the Stefan–Boltzmann law (Eq.9), with air emissivity (εa) calculatedaccording to Prata (1996) after its temperature (Ta) and hu-midity. Then it is modulated following Diak et al. (2000)to account for the longwave re-emission of the cloud cover(fC observed at the nearest Météo France weather station,Eq. (10) – assuming that the cloud temperature is equivalentto that of the surrounding air and cloud emissivity is equal
www.geosci-model-dev.net/6/1941/2013/ Geosci. Model Dev., 6, 1941–1960, 2013

1950 C. S. de Munck et al.: The GREENROOF module for TEB
to 1).
LW↓
CS = εaσT4a (9)
LW↓= (1− fC)LW↓
CS+ fCσT4a , (10)
whereσ is the Stefan–Boltzmann constant.To model the studied plot with GREENROOF, the three
natural layers of the roof (vegetation, substrate and drainagelayer) are simulated by the ISBA-DF model, while the ar-tificial layers (the two waterproofing membranes on eithersides of the insulator, and the initial structural layers of theroof) are simulated by the TEB model. Both the thermal andhydrological influences of the particle filter are considerednegligible because of its low thickness and high water con-ductivity. Finally, to ensure numerical stability in model runs,and in order to extract temperature and water content modelestimates at the same vertical levels as those measured onthe plot, the substrate and drainage layers were subdividedrespectively into three and two vertical sub-layers.
4.3 Initialization of green roof thermal parameters
Values for radiative and thermal characteristics (referred to asT in Table 1) of all green roof layers, be they natural or artifi-cial, were either recovered from the technical literature (sup-pliers or manufacturers of similar products), measured byBouzouidja (in the laboratory or in situ on the study plot) orretrieved from the scientific literature. A compilation of thesevalues is presented in Table 3. Note that the value retainedfor the dry soil thermal conductivity of the case study sub-strate is within the range of thermal conductivities reported inSailor (2008) for eight different green roof substrates at 0 %soil moisture (0.14–0.21 W m−1 K−1), and this informationis well correlated with the substrate density (800–851 kg m−3
according to Bouzouidja, 2012, and Falienor, 2010). Its heatcapacity is slightly above the range of those measured bySailor et al. (2008: 950 760–1 246 000 J m−3 K−1) but of asimilar order of magnitude.
4.4 Methodology for the calibration of green roofhydrological parameters
The first step of this calibration consists in compiling the val-ues available, for each of the six hydrological characteristicsneeded as model inputs, (referred to as H in Table 1) in thesame way as for thermal parameters (technical and scientificliterature, measurements). The water contents at field capac-ity and wilting point are prescribed from in situ observations,leaving only four hydrological characteristics to initialize forboth the substrate and the drainage layer: the porosity, whichrepresents the maximum interstitial space available for wa-ter; the saturated hydraulic conductivity, which correspondsto the infiltration rate of the water when the soil is saturated;the soil matrix potential at saturation, which corresponds tothe pressure required to extract water from a soil matrix sat-urated with water; and finally the coefficient of the water
retention curve used in ISBA, calledb, which relates the ma-trix potential to the water content of a soil matrix accordingto the formulation of Clapp and Hornberger (1978). Theb co-efficient is an empirical coefficient which varies according tosoil type, and can be determined by regression based on ob-servations. This method can be used for the substrate layerfor which the hydrological status is continuously recorded(Fig. 3), and is applied to two sets of relevant porosity–matrix-potential combination (developed in Appendix A).
Things are slightly more complex for the drainage layer.Indeed, due to the double porosity of this layer (macrop-orosity of the matrix and microporosity of the expanded claygranules) and the lack of data for initializing the matrix po-tential at saturation andb coefficient, a calibration exerciseis run. The objective of this exercise is to determine – fromthree typical hydrological behaviours, organic matter (OM),SAND or CLAY – the one that best corresponds to this soil-forming material in GREENROOF. Therefore, the calibra-tion exercise consists in running three simulation ensemblesdiffering in the initialization of their drainage layer. Based onthe green roof hydrological characteristics listed in Table 4,ensemble members are obtained by the combination of twodrainage layer parameter values (matrix potential at satura-tion andb coefficient, written in italics in Table 4) with allthe other substrate-drainage characteristic values, resultingin 32 simulations per ensemble. Each of them is then run andthe outputs are compared against local observations to iden-tify the best ensemble to model the hydrology of the casestudy plot.
The calibration period is chosen carefully, firstly to cali-brate GREENROOF at a time when many processes are ac-tive (presence of rain, vegetation fully developed and photo-synthetically active), and secondly when the plot conditionsare closest to what GREENROOF is capable of modelling.Indeed, a device with stoppers has been installed betweenthe green roof base and the tipping-bucket water gauge. Thisdevice may allow for a water blade of varying height to beretained, when it exists, by using these stoppers placed atdifferent heights of the outlet (multiples of 15 mm). It is in-tended to keep water on the roof for use during dry spells orto delay and reduce roof runoff peaks during heavy rainfallevents. Obviously, this device, which consists in an experi-mental setup, could complicate the analysis of the calibra-tion exercise presented herein since it prevents part of thewater that is drained out of the drainage layer from beingrecorded. As GREENROOF does not seek to simulate thisdevice, which is not generally implemented on green roofs,and as the dates at which these stoppers were installed areknown (two stoppers between 10 July and 8 August and be-tween 28 October and 29 November, one stopper between9 August and 27 October 2011), the calibration period cho-sen was when fewer stoppers were installed, from 10 Augustto 9 September 2011.
Geosci. Model Dev., 6, 1941–1960, 2013 www.geosci-model-dev.net/6/1941/2013/

C. S. de Munck et al.: The GREENROOF module for TEB 1951
Table 3. General and thermal characteristics of green roof substrate, drainage layers and roof artificial layers (values in bold are used insimulations).
Characteristics (unit) Value Method (Source)
SUBSTRATE
Thickness (m) 0.08 Measured (Bouzouidja, 2012)
Dry unit weight of soil particles(kg m−3)
2610 Deduced from Falienor (2010)
Dry soil thermal conductivity(W m−1 K−1)
0.15 Measureda (Bouzouidja, 2010)
Dry soil heat capacity(J m−3 K−1)
1 342 000 Measuredb (Bouzouidja, 2010)
DRAINAGE
Thickness (m) 0.05 Measured (Bouzouidja, 2012)
Dry unit weight of soil particles(kg m−3)
570 Supplier information (Leca®, 2009)
Dry soil thermal conductivity(W m−1 K−1)
<0.110.1250.1130.075–0.090
Supplier information (Leca®, 2009)Manufacturer information (SILRES®, 2012)Manufacturer information (Sinclair, 2012)Ochs et al. (2006)
Dry soil heat capacity(J m−3 K−1)
331 500 Deducted from manufacturer information (Sinclair,2012) according to density
ARTIFICIAL
Material/function5 layers, from top (1) to bot-tom (5)
(1) waterproofing membrane(2) insulating sheet (PIRc)(3) waterproofing membrane(4) insulator(5) concrete
(1) Supplier information (SOPREMA®, 2012a)(2) ACERMI (2009)(3) Supplier information (SOPREMA®, 2012b)(4 to 5) Deducted from building type and age(Lemonsu et al., 2011)
Thickness (m) (1)0.003(2) 0.060(3) 0.003(3) 0.10(4) 0.20
(1) Supplier information (SOPREMA®, 2012a)(2) Supplier information (RECTICEL®, 2012)(3) Supplier information (SOPREMA®, 2012b)(4 and 5) Deducted from building type and age(Lemonsu et al., 2011)
Thermal conductivity(W m−1 K−1)
(1) 0.7(2) 0.024(3) 0.7(4) 0.035(5) 2.3
(1 and 3) Deducted from building type and age(Lemonsu et al., 2011)(2) ACERMI (2009)(4 and 5) Deducted from building type and age(Lemonsu et al., 2011)
Heat capacity (J m−3 K−1) (1) 2 100 000(2) 44 800(3) 2 100 000(4) 75 000(4) 2 300 000
(1 and 3) Deducted from building type, age andusage (Lemonsu et al., 2011)(2) Deducted from BING (2006) and Kalzip®
(2010) based on density (RECTICEL®, 2012)(4 and 5) Deducted from building type, age andusage (Lemonsu et al., 2011)
a for a similar substrate, mean between−10 and 50◦C. b for a similar substrate, at 20◦C. c polyisocyanurate foam with aluminium layer.
Over the calibration period, a systematic calculationof simulation statistical scores is undertaken to compareGREENROOF results to observations by focusing on the hy-drological variables available on site (substrate water contentand outlet drainage). The Pearson coefficient of correlation(R), the root-mean-square error (RMSE), the mean bias error
(MBE) and the standard deviation (SD) are computed. Forthe sake of visualization,R as well as the centred RMSE andthe standard deviations (SD) of both the models and observa-tions are initially plotted on a Taylor diagram (Taylor, 2001).
www.geosci-model-dev.net/6/1941/2013/ Geosci. Model Dev., 6, 1941–1960, 2013

1952 C. S. de Munck et al.: The GREENROOF module for TEB
Table 4.Hydrological characteristics tested for green roof calibration exercise.
Characteristics (unit) Value Method (Source)
SUBSTRATE
Porosity (m3 m−3) 0.6740.411
Supplier information (Falienor, 2010)Measured (Bouzouidja, 2012)
Saturated hydraulic conductivity (m s−1) 1.073× 10⁻³
2.162× 10⁻³Supplier information (Falienor, 2010)Measured (Bouzouidja, 2012)
Matrix potential at saturation (m) –0.10 Value fitted on observed water retention curves(Appendix A)
b coefficient for water retention curve (–) 2.93.9
Deducted from water retention curve (Fig. A1)porosity of 0.674 and matrix potential of−0.10Deducted from water retention curve (Fig. A2)with porosity of 0.411 and matrix potential of−0.10
Water content at field capacity 0.37 Deducted from observations
Water content at wilting point (m3 m−3) 0.15 Deducted from observations
DRAINAGE
Porosity (m3 m−3) 0.5530.9
Deducted from supplier density data (Table 3)Literature (Ochs et al., 2006) & manufacturerinformation (Argex, 2012)
Saturated hydraulic conductivity (m s−1) 3.32× 10⁻³
1 × 10⁻²(Bouzouidjam, 2012)Technical specification (Leca®, 2012)
Matrix potential at saturation (m)b coefficient for water retention curve (–)
–0.0102.7
Values for organic matter(Lawrence and Slater, 2008)
Table 4. Hydrological characteristics tested for green roof calibration exercise. 1
Characteristics (unit) Value Method (Source)
Porosity (m3 m-3) 0.674
0.411
Supplier information (Falienor 2010)
Measured (Bouzouidja 2012)
Saturated hydraulic conductivity (m s-1) 1.073 10-3
2.162 10-3
Supplier information (Falienor 2010)
Measured (Bouzouidja 2012)
Matrix potential at saturation (m) -0.10 Value fitted on observed water retention curves (Appendix A)
b-coefficient for water retention curve (-) 2.9
3.9
Deducted from water retention curve (Figure A1) porosity of 0.674 and matrix potential of -0.10 Deducted from water retention curve (Figure A2) with porosity of 0.411 and matrix potential of -0.10
Water content at field capacity 0.37 Deducted from observations
SUB
STR
AT
E
Water content at wilting point (m3 m-3) 0.15 Deducted from observations
Porosity (m3 m-3) 0.553
0.9
Deducted from supplier density data (Table 3)
Literature (Ochs et al. 2006) & manufacturer information (Argex 2012)
Saturated hydraulic conductivity (m s-1) 3.32 10-3
1 10-2
(Bouzouidja 2012)
Technical specification (Leca 2012)
Matrix potential at saturation (m)
b-coefficient for water retention curve (-)
-0.010
2.7
Values for organic matter
(Lawrence and Slater 2008)
Matrix potential at saturation (m)
b-coefficient for water retention curve (-)
-0.121
4.05
Values for sand in ISBA
(Clapp and Hornberger 1978)
DR
AIN
AG
E
Matrix potential at saturation (m)
b-coefficient for water retention curve (-)
-0.405
11.4
Values for clay in ISBA
(Clapp and Hornberger 1978)
2
SAND
OM
CLAY
Matrix potential at saturation (m)b coefficient for water retention curve (–)
–0.1214.05
Values for sand in ISBA(Clapp and Hornberger, 1978)
Table 4. Hydrological characteristics tested for green roof calibration exercise. 1
Characteristics (unit) Value Method (Source)
Porosity (m3 m-3) 0.674
0.411
Supplier information (Falienor 2010)
Measured (Bouzouidja 2012)
Saturated hydraulic conductivity (m s-1) 1.073 10-3
2.162 10-3
Supplier information (Falienor 2010)
Measured (Bouzouidja 2012)
Matrix potential at saturation (m) -0.10 Value fitted on observed water retention curves (Appendix A)
b-coefficient for water retention curve (-) 2.9
3.9
Deducted from water retention curve (Figure A1) porosity of 0.674 and matrix potential of -0.10 Deducted from water retention curve (Figure A2) with porosity of 0.411 and matrix potential of -0.10
Water content at field capacity 0.37 Deducted from observations
SUB
STR
AT
E
Water content at wilting point (m3 m-3) 0.15 Deducted from observations
Porosity (m3 m-3) 0.553
0.9
Deducted from supplier density data (Table 3)
Literature (Ochs et al. 2006) & manufacturer information (Argex 2012)
Saturated hydraulic conductivity (m s-1) 3.32 10-3
1 10-2
(Bouzouidja 2012)
Technical specification (Leca 2012)
Matrix potential at saturation (m)
b-coefficient for water retention curve (-)
-0.010
2.7
Values for organic matter
(Lawrence and Slater 2008)
Matrix potential at saturation (m)
b-coefficient for water retention curve (-)
-0.121
4.05
Values for sand in ISBA
(Clapp and Hornberger 1978)
DR
AIN
AG
E
Matrix potential at saturation (m)
b-coefficient for water retention curve (-)
-0.405
11.4
Values for clay in ISBA
(Clapp and Hornberger 1978)
2
SAND
OM
CLAY Matrix potential at saturation (m)b coefficient for water retention curve (–)
–0.40511.4
Values for clay in ISBA(Clapp and Hornberger, 1978)
Table 4. Hydrological characteristics tested for green roof calibration exercise. 1
Characteristics (unit) Value Method (Source)
Porosity (m3 m-3) 0.674
0.411
Supplier information (Falienor 2010)
Measured (Bouzouidja 2012)
Saturated hydraulic conductivity (m s-1) 1.073 10-3
2.162 10-3
Supplier information (Falienor 2010)
Measured (Bouzouidja 2012)
Matrix potential at saturation (m) -0.10 Value fitted on observed water retention curves (Appendix A)
b-coefficient for water retention curve (-) 2.9
3.9
Deducted from water retention curve (Figure A1) porosity of 0.674 and matrix potential of -0.10 Deducted from water retention curve (Figure A2) with porosity of 0.411 and matrix potential of -0.10
Water content at field capacity 0.37 Deducted from observations
SUB
STR
AT
E
Water content at wilting point (m3 m-3) 0.15 Deducted from observations
Porosity (m3 m-3) 0.553
0.9
Deducted from supplier density data (Table 3)
Literature (Ochs et al. 2006) & manufacturer information (Argex 2012)
Saturated hydraulic conductivity (m s-1) 3.32 10-3
1 10-2
(Bouzouidja 2012)
Technical specification (Leca 2012)
Matrix potential at saturation (m)
b-coefficient for water retention curve (-)
-0.010
2.7
Values for organic matter
(Lawrence and Slater 2008)
Matrix potential at saturation (m)
b-coefficient for water retention curve (-)
-0.121
4.05
Values for sand in ISBA
(Clapp and Hornberger 1978)
DR
AIN
AG
E
Matrix potential at saturation (m)
b-coefficient for water retention curve (-)
-0.405
11.4
Values for clay in ISBA
(Clapp and Hornberger 1978)
2
SAND
OM
CLAY
4.5 Determination of the best hydrological ensemble forthe case study
The Taylor diagrams for daily outlet drainage and substratewater content are presented in Fig. 4. They demonstrate dif-ferent behaviours for the three ensembles. The model per-formance in estimating substrate water content (Fig. 4, left)is better for the OM ensemble than for the SAND and theCLAY ensembles, and is acceptable, with a correlation rang-ing from 0.6 to nearly 0.85. Two subsets can be identifiedwithin the OM ensemble; subset 1 has a slightly lowerR,a better SD and a slightly better centred RMSE than sub-set 2. The scores for the substrate water content are in co-herence with the scores for the daily outlet drainage (Fig. 4,right): they are also better for the OM ensemble than for theother two, in the same order of performance (performanceOM>performance SAND>performance CLAY). The cor-relation coefficient ranges from 0.6 to 0.8, and this time, thetwo OM subsets present different SD and centred RMSE, thewater content subset 2 being the outlet drainage subset, with
the SD the closest to observations (0.12 m3 day−1) and thesmallest centred RMSE (around 0.1 m3 day−1).
Figures 5 and 6 present the evolution of the two vari-ables of interest over the calibration period for each of thethree ensembles and their means, as well as additional sta-tistical scores. They confirm that the OM ensemble sys-tematically better suits the observations than SAND andCLAY ensembles, be it for the substrate water content orthe outlet drainage. In Fig. 5, for the substrate water con-tent, the mean bias error (MBE) of the OM ensemble meanis −0.10 m3 m−3, and those of the SAND and CLAY ensem-ble means respectively two and three times more. Figure 6demonstrates similar results for the outlet drainage, with apercentage bias error (PBE) of+121, +310 and+337 %for the OM, SAND and CLAY ensemble means respec-tively, resulting in an excess of 1.4, 3.5 and 3.8 m3 beingdrained out of the green roof over the calibration period.These better biases for the OM ensemble are also associ-ated with better RMSEs, be it for the substrate water con-tent (0.11 m3 m−3 against 0.24 and 0.30 for the SAND and
Geosci. Model Dev., 6, 1941–1960, 2013 www.geosci-model-dev.net/6/1941/2013/

C. S. de Munck et al.: The GREENROOF module for TEB 1953
Fig. 4.Taylor diagrams showing the performance of three model ensembles differing in the hydrological calibration of the DRAINAGE layer(OM, SAND and CLAY) to model (left) the water content recorded at 77 mm depth in the green roof substrate and (right) the green roofdaily outlet drainage. On each diagram, a dot is assigned to each of the 96 models. One can readR on the right-hand side of each quadrant,SD radially (SDOBS is shown by a black quadrant, at 0.041 m3 m−3 for water content and 0.12 m3 day−1 for drainage), and the centredRMSE on grey semicircles centred on the observations’ SD. The ideal model that would fit the observations is represented by the black circle(R = 1; RMSE= 0; SD= SDOBS).
Fig. 5. Comparison of the three ensemble simulations OM, SAND and CLAY with regard to their ability to model substrate water contentover the calibration period (10 August 2011–9 September 2011). Graphs represent the evolution of the water content with time for eachensemble, while the tables gather their respective scores.R is the correlation coefficient (–), RMSE the root-mean-square error and MBE themean bias error (m3 m−3).
CLAY ensembles) or the outlet drainage (0.10 m3 day−1 ver-sus 0.23 and 0.26 for the SAND and CLAY ensembles). Evenwith the best ensemble simulations, GREENROOF tends tounderestimate the water content in the substrate, while over-estimating the drainage collected at the green roof base. Thestopper in place at the base of the green roof might explainpart of this positive bias since some of the water drainedfrom the substrate and the drainage layer is retained at thegreen roof base instead of being evacuated towards the roof
outlet. In addition, the model always simulates a “back-ground” drainage” even when none is observed, which con-tributes to this positive bias.
Finally, the best calibration ensemble obtained for thedrainage layer – whose texture, porosity and hydrologicalbehaviour are complex – displays hydrological characteris-tics which are all typical of the behaviour of organic mat-ter (peat): high porosity and saturated hydraulic conductivitymatched to a lowb coefficient (according to Lawrence and
www.geosci-model-dev.net/6/1941/2013/ Geosci. Model Dev., 6, 1941–1960, 2013

1954 C. S. de Munck et al.: The GREENROOF module for TEB
Fig. 6. Comparison of the three ensemble simulations OM, SAND and CLAY with regard to their ability to model daily outlet drainageover the calibration period (10 August 2011–9 September 2011). Graphs represent the evolution of the outlet drainage with time for eachensemble, while the tables gather their respective scores.R the correlation coefficient (–), RMSE the root-mean-square error (m3 day−1),PBE the mean bias error (%) and CBE the bias error cumulated over the entire calibration period (m3). For reference, the total outlet drainageobserved over this period of time equals 1.1 m3.
Slater, 2008). This information is an interesting outcome be-cause it allows for one to relate the hydrological behaviourof expanded clay granules to a better known soil component.This best calibration ensemble will next be used to evaluatethe GREENROOF model hydrological and thermal perfor-mances over the remaining time series.
4.6 Evaluation of GREENROOF hydrological andthermal performances
4.6.1 Hydrological performance
The evolution of the substrate water content and the greenroof drainage over the entirety of the time series available arepresented in Fig. 7 for the OM ensemble calibrations and thetwo OM subsets to illustrate their discrepancies in relationto that of their statistical scores (Table 5) calculated over theevaluation period running from 10 September to 29 Novem-ber 2011.
Starting with the substrate water content, GREENROOFscores over the evaluation period are similar (RMSE andMBE) or even better (R, SD) than those of the OM ensem-ble mean over the calibration period (Fig. 5). Looking at itstemporal evolution, Fig. 7 (top) reveals a water content thatis more underestimated at the beginning of the evaluation pe-riod (until 5 October) than later on, while the overall dynam-ics are quite good. This behaviour seems to be in the conti-nuity of the underestimated water status which establishedat the end of the calibration exercise (between 27 Augustand 9 September). As highlighted previously, Fig. 7 shows
two different hydrological regimes corresponding to the twosubsets identified in Fig. 4 (1 and 2), with subset 2 clearlypresenting better scores than subset 1 (Table 5). This is il-lustrated by betterR (0.86 compared to 0.71), MBE (−0.05compared to−0.16 m3 m−3) and RMSE values (0.06 com-pared to 0.16 m3 m−3), despite a higher SD (0.05 m3 m−3)
than subset 1 and observations (0.02 m3 m−3 for both). Thebetter scores of subset 2 are explained by a higher porosityof the substrate (0.674 instead of 0.411 m3 m−3 for subset1), which is the only different hydrological characteristic be-tween the two subsets. Indeed, the subset 2 higher porosityallows for a higher water content to be reached within thesubstrate matrix when it is saturated.
The better scores of subset 2 for simulating the water con-tent of the substrate logically provides better scores as wellfor simulating the amount of water discharged at the base ofthe green roof, with a much better PBE (61 % against 192 %for subset 1) and similar RMSEs (0.07 and 0.06 m3 day−1)
despite a weaker correlation (0.66 against 0.83). Overall,evaluation scores for the drainage are acceptable and gen-erally better than those over the calibration period even if themodel overestimates the drainage most of the time. As men-tioned previously, the background drainage always simulatedby the model explains a large part of the error on the accu-mulated drainage, i.e. 1.2 and 0.5 m3 for subsets 1 and 2,respectively, over the evaluation period (for cumulated biaserrors of 4.2 and 2.3 m3, respectively).
Geosci. Model Dev., 6, 1941–1960, 2013 www.geosci-model-dev.net/6/1941/2013/

C. S. de Munck et al.: The GREENROOF module for TEB 1955
Fig. 7.Evolution between 10 July 2011 and 29 November 2011 of SUBSTRATE water content (top) and daily outlet DRAINAGE (bottom),as observed and simulated by the GREENROOF OM ensemble. Rain amount recorded during the experiment is represented by blue bars(right-hand-side axis on top graph).
Table 5.Statistical scores for the simulations of the OM ensemble over the evaluation time period (R the correlation coefficient, RMSE theroot-mean-square error, MBE the mean bias error, PBE the mean bias error expressed in percentages, CBE the bias error estimated on thevariable accumulated over the period, and SD the standard deviation). Score units depend on the variable analysed.
SUBS. WATER CONTENT OUTLET DRAINAGE SUBS. TEMPERATURE DRAIN. LAYER TEMPERATURE
SCORES R RMSE MBE SD R RMSE PBE CBE R RMSE MBE SD R RMSE MBE SD
UNIT – m3 m−3 – m3 day−1 % m3 – ◦C – ◦C
OM mean 0.86 0.11 −0.10 0.04 0.81 0.06 127 3.3 0.91 4.32 2.68 6.92 0.89 3.69 1.10 6.73OM min 0.50 0.04 −0.01 0.02 0.48 0.05 32 1.9 0.88 3.59 2.25 6.35 0.85 2.90 0.69 6.16OM max 0.87 0.18 −0.18 0.06 0.88 0.08 246 5.0 0.92 5.29 3.23 7.63 0.92 4.74 1.64 7.49S1 mean 0.71 0.16 −0.16 0.02 0.83 0.06 192 4.2 0.90 4.85 2.99 7.31 0.87 4.25 1.39 7.13S2 mean 0.86 0.06 −0.05 0.05 0.66 0.07 61 2.3 0.92 3.81 2.37 6.53 0.91 3.15 0.81 6.36OBS 0.02 4.54 4.25
4.6.2 Thermal performance
The evolution of recorded and simulated green roof tempera-tures is presented in Fig. 8. Whether at the bottom of the sub-strate (at 96 mm) or the drainage layer (at 148 mm), the tem-peratures estimated by GREENROOF demonstrate a goodcorrelation with those observed (respectively 0.91 and 0.89for the OM ensemble mean, Table 5). By contrast, even if themodel is able to capture seasonal variations, the temperaturessimulated by GREENROOF as well as their daily amplitudesare greater than that observed. This corresponds to an MBEof 2.68 and 1.10◦C for the substrate and the drainage lay-ers, respectively, and an RMSE of 4.32 and 3.69◦C. Thisoverestimation of soil temperature is coherent with the un-derestimation of water content in the substrate layer since the
effective thermal properties of the soil matrix are calculatedaccording to Peters-Lidard et al. (1998) based on the dry ther-mal properties shown in Table 3, as well as the porosity andthe water content of the soil matrix. Eventually, an underesti-mated water content will generate lower thermal conductivityand heat capacity than in reality, with a consequent increasein the soil matrix temperature. This impact has been evalu-ated on one of the best OM simulations by forcing the ef-fective thermal characteristics of the substrate to those thatit would have at field capacity: depending on the substratemoisture status in the initial simulation, this effect only con-tributes to a cooling in temperatures of 0.5 to 1.5◦C. This im-plies that other processes might be responsible for the tem-perature bias and the higher amplitudes of the temperature
www.geosci-model-dev.net/6/1941/2013/ Geosci. Model Dev., 6, 1941–1960, 2013

1956 C. S. de Munck et al.: The GREENROOF module for TEB
Fig. 8. Evolution between 10 July 2011 and 29 November 2011 of SUBSTRATE (top) and DRAINAGE layer (bottom) temperatures, asobserved and simulated by the GREENROOF OM ensemble.
simulated in the substrate. It may originate directly from theinitialization of the dry thermal characteristics themselves orfrom the simulation of the surface energy fluxes. So far, theanalysis of the amplitude and the partitioning of simulatedsensible and latent heat flux does not highlight any inco-herence with the meteorological forcings experienced by thegreen roof, but another case study with longer time series andsurface flux data would be needed to study these aspects andimprove the model. Finally, as expected by its better perfor-mance in modelling substrate water content, the OM subset 2performs slightly better at simulating substrate temperaturesthan subset 1, as shown by Fig. 8 and Table 5, with betterRMSE and MBE values than subset 1. This results in bet-ter temperature scores for the subset 2 in the drainage layer.Eventually the analysis of the two OM subsets suggests thata porosity of 0.674 instead of 0.411 m3 m−3 for the substrateis a more appropriate value for modelling this case study plotwith GREENROOF.
5 Conclusions and perspectives
A parameterization called GREENROOF for simulating ex-tensive green roofs across the cities has been developedwithin TEB, which is consistent with the modular architec-ture of SURFEX. While the natural surface scheme ISBA-DF simulates the transfers of heat and water within the nat-ural compartments of the green roof, TEB handles transferswithin artificial layers of the green roof and the structural
roof. The GREENROOF module consists of the two-waycoupling of these two models via the heat flux which estab-lishes between the natural and artificial roof layers in contactand their respective temperatures. A vertical green roof de-sign as well as two greening options (grass or sedum lawn)are available. GREENROOF is evaluated for a case study –an experimental green roof plot located in the northeast ofFrance. Initially, a calibration exercise is realized in order toidentify the soil type that best describes the hydrological be-haviour of the soil-forming materials used for the drainagelayer of the green roof plot. Calibration results show that thehydrological behaviour of expanded clay granules is closestto the behaviour of peat, which is an important indication forthe modelling community as drainage layers are not gener-ally simulated by existing green roof models. After calibra-tion, results show that GREENROOF performs well in re-producing the dynamics of both the outlet drainage and thewater content within the substrate, with a tendency to over-estimate drainage and underestimate water content. The dif-ferences between modelled and observed water contents donot impact too much the simulation of temperatures, whichpresents satisfactory statistical scores. Nonetheless, on thiscase study plot, GREENROOF tends to overestimate soiltemperatures and their amplitudes. Due to the thermal inertiaof the soil layers, the temperature of the drainage layer is theleast biased, which allows for a good thermal coupling withthe artificial/structural roof layers. Considering the results ofthis study, the future developments of GREENROOF should
Geosci. Model Dev., 6, 1941–1960, 2013 www.geosci-model-dev.net/6/1941/2013/

C. S. de Munck et al.: The GREENROOF module for TEB 1957
include the analysis of experimental green roof plots, provid-ing complete records including surface flux data, as well asplots with a retention layer instead of a drainage layer.
Since the experimental plot studied (extensive, sedumlawn, typical substrate and drainage layer materials) is a typeof green roof that is frequently implemented on urban build-ings, the hydrological characteristics highlighted via this casestudy are retained to simulate green roofs at the scale ofcities. Thanks to the coupled developments of the GREEN-ROOF module and the building energy model (BEM, Buenoet al., 2012) within TEB, impact studies are currently inprogress to assess the potential of green roofs (and associatedwater resources) as a sustainable adaptation strategy for citiesin terms of indoor thermal comfort and energy consumption,as well as urban heat island mitigation if coupled to an atmo-spheric model. Also, through the various options currentlyavailable in ISBA, other impacts of green roofs could be stud-ied at the scale of cities, such as, for example, their potentialfor carbon dioxide sequestration.
Code availability
The GREENROOF module has been implemented withinthe version 7.3 of the SURFEX platform. For further de-tails, including how to obtain a copy of the source code, seehttp://www.cnrm.meteo.fr/surfex/.
Appendix A
Fitting b coefficient of the water retention curveto observations
A1 Method
Theb coefficient is involved in a formulation implemented inISBA (hence called the GREENROOF module) which con-nects the water potential to the water content in a soil matrixderived by Clapp and Hornberger (1978):
ψ
ψSAT=
(wc
wcSAT
)−b
, (A1)
whereψ (m) is the water potential for a specific water con-tent wc (m3 m−3), ψSAT (m) is the water potential at satura-tion corresponding to the water content at saturation (i.e. theporosity) wcSAT (m3 m−3), andb is an empirical coefficient,which must be estimated. This formulation when plotted fora soil is called the water retention curve. Following Eq. (A1),theb coefficient can be estimated, if observations are avail-able, as the opposite of the slope of the water retention curveexpressed as
LOG10
(ψ
ψSAT
)= −b× LOG10
(wc
wcSAT
). (A2)
Note that for applications of ISBA to natural soils, theb coefficient does not need to be user-calibrated because it
Fig. A1. Fit of water retention curve coefficient and matrix potentialat saturation to observations when porosity= 0.674 m3 m−3.
Fig. A2. Fit of water retention curve coefficient and matrix potentialat saturation to observations when porosity= 0.411 m3 m−3.
is estimated within the model after pedotransfer functionsbased on user-input soil texture (sand and clay fractions). Thecase of green roof soil-forming materials is different becausesand and clay fractions are not really appropriate to charac-terize them. Hence, for the substrate of the green roof studiedfor which water contents and matrix potentials were recordedbetween July and November 2011, theb coefficient can beestimated.
A2 Fitting b coefficients for the case study green roofsubstrate
Theb coefficient has been estimated based on Eq. (A2) us-ing a linear regression for two compatible combinations ofporosity and saturated water potential tested in the calibrationexercise, respectively 0.674 m3 m−3 with −0.1 m for the firstcombination and 0.411 m3 m−3 with −0.1 m for the second
www.geosci-model-dev.net/6/1941/2013/ Geosci. Model Dev., 6, 1941–1960, 2013

1958 C. S. de Munck et al.: The GREENROOF module for TEB
combination. For the first combination, the linear regressionresulted in a fittedb coefficient of 2.9. The same treatment forthe second combination (Fig. A2) resulted in a fittedb coef-ficient of 3.9. The two resulting water retention curves aredisplayed in Figs. A1 and A2, showing the agreements be-tween theb fitted theoretical curves and the observed curves.For both combinations, the agreement is acceptable, but theClapp and Hornberger (1978) formulation does not seem ableto reproduce the tail of the observed water retention curve– when water content is above 0.20/0.25 m3 m−3. Also, thesecond combination appears better than the first at repro-ducing the inflexion of the observed curve, although it doesnot capture the points with the lowest water contents/greatestmatrix potentials. However, the functioning of water poten-tial probes can be well altered in dry conditions because ofthe rough texture (and the resulting lack of contact) of thesoil-forming material of the green roof substrate. This mayquestion the validity of the high water potential recorded onthat green roof plot.
Acknowledgements.The results presented in this publication arethe outcome of two research projects: MUSCADE (ModélisationUrbaine et Stratégie d’adaptation au Changement climatique pourAnticiper la Demande et la production Énergétique, ANR-09-VILL-0003) and VegDUD (Rôle du végétal dans le DéveloppementUrbain Durable, ANR-09-VILL-0007). We are grateful for theexpertise and support provided by Aaron Boone and BertrandDecharme (CNRM-GAME) on the ISBA-DF model.
Edited by: D. Lunt
The publication of this article isfinanced by CNRS-INSU.
References
ACERMI [Association pour la CERtification des MatériauxIsolants: CSTB-LNE]: CERTIFICAT ACERMI No. 04/003/323,Licence no. 04/003/323, 2009.
Alexandri, E. and Jones, P.: Developing a one-dimensionalheat and mass transfer algorithm for describing the ef-fect of green roofs on the built environment: Comparisonwith experimental results, Build. Environ., 42, 2835–2849,doi:10.1016/j.buildenv.2006.07.004, 2007.
ARGEX: available at: http://www.argex.eu/en/products/characteristics.html(last access: 24 February 2012), 2012.
Bass, B. and Baskaran, B.: Evaluating Rooftop and Vertical Gardensas an Adaptation Strategy for Urban Areas, Report no NRCC-46737, Edited by National Research Council Canada, Institutefor Research in Construction, Ottawa (Canada), 2003.
Bass, B., Krayenhoff, E. S., Martilli, A., Stull, R. B., and Auld,H.: The impact of green roofs on Toronto’s urban heat island,
in: Proceedings of the First North American Green Roof Con-ference: Greening Rooftops for Sustainable Communities, 20–30 May, Chicago, Toronto (Canada), Cardinal Group, 292–304,2003.
Berghage, R., Beattie, D., Jarrett, A., Thuring, C., and Razaei,F.: Green Roofs for Stormwater Runoff Control, Report noEPA/600/R-09/026, February 2009, edited by: the National RiskManagement Research Laboratory, Office of Research and De-velopment, US Environment Protection, Agency, Cincinnati, OH45268, 2009.
Berndtsson, J. C., Bengtsson, L., and Jinno, K.: Runoff water qual-ity from intensive and extensive vegetated roofs, Ecol. Eng., 35,369–380, 2009.
BING [Federation of European Rigid Polyurethane Foam Associa-tions]: Thermal insulation materials made of rigid polyurethanefoam (PUR/PIR), Properties – Manufacture, Report no 1, 6 Octo-ber, 2006, available at:http://www.excellence-in-insulation.eu/site/fileadmin/user_upload/PDF/Thermal_insulation_materials_made_of_rigid_polyurethane_foam.pdf, last access: 27 Octo-ber 2013.
Boone, A.: Modélisation des processus hydrologiques dans leschéma de surface ISBA: Inclusion d’un reservoir hydrologique,du gel et modélisation de la neige, PhD thesis, Université PaulSabatier, Toulouse, France, 2000.
Boone, A., Masson, V., Meyers, T., and Noilhan, J.: The influence ofthe inclusion of soil freezing on simulations by a soil-vegetation-atmosphere transfer scheme, J. Appl. Meteorol., 39, 1544–1569,2000.
Bouzouidja, R.: Caractérisation du substrat d’une toiture végétal-isée, Master’s thesis, University of Lorraine, Nancy, France,2010.
Bouzouidja, R., Lacroix, D., Séré, G. and Claverie, R.: Experi-mental determination of hydrological parameters of green roofs,Build. Environ., in preparation, 2012.
Bueno, B., Pigeon, G., Norford, L. K., Zibouche, K., and Mar-chadier, C.: Development and evaluation of a building energymodel integrated in the TEB scheme, Geosci. Model Dev., 5,433–448, doi:10.5194/gmd-5-433-2012, 2012.
Carter, T. and Butler, C.: Ecological impacts of replacing traditionalroofs with green roofs in two urban areas, Cities Environ., 1, 1–17, 2008.
Castleton, H. F., Stovin, V., Beck, S. B. M., and Davison, J.B.: Green roofs; building energy savings and the potential forretrofit, Energ. Buildings, 41, 1582–1591, 2010.
Clapp, R. B. and Hornberger, G. M.: Empirical equations for somesoil hydraulic properties, Water Resour. Res., 14, 601–604, 1978.
CRITT Horticole [Centre régional pour l’Innovation et le TransfertTechnologique Horticole]: Définition et mesure du LAI, Intégra-tion de la résistance stomatique (RS) dans la formule de l’ETP,Unpublished report, 2012.
Decharme, B., Boone, A., Delire, C., and Noilhan, J.: Local evalu-ation of the Interaction between Soil Biosphere Atmosphere soilmultilayer scheme using four pedotransfer functions, J. Geophys.Res., 116, D20126, doi:10.1029/2011JD016002, 2011.
Del Barrio, E. P.: Analysis of the green roofs cooling potential inbuildings, Energ. Buildings, 27, 179–193, 1998.
de Munck, C., Pigeon, G., Masson, V., Meunier, F., Bousquet,P., Tréméac, B., Merchat, M., Poeuf, P., and Marchadier, C.:How much air conditioning can increase air temperatures for
Geosci. Model Dev., 6, 1941–1960, 2013 www.geosci-model-dev.net/6/1941/2013/

C. S. de Munck et al.: The GREENROOF module for TEB 1959
a city like Paris (France)?, Int. J. Climatol., 33, 210–227,doi:10.1002/joc.3415, 2013.
Diak, G. R., Bland, W. L., Mecikalski, J. R., and Anderson, M.C.: Satellite-based estimates of longwave radiation for agri-cultural applications, Agr. Forest Meteorol., 103, 349–355,doi:10.1016/S0168-1923(00)00141-6, 2000.
Doya, M., Briottet, X., Djedjig, R., and Ouldboukhitine, S.: De-scription des mesures VEGDUD du 23/09/2011, Unpublished re-port, 2011.
Durham, A. K., Rowe, D. B., and Rugh, C. L.: Effect of water-ing regimen on chlorophyll fluorescence and growth of selectedgreen roof plant taxa, HortScience, 41, 1623–1628, 2006.
EEA: European Environment Agency: Urban adaptation to climatechange in Europe, Challenges and opportunities for cities to-gether with supportive national and European policies, EEA Re-port no 2/2012, ISSN 1725-9177, 2012.
Falienor: Résultats de l’analyse de substrat de toiture végétaliséeNo 1807676 – 14-F TOITURE par le Laboratoire SAS, Issuedon 09/03/2010, 2010.
Farouki, O. T.: Thermal properties of soils, Ser. on Rock and SoilMech., 11, 136 pp., Trans. Tech. Publ., Clausthal-Zellerfled, Ger-many, 1986.
Feng, C., Meng, Q., and Zhang, Y.: Theoretical and experimentalanalysis of the energy balance of extensive green roofs, Energ.Buildings, 42, 959–965, 2010.
Foster, J., Lowe, A., and Winkelman, S.: The value of green infras-tructure for urban climate adaptation, Published by the Center forClean Air Policy, Washington DC, USA, February 2011, 2011.
Getter, K. L. and Rowe, D. B.: The role of extensive green roofs insustainable development, HortScience, 41, 1276–1285, 2006.
Giguère, M.: Mesures de lutte aux îlots de chaleur urbains. Revuede literature, Direction des risques biologiques, environnemen-taux et occupationnels, Institut National de Santé Publique, Gou-vernement du Québec, Juillet 2009, 2009.
Gill, S. E., Handley, J. F., Ennos, A. R., and Pauleit, S.: Adapt-ing cities for climate change: the role of the green infrastructure,Built Environ., 33, 115–133, 2007.
Hamdi, R. and Masson, V.: Inclusion of a Drag Approach in theTown Energy Balance (TEB) Scheme: Offline 1D Evaluationin a Street Canyon, J. Appl. Meteorol. Clim., 47, 2627–2644,doi:10.1175/2008JAMC1865.1, 2008.
Hilten, R. N., Lawrence, T. M., and Tollner, E. W.: Modelingstormwater runoff from green roofs with HYDRUS-1D, J. Hy-drol., 358, 288–293, 2008.
Jacquet, S.: Performance énergétique d’une toiture végétaleau centre-ville de Montréalm Résumé de mémoire, Centred’Ecologie Urbaine de Montréal, ISBN 978-2-9810129-8-2.,available at:http://www.ecologieurbaine.net/node/1214, 2011.
Jaffal, I., Ould-Boukhitine, S.-E., and Belarbi, R.: A comprehen-sive study of the impact of green roofs on building energy per-formance, Renew. Energ., 43, 157–164, 2012.
Jarvis, P.: The interpretation of the variations in leaf water potentialand stomatal conductance found in canopies in the field, Philo-sophical Transactions of the Royal Society of London, Biol. Sci.,273, 593–610, 1976.
Jim, C. Y.: Effect of vegetation biomass structure on thermal perfor-mance of tropical green roof, Landscape Ecol. Eng., 8, 173–187,doi:10.1007/s11355-011-0161-4, 2011.
Jim, C. Y. and He, H.: Coupling dynamics with meteorological con-ditions in the green roof ecosystem, Ecol. Eng., 36, 1052–1063,2010.
Jim, C. Y. and Peng, L. L. H.: Weather effect on thermal and en-ergy performance of an extensive tropical green roof, Urban For.Urban Gree., 11, 73–85, 2011.
Jim, C. Y. and Tsang, S. W.: Modeling the heat diffusion processin the abiotic layers of green roofs, Energ. Buildings, 43, 1341–1350, 2011.
Kalzip®: Kalzip low U-value roof system – achieving0.10 W/m2/K, Product review, 2010, available at:http://www.kalzip.com/PDF/uk/Kalzip-low-U-value-system.pdf,last access: 27 October 2013.
Kumar, R. A. and Kaushik, S. C.: Performance evaluation of greenroof and shading for thermal protection of buildings, Build. En-viron., 40, 1505–1511, 2005.
Lawlor, G., Currie, B. A., Doshi, H., and Wieditz, I.: Green roofs:a resource manual for municipal policy makers, Report 65255,Published by Canada Mortgage and Housing Corporation, May2006, 2006.
Lawrence, D. M. and Slater, A. G.: Incorporating organic soil intoa global climate model, Clim. Dynam., 30, 145–160, 2008.
Lazzarin, R. M., Castellotti, F., and Busato, F.: Experimental mea-surements and numerical modelling of a green roof, Energ.Buildings, 37, 1260–1267, 2005.
Leca®: Declaration of technical specifications BS EN 13055-1 forlightweight aggregate, Issued on 01-01-2009, 2009.
Leca®: available at: http://www.leca.co.uk/33755(last ac-cess: 24 February 2012), 2012.
Lemonsu, A. and Masson, V.: Simulation of a summer urban breezeover Paris, Bound.-Lay. Meteorol., 104, 463–490, 2002.
Lemonsu, A., Grimmond, C. S. B., and Masson, V.: Modeling thesurface energy balance of the core of an old Mediterranean city:Marseille, J. Appl. Meteorol., 43, 312–327, 2004.
Lemonsu, A., Bélair, S., Mailhot, J., and Leroyer, S.: Evaluation ofthe Town Energy Balance Model in Cold and Snowy Conditionsduring the Montreal Urban Snow Experiment 2005, J. Appl. Me-teorol. Climatol., 49, 346–362, 2010.
Lemonsu, A., Pigeon, G., Marchadier, C., and Salagnac, J.-L.: Re-search report for the VURCA project, Scénarios du bâti & simu-lations, No ANR-08-VULCN-013 VURCA, 47 pp., 2011.
Lemonsu, A., Masson, V., Shashua-Bar, L., Erell, E., and Pearl-mutter, D.: Inclusion of vegetation in the Town Energy Balancemodel for modelling urban green areas, Geosci. Model Dev., 5,1377–1393, doi:10.5194/gmd-5-1377-2012, 2012.
Masson, V.: A physically-based scheme for the urban energy bud-get in atmospheric models, Bound.-Lay. Meteorol., 94, 357–397,2000.
Masson, V., Champeaux, J. L., Chauvin, F., Meriguet, C., and Pi-geon, G.: ECOCLIMAP: a global database of land surface pa-rameters at 1-km resolution in meteorological and climate mod-els, J. Climate, 16, 1261–1282, 2003.
Masson, V., Le Moigne, P., Martin, E., Faroux, S., Alias, A.,Alkama, R., Belamari, S., Barbu, A., Boone, A., Bouyssel, F.,Brousseau, P., Brun, E., Calvet, J.-C., Carrer, D., Decharme, B.,Delire, C., Donier, S., Essaouini, K., Gibelin, A.-L., Giordani, H.,Habets, F., Jidane, M., Kerdraon, G., Kourzeneva, E., Lafaysse,M., Lafont, S., Lebeaupin Brossier, C., Lemonsu, A., Mahfouf,J.-F., Marguinaud, P., Mokhtari, M., Morin, S., Pigeon, G., Sal-
www.geosci-model-dev.net/6/1941/2013/ Geosci. Model Dev., 6, 1941–1960, 2013

1960 C. S. de Munck et al.: The GREENROOF module for TEB
gado, R., Seity, Y., Taillefer, F., Tanguy, G., Tulet, P., Vincendon,B., Vionnet, V., and Voldoire, A.: The SURFEXv7.2 land andocean surface platform for coupled or offline simulation of earthsurface variables and fluxes, Geosci. Model Dev., 6, 929–960,doi:10.5194/gmd-6-929-2013, 2013.
Mentens, J., Raes, D., and Hermy, M.: Green roofs as a tool for solv-ing the rainwater runoff problem in the urbanized 21st century?,Landscape Urban Plan., 77, 217–226, 2006.
Mualem, Y.: A new model to predicting the hydraulic conductivityof unsaturated porous media, Water Resour. Res., 12, 513–522,1976.
Nardini, A., Andri, S., and Crasso, M.: Influence of substrate depthand vegetation type on temperature and water runoff mitigationby extensive green roofs: shrubs versus herbaceous plants, UrbanEcosyst., 15, 697–708, doi:10.1007/s11252-011-0220-5, 2012.
Noilhan, J. and Planton, S.: A simple parameterization for land sur-face processes for meteorological models, Mon. Weather Rev.,117, 536–549, 1989.
Oberndorfer, E., Lundholm, J., Bass, B., Coffman, R. R., Doshi, H.,Dunnett, N., Gaffin, S., Kohler, M., Liu, K. K. Y., and Rowe, B.:Green Roofs as Urban Ecosystems: Ecological Structures, Func-tions, and Services, BioScience, 57, 823–833, 2007.
Ochs, F., Heidemann, W., and Müller-Steinhagen, H.: Effectivethermal conductivity of the insulation of high temperature un-derground thermal stores during operation, in: Proceedings ofthe Ecostock 2006 conference, Richard Stockton College, NewJersey, USA, 31 May–2 June 2006, 2006.
Offerle, B., Grimmond, C. S. B., and Fortuniak, K.: Heat storageand anthropogenic heat flux in relation to the energy balance ofa central European city centre, Int. J. Climatol., 25, 1405–1419,2005.
Ouldboukhitine, S.-E., Belarbi, R., Jaffal, I., and Trabelsi, A.:Assessment of green roof thermal behaviour: a couple heatand mass transfer model, Build. Environ., 46, 2624–2631,doi:10.1016/j.buildenv.2011.06.021, 2011.
Palla, A., Gnecco, I., and Lanza, G.: Unsaturated 2D modelling ofsubsurface water flow in the coarse-grained porous matrix of agreen roof, J. Hydrol., 379, 193–204, 2009.
Palla, A., Gnecco, I., and Lanza, G.: Compared performance of aconceptual and a mechanistic hydrologic models of a green roof,Hydrol. Process., 26, 73–84, 2012.
Penney, J.: Climate change adaptation in the city of Toronto.Lessons for Great Lakes communities. Clean Air Partner-ship, Toronto, Ontario, Canada, December 2008, available at:http://www.cleanairpartnership.org/files/Climate%20Change%20Adaptation%20in%20the%20City%20of%20Toronto%20-%20Lessons%20for%20Great%20Lakes%20Communities%20%28Penney,%20J.%202008%29.pdf(last access: 27 Octo-ber 2013), 2008.
Peters-Lidard, C. D., Blackburn, E., Lian, X., and Wood, E. F.: Theeffect of soil thermal conductivity parameterization on surfaceenergy fluxes and temperatures, J. Atmos. Sci., 55, 1209–1224,doi:10.1175/1520-0469(1998)055<1209:TEOSTC>2.0.CO;2,1998.
Pigeon, G., Moscicki, M. A., Voogt, J. A., and Masson, V.: Sim-ulation of fall and winter surface energy balance over a denseurban area using the TEB scheme, Meteorol. Atmos. Phys., 102,159–172, 2008.
Prata, A. J.: A new long-wave formula for estimating downwardclear-sky radiation at the Surface, Q. J. R. Meteorol. Soc., 122,1127–1151, 1996.
RECTICEL®: available at: http://www.recticelinsulation.fr/nos-produits/powerline/#donnees_techniques(last access:1 June 2012), 2012.
Rosenzweig, C., Solecki, W. D., Parshall, L., Lynn, B., Cox, J.,Goldberg, R., Hodges, S., Gaffin, S., Slosberg, R. B., Savio, P.,Dunstan, F., and Watson, M.: Mitigating New York City’s HeatIsland. Integrating Stakeholder Perspectives and Scientific Eval-uation, B. Am. Meteorol. Soc., 90, 1297–1312, 2009.
Sailor, D. J.: A green roof model for building energy simulationprograms, Energ. Buildings, 40, 1466–1478, 2008.
SILRES®: available at:www.wacker.com/cms/media/publications/downloads/6528_EN.pdf(last access: 24 February 2012), 2012.
Simunek, J., Voel, T., and Van Genuchten, M. Th.: The SWMS_2Dcode for simulating water flow and solute transport on two-dimensional variably saturated media, Version 1.21., Researchreport No 132, US Salinity Laboratory, USDA, ARS, Riverside,California, 197 pp., 1994.
Simunkek, J., Van Genuchten, M. Th., and Sejna, M.: The HY-DRUS_1D Software package for simulating the one-dimensionalmovement of water, heat and multiple solutes in variably-saturated media, Version 3.0, HYDRUS Software Series 1. Dept.of Environmental Science, University of California Riverside,Riverside, California, USA, 240 pp., 2005.
Sinclair: available at:http://www.william-sinclair.co.uk/industrial/products/expanded_clay(last access: 24 February 2012), 2012.
SOPREMA®: SOPRALENE® FLAM JARDIN, Fiche techniqueNo DT-10/005_FR CE, 2012a.
SOPREMA®: SOPRALENE® FLAM 180, Fiche technique NoDT-09/086_FR CE, 2012b.
Taylor, K. E.: Summarizing multiple aspects of model performancein a single diagram, J. Geophys. Res., 106, 7183–7192, 2001.
USEPA: Reducing Urban Heat Islands: Compendium of Strate-gies, Green Roofs, 26 pp., available at:http://www.epa.gov/hiri/mitigation/greenroofs.htm, 2008.
Van Genuchten, M. Th.: A closed-form equation for predicting thehydraulic conductivity of unsaturated soils, Soil Sci. Soc. Am. J.,44, 892–898, 1980.
Van Woert, N. D., Rowe, D. B., Andresen, J. A., Rugh, C. L., andXiao, L.: Watering regime and green roof substrate design affectSedum plant growth, HortScience, 40, 659–664, 2005.
Voyde, E., Fassman, E., and Simcock, R.: Hydrology of an extensiveliving roof under sub-tropical climate conditions in Auckland,New Zealand, J. Hydrol., 394, 384–395, 2010.
Wark, C. G. and Wark, W. W.: Green roof specifications andstandards. Establishing an emerging technology, The Construc-tion Specifier, 56, August 2003, n0 8, available at:www.proenviroconstruction.com/pdf/GreenRoof.pdf, 2003.
Wolf, D. and Lundholm, J.T.: Water uptake in green roof micro-cosms: effects of plant species and water availability, Ecol. Eng.,33, 179–186, 2008.
Yu, C. and Zheng, C.: HYDRUS: software for flow and transportmodeling in variably saturated media, Ground Water, 48, 787–791, 2010.
Geosci. Model Dev., 6, 1941–1960, 2013 www.geosci-model-dev.net/6/1941/2013/
Related Documents