Welcome message from author
This document is posted to help you gain knowledge. Please leave a comment to let me know what you think about it! Share it to your friends and learn new things together.
Transcript

Use the following reference to cite this document:
GCOS (2021). The Status of the Global Climate Observing System 2021: The GCOS Status Report (GCOS-240), pub WMO, Geneva
© World Meteorological Organization, 2021
The right of publication in print, electronic and any other form and in any language is reserved by WMO. Short extracts from WMO publications may be reproduced without authorization, provided that the complete source is clearly indicated. Editorial correspondence and requests to publish, reproduce or translate this publication in part or in whole should be addressed to:
Chair, Publications Board
World Meteorological Organization (WMO)
7 bis, avenue de la Paix Tel.: +41 (0) 22 730 84 03
P.O. Box 2300 Fax: +41 (0) 22 730 80 40
CH-1211 Geneva 2, Switzerland E-mail: [email protected]
NOTE
The designations employed in WMO publications and the presentation of material in this publication do not imply the expression of any opinion whatsoever on the part of WMO concerning the legal status of any country, territory, city or area, or of its authorities, or concerning the delimitation of its frontiers or boundaries.
The mention of specific companies or products does not imply that they are endorsed or recommended by WMO in preference to others of a similar nature which are not mentioned or advertised.
The findings, interpretations and conclusions expressed in WMO publications with named authors are those of the authors alone and do not necessarily reflect those of WMO or its Members.
This publication has been issued without formal editing.
TABLE OF CONTENTS
The Paris Agreement ...................................................................................... 5 GCOS structure and governance ..................................................................... 6 A system of systems observing architecture approach ................................... 6 Satellite community engagement ................................................................... 8 Report preparation and structure ................................................................... 8
Atmospheric ECVs ........................................................................................ 18 Surface ECVs ........................................................................................ 19 Upper-air ECVs ..................................................................................... 20 Composition ECVs ................................................................................. 22
Ocean ECVs .................................................................................................. 24 Physical ECVs ....................................................................................... 25 Carbon and biogeochemistry ECVs ........................................................... 26 Biology and Ecosystems ECVs ................................................................. 28
Terrestrial ECVs ............................................................................................ 30 Hydrological ECVs ................................................................................. 30 Cryospheric ECVs .................................................................................. 31 Biospheric ECVs .................................................................................... 33 Anthropogenic ECVs .............................................................................. 34
Summary Assessment of each ECV ............................................................... 36
General Actions ............................................................................................ 51 Atmospheric Actions ..................................................................................... 52 Ocean Actions ............................................................................................... 53 Terrestrial Actions ........................................................................................ 54 Detailed Progress on Implementation Plan Actions ...................................... 55
Observations of and for Adaptation .............................................................. 68 Observations of Extremes............................................................................. 69 Mitigation ..................................................................................................... 75
Introduction ................................................................................................. 75 Successes ..................................................................................................... 75 Issues .......................................................................................................... 76
Sustainability ....................................................................................... 76 Gaps ................................................................................................... 77 Data Stewardship, Archiving and Access ................................................... 78 New needs and requirements since the 2016 Implementation Plan ............... 79
- ii -
82
- iii -
PREFACE
The World Meteorological Organization (WMO) is proud to be a sponsor of the Global Climate Observing System (GCOS) and to be able to support the production of this report. WMO is a specialized agency of the United Nations and is its authoritative voice for weather, water and climate. It sponsors and implements an integrated suite of programmes which cover all aspects of climate research, observations, assessment, modelling and services. WMO is now focusing on adopting an Earth System approach covering many of the areas considered in this report.
This publication reviews the state of global climate monitoring, including water, energy and greenhouse-gas fluxes, covering the atmosphere, oceans, land, cryosphere and biosphere. It supports and serves the United Nations Framework Convention on Climate Change (UNFCCC) and its Paris Agreement, the programmes of WMO and its Member States, and the other sponsors of GCOS: the Intergovernmental Oceanographic Commission of UNESCO (IOC), the United Nations Environment Programme (UNEP) and the International Science Council (ISC).
WMO programmes provide a large and vital part of the observing system monitoring the changing Earth’s climate and supporting both climate mitigation and adaptation. WMO supports global climate observations through meteorological, atmospheric composition and hydrological observing systems. These are complemented by the Global Ocean Observing System (GOOS) under IOC and co-sponsored by WMO, satellite observations coordinated by the Coordination Group on Meteorological Satellites (CGMS) and the Committee on Earth Observations Satellites (CEOS). In addition, there are numerous systems observing specific variables, particularly the Global Terrestrial Networks covering hydrology, permafrost, and glaciers. Many of these observations are performed and resourced at a national level. WMO is grateful to all these partners for their efforts to build a truly global climate observing system.
I congratulate the GCOS programme and the climate observation community on behalf of all sponsors for this important and timely publication, requested by the UNFCCC and its Subsidiary Body on Scientific and Technological Advice (SBSTA), and one which will significantly contribute to the observations and monitoring pillar of the Global Framework for Climate Services (GFCS).
GCOS is dependent on strong partners and so I am taking this opportunity to urge all Parties to the Convention on Climate Change, GCOS sponsoring organizations and relevant national and international agencies, institutions and organizations, to collaborate and support the continued development and improvement of a Global Climate Observing System for monitoring the baseline that we all need to build our sustainable future development.
Prof. Petteri Taalas Secretary-General
- iv -
EXECUTIVE SUMMARY
An Executive Summary is provided as a separate document and can be downloaded from the GCOS website (https://gcos.wmo.int/) in one of the six official UN languages.
- 5 -
1. INTRODUCTION Climate observations are of fundamental importance to understanding, attributing, predicting, projecting and mitigating and adapting to climate change. Global climate observations were instrumental for the IPCC to be able to declare, in 2013, that climate change is “unequivocal” with a “clear” human influence. However, the need for systematic climate observations is only increasing with the pressing needs for adaptation and mitigation measures, requiring a more accurate and reliable observational basis.
Climate observations are seldom performed solely for climate reasons. Meteorological observations are the basis for numerical weather prediction as well as for climate models. The Observations for Model Intercomparison Project (Obs4MIPs)1 has facilitated the use of observations in climate model evaluation and research particularly in the Coupled Model Intercomparison Project (CMIP), a major initiative of the World Climate Research Programme (WCRP). Ocean observations also support fisheries and ocean safety, while terrestrial observations are important for forest management, agriculture, and emergency response. Also, many climate observations support a range of the Sustainable Development Goals (SDG), not just Goal 13, Climate Change.
The Paris Agreement
Many parts of the Paris Agreement, approved in 2015, require systematic observations:
• The temperature goal of “holding the increase in the global average temperature to well below 2°C above pre-industrial levels and pursuing efforts to limit the temperature increase to 1.5°C above pre-industrial levels”, requires observations to not only monitor its achievement but also the impacts of mitigation measures, and how the natural carbon cycle is changing.
• The adaptation goal of “Increasing the ability to adapt to the adverse impacts of climate change and foster climate resilience and low greenhouse gas emissions development” requires observation-based predictions of a changing climate.
• Determining greenhouse gas fluxes from observations (based on measurements of atmospheric composition) could guide parties in their assessments of progress, support and improve national emission inventories and support reporting under the transparency framework.
• Observations of land cover and above ground biomass are fundamental to supporting efforts to conserve and enhance sinks and reservoirs, including forests.
• Parties should enhance understanding, action and support, of the loss and damage associated with the adverse effects of climate change, including through the Warsaw International Mechanism. Observations will support identifying, attributing, and predicting, extreme weather and slow onset events, and are an essential part of emergency warning systems.
• Informing the public of the state and future of the climate system.
• Supporting the Global Stocktake, by reporting on collective progress towards aims and goals of the Paris Agreement.
As identified in the Paris Agreement, systematic climate observations support a wide range of users beyond the more traditional scientific community. Climate services are becoming more important and should have a firm observational foundation. Consideration of these
1 https://doi.org/10.5194/gmd-13-2945-2020
- 6 -
needs by GCOS has started and will be an increasingly important focus in the future. By considering the Earth’s carbon and water climate cycles and energy balance, GCOS is identifying gaps in observations that limit understanding of the climate system.
GCOS structure and governance
The Global Climate Observing System (GCOS) was established in 1992 by the World Meteorological Organization (WMO), the Intergovernmental Oceanographic Commission of UNESCO (IOC), the United Nations Environment Programme (UNEP) and the International Science Council (ISC) to coordinate global climate observations and facilitate their development and improvement. GCOS has since then identified and updated a set of variables that, when observed, should provide the necessary information to understand, model and predict climate and plan policies for mitigation and adaptation strategies for all countries. The status of the observations of these variables, called Essential Climate Variables (ECV), are monitored by GCOS which publishes regular status reports, of which this is the fifth. GCOS also identifies and publishes what is needed to improve the system in implementation reports. GCOS works through three panels: the Atmospheric Observing Panel for Climate (AOPC), the Ocean Observations Physics and Climate Panel (OOPC) and the Terrestrial Observing Panel for Climate (TOPC), for the atmosphere, ocean and terrestrial systems respectively, and through the GCOS Cooperation Mechanism (GCM), which provides direct support to observations. The atmospheric and terrestrial panels are jointly sponsored with the WMO World Climate Research Programme (WCRP), and the ocean panel with the WCRP and the IOC Global Ocean Observing System (GOOS). Similar to the previous status report produced in 2015 (GCOS-195), this report will be followed by an Implementation Plan to be published in 2022 that will present priority actions to improve the global climate observing system and address any gaps identified in this report.
A system of systems observing architecture approach
The global climate observing system is a system of systems with a variety of components covering atmosphere, oceans, hydrology, the cryosphere and biosphere. A range of organizations monitors the climate in different ways covering different groups of ECV and regions. Both satellite and in situ observations are major contributors to global climate observations. Climate, climate change research and applications require historical observational data from sources well distributed across the globe. GCOS promotes a tiered approach to network design and implementation:
• Reference Networks. A coordinated collection of sites that make measurements of the highest quality. These measurements are fully traceable to international standards, have a quantified uncertainty budget, complete metadata (following the WMO metadata standard) and additional documentation covering site conditions, operational procedures and calibration records. These sites are expensive to maintain and so are expected to be relatively few in number. Sites typically are representative of specific climatic and environmental conditions. Reference networks should ideally be embedded in the baseline and comprehensive networks and their highly reliable observations used to validate these other networks. Examples include GCOS Reference Upper-Air Network (GRUAN) and the GCOS Surface Reference Network (GSRN) that is currently being established.
• Baseline Networks. These networks comprise the minimum number of stations necessary to achieve a globally representative coverage to allow global, hemispheric and regional averages and trends to be determined. They should exchange data as needed by global numerical weather prediction and meet national
- 7 -
and regional quality standards. Sites need to cover all climatic and environmental conditions. Examples include the GCOS Surface Network (GSN) and the GCOS Upper-Air Network (GUAN).
• Comprehensive Networks. These are the remaining observing platforms. These stations provide additional regional, national and local details. They include data of opportunity that may or may not meet established requirements, but nevertheless provide useful information.
GCOS has also defined climate monitoring principles2 that have been approved by the United Nations Framework Convention on Climate Change (UNFCCC) and WMO and which should be followed in the collection, management and distribution of climate data.
GCOS has established the GRUAN3 and is in the process of setting up, with WMO, the GSRN (GCOS 226) with a pilot planned to start operations within 2023. Once established, it is planned to extend this network to the other domains.
While the GCOS networks, the GCOS Surface Network (GSN) and the GCOS Upper Air Network (GUAN), provide a baseline network measuring meteorological variables in the atmosphere, National Meteorological and Hydrological Meteorological Services (NMHS), coordinated by WMO, provide a more comprehensive and denser network of measurements. In a similar vein, WMO’s Global Atmospheric Watch (GAW) coordinates atmospheric composition measurements, ensuring reliable and accurate data, from measurements made by WMO Members, research institutions and/or agencies and other contributing networks.
Ocean observations of ocean physics, biogeochemistry, biology and ecosystems are coordinated through GOOS. The Ocean Observations Physics and Climate Panel (OOPC) identifies ocean ECVs including sea ice and incorporates them into ocean network design4. The GOOS Observations Coordination Group (OCG) monitors the performance of these networks5 and produces an annual Ocean Observing System Report Card6.
In the terrestrial domain there is a more diverse group of comprehensive and baseline observing networks than in the atmosphere and the oceans. Hydrological observations are mostly operated by NMHS and coordinated through WMO. There are a number of Global Terrestrial Networks (GTN) that report to GCOS. These include the GTN-Hydrology (GTN-H) that itself is a collaboration of other networks such as those covering lakes, rivers, groundwater, soil moisture, and water use. The GTN-Permafrost (GTN-P) and the GTN-Glaciers (GTN-G) with the World Glacier Monitoring Service (WGMS) are increasingly cooperating with the WMO Global Cryosphere Watch (GCW). The Global Observation for Forest Cover and Land Dynamics (GOFC-GOLD) covers above-ground biomass, forests, land use and wildfires and mainly provides guidance and calibrations for the mainly satellite-based observations that are needed to cover ecosystems across the globe. In
2 The complete set of principles was adopted by the Congress of the World Meteorological
Organization (WMO) through Resolution 9 (Cg-XIV) in May 2003; agreed by the Committee on Earth Observation Satellites (CEOS) at its 17th Plenary in November 2003; and adopted by UNFCCC through decision 11/CP.9 at COP-9 in December 2003.
3 www.gruan.org 4 Ocean ECVs are a subset of Essential Ocean Variables for GOOS 5 https://www.ocean-ops.org/ 6 http://www.ocean-ops.org/reportcard2020/
- 8 -
addition to these, there are a number of regionally based networks that are significant contributors to the networks: some are nationally based while others cover wider regions.
Satellite community engagement
Satellite observations used with ground-based observations, either as complementary data sets or for validation and calibration, form an invaluable part of the global observing system.
The joint Working Group on Climate (WGClimate) of the Committee for Earth Observation Satellites (CEOS) and the Coordination Group for Meteorological Satellites (CGMS) bases the development of satellite observations for climate on the ECV requirements established by GCOS. They have produced an ECV Inventory that includes 766 climate data records for 33 ECVs including 72 separate ECV products. More records are planned7. In 2018 WGClimate published a report8 that provided a consolidated Space Agency response to actions from the 2016 GCOS-IP (GCOS-200).
Report preparation and structure
Each GCOS panel has appointed ECV Stewards for every ECV who are responsible for reporting on the status of observations of that ECV. Similarly, IP Action Rapporteurs have been appointed who are responsible for monitoring and reporting on actions from the Implementation Plan. These experts are responsible for the assessment of each ECV and IP Action presented in this report. These assessments were reviewed, firstly by the panels as a whole and then by the writing team to ensure consistency and completeness. The entire report has been subject to public review to ensure the results presented here are based on as wide a set of views as possible.
This report adopts a new approach to presenting information about the observing system. The main chapters present summary information while annexes contain more detail on each ECV and Implementation Plan action. The report is structured as follows:
• Chapter 2 discusses the energy budget and the carbon and water cycles.
• Chapter 3 presents a summary of the performance of the global climate observing system in observing each Essential Climate Variable (ECV) and making the data available. Annex A presents more detailed information for each ECV.
• Chapter 4 gives information about satellite-based ECV observations across all the domains, as provided by WGClimate.
• Chapter 5 reviews the progress made on the actions identified in the last GCOS implementation plan published in 2016. Again, this is summarised in the main chapter and Annex B presents more detail on each action.
• Chapter 6 briefly considers how well these observations can be used to address adaptation and extremes.
• Finally, chapter 7 summarises some implications and conclusions which will be further addressed in the upcoming Implementation Plan that will be presented to the UNFCCC and observing systems in 2022.
The impact of the coronavirus on observations has, in some cases, been marked and this is partially reflected in the report. A full consideration of the impacts of COVID-19 on the
7 http://climatemonitoring.info/ecvinventory 8 Space Agency response to GCOS Implementation Plan: https://www.cgms-
info.org/documents/Space_Agency_Response_to_GCOS_IP_v2.0.pdf
- 9 -
global climate observing system performance and long-term resilience will only be possible some time after the pandemic is completely over.
2. OBSERVATIONS OF THE EARTH SYSTEM CLIMATE CYCLES The most important features of the earth system for understanding and predicting climate change are water (or hydrological) and carbon cycles and the energy balance9. Ideally, these should be completely monitored by ECVs. By assessing how well these are observed, GCOS will be able to identify gaps and inconsistencies in the global climate observing system in a more integrated way than separately considering the three domains, atmosphere, ocean and terrestrial.
Matter and energy continuously cycle through the Earth system. While the rates of exchange between different reservoirs have changed over geological time, these rates are changing faster than ever before due to human influence. These changes affect the amounts of energy, carbon and water in the different components of the Earth system. This directly effects the availability of critical components such as water, where access to water of good quality is a basic human need, while changes in the energy cycle directly drive impacts such as heatwaves, ocean heatwaves, extreme precipitation and drought.
Therefore, it is important to observe not only the status of the reservoirs (the total amount of water, energy and carbon in the reservoirs), but also how they are related to each other by their exchanges (fluxes). This allows a better assessment of the availability of key components of the water cycle, and also allows the better determination of mitigation targets for the greenhouse gasses through the carbon budget. For energy, observing and knowing where the excess energy resides is key in developing adaptation plans to climate change, such as against sea level and future temperature rise. Understanding these Earth’s cycles is critical for both scientific model evaluation and for determining key policy targets set in the Paris agreement framework.
While this work continues, key messages identified so far include:
• The discrepancy in observations of the carbon cycle between sources and sinks, which reflects the overall uncertainty of observations, is 0.4 Gton C yr-1, or 3% of the global emissions. The present emission reductions pledged in the Nationally Determined Contributions (NDCs) are of the order of 50% over 25 years, or less than 2% per year. This is smaller than the observed imbalance, indicating that, as yet, we cannot observe the emissions reductions adequately to verify annual global emissions changes. A considerable part of this uncertainty is caused by uncertainty in both the land sink and land use change (fractional uncertainties of 20% and 45% respectively). This is important not only for observing mitigation actions but also for the fact that land use is expected to play a large role in mitigation efforts.
• Observations that allow estimation of both stocks such as biomass, soil carbon (both in situ and from space), and fluxes (in situ and through inversions) need to be extended to able to reduce the uncertainty in the carbon cycle. The land use uncertainty directly impacts the quantification of the land sink and is one of largest. Reducing this uncertainty through improved monitoring, particularly from space, is required.
9 There are other important earth system budgets (e.g. Nitrogen budget) that are impacted by
climate change and human activities.
- 10 -
• Improved monitoring of the chemical composition of the ocean through BGC (biogeochemical)-Argo and other in situ observing systems remain crucial to determine the strength of the ocean carbon sink.
• The Earth’s energy imbalance, the amount of heating caused by climate change, was estimated to be 0.47 Wm-2 (±0.1) over the period 1971–2018. This estimate involves observations from space, from oceans by Argo buoys and from atmospheric observations such as GRUAN. Since 89 % of this excess energy goes into the ocean it is critically important to sustain and extend an integrated ocean observing system. Turbulent fluxes of latent and sensible heat are one of the critical uncertainties. Both in situ (e.g. FLUXNET) and satellite observations need to be combined to produce new estimates. Since evaporation over the ocean cannot be determined from space but only inferred through algorithms using energy balances and weather, investment in in situ observations is needed, alongside improvement of observations over land.
• Long-term monitoring of the Earth's water cycle has made great progress in recent decades, but many observational gaps remain. Many ECV data records do not have a sufficiently long time series to allow the determination of their trends. The main contributor to the terrestrial water budget imbalance is precipitation followed by evaporation, therefore, it is of the utmost importance to recover historical satellite and ground data, and harmonize past, current, and future observing systems for these ECVs.
• To be able to better close the global hydrological budget a new terrestrial ECV, terrestrial total water storage, has been agreed that integrates over the land hydrological cycle including water stored in ground water, soil moisture, rivers, lakes, reservoirs and ice. Importantly this variable can be observed from space over large areas (GRACE and GRACE-FO) and links directly to one of the more uncertain ECVs: evaporation. Thus, the continuation of satellite-based gravity observations is vital.
• One part of the hydrological cycle where trends can be determined is sea level rise. Melting glaciers contribute 0.61 (±0.8) mmyr-1 and calving Greenland and Antarctic ice sheets 1.2 mm (±0.14 mmyr-1) to sea level rise (IPCC, 2019), together about 50% of the total (the remainder is due to thermal expansion of the ocean and changing water storage on land). Continual monitoring, satellite and in situ, of the large ice sheets and glaciers remains therefore important.
Closing the cycles will allow improved forecasts of the impacts of climate change and of the understanding of the Earth’s resilience that underpins climate policy, adaptation and mitigation. In particular, closing the Earth’s energy balance and the carbon and water cycles through observations is an outstanding scientific issue that requires high-quality climate records of key ECVs and attention to the exchange fluxes between the domains of atmosphere, land, ocean and ice. If key pools of state variables are missing, these budgets cannot be closed.
In summary the focus on Earth cycles implies the need to:
• Consistently assess the variability of the carbon, hydrological and energy cycles at various spatial and temporal scales.
• Assess the relevant land, atmosphere, and ocean storages and the fluxes between them, including anthropogenic fluxes and stores.
- 11 -
• Identify gaps in existing observation systems and in consistency and attribute their origin.
• Formulate guidelines for future Earth cycle observation strategies.
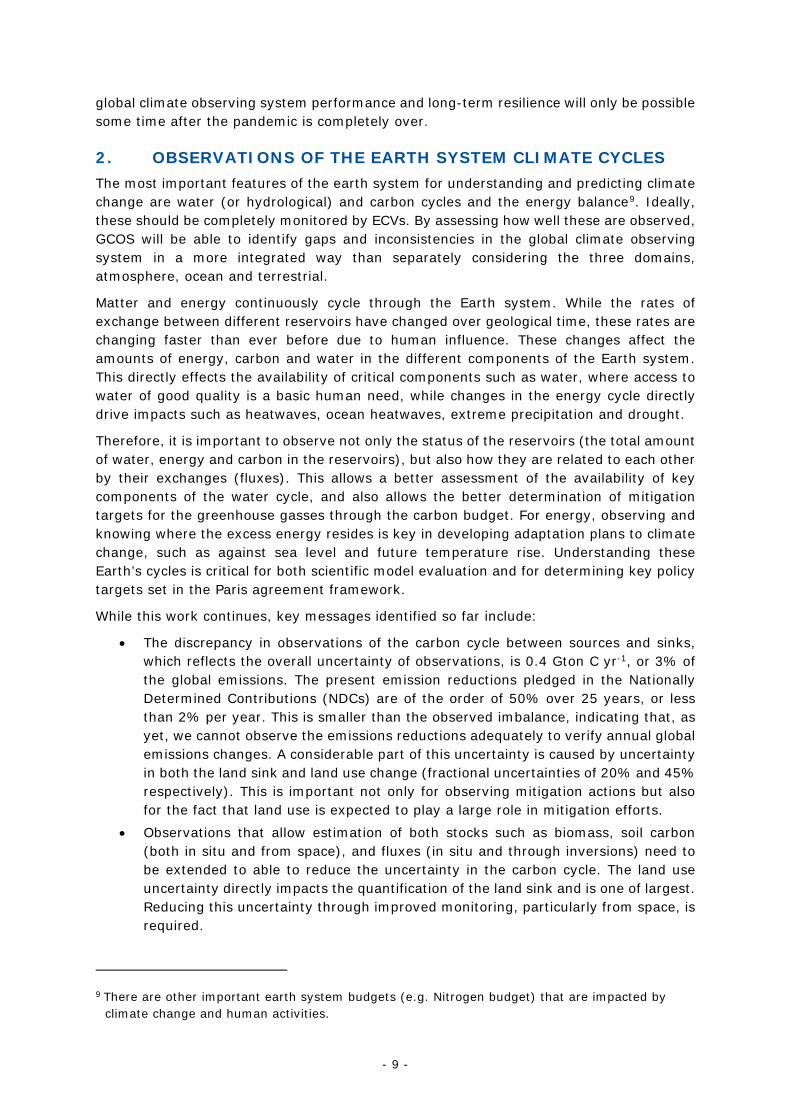
An initial attempt is made to use this cycle perspective in Figure 1 which also identifies the current ECVs as listed in the 2016 GCOS-IP. This is a simplification of the true situation. Many of the transport and composition ECVs are needed to understand and model the cycles and energy balance but cannot be simply allocated to a single cycle (e.g. Aerosols have an impact on temperatures, wind and currents affect hydrological and carbon cycles).
Figure 1. ECVs according to the cycle perspective
Four long-term targets were presented in the 2016 GCOS Implementation Plan for the carbon and water cycles, the earth’s energy balance and the state of the biosphere:
• Quantify fluxes of carbon-related greenhouse gases to +/10% on annual timescales. Quantify changes in carbon stocks to +/10% on decadal timescales in the ocean and on land, and to +/2.5 % in the atmosphere on annual timescales.
• Close the water cycle globally within 5% on annual timescales.
• Balance the global energy budget to within 0.1 Wm-2 on annual timescales.
• Measured ECVs that are accurate enough to explain changes of the biosphere
The ECVs support the monitoring of these targets.
In this report we present how well these long-term goals for the carbon and the water cycles and the energy balance have been achieved. For the next GCOS-IP it will be important to identify which additional variables and observations may be needed to close
- 12 -
the cycles, and how consistently the requirements (e.g. stability, uncertainty) of individual ECVs are specified. As shown in Figure 1, many ECVs focus on the biosphere. While, globally, changes in the biosphere are occurring e.g. global greening and browning, changes in phenology and species distribution in the ocean, GCOS has not yet agreed how to represent overall changes in the biosphere and the development of indicators is underway.
Earth’s energy budget
There are fundamentally two different ways of determining Earth’s energy budget. One is to take the global mean stocks (heat content) of the different components, such as ocean, land, ice and atmosphere and calculate their trends and total budget, noting that changes in kinetic and chemical forms of energy make a negligible contribution (von Schuckmann et al., 2016). The imbalance in this global earth heat inventory , called the Earth’s Energy Imbalance (EEI), can be expressed as EEI = 𝐹𝐹 – a𝑇𝑇 where EEI is W m-2, F is the radiative forcing (W m-2), T is the global surface temperature anomaly (K) relative to the equilibrium state, and a is the net feedback parameter (W m-2 K-1), which represents the combined effect of the various climate feedbacks. The parameter a can be viewed as a measure of how efficient the system is at restoring radiative equilibrium for a unit surface temperature rise. Current estimates (von Schuckmann et al., 2020) of the EEI range from 0.4 to 1.0 Wm-2.
The second way for determining the Earth’s energy balance is to look at the radiative fluxes directly. Satellites generally provide high quality estimates of the temporal variations of net fluxes at the top of the atmosphere while, at the Earth’s surface, the full set of radiative and turbulent fluxes are required, which are much more uncertain.
Examples of estimates of the EEI using observations can be found in Stephens et al. (2012); analysing CMIP6 models in Wild (2020); and analysing the surface fluxes in a comprehensive data assimilation system in Lecuyer et al. (2015).
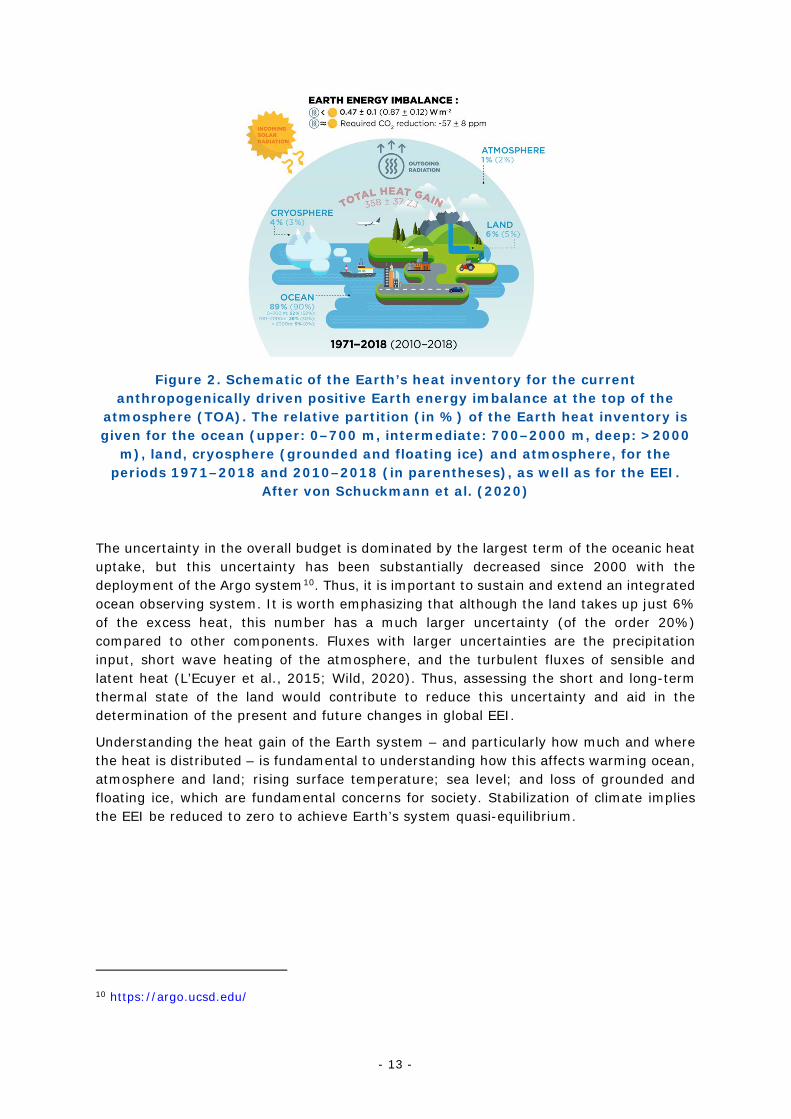
Recently a GCOS initiated comprehensive analysis, by von Schuckmann et al. (2020) arrived at a new value of EEI of 0.42 Wm-2, with an uncertainty (2 SD) of 10% (Figure 2). The total amount of energy stored in the Earth System over the period 1960-2016 amounts to 361 ±40 ZJ (1 ZJ is 1021J) (Figure 3). The major player in the Earth inventory is the ocean, particularly the upper (0-700 m) and intermediate (700-2000 m) ocean layers. Over 1960-2018, these two ocean layers accounted for 53% and 28% of the excess Earth’s heat respectively. The deep ocean layer adds another 8%, so that the full-depth ocean contributes with 89% to the Earth heat inventory over recent decades. Atmospheric warming amounts to 1% of the Earth excess heat, the land heat gain 6% and the heat gain in the cryosphere 4%, a comparable range as estimated by Slater et al. (2021). A schematic is shown in Figure 2.
- 13 -
Figure 2. Schematic of the Earth’s heat inventory for the current
anthropogenically driven positive Earth energy imbalance at the top of the atmosphere (TOA). The relative partition (in %) of the Earth heat inventory is given for the ocean (upper: 0–700 m, intermediate: 700–2000 m, deep: >2000
m), land, cryosphere (grounded and floating ice) and atmosphere, for the periods 1971–2018 and 2010–2018 (in parentheses), as well as for the EEI.
After von Schuckmann et al. (2020)
The uncertainty in the overall budget is dominated by the largest term of the oceanic heat uptake, but this uncertainty has been substantially decreased since 2000 with the deployment of the Argo system10. Thus, it is important to sustain and extend an integrated ocean observing system. It is worth emphasizing that although the land takes up just 6% of the excess heat, this number has a much larger uncertainty (of the order 20%) compared to other components. Fluxes with larger uncertainties are the precipitation input, short wave heating of the atmosphere, and the turbulent fluxes of sensible and latent heat (L’Ecuyer et al., 2015; Wild, 2020). Thus, assessing the short and long-term thermal state of the land would contribute to reduce this uncertainty and aid in the determination of the present and future changes in global EEI.
Understanding the heat gain of the Earth system – and particularly how much and where the heat is distributed – is fundamental to understanding how this affects warming ocean, atmosphere and land; rising surface temperature; sea level; and loss of grounded and floating ice, which are fundamental concerns for society. Stabilization of climate implies the EEI be reduced to zero to achieve Earth’s system quasi-equilibrium.
10 https://argo.ucsd.edu/
- 14 -
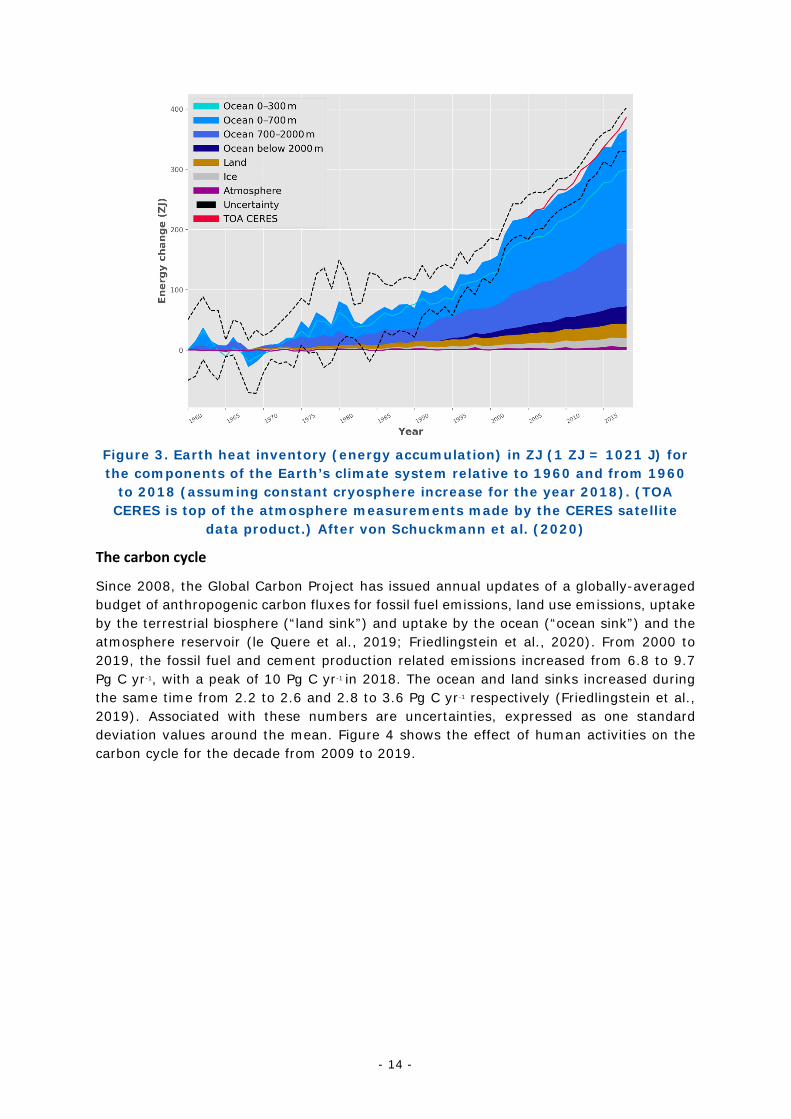
Figure 3. Earth heat inventory (energy accumulation) in ZJ (1 ZJ = 1021 J) for the components of the Earth’s climate system relative to 1960 and from 1960
to 2018 (assuming constant cryosphere increase for the year 2018). (TOA CERES is top of the atmosphere measurements made by the CERES satellite
data product.) After von Schuckmann et al. (2020)
The carbon cycle
Since 2008, the Global Carbon Project has issued annual updates of a globally-averaged budget of anthropogenic carbon fluxes for fossil fuel emissions, land use emissions, uptake by the terrestrial biosphere (“land sink”) and uptake by the ocean (“ocean sink”) and the atmosphere reservoir (le Quere et al., 2019; Friedlingstein et al., 2020). From 2000 to 2019, the fossil fuel and cement production related emissions increased from 6.8 to 9.7 Pg C yr-1, with a peak of 10 Pg C yr-1 in 2018. The ocean and land sinks increased during the same time from 2.2 to 2.6 and 2.8 to 3.6 Pg C yr-1 respectively (Friedlingstein et al., 2019). Associated with these numbers are uncertainties, expressed as one standard deviation values around the mean. Figure 4 shows the effect of human activities on the carbon cycle for the decade from 2009 to 2019.
- 15 -
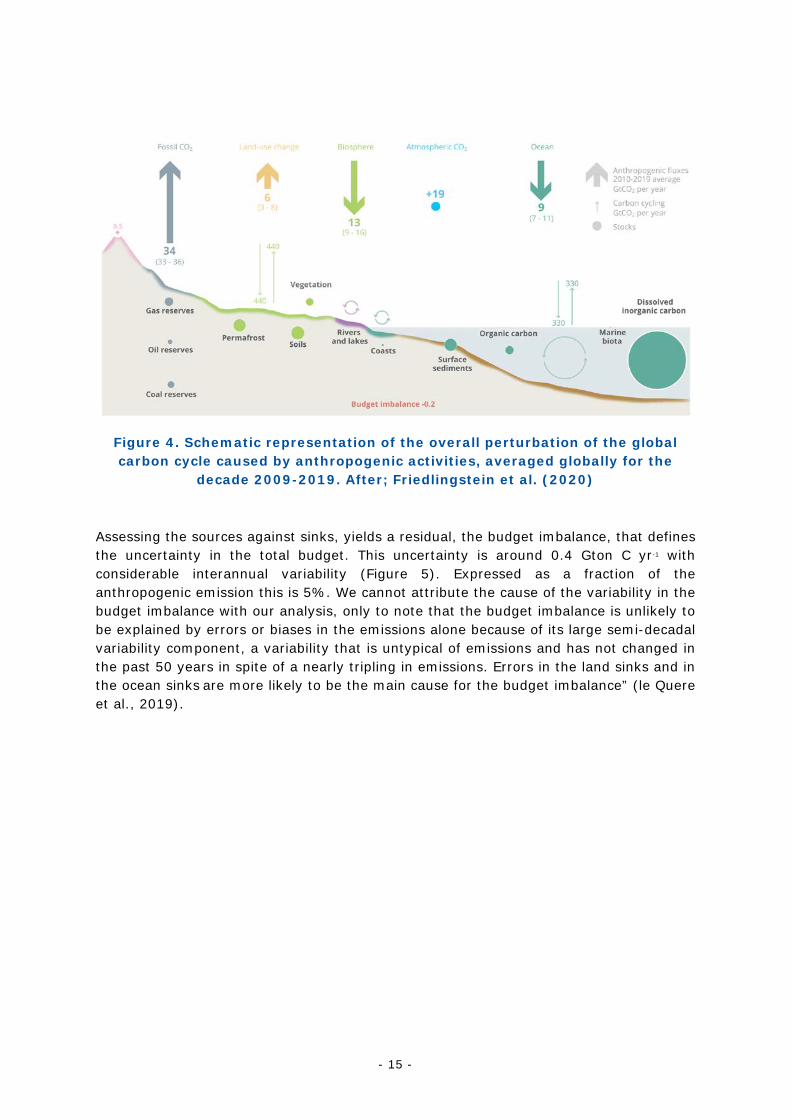
Figure 4. Schematic representation of the overall perturbation of the global carbon cycle caused by anthropogenic activities, averaged globally for the
decade 2009-2019. After; Friedlingstein et al. (2020)
Assessing the sources against sinks, yields a residual, the budget imbalance, that defines the uncertainty in the total budget. This uncertainty is around 0.4 Gton C yr-1 with considerable interannual variability (Figure 5). Expressed as a fraction of the anthropogenic emission this is 5%. We cannot attribute the cause of the variability in the budget imbalance with our analysis, only to note that the budget imbalance is unlikely to be explained by errors or biases in the emissions alone because of its large semi-decadal variability component, a variability that is untypical of emissions and has not changed in the past 50 years in spite of a nearly tripling in emissions. Errors in the land sinks and in the ocean sinks are more likely to be the main cause for the budget imbalance” (le Quere et al., 2019).
- 16 -
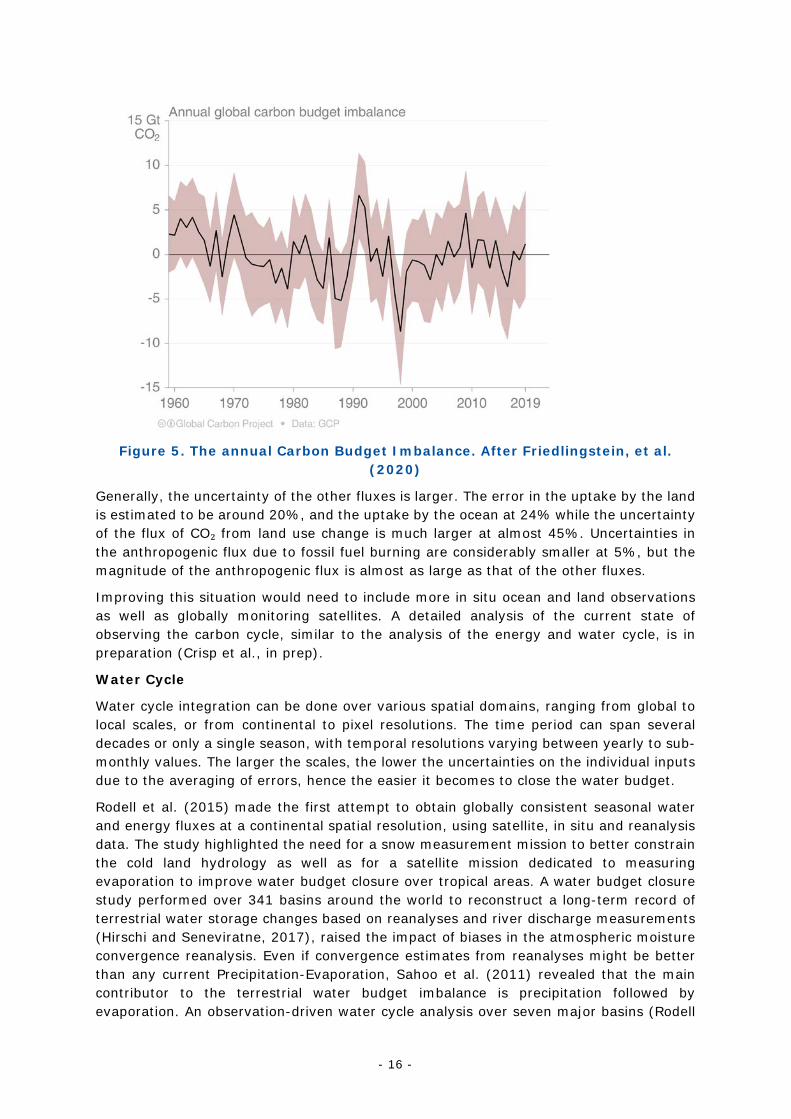
Figure 5. The annual Carbon Budget Imbalance. After Friedlingstein, et al. (2020)
Generally, the uncertainty of the other fluxes is larger. The error in the uptake by the land is estimated to be around 20%, and the uptake by the ocean at 24% while the uncertainty of the flux of CO₂ from land use change is much larger at almost 45%. Uncertainties in the anthropogenic flux due to fossil fuel burning are considerably smaller at 5%, but the magnitude of the anthropogenic flux is almost as large as that of the other fluxes.
Improving this situation would need to include more in situ ocean and land observations as well as globally monitoring satellites. A detailed analysis of the current state of observing the carbon cycle, similar to the analysis of the energy and water cycle, is in preparation (Crisp et al., in prep).
Water Cycle
Water cycle integration can be done over various spatial domains, ranging from global to local scales, or from continental to pixel resolutions. The time period can span several decades or only a single season, with temporal resolutions varying between yearly to sub-monthly values. The larger the scales, the lower the uncertainties on the individual inputs due to the averaging of errors, hence the easier it becomes to close the water budget.
Rodell et al. (2015) made the first attempt to obtain globally consistent seasonal water and energy fluxes at a continental spatial resolution, using satellite, in situ and reanalysis data. The study highlighted the need for a snow measurement mission to better constrain the cold land hydrology as well as for a satellite mission dedicated to measuring evaporation to improve water budget closure over tropical areas. A water budget closure study performed over 341 basins around the world to reconstruct a long-term record of terrestrial water storage changes based on reanalyses and river discharge measurements (Hirschi and Seneviratne, 2017), raised the impact of biases in the atmospheric moisture convergence reanalysis. Even if convergence estimates from reanalyses might be better than any current Precipitation-Evaporation, Sahoo et al. (2011) revealed that the main contributor to the terrestrial water budget imbalance is precipitation followed by evaporation. An observation-driven water cycle analysis over seven major basins (Rodell
- 17 -
et al., 2015) revealed that particularly over the tropics, evapotranspiration is still too poorly simulated by land surface models. The generally observed large uncertainties in evaporative fluxes is in line with the critical uncertainties for latent and sensible heat in Earth's energy budget, as observed before.
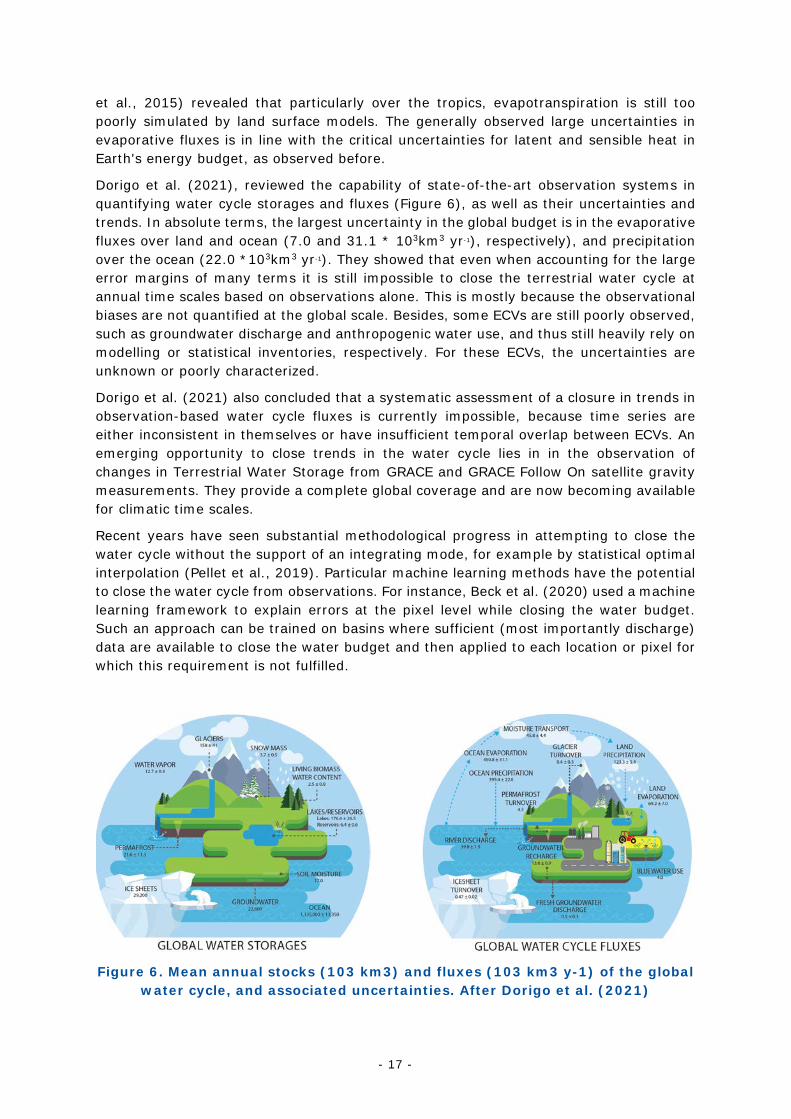
Dorigo et al. (2021), reviewed the capability of state-of-the-art observation systems in quantifying water cycle storages and fluxes (Figure 6), as well as their uncertainties and trends. In absolute terms, the largest uncertainty in the global budget is in the evaporative fluxes over land and ocean (7.0 and 31.1 * 103km3 yr-1), respectively), and precipitation over the ocean (22.0 *103km3 yr-1). They showed that even when accounting for the large error margins of many terms it is still impossible to close the terrestrial water cycle at annual time scales based on observations alone. This is mostly because the observational biases are not quantified at the global scale. Besides, some ECVs are still poorly observed, such as groundwater discharge and anthropogenic water use, and thus still heavily rely on modelling or statistical inventories, respectively. For these ECVs, the uncertainties are unknown or poorly characterized.
Dorigo et al. (2021) also concluded that a systematic assessment of a closure in trends in observation-based water cycle fluxes is currently impossible, because time series are either inconsistent in themselves or have insufficient temporal overlap between ECVs. An emerging opportunity to close trends in the water cycle lies in in the observation of changes in Terrestrial Water Storage from GRACE and GRACE Follow On satellite gravity measurements. They provide a complete global coverage and are now becoming available for climatic time scales.
Recent years have seen substantial methodological progress in attempting to close the water cycle without the support of an integrating mode, for example by statistical optimal interpolation (Pellet et al., 2019). Particular machine learning methods have the potential to close the water cycle from observations. For instance, Beck et al. (2020) used a machine learning framework to explain errors at the pixel level while closing the water budget. Such an approach can be trained on basins where sufficient (most importantly discharge) data are available to close the water budget and then applied to each location or pixel for which this requirement is not fulfilled.
Figure 6. Mean annual stocks (103 km3) and fluxes (103 km3 y-1) of the global
water cycle, and associated uncertainties. After Dorigo et al. (2021)
- 18 -
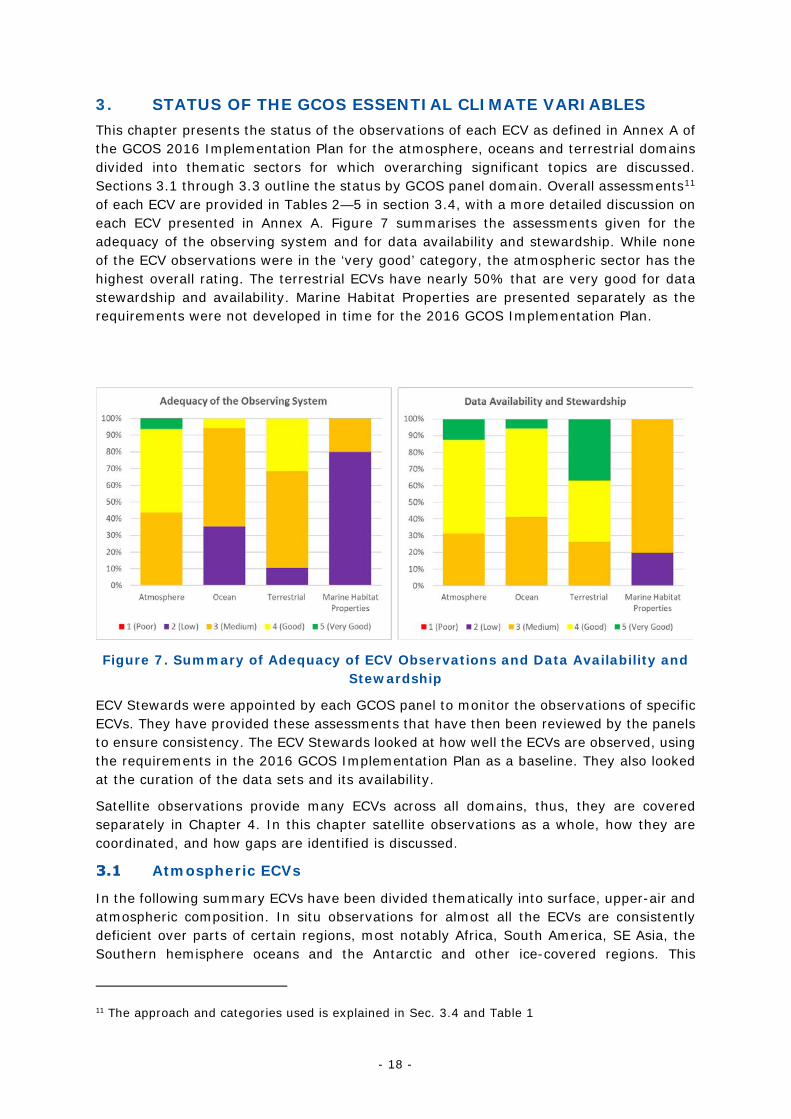
3. STATUS OF THE GCOS ESSENTIAL CLIMATE VARIABLES This chapter presents the status of the observations of each ECV as defined in Annex A of the GCOS 2016 Implementation Plan for the atmosphere, oceans and terrestrial domains divided into thematic sectors for which overarching significant topics are discussed. Sections 3.1 through 3.3 outline the status by GCOS panel domain. Overall assessments11 of each ECV are provided in Tables 2—5 in section 3.4, with a more detailed discussion on each ECV presented in Annex A. Figure 7 summarises the assessments given for the adequacy of the observing system and for data availability and stewardship. While none of the ECV observations were in the ‘very good’ category, the atmospheric sector has the highest overall rating. The terrestrial ECVs have nearly 50% that are very good for data stewardship and availability. Marine Habitat Properties are presented separately as the requirements were not developed in time for the 2016 GCOS Implementation Plan.
Figure 7. Summary of Adequacy of ECV Observations and Data Availability and
Stewardship
ECV Stewards were appointed by each GCOS panel to monitor the observations of specific ECVs. They have provided these assessments that have then been reviewed by the panels to ensure consistency. The ECV Stewards looked at how well the ECVs are observed, using the requirements in the 2016 GCOS Implementation Plan as a baseline. They also looked at the curation of the data sets and its availability.
Satellite observations provide many ECVs across all domains, thus, they are covered separately in Chapter 4. In this chapter satellite observations as a whole, how they are coordinated, and how gaps are identified is discussed.
Atmospheric ECVs
In the following summary ECVs have been divided thematically into surface, upper-air and atmospheric composition. In situ observations for almost all the ECVs are consistently deficient over parts of certain regions, most notably Africa, South America, SE Asia, the Southern hemisphere oceans and the Antarctic and other ice-covered regions. This
11 The approach and categories used is explained in Sec. 3.4 and Table 1
- 19 -
situation is either stable or deteriorating since the GCOS 2015 Status Report. This lack of in situ data will have consequences for the quality of satellite observations through lack of data for calibration and validation. Some of the problems related to the operation of the in situ network have been addressed by the GCOS Cooperation Mechanism, the system improvement and resource mobilization activity of the GCOS programme (See Annex C section C.a.i). The WMO Congress in 2019 adopted the concept for a Global Basic Observing Network (GBON), which will provide essential meteorological observations that support Numerical Weather Prediction (NWP) and Climate reanalysis. GBON will be designed, defined and monitored at the global level. WMO is currently working with partner organizations from the development and climate finance communities to establish a Systematic Observations Finance Facility (SOFF) that, if successful, will provide financial and technical support for the implementation and operation of GBON to those members who would not otherwise be able to implement their contributions to this network.
Surface ECVs
Coverage of in situ measurements for surface ECVs over land and ocean is excellent in some regions, but inadequate or non-existent over large areas of some continents, over most ice-covered regions, such as the Antarctic and Arctic, and for oceans with few shipping routes. Coverage is also sparse in desert regions and all tropical rain forests.
Not all data are under NMHS auspices, however one of the principal sources of information on the near surface ECVs over land are the Regional Basic Observational Networks (RBON) of World Weather Watch/Global Observing System (WWW/GOS)12. The measurements provided by these networks are transmitted using standard messages (SYNOP, CLIMAT) over the WMO Information System (WIS), and about 1000 of the RBON stations have been designated as the GSN. Over the ocean, the WMO Voluntary Observing Ships (VOS) program coordinates measurement and Near Real Time (NRT) transmission of marine meteorological and oceanographic measurements made aboard ships recruited to national or regional observing VOS networks. Satellites cannot accurately measure near-surface air temperature, humidity and pressure. Wind speed and direction are available over the ocean from satellite scatterometers and wind speed from microwave sensors and radar altimeters, and gridded datasets for the global ice-free ocean have been constructed starting in 1987. A global estimation of accumulated precipitation is done on an operational basis by combining in situ data with remote sensing data from satellites, radar and Commercial Microwave Links (CMLs). Radar remotely sensed precipitation data are only sparsely located and rarely shared. Microwave imagers and microwave soundings with satellite instruments are in an operational sustained status and have good continuity into the 2040s, which are assured by the space agencies.
Successes • The Copernicus Climate Change Service (C3S) and NOAA National Centers for
Environmental Information (NCEI) started a collaboration that resulted in the initiation of a new database containing all meteorological surface parameters measured from standard meteorological stations and available across synoptic through monthly aggregations13 (IP Action A2).
• Significant progress has been made in the rescue of historical data, both with the launch of the C3S data rescue service that builds upon existing WMO International
12 http://www.wmo.int/pages/prog/www 13 https://climate.copernicus.eu/global-land-and-marine-observations-database-0
- 20 -
Data Rescue activities, and through new activities such as “Integrating data rescue in the classroom” (Ryan et al., 2018). Lists of data that have been historically collected are now available (Bronnimann et al.,2019).
• As noted in the 2016 GCOS-IP there is no reference network for land surface meteorological observations. A GCOS task team has published a report (GCOS-226) that provides details on what is required to implement the GSRN. Presently, GCOS and WMO are working together to proceed with the next steps as outlined in the report. A pilot project is envisioned to start in 2021.
• Since the last GCOS-IP, there has been significant progress in the use of crowdsourcing for surface atmospheric observations. For precipitation, for example, the science Community Collaborative Rain, Hail, and Snow (CoCoRaHS) network and similar efforts such as the Weather Observations Website (WOW) have greatly increased daily coverage over some regions.
• A GCOS Task Team delivered a 2019 report, GCOS-223, on the use of radar for climatology studies. In the report, requirements for radar data to be used for climate monitoring are defined. The team recommends the establishment of an international portal to allow harmonized access to radar data, metadata and documentation. Recommendations on how to preserve datasets for future climatologists were published in Saltikoff et al. (2019).
Challenges • Large volumes of observations are still available only in paper or fiche/film records
and in need of rescue. Substantial effort and resources are still needed to both rescue these data and incorporate them in climate archives.
• While substantial progress has been made by C3S and NOAA NCEI to build a database, significant work to process extensive data sources is still required.
• Modernization of the processing and data formats used for the archival of marine surface observations is urgently needed. There is still no dedicated data centre for the archival of marine observations from the GTS.
• Gridded products for surface temperature provide the key metric in climatology and are produced by combining the surface air temperature over land with the sea surface temperature across the world’s surface at monthly and more recently at daily timescales. However, recent studies have shown that Sea Surface Temperature (SST) and marine air temperature (MAT) have significant differences in statistical properties of their anomalies and therefore another approach would be to use the MAT rather than the SST for the gridded products.
• Coverage of surface marine atmospheric ECVs, including MAT, but also humidity, wind, cloud cover, wave parameters has declined in recent decades because of a reduction in the number of ships making observations.
• High-quality precipitation products formed by combining observations from different platforms are limited by the lack of high-resolution fields.
Upper-air ECVs
For upper-air wind and temperature, and for clouds, ground-based networks and satellites together provide quasiglobal coverage. Most ground-based network archives are well stewarded. Satellite and reanalysis data are well curated by their producers. Locations where observations have long been sparse have not improved, despite continued efforts to improve the situation. Except for major air traffic corridors, in situ observations are
- 21 -
almost completely absent over the global oceans, including the Arctic Ocean. Despite the difficulties of observing the complete water vapor vertical profile, significant improvements have been made in the spatial coverage and reliability of water vapor measurements. However, no single measurement technique exists with sufficient accuracy, record length, coverage, resolution, and temporal stability to monitor multi-decadal air water vapour trends, on a global scale from the free troposphere up into the mesosphere. For Earth Radiation Budget (ERB), satellite capabilities are currently stable in terms of measurement frequency statistics. Measurements continue to be made by several satellites. The data often are shared broadly but tend not to be shared in near real time. Global coverage for lightning is ensured by at least two real-time high-resolution networks. The data are made by private networks and are currently not available free of charge.
Successes • GRUAN: Since the last GCOS-IP, the network has expanded considerably to include
several stations in regions that were previously under-represented including the first stations in the tropics and in Antarctica.
• The availability and exploitation of the Global Navigation Satellite System Radio Occultation (GNSS-RO) profiles has improved. GNSS-RO provides all sky profile information with several hundred to several thousand profiles measured per day. The fundamental measurement of phase delay is both stable and fully SI traceable.
• Aircraft Based Observations (ABO): The total number of observations increased by about 50 % from 2014 to 201914. The coverage over South America has especially improved through a new global Aircraft Meteorological Data Relay (AMDAR) program. Also, lower tropospheric observations over some islands in the tropical Indian Ocean and western Pacific became available since 2016 GCOS-IP. Details on the status of the ABO are described in the summary of Action A20 in this report.
• Lightning: a GCOS Task Team was established to work on the requirements for lightning for climate. Results are summarised in (GCOS-227. An active effort sponsored by GCOS is underway to accumulate thunder day data for climate studies, which is available for many decades from specific locations and specific countries. Data from the geostationary lightning mappers (GLMs) built by the National Aeronautics and Space Administration (NASA) and managed by NOAA are freely available for download for North and South America.
• Aeolus: Since 2016 GCOS-IP, ESA has successfully launched the Aeolus mission, which carries a doppler lidar on board to measure line-of-sight wind profiles in the troposphere and lower stratosphere globally from a polar orbiter configuration (Witze, 2018). The satellite doppler lidar greatly improves the sampling over data sparse regions for the conventional observing systems such as the tropics and Southern Ocean.
Challenges • In situ observations: The in situ and remotely sensed capability remains deficient
over certain regions, most notably Africa, South America, SE Asia, the Southern Ocean and ice-covered regions, and in some parts of these regions is further deteriorating, although improving in some other parts. The lack of improvement of the performance of upper-air stations in Africa is mainly due to the lack of the
14 https://www.wmo.int/pages/prog/www/GOS/ABO/data/ABO_Data_Statistics.html
- 22 -
necessary consistent funding required to operate and maintain an upper-air station. It is expected that the situation will improve if the implementation of GBON and the SOFF will move forward as planned.
• Cloud radar and lidar are on research satellites and no continuity is assured.
• AURA: Only the Aura Microwave Limb Sounder (MLS) currently produces near-global coverage every day with >3500 vertical profiles of water vapor from the upper troposphere through the mesosphere. The loss of the AURA MLS would reduce the global coverage of water vapor profile measurements above the middle troposphere by more than 90%. The Aura MLS has now exceeded its “expected 5-year lifetime” by 11 years. Presently there is only one plan in progress to deploy another limb sounder (ESA’s Altius) with similar capabilities as the Aura MLS. Continuity is far from assured.
• EUMETSAT and ESA are planning a follow-up mission for Aeolus but a data gap in the record will be inevitable.
• Due to COVID-19, there has been a substantial reduction of aircraft observations, used as input to critical applications supporting service delivery in the WMO domain areas of weather, climate and water, leading to a potential impact of irrecoverable losses in climate data records. This has demonstrated the importance of resilience in the observing system and the need to address this, through network planning and a balanced development of the observing systems across different system components. Some NMHS launched additional radiosondes to fill this gap.
• The trifluoromethane R23 coolant used in balloon-borne frost point hygrometer measurements of water vapour in the Upper Troposphere Lower Stratosphere (UTLS) is being phased out and a viable replacement is required that has considerably lower or ideally zero Global Warming Potential to ensure continuity of these measurements.
Composition ECVs
Generally, the global observation system for aerosols, precursors for ozone and aerosols, total column for CO2 and CH4 and ozone profile measurements above the tropopause have further improved in the past decade thanks to both availability of new satellite-based observations and further development of in situ observations from the ground and from commercial aircraft. In particular, the new satellite TROPOspheric Monitoring Instrument (TROPOMI), with strongly improved spatial resolution, measures all the precursors NO2, SO2, HCHO, CO and provides CO and CH4 column data which was not available from satellites before. TROPOMI also currently provides measurements of the tropospheric column of ozone in the tropics, with an anticipated release of tropospheric profile and extra-tropical data. Several satellite instruments dedicated to Greenhouse Gases (GHGs) have also been added such as OCO-2 and the GOSAT series. In parallel, the ground-based system was also significantly consolidated by the establishment of long-term regional organizations supporting GAW or other international networks (NDACC15 (Network for the Detection of Atmospheric Composition Change), AERONET16 (AErosol RObotic NETwork),
15 https://www.ndaccdemo.org/ 16 https://aeronet.gsfc.nasa.gov/
- 23 -
SPARTAN17), in particular in Europe with the ICOS18 and ACTRIS19 research Infrastructures. However, the availability of ground-based atmospheric composition data still remains an issue in other world regions, such as Central Asia, the tropics, Southern Hemisphere.
In addition, efforts to promote access to information and development of interoperable information systems have facilitated access to data and data products retrieved from space, ground and aircraft-based observations. Datasets are generally well curated and accessible, however, in some instances ground-, balloon and aircraft-based datasets are in various formats and spread among several data repositories.
Tropospheric profiles of O3 and CO are measured as part of the In-service Aircraft for a Global Observing System (IAGOS) Aerosol Package on-board commercial aircrafts, providing key information on both profiles and concentration along aircraft routes. In addition to these core observations, optional instrumentation packages include CO2, CH4, NO2, aerosol particle size distribution and the number concentrations which have been implemented to some aircrafts.
Successes • The TROPOMI, the satellite instrument on board the Copernicus Sentinel-5
Precursor satellite, has been in operational mode since mid-2018 and provides accurate and timely observations of key atmospheric species, although usage can be limited by the presence of thick clouds.
• The temporal sampling of measurements of precursors from satellites has significantly improved thanks to the South Korean GEMS Geostationary mission, which measures SO2 and NO2 several times per day over Asia.
• The ground-based system for aerosol products has also significantly improved, mostly for its spatial coverage in several regions (North America, Europe, some parts of Asia) for several aerosol parameters. Under the GAW program, efforts have taken place to ensure traceability and provenance of data, joint data management procedures and data policies.
• The number of global sites routinely measuring ozone profiles with balloon-borne electrochemical concentration cell (ECC) ozonesondes has increased thanks to NDACC, SHADOZ20 (Southern Hemisphere ADditional OZonesondes) and GRUAN networks, though in some regions, namely South America and Africa, the geographical coverage of ECC sounding sites remains poor.
• The Collaborative Carbon Column Observing Network (COCOON), a collection of mobile Fourier Transform Infrared Spectrometer (FTIR) instruments that have been deployed at urban sites to measure column-averaged CO2, has been developed and will become an important supplement of the Total Carbon Column Observing Network(TCCON)21, especially contributing to the quantification of local sources (Frey et al., 2019).
17 https://www.spartan-network.org/ 18 https://www.icos-cp.eu/ 19 https://www.actris.eu/ 20 https://tropo.gsfc.nasa.gov/shadoz/ 21 http://www.tccon.caltech.edu/
- 24 -
• Expansions in the number of airlines and aircraft participating in IAGOS during the last decade have helped to fill some gaps in geographical coverage, especially over the central and south Pacific regions.
• The Tropospheric Ozone Assessment Report (TOAR)22 compiled surface ozone time series from almost 10,000 global measurement sites for various analyses by bringing together air quality authorities and research networks.
Challenges • Stratospheric CH4 profiles are currently measured by only the ACE-FTS satellite
instrument using the solar occultation technique and providing about 30 measurements/day, mostly at high northern latitudes. The need for another satellite-based instrument that measures stratospheric CH4 profiles globally is critical.
• Higher quality satellite-based products for tropospheric ozone with global coverage are needed to determine statistically significant trends. However, it is likely that new products will be spatially limited to North America and Europe in the foreseeable future.
• For in situ measurements for aerosols and trace gases, the information system remains managed regionally, and in some countries/regions, operated by different research organizations, leading to difficulties to fully respond to user requirements of an integrated observing system.
• A significant reduction of measurements from the aircraft due to the COVID-19 pandemic has shown the need to build a more resilient observing system.
• Interest of some countries to join the IAGOS association, and development funding for adapting IAGOS packages to new aircraft, including on shorter routes, needs to be ensured in order to continue addressing existing gaps in geographical coverage.
Ocean ECVs
This section provides a summary of ocean ECVs. They have been divided thematically into physical, biogeochemical and biological variables. While progress during the last decade has been achieved, in situ observations for all the ocean ECVs are still deficient. The progress from the OceanObs’99 to OceanObs’19 decadal conferences and the implementation plans of GOOS, GCOS and WCRP, have meant that the ocean observing system has evolved from a platform centric perspective to an integrated observing system.
During the past two decades tremendous progress has been made in innovative technology to observe the ocean. This includes the increasing capacity of satellite observations, but also important advances of in situ observing capacity in form of autonomous platforms capable of extended mission, and the development of advanced sensors that can now observe an increasing range of the Essential Ocean Variables (EOVs), of which ECVs are a subsample, with increasing accuracy at decreasing cost and power consumption. However, ocean observations, including at the sea surface, are still too sparse. OceanOPS (formerly JCOMMOPS) center monitors and reports on the status of the global ocean observing system and networks, releases annual report cards, and is a key resource for the ocean observing system.
22 https://igacproject.org/activities/TOAR
- 25 -
The work developed across GOOS and GCOS communities has also allowed the observing community to identify new ECVs that are needed for a range of topics towards achieving a sustainable ocean and support observations for climate monitoring, mitigation, extremes predictions and adaptation.
Physical ECVs
In general, surface observations of physical ECVs have further improved in the last decade and meet requirements in the open ocean at the surface but are still inadequate at depth and in marginal seas, over the continental slopes, coastal zones and polar areas.
Whereas SST is the ocean surface variable with the greatest spatial and temporal coverage owing to the combination of satellite and in situ networks, its coverage is sparser and accuracy poorer in regions of persistent high cloud cover and coastal areas. Sea Surface Salinity or surface currents observations have further improved in the last decade but do not meet completely the resolution requirements for the open ocean, and this is even more the case for the coastal and polar oceans.
For other ECVs, such as Surface Wind Stress or Sea Level, in situ observations meet the required accuracy but coverage is extremely sparse whereas satellite observations provide a better spatial resolution but lower data quality. Thus, global products of air-sea heat fluxes generally must rely upon Numerical Weather Prediction (NWP) model outputs for near-surface air-temperature and humidity. In situ bulk heat fluxes meet all quality requirements, but coverage is extremely sparse.
Successes • Data stewardship and access to data are in general good, except for the polar
oceans, where there are still many challenges. Responding to the GCOS-IP Action O2, the GOOS Observing Coordination Group has developed a FAIR23 data framework which is progressing quickly from the supplier and the data management sides. (Steps towards the proof of concept of an Ocean Data and Information System; Tanhua et al., 2019.)
• Global ocean synthesis and reanalysis products are being regularly updated and are widely used by the scientific community in evaluations of climate variability and are providing improved ECV data products (e.g. von Schuckmann et al., 2020).
• A more systematic use of ocean modelling and analysis by research communities and many operational centres have led to prototype quantitative tools for rigorous assessment of the impact that individual observations or networks have on analysis and forecast skill.
• Satellite, in situ sensor and platform technology innovation continue to be supported through research organizations and are increasingly underpinned by private sector investments.
• The constellation of satellite sea surface temperature and salinity sensors provide good to high quality blended products (calibrated by or blended with measurements from the in situ networks) over most of the global ocean that satisfy the temporal and spatial resolution requirements. Sea surface salinity satellite data has been available only for 10 years, but it has proven to be key in providing information on the Earth water cycle and its variability.
23 https://doi.org/10.1038/sdata.2016.18
- 26 -
• The upper (0-2000 m) ocean temperature and salinity observing system has exceeded its target in the open ocean leading to improved assessments of ocean climate-driven changes (Cheng et al., 2020; Frederikse et al., 2020; Li et al., 2020; von Schuckman et al., 2020).
• Satellite-based data products of sea-ice concentration and thickness have benefited from dedicated R&D activities (e.g. ESA CCI, EUMETSAT Satellite Application Facility on Ocean and Sea Ice (OSI SAF), NOAA Climate Data Record CDR) and have matured. Some of those are sustained by operational agencies in Europe and the United States.
Challenges • Funding for sustained ocean ECV observing activities remains very fragile (National
Academies of Sciences, Engineering, and Medicine. 2017) and is largely supported by limited-duration research projects. For example, subsurface T/S profiles from Argo (which is the most sustained ocean observing network) are funded 5% from meteorological agencies with operational budgets, and 95% from ocean research agencies.
• In situ monitoring of sea ice is still driven by polar research agencies, with data stewardship and access to data are in general poor and scattered. Sea-ice thickness monitoring by satellite is compromised as the continuity of the two required types of satellite technologies (polar altimetry and L-band radiometry) is not ensured beyond 2025.
• While substantial progress has been made by the Copernicus Marine Service (CMEMS) and NOAA to build a world ocean database, significant work remains to unlock access to Exclusive Economic Zone (EEZ) data and to accelerate oceanographic cruises data access.
• Ocean subsurface data for depths greater than 2000 m as well as data in marginal seas, over continental slopes and shelfs are still very sparse.
• Heat and momentum fluxes coverage is still limited by present inability to measure near-surface and boundary layer wind, temperature and humidity with required accuracy.
• The COVID-19 pandemic has hampered the access to research and commercial cruises since March 2020. This has impacted the coverage of ocean observations as the majority of Argo and drifter deployments, Ship Of Opportunity Program eXpendable Bathy Thermograph (SOOP XBT) profiles and oceanographic moorings have been restricted or interrupted for the most part.
• Satellite salinity observations are 10 years old. They have proven to provide, together with in situ data, essential climate information. The continuity of such satellite observations is not ensured.
Carbon and biogeochemistry ECVs
Strengthened international coordination of surface and interior ocean biogeochemistry observations from ship-based, fixed-point and autonomous observations has led to continued progress and advances in meeting ECV requirements over the past decade. Coverage of data in space and time of surface ocean pCO2 observations are good in the open ocean of the northern hemisphere but are poor in the southern hemisphere and in coastal zones. Ocean interior data of inorganic carbon parameters (dissolved inorganic carbon, total alkalinity, pH), nutrients (nitrate, nitrite, phosphate, and silicic acid),
- 27 -
dissolved oxygen, and transient tracers have been collected through the Global Ocean Ship-based Hydrographic Investigations Program (GO-SHIP)). Data coverage by GO-SHIP is global, from surface to near-bottom, and the spatial intervals on selected repeat sections is good, but temporal resolution (typically once a decade) is poor. High spatial and temporal resolution observations are provided by the growing network of Biogeochemical Argo profiling floats sampling the global ocean.
Successes • Coordination of high-quality surface water CO2 measurements from ships and
moorings has been initiated through the Surface Ocean CO2 reference Observing NETwork (SOCONET) with the goal to provide accurate pCO2 data to within 2 μatm for surface ocean and 0.2 ppm for marine boundary layer measurements following rigorous best practices, calibration and intercomparison procedures.
• Surface Ocean CO2 Atlas (SOCAT) version 2021 contains 30.6 million in situ surface ocean fugacity of CO2 measurements for the global ocean and coastal seas with an accuracy < 5 μatm, while a further 2.1 million fCO2 values with an accuracy of 5 to 10 μatm are made available separately. Annual releases of SOCAT enable regular estimates of CO2 uptake by the ocean.
• The Global Ocean Data Analysis Project (GLODAP) data product provides free and open access to quality controlled, internally consistent surface to bottom ocean biogeochemical data, with an emphasis on seawater inorganic carbon. GLODAPv2.2021 includes measurements from more than 1.2 million water samples from the global ocean collected on 989 cruises.
• The developing Biogeochemical Argo network, which enables high-frequency measurements of dissolved oxygen, nitrate and pH that meet temporal requirements, is in pilot phase with research funding. To date, most of the floats are equipped with oxygen sensors and the number of floats installed with pH and nitrate sensors is growing. Data management of dissolved oxygen from Biogeochemical Argo floats has been established for Data Assembly Centres.
• The use of certified reference materials for nutrients is becoming standard for the GO-SHIP, and many other high-quality hydrographic campaigns.
• Transient tracers are being measured on most GO-SHIP cruises. There are some technological developments on the capacity to measure new transient tracers to increase the range of ventilation ages that can be assessed.
• N2O is measured on various research cruises and on a few coastal and open ocean time-series sites. Progress has been made to set up N2O underway measurement system on Ship of Opportunity lines. Standard operating procedures for measurements of N2O from discrete seawater samples and with continuous underway system have been developed.
• The state of ocean colour observations is good with several satellite missions covering the globe and providing data within a day of measurement.
• Data quality is assessed regularly through validation with the in situ network.
Challenges • In general, data quality control on ship-based and fixed-point measurements, and
resultant updates to SOCAT and GLODAP data products, are carried out through voluntary efforts by the community. The setup and support through individual research grants are vulnerable (Tanhua et al., 2021).
- 28 -
• There are several ship-based time-series stations in the world oceans that provide high-quality data of many biogeochemical ECVs with high-frequency meeting the goal of temporal resolution at a few locations, but the coordination of these time-series measurements is still in development and the data sets have not been integrated.
• Less than half of current Biogeochemical Argo floats carry nitrate and pH sensors and there are only a handful of floats which measure the entire suite of six biogeochemistry parameters required according to the Biogeochemical Argo Science and Implementation Plan. Data management for nitrate and pH observations from Biogeochemical Argo profiling floats has not yet been established.
• To date, no autonomous sensors are available for continuous N2O measurements, and while data are archived in a quality-controlled data base, there is currently no mechanism for inter-calibration or standard post-processing operations needed to make the data sets comparable within the required uncertainty.
• Ocean colour data in time/regions where the sun angle is low (near and at polar night) is currently not available but could be available with ocean lidar. Nearshore data (within 4 km of coasts) is currently not routinely available despite existing sensors (Sentinel 2ab and Landsat 8) which have been shown to be able to provide quality near shore data.
• The number of commercially available high-quality radiation sensors is limited, and radiative calibration facilities are hard and expensive to access. Most sensors are not characterized/corrected for out-of-band response, immersion coefficient and temperature effects on dark currents. Standards for laboratory calibration of hyperspectral radiometers spanning from Ultraviolet to Near Infrared are not in place. Users mostly rely on manufacturers for characterization and calibration and those are not independently assessed.
Biology and Ecosystems ECVs
Ocean biological ECVs are developing rapidly as supporting communities grow to support development of the underlying EOVs. The 10-year plan of the GOOS Biology and Ecosystems Panel to support development of all biological EOVs was endorsed by the ocean observing community at OceanObs’19 including identification of attributes necessary to be met by networks planning to become part of the global ocean observing network. The results of a project mapping existing long-term networks measuring at least one of the biological EOVs, identified that less than 10% of the oceans had any long-term biological sampling in the last 10 years, and the sampling that did occur was focused close to developed areas of the globe – North America, Europe and Australia. Increasing global coverage of biological EOVs through communication, capacity development and technology transfer will be essential components of building the global observing system.
The Biology and Ecosystem Panel is also working though GCOS with terrestrial counterparts to provide strategic input on how biological ECVs might develop over the next decade. Critical questions include the relative priorities of using the ECV data to close the carbon cycle and using the data to monitor impacts of the climate emergency on biodiversity. The latter requires greater taxonomic resolution but will be essential for adaptation and mitigation work going forward. The Plankton ECV is composed of three EOVs – microbes, phytoplankton and zooplankton diversity and biomass. The Marine
- 29 -
Habitat Properties ECV is composed of four ECV/EOVs – hard coral, mangroves, seagrass and macroalgae cover and composition.
Successes • Mapping groups are collecting sustained biological observations in the last 10 years
globally, through a Future Earth/ National Center for Ecological Analysis and Synthesis (NCEAS) grant that will result in an online repository of networks and their metadata attributes.
• A workshop at OceanObs’19 was held and received community support for the 10-year plan (including network criteria) for the GOOS Biology and Ecosystems Panel.
• A regional implementation of biological observing network mapping through the H2020 EuroSea project was initiated which will map European networks and identify where collaboration and consistency could be enhanced through targeted interventions, providing a template for further regional programs.
• A global assessment of tropical hard corals through the Global Coral Reef Monitoring Network (GCRMN) has been completed.
• EOV Implementation workshops for mangroves (1), seagrass (2), and macroalgae (1), funded through NASA, POGO (Partnership for Observation of the Global Ocean), Special Committee on Oceanic Research (SCOR) and the Australian Ocean Data Network (AODN) with additional support from IOC and Australian research agencies were held.
• The SCOR working group has identified options for including biological observations on existing physical sampling platforms (GO-SHIPS). The trial process to provide GOOS Biology and Ecosystems Panel endorsement of ‘Best Practices’ has been completed and submitted through the Ocean Best Practices group (OBP).
• Work with Secretariat to the CBD to include Habitat EOVs/ECVs as part of the post-2020 monitoring framework with links to future SDG indicators (replacing those expiring in 2020) and UN System of Environmental Economic Accounts is ongoing.
• Collaboration with The Group on Earth Observations Biodiversity Observation Network (GEOBON) Marine Biodiversity Observation Network (MBON), the Ocean Biodiversity Information System (OBIS) and UNEP World Conservation Monitoring Centre (WCMC) is ongoing and building.
Challenges • Funding for the Panel and ECV implementation workshops and capacity
development remains project-based funding of limited duration. • Obtaining resources for significant and enduring regional capacity development and
technology transfer is proving challenging.
• Biological monitoring is frequently small-scale and local leading to a wide diversity of approaches and reporting, hence the emphasis on mapping these many groups.
• A large proportion of the collected data are not FAIR and open, which hinders their reusability.
• The flow of information from primary collectors to national, regional and global outlets is generally of non-linear nature, and there is often little or no support for primary collection.
• Capacity development and the building of new collaborations presents many difficulties, in particular in a COVID-19 context.
- 30 -
• Saltmarshes are increasingly recognized for their importance to coastal biodiversity and carbon capture,but are not part of the Ocean Biology ECV or an EOV.
Terrestrial ECVs
Terrestrial ECV can be subdivided into hydrological, cryosphere, biosphere and anthropogenic sectors. In general, data are exchanged freely except for in situ hydrological observations which are poorly reported or exchanged at a global level. Many of the biosphere variables are observed well from space with in situ observations providing validation and calibration (although more are needed) and so have a good global coverage apart from some polar regions. The anthropogenic sector covering water use and greenhouse gas fluxes, is partly based on national reporting, however recent developments are including more observed data.
Hydrological ECVs
In situ hydrological observations are usually made by national organizations, with lakes and river discharge coordinated internationally by WMO. The different Global Terrestrial Networks (GTN) operate under the auspices of GCOS, and contribute to mostly the in situ observations. For in situ observations, the WMO Data Centres as well as the GTN for Hydrology (GTN-H) with its federated data centres were recognized by the WMO Congress as major hydrological initiatives (Cg 18, Res. 25), acting as hosts for quality assured hydrological data and data rescue with a global perspective. The main issue is a general lack of free and open access to data with recent and historical hydrological data not available in many parts of the world.
Successes • Satellite observations of soil moisture, water elevation of rivers and lakes and
regional ground water change have has improved significantly.
• Water level, water extent and storage changes, surface water temperature (LSWT), ice phenology (ice-on/ice-off dates and ice duration) and water reflectance (water colour) are measured as part of an ESA Climate Change Initiative (CCI) project, Copernicus and NOAA. The most complete information on the results of satellite observations of lakes ECVs have now been released24. Volume changes of approximately 100 lakes worldwide are also available within the HYDROWEB database25.
• Global observations of evaporation from land (often referred to as evapotranspiration) and soil moisture are now available based on satellite retrievals. For evaporation these are based on process-based model assumptions, since evaporation cannot be directly observed from space. In semiarid regimes and tropical forests, the divergence among existing evaporation datasets suggests higher uncertainties.
• Good access to satellite data gives near-global coverage for some products, including soil moisture, lake water level, water extent and storage changes, LSWT, ice phenology (ice-on/ice-off dates and ice duration) and water reflectance (water colour), evapotranspiration.
24 https://catalogue.ceda.ac.uk/uuid/3c324bb4ee394d0d876fe2e1db217378 25 www.hydroweb.theia.land

- 31 -
Challenges • Hydrological data (river discharge, lakes and groundwater) are not available or
exchanged internationally in many parts of the world such as most of Africa and Asia and parts of South America. Data submitted to the Global Runoff Data Centre (GRDC) are only available for research. On the other hand, satellite data are well curated and openly and freely available and techniques for satellite monitoring of lakes and river runoff are being developed to fill some of the gaps.
• Many countries have established a groundwater monitoring network. Since most groundwater issues and solutions have a local or transboundary dimension there has been little incentive to make their data available to the international community. Satellite-based gravity measurements have been used in combination with estimates of other water compartments (e.g. soil moisture) to provide regional estimates of groundwater storage change.
• In situ observations of lake water reflectance are not carried out within any context of stewardship and are relatively costly to obtain. The most complete information of lake water level, lake surface water temperature and lake ice thickness are concentrated in the international HYDROLARE database but some originators of data for Lake Surface Water Temperature (LSWT) do not openly share data or participate in organised stewardship systems.
• Soil moisture products are available from satellite observations, with in situ observations providing calibration and validation. While these satellite observations provide a near-global coverage, with free and open access to data, their accuracy remains an issue in areas of dense vegetation, permafrost, organic soils, and regions of strong topography.
• The continuation of L-band data record is threatened by absence of follow-on missions for the Soil Moisture and Ocean Salinity (SMOS) SMOS and the Soil Moisture Active Passive (SMAP).
• The long-term viability of data archives of in situ data needs to be assured.
• Quality assurance issues remain, especially around satellite observations and soil moisture and terrestrial evaporation.
• While significant improvements have been made to observe Terrestrial Water Storage (recently defined as an ECV) using satellite gravimetry (GRACE, GRACE-FO), the relevance of these data for assessing water balances and global change impacts on the water cycle has not yet been exploited.
Cryospheric ECVs
In general, for the cryosphere, data stewardship is very good: data are freely and openly available along with descriptive metadata.
Glacier observations are coordinated by the Global Terrestrial Network for Glaciers (GTN-G), operated by the World Glacier Monitoring Service (WGMS), National Snow and Ice Data Center (NSIDC), and the Global Land Ice Measurements from Space (GLIMS) initiative. All datasets on global glacier distribution and changes from GTN-G are open access and made freely available to the public.
While field-based observations of glacier mass changes are limited to glaciological in situ observations from a few hundred glaciers worldwide, with 40 reference glaciers having ongoing time-series of more than 30 years, satellite observations are extending this information globally.
- 32 -
Ice surface conditions of Antarctic and Greenland ice sheets and ice shelves are well monitored by satellite with good coverage of large remote and inaccessible regions. Satellite gravity measurements provided observations of mass loss of two ice sheets over the last two decades. However, a new area of interest, due to the observed changes, is the ice sheet/ice shelf and ocean contact zone with a focus on ice sheet ice shelf instability Marine Ice Sheet Instability (MISI). The global coverage and observation continuity are required to monitor ice mass change which affects the global sea-level change.
Permafrost observations, coordinated by the Global Terrestrial Network for Permafrost (GTN-P), cover most areas except the few isolated high mountains of Africa. The very harsh climate conditions and consecutive technical failures may lead to some data gaps. The data are not collected in real-time with much of it retrieved annually.
Several countries such as United States, Russian Federation and China have their own in situ monitoring networks for snow (monitoring snow depth, water equivalent and other meteorological parameters). However, global coverage of in situ observations is insufficient. Remote sensing data can provide global coverage.
Successes • Data stewardship and access to data are good.
• Over the past decade, the number of geodetic surveys from space-based sensors have increased from a few hundreds to about 20,000 glaciers worldwide. This sample is rapidly increasing and thanks to automated processing pipelines converting satellite stereo images into Digital Elevation Models (DEMs) might soon cover all glaciers globally.
• In general, a combination of in situ and satellite observations provides good complimentary coverage of glaciers and ice caps.
• The recent satellite-based gravity measurements provide reliable estimates of mass change of the two ice sheets and of Polar Regions with large glacier coverages.
• Snow is covered globally by the combination of in situ data, remote sensing data and reanalysis data with the remote sensing, reanalysis data and (partly) in situ data are fully available to users.
Challenges • The most urgent need for closing observational gaps of glaciers is in regions where
glaciers dominate runoff during warm/dry seasons, such as in the tropical Andes and in Central Asia. The region with the largest glacier-covered area in Asia, the Karakoram, does not have a single glacier that is frequently monitored. This leads to huge gaps in process understanding and related high uncertainties in modelling future glacier evolution.
• There are some large spatial gaps in permafrost monitoring, especially in Central Siberia and in Central-Northern Canada together with the isolated high mountains of Africa.
• The long-term future of the permafrost (GTN-P) database needs to be assured. Currently it is hosted at Arctic Portal in Akureryi/Iceland, but this is a private structure, which has periodic financial issues, and therefore does not provide sufficient guarantees of sustainability. A duplicate of the database was made at AWI in order to secure data, but a long-term solution is needed.
- 33 -
• Rock glaciers (related to mountain permafrost) are not currently explicitly covered by the permafrost ECV: a global inventory of their extents/location and measurements of movement are needed. This is a major indicator for mountain permafrost and has proved to be highly sensitive to atmospheric warming, which induces strong accelerations of surface movements.
• While satellite observation of snow can fill gaps in the global coverage, the lack of in situ observation for data calibration and validation results in large uncertainties, particularly in mountainous areas. Due to this lack of in situ data, the Intergovernmental Panel on Climate Change (IPCC) was unable to determine an interannual trend of snow depth in the recent SROCC report. The current observations are insufficient to allow the determination of any global interannual trend of snow depth due to the lack of in situ observation for data calibration and validation.
• Access to the snow water equivalent is still a challenge especially over mountain regions which need higher spatial resolution.
Biospheric ECVs
Many of the biosphere related ECV are monitored by satellites and the data are curated by the space agencies. The ECV Inventory maintained by EUMETSAT for the Joint CEOS/CGMS Working Group on Climate provides details and access to the data.
Observations of Albedo, the Fraction of Absorbed Photosynthetically Active Radiation (FAPAR) and Leaf Area Index (LAI) are based on optical satellite observations with limitations due to cloud cover across tropical regions, variations among satellite sensors and different products, and insufficient in situ validation sites.
Soil carbon observations have been compiled into global soil maps, coordinated by the Food and Agriculture Organization of the United Nations (FAO) and others26.
Observations of vegetation disturbance from clearing or fire continue to be routinely developed from different satellite observations. Future updates of global burned area products should integrate medium resolution sensors (Landsat 8, Sentinel 2) as well as SAR datasets (Sentinel 1, ALOS, Terrasar), to obtain better estimations of carbon emissions and land use trends of fire affected areas.
Land Surface Temperature (LST), the skin temperature observed by satellites, is a new ECV that is well observed from space. Dedicated Climate Data Records are now being produced from InfraRed (IR) satellites: i) based on the ATSR/SLSTR sensors, using MODIS to fill the gap between AATSR and SLSTR; ii) based on MVIRI and SEVIRI; and iii) merging data from Low Earth Orbiting and Geostationary Earth Orbiting satellites to provide a consistent global, sub-daily data set. Acknowledging the need for all-sky data, CCI is also providing a multi-decadal MicroWave (MW) LST data set.
Successes • The QA4ECV and FIDUCEO projects have made good progress in inferring a full
budget of uncertainties for LAI and FAPAR (in addition to atmospheric ECV) that needs to be implemented operationally in future.
26 See http://www.fao.org/global-soil-partnership/pillars-action/4-information-and-data-
new/global-soil-organic-carbon-gsoc-map/en/
- 34 -
• There has been significant progress in providing large area forest live biomass carbon data derived from a series of active and upcoming space-based missions.
• There has been a number of improvements recently covering adequacy of current holdings, including improved quantification of bias, validation protocols, instruments, in situ validation and data archiving. State-of-art developments, in projects such asESA CCI, EUMETSAT CM SAF and NASA MEaSUREs27, are providing a range of products from multiple sensors, using consistent retrieval algorithms with provision of uncertainty estimates partitioned by correlation length scale, and consistent cloud masking approaches across thermal infrared sensors.
• Improved Above-ground Biomass observations with further improved satellite missions are planned.
Challenges • There are, currently, limitations to observations of above-ground biomass as
current satellite-based radar and LIDAR methods cannot resolve the highest biomass concentrations. However, upcoming missions, particularly the ESA Biomass missions, are expected to address this. A biomass reference network of in situ aboveground carbon measurements is needed and has been proposed by CEOS. Ground inventory measurements provide some estimates that can be extrapolated across landscapes, but inventory data exist only in some developed countries in the northern hemisphere and remain largely unavailable in tropical regions and southern and developing countries. With the upcoming new satellite observations, it should be possible to produce, systematically and at annual to sub-annual time scales, maps of global vegetation above-ground biomass.
• Improved Quality Assurance and uncertainty assessments of satellite products for LAI and FAPAR.
• While the uncertainty of fire products has reduced significantly in recent years via validation processes, these exercises have also shown important underestimation of burned areas, particularly in regions with high predominance of small fire patches (<100 ha), which are unlikely detected by coarse (>250 m) resolution sensors Ramo et al., 2021). The data products are global with daily to weekly coverage and are widely used by the science and application community.
• Observations of other carbon pools in vegetation and soil remain underdeveloped. While a new soil carbon map is now available, consistent observations across the globe are not made routinely. Soil carbon is based on in situ observations which are not routinely or frequently repeated, so changes are not well monitored on a global scale except through carbon accounting and earth system models.
Anthropogenic ECVs
Both satellite and in situ atmospheric composition measurements (discussed in the atmospheric section) are needed to estimate global total greenhouse gas (GHG) emissions using inverse models. The results generally meet the GCOS requirements, provides reliable global trends and have detected previously unknown emission sources. Further enhancement in Earth system modelling and extension of in situ and satellite measurements will help to better separate the anthropogenic from the natural GHG fluxes
27 See https://climate.esa.int/en/, https://www.eumetsat.int/cm-saf and
https://earthdata.nasa.gov/esds/competitive-programs/measures
- 35 -
and, with better coverage and lower uncertainties, allow estimation of regional and national and local fluxes. Observations of tracers, such as carbon isotopes, will be needed to monitor fossil fuel emissions of carbon.
Estimates of anthropogenic water use have improved due to the efforts of FAO’s AQUASTAT project. However, these are based on national reporting that is not always complete or timely. In order to have a more complete overview of the changes in the water cycle, GCOS has agreed on a new an ECV – total water storage – that can be observed from space using gravity measurements that would provide more timely and complete data on the water cycle.
Successes • The AQUASTAT database has been greatly improved.
• While current observations allow estimates at a regional level with high uncertainty, WMO has raised the attention to this with the Integrated Global Greenhouse Gas Information System (IG3IS) project. The EU with ESA, ECMWF and EUMETSAT are setting up a CO2 Monitoring and Verification Support (MVS) Capacity. This CO2 MVS capacity should be operational under the Copernicus Programme by 2026 with the CO2M Sentinels operational and a full CO2MVS service (Janssens-Maenhout et al., 2020).
• The Integrated Carbon Observing System (ICOS) research infrastructure, covering 13 countries has been established by the EU. It and aims to produce standardised, high-precision and long-term observations and facilitate research to understand the carbon cycle and to provide necessary information on greenhouse gases. Observations cover greenhouse gas concentrations and fluxes in the atmosphere, meteorological parameters, ecological and oceanic parameters.
Challenges • The AQUASTAT database is based on national reporting so has gaps and is not up
to date. The new ECV, total water storage, gives timely and complete regional coverage but does require the continuation of satellite gravity observations and will not replace the specific detailed information in AQUASTAT.
• For Europe, the VERIFY H2020 project is aiming to provide a reconciliation of GHG emissions from bottom-up statistics and top-down observations (Petrescu, 2020 in ESSD28). Existing differences between bottom up (inventory based) and top down (atmospheric inversion based) are still not well explained.
• Better global coverage and resolution of column XCO2 compared to OCO-2 and GOSAT is needed. Improved calibration of the retrievals is needed – currently Aircore-type data provide the best accuracy.
• Methods to quantify fossil fuel fluxes of CO2 need to be developed, probably based on observations of carbon isotope atmospheric concentrations or other tracers such as CO and NO2.
• An outstanding issue remains the split between the anthropogenic and natural sources as defined by the UNFCCC and Intergovernmental Panel on Climate Change (IPCC) (in particular for CO2) for several reasons: the anthropogenic part is
28 Petrescu, 2020 in ESSD
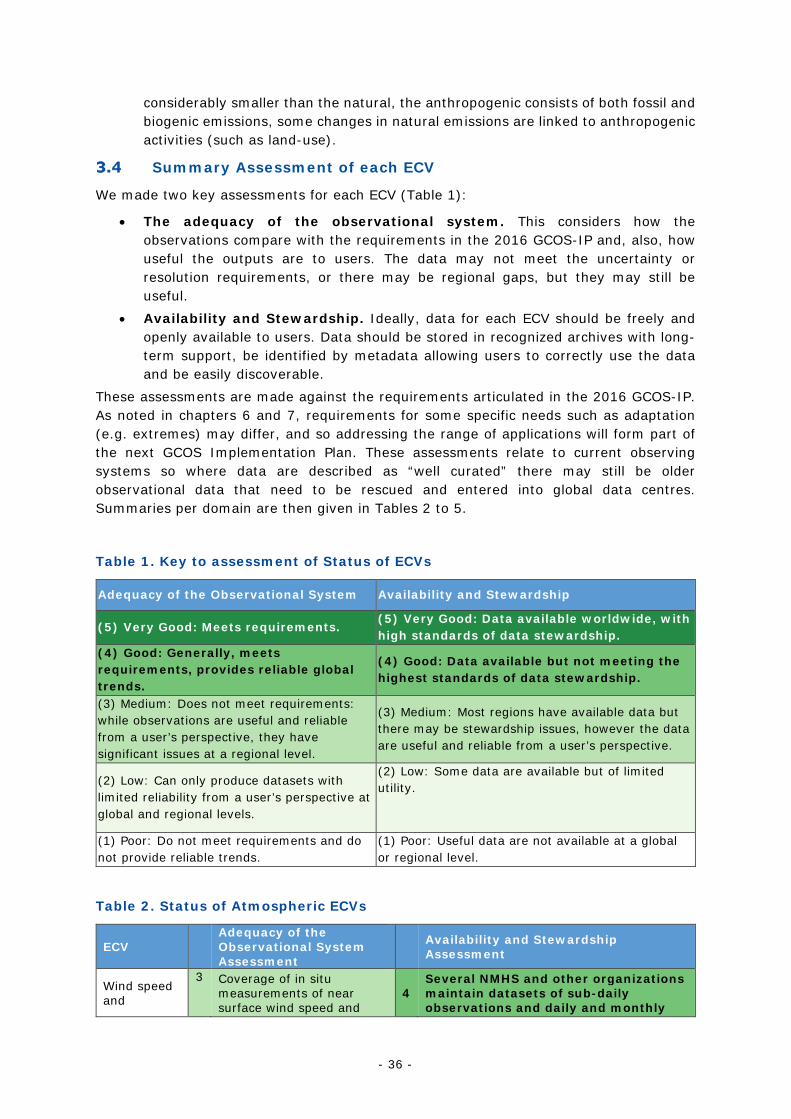
- 36 -
considerably smaller than the natural, the anthropogenic consists of both fossil and biogenic emissions, some changes in natural emissions are linked to anthropogenic activities (such as land-use).
Summary Assessment of each ECV
We made two key assessments for each ECV (Table 1):
• The adequacy of the observational system. This considers how the observations compare with the requirements in the 2016 GCOS-IP and, also, how useful the outputs are to users. The data may not meet the uncertainty or resolution requirements, or there may be regional gaps, but they may still be useful.
• Availability and Stewardship. Ideally, data for each ECV should be freely and openly available to users. Data should be stored in recognized archives with long-term support, be identified by metadata allowing users to correctly use the data and be easily discoverable.
These assessments are made against the requirements articulated in the 2016 GCOS-IP. As noted in chapters 6 and 7, requirements for some specific needs such as adaptation (e.g. extremes) may differ, and so addressing the range of applications will form part of the next GCOS Implementation Plan. These assessments relate to current observing systems so where data are described as “well curated” there may still be older observational data that need to be rescued and entered into global data centres. Summaries per domain are then given in Tables 2 to 5.
Table 1. Key to assessment of Status of ECVs
Adequacy of the Observational System Availability and Stewardship
(5) Very Good: Meets requirements. (5) Very Good: Data available worldwide, with high standards of data stewardship.
(4) Good: Generally, meets requirements, provides reliable global trends.
(4) Good: Data available but not meeting the highest standards of data stewardship.
(3) Medium: Does not meet requirements: while observations are useful and reliable from a user’s perspective, they have significant issues at a regional level.
(3) Medium: Most regions have available data but there may be stewardship issues, however the data are useful and reliable from a user’s perspective.
(2) Low: Can only produce datasets with limited reliability from a user’s perspective at global and regional levels.
(2) Low: Some data are available but of limited utility.
(1) Poor: Do not meet requirements and do not provide reliable trends.
(1) Poor: Useful data are not available at a global or regional level.
Table 2. Status of Atmospheric ECVs
ECV Adequacy of the Observational System Assessment
Availability and Stewardship Assessment
Wind speed and
3
Coverage of in situ measurements of near surface wind speed and
4 Several NMHS and other organizations maintain datasets of sub-daily observations and daily and monthly
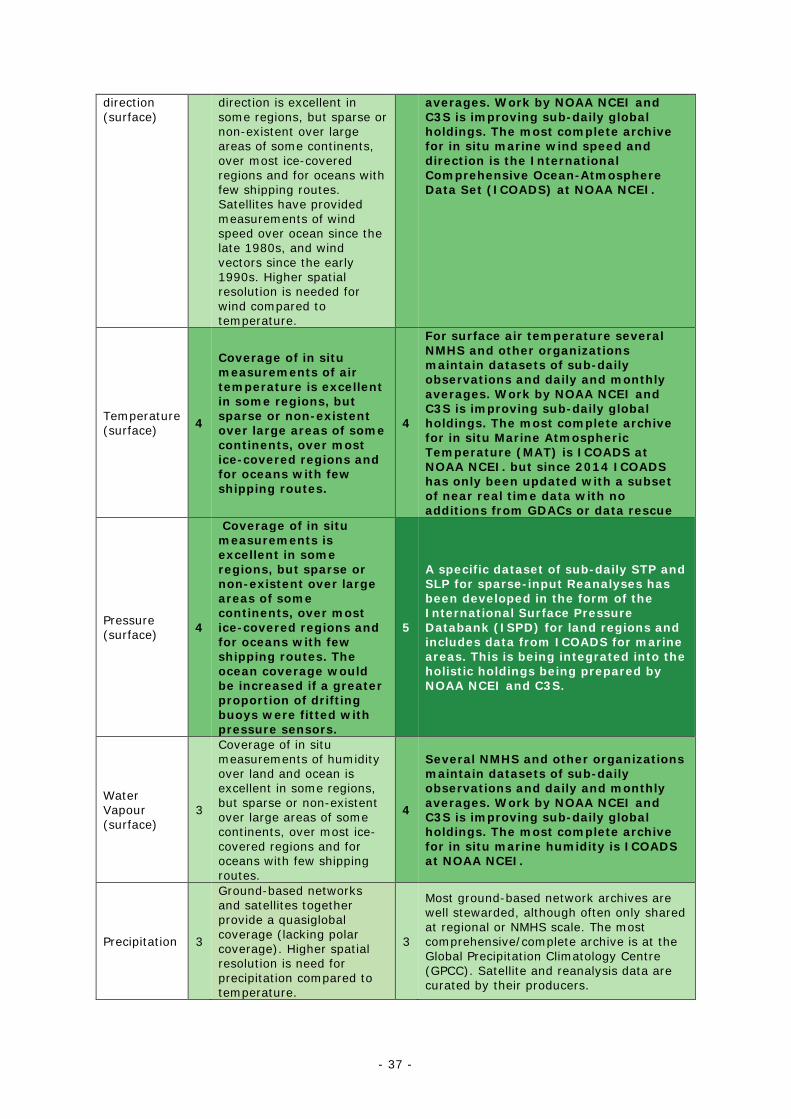
- 37 -
direction (surface)
direction is excellent in some regions, but sparse or non-existent over large areas of some continents, over most ice-covered regions and for oceans with few shipping routes. Satellites have provided measurements of wind speed over ocean since the late 1980s, and wind vectors since the early 1990s. Higher spatial resolution is needed for wind compared to temperature.
averages. Work by NOAA NCEI and C3S is improving sub-daily global holdings. The most complete archive for in situ marine wind speed and direction is the International Comprehensive Ocean-Atmosphere Data Set (ICOADS) at NOAA NCEI.
Temperature (surface) 4
Coverage of in situ measurements of air temperature is excellent in some regions, but sparse or non-existent over large areas of some continents, over most ice-covered regions and for oceans with few shipping routes.
4
For surface air temperature several NMHS and other organizations maintain datasets of sub-daily observations and daily and monthly averages. Work by NOAA NCEI and C3S is improving sub-daily global holdings. The most complete archive for in situ Marine Atmospheric Temperature (MAT) is ICOADS at NOAA NCEI. but since 2014 ICOADS has only been updated with a subset of near real time data with no additions from GDACs or data rescue
Pressure (surface) 4
Coverage of in situ measurements is excellent in some regions, but sparse or non-existent over large areas of some continents, over most ice-covered regions and for oceans with few shipping routes. The ocean coverage would be increased if a greater proportion of drifting buoys were fitted with pressure sensors.
5
A specific dataset of sub-daily STP and SLP for sparse-input Reanalyses has been developed in the form of the International Surface Pressure Databank (ISPD) for land regions and includes data from ICOADS for marine areas. This is being integrated into the holistic holdings being prepared by NOAA NCEI and C3S.
Water Vapour (surface)
3
Coverage of in situ measurements of humidity over land and ocean is excellent in some regions, but sparse or non-existent over large areas of some continents, over most ice-covered regions and for oceans with few shipping routes.
4
Several NMHS and other organizations maintain datasets of sub-daily observations and daily and monthly averages. Work by NOAA NCEI and C3S is improving sub-daily global holdings. The most complete archive for in situ marine humidity is ICOADS at NOAA NCEI.
Precipitation 3
Ground-based networks and satellites together provide a quasiglobal coverage (lacking polar coverage). Higher spatial resolution is need for precipitation compared to temperature.
3
Most ground-based network archives are well stewarded, although often only shared at regional or NMHS scale. The most comprehensive/complete archive is at the Global Precipitation Climatology Centre (GPCC). Satellite and reanalysis data are curated by their producers.
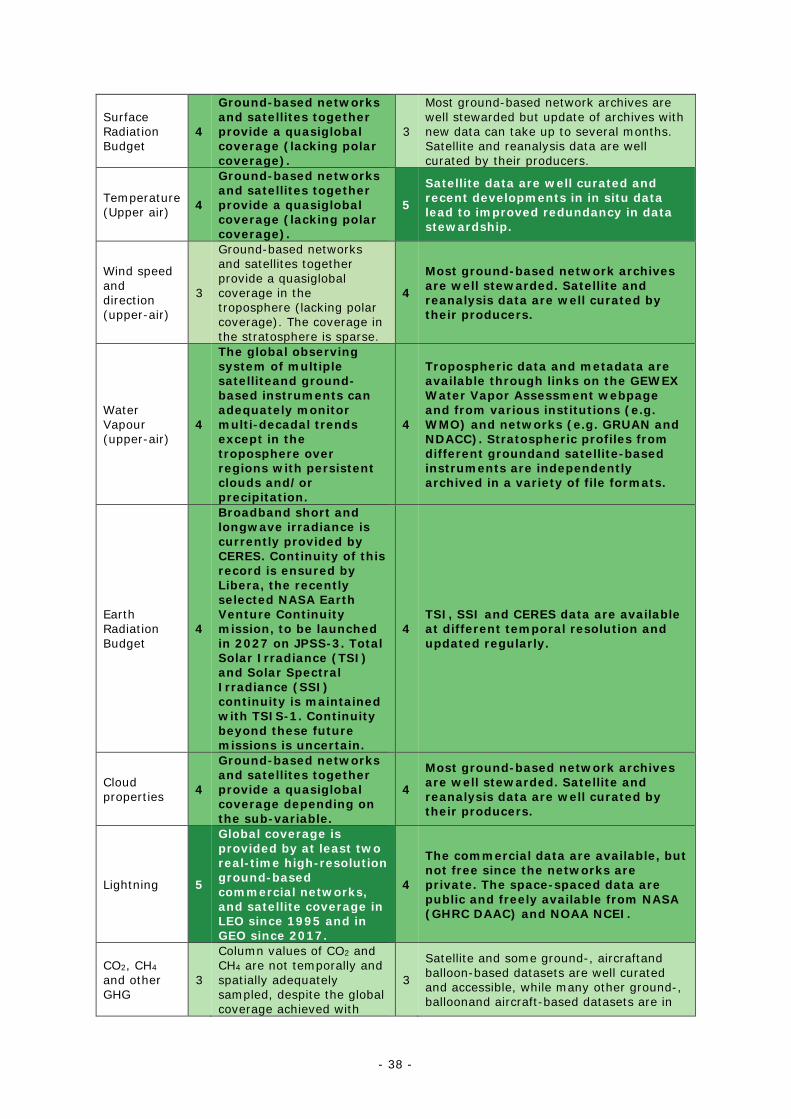
- 38 -
Surface Radiation Budget
4
Ground-based networks and satellites together provide a quasiglobal coverage (lacking polar coverage).
3
Most ground-based network archives are well stewarded but update of archives with new data can take up to several months. Satellite and reanalysis data are well curated by their producers.
Temperature (Upper air) 4
Ground-based networks and satellites together provide a quasiglobal coverage (lacking polar coverage).
5
Satellite data are well curated and recent developments in in situ data lead to improved redundancy in data stewardship.
Wind speed and direction (upper-air)
3
Ground-based networks and satellites together provide a quasiglobal coverage in the troposphere (lacking polar coverage). The coverage in the stratosphere is sparse.
4
Most ground-based network archives are well stewarded. Satellite and reanalysis data are well curated by their producers.
Water Vapour (upper-air)
4
The global observing system of multiple satelliteand ground-based instruments can adequately monitor multi-decadal trends except in the troposphere over regions with persistent clouds and/or precipitation.
4
Tropospheric data and metadata are available through links on the GEWEX Water Vapor Assessment webpage and from various institutions (e.g. WMO) and networks (e.g. GRUAN and NDACC). Stratospheric profiles from different groundand satellite-based instruments are independently archived in a variety of file formats.
Earth Radiation Budget
4
Broadband short and longwave irradiance is currently provided by CERES. Continuity of this record is ensured by Libera, the recently selected NASA Earth Venture Continuity mission, to be launched in 2027 on JPSS-3. Total Solar Irradiance (TSI) and Solar Spectral Irradiance (SSI) continuity is maintained with TSIS-1. Continuity beyond these future missions is uncertain.
4 TSI, SSI and CERES data are available at different temporal resolution and updated regularly.
Cloud properties 4
Ground-based networks and satellites together provide a quasiglobal coverage depending on the sub-variable.
4
Most ground-based network archives are well stewarded. Satellite and reanalysis data are well curated by their producers.
Lightning 5
Global coverage is provided by at least two real-time high-resolution ground-based commercial networks, and satellite coverage in LEO since 1995 and in GEO since 2017.
4
The commercial data are available, but not free since the networks are private. The space-spaced data are public and freely available from NASA (GHRC DAAC) and NOAA NCEI.
CO2, CH4 and other GHG
3
Column values of CO2 and CH4 are not temporally and spatially adequately sampled, despite the global coverage achieved with
3
Satellite and some ground-, aircraftand balloon-based datasets are well curated and accessible, while many other ground-, balloonand aircraft-based datasets are in
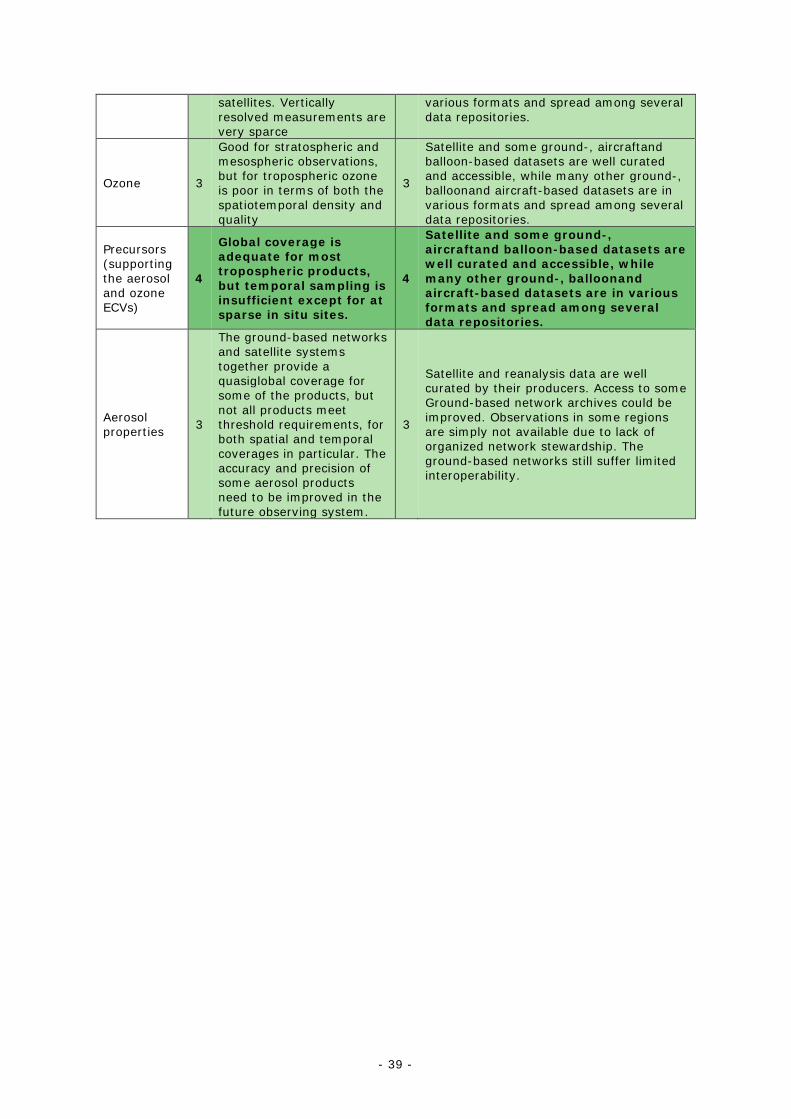
- 39 -
satellites. Vertically resolved measurements are very sparce
various formats and spread among several data repositories.
Ozone 3
Good for stratospheric and mesospheric observations, but for tropospheric ozone is poor in terms of both the spatiotemporal density and quality
3
Satellite and some ground-, aircraftand balloon-based datasets are well curated and accessible, while many other ground-, balloonand aircraft-based datasets are in various formats and spread among several data repositories.
Precursors (supporting the aerosol and ozone ECVs)
4
Global coverage is adequate for most tropospheric products, but temporal sampling is insufficient except for at sparse in situ sites.
4
Satellite and some ground-, aircraftand balloon-based datasets are well curated and accessible, while many other ground-, balloonand aircraft-based datasets are in various formats and spread among several data repositories.
Aerosol properties 3
The ground-based networks and satellite systems together provide a quasiglobal coverage for some of the products, but not all products meet threshold requirements, for both spatial and temporal coverages in particular. The accuracy and precision of some aerosol products need to be improved in the future observing system.
3
Satellite and reanalysis data are well curated by their producers. Access to some Ground-based network archives could be improved. Observations in some regions are simply not available due to lack of organized network stewardship. The ground-based networks still suffer limited interoperability.
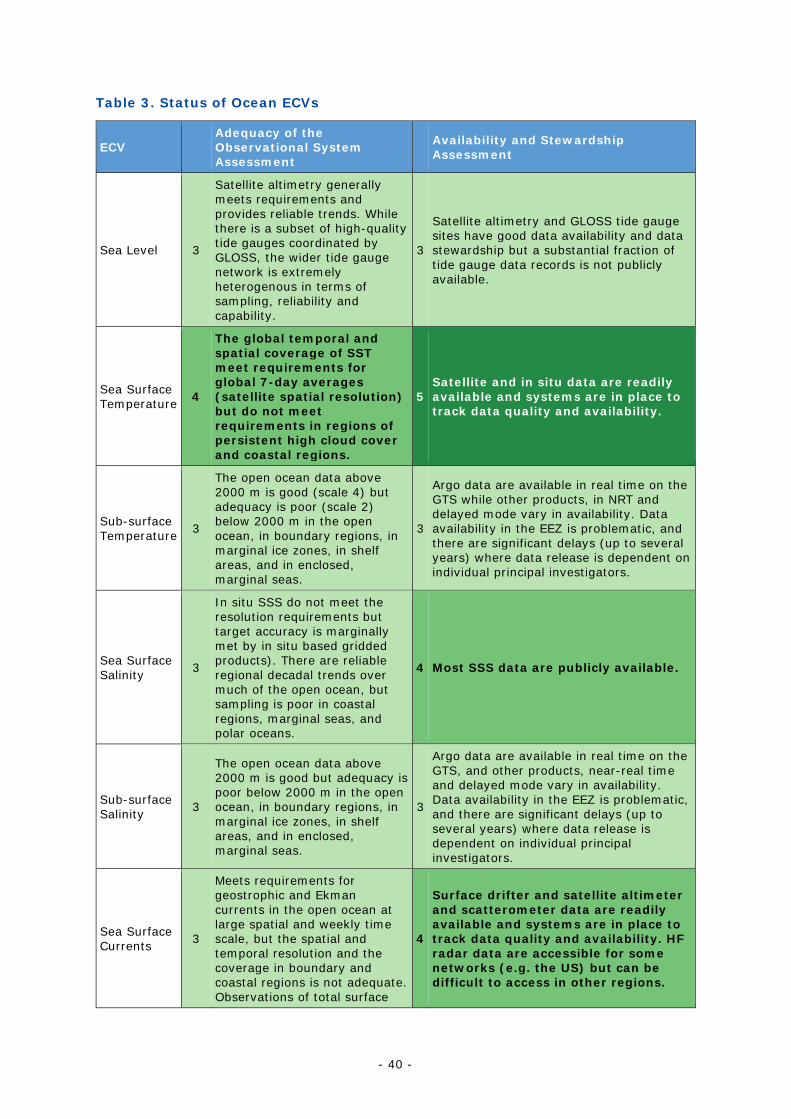
- 40 -
Table 3. Status of Ocean ECVs
ECV Adequacy of the Observational System Assessment
Availability and Stewardship Assessment
Sea Level 3
Satellite altimetry generally meets requirements and provides reliable trends. While there is a subset of high-quality tide gauges coordinated by GLOSS, the wider tide gauge network is extremely heterogenous in terms of sampling, reliability and capability.
3
Satellite altimetry and GLOSS tide gauge sites have good data availability and data stewardship but a substantial fraction of tide gauge data records is not publicly available.
Sea Surface Temperature 4
The global temporal and spatial coverage of SST meet requirements for global 7-day averages (satellite spatial resolution) but do not meet requirements in regions of persistent high cloud cover and coastal regions.
5 Satellite and in situ data are readily available and systems are in place to track data quality and availability.
Sub-surface Temperature 3
The open ocean data above 2000 m is good (scale 4) but adequacy is poor (scale 2) below 2000 m in the open ocean, in boundary regions, in marginal ice zones, in shelf areas, and in enclosed, marginal seas.
3
Argo data are available in real time on the GTS while other products, in NRT and delayed mode vary in availability. Data availability in the EEZ is problematic, and there are significant delays (up to several years) where data release is dependent on individual principal investigators.
Sea Surface Salinity 3
In situ SSS do not meet the resolution requirements but target accuracy is marginally met by in situ based gridded products). There are reliable regional decadal trends over much of the open ocean, but sampling is poor in coastal regions, marginal seas, and polar oceans.
4 Most SSS data are publicly available.
Sub-surface Salinity 3
The open ocean data above 2000 m is good but adequacy is poor below 2000 m in the open ocean, in boundary regions, in marginal ice zones, in shelf areas, and in enclosed, marginal seas.
3
Argo data are available in real time on the GTS, and other products, near-real time and delayed mode vary in availability. Data availability in the EEZ is problematic, and there are significant delays (up to several years) where data release is dependent on individual principal investigators.
Sea Surface Currents 3
Meets requirements for geostrophic and Ekman currents in the open ocean at large spatial and weekly time scale, but the spatial and temporal resolution and the coverage in boundary and coastal regions is not adequate. Observations of total surface
4
Surface drifter and satellite altimeter and scatterometer data are readily available and systems are in place to track data quality and availability. HF radar data are accessible for some networks (e.g. the US) but can be difficult to access in other regions.
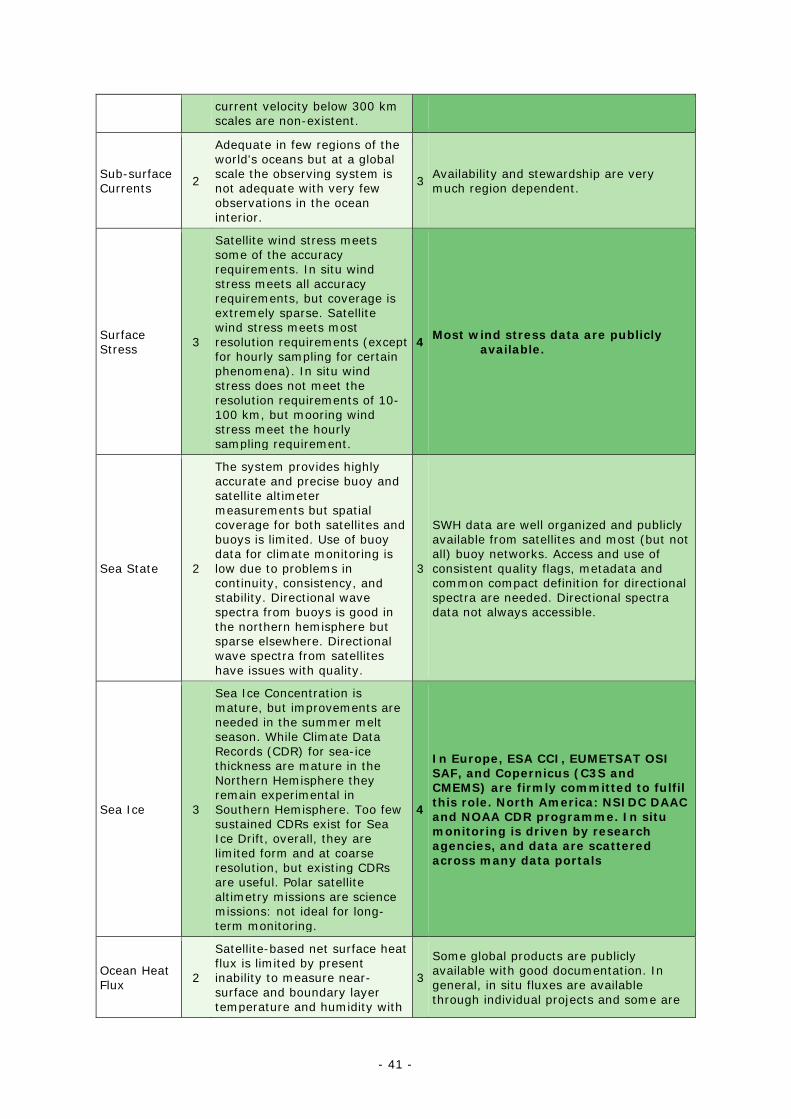
- 41 -
current velocity below 300 km scales are non-existent.
Sub-surface Currents 2
Adequate in few regions of the world's oceans but at a global scale the observing system is not adequate with very few observations in the ocean interior.
3 Availability and stewardship are very much region dependent.
Surface Stress 3
Satellite wind stress meets some of the accuracy requirements. In situ wind stress meets all accuracy requirements, but coverage is extremely sparse. Satellite wind stress meets most resolution requirements (except for hourly sampling for certain phenomena). In situ wind stress does not meet the resolution requirements of 10-100 km, but mooring wind stress meet the hourly sampling requirement.
4 Most wind stress data are publicly available.
Sea State 2
The system provides highly accurate and precise buoy and satellite altimeter measurements but spatial coverage for both satellites and buoys is limited. Use of buoy data for climate monitoring is low due to problems in continuity, consistency, and stability. Directional wave spectra from buoys is good in the northern hemisphere but sparse elsewhere. Directional wave spectra from satellites have issues with quality.
3
SWH data are well organized and publicly available from satellites and most (but not all) buoy networks. Access and use of consistent quality flags, metadata and common compact definition for directional spectra are needed. Directional spectra data not always accessible.
Sea Ice 3
Sea Ice Concentration is mature, but improvements are needed in the summer melt season. While Climate Data Records (CDR) for sea-ice thickness are mature in the Northern Hemisphere they remain experimental in Southern Hemisphere. Too few sustained CDRs exist for Sea Ice Drift, overall, they are limited form and at coarse resolution, but existing CDRs are useful. Polar satellite altimetry missions are science missions: not ideal for long-term monitoring.
4
In Europe, ESA CCI, EUMETSAT OSI SAF, and Copernicus (C3S and CMEMS) are firmly committed to fulfil this role. North America: NSIDC DAAC and NOAA CDR programme. In situ monitoring is driven by research agencies, and data are scattered across many data portals
Ocean Heat Flux 2
Satellite-based net surface heat flux is limited by present inability to measure near-surface and boundary layer temperature and humidity with
3
Some global products are publicly available with good documentation. In general, in situ fluxes are available through individual projects and some are
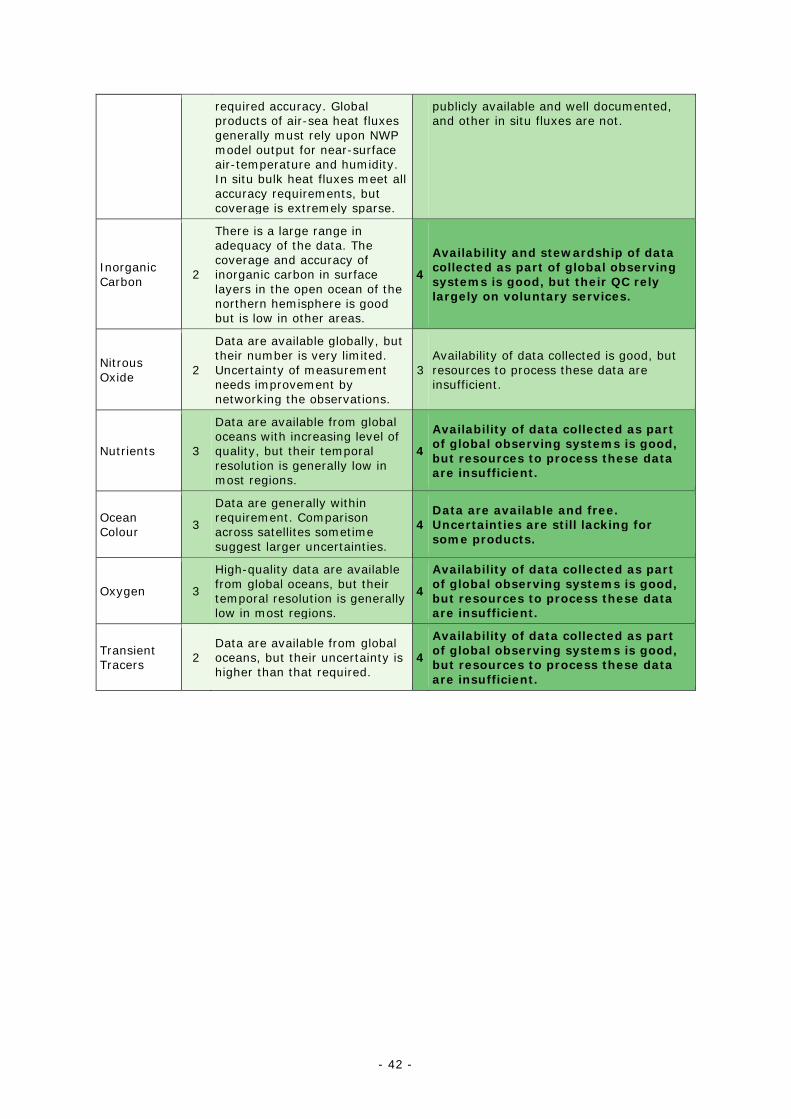
- 42 -
required accuracy. Global products of air-sea heat fluxes generally must rely upon NWP model output for near-surface air-temperature and humidity. In situ bulk heat fluxes meet all accuracy requirements, but coverage is extremely sparse.
publicly available and well documented, and other in situ fluxes are not.
Inorganic Carbon 2
There is a large range in adequacy of the data. The coverage and accuracy of inorganic carbon in surface layers in the open ocean of the northern hemisphere is good but is low in other areas.
4
Availability and stewardship of data collected as part of global observing systems is good, but their QC rely largely on voluntary services.
Nitrous Oxide 2
Data are available globally, but their number is very limited. Uncertainty of measurement needs improvement by networking the observations.
3 Availability of data collected is good, but resources to process these data are insufficient.
Nutrients 3
Data are available from global oceans with increasing level of quality, but their temporal resolution is generally low in most regions.
4
Availability of data collected as part of global observing systems is good, but resources to process these data are insufficient.
Ocean Colour 3
Data are generally within requirement. Comparison across satellites sometime suggest larger uncertainties.
4 Data are available and free. Uncertainties are still lacking for some products.
Oxygen 3
High-quality data are available from global oceans, but their temporal resolution is generally low in most regions.
4
Availability of data collected as part of global observing systems is good, but resources to process these data are insufficient.
Transient Tracers 2
Data are available from global oceans, but their uncertainty is higher than that required.
4
Availability of data collected as part of global observing systems is good, but resources to process these data are insufficient.
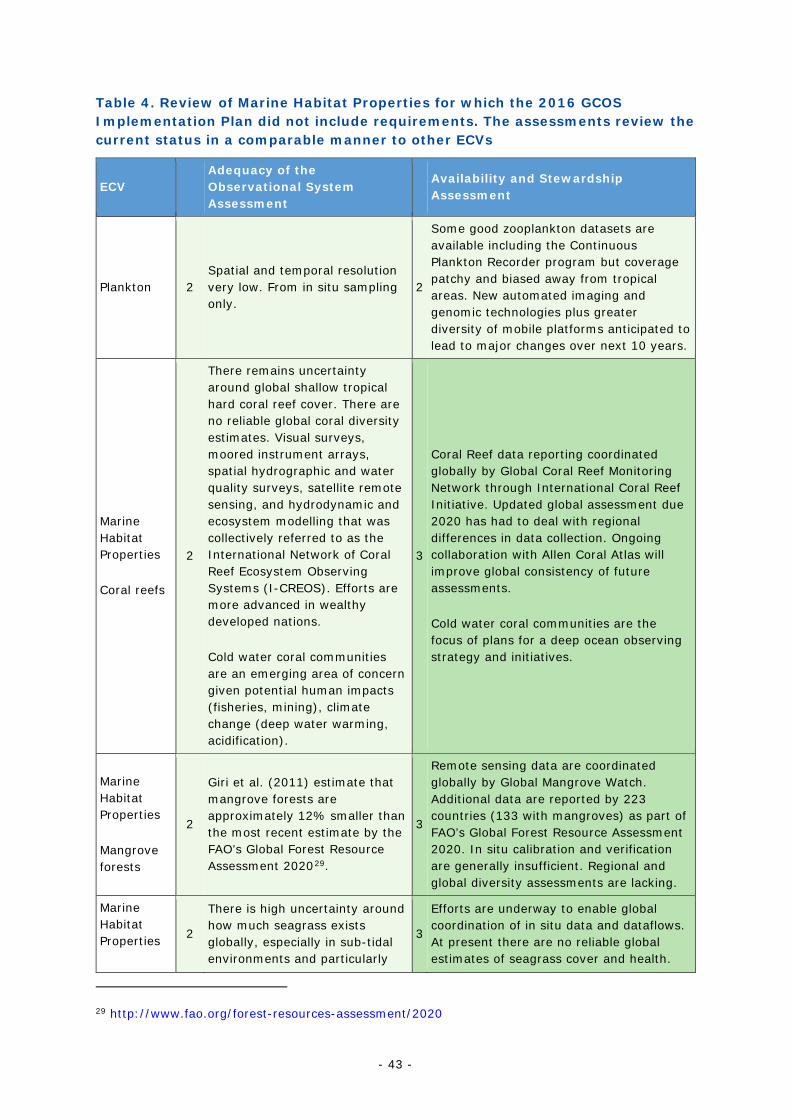
- 43 -
Table 4. Review of Marine Habitat Properties for which the 2016 GCOS Implementation Plan did not include requirements. The assessments review the current status in a comparable manner to other ECVs
ECV Adequacy of the Observational System Assessment
Availability and Stewardship Assessment
Plankton 2 Spatial and temporal resolution very low. From in situ sampling only.
2
Some good zooplankton datasets are available including the Continuous Plankton Recorder program but coverage patchy and biased away from tropical areas. New automated imaging and genomic technologies plus greater diversity of mobile platforms anticipated to lead to major changes over next 10 years.
Marine Habitat Properties
Coral reefs
2
There remains uncertainty around global shallow tropical hard coral reef cover. There are no reliable global coral diversity estimates. Visual surveys, moored instrument arrays, spatial hydrographic and water quality surveys, satellite remote sensing, and hydrodynamic and ecosystem modelling that was collectively referred to as the International Network of Coral Reef Ecosystem Observing Systems (I-CREOS). Efforts are more advanced in wealthy developed nations.
Cold water coral communities are an emerging area of concern given potential human impacts (fisheries, mining), climate change (deep water warming, acidification).
3
Coral Reef data reporting coordinated globally by Global Coral Reef Monitoring Network through International Coral Reef Initiative. Updated global assessment due 2020 has had to deal with regional differences in data collection. Ongoing collaboration with Allen Coral Atlas will improve global consistency of future assessments.
Cold water coral communities are the focus of plans for a deep ocean observing strategy and initiatives.
Marine Habitat Properties
Mangrove forests
2
Giri et al. (2011) estimate that mangrove forests are approximately 12% smaller than the most recent estimate by the FAO’s Global Forest Resource Assessment 202029.
3
Remote sensing data are coordinated globally by Global Mangrove Watch. Additional data are reported by 223 countries (133 with mangroves) as part of FAO’s Global Forest Resource Assessment 2020. In situ calibration and verification are generally insufficient. Regional and global diversity assessments are lacking.
Marine Habitat Properties 2
There is high uncertainty around how much seagrass exists globally, especially in sub-tidal environments and particularly
3
Efforts are underway to enable global coordination of in situ data and dataflows. At present there are no reliable global estimates of seagrass cover and health.
29 http://www.fao.org/forest-resources-assessment/2020
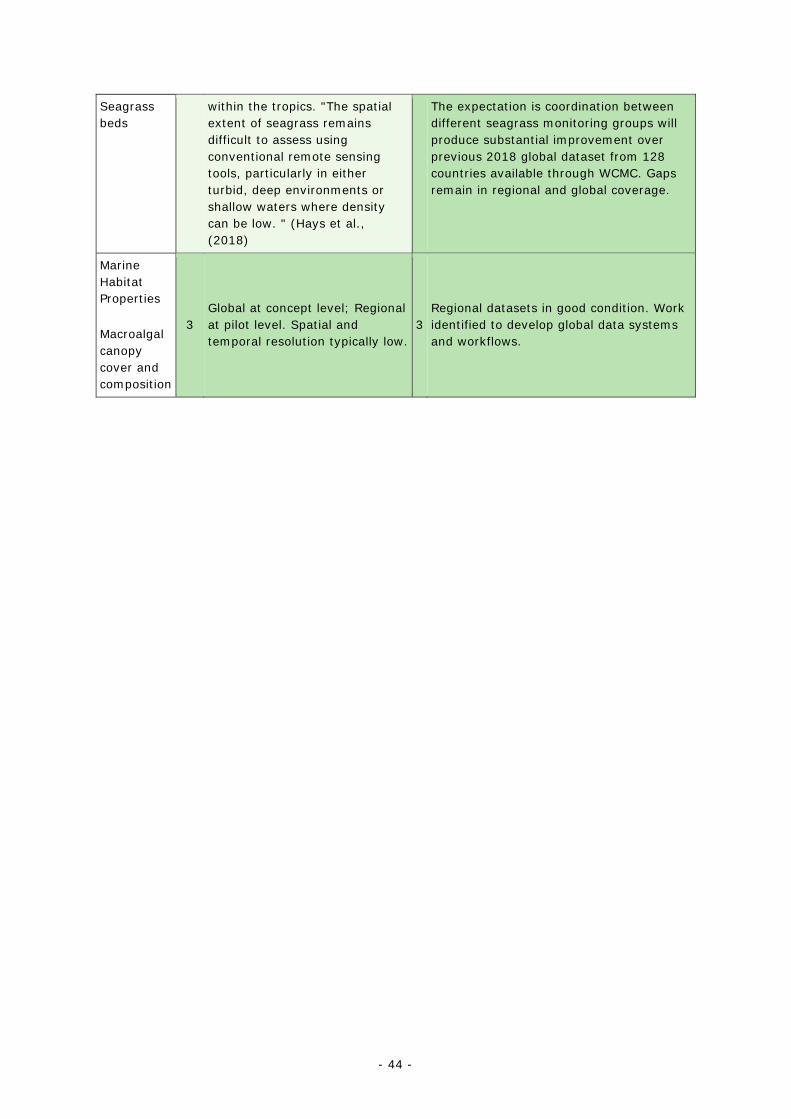
- 44 -
Seagrass beds
within the tropics. "The spatial extent of seagrass remains difficult to assess using conventional remote sensing tools, particularly in either turbid, deep environments or shallow waters where density can be low. " (Hays et al., (2018)
The expectation is coordination between different seagrass monitoring groups will produce substantial improvement over previous 2018 global dataset from 128 countries available through WCMC. Gaps remain in regional and global coverage.
Marine Habitat Properties
Macroalgal canopy cover and composition
3 Global at concept level; Regional at pilot level. Spatial and temporal resolution typically low.
3 Regional datasets in good condition. Work identified to develop global data systems and workflows.
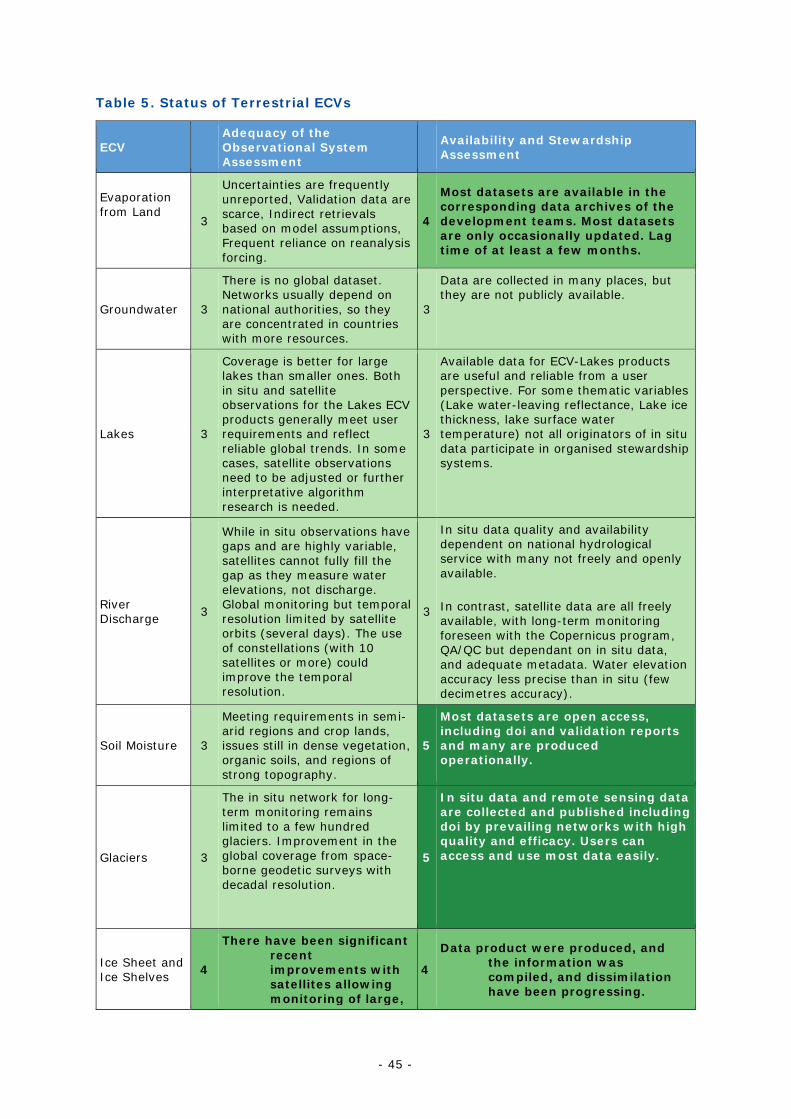
- 45 -
Table 5. Status of Terrestrial ECVs
ECV Adequacy of the Observational System Assessment
Availability and Stewardship Assessment
Evaporation from Land
3
Uncertainties are frequently unreported, Validation data are scarce, Indirect retrievals based on model assumptions, Frequent reliance on reanalysis forcing.
4
Most datasets are available in the corresponding data archives of the development teams. Most datasets are only occasionally updated. Lag time of at least a few months.
Groundwater 3
There is no global dataset. Networks usually depend on national authorities, so they are concentrated in countries with more resources.
3
Data are collected in many places, but they are not publicly available.
Lakes 3
Coverage is better for large lakes than smaller ones. Both in situ and satellite observations for the Lakes ECV products generally meet user requirements and reflect reliable global trends. In some cases, satellite observations need to be adjusted or further interpretative algorithm research is needed.
3
Available data for ECV-Lakes products are useful and reliable from a user perspective. For some thematic variables (Lake water-leaving reflectance, Lake ice thickness, lake surface water temperature) not all originators of in situ data participate in organised stewardship systems.
River Discharge 3
While in situ observations have gaps and are highly variable, satellites cannot fully fill the gap as they measure water elevations, not discharge. Global monitoring but temporal resolution limited by satellite orbits (several days). The use of constellations (with 10 satellites or more) could improve the temporal resolution.
3
In situ data quality and availability dependent on national hydrological service with many not freely and openly available.
In contrast, satellite data are all freely available, with long-term monitoring foreseen with the Copernicus program, QA/QC but dependant on in situ data, and adequate metadata. Water elevation accuracy less precise than in situ (few decimetres accuracy).
Soil Moisture 3
Meeting requirements in semi-arid regions and crop lands, issues still in dense vegetation, organic soils, and regions of strong topography.
5
Most datasets are open access, including doi and validation reports and many are produced operationally.
Glaciers 3
The in situ network for long-term monitoring remains limited to a few hundred glaciers. Improvement in the global coverage from space-borne geodetic surveys with decadal resolution.
5
In situ data and remote sensing data are collected and published including doi by prevailing networks with high quality and efficacy. Users can access and use most data easily.
Ice Sheet and Ice Shelves 4
There have been significant recent improvements with satellites allowing monitoring of large,
4
Data product were produced, and the information was compiled, and dissimilation have been progressing.
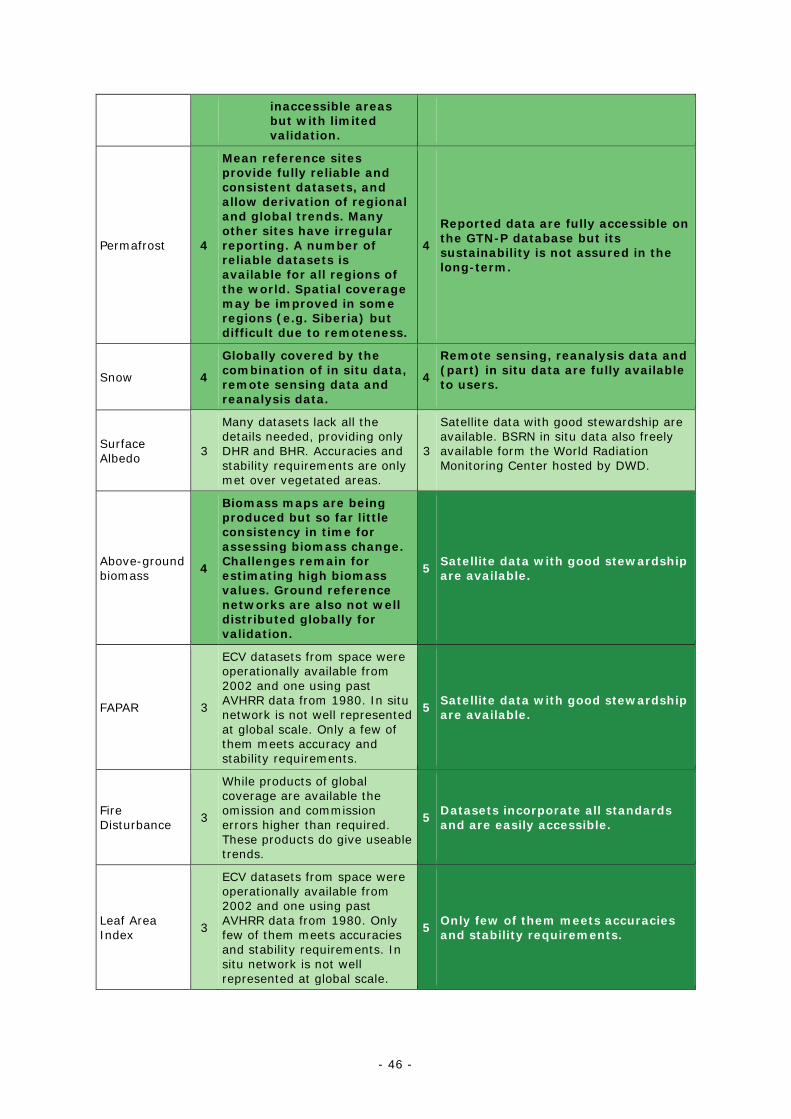
- 46 -
inaccessible areas but with limited validation.
Permafrost 4
Mean reference sites provide fully reliable and consistent datasets, and allow derivation of regional and global trends. Many other sites have irregular reporting. A number of reliable datasets is available for all regions of the world. Spatial coverage may be improved in some regions (e.g. Siberia) but difficult due to remoteness.
4
Reported data are fully accessible on the GTN-P database but its sustainability is not assured in the long-term.
Snow 4
Globally covered by the combination of in situ data, remote sensing data and reanalysis data.
4
Remote sensing, reanalysis data and (part) in situ data are fully available to users.
Surface Albedo 3
Many datasets lack all the details needed, providing only DHR and BHR. Accuracies and stability requirements are only met over vegetated areas.
3
Satellite data with good stewardship are available. BSRN in situ data also freely available form the World Radiation Monitoring Center hosted by DWD.
Above-ground biomass 4
Biomass maps are being produced but so far little consistency in time for assessing biomass change. Challenges remain for estimating high biomass values. Ground reference networks are also not well distributed globally for validation.
5 Satellite data with good stewardship are available.
FAPAR 3
ECV datasets from space were operationally available from 2002 and one using past AVHRR data from 1980. In situ network is not well represented at global scale. Only a few of them meets accuracy and stability requirements.
5 Satellite data with good stewardship are available.
Fire Disturbance 3
While products of global coverage are available the omission and commission errors higher than required. These products do give useable trends.
5 Datasets incorporate all standards and are easily accessible.
Leaf Area Index 3
ECV datasets from space were operationally available from 2002 and one using past AVHRR data from 1980. Only few of them meets accuracies and stability requirements. In situ network is not well represented at global scale.
5 Only few of them meets accuracies and stability requirements.
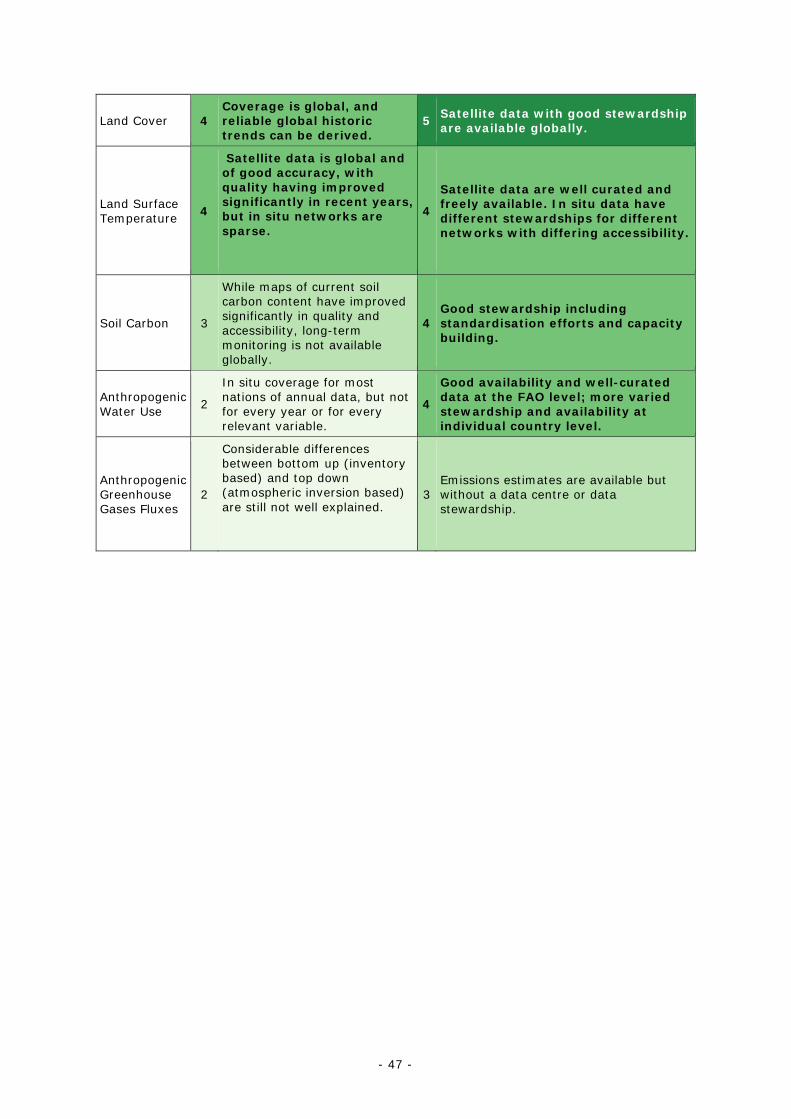
- 47 -
Land Cover 4 Coverage is global, and reliable global historic trends can be derived.
5 Satellite data with good stewardship are available globally.
Land Surface Temperature 4
Satellite data is global and of good accuracy, with quality having improved significantly in recent years, but in situ networks are sparse.
4
Satellite data are well curated and freely available. In situ data have different stewardships for different networks with differing accessibility.
Soil Carbon 3
While maps of current soil carbon content have improved significantly in quality and accessibility, long-term monitoring is not available globally.
4 Good stewardship including standardisation efforts and capacity building.
Anthropogenic Water Use 2
In situ coverage for most nations of annual data, but not for every year or for every relevant variable.
4
Good availability and well-curated data at the FAO level; more varied stewardship and availability at individual country level.
Anthropogenic Greenhouse Gases Fluxes
2
Considerable differences between bottom up (inventory based) and top down (atmospheric inversion based) are still not well explained.
3 Emissions estimates are available but without a data centre or data stewardship.
- 48 -
4. SATELLITE OBSERVATIONS Observations by satellites are important for many ECVs, contributing to ECV products of 35 ECVs across all the domains. This chapter reviews general matters related to space-based observation for climate monitoring, independent of specific ECVs, covering various topics such as international coordination, sustained satellite observing systems, the generation of CDRs30 for ECVs, the importance of satellite data rescue and long-term data preservation.
The Coordination Group of Meteorological Satellites (CGMS) and the Committee on Earth Observation Satellites (CEOS) tasked their joint Working Group on Climate (WGClimate) to coordinate international space agency activities that support climate science and services. The working group assesses the situation of the status and evolution of the space segment and the planning of climate data records for ECVs following the architecture for climate monitoring from space (Dowell et al., 2013). Implementing 2016 GCOS-IP Actions G11 and G12, since 2018 the WGClimate provides an Inventory of CDRs that is updated each year. It contains detailed information on the CDRs available and planned for each ECV Product. WGClimate continually analyses the planned CDR in the Inventory to identify potential future measurement gaps. Space agencies use this resource to inform their planning for both mission and product generation to avoid such gaps in the future.
The Vision for the WMO Integrated Global Observing System (WIGOS) in 2040 (WMO, 2019) contains specific descriptions of the space-based components that are envisioned up to 2040. The CGMS baseline mostly corresponds to the Subcomponent 1 of the WIGOS Vision, which forms the sustained satellite observing system for weather and climate. Every 4 years CGMS performs a gap analysis versus the WIGOS Vision. Annually, it performs a risk analysis of its baseline for the next 10 years. In 2020, the major risks identified were:
• Long-term continuity risk for critical sensors (e.g. Microwave and Hyperspectral Sounders and Multipurpose Imagers) in the early morning orbit towards the end of this decade.
• Continuity risk for the number and geographic distribution of radio occultations, especially in the low-to mid-latitudes.
• Lack of confirmation of long-term plans for Atmospheric Chemistry observations.
• Long-term continuity for Microwave Imager C-band (~6GHz) capability for all-weather sea surface temperatures and data availability from the early morning orbit is not assured.
• No long-term plans exist for a precipitation radar sensor; and
• No long-term plans exist for scatterometer sensors for early morning and afternoon orbits.
30 A Climate Data Record (CDR) is defined as "a time series of measurements of sufficient length,
consistency, and continuity to determine climate variability and climate change|”. An Interim Climate Data Record (ICDR) is a dataset that has been forward processed, using the baselined CDR algorithm and processing environment but whose consistency and continuity have not been verified. Eventually it will be necessary to perform a new reprocessing of the CDR and ICDR parts together to guarantee consistency, and the new reprocessed data record will replace the old CDR. A Fundamental Climate Data Record (FCDR) is a long-term data record of calibrated and quality-controlled data designed to allow the generation of homogeneous products that are accurate and stable enough for climate monitoring.
- 49 -
Some plans and CGMS recommendations to agencies exist to remedy these recognized gaps.
The operational CGMS baseline provision is complemented and substantially extended by the major European Union Copernicus programme for operational Earth observation and associated service delivery. Up until 2020 Sentinels1A and B, 2 A and B, and 3A and B, 5P and 6 have been launched and are operated by ESA, EUMETSAT, NASA and NOAA, with support from CNES. These measurements have strong value for climate monitoring as they support monitoring of sea ice, sea level, sea and land surface temperature, ocean colour, atmospheric composition including aerosols, land-use changes, agriculture, ecosystems, ice-sheets, glaciers and snow cover, and support disaster response. The Sentinel-6 mission is particularly sustaining the mean sea level record starting with the TOPEX/POSEIDON in 1992. More Sentinel missions complementing the portfolio for climate monitoring are envisioned during this decade.
CEOS and CGMS endorsed in 2020 a Greenhouse Gas Roadmap to implement an operational atmospheric CO2 and CH4 monitoring system to contribute to the Transparency Framework off the UNFCCC’s Paris Agreement and to assist in the development and validation of NDCs and for stocktaking. The first prototype system is based on available space-based assets, for instance, the United States OCO-2 and Japan’s GOSAT programmes. It is expected that role of the satellite data in informing the first global stocktake in 2023 shall be limited due to the sparseness of the observations. A pre-operational system making use of new measurements such as the planned European CO2M mission should support the second global stocktake in 2028.
WGClimate, taking into account results from the 2018 WGClimate gap analysis, recommended for the agencies to plan for uninterrupted measurements of biomass (similar to those provided by BIOMASS and GEDI) and to develop high resolution SAR/LIDAR measurements in support of the REDD+ type applications and the UNFCCC Paris Agreement Global Stocktake. In 2019, CEOS began to coordinate the use of multiple satellite missions to derive above ground biomass. In 2020, this expanded with the development of a CEOS Roadmap for Agriculture, Forest and Other Land Use (AFOLU) observations to complement the Greenhouse Gas roadmap.
Despite the successes, there are still areas for improvements. For the water vapour ECV, the long-identified impending gap in water vapour measurements from stratospheric limb sounders used for profiling, e.g. from solar occultation, limb scattering, or limb emission remains unaddressed. Other principal issues are lacking cross-sensor consistency for long-term multi-sensor CDRs, e.g. for the ECV aerosol it is not trivial to use ATSR-2/AATSR/SLSTR or MODIS/VIIRS together. Recommendations to space agencies to mitigate such gaps and improve planning of future instruments are part of the coordinated action plan of the WGClimate.
Gaps in the monitoring of the Earth’s energy, water and biogeochemical cycles and associated fluxes remain. However, new techniques to measure relevant physical and chemical aspects will need to be developed, as already documented in the 2016 GCOS-IP. In addition, geodetic satellite-based monitoring methods may in the future make an increasing contribution to many ECVs.
Interest groups from the energy, the water resource, the agricultural, the human health, the national security, the coastal communities, and many more recognise the importance of climate data records derived from long records of satellite measurements. The ECV Inventory contains information for 1137 data sets either directly provided or funded by
- 50 -
space agencies. 37 GCOS ECVs (13 Atmosphere, 15 Land, and 9 Ocean) are observable from space, the Inventory covers contributions for 35 ECVs. Space agencies have started to address data records for lightning, sea-surface salinity, above-ground biomass, and permafrost, the latter two having significance for the study and analysis of the Earth’s carbon cycle. Among the 37 GCOS ECVs observable from space, only Ocean Surface Currents and Anthropogenic GHG fluxes do not have records in the ECV Inventory. Projects are underway to develop climate data records for additional ECVs, such as river discharge.
Significant scientific progress has been made in the uncertainty characterisation of radiance data and error propagation methods into higher level products. These methods are based on metrology and need to be widely used across ECV data records.
Another important recent development is “real time” climate monitoring using Interim CDRs (ICDR) that provide actual observations consistent with the derived CDRs. These are of importance for climate services providing up-to-date information to the public. ICDRs have a higher uncertainty than CDRs. Operational implementation cost needs to be better understood before such records can be systematically produced.
Early satellite observations, even if they are of inferior quality, help to better understand environmental changes since the 1960s (e.g. the extent of the Antarctic and Greenland ice caps in the 1960s). In addition, climate reanalysis can piece together information collected by the first satellites. The early information observed by these satellites is crucially important to generate digital datasets that span several decades.
Several activities in the United States and Europe are underway to preserve satellite data that are at risk of being lost due to loss or deterioration of the storage media or due to loss of experience or information on how to read these data. This includes corrections for geometric and radiometric effects and reformatting to modern digital standards. For data users, this represents a major advancement as compared to the bespoke efforts that were required originally by investigators for analysing the data from each particular satellite instrument.
For all space-based measurements, long-term preservation programmes are and remain essential.
5. STATUS OF ACTIONS FROM THE 2016 IMPLEMENTATION PLAN
This chapter reviews the progress on all the actions identified in the 2016 GCOS Implementation Plan (2016 GCOS-IP). All the actions are reviewed against the indicators specified in the Implementation Plan. A more complete discussion is provided in Annex B. These results may not fully reflect the progress made across the global climate observing system as they may not cover all the improvements that have occurred, while other actions which depended upon other activities to be concluded, may have been overtaken by events or the relevant authorities have not decided to take action. However, these results do give an overview of progress.
Figure 8 summarises the assessments across all the domains.
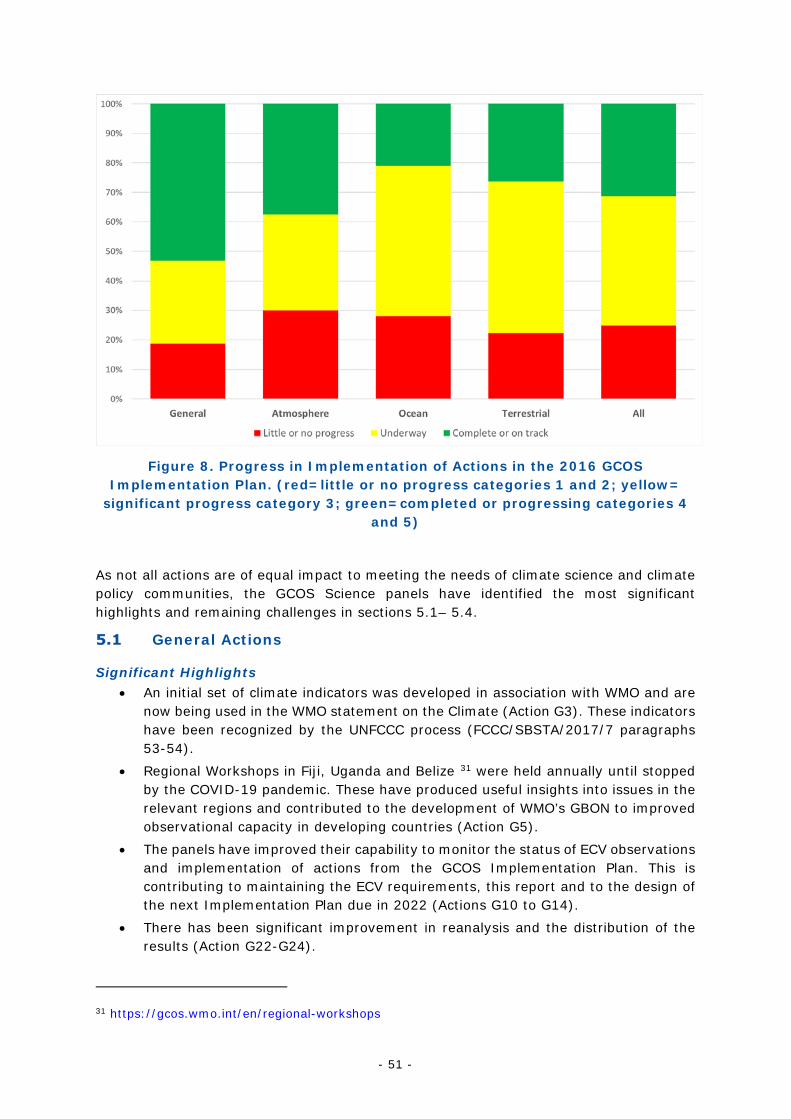
- 51 -
Figure 8. Progress in Implementation of Actions in the 2016 GCOS Implementation Plan. (red=little or no progress categories 1 and 2; yellow=
significant progress category 3; green=completed or progressing categories 4 and 5)
As not all actions are of equal impact to meeting the needs of climate science and climate policy communities, the GCOS Science panels have identified the most significant highlights and remaining challenges in sections 5.1– 5.4.
General Actions
Significant Highlights • An initial set of climate indicators was developed in association with WMO and are
now being used in the WMO statement on the Climate (Action G3). These indicators have been recognized by the UNFCCC process (FCCC/SBSTA/2017/7 paragraphs 53-54).
• Regional Workshops in Fiji, Uganda and Belize 31 were held annually until stopped by the COVID-19 pandemic. These have produced useful insights into issues in the relevant regions and contributed to the development of WMO’s GBON to improved observational capacity in developing countries (Action G5).
• The panels have improved their capability to monitor the status of ECV observations and implementation of actions from the GCOS Implementation Plan. This is contributing to maintaining the ECV requirements, this report and to the design of the next Implementation Plan due in 2022 (Actions G10 to G14).
• There has been significant improvement in reanalysis and the distribution of the results (Action G22-G24).
31 https://gcos.wmo.int/en/regional-workshops
- 52 -
Significant Challenges • While there has been improvement in data accessibility and discoverability, there
still remain some significant gaps in areas such as hydrology (due to restrictive data exchange policies) and in the long-term funding, and hence sustainability, of some data centres (Actions G15 to G20).
• While there has been improvement with data rescue activities with the establishment of the C3S Data Rescue Service, data rescue remains an important issue with early records, needed to understand changes to date, inaccessible (Actions G28-G30).
Atmospheric Actions
Significant Highlights • NOAA NCEI and the Copernicus Climate Change Service have significantly
advanced an integrated database of atmospheric observations over land through a joint project. Although far from complete, the progress to date in gaining access to data holdings and their merger is promising (Action A2).
• There has been substantial progress toward an absolutely calibrated space-based measurement system, critically with hyperspectral capability, with CLARREO pathfinder scheduled for 2023 and missions announced by ESA (TRUTHS) and the Chinese space agency (LIBRA) (Action A16).
• Significant progress has been made on the instrumentation and exchange of aircraft observations (Action A20).
• For the short term, satellite agency plans have addressed concerns around measurements of the global Earth Radiation Budget with a follow-on mission to CERES (Libera). However, the future beyond Libera (to be launched in 2027) is uncertain. (Action A27).
• An AOPC task team has made considerable progress in the establishment of lightning data which was recognized as a new ECV in the 2016 GCOS-IP (Action A29).
• Although challenges remain around aviation clearance and recovery and analysis of the samples in a timely fashion, the collection of in situ profile composition measurements has significantly improved using AIRCORE-type approaches (Action A34).
• The ability to measure various greenhouses gases from space has improved and several missions have been scheduled (Action A35).
Significant challenges • The provision of pressure sensors on marine drifting buoys has degraded. If this is
to be reversed, a clearer rationale needs to be developed and articulated to WMO members deploying floating buoys (Action A7).
• The status of surface radiation archives remains at significant risk owing to resourcing issues for WRDC and many observations are not in these records (Action A12).
• Satellite-based atmospheric wind profiles have been proven to be of value by the Atmospheric Dynamics Mission Aeolus mission, but no follow-on is presently funded and there is a risk of a considerable data gap (Action A21).
- 53 -
• The phasing out of R23 under the Kigali amendment to the Montreal Protocol places at risk long-term in situ profile measurements of water vapour in the Upper Troposphere and Lower Stratospheres. Some progress has been made but further work is still required (Action A23).
• An AOPC task team provided recommendations on radar data (GCOS-223) but no repository has been set-up and the state of radar archives remains highly unsatisfactory for global applications (Action A24).
• The continuity of limb-sounding missions capable of measuring ozone and water vapour in the upper troposphere and lower stratosphere remains uncertain with a real risk of data gaps (Action A30).
Ocean Actions
Significant Highlights • Improved discoverability and interoperability, comparability and traceability of
ocean observations among ocean observing networks for all ECVs (including ECVs of other domains) is progressing under the coordination of the GOOS Observations Coordination Group networks and the OceanOPS centre that has developed its services significantly since the last status report. Synthesis efforts for physical and biogeochemical ECVs are creating improved ECV data products (Action O2 and O3).
• Periodic evaluation of observing system against requirements has been initiated within the GOOS Framework of Ocean Observing established by GOOS in 2011 and revised in 2019. OOPC has joined OceanPredict OSEval Task Team to develop further OSEs and OSSEs observing system evaluations (Action O7).
• Targets for the upper-ocean (0 – 2000 m) temperature observing system have been exceeded thanks to the implementation of Argo profiling floats and surface (Action O9). Before the COVID-19 pandemic, deeper ocean temperature profiles were growing thanks to the increasing number of deep Argo floats deployment, GO-SHIP repeat hydrography lines and OceanSITES full depth moorings (Action O10).
• An Air-Sea Flux task team has been established in 2018 and funded by Special Committee on Oceanic Research (SCOR) to establish an international multi-disciplinary observing system activity called “Observing Air-Sea Interactions Strategy (OASIS)” (Action O17).
• Sea-state measurements have been expanded with in situ network and via satellite altimeter missions that are providing a constellation for such measurements from space (Action O33).
• The high-quality, full-depth, multi-disciplinary ship-based decadal survey is on track (Action O40). Fixed-point time series have largely been sustained. Metadata and data flow need improvement with expected data gaps in 2020-21 (Action O41).
• Surface Ocean CO2 reference NETwork (SOCONET) has been developed and covers key regions of the ocean with data of specified quality. The network will implement procedures aimed at improving its readiness level across all elements of the GOOS Framework for Ocean Observing (Actions O52 and O53).
Significant Challenges • Funding for sustained ocean ECV observing activities remains fragile, largely funded
by research projects. For example, subsurface T/S profiles from Argo are funded
- 54 -
5% from meteorological agencies with operational budgets, and 95% from ocean research agencies (Action O5).
• The COVID-19 pandemic has a large impact on the operations of the in situ networks and cruises and threatens to create considerable discontinuity in data generation.
• The development of intercomparison exercises has proceeded, and N2O observations are a mature part of GO-SHIP lines, but a further development of observing platforms is required (Action O22).
• In situ observations of plankton remain concentrated in certain geographic regions (Action O54). Continuous Plankton Recorder and supporting observations face unstable research funding, however new automated imaging and genomics technologies, as well as new platforms, are anticipated to lead to major changes in the coming 10 years (Action O26).
• In situ calibration and validation data are generally available for physical ocean ECVs, but sparse or lacking for biogeochemical and biological ocean ECVs (Action O29).
• Reviews of the adequacy of ocean surface stresses have not been carried out as a global system. In situ wind stress measurements meet all accuracy requirements, but coverage is extremely sparse (Action 16). There are currently 3 satellite scatterometers in orbit providing measurements of ocean surface wind stress together with a sparse array of in situ sensors. But the virtual constellation is inadequate for sampling the diurnal and semi-diurnal cycles. The spatial resolutions of the measurements (typically 12.5-25 km) are marginal in resolving coastal winds (Action O34). Concerns exist also for the continuity of sea-ice satellite observations (Action O35) and ocean colour (Action O36).
• The Deep Argo array has only very partially been fulfilled (159 deep Argo floats are operating as for Sep 2020, against a target of 25% of the array or about 1000 floats) (Action O39).
Terrestrial Actions
Significant Highlights • Satellite-based monitoring has developed with new or improved products available
for many terrestrial ECVs including regional groundwater changes, soil moisture, improved land cover, land surface temperature and 300 m resolution FAPAR and LAI (Actions T8, T10, T14, T15, T16, T18, T29, T32, T40, T41, T43, T44, T49, T51, T63, T68, T71).
• Access to many ECV datasets has improved with projects such as the EU’s Copernicus programme enabling global access to many ECV. NCEI continues to host many meteorological ECVs. The Joint CEOS/CGMS Working Group on Climate has produced the ECV Inventory which covers nearly all the satellite-based ECV products and enables datasets to be discovered (Actions T24, T22, T43, G17, G18, G19).
• Techniques to improve the understanding of uncertainty and QA/QC of satellite products have been developed, although they need to be fully implemented (Actions T16, T35, T41, T53, T54, T67).
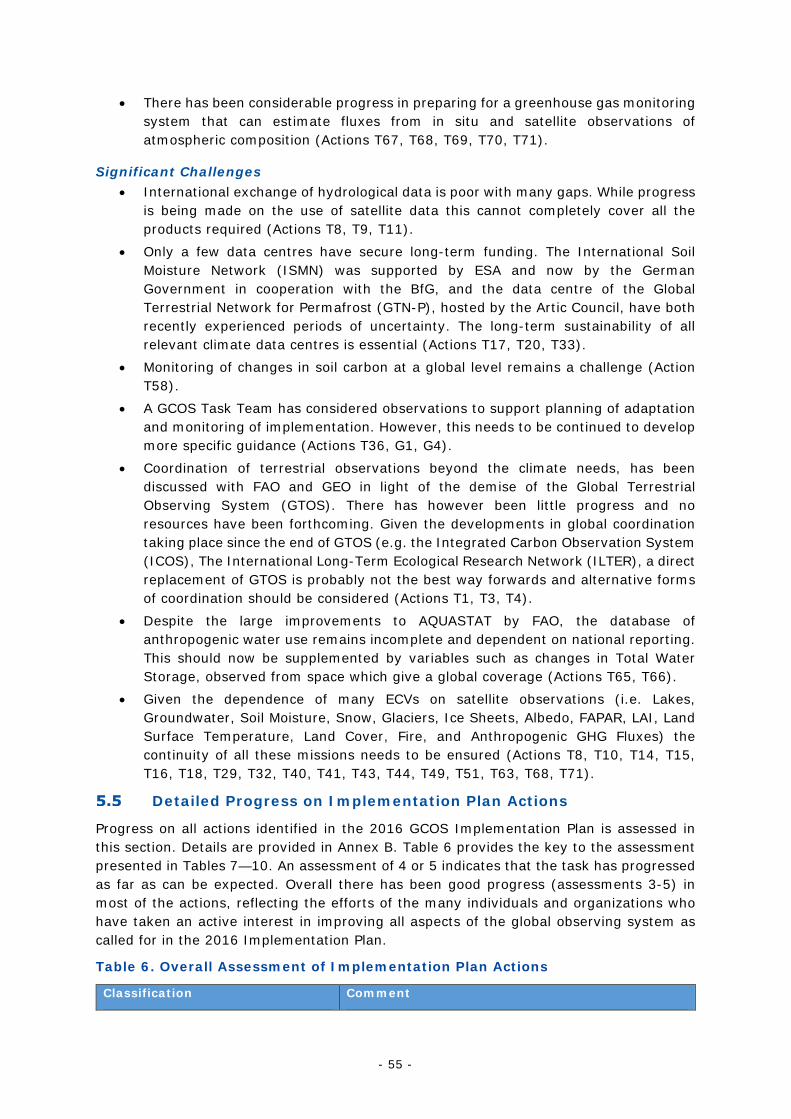
- 55 -
• There has been considerable progress in preparing for a greenhouse gas monitoring system that can estimate fluxes from in situ and satellite observations of atmospheric composition (Actions T67, T68, T69, T70, T71).
Significant Challenges • International exchange of hydrological data is poor with many gaps. While progress
is being made on the use of satellite data this cannot completely cover all the products required (Actions T8, T9, T11).
• Only a few data centres have secure long-term funding. The International Soil Moisture Network (ISMN) was supported by ESA and now by the German Government in cooperation with the BfG, and the data centre of the Global Terrestrial Network for Permafrost (GTN-P), hosted by the Artic Council, have both recently experienced periods of uncertainty. The long-term sustainability of all relevant climate data centres is essential (Actions T17, T20, T33).
• Monitoring of changes in soil carbon at a global level remains a challenge (Action T58).
• A GCOS Task Team has considered observations to support planning of adaptation and monitoring of implementation. However, this needs to be continued to develop more specific guidance (Actions T36, G1, G4).
• Coordination of terrestrial observations beyond the climate needs, has been discussed with FAO and GEO in light of the demise of the Global Terrestrial Observing System (GTOS). There has however been little progress and no resources have been forthcoming. Given the developments in global coordination taking place since the end of GTOS (e.g. the Integrated Carbon Observation System (ICOS), The International Long-Term Ecological Research Network (ILTER), a direct replacement of GTOS is probably not the best way forwards and alternative forms of coordination should be considered (Actions T1, T3, T4).
• Despite the large improvements to AQUASTAT by FAO, the database of anthropogenic water use remains incomplete and dependent on national reporting. This should now be supplemented by variables such as changes in Total Water Storage, observed from space which give a global coverage (Actions T65, T66).
• Given the dependence of many ECVs on satellite observations (i.e. Lakes, Groundwater, Soil Moisture, Snow, Glaciers, Ice Sheets, Albedo, FAPAR, LAI, Land Surface Temperature, Land Cover, Fire, and Anthropogenic GHG Fluxes) the continuity of all these missions needs to be ensured (Actions T8, T10, T14, T15, T16, T18, T29, T32, T40, T41, T43, T44, T49, T51, T63, T68, T71).
Detailed Progress on Implementation Plan Actions
Progress on all actions identified in the 2016 GCOS Implementation Plan is assessed in this section. Details are provided in Annex B. Table 6 provides the key to the assessment presented in Tables 7—10. An assessment of 4 or 5 indicates that the task has progressed as far as can be expected. Overall there has been good progress (assessments 3-5) in most of the actions, reflecting the efforts of the many individuals and organizations who have taken an active interest in improving all aspects of the global observing system as called for in the 2016 Implementation Plan.
Table 6. Overall Assessment of Implementation Plan Actions
Classification Comment
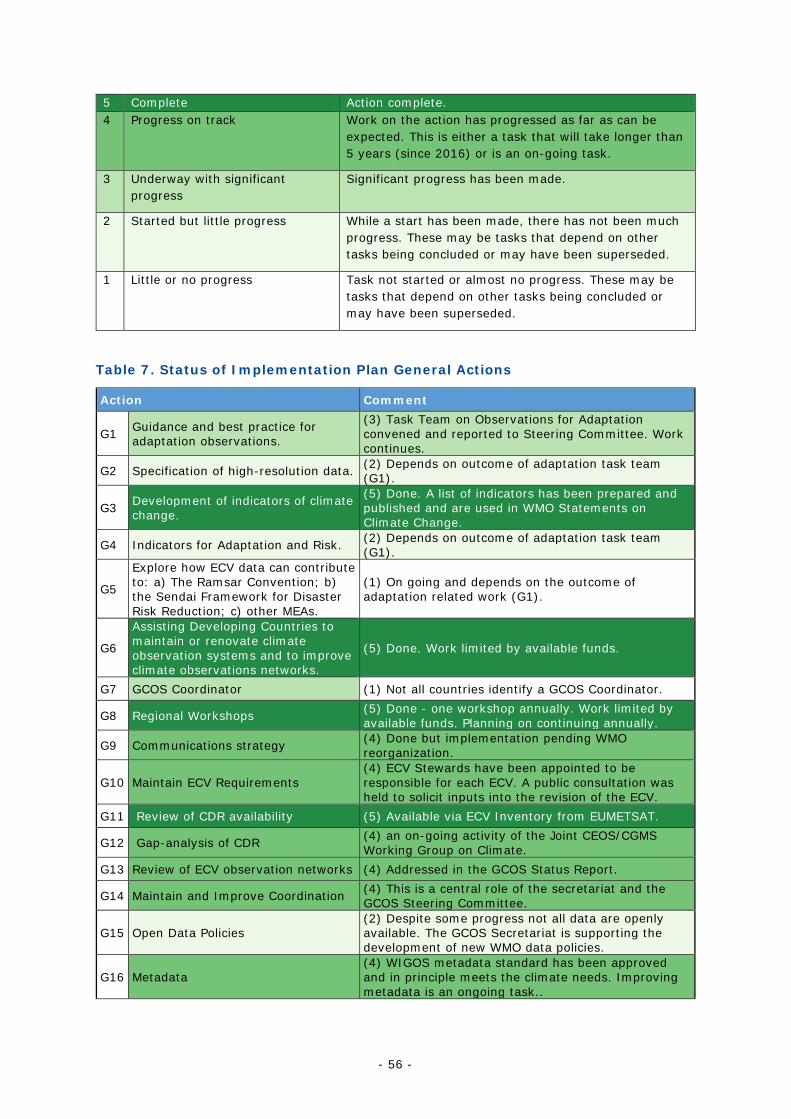
- 56 -
5 Complete Action complete. 4 Progress on track Work on the action has progressed as far as can be
expected. This is either a task that will take longer than 5 years (since 2016) or is an on-going task.
3 Underway with significant progress
Significant progress has been made.
2 Started but little progress While a start has been made, there has not been much progress. These may be tasks that depend on other tasks being concluded or may have been superseded.
1 Little or no progress Task not started or almost no progress. These may be tasks that depend on other tasks being concluded or may have been superseded.
Table 7. Status of Implementation Plan General Actions
Action Comment
G1 Guidance and best practice for adaptation observations.
(3) Task Team on Observations for Adaptation convened and reported to Steering Committee. Work continues.
G2 Specification of high-resolution data. (2) Depends on outcome of adaptation task team (G1).
G3 Development of indicators of climate change.
(5) Done. A list of indicators has been prepared and published and are used in WMO Statements on Climate Change.
G4 Indicators for Adaptation and Risk. (2) Depends on outcome of adaptation task team (G1).
G5
Explore how ECV data can contribute to: a) The Ramsar Convention; b) the Sendai Framework for Disaster Risk Reduction; c) other MEAs.
(1) On going and depends on the outcome of adaptation related work (G1).
G6
Assisting Developing Countries to maintain or renovate climate observation systems and to improve climate observations networks.
(5) Done. Work limited by available funds.
G7 GCOS Coordinator (1) Not all countries identify a GCOS Coordinator.
G8 Regional Workshops (5) Done - one workshop annually. Work limited by available funds. Planning on continuing annually.
G9 Communications strategy (4) Done but implementation pending WMO reorganization.
G10 Maintain ECV Requirements (4) ECV Stewards have been appointed to be responsible for each ECV. A public consultation was held to solicit inputs into the revision of the ECV.
G11 Review of CDR availability (5) Available via ECV Inventory from EUMETSAT.
G12 Gap-analysis of CDR (4) an on-going activity of the Joint CEOS/CGMS Working Group on Climate.
G13 Review of ECV observation networks (4) Addressed in the GCOS Status Report.
G14 Maintain and Improve Coordination (4) This is a central role of the secretariat and the GCOS Steering Committee.
G15 Open Data Policies (2) Despite some progress not all data are openly available. The GCOS Secretariat is supporting the development of new WMO data policies.
G16 Metadata (4) WIGOS metadata standard has been approved and in principle meets the climate needs. Improving metadata is an ongoing task..
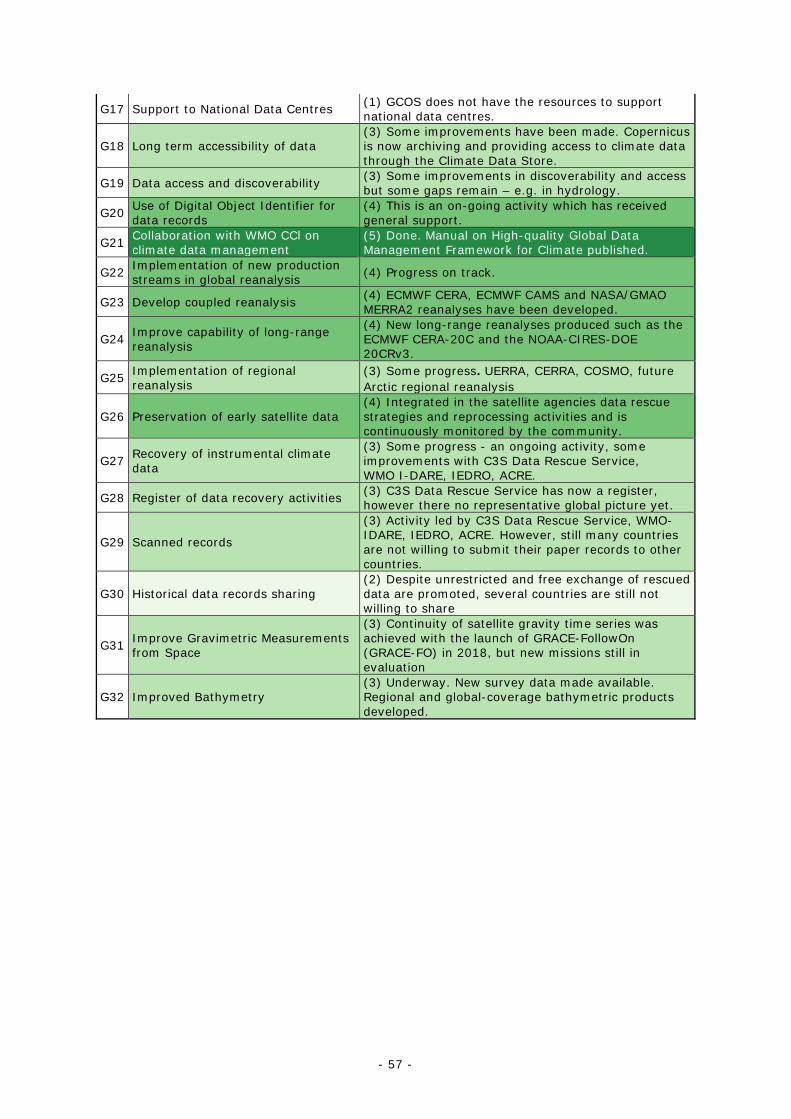
- 57 -
G17 Support to National Data Centres (1) GCOS does not have the resources to support national data centres.
G18 Long term accessibility of data (3) Some improvements have been made. Copernicus is now archiving and providing access to climate data through the Climate Data Store.
G19 Data access and discoverability (3) Some improvements in discoverability and access but some gaps remain – e.g. in hydrology.
G20 Use of Digital Object Identifier for data records
(4) This is an on-going activity which has received general support.
G21 Collaboration with WMO CCl on climate data management
(5) Done. Manual on High-quality Global Data Management Framework for Climate published.
G22 Implementation of new production streams in global reanalysis (4) Progress on track.
G23 Develop coupled reanalysis (4) ECMWF CERA, ECMWF CAMS and NASA/GMAO MERRA2 reanalyses have been developed.
G24 Improve capability of long-range reanalysis
(4) New long-range reanalyses produced such as the ECMWF CERA-20C and the NOAA-CIRES-DOE 20CRv3.
G25 Implementation of regional reanalysis
(3) Some progress. UERRA, CERRA, COSMO, future Arctic regional reanalysis
G26 Preservation of early satellite data (4) Integrated in the satellite agencies data rescue strategies and reprocessing activities and is continuously monitored by the community.
G27 Recovery of instrumental climate data
(3) Some progress - an ongoing activity, some improvements with C3S Data Rescue Service, WMO I-DARE, IEDRO, ACRE.
G28 Register of data recovery activities (3) C3S Data Rescue Service has now a register, however there no representative global picture yet.
G29 Scanned records
(3) Activity led by C3S Data Rescue Service, WMO-IDARE, IEDRO, ACRE. However, still many countries are not willing to submit their paper records to other countries.
G30 Historical data records sharing (2) Despite unrestricted and free exchange of rescued data are promoted, several countries are still not willing to share
G31 Improve Gravimetric Measurements from Space
(3) Continuity of satellite gravity time series was achieved with the launch of GRACE-FollowOn (GRACE-FO) in 2018, but new missions still in evaluation
G32 Improved Bathymetry (3) Underway. New survey data made available. Regional and global-coverage bathymetric products developed.
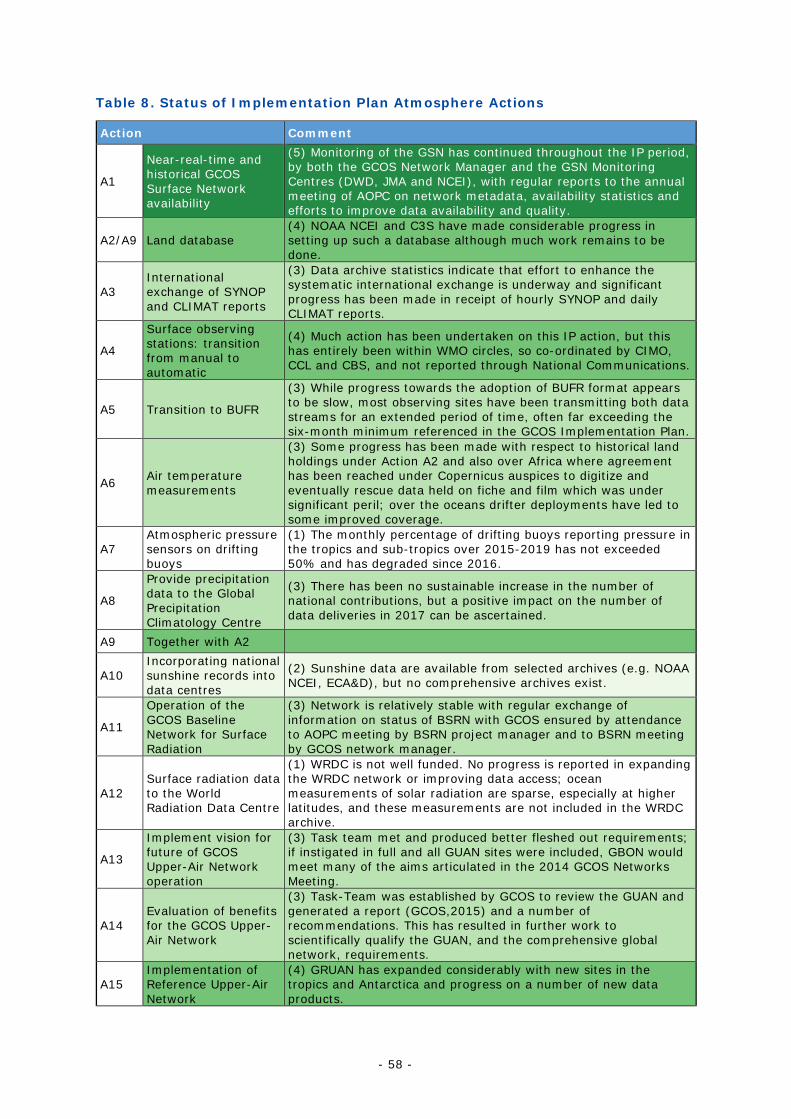
- 58 -
Table 8. Status of Implementation Plan Atmosphere Actions
Action Comment
A1
Near-real-time and historical GCOS Surface Network availability
(5) Monitoring of the GSN has continued throughout the IP period, by both the GCOS Network Manager and the GSN Monitoring Centres (DWD, JMA and NCEI), with regular reports to the annual meeting of AOPC on network metadata, availability statistics and efforts to improve data availability and quality.
A2/A9 Land database (4) NOAA NCEI and C3S have made considerable progress in setting up such a database although much work remains to be done.
A3 International exchange of SYNOP and CLIMAT reports
(3) Data archive statistics indicate that effort to enhance the systematic international exchange is underway and significant progress has been made in receipt of hourly SYNOP and daily CLIMAT reports.
A4
Surface observing stations: transition from manual to automatic
(4) Much action has been undertaken on this IP action, but this has entirely been within WMO circles, so co-ordinated by CIMO, CCL and CBS, and not reported through National Communications.
A5 Transition to BUFR
(3) While progress towards the adoption of BUFR format appears to be slow, most observing sites have been transmitting both data streams for an extended period of time, often far exceeding the six-month minimum referenced in the GCOS Implementation Plan.
A6 Air temperature measurements
(3) Some progress has been made with respect to historical land holdings under Action A2 and also over Africa where agreement has been reached under Copernicus auspices to digitize and eventually rescue data held on fiche and film which was under significant peril; over the oceans drifter deployments have led to some improved coverage.
A7 Atmospheric pressure sensors on drifting buoys
(1) The monthly percentage of drifting buoys reporting pressure in the tropics and sub-tropics over 2015-2019 has not exceeded 50% and has degraded since 2016.
A8
Provide precipitation data to the Global Precipitation Climatology Centre
(3) There has been no sustainable increase in the number of national contributions, but a positive impact on the number of data deliveries in 2017 can be ascertained.
A9 Together with A2
A10 Incorporating national sunshine records into data centres
(2) Sunshine data are available from selected archives (e.g. NOAA NCEI, ECA&D), but no comprehensive archives exist.
A11
Operation of the GCOS Baseline Network for Surface Radiation
(3) Network is relatively stable with regular exchange of information on status of BSRN with GCOS ensured by attendance to AOPC meeting by BSRN project manager and to BSRN meeting by GCOS network manager.
A12 Surface radiation data to the World Radiation Data Centre
(1) WRDC is not well funded. No progress is reported in expanding the WRDC network or improving data access; ocean measurements of solar radiation are sparse, especially at higher latitudes, and these measurements are not included in the WRDC archive.
A13
Implement vision for future of GCOS Upper-Air Network operation
(3) Task team met and produced better fleshed out requirements; if instigated in full and all GUAN sites were included, GBON would meet many of the aims articulated in the 2014 GCOS Networks Meeting.
A14 Evaluation of benefits for the GCOS Upper-Air Network
(3) Task-Team was established by GCOS to review the GUAN and generated a report (GCOS,2015) and a number of recommendations. This has resulted in further work to scientifically qualify the GUAN, and the comprehensive global network, requirements.
A15 Implementation of Reference Upper-Air Network
(4) GRUAN has expanded considerably with new sites in the tropics and Antarctica and progress on a number of new data products.
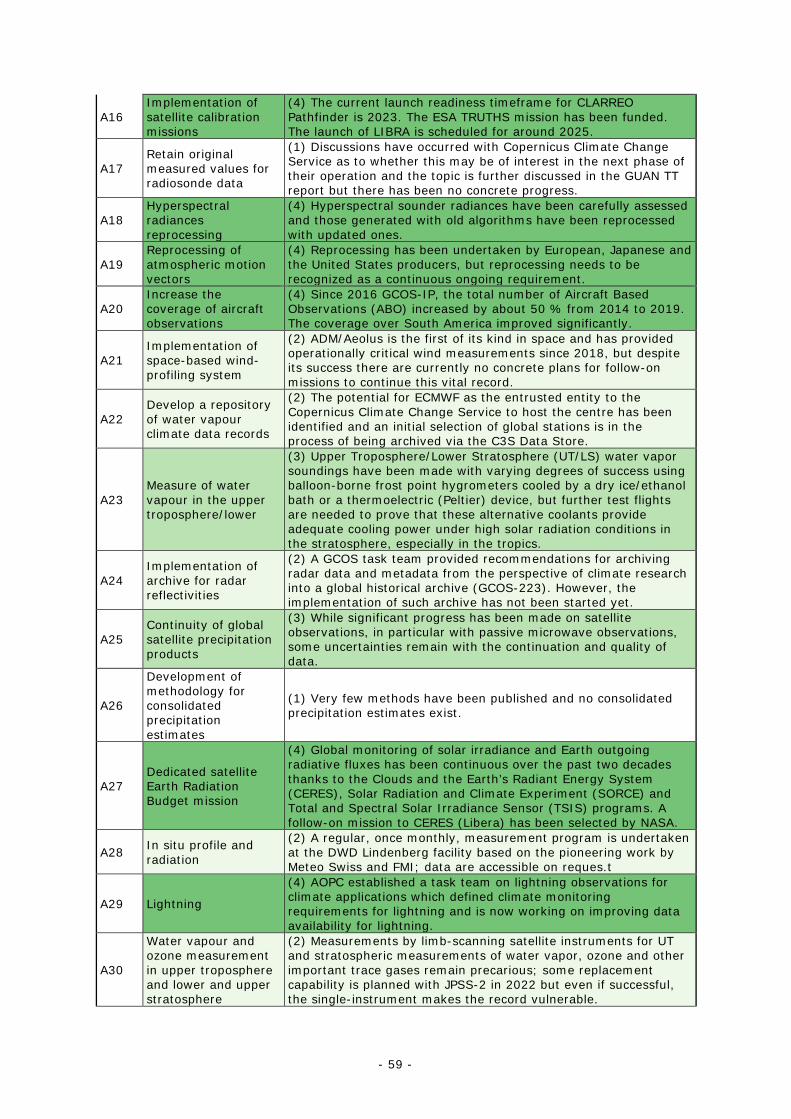
- 59 -
A16 Implementation of satellite calibration missions
(4) The current launch readiness timeframe for CLARREO Pathfinder is 2023. The ESA TRUTHS mission has been funded. The launch of LIBRA is scheduled for around 2025.
A17 Retain original measured values for radiosonde data
(1) Discussions have occurred with Copernicus Climate Change Service as to whether this may be of interest in the next phase of their operation and the topic is further discussed in the GUAN TT report but there has been no concrete progress.
A18 Hyperspectral radiances reprocessing
(4) Hyperspectral sounder radiances have been carefully assessed and those generated with old algorithms have been reprocessed with updated ones.
A19 Reprocessing of atmospheric motion vectors
(4) Reprocessing has been undertaken by European, Japanese and the United States producers, but reprocessing needs to be recognized as a continuous ongoing requirement.
A20 Increase the coverage of aircraft observations
(4) Since 2016 GCOS-IP, the total number of Aircraft Based Observations (ABO) increased by about 50 % from 2014 to 2019. The coverage over South America improved significantly.
A21 Implementation of space-based wind-profiling system
(2) ADM/Aeolus is the first of its kind in space and has provided operationally critical wind measurements since 2018, but despite its success there are currently no concrete plans for follow-on missions to continue this vital record.
A22 Develop a repository of water vapour climate data records
(2) The potential for ECMWF as the entrusted entity to the Copernicus Climate Change Service to host the centre has been identified and an initial selection of global stations is in the process of being archived via the C3S Data Store.
A23 Measure of water vapour in the upper troposphere/lower
(3) Upper Troposphere/Lower Stratosphere (UT/LS) water vapor soundings have been made with varying degrees of success using balloon-borne frost point hygrometers cooled by a dry ice/ethanol bath or a thermoelectric (Peltier) device, but further test flights are needed to prove that these alternative coolants provide adequate cooling power under high solar radiation conditions in the stratosphere, especially in the tropics.
A24 Implementation of archive for radar reflectivities
(2) A GCOS task team provided recommendations for archiving radar data and metadata from the perspective of climate research into a global historical archive (GCOS-223). However, the implementation of such archive has not been started yet.
A25 Continuity of global satellite precipitation products
(3) While significant progress has been made on satellite observations, in particular with passive microwave observations, some uncertainties remain with the continuation and quality of data.
A26
Development of methodology for consolidated precipitation estimates
(1) Very few methods have been published and no consolidated precipitation estimates exist.
A27 Dedicated satellite Earth Radiation Budget mission
(4) Global monitoring of solar irradiance and Earth outgoing radiative fluxes has been continuous over the past two decades thanks to the Clouds and the Earth’s Radiant Energy System (CERES), Solar Radiation and Climate Experiment (SORCE) and Total and Spectral Solar Irradiance Sensor (TSIS) programs. A follow-on mission to CERES (Libera) has been selected by NASA.
A28 In situ profile and radiation
(2) A regular, once monthly, measurement program is undertaken at the DWD Lindenberg facility based on the pioneering work by Meteo Swiss and FMI; data are accessible on reques.t
A29 Lightning
(4) AOPC established a task team on lightning observations for climate applications which defined climate monitoring requirements for lightning and is now working on improving data availability for lightning.
A30
Water vapour and ozone measurement in upper troposphere and lower and upper stratosphere
(2) Measurements by limb-scanning satellite instruments for UT and stratospheric measurements of water vapor, ozone and other important trace gases remain precarious; some replacement capability is planned with JPSS-2 in 2022 but even if successful, the single-instrument makes the record vulnerable.
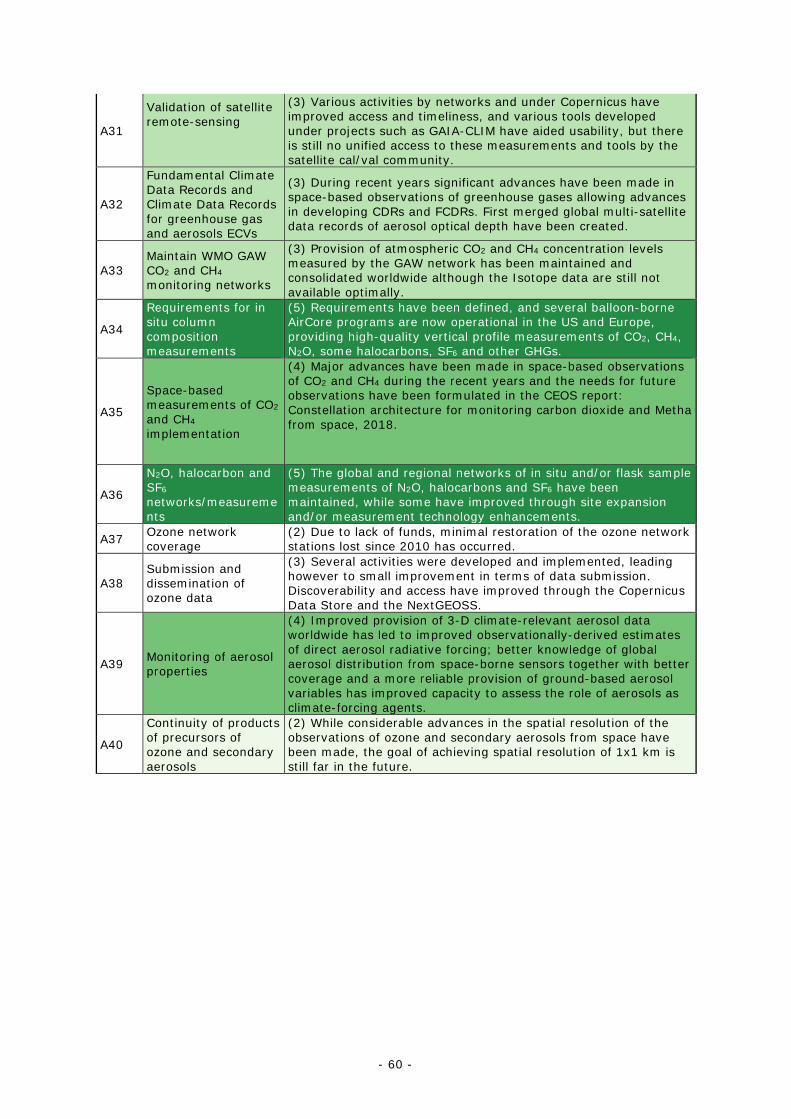
- 60 -
A31
Validation of satellite remote-sensing
(3) Various activities by networks and under Copernicus have improved access and timeliness, and various tools developed under projects such as GAIA-CLIM have aided usability, but there is still no unified access to these measurements and tools by the satellite cal/val community.
A32
Fundamental Climate Data Records and Climate Data Records for greenhouse gas and aerosols ECVs
(3) During recent years significant advances have been made in space-based observations of greenhouse gases allowing advances in developing CDRs and FCDRs. First merged global multi-satellite data records of aerosol optical depth have been created.
A33 Maintain WMO GAW CO2 and CH4 monitoring networks
(3) Provision of atmospheric CO2 and CH4 concentration levels measured by the GAW network has been maintained and consolidated worldwide although the Isotope data are still not available optimally.
A34
Requirements for in situ column composition measurements
(5) Requirements have been defined, and several balloon-borne AirCore programs are now operational in the US and Europe, providing high-quality vertical profile measurements of CO2, CH4, N2O, some halocarbons, SF6 and other GHGs.
A35
Space-based measurements of CO2 and CH4 implementation
(4) Major advances have been made in space-based observations of CO2 and CH4 during the recent years and the needs for future observations have been formulated in the CEOS report: Constellation architecture for monitoring carbon dioxide and Metha from space, 2018.
A36
N2O, halocarbon and SF6
networks/measurements
(5) The global and regional networks of in situ and/or flask sample measurements of N2O, halocarbons and SF6 have been maintained, while some have improved through site expansion and/or measurement technology enhancements.
A37 Ozone network coverage
(2) Due to lack of funds, minimal restoration of the ozone network stations lost since 2010 has occurred.
A38 Submission and dissemination of ozone data
(3) Several activities were developed and implemented, leading however to small improvement in terms of data submission. Discoverability and access have improved through the Copernicus Data Store and the NextGEOSS.
A39 Monitoring of aerosol properties
(4) Improved provision of 3-D climate-relevant aerosol data worldwide has led to improved observationally-derived estimates of direct aerosol radiative forcing; better knowledge of global aerosol distribution from space-borne sensors together with better coverage and a more reliable provision of ground-based aerosol variables has improved capacity to assess the role of aerosols as climate-forcing agents.
A40
Continuity of products of precursors of ozone and secondary aerosols
(2) While considerable advances in the spatial resolution of the observations of ozone and secondary aerosols from space have been made, the goal of achieving spatial resolution of 1x1 km is still far in the future.
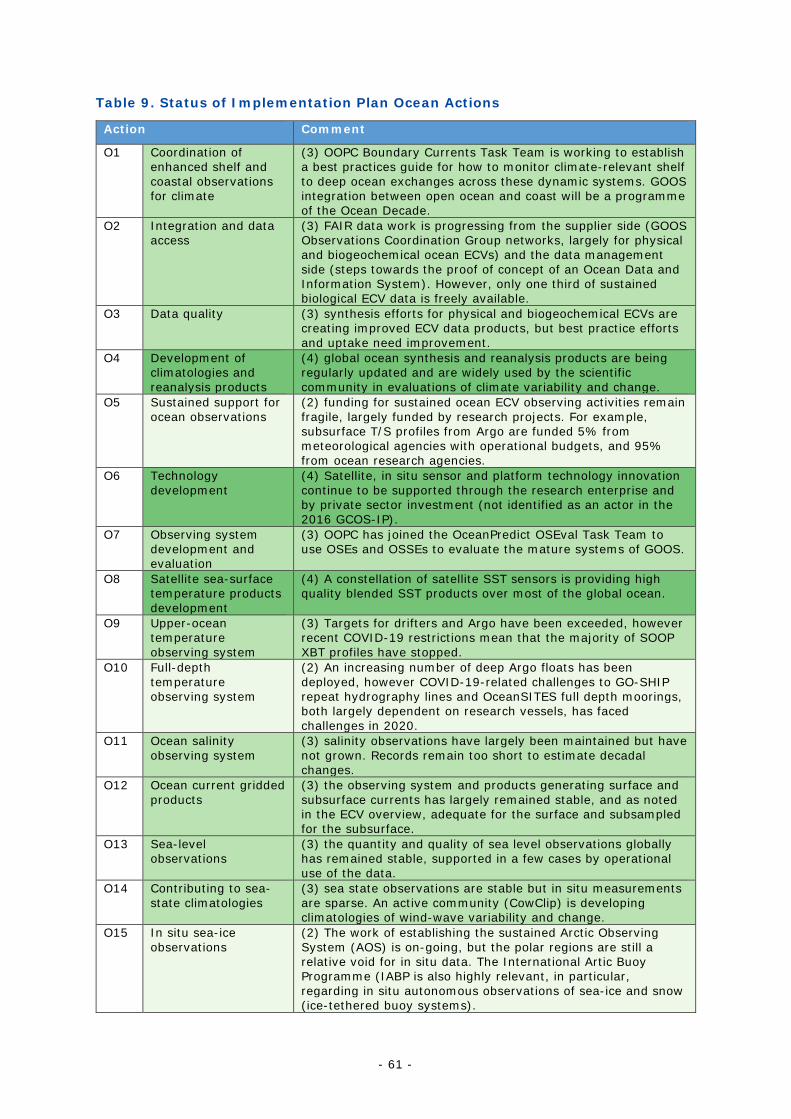
- 61 -
Table 9. Status of Implementation Plan Ocean Actions
Action Comment
O1 Coordination of enhanced shelf and coastal observations for climate
(3) OOPC Boundary Currents Task Team is working to establish a best practices guide for how to monitor climate-relevant shelf to deep ocean exchanges across these dynamic systems. GOOS integration between open ocean and coast will be a programme of the Ocean Decade.
O2 Integration and data access
(3) FAIR data work is progressing from the supplier side (GOOS Observations Coordination Group networks, largely for physical and biogeochemical ocean ECVs) and the data management side (steps towards the proof of concept of an Ocean Data and Information System). However, only one third of sustained biological ECV data is freely available.
O3 Data quality (3) synthesis efforts for physical and biogeochemical ECVs are creating improved ECV data products, but best practice efforts and uptake need improvement.
O4 Development of climatologies and reanalysis products
(4) global ocean synthesis and reanalysis products are being regularly updated and are widely used by the scientific community in evaluations of climate variability and change.
O5 Sustained support for ocean observations
(2) funding for sustained ocean ECV observing activities remain fragile, largely funded by research projects. For example, subsurface T/S profiles from Argo are funded 5% from meteorological agencies with operational budgets, and 95% from ocean research agencies.
O6 Technology development
(4) Satellite, in situ sensor and platform technology innovation continue to be supported through the research enterprise and by private sector investment (not identified as an actor in the 2016 GCOS-IP).
O7 Observing system development and evaluation
(3) OOPC has joined the OceanPredict OSEval Task Team to use OSEs and OSSEs to evaluate the mature systems of GOOS.
O8 Satellite sea-surface temperature products development
(4) A constellation of satellite SST sensors is providing high quality blended SST products over most of the global ocean.
O9 Upper-ocean temperature observing system
(3) Targets for drifters and Argo have been exceeded, however recent COVID-19 restrictions mean that the majority of SOOP XBT profiles have stopped.
O10 Full-depth temperature observing system
(2) An increasing number of deep Argo floats has been deployed, however COVID-19-related challenges to GO-SHIP repeat hydrography lines and OceanSITES full depth moorings, both largely dependent on research vessels, has faced challenges in 2020.
O11 Ocean salinity observing system
(3) salinity observations have largely been maintained but have not grown. Records remain too short to estimate decadal changes.
O12 Ocean current gridded products
(3) the observing system and products generating surface and subsurface currents has largely remained stable, and as noted in the ECV overview, adequate for the surface and subsampled for the subsurface.
O13 Sea-level observations
(3) the quantity and quality of sea level observations globally has remained stable, supported in a few cases by operational use of the data.
O14 Contributing to sea-state climatologies
(3) sea state observations are stable but in situ measurements are sparse. An active community (CowClip) is developing climatologies of wind-wave variability and change.
O15 In situ sea-ice observations
(2) The work of establishing the sustained Arctic Observing System (AOS) is on-going, but the polar regions are still a relative void for in situ data. The International Artic Buoy Programme (IABP is also highly relevant, in particular, regarding in situ autonomous observations of sea-ice and snow (ice-tethered buoy systems).
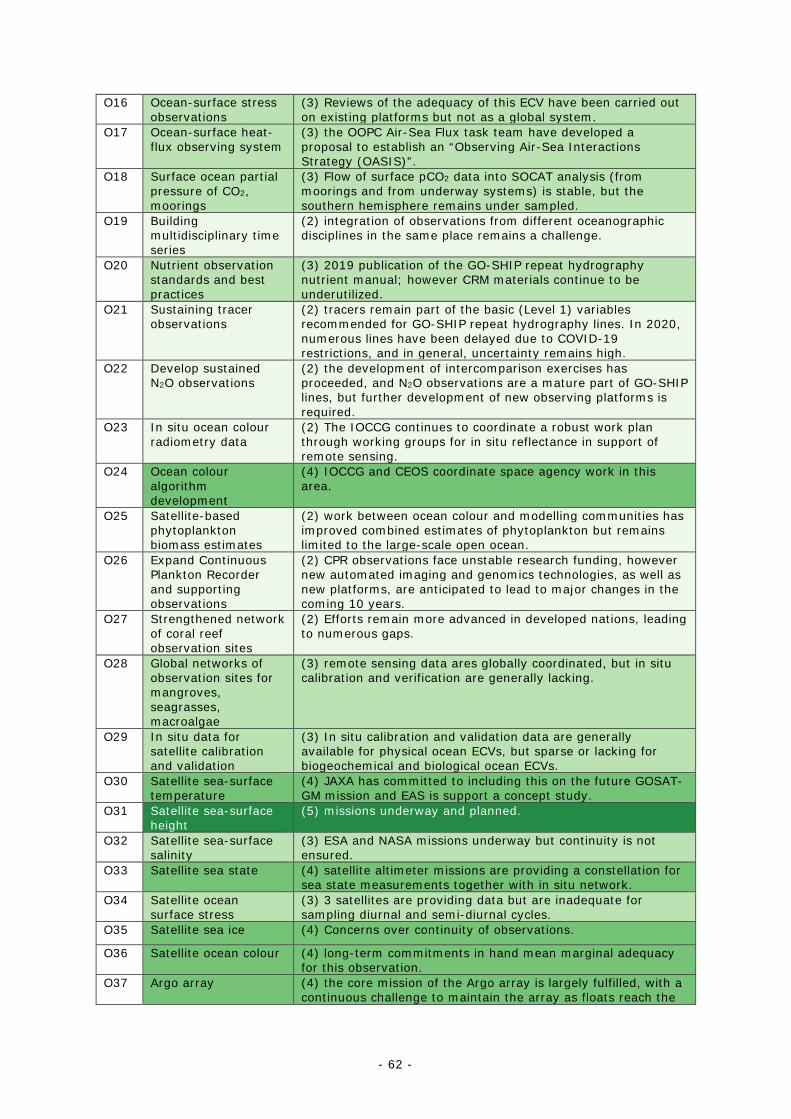
- 62 -
O16 Ocean-surface stress observations
(3) Reviews of the adequacy of this ECV have been carried out on existing platforms but not as a global system.
O17 Ocean-surface heat-flux observing system
(3) the OOPC Air-Sea Flux task team have developed a proposal to establish an “Observing Air-Sea Interactions Strategy (OASIS)”.
O18 Surface ocean partial pressure of CO2, moorings
(3) Flow of surface pCO2 data into SOCAT analysis (from moorings and from underway systems) is stable, but the southern hemisphere remains under sampled.
O19 Building multidisciplinary time series
(2) integration of observations from different oceanographic disciplines in the same place remains a challenge.
O20 Nutrient observation standards and best practices
(3) 2019 publication of the GO-SHIP repeat hydrography nutrient manual; however CRM materials continue to be underutilized.
O21 Sustaining tracer observations
(2) tracers remain part of the basic (Level 1) variables recommended for GO-SHIP repeat hydrography lines. In 2020, numerous lines have been delayed due to COVID-19 restrictions, and in general, uncertainty remains high.
O22 Develop sustained N2O observations
(2) the development of intercomparison exercises has proceeded, and N2O observations are a mature part of GO-SHIP lines, but further development of new observing platforms is required.
O23 In situ ocean colour radiometry data
(2) The IOCCG continues to coordinate a robust work plan through working groups for in situ reflectance in support of remote sensing.
O24 Ocean colour algorithm development
(4) IOCCG and CEOS coordinate space agency work in this area.
O25 Satellite-based phytoplankton biomass estimates
(2) work between ocean colour and modelling communities has improved combined estimates of phytoplankton but remains limited to the large-scale open ocean.
O26 Expand Continuous Plankton Recorder and supporting observations
(2) CPR observations face unstable research funding, however new automated imaging and genomics technologies, as well as new platforms, are anticipated to lead to major changes in the coming 10 years.
O27 Strengthened network of coral reef observation sites
(2) Efforts remain more advanced in developed nations, leading to numerous gaps.
O28 Global networks of observation sites for mangroves, seagrasses, macroalgae
(3) remote sensing data ares globally coordinated, but in situ calibration and verification are generally lacking.
O29 In situ data for satellite calibration and validation
(3) In situ calibration and validation data are generally available for physical ocean ECVs, but sparse or lacking for biogeochemical and biological ocean ECVs.
O30 Satellite sea-surface temperature
(4) JAXA has committed to including this on the future GOSAT-GM mission and EAS is support a concept study.
O31 Satellite sea-surface height
(5) missions underway and planned.
O32 Satellite sea-surface salinity
(3) ESA and NASA missions underway but continuity is not ensured.
O33 Satellite sea state (4) satellite altimeter missions are providing a constellation for sea state measurements together with in situ network.
O34 Satellite ocean surface stress
(3) 3 satellites are providing data but are inadequate for sampling diurnal and semi-diurnal cycles.
O35 Satellite sea ice (4) Concerns over continuity of observations.
O36 Satellite ocean colour (4) long-term commitments in hand mean marginal adequacy for this observation.
O37 Argo array (4) the core mission of the Argo array is largely fulfilled, with a continuous challenge to maintain the array as floats reach the
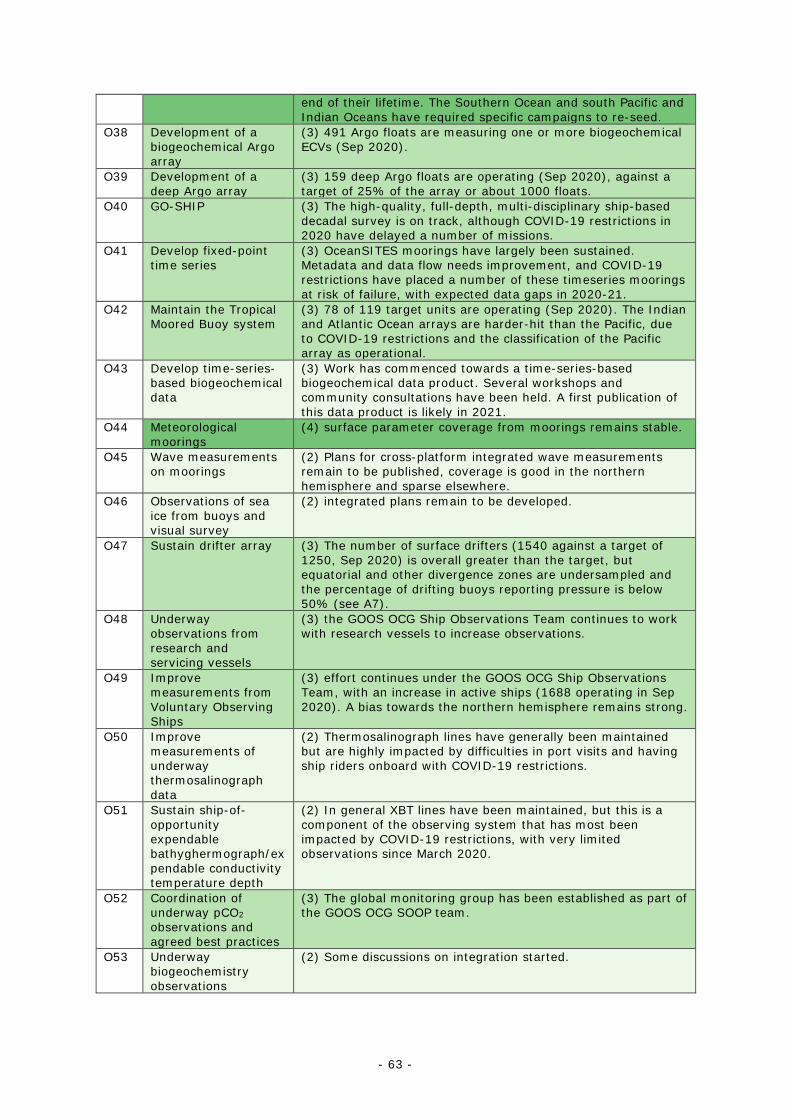
- 63 -
end of their lifetime. The Southern Ocean and south Pacific and Indian Oceans have required specific campaigns to re-seed.
O38 Development of a biogeochemical Argo array
(3) 491 Argo floats are measuring one or more biogeochemical ECVs (Sep 2020).
O39 Development of a deep Argo array
(3) 159 deep Argo floats are operating (Sep 2020), against a target of 25% of the array or about 1000 floats.
O40 GO-SHIP (3) The high-quality, full-depth, multi-disciplinary ship-based decadal survey is on track, although COVID-19 restrictions in 2020 have delayed a number of missions.
O41 Develop fixed-point time series
(3) OceanSITES moorings have largely been sustained. Metadata and data flow needs improvement, and COVID-19 restrictions have placed a number of these timeseries moorings at risk of failure, with expected data gaps in 2020-21.
O42 Maintain the Tropical Moored Buoy system
(3) 78 of 119 target units are operating (Sep 2020). The Indian and Atlantic Ocean arrays are harder-hit than the Pacific, due to COVID-19 restrictions and the classification of the Pacific array as operational.
O43 Develop time-series-based biogeochemical data
(3) Work has commenced towards a time-series-based biogeochemical data product. Several workshops and community consultations have been held. A first publication of this data product is likely in 2021.
O44 Meteorological moorings
(4) surface parameter coverage from moorings remains stable.
O45 Wave measurements on moorings
(2) Plans for cross-platform integrated wave measurements remain to be published, coverage is good in the northern hemisphere and sparse elsewhere.
O46 Observations of sea ice from buoys and visual survey
(2) integrated plans remain to be developed.
O47 Sustain drifter array (3) The number of surface drifters (1540 against a target of 1250, Sep 2020) is overall greater than the target, but equatorial and other divergence zones are undersampled and the percentage of drifting buoys reporting pressure is below 50% (see A7).
O48 Underway observations from research and servicing vessels
(3) the GOOS OCG Ship Observations Team continues to work with research vessels to increase observations.
O49 Improve measurements from Voluntary Observing Ships
(3) effort continues under the GOOS OCG Ship Observations Team, with an increase in active ships (1688 operating in Sep 2020). A bias towards the northern hemisphere remains strong.
O50 Improve measurements of underway thermosalinograph data
(2) Thermosalinograph lines have generally been maintained but are highly impacted by difficulties in port visits and having ship riders onboard with COVID-19 restrictions.
O51 Sustain ship-of-opportunity expendable bathyghermograph/expendable conductivity temperature depth
(2) In general XBT lines have been maintained, but this is a component of the observing system that has most been impacted by COVID-19 restrictions, with very limited observations since March 2020.
O52 Coordination of underway pCO2 observations and agreed best practices
(3) The global monitoring group has been established as part of the GOOS OCG SOOP team.
O53 Underway biogeochemistry observations
(2) Some discussions on integration started.
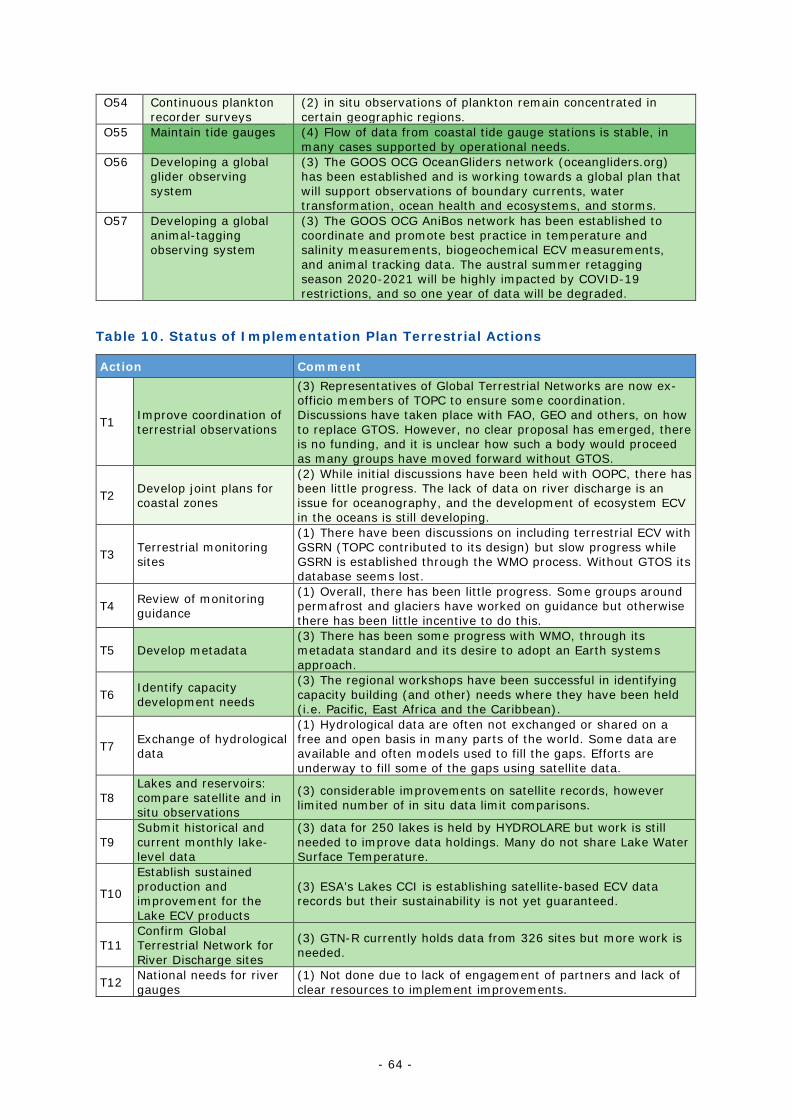
- 64 -
O54 Continuous plankton recorder surveys
(2) in situ observations of plankton remain concentrated in certain geographic regions.
O55 Maintain tide gauges (4) Flow of data from coastal tide gauge stations is stable, in many cases supported by operational needs.
O56 Developing a global glider observing system
(3) The GOOS OCG OceanGliders network (oceangliders.org) has been established and is working towards a global plan that will support observations of boundary currents, water transformation, ocean health and ecosystems, and storms.
O57 Developing a global animal-tagging observing system
(3) The GOOS OCG AniBos network has been established to coordinate and promote best practice in temperature and salinity measurements, biogeochemical ECV measurements, and animal tracking data. The austral summer retagging season 2020-2021 will be highly impacted by COVID-19 restrictions, and so one year of data will be degraded.
Table 10. Status of Implementation Plan Terrestrial Actions
Action Comment
T1 Improve coordination of terrestrial observations
(3) Representatives of Global Terrestrial Networks are now ex-officio members of TOPC to ensure some coordination. Discussions have taken place with FAO, GEO and others, on how to replace GTOS. However, no clear proposal has emerged, there is no funding, and it is unclear how such a body would proceed as many groups have moved forward without GTOS.
T2 Develop joint plans for coastal zones
(2) While initial discussions have been held with OOPC, there has been little progress. The lack of data on river discharge is an issue for oceanography, and the development of ecosystem ECV in the oceans is still developing.
T3 Terrestrial monitoring sites
(1) There have been discussions on including terrestrial ECV with GSRN (TOPC contributed to its design) but slow progress while GSRN is established through the WMO process. Without GTOS its database seems lost.
T4 Review of monitoring guidance
(1) Overall, there has been little progress. Some groups around permafrost and glaciers have worked on guidance but otherwise there has been little incentive to do this.
T5 Develop metadata (3) There has been some progress with WMO, through its metadata standard and its desire to adopt an Earth systems approach.
T6 Identify capacity development needs
(3) The regional workshops have been successful in identifying capacity building (and other) needs where they have been held (i.e. Pacific, East Africa and the Caribbean).
T7 Exchange of hydrological data
(1) Hydrological data are often not exchanged or shared on a free and open basis in many parts of the world. Some data are available and often models used to fill the gaps. Efforts are underway to fill some of the gaps using satellite data.
T8 Lakes and reservoirs: compare satellite and in situ observations
(3) considerable improvements on satellite records, however limited number of in situ data limit comparisons.
T9 Submit historical and current monthly lake-level data
(3) data for 250 lakes is held by HYDROLARE but work is still needed to improve data holdings. Many do not share Lake Water Surface Temperature.
T10
Establish sustained production and improvement for the Lake ECV products
(3) ESA’s Lakes CCI is establishing satellite-based ECV data records but their sustainability is not yet guaranteed.
T11 Confirm Global Terrestrial Network for River Discharge sites
(3) GTN-R currently holds data from 326 sites but more work is needed.
T12 National needs for river gauges
(1) Not done due to lack of engagement of partners and lack of clear resources to implement improvements.
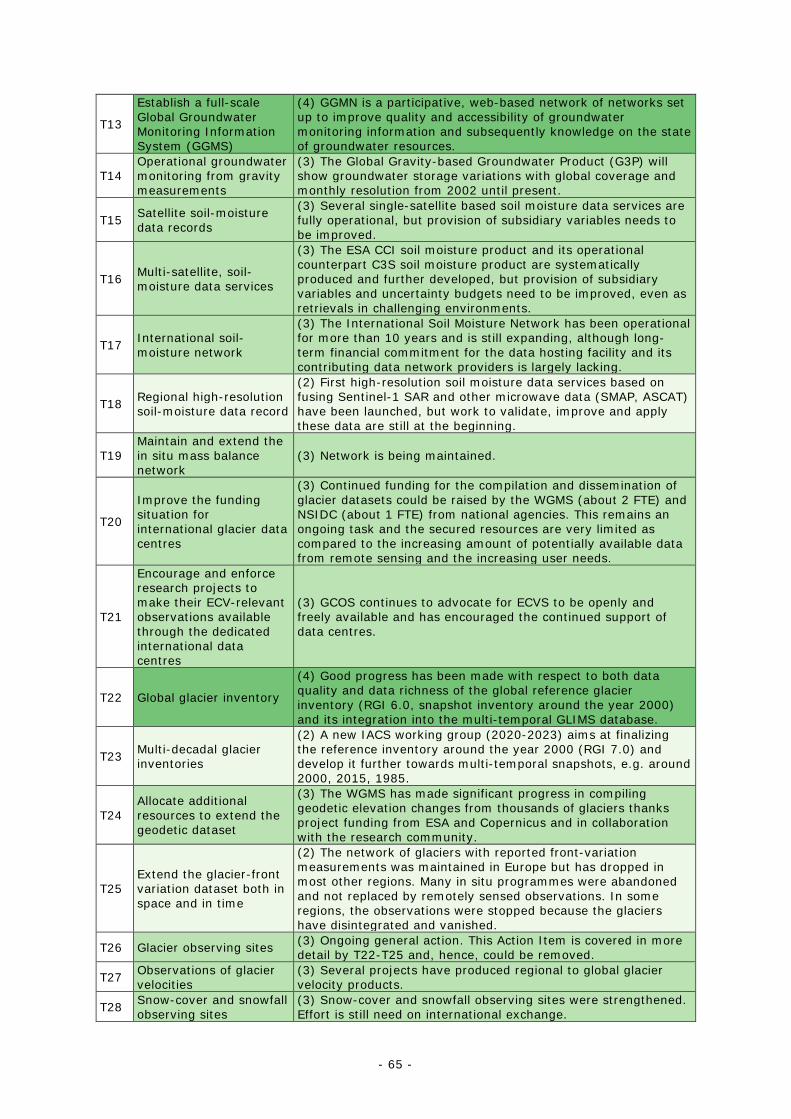
- 65 -
T13
Establish a full-scale Global Groundwater Monitoring Information System (GGMS)
(4) GGMN is a participative, web-based network of networks set up to improve quality and accessibility of groundwater monitoring information and subsequently knowledge on the state of groundwater resources.
T14 Operational groundwater monitoring from gravity measurements
(3) The Global Gravity-based Groundwater Product (G3P) will show groundwater storage variations with global coverage and monthly resolution from 2002 until present.
T15 Satellite soil-moisture data records
(3) Several single-satellite based soil moisture data services are fully operational, but provision of subsidiary variables needs to be improved.
T16 Multi-satellite, soil-moisture data services
(3) The ESA CCI soil moisture product and its operational counterpart C3S soil moisture product are systematically produced and further developed, but provision of subsidiary variables and uncertainty budgets need to be improved, even as retrievals in challenging environments.
T17 International soil-moisture network
(3) The International Soil Moisture Network has been operational for more than 10 years and is still expanding, although long-term financial commitment for the data hosting facility and its contributing data network providers is largely lacking.
T18 Regional high-resolution soil-moisture data record
(2) First high-resolution soil moisture data services based on fusing Sentinel-1 SAR and other microwave data (SMAP, ASCAT) have been launched, but work to validate, improve and apply these data are still at the beginning.
T19 Maintain and extend the in situ mass balance network
(3) Network is being maintained.
T20
Improve the funding situation for international glacier data centres
(3) Continued funding for the compilation and dissemination of glacier datasets could be raised by the WGMS (about 2 FTE) and NSIDC (about 1 FTE) from national agencies. This remains an ongoing task and the secured resources are very limited as compared to the increasing amount of potentially available data from remote sensing and the increasing user needs.
T21
Encourage and enforce research projects to make their ECV-relevant observations available through the dedicated international data centres
(3) GCOS continues to advocate for ECVS to be openly and freely available and has encouraged the continued support of data centres.
T22 Global glacier inventory
(4) Good progress has been made with respect to both data quality and data richness of the global reference glacier inventory (RGI 6.0, snapshot inventory around the year 2000) and its integration into the multi-temporal GLIMS database.
T23 Multi-decadal glacier inventories
(2) A new IACS working group (2020-2023) aims at finalizing the reference inventory around the year 2000 (RGI 7.0) and develop it further towards multi-temporal snapshots, e.g. around 2000, 2015, 1985.
T24 Allocate additional resources to extend the geodetic dataset
(3) The WGMS has made significant progress in compiling geodetic elevation changes from thousands of glaciers thanks project funding from ESA and Copernicus and in collaboration with the research community.
T25 Extend the glacier-front variation dataset both in space and in time
(2) The network of glaciers with reported front-variation measurements was maintained in Europe but has dropped in most other regions. Many in situ programmes were abandoned and not replaced by remotely sensed observations. In some regions, the observations were stopped because the glaciers have disintegrated and vanished.
T26 Glacier observing sites (3) Ongoing general action. This Action Item is covered in more detail by T22-T25 and, hence, could be removed.
T27 Observations of glacier velocities
(3) Several projects have produced regional to global glacier velocity products.
T28 Snow-cover and snowfall observing sites
(3) Snow-cover and snowfall observing sites were strengthened. Effort is still need on international exchange.
- 66 -
T29 Integrated analyses of snow
(4) Datasets produced by Aqua/Terra MODIS, AMSR-E, DMSP SSM/I, SSMI/S and POES-AVHRR with global coverage
T30 Ice-sheet measurements (4) Ice sheet measurement has progressed and providing useful field data but more comprehensive measurements of process are expected.
T31 Ice-sheet model improvement
(4) There are still uncertainty of ice sheet behaviour. More improvement of Ice modelling is expected to answer to the strong concern on the sea level rise.
T32 Continuity of laser, altimetry and gravity satellite missions
(4) Laser, altimetry and gravity satellite missions have been provided very useful observation data to monitor ice sheet change. For continuity of each observation, satellite programs should be coordinated internationally.
T33 Standards and practices for permafrost
(2) A working group on “Best practice for permafrost measurement” was set up within GCW in May-June 2020.
T34 Mapping of seasonal soil freeze/thaw (1) No action undertaken by GTN-P.
T35 Ensure the consistency of the various radiant energy fluxes
(3) Significant progress occurred in modelling and retrieval methodology, but efforts are still needed to provide operational data.
T36 Climate change indicators for adaptation
(4) TOPC has initiated a methodology of assessing current terrestrial ECVs as either being not relevant for adaptation, observations of adaptation, or observations for adaptation.
T37 Quality of ground-based reference sites for FAPAR and LAI
(4) Quality of ground-based measurements was improved with an increase number of sites.
T38 Improve snow and ice albedo products
(2) Little progress has been seen to improve quality of snow (ice and sea ice) albedo products.
T39 Improve in situ albedo measurements
(3) Only shortwave broadband albedo were provided over few sites. Progress for the protocol.
T40 Production of climate data records for LAI, FAPAR and Albedo
(4) Generation of 10-days global FAPAR and LAI products were operational provided from 300 m to few deg. No significant progress for higher resolution. Limitation of availability for past data.
T41 Evaluate LAI, FAPAR and Albedo
(4) Benchmarking of existing operational products were done and some used also fiducial ground measurements.
T42 Land-surface temperature: in situ protocols
(5) The CEOS-LPV Group have produced a LST Validation Best Practices Guide.
T43 Production of land-surface temperature datasets
(4) Space Agencies continue to produce LST data in near-real time in support of the long term archives.
T44 Reprocessing land-surface temperature
(3) Recent projects, such as ESA’s LST CCI, EUMETSAT’s CM SAF TCDRs, and NASA’s MEaSUREs, are producing first long-term Climate Data Records with consistent algorithms.
T45 Land-surface temperature in situ network expansion
(3) Major recent projects have started to expand the network of LST stations with publicly accessible data. There remains a need for in situ sites with well characterized emissivity.
T46 Land-surface temperature radiometric calibration
(3) Development of Fundamental Climate Data Records and establishment of fully traceable routes.
T47 Land-cover experts
(3) Important progress towards the development and update of independent global land cover reference dataset, but limited progress on expanding to land use/management issues due to limited funding for international coordination.
T48 Annual land-cover products
(3) Some products available, e.g. the Copernicus Global Land Service provides land cover at a 100 m resolution updated annually.
T49 Land-cover change (4) Annual land cover change at 300 m is provided by LC-CCI and the Copernicus climate service.
T50 Land-cover community consensus
(3) Important progress in the dialog between data users and producers on the needs and opportunities to better integrate
- 67 -
land management information, but production of such data are still in initial stage.
T51 Deforestation (3) Annual global tree cover loss data are being produced regularly, but does not provide estimates of deforestation (according to FAO definition).
T52 Collaboration on above ground biomass
(3) A recent meeting at the International Space Science Institute ISSI has been important for collaboration and inter-calibration.
T53 Above-ground biomass validation strategies
(3) A CEOS LPV biomass calibration and validation protocol has been developed.
T54 Above-ground biomass validation sites
(3) Several initiatives are progressing in compiling and assessing the quality of biomass reference data for global ECV calibration and validation purposes.
T55 Above-ground biomass data access (2) Some initial datasets are becoming available.
T56 Above-ground biomass: forest inventories
(2) Country NFI capacities for biomass estimation are improving and more data are becoming available for global purposes, but so far little integration with global monitoring efforts.
T57 Soil carbon: carbon mapping (3) a new global; soil carbon map is available.
T58 Soil-carbon change (2) despite maps being updated there is little progress on monitoring changes.
T59 Soil carbon – histosols (2) national soil carbon observations are contribution to improved global maps.
T60 Historic fire data (3) some activity on this topic by research organizations and government funded organizations.
T61 Operational global burned area and fire radiative power
(3) Production of operational fire products continue at the global scale (with a number of other products available for selected regions and limited time periods).
T62 Fire maps (3) while global maps are available and well curated the associated errors are still too large.
T63 Fire validation
(4) Work funded by the European Space Agency and the Copernicus programmes has supported a statistically robust sampling framework for the collection of reference data from higher resolution sensors for validation.
T64 Fire disturbance model development
(3) consolidated activity within the ESA CCI project. There is further use of Fire Disturbance Products in the GFAS and GFED (not recently updated) products.
T65 Anthropogenic water use (4) This has been done as much as possible, within the constraints of the data set itself.
T66 Pilot projects: anthropogenic water use
(1) This action has not yet been initiated, but might be able to be moved to #2 or #3 status before submission of the Status Report in late 2020.
T67
Improve global estimates of anthropogenic greenhouse-gas emissions
(4) Significant progress has been made but more work is needed to lower uncertainties and improve coverage.
T68
Use of satellites for Land use, land-use change and forestry emissions/removals
(3) Satellite imagery is routinely used to monitor forest emissions and removals.
T69 Research on the land sink
(3) Research is on-going to refine the understanding of the land sink. A paper on the carbon cycle as a whole is being prepared.
T70 Use of Inverse modelling techniques to support emission inventories
(4) Techniques are being refined, with continental scale estimates. National fluxes estimated for many countries.
T71 Prepare for a carbon-monitoring system
(5) Preparations are well developed with The CEOS report and the EU with ESA, ECMWF and EUMETSAT are setting up a CO2 Monitoring and Verification Support (MVS) Capacity.
T72 Prepare for a latent and sensible heat flux ECV (5) This was agreed by the steering committee to be a new ECV.
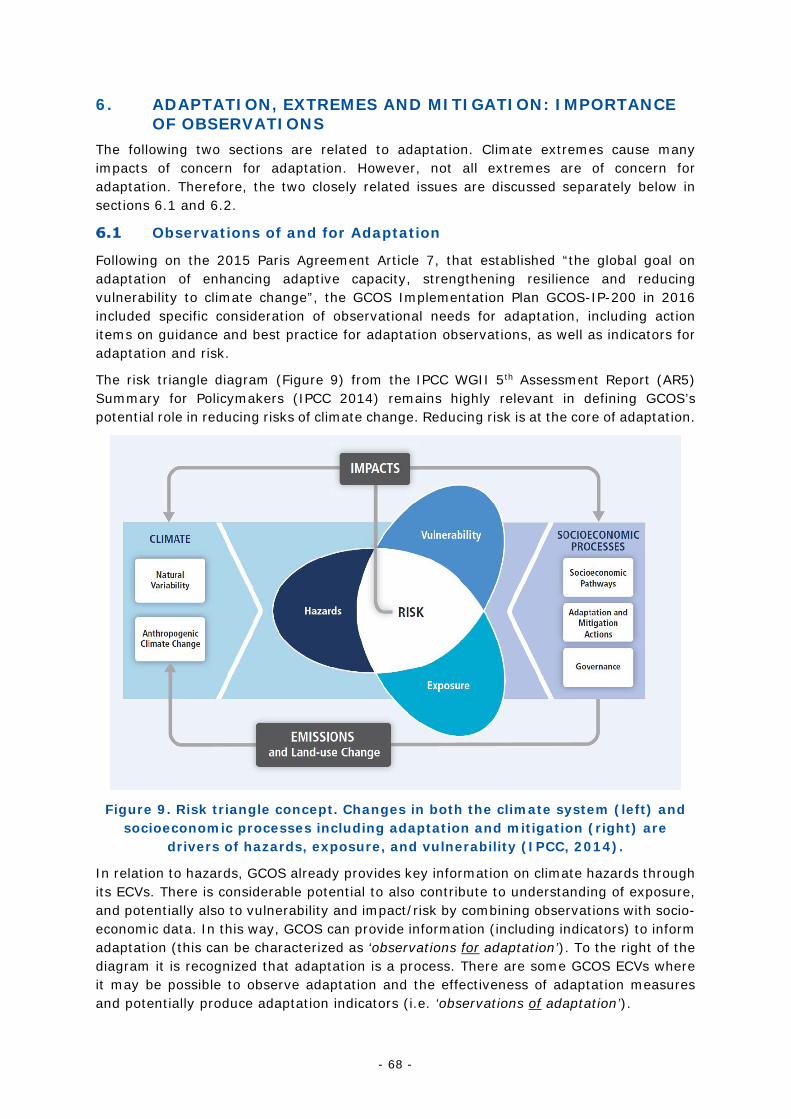
- 68 -
6. ADAPTATION, EXTREMES AND MITIGATION: IMPORTANCE OF OBSERVATIONS
The following two sections are related to adaptation. Climate extremes cause many impacts of concern for adaptation. However, not all extremes are of concern for adaptation. Therefore, the two closely related issues are discussed separately below in sections 6.1 and 6.2.
Observations of and for Adaptation
Following on the 2015 Paris Agreement Article 7, that established “the global goal on adaptation of enhancing adaptive capacity, strengthening resilience and reducing vulnerability to climate change”, the GCOS Implementation Plan GCOS-IP-200 in 2016 included specific consideration of observational needs for adaptation, including action items on guidance and best practice for adaptation observations, as well as indicators for adaptation and risk.
The risk triangle diagram (Figure 9) from the IPCC WGII 5th Assessment Report (AR5) Summary for Policymakers (IPCC 2014) remains highly relevant in defining GCOS’s potential role in reducing risks of climate change. Reducing risk is at the core of adaptation.
Figure 9. Risk triangle concept. Changes in both the climate system (left) and socioeconomic processes including adaptation and mitigation (right) are
drivers of hazards, exposure, and vulnerability (IPCC, 2014).
In relation to hazards, GCOS already provides key information on climate hazards through its ECVs. There is considerable potential to also contribute to understanding of exposure, and potentially also to vulnerability and impact/risk by combining observations with socio-economic data. In this way, GCOS can provide information (including indicators) to inform adaptation (this can be characterized as ‘observations for adaptation’). To the right of the diagram it is recognized that adaptation is a process. There are some GCOS ECVs where it may be possible to observe adaptation and the effectiveness of adaptation measures and potentially produce adaptation indicators (i.e. ‘observations of adaptation’).
- 69 -
To elaborate, observations to inform adaptation (observations for adaptation) include ECV products that can provide key information about climate hazards and links to exposure, vulnerability and ultimately risk. A clear example of this is the provision of geospatial data relevant to bio-geophysical modelling in support of adaptation, e.g. input to regional climate models, agro-ecological models, coastal and flood risk models. Relevant ECV products would be those that relate, for example, to sea-level rise, surface albedo, soil moisture, land use-land cover change (LULCC), storms intensity, marine and continental heatwaves. Another example would be the provision of geospatial data inputs such as DEM to improve understanding of the spatial dimensions of climate change impacts and adaptation imperatives. ECV products can measure either exposure (e.g. distributions of developed land subject to climate hazards) and hazards (e.g. floods arising from precipitation).
On the other hand, some existing ECV products could be used to extract information on the socio-temporal development of adaptation (observations of adaptation), for a limited number of examples. Relevant ECV products would be those that, for example, show shifts in LULCC reflecting shifts in agricultural patterns in response to climate drivers, shifts in settlements away from coasts in response to sea-level rise, shifting patterns of prescribed burning in response to climate change.
It should be noted that it may also be possible to add new products to provide more direct observations of human adaptation to climate change, for certain sectors. For example, while remote sensing (“land cover”) can track green cover in cities or other urban metrics reflecting adaptation32, national budgets for adaptation, investment in coastal defences, and so on. These metrics may be socio-economic rather than climate/physical. The best way for GCOS to deliver on these new products would likely be through partnerships with, for example, the FAO, UNEP, GEO, CDP, the C40 Cities, and the World Bank.
It is concluded that with current capabilities in relation to its ECVs and ECV products, the global climate observing system could provide indicators for adaptation that could be used in the global stocktake. With modest enhancement of products or new products, these could be used at national level to add value to National Adaptation Plans, through assessment of climate hazards and vulnerabilities, assisting in identification of adaptation options and implementation, and in management, monitoring and evaluation of adaptation actions.
Observations of Extremes
Climate change is being strongly manifest in growing impacts on society and ecosystems, especially through the occurrence of extreme events that occur at different time and geographical scales. The World Climate Research Program has established as one of its Grand Challenges: Understanding and Predicting Weather and Climate Extremes33. Their white paper34 underlines that to determine the location, intensity, and frequency of various climate extremes including droughts, floods, heavy precipitation events, cold spells, tropical and extratropical storms, terrestrial and marine heatwaves, coastal sea level
32 https://www.ipcc.ch/site/assets/uploads/2019/07/Research-Agenda-Aug-10_Final_Long-
version.pdf 33 https://www.wcrp-climate.org/gc-extreme-events 34 WCRP Grand Challenge: Understanding and Predicting Weather and Climate Extremes Xuebin
Zhang, et al. https://www.wcrp-climate.org/images/documents/grand_challenges/GC_Extremes_v2.pdf
- 70 -
surges and extreme ocean waves, long term and reliable data are needed. This information is needed in the near-term (from a season to a year) to mitigate risks to society and ecosystems, and in the longer-term (from a decade to centuries) for effective adaptation planning.
Characteristically extreme phenomena in the atmosphere are of widely differing spatial and temporal scales. Tornadoes have a spatial scale as small as less than 100 meters and a temporal scale as short as a few minutes. In contrast, a drought can last for multiple years, affecting a whole continent. Consequently, the data requirements to cover this wide spectrum are varied and complex. Over time, there have been increased efforts to improve the availability of data, to extend the historical observational record, including climate quality reanalysis over longer historical periods, and to improve remote sensing products, which now extend long enough to document trends and sample extremes. However, even now there are some geographical regions with no data at all, or with limited availability of data to the global community, that inhibit the improvement of studies that can advance knowledge of predicting or managing the occurrence of extremes.
There are some global efforts that have been developed to reanalyse the data available to cover the shortage of data. For the study of extremes, several global extreme temperature and precipitation indices were proposed by the Expert Team on Climate Change Detection Indices35, which were globally accepted to do local and regional studies, with various National Weather Services or regional researchers requested to calculate the indices and make them available to the wider community through the Meteorological Office Hadley Centre observations dataset HadEX. Another estimate arises from GHCNDEX36 which uses the Global Historical Climatology Network Daily (GHCND) dataset to calculate the extremes indices. This product is totally traceable back to the underlying daily meteorological reports, but it has less complete coverage. The Ocean Observations for Physics and Climate panel has recently set up a task team across GOOS and WCRP to develop indicators and indices intended to monitor, detect and predict climate change and extremes related with the ocean and the interactions across its interfaces.
Unfortunately, the availability of daily observational high-quality data is limited for many regions of the globe. This is due to several reasons including a lack of suitable data but is also because many countries have strict polices about data sharing. However, often National Meteorological Services are more willing to share derived indices, i.e. annual and/or monthly values derived from daily data, for example the number of days above or below a temperature or precipitation threshold. This helps to provide information about climate extremes from regions where daily data are not readily available to the scientific community. Among indices the spatial coverage of stations varies, and there are many more stations containing precipitation than temperature data. It is generally necessary to have a larger number of representative precipitation stations since the spatial variability of precipitation extremes is much higher than it is for temperature extremes
One of the most impact-relevant variables to define heat and cold waves is maximum and/or minimum temperature over/below a defined percentile. This implies a continuous and quality-controlled daily temperature dataset. The availability of these long-term
35 The joint CCl/CLIVAR/JCOMM Expert Team (ET) on Climate Change Detection and Indices
(ETCCDI) http://etccdi.pacificclimate.org/ 36 Gridded Temperature and Precipitation Climate Extremes Indices (CLIMDEX data)
https://climatedataguide.ucar.edu/climate-data/ghcndex-gridded-temperature-and-precipitation-climate-extremes-indices-climdex-data
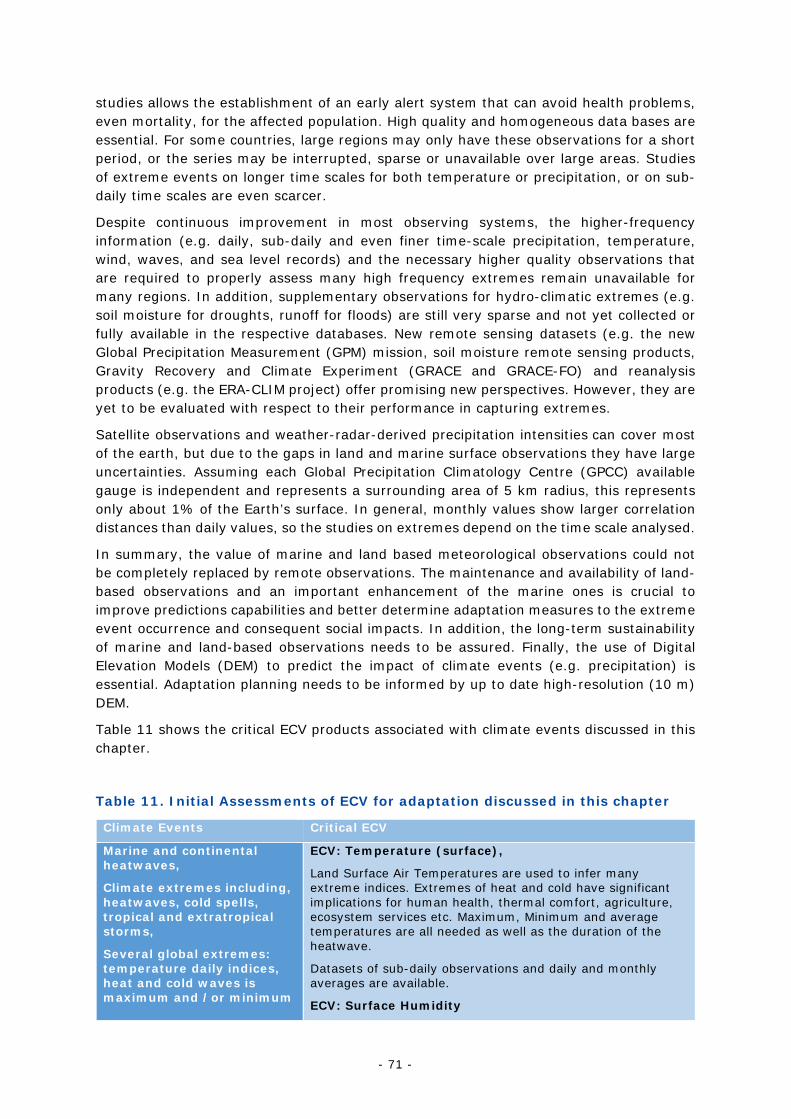
- 71 -
studies allows the establishment of an early alert system that can avoid health problems, even mortality, for the affected population. High quality and homogeneous data bases are essential. For some countries, large regions may only have these observations for a short period, or the series may be interrupted, sparse or unavailable over large areas. Studies of extreme events on longer time scales for both temperature or precipitation, or on sub-daily time scales are even scarcer.
Despite continuous improvement in most observing systems, the higher-frequency information (e.g. daily, sub-daily and even finer time-scale precipitation, temperature, wind, waves, and sea level records) and the necessary higher quality observations that are required to properly assess many high frequency extremes remain unavailable for many regions. In addition, supplementary observations for hydro-climatic extremes (e.g. soil moisture for droughts, runoff for floods) are still very sparse and not yet collected or fully available in the respective databases. New remote sensing datasets (e.g. the new Global Precipitation Measurement (GPM) mission, soil moisture remote sensing products, Gravity Recovery and Climate Experiment (GRACE and GRACE-FO) and reanalysis products (e.g. the ERA-CLIM project) offer promising new perspectives. However, they are yet to be evaluated with respect to their performance in capturing extremes.
Satellite observations and weather-radar-derived precipitation intensities can cover most of the earth, but due to the gaps in land and marine surface observations they have large uncertainties. Assuming each Global Precipitation Climatology Centre (GPCC) available gauge is independent and represents a surrounding area of 5 km radius, this represents only about 1% of the Earth’s surface. In general, monthly values show larger correlation distances than daily values, so the studies on extremes depend on the time scale analysed.
In summary, the value of marine and land based meteorological observations could not be completely replaced by remote observations. The maintenance and availability of land-based observations and an important enhancement of the marine ones is crucial to improve predictions capabilities and better determine adaptation measures to the extreme event occurrence and consequent social impacts. In addition, the long-term sustainability of marine and land-based observations needs to be assured. Finally, the use of Digital Elevation Models (DEM) to predict the impact of climate events (e.g. precipitation) is essential. Adaptation planning needs to be informed by up to date high-resolution (10 m) DEM.
Table 11 shows the critical ECV products associated with climate events discussed in this chapter.
Table 11. Initial Assessments of ECV for adaptation discussed in this chapter
Climate Events Critical ECV
Marine and continental heatwaves,
Climate extremes including, heatwaves, cold spells, tropical and extratropical storms,
Several global extremes: temperature daily indices, heat and cold waves is maximum and /or minimum
ECV: Temperature (surface),
Land Surface Air Temperatures are used to infer many extreme indices. Extremes of heat and cold have significant implications for human health, thermal comfort, agriculture, ecosystem services etc. Maximum, Minimum and average temperatures are all needed as well as the duration of the heatwave.
Datasets of sub-daily observations and daily and monthly averages are available.
ECV: Surface Humidity
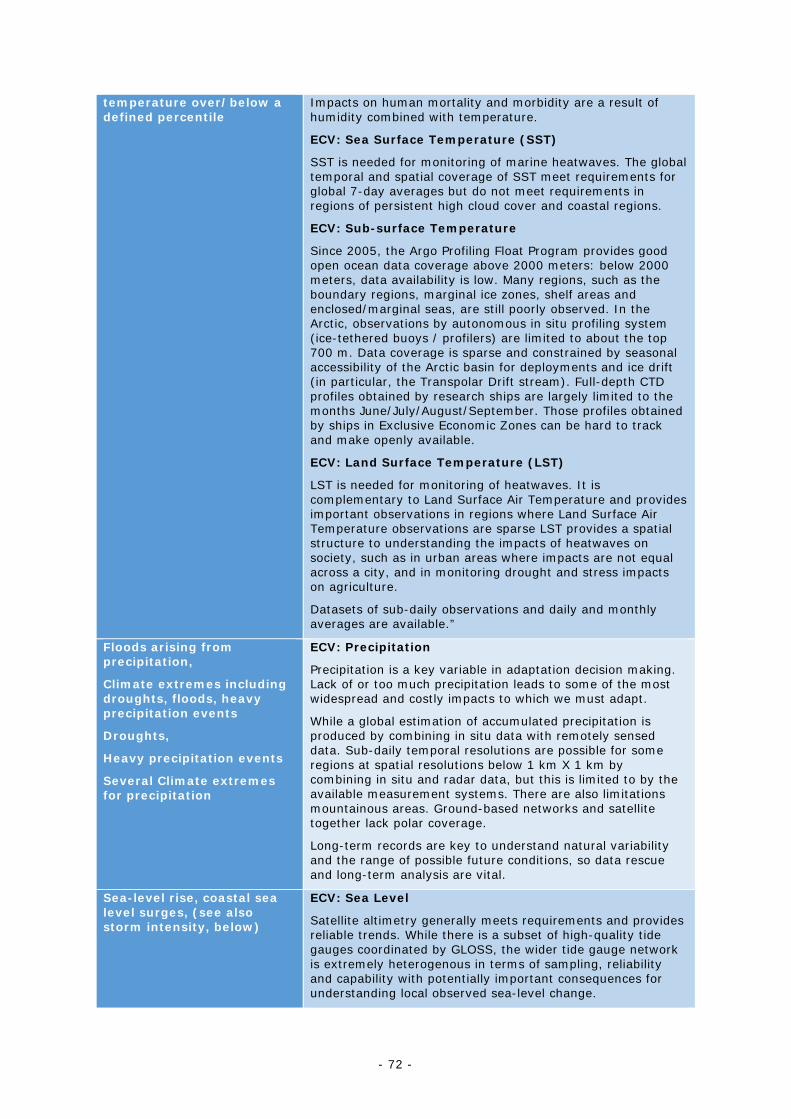
- 72 -
temperature over/below a defined percentile
Impacts on human mortality and morbidity are a result of humidity combined with temperature.
ECV: Sea Surface Temperature (SST)
SST is needed for monitoring of marine heatwaves. The global temporal and spatial coverage of SST meet requirements for global 7-day averages but do not meet requirements in regions of persistent high cloud cover and coastal regions.
ECV: Sub-surface Temperature
Since 2005, the Argo Profiling Float Program provides good open ocean data coverage above 2000 meters: below 2000 meters, data availability is low. Many regions, such as the boundary regions, marginal ice zones, shelf areas and enclosed/marginal seas, are still poorly observed. In the Arctic, observations by autonomous in situ profiling system (ice-tethered buoys / profilers) are limited to about the top 700 m. Data coverage is sparse and constrained by seasonal accessibility of the Arctic basin for deployments and ice drift (in particular, the Transpolar Drift stream). Full-depth CTD profiles obtained by research ships are largely limited to the months June/July/August/September. Those profiles obtained by ships in Exclusive Economic Zones can be hard to track and make openly available.
ECV: Land Surface Temperature (LST)
LST is needed for monitoring of heatwaves. It is complementary to Land Surface Air Temperature and provides important observations in regions where Land Surface Air Temperature observations are sparse LST provides a spatial structure to understanding the impacts of heatwaves on society, such as in urban areas where impacts are not equal across a city, and in monitoring drought and stress impacts on agriculture.
Datasets of sub-daily observations and daily and monthly averages are available.”
Floods arising from precipitation,
Climate extremes including droughts, floods, heavy precipitation events
Droughts,
Heavy precipitation events
Several Climate extremes for precipitation
ECV: Precipitation
Precipitation is a key variable in adaptation decision making. Lack of or too much precipitation leads to some of the most widespread and costly impacts to which we must adapt.
While a global estimation of accumulated precipitation is produced by combining in situ data with remotely sensed data. Sub-daily temporal resolutions are possible for some regions at spatial resolutions below 1 km X 1 km by combining in situ and radar data, but this is limited to by the available measurement systems. There are also limitations mountainous areas. Ground-based networks and satellite together lack polar coverage.
Long-term records are key to understand natural variability and the range of possible future conditions, so data rescue and long-term analysis are vital.
Sea-level rise, coastal sea level surges, (see also storm intensity, below)
ECV: Sea Level
Satellite altimetry generally meets requirements and provides reliable trends. While there is a subset of high-quality tide gauges coordinated by GLOSS, the wider tide gauge network is extremely heterogenous in terms of sampling, reliability and capability with potentially important consequences for understanding local observed sea-level change.
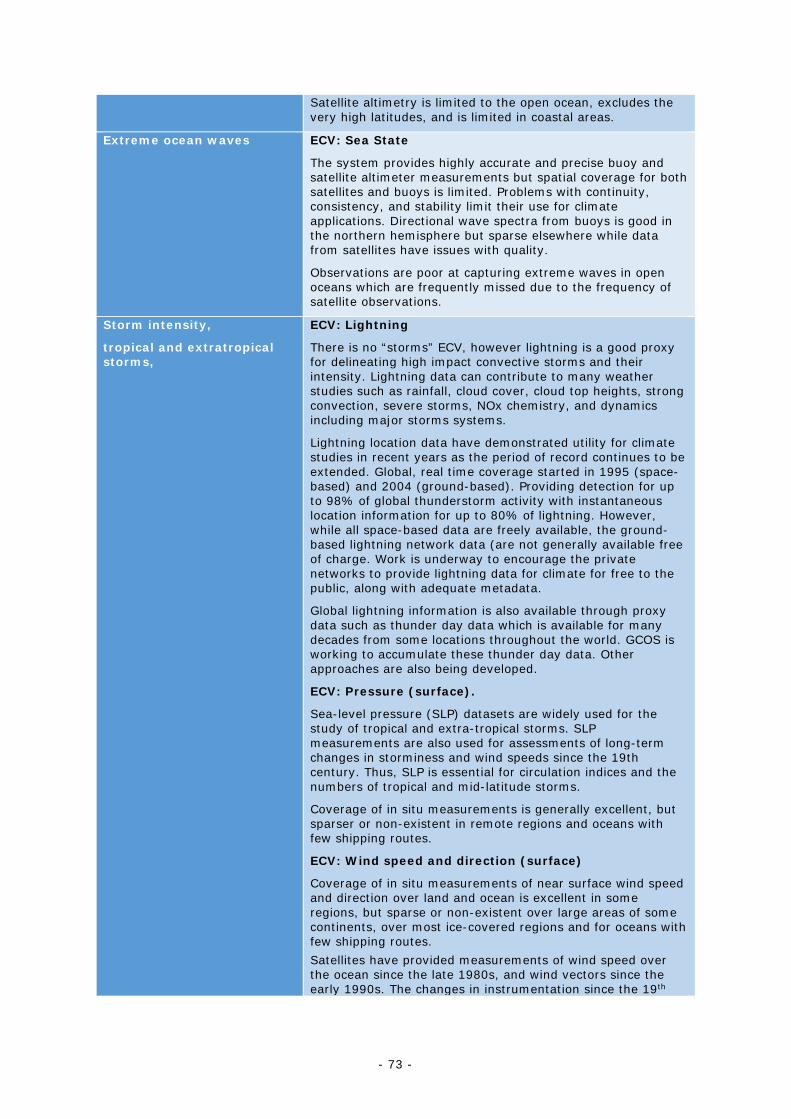
- 73 -
Satellite altimetry is limited to the open ocean, excludes the very high latitudes, and is limited in coastal areas.
Extreme ocean waves ECV: Sea State
The system provides highly accurate and precise buoy and satellite altimeter measurements but spatial coverage for both satellites and buoys is limited. Problems with continuity, consistency, and stability limit their use for climate applications. Directional wave spectra from buoys is good in the northern hemisphere but sparse elsewhere while data from satellites have issues with quality.
Observations are poor at capturing extreme waves in open oceans which are frequently missed due to the frequency of satellite observations.
Storm intensity,
tropical and extratropical storms,
ECV: Lightning
There is no “storms” ECV, however lightning is a good proxy for delineating high impact convective storms and their intensity. Lightning data can contribute to many weather studies such as rainfall, cloud cover, cloud top heights, strong convection, severe storms, NOx chemistry, and dynamics including major storms systems.
Lightning location data have demonstrated utility for climate studies in recent years as the period of record continues to be extended. Global, real time coverage started in 1995 (space-based) and 2004 (ground-based). Providing detection for up to 98% of global thunderstorm activity with instantaneous location information for up to 80% of lightning. However, while all space-based data are freely available, the ground-based lightning network data (are not generally available free of charge. Work is underway to encourage the private networks to provide lightning data for climate for free to the public, along with adequate metadata.
Global lightning information is also available through proxy data such as thunder day data which is available for many decades from some locations throughout the world. GCOS is working to accumulate these thunder day data. Other approaches are also being developed.
ECV: Pressure (surface).
Sea-level pressure (SLP) datasets are widely used for the study of tropical and extra-tropical storms. SLP measurements are also used for assessments of long-term changes in storminess and wind speeds since the 19th century. Thus, SLP is essential for circulation indices and the numbers of tropical and mid-latitude storms.
Coverage of in situ measurements is generally excellent, but sparser or non-existent in remote regions and oceans with few shipping routes.
ECV: Wind speed and direction (surface)
Coverage of in situ measurements of near surface wind speed and direction over land and ocean is excellent in some regions, but sparse or non-existent over large areas of some continents, over most ice-covered regions and for oceans with few shipping routes. Satellites have provided measurements of wind speed over the ocean since the late 1980s, and wind vectors since the early 1990s. The changes in instrumentation since the 19th
- 74 -
century means that centennial-scale series are generally not homogeneous.
Land use-land cover change (LULCC), distributions of developed/human occupied land cover subject to certain climate hazards such as drought, fire, sea level rise,
Green cover in cities,
Shifts in LULCC reflecting shifts in agricultural patterns in response to climate drivers,
Shifts in settlements away from coasts in response to sea-level rise,
Shifting patterns of prescribed burning in response to climate change
ECV: Land Cover:
Short term extremes are not generally well observed, but longer-term trends which result in a change in land cover can be captured. Some interventions can be observed at longer time scales and high-resolution land cover data can be useful for providing the local context for adaptation.
Coverage is global, and reliable global historic trends can be derived. There is a wide range of relevant long-term well curated satellite data, at a range of horizontal and temporal resolutions, and also for appropriate temporal extents. In particular, the Landsat archive and Sentinel satellites now provide many opportunities for more detailed land cover mapping. However, high-temporal resolution, with a spatial scale of 10 m, Land Cover is only available globally since 2015.
Fires ECV: Fire Disturbance.
Temporal anomalies can be detected from comparison with 20 years historical series. These are based on satellite observations, but the errors are higher than desired. Several products are available with a 300 m resolution, while ESA’s Climate Change Initiative Fire Disturbance project (FireCCI) has developed an alternative global burnt area product, based on MODIS 250 m reflectance bands, which provides similar accuracy to earlier products but seems more sensitive to small burn patches.
Surface albedo ECV: Surface Albedo
Albedo could be used for monitoring extreme events such as heavy snowfall and could detect urban changes for adaptation (linked to the net surface solar radiation heat flux). However, accuracy and stability requirements are only met over vegetated areas.
The quality of the albedo spatial measurements decreases during the fall and winter. The installation height of standard pyranometers varies from 3 m to 30 m across the Baseline Surface Radiation Network (BSRN).
Despite accuracy problems, changes and trends in relative values can be used.
Soil moisture ECV: Soil Moisture
Information of extremes of soil moisture are useful for improving irrigation efficiency, tacking the impacts for afforestation, monitoring changes in water use efficiency. However, climate and agricultural communities also require root-zone soil moisture products. Soil Moisture is useful for drought, however, for extremely wet conditions the temporal revisit times may be too short, especially for high-resolution products.
Observations meet the requirements in semi-arid regions and crop lands. There are still issues in dense vegetation, organic soils, and regions of strong topography. Datasets contain spatial and temporal gaps because of limited sensor availability and data retrievals issues.
- 75 -
Continuation of L-band data record threatened by absence of follow-on missions for SMOS and SMAP
Mitigation
ECVs have an important role in assisting Parties mitigation efforts. National reporting of greenhouse gas emissions and removals follows the IPCC National Greenhouse Gas Guidelines, and these estimates are the basis for reporting the impact on emissions and removals of mitigation efforts. The IPCC Guidelines used for reporting to the UNFCCC use economic data for many emissions but also use observations for estimating AFOLU emissions and removals. ECVs such as land cover (to identify changing land categories and the transitions between them) and above-ground biomass (especially for forests) are vital.
Measurements of atmospheric composition are being used to estimate emission fluxes using inverse modelling techniques. Currently these methods provide broad regional and global scale estimates, but this will improve with improved observations and modelling approaches. Satellite mission to measure GHG concentrations in the atmosphere are planned and programmes such as ICOS and IG3IS are developing in situ observations. Techniques to identify fossil fuel emissions and separate anthropogenic and natural fluxes are needed.
These inverse modelling techniques are also being used to support the emission inventory approaches. They have been used to identify sources of CO2, CH4 and fluorinated gases missing from national emission inventories. While they are not currently suitable to providing national estimates for all countries they can support and verify national emission inventory estimates.
7. IMPLICATIONS Introduction
Securing and extending the observing systems needed for the long-term monitoring of the Earth System as a whole requires substantial efforts and collaboration at all levels including international organizations, national agencies, and the scientific community. The systematic climate observations supported and reviewed by GCOS are usually implemented by national agencies or academia coordinated by the World Meteorological Organization (WMO), Global Ocean Observing System (GOOS), Joint Working Group on Climate (WG Climate) of the Committee on Earth Observation Satellites (CEOS) and Coordination Group for Meteorological Satellites (CGMS), and other partners and relevant organizations who are all committed to improving the observation system and supporting the UNFCCC and IPCC.
Successes
Since the 2016 GCOS Implementation Plan was published there has been significant progress in many areas and this effort needs to be maintained supported by sustainable, long-term, and adequate finance. The major improvements include:
• Satellite observations have improved their coverage both spatially, temporally and in terms of observed variables. Satellite data are accessible and well curated37. Many ECVs, especially terrestrial ECVs, such as land cover, leaf area index and
37 See for example the ECV Inventory https://climatemonitoring.info/ecvinventory/
- 76 -
FAPAR are now available from satellites providing a near-global coverage with good resolution.
• WMO and its worldwide network of NMHS ensure the required long-term monitoring, with established practices and instruments, for many ECVs in the atmospheric domain. Much of this data are exchanged internationally and support weather and climate modelling.
• Observations of atmospheric variables have further improved in the past decade thanks to new in situ observations from the ground and from commercial aircrafts.
• Most ground-based networks are well managed and archives appropriately stewarded such as the National Centres for Environmental Information (NCEI) hosted by NOAA in the US; the National Snow and Ice Data Centre in the US; International Comprehensive Ocean-Atmosphere Data Set (ICOADS) and many other data centres. The Copernicus Climate Change Service (C3S) also provides access to data and derived products as well as tools to use the data.
• GCOS and WMO are now working together to establish a reference network for atmospheric and land surface meteorological observations, which will be the surface equivalent to the GRUAN.
• The ocean observing community is working in structuring ocean observations in a fit-for-purpose observing system, with agreement on best practices for observations and data and meta-data standards.
• It was decided to expand the Argo program to the full water column and under sea ice, including biogeochemical variables. These subsurface measurements are critical to monitor and forecast the climate system.
• Technological innovations have contributed to expanding the ocean observing system and its capability, in particular with development of autonomous platforms and suitable sensors for a range of ECVs.
Issues
There are still areas for improvement in the global climate observing system. The remainder of this chapter will highlight significant areas where additional work is needed. This can be broadly grouped into two areas:
• the existing observing system does not fully meet the needs identified in the 2016 Implementation Plan (7.3.1;7.3.2;7.3.3).
• User needs are evolving. Additional observational needs have been identified through work on the adequacy of observations of the climate cycles, adaptation and extremes, the needs of the UNFCCC, the Paris Agreement (7.3.4).
Sustainability
Long-term continuity of some satellite observations is not assured. While satellite observations have been a major success, there are gaps:
• No follow up mission for Aeolus (wind profiles) is planned.
• No continuity is assured for cloud radar and lidar on research satellites.
• Only one limb sounder with similar capabilities to the Aura Microwave Limb Sounder (MLS) is planned. The MLS provides near-global coverage every day for water vapor
- 77 -
vertical profiles from the upper troposphere through the mesosphere but has now exceeded its expected lifetime.
• High-inclination altimetry is still problematic with only two research satellites flying (CryoSAT2 and ICESat2). In the future, European missions CRISTAL & CIMR would extend operational monitoring capabilities to the late 2020s (if confirmed). Likewise, Sentinel-3A/B altimeter data could be optimised for sea ice in the future.
• High-latitude sea-ice thickness monitoring is at risk (when CryoSat and ICESat2 stop working) and a gap might occur if CRISTAL is delayed.
Sustained funding is needed. While many atmospheric observations are made on an operational basis, most ocean and terrestrial observations are supported through short-term research funding with a typical lifetime of a few years leaving the development of long-term records vulnerable. This is particularly true for parameters that are not traditionally monitored for weather prediction. There is a need to recognize that the sustainable monitoring of a changing climate provides great societal benefits and is not only for academic interest. Since these observations are executed by a large range of actors a functional and effective observing system for climate needs appropriately funded support and coordination bodies are essential.
Many otherwise successful projects have not led to long-term sustained improvements. One clear message from the GCOS Regional Workshops is that most of the projects in developing countries that have a component devoted to observations have not led to sustainable long-term improvements in the observational capacity of these countries due to lack of resources and planning. More sustainable solutions are needed such as the proposal for WMO’s GBON and SOFF discussed below.
Gaps
There are still gaps in the global coverage of in situ observations: ground-based terrestrial and atmospheric observations and oceanic observations.
In situ observations for almost all the in situ ECVs are consistently deficient over certain regions, most notably parts of Africa, South America, Southeast Asia, the Southern Ocean, and ice-covered regions, a situation that has not improved since the GCOS 2015 Status Report.
The three GCOS Regional Workshops have looked at why some regions have problems in making sufficient observations. These issues include:
• For small nations (e.g. Pacific SIDS) the costs of observations may far exceed the resources available nationally amounting to a substantial fraction of the GDP.
• Lack of planning for foreseeable expenses (e.g. maintenance, equipment replacements, consumables).
• Lack of trained staff and poor staff retention.
• Poor understanding of the national benefits of observations: their contribution to disaster preparedness, adaptation planning and other climate services.
Furthermore, in remote and inaccessible areas, there are technical difficulties in the maintenance of operational observations.
The WMO Congress in 2019 adopted the concept for a Global Basic Observing Network (GBON), which, if fully implemented, will provide essential observations for global NWP and climate modelling, covering a few ECV. WMO is currently working to establish a
- 78 -
Systematic Observations Finance Facility (SOFF) that will provide financial and technical support for the implementation and operation of GBON to those members who would not otherwise be able to implement this network. Transforming the GBON and SOFF from concepts to an operational reality requires the efforts and support of all parties.
Some of the problems related to the operation of the in situ network have been addressed by the GCOS Cooperation Mechanism (GCM). While the impact of the GCM at a station or national level can be significant, the funding available to the GCM only allows a handful of countries to be assisted. The SOFF, if funded to the level envisaged on a sustained basis, would lead to global improvements but only addresses a few ECV. The need for support for the remaining in situ ECV observations remains.
Large gaps still exist in ocean observations. Subsurface measurements are critical to monitor and forecast the climate system. The decision to expand the Argo program to the full water column and under sea ice, including biogeochemical variables addresses that challenge. More regular sampling by high-quality oceanographic cruises and an increase in the deployment of observing platforms are needed, in particular along continental boundaries, the polar oceans and marginal seas. Ocean conditions affecting the loss of ice from Greenland and the Antarctic need to be better monitored to improve projections of future rates of ice loss and sea level rise. On-ice in situ observations remain a challenge due to logistical difficulties. Improving both quality and coverage of surface flux measurements of heat, carbon, freshwater, and momentum is necessary.
Gaps in the satellite-based observations include:
• Lower tropospheric ozone (to supplement the limited coverage of surface and to determine statistically significant trends).
• An instrument that measures stratospheric CH4 profiles globally.
• There is a regional imbalance of satellite observations. In high mountain areas satellite data acquisition of cryospheric observations is poor. For certain atmospheric ECVs in polar regions satellites have poor or no coverage.
Data Stewardship, Archiving and Access
Preservation of the fundamental climate data record is essential. Reanalyses and other added value products can always be recreated or improved from the basic data record. To address and understand climate change the longest possible time series need to be preserved in perpetuity. Not every ECV has a recognized global data repository (such as ICOADS, where almost all qualifying data has been collected). Even when there is a recognized global data repository it is can be incomplete and inadequately supported.
Adequate data stewardship, archiving and access requires:
• Data centres need sustainable, long-term, adequate funding.
• Clear requirements that will ensure a consistent approach among the data centres. Clearly defined principles such as the TRUST Principles (Lin et al., 2020) and FAIR Principles (Wilkinson et al., 2016) as well as clear and enforced data management plans and data citation are required.
- 79 -
• Data exchange is fundamental for collecting suitable global information for climate monitoring. WMO is currently reviewing its data policy38. The proposed data policy will cover all Earth’s system component and, if adopted, will lead to additional exchange of all types of environmental data.
• Data should be open and freely available to all users.
• Data centres not only need to serve as a repository of data but also perform quality monitoring and ongoing reprocessing of data when new techniques or observations become available.
• Data rescue allows data series to be extended in the past and needs to be adequately planned and funded with the results openly and freely available. This includes early satellite missions. Sustained support to these activities globally at scale is required. New approaches including citizen science and classroom-based approaches may help achieve digitisation steps.
New needs and requirements since the 2016 Implementation Plan
Since the last GCOS Status Report was published in 2015, and guided by the 2016 GCOS Implementation Plan, GCOS experts have identified a number of new needs, gaps and issues.
Global, regional and national observations underpin many aspects of the sixth assessment report cycle of the IPCC, the primary provider of scientific information to the UNFCCC, Kyoto Protocol and Paris Agreement. While, both reanalyses and satellite observations, have taken on an increasing role in assessment activities, the three special reports issued by IPCC in 2018-2019 have highlighted the critical role of monitoring a range of terrestrial and ocean ECVs and the knowledge gaps that need to be addressed.
Supporting the Paris Agreement One of the critical components of the UNFCCC’s Paris agreement is its ambition cycle, associated with a Global Stocktake (GST) every five years. The first GST is in 2023. This status report assesses progress against the goals set out in the 2016 GCOS-IP and is the first such update under the Paris agreement. It is of direct relevance to the global stocktake.
An important part of the Paris Agreement is the transparent reporting of a country’s NDCs39 and their emissions and removals of greenhouse gases. Techniques are being developed to use atmospheric composition observations to estimate these fluxes and independently validate reporting. These observations also allow monitoring changes in the natural carbon cycle.
To support attainment of the goals of the Paris Agreement, especially of the global stocktake in 2023, the observation community needs to address knowledge gaps through ECVs that disclose and track physical, chemical and biological cycles. Attention needs to
38 EC-73, approved version of doc 3.4(1): https://meetings.wmo.int/EC-
73/_layouts/15/WopiFrame.aspx?sourcedoc=/EC-73/English/2.%20PROVISIONAL%20REPORT%20(Approved%20documents)/EC-73-d03-4(1)-WMO-UNIFIED-DATA-POLICY-approved_en.docx&action=default
39 NDC: Nationally Determined Contribution. Countries should submit this to the UNFCCC. It can be presented in terms of an emission reduction or target or a series of polices and actions.
- 80 -
be paid to areas particularly susceptible to the impacts of climate change and to how well ECV requirements capture the relevant temporal and spatial scales. Issues include:
• The feedbacks associated with changes in land use/cover, e.g. the timing and implications of the release of stored carbon in Arctic permafrost in different temperature and stabilization regimes (IPCC, SR1.5 2018).
• Improving understanding of how response options and policies can reduce or augment the cascading impacts of land and climate, especially in relation to non-linear and tipping-point changes in natural and human systems (IPCC, SRCCL 2019).
• The ocean overturning circulation is a key factor that controls heat and carbon exchanges with the atmosphere, and hence global climate, however there are no direct measures of this and only sparse indirect indicators of how it may be changing. This is a critical weakness in sustained observations of the global ocean (IPCC, SROCC 2019).
• Given the carbon reduction commitments that have been proposed by most countries, GCOS should support the quantitative assessment of anthropogenic greenhouse gas fluxes through measurements of atmospheric composition. GCOS should also ensure that the global climate observations support to the quantitative evaluation of the effect of human activities on climate change.
• The key role of climate observations in adaptation and mitigation is discussed in Chapter 6, there are both important parts of the Paris Agreement.
The Earth System Cycles The importance of the Earth system cycles has been discussed in Chapter 2. The integrated structure of the IPCC AR5 WGI report has stressed the importance of understanding the Earth system climate cycles. Existing observations have supported the assessments but limitations in length of data records, spatial completeness or apparent quality have often led to assessments having low confidence highlighting the importance of the whole lifecycle approach to obtaining climate data records from data rescue through long-term data curation to continuous data analysis activities in informing subsequent IPCC assessment activities.
The goals on closing the main Earth cycles of water, energy and carbon implied the need to consistently assess their variability at various spatial and temporal scales. This was a major shift in emphasis, from only monitoring stocks, to also including the exchange fluxes between the different domains. In 2018 GCOS started assessments for each of the cycles, the energy, the carbon and the water cycle, to identify possible gaps and inconsistencies in existing observation systems, attribute their origin, and formulate where possible guidelines for future Earth cycle observation strategies. Each of the cycles has now been assessed (von Schuckman et al., 2020; Dorigo et al., 2021; Crisp et al., 2021, in prep). Major implications for GCOS include:
• While the estimates of global average temperature derived from observations are adequate, the uncertainty in the overall energy budget is dominated by the largest term, the oceanic heat uptake. There clearly is a need to sustain and extend an integrated ocean observing system.
• For energy fluxes, the largest uncertainties are the precipitation input, short wave heating of the atmosphere, and the turbulent fluxes of sensible and latent heat, both for the ocean and land. Research is underway looking at improvements to the
- 81 -
measurement capabilities for fluxes, especially over the oceans. This needs to be concluded and, if successful, implemented.
• The uncertainty (interannual variability) in the total carbon budget is dominated by uncertainties in the land use flux and ocean and land uptakes. These uncertainties are cause for concern as they suggest that our current observing systems do not yet have the required precision to annually monitor these trends adequately enough to guide Parties in the emission reductions that they need to achieve the Paris agreement temperature goal. This will require observational improvements particularly in the Southern Ocean and in the atmosphere over land. Satellite observations need to be complimented with a significant increase of in situ observations of GHGs with special attention given to improving the observations around urban areas.
• The largest uncertainty in the water cycle is in the evaporative fluxes over land (including polar regions) and ocean and precipitation over the ocean and mountains. Thus, there is a need to measure key variables to determine evaporative fluxes to improve water budget closure over tropical areas. A snow measurement mission is also needed to better constrain the cold land hydrology.
• A new ECV Terrestrial Water Storage ECV (a satellite, gravimetric observation) is being introduced providing near-global coverage covering gaps in reporting in situ data. It will aid in quantifying the net effect of changes in the climate, human water use and other hydrological effects on the continental water budget and helps closing the terrestrial water balance. It will also support adaptation studies for identifying hot spots of changes in the water cycle assessing the severity of droughts.
In general, the new emphasis on Earth System Cycles has contributed to identifying gaps, and priority areas for further improvement of the observing system. The 2022 Implementation Plan will revisit this and align the cycle requirements also closely with those of its sister program WCRP.
Adaptation, Extremes and Mitigation GCOS has started considering adaptation but has not yet concluded this work. In the future, attention needs to be given to monitoring extremes at appropriate spatial and temporal resolutions and locations for each specific use. Therefore, in defining ECV requirements, single values for accuracy and resolution may not be sufficient.
ECV requirements may also vary for other applications such as mitigation. For example, the requirements for atmospheric concentrations needed to monitor greenhouse gas fluxes differ according to the source being monitored, e.g. point sources, cities, countries or regions. GCOS will consider how to present the needs of different users in the next GCOS Implementation Plan.
It was concluded that with current capabilities in relation to its ECVs and ECV products, the global climate observing system could provide indicators for adaptation that could be used in the global stocktake. With modest enhancement of products or new products, these could be used at national level to add value to National Adaptation Plans, through assessment of climate hazards and vulnerabilities, assisting in identification of adaptation options and implementation, and in management, monitoring and evaluation of adaptation actions.
- 82 -
ANNEX A : DETAILED ASSESSMENT OF EACH ECV
- 83 -
TABLE OF CONTENTS: ANNEX A
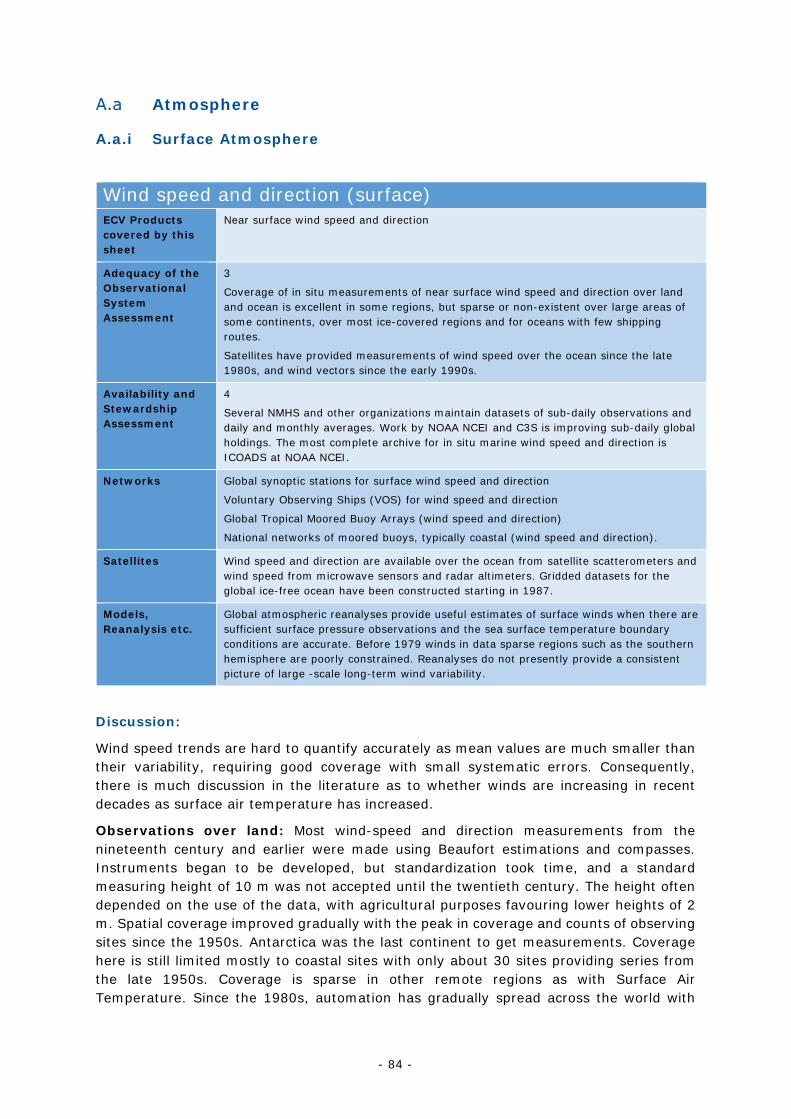
- 84 -
Atmosphere
A.a.i Surface Atmosphere
Wind speed and direction (surface) ECV Products covered by this sheet
Near surface wind speed and direction
Adequacy of the Observational System Assessment
3
Coverage of in situ measurements of near surface wind speed and direction over land and ocean is excellent in some regions, but sparse or non-existent over large areas of some continents, over most ice-covered regions and for oceans with few shipping routes.
Satellites have provided measurements of wind speed over the ocean since the late 1980s, and wind vectors since the early 1990s.
Availability and Stewardship Assessment
4
Several NMHS and other organizations maintain datasets of sub-daily observations and daily and monthly averages. Work by NOAA NCEI and C3S is improving sub-daily global holdings. The most complete archive for in situ marine wind speed and direction is ICOADS at NOAA NCEI.
Networks Global synoptic stations for surface wind speed and direction
Voluntary Observing Ships (VOS) for wind speed and direction
Global Tropical Moored Buoy Arrays (wind speed and direction)
National networks of moored buoys, typically coastal (wind speed and direction).
Satellites Wind speed and direction are available over the ocean from satellite scatterometers and wind speed from microwave sensors and radar altimeters. Gridded datasets for the global ice-free ocean have been constructed starting in 1987.
Models, Reanalysis etc.
Global atmospheric reanalyses provide useful estimates of surface winds when there are sufficient surface pressure observations and the sea surface temperature boundary conditions are accurate. Before 1979 winds in data sparse regions such as the southern hemisphere are poorly constrained. Reanalyses do not presently provide a consistent picture of large -scale long-term wind variability.
Discussion:
Wind speed trends are hard to quantify accurately as mean values are much smaller than their variability, requiring good coverage with small systematic errors. Consequently, there is much discussion in the literature as to whether winds are increasing in recent decades as surface air temperature has increased.
Observations over land: Most wind-speed and direction measurements from the nineteenth century and earlier were made using Beaufort estimations and compasses. Instruments began to be developed, but standardization took time, and a standard measuring height of 10 m was not accepted until the twentieth century. The height often depended on the use of the data, with agricultural purposes favouring lower heights of 2 m. Spatial coverage improved gradually with the peak in coverage and counts of observing sites since the 1950s. Antarctica was the last continent to get measurements. Coverage here is still limited mostly to coastal sites with only about 30 sites providing series from the late 1950s. Coverage is sparse in other remote regions as with Surface Air Temperature. Since the 1980s, automation has gradually spread across the world with
- 85 -
most observations taken now by Automatic Weather Stations (AWSs) giving a much greater potential for more readings per day, but this has not been fully realized in archives. The changes in instrumentation since the nineteenth century means that centennial-scale series are generally not homogeneous
Observations over the oceans: Historically most marine wind observations were derived from visual assessment of sea state. From the 1960s onwards direct measurements became more prevalent. Wind measurements from either ships, buoys or other platforms are subject to air-flow distortion, making it hard to construct a consistent record. Historically, wind speed and direction were recorded alongside other ECVs (pressure, air and sea temperatures, humidity and cloud) and the ship’s position in the ship’s log book. More recently measurements are available from moored buoys, typically located in tropical or coastal regions. As ship observations have declined in coverage since the 1990s there has been a decline in coverage for marine winds. Constructing a homogeneous historical record requires knowledge of the measurement method as observations derived from anemometers and from visual reports of sea state are not consistent.
Wind is measured at different heights above sea level on different platforms, typically 20 metres or more on ships and a few metres on the autonomous platforms. The construction of consistent wind speed records requires the measurement height to be known, along with an estimate of the wind gradient between the observation height and the chosen reference height. Accurate adjustment requires estimates of local air-sea temperature difference and humidity.
Data and metadata stewardship: Much more data has historically been taken across the world’s land areas than is currently available in global datasets. The National Oceanic and Atmospheric Administration (NOAA) National Climate Environmental Information (NCEI) and the Copernicus Climate Change Service (C3S) have made significant progress in the stewardship of global observations as work towards fulfilling GCOS Implementation Plan 2016 (GCOS IP 2016) Action A2, although much work remains to be done. Several NMHS maintain datasets of sub-daily observations and daily and monthly averages. The climate record for in situ winds from ships for recent decades is based largely on observations exchanged in near real time (NRT) in support of weather forecasting. Availability of observational metadata will improve if BUFR templates are diligently completed, supplementing metadata catalogued by OceanOPS (https://www.ocean-ops.org/). Archives of NRT observations are retained by several NMHS, but there is no dedicated archive specifically responsible for their direct acquisition and stewardship. Moored buoy observations are typically available in both near real time and at higher resolution with calibration following mooring visits. Global Collecting Centres provide added-value data for Voluntary Observing Ships (VOS) data, but only a subset of VOS reports become available through this route. The most complete archive for in situ wind speed and direction is the International Comprehensive Ocean-Atmosphere Data Set (ICOADS) at NOAA NCEI. Improvements to ICOADS data formats and processing are urgently needed to provide access to observations at their full resolution with WIGOS-compliant metadata along with improvements to quality control and duplicate handling (Kent et al., 2019).
Large volumes of all types of surface wind speed and direction observations are available in paper records or on archaic media or obsolete formats such as proprietary binary. Wind direction in particular is valuable very early in the record (pre 1850) for use in the construction of indices that document the prevailing flow. Resources to identify, catalogue, image and rescue this data would enhance and extend the surface wind speed and
- 86 -
direction record, recognising that incorporating newly rescued data into the climate archives also requires substantial effort and resources.
Networks: Wind speed and direction measurements are transmitted using standard messages (SYNOP, CLIMAT) over the WIS. Most countries maintain more stations than are listed in RBON, and a small number (e.g. United States, Canada, Australia, Fennoscandian countries, Netherlands) make these data available on their websites. For many countries the number internationally exchanged is limited, sometimes because of resources, but sometimes due to there being few stations in remote regions.
The WMO Voluntary Observing Ships (VOS) program coordinates measurement and NRT transmission of marine meteorological and oceanographic measurements made aboard ships recruited to national or regional observing VOS networks. Many VOS reports include wind speed and direction alongside other near-surface observations required for adjustment of winds to a common reference height (air-sea temperature difference, humidity). Limited observational metadata (observing methods and heights) is available within the reports, and more extensive metadata elements reports can be accommodated in new BUFR templates. The metadata is supplemented by a metadata database which was established by JCOMM40 based on WMO Publication No. 47.
Research vessels have the potential to make high-quality observations of many surface ECVs including wind speed and direction, but their observations are not consistently used for global monitoring as there is no internationally coordinated management system for their data.
Global Tropical Moored Buoy Arrays provide the broadest range of ECVs including wind speed and direction since the late 1970s in the Tropical Pacific and more recently extended to the Tropical Atlantic and Indian Oceans. Observations are transmitted in NRT, and these are supplemented with delayed mode observations from on-board logging retrieved when the moorings are replaced which also provides the potential for post-calibration if the instruments have survived.
National operational networks of moored buoys, typically in coastal locations, provide measurements of a range of ECVs in NRT including wind speed and direction. These buoys have not historically been managed for climate applications, so some archived records have limited metadata and provenance.
Surface Drifters have provided NRT measurements of wind speed derived from acoustic sensors, but these are not typically used for climate monitoring applications.
Satellite observations (ocean only): Satellite wind measurements started in the late 1980s for microwave wind speed with a succession of scatterometers providing in addition estimates of wind direction from the early 1990s. Sparse wind speed estimates are also available from satellite altimeters since the mid 1980s. The many different types of sensor, and frequencies of operation, mean that constructing a homogenous record, even using measurements from the same broad class of sensor, requires careful cross-comparison and adjustment among satellites and moored buoy measurements may be used as a reference.
Reanalysis: Several state-of-the-art global reanalyses provide information about surface wind, namely u and v components. Reanalysis data assimilate conventional data and
40 The Joint WMO-IOC Commission for Oceanography and Marine Meteorology (JCOMM) was
superseded in 2019 by the Joint WMO-IOC Collaborative Board.
- 87 -
satellite observations, however they do not ingest surface wind from land stations with problems in the representation of wind over not-homogeneous terrain. Surface wind in reanalyses (the 10 m wind) is parametrized in planetary boundary layer schemes. Information of wind components is available back to 1950 from a set of reanalyses, with a resolution up to 1 hour in the most recent ones, and back to the nineteenth century for a few reanalyses, at a lower space and time resolution. Data before 1979 are poorly constrained in data sparse region, as the southern hemisphere. The largest disagreement in wind speed mean, variability and trends across different reanalyses is found over land and in continental areas, with better wind speed performances from new generation products. Near surface wind and, in a few cases, instantaneous wind gust are also available in most recent reanalyses.
References:
Kent, E. C., N. A. Rayner, D. I. Berry, R. Eastman, V. Grigorieva, B. Huang, J. J. Kennedy, S. R. Smith and K. M. Willett, 2019: Observing requirements for long-term climate records at the ocean surface, Frontiers in Marine Science. 6:441. doi: 10.3389/fmars.2019.00441
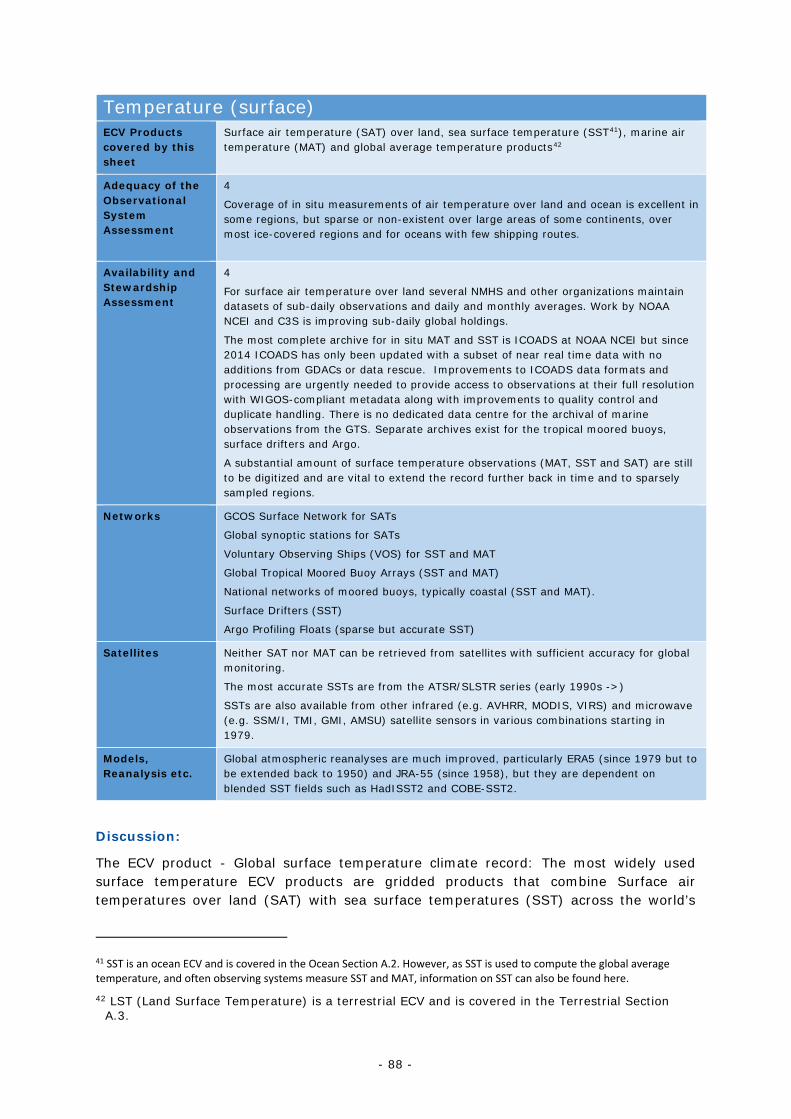
- 88 -
Temperature (surface) ECV Products covered by this sheet
Surface air temperature (SAT) over land, sea surface temperature (SST41), marine air temperature (MAT) and global average temperature products42
Adequacy of the Observational System Assessment
4
Coverage of in situ measurements of air temperature over land and ocean is excellent in some regions, but sparse or non-existent over large areas of some continents, over most ice-covered regions and for oceans with few shipping routes.
Availability and Stewardship Assessment
4
For surface air temperature over land several NMHS and other organizations maintain datasets of sub-daily observations and daily and monthly averages. Work by NOAA NCEI and C3S is improving sub-daily global holdings.
The most complete archive for in situ MAT and SST is ICOADS at NOAA NCEI but since 2014 ICOADS has only been updated with a subset of near real time data with no additions from GDACs or data rescue. Improvements to ICOADS data formats and processing are urgently needed to provide access to observations at their full resolution with WIGOS-compliant metadata along with improvements to quality control and duplicate handling. There is no dedicated data centre for the archival of marine observations from the GTS. Separate archives exist for the tropical moored buoys, surface drifters and Argo.
A substantial amount of surface temperature observations (MAT, SST and SAT) are still to be digitized and are vital to extend the record further back in time and to sparsely sampled regions.
Networks GCOS Surface Network for SATs
Global synoptic stations for SATs
Voluntary Observing Ships (VOS) for SST and MAT
Global Tropical Moored Buoy Arrays (SST and MAT)
National networks of moored buoys, typically coastal (SST and MAT).
Surface Drifters (SST)
Argo Profiling Floats (sparse but accurate SST)
Satellites Neither SAT nor MAT can be retrieved from satellites with sufficient accuracy for global monitoring.
The most accurate SSTs are from the ATSR/SLSTR series (early 1990s ->)
SSTs are also available from other infrared (e.g. AVHRR, MODIS, VIRS) and microwave (e.g. SSM/I, TMI, GMI, AMSU) satellite sensors in various combinations starting in 1979.
Models, Reanalysis etc.
Global atmospheric reanalyses are much improved, particularly ERA5 (since 1979 but to be extended back to 1950) and JRA-55 (since 1958), but they are dependent on blended SST fields such as HadISST2 and COBE-SST2.
Discussion:
The ECV product - Global surface temperature climate record: The most widely used surface temperature ECV products are gridded products that combine Surface air temperatures over land (SAT) with sea surface temperatures (SST) across the world’s
41 SST is an ocean ECV and is covered in the Ocean Section A.2. However, as SST is used to compute the global average temperature, and often observing systems measure SST and MAT, information on SST can also be found here.
42 LST (Land Surface Temperature) is a terrestrial ECV and is covered in the Terrestrial Section A.3.
- 89 -
surface at monthly and more recently at daily timescales. It is these gridded products that provide the key metric in climatology that shows that the world has warmed by over a degree Celsius since the late nineteenth century. A more consistent global temperature product would combine SAT with marine air temperatures (MAT) but this has not yet been attempted. The gridded temperature products are also essential for adaptation to climate change and to the study of changes in extremes.
Observations over land: Surface air temperatures (SATs) have been measured in parts of Europe since the seventeenth Century. Spatial coverage improved gradually with relatively stable counts since the 1950s although this hides regional improvements /degradations in the observing system. Apparent performance over time can be misleading owing to data policies and archival ingest latencies. Antarctica was the last continent to get measurements, with about 30 sites in Antarctica reporting daily and monthly instrumental climate observations since the International Geophysical Year (IGY) in 1958, and a few having records beginning in the 1940s, with variable consistency and confidence. Coverage is also sparse in other remote regions, such as the Arctic, desert regions and all tropical rain forests. Much more data has historically been taken across the world’s land areas than is available in global datasets. Some of this is down to digitized data not being shared globally, while much data in some countries remains to be made digitally available. How SATs have been measured has changed over the centuries. The standard since the middle-to-late nineteenth century has been using thermometers protected from the sun in a white louvred screen, generally 1.25 to 2 m above the ground, and read manually. Since the 1980s, automation has gradually spread across the world with most observations taken now by Automatic Weather Stations (AWSs) giving a much greater potential for more readings per day, but this has not been fully realized in archives. There is no accepted WMO standard for how the average daily or monthly SAT should be measured.
Observations over the oceans: For ocean regions there are two different measures, air temperature (marine air temperature, MAT) and the temperature of the sea just below the sea surface (sea surface temperature, SST), which is covered in detail in the Ocean Section (Section C). Historically, temperatures were recorded alongside other ECVs (pressure, wind, humidity and cloud) and the ship’s position in the ship’s log book. As ship observations have declined in coverage since the 1990s there has been a decline in coverage for MAT as ships are presently the only widely distributed source of MAT, with an increase for SST which is supplemented by the autonomous platforms. (Kent et al., 2019). More recently measurements of both MAT and SST are available from moored buoys, typically located in tropical or coastal regions. Surface drifters make a substantial contribution to the SST observing system since the 1990s, but do not typically measure MAT. A contribution for SST comes from the sparse but highly accurate Argo profiling floats.
MAT is measured at different heights above sea level on different platforms, typically 20 m or more on ships and a few metres on the autonomous platforms. The construction of consistent MAT records requires the measurement height to be known, along with an estimate of the temperature gradient between the observation height and the chosen reference height. Accurate adjustment requires estimates of local wind speed, air-sea temperature difference and humidity. Likewise, for SST, development of corrections for large differences between SST measured on different platforms, with different methods and at different depths also requires observational metadata and information on ambient conditions.
- 90 -
Data and metadata stewardship: The climate record for in situ MAT and SST from ships and surface drifters for recent decades is based largely on observations exchanged in near real time (NRT) in support of weather forecasting. Availability of observational metadata will improve if BUFR templates are diligently completed, supplementing metadata catalogued by JCOMMOPS. Archives of NRT observations are retained by several NMHS, but there is no dedicated archive specifically responsible for their direct acquisition and stewardship. In contrast for surface drifters and Argo there are dedicated global centres to collect, process and add-value to the real time observations. Moored buoy observations are typically available in both near real time and at higher resolution with calibration following mooring visits. Global Collecting Centres provide added-value data for Voluntary Observing Ships (VOS) data, but only a subset of VOS reports become available through this route.
The ISTI databank provides access to an array of monthly resolution SAT over land. GHCND provides access to many long-term daily records globally. Work by NOAA NCEI and C3S is increasing accessibility to synoptic resolution data. Several NMHS and non-NMHS organizations maintain datasets of sub-daily observations and daily and monthly averages in addition.
Large volumes of all types of surface temperature observations (SAT, MAT, SST) are available in paper records or on archaic media or obsolete formats such as proprietary binary. Resources to identify, catalogue, image and rescue this data would enhance and extend the surface temperature record, recognising that incorporating newly rescued data into the climate archives also requires substantial effort and resources.
Networks: SAT measurements are transmitted using standard messages (SYNOP, CLIMAT) over the WIS network and about 1000 have been designated as the GCOS Surface Network. Most countries maintain more stations than are listed on GBON, and a small number (e.g. United States, Canada, Australia, Fennoscandian countries, Netherlands) make these data available (but often not in NRT) on their websites. For many countries the number internationally exchanged is limited, sometimes because of resources, sometimes due to there being few stations in remote regions and other times due to national data policy.
The WMO Voluntary Observing Ships (VOS) program co-ordinates measurement and NRT transmission of marine meteorological and oceanographic measurements made aboard ships recruited to national or regional observing VOS networks. Many VOS reports include SSTs and MATs alongside other near-surface observations required for adjustment of temperatures to a common reference height (wind speed, humidity). Limited observational metadata (observing methods and heights) is available within the reports, and more extensive metadata elements reports can be accommodated in new BUFR templates. The metadata is supplemented by a metadata database being established by JCOMM based on WMO Publication No. 47. Decline in the VOS network has resulted in a decline in the number of ships reporting MAT giving a decline in coverage (Kent et al., 2019) and presently only SST and surface pressure are included as marine ECVs for the GBON.
Research vessels have the potential to make high-quality observations of many surface ECVs, including SST and MAT but their observations are not consistently used for global monitoring as there is no internationally coordinated management system for their data.
Global Tropical Moored Buoy Arrays provide the broadest range of ECVs including both SST and MAT since the late 1970s in the Tropical Pacific and more recently extended to the Tropical Atlantic and Indian Oceans. Observations are transmitted in NRT, and these
- 91 -
are supplemented with delayed mode observations from on-board logging retrieved when the moorings are replaced which also provides the potential for post-calibration if the instruments have survived.
National operational networks of moored buoys, typically in coastal locations, provide measurements of a range of ECVs in NRT including SST and MAT. These buoys have not historically been managed for climate applications, so some archived records have limited metadata and provenance.
Surface Drifters provide NRT measurements of SST and SLP, but some also record MAT. They are capable of providing accurate measurements of SST at high temporal resolution but may drift off-calibration during deployment so require careful QC. Observations are sparse in upwelling and divergence regions. The surface drifter program was established in the late 1970s and reached its design goal of 1250 drifters in 2005 – although sampling density has recently declined.
Argo Profiling Floats provide sparse but accurate SST from approximately 3000 floats which surface approximately every 10 days.
Satellite observations: Satellite measurements began to be used in the 1970s for SSTs, measuring the surface skin temperature (the top 1mm of the sea) by a variety of means. The combination of in situ measurements from ships, drifters and floats with satellite estimates, provides high temporal and spatial resolutions fields of SSTs, essential for weather forecasts and Reanalyses. Satellites cannot accurately measure MAT or SAT, but over terrestrial areas they measure the temperature of the land surface.
Reanalysis: Atmospheric reanalysis requires gridded fields of SST as a lower boundary condition, this places a requirement for higher resolution both spatially and temporally. Some atmospheric reanalyses assimilate MAT and SAT in addition to pressure observations. Modern reanalysis products (such as 20CRv3 since 1851, JRA55 since 1958 and ERA5 since 1979) produce estimates of surface temperatures that are in broad agreement with other estimates. Coupled reanalyses assimilate SST rather than using gridded fields as boundary conditions, but surface temperature estimates are required either for assimilation or validation. Ocean reanalyses or state estimates are not typically used for surface temperature monitoring.
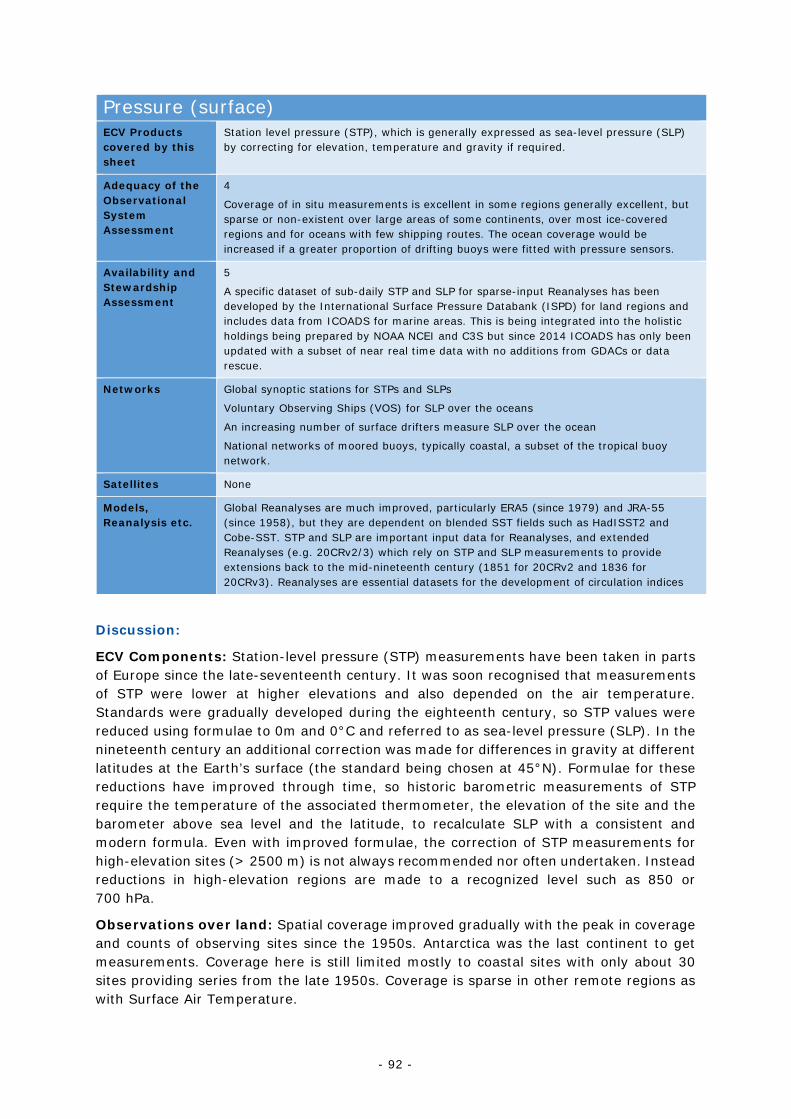
- 92 -
Pressure (surface) ECV Products covered by this sheet
Station level pressure (STP), which is generally expressed as sea-level pressure (SLP) by correcting for elevation, temperature and gravity if required.
Adequacy of the Observational System Assessment
4
Coverage of in situ measurements is excellent in some regions generally excellent, but sparse or non-existent over large areas of some continents, over most ice-covered regions and for oceans with few shipping routes. The ocean coverage would be increased if a greater proportion of drifting buoys were fitted with pressure sensors.
Availability and Stewardship Assessment
5
A specific dataset of sub-daily STP and SLP for sparse-input Reanalyses has been developed by the International Surface Pressure Databank (ISPD) for land regions and includes data from ICOADS for marine areas. This is being integrated into the holistic holdings being prepared by NOAA NCEI and C3S but since 2014 ICOADS has only been updated with a subset of near real time data with no additions from GDACs or data rescue.
Networks Global synoptic stations for STPs and SLPs
Voluntary Observing Ships (VOS) for SLP over the oceans
An increasing number of surface drifters measure SLP over the ocean
National networks of moored buoys, typically coastal, a subset of the tropical buoy network.
Satellites None
Models, Reanalysis etc.
Global Reanalyses are much improved, particularly ERA5 (since 1979) and JRA-55 (since 1958), but they are dependent on blended SST fields such as HadISST2 and Cobe-SST. STP and SLP are important input data for Reanalyses, and extended Reanalyses (e.g. 20CRv2/3) which rely on STP and SLP measurements to provide extensions back to the mid-nineteenth century (1851 for 20CRv2 and 1836 for 20CRv3). Reanalyses are essential datasets for the development of circulation indices
Discussion:
ECV Components: Station-level pressure (STP) measurements have been taken in parts of Europe since the late-seventeenth century. It was soon recognised that measurements of STP were lower at higher elevations and also depended on the air temperature. Standards were gradually developed during the eighteenth century, so STP values were reduced using formulae to 0m and 0°C and referred to as sea-level pressure (SLP). In the nineteenth century an additional correction was made for differences in gravity at different latitudes at the Earth’s surface (the standard being chosen at 45°N). Formulae for these reductions have improved through time, so historic barometric measurements of STP require the temperature of the associated thermometer, the elevation of the site and the barometer above sea level and the latitude, to recalculate SLP with a consistent and modern formula. Even with improved formulae, the correction of STP measurements for high-elevation sites (> 2500 m) is not always recommended nor often undertaken. Instead reductions in high-elevation regions are made to a recognized level such as 850 or 700 hPa.
Observations over land: Spatial coverage improved gradually with the peak in coverage and counts of observing sites since the 1950s. Antarctica was the last continent to get measurements. Coverage here is still limited mostly to coastal sites with only about 30 sites providing series from the late 1950s. Coverage is sparse in other remote regions as with Surface Air Temperature.
- 93 -
Observations over the oceans: Historically, ships measured STP, first on research vessels, but more widely on merchant and navy ships since the 1830s. SLP is typically reported by ships requiring adjustment on board. Measurements were recorded with other surface ECVs (air temperature, sea surface temperature, wind, humidity and cloud) in the ship’s logbook, which also recorded the position of the ship at sea, although position was often reported less frequently. Logbooks were and still are important documents providing vital information about the journey and of life at sea. They have been archived at a variety of centres in many maritime countries around the world. The information in some of these logbooks began to be digitized in the 1970s and much has found its way into the ICOADS since that time.
Use for weather and storm forecasting: The primary reason for pressure measurement has been weather and storm forecasting from the mid-nineteenth century, both on land, but also at sea to reduce the number of ships lost to adverse weather. Measurements at sea became a requirement from the Brussels congress in 1853 and when possible ships began to transmit SLP measurements by radio to shore in real time. SLP data are also used to track tropical and mid-latitude storm tracks and intensities. Century-scale variability in indices of storminess and wind speeds in mid-latitudes can be assessed using sub-daily and daily SLP data.
Circulation indices: SLP measurements at key stations have historically been used for many circulation indices (e.g. the North Atlantic Oscillation and the Southern Oscillation to name but two). A few climatologists noticed out-of-phase relationships between somewhat distant sites which explained features of temperature and precipitation variability. Series for many indices are still derived from key stations, but modern studies base analyses on modes of circulation variability derived from mathematical analyses (e.g. EOF, PCA etc.) of the sequence of circulation maps from the nineteenth century to the present. Gridded SLP datasets such as HadSLP2 have been widely used, but Reanalysis datasets are more commonly used today.
Data and metadata stewardship: Until the advent of reanalyses, historic measurements were considered less important than air temperatures or precipitation totals. For marine regions, much effort has been undertaken in to locate, scan and digitize more of the logbook information that it is still believed to lie dormant in archives around the world. Similarly for land, sub-daily SLP and STP measurements have been digitized, specifically with extended reanalysis in mind. All the data makes its way into ISPD and ICOADS, but neither are official archives. ICOADS has only added a subset of near real time data to its archive since 2014 and ISPD is maintained through small contributions from research budgets. Recognising this, NOAA NCEI and C3S are incorporating and extending land observations in ISPD via their work to address IP Action A2.
Large volumes of STP and SLP data are available in paper records or on archaic media or obsolete formats such as proprietary binary. Resources to identify, catalogue, image and rescue this data would enhance and extend the pressure records, recognising that incorporating newly rescued data into the climate archives also requires substantial effort and resources.
Networks: SLP and STP measurements are transmitted using standard messages (SYNOP, CLIMAT) on the WIS. Most countries maintain more stations than are listed in the Global Basic Observing Network (GBON), and a small number (e.g. United States, Canada, Australia, Fennoscandian countries, Netherlands) make these data available on their
- 94 -
websites. For many countries the number internationally exchanged is limited, sometimes because of resources, but sometimes due to there being few stations in remote regions.
The WMO Voluntary Observing Ships (VOS) program co-ordinates measurement and NRT transmission of marine meteorological and oceanographic measurements made aboard ships recruited to national or regional observing VOS networks. Most VOS reports include SLP alongside other near-surface observations. Limited observational metadata (observing methods and heights) is available within the reports, and more extensive metadata elements reports can be accommodated in new BUFR templates. The metadata is supplemented by a metadata database being established by JCOMM based on WMO Publication No. 47.
Research vessels have the potential to make high-quality observations of many surface ECVs, including pressure but their observations are not consistently used for global monitoring as there is no internationally co-ordinated management system for their data.
Global Tropical Moored Buoy Arrays have only recently begun to report pressure on a subset of moorings.
National operational networks of moored buoys, typically in coastal locations, provide measurements of a range of ECVs in NRT including pressure. These buoys have not historically been managed for climate applications so some archived records have limited metadata and provenance.
Surface Drifters provide NRT measurements of SST and SLP. They are capable of providing accurate measurements of SLP at high temporal resolution. Observations are sparse in upwelling and divergence regions. The surface drifter program was established in the late 1970s and reached its design goal of 1250 drifters in 2005 – although sampling density has recently declined.
Reanalyses: All Reanalysis products are very dependent on STP and SLP measurements, particularly so for 20CRv3/2 since 1835/1851, slightly less so for JRA55 since 1958 and ERA5 since 1950. Reanalyses have improved since the 1990s, and a simple metric of this is to calculate the average sea-level pressure of the dry mass of the atmosphere (Hersbach et al., 2020) across the world. This metric should be relatively constant from year to year. Assessments are also essential for their use in data sparse regions such the Antarctic, the central Arctic and the Southern Oceans.
References:
Hersbach,H., B. Bell, P. Berrisford, S. Hirahara, A. Horányi, J. Muñoz-Sabater, J. Nicolas, C. Peubey, R. Radu, D. Schepers, A. Simmons, C. Soci, S. Abdalla, X. Abellan, G. Balsamo, P. Bechtold, G. Biavati, J. Bidlot, M. Bonavita, G. De Chiara, P. Dahlgren, D. Dee, M. Diamantakis, R. Dragani, J. Flemming, R. Forbes, M. Fuentes, A. Geer, L. Haimberger, S. Healy, R. J. Hogan, E. Hólm, M. Janisková, S. Keeley, P. Laloyaux, P. Lopez, C. Lupu, G. Radnoti, P. de Rosnay, I. Rozum, F. Vamborg, S. Villaume and J.-. Thépaut, 2020: The ERA5 global reanalysis. Q. J. R. Meteorol. Soc., 146:1999–2049. https://doi.org/10.1002/qj.3803
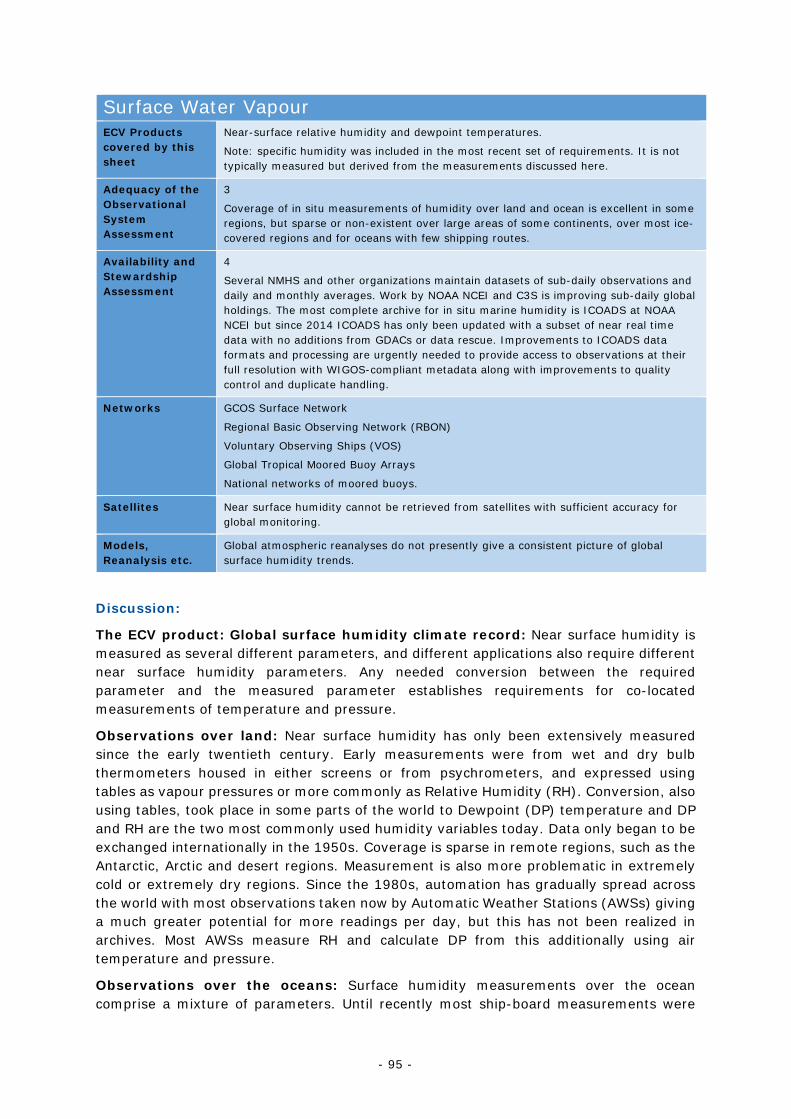
- 95 -
Surface Water Vapour ECV Products covered by this sheet
Near-surface relative humidity and dewpoint temperatures.
Note: specific humidity was included in the most recent set of requirements. It is not typically measured but derived from the measurements discussed here.
Adequacy of the Observational System Assessment
3
Coverage of in situ measurements of humidity over land and ocean is excellent in some regions, but sparse or non-existent over large areas of some continents, over most ice-covered regions and for oceans with few shipping routes.
Availability and Stewardship Assessment
4
Several NMHS and other organizations maintain datasets of sub-daily observations and daily and monthly averages. Work by NOAA NCEI and C3S is improving sub-daily global holdings. The most complete archive for in situ marine humidity is ICOADS at NOAA NCEI but since 2014 ICOADS has only been updated with a subset of near real time data with no additions from GDACs or data rescue. Improvements to ICOADS data formats and processing are urgently needed to provide access to observations at their full resolution with WIGOS-compliant metadata along with improvements to quality control and duplicate handling.
Networks GCOS Surface Network
Regional Basic Observing Network (RBON)
Voluntary Observing Ships (VOS)
Global Tropical Moored Buoy Arrays
National networks of moored buoys.
Satellites Near surface humidity cannot be retrieved from satellites with sufficient accuracy for global monitoring.
Models, Reanalysis etc.
Global atmospheric reanalyses do not presently give a consistent picture of global surface humidity trends.
Discussion:
The ECV product: Global surface humidity climate record: Near surface humidity is measured as several different parameters, and different applications also require different near surface humidity parameters. Any needed conversion between the required parameter and the measured parameter establishes requirements for co-located measurements of temperature and pressure.
Observations over land: Near surface humidity has only been extensively measured since the early twentieth century. Early measurements were from wet and dry bulb thermometers housed in either screens or from psychrometers, and expressed using tables as vapour pressures or more commonly as Relative Humidity (RH). Conversion, also using tables, took place in some parts of the world to Dewpoint (DP) temperature and DP and RH are the two most commonly used humidity variables today. Data only began to be exchanged internationally in the 1950s. Coverage is sparse in remote regions, such as the Antarctic, Arctic and desert regions. Measurement is also more problematic in extremely cold or extremely dry regions. Since the 1980s, automation has gradually spread across the world with most observations taken now by Automatic Weather Stations (AWSs) giving a much greater potential for more readings per day, but this has not been realized in archives. Most AWSs measure RH and calculate DP from this additionally using air temperature and pressure.
Observations over the oceans: Surface humidity measurements over the ocean comprise a mixture of parameters. Until recently most ship-board measurements were
- 96 -
from wet and dry bulb thermometers housed in either screens or psychrometers. Dewpoint temperature was calculated on board ship using tables or by electronic logbook software. Both measures were typically recorded and transmitted. More recently relative humidity (RH) sensors have become common as part of Automatic Weather Station (AWS) installations. Historically, humidity observations were recorded alongside other ECVs (pressure, wind, temperatures and cloud) and the ship’s position in the ship’s logbook. More recently humidity measurements are also available from moored buoys, typically located in tropical or coastal regions. As most of the coverage of near surface humidity measurements over the ocean comes from VOS, the decline in the number of VOS since the 1990s, combined with a decrease in the proportion of VOS reports containing humidity, there has been an overall decline in coverage for marine humidity (Kent et al., 2019). Humidity is measured at different heights above sea level on different platforms, typically 20 metres or more on ships and a few metres on the autonomous platforms. The construction of consistent humidity records requires the measurement height to be known, along with an estimate of the humidity gradient between the observation height and the chosen reference height. Accurate adjustment requires estimates of local wind speed, air-sea temperature difference and humidity. Differences have been found between humidity measured using different methods, so homogenisation requires metadata giving measurement method and ideally other parameters such as airflow near the sensor.
Data and metadata stewardship: NOAA NCEI and C3S have made significant steps towards a global collection of near-surface humidity data measured over land, but much work remains to be done. Several National Meteorological and Hydrological Services (NMHS) and non-NMHS organizations maintain datasets of sub-daily observations and daily averages. As the conversion between humidity variables is non-linear and additionally requires air temperature and pressure, it is better that datasets maintain the original sub-daily measurements.
The most complete archive for in situ marine humidity is ICOADS at NOAA NCEI. Improvements to ICOADS data formats and processing are urgently needed. There is no dedicated data centre for the archival of marine observations from the GTS. A separate archive exists for the tropical moored buoys. The climate record for in situ surface humidity from ships for recent decades is based largely on observations exchanged in near real time (NRT) in support of weather forecasting. Observational coverage has declined over the past decade as some ships have ceased measurement or operation. Availability of observational metadata will improve if BUFR templates are diligently completed, supplementing metadata catalogued by JCOMMOPS. Archives of NRT observations are retained by several NMHS and some progress has been made toward global stewardship by NCEI and C3S. Moored buoy observations are typically available in both near real time and at higher resolution with calibration following mooring visits. Global Collecting Centres provide added-value data for Voluntary Observing Ships (VOS) data, but only a subset of VOS reports become available through this route.
Large volumes of all types of surface humidity observations are available in paper records or on archaic media or obsolete formats such as proprietary binary. Resources to identify, catalogue, image and rescue this data would enhance and extend the surface record, recognising that incorporating newly rescued data into the climate archives also requires substantial effort and resources.
Networks: Over land near-surface humidity measurements are transmitted using standard messages (SYNOP, CLIMAT) over the WIS. Most countries maintain more stations than are listed in RBON, and a small number (e.g. United States, Canada, Australia,
- 97 -
Fennoscandian countries, Netherlands) make these data available (but often not in NRT) on their websites. For many countries the number internationally exchanged is limited, sometimes because of resources, but sometimes due to there being few stations in remote regions.
The WMO Voluntary Observing Ships (VOS) program co-ordinates measurement and NRT transmission of marine meteorological and oceanographic measurements made aboard ships recruited to national or regional observing VOS networks. Many VOS reports include humidity alongside other near-surface observations required for adjustment of temperatures to a common reference height (near-surface wind speed, air and sea temperatures). Conversion between different measures of humidity may additional require co-located measurements of temperature or pressure. Limited observational metadata (observing methods and heights) is available within the reports, and more extensive metadata elements reports can be accommodated in new BUFR templates. The metadata within reports is supplemented by a metadata database being established by JCOMM based on WMO Publication No. 47.
Research vessels have the potential to make high-quality observations of many surface ECVs, including humidity but their observations are not consistently used for global monitoring as there is no internationally co-ordinated management system for their data.
Global Tropical Moored Buoy Arrays provide the broadest range of ECVs including humidity since the late 1970s in the Tropical Pacific and more recently extended to the Tropical Atlantic and Indian Oceans. Observations are transmitted in NRT, and these are supplemented with delayed mode observations from on-board logging retrieved when the moorings are replaced which also provides the potential for post-calibration if the instruments have survived.
National operational networks of moored buoys, typically in coastal locations, provide measurements of a range of ECVs in NRT, some including humidity. These buoys have not historically been managed for climate applications so some archived records have limited metadata and provenance.
Reanalysis: Reanalysis products include near-surface humidity output which has been used in BAMS State of the Climate series, C3S monitoring and compared to data in Simmons et al. (2010) and ECMWF Tech Memo 881. Humidity suitability from reanalysis is dependent upon the reanalysis system and is regionally dependent.
References:
Kent, E. C., N. A. Rayner, D. I. Berry, R. Eastman, V. Grigorieva, B. Huang, J. J. Kennedy, S. R. Smith and K. M. Willett, 2019: Observing requirements for long-term climate records at the ocean surface, Frontiers in Marine Science 6:441. doi: 10.3389/fmars.2019.00441
Simmons, A. J., K.M. Willett, P.D. Jones, P. W. Thorne and D.P Dee, D. P., 2010: Low-frequency variations in surface atmospheric humidity, temperature, and precipitation: Inferences from reanalyses and monthly gridded observational data sets, Journal of Geophysical Research, 115, D01110, doi:10.1029/2009JD012442. ECMWF Technical Memo, 881. 10.21957/ly5vbtbfd
Simmons, A.J., H. Hersbach, J. Muñoz-Sabater, J. Nicolas, F. Vamborg, P. Berrisford, P. de Rosnay, K. Willett and J. Woollen, 2021: Low frequency variability and trends in surface air temperature and humidity from ERA5 and other datasets.
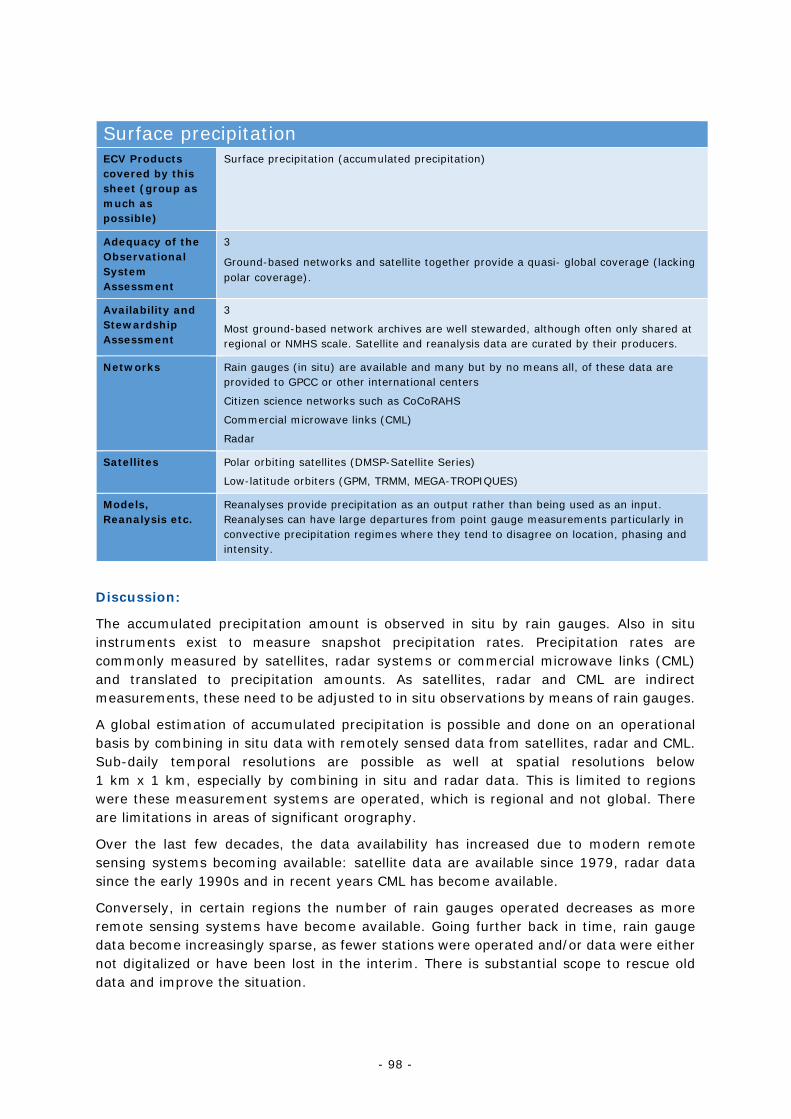
- 98 -
Surface precipitation ECV Products covered by this sheet (group as much as possible)
Surface precipitation (accumulated precipitation)
Adequacy of the Observational System Assessment
3
Ground-based networks and satellite together provide a quasi- global coverage (lacking polar coverage).
Availability and Stewardship Assessment
3
Most ground-based network archives are well stewarded, although often only shared at regional or NMHS scale. Satellite and reanalysis data are curated by their producers.
Networks Rain gauges (in situ) are available and many but by no means all, of these data are provided to GPCC or other international centers
Citizen science networks such as CoCoRAHS
Commercial microwave links (CML)
Radar
Satellites Polar orbiting satellites (DMSP-Satellite Series)
Low-latitude orbiters (GPM, TRMM, MEGA-TROPIQUES)
Models, Reanalysis etc.
Reanalyses provide precipitation as an output rather than being used as an input. Reanalyses can have large departures from point gauge measurements particularly in convective precipitation regimes where they tend to disagree on location, phasing and intensity.
Discussion:
The accumulated precipitation amount is observed in situ by rain gauges. Also in situ instruments exist to measure snapshot precipitation rates. Precipitation rates are commonly measured by satellites, radar systems or commercial microwave links (CML) and translated to precipitation amounts. As satellites, radar and CML are indirect measurements, these need to be adjusted to in situ observations by means of rain gauges.
A global estimation of accumulated precipitation is possible and done on an operational basis by combining in situ data with remotely sensed data from satellites, radar and CML. Sub-daily temporal resolutions are possible as well at spatial resolutions below 1 km x 1 km, especially by combining in situ and radar data. This is limited to regions were these measurement systems are operated, which is regional and not global. There are limitations in areas of significant orography.
Over the last few decades, the data availability has increased due to modern remote sensing systems becoming available: satellite data are available since 1979, radar data since the early 1990s and in recent years CML has become available.
Conversely, in certain regions the number of rain gauges operated decreases as more remote sensing systems have become available. Going further back in time, rain gauge data become increasingly sparse, as fewer stations were operated and/or data were either not digitalized or have been lost in the interim. There is substantial scope to rescue old data and improve the situation.
- 99 -
The surface observing capability remains deficient over certain regions, most notably Africa and the Oceans and the High Asia Mountain, and the situation has not improved since GCOS IP 2016. Precipitation observations taken at synoptic stations are generally shared in near real time as part of the global SYNOP data stream. But this is solely a small component of the total observing system. In addition, data are provided to the international data centre GPCC and to NOAA NCEI, with a focus on daily and monthly aggregations. The citizen science Community Collaborative Rain, Hail and Snow Network (CoCoRAHS) network and similar networks such as weather WOW have greatly increased daily coverage over some regions. Concerning the citizen science networks their governance, sustainability, archival, accessibility, representativity, and uncertainty needs to be evaluated in a more thorough way.
RADAR remotely sensed precipitation data are only sparsely located and shared.
Weather radars have been widely used to detect and quantify precipitation and nowcast severe weather for more than 50 years. But, they are often patchy and heterogeneous. In recent years some progress has been made to provide guidance to the NMHSs. A dedicated task team from GCOS-AOPC has addressed this topic and a few recommendations by Saltikoff et al. (2019) have been published, to preserve the datasets for the future climatologists.
From MW imagers and microwave soundings with satellite instruments precipitation can be determined. They are in an operational sustained status and have good continuity into the 2040s, which is assured by the space agencies. The satellite precipitation data is generated, archived, and distributed by the responsible space agencies in near-real time.
Extremes can be captured by the observing system and are evaluated e.g. by the NHMS’s and the WMO. However, the capturing capability is subdued to a large spatial variability. This shrinks the ability to evaluation the simulation of extreme precipitation on the global scale at a comparable quality. Agreed methods based on guidance by WMO are applied.
For reanalyses and global modelling precipitation remains a major challenge. as reported by several authors (Kaiser-Weiss et al., 2019; Lockhoff et al., 2019; Steinke et al., 2019; Kaspar et al., 2020; Rustemeier et al., 2019, when comparing reanalyses or results from global models with the surface-based observation on a global scale. It is reported that the global reanalyses are often not able to capture for example the occurrence of heavy precipitation events. Overall is noted that model evaluation is hampered by a general inconsistency between observed data sets of precipitation. However, taking the more recent high-resolution reanalyses, the matches are getting better with an improved coherence with independent observations (see review paper by Kaspar et al., 2020).
References:
Lockhoff, M., O. Zolina, C. Simmer, and J. Schulz, 2019: Representation of Precipitation Characteristics and Extremes in Regional Reanalyses and Satellite- and Gauge-Based Estimates over Western and Central Europe. Journal of Hydrometeorology, 20(6), 1123-1145. https://doi.org/10.1175/JHM-D-18-0200.1
Kaiser-Weiss, A.K., M. Borsche, D. Niermann, F. Kaspar, C. Lussana, F. A. Isotta, E. van den Besselaar, G. van der Schrier and P. Undén, 2019: Added value of regional reanalyses for climatological applications. Environ. Res. Commun. 1 071004.
Kaspar F., D. Niermann, M. Borsche, S. Fiedler, J. Keller, R. Potthast, T. Rösch, T. Spangeh and B. Tinz, 2020: Regional atmospheric reanalysis activities at Deutscher Wetterdienst:
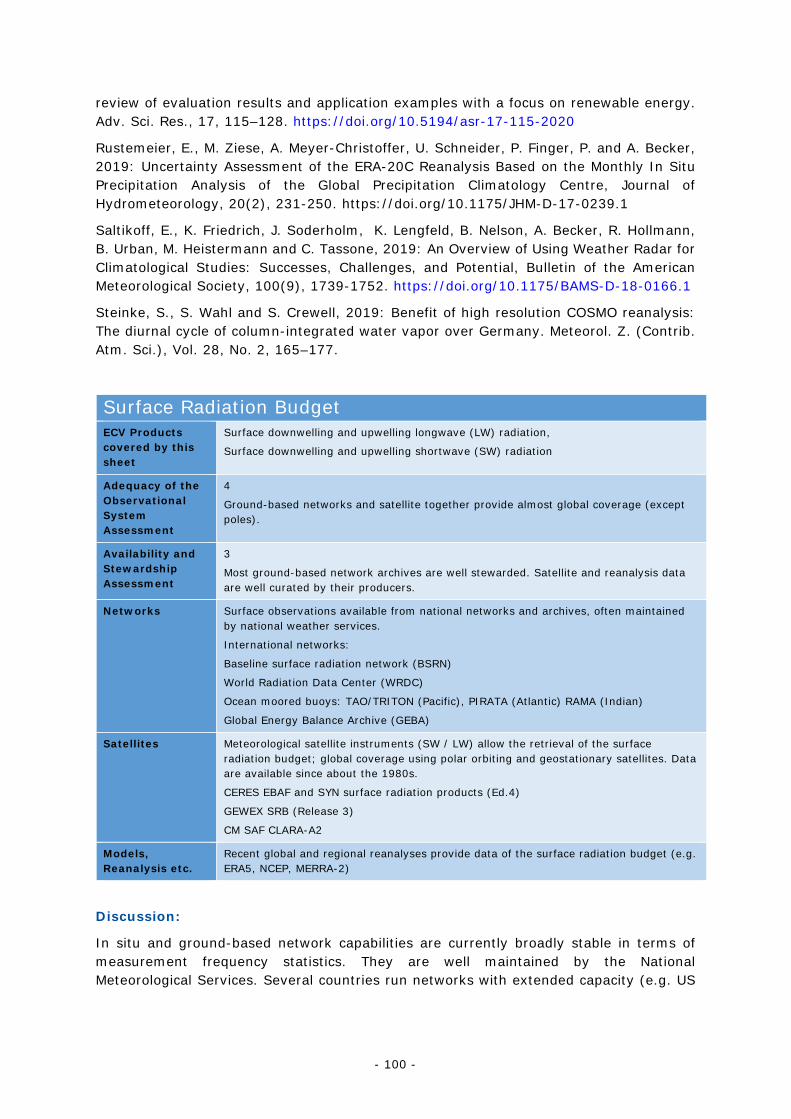
- 100 -
review of evaluation results and application examples with a focus on renewable energy. Adv. Sci. Res., 17, 115–128. https://doi.org/10.5194/asr-17-115-2020
Rustemeier, E., M. Ziese, A. Meyer-Christoffer, U. Schneider, P. Finger, P. and A. Becker, 2019: Uncertainty Assessment of the ERA-20C Reanalysis Based on the Monthly In Situ Precipitation Analysis of the Global Precipitation Climatology Centre, Journal of Hydrometeorology, 20(2), 231-250. https://doi.org/10.1175/JHM-D-17-0239.1
Saltikoff, E., K. Friedrich, J. Soderholm, K. Lengfeld, B. Nelson, A. Becker, R. Hollmann, B. Urban, M. Heistermann and C. Tassone, 2019: An Overview of Using Weather Radar for Climatological Studies: Successes, Challenges, and Potential, Bulletin of the American Meteorological Society, 100(9), 1739-1752. https://doi.org/10.1175/BAMS-D-18-0166.1
Steinke, S., S. Wahl and S. Crewell, 2019: Benefit of high resolution COSMO reanalysis: The diurnal cycle of column-integrated water vapor over Germany. Meteorol. Z. (Contrib. Atm. Sci.), Vol. 28, No. 2, 165–177.
Surface Radiation Budget ECV Products covered by this sheet
Surface downwelling and upwelling longwave (LW) radiation,
Surface downwelling and upwelling shortwave (SW) radiation
Adequacy of the Observational System Assessment
4
Ground-based networks and satellite together provide almost global coverage (except poles).
Availability and Stewardship Assessment
3
Most ground-based network archives are well stewarded. Satellite and reanalysis data are well curated by their producers.
Networks Surface observations available from national networks and archives, often maintained by national weather services.
International networks:
Baseline surface radiation network (BSRN)
World Radiation Data Center (WRDC)
Ocean moored buoys: TAO/TRITON (Pacific), PIRATA (Atlantic) RAMA (Indian)
Global Energy Balance Archive (GEBA)
Satellites Meteorological satellite instruments (SW / LW) allow the retrieval of the surface radiation budget; global coverage using polar orbiting and geostationary satellites. Data are available since about the 1980s.
CERES EBAF and SYN surface radiation products (Ed.4)
GEWEX SRB (Release 3)
CM SAF CLARA-A2
Models, Reanalysis etc.
Recent global and regional reanalyses provide data of the surface radiation budget (e.g. ERA5, NCEP, MERRA-2)
Discussion:
In situ and ground-based network capabilities are currently broadly stable in terms of measurement frequency statistics. They are well maintained by the National Meteorological Services. Several countries run networks with extended capacity (e.g. US
- 101 -
with the Atmospheric Radiation Measurement (ARM, US) or SURFRAD43 (NOAA, US) sites, Germany, France, China and other).
The measurements of surface radiation are mostly done for the solar radiation and to a lesser extent for the longwave component. The data are globally shared via the World Radiation Monitoring Center for the Baseline Surface Radiation Network (WRMC-BSRN) archive hosted at the Alfred Wegener Institute (AWI), the World Radiation Data Center (WRDC) and the Global Energy Balance Archive (GEBA). The progress in distributing surface radiation data in a regular way is still slow.
The in situ capability is deficient over certain regions, most notably Africa, Central Asia, the deep tropics, and over the oceans, even though the buoy-based measurements and their provision have improved over recent years. Existing gaps in the surface network can be filled by surface radiation estimates based on satellite data.
Although the BSRN network has expanded to cover many new climatic regions and is providing a useful reference for satellite observations, site closures are unavoidable. Since 2008, ten BSRN sites have been closed. Nevertheless, the BSRN overall performance has been largely stable and the data are provided with additional auxiliary data in order to support their analysis. It is worth noting, however, that some sites are not representative of their surrounding regions, which bears limitations when comparing to satellite pixels, and that only very few current / former BSRN stations are / have been located in Africa. Further reductions in the BSRN network density in Africa should be avoided. Currently, BSRN is considering nine candidate stations in India, Taiwan and other countries.
Under the guidance of WMO the WRDC collects, archives and distributes global in situ radiometric data to ensure the availability of these data for research by the international scientific community. The data have been provided to the WRDC by National Meteorological Services since the 1960s at predominantly daily and monthly temporal resolution.
The Global Tropical Moored Buoy Array (GTMBA) covers three buoy networks in the Pacific (TAO / TRITON), the Atlantic (PIRATA) and the Indian (RAMA) ocean. While these buoys are not primarily designed to measure surface radiation at the highest quality, they do provide very valuable radiation data at the ocean surface with high quality.
The Global Energy Balance Archive (GEBA) is meant to serve as a central database for the worldwide instrumentally measured energy fluxes at the surface, maintained by the Institute for Climate and Atmospheric Sciences at ETH Zürich, Switzerland. The GEBA database stores and provides monthly means of the various energy flux components observed at surface stations. The GEBA is based to a wide extent on data provided by the BSRN and the WRDC.
Satellite-derived data sets provide global coverage. Most satellite-derived data sets, in particular those provided by satellite agencies, are well curated by their producers and provide historical data sets up to 30 to 40 years.
The surface radiation can be estimated from SW/LW satellite measurements from meteorological satellites in the geostationary (e.g. Meteosat, GOES) and polar-orbiting (e.g. Terra, Aqua, the NOAA-satellite series, Metop) orbits, providing high temporal and spatial resolution (geostationary) and global coverage (polar-orbiting).
43 https://gml.noaa.gov/grad/surfrad/
- 102 -
It is important to note the Surface Radiation Budget from satellites measurements is estimated through an inversion process from the top of the atmosphere (ToA) radiance measurement or through radiative transfer calculations using observed surface and atmospheric properties as input and the ToA irradiances as a constraint. As for the solar radiation components a direct relationship exists between the surface radiation and the ToA radiation, this part of the surface radiation budget is often generated and distributed by the responsible satellite agency. For the solar radiation component, a strong market (Photovoltaic power generation) exists. However, the maturity and availability of satellite-derived data sets of the longwave surface radiation is much less pronounced and only a few agencies provide products in an operational mode.
Recent regional and global reanalysis data sets using the latest developments of modern reanalysis systems also provide data of the surface radiation budget with acceptable quality.
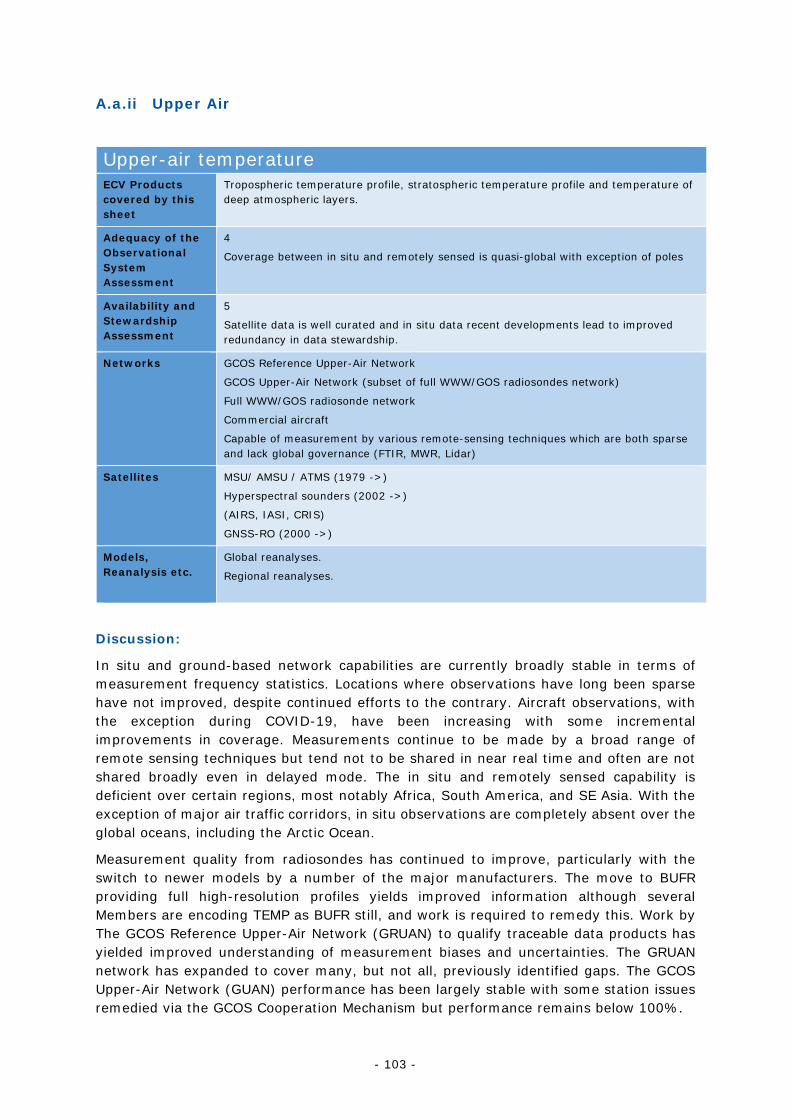
- 103 -
A.a.ii Upper Air
Upper-air temperature ECV Products covered by this sheet
Tropospheric temperature profile, stratospheric temperature profile and temperature of deep atmospheric layers.
Adequacy of the Observational System Assessment
4
Coverage between in situ and remotely sensed is quasi-global with exception of poles
Availability and Stewardship Assessment
5
Satellite data is well curated and in situ data recent developments lead to improved redundancy in data stewardship.
Networks GCOS Reference Upper-Air Network
GCOS Upper-Air Network (subset of full WWW/GOS radiosondes network)
Full WWW/GOS radiosonde network
Commercial aircraft
Capable of measurement by various remote-sensing techniques which are both sparse and lack global governance (FTIR, MWR, Lidar)
Satellites
MSU/ AMSU / ATMS (1979 ->)
Hyperspectral sounders (2002 ->)
(AIRS, IASI, CRIS)
GNSS-RO (2000 ->)
Models, Reanalysis etc.
Global reanalyses.
Regional reanalyses.
Discussion:
In situ and ground-based network capabilities are currently broadly stable in terms of measurement frequency statistics. Locations where observations have long been sparse have not improved, despite continued efforts to the contrary. Aircraft observations, with the exception during COVID-19, have been increasing with some incremental improvements in coverage. Measurements continue to be made by a broad range of remote sensing techniques but tend not to be shared in near real time and often are not shared broadly even in delayed mode. The in situ and remotely sensed capability is deficient over certain regions, most notably Africa, South America, and SE Asia. With the exception of major air traffic corridors, in situ observations are completely absent over the global oceans, including the Arctic Ocean.
Measurement quality from radiosondes has continued to improve, particularly with the switch to newer models by a number of the major manufacturers. The move to BUFR providing full high-resolution profiles yields improved information although several Members are encoding TEMP as BUFR still, and work is required to remedy this. Work by The GCOS Reference Upper-Air Network (GRUAN) to qualify traceable data products has yielded improved understanding of measurement biases and uncertainties. The GRUAN network has expanded to cover many, but not all, previously identified gaps. The GCOS Upper-Air Network (GUAN) performance has been largely stable with some station issues remedied via the GCOS Cooperation Mechanism but performance remains below 100%.
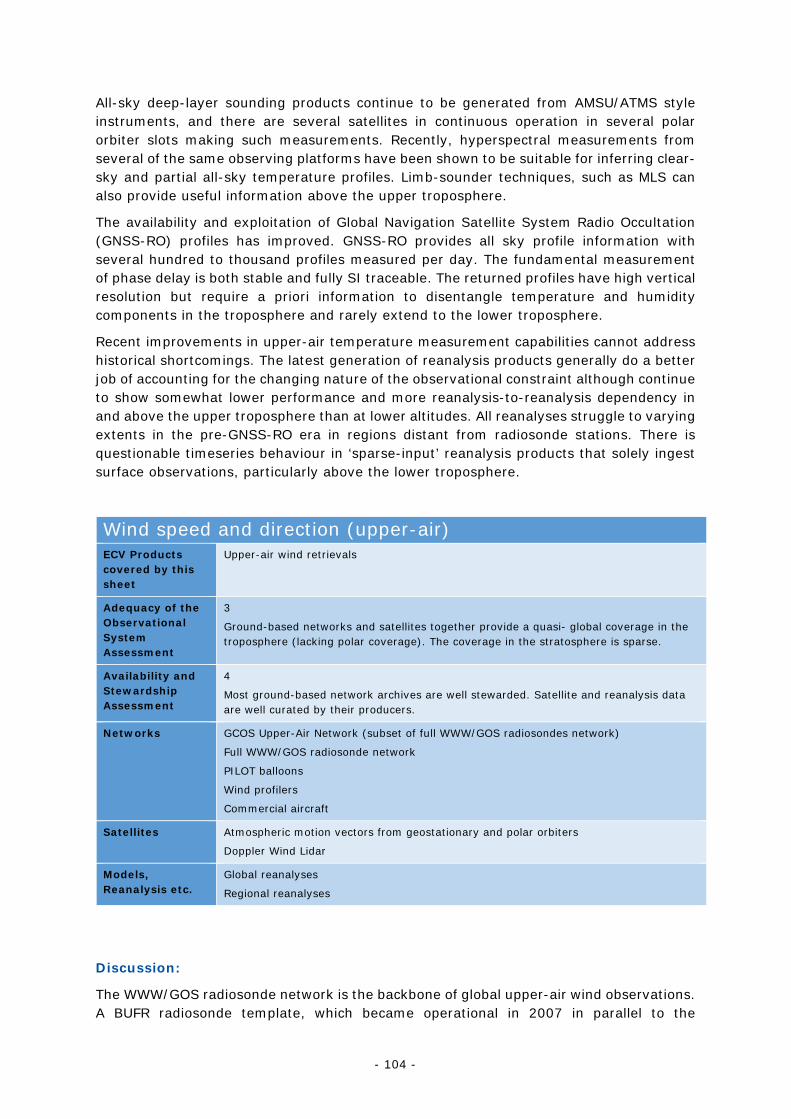
- 104 -
All-sky deep-layer sounding products continue to be generated from AMSU/ATMS style instruments, and there are several satellites in continuous operation in several polar orbiter slots making such measurements. Recently, hyperspectral measurements from several of the same observing platforms have been shown to be suitable for inferring clear-sky and partial all-sky temperature profiles. Limb-sounder techniques, such as MLS can also provide useful information above the upper troposphere.
The availability and exploitation of Global Navigation Satellite System Radio Occultation (GNSS-RO) profiles has improved. GNSS-RO provides all sky profile information with several hundred to thousand profiles measured per day. The fundamental measurement of phase delay is both stable and fully SI traceable. The returned profiles have high vertical resolution but require a priori information to disentangle temperature and humidity components in the troposphere and rarely extend to the lower troposphere.
Recent improvements in upper-air temperature measurement capabilities cannot address historical shortcomings. The latest generation of reanalysis products generally do a better job of accounting for the changing nature of the observational constraint although continue to show somewhat lower performance and more reanalysis-to-reanalysis dependency in and above the upper troposphere than at lower altitudes. All reanalyses struggle to varying extents in the pre-GNSS-RO era in regions distant from radiosonde stations. There is questionable timeseries behaviour in ‘sparse-input’ reanalysis products that solely ingest surface observations, particularly above the lower troposphere.
Wind speed and direction (upper-air) ECV Products covered by this sheet
Upper-air wind retrievals
Adequacy of the Observational System Assessment
3
Ground-based networks and satellites together provide a quasi- global coverage in the troposphere (lacking polar coverage). The coverage in the stratosphere is sparse.
Availability and Stewardship Assessment
4
Most ground-based network archives are well stewarded. Satellite and reanalysis data are well curated by their producers.
Networks GCOS Upper-Air Network (subset of full WWW/GOS radiosondes network)
Full WWW/GOS radiosonde network
PILOT balloons
Wind profilers
Commercial aircraft
Satellites Atmospheric motion vectors from geostationary and polar orbiters
Doppler Wind Lidar
Models, Reanalysis etc.
Global reanalyses
Regional reanalyses
Discussion:
The WWW/GOS radiosonde network is the backbone of global upper-air wind observations. A BUFR radiosonde template, which became operational in 2007 in parallel to the
- 105 -
alphanumeric TEMP code, offers many advantages such as the original sampling resolution with actual time and balloon position during ascent (Ingleby et al., 2016), but transition from TEMP to BUFR is still underway. Quite a few countries are reporting BUFR codes with no balloon drifting position information (i.e. reformatted from TEMP) or still reporting TEMP codes only44. A general trend in wind-finding technologies has been a switch from radiotheodolite or radar to GNSS, which significantly reduced measurement uncertainty (Ingleby, 2017).
Observations from commercial aircraft supplement the coverage provided by the WWW/GOS radiosonde network around major commercial air routes such over the United States, North Atlantic, Europe and North Pacific. The total number of observations increased by about 50 % from 2014 to 201945. The coverage over South America has especially improved through a new AMDAR program. Also, lower tropospheric observations over some islands in the tropical Indian Ocean and western Pacific became available since GCOS IP 2016.
Another source of wind information are the Atmospheric Motion Vectors (AMVs) obtained by tracking cloud elements between successive satellite images and assigning their height by measuring their temperature to provide “satellite winds”. Since this technique has been continuously improved to provide better observations for NWP (e.g. Santek et al., 2019), use of AMVs produced operationally in earlier periods is not adequate for climate applications such as reanalysis. In order to produce AMVs with homogeneous quality in time, reprocessing has been undertaken by European, Japanese and the United States producers. How far reprocessing can go back in time is subject to availability of successive images needed as input (typically < 1-hr interval) and the quality of those images (such as geolocation and calibration errors).
Another noteworthy development since GCOS IP 2016 is a successful launch of ESA’s long-awaited Aeolus mission, which carries a doppler lidar on board to measure wind profiles in the troposphere and lower stratosphere globally from a polar orbiter configuration (Witze, 2018). The doppler lidar instrument makes single-line-of-sight wind measurements, from which horizontal winds are derived through data assimilation or retrieval techniques. The satellite doppler lidar greatly improves the sampling over data sparse regions for the conventional observing systems such as the tropics and Southern Ocean.
Reanalyses can estimate wind fields for the whole atmosphere with data assimilation techniques, which combine model forecasts with information from a variety of observations and generate analysis fields as the most probable state of the atmosphere in a spatiotemporally regular manner. Changes in observing systems are better handled in the latest-generation reanalyses than previous ones, but still remain an issue in improving their temporal consistency. Therefore, care should be taken when reanalysis is used for investigating low-frequency variabilities and trends in the climate system.
Observations in the upper stratosphere and mesosphere are sparse, but there are some available from research-based radar wind profilers (e.g. Sato et al., 2014), which are useful for evaluating wind fields from reanalysis.
References:
44 https://confluence.ecmwf.int/display/TCBUF/Monitoring+Maps 45 https://www.wmo.int/pages/prog/www/GOS/ABO/data/ABO_Data_Statistics.html
- 106 -
Ingleby, B., P. Pauley, A. Kats, A., J. Ator, D. Keyser, A. Doerenbecher, E. Fucile, J. Hasegawa, E. Toyoda, T. Kleinert, W. Qu, J. St. James, W. Tennant and R. Weedon, 2016: Progress toward High-Resolution, Real-Time Radiosonde Reports, Bulletin of the American Meteorological Society, 97(11), 2149-2161. https://doi.org/10.1175/BAMS-D-15-00169.1
Ingleby, B., 2017: An assessment of different radiosonde types 2015/2016, European Centre for Medium Range Weather Forecasts, available at: https://www.ecmwf.int/search/elibrary.
Santek D., R. Dworak, S. Nebuda, S. Wanzong, R. Borde, I. Genkova, J. García-Pereda, R. Galante Negri, M. Carranza, K. Nonaka, K. Shimoji, S.M. Oh, B.-I. Lee, S.-R. Chung, J. Daniels and W. Bresky, 2018: Atmospheric Motion Vector (AMV) Intercomparison Study. Remote Sensing, 11(19):2240. https://doi.org/10.3390/rs11192240
Sato, K., M. Tsutsumi, T. Sato, T. Nakamura, A. Saito, Y. Tomikawa, K. Nishimura, M. Kohma, H. Yamagishi, and T. Yamanouchi, 2014: Program of the Antarctic Syowa MST/IS radar (PANSY). Journal of Atmospheric and Solar-Terrestrial Physics, 118, 2−15.
Witze Alexandra, 2018: World’s first wind-mapping satellite set to launch. Nature, 560, 420-421. https://doi.org/10.1038/d41586-018-05976-3
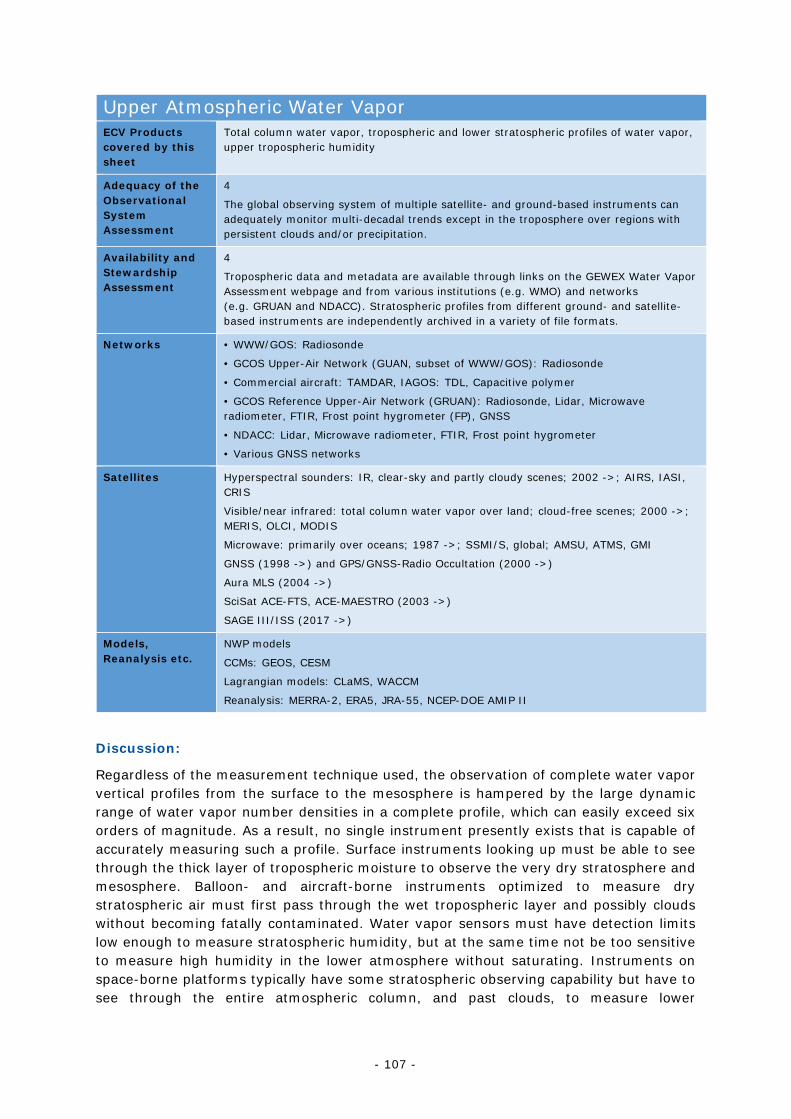
- 107 -
Upper Atmospheric Water Vapor ECV Products covered by this sheet
Total column water vapor, tropospheric and lower stratospheric profiles of water vapor, upper tropospheric humidity
Adequacy of the Observational System Assessment
4
The global observing system of multiple satellite- and ground-based instruments can adequately monitor multi-decadal trends except in the troposphere over regions with persistent clouds and/or precipitation.
Availability and Stewardship Assessment
4
Tropospheric data and metadata are available through links on the GEWEX Water Vapor Assessment webpage and from various institutions (e.g. WMO) and networks (e.g. GRUAN and NDACC). Stratospheric profiles from different ground- and satellite-based instruments are independently archived in a variety of file formats.
Networks • WWW/GOS: Radiosonde
• GCOS Upper-Air Network (GUAN, subset of WWW/GOS): Radiosonde
• Commercial aircraft: TAMDAR, IAGOS: TDL, Capacitive polymer
• GCOS Reference Upper-Air Network (GRUAN): Radiosonde, Lidar, Microwave radiometer, FTIR, Frost point hygrometer (FP), GNSS
• NDACC: Lidar, Microwave radiometer, FTIR, Frost point hygrometer
• Various GNSS networks
Satellites Hyperspectral sounders: IR, clear-sky and partly cloudy scenes; 2002 ->; AIRS, IASI, CRIS
Visible/near infrared: total column water vapor over land; cloud-free scenes; 2000 ->; MERIS, OLCI, MODIS
Microwave: primarily over oceans; 1987 ->; SSMI/S, global; AMSU, ATMS, GMI
GNSS (1998 ->) and GPS/GNSS-Radio Occultation (2000 ->)
Aura MLS (2004 ->)
SciSat ACE-FTS, ACE-MAESTRO (2003 ->)
SAGE III/ISS (2017 ->)
Models, Reanalysis etc.
NWP models
CCMs: GEOS, CESM
Lagrangian models: CLaMS, WACCM
Reanalysis: MERRA-2, ERA5, JRA-55, NCEP-DOE AMIP II
Discussion:
Regardless of the measurement technique used, the observation of complete water vapor vertical profiles from the surface to the mesosphere is hampered by the large dynamic range of water vapor number densities in a complete profile, which can easily exceed six orders of magnitude. As a result, no single instrument presently exists that is capable of accurately measuring such a profile. Surface instruments looking up must be able to see through the thick layer of tropospheric moisture to observe the very dry stratosphere and mesosphere. Balloon- and aircraft-borne instruments optimized to measure dry stratospheric air must first pass through the wet tropospheric layer and possibly clouds without becoming fatally contaminated. Water vapor sensors must have detection limits low enough to measure stratospheric humidity, but at the same time not be too sensitive to measure high humidity in the lower atmosphere without saturating. Instruments on space-borne platforms typically have some stratospheric observing capability but have to see through the entire atmospheric column, and past clouds, to measure lower
- 108 -
tropospheric water vapor. Furthermore, instrument calibration is complicated by the tendency of water vapor to adhere to every surface it contacts.
Despite these difficulties, significant improvements have been made in the spatial coverage and reliability of water vapor measurements. To date, however, no singular measurement technique exists with sufficient accuracy, record length, coverage, resolution, and temporal stability to monitor multi-decadal trends on a global scale at all levels of the atmosphere (free troposphere up into the mesosphere). An adequate assessment of water vapor trends on a global scale requires the use of observations from multiple instruments and platforms, each of which has unique advantages and shortcomings that require special attention in any trend analysis.
For the globe, the upper atmospheric humidity records useful for climate monitoring extend back to the 1950s for balloon-borne radiosondes, the 1980s for infrared-based and microwave-based satellite observations, 1994 for UTLS observations from long-haul aircraft, 1995 for total column precipitable water (PW) estimates based on the tropospheric delay of radio signals from Global Navigation Satellite System (GNSS) satellites to GNSS ground receivers, 2006 for PW estimates derived from GNSS Radio Occultation (RO), and 2014 for higher density tropospheric observations from a small number of regional service aircraft. Near-global coverage is provided by satellite-based observations, while vertical profiles from radiosondes, balloon-borne frost point hygrometers (FPs), and aircraft are concentrated on continents and islands. Vertical resolution varies widely among observing systems. It is highest, on the order of a few meters, for GNSS-RO, radiosonde and FP humidity profiles; passive microwave and infrared nadir-sounding systems provide a vertical resolution that is lower than the vertical scale of water vapor variability; and the GNSS-IWV technique only yields estimates of total column PW. Furthermore, the quality of water vapor data from different sensors varies under different atmospheric conditions. Infrared nadir-sounding systems cannot observe within and beneath clouds, passive microwave measurements can be contaminated by variations in surface emissivity and cannot penetrate precipitating clouds, and humidity sensors on radiosondes are least accurate under the dry and cold conditions of the upper troposphere and lower stratosphere.
All observing systems are, at least to some extent, affected by measurement and sampling biases and have undergone changes in instrumentation and processing algorithms over their respective periods of record. Atmospheric reanalyses, which generally provide the spatial coverage and record length needed for assessing the state of the climate over the past several decades, are impacted by these non-climatic signals as well as by temporal changes in the types and numbers of observations being assimilated.
Some observing systems with particular advantages and shortcomings are described in more detail below.
Other information: Balloon-borne measurements of relative humidity (RH) by radiosondes are made at least twice daily at several hundred locations around the globe, about 150 of which are part of the GCOS Upper Air Network (GUAN). These measurements are usually reported together with simultaneously observed temperature and either pressure or altitude, allowing for the derivation of vertical profiles of absolute humidity. Spatial coverage is concentrated on continents and islands, particularly in the mid-latitudes of the Northern Hemisphere. The vertical resolution of these profiles varies with altitude, but is generally 5-10 m from the surface to at least the middle troposphere. In cold and dry conditions of the upper troposphere and above, the quality of radiosonde RH
- 109 -
measurements is significantly reduced by the sensor’s decreased sensitivity and increased response time to changes in moisture.
Operational radiosondes are predominantly launched to obtain meteorological data for input to numerical weather prediction models, leading to spatial and temporal inconsistencies and changes in radiosonde RH sensor types, radiosonde manufacturers and models, instrument calibrations, and manufacturer-supplied instrument corrections that make it very difficult to merge the 80 years of radiosonde RH profile data into reliable climate records. To assist with the quantification of resulting biases and uncertainties in the operational radiosonde network as well as with the calibration of instruments from various observing platforms, the GCOS Reference Upper Air Network (GRUAN) provides sites distributed in various climatic conditions around the globe. GRUAN sites are certified to follow standardized operating procedures, employ careful management of instrumental or procedural changes, and utilize the centralized processing of sounding data. Several GRUAN sites also launch frost point hygrometers on the same balloons as radiosondes to extend high-quality water vapor measurements above the middle troposphere to the middle stratosphere. GRUAN measurement understanding has been used to drive improvements in several commercial sonde models.
More commercial aircraft than ever before are now being used to measure upper atmospheric humidity (among other meteorological variables and trace gases). The IAGOS program, a follow-on to the older MOZAIC program, provides both upper tropospheric and lower stratospheric measurements over long horizontal distances, depending on the cruise altitude and track of commercial airline flights. IAGOS collects data predominantly during long-haul flights between six continents. TAMDAR utilizes smaller regional aircraft flying shorter routes in North America, Asia and Europe, and with a higher frequency of take-offs and landings, provides more vertical profiles in the free troposphere. Both programs, but especially TAMDAR, contribute valuable humidity and other meteorological data to NWP, complementing humidity data from the radiosonde network.
Satellite-based measurements of water vapor vertical profiles from the upper troposphere through the mesosphere are performed by limb-viewing instruments (e.g. microwave limb sounders, solar occultation spectrometers), but only the Aura Microwave Limb Sounder currently produces near-global (82°S-82°N) coverage every day with >3500 profiles. Other limb-viewing satellite instruments generate only 30-40 profiles per day. The Aura MLS has been operational since late 2004 and has now exceeded its “expected 5-year lifetime” by 11 years. Presently there is only one plan in progress to deploy another limb sounder (ESA’s Altius) with similar capabilities as the Aura MLS for water vapor profile measurements in the upper troposphere, stratosphere and mesosphere. At this point in time, the loss of MLS would reduce the global coverage of water vapor profile measurements above the middle troposphere by more than 90%. This is, of course, a concern.
Satellite-based measurements of water vapor vertical profiles from the mid- to lower troposphere are performed by nadir-viewing instruments. Specifically, the hyperspectral infrared and microwave sounders on polar-orbiting platforms namely, AIRS/AMSU on Aqua (2002–present), IASI/AMSU on the MetOp series (2006–present) and CrIS/ATMS on Suomi-NPP and the JPSS series (2011–present). Radiance channels sensitive to water vapor absorption are assimilated into some reanalysis models, e.g. ECMWF, but this is an evolving application with room for growth. The retrieval algorithms for all three sounder suites are mature and produce water vapor profiles, along with temperature and other atmospheric gases, globally from ascending and descending orbits (12 hours apart). From
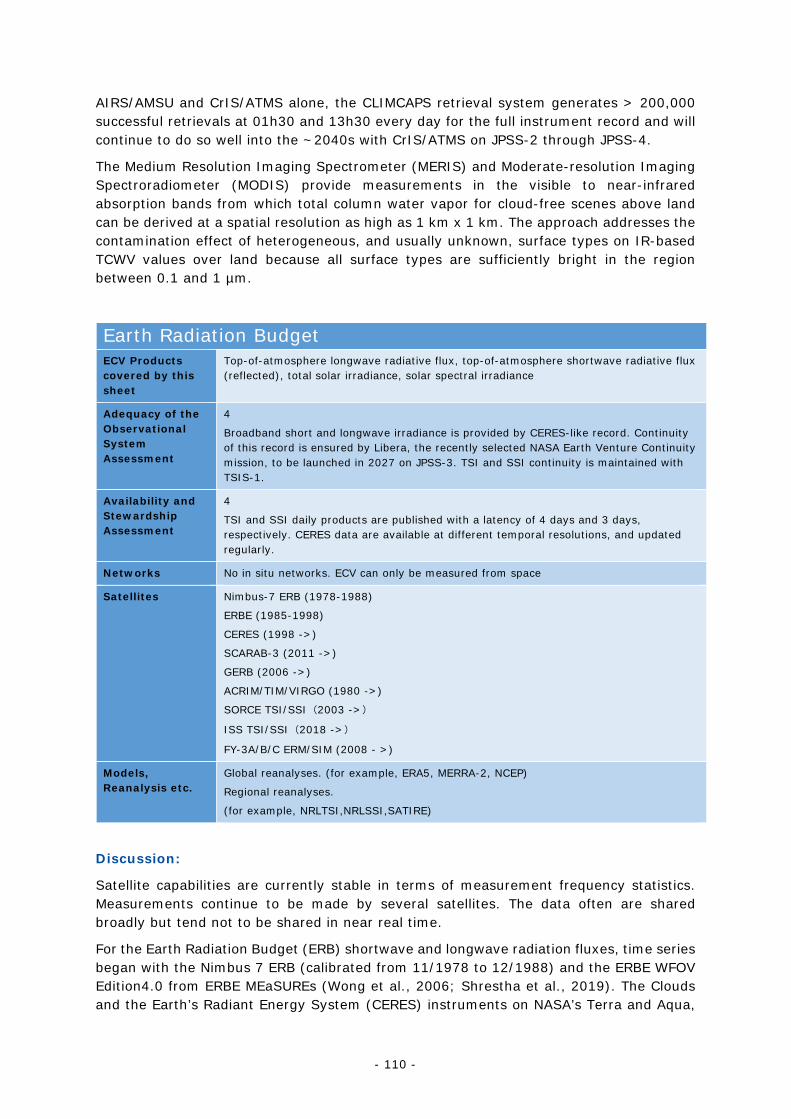
- 110 -
AIRS/AMSU and CrIS/ATMS alone, the CLIMCAPS retrieval system generates > 200,000 successful retrievals at 01h30 and 13h30 every day for the full instrument record and will continue to do so well into the ~2040s with CrIS/ATMS on JPSS-2 through JPSS-4.
The Medium Resolution Imaging Spectrometer (MERIS) and Moderate-resolution Imaging Spectroradiometer (MODIS) provide measurements in the visible to near-infrared absorption bands from which total column water vapor for cloud-free scenes above land can be derived at a spatial resolution as high as 1 km x 1 km. The approach addresses the contamination effect of heterogeneous, and usually unknown, surface types on IR-based TCWV values over land because all surface types are sufficiently bright in the region between 0.1 and 1 µm.
Earth Radiation Budget ECV Products covered by this sheet
Top-of-atmosphere longwave radiative flux, top-of-atmosphere shortwave radiative flux (reflected), total solar irradiance, solar spectral irradiance
Adequacy of the Observational System Assessment
4
Broadband short and longwave irradiance is provided by CERES-like record. Continuity of this record is ensured by Libera, the recently selected NASA Earth Venture Continuity mission, to be launched in 2027 on JPSS-3. TSI and SSI continuity is maintained with TSIS-1.
Availability and Stewardship Assessment
4
TSI and SSI daily products are published with a latency of 4 days and 3 days, respectively. CERES data are available at different temporal resolutions, and updated regularly.
Networks No in situ networks. ECV can only be measured from space
Satellites
Nimbus-7 ERB (1978-1988)
ERBE (1985-1998)
CERES (1998 ->)
SCARAB-3 (2011 ->)
GERB (2006 ->)
ACRIM/TIM/VIRGO (1980 ->)
SORCE TSI/SSI(2003 ->)
ISS TSI/SSI(2018 ->)
FY-3A/B/C ERM/SIM (2008 - >)
Models, Reanalysis etc.
Global reanalyses. (for example, ERA5, MERRA-2, NCEP)
Regional reanalyses.
(for example, NRLTSI,NRLSSI,SATIRE)
Discussion:
Satellite capabilities are currently stable in terms of measurement frequency statistics. Measurements continue to be made by several satellites. The data often are shared broadly but tend not to be shared in near real time.
For the Earth Radiation Budget (ERB) shortwave and longwave radiation fluxes, time series began with the Nimbus 7 ERB (calibrated from 11/1978 to 12/1988) and the ERBE WFOV Edition4.0 from ERBE MEaSUREs (Wong et al., 2006; Shrestha et al., 2019). The Clouds and the Earth’s Radiant Energy System (CERES) instruments on NASA’s Terra and Aqua,
- 111 -
NOAA-20 and S-NPP satellites have provided and continue to provide global coverage for more than 20 years (Wielicki et al., 1996; Loeb et al., 2016). The suite of CERES instruments will be followed by the Libera mission to be launched on JPSS-3 (~2027) and is designed to provide seamless continuity to the CERES ERB data record. The Earth Radiation Measurement (ERM) is the similar instrument mounted on FY-3 series to provide the ERB shortwave and longwave radiation fluxes since 2008 (Yang et al., 2012). GERB ERB measurements are made on a geosynchronous platform covering Europe/Africa region (Harries et al., 2005). SCARAB has flown on multiple satellites through the years most recently on Megha-Tropiques.
For the Solar Spectral Irradiance (SSI), measurement quality from TSIS-1/SIM has improved in solar spectral irradiance products with an uncertainty of 0.25% compared to 2-8% in SORCE/SIM. SI traceability of TSIS-I/SIM is ensured by the Spectral Radiometer Facility (SRF) at LASP, but more work is required to assess its on-orbit performance. SSI also will be monitored by SSIM/FY-3E which is scheduled to be launched in 2021.
For the TSI, new measurements of total solar irradiance from NORSAT-1/CLARA and TSIS-1/TIM have continued the low values as SORCE/TIM and TCTE/TIM. The TCTE satellite and SORCE mission are phased out, TSIS-1/TIM on ISS (international Space Station) is the only high-quality record during the solar cycle minimum 24-25. TSI has also been monitored by the Solar Irradiance Monitor (SIM) mounted on FY-3 series since 2008. More missions are needed to keep measurement continuity and capture the decadal climate signal. TSIS-2 as the successor of TSIS-1 is planned to operate on a cubesat platform. The long-term stability of new compact instruments requires assessment. The accuracy of solar spectral irradiance may not match the ECV requirements based on the instrument character parameters.
Numerous other satellite analysis-based data products provide estimates of ERB parameters: ISCCP FD (Zhang et al., 2004), GEWEX SRB (Stackhouse et al., 2011) using both AVHRR and GEO imagers. The CMSAF CLARA product based on AVHRR-only product (Karlsson et al., 2017). TOA Longwave (or Outgoing LW radiation – OLR) products are provided through NOAA HIRS and NASA AIRS (Moy et al., 2010).
References:
Harries, J. E., J. E. Russell, J. A. Hanafin, H. Brindley, J. Futyan, J. Rufus, S. Kellock, G. Matthews, R. Wrigley, A. Last, J. Mueller, R. Mossavati, J. Ashmall, E. Sawyer, D. Parker, M. Caldwell, P. M. Allan, A. Smith, M. J. Bates, B. Coan, B. C. Stewart, D. R: Lepine, L. A. Cornwall, D. R. Corney, M. J. Ricketts, D. Drummond, D. Smart, R. Cutler, S. Dewitte, N. Clerbaux, L. Gonzalez, A. Ipe, C. Bertrand, A. Joukoff, D. Crommelynck, N. Nelms, D. T. Llewellyn-Jones, G. Butcher, G.L. Smith, Z. P. Szewczyk, P. E. Mlynczak, A. Slingo, R. P. Allan, and M. A. Ringer, 2005: The Geostationary Earth Radiation Budget Project, Bulletin of the American Meteorological Society, 86(7), 945-960. https://doi.org/10.1175/BAMS-86-7-945
Karlsson, K.-G., K. Anttila, J. Trentmann, M Stengel, J. F. Meirink, A. Devasthale, T. Hanschmann, S. Kothe, E. Jääskeläinen, J. Sedlar, N. Benas, G.-J. van Zadelhoff, C. Schlundt, D. Stein, S. Finkensieper, N. Håkansson and R. Hollmann, 2017: CLARA-A2: the second edition of the CM SAF cloud and radiation data record from 34 years of global AVHRR data, Atmospheric Chemistry and Physics, 17, 5809-5828, doi:10.5194/acp-17-5809-2017
- 112 -
Loeb, N.G., W. Su, and S. Kato, 2016: Understanding Climate Feedbacks and Sensitivity Using Observations of Earth’s Energy Budget. Current Climate Change Reports 2, 170–178. https://doi.org/10.1007/s40641-016-0047-5
Moy, L. A., R: O. Knuteson, D. C. Tobin, H. E. Revercomb, L. A. Borg and J. Susskind, 2010: Comparison of measured and modeled outgoing longwave radiation for clear-sky ocean and land scenes using coincident CERES and AIRS observations, Journal of Geophysical Research, 115, D15110. doi:10.1029/2009JD012758.
Shrestha, A.K., S. Kato, T. Wong, P. Stackhouse and R. P. Loughman, 2019: New Temporal and Spectral Unfiltering Technique for ERBE/ERBS WFOV Nonscanner Instrument Observations. IEEE Transactions on Geoscience and Remote Sensing, vol. 57, no. 7, pp. 4600-4611, July 2019, doi: 10.1109/TGRS.2019.2891748.
Stackhouse, P. W. Jr, P. Minnis, R. Perez, M. Sengupta, K. Knapp, J. C. Mikovitz, Schlemmer, B. Scarino, T. Zhang and S. J. Cox, 2016: An Assessment of New Satellite Data Products for the Development of a Long-term Global Solar Resource at 10-100 km. Conference Proceedings, ASES National Solar Conference. doi:10.18086/solar.2016.01.24
Yang,J., P. Zhang, N. Lu, Z. Yang, J. Shi and C. Dong, 2012: Improvements on global meteorological observations from the current Fengyun 3 satellites and beyond, International Journal of Digital Earth, 5:3, 251-265, DOI: 10.1080/17538947.2012.658666
Wielicki, B. A., B. R. Barkstrom, E. F. Harrison, R. B. Lee, III, G. L. Smith and J. E. Cooper, 1996: Clouds and the Earth's Radiant Energy System (CERES): An Earth Observing System Experiment, Bulletin of the American Meteorological Society, 77(5), 853-868. https://doi.org/10.1175/1520-0477(1996)077<0853:CATERE>2.0.CO;2
Wong, T., B.A. Wielicki, R.B. Lee, G.L. Smith, K.A. Bush and J.K. Willis, 2006: Reexamination of the Observed Decadal Variability of the Earth Radiation Budget Using Altitude-Corrected ERBE/ERBS Nonscanner WFOV Data, Journal of Climate, 19(16), 4028-4040. https://doi.org/10.1175/JCLI3838.1
Zhang, Y., C. N. Long, W: B. Rossow, and E. G. Dutton, 2010: Exploiting diurnal variations to evaluate the ISCCP-FD flux calculations and radiative-flux-analysis-processed surface observations from BSRN, ARM, and SURFRAD, Journal of Geophysical Research, 115, D15105, doi:10.1029/2009JD012743.
http://www.wmo-sat.info/oscar/instruments/
http://spot.colorado.edu/~koppg/TSI/
https://wui.cmsaf.eu/safira/action/viewDoiDetails?acronym=TOA_GERB_V002
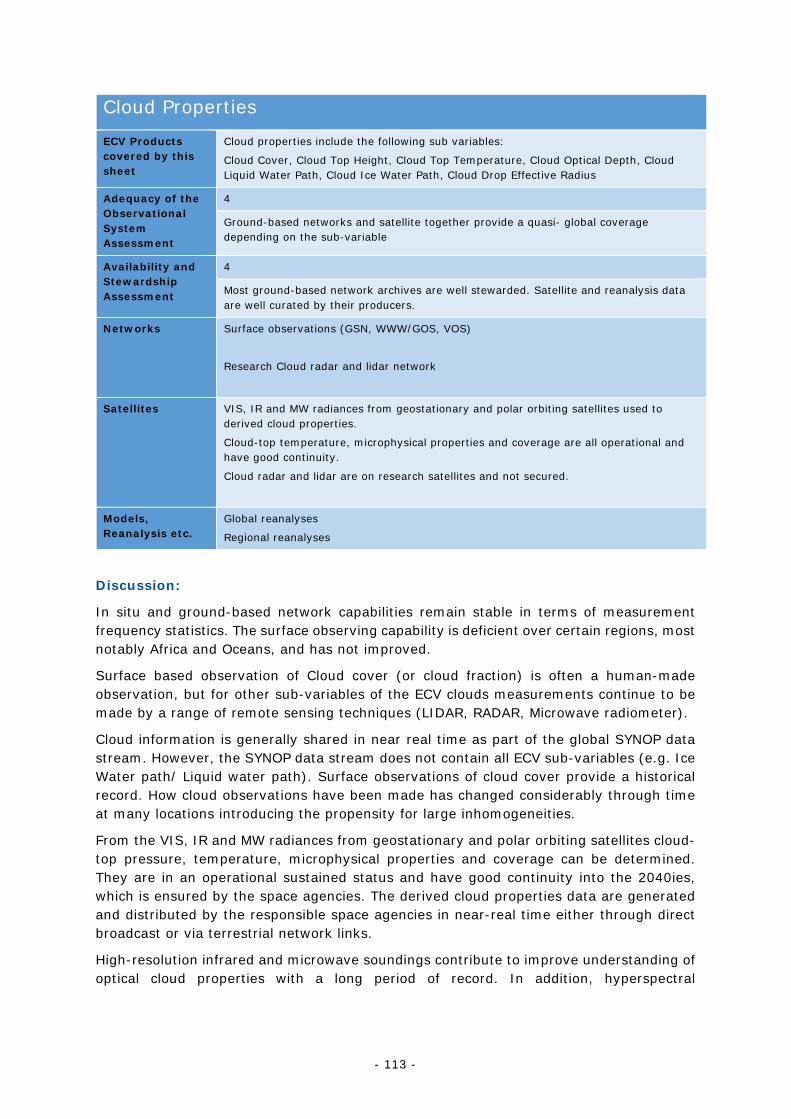
- 113 -
Cloud Properties
ECV Products covered by this sheet
Cloud properties include the following sub variables:
Cloud Cover, Cloud Top Height, Cloud Top Temperature, Cloud Optical Depth, Cloud Liquid Water Path, Cloud Ice Water Path, Cloud Drop Effective Radius
Adequacy of the Observational System Assessment
4
Ground-based networks and satellite together provide a quasi- global coverage depending on the sub-variable
Availability and Stewardship Assessment
4
Most ground-based network archives are well stewarded. Satellite and reanalysis data are well curated by their producers.
Networks Surface observations (GSN, WWW/GOS, VOS)
Research Cloud radar and lidar network
Satellites VIS, IR and MW radiances from geostationary and polar orbiting satellites used to derived cloud properties.
Cloud-top temperature, microphysical properties and coverage are all operational and have good continuity.
Cloud radar and lidar are on research satellites and not secured.
Models, Reanalysis etc.
Global reanalyses
Regional reanalyses
Discussion:
In situ and ground-based network capabilities remain stable in terms of measurement frequency statistics. The surface observing capability is deficient over certain regions, most notably Africa and Oceans, and has not improved.
Surface based observation of Cloud cover (or cloud fraction) is often a human-made observation, but for other sub-variables of the ECV clouds measurements continue to be made by a range of remote sensing techniques (LIDAR, RADAR, Microwave radiometer).
Cloud information is generally shared in near real time as part of the global SYNOP data stream. However, the SYNOP data stream does not contain all ECV sub-variables (e.g. Ice Water path/ Liquid water path). Surface observations of cloud cover provide a historical record. How cloud observations have been made has changed considerably through time at many locations introducing the propensity for large inhomogeneities.
From the VIS, IR and MW radiances from geostationary and polar orbiting satellites cloud-top pressure, temperature, microphysical properties and coverage can be determined. They are in an operational sustained status and have good continuity into the 2040ies, which is ensured by the space agencies. The derived cloud properties data are generated and distributed by the responsible space agencies in near-real time either through direct broadcast or via terrestrial network links.
High-resolution infrared and microwave soundings contribute to improve understanding of optical cloud properties with a long period of record. In addition, hyperspectral
- 114 -
measurements from several of the same observing platforms have been shown to be suitable for inferring certain cloud properties.
VIS instruments on geostationary platforms (e.g. ABI, SEVIRI) with their high spatial resolution provide excellent real-time imagery of cloud structure within evolving storms to support weather forecasting.
In terms of dedicated satellite missions with active instruments (e.g. RADAR, LIDAR system) no continuity is assured as these instruments are flown on the research satellites. Nevertheless, decadal-long data records do exist. in the public domain at various national data centres. One such record is the International Satellite Cloud Climatology Project (ISCCP) that began in 1982 to build a record of satellite observations of cloud radiative properties from a large array of instruments and algorithms. The latest ISCCP H Series is maintained by the NOAA National Centers for Environmental Information (NCEI). Another state-of-the art long-term cloud record is generated and maintained within the ESA Climate Change Initiative (CCI).
Extremes can be captured by the observing system and are evaluated e.g. by the NHMS’s and the WMO. Agreed methods based on guidance by WMO Expert Team on Climate Change Detection and Indices (ETCCDI) are applied.
For reanalyses and global modelling cloud properties remain a major challenge and shortcoming in modelling today. A part of this story are shortcomings in radiative transfer modelling through clouds. No two cloudy radiative transfer models agree consistently. Without robust, good cloudy radiative transfer models, we are limited in our ability to retrieve the more difficult cloud properties.
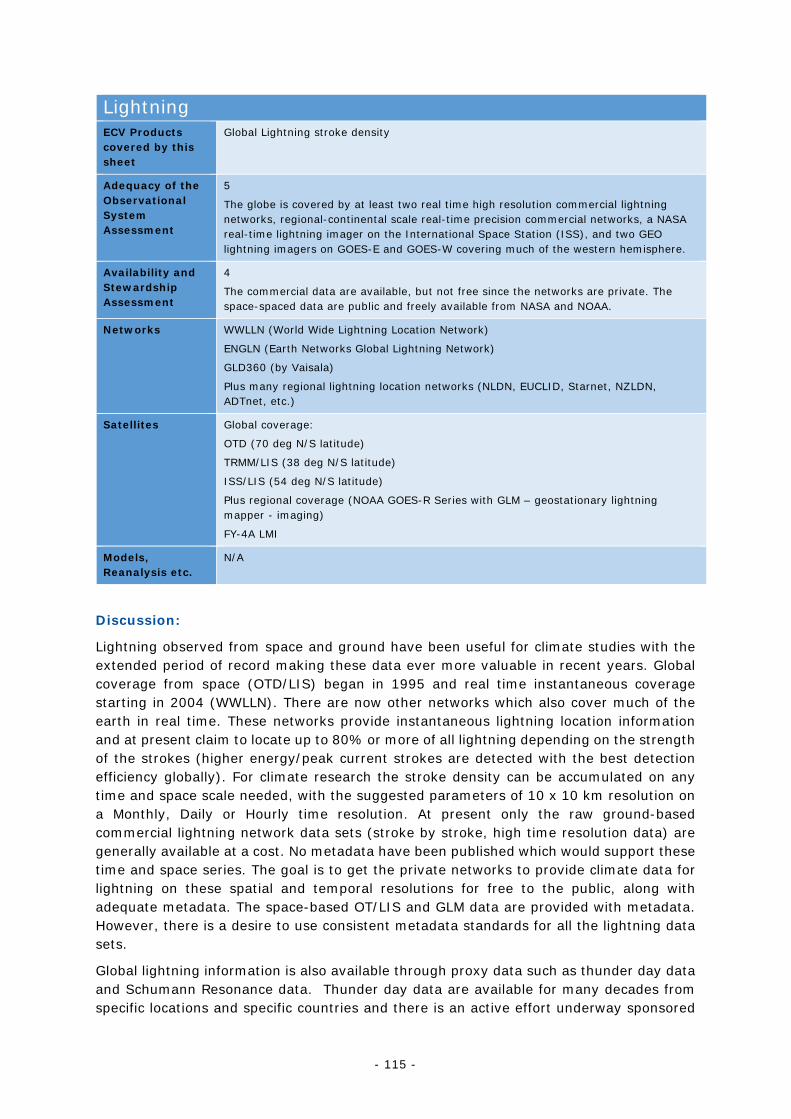
- 115 -
Lightning ECV Products covered by this sheet
Global Lightning stroke density
Adequacy of the Observational System Assessment
5
The globe is covered by at least two real time high resolution commercial lightning networks, regional-continental scale real-time precision commercial networks, a NASA real-time lightning imager on the International Space Station (ISS), and two GEO lightning imagers on GOES-E and GOES-W covering much of the western hemisphere.
Availability and Stewardship Assessment
4
The commercial data are available, but not free since the networks are private. The space-spaced data are public and freely available from NASA and NOAA.
Networks WWLLN (World Wide Lightning Location Network)
ENGLN (Earth Networks Global Lightning Network)
GLD360 (by Vaisala)
Plus many regional lightning location networks (NLDN, EUCLID, Starnet, NZLDN, ADTnet, etc.)
Satellites Global coverage:
OTD (70 deg N/S latitude)
TRMM/LIS (38 deg N/S latitude)
ISS/LIS (54 deg N/S latitude)
Plus regional coverage (NOAA GOES-R Series with GLM – geostationary lightning mapper - imaging)
FY-4A LMI
Models, Reanalysis etc.
N/A
Discussion:
Lightning observed from space and ground have been useful for climate studies with the extended period of record making these data ever more valuable in recent years. Global coverage from space (OTD/LIS) began in 1995 and real time instantaneous coverage starting in 2004 (WWLLN). There are now other networks which also cover much of the earth in real time. These networks provide instantaneous lightning location information and at present claim to locate up to 80% or more of all lightning depending on the strength of the strokes (higher energy/peak current strokes are detected with the best detection efficiency globally). For climate research the stroke density can be accumulated on any time and space scale needed, with the suggested parameters of 10 x 10 km resolution on a Monthly, Daily or Hourly time resolution. At present only the raw ground-based commercial lightning network data sets (stroke by stroke, high time resolution data) are generally available at a cost. No metadata have been published which would support these time and space series. The goal is to get the private networks to provide climate data for lightning on these spatial and temporal resolutions for free to the public, along with adequate metadata. The space-based OT/LIS and GLM data are provided with metadata. However, there is a desire to use consistent metadata standards for all the lightning data sets.
Global lightning information is also available through proxy data such as thunder day data and Schumann Resonance data. Thunder day data are available for many decades from specific locations and specific countries and there is an active effort underway sponsored
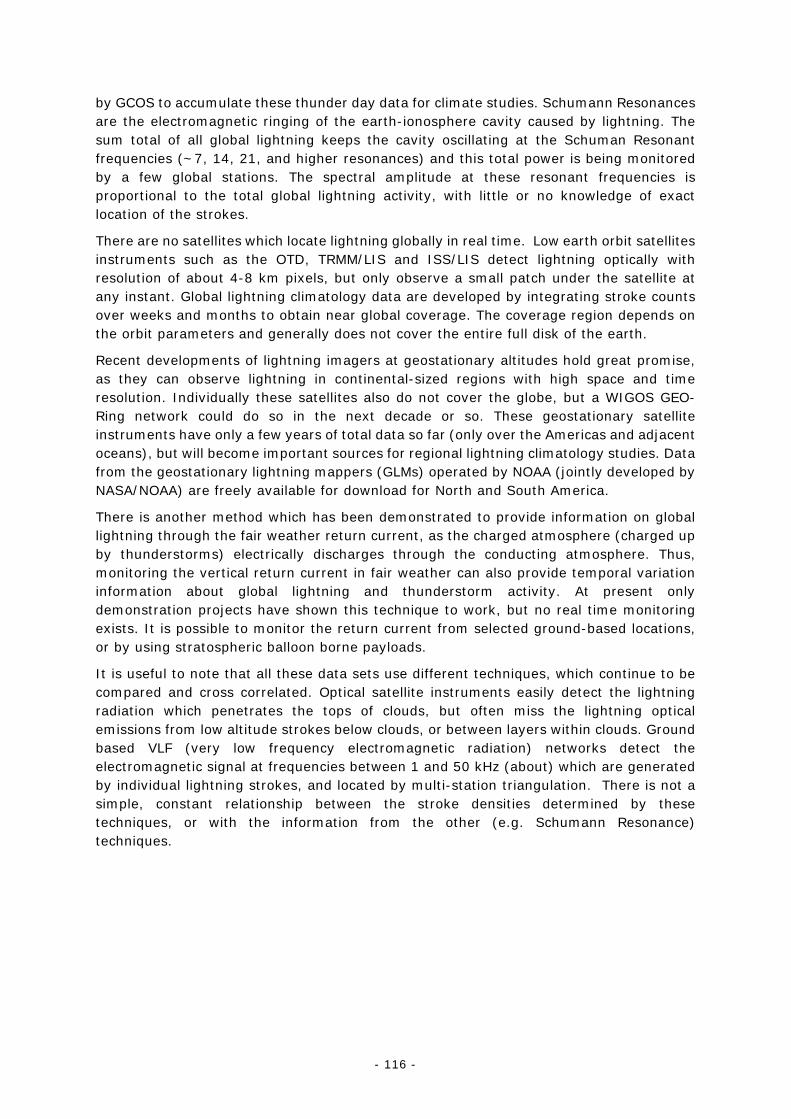
- 116 -
by GCOS to accumulate these thunder day data for climate studies. Schumann Resonances are the electromagnetic ringing of the earth-ionosphere cavity caused by lightning. The sum total of all global lightning keeps the cavity oscillating at the Schuman Resonant frequencies (~7, 14, 21, and higher resonances) and this total power is being monitored by a few global stations. The spectral amplitude at these resonant frequencies is proportional to the total global lightning activity, with little or no knowledge of exact location of the strokes.
There are no satellites which locate lightning globally in real time. Low earth orbit satellites instruments such as the OTD, TRMM/LIS and ISS/LIS detect lightning optically with resolution of about 4-8 km pixels, but only observe a small patch under the satellite at any instant. Global lightning climatology data are developed by integrating stroke counts over weeks and months to obtain near global coverage. The coverage region depends on the orbit parameters and generally does not cover the entire full disk of the earth.
Recent developments of lightning imagers at geostationary altitudes hold great promise, as they can observe lightning in continental-sized regions with high space and time resolution. Individually these satellites also do not cover the globe, but a WIGOS GEO-Ring network could do so in the next decade or so. These geostationary satellite instruments have only a few years of total data so far (only over the Americas and adjacent oceans), but will become important sources for regional lightning climatology studies. Data from the geostationary lightning mappers (GLMs) operated by NOAA (jointly developed by NASA/NOAA) are freely available for download for North and South America.
There is another method which has been demonstrated to provide information on global lightning through the fair weather return current, as the charged atmosphere (charged up by thunderstorms) electrically discharges through the conducting atmosphere. Thus, monitoring the vertical return current in fair weather can also provide temporal variation information about global lightning and thunderstorm activity. At present only demonstration projects have shown this technique to work, but no real time monitoring exists. It is possible to monitor the return current from selected ground-based locations, or by using stratospheric balloon borne payloads.
It is useful to note that all these data sets use different techniques, which continue to be compared and cross correlated. Optical satellite instruments easily detect the lightning radiation which penetrates the tops of clouds, but often miss the lightning optical emissions from low altitude strokes below clouds, or between layers within clouds. Ground based VLF (very low frequency electromagnetic radiation) networks detect the electromagnetic signal at frequencies between 1 and 50 kHz (about) which are generated by individual lightning strokes, and located by multi-station triangulation. There is not a simple, constant relationship between the stroke densities determined by these techniques, or with the information from the other (e.g. Schumann Resonance) techniques.
- 117 -
A.a.iii Composition
Carbon Dioxide, Methane & other Greenhouse Gases ECV Products covered by this sheet
Tropospheric CO2 column; Tropospheric CO2 profile; Tropospheric CH4 column; Tropospheric CH4 profile; Stratospheric CH4 profile
Adequacy of the Observational System Assessment
3
Column values of CO2 and CH4 are not temporally and spatially adequately sampled. despite the global coverage achieved with satellites. Vertically resolved measurements are very sparse.
Availability and Stewardship Assessment
3
Satellite and some ground-, aircraft- and balloon-based datasets are well curated and accessible, while ground-, balloon- and aircraft-based datasets are in various formats and spread among several data repositories.
Networks TCCON / NDACC: total column CO2 and CH4 and some in situ balloon based measurements
ICOS, GAW: surface in situ CO2 and CH4
NOAA GGGRN: global flask network CO2 and CH4 with sparse in situ ground-, aircraft- and balloon-based measurements of CO2 and CH4
IAGOS/CARIBIC: CO2 and CH4 measurements from commercial aircraft
Regional and national in situ and flask networks: surface values
Satellites MetOp IASI, Aqua AIRS, Suomi-NPP CrIS, JPSS-1 CrIS, Sentinel-5P TROPOMI, GOSAT and GOSAT-2 TANSO, OCO-2, ISS OCO-3, OCO-2, SCISAT ACE-FTS, TANSAT
Models, Reanalysis etc.
CAMS (forecast, (re)analysis, inverse modelling)
C3S (reanalysis)
MERRA-2 (reanalysis)
NOAA Carbon Tracker (data assimilation/model)
Carbon cycle and Earth system models
Discussion:
The global coverage of total column observations of both CO2 and CH4 has improved during the last decade with the addition of several satellite instruments dedicated to GHGs that complement GOSAT, the first GHG-dedicated satellite mission. After the demonstration with SCIAMACHY/Envisat, dedicated CO2 observations have recently been made by OCO-2, OCO-3, TANSAT, GOSAT, GOSAT-2, and CH4 by ACE-FTS, S5P/TROPOMI and GOSAT-2. AIRS, IASI and CrIS observe mid-tropospheric variations of both CO2 and CH4 but at coarser spatial and vertical resolutions. OCO-2 has a relatively narrow swath of ~10 km, while TROPOMI and CrIS measure top of atmosphere radiance with >2000 km-wide swaths to achieve near-global coverage daily. None of the satellite instruments provide presently tropospheric column observations and this is reflected in the updated ECV requirements and the tropospheric column ECVs have been replaced by total column ECVs. The data from the satellite instruments are generally well-documented, easily accessible from online archives and distributed with a range of error and uncertainty metrics to facilitate transparency in downstream data processing applications. The required uncertainty limits when interpreted as total column uncertainties, are achieved with satellite observations. The spatial resolution requirements are met with satellite. The

- 118 -
sampling frequency CO2 observations is strongly limited by the narrow swath of present satellites. For CH4 the situation is better with S5P/TROPOMI providing nearly daily sampling frequency. Hover, the temporal sampling requirement of 4h is not met with present satellites.
Ground based measurements of total columns of CO2 and CH4 are obtained by Fourier Transform Infrared (FTIR) spectrometers as part of the TCCON and NDACC. High measurement quality is achieved through coordinated activities like inter-comparison campaigns at network sites. New networks include COCOON, a collection of mobile FTIR instruments that have been deployed at urban sites to measure CO2 emissions. Observations from other more regional networks or individual institutions are coordinated by the Global Atmosphere Watch Programme; data are available in the World Data Centre for Greenhouse Gases46.
Profiles of CO2 and CH4 obtained from aircraft- and balloon-based measurements meet the vertical resolution requirements but are spatiotemporally sparse, especially in the stratosphere and over the oceans.
Tropospheric profiles of CO2 and CH4 are obtained by the IAGOS/CARIBIC program of in situ measurements from commercial aircraft. One recently-realized vulnerability in the program was a significant reduction in IAGOS data due a drastic decline in commercial aircraft flights driven by the COVID-19 global pandemic. In a few places, balloon-borne observations of CH4 and CO2 profiles are obtained by AirCores - whole air samplers with an altitude-dependent vertical resolution of 0.1-1 km. Developments are ongoing to further improve and simplify tropospheric profile measurements using more automated technologies including drones and return gliders.
High-quality, ground-based observations of CO2 and CH4 are made in Europe by the ICOS network, and worldwide by NOAA’s Global Greenhouse Gas Reference Network, which includes a global array of flask sampling sites and less dense networks of in situ measurements at the surface, from tall towers, and from aircraft.
Stratospheric CH4 profiles are currently measured by only the ACE-FTS satellite instrument using the solar occultation technique. ACE-FTS provides about 30 measurements/day, predominantly at high northern latitudes. The need for continuation of satellite-based instrument that measures stratospheric CH4 profiles also around the globe is critical.
46 www.gaw.kishou.go.jp
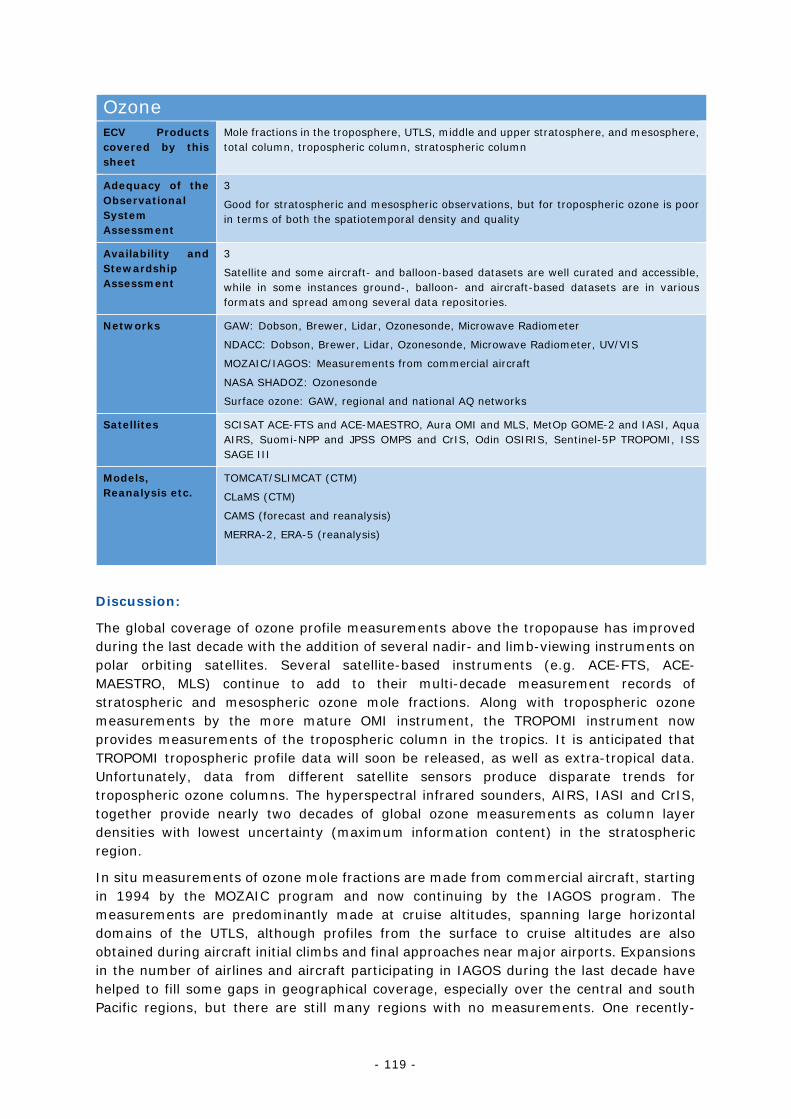
- 119 -
Ozone ECV Products covered by this sheet
Mole fractions in the troposphere, UTLS, middle and upper stratosphere, and mesosphere, total column, tropospheric column, stratospheric column
Adequacy of the Observational System Assessment
3
Good for stratospheric and mesospheric observations, but for tropospheric ozone is poor in terms of both the spatiotemporal density and quality
Availability and Stewardship Assessment
3
Satellite and some aircraft- and balloon-based datasets are well curated and accessible, while in some instances ground-, balloon- and aircraft-based datasets are in various formats and spread among several data repositories.
Networks GAW: Dobson, Brewer, Lidar, Ozonesonde, Microwave Radiometer
NDACC: Dobson, Brewer, Lidar, Ozonesonde, Microwave Radiometer, UV/VIS
MOZAIC/IAGOS: Measurements from commercial aircraft
NASA SHADOZ: Ozonesonde
Surface ozone: GAW, regional and national AQ networks
Satellites SCISAT ACE-FTS and ACE-MAESTRO, Aura OMI and MLS, MetOp GOME-2 and IASI, Aqua AIRS, Suomi-NPP and JPSS OMPS and CrIS, Odin OSIRIS, Sentinel-5P TROPOMI, ISS SAGE III
Models, Reanalysis etc.
TOMCAT/SLIMCAT (CTM)
CLaMS (CTM)
CAMS (forecast and reanalysis)
MERRA-2, ERA-5 (reanalysis)
Discussion:
The global coverage of ozone profile measurements above the tropopause has improved during the last decade with the addition of several nadir- and limb-viewing instruments on polar orbiting satellites. Several satellite-based instruments (e.g. ACE-FTS, ACE-MAESTRO, MLS) continue to add to their multi-decade measurement records of stratospheric and mesospheric ozone mole fractions. Along with tropospheric ozone measurements by the more mature OMI instrument, the TROPOMI instrument now provides measurements of the tropospheric column in the tropics. It is anticipated that TROPOMI tropospheric profile data will soon be released, as well as extra-tropical data. Unfortunately, data from different satellite sensors produce disparate trends for tropospheric ozone columns. The hyperspectral infrared sounders, AIRS, IASI and CrIS, together provide nearly two decades of global ozone measurements as column layer densities with lowest uncertainty (maximum information content) in the stratospheric region.
In situ measurements of ozone mole fractions are made from commercial aircraft, starting in 1994 by the MOZAIC program and now continuing by the IAGOS program. The measurements are predominantly made at cruise altitudes, spanning large horizontal domains of the UTLS, although profiles from the surface to cruise altitudes are also obtained during aircraft initial climbs and final approaches near major airports. Expansions in the number of airlines and aircraft participating in IAGOS during the last decade have helped to fill some gaps in geographical coverage, especially over the central and south Pacific regions, but there are still many regions with no measurements. One recently-
- 120 -
realized vulnerability in the program was a significant reduction in IAGOS data due a drastic decline in commercial aircraft flights driven by the COVID-19 global pandemic.
The global network of sites measuring ozone profiles with balloon-borne electrochemical concentration cell (ECC) ozonesondes declined somewhat during the early 2010s as Environment and Climate Change Canada decided to consolidate its ECC and Brewer networks. Fortunately, growth of the SHADOZ, NDACC and GRUAN networks since that time has increased the number of global sites routinely launching ECCs. In some regions, namely South America and Africa the geographical coverage of ECC sounding sites remains poor. Recent, world-wide efforts by ECC sounding networks have focused on the standardization of pre-flight instrument preparation and testing procedures, and the homogenization of data processing methods. GRUAN is developing a climate quality product for ozonesonde data that is centrally processed and includes error estimates for every measurement.
Ground-based measurements of ozone profiles and total columns are made around the globe using Dobson and Brewer spectrophotometers, Fourier-transform Infrared (FTIR) spectrometers, microwave radiometers, and various UV-visible spectrometers. The networks of these ground-based instruments are stable and together provide adequate global coverage, including several polar sites in both hemispheres. However, the balloon soundings at many of these sites are only weekly, so the temporal density of observations is low. The WMO-coordinated network of Dobson spectrophotometers, first introduced in 1926, has produced the longest records of total column ozone and continues to operate globally. Regional campaigns to Inter-calibrate Dobson and Brewer instruments have been performed regularly for many years, with absolute calibrations tied to WMO World Reference Standard instruments.
Surface ozone has been measured by regional and national networks for many years, mainly for the purpose of air quality monitoring near urban areas. The more recent WMO GAW network was developed with the monitoring of background tropospheric ozone levels in mind. Strengths and inadequacies of the global coverage of surface ozone monitoring sites were recently addressed in the IGAC Tropospheric Ozone Assessment Report. Though there is some evidence that surface ozone levels are higher today than 40-50 years ago, there is no clear global pattern for changes in surface ozone mole fractions since 2000. It is hoped that new, higher quality satellite-based products for tropospheric ozone, including profile information, with better global coverage can supplement the limited coverage of surface observations and permit the determination of statistically significant trends. Unfortunately, it is likely that new satellite-derived tropospheric ozone products will be spatially limited to North America and Europe in the foreseeable future.
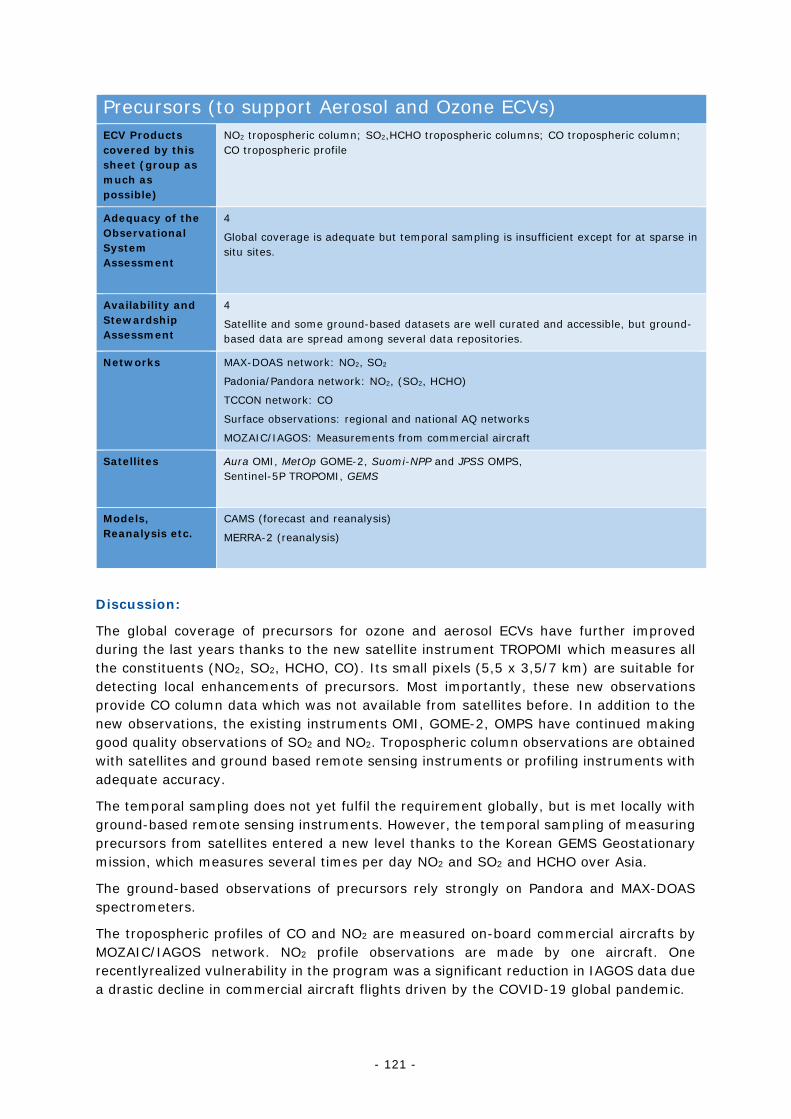
- 121 -
Precursors (to support Aerosol and Ozone ECVs) ECV Products covered by this sheet (group as much as possible)
NO2 tropospheric column; SO2,HCHO tropospheric columns; CO tropospheric column; CO tropospheric profile
Adequacy of the Observational System Assessment
4
Global coverage is adequate but temporal sampling is insufficient except for at sparse in situ sites.
Availability and Stewardship Assessment
4
Satellite and some ground-based datasets are well curated and accessible, but ground-based data are spread among several data repositories.
Networks MAX-DOAS network: NO2, SO2
Padonia/Pandora network: NO2, (SO2, HCHO)
TCCON network: CO
Surface observations: regional and national AQ networks
MOZAIC/IAGOS: Measurements from commercial aircraft
Satellites Aura OMI, MetOp GOME-2, Suomi-NPP and JPSS OMPS, Sentinel-5P TROPOMI, GEMS
Models, Reanalysis etc.
CAMS (forecast and reanalysis)
MERRA-2 (reanalysis)
Discussion:
The global coverage of precursors for ozone and aerosol ECVs have further improved during the last years thanks to the new satellite instrument TROPOMI which measures all the constituents (NO2, SO2, HCHO, CO). Its small pixels (5,5 x 3,5/7 km) are suitable for detecting local enhancements of precursors. Most importantly, these new observations provide CO column data which was not available from satellites before. In addition to the new observations, the existing instruments OMI, GOME-2, OMPS have continued making good quality observations of SO2 and NO2. Tropospheric column observations are obtained with satellites and ground based remote sensing instruments or profiling instruments with adequate accuracy.
The temporal sampling does not yet fulfil the requirement globally, but is met locally with ground-based remote sensing instruments. However, the temporal sampling of measuring precursors from satellites entered a new level thanks to the Korean GEMS Geostationary mission, which measures several times per day NO2 and SO2 and HCHO over Asia.
The ground-based observations of precursors rely strongly on Pandora and MAX-DOAS spectrometers.
The tropospheric profiles of CO and NO2 are measured on-board commercial aircrafts by MOZAIC/IAGOS network. NO2 profile observations are made by one aircraft. One recentlyrealized vulnerability in the program was a significant reduction in IAGOS data due a drastic decline in commercial aircraft flights driven by the COVID-19 global pandemic.
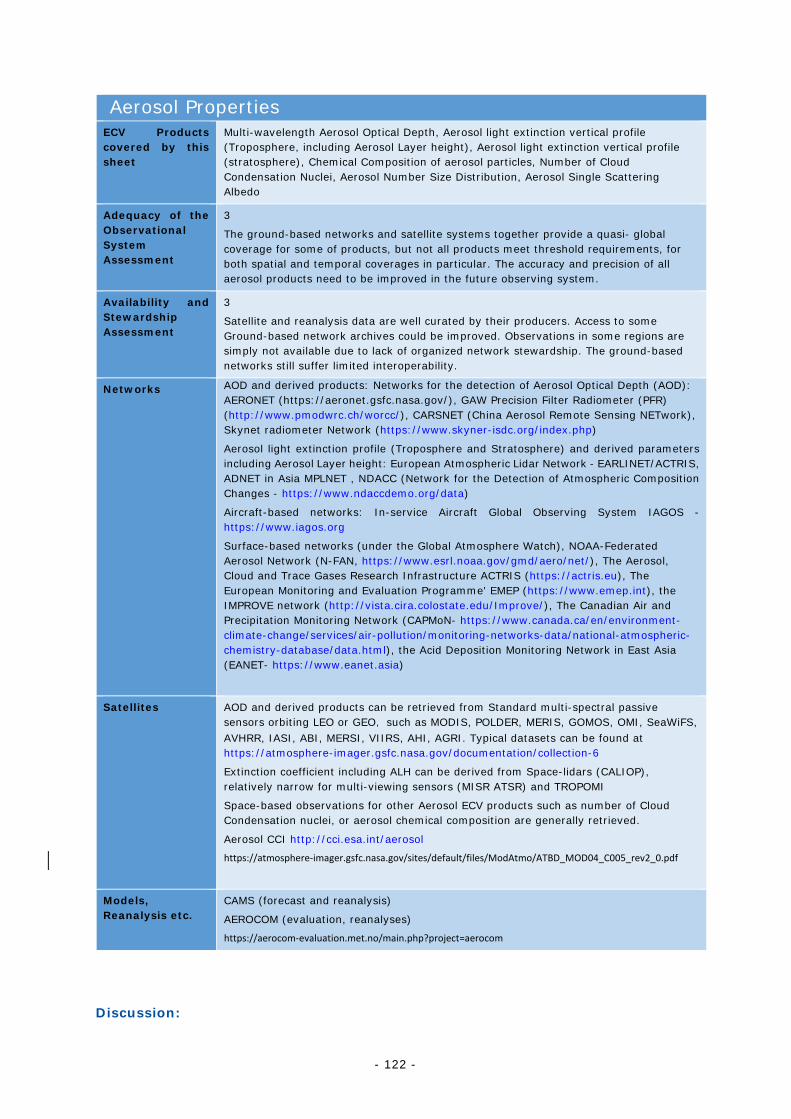
- 122 -
Aerosol Properties ECV Products covered by this sheet
Multi-wavelength Aerosol Optical Depth, Aerosol light extinction vertical profile (Troposphere, including Aerosol Layer height), Aerosol light extinction vertical profile (stratosphere), Chemical Composition of aerosol particles, Number of Cloud Condensation Nuclei, Aerosol Number Size Distribution, Aerosol Single Scattering Albedo
Adequacy of the Observational System Assessment
3
The ground-based networks and satellite systems together provide a quasi- global coverage for some of products, but not all products meet threshold requirements, for both spatial and temporal coverages in particular. The accuracy and precision of all aerosol products need to be improved in the future observing system.
Availability and Stewardship Assessment
3
Satellite and reanalysis data are well curated by their producers. Access to some Ground-based network archives could be improved. Observations in some regions are simply not available due to lack of organized network stewardship. The ground-based networks still suffer limited interoperability.
Networks AOD and derived products: Networks for the detection of Aerosol Optical Depth (AOD): AERONET (https://aeronet.gsfc.nasa.gov/), GAW Precision Filter Radiometer (PFR) (http://www.pmodwrc.ch/worcc/), CARSNET (China Aerosol Remote Sensing NETwork), Skynet radiometer Network (https://www.skyner-isdc.org/index.php)
Aerosol light extinction profile (Troposphere and Stratosphere) and derived parameters including Aerosol Layer height: European Atmospheric Lidar Network - EARLINET/ACTRIS, ADNET in Asia MPLNET , NDACC (Network for the Detection of Atmospheric Composition Changes - https://www.ndaccdemo.org/data)
Aircraft-based networks: In-service Aircraft Global Observing System IAGOS - https://www.iagos.org
Surface-based networks (under the Global Atmosphere Watch), NOAA-Federated Aerosol Network (N-FAN, https://www.esrl.noaa.gov/gmd/aero/net/), The Aerosol, Cloud and Trace Gases Research Infrastructure ACTRIS (https://actris.eu), The European Monitoring and Evaluation Programme' EMEP (https://www.emep.int), the IMPROVE network (http://vista.cira.colostate.edu/Improve/), The Canadian Air and Precipitation Monitoring Network (CAPMoN- https://www.canada.ca/en/environment-climate-change/services/air-pollution/monitoring-networks-data/national-atmospheric-chemistry-database/data.html), the Acid Deposition Monitoring Network in East Asia (EANET- https://www.eanet.asia)
Satellites AOD and derived products can be retrieved from Standard multi-spectral passive sensors orbiting LEO or GEO,such as MODIS, POLDER, MERIS, GOMOS, OMI, SeaWiFS, AVHRR, IASI, ABI, MERSI, VIIRS, AHI, AGRI. Typical datasets can be found at https://atmosphere-imager.gsfc.nasa.gov/documentation/collection-6
Extinction coefficient including ALH can be derived from Space-lidars (CALIOP), relatively narrow for multi-viewing sensors (MISR ATSR) and TROPOMI
Space-based observations for other Aerosol ECV products such as number of Cloud Condensation nuclei, or aerosol chemical composition are generally retrieved.
Aerosol CCI http://cci.esa.int/aerosol
https://atmosphere-imager.gsfc.nasa.gov/sites/default/files/ModAtmo/ATBD_MOD04_C005_rev2_0.pdf
Models, Reanalysis etc.
CAMS (forecast and reanalysis)
AEROCOM (evaluation, reanalyses)
https://aerocom-evaluation.met.no/main.php?project=aerocom
Discussion:
- 123 -
Generally, the global observation system for aerosol ECVs have further improved in the past decade thanks to both availability of new satellite-based observations and the development of the in situ observations from the ground and from commercial aircraft. In addition, efforts to promote access to information and development of interoperable information systems have facilitated access to data and data products retrieved from both space, ground and aircraft-based observations.
However, despite evident progresses, the aerosol observing system still does not fully meet the expected requirements for a Global Observing System. The wide spatial coverage of space-borne sensors generally provides sufficient information at Threshold for most ECV products that are suited for many applications (evaluations, analyses), however, smaller retrieval areas should be explored in future satellite missions to respond to requirements at breakthrough and goal levels. Only the threshold temporal resolution of AOD products is met for space-borne sensors which are taken from polar orbiters with repeat measurement times outside the polar regions that are quite long. This is compensated for in many regions but not all by a dense ground-based network for AOD and derived products retrieval.
Most aerosol products in satellite remote sensing can only address column averaged (or integrated) properties. However, vertical distributions are useful constraints for the evaluation of transport in global models. A smart use of in situ observations, space observations and models may compensate for sparseness and limitations of information on vertical distribution, but this only applies to regions where lidar networks are operational with seamless access, as for the United States and Europe. Access to vertical profiles remains a limiting factor to a global aerosol observing system.
The ground-based system has also significantly improved mostly for its spatial coverage that is now close to threshold in several regions (North America, Europe, some parts of Asia) for several aerosol parameters. AERONET and other AOD networks (Skynet, PFR, etc.) provide a dense network of observations over land, responding to threshold requirements (and breakthrough in some areas) for GCOS. Threshold in Timeliness is only met by a few networks.
For other aerosol parameters, despite the fact that e.g. NOAA-FAN in the US, ACTRIS in Europe have extended their networks beyond US and Europe political boundaries, many areas in the world remain undersampled and data access remains an issue.
The tropospheric profiles of aerosol particle size distribution and the number concentrations are measured as part of the IAGOS CARIBIC package and is planned to be implemented on the IAGOS Aerosol Package on-board commercial aircrafts in the future, providing key information on both profiles and concentration along aircraft routes. Interest of some countries to join the IAGOS association, and development funding for adapting IAGOS packages to new aircraft, including on shorter routes, will be of key importance. One recently realised vulnerability in the program was a significant reduction in IAGOS data due a drastic decline in commercial aircraft flights driven by the COVID-19 global pandemic.
The development of the in situ observing system for Aerosol ECV products has been paralleled with great efforts to ensure traceability and provenance of data, joint data management procedures and data policies, under the GAW program. The information system remains, however, managed regionally, and in some countries/regions, operated by different research organisations, leading to difficulties to fully respond to user requirements of an integrated observing system.
- 124 -
Record length of aerosol products should be at least 10 to 15 years for trends to be derived. Continuity of operations and consistency in the time series for both space-based and in situ observing systems are key to many downstream applications and must remain high on the agenda.
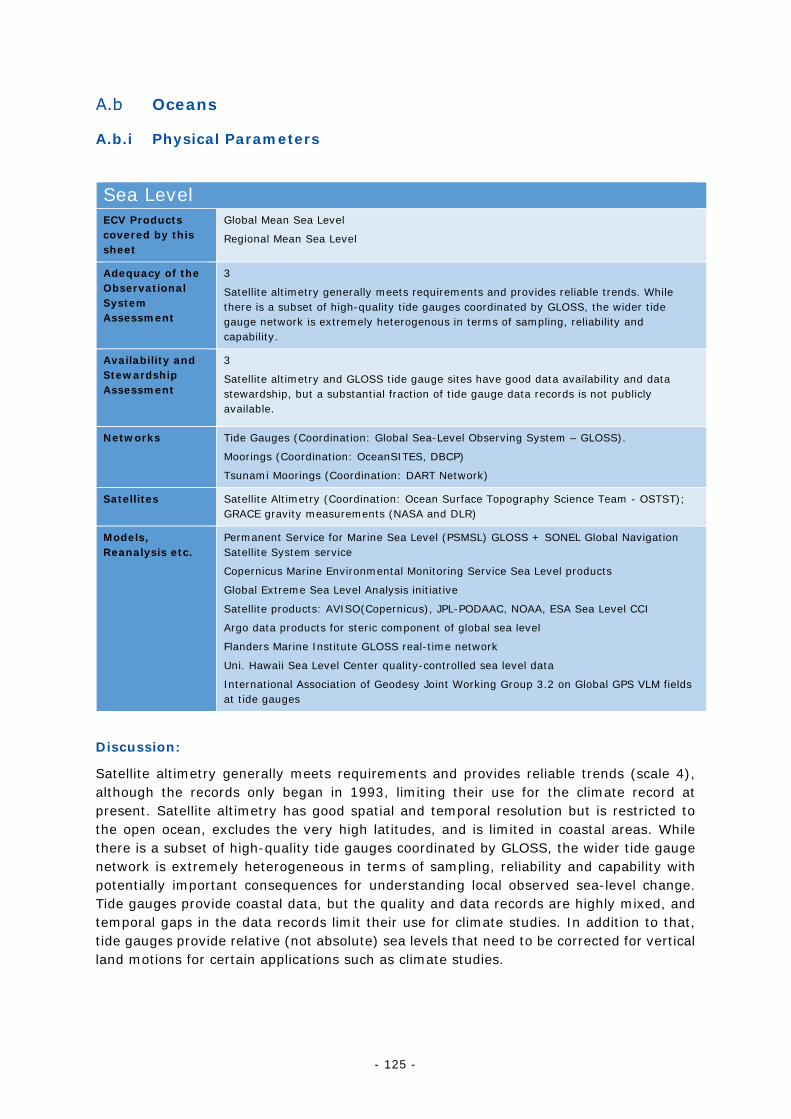
- 125 -
Oceans
A.b.i Physical Parameters
Sea Level ECV Products covered by this sheet
Global Mean Sea Level
Regional Mean Sea Level
Adequacy of the Observational System Assessment
3
Satellite altimetry generally meets requirements and provides reliable trends. While there is a subset of high-quality tide gauges coordinated by GLOSS, the wider tide gauge network is extremely heterogenous in terms of sampling, reliability and capability.
Availability and Stewardship Assessment
3
Satellite altimetry and GLOSS tide gauge sites have good data availability and data stewardship, but a substantial fraction of tide gauge data records is not publicly available.
Networks Tide Gauges (Coordination: Global Sea-Level Observing System – GLOSS).
Moorings (Coordination: OceanSITES, DBCP)
Tsunami Moorings (Coordination: DART Network)
Satellites Satellite Altimetry (Coordination: Ocean Surface Topography Science Team - OSTST); GRACE gravity measurements (NASA and DLR)
Models, Reanalysis etc.
Permanent Service for Marine Sea Level (PSMSL) GLOSS + SONEL Global Navigation Satellite System service
Copernicus Marine Environmental Monitoring Service Sea Level products
Global Extreme Sea Level Analysis initiative
Satellite products: AVISO(Copernicus), JPL-PODAAC, NOAA, ESA Sea Level CCI
Argo data products for steric component of global sea level
Flanders Marine Institute GLOSS real-time network
Uni. Hawaii Sea Level Center quality-controlled sea level data
International Association of Geodesy Joint Working Group 3.2 on Global GPS VLM fields at tide gauges
Discussion:
Satellite altimetry generally meets requirements and provides reliable trends (scale 4), although the records only began in 1993, limiting their use for the climate record at present. Satellite altimetry has good spatial and temporal resolution but is restricted to the open ocean, excludes the very high latitudes, and is limited in coastal areas. While there is a subset of high-quality tide gauges coordinated by GLOSS, the wider tide gauge network is extremely heterogeneous in terms of sampling, reliability and capability with potentially important consequences for understanding local observed sea-level change. Tide gauges provide coastal data, but the quality and data records are highly mixed, and temporal gaps in the data records limit their use for climate studies. In addition to that, tide gauges provide relative (not absolute) sea levels that need to be corrected for vertical land motions for certain applications such as climate studies.
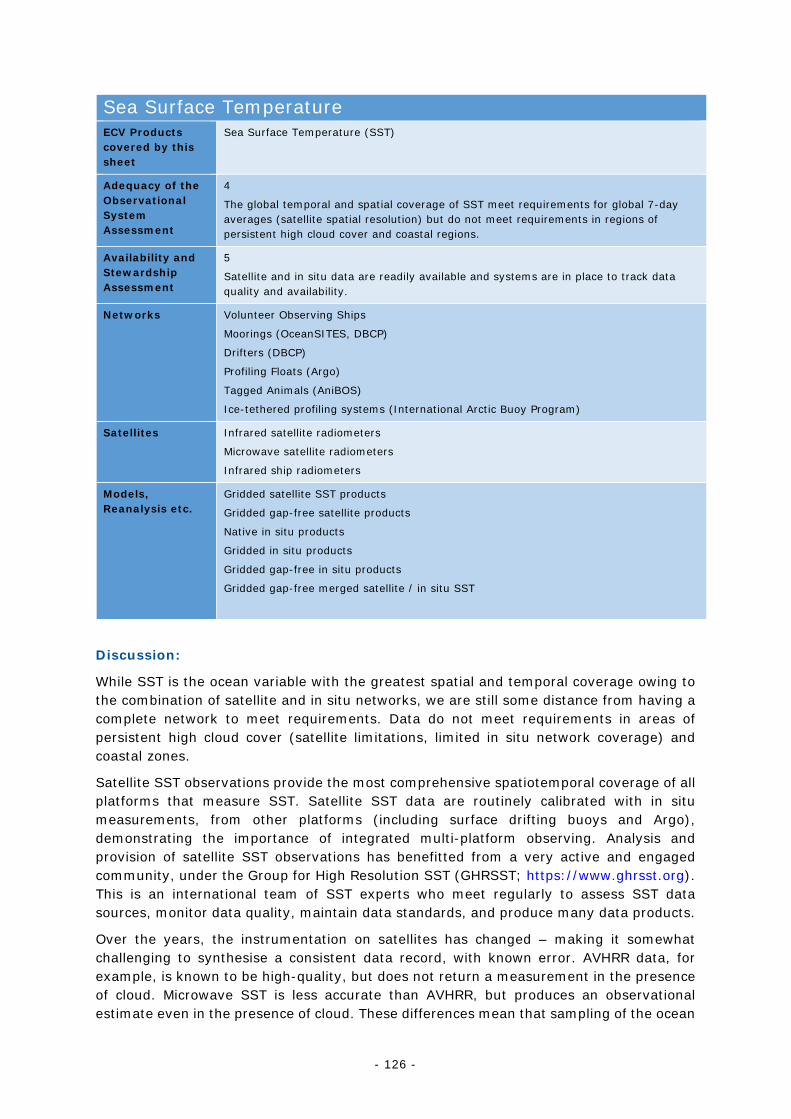
- 126 -
Sea Surface Temperature ECV Products covered by this sheet
Sea Surface Temperature (SST)
Adequacy of the Observational System Assessment
4
The global temporal and spatial coverage of SST meet requirements for global 7-day averages (satellite spatial resolution) but do not meet requirements in regions of persistent high cloud cover and coastal regions.
Availability and Stewardship Assessment
5
Satellite and in situ data are readily available and systems are in place to track data quality and availability.
Networks Volunteer Observing Ships
Moorings (OceanSITES, DBCP)
Drifters (DBCP)
Profiling Floats (Argo)
Tagged Animals (AniBOS)
Ice-tethered profiling systems (International Arctic Buoy Program)
Satellites Infrared satellite radiometers
Microwave satellite radiometers
Infrared ship radiometers
Models, Reanalysis etc.
Gridded satellite SST products
Gridded gap-free satellite products
Native in situ products
Gridded in situ products
Gridded gap-free in situ products
Gridded gap-free merged satellite / in situ SST
Discussion:
While SST is the ocean variable with the greatest spatial and temporal coverage owing to the combination of satellite and in situ networks, we are still some distance from having a complete network to meet requirements. Data do not meet requirements in areas of persistent high cloud cover (satellite limitations, limited in situ network coverage) and coastal zones.
Satellite SST observations provide the most comprehensive spatiotemporal coverage of all platforms that measure SST. Satellite SST data are routinely calibrated with in situ measurements, from other platforms (including surface drifting buoys and Argo), demonstrating the importance of integrated multi-platform observing. Analysis and provision of satellite SST observations has benefitted from a very active and engaged community, under the Group for High Resolution SST (GHRSST; https://www.ghrsst.org). This is an international team of SST experts who meet regularly to assess SST data sources, monitor data quality, maintain data standards, and produce many data products.
Over the years, the instrumentation on satellites has changed – making it somewhat challenging to synthesise a consistent data record, with known error. AVHRR data, for example, is known to be high-quality, but does not return a measurement in the presence of cloud. Microwave SST is less accurate than AVHRR, but produces an observational estimate even in the presence of cloud. These differences mean that sampling of the ocean
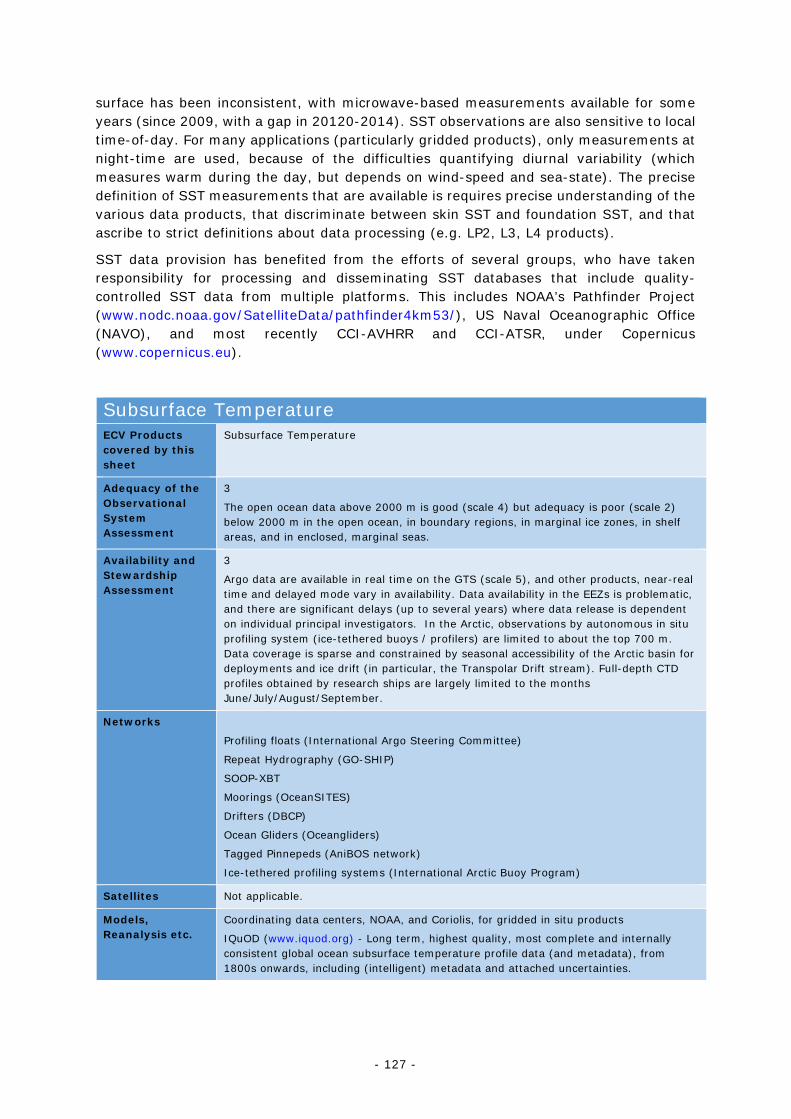
- 127 -
surface has been inconsistent, with microwave-based measurements available for some years (since 2009, with a gap in 20120-2014). SST observations are also sensitive to local time-of-day. For many applications (particularly gridded products), only measurements at night-time are used, because of the difficulties quantifying diurnal variability (which measures warm during the day, but depends on wind-speed and sea-state). The precise definition of SST measurements that are available is requires precise understanding of the various data products, that discriminate between skin SST and foundation SST, and that ascribe to strict definitions about data processing (e.g. LP2, L3, L4 products).
SST data provision has benefited from the efforts of several groups, who have taken responsibility for processing and disseminating SST databases that include quality-controlled SST data from multiple platforms. This includes NOAA’s Pathfinder Project (www.nodc.noaa.gov/SatelliteData/pathfinder4km53/), US Naval Oceanographic Office (NAVO), and most recently CCI-AVHRR and CCI-ATSR, under Copernicus (www.copernicus.eu).
Subsurface Temperature ECV Products covered by this sheet
Subsurface Temperature
Adequacy of the Observational System Assessment
3
The open ocean data above 2000 m is good (scale 4) but adequacy is poor (scale 2) below 2000 m in the open ocean, in boundary regions, in marginal ice zones, in shelf areas, and in enclosed, marginal seas.
Availability and Stewardship Assessment
3
Argo data are available in real time on the GTS (scale 5), and other products, near-real time and delayed mode vary in availability. Data availability in the EEZs is problematic, and there are significant delays (up to several years) where data release is dependent on individual principal investigators. In the Arctic, observations by autonomous in situ profiling system (ice-tethered buoys / profilers) are limited to about the top 700 m. Data coverage is sparse and constrained by seasonal accessibility of the Arctic basin for deployments and ice drift (in particular, the Transpolar Drift stream). Full-depth CTD profiles obtained by research ships are largely limited to the months June/July/August/September.
Networks
Profiling floats (International Argo Steering Committee)
Repeat Hydrography (GO-SHIP)
SOOP-XBT
Moorings (OceanSITES)
Drifters (DBCP)
Ocean Gliders (Oceangliders)
Tagged Pinnepeds (AniBOS network)
Ice-tethered profiling systems (International Arctic Buoy Program)
Satellites Not applicable.
Models, Reanalysis etc.
Coordinating data centers, NOAA, and Coriolis, for gridded in situ products
IQuOD (www.iquod.org) - Long term, highest quality, most complete and internally consistent global ocean subsurface temperature profile data (and metadata), from 1800s onwards, including (intelligent) metadata and attached uncertainties.
- 128 -
Discussion:
There is a large range in adequacy of the subsurface temperature data. During the period from 2000-2005, global-scale data sampling started to grow due to the Argo Profiling Float Program. Since the year 2005, open ocean data coverage above 2000 meters is good, but below 2000 meters, where Argo does not sample, data availability from combined other observing platforms is low. Many regions, such as the boundary regions, marginal ice zones, shelf areas and enclosed/marginal seas, are still poorly observed. In the Arctic, observations by ice-tethered profiling systems give year-round measurements of T and S to about 700 m, but coverage is sparse. Before the year 2000, data are limited and inhomogeneous, and often limited to 300 or 700 m depth layers. Sparse data are available from the beginning of the century, and starting in the 1950s and 1960s, data sampling increased due to technological developments, but with large gaps and irregular sampling. Since 2005, global 3-monthly resolution in the open ocean is good (above 2000 m). There is still substantial spread in global ocean heat content estimates for the 0-2000 m layer, even at annual timescales. Since 2000, availability and stewardship of data collected as part of global observing systems is very good, but the data collected in Exclusive Economic Zones can be hard to track and to make openly available. Data quality control can vary between automatic instantaneous (real time) for operational use, real-time data combined with additional QC for assimilation (near-real-time), and near-real time data combined with scientific QC (delayed-mode). There are some issues with the delayed mode data being made available in a timely manner where data release is dependent on the PI, where delays of several years have been known to occur.
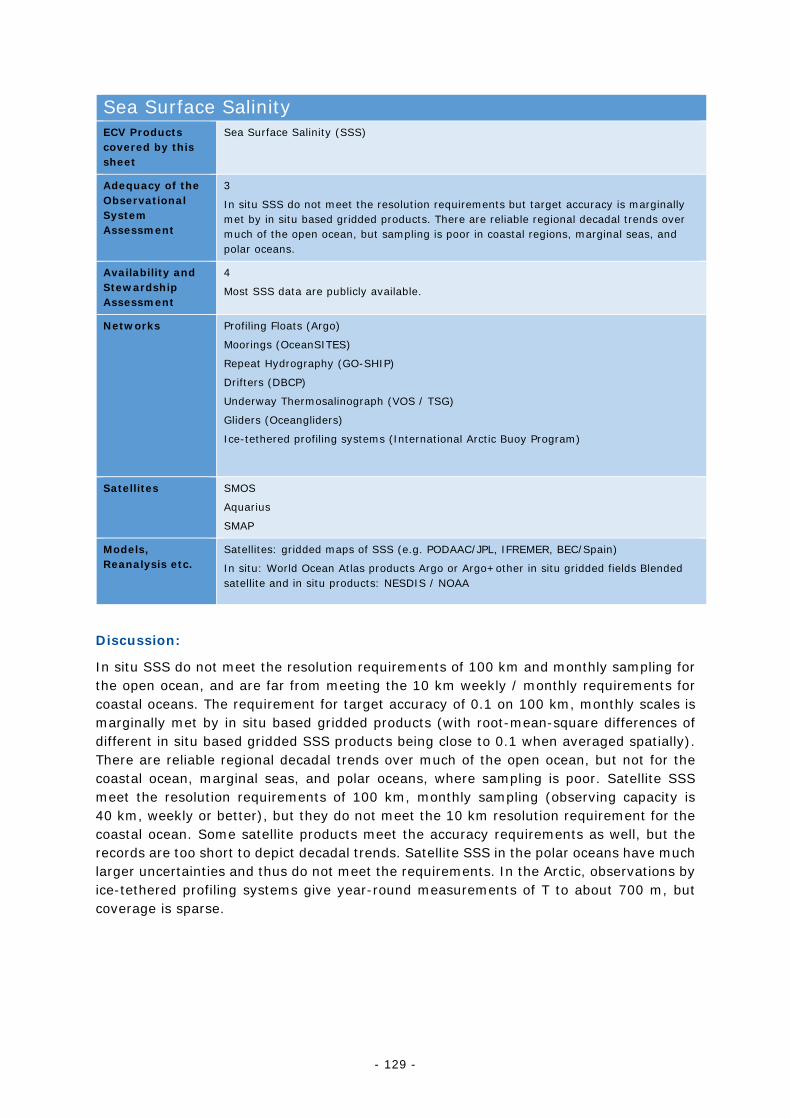
- 129 -
Sea Surface Salinity ECV Products covered by this sheet
Sea Surface Salinity (SSS)
Adequacy of the Observational System Assessment
3
In situ SSS do not meet the resolution requirements but target accuracy is marginally met by in situ based gridded products. There are reliable regional decadal trends over much of the open ocean, but sampling is poor in coastal regions, marginal seas, and polar oceans.
Availability and Stewardship Assessment
4
Most SSS data are publicly available.
Networks Profiling Floats (Argo)
Moorings (OceanSITES)
Repeat Hydrography (GO-SHIP)
Drifters (DBCP)
Underway Thermosalinograph (VOS / TSG)
Gliders (Oceangliders)
Ice-tethered profiling systems (International Arctic Buoy Program)
Satellites SMOS
Aquarius
SMAP
Models, Reanalysis etc.
Satellites: gridded maps of SSS (e.g. PODAAC/JPL, IFREMER, BEC/Spain)
In situ: World Ocean Atlas products Argo or Argo+other in situ gridded fields Blended satellite and in situ products: NESDIS / NOAA
Discussion:
In situ SSS do not meet the resolution requirements of 100 km and monthly sampling for the open ocean, and are far from meeting the 10 km weekly / monthly requirements for coastal oceans. The requirement for target accuracy of 0.1 on 100 km, monthly scales is marginally met by in situ based gridded products (with root-mean-square differences of different in situ based gridded SSS products being close to 0.1 when averaged spatially). There are reliable regional decadal trends over much of the open ocean, but not for the coastal ocean, marginal seas, and polar oceans, where sampling is poor. Satellite SSS meet the resolution requirements of 100 km, monthly sampling (observing capacity is 40 km, weekly or better), but they do not meet the 10 km resolution requirement for the coastal ocean. Some satellite products meet the accuracy requirements as well, but the records are too short to depict decadal trends. Satellite SSS in the polar oceans have much larger uncertainties and thus do not meet the requirements. In the Arctic, observations by ice-tethered profiling systems give year-round measurements of T to about 700 m, but coverage is sparse.
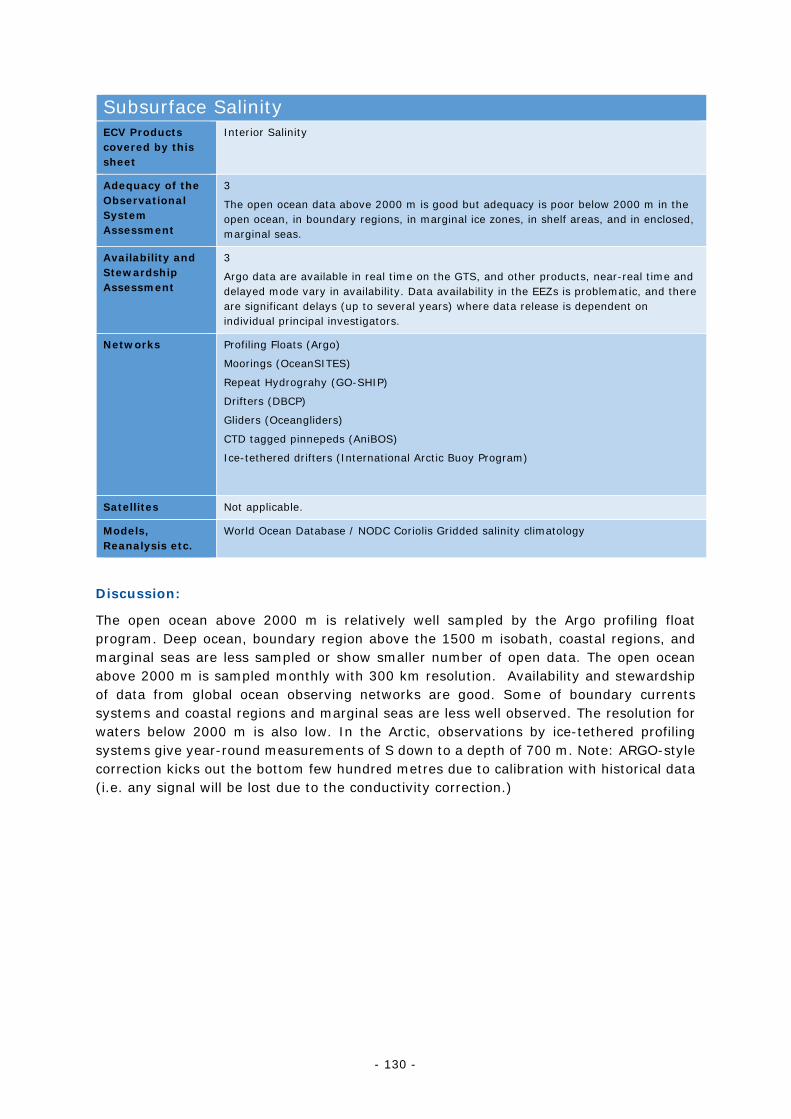
- 130 -
Subsurface Salinity ECV Products covered by this sheet
Interior Salinity
Adequacy of the Observational System Assessment
3
The open ocean data above 2000 m is good but adequacy is poor below 2000 m in the open ocean, in boundary regions, in marginal ice zones, in shelf areas, and in enclosed, marginal seas.
Availability and Stewardship Assessment
3
Argo data are available in real time on the GTS, and other products, near-real time and delayed mode vary in availability. Data availability in the EEZs is problematic, and there are significant delays (up to several years) where data release is dependent on individual principal investigators.
Networks Profiling Floats (Argo)
Moorings (OceanSITES)
Repeat Hydrograhy (GO-SHIP)
Drifters (DBCP)
Gliders (Oceangliders)
CTD tagged pinnepeds (AniBOS)
Ice-tethered drifters (International Arctic Buoy Program)
Satellites Not applicable.
Models, Reanalysis etc.
World Ocean Database / NODC Coriolis Gridded salinity climatology
Discussion:
The open ocean above 2000 m is relatively well sampled by the Argo profiling float program. Deep ocean, boundary region above the 1500 m isobath, coastal regions, and marginal seas are less sampled or show smaller number of open data. The open ocean above 2000 m is sampled monthly with 300 km resolution. Availability and stewardship of data from global ocean observing networks are good. Some of boundary currents systems and coastal regions and marginal seas are less well observed. The resolution for waters below 2000 m is also low. In the Arctic, observations by ice-tethered profiling systems give year-round measurements of S down to a depth of 700 m. Note: ARGO-style correction kicks out the bottom few hundred metres due to calibration with historical data (i.e. any signal will be lost due to the conductivity correction.)
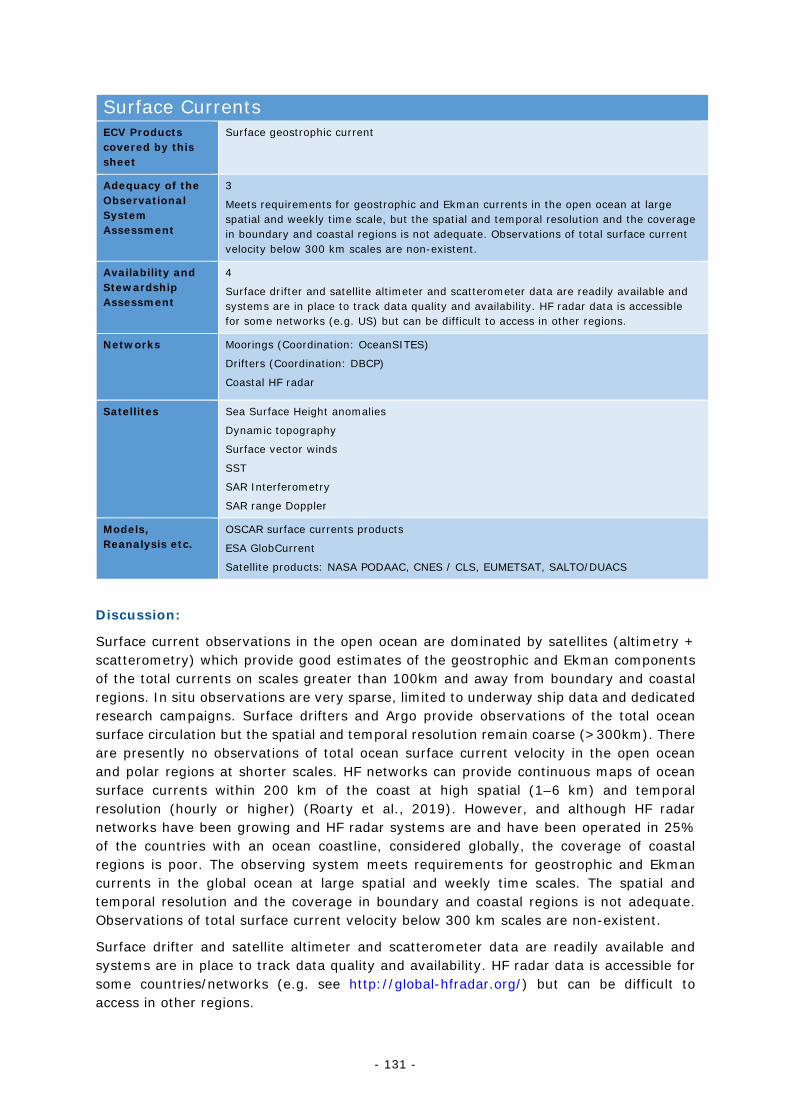
- 131 -
Surface Currents ECV Products covered by this sheet
Surface geostrophic current
Adequacy of the Observational System Assessment
3
Meets requirements for geostrophic and Ekman currents in the open ocean at large spatial and weekly time scale, but the spatial and temporal resolution and the coverage in boundary and coastal regions is not adequate. Observations of total surface current velocity below 300 km scales are non-existent.
Availability and Stewardship Assessment
4
Surface drifter and satellite altimeter and scatterometer data are readily available and systems are in place to track data quality and availability. HF radar data is accessible for some networks (e.g. US) but can be difficult to access in other regions.
Networks Moorings (Coordination: OceanSITES)
Drifters (Coordination: DBCP)
Coastal HF radar
Satellites Sea Surface Height anomalies
Dynamic topography
Surface vector winds
SST
SAR Interferometry
SAR range Doppler
Models, Reanalysis etc.
OSCAR surface currents products
ESA GlobCurrent
Satellite products: NASA PODAAC, CNES / CLS, EUMETSAT, SALTO/DUACS
Discussion:
Surface current observations in the open ocean are dominated by satellites (altimetry + scatterometry) which provide good estimates of the geostrophic and Ekman components of the total currents on scales greater than 100km and away from boundary and coastal regions. In situ observations are very sparse, limited to underway ship data and dedicated research campaigns. Surface drifters and Argo provide observations of the total ocean surface circulation but the spatial and temporal resolution remain coarse (>300km). There are presently no observations of total ocean surface current velocity in the open ocean and polar regions at shorter scales. HF networks can provide continuous maps of ocean surface currents within 200 km of the coast at high spatial (1–6 km) and temporal resolution (hourly or higher) (Roarty et al., 2019). However, and although HF radar networks have been growing and HF radar systems are and have been operated in 25% of the countries with an ocean coastline, considered globally, the coverage of coastal regions is poor. The observing system meets requirements for geostrophic and Ekman currents in the global ocean at large spatial and weekly time scales. The spatial and temporal resolution and the coverage in boundary and coastal regions is not adequate. Observations of total surface current velocity below 300 km scales are non-existent.
Surface drifter and satellite altimeter and scatterometer data are readily available and systems are in place to track data quality and availability. HF radar data is accessible for some countries/networks (e.g. see http://global-hfradar.org/) but can be difficult to access in other regions.
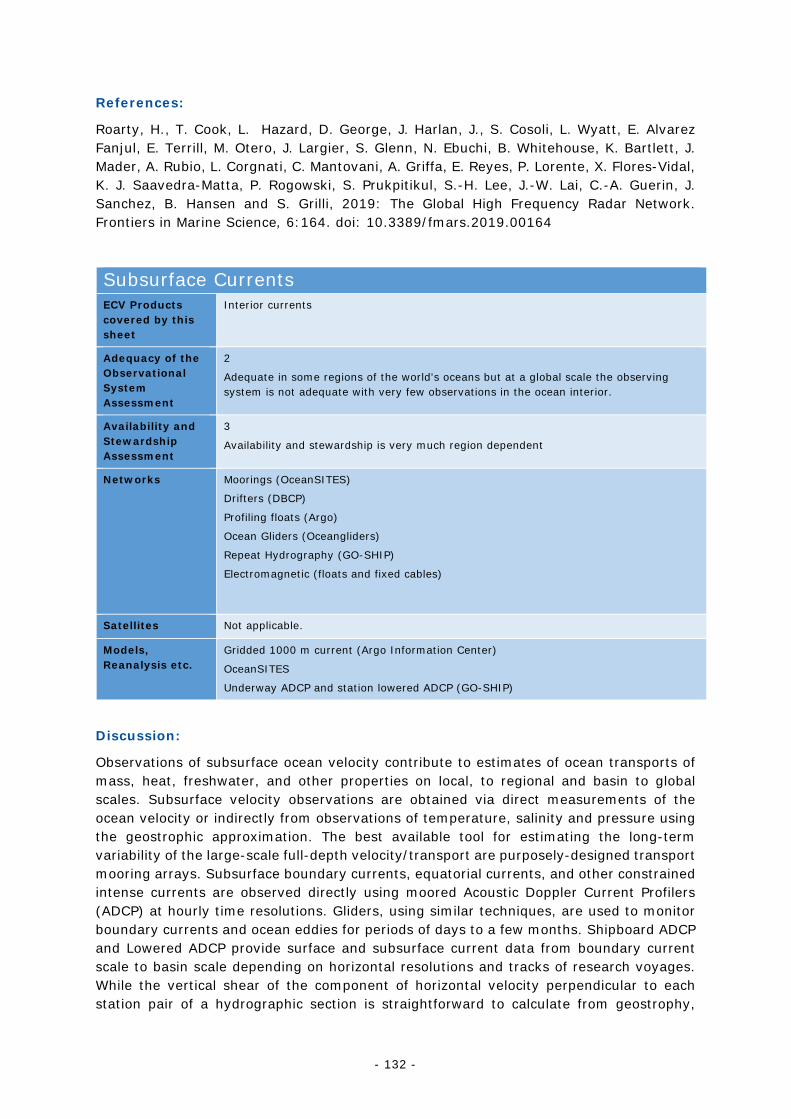
- 132 -
References:
Roarty, H., T. Cook, L. Hazard, D. George, J. Harlan, J., S. Cosoli, L. Wyatt, E. Alvarez Fanjul, E. Terrill, M. Otero, J. Largier, S. Glenn, N. Ebuchi, B. Whitehouse, K. Bartlett, J. Mader, A. Rubio, L. Corgnati, C. Mantovani, A. Griffa, E. Reyes, P. Lorente, X. Flores-Vidal, K. J. Saavedra-Matta, P. Rogowski, S. Prukpitikul, S.-H. Lee, J.-W. Lai, C.-A. Guerin, J. Sanchez, B. Hansen and S. Grilli, 2019: The Global High Frequency Radar Network. Frontiers in Marine Science, 6:164. doi: 10.3389/fmars.2019.00164
Subsurface Currents ECV Products covered by this sheet
Interior currents
Adequacy of the Observational System Assessment
2
Adequate in some regions of the world's oceans but at a global scale the observing system is not adequate with very few observations in the ocean interior.
Availability and Stewardship Assessment
3
Availability and stewardship is very much region dependent
Networks Moorings (OceanSITES)
Drifters (DBCP)
Profiling floats (Argo)
Ocean Gliders (Oceangliders)
Repeat Hydrography (GO-SHIP)
Electromagnetic (floats and fixed cables)
Satellites Not applicable.
Models, Reanalysis etc.
Gridded 1000 m current (Argo Information Center)
OceanSITES
Underway ADCP and station lowered ADCP (GO-SHIP)
Discussion:
Observations of subsurface ocean velocity contribute to estimates of ocean transports of mass, heat, freshwater, and other properties on local, to regional and basin to global scales. Subsurface velocity observations are obtained via direct measurements of the ocean velocity or indirectly from observations of temperature, salinity and pressure using the geostrophic approximation. The best available tool for estimating the long-term variability of the large-scale full-depth velocity/transport are purposely-designed transport mooring arrays. Subsurface boundary currents, equatorial currents, and other constrained intense currents are observed directly using moored Acoustic Doppler Current Profilers (ADCP) at hourly time resolutions. Gliders, using similar techniques, are used to monitor boundary currents and ocean eddies for periods of days to a few months. Shipboard ADCP and Lowered ADCP provide surface and subsurface current data from boundary current scale to basin scale depending on horizontal resolutions and tracks of research voyages. While the vertical shear of the component of horizontal velocity perpendicular to each station pair of a hydrographic section is straightforward to calculate from geostrophy,
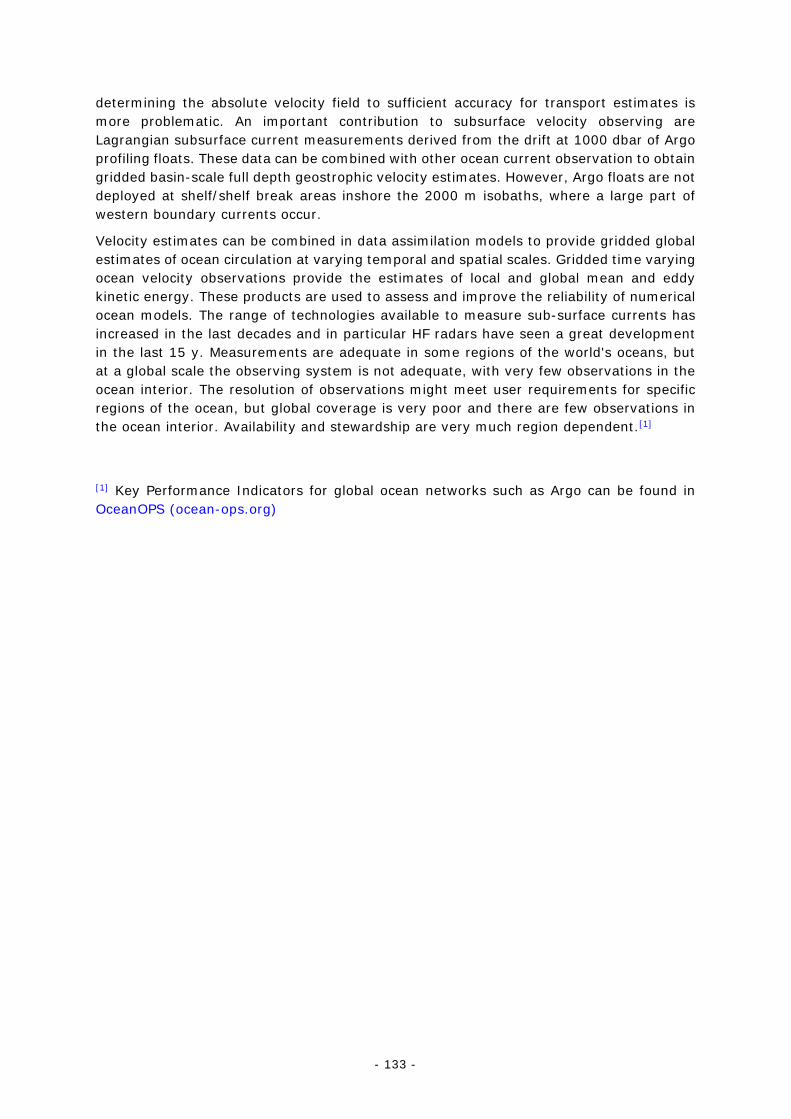
- 133 -
determining the absolute velocity field to sufficient accuracy for transport estimates is more problematic. An important contribution to subsurface velocity observing are Lagrangian subsurface current measurements derived from the drift at 1000 dbar of Argo profiling floats. These data can be combined with other ocean current observation to obtain gridded basin-scale full depth geostrophic velocity estimates. However, Argo floats are not deployed at shelf/shelf break areas inshore the 2000 m isobaths, where a large part of western boundary currents occur.
Velocity estimates can be combined in data assimilation models to provide gridded global estimates of ocean circulation at varying temporal and spatial scales. Gridded time varying ocean velocity observations provide the estimates of local and global mean and eddy kinetic energy. These products are used to assess and improve the reliability of numerical ocean models. The range of technologies available to measure sub-surface currents has increased in the last decades and in particular HF radars have seen a great development in the last 15 y. Measurements are adequate in some regions of the world's oceans, but at a global scale the observing system is not adequate, with very few observations in the ocean interior. The resolution of observations might meet user requirements for specific regions of the ocean, but global coverage is very poor and there are few observations in the ocean interior. Availability and stewardship are very much region dependent.[1]
[1] Key Performance Indicators for global ocean networks such as Argo can be found in OceanOPS (ocean-ops.org)
- 134 -
Surface Stress ECV Products covered by this sheet
Ocean surface stress
Adequacy of the Observational System Assessment
3
Satellite ocean-surface wind stress meets some of the accuracy requirements. In situ wind stress meets all accuracy requirements, but coverage is extremely sparse. Satellite wind stress measurements, with typical spatial resolution of 25 km, are close to meeting the 10-100 km spatial resolution requirements. But they do not meet the hourly sampling requirement for certain phenomena. In situ wind stress does not meet the resolution requirements of 10-100 km, but mooring wind stress meet the hourly sampling requirement.
Availability and Stewardship Assessment
4
Most wind stress data are available publicly.
Networks Research vessels (GO-SHIP)
Surface Buoys (DBCP)
Air-sea Flux Moorings (OceanSITES)
Satellites Scatterometers
Polarimetric passive microwave radiometers
Models, Reanalysis etc.
CCMP wind analysis, IFREMER wind analysis, ERA-Interim, ERA5, CFSRv2, MERRA2, JRA-55
Discussion:
Satellite measurements of ocean-surface wind stress are derived from scatterometers and polarimetric radiometers. While the typical spatial resolution is 25 km. Products generated at 12.5 km are also available with higher noise level. There are very few of these satellites currently operating in orbit and with the ASCAT series being the only operational mission. Because of this, there are significant temporal sampling gaps on diurnal time scales (not meeting the hourly temporal sampling requirement). Resolving diurnal wind stress are important for many science and application areas, such diurnal convection and its effect on variability of longer time scales including synoptic storms and Madden-Julian Oscillation. International coordination among space agencies is critical to improve the ability to sample diurnal surface stress. Satellite scatterometers are typically on sun-synchronous orbits with fixed local equatorial crossing times. This may cause aliasing of diurnal signal into the long-term mean. There are insufficient in situ surface stress measurements over the global ocean to understand the extent of the diurnal aliasing in satellite surface stress. Satellite scatterometers use both Ku- and C- band microwave frequencies. Ku-band sensors are more susceptible to rain effect than C-band sensors. Inter-calibration of different satellite scatterometers using long-term in situ measurements is important, especially in climatologically rainy regions. In such regions, the evaluation of satellite surface stress using in situ measurements need to take into account small-scale wind variability that are averaged within satellite footprints but sampled at point-wise locations by in situ sensors. Such small-scale wind variability, which can be stronger under rainy conditions (e.g. associated with transient convective rain cells), can contribute the difference between satellite and in situ surface stress measurements. Effect of surface currents can also contribute to the difference between surface stress derived from satellites and in situ sensors.
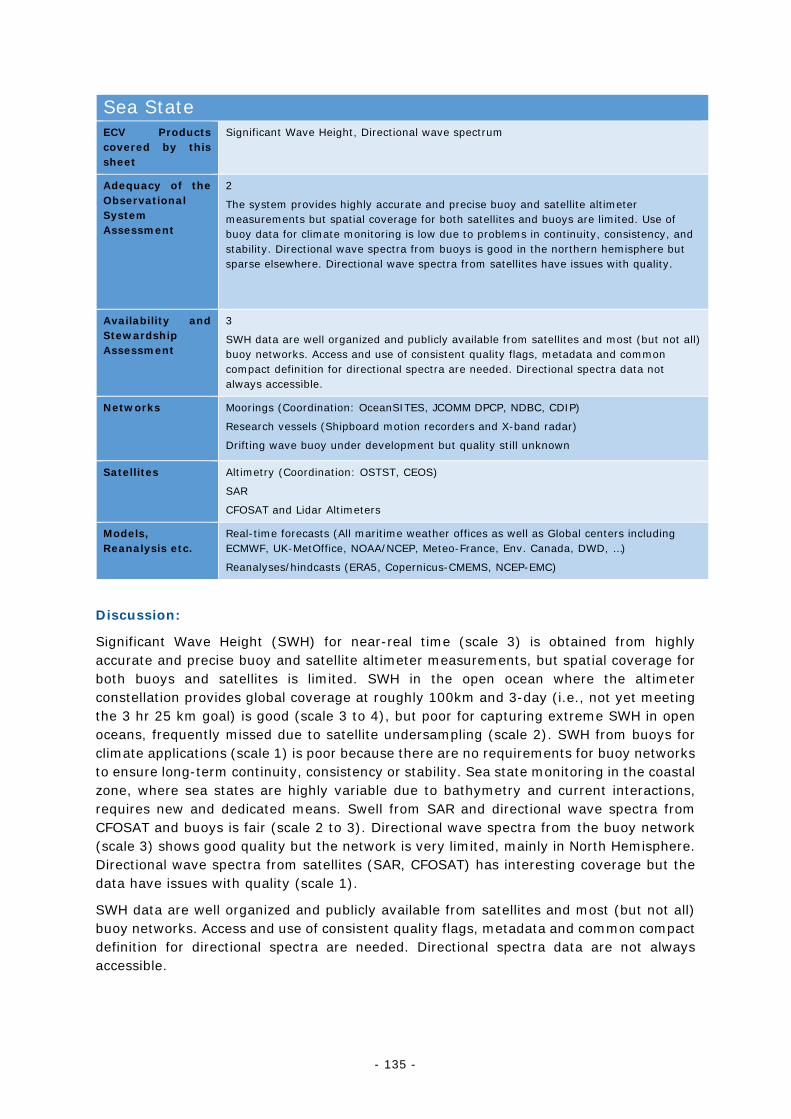
- 135 -
Sea State ECV Products covered by this sheet
Significant Wave Height, Directional wave spectrum
Adequacy of the Observational System Assessment
2
The system provides highly accurate and precise buoy and satellite altimeter measurements but spatial coverage for both satellites and buoys are limited. Use of buoy data for climate monitoring is low due to problems in continuity, consistency, and stability. Directional wave spectra from buoys is good in the northern hemisphere but sparse elsewhere. Directional wave spectra from satellites have issues with quality.
Availability and Stewardship Assessment
3
SWH data are well organized and publicly available from satellites and most (but not all) buoy networks. Access and use of consistent quality flags, metadata and common compact definition for directional spectra are needed. Directional spectra data not always accessible.
Networks Moorings (Coordination: OceanSITES, JCOMM DPCP, NDBC, CDIP)
Research vessels (Shipboard motion recorders and X-band radar)
Drifting wave buoy under development but quality still unknown
Satellites Altimetry (Coordination: OSTST, CEOS)
SAR
CFOSAT and Lidar Altimeters
Models, Reanalysis etc.
Real-time forecasts (All maritime weather offices as well as Global centers including ECMWF, UK-MetOffice, NOAA/NCEP, Meteo-France, Env. Canada, DWD, …)
Reanalyses/hindcasts (ERA5, Copernicus-CMEMS, NCEP-EMC)
Discussion:
Significant Wave Height (SWH) for near-real time (scale 3) is obtained from highly accurate and precise buoy and satellite altimeter measurements, but spatial coverage for both buoys and satellites is limited. SWH in the open ocean where the altimeter constellation provides global coverage at roughly 100km and 3-day (i.e., not yet meeting the 3 hr 25 km goal) is good (scale 3 to 4), but poor for capturing extreme SWH in open oceans, frequently missed due to satellite undersampling (scale 2). SWH from buoys for climate applications (scale 1) is poor because there are no requirements for buoy networks to ensure long-term continuity, consistency or stability. Sea state monitoring in the coastal zone, where sea states are highly variable due to bathymetry and current interactions, requires new and dedicated means. Swell from SAR and directional wave spectra from CFOSAT and buoys is fair (scale 2 to 3). Directional wave spectra from the buoy network (scale 3) shows good quality but the network is very limited, mainly in North Hemisphere. Directional wave spectra from satellites (SAR, CFOSAT) has interesting coverage but the data have issues with quality (scale 1).
SWH data are well organized and publicly available from satellites and most (but not all) buoy networks. Access and use of consistent quality flags, metadata and common compact definition for directional spectra are needed. Directional spectra data are not always accessible.
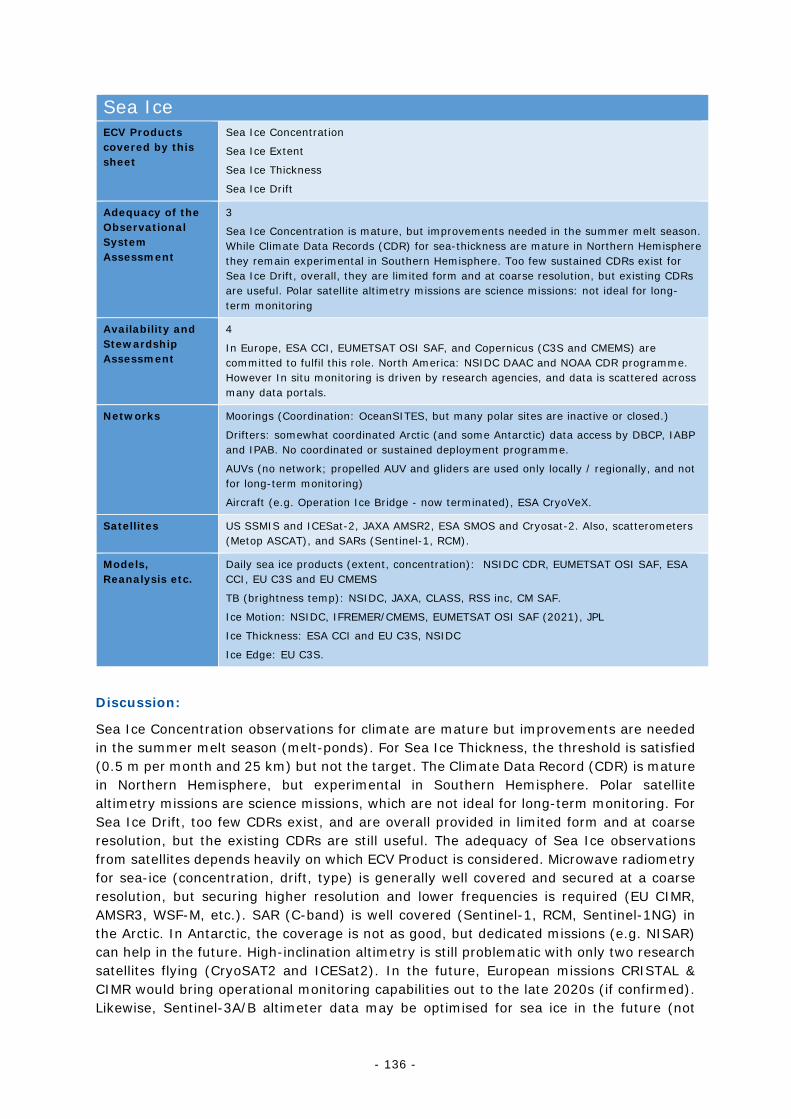
- 136 -
Sea Ice ECV Products covered by this sheet
Sea Ice Concentration
Sea Ice Extent
Sea Ice Thickness
Sea Ice Drift
Adequacy of the Observational System Assessment
3
Sea Ice Concentration is mature, but improvements needed in the summer melt season. While Climate Data Records (CDR) for sea-thickness are mature in Northern Hemisphere they remain experimental in Southern Hemisphere. Too few sustained CDRs exist for Sea Ice Drift, overall, they are limited form and at coarse resolution, but existing CDRs are useful. Polar satellite altimetry missions are science missions: not ideal for long-term monitoring
Availability and Stewardship Assessment
4
In Europe, ESA CCI, EUMETSAT OSI SAF, and Copernicus (C3S and CMEMS) are committed to fulfil this role. North America: NSIDC DAAC and NOAA CDR programme. However In situ monitoring is driven by research agencies, and data is scattered across many data portals.
Networks Moorings (Coordination: OceanSITES, but many polar sites are inactive or closed.)
Drifters: somewhat coordinated Arctic (and some Antarctic) data access by DBCP, IABP and IPAB. No coordinated or sustained deployment programme.
AUVs (no network; propelled AUV and gliders are used only locally / regionally, and not for long-term monitoring)
Aircraft (e.g. Operation Ice Bridge - now terminated), ESA CryoVeX.
Satellites US SSMIS and ICESat-2, JAXA AMSR2, ESA SMOS and Cryosat-2. Also, scatterometers (Metop ASCAT), and SARs (Sentinel-1, RCM).
Models, Reanalysis etc.
Daily sea ice products (extent, concentration): NSIDC CDR, EUMETSAT OSI SAF, ESA CCI, EU C3S and EU CMEMS
TB (brightness temp): NSIDC, JAXA, CLASS, RSS inc, CM SAF.
Ice Motion: NSIDC, IFREMER/CMEMS, EUMETSAT OSI SAF (2021), JPL
Ice Thickness: ESA CCI and EU C3S, NSIDC
Ice Edge: EU C3S.
Discussion:
Sea Ice Concentration observations for climate are mature but improvements are needed in the summer melt season (melt-ponds). For Sea Ice Thickness, the threshold is satisfied (0.5 m per month and 25 km) but not the target. The Climate Data Record (CDR) is mature in Northern Hemisphere, but experimental in Southern Hemisphere. Polar satellite altimetry missions are science missions, which are not ideal for long-term monitoring. For Sea Ice Drift, too few CDRs exist, and are overall provided in limited form and at coarse resolution, but the existing CDRs are still useful. The adequacy of Sea Ice observations from satellites depends heavily on which ECV Product is considered. Microwave radiometry for sea-ice (concentration, drift, type) is generally well covered and secured at a coarse resolution, but securing higher resolution and lower frequencies is required (EU CIMR, AMSR3, WSF-M, etc.). SAR (C-band) is well covered (Sentinel-1, RCM, Sentinel-1NG) in the Arctic. In Antarctic, the coverage is not as good, but dedicated missions (e.g. NISAR) can help in the future. High-inclination altimetry is still problematic with only two research satellites flying (CryoSAT2 and ICESat2). In the future, European missions CRISTAL & CIMR would bring operational monitoring capabilities out to the late 2020s (if confirmed). Likewise, Sentinel-3A/B altimeter data may be optimised for sea ice in the future (not
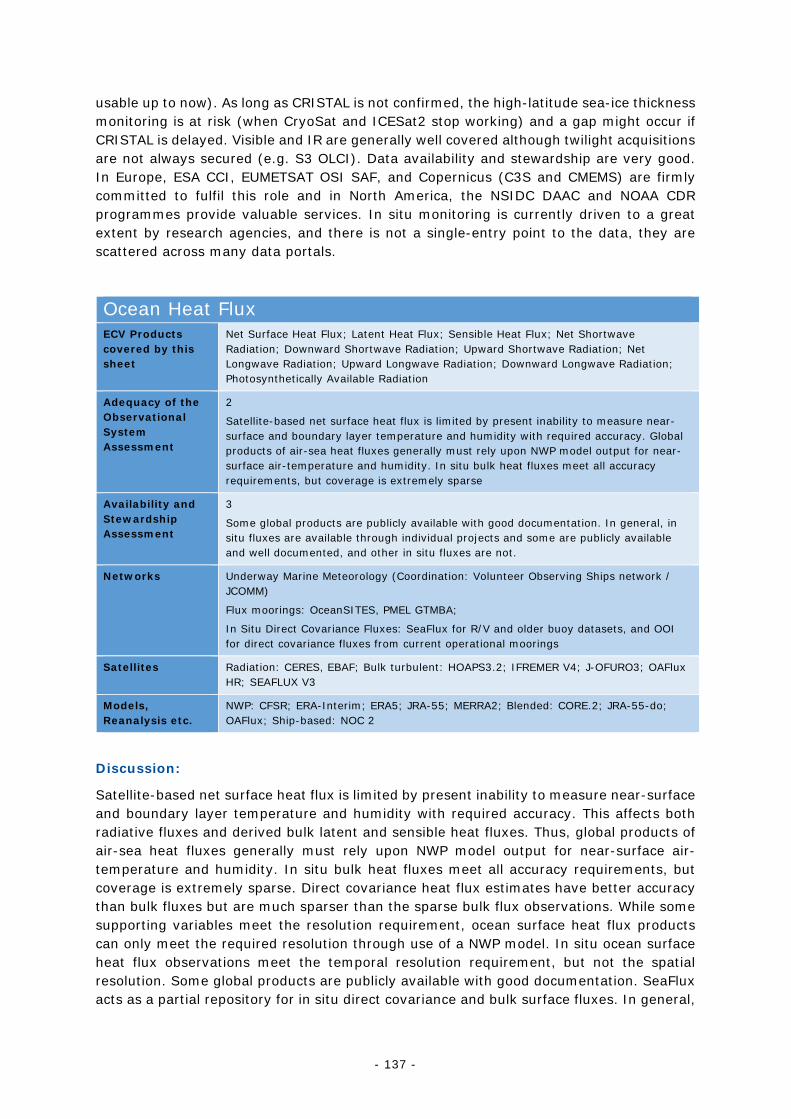
- 137 -
usable up to now). As long as CRISTAL is not confirmed, the high-latitude sea-ice thickness monitoring is at risk (when CryoSat and ICESat2 stop working) and a gap might occur if CRISTAL is delayed. Visible and IR are generally well covered although twilight acquisitions are not always secured (e.g. S3 OLCI). Data availability and stewardship are very good. In Europe, ESA CCI, EUMETSAT OSI SAF, and Copernicus (C3S and CMEMS) are firmly committed to fulfil this role and in North America, the NSIDC DAAC and NOAA CDR programmes provide valuable services. In situ monitoring is currently driven to a great extent by research agencies, and there is not a single-entry point to the data, they are scattered across many data portals.
Ocean Heat Flux ECV Products covered by this sheet
Net Surface Heat Flux; Latent Heat Flux; Sensible Heat Flux; Net Shortwave Radiation; Downward Shortwave Radiation; Upward Shortwave Radiation; Net Longwave Radiation; Upward Longwave Radiation; Downward Longwave Radiation; Photosynthetically Available Radiation
Adequacy of the Observational System Assessment
2
Satellite-based net surface heat flux is limited by present inability to measure near-surface and boundary layer temperature and humidity with required accuracy. Global products of air-sea heat fluxes generally must rely upon NWP model output for near-surface air-temperature and humidity. In situ bulk heat fluxes meet all accuracy requirements, but coverage is extremely sparse
Availability and Stewardship Assessment
3
Some global products are publicly available with good documentation. In general, in situ fluxes are available through individual projects and some are publicly available and well documented, and other in situ fluxes are not.
Networks Underway Marine Meteorology (Coordination: Volunteer Observing Ships network / JCOMM)
Flux moorings: OceanSITES, PMEL GTMBA;
In Situ Direct Covariance Fluxes: SeaFlux for R/V and older buoy datasets, and OOI for direct covariance fluxes from current operational moorings
Satellites Radiation: CERES, EBAF; Bulk turbulent: HOAPS3.2; IFREMER V4; J-OFURO3; OAFlux HR; SEAFLUX V3
Models, Reanalysis etc.
NWP: CFSR; ERA-Interim; ERA5; JRA-55; MERRA2; Blended: CORE.2; JRA-55-do; OAFlux; Ship-based: NOC 2
Discussion:
Satellite-based net surface heat flux is limited by present inability to measure near-surface and boundary layer temperature and humidity with required accuracy. This affects both radiative fluxes and derived bulk latent and sensible heat fluxes. Thus, global products of air-sea heat fluxes generally must rely upon NWP model output for near-surface air-temperature and humidity. In situ bulk heat fluxes meet all accuracy requirements, but coverage is extremely sparse. Direct covariance heat flux estimates have better accuracy than bulk fluxes but are much sparser than the sparse bulk flux observations. While some supporting variables meet the resolution requirement, ocean surface heat flux products can only meet the required resolution through use of a NWP model. In situ ocean surface heat flux observations meet the temporal resolution requirement, but not the spatial resolution. Some global products are publicly available with good documentation. SeaFlux acts as a partial repository for in situ direct covariance and bulk surface fluxes. In general,
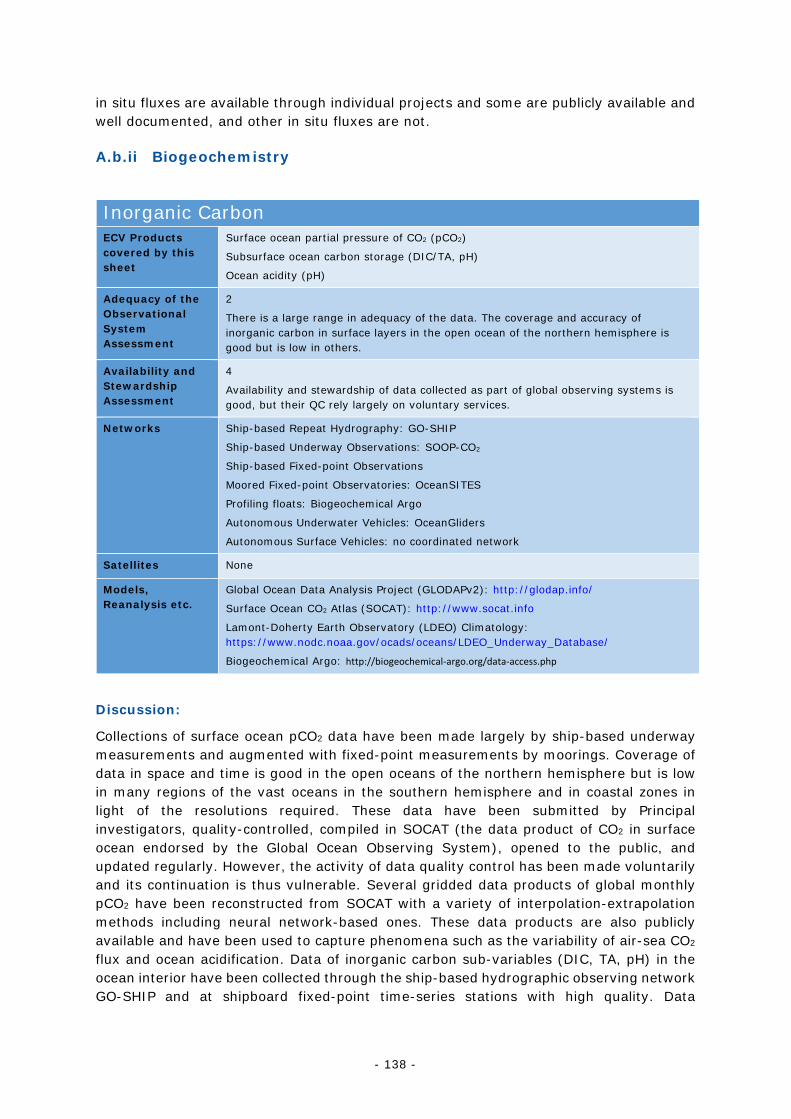
- 138 -
in situ fluxes are available through individual projects and some are publicly available and well documented, and other in situ fluxes are not.
A.b.ii Biogeochemistry
Inorganic Carbon ECV Products covered by this sheet
Surface ocean partial pressure of CO2 (pCO2)
Subsurface ocean carbon storage (DIC/TA, pH)
Ocean acidity (pH)
Adequacy of the Observational System Assessment
2
There is a large range in adequacy of the data. The coverage and accuracy of inorganic carbon in surface layers in the open ocean of the northern hemisphere is good but is low in others.
Availability and Stewardship Assessment
4
Availability and stewardship of data collected as part of global observing systems is good, but their QC rely largely on voluntary services.
Networks Ship-based Repeat Hydrography: GO-SHIP
Ship-based Underway Observations: SOOP-CO2
Ship-based Fixed-point Observations
Moored Fixed-point Observatories: OceanSITES
Profiling floats: Biogeochemical Argo
Autonomous Underwater Vehicles: OceanGliders
Autonomous Surface Vehicles: no coordinated network
Satellites None
Models, Reanalysis etc.
Global Ocean Data Analysis Project (GLODAPv2): http://glodap.info/
Surface Ocean CO2 Atlas (SOCAT): http://www.socat.info
Lamont-Doherty Earth Observatory (LDEO) Climatology: https://www.nodc.noaa.gov/ocads/oceans/LDEO_Underway_Database/
Biogeochemical Argo: http://biogeochemical-argo.org/data-access.php
Discussion:
Collections of surface ocean pCO2 data have been made largely by ship-based underway measurements and augmented with fixed-point measurements by moorings. Coverage of data in space and time is good in the open oceans of the northern hemisphere but is low in many regions of the vast oceans in the southern hemisphere and in coastal zones in light of the resolutions required. These data have been submitted by Principal investigators, quality-controlled, compiled in SOCAT (the data product of CO2 in surface ocean endorsed by the Global Ocean Observing System), opened to the public, and updated regularly. However, the activity of data quality control has been made voluntarily and its continuation is thus vulnerable. Several gridded data products of global monthly pCO2 have been reconstructed from SOCAT with a variety of interpolation-extrapolation methods including neural network-based ones. These data products are also publicly available and have been used to capture phenomena such as the variability of air-sea CO2 flux and ocean acidification. Data of inorganic carbon sub-variables (DIC, TA, pH) in the ocean interior have been collected through the ship-based hydrographic observing network GO-SHIP and at shipboard fixed-point time-series stations with high quality. Data
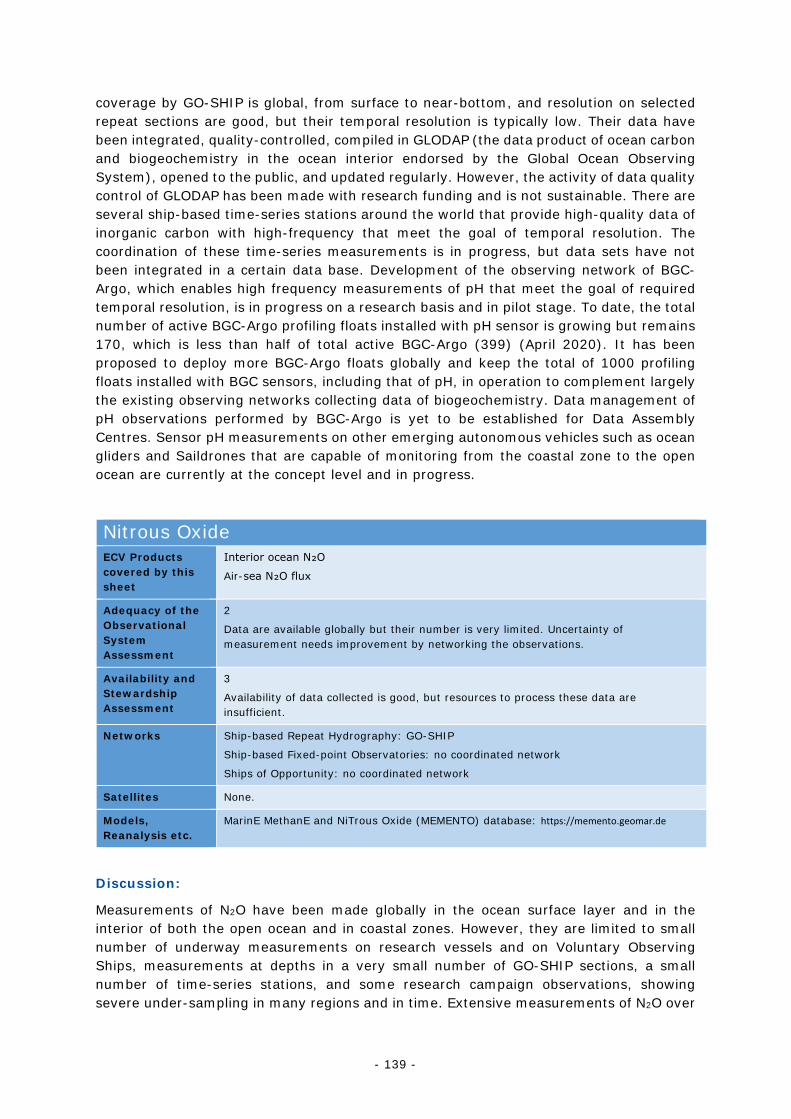
- 139 -
coverage by GO-SHIP is global, from surface to near-bottom, and resolution on selected repeat sections are good, but their temporal resolution is typically low. Their data have been integrated, quality-controlled, compiled in GLODAP (the data product of ocean carbon and biogeochemistry in the ocean interior endorsed by the Global Ocean Observing System), opened to the public, and updated regularly. However, the activity of data quality control of GLODAP has been made with research funding and is not sustainable. There are several ship-based time-series stations around the world that provide high-quality data of inorganic carbon with high-frequency that meet the goal of temporal resolution. The coordination of these time-series measurements is in progress, but data sets have not been integrated in a certain data base. Development of the observing network of BGC-Argo, which enables high frequency measurements of pH that meet the goal of required temporal resolution, is in progress on a research basis and in pilot stage. To date, the total number of active BGC-Argo profiling floats installed with pH sensor is growing but remains 170, which is less than half of total active BGC-Argo (399) (April 2020). It has been proposed to deploy more BGC-Argo floats globally and keep the total of 1000 profiling floats installed with BGC sensors, including that of pH, in operation to complement largely the existing observing networks collecting data of biogeochemistry. Data management of pH observations performed by BGC-Argo is yet to be established for Data Assembly Centres. Sensor pH measurements on other emerging autonomous vehicles such as ocean gliders and Saildrones that are capable of monitoring from the coastal zone to the open ocean are currently at the concept level and in progress.
Nitrous Oxide ECV Products covered by this sheet
Interior ocean N₂O
Air-sea N₂O flux
Adequacy of the Observational System Assessment
2
Data are available globally but their number is very limited. Uncertainty of measurement needs improvement by networking the observations.
Availability and Stewardship Assessment
3
Availability of data collected is good, but resources to process these data are insufficient.
Networks Ship-based Repeat Hydrography: GO-SHIP
Ship-based Fixed-point Observatories: no coordinated network
Ships of Opportunity: no coordinated network
Satellites None.
Models, Reanalysis etc.
MarinE MethanE and NiTrous Oxide (MEMENTO) database: https://memento.geomar.de
Discussion:
Measurements of N2O have been made globally in the ocean surface layer and in the interior of both the open ocean and in coastal zones. However, they are limited to small number of underway measurements on research vessels and on Voluntary Observing Ships, measurements at depths in a very small number of GO-SHIP sections, a small number of time-series stations, and some research campaign observations, showing severe under-sampling in many regions and in time. Extensive measurements of N2O over
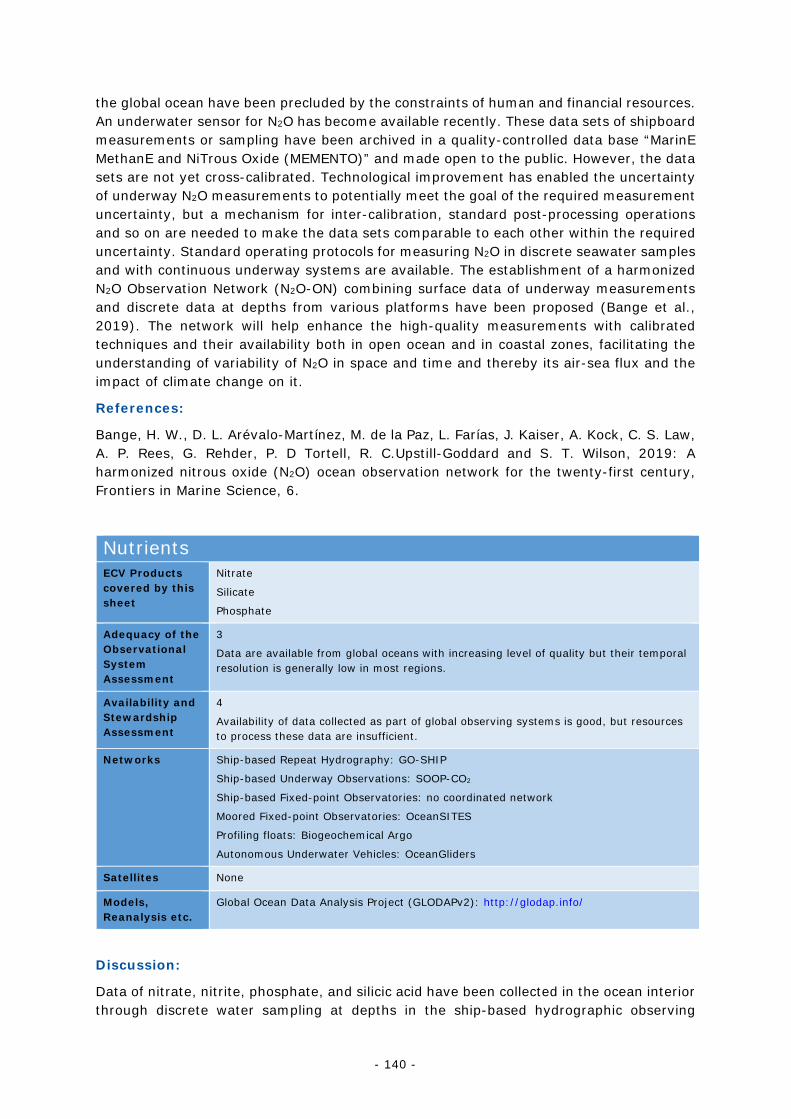
- 140 -
the global ocean have been precluded by the constraints of human and financial resources. An underwater sensor for N2O has become available recently. These data sets of shipboard measurements or sampling have been archived in a quality-controlled data base “MarinE MethanE and NiTrous Oxide (MEMENTO)” and made open to the public. However, the data sets are not yet cross-calibrated. Technological improvement has enabled the uncertainty of underway N2O measurements to potentially meet the goal of the required measurement uncertainty, but a mechanism for inter-calibration, standard post-processing operations and so on are needed to make the data sets comparable to each other within the required uncertainty. Standard operating protocols for measuring N2O in discrete seawater samples and with continuous underway systems are available. The establishment of a harmonized N2O Observation Network (N2O-ON) combining surface data of underway measurements and discrete data at depths from various platforms have been proposed (Bange et al., 2019). The network will help enhance the high-quality measurements with calibrated techniques and their availability both in open ocean and in coastal zones, facilitating the understanding of variability of N2O in space and time and thereby its air-sea flux and the impact of climate change on it.
References:
Bange, H. W., D. L. Arévalo-Martínez, M. de la Paz, L. Farías, J. Kaiser, A. Kock, C. S. Law, A. P. Rees, G. Rehder, P. D Tortell, R. C.Upstill-Goddard and S. T. Wilson, 2019: A harmonized nitrous oxide (N2O) ocean observation network for the twenty-first century, Frontiers in Marine Science, 6.
Nutrients ECV Products covered by this sheet
Nitrate
Silicate
Phosphate
Adequacy of the Observational System Assessment
3
Data are available from global oceans with increasing level of quality but their temporal resolution is generally low in most regions.
Availability and Stewardship Assessment
4
Availability of data collected as part of global observing systems is good, but resources to process these data are insufficient.
Networks Ship-based Repeat Hydrography: GO-SHIP
Ship-based Underway Observations: SOOP-CO2
Ship-based Fixed-point Observatories: no coordinated network
Moored Fixed-point Observatories: OceanSITES
Profiling floats: Biogeochemical Argo
Autonomous Underwater Vehicles: OceanGliders
Satellites None
Models, Reanalysis etc.
Global Ocean Data Analysis Project (GLODAPv2): http://glodap.info/
Discussion:
Data of nitrate, nitrite, phosphate, and silicic acid have been collected in the ocean interior through discrete water sampling at depths in the ship-based hydrographic observing
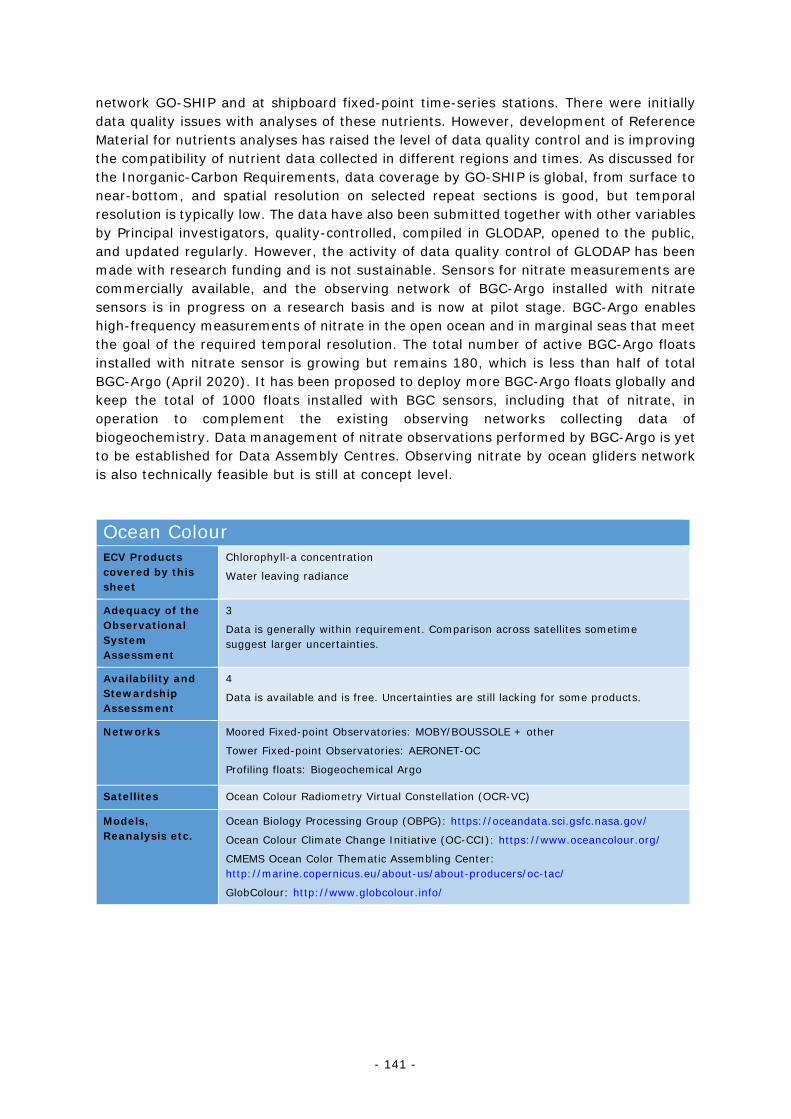
- 141 -
network GO-SHIP and at shipboard fixed-point time-series stations. There were initially data quality issues with analyses of these nutrients. However, development of Reference Material for nutrients analyses has raised the level of data quality control and is improving the compatibility of nutrient data collected in different regions and times. As discussed for the Inorganic-Carbon Requirements, data coverage by GO-SHIP is global, from surface to near-bottom, and spatial resolution on selected repeat sections is good, but temporal resolution is typically low. The data have also been submitted together with other variables by Principal investigators, quality-controlled, compiled in GLODAP, opened to the public, and updated regularly. However, the activity of data quality control of GLODAP has been made with research funding and is not sustainable. Sensors for nitrate measurements are commercially available, and the observing network of BGC-Argo installed with nitrate sensors is in progress on a research basis and is now at pilot stage. BGC-Argo enables high-frequency measurements of nitrate in the open ocean and in marginal seas that meet the goal of the required temporal resolution. The total number of active BGC-Argo floats installed with nitrate sensor is growing but remains 180, which is less than half of total BGC-Argo (April 2020). It has been proposed to deploy more BGC-Argo floats globally and keep the total of 1000 floats installed with BGC sensors, including that of nitrate, in operation to complement the existing observing networks collecting data of biogeochemistry. Data management of nitrate observations performed by BGC-Argo is yet to be established for Data Assembly Centres. Observing nitrate by ocean gliders network is also technically feasible but is still at concept level.
Ocean Colour ECV Products covered by this sheet
Chlorophyll-a concentration
Water leaving radiance
Adequacy of the Observational System Assessment
3
Data is generally within requirement. Comparison across satellites sometime suggest larger uncertainties.
Availability and Stewardship Assessment
4
Data is available and is free. Uncertainties are still lacking for some products.
Networks Moored Fixed-point Observatories: MOBY/BOUSSOLE + other
Tower Fixed-point Observatories: AERONET-OC
Profiling floats: Biogeochemical Argo
Satellites Ocean Colour Radiometry Virtual Constellation (OCR-VC)
Models, Reanalysis etc.
Ocean Biology Processing Group (OBPG): https://oceandata.sci.gsfc.nasa.gov/
Ocean Colour Climate Change Initiative (OC-CCI): https://www.oceancolour.org/
CMEMS Ocean Color Thematic Assembling Center: http://marine.copernicus.eu/about-us/about-producers/oc-tac/
GlobColour: http://www.globcolour.info/
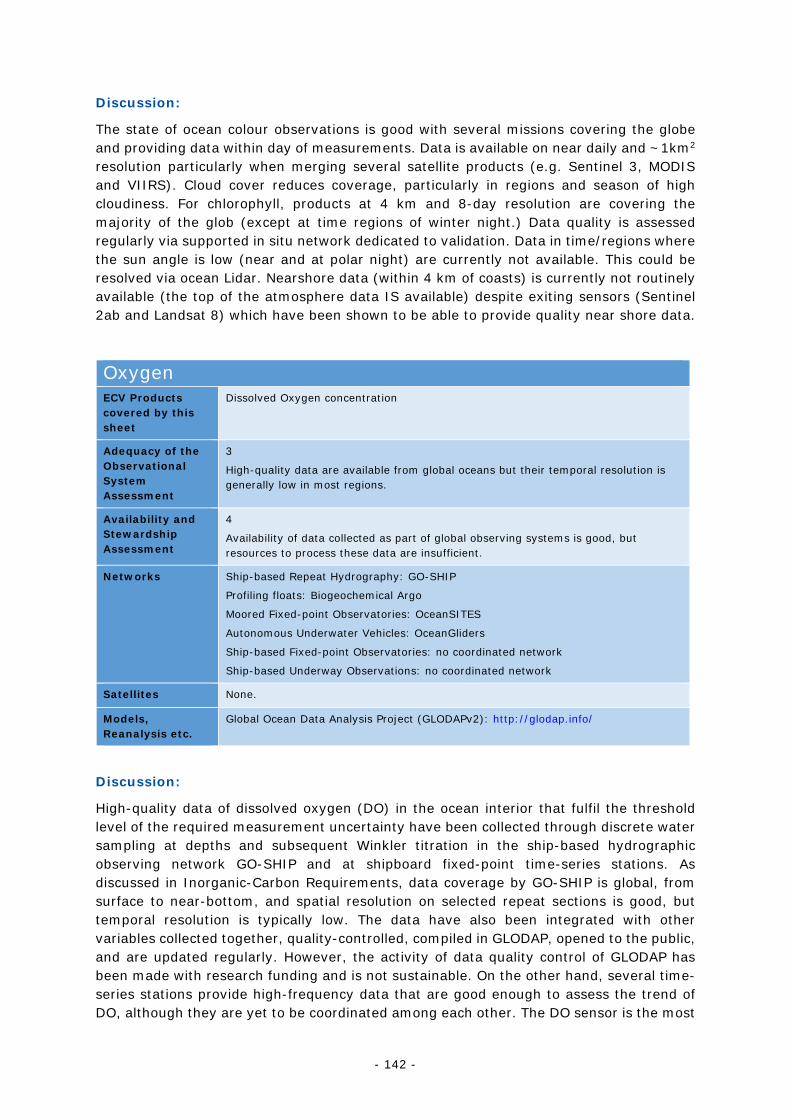
- 142 -
Discussion:
The state of ocean colour observations is good with several missions covering the globe and providing data within day of measurements. Data is available on near daily and ~1km2 resolution particularly when merging several satellite products (e.g. Sentinel 3, MODIS and VIIRS). Cloud cover reduces coverage, particularly in regions and season of high cloudiness. For chlorophyll, products at 4 km and 8-day resolution are covering the majority of the glob (except at time regions of winter night.) Data quality is assessed regularly via supported in situ network dedicated to validation. Data in time/regions where the sun angle is low (near and at polar night) are currently not available. This could be resolved via ocean Lidar. Nearshore data (within 4 km of coasts) is currently not routinely available (the top of the atmosphere data IS available) despite exiting sensors (Sentinel 2ab and Landsat 8) which have been shown to be able to provide quality near shore data.
Oxygen ECV Products covered by this sheet
Dissolved Oxygen concentration
Adequacy of the Observational System Assessment
3
High-quality data are available from global oceans but their temporal resolution is generally low in most regions.
Availability and Stewardship Assessment
4
Availability of data collected as part of global observing systems is good, but resources to process these data are insufficient.
Networks Ship-based Repeat Hydrography: GO-SHIP
Profiling floats: Biogeochemical Argo
Moored Fixed-point Observatories: OceanSITES
Autonomous Underwater Vehicles: OceanGliders
Ship-based Fixed-point Observatories: no coordinated network
Ship-based Underway Observations: no coordinated network
Satellites None.
Models, Reanalysis etc.
Global Ocean Data Analysis Project (GLODAPv2): http://glodap.info/
Discussion:
High-quality data of dissolved oxygen (DO) in the ocean interior that fulfil the threshold level of the required measurement uncertainty have been collected through discrete water sampling at depths and subsequent Winkler titration in the ship-based hydrographic observing network GO-SHIP and at shipboard fixed-point time-series stations. As discussed in Inorganic-Carbon Requirements, data coverage by GO-SHIP is global, from surface to near-bottom, and spatial resolution on selected repeat sections is good, but temporal resolution is typically low. The data have also been integrated with other variables collected together, quality-controlled, compiled in GLODAP, opened to the public, and are updated regularly. However, the activity of data quality control of GLODAP has been made with research funding and is not sustainable. On the other hand, several time-series stations provide high-frequency data that are good enough to assess the trend of DO, although they are yet to be coordinated among each other. The DO sensor is the most
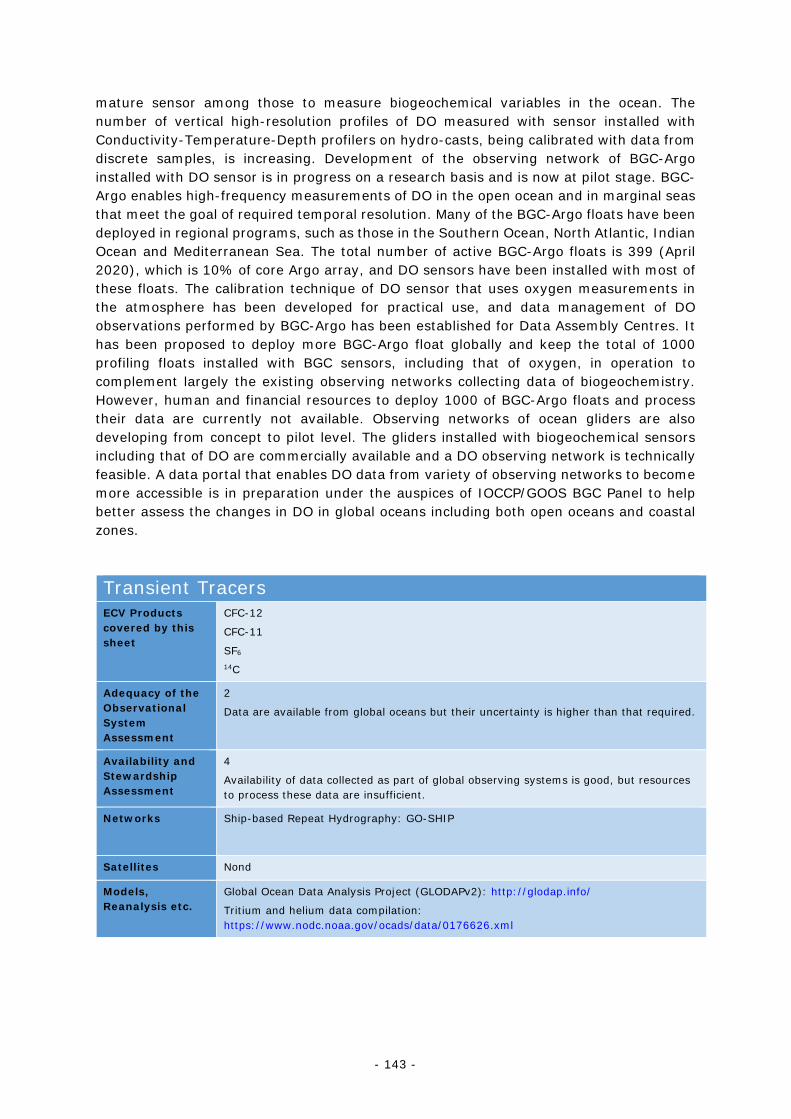
- 143 -
mature sensor among those to measure biogeochemical variables in the ocean. The number of vertical high-resolution profiles of DO measured with sensor installed with Conductivity-Temperature-Depth profilers on hydro-casts, being calibrated with data from discrete samples, is increasing. Development of the observing network of BGC-Argo installed with DO sensor is in progress on a research basis and is now at pilot stage. BGC-Argo enables high-frequency measurements of DO in the open ocean and in marginal seas that meet the goal of required temporal resolution. Many of the BGC-Argo floats have been deployed in regional programs, such as those in the Southern Ocean, North Atlantic, Indian Ocean and Mediterranean Sea. The total number of active BGC-Argo floats is 399 (April 2020), which is 10% of core Argo array, and DO sensors have been installed with most of these floats. The calibration technique of DO sensor that uses oxygen measurements in the atmosphere has been developed for practical use, and data management of DO observations performed by BGC-Argo has been established for Data Assembly Centres. It has been proposed to deploy more BGC-Argo float globally and keep the total of 1000 profiling floats installed with BGC sensors, including that of oxygen, in operation to complement largely the existing observing networks collecting data of biogeochemistry. However, human and financial resources to deploy 1000 of BGC-Argo floats and process their data are currently not available. Observing networks of ocean gliders are also developing from concept to pilot level. The gliders installed with biogeochemical sensors including that of DO are commercially available and a DO observing network is technically feasible. A data portal that enables DO data from variety of observing networks to become more accessible is in preparation under the auspices of IOCCP/GOOS BGC Panel to help better assess the changes in DO in global oceans including both open oceans and coastal zones.
Transient Tracers ECV Products covered by this sheet
CFC-12
CFC-11
SF6 14C
Adequacy of the Observational System Assessment
2
Data are available from global oceans but their uncertainty is higher than that required.
Availability and Stewardship Assessment
4
Availability of data collected as part of global observing systems is good, but resources to process these data are insufficient.
Networks Ship-based Repeat Hydrography: GO-SHIP
Satellites Nond
Models, Reanalysis etc.
Global Ocean Data Analysis Project (GLODAPv2): http://glodap.info/
Tritium and helium data compilation: https://www.nodc.noaa.gov/ocads/data/0176626.xml
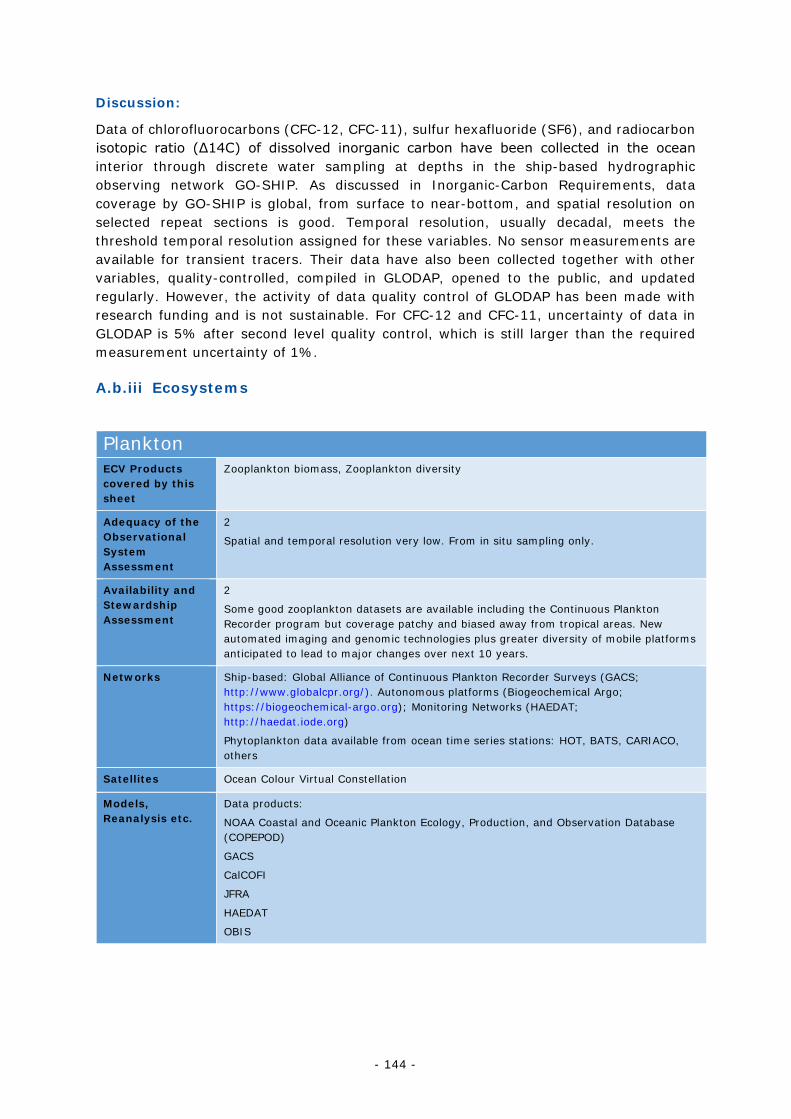
- 144 -
Discussion:
Data of chlorofluorocarbons (CFC-12, CFC-11), sulfur hexafluoride (SF6), and radiocarbon isotopic ratio (Δ14C) of dissolved inorganic carbon have been collected in the ocean interior through discrete water sampling at depths in the ship-based hydrographic observing network GO-SHIP. As discussed in Inorganic-Carbon Requirements, data coverage by GO-SHIP is global, from surface to near-bottom, and spatial resolution on selected repeat sections is good. Temporal resolution, usually decadal, meets the threshold temporal resolution assigned for these variables. No sensor measurements are available for transient tracers. Their data have also been collected together with other variables, quality-controlled, compiled in GLODAP, opened to the public, and updated regularly. However, the activity of data quality control of GLODAP has been made with research funding and is not sustainable. For CFC-12 and CFC-11, uncertainty of data in GLODAP is 5% after second level quality control, which is still larger than the required measurement uncertainty of 1%.
A.b.iii Ecosystems
Plankton ECV Products covered by this sheet
Zooplankton biomass, Zooplankton diversity
Adequacy of the Observational System Assessment
2
Spatial and temporal resolution very low. From in situ sampling only.
Availability and Stewardship Assessment
2
Some good zooplankton datasets are available including the Continuous Plankton Recorder program but coverage patchy and biased away from tropical areas. New automated imaging and genomic technologies plus greater diversity of mobile platforms anticipated to lead to major changes over next 10 years.
Networks Ship-based: Global Alliance of Continuous Plankton Recorder Surveys (GACS; http://www.globalcpr.org/). Autonomous platforms (Biogeochemical Argo; https://biogeochemical-argo.org); Monitoring Networks (HAEDAT; http://haedat.iode.org)
Phytoplankton data available from ocean time series stations: HOT, BATS, CARIACO, others
Satellites Ocean Colour Virtual Constellation
Models, Reanalysis etc.
Data products:
NOAA Coastal and Oceanic Plankton Ecology, Production, and Observation Database (COPEPOD)
GACS
CalCOFI
JFRA
HAEDAT
OBIS
- 145 -
Discussion:
Plankton is a broad category that includes both plant-like photosynthetic organisms and all animal or animal-like organisms whose dispersal in the ocean is dominated by physical processes such as ocean currents. The zooplankton includes protozoans and metazoans. Many of the ecosystem services supporting human activities in coastal ocean waters depend on photosynthetic microorganisms representing the lowest trophic levels in the ocean, fixing carbon and producing oxygen. High-biomass and/or toxic proliferations of some specific cells (or “Harmful Algal Blooms” or HABs), are known to cause harm to aquatic ecosystems, including plants and animals, and to humans via direct exposure to water-borne toxins or by toxic seafood consumption. Zooplankton are the food for many mammals, birds, fish, corals and other invertebrates including zooplankton. They are consumers of the phytoplankton and can also be carnivorous. They are an intermediary between primary productivity and higher trophic levels. They also play a key role in defining the chemistry of the ocean by recycling nutrients and carbon in near-surface waters of the ocean and by delivering these materials to deeper ocean waters through defecation and through daily and ontogenetic migration. Phytoplankton and zooplankton biomass are important and commonly used variables to evaluate trophic state, fisheries potential, and ecosystem health. Today, it is still impractical to monitor the number and diversity of organisms in mid- to upper trophic levels of the food web. Yet, the abundance of many fish species, sea birds, and marine mammals on continental shelves is critically tied to fluctuations in the abundance of smaller planktonic organisms driven by climate-scale changes. The plankton can be extremely diverse. Phytoplankton diversity is often based on functional groupings and traits (e.g. nitrogen fixing, toxic, prokaryotic vs. eukaryotic), but species diversity becomes critical when for example identifying HABs. Plankton diversity refers to the number of species, taxonomic composition, or community structure within a region. Zooplankton diversity influences ecosystem health and productivity through trophic links. In turn, zooplankton diversity is sensitive to environmental pressures such as climate change, including ocean acidification, warming and deoxygenation. The abundance and functional types of zooplankton, even their presence or absence, are accepted indicators of marine ecosystem responses to climate change. Ichthyoplankton surveys, focussing on larval fish species, can also be informative for zooplankton diversity. Phytoplankton biomass is inferred from the presence of chlorophyll-a, allowing for global synoptic assessments using ocean colour as well as routine deployment of fluorometers in situ. Zooplankton biomass is most commonly measured as wet weight, dry weight, and also as carbon content, nitrogen content, protein and lipid content. Recent approaches also include acoustic and optical detection of zooplankton biomass. Observation and measurement of phytoplankton and zooplankton abundance and diversity are obtained through various methods, which traditionally have involved the use of vertically or horizontally towed nets (with mesh sizes ranging from less than 100 μm up to 500 μm) but more recently include instruments such as imaging flow cytobots and video plankton recorders which collect an image of the organisms in situ. In terms of consistent and most extensive sampling effort, the best example to date is that of the Continuous Plankton Recorder (CPR) which collects observations along the track of ships of opportunity in some areas of the world. CPR surveys are brought together through the Global Alliance of CPR Survey (GACS). Net tow sampling is conducted in extensive and long-standing projects by various regional fisheries and oceanography surveys (e.g. the California Cooperative Oceanic Fisheries Investigations, CalCOFI). Some collections are conducted as part of research and fisheries programs, some of which are part of regional Ocean Observing Systems (OOS). There are also numerous national plankton monitoring
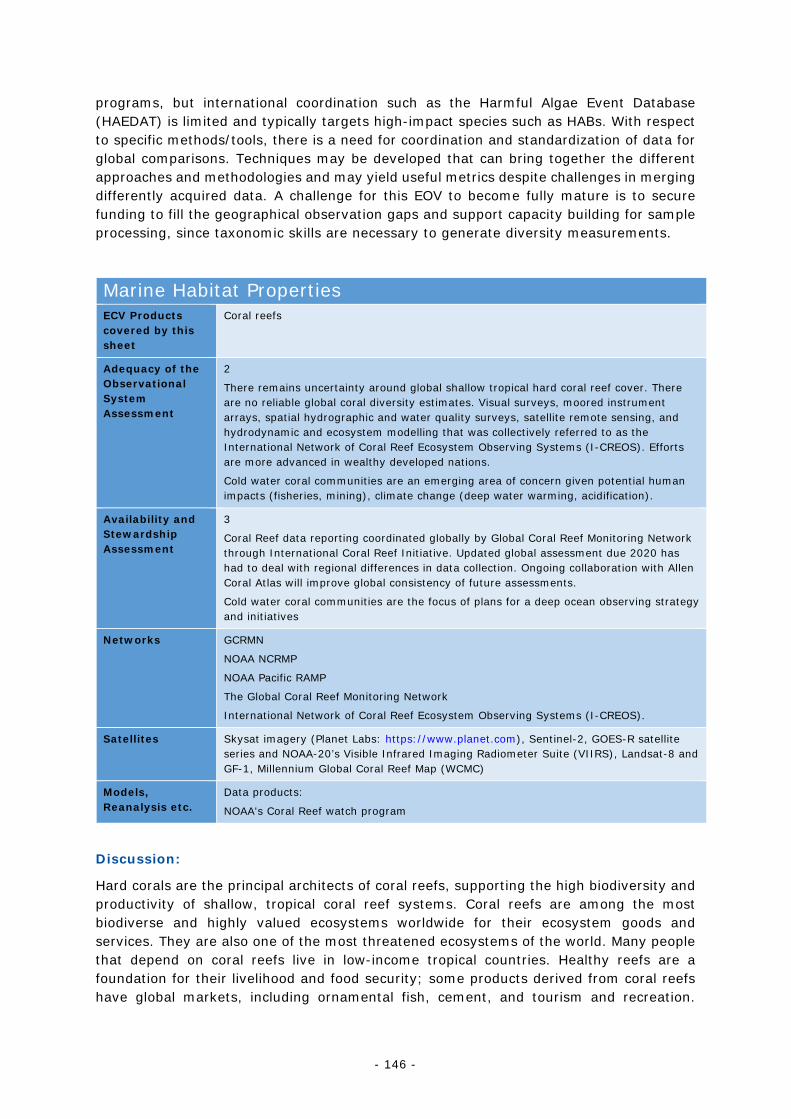
- 146 -
programs, but international coordination such as the Harmful Algae Event Database (HAEDAT) is limited and typically targets high-impact species such as HABs. With respect to specific methods/tools, there is a need for coordination and standardization of data for global comparisons. Techniques may be developed that can bring together the different approaches and methodologies and may yield useful metrics despite challenges in merging differently acquired data. A challenge for this EOV to become fully mature is to secure funding to fill the geographical observation gaps and support capacity building for sample processing, since taxonomic skills are necessary to generate diversity measurements.
Marine Habitat Properties ECV Products covered by this sheet
Coral reefs
Adequacy of the Observational System Assessment
2
There remains uncertainty around global shallow tropical hard coral reef cover. There are no reliable global coral diversity estimates. Visual surveys, moored instrument arrays, spatial hydrographic and water quality surveys, satellite remote sensing, and hydrodynamic and ecosystem modelling that was collectively referred to as the International Network of Coral Reef Ecosystem Observing Systems (I-CREOS). Efforts are more advanced in wealthy developed nations.
Cold water coral communities are an emerging area of concern given potential human impacts (fisheries, mining), climate change (deep water warming, acidification).
Availability and Stewardship Assessment
3
Coral Reef data reporting coordinated globally by Global Coral Reef Monitoring Network through International Coral Reef Initiative. Updated global assessment due 2020 has had to deal with regional differences in data collection. Ongoing collaboration with Allen Coral Atlas will improve global consistency of future assessments.
Cold water coral communities are the focus of plans for a deep ocean observing strategy and initiatives
Networks GCRMN
NOAA NCRMP
NOAA Pacific RAMP
The Global Coral Reef Monitoring Network
International Network of Coral Reef Ecosystem Observing Systems (I-CREOS).
Satellites Skysat imagery (Planet Labs: https://www.planet.com), Sentinel-2, GOES-R satellite series and NOAA-20’s Visible Infrared Imaging Radiometer Suite (VIIRS), Landsat-8 and GF-1, Millennium Global Coral Reef Map (WCMC)
Models, Reanalysis etc.
Data products:
NOAA's Coral Reef watch program
Discussion:
Hard corals are the principal architects of coral reefs, supporting the high biodiversity and productivity of shallow, tropical coral reef systems. Coral reefs are among the most biodiverse and highly valued ecosystems worldwide for their ecosystem goods and services. They are also one of the most threatened ecosystems of the world. Many people that depend on coral reefs live in low-income tropical countries. Healthy reefs are a foundation for their livelihood and food security; some products derived from coral reefs have global markets, including ornamental fish, cement, and tourism and recreation.
- 147 -
Climate change, ocean acidification, fisheries, pollution, and coastal development are all significant threats to coral reefs. Hard corals are particularly vulnerable because they are slow-growing and susceptible to stress, particularly when there are synergies between natural and anthropogenic stresses. The health and areal extent of the hard coral community within a reef are direct indicators of the ability of a system to sustain the diversity of associated species, productivity, and valuable ecosystem services. Multiple measures give fundamental information on the health of a coral reef: live hard coral cover and the areal extent of a reef are the most important indicators of whether a reef is in a coral-dominated state or not; the composition and diversity of coral taxa is an important index of reef health; coral condition (e.g. bleaching, disease) gives fundamental information on the health of a reef; the size class structure (and recruitment) of hard corals gives fundamental information on the resilience, disturbance history and recovery potential of a reef. ‘Hard’ and ‘soft’ corals are key taxonomic groups dominating hard and some soft substrates in subtidal habitats from the shallows to the deep ocean, and from the equator to polar regions. This wide range of habitats can be grouped into three principal assemblages: tropical hard coral communities (coral reefs), soft coral-dominated habitats, and deep- or cold-water coral communities. This specification sheet is focused on the former – tropical hard coral communities – to meet the immediate need there. Parallel specification sheets have been developed for other hard- and soft-coral dominated habitats.
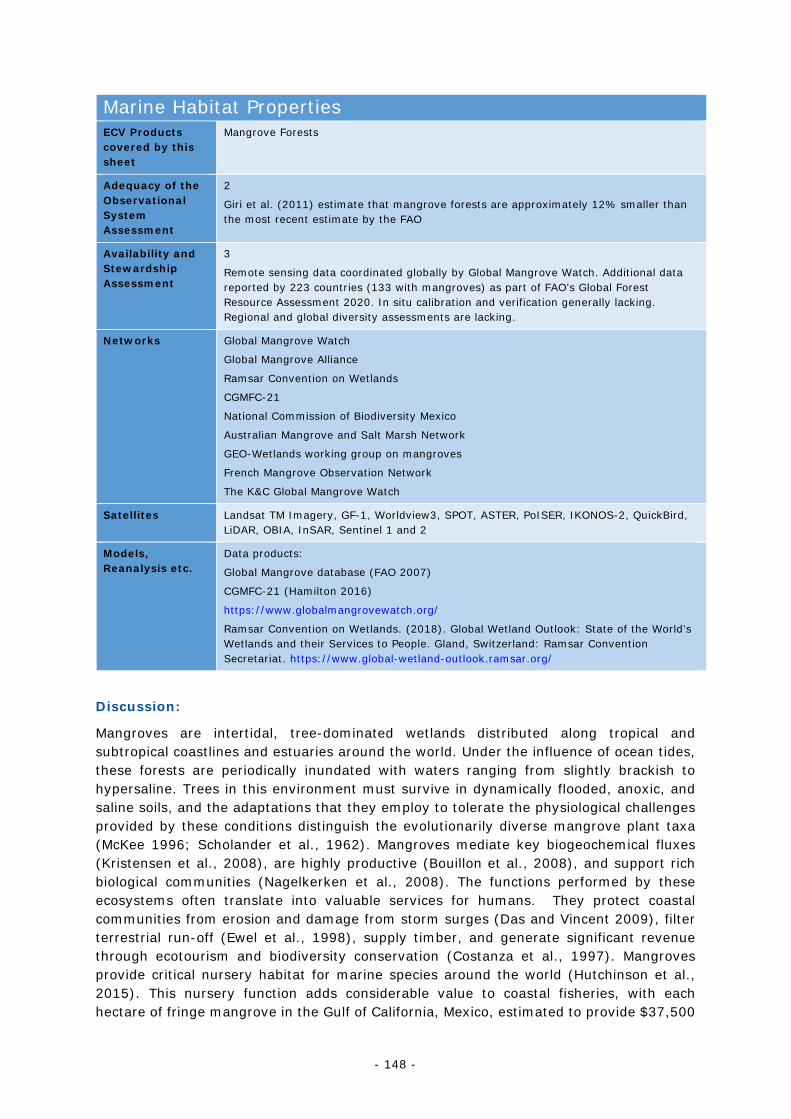
- 148 -
Marine Habitat Properties ECV Products covered by this sheet
Mangrove Forests
Adequacy of the Observational System Assessment
2
Giri et al. (2011) estimate that mangrove forests are approximately 12% smaller than the most recent estimate by the FAO
Availability and Stewardship Assessment
3
Remote sensing data coordinated globally by Global Mangrove Watch. Additional data reported by 223 countries (133 with mangroves) as part of FAO’s Global Forest Resource Assessment 2020. In situ calibration and verification generally lacking. Regional and global diversity assessments are lacking.
Networks Global Mangrove Watch
Global Mangrove Alliance
Ramsar Convention on Wetlands
CGMFC-21
National Commission of Biodiversity Mexico
Australian Mangrove and Salt Marsh Network
GEO-Wetlands working group on mangroves
French Mangrove Observation Network
The K&C Global Mangrove Watch
Satellites Landsat TM Imagery, GF-1, Worldview3, SPOT, ASTER, PoISER, IKONOS-2, QuickBird, LiDAR, OBIA, InSAR, Sentinel 1 and 2
Models, Reanalysis etc.
Data products:
Global Mangrove database (FAO 2007)
CGMFC-21 (Hamilton 2016)
https://www.globalmangrovewatch.org/
Ramsar Convention on Wetlands. (2018). Global Wetland Outlook: State of the World’s Wetlands and their Services to People. Gland, Switzerland: Ramsar Convention Secretariat. https://www.global-wetland-outlook.ramsar.org/
Discussion:
Mangroves are intertidal, tree-dominated wetlands distributed along tropical and subtropical coastlines and estuaries around the world. Under the influence of ocean tides, these forests are periodically inundated with waters ranging from slightly brackish to hypersaline. Trees in this environment must survive in dynamically flooded, anoxic, and saline soils, and the adaptations that they employ to tolerate the physiological challenges provided by these conditions distinguish the evolutionarily diverse mangrove plant taxa (McKee 1996; Scholander et al., 1962). Mangroves mediate key biogeochemical fluxes (Kristensen et al., 2008), are highly productive (Bouillon et al., 2008), and support rich biological communities (Nagelkerken et al., 2008). The functions performed by these ecosystems often translate into valuable services for humans. They protect coastal communities from erosion and damage from storm surges (Das and Vincent 2009), filter terrestrial run-off (Ewel et al., 1998), supply timber, and generate significant revenue through ecotourism and biodiversity conservation (Costanza et al., 1997). Mangroves provide critical nursery habitat for marine species around the world (Hutchinson et al., 2015). This nursery function adds considerable value to coastal fisheries, with each hectare of fringe mangrove in the Gulf of California, Mexico, estimated to provide $37,500
- 149 -
(U.S.) per year in fisheries production (Aburto-Oropeza et al., 2008). Globally, mangroves sequester and store more carbon than almost any other type of ecosystem (Donato et al., 2011). Estimates of the total amount of carbon stored by mangroves range from 3 Pg C (Hutchinson et al., 2014) to 20 Pg C (Donato et al., 2011 estimate of 1,000 tons C/ha). Despite growing appreciation for the economic value of mangroves, these forests are severely threatened, with about 1% destroyed each year globally (Duarte et al., 2013). Unsustainable coastal forestry, agriculture, aquaculture, and urbanization and infrastructure development, along with increasing sea level, have already resulted in the cumulative loss of more than 35% of global mangrove cover (Valiela et al., 2001). In addition to these rapid anthropogenic declines, mangrove forests are naturally dynamic, made up of species adapted to aggressive colonization of open intertidal habitat and capable of shifting their distributions with changes in coastal geomorphology (Thom, 1967). Taking into account their ecological and social value, dynamic distributions, and severe recent losses to human impacts, mangroves require urgent management, including restoration, and monitoring. Several studies have estimated mangrove area (Giri et al., 2011, Hamilton & Casey 2015) and biomass (Hutchinson et al., 2014), but the dynamic distribution of this biome requires a globally integrated and consistent approach based on high temporal and spatial resolution data. Global mangrove area was estimated in the year 2000 to cover 137,760 km2 in 118 countries, with more than 50% of this area in six countries (Indonesia, Australia, Brazil, Mexico, Nigeria, and Malaysia) (data from the year 2000; Giri et al., 2011). In a more recent analysis, global forest area was recently estimated in the year 2012 as 81,684 km2 in areas delineated as mangrove forest and 167,387 km2 within wider mangrove biome with only 20 countries containing greater than 80% of the global mangrove holdings. (Hamilton & Casey 2016). While researchers in the countries with large areas of mangroves are contributing valuable information, the value of this information could be extended with support from international initiatives.
References:
Aburto-Oropeza, O., E. Ezcurra, G. Danemann, C. Valdez, J. Murray and E. Sala, 2008: Mangroves in the Gulf of California increase fishery yields. Proceedings of the National Academy of Sciences 105: 10,456–10,459.
Bouillon S., A. V. Borges, A. Castañeda-Moya, K. Diele, T. Dittmar, N.C. Duke, E. Kristensen, S. Y. Lee, C. Marchand, J. J. Middelburg, et al., 2008: Mangrove production and carbon sinks: a revision of global budget estimates. Global Biogeochemical Cycles 22: GB2013. doi: 10.1016/j.molimm.2014.11.005.
Costanza, R., R. d’Arge, R. de Groot, S. Farber, M. Grasso, B. Hannon, K. Limburg, S. Naeem, R. V. O’Neill, J. Paruelo, R. G. Raskin, P. Sutton, and M. van den Belt, 1997: The value of the world’s ecosystem services and natural capital. Nature 387: 253–260.
Das, S., and J. R. Vincent, 2009: Mangroves protected villages and reduced death toll during Indian super cyclone. Proceedings of the National Academy of Sciences 106: 7,357–7,360.
Donato, D. C., J. B. Kauffman, D. Murdiyarso, S. Kurnianto, M. Stidham, and M. Manninen, 2011: Mangroves among the most carbon-rich forests in the tropics. Nature Geoscience 4: 293–297.
Duarte, C. M., I. J. Losada, I. E. Hendriks, I. Mazarrasa, and N. Marbà, 2013: The role of coastal plant communities for climate change mitigation and adaptation. Nature Climate Change 3: 961–968.
- 150 -
Ewel, K. C., R. R. Twilley, and J. E. Ong, 1998: Different kinds of mangrove forests provide different goods and services. Global Ecology and Biogeography Letters 7: 83–94.
Giri, C., E. Ochieng, L. L. Tieszen, Z. Zhu, A. Singh, T. Loveland, J. Masek, and N. Duke, 2011: Status and distribution of mangrove forests of the world using earth observation satellite data. Global Ecology and Biogeography 20: 154–159.
Hamilton S.E. and D. Casey D., 2016: Creation of a high spatio-temporal resolution global database of continuous mangrove forest cover for the twenty-first century (CGMFC-21). Global Ecology and Biogeography 25 (6):729-738. doi:10.1111/geb.12449
Hutchinson J., A. Manica, R. Swetnam, A. Balmford, and M. Spalding, 2014: Predicting global patterns in mangrove forest biomass. Conservation Letters 7(3): 233–240.
Hutchinson, J., D. P. Phillip, J. E. Claussen, O. Aburto-Oropeza, M. Carrasquilla-Henao, G. A. Castellanos-Galindo, M. T. Costa, P. D. Daneshgar, H. J. Hartman, F. Juanes, et al., 2015: Building an expert-judgment-based model of mangrove fisheries. American Fisheries Society Symposium 83: 17–42.
Kristensen, E., S. S. Bouillon, T. Dittmar, and C. Marchand, 2008: Organic carbon dynamics in mangrove ecosystems: a review. Aquatic Botany 89: 201–219.
McKee, K. L, 1996: Growth and physiological responses of neotropical mangrove seedlings to root zone hypoxia. Tree Physiology 16: 883–889.
Nagelkerken, I., S. J. M. Blaber, S. Bouillon, P. Green, M. Haywood, L. G. Kirton, J.-O. Meynecke, J. Pawlik, H. M. Penrose, A. Sasekumar, and P. J. Somerfield, 2008: The habitat function of mangroves for terrestrial and marine fauna: a review. Aquatic Biology 89: 155–185.
Scholander, P. F., H. T. Hammel, E. Hemmingsen, and W. Garey, 1962: Salt Balance in Mangroves. Plant Physiology 37(6): 722–729.
Thom, B. G., 1967: Mangrove ecology and deltaic geomorphology: Tabasco, Mexico. Journal of Ecology 55(2): 301–343.
Valiela, I., J. L. Bowen, and J. K. York, 2001: Mangrove forests: one of the world’s threatened major tropical environments. Bioscience 51(10): 807–815.
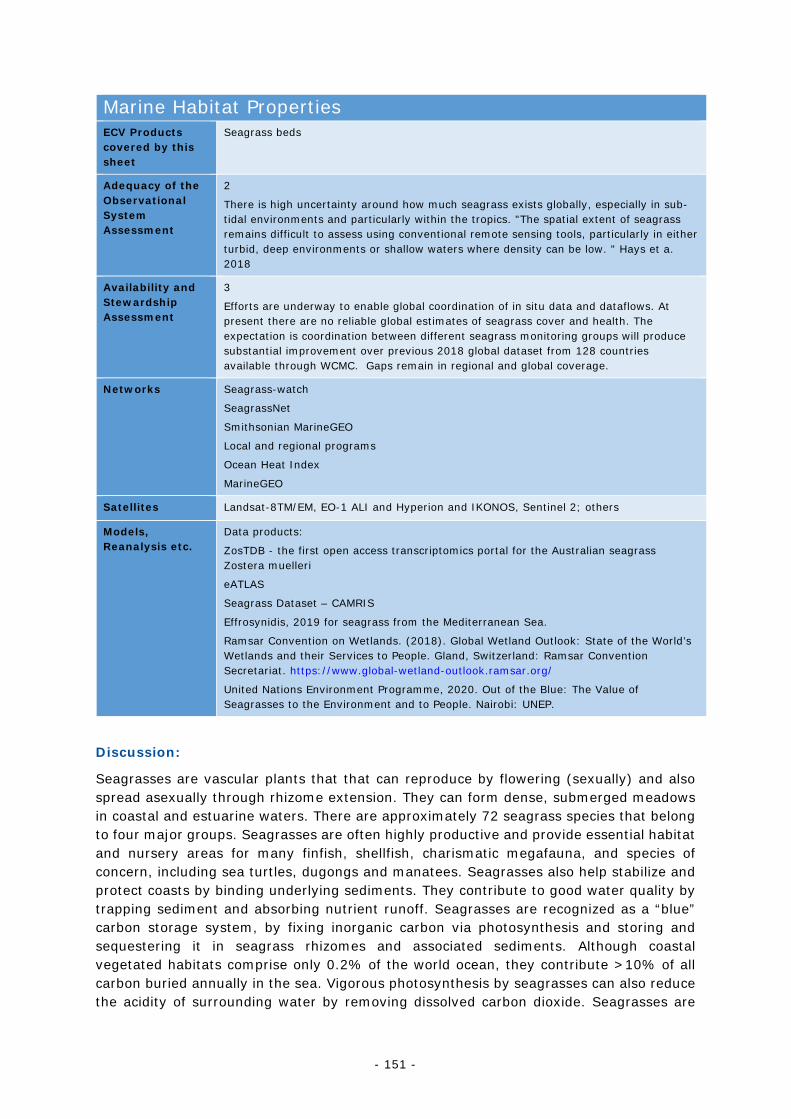
- 151 -
Marine Habitat Properties ECV Products covered by this sheet
Seagrass beds
Adequacy of the Observational System Assessment
2
There is high uncertainty around how much seagrass exists globally, especially in sub-tidal environments and particularly within the tropics. "The spatial extent of seagrass remains difficult to assess using conventional remote sensing tools, particularly in either turbid, deep environments or shallow waters where density can be low. " Hays et a. 2018
Availability and Stewardship Assessment
3
Efforts are underway to enable global coordination of in situ data and dataflows. At present there are no reliable global estimates of seagrass cover and health. The expectation is coordination between different seagrass monitoring groups will produce substantial improvement over previous 2018 global dataset from 128 countries available through WCMC. Gaps remain in regional and global coverage.
Networks Seagrass-watch
SeagrassNet
Smithsonian MarineGEO
Local and regional programs
Ocean Heat Index
MarineGEO
Satellites Landsat-8TM/EM, EO-1 ALI and Hyperion and IKONOS, Sentinel 2; others
Models, Reanalysis etc.
Data products:
ZosTDB - the first open access transcriptomics portal for the Australian seagrass Zostera muelleri
eATLAS
Seagrass Dataset – CAMRIS
Effrosynidis, 2019 for seagrass from the Mediterranean Sea.
Ramsar Convention on Wetlands. (2018). Global Wetland Outlook: State of the World’s Wetlands and their Services to People. Gland, Switzerland: Ramsar Convention Secretariat. https://www.global-wetland-outlook.ramsar.org/
United Nations Environment Programme, 2020. Out of the Blue: The Value of Seagrasses to the Environment and to People. Nairobi: UNEP.
Discussion:
Seagrasses are vascular plants that that can reproduce by flowering (sexually) and also spread asexually through rhizome extension. They can form dense, submerged meadows in coastal and estuarine waters. There are approximately 72 seagrass species that belong to four major groups. Seagrasses are often highly productive and provide essential habitat and nursery areas for many finfish, shellfish, charismatic megafauna, and species of concern, including sea turtles, dugongs and manatees. Seagrasses also help stabilize and protect coasts by binding underlying sediments. They contribute to good water quality by trapping sediment and absorbing nutrient runoff. Seagrasses are recognized as a “blue” carbon storage system, by fixing inorganic carbon via photosynthesis and storing and sequestering it in seagrass rhizomes and associated sediments. Although coastal vegetated habitats comprise only 0.2% of the world ocean, they contribute >10% of all carbon buried annually in the sea. Vigorous photosynthesis by seagrasses can also reduce the acidity of surrounding water by removing dissolved carbon dioxide. Seagrasses are
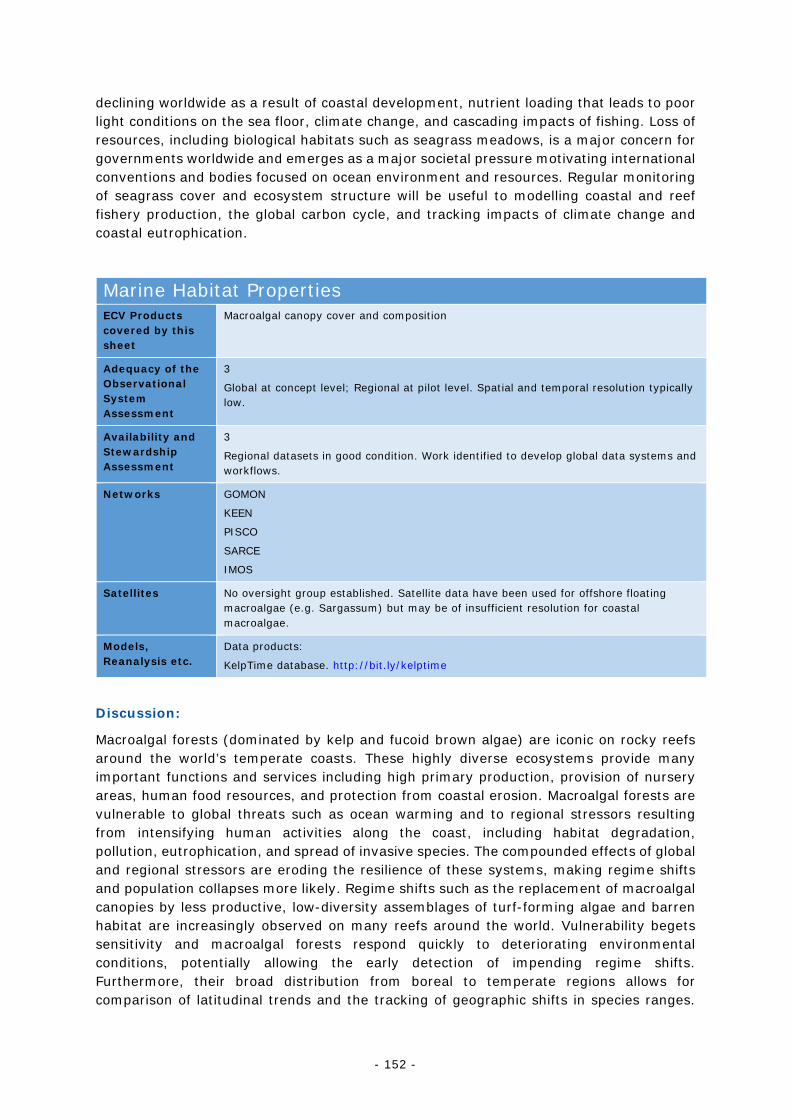
- 152 -
declining worldwide as a result of coastal development, nutrient loading that leads to poor light conditions on the sea floor, climate change, and cascading impacts of fishing. Loss of resources, including biological habitats such as seagrass meadows, is a major concern for governments worldwide and emerges as a major societal pressure motivating international conventions and bodies focused on ocean environment and resources. Regular monitoring of seagrass cover and ecosystem structure will be useful to modelling coastal and reef fishery production, the global carbon cycle, and tracking impacts of climate change and coastal eutrophication.
Marine Habitat Properties ECV Products covered by this sheet
Macroalgal canopy cover and composition
Adequacy of the Observational System Assessment
3
Global at concept level; Regional at pilot level. Spatial and temporal resolution typically low.
Availability and Stewardship Assessment
3
Regional datasets in good condition. Work identified to develop global data systems and workflows.
Networks GOMON
KEEN
PISCO
SARCE
IMOS
Satellites No oversight group established. Satellite data have been used for offshore floating macroalgae (e.g. Sargassum) but may be of insufficient resolution for coastal macroalgae.
Models, Reanalysis etc.
Data products:
KelpTime database. http://bit.ly/kelptime
Discussion:
Macroalgal forests (dominated by kelp and fucoid brown algae) are iconic on rocky reefs around the world’s temperate coasts. These highly diverse ecosystems provide many important functions and services including high primary production, provision of nursery areas, human food resources, and protection from coastal erosion. Macroalgal forests are vulnerable to global threats such as ocean warming and to regional stressors resulting from intensifying human activities along the coast, including habitat degradation, pollution, eutrophication, and spread of invasive species. The compounded effects of global and regional stressors are eroding the resilience of these systems, making regime shifts and population collapses more likely. Regime shifts such as the replacement of macroalgal canopies by less productive, low-diversity assemblages of turf-forming algae and barren habitat are increasingly observed on many reefs around the world. Vulnerability begets sensitivity and macroalgal forests respond quickly to deteriorating environmental conditions, potentially allowing the early detection of impending regime shifts. Furthermore, their broad distribution from boreal to temperate regions allows for comparison of latitudinal trends and the tracking of geographic shifts in species ranges.
- 153 -
Macroalgal forests provide a sensitive and well understood indicator of changing coastal marine environments, and are also models for understanding more complex interactions influencing marine communities, building on the detailed experimental knowledge and basic ecological understanding accumulated for these systems over decades.
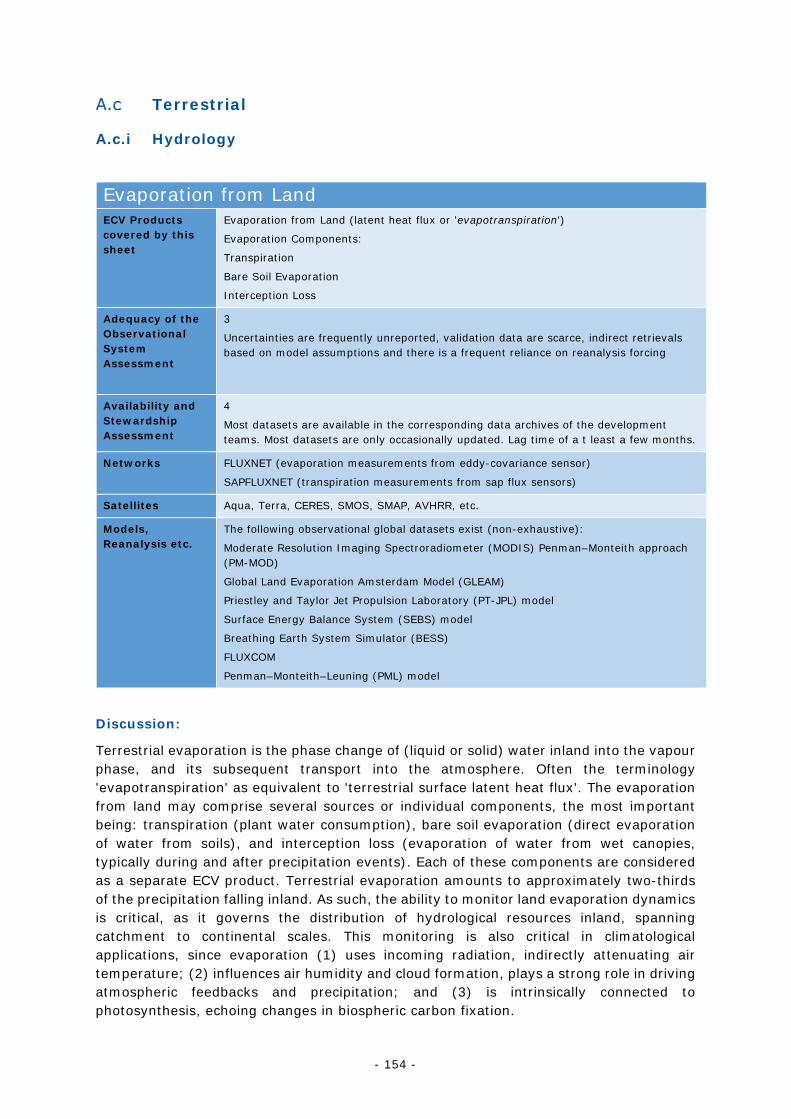
- 154 -
Terrestrial
A.c.i Hydrology
Evaporation from Land ECV Products covered by this sheet
Evaporation from Land (latent heat flux or 'evapotranspiration')
Evaporation Components:
Transpiration
Bare Soil Evaporation
Interception Loss
Adequacy of the Observational System Assessment
3
Uncertainties are frequently unreported, validation data are scarce, indirect retrievals based on model assumptions and there is a frequent reliance on reanalysis forcing
Availability and Stewardship Assessment
4
Most datasets are available in the corresponding data archives of the development teams. Most datasets are only occasionally updated. Lag time of a t least a few months.
Networks FLUXNET (evaporation measurements from eddy-covariance sensor)
SAPFLUXNET (transpiration measurements from sap flux sensors)
Satellites Aqua, Terra, CERES, SMOS, SMAP, AVHRR, etc.
Models, Reanalysis etc.
The following observational global datasets exist (non-exhaustive):
Moderate Resolution Imaging Spectroradiometer (MODIS) Penman–Monteith approach (PM-MOD)
Global Land Evaporation Amsterdam Model (GLEAM)
Priestley and Taylor Jet Propulsion Laboratory (PT-JPL) model
Surface Energy Balance System (SEBS) model
Breathing Earth System Simulator (BESS)
FLUXCOM
Penman–Monteith–Leuning (PML) model
Discussion:
Terrestrial evaporation is the phase change of (liquid or solid) water inland into the vapour phase, and its subsequent transport into the atmosphere. Often the terminology 'evapotranspiration' as equivalent to 'terrestrial surface latent heat flux'. The evaporation from land may comprise several sources or individual components, the most important being: transpiration (plant water consumption), bare soil evaporation (direct evaporation of water from soils), and interception loss (evaporation of water from wet canopies, typically during and after precipitation events). Each of these components are considered as a separate ECV product. Terrestrial evaporation amounts to approximately two-thirds of the precipitation falling inland. As such, the ability to monitor land evaporation dynamics is critical, as it governs the distribution of hydrological resources inland, spanning catchment to continental scales. This monitoring is also critical in climatological applications, since evaporation (1) uses incoming radiation, indirectly attenuating air temperature; (2) influences air humidity and cloud formation, plays a strong role in driving atmospheric feedbacks and precipitation; and (3) is intrinsically connected to photosynthesis, echoing changes in biospheric carbon fixation.
- 155 -
Terrestrial evaporation cannot be observed directly from space, yet a range of approaches have been proposed to indirectly derive this flux by applying models that combine the satellite-observed environmental and climatic drivers of the flux. Several international activities have advanced the study field in recent years, including the European Union Water and global Change (WATCH) project, the LandFlux initiative of the Global Energy and Water- cycle Exchanges (GEWEX) project, and the European Space Agency (ESA) Water Cycle Multi-Mission Observation Strategy (WACMOS)-ET project. Inter-comparison of the emerging observation-based global evaporation datasets brought to light large discrepancies among them (Miralles et al., 2016). To date, areas of particularly low accuracy still exist. In semiarid regimes and tropical forests, the divergence among existing datasets and low agreement against in situ measurements suggest higher uncertainties. For semiarid regions, this relates to difficulties to reflect the response of evaporation to drought stress. For tropical forests, large part of the uncertainty relates to the high error in interception loss estimates. Interception loss remains in relative terms the most uncertain component in terrestrial evaporation models. This also affects the quality of the evaporation data in temperate and boreal forests. Boreal regions are further affected by two large sources of uncertainties: (a) the poor representation of sublimation processes in current models, (b) the difficulties to mimic evaporation under conditions of severe radiation limitation. Moreover, long-term trends in the existing datasets need to be interpreted with caution, since the effects of CO2 fertilization on transpiration via stomatal conductance and biomass changes, or the regulation of stomatal conductance by atmospheric aridity, remain poorly represented in current evaporation retrieval models. Nonetheless, the separate estimation of any of the evaporation components remains challenging, and the uncertainty in the individual evaporation components (i.e. transpiration, bare soil evaporation, interception loss) remains higher than that of total evaporation (Talsma et al., 2018).
Therefore, progress in the field of global terrestrial evaporation monitoring remains indispensable to reduce uncertainties, and even just to adequately estimate and report these uncertainties. Nonetheless, one decade after the start of the first approaches to derive evaporation from satellite data at global scales, current methods appear relatively well developed, and the ongoing progress in satellite technology has the potential to improve these datasets (McCabe et al., 2019). Just recently, Fisher et al. (2017) provided clear guidelines to the scientific community in order to address some of grand challenges currently faced to improve global evaporation estimates. Among others, these challenges included the improvement in accuracy, and highlighted the need for higher spatiotemporal resolution, multi-scale coverage, and long-term monitoring. A roadmap for the future was recently proposed by McCabe et al. (2019), aiming to bring evaporation estimates one step closer to their observational nature, and one step away from the influence of model assumptions. Potential pathways include the use of new types of satellite observations, such as solar induced chlorophyll fluorescence, and novel platforms, such as CubeSats and unmanned aerial vehicles. These advances are expected to deliver new means to increase our ability to estimate terrestrial evaporation at global scales.
Terrestrial evaporation cannot be observed directly from space; this flux is estimated by applying models that combine the satellite-observed environmental and climatic drivers of evaporation. Most models are based on different modifications of traditional local-scale formulations, that are usually process-based or semi-empirical. A few apply satellite data within statistical approaches, sometimes in combination with ground meteorological measurements of evaporation. The majority of these formulations use reanalysis input data for variables that are difficult to retrieve from satellite sensors. Although many of
- 156 -
these models were originally intended for climatological-scale studies, some have evolved to provide estimates of evaporation in near operational mode, with ongoing efforts aiming to reduce product latency and improve spatial resolution. This opens up a range of possible applications, from regional drought monitoring to irrigation management. Some examples of evaporation datasets targeting near-real-time simulation at continental scales include the Land Surface Analysis Satellite Applications Facility (LSA-SAF) evaporation dataset, the Atmosphere–Land Exchange Inverse (ALEXI) and the Global Land Evaporation Amsterdam Model (GLEAM). The scarcity of in situ evaporation measurements at global scales, despite the efforts by the FLUXNET and SAPFLUXNET communities, remains bottleneck for the improvement of global satellite-based evaporation datasets, which rely on in situ measurements for validation or parameterisation of the underlying retrieval models.
References:
Fisher J. B., F. Melton, E. Middleton, C. Hain, M. Anderson, R. Allen, M. F. McCabe, S. Hook, D. Baldocchi, P. A. Townsend, A. Kilic, K. Tu, D. D. Miralles, J. Perret, J-P. Lagouarde, D. Waliser, A. J. Purdy, A. French, D. Schimel, J. S. Famiglietti, G. Stephens and E. F. Wood, 2019: The future of evapotranspiration: Global requirements for ecosystem functioning, carbon and climate feedbacks, agricultural management, and water resources, 2019, Water Resources Research Vol. 53, Issue 4, pp 2618-2626 https://doi.org/10.1002/2016WR020175
Miralles D. G., C. Jiménez, M. Jung, D. Michel, A. Ershadi, M. F. McCabe, M. Hirschi, B. Martens, A. J. Dolman, J. B. Fisher, Q. Mu, S. I. Seneviratne, E. F. Wood, and D. Fernández-Prieto, 2016: The WACMOS-ET project – Part 2: Evaluation of global terrestrial evaporation data sets, Hydrology and Earth System Sciences, 20, 823–842, 2016, https://doi.org/10.5194/hess-20-823-2016
McCabe, M.F.D.G. Miralles, T.R.H. Holmes and J.B. Fisher, 2019: Advances in the Remote Sensing of Terrestrial Evaporation. Remote Sensing, 11, 1138. https://doi.org/10.3390/rs11091138
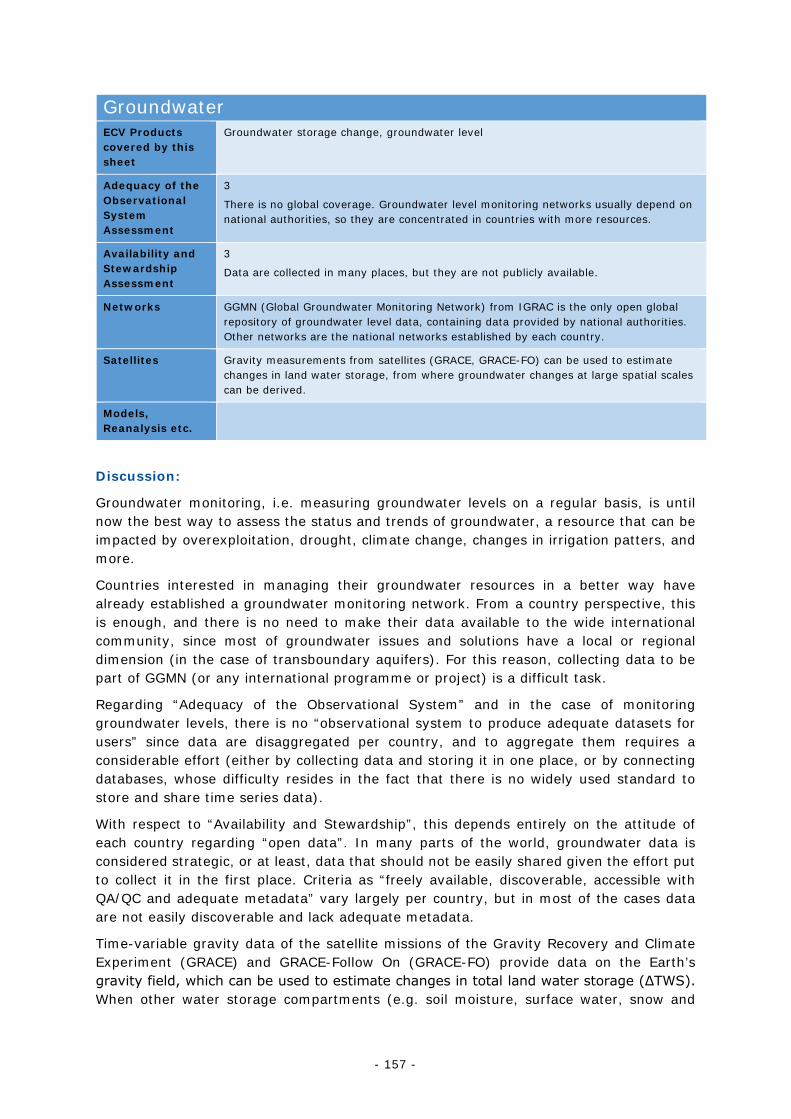
- 157 -
Groundwater ECV Products covered by this sheet
Groundwater storage change, groundwater level
Adequacy of the Observational System Assessment
3
There is no global coverage. Groundwater level monitoring networks usually depend on national authorities, so they are concentrated in countries with more resources.
Availability and Stewardship Assessment
3
Data are collected in many places, but they are not publicly available.
Networks GGMN (Global Groundwater Monitoring Network) from IGRAC is the only open global repository of groundwater level data, containing data provided by national authorities. Other networks are the national networks established by each country.
Satellites Gravity measurements from satellites (GRACE, GRACE-FO) can be used to estimate changes in land water storage, from where groundwater changes at large spatial scales can be derived.
Models, Reanalysis etc.
Discussion:
Groundwater monitoring, i.e. measuring groundwater levels on a regular basis, is until now the best way to assess the status and trends of groundwater, a resource that can be impacted by overexploitation, drought, climate change, changes in irrigation patters, and more.
Countries interested in managing their groundwater resources in a better way have already established a groundwater monitoring network. From a country perspective, this is enough, and there is no need to make their data available to the wide international community, since most of groundwater issues and solutions have a local or regional dimension (in the case of transboundary aquifers). For this reason, collecting data to be part of GGMN (or any international programme or project) is a difficult task.
Regarding “Adequacy of the Observational System” and in the case of monitoring groundwater levels, there is no “observational system to produce adequate datasets for users” since data are disaggregated per country, and to aggregate them requires a considerable effort (either by collecting data and storing it in one place, or by connecting databases, whose difficulty resides in the fact that there is no widely used standard to store and share time series data).
With respect to “Availability and Stewardship”, this depends entirely on the attitude of each country regarding “open data”. In many parts of the world, groundwater data is considered strategic, or at least, data that should not be easily shared given the effort put to collect it in the first place. Criteria as “freely available, discoverable, accessible with QA/QC and adequate metadata” vary largely per country, but in most of the cases data are not easily discoverable and lack adequate metadata.
Time-variable gravity data of the satellite missions of the Gravity Recovery and Climate Experiment (GRACE) and GRACE-Follow On (GRACE-FO) provide data on the Earth’s gravity field, which can be used to estimate changes in total land water storage (ΔTWS). When other water storage compartments (e.g. soil moisture, surface water, snow and
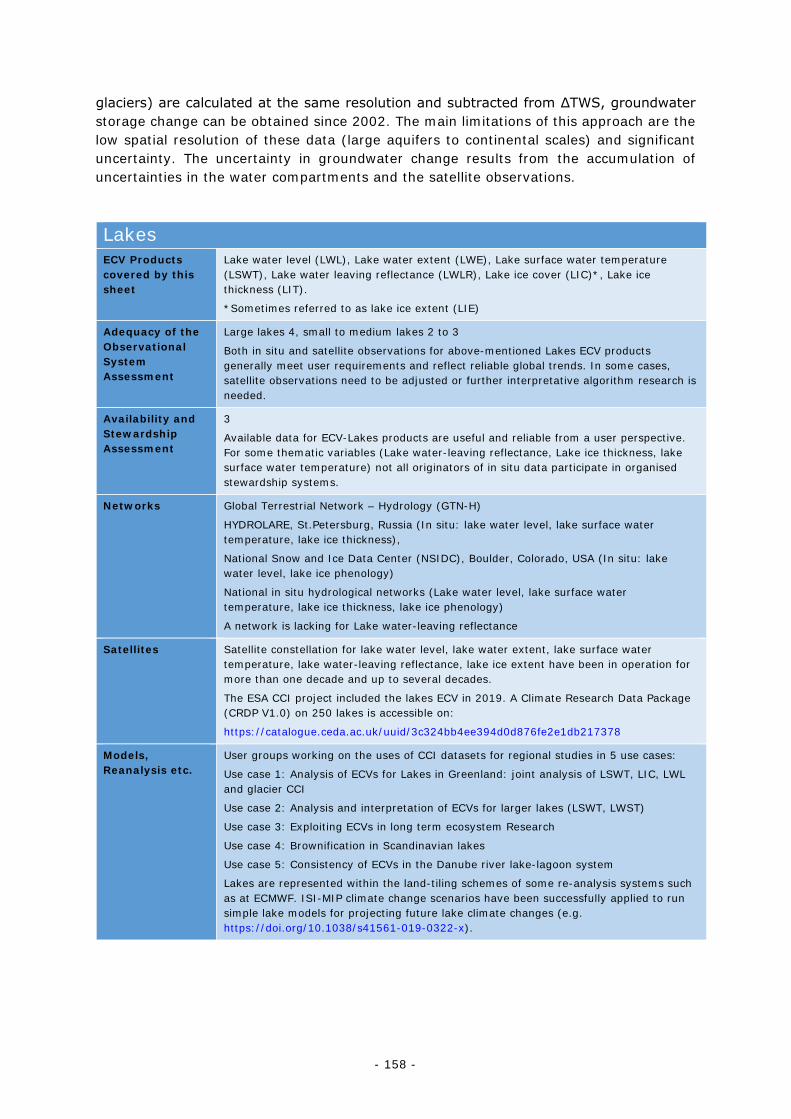
- 158 -
glaciers) are calculated at the same resolution and subtracted from ΔTWS, groundwater storage change can be obtained since 2002. The main limitations of this approach are the low spatial resolution of these data (large aquifers to continental scales) and significant uncertainty. The uncertainty in groundwater change results from the accumulation of uncertainties in the water compartments and the satellite observations.
Lakes ECV Products covered by this sheet
Lake water level (LWL), Lake water extent (LWE), Lake surface water temperature (LSWT), Lake water leaving reflectance (LWLR), Lake ice cover (LIC)*, Lake ice thickness (LIT).
*Sometimes referred to as lake ice extent (LIE)
Adequacy of the Observational System Assessment
Large lakes 4, small to medium lakes 2 to 3
Both in situ and satellite observations for above-mentioned Lakes ECV products generally meet user requirements and reflect reliable global trends. In some cases, satellite observations need to be adjusted or further interpretative algorithm research is needed.
Availability and Stewardship Assessment
3
Available data for ECV-Lakes products are useful and reliable from a user perspective. For some thematic variables (Lake water-leaving reflectance, Lake ice thickness, lake surface water temperature) not all originators of in situ data participate in organised stewardship systems.
Networks Global Terrestrial Network – Hydrology (GTN-H)
HYDROLARE, St.Petersburg, Russia (In situ: lake water level, lake surface water temperature, lake ice thickness),
National Snow and Ice Data Center (NSIDC), Boulder, Colorado, USA (In situ: lake water level, lake ice phenology)
National in situ hydrological networks (Lake water level, lake surface water temperature, lake ice thickness, lake ice phenology)
A network is lacking for Lake water-leaving reflectance
Satellites Satellite constellation for lake water level, lake water extent, lake surface water temperature, lake water-leaving reflectance, lake ice extent have been in operation for more than one decade and up to several decades.
The ESA CCI project included the lakes ECV in 2019. A Climate Research Data Package (CRDP V1.0) on 250 lakes is accessible on:
https://catalogue.ceda.ac.uk/uuid/3c324bb4ee394d0d876fe2e1db217378
Models, Reanalysis etc.
User groups working on the uses of CCI datasets for regional studies in 5 use cases:
Use case 1: Analysis of ECVs for Lakes in Greenland: joint analysis of LSWT, LIC, LWL and glacier CCI
Use case 2: Analysis and interpretation of ECVs for larger lakes (LSWT, LWST)
Use case 3: Exploiting ECVs in long term ecosystem Research
Use case 4: Brownification in Scandinavian lakes
Use case 5: Consistency of ECVs in the Danube river lake-lagoon system
Lakes are represented within the land-tiling schemes of some re-analysis systems such as at ECMWF. ISI-MIP climate change scenarios have been successfully applied to run simple lake models for projecting future lake climate changes (e.g. https://doi.org/10.1038/s41561-019-0322-x).
- 159 -
Discussion:
Terrestrial and satellite observations of the products that make up the ECV-Lakes are carried out on all continents and provide relevant data for a variety of data consumers (water, shipping, science and education, environmental protection, etc.). All thematic ECVs included in the Lakes ECV are sensitive to climate change.
In situ observations provide data (albeit scarce) on lake water level, lake surface water temperature, lake ice phenology (ice-on/ice-off dates and ice duration), lake water leaving reflectance. Satellite data provide information on lake water level, lake water extent, lake surface water temperature, lake water leaving reflectance, lake ice extent.
In situ observations of lake water level, lake surface water temperature and lake ice thickness are usually part of complex hydrological observations carried out by national hydrological networks. Most countries in their hydrological observations on lakes are guided by WMO regulations - Technical Regulations, volume III, Hydrology, 2006 edition, WMO-No.49 Guide to Hydrological Practices, sixth edition, 2008, WMO-No.168. In this regard, the data of in situ observations of the products considered within the Lakes ECV in international exchange have the necessary accuracy. The most complete regime information on the results of in situ observations of lake water level, lake surface water temperature, lake ice thickness is concentrated in the international HYDROLARE database. Nevertheless, some originators of data for LSWT do not openly share data or participate in organised stewardship systems: presently the Lake CCI project attempts to collect additional in situ data on an annual basis for annual climate assessment activities.
In situ observations of lake water leaving reflectance are not carried out within any context of stewardship and are relatively costly to obtain. Several properties of lake water quality that can also be derived from lake water-leaving reflectance are routinely monitored in national monitoring programmes (Chlorophyll-a, Turbidity, Dissolved Organic Matter). In the latter cases, protocols are embedded in ISO standards meeting adequate accuracy targets. For Reflectance, some networks include inland water platforms (AERONET-OC) but these do not meet all requirements for satellite validation, lacking essential wavebands and reference measurements. The foremost international database for collective lake optical measurements of research quality is LIMNADES hosted at the University of Stirling (UK). This initiative only covers data sharing and not quality control.
Satellite observations of the above-mentioned Lakes ECV products are carried out, as a rule, as part of integrated international projects carried out under the auspices of ESA, NASA and other agencies launching satellites for the scientific study of the planet’s natural resources. Currently, the study of the hydrological properties of lakes is carried out as part of international missions (Sentinel1/2/3, Radarsat, Landsat, Jason, MODIS, AVHRR, etc.). In the near future, new missions are planned. The Sentinel programme from the EU will allow monitoring very large number of variables related to the water cycle, including lakes variables. The ESA CCI programme gathers experts in different domains to create global data records of ECVs. Observations of lake water extent and lake ice extent are made only by satellite. The accuracy of these observations provides a study of the dynamics of these products, including within the framework of GCOS. Satellite observation data for lake water level and lake surface water temperature are less accurate than in situ observations but due to scarcity of in situ observations, satellites provide highly valuable and unique information on these variables worldwide. Moreover, the technical capabilities of new satellites and the improvement of methods for adjusting satellite observation data based
- 160 -
on in situ observations can constantly improve the accuracy of satellite measurements of these products.
The most complete information on the results of satellite observations of lake water level and lake water extent is concentrated in the international database HYDROWEB. Satellite observation data for lake water leaving reflectance and lake surface water temperature are provided in the Copernicus Global Land Service and Copernicus Climate Service (only LSWT). Lake ice extent products are also recorded in national archives (internationally accessible). Global databases of these observations now exist within the framework of the CCI project (see CRDP V1.0, link given above) for an initial set of 250 lakes.
Adaptation:
● Lake water level – shipping, fisheries, coastal infrastructure. ● Lake ice thickness, Lake ice extent - transportation (shipping and ice roads), leisure
activities (e.g. ice fishing and snowmobiling), food security (northern communities via ice roads).
● Lake water leaving reflectance – water extraction, ecosystem health, fisheries and aquaculture, drinking water supply, recreation.
Extremes:
● Highest lake water level, largest lake water extent – inundation. ● Extremely high or low lake water temperature – fisheries and aquaculture issues. ● Extremes in lake water leaving reflectance due to episodic events such as harmful
phytoplankton blooms, aquatic vegetation, erosion – fisheries, aquaculture, drinking water supply, recreational value.
● Low and high ice years – transportation, leisure activities, food security. ● There is a lack of studies on lake temperature extremes, including lake
heatwaves – these may be expected to affect ecological and fishery systems, and societal exploitation.
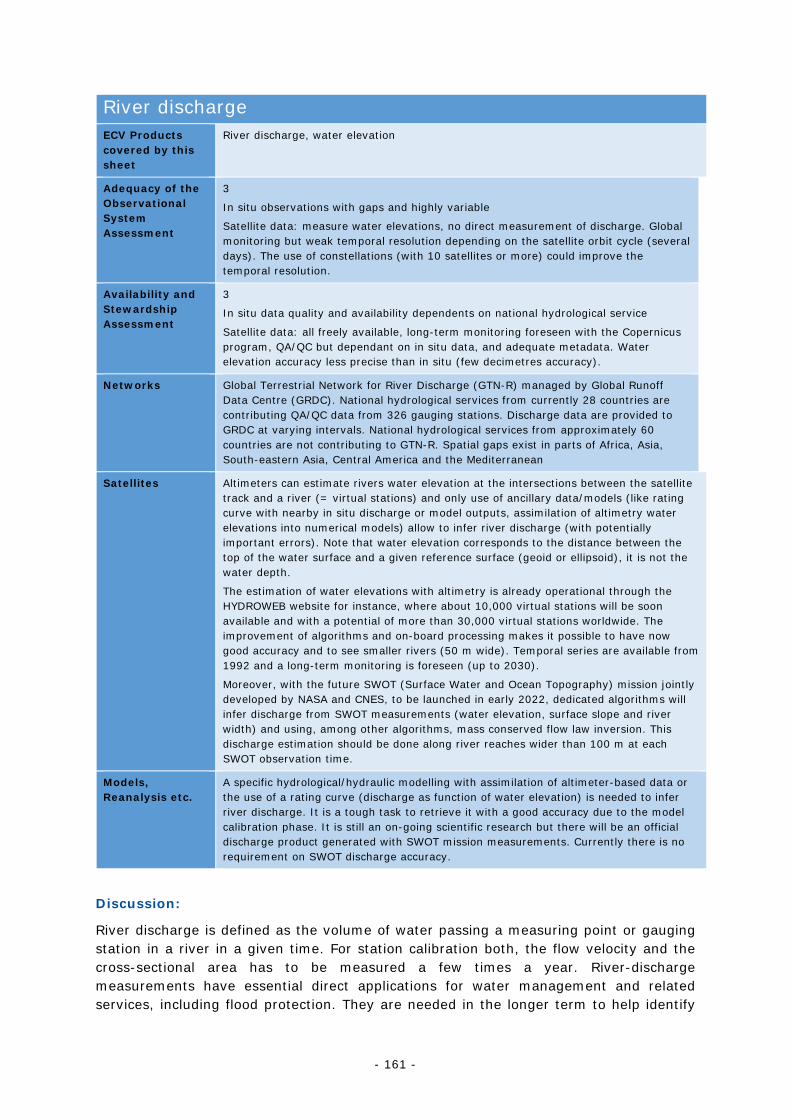
- 161 -
River discharge ECV Products covered by this sheet
River discharge, water elevation
Adequacy of the Observational System Assessment
3
In situ observations with gaps and highly variable
Satellite data: measure water elevations, no direct measurement of discharge. Global monitoring but weak temporal resolution depending on the satellite orbit cycle (several days). The use of constellations (with 10 satellites or more) could improve the temporal resolution.
Availability and Stewardship Assessment
3
In situ data quality and availability dependents on national hydrological service
Satellite data: all freely available, long-term monitoring foreseen with the Copernicus program, QA/QC but dependant on in situ data, and adequate metadata. Water elevation accuracy less precise than in situ (few decimetres accuracy).
Networks Global Terrestrial Network for River Discharge (GTN-R) managed by Global Runoff Data Centre (GRDC). National hydrological services from currently 28 countries are contributing QA/QC data from 326 gauging stations. Discharge data are provided to GRDC at varying intervals. National hydrological services from approximately 60 countries are not contributing to GTN-R. Spatial gaps exist in parts of Africa, Asia, South-eastern Asia, Central America and the Mediterranean
Satellites Altimeters can estimate rivers water elevation at the intersections between the satellite track and a river (= virtual stations) and only use of ancillary data/models (like rating curve with nearby in situ discharge or model outputs, assimilation of altimetry water elevations into numerical models) allow to infer river discharge (with potentially important errors). Note that water elevation corresponds to the distance between the top of the water surface and a given reference surface (geoid or ellipsoid), it is not the water depth.
The estimation of water elevations with altimetry is already operational through the HYDROWEB website for instance, where about 10,000 virtual stations will be soon available and with a potential of more than 30,000 virtual stations worldwide. The improvement of algorithms and on-board processing makes it possible to have now good accuracy and to see smaller rivers (50 m wide). Temporal series are available from 1992 and a long-term monitoring is foreseen (up to 2030).
Moreover, with the future SWOT (Surface Water and Ocean Topography) mission jointly developed by NASA and CNES, to be launched in early 2022, dedicated algorithms will infer discharge from SWOT measurements (water elevation, surface slope and river width) and using, among other algorithms, mass conserved flow law inversion. This discharge estimation should be done along river reaches wider than 100 m at each SWOT observation time.
Models, Reanalysis etc.
A specific hydrological/hydraulic modelling with assimilation of altimeter-based data or the use of a rating curve (discharge as function of water elevation) is needed to infer river discharge. It is a tough task to retrieve it with a good accuracy due to the model calibration phase. It is still an on-going scientific research but there will be an official discharge product generated with SWOT mission measurements. Currently there is no requirement on SWOT discharge accuracy.
Discussion:
River discharge is defined as the volume of water passing a measuring point or gauging station in a river in a given time. For station calibration both, the flow velocity and the cross-sectional area has to be measured a few times a year. River-discharge measurements have essential direct applications for water management and related services, including flood protection. They are needed in the longer term to help identify
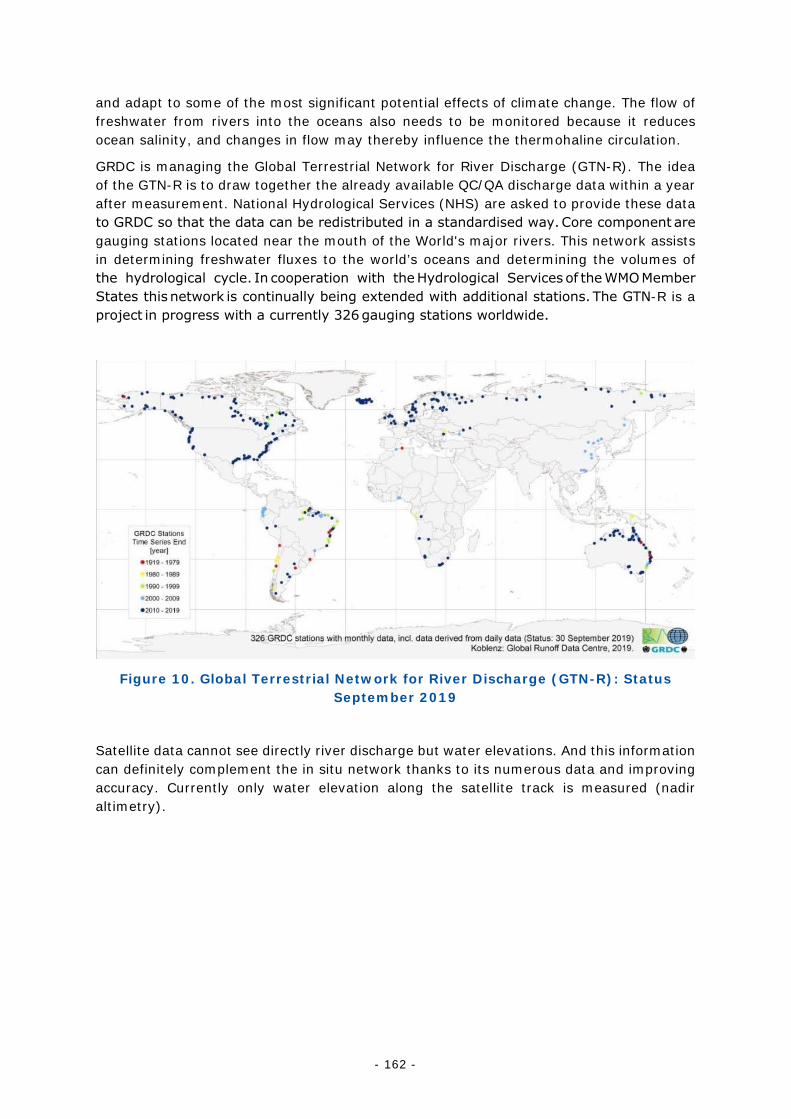
- 162 -
and adapt to some of the most significant potential effects of climate change. The flow of freshwater from rivers into the oceans also needs to be monitored because it reduces ocean salinity, and changes in flow may thereby influence the thermohaline circulation.
GRDC is managing the Global Terrestrial Network for River Discharge (GTN-R). The idea of the GTN-R is to draw together the already available QC/QA discharge data within a year after measurement. National Hydrological Services (NHS) are asked to provide these data to GRDC so that the data can be redistributed in a standardised way. Core component are gauging stations located near the mouth of the World's major rivers. This network assists in determining freshwater fluxes to the world’s oceans and determining the volumes of the hydrological cycle. In cooperation with the Hydrological Services of the WMO Member States this network is continually being extended with additional stations. The GTN-R is a project in progress with a currently 326 gauging stations worldwide.
Figure 10. Global Terrestrial Network for River Discharge (GTN-R): Status September 2019
Satellite data cannot see directly river discharge but water elevations. And this information can definitely complement the in situ network thanks to its numerous data and improving accuracy. Currently only water elevation along the satellite track is measured (nadir altimetry).
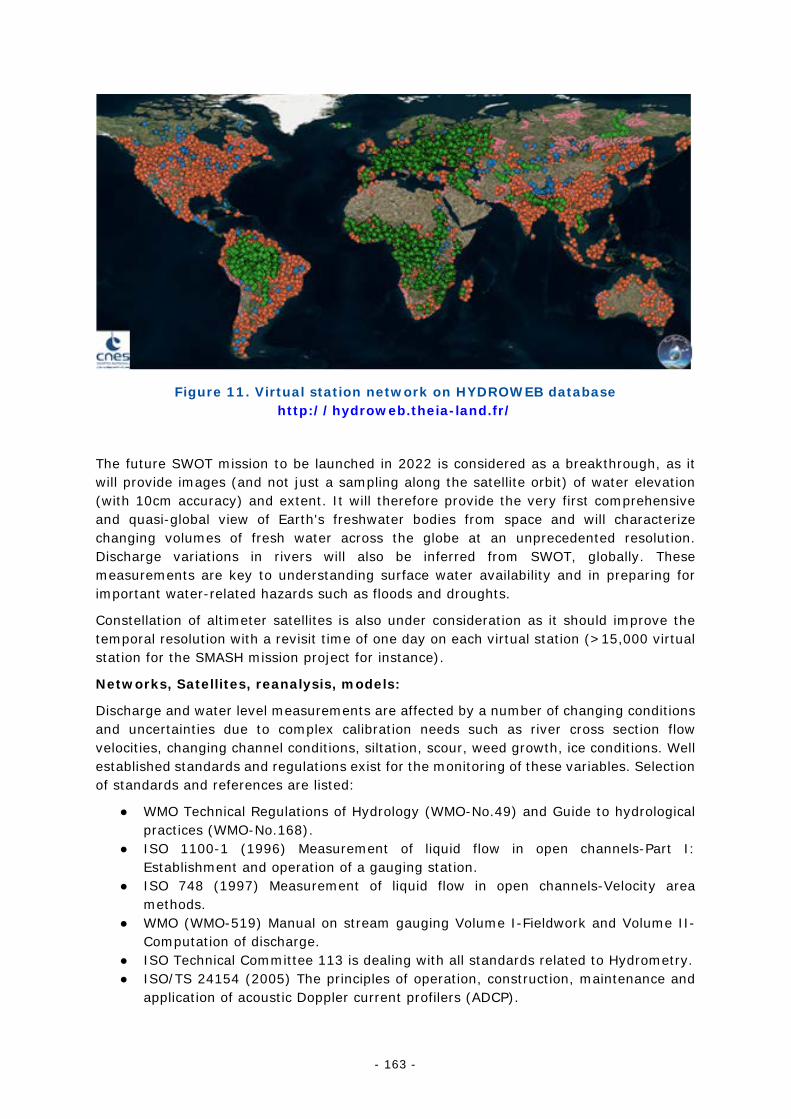
- 163 -
Figure 11. Virtual station network on HYDROWEB database http://hydroweb.theia-land.fr/
The future SWOT mission to be launched in 2022 is considered as a breakthrough, as it will provide images (and not just a sampling along the satellite orbit) of water elevation (with 10cm accuracy) and extent. It will therefore provide the very first comprehensive and quasi-global view of Earth's freshwater bodies from space and will characterize changing volumes of fresh water across the globe at an unprecedented resolution. Discharge variations in rivers will also be inferred from SWOT, globally. These measurements are key to understanding surface water availability and in preparing for important water-related hazards such as floods and droughts.
Constellation of altimeter satellites is also under consideration as it should improve the temporal resolution with a revisit time of one day on each virtual station (>15,000 virtual station for the SMASH mission project for instance).
Networks, Satellites, reanalysis, models:
Discharge and water level measurements are affected by a number of changing conditions and uncertainties due to complex calibration needs such as river cross section flow velocities, changing channel conditions, siltation, scour, weed growth, ice conditions. Well established standards and regulations exist for the monitoring of these variables. Selection of standards and references are listed:
● WMO Technical Regulations of Hydrology (WMO-No.49) and Guide to hydrological practices (WMO-No.168).
● ISO 1100-1 (1996) Measurement of liquid flow in open channels-Part I: Establishment and operation of a gauging station.
● ISO 748 (1997) Measurement of liquid flow in open channels-Velocity area methods.
● WMO (WMO-519) Manual on stream gauging Volume I-Fieldwork and Volume II-Computation of discharge.
● ISO Technical Committee 113 is dealing with all standards related to Hydrometry. ● ISO/TS 24154 (2005) The principles of operation, construction, maintenance and
application of acoustic Doppler current profilers (ADCP).
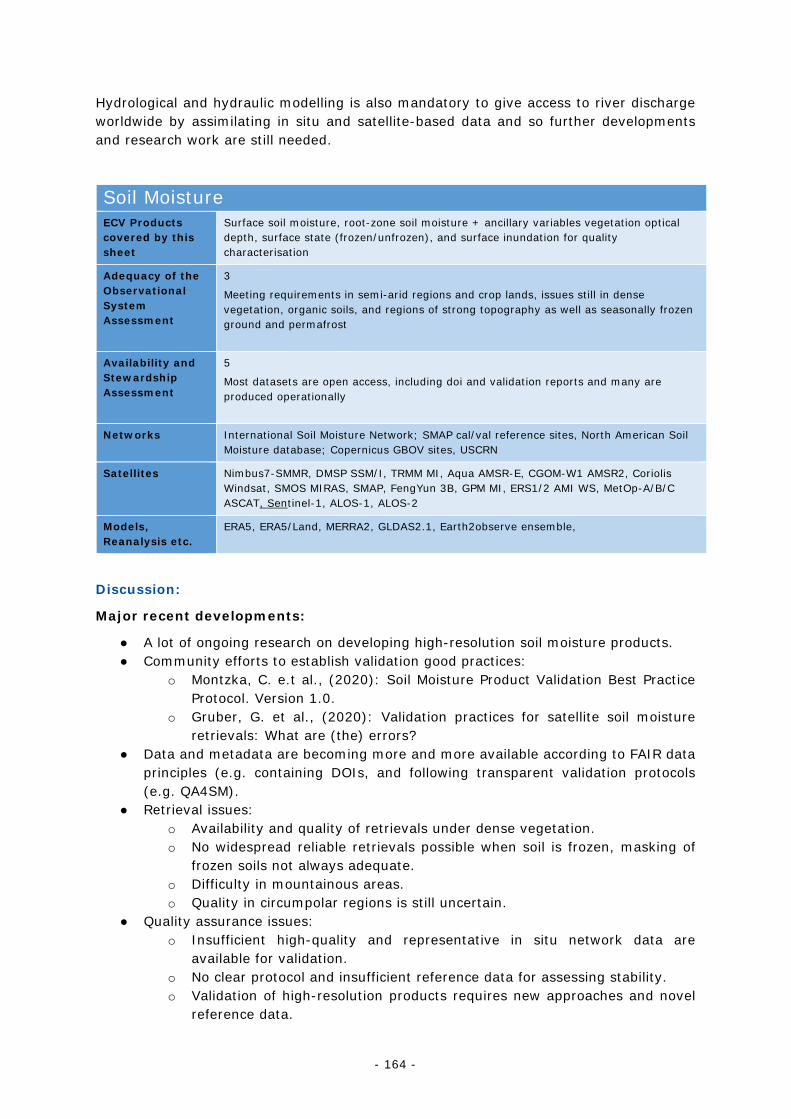
- 164 -
Hydrological and hydraulic modelling is also mandatory to give access to river discharge worldwide by assimilating in situ and satellite-based data and so further developments and research work are still needed.
Soil Moisture ECV Products covered by this sheet
Surface soil moisture, root-zone soil moisture + ancillary variables vegetation optical depth, surface state (frozen/unfrozen), and surface inundation for quality characterisation
Adequacy of the Observational System Assessment
3
Meeting requirements in semi-arid regions and crop lands, issues still in dense vegetation, organic soils, and regions of strong topography as well as seasonally frozen ground and permafrost
Availability and Stewardship Assessment
5
Most datasets are open access, including doi and validation reports and many are produced operationally
Networks International Soil Moisture Network; SMAP cal/val reference sites, North American Soil Moisture database; Copernicus GBOV sites, USCRN
Satellites Nimbus7-SMMR, DMSP SSM/I, TRMM MI, Aqua AMSR-E, CGOM-W1 AMSR2, Coriolis Windsat, SMOS MIRAS, SMAP, FengYun 3B, GPM MI, ERS1/2 AMI WS, MetOp-A/B/C ASCAT, Sentinel-1, ALOS-1, ALOS-2
Models, Reanalysis etc.
ERA5, ERA5/Land, MERRA2, GLDAS2.1, Earth2observe ensemble,
Discussion:
Major recent developments:
● A lot of ongoing research on developing high-resolution soil moisture products. ● Community efforts to establish validation good practices:
o Montzka, C. e.t al., (2020): Soil Moisture Product Validation Best Practice Protocol. Version 1.0.
o Gruber, G. et al., (2020): Validation practices for satellite soil moisture retrievals: What are (the) errors?
● Data and metadata are becoming more and more available according to FAIR data principles (e.g. containing DOIs, and following transparent validation protocols (e.g. QA4SM).
● Retrieval issues: o Availability and quality of retrievals under dense vegetation. o No widespread reliable retrievals possible when soil is frozen, masking of
frozen soils not always adequate. o Difficulty in mountainous areas. o Quality in circumpolar regions is still uncertain.
● Quality assurance issues: o Insufficient high-quality and representative in situ network data are
available for validation. o No clear protocol and insufficient reference data for assessing stability. o Validation of high-resolution products requires new approaches and novel
reference data.
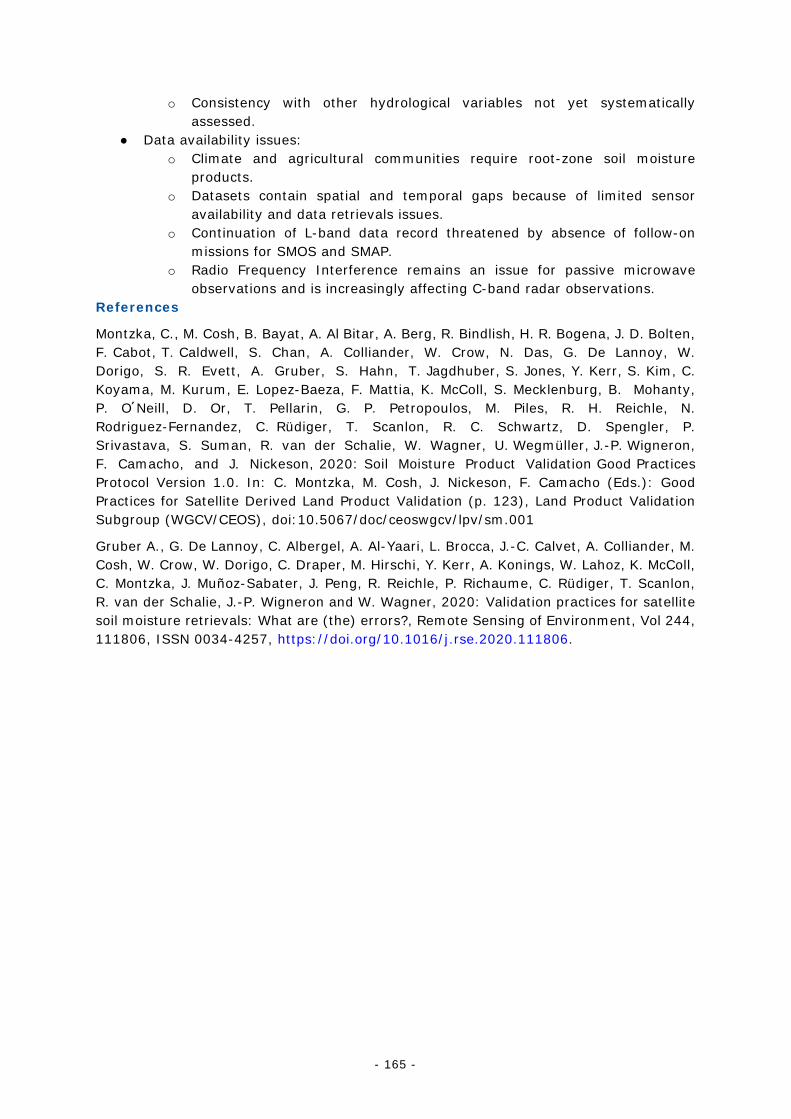
- 165 -
o Consistency with other hydrological variables not yet systematically assessed.
● Data availability issues: o Climate and agricultural communities require root-zone soil moisture
products. o Datasets contain spatial and temporal gaps because of limited sensor
availability and data retrievals issues. o Continuation of L-band data record threatened by absence of follow-on
missions for SMOS and SMAP. o Radio Frequency Interference remains an issue for passive microwave
observations and is increasingly affecting C-band radar observations. References
Montzka, C., M. Cosh, B. Bayat, A. Al Bitar, A. Berg, R. Bindlish, H. R. Bogena, J. D. Bolten, F. Cabot, T. Caldwell, S. Chan, A. Colliander, W. Crow, N. Das, G. De Lannoy, W. Dorigo, S. R. Evett, A. Gruber, S. Hahn, T. Jagdhuber, S. Jones, Y. Kerr, S. Kim, C. Koyama, M. Kurum, E. Lopez-Baeza, F. Mattia, K. McColl, S. Mecklenburg, B. Mohanty, P. O Neill, D. Or, T. Pellarin, G. P. Petropoulos, M. Piles, R. H. Reichle, N. Rodriguez-Fernandez, C. Rüdiger, T. Scanlon, R. C. Schwartz, D. Spengler, P. Srivastava, S. Suman, R. van der Schalie, W. Wagner, U. Wegmüller, J.-P. Wigneron, F. Camacho, and J. Nickeson, 2020: Soil Moisture Product Validation Good Practices Protocol Version 1.0. In: C. Montzka, M. Cosh, J. Nickeson, F. Camacho (Eds.): Good Practices for Satellite Derived Land Product Validation (p. 123), Land Product Validation Subgroup (WGCV/CEOS), doi:10.5067/doc/ceoswgcv/lpv/sm.001
Gruber A., G. De Lannoy, C. Albergel, A. Al-Yaari, L. Brocca, J.-C. Calvet, A. Colliander, M. Cosh, W. Crow, W. Dorigo, C. Draper, M. Hirschi, Y. Kerr, A. Konings, W. Lahoz, K. McColl, C. Montzka, J. Muñoz-Sabater, J. Peng, R. Reichle, P. Richaume, C. Rüdiger, T. Scanlon, R. van der Schalie, J.-P. Wigneron and W. Wagner, 2020: Validation practices for satellite soil moisture retrievals: What are (the) errors?, Remote Sensing of Environment, Vol 244, 111806, ISSN 0034-4257, https://doi.org/10.1016/j.rse.2020.111806.
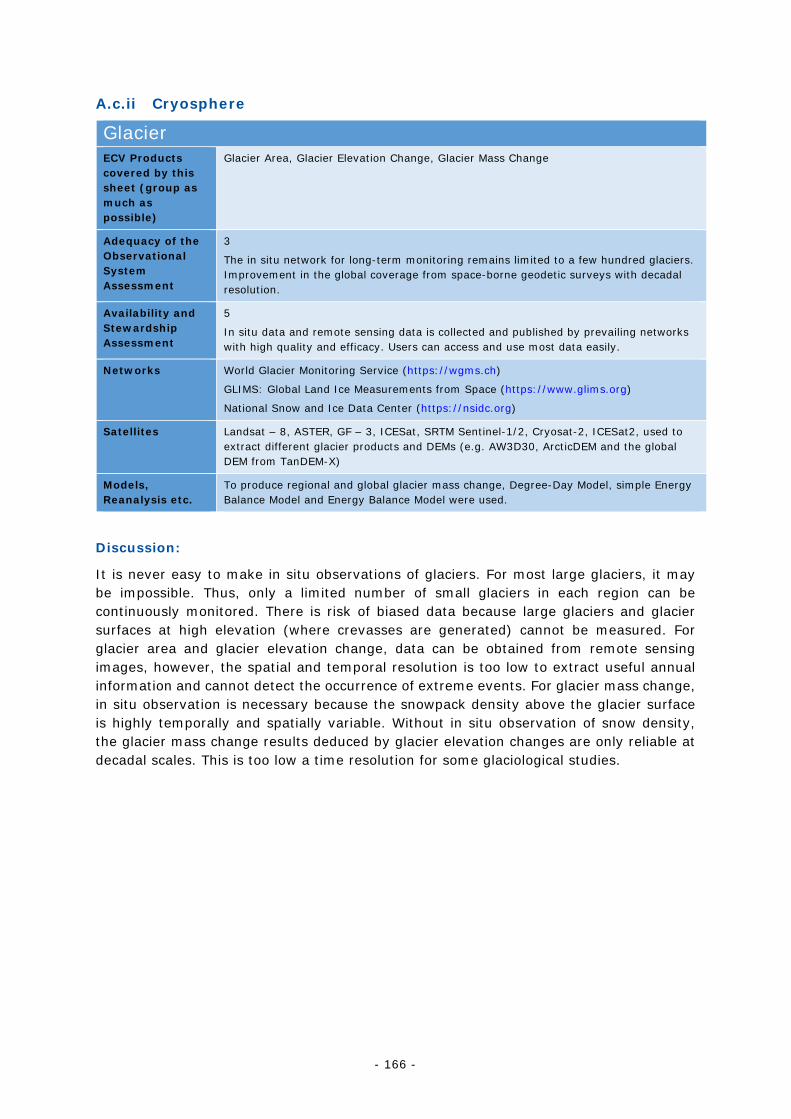
- 166 -
A.c.ii Cryosphere
Glacier ECV Products covered by this sheet (group as much as possible)
Glacier Area, Glacier Elevation Change, Glacier Mass Change
Adequacy of the Observational System Assessment
3
The in situ network for long-term monitoring remains limited to a few hundred glaciers. Improvement in the global coverage from space-borne geodetic surveys with decadal resolution.
Availability and Stewardship Assessment
5
In situ data and remote sensing data is collected and published by prevailing networks with high quality and efficacy. Users can access and use most data easily.
Networks World Glacier Monitoring Service (https://wgms.ch)
GLIMS: Global Land Ice Measurements from Space (https://www.glims.org)
National Snow and Ice Data Center (https://nsidc.org)
Satellites Landsat – 8, ASTER, GF – 3, ICESat, SRTM Sentinel-1/2, Cryosat-2, ICESat2, used to extract different glacier products and DEMs (e.g. AW3D30, ArcticDEM and the global DEM from TanDEM-X)
Models, Reanalysis etc.
To produce regional and global glacier mass change, Degree-Day Model, simple Energy Balance Model and Energy Balance Model were used.
Discussion:
It is never easy to make in situ observations of glaciers. For most large glaciers, it may be impossible. Thus, only a limited number of small glaciers in each region can be continuously monitored. There is risk of biased data because large glaciers and glacier surfaces at high elevation (where crevasses are generated) cannot be measured. For glacier area and glacier elevation change, data can be obtained from remote sensing images, however, the spatial and temporal resolution is too low to extract useful annual information and cannot detect the occurrence of extreme events. For glacier mass change, in situ observation is necessary because the snowpack density above the glacier surface is highly temporally and spatially variable. Without in situ observation of snow density, the glacier mass change results deduced by glacier elevation changes are only reliable at decadal scales. This is too low a time resolution for some glaciological studies.
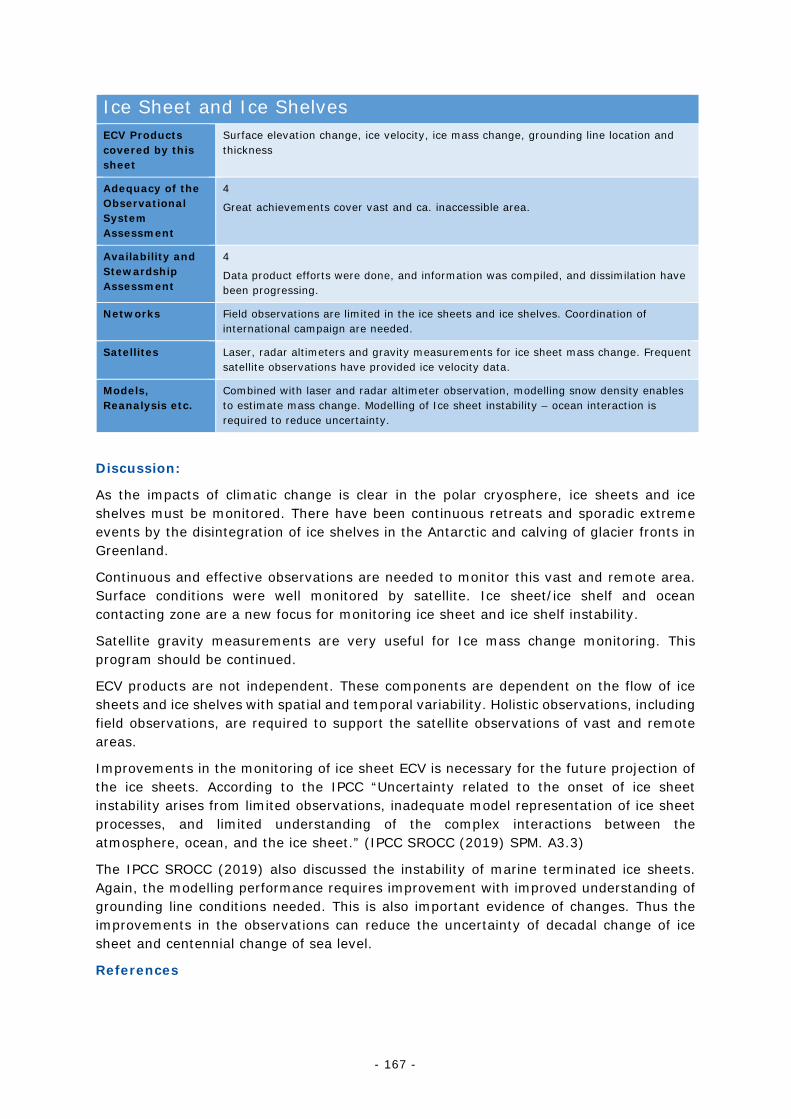
- 167 -
Ice Sheet and Ice Shelves ECV Products covered by this sheet
Surface elevation change, ice velocity, ice mass change, grounding line location and thickness
Adequacy of the Observational System Assessment
4
Great achievements cover vast and ca. inaccessible area.
Availability and Stewardship Assessment
4
Data product efforts were done, and information was compiled, and dissimilation have been progressing.
Networks Field observations are limited in the ice sheets and ice shelves. Coordination of international campaign are needed.
Satellites Laser, radar altimeters and gravity measurements for ice sheet mass change. Frequent satellite observations have provided ice velocity data.
Models, Reanalysis etc.
Combined with laser and radar altimeter observation, modelling snow density enables to estimate mass change. Modelling of Ice sheet instability – ocean interaction is required to reduce uncertainty.
Discussion:
As the impacts of climatic change is clear in the polar cryosphere, ice sheets and ice shelves must be monitored. There have been continuous retreats and sporadic extreme events by the disintegration of ice shelves in the Antarctic and calving of glacier fronts in Greenland.
Continuous and effective observations are needed to monitor this vast and remote area. Surface conditions were well monitored by satellite. Ice sheet/ice shelf and ocean contacting zone are a new focus for monitoring ice sheet and ice shelf instability.
Satellite gravity measurements are very useful for Ice mass change monitoring. This program should be continued.
ECV products are not independent. These components are dependent on the flow of ice sheets and ice shelves with spatial and temporal variability. Holistic observations, including field observations, are required to support the satellite observations of vast and remote areas.
Improvements in the monitoring of ice sheet ECV is necessary for the future projection of the ice sheets. According to the IPCC “Uncertainty related to the onset of ice sheet instability arises from limited observations, inadequate model representation of ice sheet processes, and limited understanding of the complex interactions between the atmosphere, ocean, and the ice sheet.” (IPCC SROCC (2019) SPM. A3.3)
The IPCC SROCC (2019) also discussed the instability of marine terminated ice sheets. Again, the modelling performance requires improvement with improved understanding of grounding line conditions needed. This is also important evidence of changes. Thus the improvements in the observations can reduce the uncertainty of decadal change of ice sheet and centennial change of sea level.
References
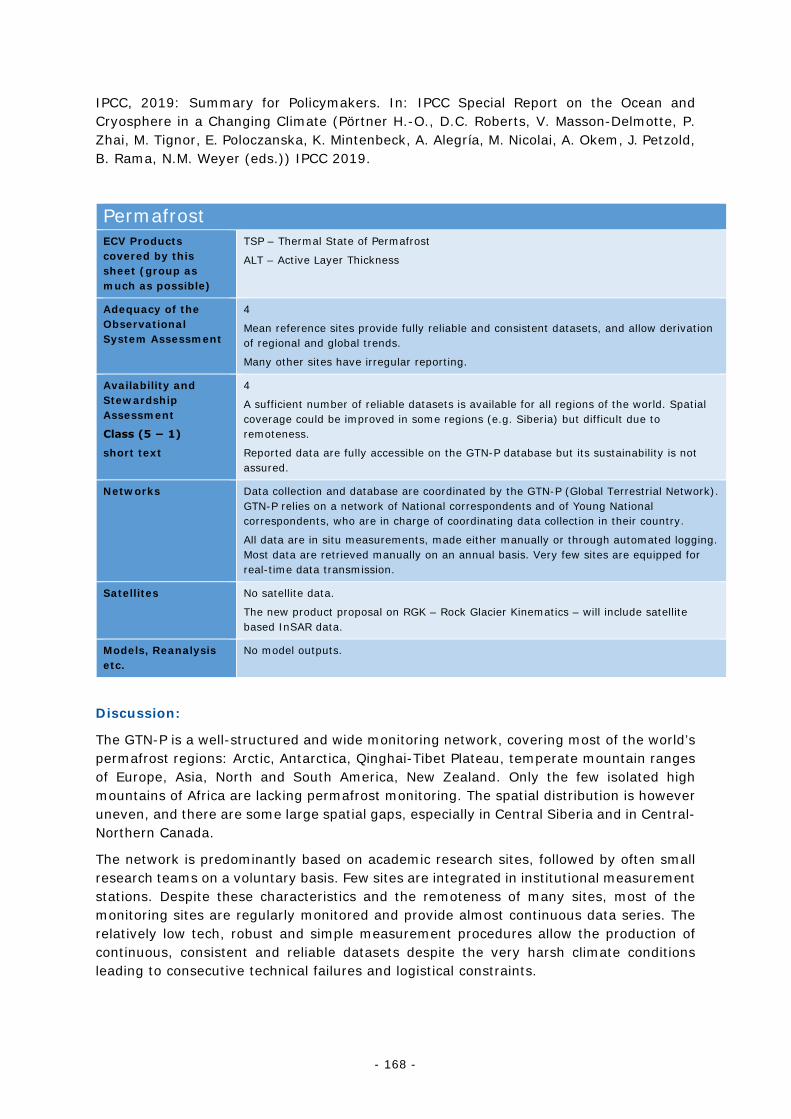
- 168 -
IPCC, 2019: Summary for Policymakers. In: IPCC Special Report on the Ocean and Cryosphere in a Changing Climate (Pörtner H.-O., D.C. Roberts, V. Masson-Delmotte, P. Zhai, M. Tignor, E. Poloczanska, K. Mintenbeck, A. Alegría, M. Nicolai, A. Okem, J. Petzold, B. Rama, N.M. Weyer (eds.)) IPCC 2019.
Permafrost
ECV Products covered by this sheet (group as much as possible)
TSP – Thermal State of Permafrost
ALT – Active Layer Thickness
Adequacy of the Observational System Assessment
4
Mean reference sites provide fully reliable and consistent datasets, and allow derivation of regional and global trends.
Many other sites have irregular reporting.
Availability and Stewardship Assessment
Class (5 − 1)
short text
4
A sufficient number of reliable datasets is available for all regions of the world. Spatial coverage could be improved in some regions (e.g. Siberia) but difficult due to remoteness.
Reported data are fully accessible on the GTN-P database but its sustainability is not assured.
Networks Data collection and database are coordinated by the GTN-P (Global Terrestrial Network). GTN-P relies on a network of National correspondents and of Young National correspondents, who are in charge of coordinating data collection in their country.
All data are in situ measurements, made either manually or through automated logging. Most data are retrieved manually on an annual basis. Very few sites are equipped for real-time data transmission.
Satellites No satellite data.
The new product proposal on RGK – Rock Glacier Kinematics – will include satellite based InSAR data.
Models, Reanalysis etc.
No model outputs.
Discussion:
The GTN-P is a well-structured and wide monitoring network, covering most of the world’s permafrost regions: Arctic, Antarctica, Qinghai-Tibet Plateau, temperate mountain ranges of Europe, Asia, North and South America, New Zealand. Only the few isolated high mountains of Africa are lacking permafrost monitoring. The spatial distribution is however uneven, and there are some large spatial gaps, especially in Central Siberia and in Central-Northern Canada.
The network is predominantly based on academic research sites, followed by often small research teams on a voluntary basis. Few sites are integrated in institutional measurement stations. Despite these characteristics and the remoteness of many sites, most of the monitoring sites are regularly monitored and provide almost continuous data series. The relatively low tech, robust and simple measurement procedures allow the production of continuous, consistent and reliable datasets despite the very harsh climate conditions leading to consecutive technical failures and logistical constraints.
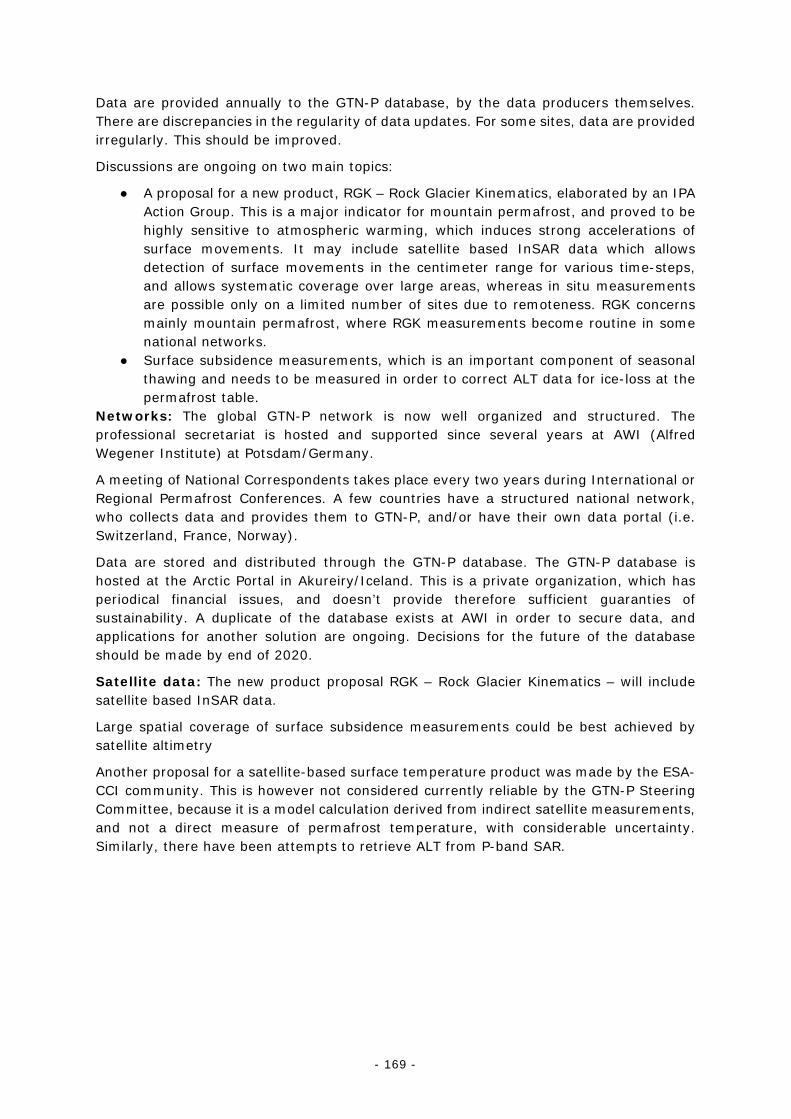
- 169 -
Data are provided annually to the GTN-P database, by the data producers themselves. There are discrepancies in the regularity of data updates. For some sites, data are provided irregularly. This should be improved.
Discussions are ongoing on two main topics:
● A proposal for a new product, RGK – Rock Glacier Kinematics, elaborated by an IPA Action Group. This is a major indicator for mountain permafrost, and proved to be highly sensitive to atmospheric warming, which induces strong accelerations of surface movements. It may include satellite based InSAR data which allows detection of surface movements in the centimeter range for various time-steps, and allows systematic coverage over large areas, whereas in situ measurements are possible only on a limited number of sites due to remoteness. RGK concerns mainly mountain permafrost, where RGK measurements become routine in some national networks.
● Surface subsidence measurements, which is an important component of seasonal thawing and needs to be measured in order to correct ALT data for ice-loss at the permafrost table.
Networks: The global GTN-P network is now well organized and structured. The professional secretariat is hosted and supported since several years at AWI (Alfred Wegener Institute) at Potsdam/Germany.
A meeting of National Correspondents takes place every two years during International or Regional Permafrost Conferences. A few countries have a structured national network, who collects data and provides them to GTN-P, and/or have their own data portal (i.e. Switzerland, France, Norway).
Data are stored and distributed through the GTN-P database. The GTN-P database is hosted at the Arctic Portal in Akureiry/Iceland. This is a private organization, which has periodical financial issues, and doesn’t provide therefore sufficient guaranties of sustainability. A duplicate of the database exists at AWI in order to secure data, and applications for another solution are ongoing. Decisions for the future of the database should be made by end of 2020.
Satellite data: The new product proposal RGK – Rock Glacier Kinematics – will include satellite based InSAR data.
Large spatial coverage of surface subsidence measurements could be best achieved by satellite altimetry
Another proposal for a satellite-based surface temperature product was made by the ESA-CCI community. This is however not considered currently reliable by the GTN-P Steering Committee, because it is a model calculation derived from indirect satellite measurements, and not a direct measure of permafrost temperature, with considerable uncertainty. Similarly, there have been attempts to retrieve ALT from P-band SAR.
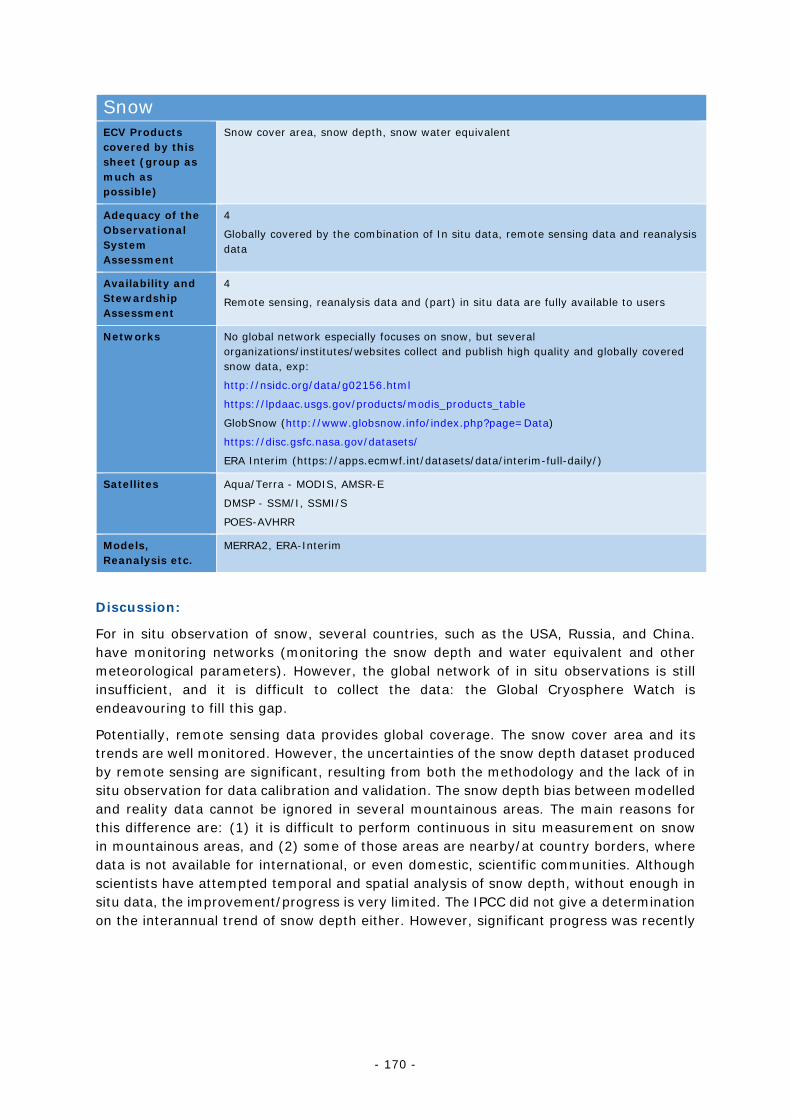
- 170 -
Snow ECV Products covered by this sheet (group as much as possible)
Snow cover area, snow depth, snow water equivalent
Adequacy of the Observational System Assessment
4
Globally covered by the combination of In situ data, remote sensing data and reanalysis data
Availability and Stewardship Assessment
4
Remote sensing, reanalysis data and (part) in situ data are fully available to users
Networks No global network especially focuses on snow, but several organizations/institutes/websites collect and publish high quality and globally covered snow data, exp:
http://nsidc.org/data/g02156.html
https://lpdaac.usgs.gov/products/modis_products_table
GlobSnow (http://www.globsnow.info/index.php?page=Data)
https://disc.gsfc.nasa.gov/datasets/
ERA Interim (https://apps.ecmwf.int/datasets/data/interim-full-daily/)
Satellites Aqua/Terra - MODIS, AMSR-E
DMSP - SSM/I, SSMI/S
POES-AVHRR
Models, Reanalysis etc.
MERRA2, ERA-Interim
Discussion:
For in situ observation of snow, several countries, such as the USA, Russia, and China. have monitoring networks (monitoring the snow depth and water equivalent and other meteorological parameters). However, the global network of in situ observations is still insufficient, and it is difficult to collect the data: the Global Cryosphere Watch is endeavouring to fill this gap.
Potentially, remote sensing data provides global coverage. The snow cover area and its trends are well monitored. However, the uncertainties of the snow depth dataset produced by remote sensing are significant, resulting from both the methodology and the lack of in situ observation for data calibration and validation. The snow depth bias between modelled and reality data cannot be ignored in several mountainous areas. The main reasons for this difference are: (1) it is difficult to perform continuous in situ measurement on snow in mountainous areas, and (2) some of those areas are nearby/at country borders, where data is not available for international, or even domestic, scientific communities. Although scientists have attempted temporal and spatial analysis of snow depth, without enough in situ data, the improvement/progress is very limited. The IPCC did not give a determination on the interannual trend of snow depth either. However, significant progress was recently
- 171 -
made in determining trends in non-mountain snow water equivalent from both satellites combined with in situ data 47and reanalyses datasets.
Snow thickness on sea ice is poorly measured. Monitoring snow thickness on sea ice and snow on land ice are as they are substantial control of ice beneath.
47 See DOI: 10.1038/s41586-020-2258-0 and DOI: 10.5194/tc-14-2495-2020)
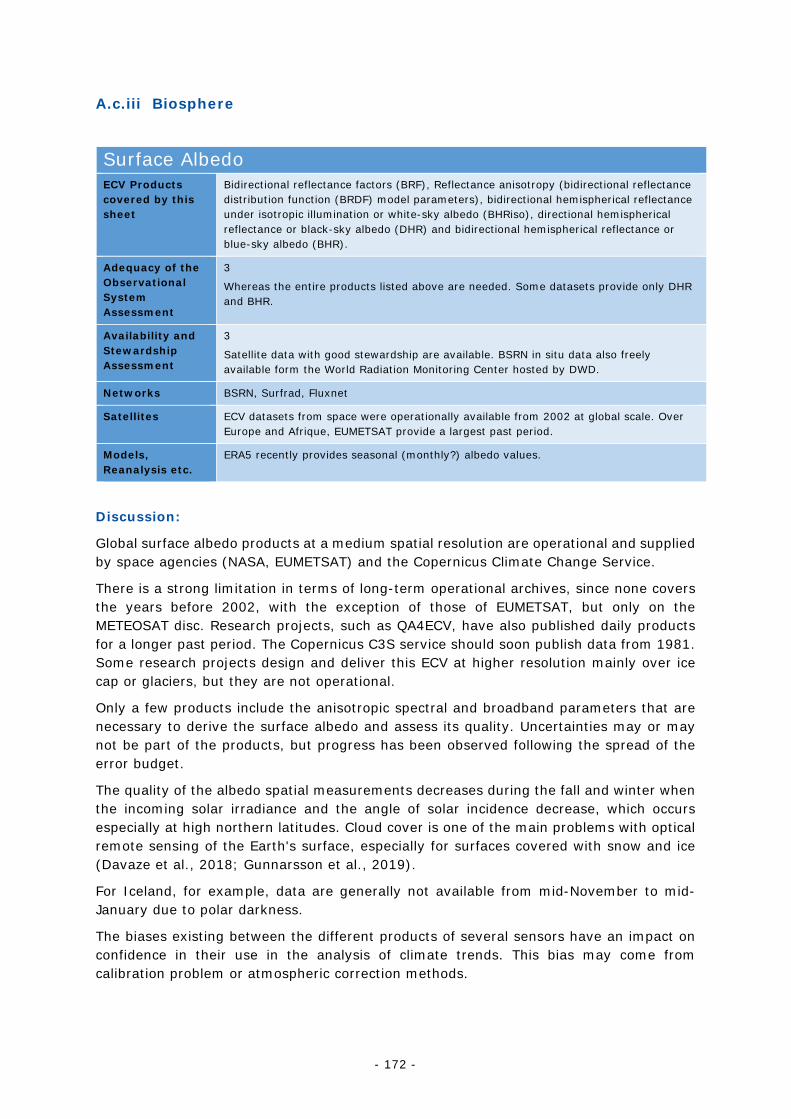
- 172 -
A.c.iii Biosphere
Surface Albedo ECV Products covered by this sheet
Bidirectional reflectance factors (BRF), Reflectance anisotropy (bidirectional reflectance distribution function (BRDF) model parameters), bidirectional hemispherical reflectance under isotropic illumination or white-sky albedo (BHRiso), directional hemispherical reflectance or black-sky albedo (DHR) and bidirectional hemispherical reflectance or blue-sky albedo (BHR).
Adequacy of the Observational System Assessment
3
Whereas the entire products listed above are needed. Some datasets provide only DHR and BHR.
Availability and Stewardship Assessment
3
Satellite data with good stewardship are available. BSRN in situ data also freely available form the World Radiation Monitoring Center hosted by DWD.
Networks BSRN, Surfrad, Fluxnet
Satellites ECV datasets from space were operationally available from 2002 at global scale. Over Europe and Afrique, EUMETSAT provide a largest past period.
Models, Reanalysis etc.
ERA5 recently provides seasonal (monthly?) albedo values.
Discussion:
Global surface albedo products at a medium spatial resolution are operational and supplied by space agencies (NASA, EUMETSAT) and the Copernicus Climate Change Service.
There is a strong limitation in terms of long-term operational archives, since none covers the years before 2002, with the exception of those of EUMETSAT, but only on the METEOSAT disc. Research projects, such as QA4ECV, have also published daily products for a longer past period. The Copernicus C3S service should soon publish data from 1981. Some research projects design and deliver this ECV at higher resolution mainly over ice cap or glaciers, but they are not operational.
Only a few products include the anisotropic spectral and broadband parameters that are necessary to derive the surface albedo and assess its quality. Uncertainties may or may not be part of the products, but progress has been observed following the spread of the error budget.
The quality of the albedo spatial measurements decreases during the fall and winter when the incoming solar irradiance and the angle of solar incidence decrease, which occurs especially at high northern latitudes. Cloud cover is one of the main problems with optical remote sensing of the Earth's surface, especially for surfaces covered with snow and ice (Davaze et al., 2018; Gunnarsson et al., 2019).
For Iceland, for example, data are generally not available from mid-November to mid-January due to polar darkness.
The biases existing between the different products of several sensors have an impact on confidence in their use in the analysis of climate trends. This bias may come from calibration problem or atmospheric correction methods.
- 173 -
Despite the accuracy problem, applications can be made through changes and trends in relative values. In climate modelling studies, the climatology of the surface albedo of the functional types of plants (PFT) is often used as a reference or constraint.
Baseline Surface Radiation Network (BSRN) and SURFace RADiation Budget Measurement Network (SURFRAD) provides shortwave broadband albedo only (not spectral) over several sites. Despite BSRN uses pairs of secondary standard pyranometers to retrieve the albedo, the installation height is not homogeneous across sites as it varies from 3 m to 30 m. Only few sites implement tower observations, which are the most representative for monitoring purposes. US BSRN sites (most SURFRAD) perform homogeneous measurement from a nominal height of 10 m. To include upwelling components as basic requirements for future BSRN candidate stations, and to provide products for albedo in black-sky and white-sky conditions, are under discussion. Despite its wider distribution and tower implementation FLUXNET do not measure the irradiance with the same quality instruments and BSRN/SURFRAD and do not provide information of the diffuse component, which is useful in the process of cloud screening and reduction of the albedo to white-sky and black-sky components (see Copernicus Ground-Based Observation for Validation Service).
References
Davaze L., A. Rabatel, Y. Arnaud1, P. Sirguey, D. Six, A. Letreguilly and M. Dumont, 2018: Monitoring glacier albedo as a proxy to derive summer and annual surface mass balances from optical remote-sensing data The Cryosphere, 12, 271–286, 2018 https://doi.org/10.5194/tc-12-271-2018
Gunnarsson A., S.M. Gardarsson, F. Pálsson, T. Jóhannesson, and Ó. G. B. Sveinsson, 2019: Annual and inter-annual variability and trends of albedo of Icelandic glaciers The Cryosphere, 15, 547–570, 2021 https://doi.org/10.5194/tc-15-547-2021
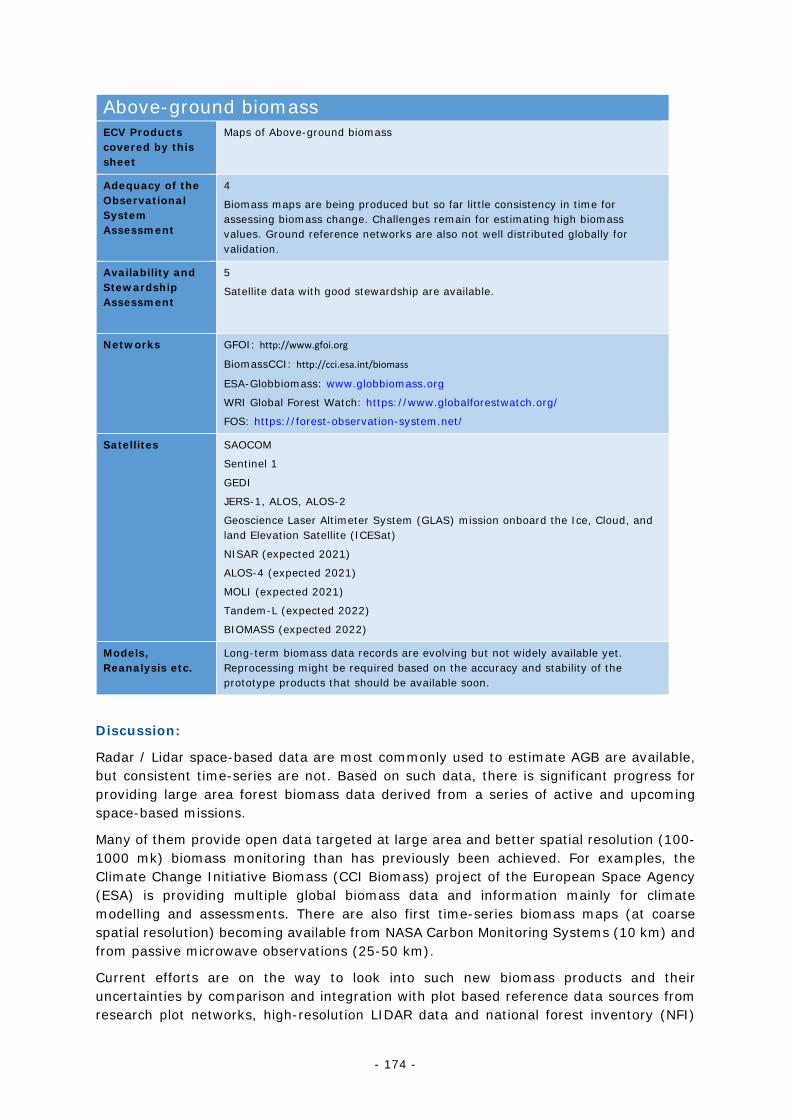
- 174 -
Above-ground biomass ECV Products covered by this sheet
Maps of Above-ground biomass
Adequacy of the Observational System Assessment
4
Biomass maps are being produced but so far little consistency in time for assessing biomass change. Challenges remain for estimating high biomass values. Ground reference networks are also not well distributed globally for validation.
Availability and Stewardship Assessment
5
Satellite data with good stewardship are available.
Networks GFOI: http://www.gfoi.org
BiomassCCI: http://cci.esa.int/biomass
ESA-Globbiomass: www.globbiomass.org
WRI Global Forest Watch: https://www.globalforestwatch.org/
FOS: https://forest-observation-system.net/
Satellites SAOCOM
Sentinel 1
GEDI
JERS-1, ALOS, ALOS-2
Geoscience Laser Altimeter System (GLAS) mission onboard the Ice, Cloud, and land Elevation Satellite (ICESat)
NISAR (expected 2021)
ALOS-4 (expected 2021)
MOLI (expected 2021)
Tandem-L (expected 2022)
BIOMASS (expected 2022)
Models, Reanalysis etc.
Long-term biomass data records are evolving but not widely available yet. Reprocessing might be required based on the accuracy and stability of the prototype products that should be available soon.
Discussion:
Radar / Lidar space-based data are most commonly used to estimate AGB are available, but consistent time-series are not. Based on such data, there is significant progress for providing large area forest biomass data derived from a series of active and upcoming space-based missions.
Many of them provide open data targeted at large area and better spatial resolution (100-1000 mk) biomass monitoring than has previously been achieved. For examples, the Climate Change Initiative Biomass (CCI Biomass) project of the European Space Agency (ESA) is providing multiple global biomass data and information mainly for climate modelling and assessments. There are also first time-series biomass maps (at coarse spatial resolution) becoming available from NASA Carbon Monitoring Systems (10 km) and from passive microwave observations (25-50 km).
Current efforts are on the way to look into such new biomass products and their uncertainties by comparison and integration with plot based reference data sources from research plot networks, high-resolution LIDAR data and national forest inventory (NFI)
- 175 -
datasets. The CEOS WGCV is in the process of finalizing a community-consensus protocol for global biomass validation.
FAPAR ECV Products covered by this sheet
Adequacy of the Observational System Assessment
3
ECV datasets from space were operationally available from 2002 and one using past AVHRR data from 1980. In situ network is not well represented at global scale. Only a few of them meets accuracy and stability requirements
Availability and Stewardship Assessment
5
Satellite data with good stewardship are available.
Networks Long-term infrastructural networks, e.g. TERN, NEON, ICOS, Fluxnet.
Satellites ECV datasets from space were operationally available from 2002 and one using past AVHRR data from 1980.
In situ network is not well represented at global scale.
Models, Reanalysis etc.
Discussion:
ECV FAPAR data are produced by national space agencies (e.g. NASA and ESA) and Copernicus services at global scale. EUMETSAT also provides operational daily products for Europe and Africa. In addition, some research products are also available but only cover a limited period. ECV FAPAR products on a higher spatial scale (around 20-30 m), which could be used for adaptation, are not yet operational but feasible.
The 'in situ' measurement networks include less than a hundred local sites which do not sample all types of vegetation. The sites are almost missing on the South American and African continents. The traceability of measurements and standard methods across networks has not yet been achieved, but recent progress has been seen. We must also highlight the disparities between the available products in term of temporal and spatial scale, different geographic projection that implies often a post-processing by final users.
The main default for the applications relating to climate change concerns the non-compliance with the requirement of long-term temporal stability. This failure affects the confidence of interannual variability and the analysis of trends. This is mainly due to the following problems: poor calibration or drift for the older sensors but also for a series of same sensors on board different platforms, such as AVHRR / NOAA; use of a non-physical algorithm on different optical sensors. (See the example in Gobron et al., 2019).
This implies that the analysis of trends in the FAPAR ECV is not reliable and can only be carried out over a short and recent "climatic" period (last 18 years).
In addition, the uncertainties (when present) of various products are either missing or do not represent a correct mathematical quantity. Thanks to research projects, such as QA4ECV and FIDUCEO, progress has been made to have a full budget of uncertainties but has not always been implemented operationally. Long-term reprocessing of archives using
- 176 -
state-of-the-art retrieval algorithm and handling of uncertainties must be considered to overcome these problems.
The current products available represent also different definitions, as the products can represent either instantaneous or diffuse values and can represent either the total, mixed or green leaves absorption.
This implies that the documentation is necessary for their use in certain applications. For example, Zhang. and. al. (2020) has shown that certain products are better suitable for the calculation of GPP. In addition, consistency with other terrestrial ECVs should be improved.
In situ sensors across the several networks can be different and sometimes non-standard. Progress has been made regarding the use of PAR sensor networks which has proven to be more appropriate to represent this ECV at the local scale. However, research is still needed to infer the 'green' values instead of the total absorption. In vegetation and climate models, the parametrization of the radiative transfer is often based on a 1-D model which establishes the physical link between LAI, FAPAR and surface albedo. This means that the assimilation of these ECVs must be taken with caution.
MODIS and MISR instruments on board TERRA have been flying since 2002 and will stop in a few years. VIRSS can replace MODIS even if its performance is not at the same level. Fortunately, Copernicus Sentinel 3A and its twin Sentinel 3B have been launched in the past four years. However, their main area of application concerns the oceans. In addition, Sentinel 2A and Sentinel 2B provide data that can be used for LAI at higher resolution, although geographic coverage at global scale may be limited.
The recent Earth Polychromatic Imaging Camera (EPIC) on the Deep Space Climate Observatory (DSCOVR) platform, which was launched into the Sun–Earth’s first Lagrange Point (L1) orbit, provide spectral images of the entire sunlit face of Earth with 10 narrow channels (from 317 to 780 nm). As EPIC can provide high-temporal resolution data, it is beneficial to explore the feasibility of EPIC to estimate high-temporal resolution FAPAR.
References
Gobron, N.; M. Marioni; M. Robustelli, E. Vermote, 2019: Can We Use the QA4ECV Black-sky Fraction of Absorbed Photosynthetically Active Radiation (FAPAR) using AVHRR Surface Reflectance to Assess Terrestrial Global Change? Remote Sensing, 11, 3055. https://doi.org/10.3390/rs11243055
Zhang Z., Y. Zhang, A. Porcar-Castell, J. Joiner, L. Guanter, X. Yang, M. Migliavacca, W. Ju, Z. Sun, S. Chen, D. Martini, Q. Zhang, Z. Li, J. Cleverly, H. Wang and Y. Goulas, 2020: Reduction of structural impacts and distinction of photosynthetic pathways in a global estimation of GPP from space-borne solar-induced chlorophyll fluorescence, Remote Sensing of Environment, Vol 240, 111722, ISSN 0034-4257, https://doi.org/10.1016/j.rse.2020.111722.
- 177 -
Fire Disturbance ECV Products covered by this sheet
Burned Area
Adequacy of the Observational System Assessment
3
Omission and commission errors higher than required
Availability and Stewardship Assessment
5
Datasets incorporate all standards and are easily accessible.
Networks NASA MODIS standard products
ESA CCI standard products
EU Copernicus Climate Change Service
GOFC-GOLD Fire Implementation Team
Global Wildland Information System (JRC)
Satellites Terra-Aqua MODIS (>2000)
Sentinel-3 SLSTR-OLCI (>2018)
NOAA-VIIRS (>2013)
NOAA-AVHRR (>1982) limited interest
Models, Reanalysis etc.
Several Fire modules within DGVM (Spitfire, GlobFIRM, CASA, CTEM, Orchidee)
Discussion:
Several global BA (burnt area) products have been released in the last years, mainly derived from sensors providing frequent temporal coverage (daily), such as MODIS, MERIS or VEGETATION, but coarse spatial detail (>300 m). A recent review by Chuvieco et al. (2019) shows the strengths and limitations of existing global products. The most reliable ones estimate total worldwide BA in the range of 3.5 to 4.5 Mkm2, but this estimation is likely to be conservative since comparison of global and regional products show an important underestimation from the former (Roteta et al. 2019, Hawbaker et al.2017). Now the most used global BA product is the MCD64A1, produced by NASA based on MODIS 500 m reflectance bands guided by active fires. The last version is collection 6 (Giglio et al. 2018), which has superseded other NASA BA products. The ESA’s Climate Change Initiative Fire Disturbance project (FireCCI) has developed an alternative global BA product, based on MODIS 250 m reflectance bands, which provides similar accuracy to the NASA product but seems more sensitive to small burn patches (Chuvieco et al. 2018, Lizundia-Loiola et. al., 2020). A prototype for generating BA products from long-term series of AVHRR products has also been recently published, but it is still unstable and provides low accuracy for Boreal and temperate regions (Otón et. al. 2019)
These global BA products have been extensively used for the analysis of fire activity, determining characteristics of fire regimes, such as average BA and temporal persistency (Abatzoglou et al. 2018), and spatial variations of BA trends (Andela et al. 2017). These trends are then related to the main drivers of fire, including climate changes and human activity. The analysis of agricultural fires is particularly challenging since they tend to be small and low intensity and are therefore difficult to map using standard remote sensing approaches. However, considering these cropland fires is important to better account for
- 178 -
atmospheric emissions, particularly in some regions where they have a relevant impact on air pollution (Wu et al. 2019)
A growing recent trend in remote sensing of fire effects is the use of BA products for parameterization of Dynamic Global Vegetation Models (DGVM). Most DGVM include a fire component, which tries to estimate the impact of fire over vegetation and soils (Lasslop et. al. 2018). These fire modules generally use stochastic processes to estimate fire ignition and standard fire propagation models to estimate BA (Hantson net al. 2016). Several studies have found a tendency towards underestimation of actual BA by these models (Kloster et al. 2017). For this reason, recent studies tried to improve them by better understanding the spatial variation of fire characteristics. The most analysed in the last few years are fire size, shape and orientation (Laurent et.al 2018). Once fire events have been individualized, several analyses can be conducted, such as fire –size distribution (Hantson et al. 2015) or relations between fire size and fire radiative power (Laurent et al. 2019). In addition, the use of BA products in DGVM requires a better characterization of product uncertainty, which is a novel field of research that requires further efforts (Brennan et al. 2019).
References:
Abatzoglou, J.T.; A.P. Williams, L. Boschetti, M. Zubkova and C.K. Kolden, 2018: C.A. Global patterns of interannual climate-fire relationships. Global Change Biology 2018, 24, 5164-5175. https://doi.org/10.1111/gcb.14405
Andela, N.; D.C. Morton, L. Giglio, Y. Chen, G.R. van der Werf, P.S. Kasibhatla, R.S. DeFries, G.J Collatz, S. Hantson, S. Kloster, D. Bachelet, M. Forrest, G. Lasslop, F. Li, S. Mangeon, J. R. Melton, C. Yue and J. T. Randerson, 2017: A human-driven decline in global burned area. Science 2017, 356, 1356-1362. https://dx.doi.org/10.1126%2Fscience.aal4108
Brennan, J.; J.L. Gomez-Dans, M. Disney, P. Lewis, 2019: Theoretical uncertainties for global satellite-derived burned area estimates. Biogeosciences, 16, 3147-3164. https://doi.org/10.5194/bg-16-3147-2019
Chuvieco, E.; J. Lizundia-Loiola, M.L. Pettinari, R. Ramo, M. Padilla, K. Tansey, F. Mouillot, P. Laurent, T. Storm, A. Heil and S. Plummer, 2018: Generation and analysis of a new global burned area product based on MODIS 250 m reflectance bands and thermal anomalies. Earth Systems Science Data, 10, 2015-2031. https://doi.org/10.5194/essd-10-2015-2018
Chuvieco, E.; F. Mouillot, G.R. van der Werf, J. San Miguel, M. Tanasse, N. Koutsias, M. García, M. Yebra, M. Padilla, I. Gitas, A. Heili, J. T. Hawbaker and L. Gigliok, 2019: Historical background and current developments for mapping burned area from satellite earth observation. Remote Sensing of the Environment, 225, 45-64. https://doi.org/10.1016/j.rse.2019.02.013
Giglio, L.; L. Boschetti, D.P. Roy, M.L. Humber and C.O. Justice, 2018: The collection 6 MODIS burned area mapping algorithm and product. Remote Sensing of the Environment, 217, 72-85. https://doi.org/10.1016/j.rse.2018.08.005
Hantson, S., G. Lasslop, S. Kloster and E. Chuvieco, 2015: Anthropogenic effects on global mean fire size. International Journal of Wildland Fire, 24, 589-596. https://doi.org/10.1071/WF14208
- 179 -
Hantson, S. A. Arneth, S.P. Harrison, D.I. Kelley, I.C. Prentice, S.S. Rabin, S. Archibald, F. Mouillot, S.R. Arnold and P. Artaxo, 2016: The status and challenge of global fire modelling. Biogeosciences, 13, 3359-3375. https://doi.org/10.5194/bg-13-3359-2016
Hawbaker, T.J.; M.K. Vanderhoof, Y-J. Beal, J.D. Takacs, G.L. Schmidt, J.T. Falgout, B. Williams, N.M. Fairaux, M.K. Caldwell and J.J. Picotte, 2017: Mapping burned areas using dense time-series of Landsat data. Remote Sensing of the Environment, 198, 504-522. https://doi.org/10.1016/j.rse.2017.06.027
Kloster, S.; G. Lasslop, Historical and future fire occurrence (1850 to 2100) simulated in cmip5 earth system models, 2017: Global and Planetary Change, 150, 58-69. https://doi.org/10.1016/j.gloplacha.2016.12.017
Lasslop, G.; A.I. Coppola, A. Voulgarakis, C. Yue, C.; S. Veraverbeke, Influence of fire on the carbon cycle and climate. Current Climate Change Reports, 2019: 5, 112-123. https://doi.org/10.5167/uzh-170518
Laurent, P.; F. Mouillot, C. Yue, P. Ciais, M.V. Moreno and J.M.P. Nogueira, 2018: FRY, a global database of fire patch functional traits derived from space-borne burned area products. Scientific Data, 5, 180132. https://doi.org/10.1038/sdata.2018.132
Laurent, P.; F. Mouillot, M.V. Moreno, C. Yue and P. Ciais, 2019: Varying relationships between fire radiative power and fire size at a global scale. Biogeosciences, 16, 275-288. https://doi.org/10.5194/bg-16-275-2019
Lizundia-Loiola, J., G. Otón, R. Ramo and E. Chuvieco, 2020: A spatio-temporal active-fire clustering approach for global burned area mapping at 250 m from MODIS data. Remote Sensing of the Environment, 236, 111493. https://doi.org/10.1016/j.rse.2019.111493
Otón, G.; R. Ramo, J. Lizundia-Loiola and E. Chuvieco,2019: Global detection of long-term (1982–2017) burned area with avhrr-ltdr data. Remote Sensing, 11, 2079, https://doi.org/10.3390/rs11182079
Roteta, E.; A. Bastarrika, T. Storm and E. Chuvieco, 2019: Development of a sentinel-2 burned area algorithm: Generation of a small fire database for northern hemisphere tropical Africa Remote Sensing of the Environment, 222, 1-17. https://doi.org/10.1016/j.rse.2018.12.011
Wu, J.; S.F. Kong, F.Q. Wu, Y. Cheng, S.R. Zheng, Q. Yan, H. Zheng, G.W. Yang, M.M. Zheng, D.T. Liu, D. Zhao and S. Qi, 2018: Estimating the open biomass burning emissions in central and eastern China from 2003 to 2015 based on satellite observation. Atmospheric Chemistry and Physics, 18, 11623-11646. https://doi.org/10.5194/acp-18-11623-2018
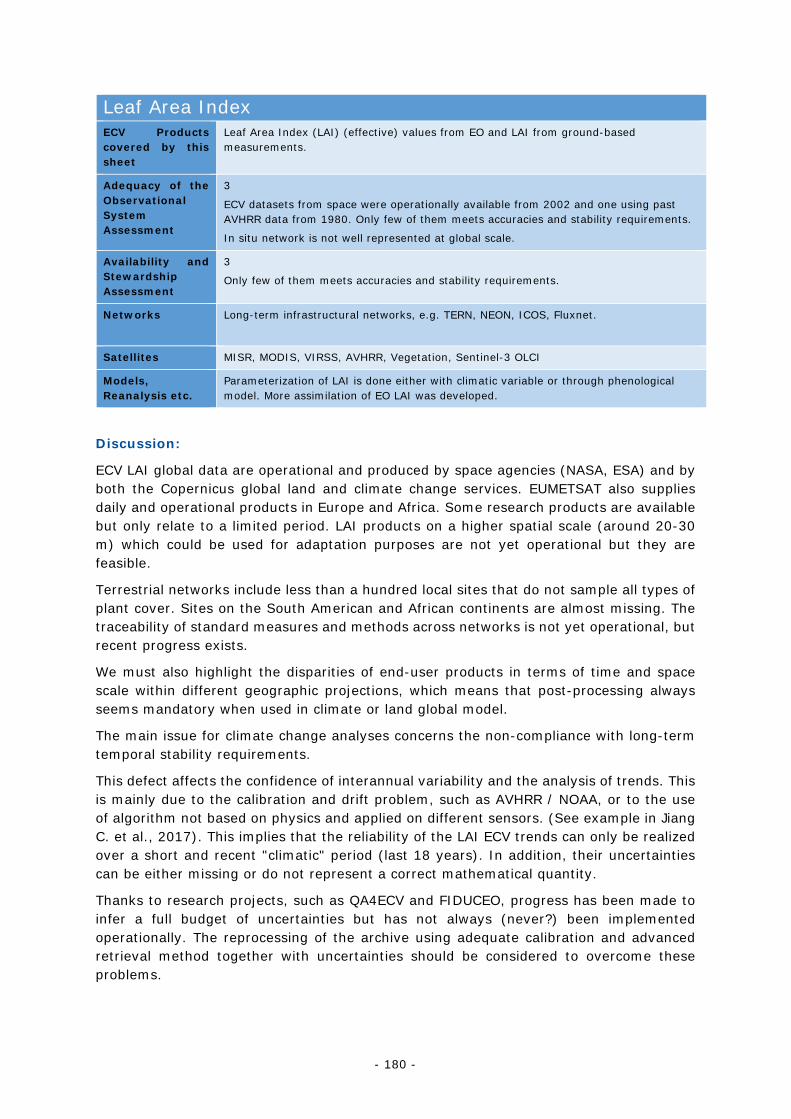
- 180 -
Leaf Area Index ECV Products covered by this sheet
Leaf Area Index (LAI) (effective) values from EO and LAI from ground-based measurements.
Adequacy of the Observational System Assessment
3
ECV datasets from space were operationally available from 2002 and one using past AVHRR data from 1980. Only few of them meets accuracies and stability requirements.
In situ network is not well represented at global scale.
Availability and Stewardship Assessment
3
Only few of them meets accuracies and stability requirements.
Networks Long-term infrastructural networks, e.g. TERN, NEON, ICOS, Fluxnet.
Satellites MISR, MODIS, VIRSS, AVHRR, Vegetation, Sentinel-3 OLCI
Models, Reanalysis etc.
Parameterization of LAI is done either with climatic variable or through phenological model. More assimilation of EO LAI was developed.
Discussion:
ECV LAI global data are operational and produced by space agencies (NASA, ESA) and by both the Copernicus global land and climate change services. EUMETSAT also supplies daily and operational products in Europe and Africa. Some research products are available but only relate to a limited period. LAI products on a higher spatial scale (around 20-30 m) which could be used for adaptation purposes are not yet operational but they are feasible.
Terrestrial networks include less than a hundred local sites that do not sample all types of plant cover. Sites on the South American and African continents are almost missing. The traceability of standard measures and methods across networks is not yet operational, but recent progress exists.
We must also highlight the disparities of end-user products in terms of time and space scale within different geographic projections, which means that post-processing always seems mandatory when used in climate or land global model.
The main issue for climate change analyses concerns the non-compliance with long-term temporal stability requirements.
This defect affects the confidence of interannual variability and the analysis of trends. This is mainly due to the calibration and drift problem, such as AVHRR / NOAA, or to the use of algorithm not based on physics and applied on different sensors. (See example in Jiang C. et al., 2017). This implies that the reliability of the LAI ECV trends can only be realized over a short and recent "climatic" period (last 18 years). In addition, their uncertainties can be either missing or do not represent a correct mathematical quantity.
Thanks to research projects, such as QA4ECV and FIDUCEO, progress has been made to infer a full budget of uncertainties but has not always (never?) been implemented operationally. The reprocessing of the archive using adequate calibration and advanced retrieval method together with uncertainties should be considered to overcome these problems.
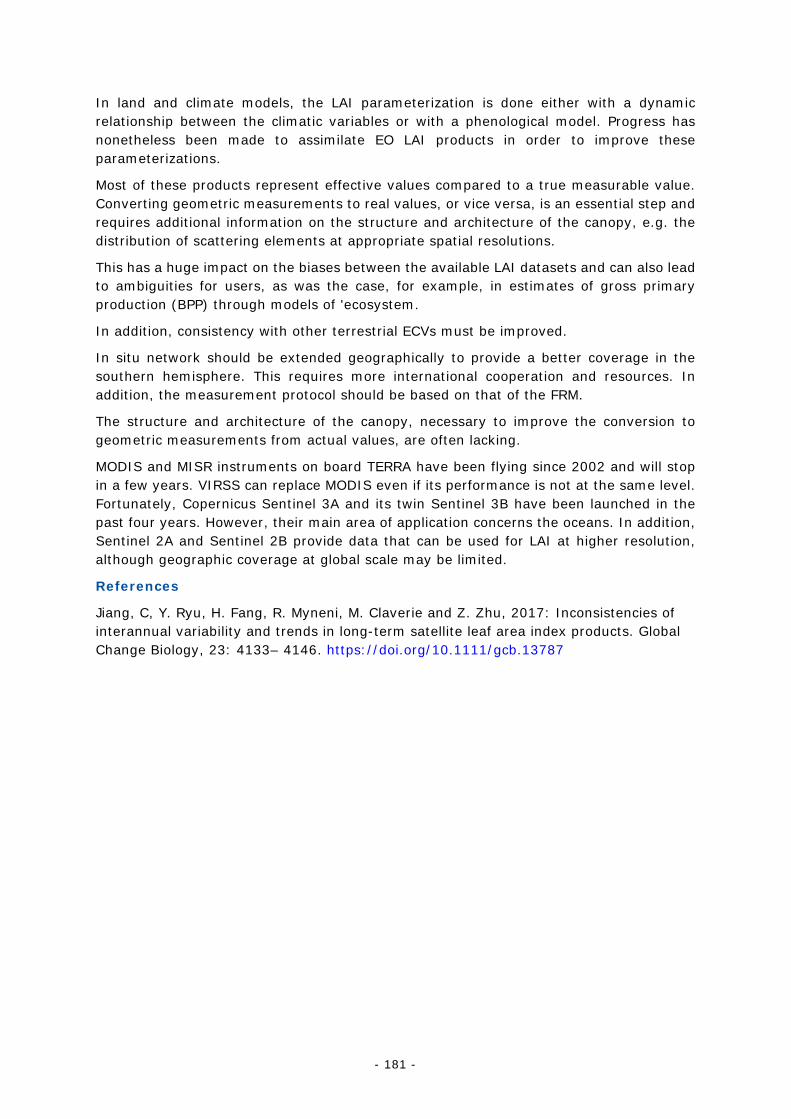
- 181 -
In land and climate models, the LAI parameterization is done either with a dynamic relationship between the climatic variables or with a phenological model. Progress has nonetheless been made to assimilate EO LAI products in order to improve these parameterizations.
Most of these products represent effective values compared to a true measurable value. Converting geometric measurements to real values, or vice versa, is an essential step and requires additional information on the structure and architecture of the canopy, e.g. the distribution of scattering elements at appropriate spatial resolutions.
This has a huge impact on the biases between the available LAI datasets and can also lead to ambiguities for users, as was the case, for example, in estimates of gross primary production (BPP) through models of 'ecosystem.
In addition, consistency with other terrestrial ECVs must be improved.
In situ network should be extended geographically to provide a better coverage in the southern hemisphere. This requires more international cooperation and resources. In addition, the measurement protocol should be based on that of the FRM.
The structure and architecture of the canopy, necessary to improve the conversion to geometric measurements from actual values, are often lacking.
MODIS and MISR instruments on board TERRA have been flying since 2002 and will stop in a few years. VIRSS can replace MODIS even if its performance is not at the same level. Fortunately, Copernicus Sentinel 3A and its twin Sentinel 3B have been launched in the past four years. However, their main area of application concerns the oceans. In addition, Sentinel 2A and Sentinel 2B provide data that can be used for LAI at higher resolution, although geographic coverage at global scale may be limited.
References
Jiang, C, Y. Ryu, H. Fang, R. Myneni, M. Claverie and Z. Zhu, 2017: Inconsistencies of interannual variability and trends in long-term satellite leaf area index products. Global Change Biology, 23: 4133– 4146. https://doi.org/10.1111/gcb.13787
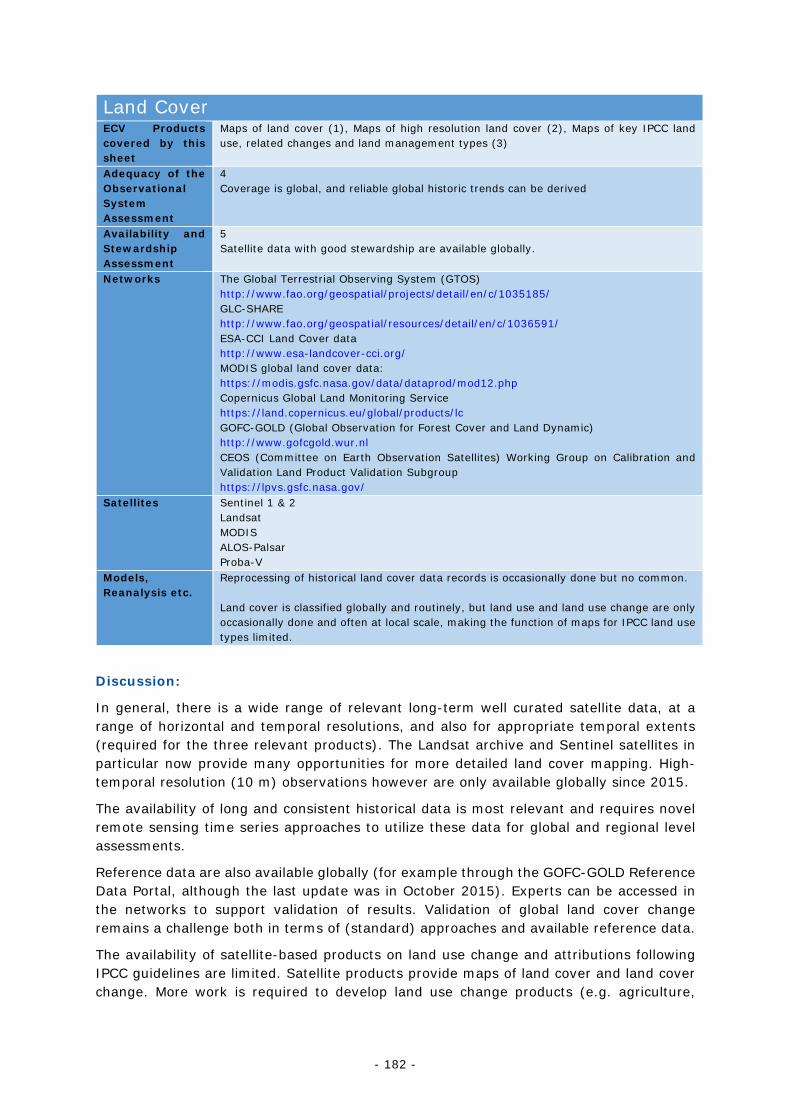
- 182 -
Land Cover ECV Products covered by this sheet
Maps of land cover (1), Maps of high resolution land cover (2), Maps of key IPCC land use, related changes and land management types (3)
Adequacy of the Observational System Assessment
4 Coverage is global, and reliable global historic trends can be derived
Availability and Stewardship Assessment
5 Satellite data with good stewardship are available globally.
Networks The Global Terrestrial Observing System (GTOS) http://www.fao.org/geospatial/projects/detail/en/c/1035185/ GLC-SHARE http://www.fao.org/geospatial/resources/detail/en/c/1036591/ ESA-CCI Land Cover data http://www.esa-landcover-cci.org/ MODIS global land cover data: https://modis.gsfc.nasa.gov/data/dataprod/mod12.php Copernicus Global Land Monitoring Service https://land.copernicus.eu/global/products/lc GOFC-GOLD (Global Observation for Forest Cover and Land Dynamic) http://www.gofcgold.wur.nl CEOS (Committee on Earth Observation Satellites) Working Group on Calibration and Validation Land Product Validation Subgroup https://lpvs.gsfc.nasa.gov/
Satellites Sentinel 1 & 2 Landsat MODIS ALOS-Palsar Proba-V
Models, Reanalysis etc.
Reprocessing of historical land cover data records is occasionally done but no common. Land cover is classified globally and routinely, but land use and land use change are only occasionally done and often at local scale, making the function of maps for IPCC land use types limited.
Discussion:
In general, there is a wide range of relevant long-term well curated satellite data, at a range of horizontal and temporal resolutions, and also for appropriate temporal extents (required for the three relevant products). The Landsat archive and Sentinel satellites in particular now provide many opportunities for more detailed land cover mapping. High-temporal resolution (10 m) observations however are only available globally since 2015.
The availability of long and consistent historical data is most relevant and requires novel remote sensing time series approaches to utilize these data for global and regional level assessments.
Reference data are also available globally (for example through the GOFC-GOLD Reference Data Portal, although the last update was in October 2015). Experts can be accessed in the networks to support validation of results. Validation of global land cover change remains a challenge both in terms of (standard) approaches and available reference data.
The availability of satellite-based products on land use change and attributions following IPCC guidelines are limited. Satellite products provide maps of land cover and land cover change. More work is required to develop land use change products (e.g. agriculture,
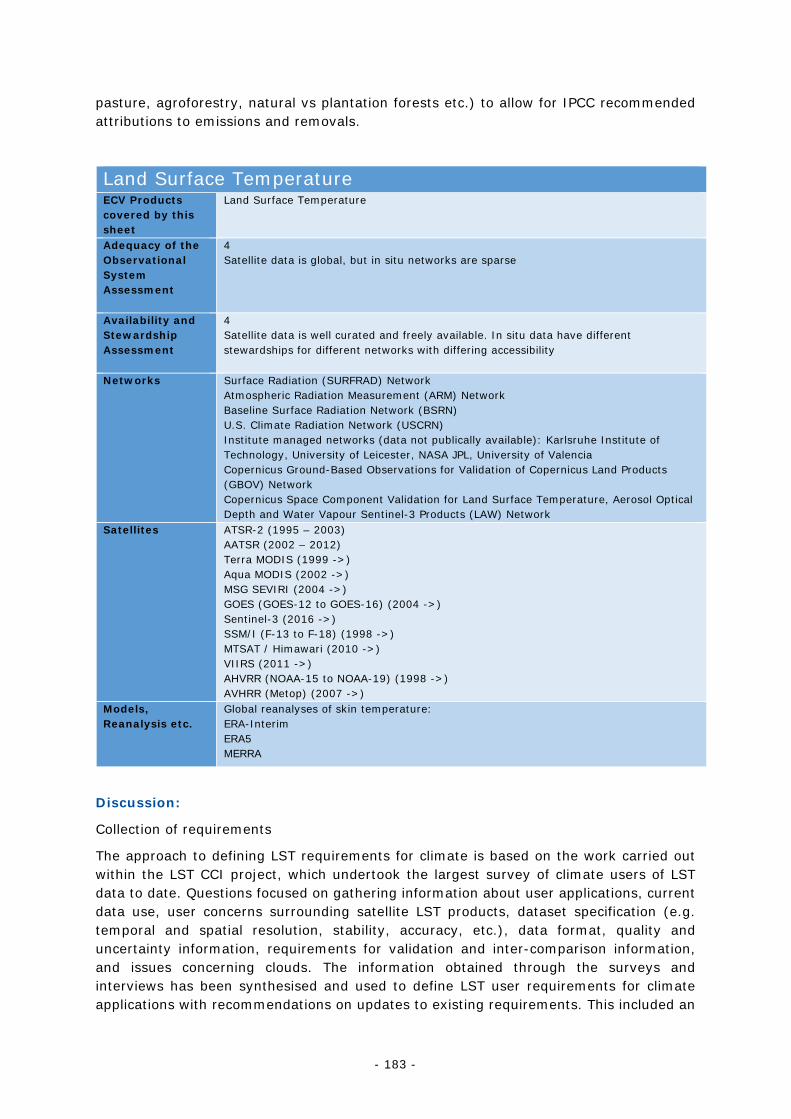
- 183 -
pasture, agroforestry, natural vs plantation forests etc.) to allow for IPCC recommended attributions to emissions and removals.
Land Surface Temperature ECV Products covered by this sheet
Land Surface Temperature
Adequacy of the Observational System Assessment
4 Satellite data is global, but in situ networks are sparse
Availability and Stewardship Assessment
4 Satellite data is well curated and freely available. In situ data have different stewardships for different networks with differing accessibility
Networks Surface Radiation (SURFRAD) Network Atmospheric Radiation Measurement (ARM) Network Baseline Surface Radiation Network (BSRN) U.S. Climate Radiation Network (USCRN) Institute managed networks (data not publically available): Karlsruhe Institute of Technology, University of Leicester, NASA JPL, University of Valencia Copernicus Ground-Based Observations for Validation of Copernicus Land Products (GBOV) Network Copernicus Space Component Validation for Land Surface Temperature, Aerosol Optical Depth and Water Vapour Sentinel-3 Products (LAW) Network
Satellites ATSR-2 (1995 – 2003) AATSR (2002 – 2012) Terra MODIS (1999 ->) Aqua MODIS (2002 ->) MSG SEVIRI (2004 ->) GOES (GOES-12 to GOES-16) (2004 ->) Sentinel-3 (2016 ->) SSM/I (F-13 to F-18) (1998 ->) MTSAT / Himawari (2010 ->) VIIRS (2011 ->) AHVRR (NOAA-15 to NOAA-19) (1998 ->) AVHRR (Metop) (2007 ->)
Models, Reanalysis etc.
Global reanalyses of skin temperature: ERA-Interim ERA5 MERRA
Discussion:
Collection of requirements
The approach to defining LST requirements for climate is based on the work carried out within the LST CCI project, which undertook the largest survey of climate users of LST data to date. Questions focused on gathering information about user applications, current data use, user concerns surrounding satellite LST products, dataset specification (e.g. temporal and spatial resolution, stability, accuracy, etc.), data format, quality and uncertainty information, requirements for validation and inter-comparison information, and issues concerning clouds. The information obtained through the surveys and interviews has been synthesised and used to define LST user requirements for climate applications with recommendations on updates to existing requirements. This included an
- 184 -
evaluation of requirements for the parameters specified in the GCOS Implementation Plan: LST spatial and temporal resolution, data set length, accuracy, precision and stability. In addition qualitative user consensus on requirements for spatial domain, observation times, temporal and spatial resolution, dataset length, accuracy, precision and stability are:
● LST data should be provided globally ● Observations should be provided at all times of day ● . User priorities for dataset specification are:
o High quality data more important than spatially complete fields o High temporal resolution more important for global studies, whilst high
spatial resolution is more important for local studies o Dataset length is more important for global studies, whilst high data
resolution is more important for local studies Adequacy/inadequacy of current holdings
Single-sensor Infrared (IR) LST data-products from satellite have greatly improved:
● High accuracy of IR LST data – validation shows majority of biases < 1.0 K from MODIS, AATSR, Sentinel-3, and VIIRS, with high accuracy of emissivity <0.015 (1.5%) available from MODIS, ASTER, and VIIRS products.
● Full- pixel uncertainty budgets from first principles categorised by effects whose errors have distinct correlation properties: random, locally-correlated and (large-scale) systematic following a consistent approach with the SST community; these are applicable to all processing levels and products
● Advances in cloud detection (dynamic probabilistic and confidence-level approaches)
● Global LST data which resolve the diurnal cycle becoming available ● Merged geostationary (GEO) and low earth orbit (LEO) data sets are for the first
time giving high spatial resolution, sub-diurnal sampling.: ● Inter-calibrated merged GEO (SEVIRI, GOES, MTSAT) and merged LEO (ATSR,
MODIS, AVHRR) being produced at 3- hourly resolution Quantification of the infrared LST clear-sky bias by using microwave LST measurements
Improved validation protocols are being applied to LST data:
● Community- driven standardised LST validation protocol from CEOS LPV using both temperature- and radiance-based methods being applied across several existing and proposed for new projects.
● Accurate and highly highly-stable in situ instruments, with documented calibration at dedicated sites
● Validation of LST uncertainty in line with SST approaches ● Increasing confidence in traceability and stability of LST: ● LEO IR time series length being increased with ATSR back to 1991 ● LEO IR time series length being increased with AVHRR back to 1991 and potentially
back to 1981 ● GEO IR time series length being increased with Meteosat-MVIRI back to 1983 ● Microwave (MW) time series length being increased with SSM/I back to 1998 ● Quantitative assessments of biases between consecutive instruments such as
ATSR-2/AATSR and MODIS/VIIRS. Satellite instruments and satellite datasets
- 185 -
● Fundamental Climate Data Records (FCDRs) of appropriate TIR and microwave imagery (top-of-atmosphere radiances), as a basis for LST CDRs, with appropriate global and diurnal coverage.
● Sustained IR and microwave sensors, capable of supporting climate accuracy global LST analyses.
● Geostationary Earth Orbit (GEO) platforms, which allow regional coverage and high temporal resolution and therefore frequent observations under clear-sky conditions to resolve the diurnal cycle, since surface temperature changes significantly over periods ranging from hours to years and beyond
● Low Earth Orbit (LEO) satellites, which can provide observations for all regions up to twice- daily, acquire data for more or less narrow swaths during each orbit. These platforms are able to deliver sub-daily observations over the high latitudes thereby resolving the diurnal cycle for clear-sky over these regions
● High-accuracy and high temporal stability observations, which merge together LST coverage by LEO and GEO instruments in the IR to provide diurnal and high high-spatial spatial-resolution capability, and microwave observations to understand the clear-sky bias and to deliver all-sky datasets
● FCDR generation capabilities which are independent from in situ measurements and are consistently applicable to different satellite instruments which observe LST, involving such measures as inter-instrument harmonisation of brightness temperatures, detailed uncertainty analysis, aerosol detection and assessment of stability (older AVHRR data being reprocessed to guarantee consistency with MODIS, and (A)ATSR and VIIRS-derived LST)
● Instrument calibration involving prelaunch characterization, on-board calibration, and in-orbit calibration campaigns. This is important also to allow inter-calibration of data retrieved from different sensors and platforms before being merged
● Reprocessing of archives of LEO and GEO LST observations in a consistent manner to community agreed data formats
● Assessment of FCDR maturity with respect to the system maturity matrices; and to include full metadata traceability for improved data provenance
● Production of long-term, stable data sets free from non-climatic artefacts. In situ validation and data archiving:
● The objective of validation and inter-comparison is to provide an assessment of the quality of LST products and assessments of instrument stability including current data from operations as well as long- term datasets from archives. Such an assessment is of utmost importance for the acceptance by the user community
● Validation and inter-comparison should follow a clear and transparent protocol for assessing the various LST data sets
● A comparison against in situ data is generally regarded as the most accurate and reliable LST validation technique. However, this is the most resource-demanding method requiring utmost care in determining accurate LST over sufficiently representative sites, and ensuring radiometers are well-calibrated, and appropriate understanding of the mismatch in spatial scale between the point-level in situ observations and the satellite LST pixels
● The in situ network of permanent high quality IR radiometers for dedicated LST validation is being expanded, but still need to work with in situ data providers to ensure validation data is collected according to set guidelines and is publicly available to the research community.
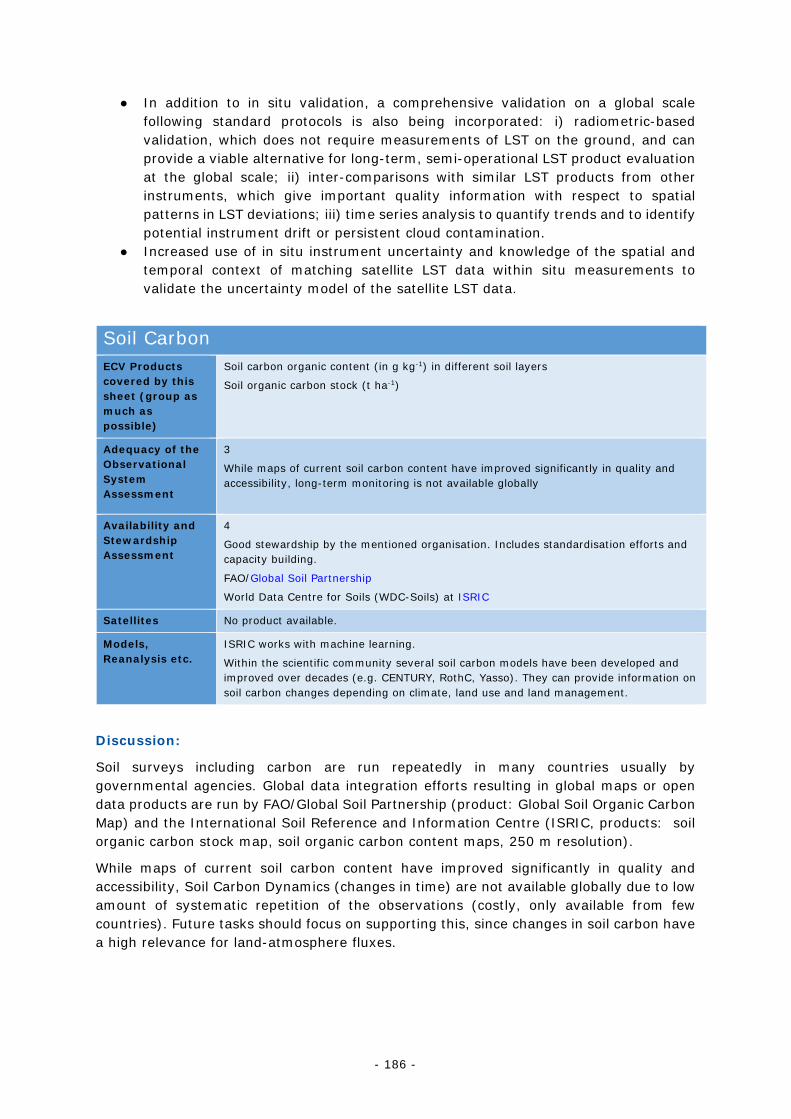
- 186 -
● In addition to in situ validation, a comprehensive validation on a global scale following standard protocols is also being incorporated: i) radiometric-based validation, which does not require measurements of LST on the ground, and can provide a viable alternative for long-term, semi-operational LST product evaluation at the global scale; ii) inter-comparisons with similar LST products from other instruments, which give important quality information with respect to spatial patterns in LST deviations; iii) time series analysis to quantify trends and to identify potential instrument drift or persistent cloud contamination.
● Increased use of in situ instrument uncertainty and knowledge of the spatial and temporal context of matching satellite LST data within situ measurements to validate the uncertainty model of the satellite LST data.
Soil Carbon ECV Products covered by this sheet (group as much as possible)
Soil carbon organic content (in g kg-1) in different soil layers
Soil organic carbon stock (t ha-1)
Adequacy of the Observational System Assessment
3
While maps of current soil carbon content have improved significantly in quality and accessibility, long-term monitoring is not available globally
Availability and Stewardship Assessment
4
Good stewardship by the mentioned organisation. Includes standardisation efforts and capacity building.
FAO/Global Soil Partnership
World Data Centre for Soils (WDC-Soils) at ISRIC
Satellites No product available.
Models, Reanalysis etc.
ISRIC works with machine learning.
Within the scientific community several soil carbon models have been developed and improved over decades (e.g. CENTURY, RothC, Yasso). They can provide information on soil carbon changes depending on climate, land use and land management.
Discussion:
Soil surveys including carbon are run repeatedly in many countries usually by governmental agencies. Global data integration efforts resulting in global maps or open data products are run by FAO/Global Soil Partnership (product: Global Soil Organic Carbon Map) and the International Soil Reference and Information Centre (ISRIC, products: soil organic carbon stock map, soil organic carbon content maps, 250 m resolution).
While maps of current soil carbon content have improved significantly in quality and accessibility, Soil Carbon Dynamics (changes in time) are not available globally due to low amount of systematic repetition of the observations (costly, only available from few countries). Future tasks should focus on supporting this, since changes in soil carbon have a high relevance for land-atmosphere fluxes.
- 187 -
A.c.iv Anthropogenic
Anthropogenic Water Use ECV Products covered by this sheet
Terrestrial water use for household, industry, livestock and irrigation
Adequacy of the Observational System Assessment
2
In situ coverage for most nations of annual data, but not for every year or for every relevant variable.
Availability and Stewardship Assessment
4
Good availability and well-curated data at the FAO level; more varied stewardship and availability at individual country level.
Networks Data at the national level (200 countries) provided to the United Nations Food and Agriculture Organisation who then publish at
http://www.fao.org/nr/water/aquastat/data/query/index.html?lang=en
Satellites Not applicable
Models, Reanalysis etc.
Not applicable
Discussion:
This is a data set that is dependent on in-country tabulations of a range of anthropogenic water use statistics that are then provided to the UN Food and Agriculture Organisation (FAO) for uploading to their AQUASTAT database/website. The quality of data is therefore highly dependent on in-country collection from a range of sources and quality control that is highly variable across the 200 contributing countries. The FAO website is well organised and compiled with clear attempts to homogenise the data. Depending on the variable, some annual data are available from ~1960, but often for data in the last year of five-year blocks.
This data set does not lend itself to automated, satellite or modelling so is unlikely to evolve much more than its current form.
- 188 -
Anthropogenic greenhouse-gas fluxes ECV Products covered by this sheet
National annual CO2, CH4 and N2O emission inventory time series and their uncertainty per sector and covariance matrix; also disaggregated spatially (e.g. to 0.1degx0.1deg) and temporally (monthly, daily, hourly) and their gridmap uncertainties
Adequacy of the Observational System Assessment
2
Considerable differences between bottom up (inventory based) and top down (atmospheric inversion based) are still not well explained
Availability and Stewardship Assessment
3
Emissions estimates are available but without a data centre or data stewardship.
Networks For CO2 and CH4: TCCON, COCCON,
For CO2 and CH4 and N2O: ICOS
Ref: https://www.copernicus.eu/sites/default/files/2019-09/CO2_Green_Report_2019.pdf
Satellites For CO2: GOSAT2, OCO-2, and in the future OCO-3, GOSAT3, and CO2M Sentinel
For CH4: GOSAT2, Sentinel 5P, and in the future GOSAT3, CO2M Sentinel
Ref: http://ceos.org/document_management/Virtual_Constellations/ACC/Documents/CEOS_AC-VC_GHG_White_Paper_Publication_Draft2_20181111.pdf
Models, Reanalysis etc.
e.g. Ensemble models of the Copernicus Atmospheric Monitoring Service (incl. IFS model of ECMWF)
Discussion:
Estimates of anthropogenic global greenhouse gas (GHG) emissions have a number of issues with considerable differences between bottom up (inventory based) and top down (atmospheric inversion based, see Balsamo et al. 2018) still not well explained. In particular regions which are poorly equipped with in situ stations or which are subject to less well-managed land-use changes or less well confined (less well characterised or less well regulated) human activities (e.g. exploratory drilling, shale gas fracking, waste incineration or disposal) could benefit from additional in situ measurements (Pinty et al., 2019). The space borne observations (e.g. GOSAT2 or OCO-2) do provide useful and reliable information and spotted emission sources which were neglected or missing (e.g. fugitive CH4 emissions from coal mines, which are now taken up in the 2019 Refinement of the IPCC 2006 guidelines for national emission; the Indian coal power plant missing in the CARMA database) and CEOS is working towards a better constellation architecture (Crisp et al., 2018, CEOS 2018) to produce datasets for users, atmospheric modellers, national inventory compilers, policymakers, citizens. A fair and transparent monitoring of the nationally determined contributions to GHG reductions which the UN Parties have to report under the enhanced transparency framework of the Paris Agreement could benefit of observation-based evidence when discrepancies arise in reviews or stock takes (such as the biennial Facilitative Multilateral Consideration of Progress and the five-yearly Global Stock Take).
Given better coverage, the observational system can provide evidence for the level of GHGs in the atmosphere and its trends, in particular supporting the monitoring of the desired GHG emission reductions, which is pursued with the Copernicus CO2 Monitoring system (Janssens-Maenhout et al., 2020). However, it will not replace national inventories with disaggregated sector-specific information, but it can complement these with very
- 189 -
valuable information, in particular on those emissions of activities with human-nature interactions and feedbacks, such as the agriculture, forestry, other land-use (AFOLU) sector. The AFOLU sector is still showing the largest uncertainties in the national inventories and will need to provide a sink for the remaining emissions that cannot be cut to zero.
Moreover, the extra spatially disaggregated information of the observational system will allow for identifying emission hotspots, displacements or accidental releases, which need to be under control. We call for the provision of emission gridmaps in addition to the national annual inventories because they support the tracking of GHG reduction actions, which take place at local level. Also the higher temporal resolution of the observational system allows for a more efficient follow-up and action in those regions where derailing is monitored or where a green recovery should be planned (in particular after a disruptive event such as COVID-19, as indicated by Le Quéré, 2020). Of course, the large variability in the spatially and temporally disaggregated information needs an assessment with robust uncertainties. However, visualisation of the problem with near-real time maps might be part of the climate change solution.
References:
Balsamo, G., A. Agusti-Panareda, C. Albergel, G. Arduini, A. Beljaars, J. Bidlot, E. Blyth, N. Bousserez, S. Boussetta, A. Brown, R. Buizza, C. Buontempo, F. Chevallier, M. Choulga, H. Cloke, M.F. Cronin, M. Dahoui, P. De Rosnay, P.A. Dirmeyer, M. Drusch, E. Dutra, M.B. Ek, P. Gentine, H. Hewitt, S.P.E. Keeley, Y. Kerr, S. Kumar, C. Lupu, J-F. Mahfouf, J. McNorton, S. Mecklenburg, K. Mogensen, J. Muñoz-Sabater, R. Orth, F. Rabier, R. Reichle, B. Ruston, F. Pappenberger, I. Sandu, S.I. Seneviratne, S. Tietsche, I.F. Trigo, R. Uijlenhoet, N. Wedi, R.I. Woolway and X. Zeng, 2018: Satellite and In Situ Observations for Advancing Global Earth Surface Modelling: A Review. Remote Sensing, 10, 2038. https://doi.org/10.3390/rs10122038
CEOS (2018), A constellation architecture for monitoring carbon dioxide and methane from space, White paper of the CEOS Atmospheric Composition Virtual Constellation Greenhouse Gas Team, 173 pp., http://ceos.org/document_management/Virtual_Constellations/ACC/Documents/CEOS_AC-VC_GHG_White_Paper_Version_1_20181009.pdf
Janssens-Maenhout, G., B. Pinty, M. Dowell, H. Zunker, E. Andersson, G. Balsamo, J.-L. Bézy, T. Brunhes, H. Bösch, B. Bojkov, D. M. BrunnerBuchwitz, D. Crisp, P. Ciais, C P. Counet, D. Dee, H. Denier van der Gon, H. Dolman, M.R. Drinkwater, O. Dubovik, R. Engelen, T. Fehr, V. Fernandez, M. Heimann, K. Holmlund, S. Houweling, R. Husband, O. Juvyns, A. Kentarchos, J. Landgraf, R. Lang, A. Löscher, J. Marshall, Y. Meijer, M. Nakajima, P.I. Palmer, P. Peylin, P. Rayner, M. Scholze, B. Sierk, J. Tamminen and J.P. Veefkind, 2020: Toward an Operational Anthropogenic CO2 Emissions Monitoring and Verification Support Capacity, Bulletin of the American Meteorological Society, 101(8), E1439-E1451. Retrieved Jun 28, 2021, from https://doi.org/10.1175/BAMS-D-19-0017.1
Pinty, B., P. Ciais, D. Dee, A. Dolman, M. Dowell, R. Engelen, K. Holmlund, G. Janssens-Maenhout, Y. Meijer, P. Palmer, M. Scholze, H. Denier Van Der Gon, M. Heimann, O. Juvyns, A, Kentarchos and H. Zunker, 2019: CO2: An operational anthropogenic CO2 emissions monitoring and verification support capacity, EUR 29817 EN, Publications Office of the European Union, Luxembourg, ISBN 978-92-76-09004-5, doi:10.2760/182790, JRC117323
- 190 -
Le Quéré C., R.B. Jackson, M.W. Jones, A.J.P. Smith, S. Abernethy, R.M. Andrew, A.J. De-Gol, D.R. Willis, Y. Shan, J.G. Canadell, P. Friedlingstein, F. Creutzig and G.P. Peters, 2020: Temporary reduction in daily global CO2 emissions during the COVID-19 forced confinement Nature Climate Change volume 10, pages 647–653 (2020) https://doi.org/10.1038/s41558-020-0797-x
UNFCCC (2017) Report of the Subsidiary Body for Scientific and Technological Advice on its forty-seventh session, held in Bonn from 6 to 15 November 2017 UNFCCC/SBSTA/2017/7

- 191 -
ANNEX B : ASSESSMENT OF PROGRESS ON IMPLEMENTATION PLAN ACTIONS
- 192 -
TABLE OF CONTENTS: ANNEX B
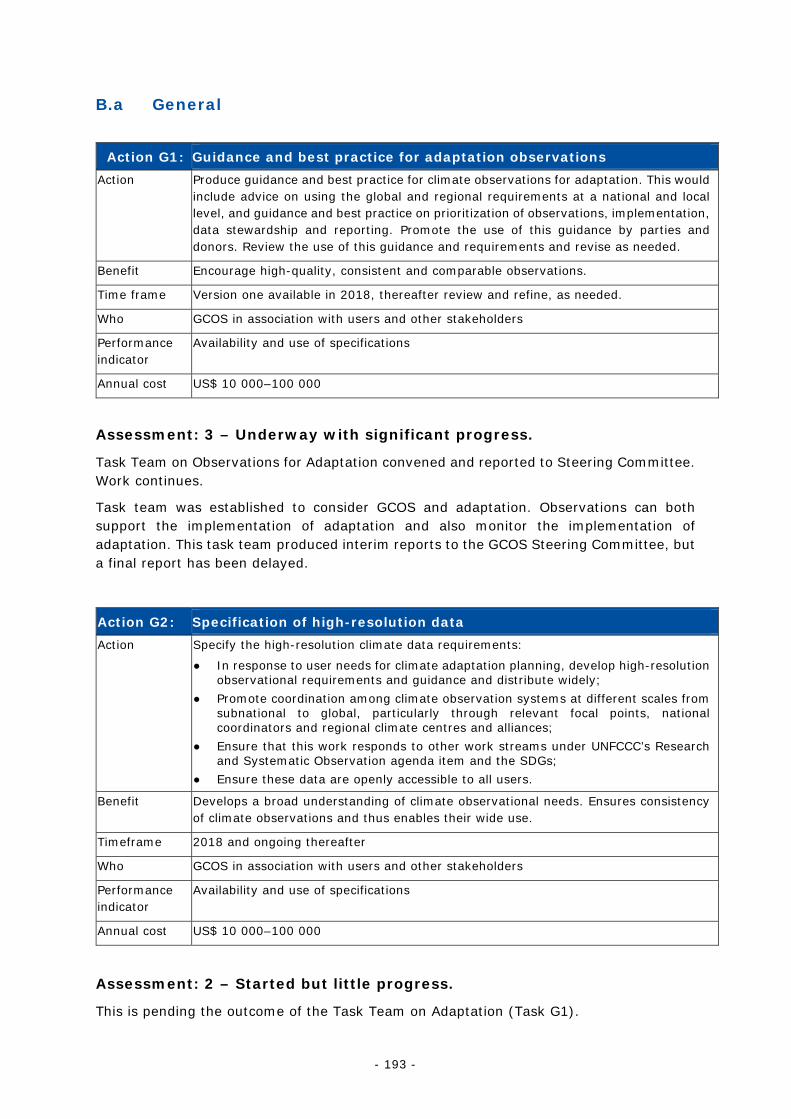
- 193 -
B.a General
Assessment: 3 – Underway with significant progress.
Task Team on Observations for Adaptation convened and reported to Steering Committee. Work continues.
Task team was established to consider GCOS and adaptation. Observations can both support the implementation of adaptation and also monitor the implementation of adaptation. This task team produced interim reports to the GCOS Steering Committee, but a final report has been delayed.
Action G2: Specification of high-resolution data Action Specify the high-resolution climate data requirements:
● In response to user needs for climate adaptation planning, develop high-resolution observational requirements and guidance and distribute widely;
● Promote coordination among climate observation systems at different scales from subnational to global, particularly through relevant focal points, national coordinators and regional climate centres and alliances;
● Ensure that this work responds to other work streams under UNFCCC’s Research and Systematic Observation agenda item and the SDGs;
● Ensure these data are openly accessible to all users.
Benefit Develops a broad understanding of climate observational needs. Ensures consistency of climate observations and thus enables their wide use.
Timeframe 2018 and ongoing thereafter
Who GCOS in association with users and other stakeholders
Performance indicator
Availability and use of specifications
Annual cost US$ 10 000–100 000
Assessment: 2 – Started but little progress.
This is pending the outcome of the Task Team on Adaptation (Task G1).
Action G1: Guidance and best practice for adaptation observations Action Produce guidance and best practice for climate observations for adaptation. This would
include advice on using the global and regional requirements at a national and local level, and guidance and best practice on prioritization of observations, implementation, data stewardship and reporting. Promote the use of this guidance by parties and donors. Review the use of this guidance and requirements and revise as needed.
Benefit Encourage high-quality, consistent and comparable observations.
Time frame Version one available in 2018, thereafter review and refine, as needed.
Who GCOS in association with users and other stakeholders
Performance indicator
Availability and use of specifications
Annual cost US$ 10 000–100 000
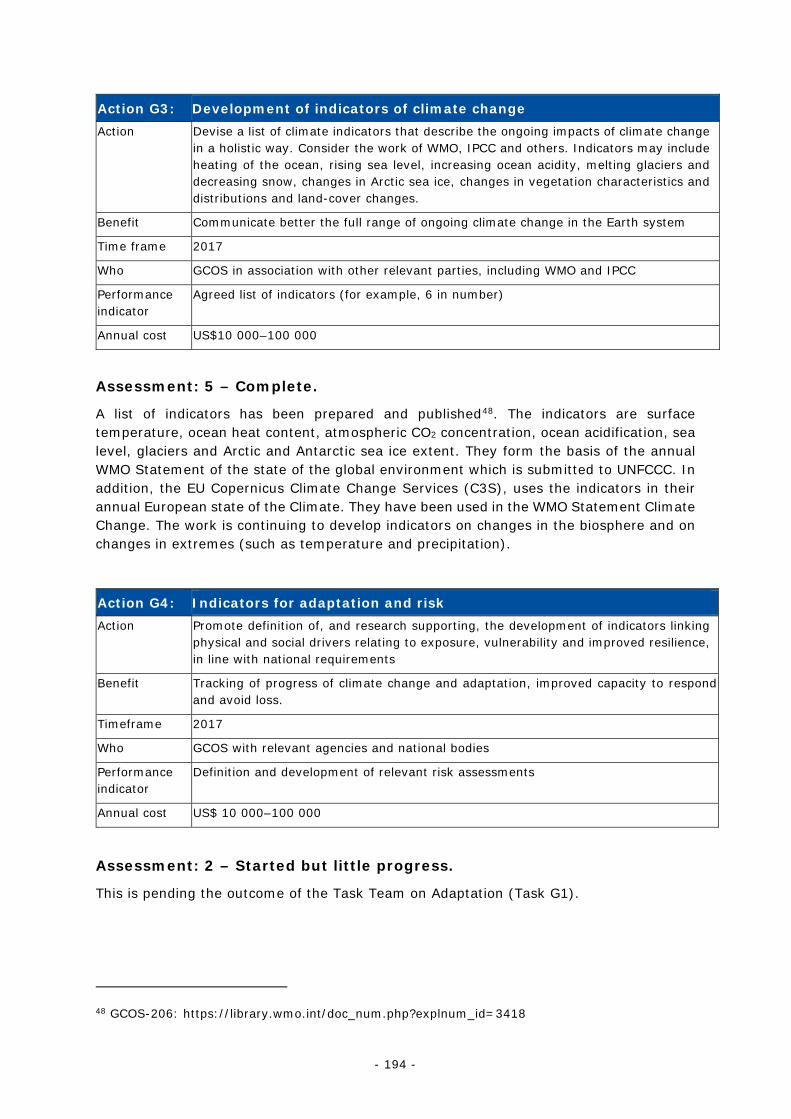
- 194 -
Action G3: Development of indicators of climate change Action Devise a list of climate indicators that describe the ongoing impacts of climate change
in a holistic way. Consider the work of WMO, IPCC and others. Indicators may include heating of the ocean, rising sea level, increasing ocean acidity, melting glaciers and decreasing snow, changes in Arctic sea ice, changes in vegetation characteristics and distributions and land-cover changes.
Benefit Communicate better the full range of ongoing climate change in the Earth system
Time frame 2017
Who GCOS in association with other relevant parties, including WMO and IPCC
Performance indicator
Agreed list of indicators (for example, 6 in number)
Annual cost US$10 000–100 000
Assessment: 5 – Complete.
A list of indicators has been prepared and published48. The indicators are surface temperature, ocean heat content, atmospheric CO2 concentration, ocean acidification, sea level, glaciers and Arctic and Antarctic sea ice extent. They form the basis of the annual WMO Statement of the state of the global environment which is submitted to UNFCCC. In addition, the EU Copernicus Climate Change Services (C3S), uses the indicators in their annual European state of the Climate. They have been used in the WMO Statement Climate Change. The work is continuing to develop indicators on changes in the biosphere and on changes in extremes (such as temperature and precipitation).
Action G4: Indicators for adaptation and risk Action Promote definition of, and research supporting, the development of indicators linking
physical and social drivers relating to exposure, vulnerability and improved resilience, in line with national requirements
Benefit Tracking of progress of climate change and adaptation, improved capacity to respond and avoid loss.
Timeframe 2017
Who GCOS with relevant agencies and national bodies
Performance indicator
Definition and development of relevant risk assessments
Annual cost US$ 10 000–100 000
Assessment: 2 – Started but little progress.
This is pending the outcome of the Task Team on Adaptation (Task G1).
48 GCOS-206: https://library.wmo.int/doc_num.php?explnum_id=3418
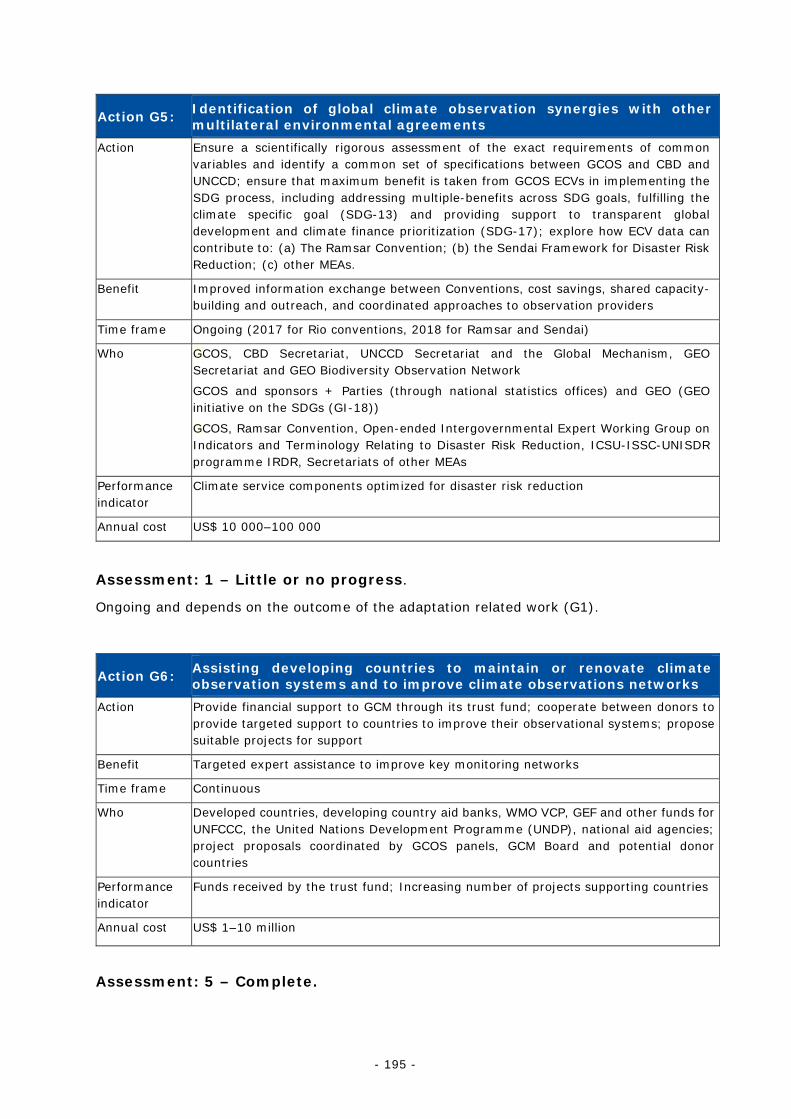
- 195 -
Action G5: Identification of global climate observation synergies with other multilateral environmental agreements
Action
Ensure a scientifically rigorous assessment of the exact requirements of common variables and identify a common set of specifications between GCOS and CBD and UNCCD; ensure that maximum benefit is taken from GCOS ECVs in implementing the SDG process, including addressing multiple-benefits across SDG goals, fulfilling the climate specific goal (SDG-13) and providing support to transparent global development and climate finance prioritization (SDG-17); explore how ECV data can contribute to: (a) The Ramsar Convention; (b) the Sendai Framework for Disaster Risk Reduction; (c) other MEAs.
Benefit Improved information exchange between Conventions, cost savings, shared capacity-building and outreach, and coordinated approaches to observation providers
Time frame Ongoing (2017 for Rio conventions, 2018 for Ramsar and Sendai)
Who GCOS, CBD Secretariat, UNCCD Secretariat and the Global Mechanism, GEO Secretariat and GEO Biodiversity Observation Network
GCOS and sponsors + Parties (through national statistics offices) and GEO (GEO initiative on the SDGs (GI-18))
GCOS, Ramsar Convention, Open-ended Intergovernmental Expert Working Group on Indicators and Terminology Relating to Disaster Risk Reduction, ICSU-ISSC-UNISDR programme IRDR, Secretariats of other MEAs
Performance indicator
Climate service components optimized for disaster risk reduction
Annual cost US$ 10 000–100 000
Assessment: 1 – Little or no progress.
Ongoing and depends on the outcome of the adaptation related work (G1).
Action G6: Assisting developing countries to maintain or renovate climate observation systems and to improve climate observations networks
Action
Provide financial support to GCM through its trust fund; cooperate between donors to provide targeted support to countries to improve their observational systems; propose suitable projects for support
Benefit Targeted expert assistance to improve key monitoring networks
Time frame Continuous
Who Developed countries, developing country aid banks, WMO VCP, GEF and other funds for UNFCCC, the United Nations Development Programme (UNDP), national aid agencies; project proposals coordinated by GCOS panels, GCM Board and potential donor countries
Performance indicator
Funds received by the trust fund; Increasing number of projects supporting countries
Annual cost US$ 1–10 million
Assessment: 5 – Complete.

- 196 -
Work is limited by available funds but the GCOS Cooperation Mechanism has supported several countries. Since 2016, US$ 0.5 million (compared to US$ 1.2 million 2010-2015) has been invested in several projects (See Annex C.a.i for a complete list).
Action G7: GCOS coordinator Action Activate national coordinators
Benefit Coordinated planning and implementation of systematic climate observing systems across the many national departments and agencies involved with their provision
Time frame Ongoing
Who Relevant division at national governmental level responsible for the coordination of climate observation
Performance indicator
Annual reports describing and assessing progress made in national coordination in compliance with the coordinator’s responsibilities; establishing a national climate observations inventory and publication of annual reports
Annual cost US$ 10 000–100 000/year/national government
Assessment: 1 – No progress
Not all countries identify a GCOS Coordinator.
Action G8: Regional workshops Action Hold regional workshops to identify needs and regional cooperation, starting with Africa
Benefit Improve key monitoring networks to fill gaps in regions
Time frame 2018–2020
Who GCOS secretariat in coordination with the UNFCCC Secretariat and national coordinators and the involvement and coordination with existing capacity-building activities, for example WCRP programmes such as CLIVAR or CORDEX)
Performance indicator
Workshop outputs describing regional plans and priority national needs.
Annual cost US$ 1–10 million (total for six workshops)
Assessment: 5 – Complete.
One workshop was held annually. However, the work was limited by available funds. Workshops were held in Fiji for Pacific Island Stated, Uganda, for East Africa and in Belize, for the Caribbean. See https://gcos.wmo.int/en/regional-workshops. The outcomes were presented to the UNFCCC. GCOS plans to hold future workshops annually but this was not possible in 2020 due to COVID-19.
- 197 -
Action G9: Communication strategy Action Develop and implement a GCOS communication strategy
Benefit Targeted expert assistance to improve key monitoring networks
Timeframe Develop strategy/plan in 2017; implement in subsequent years
Who GCOS Secretariat.
Performance indicator
Increased monitoring and use of GCMP and monitoring of ECVs; increased donations to GCM; climate monitoring included in national plans and/or reporting to UNFCCC; production of material and improved website; participation in international meetings
Annual cost US$ 100 000–1 million
Assessment: 4 − Progress on track.
Done but implementation pending WMO reorganisation.
Action G10: Maintain ECV requirements
Action
Routinely maintain, review and revise list of ECV requirements. The GCOS secretariat will ensure that there is a consistent approach between panels.
Benefit Clear, consistent and complete list of ECV requirements as a basis for national and international climate observations ensures consistency between observations.
Who GCOS Panels, GCOS secretariat
Time frame Develop a systematic approach in 2017 and review every five years
Performance indicator
Annually updated list of ECV requirements.
Annual cost US$ 1 000–10 000 for experts
Assessment: 4 – Progress on track.
Underway - an on-going activity of the panels.
ECV Stewards have been appointed to be responsible for each ECV. A public consultation was held to solicit inputs into the revision of the ECV.
- 198 -
Action G11: Review of availability of climate data records
Action Provide a structured, comprehensive and accessible view as to what CDRs are currently available, and what are planned to exist, together with an assessment of the degree of compliance of such records with the GCOS requirements for the ECV products indicated in Annex A
Benefit Improve planning of satellite-derived climate data acquisition
Who CEOS/CGMS Working Group on Climate for records contributing to the ECV products that are indicated in Annex A.
Time frame End 2016 and updated every two years thereafter.
Performance indicator
Online availability of an inventory of current and future CDRs, together with an assessment of compliance with GCOS requirements
Annual cost Covered by CEOS and CGMS agencies
Assessment: 5 – Complete.
Available via ECV Inventory hosted by EUMETSAT for the Joint CEOS/CGMS Working Group on Climate.49
Action G12: Gap-analysis of climate data records
Action Establish a gap analysis process and associated actions, to: (a) address gaps/deficiencies in the current available set of CDRs; and (b) ensure continuity of records, and address gaps through the appropriate planning of future satellite missions for the ECV products indicated in Annex A
Benefit Increase the utility of the CDRs
Who CEOS/CGMS Working Group on Climate for records contributing to the ECV indicated in Annex A
Time frame End 2017 and updated every two years thereafter.
Performance indicator
Availability of gap analysis and associated action plan
Annual cost Covered by CEOS and CGMS agencies
Assessment: 4 – Progress on track.
Underway - an on-going activity of the Joint CEOS/CGMS Working Group on Climate50.
49 https://climatemonitoring.info/ecvinventory 50 ECV-Inventory Gap Analysis Report, The Joint CEOS/CGMS Working Group on Climate
(WGClimate) Document Reference WGCL/REP/18/986356. Version 1.1, 17 May 2018, https://ceos.org/document_management/Working_Groups/WGClimate/Documents/WGClimate_ECV-Inventory_Gap_Analysis_Report_v1.1.pdf
- 199 -
Action G13: Review of ECV observation networks
Action For all ECV products not covered by a review following actions G11 and G12: develop and implement a process to regularly review ECV observation networks, comparing their products with the ECV product requirements; identify gaps between the observations and the requirements; identify any deficiencies and develop remediation plans with relevant organizations; and ensure the data is discoverable and accessible. This action may also contribute to the definition of reference-grade observing network and standards. The GCOS science panels should identify stakeholders who will perform this review and regularly check all ECV products are being reviewed.
Benefit Increase quality and availability of climate observations
Who Organizations listed in Annex A. GCOS panels to maintain oversight.
Time frame Develop and demonstrate review process in 2017. Review each ECV’s observing systems at least every four years.
Performance indicator
Reports of results of ECV reviews produced by panels each year.
Annual cost US$ 100 000–1 million also part of the work of panels
Assessment: 4 – Progress on track.
This is addressed in this GCOS Status Report.
Action G14: Maintain and improve coordination
Action Maintain and improve coordination with other global observing systems (such as GOOS and FluxNet), satellite agencies (especially through CGMS and CEOS), those providing climate services (such as GFCS, Copernicus and NMHS climate departments), GEO flagships (such as GEO Carbon, GFOI, Blue Planet: Oceans and Society), Regional Climate Centres and WMO technical commissions and other users such as UNFCCC and IPCC
Benefit Improved and more efficient observation systems.
Who GCOS Secretariat and Science Panels
Time frame On going
Performance indicator
Reports to GCOS Steering Committee and science panels
Annual cost Part of ongoing tasks of GCOS
Assessment: 4 – Progress on track.
Underway - an on-going activity. This is a central role of the secretariat and the GCOS Steering Committee
- 200 -
Action G15: Open data policies
Action Ensure free and unrestricted data access by encouraging that data policies facilitating the open exchange and archiving of all ECVs are followed; encouraging national parties to develop new data policies where appropriate, assessing and regularly reporting of status of data access
Benefit Access to data by all users in all countries at minimum cost
Who Parties and international agencies, appropriate technical commissions and international programmes; GCOS Secretariat.
Time frame Continuing, of high priority.
Performance indicator
Number of countries adhering to data policies favouring free and open exchange of ECV data.
Annual cost US$ 100 000–1 million
Assessment: 2 – Started but little progress.
Despite some progress not all data is openly available. The GCOS Secretariat is supporting the development of new WMO data policies.
Action G16: Metadata
Action 1. GCOS to work with WMO to ensure that the WIGOS metadata standard meets GCOS requirements for metadata, where relevant;
2. Develop metadata standards for those observing systems where they do not exist.
Benefit Improved access and discoverability of datasets
Who Operators of GCOS related systems, including data centres
Time frame Continuous
Performance indicator
Number of ECV-related datasets accessible through standard mechanisms
Annual cost US$ 100 000–1 million (US$ 20 000 per data centre) (10% in non-Annex-I Parties)
Assessment: 4 – Progress on track.
WIGOS metadata standard has been approved and in principle meets the climate needs. Improving metadata is an ongoing task.
- 201 -
Action G17: Support to national data centres
Action Ensure national data centres are supported to enable timely, efficient and quality-controlled flow of observations to international data centres where they exist; ensure timely flow of feedback from monitoring centres to observing network operators
Benefit Long-term, sustainable, provision of timely data and improved data quality
Who Parties with coordination by appropriate technical commissions and international programmes
Time frame Continuing, of high priority
Performance indicator
Data receipt at centres and archives
Annual cost US$ 10–30 million (70% in non-Annex-I Parties)
Assessment: 1 – No progress
GCOS does not have the resources to support national data centres.
Action G18: Long-term accessibility of data
Action Ensure that data centres follow best practice in data stewardship to ensure long-term preservation of data according to guidance to be developed by WMO
Benefit Preservation of data for future generations
Who Funding agencies for data centre
Time frame Ongoing
Performance indicator
Data held in compliant data centres and holdings and accessible to users
Annual cost US$ 1–10 million
Assessment: 3 – Underway with significant progress.
Some improvements have been made. Copernicus is now archiving and providing access to climate data through the Climate Data Store. Despite short term support for some ECVs (e.g. for permafrost and soil moisture) this is fragile and does not cover all the relevant ECVs, ECVs products or guarantee long term data storage.
- 202 -
Action G19: Data access and discoverability
Action Identify and develop means of discovering and accessing all relevant CDRs and other relevant products. Ensure there is access to metadata that clearly distinguishes each data product and describes its adherence to the GCMP
Benefit Increase access to CDRs
Who GCOS, GEO, US National Oceanographic and Atmospheric Administration (NOAA)
Time frame Develop plans in 2017
Performance indicator
Reports of results of ECV reviews produced by panels each year
Annual cost US$10 000–100 000
Assessment: 3 – Underway with significant progress.
Despite some improvements in discoverability and access some gaps remain. Many climate data records are discoverable through sources such as the ECV inventory, the Climate Data Store and NOAA's National Centers for Environmental Information (NCEI). However, significant gaps remain in access to hydrological data.
Action G20: Use of digital object identifiers for data records
Action GCOS to encourage international data centres to introduce DOIs for their data records of ECV and recommend datasets producers to follow this practice
Benefit Help researchers to discover relevant data more easily
Who GCOS panels
Time frame Ongoing
Performance indicator
Number of data records having an assigned DOI
Annual cost Should be part of network planning and implementation.
Assessment: 4 – Progress on track.
Underway. This is an on-going activity which has received general support.
- 203 -
Action G21: Collaboration with WMO CCl on climate data management
Action GCOS secretariat to engage with WMO CCl on development of regulatory and guidance on climate data management
Benefit Users to climate data will have easier access to data.
Who GCOS secretariat and WMO CCl
Time frame Ongoing until 2019
Performance indicator
Guidance material publication
Annual cost None
Assessment: 5 – Complete
Due to WMO reorganization WMO Commission for Climatology (CCl) no longer exists. The Manual on the High-quality Global Data Management Framework for Climate51 was published in collaboration.
Action G22: Implementation of new production streams in global reanalysis
Action Continue comprehensive global reanalyses and implement planned new production streams using improved data-assimilation systems and better collections of observations; provide information on the uncertainty of products and feedback on data usage by the assimilation systems
Benefit Improved reanalysis datasets
Who Global reanalysis production centres
Time frame Ongoing
Performance indicator
Number and specifications of global reanalyses in production; improved results from evaluations of performance; user uptake of uncertainty information; extent to which observational archives are enhanced with feedback from reanalyses
Annual cost US$ 10–30 million
Assessment: 4 – Progress on track.
New production streams have been implemented at principal producing centres with higher resolution, improved data assimilation systems and better collection of observations.
51 https://library.wmo.int/doc_num.php?explnum_id=10197
- 204 -
Action G23: Develop coupled reanalysis
Action Further develop coupled reanalysis and improve the coupled modelling and data assimilation methodology
Benefit Provide coupled reanalysis data sets
Who Global reanalysis production centres and other centres undertaking research in data assimilation
Time frame Ongoing
Performance indicator
Number, specification and demonstrated benefits of coupled reanalyses
Annual cost US$ 1–10 million
Assessment: 4 – Progress on track:
The ECMWF CERA (coupled atmosphere-ocean), the ECMWF CAMS (atmospheric composition) and the NASA/GMAO MERRA2 (which includes aerosol species) reanalyses have been developed.
Action G24: Improve capability of long-range reanalysis
Action Improve the capability of long-scale reanalysis using sparse observations datasets
Benefit Provide longer reanalysis datasets
Who Global reanalysis production centres and other centres undertaking research in data assimilation
Time frame Ongoing
Performance indicator
Demonstrated improvements in the representation of long-term variability and change in century-scale reanalyses
Annual cost US$ 1–10 million
Assessment: 4 – Progress on track.
Newly produced long-range reanalyses, e.g. the ECMWF CERA-20C and the NOAA-CIRES-DOE 20CRv3, improve upon earlier products.
Action G25: Implementation of regional reanalysis
Action Develop and implement regional reanalysis and other approaches to downscaling the information from global data products
Benefit Capability to capture climate variability on a regional scale
Who Dataset producers
Time frame Ongoing
Performance indicator
Number and evaluated performance of regional reanalyses and other downscaled datasets
Annual cost US$ 1–10 million
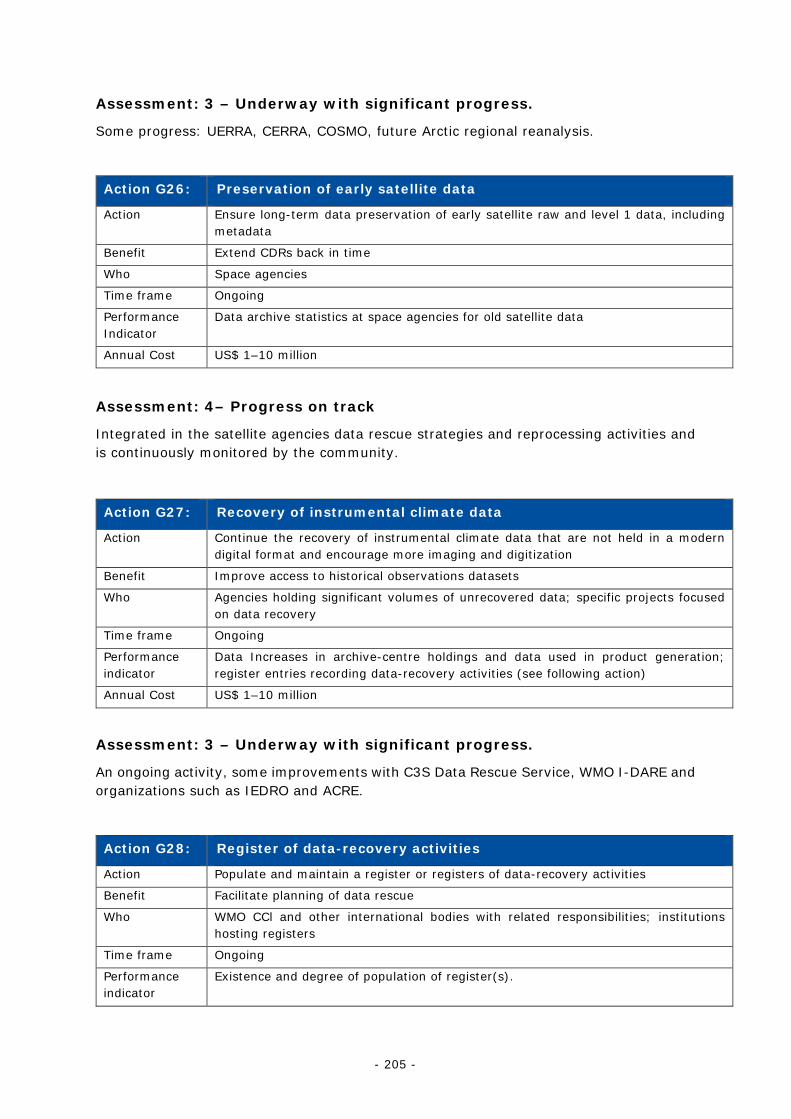
- 205 -
Assessment: 3 – Underway with significant progress.
Some progress: UERRA, CERRA, COSMO, future Arctic regional reanalysis.
Action G26: Preservation of early satellite data
Action Ensure long-term data preservation of early satellite raw and level 1 data, including metadata
Benefit Extend CDRs back in time
Who Space agencies
Time frame Ongoing
Performance Indicator
Data archive statistics at space agencies for old satellite data
Annual Cost US$ 1–10 million
Assessment: 4– Progress on track
Integrated in the satellite agencies data rescue strategies and reprocessing activities and is continuously monitored by the community.
Action G27: Recovery of instrumental climate data
Action Continue the recovery of instrumental climate data that are not held in a modern digital format and encourage more imaging and digitization
Benefit Improve access to historical observations datasets
Who Agencies holding significant volumes of unrecovered data; specific projects focused on data recovery
Time frame Ongoing
Performance indicator
Data Increases in archive-centre holdings and data used in product generation; register entries recording data-recovery activities (see following action)
Annual Cost US$ 1–10 million
Assessment: 3 – Underway with significant progress.
An ongoing activity, some improvements with C3S Data Rescue Service, WMO I-DARE and organizations such as IEDRO and ACRE.
Action G28: Register of data-recovery activities
Action Populate and maintain a register or registers of data-recovery activities
Benefit Facilitate planning of data rescue
Who WMO CCl and other international bodies with related responsibilities; institutions hosting registers
Time frame Ongoing
Performance indicator
Existence and degree of population of register(s).
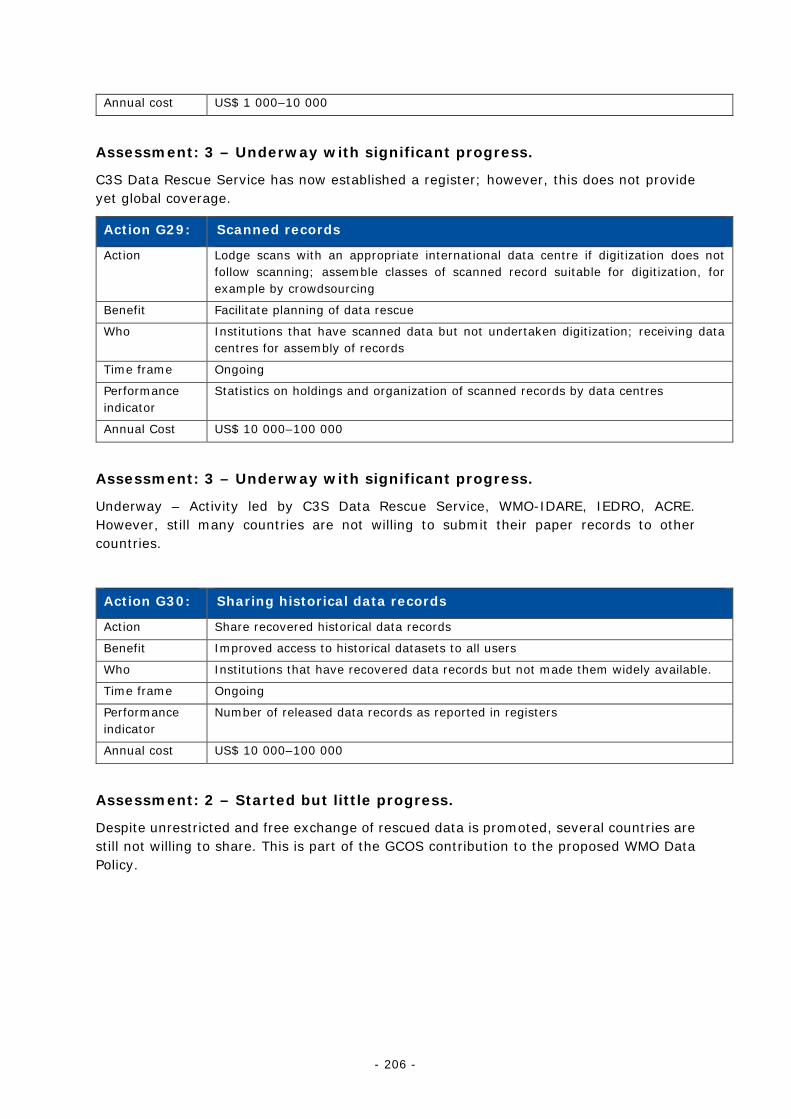
- 206 -
Annual cost US$ 1 000–10 000
Assessment: 3 – Underway with significant progress.
C3S Data Rescue Service has now established a register; however, this does not provide yet global coverage.
Action G29: Scanned records
Action Lodge scans with an appropriate international data centre if digitization does not follow scanning; assemble classes of scanned record suitable for digitization, for example by crowdsourcing
Benefit Facilitate planning of data rescue
Who Institutions that have scanned data but not undertaken digitization; receiving data centres for assembly of records
Time frame Ongoing
Performance indicator
Statistics on holdings and organization of scanned records by data centres
Annual Cost US$ 10 000–100 000
Assessment: 3 – Underway with significant progress.
Underway – Activity led by C3S Data Rescue Service, WMO-IDARE, IEDRO, ACRE. However, still many countries are not willing to submit their paper records to other countries.
Action G30: Sharing historical data records
Action Share recovered historical data records
Benefit Improved access to historical datasets to all users
Who Institutions that have recovered data records but not made them widely available.
Time frame Ongoing
Performance indicator
Number of released data records as reported in registers
Annual cost US$ 10 000–100 000
Assessment: 2 – Started but little progress.
Despite unrestricted and free exchange of rescued data is promoted, several countries are still not willing to share. This is part of the GCOS contribution to the proposed WMO Data Policy.
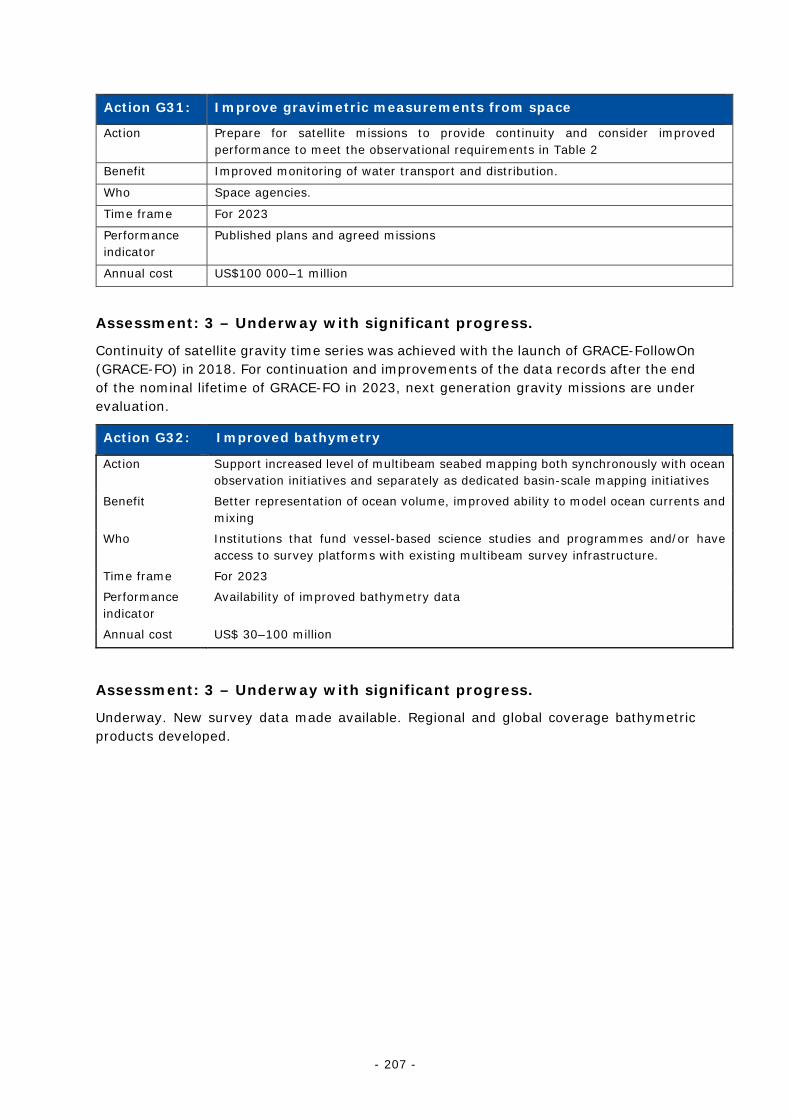
- 207 -
Action G31: Improve gravimetric measurements from space
Action Prepare for satellite missions to provide continuity and consider improved performance to meet the observational requirements in Table 2
Benefit Improved monitoring of water transport and distribution.
Who Space agencies.
Time frame For 2023
Performance indicator
Published plans and agreed missions
Annual cost US$100 000–1 million
Assessment: 3 – Underway with significant progress.
Continuity of satellite gravity time series was achieved with the launch of GRACE-FollowOn (GRACE-FO) in 2018. For continuation and improvements of the data records after the end of the nominal lifetime of GRACE-FO in 2023, next generation gravity missions are under evaluation.
Action G32: Improved bathymetry
Action Support increased level of multibeam seabed mapping both synchronously with ocean observation initiatives and separately as dedicated basin-scale mapping initiatives
Benefit Better representation of ocean volume, improved ability to model ocean currents and mixing
Who Institutions that fund vessel-based science studies and programmes and/or have access to survey platforms with existing multibeam survey infrastructure.
Time frame For 2023
Performance indicator
Availability of improved bathymetry data
Annual cost US$ 30–100 million
Assessment: 3 – Underway with significant progress.
Underway. New survey data made available. Regional and global coverage bathymetric products developed.
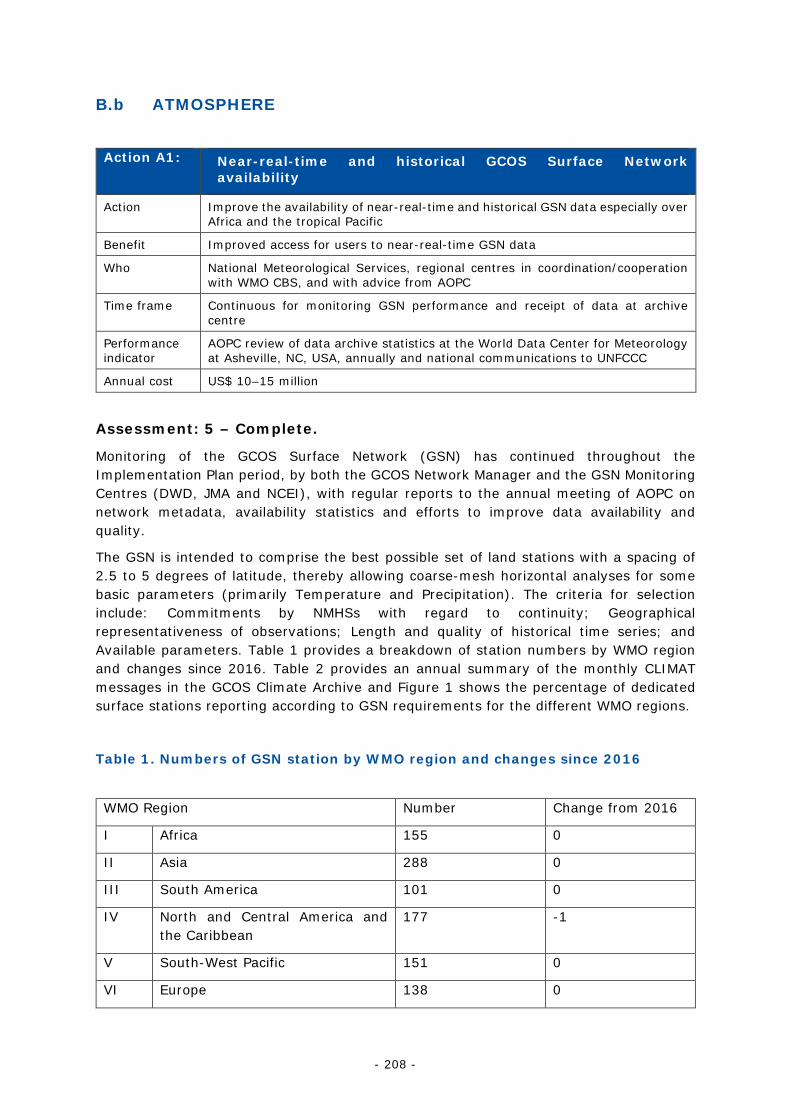
- 208 -
B.b ATMOSPHERE
Action A1: A Near-real-time and historical GCOS Surface Network availability
Action Improve the availability of near-real-time and historical GSN data especially over Africa and the tropical Pacific
Benefit Improved access for users to near-real-time GSN data
Who National Meteorological Services, regional centres in coordination/cooperation with WMO CBS, and with advice from AOPC
Time frame Continuous for monitoring GSN performance and receipt of data at archive centre
Performance indicator
AOPC review of data archive statistics at the World Data Center for Meteorology at Asheville, NC, USA, annually and national communications to UNFCCC
Annual cost US$ 10–15 million
Assessment: 5 – Complete.
Monitoring of the GCOS Surface Network (GSN) has continued throughout the Implementation Plan period, by both the GCOS Network Manager and the GSN Monitoring Centres (DWD, JMA and NCEI), with regular reports to the annual meeting of AOPC on network metadata, availability statistics and efforts to improve data availability and quality.
The GSN is intended to comprise the best possible set of land stations with a spacing of 2.5 to 5 degrees of latitude, thereby allowing coarse-mesh horizontal analyses for some basic parameters (primarily Temperature and Precipitation). The criteria for selection include: Commitments by NMHSs with regard to continuity; Geographical representativeness of observations; Length and quality of historical time series; and Available parameters. Table 1 provides a breakdown of station numbers by WMO region and changes since 2016. Table 2 provides an annual summary of the monthly CLIMAT messages in the GCOS Climate Archive and Figure 1 shows the percentage of dedicated surface stations reporting according to GSN requirements for the different WMO regions.
Table 1. Numbers of GSN station by WMO region and changes since 2016
WMO Region Number Change from 2016
I Africa 155 0
II Asia 288 0
III South America 101 0
IV North and Central America and the Caribbean
177 -1
V South-West Pacific 151 0
VI Europe 138 0
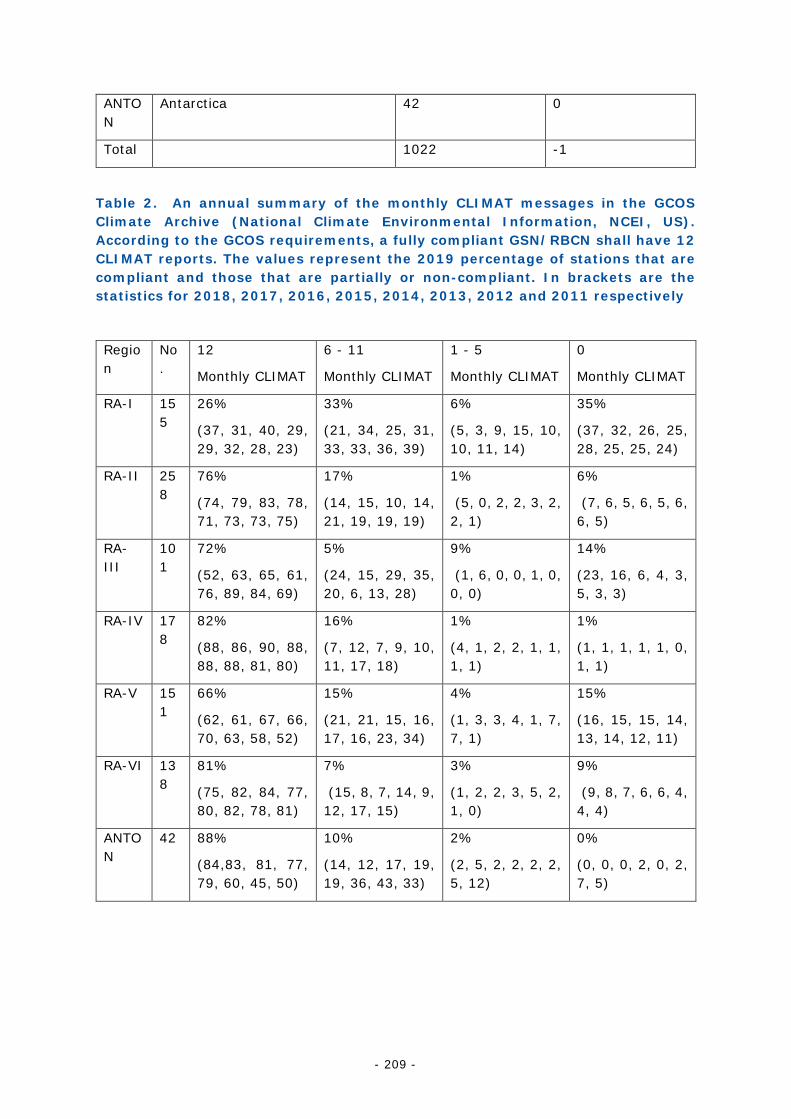
- 209 -
Table 2. An annual summary of the monthly CLIMAT messages in the GCOS Climate Archive (National Climate Environmental Information, NCEI, US). According to the GCOS requirements, a fully compliant GSN/RBCN shall have 12 CLIMAT reports. The values represent the 2019 percentage of stations that are compliant and those that are partially or non-compliant. In brackets are the statistics for 2018, 2017, 2016, 2015, 2014, 2013, 2012 and 2011 respectively
Region
No.
12
Monthly CLIMAT
6 - 11
Monthly CLIMAT
1 - 5
Monthly CLIMAT
0
Monthly CLIMAT
RA-I 155
26%
(37, 31, 40, 29, 29, 32, 28, 23)
33%
(21, 34, 25, 31, 33, 33, 36, 39)
6%
(5, 3, 9, 15, 10, 10, 11, 14)
35%
(37, 32, 26, 25, 28, 25, 25, 24)
RA-II 258
76%
(74, 79, 83, 78, 71, 73, 73, 75)
17%
(14, 15, 10, 14, 21, 19, 19, 19)
1%
(5, 0, 2, 2, 3, 2, 2, 1)
6%
(7, 6, 5, 6, 5, 6, 6, 5)
RA-III
101
72%
(52, 63, 65, 61, 76, 89, 84, 69)
5%
(24, 15, 29, 35, 20, 6, 13, 28)
9%
(1, 6, 0, 0, 1, 0, 0, 0)
14%
(23, 16, 6, 4, 3, 5, 3, 3)
RA-IV 178
82%
(88, 86, 90, 88, 88, 88, 81, 80)
16%
(7, 12, 7, 9, 10, 11, 17, 18)
1%
(4, 1, 2, 2, 1, 1, 1, 1)
1%
(1, 1, 1, 1, 1, 0, 1, 1)
RA-V 151
66%
(62, 61, 67, 66, 70, 63, 58, 52)
15%
(21, 21, 15, 16, 17, 16, 23, 34)
4%
(1, 3, 3, 4, 1, 7, 7, 1)
15%
(16, 15, 15, 14, 13, 14, 12, 11)
RA-VI 138
81%
(75, 82, 84, 77, 80, 82, 78, 81)
7%
(15, 8, 7, 14, 9, 12, 17, 15)
3%
(1, 2, 2, 3, 5, 2, 1, 0)
9%
(9, 8, 7, 6, 6, 4, 4, 4)
ANTON
42 88%
(84,83, 81, 77, 79, 60, 45, 50)
10%
(14, 12, 17, 19, 19, 36, 43, 33)
2%
(2, 5, 2, 2, 2, 2, 5, 12)
0%
(0, 0, 0, 2, 0, 2, 7, 5)
ANTON
Antarctica 42 0
Total 1022 -1
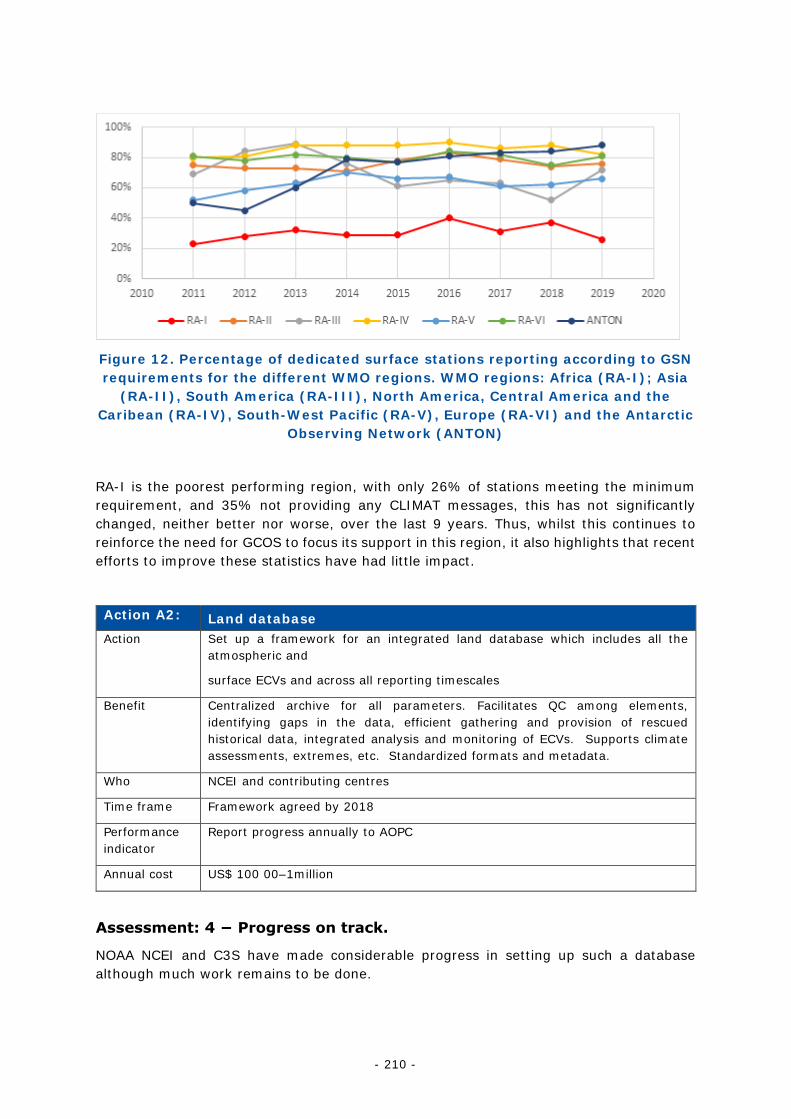
- 210 -
Figure 12. Percentage of dedicated surface stations reporting according to GSN requirements for the different WMO regions. WMO regions: Africa (RA-I); Asia
(RA-II), South America (RA-III), North America, Central America and the Caribean (RA-IV), South-West Pacific (RA-V), Europe (RA-VI) and the Antarctic
Observing Network (ANTON)
RA-I is the poorest performing region, with only 26% of stations meeting the minimum requirement, and 35% not providing any CLIMAT messages, this has not significantly changed, neither better nor worse, over the last 9 years. Thus, whilst this continues to reinforce the need for GCOS to focus its support in this region, it also highlights that recent efforts to improve these statistics have had little impact.
Action A2: A Land database Action Set up a framework for an integrated land database which includes all the
atmospheric and
surface ECVs and across all reporting timescales
Benefit Centralized archive for all parameters. Facilitates QC among elements, identifying gaps in the data, efficient gathering and provision of rescued historical data, integrated analysis and monitoring of ECVs. Supports climate assessments, extremes, etc. Standardized formats and metadata.
Who NCEI and contributing centres
Time frame Framework agreed by 2018
Performance indicator
Report progress annually to AOPC
Annual cost US$ 100 00–1million
Assessment: 4 − Progress on track.
NOAA NCEI and C3S have made considerable progress in setting up such a database although much work remains to be done.
- 211 -
There has been considerable progress made in the instigation and population of a new database containing all meteorological surface parameters measured from standard meteorological stations and available across synoptic through monthly aggregations. In 2017 the Copernicus Climate Change Service and NOAA NCEI started a collaborative effort to realise this action based upon its articulation in Thorne et al., 2017. The effort has collated to date in excess of 350 data sources ranging from large global collections of several thousand stations through to small collections and including a broad range of data rescued collections. The sources include a number of national holdings from NMHSs that have over the past several years adopted open data policies. It also benefits from the efforts of the European Environment Agency to secure agreements on data sharing via the EU Copernicus program.
To date a subset of these sources have been converted to a common format, merged to avoid duplication, and quality controlled. Data are made available at sub-daily, daily and monthly timescales respecting the known data IPR restrictions. Data availability from sources processed to date shows reasonable spatial completeness as shown in the maps below.
Many sources remain to be processed and so both spatial and temporal completeness can be improved in future work that is planned. There is also a new portal by which data owners can submit additional holdings and it is hoped that additional data rescue activities can also add sources over time. Discussions are ongoing with the Infrastructure Commission over the use and allocation of WIGOS Station Identifiers and inclusion in OSCAR Surface for discoverability and accessibility.
References:
Thorne, P.W., R. J. Allan, L. Ashcroft, P. Brohan, R. J. H. Dunn, M. J. Menne, P. R. Pearce, J. Picas, K. M. Willett, M., Benoy, S. Bronnimann, P. O. Canziani, J. Coll, R. Crouthamel, G. P. Compo, D. Cuppett, M. Curley, C. Duffy, I. Gillespie, J. Guijarro, S. Jourdain, E. C. Kent, H. Kubota, T. P. Legg, Q. Li, J. Matsumoto, C. Murphy, N. A. Rayner, J. J. Rennie, E. Rustemeier, L. C. Slivinski, V. Slonosky, A. Squintu, B. Tinz, M. A. Valente, S. Walsh, X. L. Wang, N. Westcott, K. Wood, S. D. Woodruff and S. J. Worley, 2017: Towards an integrated set of surface meteorological observations for climate science and applications, Bulletin American Meteorological Society, https://doi.org/10.1175/BAMS-D-16-0165.1.
Action A3: International exchange of SYNOP and CLIMAT reports
Action Obtain further progress in the systematic international exchange of both hourly SYNOP reports and daily and monthly CLIMAT reports from all stations
Benefit Enhanced holdings data archives
Who NMHSs, regional centres in coordination/cooperation with WMO CBS, and with advice from AOPC
Time frame Continuous, with significant improvement in receipt of RBSN synoptic and CLIMAT data by 2019
Performance Indicator
Data archive statistics at data centres
Annual cost US$ 100 000–1 million
- 212 -
Assessment: 3 – Underway with significant progress.
Data archive statistics indicate that effort to enhance the systematic international exchange is underway and significant progress has been made in receipt of hourly SYNOP (Surface Synoptic Observations) and daily CLIMAT reports.
A significant development in monitoring SYNOP reports since the time of the GCOS-IP 2016 is the launch of the WIGOS Data Quality Monitoring System (WDQMS) Webtool (https://wdqms.wmo.int/), a resource developed by WMO, and hosted by ECMWF, to monitor the performance of all WIGOS observing components. The current version of the webtool monitors the availability and quality of land-surface synoptic (SYNOP) and upper-air land observations based on near-real-time monitoring information from four participating global NWP centres (DWD, ECMWF, JMA and NCEP). From coverage maps of SYNOP reports monitored by the webtools for recent months (not shown), substantial coverage in receipt of hourly SYNOP reports can be seen over Europe, Japan, Australia, Greenland and Antarctica as already shown in the previous Status Report (GCOS-195, Figure 76), and also a significant improvement over South America and the South Pacific. It should be noted, however, that the data availability obtained by the webtool varies between monitoring centres, which indicates that there could be some issues in the routing of messages within GTS whereby some messages are not shared truly globally.
Figure 13 shows average counts of surface air-temperature observations for each hour of the day for October 2014 and 2019. Observation counts of SYNOP reports increased in all hours from the year 2014 to 2019, with the largest increases at hours 0300, 0900, 1500 and 2100, leading to a more regular three hourly peak in 2019. METAR (aerodrome routine meteorological) reports show a greater increase in observation numbers than SYNOP reports and supplement the coverage of SYNOP reports, predominantly over North America.
For monthly CLIMAT reports from the Regional Basic Synoptic Network (RBSN), as assessed in Action A1, RA-I is the poorest performing region, with only 17% of stations meeting the minimum requirement in 2019.
Percentages of stations with zero reports in the Regional Basic Climatological Network (RBCN) are greater than those in GSN for all regions, suggesting that not all countries are sending CLIMAT messages for their RBCN stations.
Transmissions of daily CLIMAT messages began January 2019 and a total of 259 stations (around 10% of all CLIMAT stations) had transmitted at least one message as of May 2020. Participating countries are located in Europe (111; Ireland, Norway, Spain, Switzerland), South America/Antarctica (73; Argentina, Antarctica), East Asia (64; Japan, South Korea, Hongkong), and Africa (11; Algeria). Most stations are not transmitting all six possible elements.
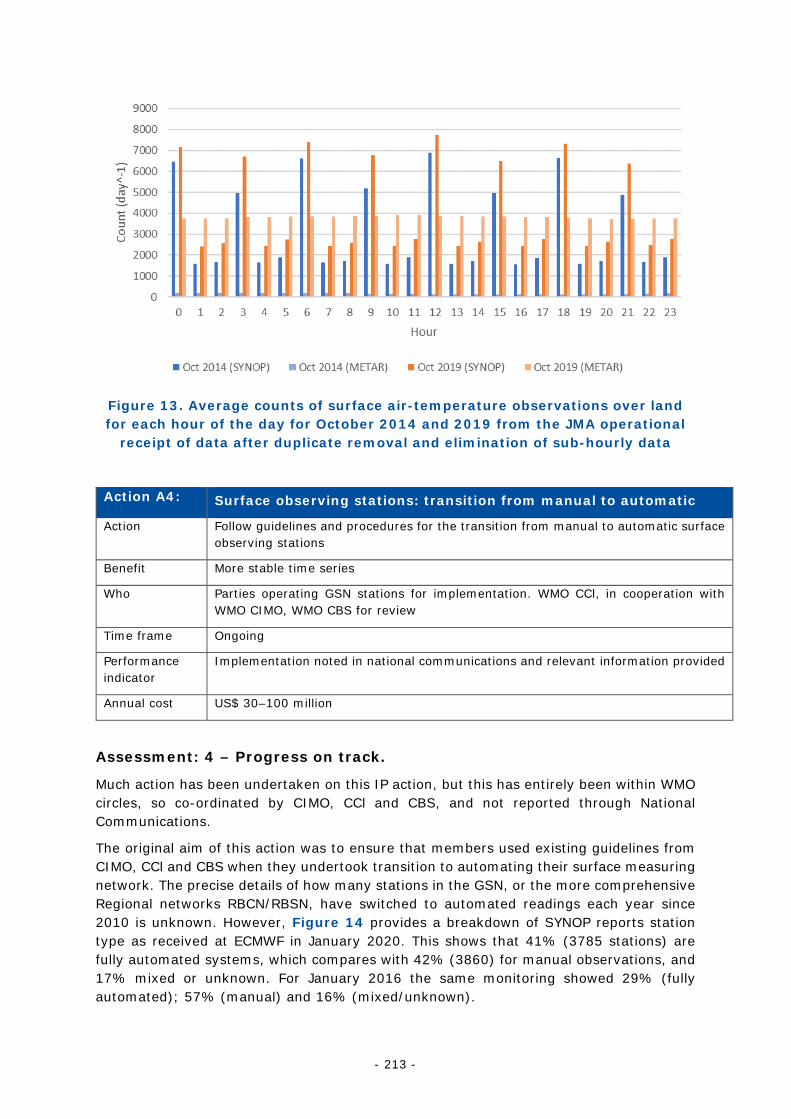
- 213 -
Figure 13. Average counts of surface air-temperature observations over land for each hour of the day for October 2014 and 2019 from the JMA operational
receipt of data after duplicate removal and elimination of sub-hourly data
Action A4: Surface observing stations: transition from manual to automatic
Action Follow guidelines and procedures for the transition from manual to automatic surface observing stations
Benefit More stable time series
Who Parties operating GSN stations for implementation. WMO CCl, in cooperation with WMO CIMO, WMO CBS for review
Time frame Ongoing
Performance indicator
Implementation noted in national communications and relevant information provided
Annual cost US$ 30–100 million
Assessment: 4 – Progress on track.
Much action has been undertaken on this IP action, but this has entirely been within WMO circles, so co-ordinated by CIMO, CCl and CBS, and not reported through National Communications.
The original aim of this action was to ensure that members used existing guidelines from CIMO, CCl and CBS when they undertook transition to automating their surface measuring network. The precise details of how many stations in the GSN, or the more comprehensive Regional networks RBCN/RBSN, have switched to automated readings each year since 2010 is unknown. However, Figure 14 provides a breakdown of SYNOP reports station type as received at ECMWF in January 2020. This shows that 41% (3785 stations) are fully automated systems, which compares with 42% (3860) for manual observations, and 17% mixed or unknown. For January 2016 the same monitoring showed 29% (fully automated); 57% (manual) and 16% (mixed/unknown).
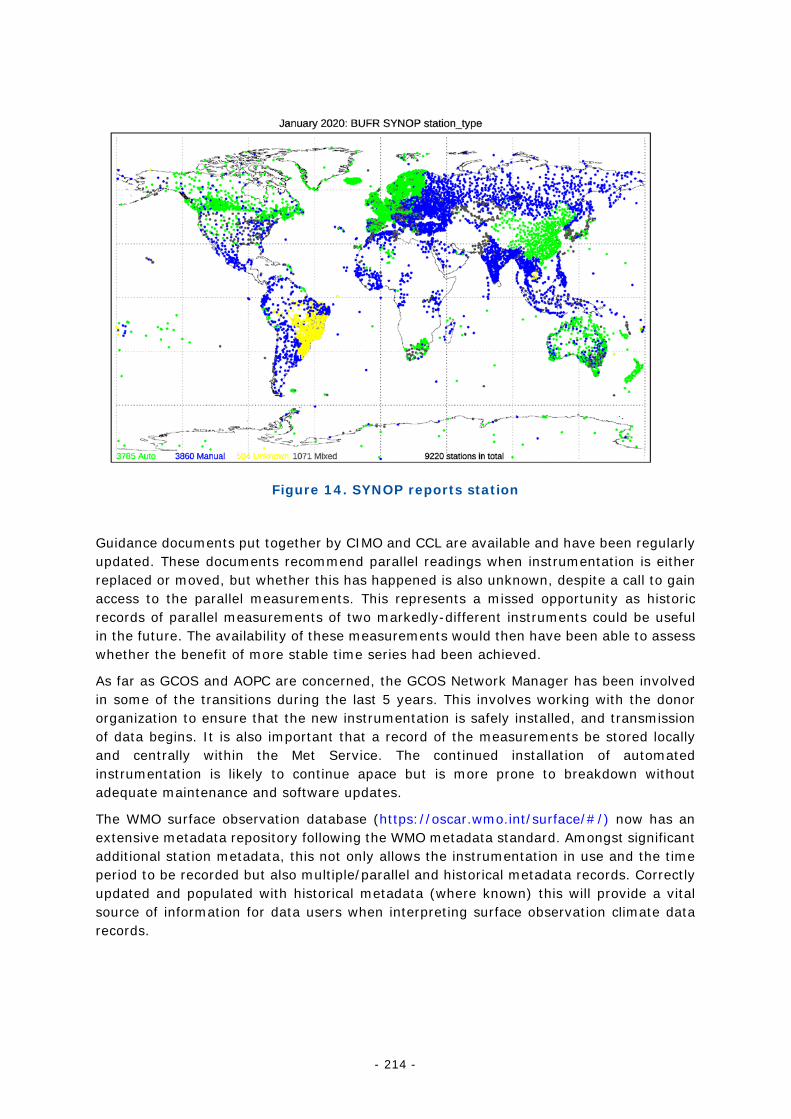
- 214 -
Figure 14. SYNOP reports station
Guidance documents put together by CIMO and CCL are available and have been regularly updated. These documents recommend parallel readings when instrumentation is either replaced or moved, but whether this has happened is also unknown, despite a call to gain access to the parallel measurements. This represents a missed opportunity as historic records of parallel measurements of two markedly-different instruments could be useful in the future. The availability of these measurements would then have been able to assess whether the benefit of more stable time series had been achieved.
As far as GCOS and AOPC are concerned, the GCOS Network Manager has been involved in some of the transitions during the last 5 years. This involves working with the donor organization to ensure that the new instrumentation is safely installed, and transmission of data begins. It is also important that a record of the measurements be stored locally and centrally within the Met Service. The continued installation of automated instrumentation is likely to continue apace but is more prone to breakdown without adequate maintenance and software updates.
The WMO surface observation database (https://oscar.wmo.int/surface/#/) now has an extensive metadata repository following the WMO metadata standard. Amongst significant additional station metadata, this not only allows the instrumentation in use and the time period to be recorded but also multiple/parallel and historical metadata records. Correctly updated and populated with historical metadata (where known) this will provide a vital source of information for data users when interpreting surface observation climate data records.
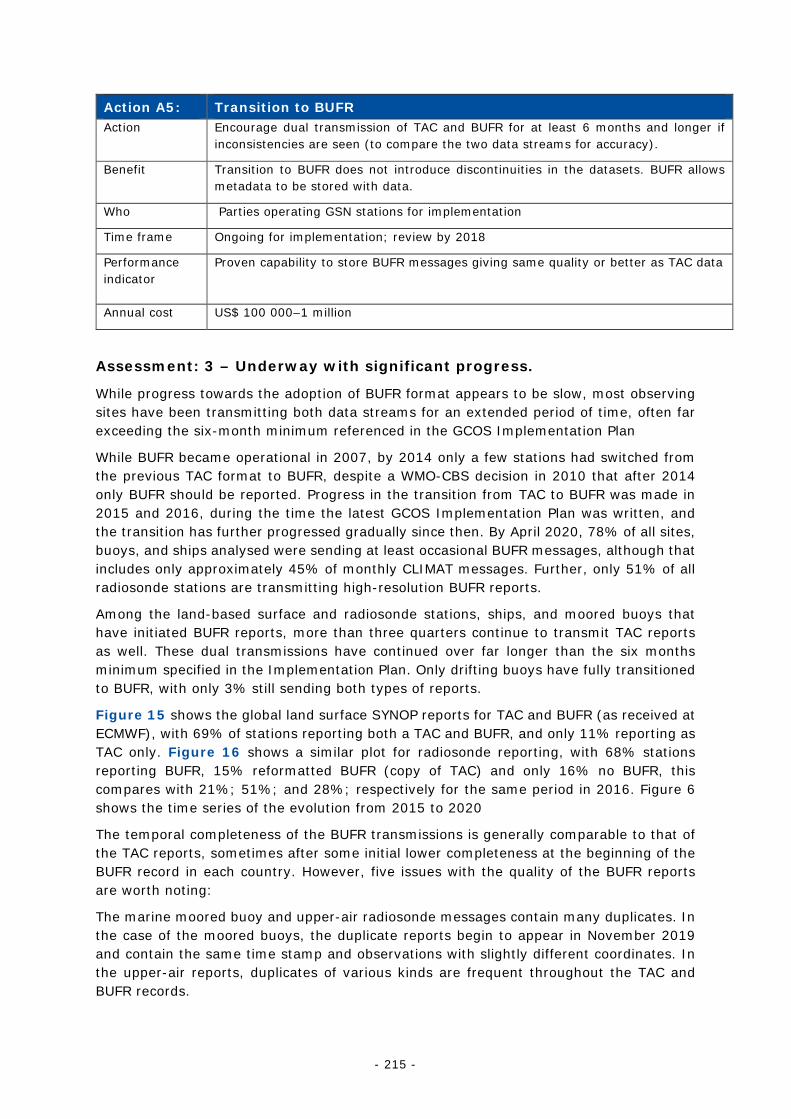
- 215 -
Action A5: Transition to BUFR Action Encourage dual transmission of TAC and BUFR for at least 6 months and longer if
inconsistencies are seen (to compare the two data streams for accuracy).
Benefit Transition to BUFR does not introduce discontinuities in the datasets. BUFR allows metadata to be stored with data.
Who Parties operating GSN stations for implementation
Time frame Ongoing for implementation; review by 2018
Performance indicator
Proven capability to store BUFR messages giving same quality or better as TAC data
Annual cost US$ 100 000–1 million
Assessment: 3 – Underway with significant progress.
While progress towards the adoption of BUFR format appears to be slow, most observing sites have been transmitting both data streams for an extended period of time, often far exceeding the six-month minimum referenced in the GCOS Implementation Plan
While BUFR became operational in 2007, by 2014 only a few stations had switched from the previous TAC format to BUFR, despite a WMO-CBS decision in 2010 that after 2014 only BUFR should be reported. Progress in the transition from TAC to BUFR was made in 2015 and 2016, during the time the latest GCOS Implementation Plan was written, and the transition has further progressed gradually since then. By April 2020, 78% of all sites, buoys, and ships analysed were sending at least occasional BUFR messages, although that includes only approximately 45% of monthly CLIMAT messages. Further, only 51% of all radiosonde stations are transmitting high-resolution BUFR reports.
Among the land-based surface and radiosonde stations, ships, and moored buoys that have initiated BUFR reports, more than three quarters continue to transmit TAC reports as well. These dual transmissions have continued over far longer than the six months minimum specified in the Implementation Plan. Only drifting buoys have fully transitioned to BUFR, with only 3% still sending both types of reports.
Figure 15 shows the global land surface SYNOP reports for TAC and BUFR (as received at ECMWF), with 69% of stations reporting both a TAC and BUFR, and only 11% reporting as TAC only. Figure 16 shows a similar plot for radiosonde reporting, with 68% stations reporting BUFR, 15% reformatted BUFR (copy of TAC) and only 16% no BUFR, this compares with 21%; 51%; and 28%; respectively for the same period in 2016. Figure 6 shows the time series of the evolution from 2015 to 2020
The temporal completeness of the BUFR transmissions is generally comparable to that of the TAC reports, sometimes after some initial lower completeness at the beginning of the BUFR record in each country. However, five issues with the quality of the BUFR reports are worth noting:
The marine moored buoy and upper-air radiosonde messages contain many duplicates. In the case of the moored buoys, the duplicate reports begin to appear in November 2019 and contain the same time stamp and observations with slightly different coordinates. In the upper-air reports, duplicates of various kinds are frequent throughout the TAC and BUFR records.
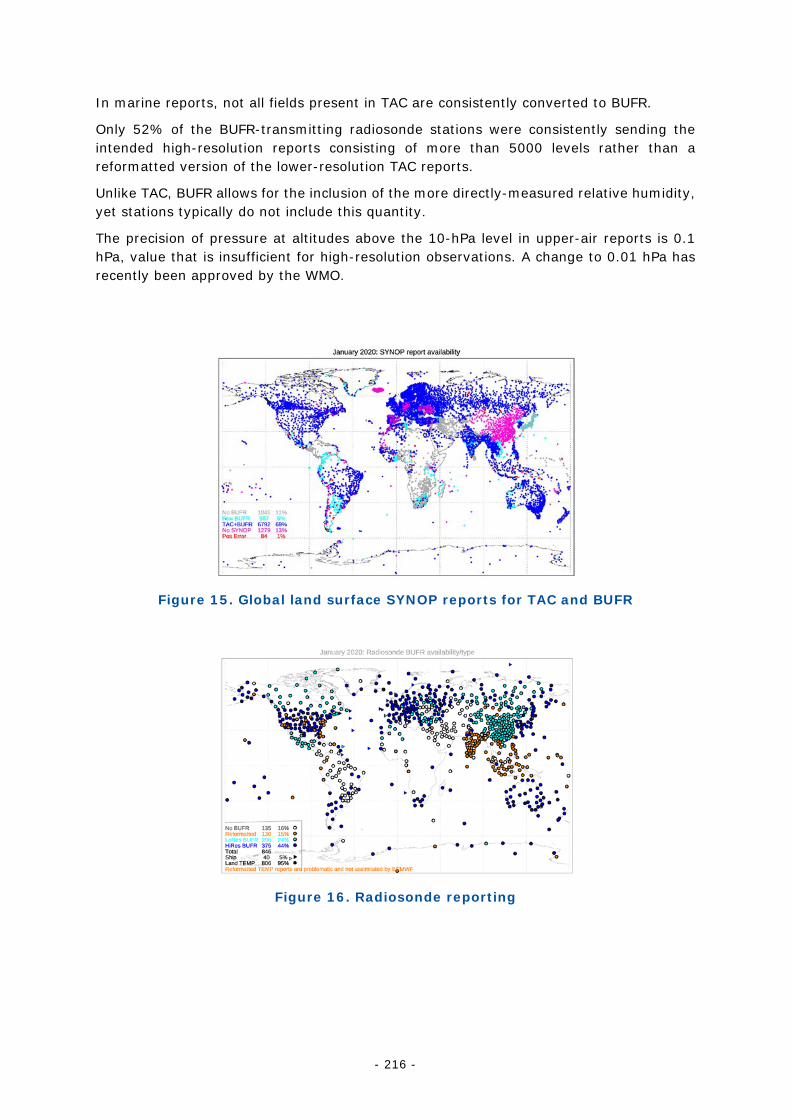
- 216 -
In marine reports, not all fields present in TAC are consistently converted to BUFR.
Only 52% of the BUFR-transmitting radiosonde stations were consistently sending the intended high-resolution reports consisting of more than 5000 levels rather than a reformatted version of the lower-resolution TAC reports.
Unlike TAC, BUFR allows for the inclusion of the more directly-measured relative humidity, yet stations typically do not include this quantity.
The precision of pressure at altitudes above the 10-hPa level in upper-air reports is 0.1 hPa, value that is insufficient for high-resolution observations. A change to 0.01 hPa has recently been approved by the WMO.
Figure 15. Global land surface SYNOP reports for TAC and BUFR
Figure 16. Radiosonde reporting
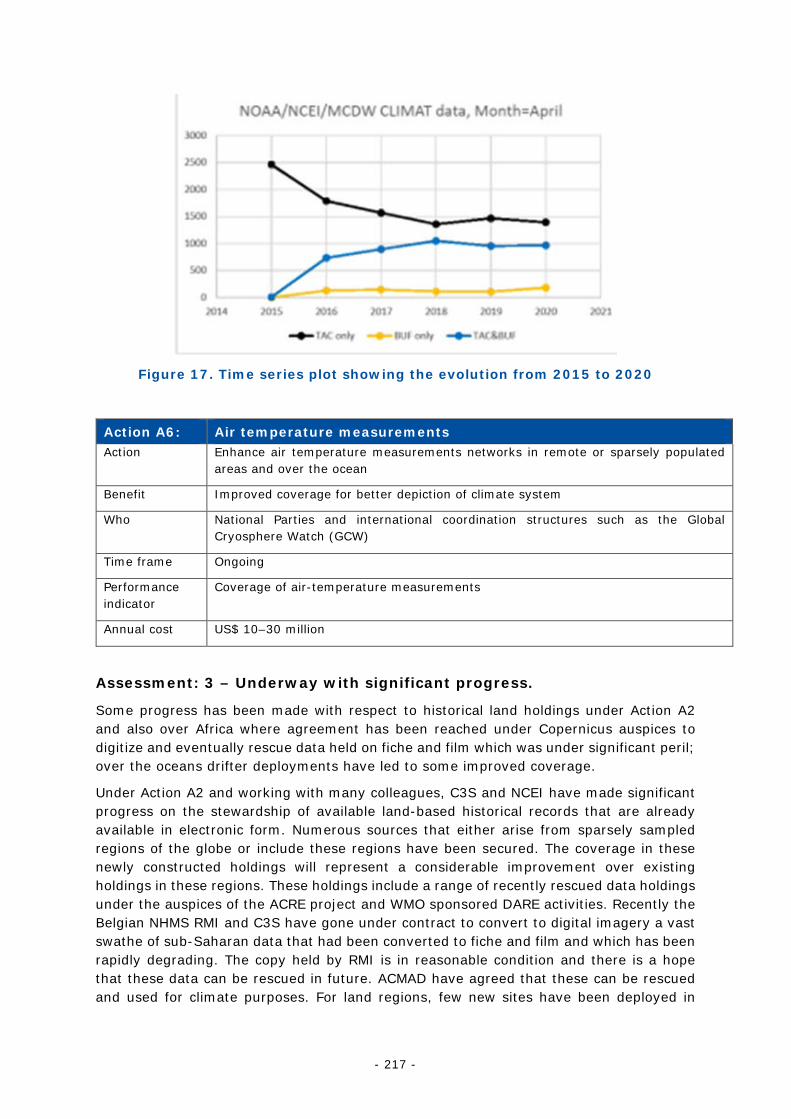
- 217 -
Figure 17. Time series plot showing the evolution from 2015 to 2020
Action A6: Air temperature measurements Action Enhance air temperature measurements networks in remote or sparsely populated
areas and over the ocean
Benefit Improved coverage for better depiction of climate system
Who National Parties and international coordination structures such as the Global Cryosphere Watch (GCW)
Time frame Ongoing
Performance indicator
Coverage of air-temperature measurements
Annual cost US$ 10–30 million
Assessment: 3 – Underway with significant progress.
Some progress has been made with respect to historical land holdings under Action A2 and also over Africa where agreement has been reached under Copernicus auspices to digitize and eventually rescue data held on fiche and film which was under significant peril; over the oceans drifter deployments have led to some improved coverage.
Under Action A2 and working with many colleagues, C3S and NCEI have made significant progress on the stewardship of available land-based historical records that are already available in electronic form. Numerous sources that either arise from sparsely sampled regions of the globe or include these regions have been secured. The coverage in these newly constructed holdings will represent a considerable improvement over existing holdings in these regions. These holdings include a range of recently rescued data holdings under the auspices of the ACRE project and WMO sponsored DARE activities. Recently the Belgian NHMS RMI and C3S have gone under contract to convert to digital imagery a vast swathe of sub-Saharan data that had been converted to fiche and film and which has been rapidly degrading. The copy held by RMI is in reasonable condition and there is a hope that these data can be rescued in future. ACMAD have agreed that these can be rescued and used for climate purposes. For land regions, few new sites have been deployed in
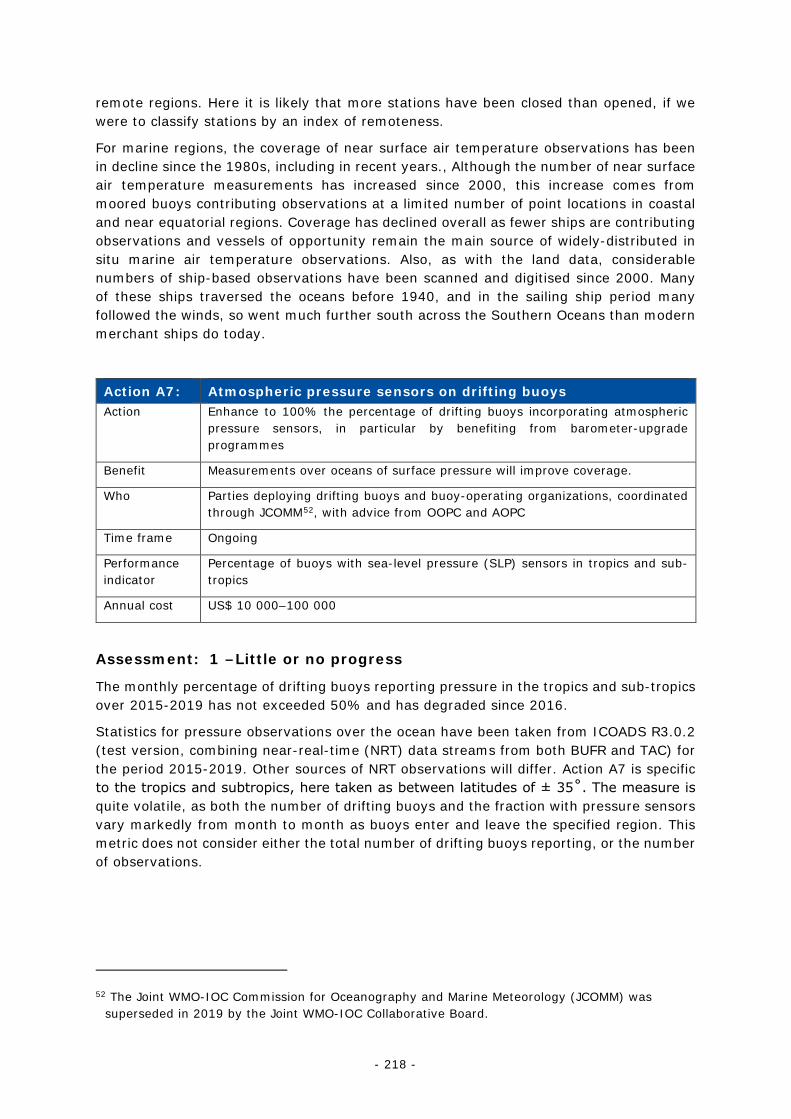
- 218 -
remote regions. Here it is likely that more stations have been closed than opened, if we were to classify stations by an index of remoteness.
For marine regions, the coverage of near surface air temperature observations has been in decline since the 1980s, including in recent years., Although the number of near surface air temperature measurements has increased since 2000, this increase comes from moored buoys contributing observations at a limited number of point locations in coastal and near equatorial regions. Coverage has declined overall as fewer ships are contributing observations and vessels of opportunity remain the main source of widely-distributed in situ marine air temperature observations. Also, as with the land data, considerable numbers of ship-based observations have been scanned and digitised since 2000. Many of these ships traversed the oceans before 1940, and in the sailing ship period many followed the winds, so went much further south across the Southern Oceans than modern merchant ships do today.
Action A7: Atmospheric pressure sensors on drifting buoys Action Enhance to 100% the percentage of drifting buoys incorporating atmospheric
pressure sensors, in particular by benefiting from barometer-upgrade programmes
Benefit Measurements over oceans of surface pressure will improve coverage.
Who Parties deploying drifting buoys and buoy-operating organizations, coordinated through JCOMM52, with advice from OOPC and AOPC
Time frame Ongoing
Performance indicator
Percentage of buoys with sea-level pressure (SLP) sensors in tropics and sub-tropics
Annual cost US$ 10 000–100 000
Assessment: 1 –Little or no progress
The monthly percentage of drifting buoys reporting pressure in the tropics and sub-tropics over 2015-2019 has not exceeded 50% and has degraded since 2016.
Statistics for pressure observations over the ocean have been taken from ICOADS R3.0.2 (test version, combining near-real-time (NRT) data streams from both BUFR and TAC) for the period 2015-2019. Other sources of NRT observations will differ. Action A7 is specific to the tropics and subtropics, here taken as between latitudes of ± 35˚. The measure is quite volatile, as both the number of drifting buoys and the fraction with pressure sensors vary markedly from month to month as buoys enter and leave the specified region. This metric does not consider either the total number of drifting buoys reporting, or the number of observations.
52 The Joint WMO-IOC Commission for Oceanography and Marine Meteorology (JCOMM) was
superseded in 2019 by the Joint WMO-IOC Collaborative Board.
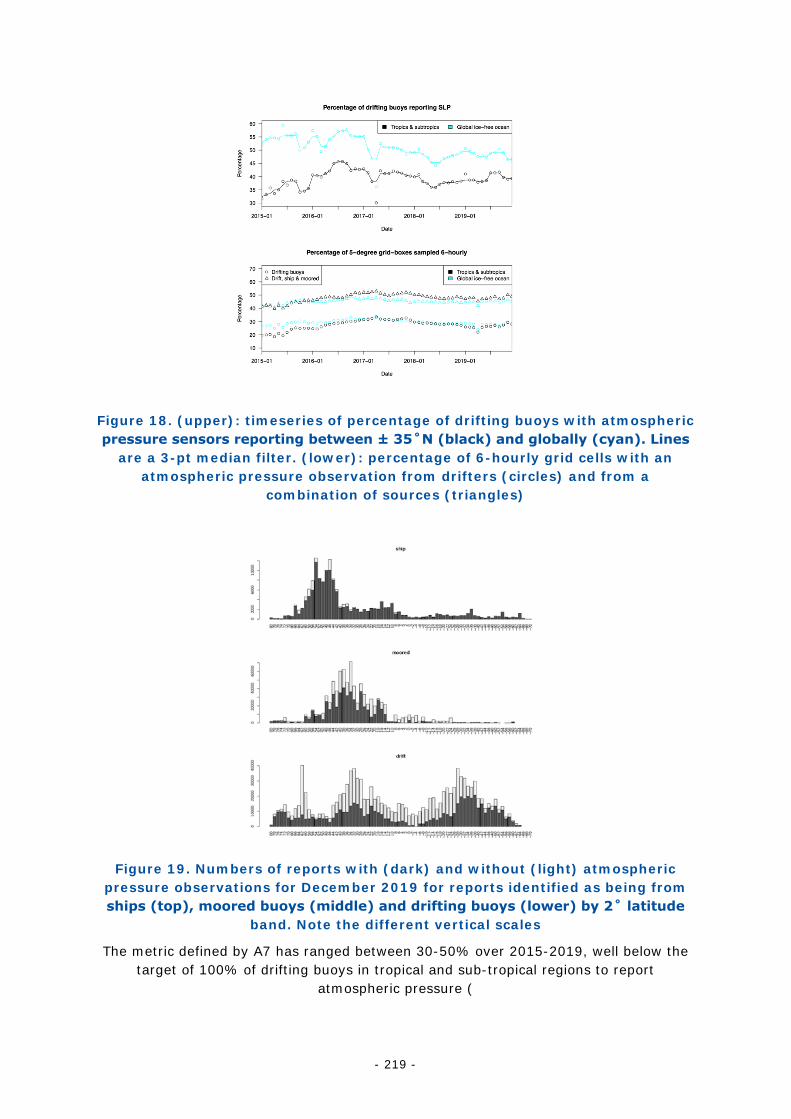
- 219 -
Figure 18. (upper): timeseries of percentage of drifting buoys with atmospheric pressure sensors reporting between ± 35˚N (black) and globally (cyan). Lines
are a 3-pt median filter. (lower): percentage of 6-hourly grid cells with an atmospheric pressure observation from drifters (circles) and from a
combination of sources (triangles)
Figure 19. Numbers of reports with (dark) and without (light) atmospheric pressure observations for December 2019 for reports identified as being from ships (top), moored buoys (middle) and drifting buoys (lower) by 2˚ latitude
band. Note the different vertical scales
The metric defined by A7 has ranged between 30-50% over 2015-2019, well below the target of 100% of drifting buoys in tropical and sub-tropical regions to report
atmospheric pressure (
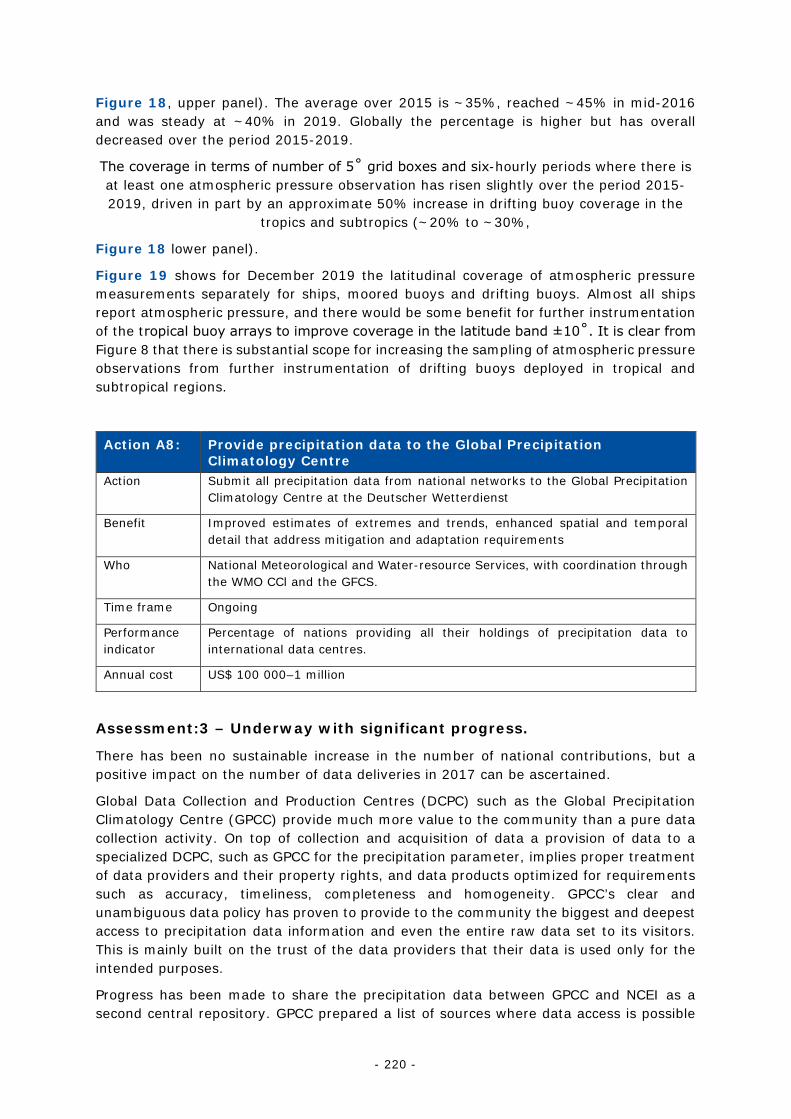
- 220 -
Figure 18, upper panel). The average over 2015 is ~35%, reached ~45% in mid-2016 and was steady at ~40% in 2019. Globally the percentage is higher but has overall decreased over the period 2015-2019.
The coverage in terms of number of 5˚ grid boxes and six-hourly periods where there is at least one atmospheric pressure observation has risen slightly over the period 2015-2019, driven in part by an approximate 50% increase in drifting buoy coverage in the
tropics and subtropics (~20% to ~30%,
Figure 18 lower panel).
Figure 19 shows for December 2019 the latitudinal coverage of atmospheric pressure measurements separately for ships, moored buoys and drifting buoys. Almost all ships report atmospheric pressure, and there would be some benefit for further instrumentation of the tropical buoy arrays to improve coverage in the latitude band ±10˚. It is clear from Figure 8 that there is substantial scope for increasing the sampling of atmospheric pressure observations from further instrumentation of drifting buoys deployed in tropical and subtropical regions.
Action A8: Provide precipitation data to the Global Precipitation Climatology Centre
Action Submit all precipitation data from national networks to the Global Precipitation Climatology Centre at the Deutscher Wetterdienst
Benefit Improved estimates of extremes and trends, enhanced spatial and temporal detail that address mitigation and adaptation requirements
Who National Meteorological and Water-resource Services, with coordination through the WMO CCl and the GFCS.
Time frame Ongoing
Performance indicator
Percentage of nations providing all their holdings of precipitation data to international data centres.
Annual cost US$ 100 000–1 million
Assessment:3 – Underway with significant progress.
There has been no sustainable increase in the number of national contributions, but a positive impact on the number of data deliveries in 2017 can be ascertained.
Global Data Collection and Production Centres (DCPC) such as the Global Precipitation Climatology Centre (GPCC) provide much more value to the community than a pure data collection activity. On top of collection and acquisition of data a provision of data to a specialized DCPC, such as GPCC for the precipitation parameter, implies proper treatment of data providers and their property rights, and data products optimized for requirements such as accuracy, timeliness, completeness and homogeneity. GPCC’s clear and unambiguous data policy has proven to provide to the community the biggest and deepest access to precipitation data information and even the entire raw data set to its visitors. This is mainly built on the trust of the data providers that their data is used only for the intended purposes.
Progress has been made to share the precipitation data between GPCC and NCEI as a second central repository. GPCC prepared a list of sources where data access is possible
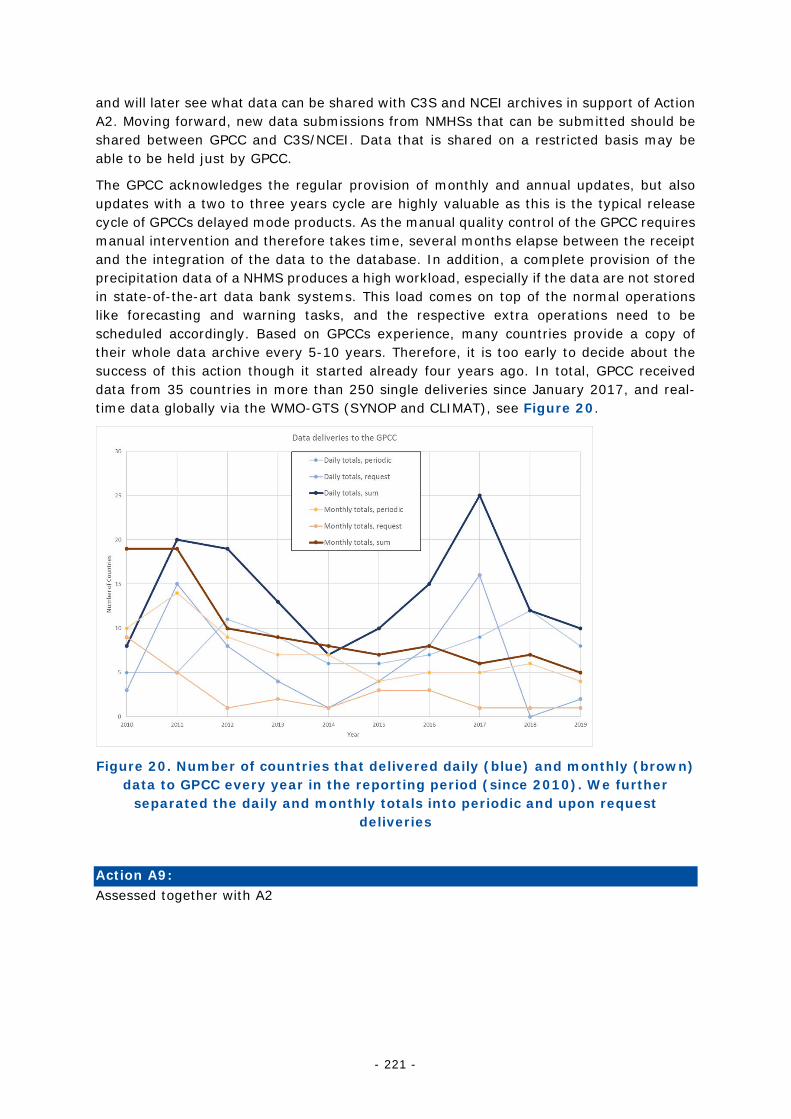
- 221 -
and will later see what data can be shared with C3S and NCEI archives in support of Action A2. Moving forward, new data submissions from NMHSs that can be submitted should be shared between GPCC and C3S/NCEI. Data that is shared on a restricted basis may be able to be held just by GPCC.
The GPCC acknowledges the regular provision of monthly and annual updates, but also updates with a two to three years cycle are highly valuable as this is the typical release cycle of GPCCs delayed mode products. As the manual quality control of the GPCC requires manual intervention and therefore takes time, several months elapse between the receipt and the integration of the data to the database. In addition, a complete provision of the precipitation data of a NHMS produces a high workload, especially if the data are not stored in state-of-the-art data bank systems. This load comes on top of the normal operations like forecasting and warning tasks, and the respective extra operations need to be scheduled accordingly. Based on GPCCs experience, many countries provide a copy of their whole data archive every 5-10 years. Therefore, it is too early to decide about the success of this action though it started already four years ago. In total, GPCC received data from 35 countries in more than 250 single deliveries since January 2017, and real-time data globally via the WMO-GTS (SYNOP and CLIMAT), see Figure 20.
Figure 20. Number of countries that delivered daily (blue) and monthly (brown) data to GPCC every year in the reporting period (since 2010). We further
separated the daily and monthly totals into periodic and upon request deliveries
Action A9: Assessed together with A2
- 222 -
Action A10: Incorporating national sunshine records into data centres Action National sunshine records should be incorporated into International Data
Centres.
Benefit Better description of surface radiation fields
Who NMHSs
Time frame Implement in next 2 years
Performance indicator
Sunshine record archive established in international data centres in analysis centres by 2018
Annual cost US$ 1–10 million
Assessment: 2 – Started but little progress
Sunshine data are available from selected archives (e.g. NOAA NCEI, ECA&D), but no comprehensive archives exist.
Sunshine duration (SD) is one of the most important and widely used parameters in climate monitoring and a key variable for various sectors, including tourism, public health, agriculture, vegetation modelling, and solar energy. SD is strongly related to the Essential Climate Variables cloud properties and surface radiation budget. Sunshine duration is often used as an input parameter for hydrological modelling and is a good predictor for the estimation of global radiation, where it can be also used for quality control of measured global radiation data.
Historical records of SD date back more than a century. In the mid-19th century, the Campbell–Stokes sunshine recorder was invented—much earlier than the first pyranometer. Even today, Campbell–Stokes recorders are still used by many National Meteorological and Hydrological Services (NMHSs) instead of a more complex measurement of solar radiation with pyranometers.
As SD data are a good proxy for global and direct solar radiation it allows to establish back-ward in time (“synthetic”) time series of solar surface radiation. However, within archives of in situ observations, sunshine data have often been of secondary importance compared to temperature and precipitation. Two central archives are available, one in Europe (ECA&D) and one in the US (NCEI) from which SD is available and accessible.
ECA&D (https://eca.knmi.nl/), which is maintained by KNMI, holds about 1000 time series from stations from about 23 European Countries. Naturally, the length of the time-series is highly variable. Some of them date back to 1888, but other start in the 1950s. About one third of them are still operating.
The Monthly Climatic Data for the World (MCDW) at NCEI contains 3215 stations that reported sunshine in at least one monthly CLIMAT message between 1986, the earliest year with such data, and 2020. As of June 2020, 1414 stations were reporting sunshine. A total of 222 of them had reported sunshine in at least 360 months, 629 in at least 120 months. Stations with sunshine records in CLIMAT messages are distributed over all continents. Among stations with at least 360 months of such data, North America has only one station.
- 223 -
The Global Historical Climatology Network – Daily (GHCNd) and Integrated Surface Data (ISD) datasets contain historical sunshine duration for the United States from 1965 until after the year 2000, though they have not been rigorously quality controlled (https://www.ncdc.noaa.gov/data-access/land-based-station-data/land-based-datasets/global-historical-climatology-network-ghcn). Climate quality radiation observations are available from the U.S. Climate Reference Network for the period 2001-present (https://www.ncdc.noaa.gov/data-access/land-based-station-data/land-based-datasets/us-climate-reference-network-uscrn).
In the United States and in European Countries, measurements of sunshine duration are no longer performed at many sites operated by the NMHSs. Meanwhile, satellite data are being used to provide SD (e.g. Kothe et al. (2013))
A call for NHMSs to share their sunshine data with central repositories (e.g., the Copernicus project or NOAA/NCEI) and to distribute real-time updates of these data would be valuable. Accordingly, this action should be combined with action A1 or action A2. Work by NOAA NCEI and C3S has highlighted substantial timescale variability in existing archive sources with SD generally better reported at monthly than daily or sub-daily resolutions.
References:
Kothe S., E. Good, A. Obregon and H. Nitsche, 2013: Satellite-Based Sunshine Duration for Europe, Remote Sensing, 5, 2943-2972; doi:10.3390/rs5062943
Action A11: Operation of the the GCOS Baseline Network for Surface Radiation
Action Ensure continued long-term operation of the BSRN and expand the network to obtain globally more representative coverage and improve communications between station operators and the archive centre1
Benefit Continuing baseline surface radiation climate record at BSRN sites
Who Parties’ national services and research programmes operating BSRN sites in cooperation with AOPC and the WCRP GEWEX Radiation Panel
Time frame Ongoing
Performance indicator
The number of BSRN stations regularly submitting valid data to international data centres
Annual cost US$ 100 000–1million
Assessment: 3 – Underway with significant progress.
Network is relatively stable with regular exchange of information on status of BSRN with GCOS ensured by attendance to AOPC meeting by BSRN project manager and to BSRN meeting by GCOS network manager
At the request of the GCOS Secretariat, Christian Lanconelli (BSRN Project Manager) and Amelie Driemel (World Radiation Monitoring Centre Director) provided an analysis on the number of BSRN stations regularly submitting valid data to international data centres, which is summarized below.
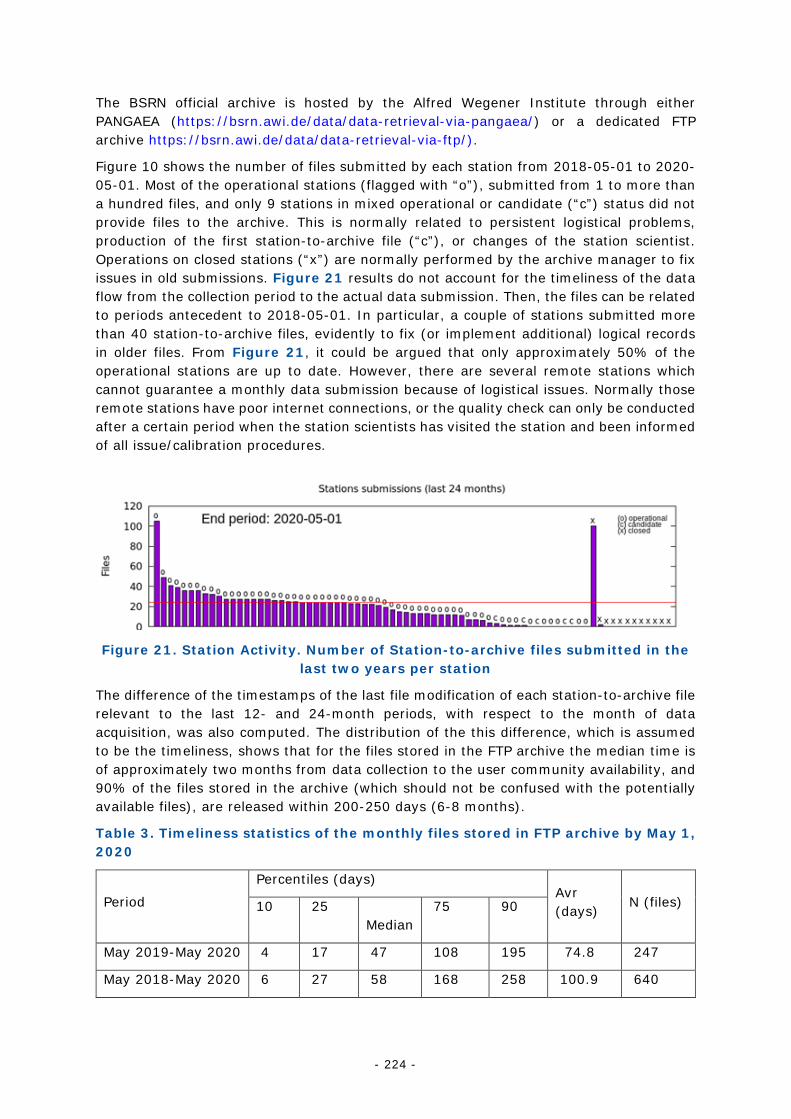
- 224 -
The BSRN official archive is hosted by the Alfred Wegener Institute through either PANGAEA (https://bsrn.awi.de/data/data-retrieval-via-pangaea/) or a dedicated FTP archive https://bsrn.awi.de/data/data-retrieval-via-ftp/).
Figure 10 shows the number of files submitted by each station from 2018-05-01 to 2020-05-01. Most of the operational stations (flagged with “o”), submitted from 1 to more than a hundred files, and only 9 stations in mixed operational or candidate (“c”) status did not provide files to the archive. This is normally related to persistent logistical problems, production of the first station-to-archive file (“c”), or changes of the station scientist. Operations on closed stations (“x”) are normally performed by the archive manager to fix issues in old submissions. Figure 21 results do not account for the timeliness of the data flow from the collection period to the actual data submission. Then, the files can be related to periods antecedent to 2018-05-01. In particular, a couple of stations submitted more than 40 station-to-archive files, evidently to fix (or implement additional) logical records in older files. From Figure 21, it could be argued that only approximately 50% of the operational stations are up to date. However, there are several remote stations which cannot guarantee a monthly data submission because of logistical issues. Normally those remote stations have poor internet connections, or the quality check can only be conducted after a certain period when the station scientists has visited the station and been informed of all issue/calibration procedures.
Figure 21. Station Activity. Number of Station-to-archive files submitted in the last two years per station
The difference of the timestamps of the last file modification of each station-to-archive file relevant to the last 12- and 24-month periods, with respect to the month of data acquisition, was also computed. The distribution of the this difference, which is assumed to be the timeliness, shows that for the files stored in the FTP archive the median time is of approximately two months from data collection to the user community availability, and 90% of the files stored in the archive (which should not be confused with the potentially available files), are released within 200-250 days (6-8 months).
Table 3. Timeliness statistics of the monthly files stored in FTP archive by May 1, 2020
Period
Percentiles (days) Avr (days)
N (files) 10 25 Median
75 90
May 2019-May 2020 4 17 47 108 195 74.8 247
May 2018-May 2020 6 27 58 168 258 100.9 640
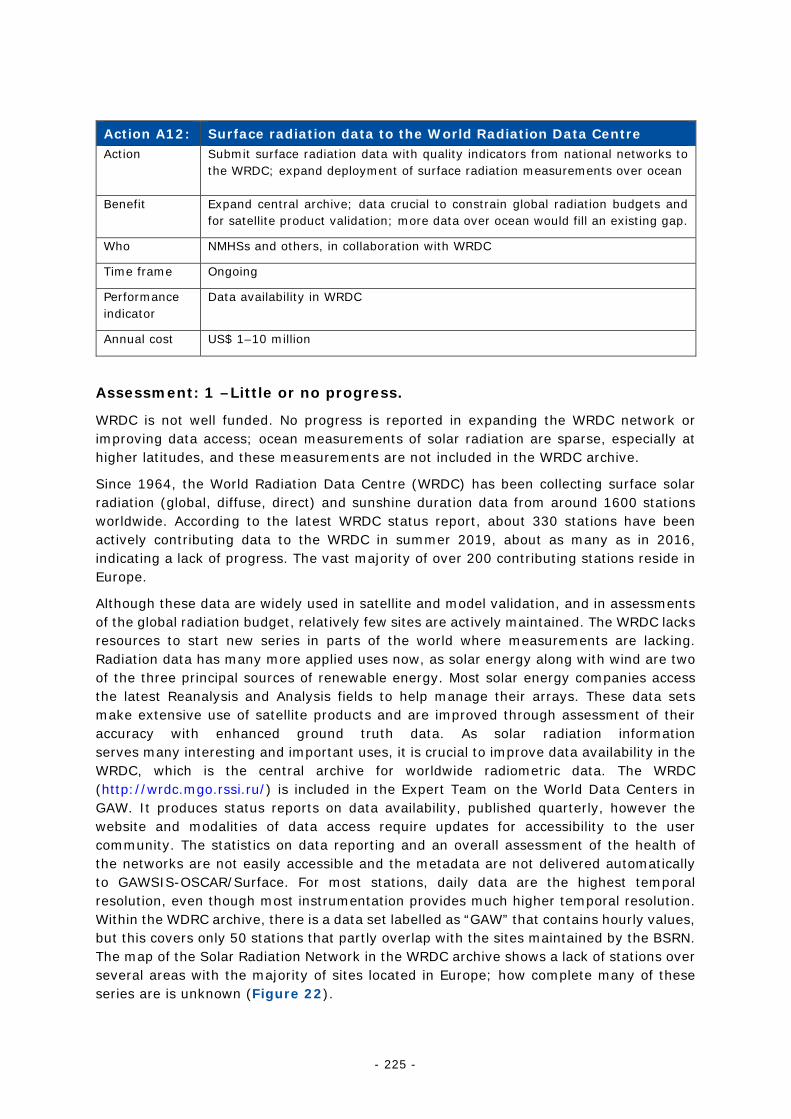
- 225 -
Action A12: Surface radiation data to the World Radiation Data Centre Action
Submit surface radiation data with quality indicators from national networks to the WRDC; expand deployment of surface radiation measurements over ocean
Benefit Expand central archive; data crucial to constrain global radiation budgets and for satellite product validation; more data over ocean would fill an existing gap.
Who NMHSs and others, in collaboration with WRDC
Time frame Ongoing
Performance indicator
Data availability in WRDC
Annual cost US$ 1–10 million
Assessment: 1 –Little or no progress.
WRDC is not well funded. No progress is reported in expanding the WRDC network or improving data access; ocean measurements of solar radiation are sparse, especially at higher latitudes, and these measurements are not included in the WRDC archive.
Since 1964, the World Radiation Data Centre (WRDC) has been collecting surface solar radiation (global, diffuse, direct) and sunshine duration data from around 1600 stations worldwide. According to the latest WRDC status report, about 330 stations have been actively contributing data to the WRDC in summer 2019, about as many as in 2016, indicating a lack of progress. The vast majority of over 200 contributing stations reside in Europe.
Although these data are widely used in satellite and model validation, and in assessments of the global radiation budget, relatively few sites are actively maintained. The WRDC lacks resources to start new series in parts of the world where measurements are lacking. Radiation data has many more applied uses now, as solar energy along with wind are two of the three principal sources of renewable energy. Most solar energy companies access the latest Reanalysis and Analysis fields to help manage their arrays. These data sets make extensive use of satellite products and are improved through assessment of their accuracy with enhanced ground truth data. As solar radiation information serves many interesting and important uses, it is crucial to improve data availability in the WRDC, which is the central archive for worldwide radiometric data. The WRDC (http://wrdc.mgo.rssi.ru/) is included in the Expert Team on the World Data Centers in GAW. It produces status reports on data availability, published quarterly, however the website and modalities of data access require updates for accessibility to the user community. The statistics on data reporting and an overall assessment of the health of the networks are not easily accessible and the metadata are not delivered automatically to GAWSIS-OSCAR/Surface. For most stations, daily data are the highest temporal resolution, even though most instrumentation provides much higher temporal resolution. Within the WDRC archive, there is a data set labelled as “GAW” that contains hourly values, but this covers only 50 stations that partly overlap with the sites maintained by the BSRN. The map of the Solar Radiation Network in the WRDC archive shows a lack of stations over several areas with the majority of sites located in Europe; how complete many of these series are is unknown (Figure 22).
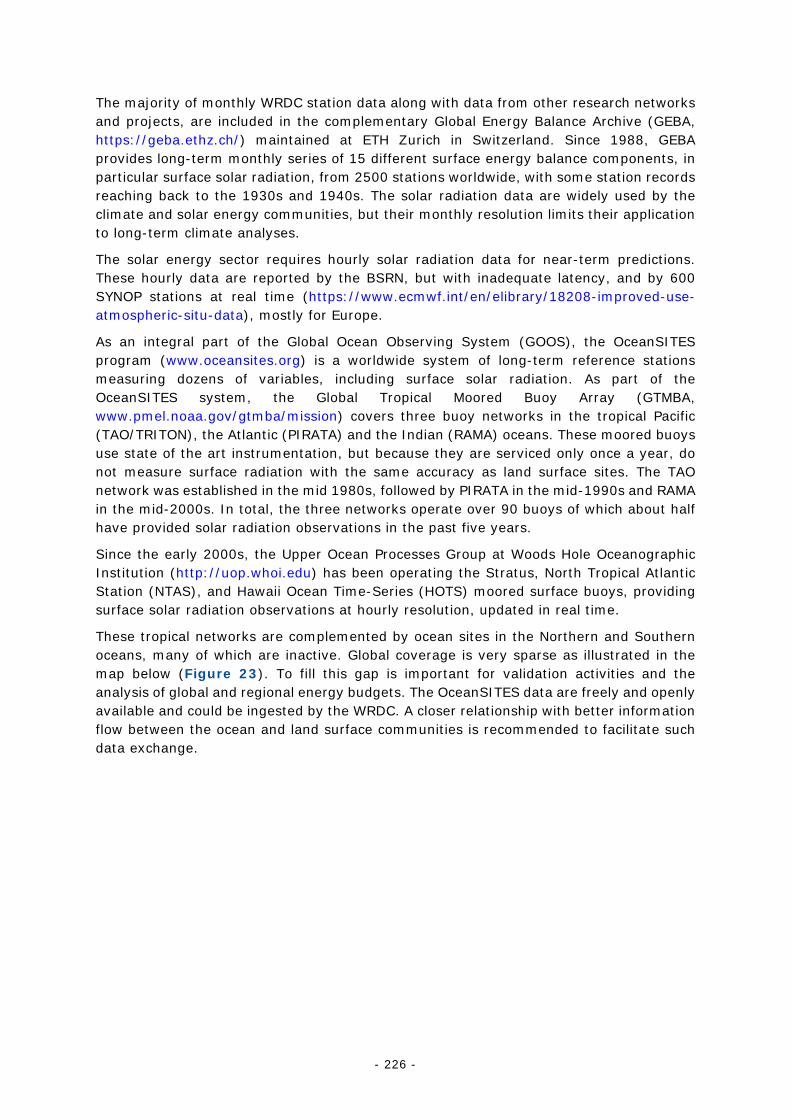
- 226 -
The majority of monthly WRDC station data along with data from other research networks and projects, are included in the complementary Global Energy Balance Archive (GEBA, https://geba.ethz.ch/) maintained at ETH Zurich in Switzerland. Since 1988, GEBA provides long-term monthly series of 15 different surface energy balance components, in particular surface solar radiation, from 2500 stations worldwide, with some station records reaching back to the 1930s and 1940s. The solar radiation data are widely used by the climate and solar energy communities, but their monthly resolution limits their application to long-term climate analyses.
The solar energy sector requires hourly solar radiation data for near-term predictions. These hourly data are reported by the BSRN, but with inadequate latency, and by 600 SYNOP stations at real time (https://www.ecmwf.int/en/elibrary/18208-improved-use-atmospheric-situ-data), mostly for Europe.
As an integral part of the Global Ocean Observing System (GOOS), the OceanSITES program (www.oceansites.org) is a worldwide system of long-term reference stations measuring dozens of variables, including surface solar radiation. As part of the OceanSITES system, the Global Tropical Moored Buoy Array (GTMBA, www.pmel.noaa.gov/gtmba/mission) covers three buoy networks in the tropical Pacific (TAO/TRITON), the Atlantic (PIRATA) and the Indian (RAMA) oceans. These moored buoys use state of the art instrumentation, but because they are serviced only once a year, do not measure surface radiation with the same accuracy as land surface sites. The TAO network was established in the mid 1980s, followed by PIRATA in the mid-1990s and RAMA in the mid-2000s. In total, the three networks operate over 90 buoys of which about half have provided solar radiation observations in the past five years.
Since the early 2000s, the Upper Ocean Processes Group at Woods Hole Oceanographic Institution (http://uop.whoi.edu) has been operating the Stratus, North Tropical Atlantic Station (NTAS), and Hawaii Ocean Time-Series (HOTS) moored surface buoys, providing surface solar radiation observations at hourly resolution, updated in real time.
These tropical networks are complemented by ocean sites in the Northern and Southern oceans, many of which are inactive. Global coverage is very sparse as illustrated in the map below (Figure 23). To fill this gap is important for validation activities and the analysis of global and regional energy budgets. The OceanSITES data are freely and openly available and could be ingested by the WRDC. A closer relationship with better information flow between the ocean and land surface communities is recommended to facilitate such data exchange.
- 227 -
Figure 22. Stations in the WRDC
Figure 23. OceanSITES: Number of platforms by status in July 2020
- 228 -
Action A13: Implement vision for future of GCOS Upper-Air Network operation Action Show demonstrable steps towards implementing the vision articulated in the GCOS
Networks Meeting in 201453 relating to the future of GUAN operation
Benefit Improved data quality, better integrated with GRUAN and more closely aligned with WIGOS framework
Who Task team of AOPC with GCOS Secretariat in collaboration with relevant WMO commissions and WIGOS
Time frame 2019 for adoption at Nineteenth World Meteorological Congress
Performance indicator
Annual reporting in progress at AOPC of task team
Annual cost US$ 100 000–1 million
Assessment: 3 – Underway with significant progress.
Task team met and produced better fleshed out requirements; if instigated in full and all GUAN sites were included, the Global Basic Observation Network (GBON) would meet many of the aims articulated in the 2014 GCOS Networks Meeting.
A task team was set up by AOPC to further this action. This group met in person at the GRUAN Lead Centre in Lindenberg, Germany, in 2017 and produced a report (GCOS-21554). This report further highlighted a number of issues and options regarding the future of GUAN. Thereafter resource commitments precluded significant progress on the matter by the task team. GCOS Secretariat presented the outcomes and recommendations of the TT to several WMO meetings including CIMO TECO (Oct 2018). In general, there has been good support for the ‘revised’ GUAN and it’s stronger links with GRUAN. However, the proposal continues to lack leadership and a dedicated Lead Center with no offers of interest from WMO Member countries. Whilst any implementation would have the technical support of the GCOS Network Manager this is not an activity that can be led by GCOS secretariat.
The WIGOS proposal for a Global Basic Observing Network (GBON) the principal of which was approved by WMO Congress (2019) has significant synergies with the GUAN proposal and thus their implementations should be closely aligned. The scoped GBON network proposal would instigate a global network of radiosonde sites at a spacing much finer than that of GUAN and requiring ascents to 30hPa with 50 m (10 second) resolution. There will be a finance fund to support GBON and the continued role of the GCOS funding support would come into question. There are a lot of unknowns, not least of which is will GBON be approved and made operational. The expectation is that GUAN will become an underpinning component of the GBON network, not only acting as a baseline network but ensuring that those stations with long-term archives (many greater than 50 years) are sustained.
53 GCOS-182: http://www.wmo.int/pages/prog/gcos/Publications/gcos-182.pdf 54 GCOS-215: https://library.wmo.int/doc_num.php?explnum_id=4469
- 229 -
Action A14: Evaluation of benefits for the GCOS Upper-Air Network Action Quantify the benefits of aspects of GUAN operation including attaining 30 hPa or
10 hPa, twice-daily as opposed to daily ascents and the value of remote island GUAN sites
Benefit Better guidance to GUAN management, improved scientific rationale for decision-making
Who NWP and reanalysis centres
Time frame Completed by 2018
Performance indicator
Published analysis (in peer reviewed literature plus longer report)
Annual cost US$ 10 000–100 000
Assessment: 3 – Underway with significant progress.
Task-Team was established by GCOS to review the GUAN and generated a report (GCOS,2015) and a number of recommendations. This has resulted in further work to scientifically qualify the GUAN, and the comprehensive global network, requirements.
AOPC-22 (Exeter, UK, March 2017) agreed on the creation of a dedicated task-team to deliver progress upon a number of actions in the GCOS Implementation Plan (GCOS 200) related to the operation and monitoring of the GCOS Upper Air Network:
• Reviewing the network requirements; • Assessing and documenting the benefits of meeting stated requirements; • How it contributes as a baseline network in the tiered network framework with the
GCOS Upper-Air Network (GRUAN) and the comprehensive network. Report from the first meeting including recommendations on the future development of the GUAN was published as: GCOS, 21555. Report from 1st Meeting of the Task Team GCOS Upper Air Network (TT-GUAN-1).
SWOT (Strengths, weaknesses, Opportunities and Threats) analysis agreed by TT-GUAN is shown in Figure 24.
55 GCOS-215: https://library.wmo.int/doc_num.php?explnum_id=4469
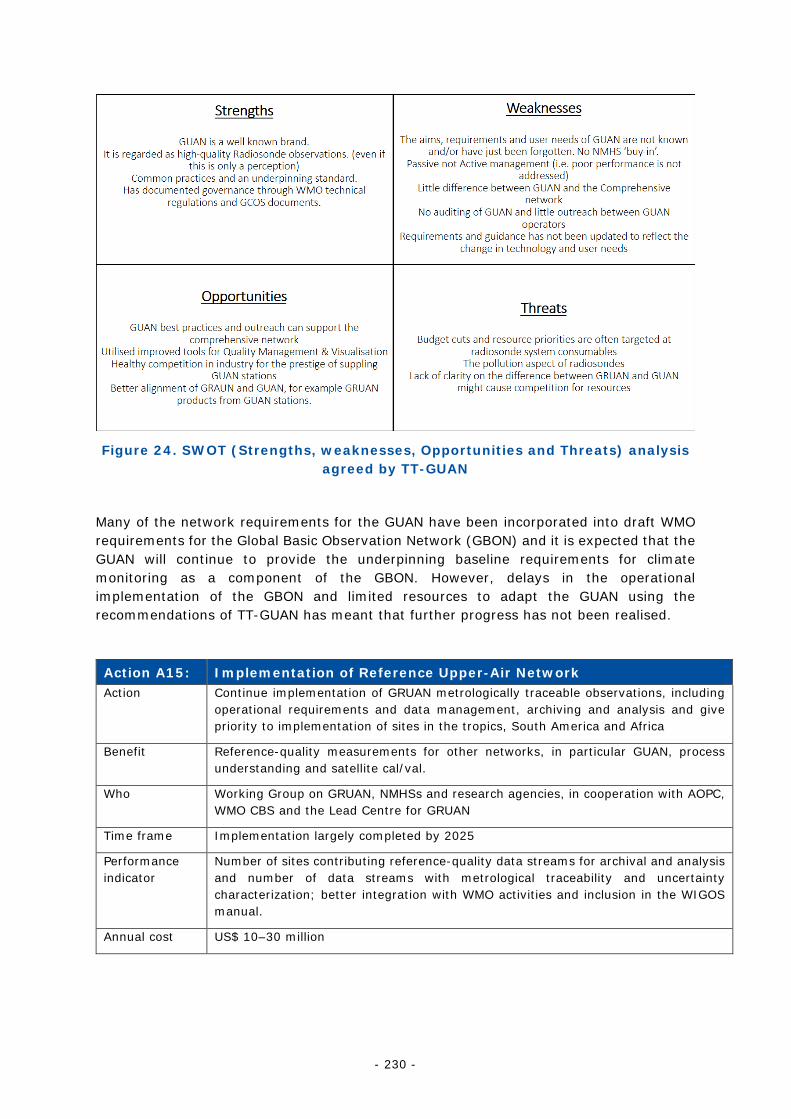
- 230 -
Figure 24. SWOT (Strengths, weaknesses, Opportunities and Threats) analysis agreed by TT-GUAN
Many of the network requirements for the GUAN have been incorporated into draft WMO requirements for the Global Basic Observation Network (GBON) and it is expected that the GUAN will continue to provide the underpinning baseline requirements for climate monitoring as a component of the GBON. However, delays in the operational implementation of the GBON and limited resources to adapt the GUAN using the recommendations of TT-GUAN has meant that further progress has not been realised.
Action A15: Implementation of Reference Upper-Air Network Action Continue implementation of GRUAN metrologically traceable observations, including
operational requirements and data management, archiving and analysis and give priority to implementation of sites in the tropics, South America and Africa
Benefit Reference-quality measurements for other networks, in particular GUAN, process understanding and satellite cal/val.
Who Working Group on GRUAN, NMHSs and research agencies, in cooperation with AOPC, WMO CBS and the Lead Centre for GRUAN
Time frame Implementation largely completed by 2025
Performance indicator
Number of sites contributing reference-quality data streams for archival and analysis and number of data streams with metrological traceability and uncertainty characterization; better integration with WMO activities and inclusion in the WIGOS manual.
Annual cost US$ 10–30 million
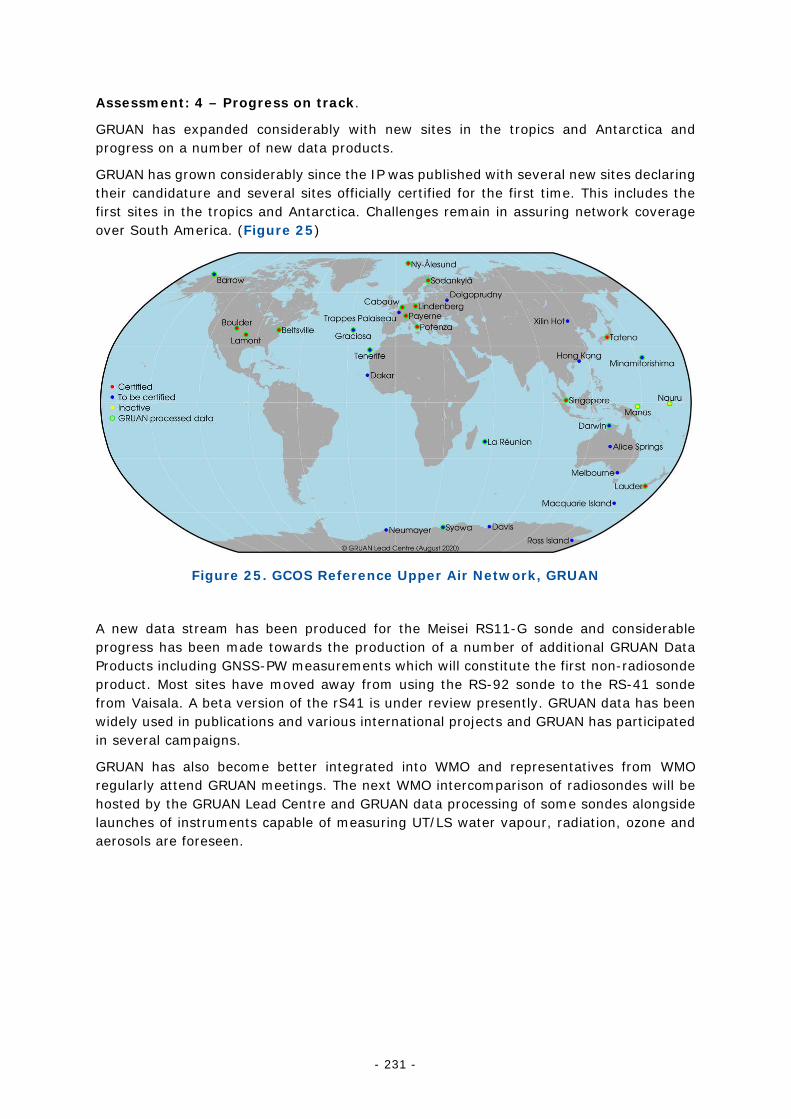
- 231 -
Assessment: 4 – Progress on track.
GRUAN has expanded considerably with new sites in the tropics and Antarctica and progress on a number of new data products.
GRUAN has grown considerably since the IP was published with several new sites declaring their candidature and several sites officially certified for the first time. This includes the first sites in the tropics and Antarctica. Challenges remain in assuring network coverage over South America. (Figure 25)
Figure 25. GCOS Reference Upper Air Network, GRUAN
A new data stream has been produced for the Meisei RS11-G sonde and considerable progress has been made towards the production of a number of additional GRUAN Data Products including GNSS-PW measurements which will constitute the first non-radiosonde product. Most sites have moved away from using the RS-92 sonde to the RS-41 sonde from Vaisala. A beta version of the rS41 is under review presently. GRUAN data has been widely used in publications and various international projects and GRUAN has participated in several campaigns.
GRUAN has also become better integrated into WMO and representatives from WMO regularly attend GRUAN meetings. The next WMO intercomparison of radiosondes will be hosted by the GRUAN Lead Centre and GRUAN data processing of some sondes alongside launches of instruments capable of measuring UT/LS water vapour, radiation, ozone and aerosols are foreseen.
- 232 -
Action A16: Implementation of satellite calibration missions Action Implement a sustained satellite climate calibration mission or missions
Benefit Improved quality of satellite radiance data for climate monitoring
Who Space agencies
Time frame Ongoing
Performance indicator
Commitment to implement by the next status report in 2020; proof-of-concept proven on ISS pathfinder
Annual cost US$ 100–300 million
Assessment: 4 – Progress on track.
The current launch readiness timeframe for CLARREO Pathfinder is 2023. The ESA TRUTHS mission has been funded. The launch of LIBRA is scheduled for around 2025.
Climate trend analysis and monitoring depends on high accuracy observations with well-characterized errors and uncertainty. The latter is especially important when measurements from different sensors and sources are combined to form long term climate records. To this end, the Climate Absolute Radiance and Refractivity Observatory (CLARREO; Wielicki et al., 2013) was proposed to include an infrared and reflected solar spectrometer to function as SI traceable reference standards in space for the optimization and inter-calibration of measurements from a number of different space-based instruments.
To date, the CLARREO infrared spectrometer (Tobin et al., 2016) remains unfunded, with no funding commitment. Despite this, Taylor et al. (2020) demonstrated a new technology and implementation approach with the Absolute Radiance Interferometer (ARI) instrument (Taylor et al. 2020). They continue to make a strong case for an infrared CLARREO Pathfinder that would initiate an ongoing sequence of missions to better inter-calibrate operational sounders (e.g., AIRS, IASI, CrIS) and accurately quantify long-term climate trends of Earth emission.
The CLARREO solar reflectance spectrometer (Goldin et al. 2019) was identified as a Pathfinder mission and funded to have a place on the International Space Station (ISS). The goal of this CLARREO Pathfinder mission is to be the benchmark system for VIIRS and CERES. Specifically, it will provide an accurate estimate of uncertainty due to polarization that can then be used to correct VIIRS and CERES radiance/reflectance calibration. The 2017 Earth Science Decadal Survey also recommended to NASA that it completed the CPF mission. The current launch readiness timeframe is 2023. The CPF operations timeframe is confirmed for one year on ISS, and the mission includes an additional year for science data analysis. However, an extension of the one year of operations on ISS is currently being advocated.
The UK’s National Physical Laboratory has similarly proposed a mission Traceable Radiometry Underpinning Terrestrial- and Helio- Studies (TRUTHS) which has been funded as an ESA earthwatch mission in 2019 to be launched in the mid-2020s. This mission is concerned with measurements in the visible and near infra-red portions of the spectrum. It will fly in a processing truly polar orbit and has an absolute traceability. Further details can be found at https://www.npl.co.uk/earth-observation/truths.
- 233 -
The Chinese Space-based Radiometric Benchmark (CSRB) project has been under development since 2014. Its goal is to launch a reference-type satellite named LIBRA around 2025. LIBRA will offer measurements with SI traceability for the outgoing radiation from the Earth and the incoming radiation from the Sun with high spectral resolution. The system will be realized with four payloads, i.e., the Infrared Spectrometer (IRS), the Earth-Moon Imaging Spectrometer (EMIS), the Total Solar Irradiance (TSI), and the Solar spectral Irradiance Traceable to Quantum benchmark (SITQ). As a complementary project to CLARREO and TRUTHS, LIBRA is expected to join the Earth observation satellite constellation and intends to contribute to space-based climate studies via publicly available data. More information can be found in Peng Zhang et al. (2020).
References:
Goldin, D., X. Xiong, Y. Shea and C. Lukashin. 2019: CLARREO Pathfinder/VIIRS Intercalibration: Quantifying the Polarization Effects on Reflectance and the Intercalibration Uncertainty. Remote Sensing, 11, 1914, https://doi.org/10.3390/rs11161914.
Taylor, J.K. H.E. Revercomb, F.A. Best, D.C. Tobin, and P.J. Gero. 2020: The Infrared Absolute Radiance Interferometer (ARI) for CLARREO. Remote Sensing, 12, 1915, https://doi.org/10.3390/rs12121915.
Tobin, D., R. Holz, F. Nagle and H. Revercomb. 2016: Characterization of the Climate Absolute Radiance and Refractivity Observatory (CLARREO) ability to serve as an infrared satellite intercalibration reference. Journal of Geophysical Research Atmosphere, 121, 4258–4271, https://doi.org/10.1002/2016JD024770.
Wielicki, B.A. et al. 2013: Achieving climate change absolute accuracy in orbit, Bulletin American Meteorological Society, 10, 1519–1539, https://doi.org/10.1175/BAMS-D-12-00149.1.
Action A17: Retain original measured values for radiosonde data Action For radiosonde data and any other data that require substantive processing from the
original measurement (e.g. digital counts) to the final estimate of the measurand (e.g. T and q profiles through the lower stratosphere); the original measured values should be retained to allow subsequent reprocessing.
Benefit Possibility to reprocess data as required, improved data provenance
Who HMEI (manufacturers), NMHSs, archival centres.
Time frame Ongoing.
Performance indicator
Original measurement raw data and metadata available at recognized repositories
Annual cost US$ 100 000–1million
Assessment: 1 – Little or no progress.
Discussions have occurred with Copernicus Climate Change Service as to whether this may be of interest in the next phase of their operation and the topic is further discussed in the GUAN TT report but there has been no concrete progress.
- 234 -
In terms of radiosonde ‘raw’ data, with the exception of GRUAN stations, the only archive of this type of measurements is the station (radiosonde ground-system) itself. That said many stations are now reporting the full-resolution data, which although is not the uncorrected (raw) measurements, this does allow the user to access all of the data measured by the radiosonde.
In terms of the performance indicator this target has not been met, but further steps can still be taken to document a process to obtain the original data and identify a repository to archive them. This requires funding support and the Copernicus Climate Change Service have been approached to this end.
Action A18: Hyperspectral radiances reprocessing Action Undertake a programme of consistent reprocessing of the satellite hyperspectral
sounder radiances
Benefit Consistent time series of hyperspectral radiances for monitoring and reanalyses, improved CDRs computed from the FCDRs
Who Space agencies
Time frame Ongoing
Performance indicator
Reprocessed FCDRs available for hyperspectral sounders
Annual cost US$ 100 000–1 million
Assessment: 4 – Progress on track.
Hyperspectral sounder radiances have been carefully assessed and those generated with old algorithms have been reprocessed with updated ones.
The hyperspectral infrared sounders (e.g. AIRS, IASI and CrIS) in sun-synchronous low-Earth orbits measure radiances with much higher spectral resolution than conventional sounders and enable the profiling of temperature and humidity, and measurement of concentrations of trace gases with high vertical resolution. They also provide a benchmark for intercalibration of observations from different instruments in orbit and enable those instruments to make better characterised measurements as undertaken within the GSICS initiative. Ensuring consistent time series of hyperspectral radiances is essential for improving CDRs computed from them as well as for providing reanalyses with high-quality observations to be assimilated and a reliable reference-series against which they can be assessed.
AIRS on the EOS Aqua satellite, launched in 2002, provides the longest record of hyperspectral radiances. AIRS channel properties and radiance uncertainty are well characterized and has been closely monitored by the NASA AIRS Science Team. Pagano et al. (2020) recently demonstrated its radiometric and spectral accuracy and stability; and provided the latest assessment of measurement uncertainty.
IASIs are flying on board the Metop satellites, launched in 2006 (Metop-A), 2012 (Metop-B) and 2018 (Metop-C). EUMETSAT has reprocessed the radiances from IASI on board Metop-A for the 2007-2017 period with the most recent version of the algorithm, making them consistent with both those generated after 2017 and from IASI on board Metop-B.
- 235 -
Impact of the past algorithm updates on radiances has also be assessed (Bouillon et al., 2020).
Radiances from CrIS onboard the JPSS series of satellites, launched in 2011 (Suomi NPP) and 2017 (JPSS-1), have recently been reprocessed with an updated calibration algorithm with improvements in radiometric and spectral accuracy (Chen et al., 2017). NASA maintains a commitment to reprocess the full record of AIRS (a grating spectrometer) and CrIS (a Michelson interferometer like IASI) as Level 1B calibrated radiances whenever significant gains have been made in their respective calibration algorithms.
References:
Bouillon, M, S. Safieddine, J. Hadji-Lazaro, S. Whitburn, L. Clarisse, M. Doutriaux-Boucher, D. Coppens, T. August, E. Jacquette and C. Clerbaux, 2020: Ten-year assessment of IASI radiance and temperature. Remote Sensing, 12: 2393. https://doi.org/10.3390/rs12152393.
Chen, Y., Y. Han and F. Weng, 2017: Reprocessing of Suomi NPP CrIS sensor data records and impacts on radiometric and spectral long-term accuracy and stability. In 2017 IEEE International Geoscience and Remote Sensing Symposium (IGARSS). 4178–4181. https://doi.org/10.1109/IGARSS.2017.8127922.
Pagano, T. S., H. H. Aumann, S. E. Broberg, C. Cañas, E. M. Manning, K. O. Overoye and R. C. Wilson, 2020: SI-traceability and measurement uncertainty of the Atmospheric Infrared Sounder Version 5 Level 1B radiances. Remote Sensing, 12: 1338. https://doi.org/10.3390/rs12081338.
Action A19: Reprocessing of atmospheric motion vectors Action Continue reprocessing of AMVs derived from geostationary satellite imagery in a
coordinated manner across agencies
Benefit Consistent time series of AMVs for monitoring and reanalyses, improved CDRs computed from the FCDRs
Who Space agencies
Time frame Ongoing
Performance indicator
Reprocessed FCDRs available for upper-air winds
Annual cost US$ 100 000–1 million
Assessment: 4 – Progress on track.
Reprocessing has been undertaken by European, Japanese and the United States producers, but reprocessing needs to be recognised as a continuous ongoing requirement.
The atmospheric motion vectors (AMVs) are one of the sources of wind information and obtained by tracking cloud elements between successive satellite images and assigning their height by measuring their temperature to provide “satellite winds”. Since this technique has been continuously improved to provide better observations for NWP (e.g. Santek et al., 2019), use of AMVs produced operationally in earlier periods is not adequate
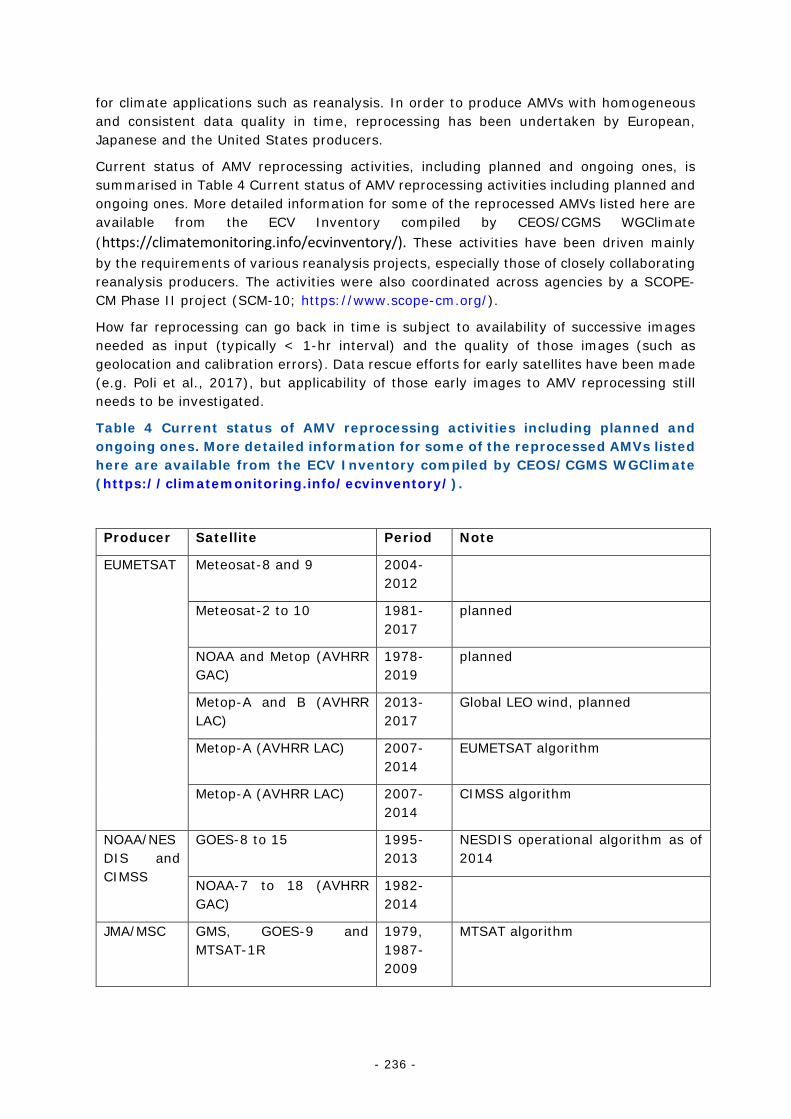
- 236 -
for climate applications such as reanalysis. In order to produce AMVs with homogeneous and consistent data quality in time, reprocessing has been undertaken by European, Japanese and the United States producers.
Current status of AMV reprocessing activities, including planned and ongoing ones, is summarised in Table 4 Current status of AMV reprocessing activities including planned and ongoing ones. More detailed information for some of the reprocessed AMVs listed here are available from the ECV Inventory compiled by CEOS/CGMS WGClimate (https://climatemonitoring.info/ecvinventory/). These activities have been driven mainly by the requirements of various reanalysis projects, especially those of closely collaborating reanalysis producers. The activities were also coordinated across agencies by a SCOPE-CM Phase II project (SCM-10; https://www.scope-cm.org/).
How far reprocessing can go back in time is subject to availability of successive images needed as input (typically < 1-hr interval) and the quality of those images (such as geolocation and calibration errors). Data rescue efforts for early satellites have been made (e.g. Poli et al., 2017), but applicability of those early images to AMV reprocessing still needs to be investigated.
Table 4 Current status of AMV reprocessing activities including planned and ongoing ones. More detailed information for some of the reprocessed AMVs listed here are available from the ECV Inventory compiled by CEOS/CGMS WGClimate (https://climatemonitoring.info/ecvinventory/).
Producer Satellite Period Note
EUMETSAT Meteosat-8 and 9 2004-2012
Meteosat-2 to 10 1981-2017
planned
NOAA and Metop (AVHRR GAC)
1978-2019
planned
Metop-A and B (AVHRR LAC)
2013-2017
Global LEO wind, planned
Metop-A (AVHRR LAC) 2007-2014
EUMETSAT algorithm
Metop-A (AVHRR LAC) 2007-2014
CIMSS algorithm
NOAA/NESDIS and CIMSS
GOES-8 to 15 1995-2013
NESDIS operational algorithm as of 2014
NOAA-7 to 18 (AVHRR GAC)
1982-2014
JMA/MSC GMS, GOES-9 and MTSAT-1R
1979, 1987-2009
MTSAT algorithm
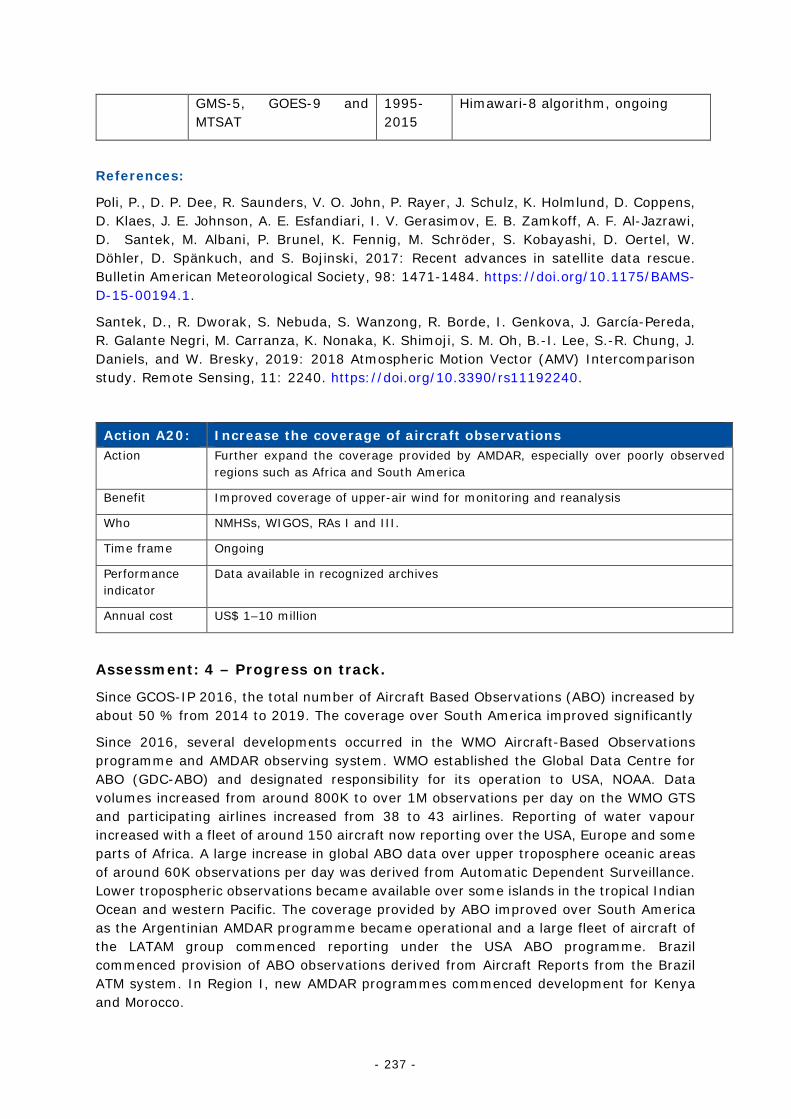
- 237 -
GMS-5, GOES-9 and MTSAT
1995-2015
Himawari-8 algorithm, ongoing
References:
Poli, P., D. P. Dee, R. Saunders, V. O. John, P. Rayer, J. Schulz, K. Holmlund, D. Coppens, D. Klaes, J. E. Johnson, A. E. Esfandiari, I. V. Gerasimov, E. B. Zamkoff, A. F. Al-Jazrawi, D. Santek, M. Albani, P. Brunel, K. Fennig, M. Schröder, S. Kobayashi, D. Oertel, W. Döhler, D. Spänkuch, and S. Bojinski, 2017: Recent advances in satellite data rescue. Bulletin American Meteorological Society, 98: 1471-1484. https://doi.org/10.1175/BAMS-D-15-00194.1.
Santek, D., R. Dworak, S. Nebuda, S. Wanzong, R. Borde, I. Genkova, J. García-Pereda, R. Galante Negri, M. Carranza, K. Nonaka, K. Shimoji, S. M. Oh, B.-I. Lee, S.-R. Chung, J. Daniels, and W. Bresky, 2019: 2018 Atmospheric Motion Vector (AMV) Intercomparison study. Remote Sensing, 11: 2240. https://doi.org/10.3390/rs11192240.
Action A20: Increase the coverage of aircraft observations Action Further expand the coverage provided by AMDAR, especially over poorly observed
regions such as Africa and South America
Benefit Improved coverage of upper-air wind for monitoring and reanalysis
Who NMHSs, WIGOS, RAs I and III.
Time frame Ongoing
Performance indicator
Data available in recognized archives
Annual cost US$ 1–10 million
Assessment: 4 – Progress on track.
Since GCOS-IP 2016, the total number of Aircraft Based Observations (ABO) increased by about 50 % from 2014 to 2019. The coverage over South America improved significantly
Since 2016, several developments occurred in the WMO Aircraft-Based Observations programme and AMDAR observing system. WMO established the Global Data Centre for ABO (GDC-ABO) and designated responsibility for its operation to USA, NOAA. Data volumes increased from around 800K to over 1M observations per day on the WMO GTS and participating airlines increased from 38 to 43 airlines. Reporting of water vapour increased with a fleet of around 150 aircraft now reporting over the USA, Europe and some parts of Africa. A large increase in global ABO data over upper troposphere oceanic areas of around 60K observations per day was derived from Automatic Dependent Surveillance. Lower tropospheric observations became available over some islands in the tropical Indian Ocean and western Pacific. The coverage provided by ABO improved over South America as the Argentinian AMDAR programme became operational and a large fleet of aircraft of the LATAM group commenced reporting under the USA ABO programme. Brazil commenced provision of ABO observations derived from Aircraft Reports from the Brazil ATM system. In Region I, new AMDAR programmes commenced development for Kenya and Morocco.
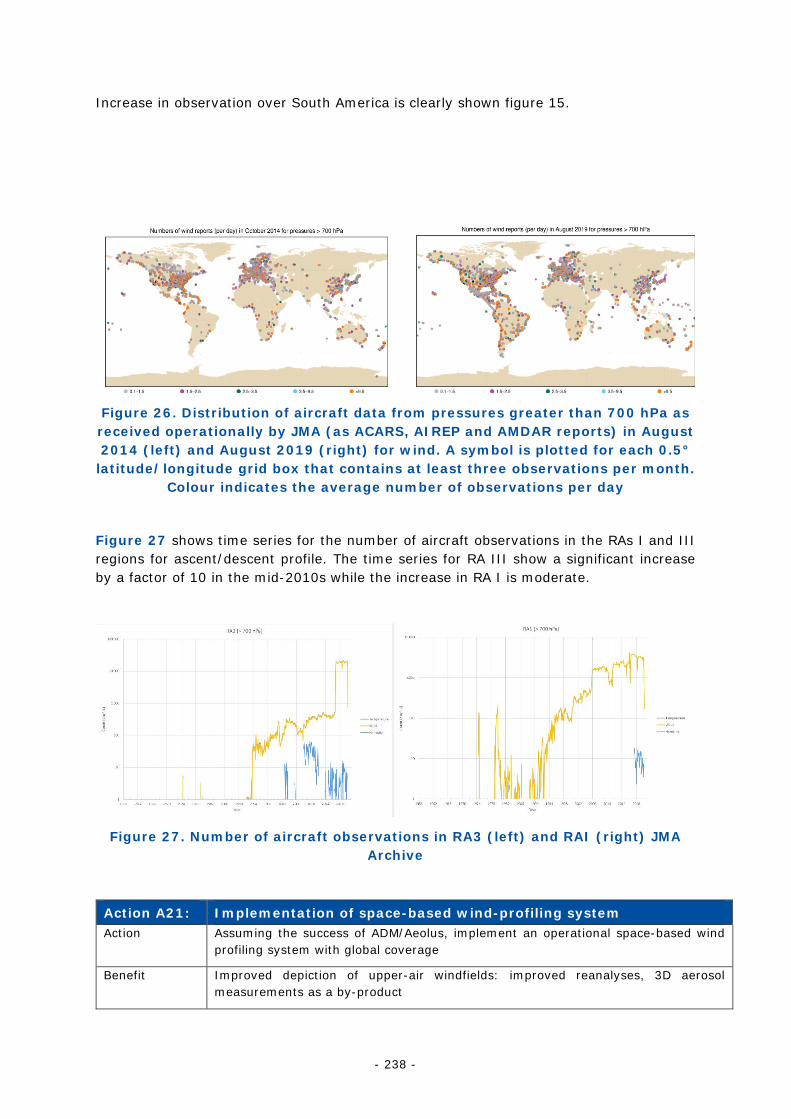
- 238 -
Increase in observation over South America is clearly shown figure 15.
Figure 26. Distribution of aircraft data from pressures greater than 700 hPa as received operationally by JMA (as ACARS, AIREP and AMDAR reports) in August 2014 (left) and August 2019 (right) for wind. A symbol is plotted for each 0.5°
latitude/longitude grid box that contains at least three observations per month. Colour indicates the average number of observations per day
Figure 27 shows time series for the number of aircraft observations in the RAs I and III regions for ascent/descent profile. The time series for RA III show a significant increase by a factor of 10 in the mid-2010s while the increase in RA I is moderate.
Figure 27. Number of aircraft observations in RA3 (left) and RAI (right) JMA Archive
Action A21: Implementation of space-based wind-profiling system Action Assuming the success of ADM/Aeolus, implement an operational space-based wind
profiling system with global coverage
Benefit Improved depiction of upper-air windfields: improved reanalyses, 3D aerosol measurements as a by-product
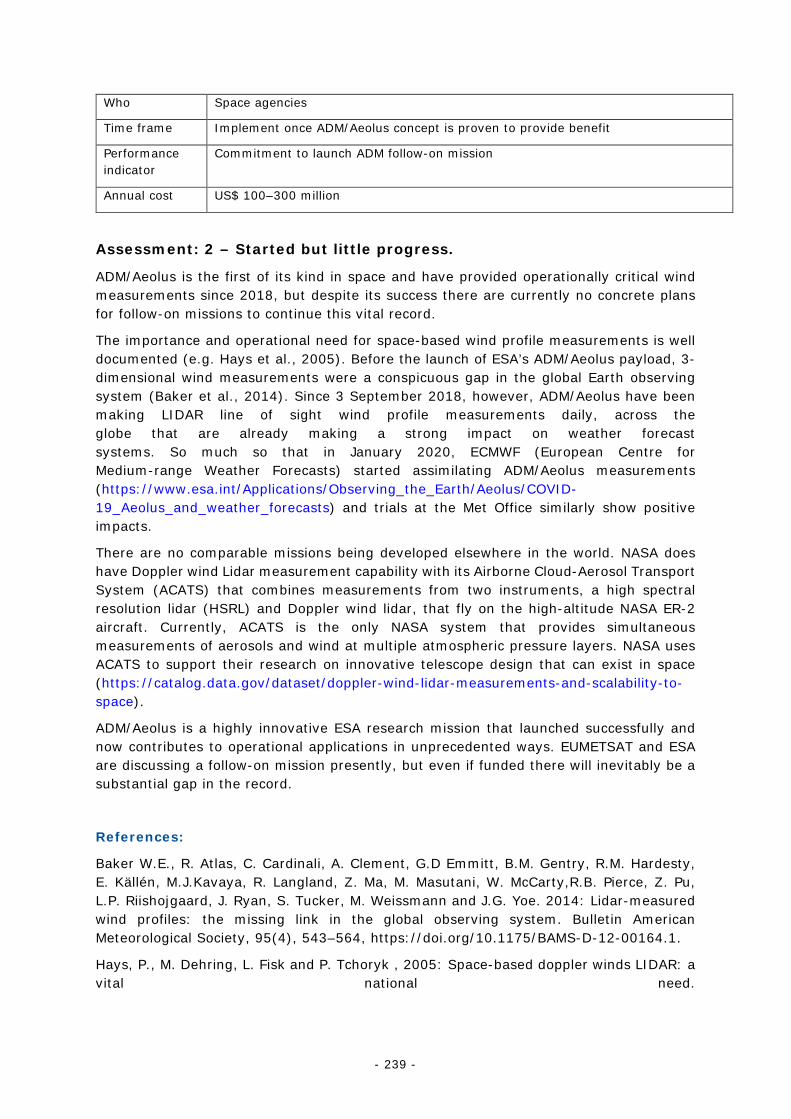
- 239 -
Who Space agencies
Time frame Implement once ADM/Aeolus concept is proven to provide benefit
Performance indicator
Commitment to launch ADM follow-on mission
Annual cost US$ 100–300 million
Assessment: 2 – Started but little progress.
ADM/Aeolus is the first of its kind in space and have provided operationally critical wind measurements since 2018, but despite its success there are currently no concrete plans for follow-on missions to continue this vital record.
The importance and operational need for space-based wind profile measurements is well documented (e.g. Hays et al., 2005). Before the launch of ESA’s ADM/Aeolus payload, 3-dimensional wind measurements were a conspicuous gap in the global Earth observing system (Baker et al., 2014). Since 3 September 2018, however, ADM/Aeolus have been making LIDAR line of sight wind profile measurements daily, across the globe that are already making a strong impact on weather forecast systems. So much so that in January 2020, ECMWF (European Centre for Medium-range Weather Forecasts) started assimilating ADM/Aeolus measurements (https://www.esa.int/Applications/Observing_the_Earth/Aeolus/COVID-19_Aeolus_and_weather_forecasts) and trials at the Met Office similarly show positive impacts.
There are no comparable missions being developed elsewhere in the world. NASA does have Doppler wind Lidar measurement capability with its Airborne Cloud-Aerosol Transport System (ACATS) that combines measurements from two instruments, a high spectral resolution lidar (HSRL) and Doppler wind lidar, that fly on the high-altitude NASA ER-2 aircraft. Currently, ACATS is the only NASA system that provides simultaneous measurements of aerosols and wind at multiple atmospheric pressure layers. NASA uses ACATS to support their research on innovative telescope design that can exist in space (https://catalog.data.gov/dataset/doppler-wind-lidar-measurements-and-scalability-to-space).
ADM/Aeolus is a highly innovative ESA research mission that launched successfully and now contributes to operational applications in unprecedented ways. EUMETSAT and ESA are discussing a follow-on mission presently, but even if funded there will inevitably be a substantial gap in the record.
References:
Baker W.E., R. Atlas, C. Cardinali, A. Clement, G.D Emmitt, B.M. Gentry, R.M. Hardesty, E. Källén, M.J.Kavaya, R. Langland, Z. Ma, M. Masutani, W. McCarty,R.B. Pierce, Z. Pu, L.P. Riishojgaard, J. Ryan, S. Tucker, M. Weissmann and J.G. Yoe. 2014: Lidar-measured wind profiles: the missing link in the global observing system. Bulletin American Meteorological Society, 95(4), 543–564, https://doi.org/10.1175/BAMS-D-12-00164.1.
Hays, P., M. Dehring, L. Fisk and P. Tchoryk , 2005: Space-based doppler winds LIDAR: a vital national need.

- 240 -
National Research Council Decadal Study. Available online: http://cires1.colorado.edu/events/lidarworkshop/LWG/Splash%20Papers/Hays.pdf.
- 241 -
Action A22: Develop a repository of water vapour climate data records Action Develop and populate a globally recognized repository of GNSS zenith total delay and
total column water data and metadata
Benefit Reanalyses, water vapour CDRs
Who AOPC to identify the appropriate responsible body
Time frame By 2018
Performance indicator
Number of sites providing historical data to the repository
Annual cost US$ 100 000–1 million
Assessment: 2 – Started but little progress.
The potential for ECMWF as the entrusted entity to the Copernicus Climate Change Service to host the centre has been identified and an initial selection of global stations is in the process of being archived via the C3S Data Store.
The importance of GNSS-PW data has been recognised via C3S and its contract C3S 311a Lot 3, led by CNR (Italy) which has created a globally representative set of holdings. These are in the process of being made available via the Copernicus Climate Data Store hosted by ECMWF. This has the potential to become a global repository for these data but the formalisation of such a role is yet to proceed. Informal discussions with ECMWF and various communications by the C3S 311a Lot 3 contract have highlighted this potential. Formal accreditation as the data centre is pending a formal request for application. The C3S 311a Lot 3 team have identified numerous additional assets that could be targeted to create a truly comprehensive repository in time if resources to support the activity were forthcoming.
Action A23: Measure of water vapour in the upper troposphere/lower Action Promote the development of more economical and environmentally friendly
instrumentation for measuring accurate in situ water-vapour concentrations in the UT/LS
Benefit Improved UT/LS water vapour characterization, water-vapour CDRs
Who NMHSs, National measurements institutes, HMEI and GRUAN
Time frame Ongoing
Performance indicator
Number of sites providing higher-quality data to archives
Annual cost US$ 10–30 million
Assessment: 3 – Underway with significant progress.
UT/LS water vapor soundings have been made with varying degrees of success using balloon-borne frost point hygrometers cooled by a dry ice/ethanol bath or a thermoelectric (Peltier) device, but further test flights are needed to prove that these alternative coolants
- 242 -
provide adequate cooling power under high solar radiation conditions in the stratosphere, especially in the tropics.
For more than four decades, vertical profiles of atmospheric water vapor have been made from the surface up to the middle stratosphere using balloon-borne chilled-mirror frost point hygrometers. The most successful instruments to date have relied on the refrigerant R23 (CHF3, HFC-23) to cool the mirror where frost is grown, detected and controlled. Liquid R23 has nearly perfect physical properties for such an instrument, with pressure-dependent boiling points approximately 20°C colder than typical atmospheric frost point temperatures throughout the 0-35 km altitude range.
Though not an ozone-depleting substance (ODS), R23 has a Global Warming Potential (GWP) nearly 15,000 times that of CO2. Early non-chlorinated replacements of CFCs and other ODSs were deemed acceptable in response to the Montreal Protocol’s call to rapidly reduce and eventually cease the production and consumption of ODSs, even though many replacements have very high GWPs. Now, with atmospheric burdens of most ODSs in decline, concern about the use of high-GWP replacements has brought about regulatory action. The Kigali Amendment to the Montreal Protocol set deadlines to reduce (and eventually cease) the production and consumption of high-GWP replacements like R23.
The search for an alternative, more environmentally-friendly method of cooling the mirrors in balloon-borne frost point hygrometers began before 2016, but to the best of our knowledge, not one of the 10 or so sites that routinely performs frost point hygrometers soundings has completely abandoned the use of R23. Currently, two alternative cooling methods are being explored. One uses thermoelectric cooling that requires the difficult dissipation of a large amount of heat in the sun-baked, low-density air of the stratosphere. One thermoelectric-cooled instrument employs alcohol to help with heat dissipation. The other cooling method utilizes a cold slush bath of pure ethanol and dry ice as the mirror coolant. The bath is contained in a Styrofoam Dewar much like the insulated containment vessel used for liquid R23. Each of these alternative cooling methods has demonstrated adequate mirror cooling power up to the tropopause, but to our current knowledge, only the slush bath has adequately cooled the mirror well into the stratosphere (~25 km). Several test flights at Jülich (Germany) and Boulder, Colorado (USA) have demonstrated the high potential for the slush bath to adequately cool the mirror throughout an entire sounding. Further tests, especially in the high solar radiation environment of the tropical stratosphere, are needed to conclusively prove the adequacy of this cooling method. The conversion of frost point hygrometers from R23 to a slush bath of ethanol and dry ice is not expected to significantly increase or decrease the current cost of frost point hygrometers (~US$3,000).
Since frost point hygrometry requires stability of the frost layer on the chilled mirror under a wide range of atmospheric moisture conditions, tuning of the frost control logic is dependent on the mirror cooling power. The ethanol slush bath is inherently warmer than liquid R23 so it provides less cooling power and requires retuning the frost control logic. Improper tuning generally decreases the stability of frost on the mirror and increases measurement noise, but can also intermittently bias measurements to either side of the true frost point temperature. To avoid introducing biases into frost point hygrometer measurement records, it is highly recommended that two instruments, one cooled by R23 and the other by a new method, be flown concurrently to directly compare their measured frost point temperatures for sufficient time to adequately manage the transition. If possible, such comparisons should span a wide range of climatic conditions and, where applicable, seasons of the year.
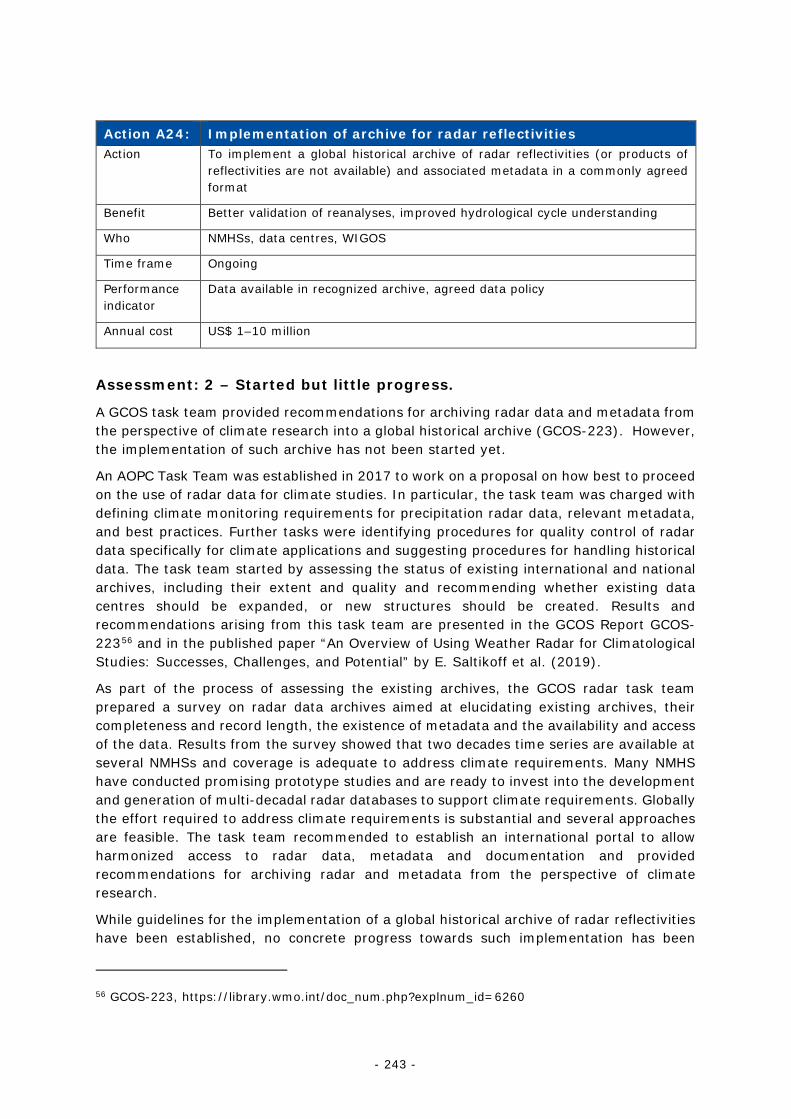
- 243 -
Action A24: Implementation of archive for radar reflectivities Action To implement a global historical archive of radar reflectivities (or products of
reflectivities are not available) and associated metadata in a commonly agreed format
Benefit Better validation of reanalyses, improved hydrological cycle understanding
Who NMHSs, data centres, WIGOS
Time frame Ongoing
Performance indicator
Data available in recognized archive, agreed data policy
Annual cost US$ 1–10 million
Assessment: 2 – Started but little progress.
A GCOS task team provided recommendations for archiving radar data and metadata from the perspective of climate research into a global historical archive (GCOS-223). However, the implementation of such archive has not been started yet.
An AOPC Task Team was established in 2017 to work on a proposal on how best to proceed on the use of radar data for climate studies. In particular, the task team was charged with defining climate monitoring requirements for precipitation radar data, relevant metadata, and best practices. Further tasks were identifying procedures for quality control of radar data specifically for climate applications and suggesting procedures for handling historical data. The task team started by assessing the status of existing international and national archives, including their extent and quality and recommending whether existing data centres should be expanded, or new structures should be created. Results and recommendations arising from this task team are presented in the GCOS Report GCOS-22356 and in the published paper “An Overview of Using Weather Radar for Climatological Studies: Successes, Challenges, and Potential” by E. Saltikoff et al. (2019).
As part of the process of assessing the existing archives, the GCOS radar task team prepared a survey on radar data archives aimed at elucidating existing archives, their completeness and record length, the existence of metadata and the availability and access of the data. Results from the survey showed that two decades time series are available at several NMHSs and coverage is adequate to address climate requirements. Many NMHS have conducted promising prototype studies and are ready to invest into the development and generation of multi-decadal radar databases to support climate requirements. Globally the effort required to address climate requirements is substantial and several approaches are feasible. The task team recommended to establish an international portal to allow harmonized access to radar data, metadata and documentation and provided recommendations for archiving radar and metadata from the perspective of climate research.
While guidelines for the implementation of a global historical archive of radar reflectivities have been established, no concrete progress towards such implementation has been
56 GCOS-223, https://library.wmo.int/doc_num.php?explnum_id=6260
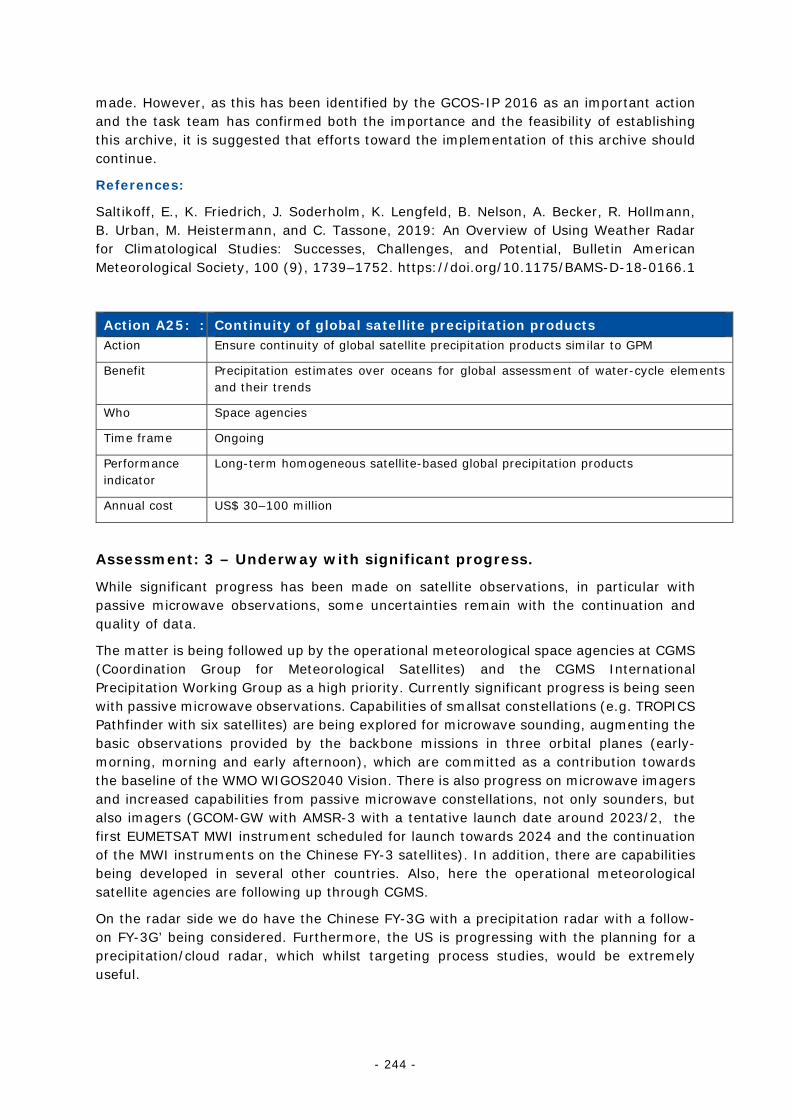
- 244 -
made. However, as this has been identified by the GCOS-IP 2016 as an important action and the task team has confirmed both the importance and the feasibility of establishing this archive, it is suggested that efforts toward the implementation of this archive should continue.
References:
Saltikoff, E., K. Friedrich, J. Soderholm, K. Lengfeld, B. Nelson, A. Becker, R. Hollmann, B. Urban, M. Heistermann, and C. Tassone, 2019: An Overview of Using Weather Radar for Climatological Studies: Successes, Challenges, and Potential, Bulletin American Meteorological Society, 100 (9), 1739–1752. https://doi.org/10.1175/BAMS-D-18-0166.1
Action A25: : Continuity of global satellite precipitation products Action Ensure continuity of global satellite precipitation products similar to GPM
Benefit Precipitation estimates over oceans for global assessment of water-cycle elements and their trends
Who Space agencies
Time frame Ongoing
Performance indicator
Long-term homogeneous satellite-based global precipitation products
Annual cost US$ 30–100 million
Assessment: 3 – Underway with significant progress.
While significant progress has been made on satellite observations, in particular with passive microwave observations, some uncertainties remain with the continuation and quality of data.
The matter is being followed up by the operational meteorological space agencies at CGMS (Coordination Group for Meteorological Satellites) and the CGMS International Precipitation Working Group as a high priority. Currently significant progress is being seen with passive microwave observations. Capabilities of smallsat constellations (e.g. TROPICS Pathfinder with six satellites) are being explored for microwave sounding, augmenting the basic observations provided by the backbone missions in three orbital planes (early-morning, morning and early afternoon), which are committed as a contribution towards the baseline of the WMO WIGOS2040 Vision. There is also progress on microwave imagers and increased capabilities from passive microwave constellations, not only sounders, but also imagers (GCOM-GW with AMSR-3 with a tentative launch date around 2023/2, the first EUMETSAT MWI instrument scheduled for launch towards 2024 and the continuation of the MWI instruments on the Chinese FY-3 satellites). In addition, there are capabilities being developed in several other countries. Also, here the operational meteorological satellite agencies are following up through CGMS.
On the radar side we do have the Chinese FY-3G with a precipitation radar with a follow-on FY-3G’ being considered. Furthermore, the US is progressing with the planning for a precipitation/cloud radar, which whilst targeting process studies, would be extremely useful.
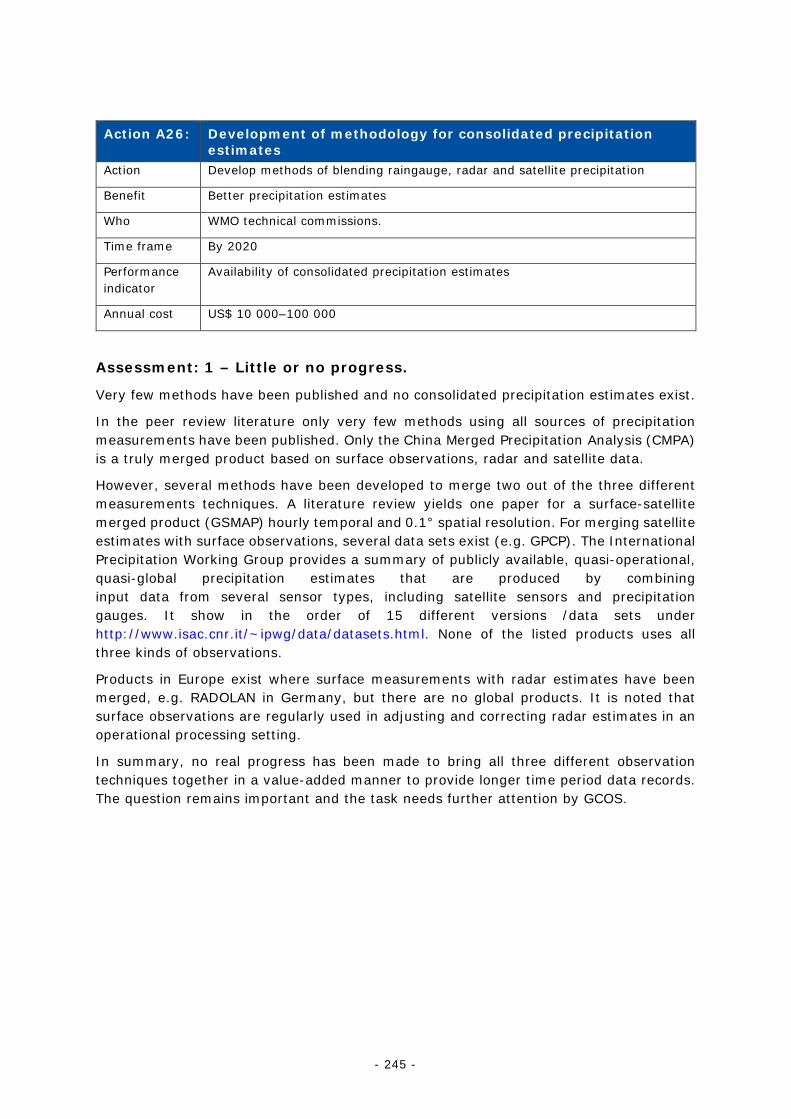
- 245 -
Action A26: Development of methodology for consolidated precipitation estimates
Action Develop methods of blending raingauge, radar and satellite precipitation
Benefit Better precipitation estimates
Who WMO technical commissions.
Time frame By 2020
Performance indicator
Availability of consolidated precipitation estimates
Annual cost US$ 10 000–100 000
Assessment: 1 – Little or no progress.
Very few methods have been published and no consolidated precipitation estimates exist.
In the peer review literature only very few methods using all sources of precipitation measurements have been published. Only the China Merged Precipitation Analysis (CMPA) is a truly merged product based on surface observations, radar and satellite data.
However, several methods have been developed to merge two out of the three different measurements techniques. A literature review yields one paper for a surface-satellite merged product (GSMAP) hourly temporal and 0.1° spatial resolution. For merging satellite estimates with surface observations, several data sets exist (e.g. GPCP). The International Precipitation Working Group provides a summary of publicly available, quasi-operational, quasi-global precipitation estimates that are produced by combining input data from several sensor types, including satellite sensors and precipitation gauges. It show in the order of 15 different versions /data sets under http://www.isac.cnr.it/~ipwg/data/datasets.html. None of the listed products uses all three kinds of observations.
Products in Europe exist where surface measurements with radar estimates have been merged, e.g. RADOLAN in Germany, but there are no global products. It is noted that surface observations are regularly used in adjusting and correcting radar estimates in an operational processing setting.
In summary, no real progress has been made to bring all three different observation techniques together in a value-added manner to provide longer time period data records. The question remains important and the task needs further attention by GCOS.
- 246 -
Action A27: Dedicated satellite Earth Radiation Budget (ERB) mission Action Ensure sustained incident total and spectral solar irradiances and ERB
observations, with at least one dedicated satellite instrument operating at any one time
Benefit Seasonal forecasting, reanalyses, model validation.
Who Space agencies
Time frame Ongoing
Performance indicator
Long-term data availability at archives
Annual cost US$ 30–100 million
Assessment: 4 – Progress on track.
Global monitoring of solar irradiance and Earth outgoing radiative fluxes has been continuous over the past two decades thanks to the Clouds and the Earth’s Radiant Energy System (CERES), Solar Radiation and Climate Experiment (SORCE) and Total and Spectral Solar Irradiance Sensor (TSIS) programs.
Since 2018, the NASA TSIS-1 instruments Total Irradiance Monitor (TIM) and Spectral Irradiance Monitor (SIM) have continued the long-term solar irradiance measurements taken by SORCE, a 17-year mission that phased out in February 2020. TSIS-1 is operated from the International Space Station (ISS) and will be succeeded by TSIS-2, a free-flyer to be launched in 2023. A Compact Spectral Irradiance Monitor (CSIM) deployed on a CubeSat has been collecting solar spectral irradiance data since December 2018. A compact CubeSat version of the TIM, CTIM, will launch in 2021.
Global Earth outgoing shortwave and longwave fluxes have been measured through CERES since March 2000. Currently, six instruments are operational on the Terra, Aqua, S-NPP and NOAA-20 satellites. The latest instrument, FM6, was launched in 2017 and will be succeeded by the recently selected NASA instrument Libera, projected to launch in 2027 on JPSS-3. The instrument specifics are such that seamless continuation of the ERB measurements is facilitated; mission overlap of at least one year is anticipated but not guaranteed. The CERES data are freely and openly available at https://ceres.larc.nasa.gov/data/. Beyond Libera (projected mission lifetime 2027-2032), the future for CERES-like broadband ERB measurements is uncertain. It is imperative that space agencies make further plans to maintain seamless continuity of the ERB climate data record.
The CLARREO Pathfinder mission will measure spectrally resolved Earth-reflected radiation from 350-2300 nm at 6 nm spectral resolution and 1 km spatial resolution. The objectives of CLARREO Pathfinder are to demonstrate high accuracy (<0.3% uncertainty) by direct calibration from the Sun and to transfer calibration to VIIRS and CERES. CLARREO Pathfinder will deploy on the ISS in 2023.
The Geostationary Earth Radiation Budget (GERB) instrument aboard EUMETSAT's Meteosat Second Generation satellites, measures outgoing solar and total radiation for the limited region of the Earth viewable from a geostationary orbit located over the equator at zero degrees longitude. With the first GERB instrument launched in late 2002 and the
- 247 -
fourth and final instrument beginning operations in January 2018, the GERB operational record covers the period May 2004 to present at a roughly 15-minute time resolution. Operational constraints severely curtail data availability for three weeks each equinox and there is currently a two-year gap from April 2013 to April 2015 in the record due to a temporary failure of the third GERB instrument. Climate quality products are available for May 2004 to Jan 2013 on CEDA (http://ceda.ac.uk ), and operational quality products for May 2015 to present can be accessed via the ROLSS server at RMIB (http://gerb.oma.be).
The recently selected ESA TRUTHS mission will measure with absolute calibration visible and near infrared radiation components from a processing polar orbit. This mission will launch in the mid-2020s.
Action A28: In situ profile and radiation Action To understand the vertical profile of radiation requires development and deployment
of technologies to measure in situ profiles.
Benefit Understanding of 3D radiation field, model validation, better understanding of radiosondes
Who NMHSs, National measurements institutes, HMEI
Time frame Ongoing
Performance indicator
Data availability in NMS archives
Annual cost US$ 1–10 million
Assessment: 2 – Started but little progress.
A regular, once monthly, measurement program is undertaken at the DWD Lindenberg facility based on the pioneering work by Meteo Swiss and FMI; data is accessible on request.
Progress on the creation of a long-term measurement series of radiation profiles has been reported to GRUAN via its Implementation and Coordination Meetings. Staff at the Lead Centre in Lindenberg is flying a monthly payload undertaking upward and downward looking LW and SW radiation components in cloudy and clear sky conditions. The data is available upon request. The instrumentation remains in a development phase but is based on sensors commercially available and traced back to calibration standards. There is currently one known manufacturer. Significant work is still required to instigate a network of such measurements and would most likely be attainable in the future via GRUAN in the first instance. However, it is not presently seen as a priority activity for GRUAN. To our knowledge, beyond these Lindenberg flights no additional development / deployment has occurred since the IP was published.
- 248 -
Action A29: Lightning Action To define the requirement for lightning measurements, including data exchange, for
climate monitoring and to encourage space agencies and operators of ground-based systems to provide global coverage and reprocessing of existing datasets
Benefit Ability to monitor trends in severe storms
Who GCOS AOPC and space agencies
Time frame Requirements to be defined by 2017
Performance indicator
Update to Annex A for lightning and commitments by space agencies to include lightning imagers on all geostationary platforms. Reprocessed satellite datasets of lightning produced
Annual cost US$ 10–30 million
Assessment: 4 – Progress on track.
AOPC established a task team on lightning observations for climate applications which defined climate monitoring requirements for lightning and is now working on improving data availability for lightning.
Lightning observations have become operational in recent decades and the availability of increasingly longer time series unleashes the great potential of lightning as a climatological variable. Therefore, lightning has been added to the list of Essential Climate Variables (ECV) in the 2016 GCOS Implementation Plan. In order to define observational requirements and to explore how the usage of lightning data for climate applications can be promoted, AOPC agreed during AOPC-22 (Exeter, UK, March 2017) on the creation of a dedicated task team on lightning observations for climate applications (TTLOCA). This task team continued the work related to lightning observations of the Task Team on the Use of Remote Sensing Data for Climate Monitoring of the Commission for Climatology (CCl) as a joint GCOS/CCl task team. TTLOCA completed its Terms of Reference (ToR, GCOS-213), defined requirements for the observation of lighting and suggested as additional ECV product Schumann Resonances, which have currently the status of an emerging ECV product.
In addition, a report discussing challenges and general recommendations on the usage of lightning has been published (GCOS-22757). Further initiatives like the establishment of a thunder day database and a pilot study on measuring ionospheric potential using the GCOS Reference Upper Air Network to observe global thunderstorm activity have also been launched. Based on this outcome, AOPC decided during its 25th session (videoconference, April 2020) to extend TTLOCA by two years and charge it with continuing current relevant activities and with initiating tasks that were identified during its initial phase.
These additional charges mainly focus on (1) making lightning data available; (2) Establishing an international database for thunder day data; (3) Collaborating with GRUAN through the AOPC WG-GRUAN and the DWD hosted Lead Centre facility to hold field campaigns to measure ionospheric potential once sensors are available; and (4) Liaising with other interested expert groups within WMO to ensure full consistency for application
57 https://library.wmo.int/doc_num.php?explnum_id=6262
- 249 -
areas for lightning (e.g. registration of private lightning data providers at the WIS; metadata for real-time lightning applications). This includes exploring whether it is possible, in collaboration with the WMO/WHO working group, to identify more reliable numbers of lightning fatalities and injuries and whether material could be developed to support educational programs of WHO.
Action A30: Water vapour and ozone measurement in upper troposphere and lower and upper stratosphere
Action Re-establish sustained limb-scanning satellite measurement of profiles of water vapour, ozone and other important species from UT/LS up to 50 km
Benefit Ensured continuity of global coverage of vertical profiles of UT/LS constituents
Who Space agencies
Time frame Ongoing, with urgency in initial planning to minimize data gap
Performance indicator
Continuity of UT/LS and upper stratospheric data records
Annual cost US$ 30–100 million
Assessment: 2 – Started but little progress.
Measurements by limb-scanning satellite instruments for UT and stratospheric measurements of water vapor, ozone and other important trace gases remain precarious; some replacement capability is planned with JPSS-2 in 2022 but even if successful, the single-instrument makes the record vulnerable.
Limb-scanning satellite instruments that measure vertical profiles of water vapor, ozone and other important trace gases (e.g., N2O, CH4) from the upper troposphere (UT) to the stratopause are currently scarce, with only two currently operational. Limb scanners are distinct from spectrometers that measure solar (or lunar) occultations as the sun (or moon) rises or sets behind Earth's limb (e.g., ACE-FTS, SAGE III/ISS) because they measure up to 3500 vertical profiles per day, ~100 times the data density provided by the spectrometers (30-40 profiles per day).
The Aura Microwave Limb Sounder (MLS) is now in its 17th year of operation and is currently the only limb-scanning instrument that measures water vapor, ozone, N2O and other important trace gases in the UT and stratosphere. The Ozone Mapping and Profiler Suite-Limb (OMPS-L) instrument aboard the Suomi National Polar-orbiting Partnership (NPP) satellite, launched in October 2011, is the other limb-scanning instrument that currently measures ozone profiles in the UT and stratosphere. Since these are the only two limb-scanning satellite instruments that meet the requirements of this action item, we find there has been very limited progress to re-establish sustained measurements of this type in the last five years. In fact, the OMPS-L instrument was omitted from the payload of the first Joint Polar Satellite System (JPSS) mission that was launched in late 2017 as the follow-up to the Suomi NPP.
There are fortunately plans to include OMPS-L on future missions of the JPSS, with JPSS-2 set to launch in March 2022. After its planned launch at the end of 2022, the Atmospheric Limb Tracker for Investigation of the Upcoming Stratosphere (ALTIUS) instrument will
- 250 -
deliver high-resolution profiles of ozone, water vapor, methane and other important trace gases in the stratosphere.
Action A31: Validation of satellite remote sensing Action Engage existing networks of ground-based, remote sensing stations (e.g.
NDACC, TCCON, GRUAN) to ensure adequate, sustained delivery of data from MAXDOAS, charge coupled device (CCD) spectrometers, lidar, and FTIR instruments for validating satellite remote-sensing of the atmosphere
Benefit Validation, correction and improvement of satellite retrievals
Who Space agencies, working with existing networks and environmental protection agencies
Time frame Ongoing, with urgency in initial planning to minimize data gap
Performance indicator
Availability of comprehensive validation reports and near-real-time monitoring based on data from the networks
Annual cost US$ 1–10 million
Assessment: 3 – Underway with significant progress.
Various activities by networks and under Copernicus have improved access and timeliness, and various tools developed under projects such as GAIA-CLIM have aided usability, but there is still no unified access to these measurements and tools by the satellite cal/val community.
Access to high quality measurements from networks such as GRUAN, NDACC and TCCON has generally improved. Much of this has been via contracts to CAMS and C3S Copernicus activities funded via ECMWF which has enabled access to data under improved and unified formats. However, this activity has not been holistic and users still require to access numerous portals and cope with several distinct formats when accessing these data. The community has called for an improved and holistic approach to access to both these data and tools that enable their exploitation (Streckx et al., 2020). If adopted this vision would meet the aims of this IP action in full.
Several projects have developed a range of tools that deal with issues around co-location and non-equivalence of measurement techniques. These have included the use of data assimilation and radiative transfer techniques.
There remains a disconnect and degree of tension between satellite and in situ measurements. With some notable exceptions satellite and in situ measurements generally compete for funding rather than work together. Satellite governance typically is also separated from in situ governance.
References:
Sterckx, S., I. Brown, A. Kääb, M. Krol, R. Morrow, P. Veefkind, K.F. Boersma, M. De Mazière, N. Fox and P.W. Thorne. 2020: Towards a European Cal/Val service for earth observation, International Journal of Remote Sensing, 41:12, 4496-4511, DOI: 10.1080/01431161.2020.1718240
- 251 -
Action A32: Fundamental Climate Data Records and Climate Data Records for greenhouse gas and aerosols ECVs
Action Extend and refine the satellite data records (FCDRs and CDRs) for GHG and aerosol ECVs
Benefit Improved record of GHG concentrations
Who Space agencies
Time frame Ongoing
Performance indicator
Availability of updated FCDRs and CDRs for GHGs and aerosols
Annual cost US$ 1–10 million
Assessment: 3 – Underway with significant progress.
During the recent years significant advances have been made in space-based observations of greenhouse gases allowing advances in developing CDRs and FCDRs. First merged global multi-satellite data records of aerosol optical depth have been created.
Action A33: Maintain WMO GAW CO2 and CH4 monitoring networks Action Maintain and enhance the WMO GAW Global Atmospheric CO2 and CH4 monitoring
networks as major contributions to the GCOS Comprehensive Networks for CO2 and CH4. Advance the measurement of isotopic forms of CO2 and CH4 and of appropriate tracers to separate human from natural influences on the CO2 and CH4 budgets
Benefit A well-maintained, ground-based and in situ network provides the basis for understanding trends and distributions of GHGs.
Who National Environmental Services, NMHSs, research agencies, and space agencies under the guidance of WMO GAW and its Scientific Advisory Group on Greenhouse Gases
Time frame Ongoing
Performance indicator
Data flow to archive and analysis centres
Annual cost US$ 1–10 million
Assessment: 3 – Underway with significant progress.
Provision of atmospheric CO2 and CH4 concentration levels measured by the GAW network has been maintained and consolidated worldwide although the Isotope data is still not available optimally.
The GAW Programme coordinates systematic worldwide observations and analysis of CO2 and CH4 and measurement data are reported by participating countries / organisations
- 252 -
and archived and distributed by the WMO World Data Centre for Greenhouse Gases (WDCGG). Recommendations for the quality of greenhouse gas observations were reviewed at 20th WMO/IAEA Meeting on Carbon Dioxide, Other Greenhouse Gases and Related Measurement Techniques (GGMT-2019) in 2019 and are published as GAW Report (https://library.wmo.int/doc_num.php?explnum_id=10353).
The in situ measurement network has been maintained and consolidated over the current implementation period. High-quality, ground-based observations of CO2 and CH4 are mainly provided by the ICOS network (in Europe), and by NOAA’s Global Greenhouse Gas Reference Network which includes a global array of flask sampling sites and less dense networks of in situ measurements at the surface, from tall towers, and from aircraft and by many other institutions listed under “contributors” at https://gaw.kishou.go.jp/documents/db_list/organization. Tropospheric profiles of CO2 and CH4 are also obtained by the IAGOS Research infrastructure of in situ measurements from long-haul commercial aircraft, though these observations suffered a substantial reduction in 2020 due to COVID-19 air travel restrictions. Establishing ICOS, and to a lesser degree IAGOS as pan-European research infrastructures has been essential to consolidating and enhancing the provision of CO2 and CH4 data. This should not hide that many observation sites outside of the two main providers are struggling with sustainability issues. Provision of CO2 and CH4 concentrations measured on tall towers, near-surface and from aircraft are essential to improve knowledge of GHG emissions. The measurement of CO2 and CH4 isotopes and of appropriate tracers, are required to separate human from natural influences on the CO2 and CH4 budgets. These measurements are regularly performed as part of NOAA and ICOS networks but Isotope data is still not available optimally from WDCGG.
Technical difficulties linked to machine-to-machine access to WDCGG also limit the provision of data in Near-Real-Time, as required for some applications. NRT data are accessible through ICOS and NOAA, however. NOAA and ICOS together now provide up to date (meta)data in netcdf-cf format for CO2 and CH4 as Globalview Obspack products.
Action A34: Requirements for in situ column composition measurements Action Define the requirements for providing vertical profiles of CO2, CH4 and other GHGs,
using recently emerging technology, such as balloon capture technique58
Benefit Ability to provide widespread, accurate, in situ vertical profiles economically; an excellent tool for validating satellite retrievals and improving transport models
Who GCOS AOPC and space agencies
Time frame Requirements to be defined by 2018
Performance indicator
Update to Annex A to include vertical profiles and XCO2 (the dry-air column-averaged mole fraction of CO2)
Annual cost US$ <5 million
58 E.g. AirCore
- 253 -
Assessment: 5 – Complete.
Requirements have been defined, and several balloon-borne AirCore programs are now operational in the US and Europe, providing high-quality vertical profile measurements of CO2, CH4, N2O, some halocarbons, SF6 and other GHGs.
Recommendations for the emerging techniques are summarized in the GGMT-2019 report59.Measurement requirements for column in situ measurements have been defined by GCOS AOPC as part of a broader reworking of composition ECVs. These will be articulated in the forthcoming 2022 Implementation Plan.
Several balloon-borne AirCore programs are now operational in the US and Europe, providing high-quality vertical profile measurements of CO2, CH4, N2O, some halocarbons, SF6 and other trace gases. These measurements meet ECV threshold requirements for vertical resolution (with altitude-dependent vertical resolution of 0.1 to 1 km), accuracy and stability but are severely inadequate in horizontal and temporal resolution.
An AirCore autonomously samples the partial atmospheric column from the middle stratosphere to the surface, where the sampler must be recovered and analysed within a few hours to prevent molecular diffusion from eroding the vertical resolution of the collected sample. Additional tracking devices are suggested to aid in quickly locating a payload after it lands.
In some locations, the weight and/or density of the AirCore payload exceed(s) the limit(s) for exempted meteorological balloon payloads, requiring that local civil aviation authorities are notified a day or more prior to launch. Additional hardware designed to increase the detectability of balloons, including radar reflectors, transponders or flashing lights (at night) may be required to broadcast the balloon’s presence to nearby aircraft.
The construction and automation of an AirCore is straightforward and somewhat dependent on the target gases to be measured. The analysis performed on the captured air is the real challenge.
The cost of a basic AirCore sampler unit is approximately US$ 5000 but can increase significantly if an extra-long Core and/or specially-coated tubing is required. Safety and tracking devices like an Automatic Dependent Surveillance – Broadcast (ADS-B) system or Iridium system can add another US$ 5000. Costs of the analysis system used to measure the Core are not included in these figures.
Action A35: Space-based measurements of CO2 and CH4 implementation Action Assess the value of the data provided by current space-based measurements of CO2
and CH4, and develop and implement proposals for follow-on missions accordingly
Benefit Provision of global records of principal greenhouse gases; informing decision-makers in urgent efforts to manage GHG emissions
Who Research institutions and space agencies
Time frame Assessments are ongoing and jointly pursued by research institutions
Performance indicator
Approval of subsequent missions to measure GHGs
59 https://library.wmo.int/doc_num.php?explnum_id=10353
- 254 -
Annual cost US$ 30–100 million
Assessment: 4 – Progress on track.
Major advances have been made in space-based observations of CO2 and CH4 during the recent years and the needs for future observations have been formulated in the CEOS report: Constellation architecture for monitoring carbon dioxide and methane from space, 2018.
The number of satellites measuring total column CO2 (or more specifically column-averaged dry air mole fraction of CO2, typically denoted as XCO2) is increasing steadily at the moment (GOSAT, OCO-2, GOSAT-2, TanSat, OCO-3). The OCO-2 XCO2 observations have been shown to agree with 0.5 ppm (0.1%) median bias and 1.5 ppm (0.4%) RMS difference with ground based FTIR observations after bias correction (Wunch et al, Atmos. Meas. Tech., 10, 2209–2238, 2017). Despite the fact that none of the present instruments has dense spatial coverage, the small pixels (of the order of few km by few km) already demonstrate capabilities for detecting emission signatures.
The need for improved coverage and wide swaths for detecting CO2 emissions have driven the observation requirements of the future instruments, including CNES/MicroCarb (2022 expected launch), geostationary GeoCARB, and EU&ESA/CO2M with planned launch in 2025 (noting that funding from EU is still pending but the mission is recognized as Copernicus high priority candidate mission).
The total column CH4 observations (or more specifically column-averaged dry air mole fraction of CH4, typically denoted as XCH4) have also improved significantly during recent years as Sentinel 5P/TROPOMI was launched to complement GOSAT (2009->) and GOSAT-2 (2018->). Sentinel 5P has global daily coverage of the sunlit part of the globe with relatively small pixels of 5.5 x 7 km. The GOSAT CH4 observations agree well with ground based TCCON measurements, with a 6 ppb (0.3%) bias and 13 ppb (0.7%) standard deviation (Yoshida et al., 2013). Future missions measuring methane include active lidar mission MERLIN (launch expected in 2025) which will provide CH4 profiles and also cover regions with little or no sunlight which nadir-looking SWIR instruments are missing.
The important role of satellite instruments in providing top-down verification capacity for greenhouse gas stocktake, as defined by the Paris agreement, has been recognized by the space agencies and resulted in the CEOS report: Constellation architecture for monitoring carbon dioxide and methane from space, 2018. Several other documents (most importantly EU reports on CO2: Blue report, Red report and Green report) have also highlighted these developments.
● CEOS report: Constellation architecture for monitoring Carbon Dioxide and Methane from Space, 2018
o http://ceos.org/document_management/Virtual_Constellations/ACC/Documents/CEOS_AC-VC_GHG_White_Paper_Publication_Draft2_20181111.pdf
● Blue Report, 2015: Towards a European Operational Observing System to Monitor Fossil CO2 emissions
o https://www.copernicus.eu/sites/default/files/2019-09/CO2_Blue_report_2015.pdf
● Red Report, 2017: Baseline Requirements, Model Components and Functional Architecture
- 255 -
o https://www.copernicus.eu/sites/default/files/2019-09/CO2_Red_Report_2017.pdf
References:
Yoshida et al., 2013: Improvement of the retrieval algorithm for GOSAT SWIR XCO2 and XCH4 and their validation using TCCON data, Atmospheric Measurements Techniques, 6, 1533–1547, https://doi.org/10.5194/amt-6-1533-2013
Action A36: N2O, halocarbon and SF6 networks/measurements Action Maintain networks for N2O, halocarbon and SF6 measurements
Benefit Informs the parties to the Montreal Protocol, provides records of long-lived, non-CO2 GHGs and offers potential tracers for attribution of CO2 emissions.
Who National research agencies, national environmental services, NMHSs, through WMO GAW
Time frame Ongoing
Performance indicator
Data flow to archive and analysis centres
Annual cost US$ 30–100 million
Assessment: 5 – Complete.
The global and regional networks of in situ and/or flask sample measurements of N2O, halocarbons and SF6 have been maintained, while some have improved through site expansion and/or measurement technology enhancements.
The stations reporting respective data can be found under https://gaw.kishou.go.jp/documents/db_list/organization. GAW coordinated observations of N2O are recognized a GCOS Global Baseline Observing Network and as Global Comprehensive Observing Network.
There are a number of independent networks that contribute to these globally coordinated efforts and that measure nitrous oxide (N2O), halocarbons, and sulfur hexafluoride (SF6), or a subset of these gases, in situ and/or through flask collections and analyses. NOAA’s Global Greenhouse Gas Reference Network (GGGRN) and the Advanced Global Atmospheric Gases Experiment (AGAGE) are global in coverage, while networks of the University of California – Irvine, the University of East Anglia and Europe’s Integrated Carbon Observing System (ICOS) provide data at more regional scales. There are still substantial spatial gaps in the network coverage.
All of these networks have remained stable in terms of infrastructure and financial support. Some have even increased their number of sites and/or the numbers of ozone-depleting, greenhouse or other trace gases measured. The networks are cooperative in nature and complement one another in enabling direct comparisons of data records at sites where two or more networks overlap, and in verifying data features observed at one site with those at another site. Some sites are remotely located to sample the background atmosphere while others are purposefully situated where they can sample regionally integrated emissions.
- 256 -
N2O is both a greenhouse gas and an ozone depleting substance that is emitted from both natural and anthropogenic sources. It is currently the third strongest human-emitted contributor to radiative forcing behind carbon dioxide and methane. Measurements are made in situ and in stored air samples (flasks), mainly by gas chromatography, but now also by optical techniques such as laser spectroscopy. The global coverage of network sites providing N2O mole fraction data is adequate to determine trends at regional to global scales, but only with higher spatiotemporal density in situ measurements like those provided by ICOS can process studies be performed.
Each of these networks also measure 30+ halocarbons, including substances banned by the Montreal Protocol, their replacements, and now the replacements for the replacements. Gas chromatography is again the main analytical method for halocarbons, with cryo-focusing (pre-concentration) of samples and mass-selective detectors allowing the detection of sub-parts per trillion mole fractions for some. Halocarbon networks were initially developed to track the increasing trends of ODSs with concern for the stratospheric ozone layer, but now there is also substantial interest in verifying that banned ODSs are no longer produced, as well as monitoring replacement gases with high Global Warming Potentials (GWPs). Recently, emissions of CFC-11 likely associated with unauthorized production, long ago banned by the Montreal Protocol, were detected by network measurements and traced back to southeast Asia.
SF6 is measured by most of these networks, either in situ, or from grab samples, or both. It is a very long-lived, purely anthropogenic greenhouse gas with a GWP some 24,000 times that of CO2. Nearly all the SF6 ever emitted still remains in the atmosphere. The dominant measurement technique for SF6 is gas chromatography. As with N2O, the network measurements of SF6 are used to determine large-scale trends, but only a dense network of measurement sites is sufficient for smaller scale emission studies. SF6 is also useful as a tracer of atmospheric transport and has been used to validate and improve transport models. Similar applications have also been used to study ocean circulation as SF6 is soluble.
Action A37: Ozone network coverage Action Urgently restore the coverage the extent possible and maintain the quality and
continuity of the GCOS Global Baseline (profile, total and surface level) Ozone Networks coordinated by WMO GAW.
Benefit Provides validation of satellite retrievals and information on global trends and distributions of ozone.
Who Parties’ national research agencies and NMHSs, through WMO GAW and network partners, in consultation with AOPC
Time frame Ongoing.
Performance indicator
Improved and sustained network coverage and data quality
Annual cost US$ 1–10 million
Assessment: 2 – Started but little progress.
Due to lack of funds, minimal restoration of the ozone network stations lost since 2010 has occurred.
- 257 -
This action is related to recent and ongoing loss of long-term ozone observations at a number of key sites. While there has been no substantial further network degradation the majority of the sites that were lost in the early parts of the 2010s have not been restored.
Various activities were carried out by GAW Programme to maintain the ozone observing network with no directly visible progress. Demands for training, instrument service and calibration, and financial help within the aging observing network exceed available resources within individual countries and those available for international support within GAW and UNEP. Important components of the GAW effort were to maintain the quality of data and their submission to WOUDC (World Ozone and Ultraviolet Radiation Data Centre) by active stations, to facilitate restarting of suspended observations and to facilitate the initiation of observations at priority stations where long-term commitment for ozone measurements exist. Activities which received significant support were prioritized in cooperation with the ozone scientific community, Ozone Secretariat of UNEP and some individual national programs. Capacity building was identified as a major factor for sustaining the ozone observing network for the GAW programme and was supported in a number small targeted and large events and activities. Opportunities for GAW to support the transportation and repairs of instruments to resume ozone observations or the relocation of instruments to priority sites were also explored. Under implementation was the relocation of two Brewer instruments donated by the Canadian government, and a call for hosts of available Dobson instruments was issued on the GAW website in September 2020 and distributed through different GAW and UNEP channels. In parallel to those activities, the reference instruments of individual networks were intercompared. Those campaigns included activities dedicated to instruments inter-comparison, service, calibration and training sessions on operation, service and data processing. An important work of the GAW ozonesonde community towards harmonizing ozonesondes records was completed in 2020 and subjected to peer review. Reports detailing results from inter-comparison campaigns and ozonesondes’ quality assurance and quality control review have been published or are being published and are available through WMO online library. A capacity-building initiative on data management and instrument calibration for WMO RA-I was designed and implemented in 2018 and 2019 to strengthen the technical and scientific expertise required to maintain high quality measurements, data processing and analysis. This activity was coordinated by the GAW office and implemented in two phases involving staff of the Kenya Meteorological Department (KMD) and MeteoSwiss. The calibration and servicing of ozone monitoring instruments, relocation of 2 Brewer instruments and commencement of long-term observations, the implementation of an already started ozonesonde project in Ecuador, and multiple inter-comparison, calibration, service and training events planned or coordinated by GAW in 2020 and 2021 were cancelled, suspended or postponed due to the COVID19 pandemic. Those factors, along with reported suspensions of observations and the toll of economic hardship are expected to strongly affect the health of the network and data availability since early 2020.
- 258 -
Action A38: Submission and dissemination of ozone data Action Improve timeliness and completeness of submission and dissemination of
surface ozone, ozone column and profile data to users, WDCGG and WOUDC
Benefit Improves timeliness of satellite retrieval validation and availability of information for determining global trends and distributions of ozone.
Who Parties’ national research agencies and services that submit data to WDCGG and WOUDC, through WMO GAW and network partners.
Time frame Ongoing
Performance indicator
Network coverage, operating statistics and timeliness of delivery.
Annual cost US$ 100 000–1 million
Assessment: 3 Underway with significant progress.
Several activities were developed and implemented, leading however to small improvement in terms of data submission. Discoverability and access have improved through the Copernicus Data Store and the NextGEOSS
A number of activities were developed and implemented by GAW to advance this action item with results that do not necessarily reflect the invested efforts because of multiple factors including the COVID19 pandemic. The GAW secretariat worked with managers of ozone observation stations and the station/network PIs to improve data submission in 2019 and 2020. A number of stations which were behind in data submissions, including those important for satellite validation, were contacted. As part of their routine work, WOUDC and WDCGG issue an annual call for data submissions to all station contacts. WOUDC activities in 2019-20 include the quality assurance of data, providing feedback about problems with submission to data contributors, the full reporting to contributors about any identified issues with the format conformity of data and metadata with what was addressed by follow up actions, files verification and acceptance reports. Delays in the submission of ozonesonde data by stations were communicated to the ozonesonde community to facilitate specialized assistance where needed. A couple of issues causing the delays in data submission were identified and guidance was provided to stations experiencing difficulties with the submission process itself. Training and refresher activities which were designed to be part of ozone measurement inter-comparison campaigns in 2018 and 2019, along with the ongoing support by Regional Centers, are expected to maintain data processing and submission capacity within the GAW monitoring network. A number of activities were undertaken to improve data discoverability and access. Ozone total column and ozone profile data from ozonesonde stations within WOUDC were integrated in Copernicus Climate Data Store in 2020. Discoverability of ozone and UV data from WOUDC and WDCRG (World Data Centre for Reactive Gases) and GHG from WDCGG was also improved through the federated data hub NextGEOSS. A decision was made to move towards a single data format for collaboration between databases providing ozone data based on a single format and single submission. The Data Center InterOperability (DCIO) approach that was considered to be the most sustainable for the future and offered preventions for data storage duplication and the mix-up of data versions. Federated search on ozone data became operational in 2019 and members were extended in 2020. Efforts
- 259 -
were put in for 10 months in 2020 to align metadata with the WIGOS metadata standard and to update OSCAR GAW information. A comprehensive assessment of ozonesonde QA-QC protocols, data and metadata was carried out, and a set of recommendations guiding those, including a start in reporting measurement uncertainties and expanded metadata, was completed and will be published as a WMO Report in 2021. In addition to this assessment, a number of inter-comparison field campaigns and laboratory work, calibration activities and other laboratory work had been performed to ensure high quality and compatibility of ozone and GHG observations for assessments and trend analyses. Tools which could facilitate machine-to-machine access for WOUDC and WDCGG now exist, with a demonstration and some training on their use provided, along with the other GAW relevant activities, under the Expert Team of Atmospheric Composition Data Management. These are expected to lead to improved data dissemination, searchability and discoverability. GHG data from WDCGG had been systematically analysed and broadly disseminated through WMO GHG bulletins. To view the latest one, please see: https://library.wmo.int/doc_num.php?explnum_id=10437.
Action A39: Monitoring of aerosol properties Action Provide more accurate measurement-based estimates of global and regional direct
aerosol radiative forcing (DARF) at the top of the atmosphere and its uncertainties, and determine aerosol forcing at the surface and in the atmosphere through accurate monitoring of the 3D distribution of aerosols and aerosol properties. Ensure continuity of monitoring programs based on in situ ground-based measurement of aerosol properties.
Benefit Reducing uncertainties in DARF and the anthropogenic contributions to DARF, and the uncertainty in climate sensitivity and future predictions of surface temperature.
Better constraints on aerosol type needed for atmospheric correction and more accurate ocean property retrieval than currently available.
Who Parties’ national services, research agencies and space agencies, with guidance from AOPC and in cooperation with WMO GAW and AERONET
Time frame Ongoing, baseline in situ components and satellite strategy is currently defined.
Performance indicator
Availability of the necessary measurements, appropriate plans for future
Annual cost US$ 10–30 million
Assessment: 4 – Progress on track.
Improved provision of 3-D climate-relevant aerosol data worldwide has led to improved observationally-derived estimates of direct aerosol radiative forcing; better knowledge of global aerosol distribution from space-borne sensors together with better coverage and a more reliable provision of ground-based aerosol variables has improved capacity to assess the role of aerosols as climate-forcing agents.
Generally, the global observation system for aerosol ECVs has further improved in the past decade thanks to both availability of new satellite-based observations and the development of the in situ observations from the ground and from commercial aircraft. In addition, efforts to promote access to information and development of interoperable
- 260 -
information systems have facilitated access to data and data products retrieved from space, ground and aircraft-based observations.
A consequence of this is the capacity to produce observationally derived estimates of the magnitude of direct aerosol radiative forcing with much improved quality compared to previous estimates. These permit consideration of geographical variations of the aerosol forcing estimates.
The wide spatial coverage of space-borne sensors generally provides sufficient information meeting threshold requirements for most ECV products that are suited for many applications (evaluations, analyses); however, smaller retrieval areas should be explored in future satellite missions. Space-borne sensors provide global coverage but at low repeat measurement frequency which are complemented in many regions (but not all) by a dense ground-based network for AOD and derived products retrieval.
The aerosol in situ observing system is still a collection of different networks and very different governing structures with limited interactions between them. However, continuity of the different programs has been maintained and, in some regions, consolidated by the establishment of research infrastructures such as ACTRIS or IAGOS. Spatial coverage is greatly improved in several regions (North America, Europe, some parts of Asia) for several ECVs. AERONET and other AOD networks (e.g. Skynet, PFR) provide a dense network of observations over land. For other ECVs, despite the fact that NOAA-FAN (US), and ACTRIS and IAGOS (Europe) have extended their networks beyond US and Europe, many areas in the world remain undersampled and data access remains an issue.
A smart use of in situ observations, space observations and models may compensate for sparseness and limitations of information on vertical distribution, but this only applies to regions where lidar networks are operational with seamless access, as in the United States and Europe. Access to vertical profiles remains a limiting factor to a global aerosol observing system.
The development of the in situ observing system for Aerosol ECV products has been paralleled with great efforts to ensure traceability of provenance of data, joint data management procedures and data policies. The information system remains, however, managed regionally, and in some countries/regions, operated by different research organisations, leading to difficulties to fully respond to user requirements of an integrated observing system. There is a lot of attention paid to aerosol in the context of health and substantial extension of the networks was made through the utilization of the low-cost sensor that do not meet requirements for the climate monitoring.
Record length of aerosol products should be at least 10 to 15 years for trends to be derived. Continuity of operations and consistency in the time series for both space-based and in situ observing systems are key to many downstream applications and must remain high on the agenda.
- 261 -
Action A40: Continuity of products of precursors of ozone and secondary aerosols
Action Ensure continuity of products based on space-based, ground-based and in situ measurements of the precursors (NO2, SO2, HCHO, NH3 and CO) of ozone and secondary aerosol and derive consistent emission databases, seeking to improve spatial resolution to about 1 x 1 km2 for air quality
Benefit Improved understanding of how air pollution influences climate forcing and how climate change influences air quality.
Who Space agencies, in collaboration with national environmental agencies and NMHSs
Time frame Ongoing
Performance indicator
Availability of the necessary measurements, appropriate plans for future missions, and derived emission databases
Annual cost US$ 100–300 million
Assessment: 2 – Started but little progress.
While considerable advances in the spatial resolution of the observations of ozone and secondary aerosols from space have been made, the goal of achieving spatial resolution of 1x1 km is still far in the future.
Ozone and aerosol precursors can be measured from space using UV-VIS-SWIR wavelengths in nadir mode. The Ozone Monitoring Instrument (OMI, 2004 ->) has measured SO2, NO2 and HCHO with 24x13 km pixels at best. The GOME-2 instruments (2006->, 2012->, 2018->) have similar observation capabilities with slightly worse horizontal resolution. A clear improvement in the spatial resolution was made with Sentinel 5 Precursor/TROPOMI, which measures NO2, SO2 and HCHO at a resolution of 3.5 x 5.5 km and CO at 7 x 5.5 km.
By using a so-called oversampling technique, temporal averages of the gases can be obtained with higher spatial resolution than the original measurements. This comes, however, at the price of reduced temporal sampling.
The EU&ESA Copernicus High Priority CO2 Monitoring Mission, CO2M, is planning to make observations of NO2 at 2 x 2 km spatial resolution to support detecting CO2 emission plumes since the signature of NO2 emissions originating from same source is easier to detect from the background due to its shorter lifetime. If the mission is funded the launch is expected in 2025.
Ground-based measurements of these precursor gases are difficult due to their low abundances, especially in remote locations far from sources. Except for CO, these precursors are typically measured by remote-sensing instruments because the requisite sample handling for in situ measurements and/or sample storage for flask measurements can be detrimental to sample integrity. The preferred ground-based measurement techniques are spectroscopic with a long pathlength, generally utilizing the sun as the light source such as the FTIR technique. Ground-based sites making such measurements are spatially sparse, and their data should be considered complementary to space-based measurements, especially to monitor and detect any biases or drifts in the satellite retrievals of these gases.
- 262 -
Use of in situ observations to derive emission inventories remain limited in geographical and spatial coverage.
However, there are substantial efforts done by AMIGO activity https://igacproject.org/activities/amigo.
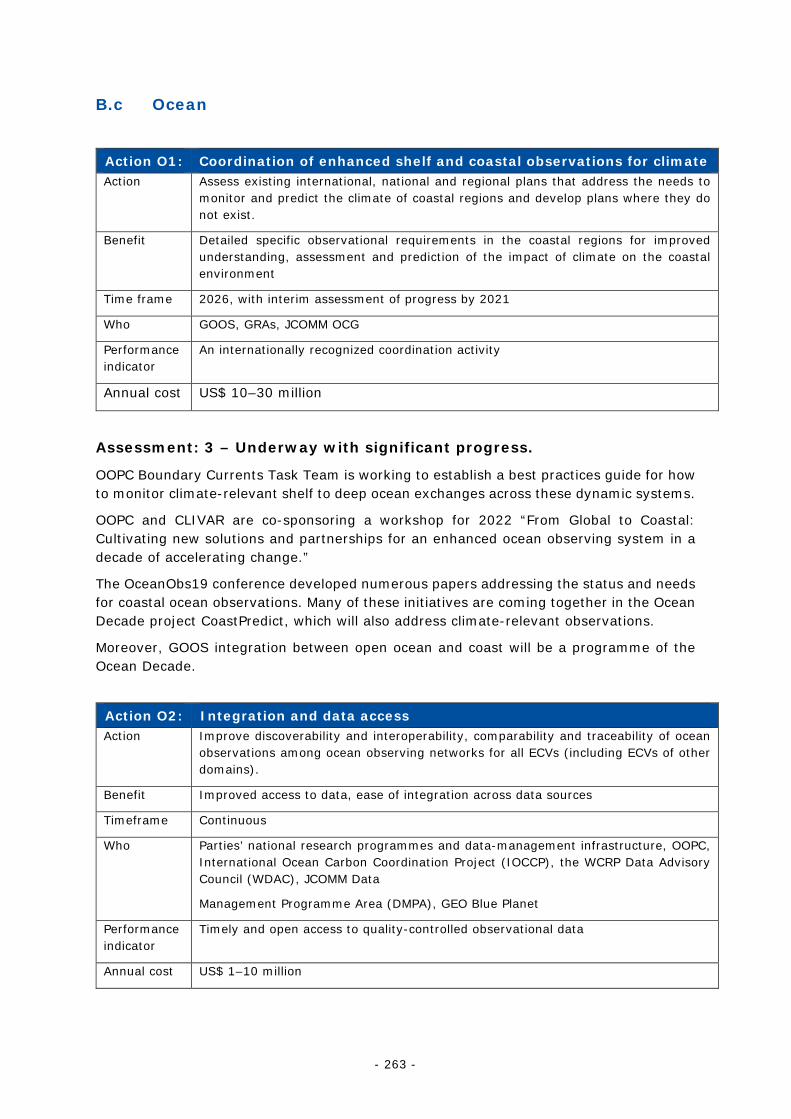
- 263 -
B.c Ocean
Action O1: Coordination of enhanced shelf and coastal observations for climate Action Assess existing international, national and regional plans that address the needs to
monitor and predict the climate of coastal regions and develop plans where they do not exist.
Benefit Detailed specific observational requirements in the coastal regions for improved understanding, assessment and prediction of the impact of climate on the coastal environment
Time frame 2026, with interim assessment of progress by 2021
Who GOOS, GRAs, JCOMM OCG
Performance indicator
An internationally recognized coordination activity
Annual cost US$ 10–30 million
Assessment: 3 – Underway with significant progress.
OOPC Boundary Currents Task Team is working to establish a best practices guide for how to monitor climate-relevant shelf to deep ocean exchanges across these dynamic systems.
OOPC and CLIVAR are co-sponsoring a workshop for 2022 “From Global to Coastal: Cultivating new solutions and partnerships for an enhanced ocean observing system in a decade of accelerating change.”
The OceanObs19 conference developed numerous papers addressing the status and needs for coastal ocean observations. Many of these initiatives are coming together in the Ocean Decade project CoastPredict, which will also address climate-relevant observations.
Moreover, GOOS integration between open ocean and coast will be a programme of the Ocean Decade.
Action O2: Integration and data access Action Improve discoverability and interoperability, comparability and traceability of ocean
observations among ocean observing networks for all ECVs (including ECVs of other domains).
Benefit Improved access to data, ease of integration across data sources
Timeframe Continuous
Who Parties’ national research programmes and data-management infrastructure, OOPC, International Ocean Carbon Coordination Project (IOCCP), the WCRP Data Advisory Council (WDAC), JCOMM Data
Management Programme Area (DMPA), GEO Blue Planet
Performance indicator
Timely and open access to quality-controlled observational data
Annual cost US$ 1–10 million
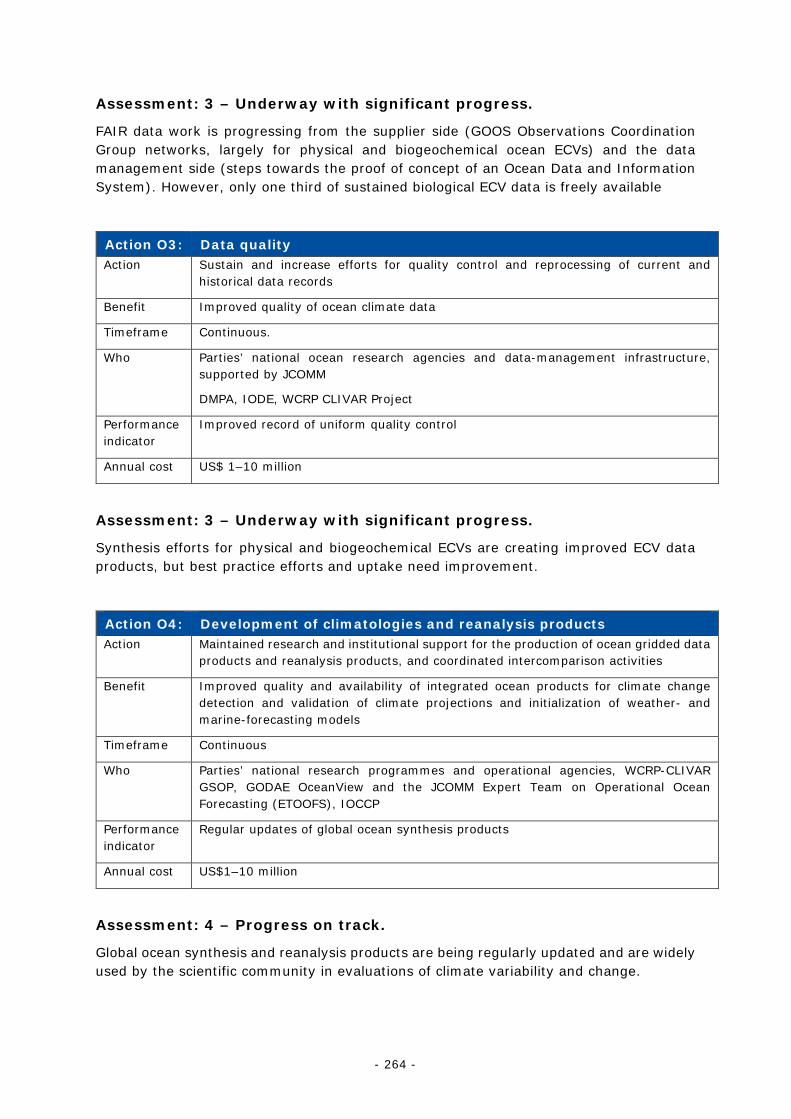
- 264 -
Assessment: 3 – Underway with significant progress.
FAIR data work is progressing from the supplier side (GOOS Observations Coordination Group networks, largely for physical and biogeochemical ocean ECVs) and the data management side (steps towards the proof of concept of an Ocean Data and Information System). However, only one third of sustained biological ECV data is freely available
Action O3: Data quality Action Sustain and increase efforts for quality control and reprocessing of current and
historical data records
Benefit Improved quality of ocean climate data
Timeframe Continuous.
Who Parties’ national ocean research agencies and data-management infrastructure, supported by JCOMM
DMPA, IODE, WCRP CLIVAR Project
Performance indicator
Improved record of uniform quality control
Annual cost US$ 1–10 million
Assessment: 3 – Underway with significant progress.
Synthesis efforts for physical and biogeochemical ECVs are creating improved ECV data products, but best practice efforts and uptake need improvement.
Action O4: Development of climatologies and reanalysis products Action Maintained research and institutional support for the production of ocean gridded data
products and reanalysis products, and coordinated intercomparison activities
Benefit Improved quality and availability of integrated ocean products for climate change detection and validation of climate projections and initialization of weather- and marine-forecasting models
Timeframe Continuous
Who Parties’ national research programmes and operational agencies, WCRP-CLIVAR GSOP, GODAE OceanView and the JCOMM Expert Team on Operational Ocean Forecasting (ETOOFS), IOCCP
Performance indicator
Regular updates of global ocean synthesis products
Annual cost US$1–10 million
Assessment: 4 – Progress on track.
Global ocean synthesis and reanalysis products are being regularly updated and are widely used by the scientific community in evaluations of climate variability and change.
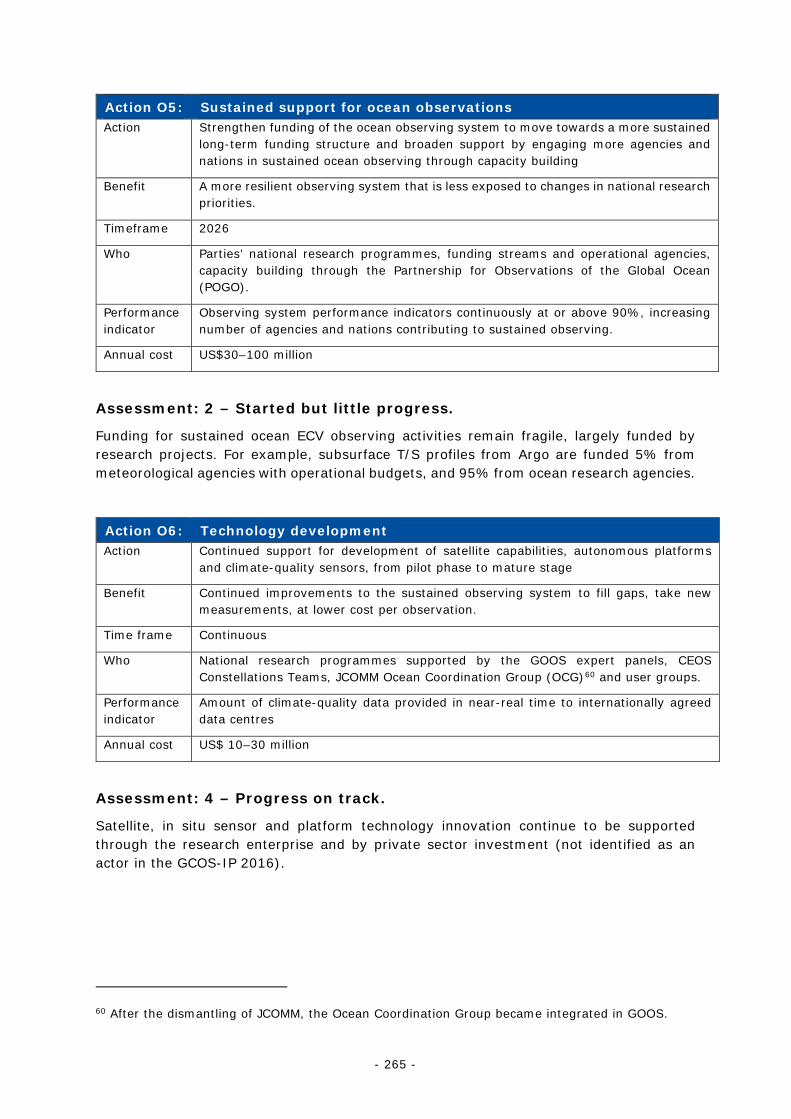
- 265 -
Action O5: Sustained support for ocean observations Action Strengthen funding of the ocean observing system to move towards a more sustained
long-term funding structure and broaden support by engaging more agencies and nations in sustained ocean observing through capacity building
Benefit A more resilient observing system that is less exposed to changes in national research priorities.
Timeframe 2026
Who Parties’ national research programmes, funding streams and operational agencies, capacity building through the Partnership for Observations of the Global Ocean (POGO).
Performance indicator
Observing system performance indicators continuously at or above 90%, increasing number of agencies and nations contributing to sustained observing.
Annual cost US$30–100 million
Assessment: 2 – Started but little progress.
Funding for sustained ocean ECV observing activities remain fragile, largely funded by research projects. For example, subsurface T/S profiles from Argo are funded 5% from meteorological agencies with operational budgets, and 95% from ocean research agencies.
Action O6: Technology development Action Continued support for development of satellite capabilities, autonomous platforms
and climate-quality sensors, from pilot phase to mature stage
Benefit Continued improvements to the sustained observing system to fill gaps, take new measurements, at lower cost per observation.
Time frame Continuous
Who National research programmes supported by the GOOS expert panels, CEOS Constellations Teams, JCOMM Ocean Coordination Group (OCG)60 and user groups.
Performance indicator
Amount of climate-quality data provided in near-real time to internationally agreed data centres
Annual cost US$ 10–30 million
Assessment: 4 – Progress on track.
Satellite, in situ sensor and platform technology innovation continue to be supported through the research enterprise and by private sector investment (not identified as an actor in the GCOS-IP 2016).
60 After the dismantling of JCOMM, the Ocean Coordination Group became integrated in GOOS.
- 266 -
Action O7: Observing system development and evaluation Action Support and engage in systems-based observing system development projects
established through GOOS as detailed in this Plan and efforts for the ongoing evaluation of the observing system
Benefit Continued improvements to the sustained observing system ensure it is robust, integrated and meets future needs.
Time frame Continuous
Who National research programmes supported by GOOS expert panels and regional alliances
Performance indicator
Periodic evaluation of observing system against requirements and expansion of support for sustained observations
Annual cost US$ 100 000–1million (mainly to Annex I Parties).
Assessment: 3 underway with significant progress.
OOPC has joined the OceanPredict OSEval Task Team to use OSEs and OSSEs to evaluate the mature systems of GOOS.
The OOPC Task Teams are evaluating observation capacity and developing implementation strategies for climate observations with a) the earth system (ocean heat and freshwater transport), b) the air-sea interface, and c) the coastal to open ocean interface (boundary systems).
The GOOS Steering Committee has approved a GOOS-level task team to establish authoritative guidance and guidelines for system reviews based on recent regional and/or thematic reviews carried out in TPOS2020, TAOS and the IndOOS system.
Action O8: Satellite sea-surface temperature product development Action Continue the provision of best possible SST fields based on a continuous coverage
mix of polar orbiting (including dual view) and geostationary IR measurements, combined with passive MW coverage, and appropriate linkage with the comprehensive in situ networks
Benefit Global routine calibrated mapping of SST for climate monitoring and weather and subseasonal to seasonal prediction systems
Time frame Continuous
Who Space agencies, coordinated through Global High Resolution Sea Surface Temperature Project (GHRSST).
CEOS, CGMS and WMO Space Programme.
Performance indicator
Agreement of plans for maintaining a CEOS Virtual Constellation for SST, ongoing satellite operation, routine delivery of SST products
Annual cost US$ 1–10 million
Assessment: 4 – Progress on track.
A constellation of satellite SST sensors is providing high quality blended SST products over most of the global ocean
- 267 -
The constellation of satellite SST sensors include polar orbiting and geostationary satellites, infrared and passive microwave radiometry, providing high quality blended SST products over most of the global ocean that satisfy the temporal and spatial resolution requirements, calibrated by or blended with SST measurements from the in situ networks. Polar ocean SST measurements are of lesser quality. The resolution of SST in cloudy region is limited to the resolution of passive microwave sensors (~50 km).
Action O9: Upper-ocean temperature observing system Action Maintain a global upper ocean (0-2000 m) temperature observing system for the
assessment of ocean temperature and heat content change and its contribution to sea-level rise
Benefit High-quality ocean temperature time series for accurate estimates of annual ocean heat storage as a function of depth and its spatial distribution to assess the role on the ocean in the Earth’s energy balance and ocean warming contribution to sea-level change
Time frame Continuous
Who Parties’ national agencies working with GOOS observational networks (Drifters, CEOS, Argo, SOOP, OceanSITES), in cooperation with the Observations Coordination Group of JCOMM.
Performance indicator
Spatial coverage, interoperability of observations platforms, annually updated global upper-ocean temperature records
Annual cost US$ 30–100 million
Assessment: 3 underway with significant progress.
Targets for drifters and Argo have been exceeded, however COVID-19 restrictions meant that the majority of Ship Of Opportunity Programme (SOOP) XBT profiles stopped61.
61 https://www.ocean-ops.org/reportcard2020/
- 268 -
Action O10: Full-depth temperature observing system Action Develop and begin implementation of a full-depth ocean temperature observing
system to support the decadal global assessment of the total ocean heat content and thermosteric sea-level rise
Benefit High-quality, deep-ocean temperature time series for accurate estimates of biennial to decadal ocean heat storage below 2000 m and its spatial distribution to assess the role of the ocean in the Earths energy balance and ocean-warming contribution to sea-level change
Time frame Observational system in place by 2026
Who Parties, national agencies working with GOOS observational networks (Argo, GO-SHIP, OceanSITES), in cooperation with the JCOMM Observations Coordination Group
Performance indicator
Design study completed and targeted implementation begun; spatial coverage, interoperability of observations platforms
Annual cost US$ 30–100 million
Assessment: 2 – Started but little progress.
The number of deep Argo floats has increased, however GO-SHIP repeat hydrography lines and OceanSITES full depth moorings, both largely dependent on research vessels, faced challenges in 2020 due to COVID-19.
Action O11: Ocean salinity observing system Action Maintain and grow a global ocean salinity observing system for the assessment of
ocean salinity and freshwater content change and its contribution to global hydrological cycle
Benefit High-quality ocean salinity time-series for accurate estimates of annual (0-2000 m) to decadal (below 2000 m) ocean freshwater changes and its spatial distribution to assess the role on the ocean in the Earths hydrological cycle and contribution to sea-level change. Improved initialisation of weather- and climate forecasting systems
Time frame Continuous.
Who Parties’ national agencies working with GOOS observational networks (CEOS, SOOP, Argo, GO-SHIP, OceanSITES), in cooperation the Observations Coordination Group.
Performance indicator
Spatial coverage, interoperability of observations platforms’ annually updated global ocean salinity records
Annual cost US$ 30–100 million (10% in non-Annex I Parties)
Assessment: 3 underway with significant progress.
Salinity observations have largely been maintained but have not grown. Records remain too short to estimate decadal changes.
- 269 -
Action O12: Ocean current gridded products Action Maintain gridded ocean-surface and subsurface current products based on satellite,
drifting-buoy and Argo programme, other observations and data-assimilating models
Benefit High-quality ocean-current observations for climate services and marine operational systems
Time frame Continuous
Who Parties’ national agencies working with CEOS, GOOS observational networks (SOOP, Argo, GO-SHIP.
OceanSITES, Drifters) in cooperation with the JCOMM Observations Coordination Group, Godea.
OceanView and reanalysis projects.
Performance indicator
Spatial coverage, interoperability of observation platforms
Annual cost US$ 1–10 million (10% in non-Annex I Parties)
Assessment: 3 underway with significant progress.
The observing systems generating surface and subsurface currents has largely remained stable, and as noted in the ECV overview, adequate for the surface and subsampled for the subsurface.
Action O13: Sea-level observations Action Maintain and develop a global sea-surface-height observing system from
observational and satellite networks for annual assessment of sea level and sea-level rise
Benefit Quality control and accurate global sea level and regional sea-level variability dataset
Time frame Continuous
Who Parties’ national agencies working with CEOS, GOOS observational networks (e.g. GLOSS), in cooperation with the JCOMM Observations Coordination Group
Performance indicator
Spatial coverage, interoperability of observations platforms, annually updated global sea-level data
Annual cost US$ 30–100 million
Assessment: 3 underway with significant progress
The quantity and quality of sea level observations globally has remained stable, supported in a number of cases by operational use of the data.
- 270 -
Action O14: Contributing to sea-state climatologies Action Maintain and improve the global sea-state observing system from the observational
networks to inform wave models/climatologies for assessment of wave climate, its trend and variability and contribution to extremes of sea level; expand observations on surface-reference moorings and drifters
Benefit Routine observations of wave climate and extremes in support of marine/climate services
Time frame Continuous
Who Parties’ national agencies coordinated through GOOS, OOPC, GRAs, OceanSITES, DBCP, guidance from the JCOMM Expert Team on Waves and Coastal Hazard Forecasting Systems
Performance indicator
Number of global wave observations available routinely at International Data Centres.
Annual cost US$ 1–10 million
Assessment: 3 underway with significant progress
Sea state observations are stable but in situ measurements are sparse. An active community (CowClip) is developing climatologies of wind-wave variability and change.
Action O15: In situ sea-ice observations Action Plan, establish and sustain systematic in situ observations from sea ice, buoys,
visual surveys (SOOP and aircraft) and in-water upward-looking Sonar (ULS)
Benefit Long time series for validations of satellite data and model fields; short- and long-term forecasting of sea ice conditions; ocean-atmosphere-sea ice interaction and process studies
Time frame Integrated Arctic Observing System design and demonstration project funded by EU for 2017–2020
Who National and international services and research programmes, Copernicus; coordination through Arctic
Council, EU-PolarNET, Arctic-ROOS (in EuroGOOS), CLIVAR, CLIC, JCOMM, OOPC
Performance indicator
Establishment of agreement and frameworks for coordination and implementation of sustained Arctic (EU-PolarNet and Arctic-ROOS, which will be extended with the new funded project (see time frame)) and
Southern Ocean observations (SOOS)
Annual cost US$ 30–100 million
Assessment: 2 started but little progress.
The work of establishing the sustained Arctic Observing System (AOS) is on-going, contributed to by various sources, and funding agencies (e.g. EU). The AOS itself is not in-place and, in any case, the general sentiment is that more must be done (more sensors must be deployed, and better data access must be pursued). The AOS is still being developed on research funds, and this does not help turning it into an operational service.
- 271 -
Action O16: Ocean-surface stress observations Action Develop requirements and review system design (satellite and in situ) for observing
OSS ECV and commence implementation
Benefit Agreed plan for design of surface-stress observing system to improve ocean-surface-stress products
Time frame Internationally agreed plans published and establish GDACs by 2019
Who CEOS and in situ networks
Performance indicator
Publication of internationally agreed plans, establishment of agreements/frameworks for coordination according to plan
Annual cost US$ 100 000–1 million
Assessment: 3 underway with significant progress.
Reviews of the adequacy of this ECV have been carried out on existing platforms but not as a global system.
In situ wind stress measurements meet all accuracy requirements, but coverage is extremely sparse. Mooring wind stress observations meet the hourly sampling requirements. Satellite wind stress meets most resolution requirements (except for hourly sampling for certain phenomena) and some of the accuracy requirements.
Action O17: Ocean-surface heat-flux observing system Action Develop requirements and system design for observing Ocean surface heat flux ECV
(utilizing indirect and direct methods) and commence implementation
Benefit Agreed plan for high-quality heat-flux data required to improve surface flux products
Time frame Complete programme design and begin implementation of observational system by 2019
Who GOOS observational networks (CEOS, OceanSITES, SOOP), in cooperation with the JCOMM Observations
Coordination Group
Performance indicator
Publication of observing network plan; spatial coverage, interoperability of observation platforms
Annual cost US$ 10–30 million
Assessment: 3 underway with significant progress.
The OOPC Air-Sea Flux task team have developed a proposal to establish an international multi-disciplinary observing system activity called Observing Air-Sea Interactions Strategy (OASIS)62.
62 https://airseaobs.org/
- 272 -
Action O18: Surface ocean partial pressure of CO2, moorings Action Sustain the surface reference mooring pCO2 network and increase the number of
sites to cover all major biogeochemical regions to resolve seasonal cycle
Benefit Increased information on seasonal and longer variability in key ocean areas
Time frame Continuous
Who IOCCP, in consultation with OOPC; implementation through national services and research programmes
Performance indicator
Flow of data of adequate quality into SOCAT
Annual cost US$ 1–10 million
Assessment: 3 underway with significant progress.
Flow of surface pCO2 data into The Surface Ocean CO₂ Atlas (SOCAT) analysis (from moorings and from underway systems) is stable, but the southern hemisphere remains undersampled.
Significant progress has been made in the sense that more and more pCO2 data from moorings are submitted to, and included in, SOCAT. It should be noted though, that there is still work to do on metadata structure which is suitable for mooring data and still acceptable in SOCAT. Work on this is underway, but slow. While the number of moorings submitting data to SOCAT has increased substantially the past 5 years, these moorings are primarily in North American waters so there is a way to go to cover all major biogeochemical regions.
Action O19: Building multidisciplinary time series Action Add inorganic carbon and basic physical measurements to existing biological
timeseries, considering particularly spatial gaps in current observing system, aiming for balanced representation of the full range of natural variability
Benefit Improved understanding of the regional effects of ocean acidification
Time frame Continuous
Who Parties’ national research programmes supported by GOA-ON, GOOS Biogeochemistry and Biology and Ecosystems expert panels.
Performance indicator
Flow of data of adequate quality to data centres
Annual cost US$ 1–10 million
Assessment: 2 started but little progress.
Integration of observations from different oceanographic disciplines in the same place remains a challenge but this has become a major goal for GOOS 2030 IP.
Ocean time series programs in general continue to face many challenges some of which significantly hinder their intended operation and prevent operators from expanding the capacity by for example adding inorganic carbon and/or basic physical measurements to
- 273 -
existing biological time-series. These challenges include: (i) unavailability of sustained funding; (ii) varying levels of access to analytical facilities, instrumentation, and technology; (iii) lack of access to training on standardized sampling and analytical approaches, which hinders comparability of data sets across sites; (iv) multiple disconnected databases and interfaces for accessing time series data without a universal set of data and metadata reporting guidelines.
A recent global overview of the uncoordinated ecological time series network, along with a list of biogeochemical and physical measurements, can be found in a 2017 report by IGMETS (http://igmets.net/). Current activities focus on implementing recommendations from several relevant OceanObs’19 community white papers.
Action O20: Nutrient observation standards and best practices Action Increase the use of nutrient CRMs on ship-based hydrographic programmes
Benefit Increased accuracy of nutrient measurements
Time frame Continuous
Who IOCCP, in consultation with OOPC; implementation through national services and research programmes;
SCOR working group 147 “Towards comparability of global oceanic nutrient data"
Performance indicator
Increased consistency of nutrient data
Annual cost US$ 1–10 million
Assessment: 3 underway with significant progress.
Nutrient best practices manual produced by an international working group, and the BP manual has been published and widely used. The use of Certified Reference Materials (CRMs) for nutrients is becoming standard for the GO-SHIP program, and many other high-quality hydrographic campaigns.
- 274 -
Action O21: Sustaining tracer observations Action Maintain capacity to measure transient tracers on the GO-SHIP network. Encourage
technological development to encompass additional tracers that provide additional information on ventilation.
Benefit Information on ocean ventilation and variability in ventilation
Time frame Continuous
Who IOCCP, in consultation with OOPC; implementation through national services and research programmes
Performance indicator
Number of high-quality transient tracer measurements on the repeat hydrography programme
Annual cost US$ 1–10 million
Assessment: 2 started but little progress.
Tracers remain part of the basic (Level 1) variables recommended for GO-SHIP repeat hydrography lines. In 2020, numerous lines have been delayed due to COVID-19 restrictions, and in general, uncertainty remains high.
There is some technological development on the capacity to measure new transient tracers to increase the range of ventilation ages that can be assessed. The number of labs internationally with capacity to measure transient tracers is declining with possible implications for future GO-SHIP surveys. Several nations carrying out GO-SHIP cruises don’t have national capacity but are reliant on cooperation with groups from other countries, sometimes with negative implications for the transient tracer observations.
Action O22: Develop sustained N2O observations Action Develop an observing network for ocean N2O observations, with particular emphasis
on regions with known high oceanic N2O production/emission rates
Benefit Improved estimate of oceanic emissions by improved spatial and temporal coverage; detecting seasonal and interannual variability
Time frame Continuous
Who IOCCP, in consultation with OOPC; implementation through national services and research programmes, SCOR WG 143 Dissolved N2O and CH4 measurements: working towards a global network of ocean time series measurements of N2O and CH4
Performance indicator
Flow of data of adequate quality into MEMENTO
Annual cost US$ 1–10 million
Assessment: 2 started but little progress.
The development of intercomparison exercises has proceeded, and N2O observations are a mature part of GO-SHIP lines, but further development of new observing platforms is required.
- 275 -
N2O is measured on various research cruises and on a few coastal and open ocean time-series sites. Progress has been made to set up N2O underway measurement system on VOS (SOOP) lines. Various internal. inter-comparison exercises and the writing of SOPs have been initiated by the SCOR WG #143. SOPs for measurements of N2O from discrete seawater samples and with continuous underway system are available now. Therefore, the overall quality and comparability of the N2O concentration measurements will increase in the near future. A concept for a global N2O ocean observation network has been outlined recently, but realisation is pending (of course).
Action O23: In situ ocean colour radiometry data Action Continue and improve the generation and maintenance of climate-quality in situ OCR
data. Develop new high-resolution sensors of high radiometric quality suitable for improving satellite algorithms; validating products; and for characterising product uncertainties, with global coverage and validity (including coastal (Case-2) waters) and at the temporal and spatial scales required by users.
Benefit Monitoring of changes and variability in ocean colour and derived products
Time frame Implement plan beyond 2017 after completion of ESA’s OC-CCI activities
Who CEOS space agencies, in consultation with IOCCG and GEO through INSITU OCR initiative of IOCCG, and in accordance with the recommendations contained in the IOCCG INSITU-OCR White Paper (see http://www.ioccg.org/groups/INSITU-OCR_White-Paper.pdf).
Performance indicator
Free and open access to up-to-date, multi-sensor global products for climate research; flow of data into agreed archives
Annual cost US$ 30–100 million
Assessment: 2 started but little progress.
The IOCCG continues to coordinate a robust work plan through working groups for in situ reflectance in support of remote sensing.
Number of commercially available high quality radiation sensors is limited (e.g. Seabird and Trios. Biospherical has declared bankruptcy this year) and radiative calibration facilities (e.g. NIST in US) are hard and expensive to access. Most sensors are not characterized/corrected for out-of-band response, immersion coefficient and temperature effects on dark currents. Standards for laboratory calibration of hyperspectral radiometers spanning from UV to NIR are not in place. Users mostly rely on manufacturers for characterization and calibration and those are not independently assessed.
- 276 -
Action O24: Ocean colour algorithm development Action Support continued research and technology development to ensure that the best
and the most up to date algorithms are used for processing the ocean-colour time-series data in a consistent manner for climate research; to develop product suites suitable for application across wide ranges of water types, including coastal water types; to study inter-sensor differences and minimize them before multi-sensor data are merged; to provide quality assurance and uncertainty characterization of products
Benefit Improved quality of ocean colour products, particularly in coastal waters and complex water types
Time frame Implement plan as accepted by CEOS agencies in 2009
Who CEOS space agencies, in consultation with IOCCG and GEO
Performance indicator
Improved algorithms for a range of water-property types
Assessment: 4 – Progress on track.
IOCCG and CEOS coordinate space agency work in this area.
Recent literature includes many algorithms addressing optically complex water, from correcting the atmospheric contribution to the derivation of products using a variety of novel techniques (most notably machine learning) and being validated on global scales. These algorithms are critical for coastal management, decision support and policy. Most are still in evaluation and have not become operational.
Action O25: Satellite-based phytoplankton biomass estimates Action Establish a plan to improve and test regional algorithms to convert satellite
observations to water-column integrated phytoplankton biomass through implementing an in situ phytoplankton monitoring programme. Estimates of uncertainty should be a standard output associated with improved algorithms. Wherever possible, a time series of phytoplankton should be collected simultaneously with the measurement of other important physical and biogeochemical variables.
Benefit Baseline information on plankton
Time frame Implementation build-up to 2020
Who CEOS space agencies, in consultation with IOCCG, including Satellite PFT Intercomparison Project, parties’ national research agencies, working with SCOR and GOOS
Performance indicator
Publication of internationally agreed plans; establishment of agreements/frameworks for coordination of a sustained global phytoplankton observing system with consistent sensors and a focused global program of in situ calibration implementation according to plan, flow of data into agreed archives, summary interpreted data products available as well as original data.
Annual cost US$ 100 000–1 million
- 277 -
Assessment: 2 started but little progress.
Work between ocean colour and modelling communities has improved combined estimates of phytoplankton, but remains limited to the large-scale open ocean.
The GOOS BioEco panel has a 10-year plan for the implementation of the EOV’s. Progress will be assessed against this 10-year plan for each ECV. The plankton EOV/ECV is being considered as an indicator in the Convention of Biological Diversity (CBD) post 2020 framework.
Action O26: Expand Continuous Plankton Recorder and supporting observations
Action Establish plan for, and implement, global CPR surveys, including extension to (sub) tropical areas and integration of data from supporting observation programmes
Benefit Information on variability and trends in plankton
Time frame Internationally agreed plans published by end 2019; implementation build-up to 2024
Who Parties’ national research agencies, working with SCOR and GOOS Biology and Ecoystems Panel, IGMETS, Global Alliance of CPR Surveys, OceanSITES
Performance indicator
Publication of internationally agreed plans; establishment of agreements/frameworks for coordination of sustained global CPR surveys supported by repeated surveys at fixed locations; implementation according to plan; flow of data into agreed archives, summary of interpreted data products available
Annual cost US$ 10–30 million
Assessment: 2 started but little progress.
CPR observations face unstable research funding, however new automated imaging and genomics technologies, as well as new platforms, are anticipated to lead to major changes in the coming 10 years. Progress can be seen at https://www.cprsurvey.org/.
- 278 -
Action O27: Strengthened network of coral reef observation sites Action Strengthen the global network of long-term observation sites covering all major
coral-reef habitats within interconnected regional hubs, encourage collection of physical, biogeochemical, biological and ecological measurements, following common and intercalibrated protocols and designs, and implement capacity building workshops
Benefit Accurate global monitoring of changes in coral-reef cover, health and pressures
Time frame 2016–2020
Who Parties’ national research and operational agencies, supported by GCRMN, GOOS Biology and Ecosystems
Panel, GRAs and other partners
Performance indicator
Reporting on implementation status of network
Annual cost US$ 30–100 million
Assessment: 2 started but little progress.
Efforts remain more advanced in developed nations, leading to numerous gaps.
Significant progress on developing the coral ECV under the Global Coral Monitoring Research Network. A global report is close to publication and the monitoring approach has been approved by the International Coral Research Initiative (ICRI). Monitoring quality is variable between region and countries depending on resources available. The coral EOV/ECV is proposed as a high-profile indicator in the CBD post-2020 framework given widespread international concern and interest.
Action O28: Global networks of observation sites for mangroves, seagrasses, macroalgae
Action Advance the establishment of global networks of long-term observation sites for seagrass beds, mangrove forests and macroalgal communities (including kelp forests) and encourage collection of physical, biogeochemical, biological and ecological measurements, following common and intercalibrated protocols and designs and implement capacity-building workshops
Benefit Accurate global monitoring of changes in mangroves, seagrasses and macroalgae cover
Time frame 2016–2020.
Who Parties’ national research and operational agencies, supported by GOOS Biology and Ecosystems Panel.
GRAs and other partners in consultation with CBD and Ramsar Convention on Wetlands.
Performance indicator
Reporting on implementation status of network.
Annual cost US$ 30–100 million
- 279 -
Assessment: 3 underway with significant progress.
Remote sensing data is globally coordinated, but in situ calibration and verification are generally lacking.
Seagrass: There are several large-scale programs but they are mainly organized by individual researchers and project-oriented and do not have regular coverage in time and space. Lauren Weatherdon and Emmet Duffy are co-PIs on a small grant from SCOR that is organizing the global seagrass community to organize best practices, a community of practice, and advance the seagrass EOV and data system.
Mangroves: Global capabilities are at 4 for EO systems, in terms of extent (but not habitat). At regional levels this at 3.
Macroalgae: Global at concept level; Regional at pilot level. Spatial and temporal resolution typically low. No oversight group established. Satellite data have been used for offshore floating macroalgae (e.g. Sargassum) but may be of insufficient resolution for coastal macroalgae.
Action O29: In situ data for satellite calibration and validation Action Maintain in situ observations of surface ECV measurements from existing
observations networks (including surface drifting buoys, SOOP ships, tropical moorings, reference moorings, Argo drifting floats, and research ships) for calibration and validation of satellite data; undertake a review of requirements of observations
Benefit Comprehensive in situ observations for calibration and validation of satellite data
Time frame Continuous, review by 2020
Who Parties’ national services and ocean research programmes, through GOOS, IODE and JCOMM, in collaboration with WRCP/CLIVAR and CEOS
Performance indicator
Data availability at international data centres
Annual cost US$ 1–10 million
Assessment: 3 underway with significant progress.
In situ calibration and validation data are generally available for physical ocean ECVs, but sparse or lacking for biogeochemical and biological ocean ECVs.
- 280 -
Action O30: Satellite sea-surface temperature Action Secure future passive microwave missions capable of SST measurements
Benefit Ensure SST coverage in regions of high cloud coverage
Time frame Continuous
Who Space agencies, coordinated through CEOS, CGMS, and WMO Space Programme in consultation with the
Global High Resolution Sea Surface Temperature Project (GHRSST)
Performance indicator
Agreement of plans for maintaining required microwave SST missions
Annual cost US$ 100–300 million (for securing needed missions)
Assessment: 4 progress on track.
JAXA has committed to including this on the future GOSAT-GM mission and EAS is support a concept study.
JAXA has committed to AMSR-3 onboard of the planned GOSAT-GW (2022-2027) (https://space.oscar.wmo.int/satellites/view/gosat_gw) that provides microwave SST that are not obscured by clouds. ESA is supporting a concept study for a Copernicus high priority candidate mission, the Copernicus Imaging Microwave Radiometer (CIMR), that is planned for following AMSR-3.
Action O31: Satellite sea-surface height Action Ensure continuous coverage from one higher-precision, medium-inclination
altimeter and two medium-precision, higher-inclination altimeters, including a satellite altimetry reference mission with no discontinuity between each satellite to ensure that each mission following another has an overlap period.
(6–9 months) to intercalibrate one another (example of TOPEX/Poseidon and Jason missions)
Benefit Global routine calibrated mapping of SSH; intercalibration period between difference satellite missions
Time frame Continuous
Who Space agencies, with coordination through the OSTST, CEOS Constellation for Ocean Surface Topography, CGMS and the WMO Space Programme.
Performance indicator
Satellites operating; provision of data to analysis centres
Annual cost US$ 30–100 million
Assessment: 5 – Complete.
Missions underway and planned.
The series of current and planned satellite altimeter missions have addressed Action 31. These missions include Jason-3, Sentinal-3 series, CryoSat-2, CFOSAT, and Jason-
- 281 -
CS/Sentinel-6, CRISTAL. Sea-surface height measurements from these missions are being used operationally by analysis centres.
Action O32: Satellite sea-surface salinity Action Ensure the continuity of space-based SSS measurements
Benefit Continue satellite SSS record to facilitate research (ocean circulation, climate variability, water cycle, and marine biogeochemistry), operation (seasonal climate forecast, short-term ocean forecast, ecological forecast) and linkages with the water cycle
Time frame Continuous
Who Space agencies, coordinated through OSSST, CEOS, CGMS and WMO Space Programme and in situ network
Performance indicator
Agreement of plans for maintaining a CEOS virtual constellation for SSS, ongoing satellite operation, routine delivery of SSS products
Annual cost US$ 30–100 million (for securing needed missions)
Assessment: 3 − underway with significant progress.
ESA and NASA missions underway but continuity is not ensured.
ESA’S SMOS mission and NASA’s SMAP mission are providing satellite SSS for various applications. But the continuity is not ensured. Currently there is only one mission concept, the Copernicus Microwave Imaging Radiometer (CIMR) by ESA, that aims to provide satellite SSS. But the mission timeline is 2028 or beyond even if it will move into the operation phase. Given the ages of the current SSS-measuring satellites (SMOS since 2009 and SMAP since 2015), a gap before CIMR is extremely likely. Moreover, there will be no constellation if there is only CIMR in orbit.
Action O33: Satellite sea state Action Continue to improve the delivery and quality of sea-state fields, based on satellite
missions with in situ networks
Benefit Global routine calibrated mapping of sea state
Time frame Continuous
Who Space agencies, coordinated through CEOS, CGMS, and WMO Space Programme and in situ network
Performance indicator
Agreement of plans for maintaining a CEOS virtual constellation for sea state
Annual cost US$ 1–10 million (for generation of datasets)
Assessment: 4 − progress on track.
Satellite altimeter missions are providing a constellation for sea state measurements together with in situ network.
- 282 -
Action O34: Satellite ocean surface stress Action Continue to improve the delivery and quality of ocean-surface stress fields based on
satellite missions with the comprehensive in situ networks (e.g. met-ocean moorings); improve resolution with the benefit of near coastal data; improved coverage of the diurnal and semi-diurnal cycles.
Benefit Global routine calibrated mapping of ocean-surface stress
Time frame Continuous
Who Space agencies, coordinated through OVSST, CEOS, CGMS and WMO Space Programme and in situ network
Performance indicator
Agreement of plans for maintaining a CEOS virtual constellation for ocean-surface stress
Assessment: 3 − underway with significant progress.
3 satellites are providing data but are inadequate for sampling diurnal and semi-diurnal cycles.
There are currently 3 satellite scatterometers in orbit providing measurements of ocean surface wind stress together with a sparse array of in situ sensors. But the virtual constellation is inadequate for sampling the diurnal and semi-diurnal cycles. The spatial resolutions of the measurements (typically 12.5-25 km) are marginal in resolving coastal winds.
Action O35: Satellite sea ice Action Ensure sustained satellite-based (microwave radiometry, SAR, altimetry, visible and
IR) sea-ice products; high-inclination altimetry (e.g. Cryosat follow-on) also desired
Benefit Global, routine, calibrated mapping of sea ice
Time frame Continuous
Who Parties’ national services, research programmes and space agencies, coordinated through the WMO Space Programme and Global Cryosphere Watch, CGMS and CEOS; national services for in situ systems, coordinated through WCRP CliC and JCOMM
Performance indicator
Sea-ice data in international data centres
Annual cost US$ 1 -10 million (for generation of datasets)
Assessment: 4 − progress on track.
Concerns over continuity of observations.
The score depends heavily on which ECV Product is considered. Microwave radiometry for sea-ice (concentration, drift, type) [4] is generally well covered and secured at a coarse resolution, but securing higher resolution and/or lower frequencies (i.e. L-band, C-band) is required (EU CIMR, AMSR3, WSF-M, etc.). SAR (C-band) [3] is well covered (Sentinel-1, RCM, Sentinel-1NG) in the Arctic. In the Southern Hemisphere, not as well, but dedicated missions (e.g. NISAR) can help in the future. High-inclination altimetry is still
- 283 -
problematic [2] with only two research satellites flying (CryoSAT2 and ICESat2). Future would be secured with EU CRISTAL but it is not yet committed, and a gap might occur if CRISTAL is delayed. Visible and IR imagery generally well covered [5] although twilight acquisitions not always secured (e.g. Satellite data gaps for sea-ice thickness (both high-polar altimetry and L-band radiometry) are probable for the second half of the decade.
The Sea Ice ECV is a highly multivariate ECV with, at present, 4 products, but several more associated and supporting variables. In addition, these variables are supported by different (satellite and in situ) systems. This makes status reporting a challenge. The ongoing open consultation process of GCOS ECVs has underlined that several variables that are today considered “supporting” or “associated” should be considered as ECV Products. Increasing the number of ECV products will not make reporting on the status easier in the future.
Concerning future and planned satellites, we report with our knowledge as of August 2020. Some satellite design and selection processes are on-going, especially with EU/ESA (CIMR and CRISTAL) and decisions will be made during 2021, thus before revision of the Implementation Plan.
Action O36: Satellite ocean colour Action Support generation of long-term multi-sensor climate-quality OCR time series that
are corrected for intersensor bias as needed and that have quantitative uncertainty characterization, with global coverage and validity, including coastal (Case-2) waters, and capable of dealing with user requirements for products at a variety of space and timescales.
Benefit Global routine calibrated mapping of ocean colour, including coastal (Case-2) regions
Time frame Implement plan beyond 2017
Who CEOS space agencies, in consultation with IOCCG and GEO; agencies responsible for operational Earth observations, such as NOAA in the USA and Copernicus in the European Union
Performance indicator
Free and open access to up-to-date, multi-sensor global products for climate research; flow of data into agreed archives
Annual cost US$ 1–10 million (for generation of datasets)
Assessment: 4 − progress on track.
Long-term commitments in hand mean marginal adequacy for this observation
There have been 34 AERONET-OC stations in existence since 2002 of which 18 are currently operational (https://aeronet.gsfc.nasa.gov/cgi-bin/draw_map_display_seaprism_v3 ) + two active global cal/val station (MOBY and BOUSSOLE). Data is served on public databases and are critical for the evaluation of satellite ocean colour data.
- 284 -
Action O37: Argo array Action Sustain and expand the Argo profiling float network of at least one float every 3° x
3° in the ocean, including regional seas and the seasonal ice zone (approximately 3800 floats)
Benefit Global climate-quality observations of the broadscale subsurface global ocean temperature and salinity down to 2000 m
Time frame Continuous
Who Parties participating in the Argo programme and in cooperation with the OCG
Performance indicator
Spatial coverage and number of active floats
Annual cost US$ 30 million
Assessment: 4 − progress on track.
The core mission of the Argo array is largely fulfilled, with a continuous challenge to maintain the array as floats reach the end of their lifetime. The Southern Ocean and south Pacific and Indian Oceans have required specific campaigns to re-seed.
Action O38: Development of a biogeochemical Argo array Action Deploy a global array of 1 000 profiling floats (~6°x ~6°) equipped with pH, oxygen,
nitrate, chlorophyll fluorescence, backscatter and downwelling irradiance sensors, consistent with the Biogeochemical Argo
Science and Implementation Plan
Benefit Global observations of the broadscale subsurface global ocean biogeochemistry down to 2000 m
Time frame In place by 2026; review progress in 2021
Who Parties, in cooperation with the Argo Project and the OCG
Performance indicator
Number of floats reporting oxygen and biogeochemical variables
Annual cost US$ 25 million
Assessment: 3 − underway with significant progress.
491 Argo floats are measuring one or more biogeochemical ECVs (June 2020).
Significant progress has been made with respect to the Biogeochemical Argo Science and Implementation Plan. Almost all platforms carry an oxygen sensor, more than half measure chlorophyll-a and suspended particles but less than half measure pH, nitrate and downwelling irradiance. However, there are only a handful of floats which measure the entire suite of six parameters.
- 285 -
Action O39: Development of a deep Argo array Action Deploy a global array of approximately 1230 deep Argo floats at 5° x 5° spacing,
covering all ocean regions deeper than 2000 m
Benefit Global climate-quality observations of the broad-scale subsurface global ocean temperature and salinity below 2000 m
Time frame Array in place and maintained by 2026; review progress in 2021
Who Parties participating in the Argo programme and in cooperation with the JCOMM Observations
Coordination Group
Performance indicator
Spatial coverage and number of active deep floats
Annual cost US$ 20 million
Assessment: 3 − underway with significant progress.
139 deep Argo floats are operating (June 2021), against a target of 25% of the array of about 1000 floats.
Action O40: GO-SHIP Action Maintain a high-quality, full-depth, multi-disciplinary ship-based decadal survey of
the global ocean (approximately 60 sections) and provide a platform to deploy autonomous components of the ocean observing system and test new technology
Benefit Global, comprehensive, full-depth, decadal ocean inventory of ECVs
Time frame Continuous
Who National research programmes supported by the GO-SHIP project, OCG and GOOS
Performance indicator
Percentage coverage of the sections and completion of Level-1 measurements
Annual cost US$ 10–30 million
Assessment: 3 − underway with significant progress.
The high-quality, full-depth, multi-disciplinary ship-based decadal survey is on track, although COVID-19 restrictions in 2020 have delayed a number of missions.
Action O41: Develop fixed-point time series Action Build and maintain a globally distributed network of multi-disciplinary, fixed-point
surface and subsurface time series, using mooring, ship and other fixed instruments
Benefit Comprehensive high temporal resolution time series characterizing trends and variability in key ocean regimes
Time frame Continuous
- 286 -
Who Parties’ national services and ocean research agencies responding to the OceanSITES plan working with
GOOS panels and GRAs
Performance indicator
Moorings operational and reporting to archives
Annual cost US$ 30–100 million
Assessment: − underway with significant progress.
OceanSITES moorings have largely been sustained. Metadata and data flow needs improvement, and COVID-19 restrictions have placed a number of these timeseries moorings at risk of failure, with expected data gaps in 2020-21.
Action O42: Maintain the Tropical Moored Buoy system Action Maintain the Tropical Moored Buoy system
Benefit Contributes to observing state of the tropical ocean climate, particularly focused on coupled air–sea processes and high frequency variability and for prediction of ENSO events
Time frame Continuous
Who Parties’ national agencies, coordinated through the JCOMM Tropical Moored Buoy Implementation
Panel, following guidance from scientific development projects (e.g. TPOS 2020, IIOE-II, AtlantOS)
Performance indicator
Data acquisition at international data centres and robust design requirements articulated
Annual cost US$ 30–100 million
Assessment: 3 − underway with significant progress.
78 of 119 target units are operating (Sep 2020). The Indian and Atlantic Ocean arrays are harder-hit than the Pacific, due to COVID-19 restrictions and the classification of the Pacific array as operational.
Action O43: Develop time-series-based biogeochemical data Action Establish a coordinated network of ship-based multidisciplinary time series that is
geographically representative; initiate a global data product of time-series-based biogeochemical data
Benefit Provision of comprehensive regular observations of ocean biogeochemistry, complementary to the
GO-SHIP decadal survey
- 287 -
Time frame Internationally agreed plans published by end 2018; implementation build-up to 2020
Who Parties’ national research agencies, working with IOCCP and user groups, such as IGMETS
Performance indicator
Publication of internationally agreed plans; timely availability of data in internationally agreed on data centres
Annual cost US$ 10–30 million
Assessment: 3 − underway with significant progress.
Work has commenced towards a time-series-based biogeochemical data product. Several workshops and community consultations have been held. A first publication of this data product is likely in 2021.
Action O44: Meteorological moorings Action Maintain measurements on surface moored buoys of meteorological parameters (air
temperature, humidity, SST, wind speed and direction) and expand range of parameters measured (surface pressure, waves, precipitation and radiation); ensure observational metadata are available for all moored buoy observations, both for current data and for the historical archive
Benefit Comprehensive marine meteorological observation delivery
Time frame Continuous
Who Parties’ national services and ocean research agencies, DBCP, OceanSITES
Performance indicator
Moorings operational and reporting to archives
Annual cost US$ 30–100 million
Assessment: 4 − progress on track.
Surface parameter coverage from moorings remains stable.
- 288 -
Action O45: Wave measurements on moorings Action Develop a strategy and implement a wave measurement component as part of the
Surface Reference
Mooring Network (DBCP and OceanSITES)
Benefit Comprehensive in situ reference observations of wave parameters.
Time frame Complete plan and begin implementation by 2020
Who Parties operating moorings, DBCP, OceanSITES, coordinated through the JCOMM Expert Team on Waves and Coastal Hazards
Performance indicator
Sea-state measurement at the international data centres
Annual cost US$ 1–10 million
Assessment: 2 − started but little progress.
Plans for cross-platform integrated wave measurements remain to be published, coverage is good in the northern hemisphere and sparse elsewhere.
Action O46: Observations of sea ice from buoys and visual survey Action Establish and sustain systematic in situ observations from sea-ice buoys, visual
surveys (SOOP and Aircraft) and ULS in the Arctic and Antarctic
Benefit Enables tracking of variability in ice thickness and extent
Time frame Continuous
Who Arctic Party research agencies, supported by the Arctic Council; Party research agencies, supported by
CLIVAR Southern Ocean Panel; JCOMM, working with CliC and OOPC
Performance indicator
Establishment of agreements/frameworks for coordination of sustained Arctic and Southern Ocean observations, implementation according to plan
Annual cost Plan and agreement of frameworks: US$ 100 000–1 million
Implementation: US$ 10–30 million
Assessment: 2 − started but little progress.
Integrated plans remain to be developed.
- 289 -
Action O47: Sustain drifter array Action Sustain global coverage of the drifting buoy array (at least 1300 drifting buoys to
cover oceans in the latitudes between 60S and 60N, excluding marginal seas, plus additional coverage for these areas) with ocean temperature sensors and atmospheric pressure sensors on all drifting buoys
Benefit Routine broad-scale observations of surface temperature and sea-level pressure in support of NWP; climate-data products (e.g. SST) and VOSClim for climate-quality flux estimates
Time frame Continuous
Who Parties’ national services and research programmes through JCOMM, DBCP and the Ship Observations Team (SOT)
Performance indicator
Data submitted to analysis centres and archives
Annual cost US$ 1–10 million
Assessment: 3 − underway with significant progress.
The number of surface drifters (1540 against a target of 1250, Sep 2020) is overall greater than the target, even as equatorial and other divergence zones are undersampled and the percentage of buoys equipped with atmospheric pressure sensors is below 50% (see A7).
Action O48: Underway observations from research and servicing vessels Action Ensure where possible that ancillary underway observations are collected during
research voyages and routine mooring servicing cruises
Benefit Improved coverage of underway observations, particularly in data-sparse, open oceans, and complementary to moored buoy arrays
Time frame Continuous.
Who National research agencies in consultation with the JCOMM Ship Observations Team and GO-SHIP
Performance indicator
Improved observations from research vessels
Annual cost US$ 1–10 million
Assessment: 3 − underway with significant progress.
The GOOS OCG Ship Observations Team continues to work with research vessels to increase observations.
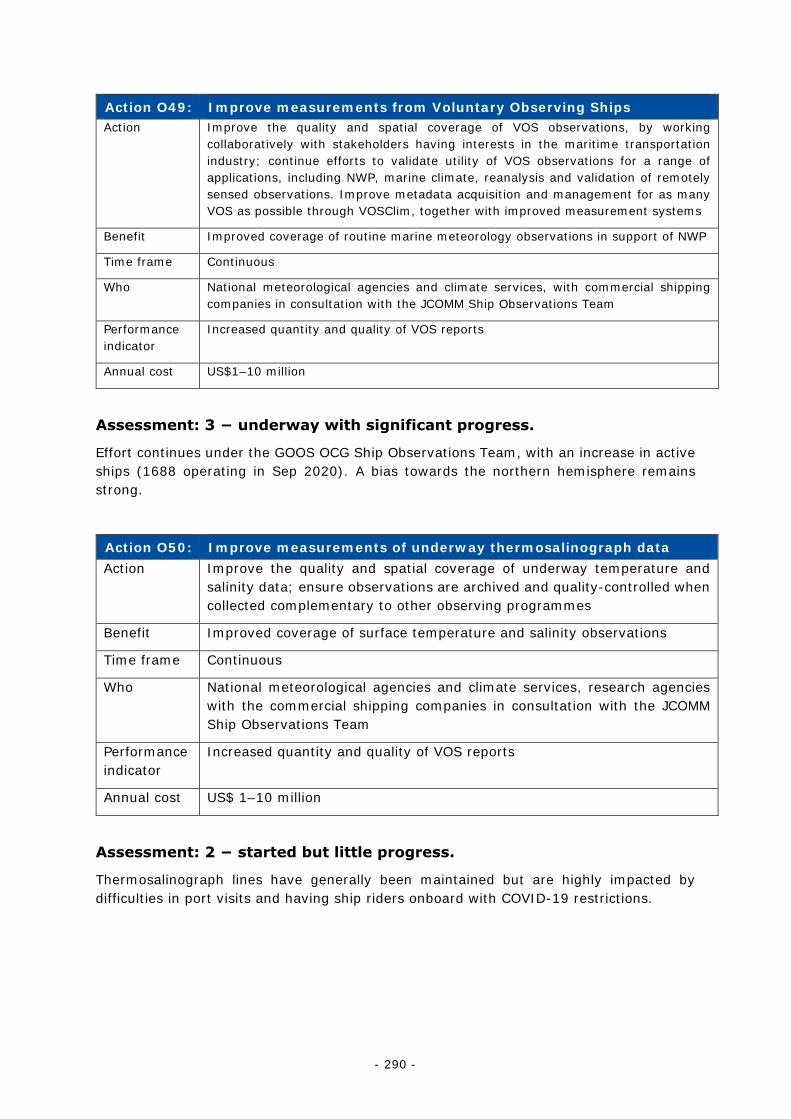
- 290 -
Action O49: Improve measurements from Voluntary Observing Ships Action Improve the quality and spatial coverage of VOS observations, by working
collaboratively with stakeholders having interests in the maritime transportation industry; continue efforts to validate utility of VOS observations for a range of applications, including NWP, marine climate, reanalysis and validation of remotely sensed observations. Improve metadata acquisition and management for as many VOS as possible through VOSClim, together with improved measurement systems
Benefit Improved coverage of routine marine meteorology observations in support of NWP
Time frame Continuous
Who National meteorological agencies and climate services, with commercial shipping companies in consultation with the JCOMM Ship Observations Team
Performance indicator
Increased quantity and quality of VOS reports
Annual cost US$1–10 million
Assessment: 3 − underway with significant progress.
Effort continues under the GOOS OCG Ship Observations Team, with an increase in active ships (1688 operating in Sep 2020). A bias towards the northern hemisphere remains strong.
Action O50: Improve measurements of underway thermosalinograph data Action Improve the quality and spatial coverage of underway temperature and
salinity data; ensure observations are archived and quality-controlled when collected complementary to other observing programmes
Benefit Improved coverage of surface temperature and salinity observations
Time frame Continuous
Who National meteorological agencies and climate services, research agencies with the commercial shipping companies in consultation with the JCOMM Ship Observations Team
Performance indicator
Increased quantity and quality of VOS reports
Annual cost US$ 1–10 million
Assessment: 2 − started but little progress.
Thermosalinograph lines have generally been maintained but are highly impacted by difficulties in port visits and having ship riders onboard with COVID-19 restrictions.
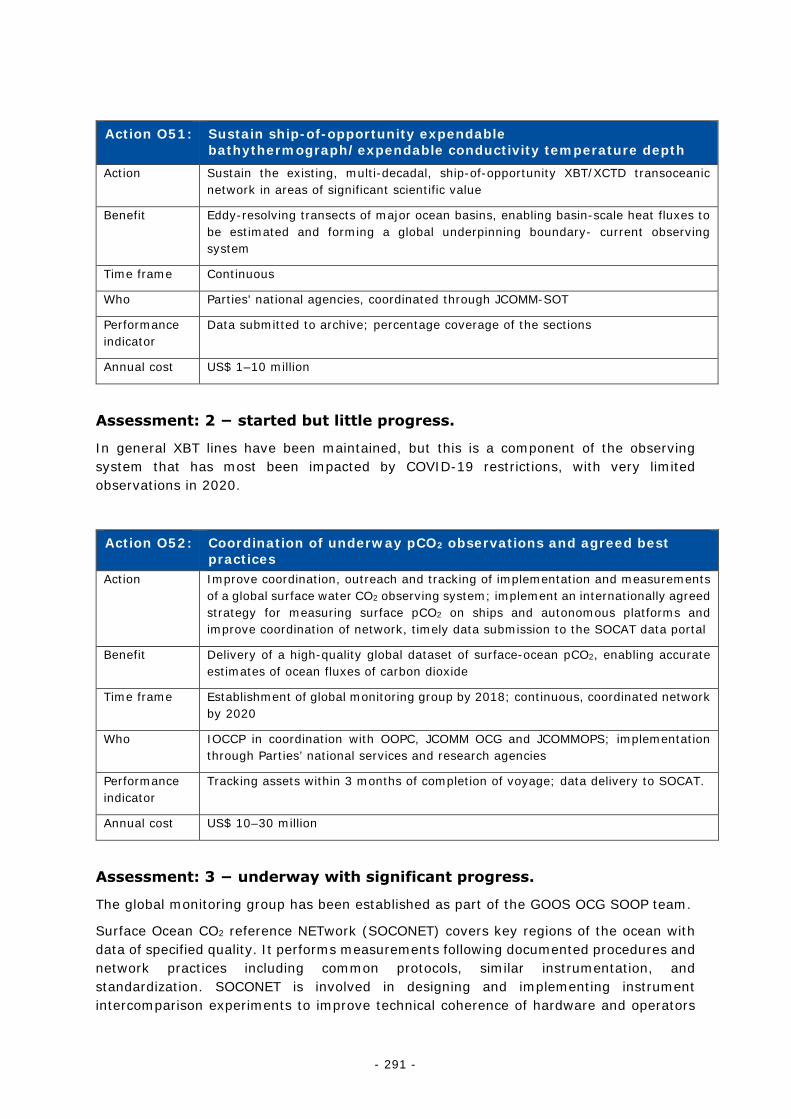
- 291 -
Action O51: Sustain ship-of-opportunity expendable bathythermograph/expendable conductivity temperature depth
Action Sustain the existing, multi-decadal, ship-of-opportunity XBT/XCTD transoceanic network in areas of significant scientific value
Benefit Eddy-resolving transects of major ocean basins, enabling basin-scale heat fluxes to be estimated and forming a global underpinning boundary- current observing system
Time frame Continuous
Who Parties' national agencies, coordinated through JCOMM-SOT
Performance indicator
Data submitted to archive; percentage coverage of the sections
Annual cost US$ 1–10 million
Assessment: 2 − started but little progress.
In general XBT lines have been maintained, but this is a component of the observing system that has most been impacted by COVID-19 restrictions, with very limited observations in 2020.
Action O52: Coordination of underway pCO2 observations and agreed best practices
Action Improve coordination, outreach and tracking of implementation and measurements of a global surface water CO2 observing system; implement an internationally agreed strategy for measuring surface pCO2 on ships and autonomous platforms and improve coordination of network, timely data submission to the SOCAT data portal
Benefit Delivery of a high-quality global dataset of surface-ocean pCO2, enabling accurate estimates of ocean fluxes of carbon dioxide
Time frame Establishment of global monitoring group by 2018; continuous, coordinated network by 2020
Who IOCCP in coordination with OOPC, JCOMM OCG and JCOMMOPS; implementation through Parties’ national services and research agencies
Performance indicator
Tracking assets within 3 months of completion of voyage; data delivery to SOCAT.
Annual cost US$ 10–30 million
Assessment: 3 − underway with significant progress.
The global monitoring group has been established as part of the GOOS OCG SOOP team.
Surface Ocean CO2 reference NETwork (SOCONET) covers key regions of the ocean with data of specified quality. It performs measurements following documented procedures and network practices including common protocols, similar instrumentation, and standardization. SOCONET is involved in designing and implementing instrument intercomparison experiments to improve technical coherence of hardware and operators
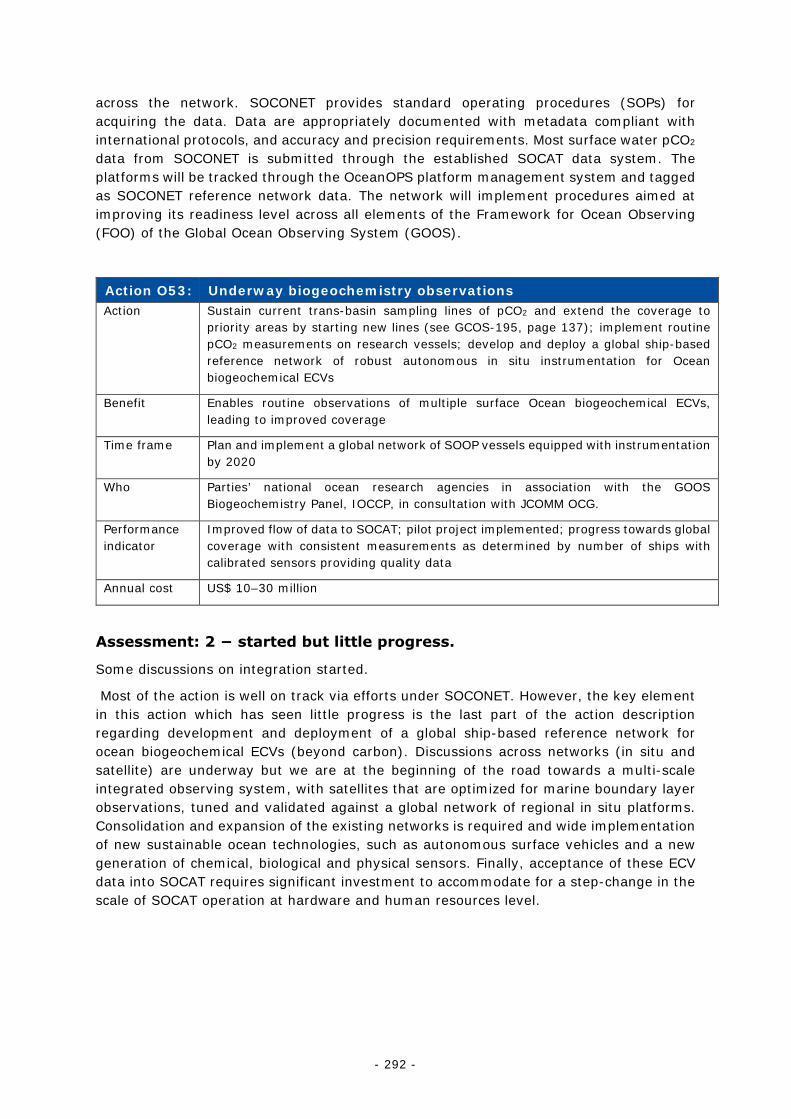
- 292 -
across the network. SOCONET provides standard operating procedures (SOPs) for acquiring the data. Data are appropriately documented with metadata compliant with international protocols, and accuracy and precision requirements. Most surface water pCO2 data from SOCONET is submitted through the established SOCAT data system. The platforms will be tracked through the OceanOPS platform management system and tagged as SOCONET reference network data. The network will implement procedures aimed at improving its readiness level across all elements of the Framework for Ocean Observing (FOO) of the Global Ocean Observing System (GOOS).
Action O53: Underway biogeochemistry observations Action Sustain current trans-basin sampling lines of pCO2 and extend the coverage to
priority areas by starting new lines (see GCOS-195, page 137); implement routine pCO2 measurements on research vessels; develop and deploy a global ship-based reference network of robust autonomous in situ instrumentation for Ocean biogeochemical ECVs
Benefit Enables routine observations of multiple surface Ocean biogeochemical ECVs, leading to improved coverage
Time frame Plan and implement a global network of SOOP vessels equipped with instrumentation by 2020
Who Parties’ national ocean research agencies in association with the GOOS Biogeochemistry Panel, IOCCP, in consultation with JCOMM OCG.
Performance indicator
Improved flow of data to SOCAT; pilot project implemented; progress towards global coverage with consistent measurements as determined by number of ships with calibrated sensors providing quality data
Annual cost US$ 10–30 million
Assessment: 2 − started but little progress.
Some discussions on integration started.
Most of the action is well on track via efforts under SOCONET. However, the key element in this action which has seen little progress is the last part of the action description regarding development and deployment of a global ship-based reference network for ocean biogeochemical ECVs (beyond carbon). Discussions across networks (in situ and satellite) are underway but we are at the beginning of the road towards a multi-scale integrated observing system, with satellites that are optimized for marine boundary layer observations, tuned and validated against a global network of regional in situ platforms. Consolidation and expansion of the existing networks is required and wide implementation of new sustainable ocean technologies, such as autonomous surface vehicles and a new generation of chemical, biological and physical sensors. Finally, acceptance of these ECV data into SOCAT requires significant investment to accommodate for a step-change in the scale of SOCAT operation at hardware and human resources level.
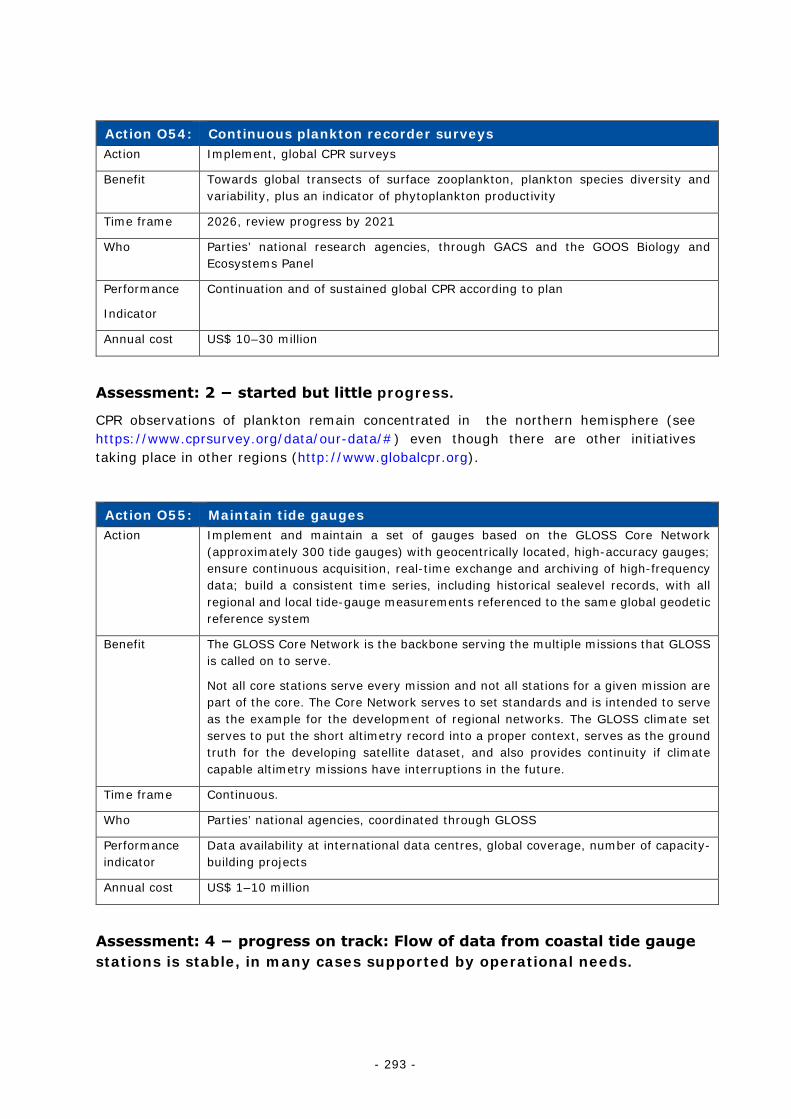
- 293 -
Action O54: Continuous plankton recorder surveys Action Implement, global CPR surveys
Benefit Towards global transects of surface zooplankton, plankton species diversity and variability, plus an indicator of phytoplankton productivity
Time frame 2026, review progress by 2021
Who Parties’ national research agencies, through GACS and the GOOS Biology and Ecosystems Panel
Performance
Indicator
Continuation and of sustained global CPR according to plan
Annual cost US$ 10–30 million
Assessment: 2 − started but little progress.
CPR observations of plankton remain concentrated in the northern hemisphere (see https://www.cprsurvey.org/data/our-data/#) even though there are other initiatives taking place in other regions (http://www.globalcpr.org).
Action O55: Maintain tide gauges Action Implement and maintain a set of gauges based on the GLOSS Core Network
(approximately 300 tide gauges) with geocentrically located, high-accuracy gauges; ensure continuous acquisition, real-time exchange and archiving of high-frequency data; build a consistent time series, including historical sealevel records, with all regional and local tide-gauge measurements referenced to the same global geodetic reference system
Benefit The GLOSS Core Network is the backbone serving the multiple missions that GLOSS is called on to serve.
Not all core stations serve every mission and not all stations for a given mission are part of the core. The Core Network serves to set standards and is intended to serve as the example for the development of regional networks. The GLOSS climate set serves to put the short altimetry record into a proper context, serves as the ground truth for the developing satellite dataset, and also provides continuity if climate capable altimetry missions have interruptions in the future.
Time frame Continuous.
Who Parties’ national agencies, coordinated through GLOSS
Performance indicator
Data availability at international data centres, global coverage, number of capacity-building projects
Annual cost US$ 1–10 million
Assessment: 4 − progress on track: Flow of data from coastal tide gauge stations is stable, in many cases supported by operational needs.
- 294 -
Action O56: Developing a global glider observing system Action Design and begin implementation of a globally distributed network of multi-
disciplinary glider missions across the continental shelf seas to the open ocean as part of a glider reference coastal–open ocean observation network
Benefit Multi-disciplinary, high-frequency observations enabling the linkage of open ocean and coastal environments and cross-shelf exchange of properties
Time frame Framework and plan developed by 2020
Who National research programmes coordinated by the global glider programme and GOOS
Performance indicator
Published, internationally agreed plan and implementation of sustained coastal boundary–open ocean sections
Annual cost US$ 10–30 million
Assessment: 3 − underway with significant progress.
The GOOS OCG OceanGliders network (oceangliders.org) has been established and is working towards a global plan that will support observations of boundary currents, water transformation, ocean health and ecosystems, and storms.
Action O57: Developing a global animal-tagging observing system Action Move towards global coordination of pinniped tagging for ecosystem and climate
applications, including the coordination of deployment locations/species and QA/QC of resultant data
Benefit High-frequency T/S profile data in polar regions and in the ice zone, filling a critical gap in the observing system; high-frequency T/S profile data in other regions providing complementary data to other observing systems and likely high-frequency sampling of physical features of interest to foraging animals such as fronts and eddies
Time frame Framework and plan developed by 2020
Who National research programmes coordinated through SOOS, SAEON, GOOS
Performance indicator
An internationally recognized coordination activity and observing plan.
Annual cost US$ 10–30 million
Assessment: 3 − underway with significant progress.
The GOOS OCG AniBos network has been established to coordinate and promote best practice in temperature and salinity measurements, biogeochemical ECV measurements, and animal tracking data. The austral summer retagging season 2020-2021 will be highly impacted by COVID-19 restrictions, and so one year of data will be degraded.
- 295 -
B.d Terrestrial
Action T1: Improve coordination of terrestrial observations Action Establish mechanism to coordinate terrestrial observations: this will be particularly
important for climate change impacts and adaptation where local information will be critical and will not be provided through GCOS directly. It includes biodiversity and natural resources information and could also incorporate socioeconomic components (e.g. health) to become fine-tuned with post-2015 frameworks. This would be based on discussions with stakeholders and could include a formal framework or regular meetings to exchange ideas and coordinate observational requirements.
Benefit Efficient observing systems with minimal duplication, delivering consistent and comparable data to a range of different users
Time frame 2017: Hold workshops to discuss way forward 2019: Mechanism in place.
Who All involved in terrestrial observations. Initially TOPC, GEO, ICSU, GOFC-GOLD, FluxNet, NEON
Performance indicator
Presence of active mechanism
Annual cost US$ 100 000–1 million
Assessment: 3 – Underway with significant progress.
Discussions have taken place with FAO, GEO and others, on how to replace GTOS. However, no clear proposal has emerged, there is no funding, and it is unclear how such a body would proceed as many groups have moved forward without GTOS. While there was a willingness to coordinate, there is no clear vision of who would fund this. In the absence of GTOS the various groups have developed their own ways of working together with several networks now reporting to TOPC.
Action T2: Develop joint plans for coastal zones Action Jointly consider observations of coastal zones (including sea ice, mangroves and sea
grass, river and groundwater flows, nutrients, etc.) to ensure the seamless coverage of ECVs and the global cycles in these areas
Benefit Consistent, accurate and complete monitoring of coastal zones
Time frame 2017: joint meetings
2019: agreed plans
Who All involved in coastal observations. Initially TOPC, OOPC
Performance indicator
Plan completed
Annual cost US$ 1 000–10 000k
Assessment: 2 – Started but little progress.
- 296 -
While initial discussions have been held with OOPC, there has been little progress. Issue for oceanography include the lack of data on river discharge, and the on-going development of ecosystem ECV in the oceans. Monitoring techniques for the coastal oceans need to be developed as well as a clear picture of the user needs.
Action T3: Terrestrial monitoring sites Action Review the need for establishing a public database of sites that aim to record climate-
relevant data and their data. Consider the usefulness of establishing a set of GCOS terrestrial monitoring sites that aim to monitor at least one ECV according to the GCMP.
Benefit Improved access to monitoring and increased use of the data
Time frame One year for review
Who GCOS
Performance indicator
Report on GCOS terrestrial monitoring sites
Annual cost US$ 10 000–100 000
Assessment: 1 – Not done.
There have been discussions on including terrestrial ECV with the GCOS Surface Reference Network (GSRN) (TOPC contributed to its design) but slow progress while GSRN is established through the WMO process. Without GTOS its database seems lost.
Action T4: Review of monitoring guidance Action Review existing monitoring standards/guidance/best practice for each ECV and
maintain database of this guidance for terrestrial ECVs
Benefit Improved consistency and accuracy of results to meet user needs
Time frame Review: 2017–2018, maintain database as of 2019
Who TOPC
Performance indicator
Presence of maintained database
Annual cost US$ 1 000 –10 000
Assessment: 1 – Not done.
Overall, there has been little progress. Some groups around permafrost and glaciers have worked on guidance but otherwise there has been little incentive to do this.
- 297 -
Action T5: Develop metadata Action Provide guidance on metadata for terrestrial ECVs and encourage its use by data
producers and data holdings
Benefit Provide users with a clear understanding of each dataset and the differences and applicability of different products for each ECV
Time frame 2018
Who TOPC in association with appropriate data producers
Performance indicator
Availability of metadata guidance
Annual cost US$ 1 000 –10 000
Assessment: 3 – Underway with significant progress.
There has been some progress with WMO, through its metadata standard and its desire to adopt an Earth systems approach.
Action T6: Identify capacity development needs Action Identify capacity-development needs to inform GCM and other capacity-building
initiatives; identify specific improvements that could be supported by GCM
Benefit Improved monitoring in recipient countries
Time frame Ongoing
Who TOPC and GCM
Performance indicator
Project proposals and Implemented projects
Annual cost US$ 10 000–100 000
Assessment: 3 – Underway with significant progress.
The regional workshops have been successful in identifying capacity building (and other) needs where they have been held (i.e. Pacific, East Africa and the Caribbean). Issues include sustainability, data exchange, planning and staff retention. Many countries with few resources cannot afford sufficient monitoring and this has contributed to the WMO developments of GBON and SOFF.
- 298 -
Action T7: Exchange of hydrological data Action In line with WMO Resolutions 25 (Cg-XIII) and 40 (Cg-XII), improve the exchange
hydrological data and delivery to data centres of all networks encompassed by GTN-H, in particular the GCOS baseline networks, and facilitate the development of integrated hydrological products to demonstrate the value of these coordinated and sustained global hydrological networks.
Benefit Improved reporting filling large geographic gaps in datasets
Time frame Continuing; 2018 (demonstration products)
Who GTN-H partners in cooperation with WMO and GCOS
Performance indicator
Number of datasets available in international data centres; number of available demonstration products
Annual cost US$ 100 000–1 million
Assessment 1: – Not done.
No improvement despite the efforts of GTN-H and WMO. Hydrological data is often not exchanged or shared on a free and open basis in many parts of the world. Some data is available and often models used to fill the gaps. Efforts are underway to fill some of the gaps using satellite data.
Action T8: Lakes and reservoirs: compare satellite and in situ observations Action Assess accuracy of satellite water-level measurements by a comparative analysis of
in situ and satellite observations for selected lakes and reservoirs
Benefit Improved accuracy
Time frame 2017–2020
Who Legos/CNES, HYDROLARE
Performance indicator
Improving accuracy of satellite water-level measurements
Annual cost US$ 10 000–100 000
Assessment 3: – Underway with significant progress.
Considerable improvements in the databases of the satellite observations together with available in situ data are improving the accuracy of satellite observations and contributing to the design of future missions.
- 299 -
Action T9: Submit historical and current monthly lake-level data Action Continue submitting to HYDROLARE historical and current monthly lake-level data for
GTN-L lakes and other lakes, as well as weekly/monthly water-temperature and ice-thickness data for GTN-L
Benefit Maintain data record
Time frame Continuous
Who National Hydrological Services through WMO CHy and other institutions and agencies providing and holding data
Performance indicator
Completeness of database
Annual cost US$ 100 000–1 million (40% in non-Annex-1 Parties)
Assessment 3: – Underway with significant progress.
The most complete regime information on the results of in situ observations of lake water level, lake surface water temperature, lake ice thickness for 250 lakes is held in the international HYDROLARE database. Nevertheless, some originators of data for LSWT do not openly share data or participate in organised stewardship systems: presently ESA’s Lake CCI project is attempting to collect additional in situ data on an annual basis for annual climate assessment activities.
Action T10: Establish sustained production and improvement for the Lake ECV products
Action Establish satellite-based ECV data records for Lake-surface water temperature, Lake ice coverage and Lake water-leaving reflectance (Lake colour); implement and sustain routine production of these new satellite based products;
Sustain efforts on improving algorithms, processing chains and uncertainty assessments for these new ECV products, including systematic in situ data sharing and collection in support of ECV validation;
Develop additional products derived from Lake water-leaving reflectance for turbidity, chlorophyll and coloured dissolved organic matter
Benefit Add additional Lake ECV products for extended data records; provide a more comprehensive assessment of climate variability and change in lake systems
Time frame Continuous.
Who Space agencies and CEOS, Copernicus Global Land Service, GloboLakes and ESA CCI
Performance indicator
Completeness of database
Annual Cost 1–10M US$ (40% in non-Annex-1 Parties)
Assessment 3: – Underway with significant progress.
- 300 -
As noted above, ESA’s Lakes CCI is establishing satellite-based ECV data records. Sustaining these efforts is not yet guaranteed. The GloboLakes Lake Surface Temperature product is being updated and reported on by the Copernicus Climate Change Service.
Action T11: Confirm Global Terrestrial Network for River Discharge sites Action Confirm locations of GTN-R sites; determine operational status of gauges at all GTN-
R sites; ensure that GRDC receives daily river discharge data from all priority reference sites within one year of observation (including measurement and data transmission technology used)
Benefit Up-to-date data for all areas
Time frame 2019
Who National Hydrological Services, through WMO CHy in cooperation with TOPC, GCOS and GRDC
Performance indicator
Reports (made in cooperation with GTN-H partners) to TOPC, GCOS and WMO CHy on the completeness of the GTN-R record held in GRDC, including the number of stations and nations submitting data to GRDC, National Communication to UNFCCC
Annual cost US$ 1–10 million (60% in non-Annex I Parties)
Assessment 3: – Underway with significant progress.
The Global Terrestrial Network for River Discharge (GTN-R) draws together available QC/QA river discharge data, ideally within a year after measurement, and currently from 326 gauging stations worldwide. Work is continuing to check their locations and determine their status; however, some errors remain and not all records are up to date.
Action T12: National needs for river gauges Action Assess national needs for river gauges in support of impact assessments and
adaptation and consider the adequacy of those networks
Benefit Prepare for improvement proposals
Time frame 2019
Who National Hydrological Services, in collaboration with WMO CHy and TOPC
Performance indicator
National needs identified; options for implementation explored
Annual cost US$ 10–30 million (80% in non-Annex I Parties)
Assessment: 1 – Not done
Due to lack of engagement of partners and lack of clear resources to implement improvements no progress was made.
- 301 -
Action T13: Establish a full-scale Global Groundwater Monitoring Information System (GGMS)
Action Complete the establishment of a full-scale GGMS as a web portal for all GTN-GW datasets; continue existing observations and deliver readily available data and products to the information system
Benefit Global, consistent and verified datasets available to users
Time frame 2019
Who IGRAC, in cooperation with GTN-H and TOPC
Performance indicator
Reports to UNESCO IHP and WMO CHy on the completeness of the GTN-GW record held in GGMS, including the number of records in, and nations submitting data to, GGMS; web-based delivery of products to the community
Annual cost US$ 1–10 million
Assessment: 4 − Progress on track.
The Global Groundwater Monitoring Network (GGMN)is a participative, web-based network of networks set up to improve quality and accessibility of groundwater monitoring information and subsequently knowledge on the state of groundwater resources.
Back in 2007, a workshop on Global Monitoring of Groundwater Resources, jointly sponsored by IGWCO, GARS and UNESCO, was held at the International Groundwater Resources Assessment Centre (IGRAC). One important outcome of this meeting was to support IGRAC as the lead institution for the development of a Global Groundwater Monitoring System (GGMS). At that time, the intention was that GGMS was the product of GTN-GW, whose success would depend on coordination among several agencies, as: ESA, GARS, GEMS/Water, GRAPHIC, GRDC, GTN-(H,L,P,R), IAEA, IGRAC, IGWCO NASA/Goddard Space Flight Center, TU Delft, UNESCO, USGS, University of California (Berkeley, Irvine, USA), University of New Hampshire (USA), VU Amsterdam (the Netherlands), and WHYMAP (http://www.fao.org/tempref/docrep/fao/011/i0197e/i0197e07.pdf). Five years later, the GGMN Programme was launched by IGRAC, as a UNESCO and WMO programme. GTN-GW did not exist as such, but its role was fulfilled by GGMN, which works as a global network of national groundwater monitoring networks and it is part of GTN-H. The last version of the portal was launched in 2016, including advanced time series analysis functionalities. In 2019, the mobile app of GGMN was launched.
GGMN holds groundwater level data from 39208 stations in 34 countries. IGRAC is permanently updating the data in GGMN and contacting new countries to expand the network.
Although GGMN is a UNESCO and WMO programme, there is no defined mechanism to report neither to UNESCO IHP and WMO CHy on the completeness of the network.
- 302 -
Action T14: Operational groundwater monitoring from gravity measurements Action Develop an operational groundwater product, based on satellite observations
Benefit Global, consistent and verified datasets available to users
Time frame 2019
Who Satellite agencies, CEOS, CGMS
Performance indicator
Reports to UNESCO IHP and WMO CHy on the completeness of the GTN-GW record held in GGMS, including the number of records in, and nations submitting data to, GGMS; web-based delivery of products to the community.
Annual Cost US$ 1–10 million
Assessment: 3 − Underway with significant progress.
The Global Gravity-based Groundwater Product (G3P) will show groundwater storage variations with global coverage and monthly resolution from 2002 until present.
G3P is an ongoing H2020 project (2020-2022) that aims at integrating the Essential Climate Variable (ECV) Groundwater as a new product into the Copernicus Services (European Union's Earth Observation Programme), as there is no consistent global freely accessible data set on groundwater storage variations based on gravity data yet. The G3P Consortium is integrated by 12 project partners: GFZ (coordinator), UB, TUG, FMI, TUW, CLS, IGRAC, UZH, MAG, LEGOS, FUWA and EODC. It is worth noting that IGRAC (GGMN) and TUW (International Soil Moisture Network, ISMN) are part of GTN-H.
The G3P product on long-term monthly groundwater storage change will be made available for visualization, analysis and download for further applications to the general public and to the various user communities by two service portals: the gravity Information Service (GravIS) and the Global Groundwater Monitoring Network (GGMN). In this way, G3P through GGMN will provide the first global quantitative data source for the ECV Groundwater, a valuable input for GCOS.
More information in: https://www.g3p.eu/.
Action T15: Satellite soil-moisture data records Action Regularly update individual microwave sensor (SMOS, SMAP, ASCAT, AMSR-E …)
soil-moisture data records, including the subsidiary variables (freeze/thaw, surface inundation, vegetation optical depth, root-zone soil moisture)
Benefit Time series of data to identify trends over time
Time frame Continuing
Who Space agencies (ESA, EUMETSAT, NASA, NOAA, JAXA …) and Earth observation service providers
Performance indicator
Availability of free and open global soil-moisture data records for individual microwave missions
Annual cost US$ 10–30 million
- 303 -
Assessment: 3 – Underway with significant progress
Several single-microwave-satellite (SMAP, SMOS, ASCAT, AMRS-2) based soil moisture data (surface and profile) are fully operational and provide regular re-processed data record. However, only few also contain information about the freeze/thaw status and vegetation optical depth, and none contains surface inundation as subsidiary variables. Moreover, SMAP and SMOS are well beyond their regular lifetime, and no successor missions are planned.
EUMETSAT H-SAF regularly releases re-processed soil moisture data records referred to as "Surface Soil Moisture Metop ASCAT Data Record Time Series". See http://hsaf.meteoam.it/description-h25-h108-h111.
Action T16: Multi-satellite, soil-moisture data services Action Regularly update of merged multi-sensor, soil-moisture data records, including the
subsidiary variables
(freeze/thaw, surface inundation, vegetation optical depth, root-zone soil moisture)
Benefit High-quality, soil moisture CDR for users
Time frame Continuing
Who Copernicus, NOAA, Earth observation data providers
Performance indicator
Availability of free and open merged multi-sensor data records (merged passive, merged active and merged active-passive data)
Annual cost US$ 1–10 million
Assessment: 3 – Underway with significant progress. The ESA CCI soil moisture product and its operational counterpart C3S soil moisture product are systematically produced and further developed, but provision of subsidiary variables and uncertainty budgets need to be improved, even as retrievals in challenging environments.
The ESA CCI multi-sensor soil moisture product is a research product that is systematically extended and improved on a yearly basis. It contains two three datasets: one based on microwave radiometers only (e.g. SMOS, AMSR, TMI), one based on scatterometers only (ERS, ASCAT), and a dataset based on both radiometer and scatterometer data. The ESA CCI soil moisture methodology feeds into the Copernicus Climate Change Service (C3S) to produce every 10 days in a fully operational fashion an update of the climate data record. While a large archive of validation studies of the product exists, a systematic end-to-end error budget is lacking, even as ancillary information about the freeze/thaw status, vegetation optical depth, even as the level of surface inundation. With agreed continuation of the C-band scatterometer missions, continuation of part of the input mission is given. However, the latest product versions significantly benefit from the inclusion of the dedicated L-band missions SMAP and SMOS, which is threatened by the fact that these are well beyond their regular lifetime, and no successor missions are planned.
Other, scientific multi-sensor products are being developed for shorter and more homogeneous time periods.
- 304 -
Action T17: International soil-moisture network Action Operate, provide user services and expand the International Soil Moisture Network
(ISMN), which is part of the GTN-H.
Benefit Coordinated in situ soil moisture data for users and calibration/validation
Time frame Continuing
Who Vienna Technical University, supported by national data providers, ESA, GEWEX, CEOS and GEO
Performance indicator
Availability of harmonized and quality-controlled in situ soil-moisture data provided by network operators to ISMN
Annual cost US$ 100 000–1 million (includes only central services of the ISMN data centre)
Assessment: 3 – Underway with significant progress.
The International Soil Moisture Network (ISMN) has been operational for more than 10 years and is still expanding, although long-term financial commitment for the data hosting facility and its contributing data network providers is largely lacking.
The ISMN started operations in 2010 and is still rapidly growing in terms of data volume and number of users served. Since the beginning, the ISMN has been funded by ESA, currently within the QA4EO programme. Despite being a global network, data coverage is still poor in many regions of the world, in particular the global South.
As the operation of the ISMN is labour and resource intense, there is the intention to transfer the ISMN to an operational data centre. A strong interest in hosting the ISMN has been expressed by some German ministries, but no final commitment has been made so far. On the mid-term, R&D support is expected to remain under the umbrella of ESA. Future R&D shall focus on providing full traceability and providing fiducial reference measurements of soil moisture measurements containing end-to-end uncertainty budgets and representativeness information.
Action T18: Regional high-resolution soil-moisture data record Action Develop high-resolution soil-moisture data records for climate change adaptation
and mitigation by exploiting microwave and thermal remote-sensing data
Benefit Availability of data suitable for adaptation
Time frame 2017–2020
Who NASA Soil Moisture Active-Passive Programme, ESA Climate Change Initiative, Copernicus Evolution
Activities in cooperation with identified universities and research organizations
Performance indicator
Public releases of experimental multi-year (> 10 years) high-resolution, soil-moisture data records
Annual cost US$ 10–30 million
Assessment: 2 – Started but little progress.
- 305 -
First high-resolution soil moisture data services based on fusing Sentinel-1 SAR and other microwave data (SMAP, ASCAT) have been launched, but work to validate, improve and apply these data is still at the beginning.
First high-resolution soil moisture data sets have become available, for example the SMAP/Sentinel-1 L2 Radiometer/Radar 30-Second Scene 3 km EASE-Grid Soil Moisture data set or the Copernicus Global Land 1 km Sentinel-1 surface soil moisture and 1 km ASCAT-Sentinel-1 based Soil Water Index (SWI) data for Europe. Additionally, several research data sets created by fusing microwave and optical/thermal data have been published. However, the quality and respective strengths and weaknesses of these novel high-resolution soil moisture data sets are yet only poorly understood. In this respect, an important problem is the lack of very dense in situ soil moisture networks and the unknown quality of simulated high-resolution soil moisture data.
A beta version of the SMAP/Sentinel-1 L2 Radiometer/Radar 30-Second Scene 3 km EASE-Grid Soil Moisture data set has become available at the NASA National Snow and Ice Data Center Distributed Active Archive Center (NSIDC DAAC):
https://nsidc.org/the-drift/data-update/high-resolution-smapsentinel-1-soil-moisture-data-available/
Action T19: Maintain and extend the in situ mass balance network Action Maintain and extend the in situ mass balance network, especially within developing
countries and High Mountain Asia (Himalaya, Karakorum, Pamir) (e.g. using capacity-building and twinning programmes)
Benefit Maintain a critical climate record
Time frame Ongoing
Who Research community, national institutions and agencies
Performance indicator
Number of observation series submitted to WGMS
Annual cost US$ 100 000–1 million
Assessment: 3 – Underway with significant progress.
Network is being maintained but needs to be expanded. Between 2017 and the end of 2019 the number of observations increased by 6% covering only 2% more glaciers.
- 306 -
Action T20: Improve the funding situation for international glacier data centres
Action Improve the funding situation for international glacier data centres and services as well as for long-term glacier-monitoring programmes. Integrated and international availability of funding for sustaining programme, expecting also private sector contributions
Benefit Secure long-term monitoring and data availability
Time frame 2020
Who National and international funding agencies
Performance indicator
Resources dedicated to glacier-database management at WGMS and NSIDC; number of reference glaciers with more than 30 years of continued observations
Annual cost US$ 1–10 million
Assessment 3: – Underway with significant progress.
Continued funding for the compilation and dissemination of glacier datasets could be raised by the WGMS (about 2 FTE) and NSIDC (about 1 FTE) from national agencies. This remains an ongoing task and the secured resources are very limited as compared to the increasing amount of potentially available data from remote sensing and the increasing user needs.
Progress:
● WGMS get long-term core funding from Swiss government. ● NSIDC got some project money dedicated to the GLIMS database. ● Based on an evaluation at both international and national levels in 2019, the WGMS
got approved continued funding including a 4% increase of the general budget (about 2 FTE).
Action T21: Encourage and enforce research projects to make their ECV-relevant observations available through the dedicated international data centres
Action Encourage and enforce research projects to make their ECV-relevant observations available through the dedicated international data centres (e.g. through dedicated budget lines and the use of digital object identifiers for datasets).
Benefit Open and long-term availability of data for users
Time frame Ongoing
Who National funding agencies
Performance indicator
Number of datasets submitted to dedicated international data centres
Annual cost US$ 100 000–1 million
Assessment: 3 – Underway with significant progress.
GCOS continues to advocate for ECVs to be openly and freely available and has encouraged the continued support of data centres.
- 307 -
Action T22: Global Glacier Inventory Action Finalize the completion of a global reference inventory for glaciers and increase its
data quality (e.g. outline, time stamp) and data richness (e.g. attribute fields, hypsometry)
Benefit Improved data quality on glaciers
Time frame 2020
Who NSIDC and WGMS with GLIMS research community and space agencies
Performance indicator
Data coverage in GLIMS database
Annual cost US$ 100 000–1 million
Assessment 4: − Progress on track.
Good progress has been made with respect to both data quality and data richness with the release of the global reference glacier inventory (RGI 6.0, a snapshot global inventory around the year 2000) and its integration into the multi-temporal GLIMS database. A complete global coverage of glacier mass changes (2000-2020) is now available (Hugonnet et al., 2021).
Progress:
● Ongoing effort of GLIMS community: http://www.glims.org/ ● IACS Working Group working on this
task: https://cryosphericsciences.org/activities/working-groups/rgi-working-group/ http://www.cryosphericsciences.org/wg_randGlacierInv.html
• Above products are brokered to C3S Climate Data Store: https://climate.copernicus.eu/
References:
Hugonnet, R., R. McNabb, R., E. Berthier et al. 2021 : Accelerated global glacier mass loss in the early twenty-first century, Nature, 592, 726–731. https://doi.org/10.1038/s41586-021-03436-z
Action T23: Multi-decadal glacier inventories Action Continue to produce and compile repeat inventories at multi-decadal timescale
Benefit Extend the time series of glacier information
Time frame Ongoing
Who NSIDC and WGMS with GLIMS research community and space agencies.
Performance indicator
Data coverage in GLIMS database
Annual cost US$ 1–10 million
Assessment: 2 − Started but little progress.
- 308 -
A recent IACS working group (2020-2023) aims at finalizing the reference inventory around the year 2000 (RGI 7.0) and develop it further towards multi-temporal snapshots, e.g. around 2000, 2015, 1985.
Continued efforts in improving a worldwide glacier inventory within Copernicus Climate Change service: https://cds.climate.copernicus.eu/cdsapp#!/dataset/insitu-glaciers-extent?tab=overview
National assessment of implementation (as of 2015) of international monitoring strategy, including state of glacier inventories: Gärtner-Roer et al., 2019: Worldwide assessment of national glacier monitoring and future perspectives. Mountain Research and Development. https://doi.org/10.1659/MRD-JOURNAL-D-19-00021.1
New IACS Working Group (RGI, 2020-2023):
https://cryosphericsciences.org/activities/working-groups/rgi-working-group/
Action T24: Allocate additional resources to extend the geodetic dataset Action Allocate additional resources to extend the geodetic dataset at national, regional
and global levels: decadal elevation change can potentially be computed for thousands of glaciers from air- and spaceborne sensors
Benefit Improved accuracy of glacier change
Time frame Ongoing
Who WGMS with research community and space agencies
Performance indicator
Data coverage in WGMS database
Annual cost US$ 30–100 million
Assessment: 3 − Underway with significant progress.
The WGMS has made significant progress in compiling geodetic elevation changes from thousands of glaciers thanks project funding from ESA and Copernicus and in collaboration with the research community.
Progress:
● The WGMS started to compile and produce geodetic elevation changes for several thousand glaciers within the Copernicus Climate Change Service: http://wgms.ch/boost-remote-sensing-data/
● The WGMS encouraged its network of Principal Investigators to participate in a first scientific exploitation of the global DEM product of the TanDEM-X mission for glacier monitoring: http://wgms.ch/boost-remote-sensing-data/
● In coordination with LEGOS and the WGMS, glaciologists can acquire stereo data of selected benchmark glaciers at the end of the melt season: http://wgms.ch/boost-remote-sensing-data/
● New IACS Working Group (RAGMAC, 2020-2023) aims at achieving global coverage: https://cryosphericsciences.org/activities/wg-ragmac/
● The new amount of data requires an upgrade of the database infrastructure at the WGMS. A proposal for a corresponding project with a database manager is under evaluation by the national agencies.
- 309 -
Action T25: Extend the glacier-front variation dataset both in space and in time
Action Extend the glacier-front variation dataset both in space and back in time, using remote-sensing, in situ observations and reconstruction methods
Benefit Understanding long-term trends in glacier extent (mass trends need additional information)
Time frame Ongoing
Who WGMS with research community and space agencies
Performance indicator
Data coverage in WGMS database
Annual Cost US$ 10 000–100 000
Assessment: 2 − Started but little progress.
The network of glaciers with reported front-variation measurements was maintained in Europe but has stopped in most other regions. Many in situ programmes were abandoned and not replaced by remotely sensed observations. In some regions, the observations were stopped because the glaciers have disintegrated and vanished.
Progress:
● WGMS has annual calls-for-data to compile glacier front variation data from direct observations.
● The WGMS has extended its database to store glacier front variations from reconstructions (e.g. historical & pictorial sources, dendrochronology).
Action T26: Glacier observing sites Action Maintain current glacier-observing sites and add additional sites and infrastructure
in data-sparse regions, including South America, Africa, the Himalayas, the Karakoram and Pamir mountain ranges, and New Zealand; attribute quality levels to long-term mass-balance measurements; improve satellite based glacier inventories in key areas
Benefit Sustained global monitoring to understand global trends
Time frame Continuing, new sites by 2017
Who Parties’ national services and agencies coordinated by GTN-G partners, WGMS, GLIMS and NSIDC
Performance indicator
Completeness of database held at NSIDC from WGMS and GLIMS
Annual cost US$ 10–30 million
Assessment: 3 − Underway with significant progress.
Ongoing general action. This Action Item is covered in more detail by T22-T25.
- 310 -
There is an ongoing need for research & monitoring activities, ideally coordinated by the GTN-G bodies (i.e. WGMS, NSIDC, GLIMS). For more information see Gärtner-Roer et al. 2019 and national factsheets63.
References:
Gärtner-Roer I, SU. Nussbaumer, F. Hüsler and M. Zemp. 2019: Worldwide assessment of national glacier monitoring and future perspectives. Mountain Research and Development, 39(2): A1–A11. https://doi.org/10.1659/MRD-JOURNAL-D-19-00021.1
Action T27: Observations of glacier velocities Action Encourage observations and reporting of glacier velocities
Benefit Improve understanding of glacier dynamics and mass loss
Time frame Starting 2017
Who GTN-G partners, WGMS, GLIMS and NSIDC
Performance indicator
Completeness of database held at NSIDC from WGMS and GLIMS
Annual cost US$ 100 000–1 million
Assessment: 3 − Underway with significant progress.
Several projects have produced regional to global glacier velocity products. Observations of glacier velocity is an interesting parameter for glacier inventories (e.g. for separation of ice divides, ice thickness modelling) and glacier change estimates (e.g. flux gate method, calving rates, flow dynamics) but its interpretation as climate proxy is not straightforward.
Progress:
● ESA Glaciers_cci produced glacier velocities for several regions: http://www.esa-glaciers-cci.org/
● Global Land Ice Velocity Extraction from Landsat 8: https://nsidc.org/data/golive ● Cryoportal by ENVEO, at: http://cryoportal.enveo.at/data/
63 See https://wgms.ch/national-glacier-state/
- 311 -
Action T28: Snow-cover and snowfall observing sites Action Strengthen and maintain existing snow-cover and snowfall observing sites, provide
clear and unambiguous instructions; ensure that sites exchange snow data internationally; establish global monitoring of those data over the GTS; and recover historical data; ensure reporting includes reports of zero cover.
Benefit Improved understanding of changes in global snow
Time frame Continuing; receipt of 90% of snow measurements at international data centres
Who NMHSs and research agencies, in cooperation with WMO-GCW and WCRP and with advice from TOPC,
AOPC and GTN-H
Performance indicator
Data submission to national centres such as NSIDC and world data services
Annual cost US$ 1–10 million
Assessment: 3 − Underway with significant progress.
Several countries have monitoring networks on snow cover (monitor the snow depth and water equivalent along with other meteorological parameters), like the USA, Russia or China. It is easy for users to find the information on those networks in the websites of national meteorological organizations; for some of them users can get in situ observation data via application. At the websites of international data centres like NSIDC, most data users can find is obtained by remote sensing, re-analysis and modelling, which means still effort is needed on the international exchange of in situ observation data.
Action T29: Integrated analyses of snow Action Obtain integrated analyses of snow over both hemispheres
Benefit Improved understanding of changes in global snow
Time frame Continuous
Who Space and research agencies in cooperation with WMO-GCW and WCRP-CliC with advice from TOPC,
AOPC and IACS
Performance indicator
Availability of snow-cover products for both hemispheres
Annual cost US$ 1–10 million
Assessment: 4 − Progress on track.
Datasets produced by Aqua/Terra - MODIS, AMSR-E, DMSP - SSM/I, SSMI/S and POES-AVHRR with global coverage.
- 312 -
Datasets produced by Aqua/Terra - MODIS, AMSR-E, DMSP - SSM/I, SSMI/S and POES-AVHRR with global coverage can be found at the following websites:
● http://nsidc.org/data/g02156.html ● https://lpdaac.usgs.gov/products/modis_products_table ● http://www.globsnow.info/index.php?page=Data ● https://disc.gsfc.nasa.gov/datasets/ ● https://cds.climate.copernicus.eu/#!/search?text=ERA5&type=dataset
Action T30: Ice-sheet measurements Action Ensure continuity of in situ ice-sheet measurements and field experiments for
improved understanding of processes and for the better assessment of mass-loss changes
Benefit Robust data on trends in ice-sheet changes
Time frame Ongoing
Who Parties, working with WCRP-CliC, IACS and SCAR
Performance indicator
Integrated assessment of ice sheet change supported by verifying observations.
Annual cost US$ 10–30 million
Assessment: 4 − Progress on track.
Ice sheet measurement has progressed and providing useful field data. Several areas have been intensively investigated and new changes were recognized. However, ice sheets are vast and large mass movement is very complicated with the interaction with bottom and ocean margins. More comprehensive measurements of process are expected.
Ongoing action for the research community, still not well coordinated.
Progress in Greenland:
● Danish Programme for the monitoring of the Greenland Ice Sheet: https://www.promice.dk/home.html
Progress in Antarctica: ● CRYOBSCLIM/GLACIOCLIM SurfAce Mass Balance of Antarctica
Observatory: http://pp.ige-grenoble.fr/pageperso/favier/glacioclim-samba.php
- 313 -
Action T31: Ice-sheet model improvement Action Research into ice-sheet model improvement to assess future sea-level rise;
improving knowledge and modelling of ice–ocean interaction, calving ice-mass discharge
Benefit Improved sea-level rise forecasting
Time frame International initiative to assess local and global sea-level rise and variability
Who WCRP-CliC sea-level cross-cut, IACS and SCAR
Performance indicator
Reduction of sea-level rise uncertainty in future climate prediction from ice-sheet contributions
Annual cost US$ 1–10 million (mainly by Annex-I Parties)
Assessment: 4 − Progress on track.
Based on progressed ice sheet measurement, efforts on ice sheet modelling have been done. There is still uncertainty around ice sheet behaviour. Improvement of ice modelling is expected to answer to the strong concern on the sea level rise.
Progress Antarctica:
● Ice Sheet Mass Balance and Sea Level (ISMASS): https://www.scar.org/science/ismass/ismass/
● Progress in polar regions: ● IPCC (2019) SROCC ● https://www.ipcc.ch/site/assets/uploads/sites/3/2019/11/07_SROCC_Ch03_FINA
L.pdf
Action T32: Continuity of laser, altimetry and gravity satellite missions Action Ensure continuity of laser, altimetry and gravity satellite missions adequate to
monitor ice masses over decadal timeframes
Benefit Sustain ice-sheet monitoring into the future
Time frame New sensors to be launched in 10-30 years
Who Space agencies, in cooperation with WCRP-CliC and TOPC
Performance indicator
Appropriate follow-on missions agreed
Annual cost US$ 30–100 million
Assessment: 4 − Progress on track.
Laser, altimetry and gravity satellite missions have been provided very useful observation data to monitor ice sheet change. For continuity of each observation, satellite programs should be coordinated internationally.
Zemp et al. (2019) provides a new global assessment on glacier changes combining in situ with (strongly extended) space-based observations Continued efforts in compiling glacier mass changes from geodetic methods continue within Copernicus Climate Change
- 314 -
service: https://cds.climate.copernicus.eu/cdsapp#!/dataset/insitu-glaciers-elevation-mass?tab=overview
Useful information:
● Hvidberg, C.S., et al., User Requirements Document (URD) for the Greenland_Ice_Sheet_cci project of ESA's Climate Change Initiative, version 2.4, 2017-11-22. Available from: http://www.esa-icesheets-cci.org/.
● Hvidberg, C.S., et al., User Requirements Document for the Ice_Sheets_cci project of ESA's Climate Change Initiative, version 1.5, 03 Aug 2012. Available from: http://www.esa-icesheets-cci.org/.
● Zemp, M., Huss, M., Thibert, E. et al. Global glacier mass changes and their contributions to sea-level rise from 1961 to 2016. Nature 568, 382–386 (2019). https://doi.org/10.1038/s41586-019-1071-0
Action T33: Standards and practices for permafrost Action Refine and implement international observing standards and practices for
permafrost and combine with environmental variable measurements; establish national data centres
Benefit Consistent and comparable global observations
Time frame Complete by 2018
Who Parties’ national services/research institutions and IPA
Performance indicator
Implementation of guidelines and establishment of national centres
Annual cost US$ 100 000–1 million
Assessment: 2 − Started but little progress.
A working group on “Best practice for permafrost measurement” was set up within GCW in May-June 2020.
Current measurements rely on standards developed by various projects (e.g. CALM protocols for active layer thickness, PACE21 requirements for boreholes).
These standards will be reworked and extended for other variables within the working group on best practices initiated by GCW in spring 2020. Several GTN-P SC members are involved in this working group.
For the proposal of new rock glacier kinematics product, standards and practices are elaborated and will be provided together with the product proposal by the International Permafrost Association (IPA) Action Group on rock glaciers.
- 315 -
Action T34: Mapping of seasonal soil freeze/thaw Action Implement operational mapping of seasonal soil freeze/thaw through an
international initiative for monitoring seasonally frozen ground in non-permafrost regions and active layer freeze/thaw in permafrost regions
Benefit Improved understanding of changes in biosphere and carbon cycle
Time frame Complete by 2020
Who Parties, space agencies, national services and NSIDC, with guidance from IPA, the IGOS Cryosphere
Theme team, and WMO-GCW
Performance indicator
Number and quality of mapping products published.
Annual cost US$ 1–10 million
Assessment: 1 − Little or no progress.
No action undertaken by GTN-P.
GTN-P was fully occupied by the structuring of the permafrost monitoring network, and seasonal frost in non-permafrost areas was not a priority.
Observations show that seasonal frost can be valuably monitored only if measured together with snow thickness and soil moisture. The best way would be to implement it on standard meteorological stations.
Results show also that the seasonal freeze/thaw occurrence, frequency, depth and intensity are highly variable on short distances, due to the spatial variability of the snow cover, which questions the representativity of isolated measurement stations. This issue could be solved by setting up measurement arrays.
This is also being investigated by ESA’s CCI+.
Action T35: Ensure the consistency of the various radiant energy fluxes Action The various radiant energy fluxes (e.g. surface albedo and FAPAR) derived from
remote-sensing observation, and their compatibility with the specific requirements of the models, especially in the context of climate change studies; fire and surface albedo, especially in the context of climate change studies
Benefit Improved data leading to improved model predictions and understanding of changes in biosphere
Time frame 2020
Who CEOS WG Cal/Val, TOPC observers, CEOS/CGMS WG Climate
Performance indicator
Documented system to ensure consistency; reports demonstrating consistency
Annual cost US$ 100 000–1 million
Assessment: 3 − Underway with significant progress.
- 316 -
Significant progress occurred in modelling and retrieval methodology but efforts are still needed to provide operational data.
GEWEX-GDAP (Data and Assessments Panel) have had some efforts to do this in terms of producing a consistent global water and energy product (based around SRB). The GEWEX-LandFlux project "tried" to do this in developing the global surface heat flux product - but with varying success (i.e. the albedo, LAI, FAPAR etc were key challenges).
Methodology to check the physical consistencies between fire events and albedo changes (using several Earth Observation products) was done together with the impacts on radiative forcing (Mota B. et al., 2019).
Spatial and temporal consistencies of change for FAPAR and LAI using three sources of products were also studied. The Copernicus Climate Change Service (C3S) has ensured in its call for consistency between surface albedo, FAPAR and LAI (version 2 products) but the products were just released.
There remains a need for joint retrievals to ensure radiative consistency with QUANTIFY EOLDAS framework.
References:
Mota B., Gobron, N., Cappucci, F. and O. Morgan, 2019: Burned area and surface albedo products: Assessment of change consistency at global scale. Remote Sensing of Environment, 225, 249-266. DOI: 10.1016/j.rse.2019.03.001.
Action T36: Climate change indicators for adaptation Action Establish climate change indicators for adaptation issues using land ECVs at high
resolution
Benefit Inputs into adaptation planning, damage limitation and risk assessments
Time frame Initial products by 2018; ongoing development and improvement
Who GCOS, GCOS Science panels, WCRP, GFCS
Performance indicator
Availability of indicators
Annual cost US$ 100 000–1 million
Assessment: 4 − Progress on track.
TOPC has initiated a methodology of assessing current terrestrial ECVs as either being not relevant for adaptation, observations of adaptation, or observations for adaptation.
This activity is described in more detail within the body of the Status Report.
- 317 -
Action T37: Quality of ground-based reference sites for FAPAR and LAI Action Improve the quality and number of ground-based reference sites for FAPAR and
LAI; agree minimum measurement standards and protocols; conduct systematic and comprehensive evaluation of ground-based measurements for building a reference sites network
Benefit Ensure quality assurance of LAI and FAPAR products
Time frame Network operational by 2020
Who Parties’ national and regional research centres, in cooperation with space agencies and Copernicus coordinated by CEOS WGCV, GCOS and TOPC
Performance indicator
Data available
Annual cost US$ 1–10 million
Assessment: 4 − Progress on track.
Quality of ground-based measurements was improved with an increase number of sites.
The CEOS LPV reviewed and proposed a new list of super-sites. Whereas the ESA FRM4VEG project (https://frm4veg.org/) assure the definition of standard protocols for vegetation products, the Ground-Based Observations for Validation (GBOV) of Copernicus Global Land GBOV project provides operationally raw measurements (together Land Products, e.g. up-scaling data) over 74 sites (https://land.copernicus.eu/global/gbov).
Action T38: Improve snow and ice albedo products Action Improve quality of snow (ice and sea ice) albedo products
Benefit Improve consistency of datasets
Time frame 2018
Who Space agencies and Copernicus coordinated through CEOS WGCV LPV, WMO Space Programme, with advice from GCOS and TOPC
Performance indicator
Product available
Annual cost US$ 100 000–1 million
Assessment: 2 − Started but little progress.
Despite the importance of snow (ice and sea ice) albedo for climate change, little progress has been seen to improve quality of snow (ice and sea ice) albedo products.
- 318 -
Action T39: Improve in situ albedo measurements Action Improve quality of available in situ validation measurements and collocated albedo
products, as well as BHR factors and measures of surface anisotropy from all space agencies generating such products; promote benchmarking activities to assess the reliability of albedo products
Benefit Improved calibration and validation
Time frame Full benchmarking/intercomparison by 2022
Who BSRN and spatially representative FLUXNET sites, space agencies in cooperation with CEOS WGCV LPV
Performance indicator
Data available to analysis centres
Annual cost US$ 1–10 million
Assessment: 3 − Underway with significant progress.
Only shortwave broadband albedo were provided over few sites. Progress for the protocol.
Baseline Surface Radiation Network (BSRN) and SURFace RADiation Budget Measurement Network (Surfrad) provides only shortwave broadband albedo only (not spectral) over several sites.
Only few sites implement tower observations, which are the most representative for monitoring purposes. US BSRN sites (most SURFRAD) perform homogeneous measurement from a nominal height of 10 m. To include upwelling components as basic requirements for future BSRN candidate stations, and to provide products for albedo in black-sky and white-sky conditions, are under discussion. Despite its wider distribution and tower implementation FLUXNET do not measure the irradiance with the same quality instruments and BSRN/SURFRAD and do not provide information of the diffuse component, which is useful in the process of cloud screening and reduction of the albedo to white-sky and black-sky components (see Copernicus Ground-Based Observation for Validation Service).
Theoretical 3D-RT based study shows how to improve the ground-based albedo quality.
● https://www.sciencedirect.com/science/article/pii/S0022407316300085 ● CEOS protocol for the albedo (available at ceos.lpc web site).
- 319 -
Action T40: Production of climate data records for LAI, FAPAR and Albedo Action Operationalize the generation of
• 10-day and monthly FAPAR and LAI products as gridded global products at 5 km spatial resolution over time periods as long as possible;
• 10-day FAPAR and LAI products at 50 m spatial resolution; • Daily (for full characterization of rapidly greening and senescing vegetation,
particularly over higher latitudes with the rapid changes due to snowfall and snowmelt), 10-day and monthly surface albedo products from a range of sensors using both archived and current Earth observation systems as gridded global products at 1 km to 5 km spatial resolution of over time periods as long as possible
Benefit Provide longer time records for climate monitoring
Time frame 2020
Who Space agencies, Copernicus and SCOPE-CM coordinated through CEOS WGCV LPV
Performance indicator
Operational data providers accept the charge of generating, maintaining and distributing global physically consistent ECV products
Annual cost US$ 100 000–1 million
Assessment: 4 – Progress on track.
Generation of 10-days global FAPAR and LAI products were operational provided from 300 m to few deg. No significant progress for higher resolution. Limitation of availability for past data
Albedo products.
● The CEOS WG Climate released an ECV inventory in October 2017 (see http://climatemonitoring.info/ecvinventory/);
● In addition to them, new operational, like C3S ones (https://cds.climate.copernicus.eu/) and research products are available to user’s community.
The highest spatial resolution products are not operational at global scale but anymore could theoretically access to inputs data and use cloud server for making their own products at regional scale.
- 320 -
Action T41: Evaluate LAI, FAPAR and Albedo Action Promote benchmarking activities to assess reliability of FAPAR and LAI products,
taking into account their intrinsic definition and accuracy assessment against fiducial ground references
Evaluate the albedo products with high-quality tower data from spatially representative sites
Benefit Improved accuracy of data
Timeframe Evaluation by 2019
Who Space agencies and Copernicus in relation with CEOS WGCV, GCOS/TOPC
Performance indicator
Publish results
Benefit Recommendations after gap analysis on further actions for improving algorithms
Annual cost US$ 10 000–100 000
Assessment: 4 − Progress on track.
Benchmarking of existing operational products were done, and some used also fiducial ground measurements.
A lot of published results are available in peer-review articles. This concerns either regional or global scale studies for LAI, FAPAR and surface albedo. (see Mayr, S. et. al (2019) Validation of Earth Observation Time-Series: A Review for Large-Area and Temporally Dense Land Surface Products. Remote Sens. 11, 2616. and Special Issue "Recent Advances in Satellite Derived Global Land Product Validation" https://www.mdpi.com/2072-4292/11/22/2616).
Action T42: Land-surface temperature: in situ protocols Action Promote standardized data protocols for in situ LST and support the CEOS-LPV
group in development of a consistent approach to data validation, taking its LST Validation Protocol as a baseline
Benefits LST datasets will be more accessible to users, encouraging user uptake of more than one LST dataset. This will lead to better characterisation of uncertainties and inter-dataset variability.
Time frame Network concept and approach by 2017; implementation by 2018
Who Parties’ national services and research agencies, space data providers, GOFC-GOLD, NASA LCLUC, TOPC,
CEOS WGCV/LPV
Performance indicator
Availability of protocols and evidence of their use.
Annual cost US$ 1 000 –10 000
Assessment: 5 – Complete.
- 321 -
The CEOS-LPV Group have produced a LST Validation Best Practices Guide
Support from the LST data providers and user community have enabled the CEOS-LPV Group to document the in situ validation protocols with regards to site implementation and validation of the satellite LST products in a Best Practices Guide (Guillevic et al., 2018). This protocol builds on earlier work (Schneider et al., 2021) and establishes a set of procedures which were already in common use. The protocol is now adhered to in many large agency projects (such as Sentinel-3 validation, ESA Climate Change Initiative, EUMETSAT validation of operational sensors, Copernicus global land validation). In addition to best practices for instrumentation and validation techniques these protocols also promote the use of harmonised data formats to enable easier cross-comparison.
References:
Guillevic, P., F. Göttsche, J. Nickeson, G. Hulley, D. Ghent, Y. Yu, I. Trigo, S. Hook, J. Sobrino, J. Remedios, M. Román and F. Camacho, 2018: Land Surface Temperature Product Validation Best Practice Protocol, Version 1.1. https://lpvs.gsfc.nasa.gov/PDF/CEOS_LST_PROTOCOL_Feb2018_v1.1.0_light.pdf.
Schneider, P., D. Ghent, G. Corlett, F. Prata and J. Remedios, 2012: AATSR Validation: LST Validation Protocol. ESA Report, Contract No.: 9054/05/NL/FF, European Space Agency (ESA). UL-NILU-ESA-LST-LVP Issue 1 Revision 0. http://lst.nilu.no/Portals/73/Docs/Reports/UL-NILU-ESA-LST-LVP-Issue1-Rev0-1604212.pdf.
Action T43: Production of land-surface temperature datasets Action Continue the production of global LST datasets, ensuring consistency between
products produced from different sensors and by different groups
Benefits Make available long time series of LST datasets in consistent formats, enabling more widespread use of LST for climate applications
Time frame Continual
Who Space agencies
Performance indicator
Up-to-date production of global LST datasets
Annual cost US$ 10 000 –100 000
Assessment: 4 − Progress on track.
Space Agencies continue to produce LST data in near-real time in support of the long-term archives.
Space Agencies have operational processing chains in place to ensure continued production of LST data in near-real time to add to their long-term archives of LST data. Examples such as ESA’s Sentinel-3A and Sentinel-3B, NASA’s Terra MODIS and Aqua MODIS, NOAA’s VIIRS, and EUMETSAT’s Metop and MSG satellites for AVHRR and SEVIRI respectively, ensure the continuity of both global and regional LST data. New processing baselines are implemented in ground segments to ensure the latest scientific developments are exploited, and periodically long-term archives are re-processed to new Collections to converge to the most recent updates in the operational products.
- 322 -
Furthermore, continuity of the LST data is guaranteed through approved new operational missions to replace the existing ones prior to the end of their operational lives. Examples include Sentinel-3C and Sentinel-3D, NOAA’s JPSS, and EUMETSAT’s MTG. While each Agency disseminates operational LST data in a different format, community influence has encouraged many projects to start delivering data in format more harmonised across the science community. Examples include Sentinel-3C and Sentinel-3D, NOAA’s JPSS, and EUMETSAT’s MTG. While each Agency disseminates operational LST data in a different format, community influence has encouraged many projects to start delivering data in format more harmonised across the science community; examples include the Climate Change Initiative and Copernicus Services.
Action T44: Reprocessing land-surface temperature Action Reprocess existing datasets of LST to generate a consistent long-term time series
of global LST; in particular, reprocess archives of low Earth orbit and geostationary LST observations in a consistent manner and to community-agreed data formats
Benefits Make available long time series
Time frame Network concept and approach by 2017; implementation by 2018
Who Parties’ national services and research agencies, space data providers, GOFC-GOLD, NASA LCLUC, TOPC,
CEOS WGCV/LPV
Performance indicator
Availability of long time series of LST datasets
Annual cost US$ 100 000–1 million
Assessment: 3 − Underway with significant progress.
Recent projects, such as ESA’s LST CCI, EUMETSAT’s CM SAF TCDRs, and NASA’s MEaSUREs, are producing first long-term Climate Data Records with consistent algorithms.
In ESA’s LST CCI two dedicated Climate Data Records (CDRs) will be produced from InfraRed (IR) satellites. One will be based on the ATSR/SLSTR sensors, using MODIS to fill the gap between (A)ATSR and SLSTR. The other will merge data from Low Earth Orbiting (LEO) and Geostationary Earth Orbiting (GEO) satellites to provide a consistent global, sub-daily data set. A multi-decadal MicroWave (MW) LST data set from SSM/I sensors is also being produced. In EUMETSAT’s CM SAF a long term TCDR is being produced combining data from being MVIRI and SEVIRI sensors for Europe and Africa. NASA’s MEaSUREs project is producing a unified and coherent Land Surface Temperature and Emissivity (LST&E) Earth System Data Records (ESDRs) for MODIS, by combining two existing products, and GOES for hourly products over N. America. In each case, within-project consistency in algorithms, cloud detection techniques, emissivity inputs and radiative transfer modelling is ensured.
- 323 -
Action T45: Land-surface temperature in situ network expansion Action Expand the in situ network of permanent, high-quality IR radiometers for dedicated
LST validation
Benefits LST datasets better validated and over more land-surface types; independent validation of stated accuracies providing credibility to satellite LST products
Time frame Network concept and approach by 2017; implementation by 2018
Who Parties’ national services and research agencies, space data providers, GOFC-GOLD, NASA LCLUC, TOPC,
CEOS WGCV/LPV, ILSTE
Performance indicator
Establishment of a comprehensive network of ground sites with high-quality in situ measurements suitable for validating the different sensors; results from in situ radiometer intercomparison exercises
Annual cost US$ 1–10 million (10-20 sites at US$ 100 000 per site)
Assessment: 3 − Underway with significant progress.
Major recent projects have started to expand the network of LST stations with publicly accessible data.
Two recent initiatives have begun to expand the network for LST validation with new in situ sites: i) Copernicus Ground-Based Observations for Validation of Copernicus Land Products (GBOV); and ii) Copernicus Space Component Validation for Land Surface Temperature, Aerosol Optical Depth and Water Vapour Sentinel-3 Products (LAW). In each project new LST radiometers have been/are being installed on existing infrastructure. Currently the expansion is 3 new stations from GBOV and 5 new stations from LAW. The selection of station deployment has been aimed at filling gaps in the LST validation over different geographical and climatological regions. While an objective of these studies is the validation of Copernicus products (LST from Copernicus Global Land Service, and LST from Sentinel-3 respectively), the publicly accessible provision of both in situ data and in situ vs. satellite matched data presents a wider user community the opportunity to validate other LST data products using data from these new stations.
Action T46: Land-surface temperature radiometric calibration Action Radiometric calibration intercomparisons and uncertainties for LST sensors
Benefits LST datasets better calibrated and over all land-surface types for different satellite sensors; independent calibration providing credibility and traceability of data and uncertainties
Time frame Network concept and approach by 2017; implementation by 2018
Who Coordinated by CEOS WGCV Infrared and Visible Optical Sensors subgroup/GSICS and supported by space agencies
Performance indicator
ECV generators taking into account radiometric calibration uncertainties, ideally with calibrations being referenced to a common framework
Annual Cost US$ 1–10 million
- 324 -
Assessment: 3 − Underway with significant progress.
Development of Fundamental Climate Data Records and establishment of fully traceable routes.
Fundamental Climate Data Records (FCDRs) have been produced within the FIDUCEO project for the AVHRRs, within CM SAF for SSM/I, and intercalibration has been performed for SEVIRI within GSICS. These FCDRs are the critical inputs to developing long-term Thematic Climate Data Records (TCDRs) for LST. Projects such as LST CCI are additionally intercalibrating between other sensors for developing TCDRs using GSICS approaches.
In terms of traceability of LST data and associated uncertainties, evidence to justify the quality of data requires a full uncertainty budget showing a comparison to an independent reference which is also SI traceable and with an associated uncertainty. The FRM4STS project has established a traceable route from the in situ radiometers at Gobabeb, Namibia to the blackbody source at the UK’s National Physical Laboratory (NPL).
Action T47: Land-cover experts Action Maintain and strengthen a global network of land-cover/land-use experts to:
develop and update an independent, very high spatial-resolution reference dataset for global land-cover map accuracy assessment; and facilitate access to land-use and management information to support the development of global-scale land-use products
Benefits For GLC map developers, GLC map users
Time frame Network concept and approach by 2017; implementation by 2018
Who GOFC-GOLD, CEOS WGCV/LPV, Parties’ national services and research agencies, space data providers,
NASA LCLUC, TOPC
Performance indicator
Global LC map developers using the reference data developed by the operational network
Annual cost US$ 100 000–1 million
Assessment: 3 − Underway with significant progress.
Important progress towards the development and update of independent global land cover reference dataset, but limited progress on expanding to land use/management issues due to limited funding for international coordination.
A reference data portal containing many published/historical land cover reference/validation data have been assessed and made available (http://www.gofcgold.wur.nl/sites/gofcgold_refdataportal.php). More consistent reference data is collected by the EC Copernicus global land monitoring service and will be made available in the future as annual operational data stream (https://land.copernicus.eu/global/products/lc). Global land use change datasets are in evolution in the research domain. Overall, there is a lack of support for better coordination of land cover/use monitoring activities globally.
- 325 -
Action T48: Annual land-cover products Action Generate annual land-cover products over key regions that allow change
assessment across time (including for the six IPCC AFOLU land categories) at 10 m–30 m spatial resolutions, according to internationally agreed standards and accompanied by statistical descriptions of their accuracy
Benefits For mitigation and adaptation communities
Time frame 2017 and beyond
Who Space agencies, GOFC-GOLD, Copernicus Land Service, USGS, University of Maryland (UMD)-GoogleEarth
Performance indicator
Product delivered and used by a large community; use of standard approaches for validation and uncertainty metrics
Annual cost US$ 1–10 million
Assessment: 3 − Underway with significant progress. First prototype global land cover and change datasets are in development in the research and global demonstration domain.
Several pre-operational efforts are producing global and regional land cover datasets using Landsat and increasingly Sentinel data. They include UMD annual global tree cover gains and losses, China's 30 m global land cover, and ESA/UCL first 20 m prototype land cover map for Africa and the following LC-CCI activities. ESA planning to release a global 10 m land cover data for 2020. None of them allow for a global change assessments at 30 m resolution for all IPCC land use categories and also the independent validation for both high resolution land cover and changes is just starting.
Action T49: Land-cover change Action Generate global-scale land-cover products with an annual frequency and long-term
records that allow change assessment across time (including as much as possible for the six IPCC AFOLU land categories), at resolutions between 250 m and 1 km, according to internationally agreed standards and accompanied by statistical descriptions of their accuracy
Benefits To climate change modellers, others
Time frame 2017 and beyond
Who Space agencies, research institutes, GOFC-GOLD, Copernicus Land Service
Performance indicator
Product delivered and used; use of standard approaches for validation and uncertainty metrics
Annual cost US$ 1–10 million
Assessment: 4 − Progress on track.
Annual land cover change at 300 m is provided by LC-CCI and the Copernicus climate service.
The ESA CCI land cover project has generated and made available a long-time series of land cover changes (https://www.esa-landcover-cci.org/) for the six IPCC categories. This
- 326 -
is continued now as part of the Copernicus Climate Monitoring service with annual updates. No validation of the annual land cover changes has been published so far.
Action T50: Land-cover community consensus Action Develop a community consensus strategy and priorities for monitoring to include
information on land management in current land-cover datasets and start collecting relevant datasets and observations, building on ongoing activities
Benefits To climate change modellers, mitigation and adaptation user communities
Time frame Concept and approach by 2017; start Implementation by 2018
Who Parties’ national services and research agencies, space agencies, GOFC-GOLD, NASA LCLUC, TOPC,
UMD-GoogleEarth, CEOS, ESA, USGS, GOFC-GOLD, FAO, GEO
Performance indicator
Product delivered and used
Annual cost US$ 100 000–1 million
Assessment: 3 − Underway with significant progress. Important progress in the dialog between data users and producers on the needs and opportunities to better integrate land management information, but production of such data is still in initial stage.
Two community-consensus benchmark scientific papers (see References below) have been published to clarify and status and needs to include land use and land management information earth system and integrated assessment models. They can be used as reference document to start collecting data (for modeling purposes) and identify further gaps and observational challenges.
References:
Erb, K.H., S. Luyssaert, P. Meyfroidt, J. Pongratz, A. Don, S. Kloster, T. Kuemmerle, T. Fetzel, R. Fuchs, M. Herold, H. Haberl, C. D. Jones, E. Marín-Spiotta, I. McCallum, E. Robertson, V. Seufert, S. Fritz, A. Valade, A. Wiltshire and A. J. Dolman, 2017: Land management: data availability and process understanding for global change studies Global Change Biology. https://doi.org/10.1111/gcb.13443
Pongratz, J., H. Dolman, A. Don, K.H. Erb, R. Fuchs, M. Herold, C. Jones, T. Kuemmerle, S. Luyssaert, P. Meyfroidt and K. Naudtset, 2018: Models meet data: challenges and opportunities in implementing land management in Earth system models. Global Change Biology 24 (4), 1470-1487. https://doi.org/10.1111/gcb.13988
- 327 -
Action T51: Deforestation Action Develop yearly deforestation (forest clearing) and degradation (partial clearing) for
key regions that allow change assessment across time at 10 m–30 m spatial resolutions, according to internationally agreed definitions.
Benefits To provide annual monitoring of deforestation and forest degradation to support management and reporting
Time frame Concept and approach by 2017; implementation by 2018
Who Parties’ national services and research agencies, space agencies, GOFC-GOLD, NASA LCLUC, UMD-GoogleEarth, TOPC.
Performance indicator
Indicators-based standard validation approach for change of forest cover and attributions associated with deforestation and degradation; product delivered and used
Annual cost US$ 100 000–1 million
Assessment: 3 − Underway with significant progress.
Annual global tree cover loss data are being produced regularly, but does not provide estimates of deforestation (according to FAO definition).
UMD/GLAD are producing annual global tree cover loss and gain data using Landsat data 2000-18. There is inconsistency with the forest and deforestation definition used by FAO FRA. Some sample-based approach (FAO/JRC) has been used to map tropical deforestation and follow up land use but has not recently been updated.
Many countries involved in REDD+ are now capable of producing forest area change estimates at annual or bi-annual level using satellite time series for reporting using the IPCC GHG inventory good practice guidelines. A related method and guidance document have been developed by the Global Forest Observation Initiative (GFOI) that is now widely used by countries (www.gfoi.org/methods-guidance/).
Action T52: Collaboration on above ground biomass Action Encourage inter-agency collaboration on developing optimal methods to combine
biomass estimates from current and upcoming missions (e.g. ESA BIOMASS, NASA GEDI and NASA-ISRO NiSAR, JAXA PALSAR, CONAE SAOCOM)
Benefits Reduced error, cross-validation, combining strengths of different sensors in different biomass ranges
Time frame Most key missions are expected to be in orbit between 2016 and 2020
Who ESA, NASA, JAXA, NASA-ISRO, CONAE
Performance indicator
A strategy to combine biomass estimates from different sensors, together with algorithms and processing methods
Annual cost US$ 100 000–1 million
Assessment: 3 − Underway with significant progress
- 328 -
A recent meeting at the International Space Science Institute ISSI, (http://www.issibern.ch/workshops/biomass/) has been important for collaboration and inter-calibration. A special issue in a scientific journal has been prepared showcasing several of the ongoing collaboration efforts (https://link.springer.com/journal/10712/40/4). Space agencies are interacting and collaboration needs to improve now that an increasing number of space-based biomass data are starting operation.
Action T53: Above-ground biomass validation strategies Action Encourage inter-agency collaboration to develop validation strategies for upcoming
missions aimed at measuring biomass (e.g. ESA BIOMASS, NASA GEDI and NASA-ISRO NiSAR), to include combined use of in situ and airborne lidar biomass measurements
Benefits Potential to produce more comprehensive validation of biomass estimates by cost-sharing. Greater consistency between biomass estimates from different sensors because of assessment against common reference data
Time frame From now until the operational phase of the various sensors (2016–2022).
Who ESA, NASA, JAXA, NASA-ISRO, CONAE
Performance indicator
Formal agreement between agencies on a strategy for joint gathering and sharing of validation data, together with funding of specific elements of the overall set of validation data
Annual cost US$ 10 000–100 000
Assessment: 3 − Underway with significant progress.
A CEOS LPV biomass calibration and validation protocol has been developed.
The CEOS LPV has established a team focusing on biomass and the effort to develop a validation protocol has started. A biomass cal/val protocol has been developed (see concept here: https://link.springer.com/article/10.1007/s10712-019-09538-8) and should be finalized and released very soon.
- 329 -
Action T54: Above-ground biomass validation sites Action Develop a set of validation sites covering the major forest types, especially in the
tropics, at which high-quality biomass estimations can be made, using standard protocols developed from ground measurements or airborne lidar techniques
Benefits Essential to give confidence in satellite-derived biomass estimates at global scale
Time frame From now up to the operational phase of the various sensors (2018–2022)
Who Space agencies working with key in situ networks (e.g. RainFor, Afritron, the Smithsonian Center for
Tropical Forest Science), GEO-GFOI
Performance indicator
Establishment of a comprehensive network of ground sites with high-quality, in situ biomass estimates with uncertainty assessments suitable for validating the different sensors
Annual cost US$ 30–100 million (50 tropical sites covering all forest types: US$ 20 million); estimate for temperate and boreal sites not yet formulated
Assessment: 3 − Underway with significant progress.
Several initiatives are progressing in compiling and assessing the quality of biomass reference data for global ECV calibration and validation purposes.
The in situ community from tropical biomass networks (i.e. Rainfor, Afritron, 2ndFor etc.) have proposed a framework to develop a set of validation sites. A first effort has resulted in the FOS network and standardized some available in situ datasets (http://forest-observation-system.net/).
The Global Ecosystem Dynamics Investigation (GEDI) team is putting together a comprehensive calibration database to be ready for GEDI operation in 2019-21.
The ESA Globbiomass and Biomass-CCI project has putting together a comprehensive global biomass validation database to independently validate the 2010, 2017 and 2018 products with the focus on climate model users.
Action T55: Above-ground biomass data access Action Promote access to well-calibrated and validated regional- and national-scale
biomass maps that are increasingly being produced from airborne lidar.
Benefits Greatly extends the representativeness of data available for validating satellite-derived biomass data, since a much greater range of land types and forest conditions will be covered
Time frame From now until the operational phase of the various sensors (2016–2022)
Who GEO-GFOI, other national and international bodies producing biomass maps
Performance indicator
Availability of multiple regional- to country-scale maps of biomass derived from airborne lidar; use of standard protocols for uncertainty assessment of lidar estimation of biomass
Annual cost US$ 10 000–100 000 (does not include monitoring costs)
- 330 -
Assessment: 2 − Started but little progress.
Some initial datasets are becoming available.
Several initiatives have been producing regional biomass maps and data bases that have been made available (i.e. Global Forest Watch, www.globalforestwatch.org, ESA Globbiomass project globbiomass.org). Australia has put together a comprehensive regional biomass database (www.tern.org.au)
Action T56: Above-ground biomass: forest inventories Action Improve access to high-quality forest inventories, especially in the tropics, including
those developed for research purposes and REDD+
Benefits Extends the data available for validating satellite-derived biomass data
Time frame From now until the operational phase of the various sensors (2016–2022)
Who GEO-GFOI, other national and international bodies producing or funding forest inventories
Performance indicator
Access to databases of georeferenced biomass measurements derived from ground measurements for forest-inventory purposes
Annual cost US$ 10 000–100 000
Assessment: 2 − Started but little progress.
Country National Forest Inventory (NFI) capacities for biomass estimation are improving and more data are becoming available for global purposes, but so far little integration with global monitoring efforts.
The GFOI R&D coordination team in collaboration with FAO and the Worldbank Forest Carbon Partnership Facility (FCPF) have collaborated with countries to share NFI data on aggregate level for the purpose of updating the biomass Tier 1 defaults the 2019 refinement of the IPCC GPG for AFOLU. This effort could be seen as a pilot to see if and how an interaction between NFI efforts in the tropics and biomass mapping from space can start to exchange and integrate more. GFOI is a central body to establish such a mechanism and to improve the demonstration of approaches how global space-based biomass estimation can better link with national forest monitoring efforts.
Action T57: Soil carbon: carbon mapping Action Cooperate with the soil-carbon mapping exercises to advocate accurate maps of
soil carbon
Benefit Improved data accuracy
Time frame Ongoing
Who TOPC and GCOS
Performance indicator
Improved maps
Annual cost US$1 000–10 000
- 331 -
Assessment: 3 − Underway with significant progress.
A new global; soil carbon map coordinated by FAO is available (see http://www.fao.org/soils-portal/data-hub/soil-maps-and-databases/harmonized-world-soil-database-v12/en/).
Action T58: Soil-carbon change Action Encourage flux sites to measure soil carbon at five-year intervals and record soil-
management activities; use this to supplement long-term experiments that are monitoring soil carbon.
Benefit Improved in situ observations will improve accuracy.
Time frame Ongoing
Who TOPC and GCOS
Performance indicator
Number of flux sites making measurements
Annual cost US$10 000–100 000
Assessment: 2 − Started but little progress.
Despite maps being updated (see action T57) there is little progress on monitoring changes
Action T59: Soil carbon – histosols Action Provide global maps of the extent of histosols (peatlands, wetlands and permafrost)
and their depth
Benefit Improve understanding of carbon pools at risk from climate change
Time frame Ongoing
Who Research communities, ISRIC, HWSD and the Global Soil Map
Performance indicator
Availability of maps
Annual cost US$ 10 000–100 000
Assessment: 2 − Started but little progress.
National soil carbon observations are contribution to improved global maps
- 332 -
Action T60: Historic fire data Action Reanalyse the historical fire-disturbance satellite data (1982 to present)
Benefits Climate-modelling communities
Time frame By 2020
Who Space agencies, working with research groups coordinated by GOFC-GOLD-Fire By 2020
Performance indicator
Establishment of a consistent dataset, including the globally available AVHRR data record
Annual cost US$ 1–10 million
Assessment: 3 − Underway with significant progress.
There is some activity on this topic by research organisations and government funded organisations.
Action T61: Operational global burned area and fire radiative power Action Continue the production of operational, global burned area active fire (with
associated FRP) products, with metadata and uncertainty characterizations that meet threshold requirements and have necessary product back-up to ensure operational delivery of products to users.
Benefits Climate-modelling communities, space agencies, civil protection services, fire managers, other users
Time frame Continuous
Who Space agencies, Copernicus Global Land Service, Copernicus Atmospheric Monitoring Service,
GOFC-GOLD
Performance indicator
Availability of products that meet user needs
Annual cost US$ 1–10 million
Assessment: 3 − Underway with significant progress.
Production of operational fire products continue at the global scale (with a number of other products available for selected regions and limited time periods). These include:
● Burned Area: MODIS (MCD64); Copernicus CGLS; ESA CCI ● Fire Radiative Power (FRP): Copernicus CAMS that is assimilated into the GFAS
system; NASA MODFIRE; ● Active Fire Data come from a number of sources including from MODIS, SLSTR,
VIIRS and sensors in geo-stationary orbit.
It is less clear on the status of these products with regard to the availability of supporting information on metadata and uncertainty characterization. Kevin Tansey invites experts to contribute to discussion around this topic and provide evidence work on uncertainty
- 333 -
characterization is on-going, the definitions that are in use and how this information is embedded or made explicit in products.
Action T62: Fire maps Action Consistently map global burned area at < 100 m resolution on a near-daily basis
from combinations of satellite products (Sentinel-2, Landsat, Sentinel-1, PROBA); work towards deriving consistent measures of fire severity, fire type, fuel moisture and related plant-fuel parameters
Benefits Climate-modelling communities, space agencies, civil protection services, fire managers, other users
Time frame By 2020
Who Space agencies, research organizations, international organizations in collaboration with GOFC-GOLD-
Fire
Performance indicator
Availability of data and products
Annual cost US$ 1–10 million
Assessment: 3 − Underway with significant progress.
The ESA CCI project is developing these products.
Action T63: Fire validation Action Continuation of validation activity around the detection of fire-disturbed areas from
satellites to show that threshold requirements are being met; work to reduce the errors of commission and omission; provide better than existing uncertainty characterization of fire-disturbance products.
Benefits Climate-modelling communities.
Time frame Continuous
Who Space agencies and research organizations, supported by CEOS LPV
Performance indicator
Publication of temporal accuracy
Annual cost US$ 1–10 million
Assessment: 4 − Progress on track.
There has been a strong development against this action. Work funded by the European Space Agency and the Copernicus programmes has supported the production of a statistically robust sampling framework for the collection of reference data from higher resolution sensors (Landsat) to validate global burned area products. The reference data set comprises at least 100 image pairs for each year covering the period 2003 to 2014. Based on this data set that stability of products can be established. The methodology for deriving the reference data sample and the metrics of reporting accuracy has been
- 334 -
published in the peer-reviewed literature. The results will give insight into how algorithms and detection methods can be improved to reduce uncertainty in future iterations.
Action T64: Fire disturbance model development Action Continuation of joint projects between research groups involved in the
development of atmospheric transport models, dynamic vegetation models and GHG emission models, the climate-modelling and transport-modelling community and those involved in the continual algorithm development, validation and uncertainty characterization of fire-disturbance products from satellite data (the Earth observation and modelling community); contribute to better understanding of fire risk and fire-risk modelling
Benefits Climate-modelling communities, Copernicus Programme
Time frame Continuous
Who Space agencies (NASA, ESA, etc.), inter-agency bodies (GOFC-GOLD, CEOS, ECMWF, Meteosat, etc.),
Copernicus Global Land Service, Copernicus Atmospheric Monitoring Service, GOFC-GOLD
Performance indicator
Projects that engage climate and atmospheric transport modellers and product-development community
Annual cost US$ 1–10 million
Assessment: 3 − Underway with significant progress
There is consolidated activity on this action within the ESA CCI project. There is further use of Fire Disturbance Products in the GFAS and GFED (not recently updated) products.
Action T65: Anthropogenic water use Action Collect, archive and disseminate information related to anthropogenic water use
Benefit Accurate and up-to-date data on water availability and stress
Time frame Continuous
Who UN-Water, IWMI and FAO through AQUASTAT in collaboration with UN Statistics Division and other data sources
Performance indicator
Information contained in the AQUASTAT database.
Annual cost US$ 100 000–1 million
Assessment: 4 − Progress on track. This has been done as much as possible, within the constraints of the data set itself. Considerable effort has been expended by FAO to collect data and update AQUASTAT – the database of anthropogenic water use. AQUASTAT has been cooperating with GTN-H to improve data collection. Anthropogenic water use is important as it reflects human needs, especially for agriculture, and also is a response to changing temperatures.
- 335 -
Action T66: Pilot projects: anthropogenic water use Action Develop and implement pilot data-collection exercises for water use
Benefit Demonstrate data-collection approaches for wide implementation
Time frame 2016–2019
Who GTN-H, UN-Water, IWMI and FAO through AQUASTAT in collaboration with the Convention on the
Protection and Use of Transboundary Watercourses and International Lakes
Performance indicator
Completed data collection in pilot areas
Annual cost US$ 100 000–1 million
Assessment: 1 − Little or no progress.
The way ahead will need to be discussed with GCOS technical support and possibly within the TOPC. Running a pilot with input from a country with advanced collection capabilities (e.g. within EU or Australia) may be the best option, but we need to know what the target data set should look like.
- 336 -
Action T67: Improve global estimates of anthropogenic greenhouse-gas emissions
Action Continue to produce annual global estimates of emissions from fossil fuel, industry, agriculture and waste; improve these estimates by following IPCC methods using Tier 2 for significant sectors; this will require a global knowledge of fuel carbon contents and a consideration of the accuracy of the statistics used
Benefit Improved tracking of global anthropogenic emissions
Time frame Ongoing, with annual updates
Who IEA, FAO, Global Carbon Project (GCP), Carbon Dioxide Information Analysis Centre (CDIAC), Emissions
Database for Global Atmospheric Research (EDGAR)
Performance indicator
Availability of Improved estimates.
Annual cost US$ 10 000–100 000
Assessment: 4 − Progress on track.
Significant progress has been made with revised guidelines in 2019 but more work is needed to lower uncertainties and improve coverage. Estimates are reviewed and used by the Global Carbon Project64 (https://www.globalcarbonproject.org/, Friedlingstein et al., 2020). Examples of datasets available include:
• CarbonTracker Europe: https://www.carbontracker.eu/ • Jena CarboScope: http://www.bgc-jena.mpg.de/CarboScope • Copernicus Atmosphere Monitoring Service:
https://ads.atmosphere.copernicus.eu/cdsapp • The Japan Agency for Marine-Earth Science and Technology (JAMSTEC)’s Model for
Interdisciplinary Research on Climate (MIROC)-based Earth System Simulation version 2 (referred to as MIROC-ES2L) (Hajima et al., 2020).
References:
Friedlingstein, P., M. O'Sullivan, M. W. Jones, R. M. Andrew, J. Hauck, A. Olsen,G. P. Peters, W. Peters, J. Pongratz, S. Sitch, C. Le Quéré, J. G. Canadell, P. Ciais, R. B. Jackson, S. Alin, L. E. O. C. Aragão, A. Arneth, V. Arora, N. R. Bates, M. Becker, A. Benoit-Cattin, H. C. Bittig, L. Bopp, S. Bultan, N. Chandra, F. Chevallier, L. P. Chini, W. Evans, L. Florentie, P. M. Forster, T. Gasser, M. Gehlen, D. Gilfillan, T. Gkritzalis, L. Gregor, N. Gruber, I. Harris, K. Hartung, V. Haverd, R. A. Houghton, T. Ilyina, A.l K. Jain, E. Joetzjer, K. Kadono, Ei. Kato, V. Kitidis, J. I. Korsbakken, P. Landschützer, N. Lefèvre, A. Lenton, S. Lienert, Z. Liu, D. Lombardozzi, G. Marland, N. Metzl, D. R. Munro, J. E. M. S. Nabel, S.-I. Nakaoka, Y. Niwa, K. O'Brien, T. Ono, P. I. Palmer, D. Pierrot, B. Poulter, L. Resplandy, E. Robertson, C. Rödenbeck, J. Schwinger, R. Séférian, I. Skjelvan, A. J. P. Smith, A. J. Sutton, T. Tanhua, P. P. Tans, H. Tian, B. Tilbrook, G. van
64 https://www.globalcarbonproject.org/
- 337 -
der Werf, N. Vuichard, A. P. Walker, R. Wanninkhof, A. J. Watson, D. Willis, A. J. Wiltshire, W. Yuan, X. Yue and S. Zaehle, 2020: Global Carbon Budget 2020. Earth Syst. Sci. Data, 12, 3269–3340, 2020. https://doi.org/10.5194/essd-12-3269-2020
Hajima T., M. Watanabe, A. Yamamoto, H. Tatebe, M. A. Noguchi, M. Abe, R. Ohgaito, A. Ito, D. Yamazaki, H. Okajima, A. Ito, K. Takata, K. Ogochi, S. Watanabe and M. Kawamiya, 2020: Description of the MIROC-ES2L earth system model and evaluation of its climate–biogeochemical processes and feedbacks. Geoscientific Model Development Discuss. https://doi.org/10.5194/gmd-2019-275
- 338 -
Action T68: Use of satellites for Land use, land-use change and forestry emissions/removals
Action Support the improvement of estimates of emissions and removals from Forestry and Land-use change by using satellite data to monitor changes where ground-based data are insufficient.
Benefit Improved global and national monitoring of LULUCF
Time frame Ongoing.
Who National reporting supported by international agencies through programmes such as UNREDD and GFOI
Performance indicator
Availability of satellite data
Annual cost US$ 100 000–1 million
Assessment 3: − Underway with significant progress.
Satellite imagery is routinely used to monitor forest emissions and removals and used to provide monitoring data for REDD+65. Many countries used remote sensing of forest to support reporting emissions and removals of GHG to the UNFCCC. Projects such as the Global Forest Observations Initiative (GFOI) support developing countries by providing access to satellite data, methods and training.
Action T69: Research on the land sink Action Research to better understand the land sink, its processes and magnitudes
Benefit Better understanding of the global carbon cycle
Time frame Ongoing
Who GCP, research groups
Performance indicator
Published results
Annual cost US$ 100 000–1 million
Assessment 3: − Underway with significant progress.
65 The UNFCCC activity for “reducing emissions from deforestation and forest degradation in
developing countries, and the role of conservation, sustainable management of forests, and enhancement of forest carbon stocks in developing countries".
- 339 -
Research is on-going to refine the understanding of the land sink and a paper on observing the carbon cycle as a whole is being prepared. The Global Carbon Project reviews estimates of the carbon land and uses them in their budget estimates66.
Action T70: Use of Inverse modelling techniques to support emission inventories
Action Develop inverse modelling methods to support and add credibility to emission inventories; develop and disseminate examples for several GHGs
Benefit Added credibility of national emission/removal estimates and demonstration of inventory completeness
Time frame Ongoing
Who National Inventory agencies, researchers
Performance indicator
Published results
Annual cost US$ 1–10 million
Assessment 4: − Progress on track.
Techniques are being refined, with continental scale estimates. National fluxes estimated for many countries.
Action T71: Prepare for a carbon-monitoring system Action Preparatory work to develop a carbon monitoring system to be operational by
2035;
Development of comprehensive monitoring systems of measurements of atmospheric concentrations and of emission fluxes from anthropogenic area and point sources to include space based monitoring, in situ flask and flux tower measurements and the necessary transport and assimilation models
Benefit Improved estimates of national emissions and removals
Time frame Initial demonstration results by 2023 – complete systems unlikely before 2030
Who Space agencies
Performance indicator
Published results
Annual cost US$ 10–100 billion
66 Global Carbon Project (GCP) https://www.globalcarbonproject.org/ Global Carbon Project (2020) Carbon budget and trends 2020. published on 11 December 2020 Earth System Science Data, 12, 3269–3340, 2020, DOI: 10.5194/essd-12-3269-2020
- 340 -
Assessment 5: − Complete.
Preparations are well developed with the EU with ESA, ECMWF and EUMETSAT are setting up a CO2 Monitoring and Verification Support Capacity
Action T72: Prepare for a latent and sensible heat flux ECV Action Review the feasibility of global monitoring of latent and sensible heat fluxes form
the land surface; prepare proposals for such an ECV.
Development of comprehensive monitoring systems of measurements of atmospheric concentrations and emission fluxes from anthropogenic point sources, to include space-based monitoring, in situ flask and flux tower measurements and the necessary transport and assimilation models
Benefit Improve understanding of heat fluxes over land
Time frame 2017
Who TOPC
Performance indicator
Proposals for consideration by GCOS Steering Committee
Annual cost US$10 000–100 000
Assessment 5: − Complete.
This was agreed by the GCOS Steering Committee to be a new ECV. Work is continuing to implement this.
- 341 -
ANNEX C: NETWORKS This annex provides some information on those networks that are managed or associated with GCOS. Not all networks that contribute to observing the global climate system are addressed. Sections A and B discuss those networks that report to GCOS, while section C discusses the Global Ocean Observing System (GOOS) that reports to Intergovernmental Oceanographic Commission (IOC).
- 342 -
TABLE OF CONTENTS: ANNEX C
- 343 -
GCOS Atmospheric Networks This section discusses only those atmospheric networks that are managed, monitored or directly report to GCOS. The broader observing system also contributes to GCOS goals but is monitored or managed by other programs including the WMO Integrated Global Observing System (WIGOS) and the Global Atmosphere Watch (GAW). The implementation of WIGOS including WIGOS Data Quality Management System is adding considerable value for many observing programs which do not directly report to GCOS.
C.a.i GCOS Cooperation Mechanism (GCM) The GCOS Cooperation Mechanism (GCM) is the system improvement and resource mobilization activity of the GCOS programme established following a decision by the United Nations Framework Convention on Climate Change (UNFCCC) Subsidiary Body for Scientific and Technological Advice (SBSTA) in 2004 (UNFCCC Decision 5/CP.5) in order “to enable developing countries to collect, exchange, and utilize data on a continuing basis in pursuance of the UNFCCC”. Approximately 4 million USD has been raised to accomplish projects dedicated to improving climate observation systems and since 2016, 0.5 million USD (compared to 1.2 million USD 2010-2015) has been invested in the following projects:
• Support for the ongoing operations of the GCOS Upper Air Network stations at Yerevan, Armenia; Nairobi, Kenya; Gan, Maldives; Dar Es Salaam, Tanzania.
• Engagement of a consultant based in Harare, Zimbabwe, to assist in the re-establishment of surface climate stations in Chad (new instrumentation incorporating a non-mercury temperature sensor).
• Support to the CATCOS project, funded by the Swiss Agency for Development and Cooperation that supports ongoing operations and emergency maintenance in over 10 countries.
• Financial support to Colorado State University, in support of the expansion of the Community Collaborative Rain, Hail and Snow Network (CoCoRahs) in the Bahamas (Volunteer Rain Gauge Network).
• New instrumentation for a candidate Baseline Surface Radiation Network observatory in Peru.
• Equipment (Camera’s, copiers and shelving) for a data rescue project in Botswana.
C.a.ii GSN and GUAN Climate and climate change research and applications require historical observational data from sources well distributed across the globe. In particular, it is of major importance that data from different locations and times are comparable or can be made comparable. In practice, meteorological measurements are made at thousands of places all over the world, more or less regularly. The most essential subset of these observing stations is operating under the regime coordinated by the World Meteorological Organization (WMO), involving clear commitments regarding the site, the exposure of instruments, error handling, units of measurement, coding and exchange of reports. In practice, this WMO Global Observing System (GOS) is implemented by National Meteorological and Hydrological Services (NMHSs) of WMO Members. The original prime purpose of the system was the provision of data in support of weather observation and forecasting, but it of course serves many other potential users particularly in this case climate and climate change research.
Many requirements for climate applications and research are satisfied very well by the GOS. The needs of the climatological and the synoptic communities have much in parallel.
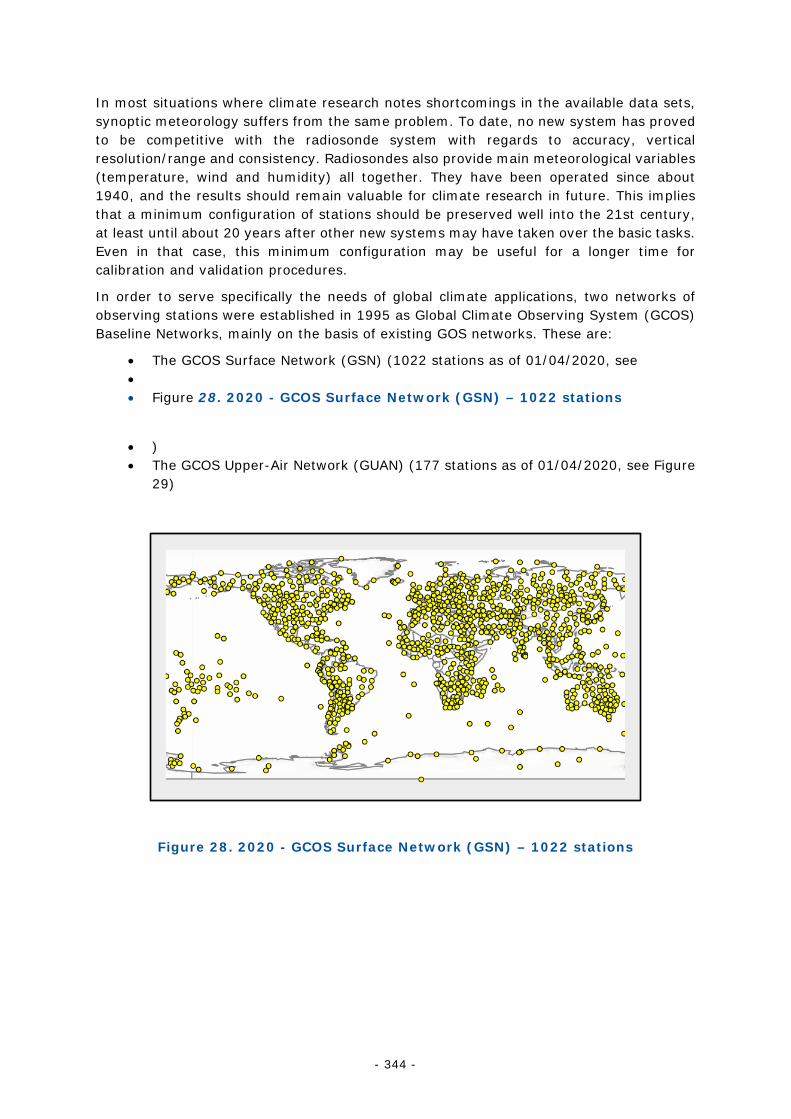
- 344 -
In most situations where climate research notes shortcomings in the available data sets, synoptic meteorology suffers from the same problem. To date, no new system has proved to be competitive with the radiosonde system with regards to accuracy, vertical resolution/range and consistency. Radiosondes also provide main meteorological variables (temperature, wind and humidity) all together. They have been operated since about 1940, and the results should remain valuable for climate research in future. This implies that a minimum configuration of stations should be preserved well into the 21st century, at least until about 20 years after other new systems may have taken over the basic tasks. Even in that case, this minimum configuration may be useful for a longer time for calibration and validation procedures.
In order to serve specifically the needs of global climate applications, two networks of observing stations were established in 1995 as Global Climate Observing System (GCOS) Baseline Networks, mainly on the basis of existing GOS networks. These are:
• The GCOS Surface Network (GSN) (1022 stations as of 01/04/2020, see • • Figure 28. 2020 - GCOS Surface Network (GSN) – 1022 stations
• ) • The GCOS Upper-Air Network (GUAN) (177 stations as of 01/04/2020, see Figure
29)
Figure 28. 2020 - GCOS Surface Network (GSN) – 1022 stations
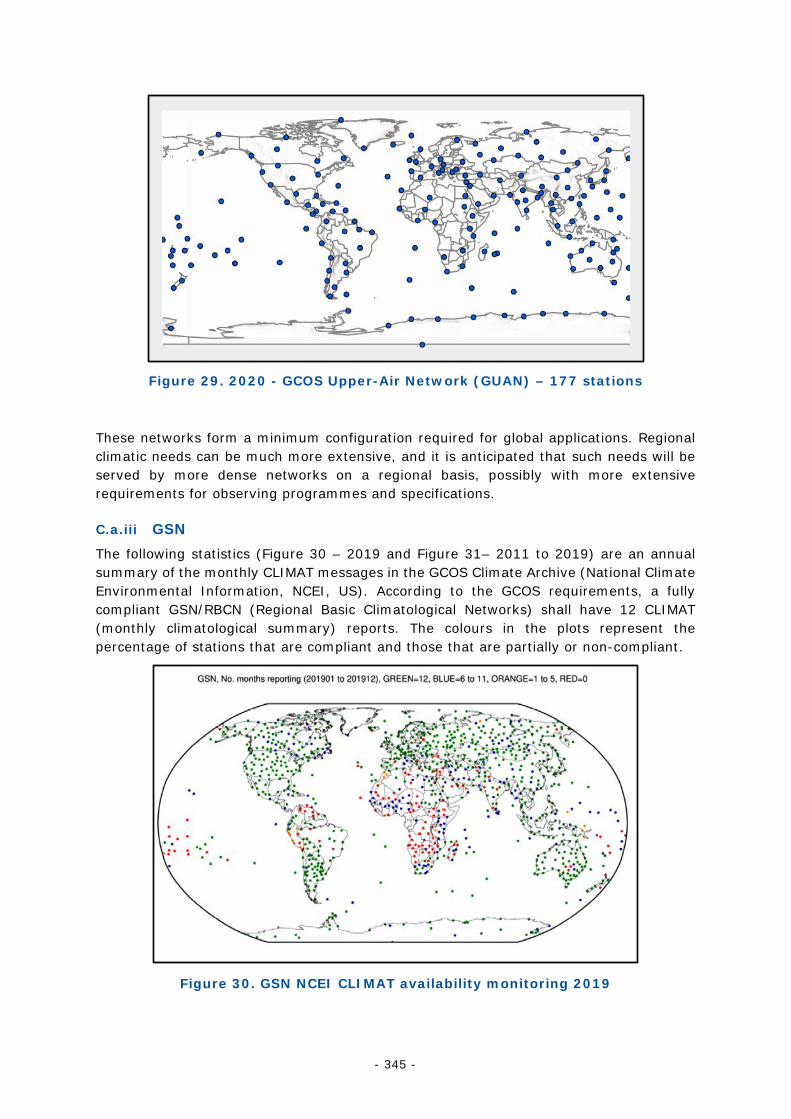
- 345 -
Figure 29. 2020 - GCOS Upper-Air Network (GUAN) – 177 stations
These networks form a minimum configuration required for global applications. Regional climatic needs can be much more extensive, and it is anticipated that such needs will be served by more dense networks on a regional basis, possibly with more extensive requirements for observing programmes and specifications.
C.a.iii GSN The following statistics (Figure 30 – 2019 and Figure 31– 2011 to 2019) are an annual summary of the monthly CLIMAT messages in the GCOS Climate Archive (National Climate Environmental Information, NCEI, US). According to the GCOS requirements, a fully compliant GSN/RBCN (Regional Basic Climatological Networks) shall have 12 CLIMAT (monthly climatological summary) reports. The colours in the plots represent the percentage of stations that are compliant and those that are partially or non-compliant.
Figure 30. GSN NCEI CLIMAT availability monitoring 2019
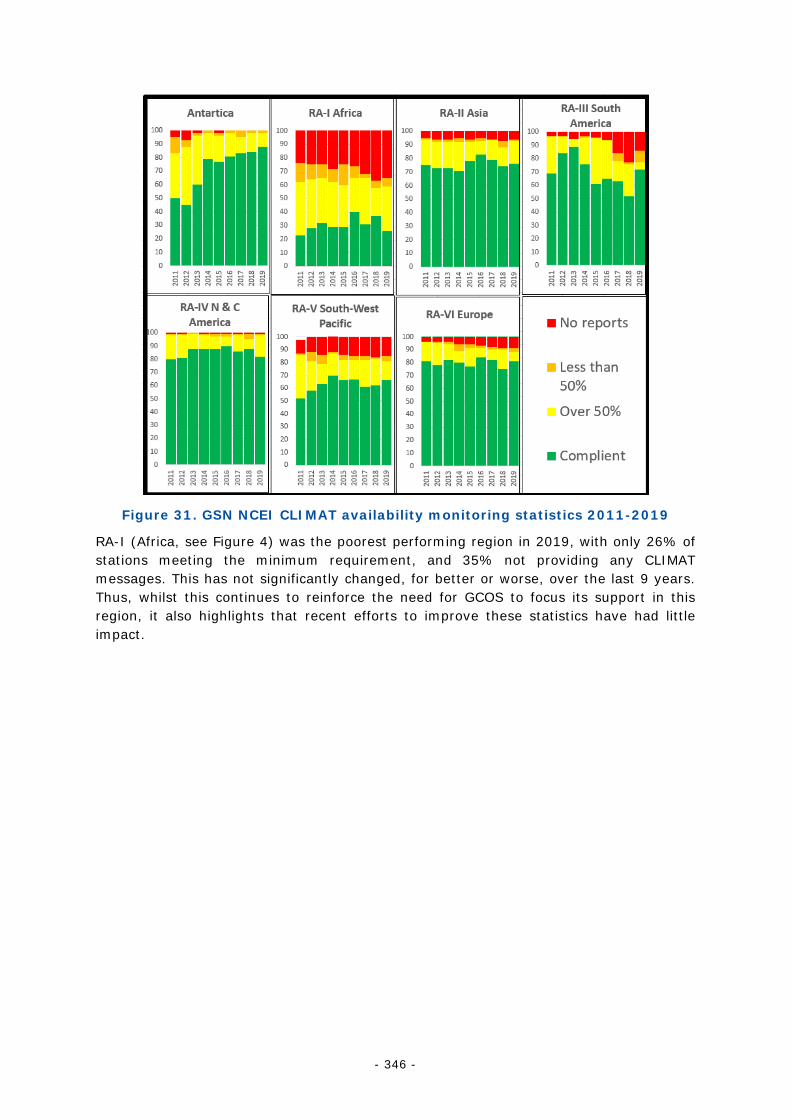
- 346 -
Figure 31. GSN NCEI CLIMAT availability monitoring statistics 2011-2019
RA-I (Africa, see Figure 4) was the poorest performing region in 2019, with only 26% of stations meeting the minimum requirement, and 35% not providing any CLIMAT messages. This has not significantly changed, for better or worse, over the last 9 years. Thus, whilst this continues to reinforce the need for GCOS to focus its support in this region, it also highlights that recent efforts to improve these statistics have had little impact.
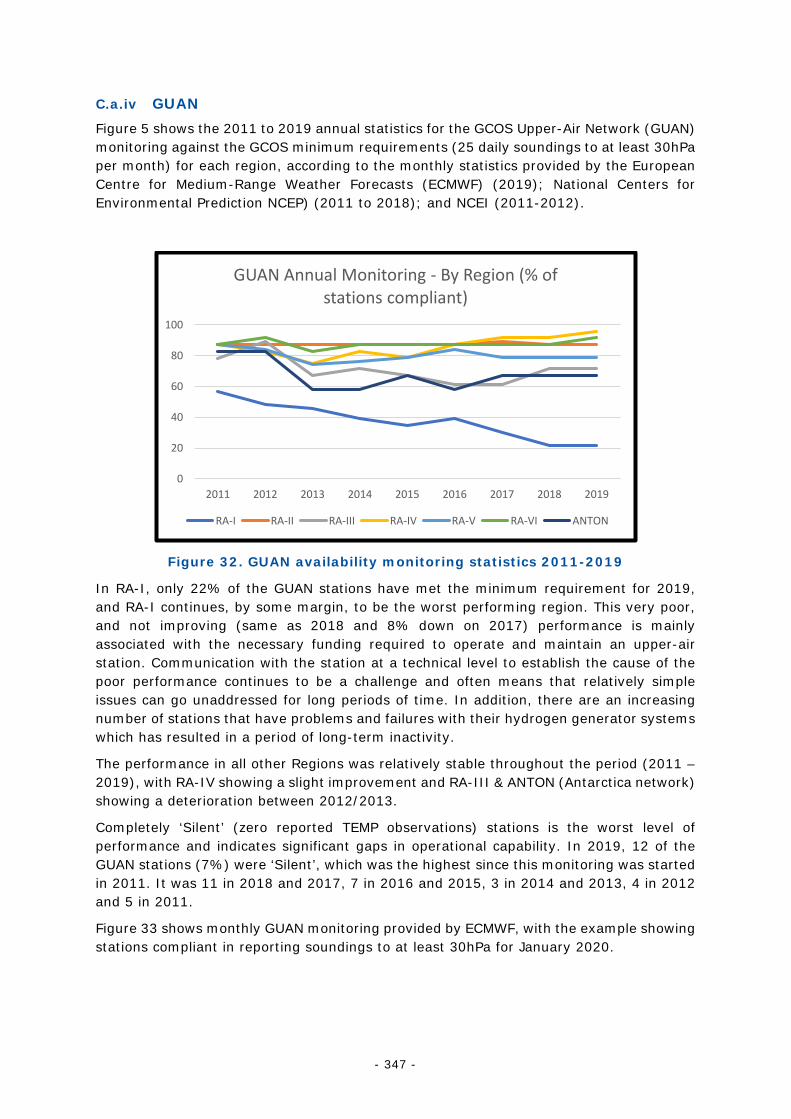
- 347 -
C.a.iv GUAN Figure 5 shows the 2011 to 2019 annual statistics for the GCOS Upper-Air Network (GUAN) monitoring against the GCOS minimum requirements (25 daily soundings to at least 30hPa per month) for each region, according to the monthly statistics provided by the European Centre for Medium-Range Weather Forecasts (ECMWF) (2019); National Centers for Environmental Prediction NCEP) (2011 to 2018); and NCEI (2011-2012).
Figure 32. GUAN availability monitoring statistics 2011-2019
In RA-I, only 22% of the GUAN stations have met the minimum requirement for 2019, and RA-I continues, by some margin, to be the worst performing region. This very poor, and not improving (same as 2018 and 8% down on 2017) performance is mainly associated with the necessary funding required to operate and maintain an upper-air station. Communication with the station at a technical level to establish the cause of the poor performance continues to be a challenge and often means that relatively simple issues can go unaddressed for long periods of time. In addition, there are an increasing number of stations that have problems and failures with their hydrogen generator systems which has resulted in a period of long-term inactivity.
The performance in all other Regions was relatively stable throughout the period (2011 – 2019), with RA-IV showing a slight improvement and RA-III & ANTON (Antarctica network) showing a deterioration between 2012/2013.
Completely ‘Silent’ (zero reported TEMP observations) stations is the worst level of performance and indicates significant gaps in operational capability. In 2019, 12 of the GUAN stations (7%) were ‘Silent’, which was the highest since this monitoring was started in 2011. It was 11 in 2018 and 2017, 7 in 2016 and 2015, 3 in 2014 and 2013, 4 in 2012 and 5 in 2011.
Figure 33 shows monthly GUAN monitoring provided by ECMWF, with the example showing stations compliant in reporting soundings to at least 30hPa for January 2020.
0
20
40
60
80
100
2011 2012 2013 2014 2015 2016 2017 2018 2019
GUAN Annual Monitoring - By Region (% of stations compliant)
RA-I RA-II RA-III RA-IV RA-V RA-VI ANTON
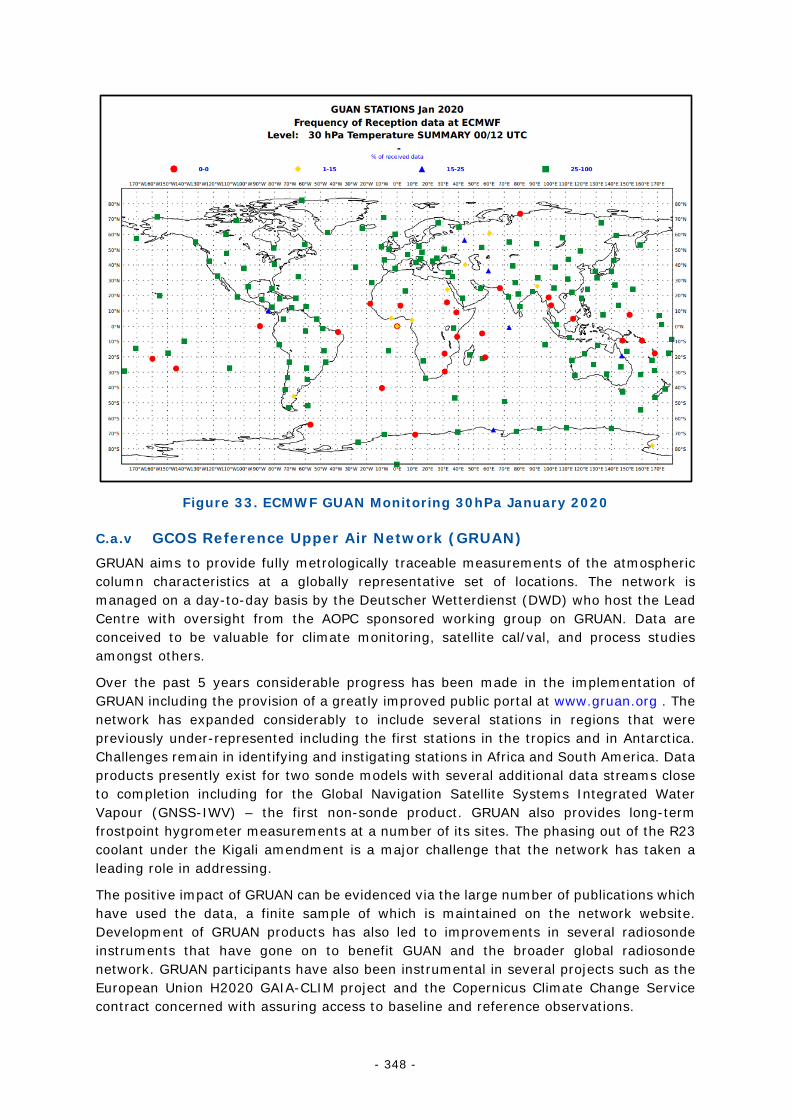
- 348 -
Figure 33. ECMWF GUAN Monitoring 30hPa January 2020
C.a.v GCOS Reference Upper Air Network (GRUAN) GRUAN aims to provide fully metrologically traceable measurements of the atmospheric column characteristics at a globally representative set of locations. The network is managed on a day-to-day basis by the Deutscher Wetterdienst (DWD) who host the Lead Centre with oversight from the AOPC sponsored working group on GRUAN. Data are conceived to be valuable for climate monitoring, satellite cal/val, and process studies amongst others.
Over the past 5 years considerable progress has been made in the implementation of GRUAN including the provision of a greatly improved public portal at www.gruan.org . The network has expanded considerably to include several stations in regions that were previously under-represented including the first stations in the tropics and in Antarctica. Challenges remain in identifying and instigating stations in Africa and South America. Data products presently exist for two sonde models with several additional data streams close to completion including for the Global Navigation Satellite Systems Integrated Water Vapour (GNSS-IWV) – the first non-sonde product. GRUAN also provides long-term frostpoint hygrometer measurements at a number of its sites. The phasing out of the R23 coolant under the Kigali amendment is a major challenge that the network has taken a leading role in addressing.
The positive impact of GRUAN can be evidenced via the large number of publications which have used the data, a finite sample of which is maintained on the network website. Development of GRUAN products has also led to improvements in several radiosonde instruments that have gone on to benefit GUAN and the broader global radiosonde network. GRUAN participants have also been instrumental in several projects such as the European Union H2020 GAIA-CLIM project and the Copernicus Climate Change Service contract concerned with assuring access to baseline and reference observations.
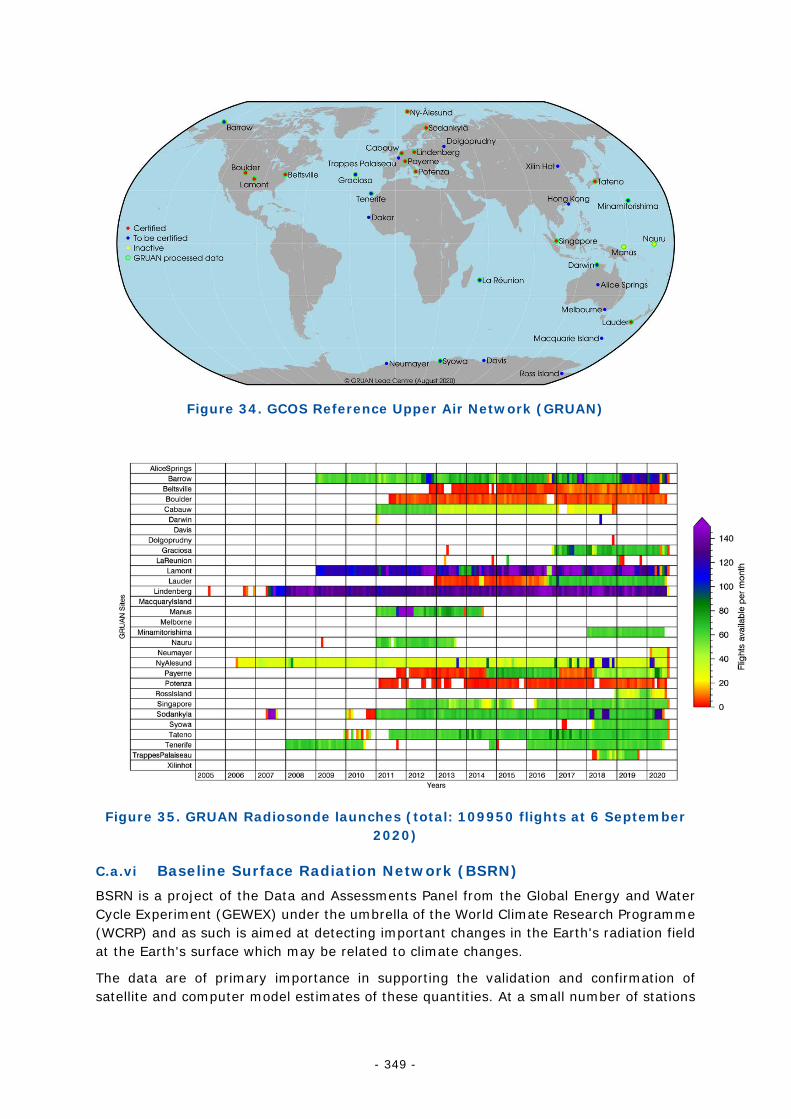
- 349 -
Figure 34. GCOS Reference Upper Air Network (GRUAN)
Figure 35. GRUAN Radiosonde launches (total: 109950 flights at 6 September
2020)
C.a.vi Baseline Surface Radiation Network (BSRN) BSRN is a project of the Data and Assessments Panel from the Global Energy and Water Cycle Experiment (GEWEX) under the umbrella of the World Climate Research Programme (WCRP) and as such is aimed at detecting important changes in the Earth's radiation field at the Earth's surface which may be related to climate changes.
The data are of primary importance in supporting the validation and confirmation of satellite and computer model estimates of these quantities. At a small number of stations
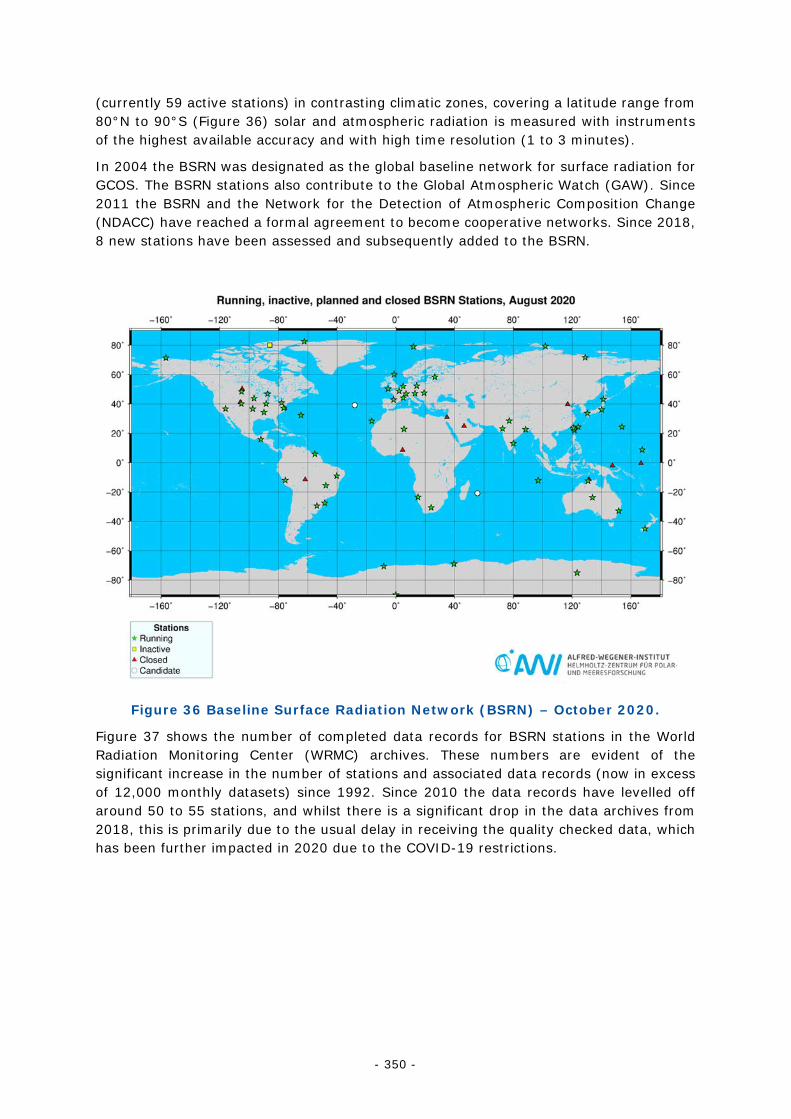
- 350 -
(currently 59 active stations) in contrasting climatic zones, covering a latitude range from 80°N to 90°S (Figure 36) solar and atmospheric radiation is measured with instruments of the highest available accuracy and with high time resolution (1 to 3 minutes).
In 2004 the BSRN was designated as the global baseline network for surface radiation for GCOS. The BSRN stations also contribute to the Global Atmospheric Watch (GAW). Since 2011 the BSRN and the Network for the Detection of Atmospheric Composition Change (NDACC) have reached a formal agreement to become cooperative networks. Since 2018, 8 new stations have been assessed and subsequently added to the BSRN.
Figure 36 Baseline Surface Radiation Network (BSRN) – October 2020.
Figure 37 shows the number of completed data records for BSRN stations in the World Radiation Monitoring Center (WRMC) archives. These numbers are evident of the significant increase in the number of stations and associated data records (now in excess of 12,000 monthly datasets) since 1992. Since 2010 the data records have levelled off around 50 to 55 stations, and whilst there is a significant drop in the data archives from 2018, this is primarily due to the usual delay in receiving the quality checked data, which has been further impacted in 2020 due to the COVID-19 restrictions.
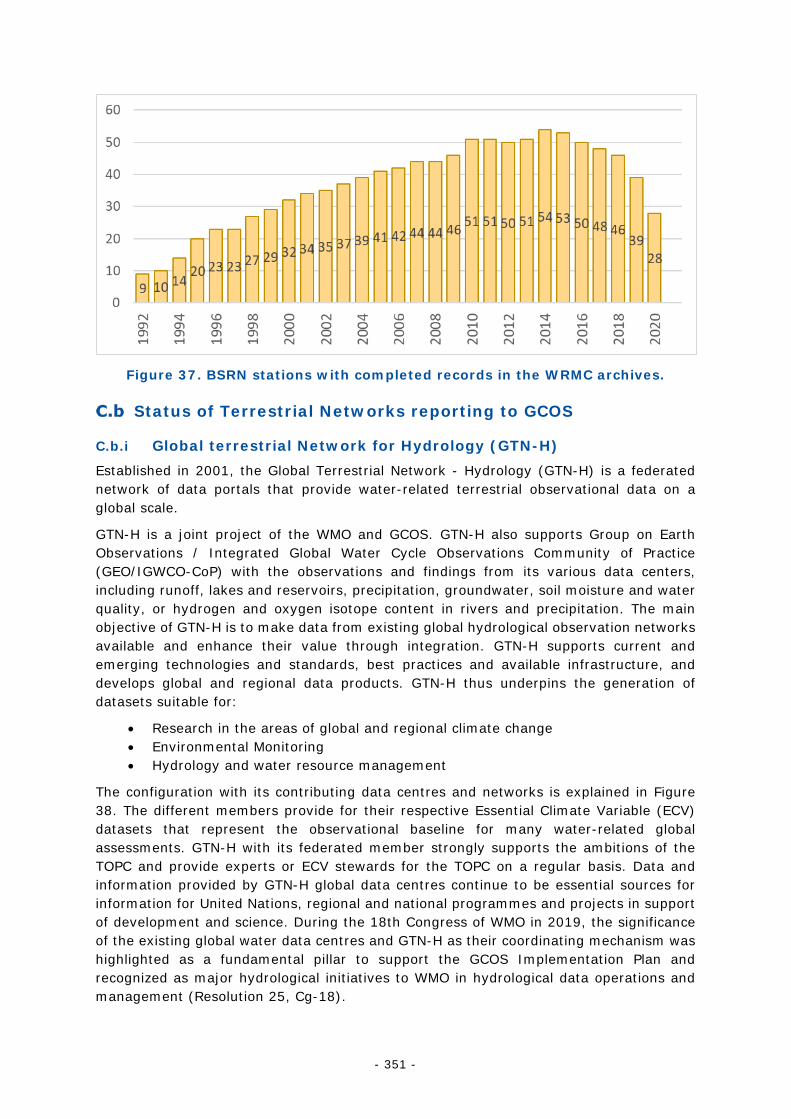
- 351 -
Figure 37. BSRN stations with completed records in the WRMC archives.
Status of Terrestrial Networks reporting to GCOS
C.b.i Global terrestrial Network for Hydrology (GTN-H) Established in 2001, the Global Terrestrial Network - Hydrology (GTN-H) is a federated network of data portals that provide water-related terrestrial observational data on a global scale.
GTN-H is a joint project of the WMO and GCOS. GTN-H also supports Group on Earth Observations / Integrated Global Water Cycle Observations Community of Practice (GEO/IGWCO-CoP) with the observations and findings from its various data centers, including runoff, lakes and reservoirs, precipitation, groundwater, soil moisture and water quality, or hydrogen and oxygen isotope content in rivers and precipitation. The main objective of GTN-H is to make data from existing global hydrological observation networks available and enhance their value through integration. GTN-H supports current and emerging technologies and standards, best practices and available infrastructure, and develops global and regional data products. GTN-H thus underpins the generation of datasets suitable for:
• Research in the areas of global and regional climate change • Environmental Monitoring • Hydrology and water resource management
The configuration with its contributing data centres and networks is explained in Figure 38. The different members provide for their respective Essential Climate Variable (ECV) datasets that represent the observational baseline for many water-related global assessments. GTN-H with its federated member strongly supports the ambitions of the TOPC and provide experts or ECV stewards for the TOPC on a regular basis. Data and information provided by GTN-H global data centres continue to be essential sources for information for United Nations, regional and national programmes and projects in support of development and science. During the 18th Congress of WMO in 2019, the significance of the existing global water data centres and GTN-H as their coordinating mechanism was highlighted as a fundamental pillar to support the GCOS Implementation Plan and recognized as major hydrological initiatives to WMO in hydrological data operations and management (Resolution 25, Cg-18).
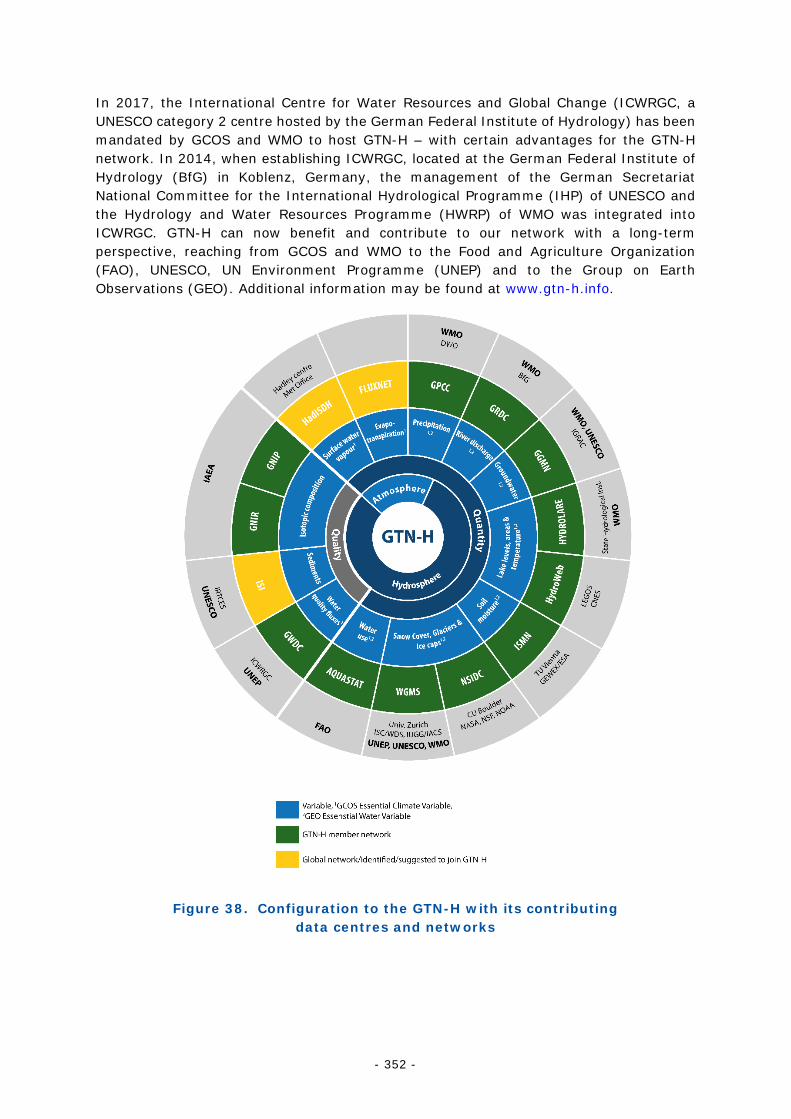
- 352 -
In 2017, the International Centre for Water Resources and Global Change (ICWRGC, a UNESCO category 2 centre hosted by the German Federal Institute of Hydrology) has been mandated by GCOS and WMO to host GTN-H – with certain advantages for the GTN-H network. In 2014, when establishing ICWRGC, located at the German Federal Institute of Hydrology (BfG) in Koblenz, Germany, the management of the German Secretariat National Committee for the International Hydrological Programme (IHP) of UNESCO and the Hydrology and Water Resources Programme (HWRP) of WMO was integrated into ICWRGC. GTN-H can now benefit and contribute to our network with a long-term perspective, reaching from GCOS and WMO to the Food and Agriculture Organization (FAO), UNESCO, UN Environment Programme (UNEP) and to the Group on Earth Observations (GEO). Additional information may be found at www.gtn-h.info.
Figure 38. Configuration to the GTN-H with its contributing data centres and networks
- 353 -
C.b.ii Global Terrestrial Network for Glaciers (GTN-G) Among the first Global Terrestrial Networks, the Global Terrestrial Network for Glaciers (GTN‐G) was established in 1998 (Haeberli, 1998). GTN‐G is led by the World Glacier Monitoring Service (WGMS) in close collaboration with the US National Snow and Ice Data Center (NSIDC) in Boulder and the Global Land Ice Measurements from Space (GLIMS) initiative. GTN-G has become the framework for the internationally coordinated monitoring of glaciers in support of the UNFCCC. GTN‐G and its operational bodies are periodically evaluated through the GTN‐G Advisory Board, under the lead of the International Association of Cryospheric Sciences (IACS). GTN-G has no dedicated budget and, hence, fully depends on the funding situation of its operational bodies (i.e., a few full-time equivalents in total).
GTN-G has developed an integrated, multilevel strategy for global glacier observations and is based on a system of tiers of the Global Hierarchical Observing Strategy (Haeberli et al., 2000). It combines process-oriented in situ studies on single glaciers (e.g., glaciological mass-balance measurements) with satellite-based coverage of large glacier ensembles in entire mountain systems (i.e., glacier inventories, combined with digital elevation models from geodetic surveys). In a recent study, Gärtner-Roer et al. (2019) assessed the status of national implementations of this international monitoring strategy to make the data easily accessible to a broader audience, to identify gaps in the monitoring setup, and to guide countries in improving their monitoring schemes. Unfortunately, those countries with the highest glacier coverage are not the ones with the best developed monitoring networks. This observational bias needs to be addressed by capacity building and twinning for in situ measurements whereas remote sensing can help to improve the observational coverage in space and time.
Over recent years, GTN-G has made great progress in increasing the accessibility of glaciological data and information and, hence, provides an important service to the scientific community, national and international agencies, and to the wider public. As such, NSIDC and GLIMS successfully merged the existing glacier inventories, streamlined data delivery, and released new versions of the Randolph Glacier Inventory (RGI, RGI Consortium, 2017). At the same time, the WGMS was able to further extend the compilation and computation of glacier volume changes using space-borne sensors within the framework of ESA’s Climate Change Initiative (CCI, CCI+) and Europe’s Copernicus Climate Change Service (C3S). These efforts resulted in a strong and ongoing improvement of the observational coverage in many regions (Figure 12). At the same time, the database infrastructure of WGMS needs to be modernized and upgraded in order to deal in an efficient manner with the tremendous increase in data from remote sensing. The migration to a new Fluctuations of Glaciers database infrastructure is a key task for the coming years. This progress has been achieved thanks to the available funding of the GTN-G bodies and to the collaboration with the glaciological community, often through IACS working groups (https://cryosphericsciences.org/).
GTN-G managed to building up an unrivalled collection of global glacier datasets thanks to the long-term commitment of its operational bodies and a well-established international collaboration network. The GTN-G datasets provide, despite remaining limitations, the observational baseline for global assessments on glacier distribution (e.g., RGI Consortium 2017, Farinotti et al., 2019a) and changes (e.g., Marzeion et al., 2014, Zemp et al., 2015, 2019) as well as on related impacts on local hazards (e.g., Haeberli & Whiteman, 2015), regional water availability (e.g., Huss and Hock, 2018, Farinotti et al., 2019b), and global sea-level rise (e.g., Hock et al., 2019, Marzeion et al., 2020, Zemp et al., 2020).
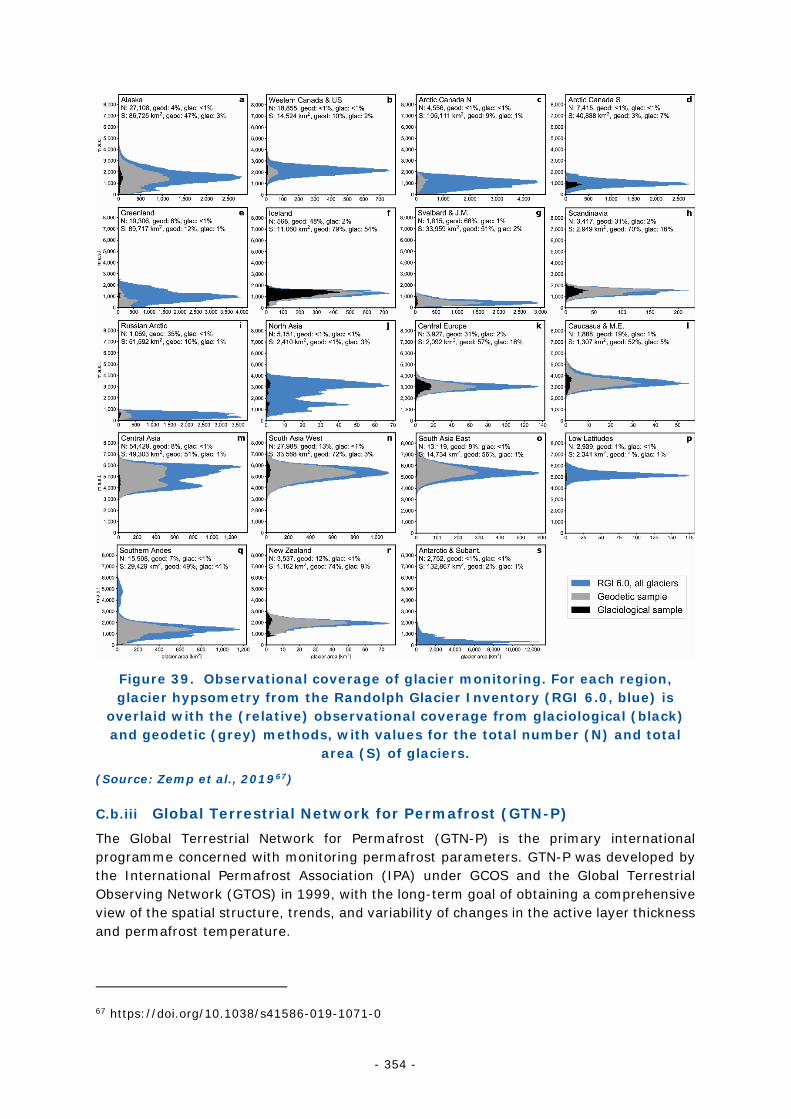
- 354 -
Figure 39. Observational coverage of glacier monitoring. For each region, glacier hypsometry from the Randolph Glacier Inventory (RGI 6.0, blue) is
overlaid with the (relative) observational coverage from glaciological (black) and geodetic (grey) methods, with values for the total number (N) and total
area (S) of glaciers.
(Source: Zemp et al., 201967)
C.b.iii Global Terrestrial Network for Permafrost (GTN-P) The Global Terrestrial Network for Permafrost (GTN-P) is the primary international programme concerned with monitoring permafrost parameters. GTN-P was developed by the International Permafrost Association (IPA) under GCOS and the Global Terrestrial Observing Network (GTOS) in 1999, with the long-term goal of obtaining a comprehensive view of the spatial structure, trends, and variability of changes in the active layer thickness and permafrost temperature.
67 https://doi.org/10.1038/s41586-019-1071-0
- 355 -
The data management system of the GTN-P oversees permafrost data submission, archival, storage, and dissemination of a wide range of permafrost data. The aim of the GTN-P database is to include a wide range of permafrost data. The GTN-P database is the free, open-source central database for permafrost monitoring parameters. The data management system is organized along a controlled vocabulary in order to reduce ambiguity and the contribution to common grounding and shared understanding. It also links to the permafrost thesaurus, a glossary of nearly 600 permafrost-related terms. The work on a permafrost ontology, an organized vocabulary showing the interrelationships of terms, is in progress.
C.b.iv Global Observations of Forest Cover and Land-use Dynamics (GOFC–GOLD)
Global Observations of Forest Cover and Land-use Dynamics (GOFC–GOLD) is a coordinated international program working to provide ongoing space-based and in situ observations of the land surface to support sustainable management of terrestrial resources at different scales. The GOFC–GOLD program acts as an international forum to exchange information, coordinate satellite observations, and provide a framework for and advocacy to establish long-term monitoring systems. It was established as a part of a Committee on Earth Observation Satellites (CEOS) pilot project in 1997, with a focus on global observations of forest cover. Since then, the program has expanded to include two Implementation Teams: Land Cover Characteristics and Change, and Fire Mapping and Monitoring. In addition, two working groups—Reducing Emissions from Deforestation and Forest Degradation (REDD), and Biomass Monitoring—were also formed. GOFC– GOLD activities are guided by an executive committee, primarily with support from NASA and the European Space Agency (ESA). Another key activity of GOFC-GOLD is the coordination of Regional Networks, which involve local data providers, data brokers and data users .
The GOFC-GOLD Land Cover Project Office (LC-PO) manages the Land Cover Characteristics and Change Implementation Team of GOFC-GOLD. It was established as a technical panel of the Global Terrestrial Observing System (GTOS), and now reports to TOPC and GCOS as GTOS is no longer operational. It provides the platform for international communication and cooperation for actors involved in global earth observation including data producers (e.g. space agencies, land cover facilities, operational service mechanisms including Copernicus), the scientific community, and data users (FAO and other UN organizations, the European Economic Area (EEA), global climate and land use assessment communities (i.e. the Intergovernmental Panel on Climate Change (IPCC), Global Land Programme (GLP) etc.). These activities improve the value of current and future land monitoring datasets for a multitude of applications and contribute to the overall goal of operational observations of the land surface.
The LC-PO’s activities for the GOFC-GOLD REDD working group have been implemented recently through the of Global Forest Observations Initiative (GFOI) from GEO. The LC-PO lead the R&D component of GFOI which is another major international coordination initiative. The main aim is to support REDD+ countries in developing their national forest monitoring capacities. the key role of the R&D component to achieve the objectives of GFOI starting from assessing country needs and defining R&D priorities, stimulating dedicated research, synthesizing research findings to improve guidance (i.e. GOFC-GOLD Sourcebook, www.gofcgold.wur.nl/redd/) and training materials (GOFC-GOLD training materials http://www.gofcgold.wur.nl/redd/training-materials/), and feeding back into country capacity developing processes.
- 356 -
Other recent significant objectives of GOFC-GOLD are to maintain and develop participation of the LC-PO in TOPC/GCOS meetings. Prof. Herold is member of TOPC and together with Sarah Carter is responsible for land cover and biomass ECVs.
The ESA supported the GOFC-GOLD LC-PO for 6 years (2011-2016) at Wageningen University (under GOFC-GOLD land cover team co-chair Prof. Martin Herold) and this period followed 6 years of operation at the Friedrich-Schiller-University (FSU) in Jena.
The last meeting of the GOFC-GOLD LC IT was held in 2016, and several new directions which the forest/land monitoring and the global land cover research communities should take were identified since the official launch of the UN Sustainable Development Goals (SDGs) including the need to cater for non-climate users, and the outcomes of the UNFCCC COP-21 (Paris Agreement). The need to provide contributions to international initiatives such as the SDGs has been recently achieved through the team’s participation as an expert member of Inter-Agency Expert Group (IAEG)-SDG geospatial working group (WG-GI) that is working on detailing and demonstrating the use of Earth Observation data for SDG assessment purpose and activities. A number of other key priorities were identified based on evolving needs of the field. The requirement to constantly update these through active participation in relevant networks and scientific communities is a constant challenge which the team is undertaking. The need to link LC-IT activities to broader GOFC-GOLD activities has also recently been identified, and efforts have been undertaken to revamp this network.
Ocean Observations This section draws from the Ocean Observing System Report Card 202068, published by the Global Ocean Observing System (GOOS) Observations Coordination Group (OCG).
68 https://www.ocean-ops.org/reportcard/
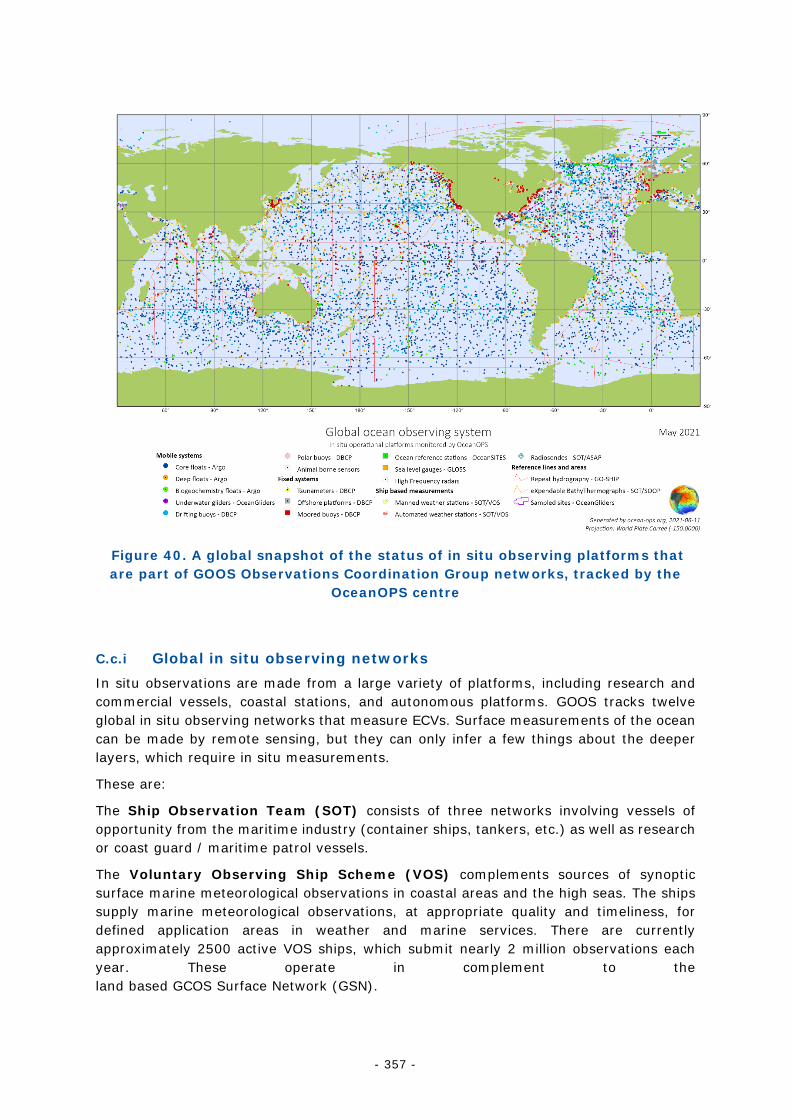
- 357 -
Figure 40. A global snapshot of the status of in situ observing platforms that are part of GOOS Observations Coordination Group networks, tracked by the
OceanOPS centre
C.c.i Global in situ observing networks In situ observations are made from a large variety of platforms, including research and commercial vessels, coastal stations, and autonomous platforms. GOOS tracks twelve global in situ observing networks that measure ECVs. Surface measurements of the ocean can be made by remote sensing, but they can only infer a few things about the deeper layers, which require in situ measurements.
These are:
The Ship Observation Team (SOT) consists of three networks involving vessels of opportunity from the maritime industry (container ships, tankers, etc.) as well as research or coast guard / maritime patrol vessels.
The Voluntary Observing Ship Scheme (VOS) complements sources of synoptic surface marine meteorological observations in coastal areas and the high seas. The ships supply marine meteorological observations, at appropriate quality and timeliness, for defined application areas in weather and marine services. There are currently approximately 2500 active VOS ships, which submit nearly 2 million observations each year. These operate in complement to the land based GCOS Surface Network (GSN).
- 358 -
Within the Automated Shipboard Aerological Programme (ASAP), ships provide upper-air observations of appropriate quality and timeliness for WMO defined application areas, such as forecasts and warnings to safeguard commerce and the protection of life and property at sea. The soundings are made using balloons (filled with helium gas) equipped with the required instruments and data telecommunication system. Around 5000 soundings are taken annually, a complement to the land-based GCOS Upper-Air Network (GUAN).
The Ship of Opportunity Program (SOOP) collects upper ocean temperature profiles and surface measurements. The network consists of collecting temperature profiles down to 800m across ocean basins as well as surface CO2 and surface temperature and salinity data. SOOP can be divided into four sub-programs, each focusing on different variables and addressing various phenomena, therefore having a unique contribution: SOOP - Expendable bathythermographs measuring temperature in the upper 700 m of the ocean, SOOP-CO2 for surface carbon, SOOP-BGC for other biogeochemical surface variables, and SOOP-Thermosalinographs measuring sea surface temperature and salinity.
The Global Sea Level Network (GLOSS) is a network of tide gauges delivering to specifications (data, timeliness, accuracy) for characterising Global Sea Level Changes. The main component of GLOSS is the 'Global Core Network' (GCN) of 290 sea level stations around the world for long term climate change and oceanographic sea level monitoring. It is designed to provide an approximately evenly distributed sampling of global coastal sea level variations. The GLOSS altimeter calibration (ALT) set consists mostly of island stations and will provide an ongoing facility for mission intercalibrations. The data is transmitted in Real time and Fast and in Delayed Mode.
The Data Buoy Cooperation Panel (DBCP) comprises the Global Drifter Array and the National/Coastal Moored Buoy Networks.
The DBCP Drifting and polar buoys is a network of surface lagrangian drifters equipped with a thermistor on the base of the surface hull to measure sea surface temperature, and a drogue centred at 15m below the surface such that the drifters follow the surface circulation. The drifters are the only source of global in situ air pressure data and the primary source of in situ sea surface temperature data for climate. A small number of drifters also report surface salinity and wind speed. The aim of the DBCP Global Drifters Array is to maintain a global 5x5 degree array of satellite-tracked surface drifting buoys. In addition, drifters are also deployed at higher latitudes, often on seasonal ice in the Arctic and Antarctic regions.
The DBCP Moored buoys encompasses moored buoys deployed, operated and maintained by a wide variety of organizations. They provide data in support of weather prediction, marine services, and research. Some of these networks have been in place for 40 years, and so provide valuable time-series for marine climate studies, in particular for wave climate.
The OceanSITES Open-Ocean Timeseries network aims to collect physical, biogeochemical, and biology/ecosystem data worldwide with interdisciplinary moorings taking long-term, high-frequency observations at fixed locations in the open ocean, covering the full-depth water column, the sea floor as well as the overlying atmosphere. OceanSITES has three types of sites: transport moored arrays, air/sea flux reference sites, and multidisciplinary Global Ocean Watch sites, which are operated in key regions of the global ocean. One of the main drivers for time series is to provide both monitoring and process observations with a temporal resolution from minutes to decades to detect,
- 359 -
understand, and predict global physical, biogeochemical and ecosystem state and changes, including ocean warming, ocean carbon uptake/storage and acidification, ocean deoxygenation, but considering also the role of and impact on ecosystem.
Argo is a network of Quasi-Lagrangian profiling floats, which are capable of adjusting their buoyancy. The array of now almost 4000 floats provides 140,000 temperature/salinity (T/S) profiles and velocity measurements per year distributed over the global oceans at an average 3 degree spacing. Floats cycle to 2000m depth every 10 days. Other types of floats go deeper than 2000 m (deep Argo), and biogeochemical Argo (BGC Argo) is developing. Argo provides a quantitative description of the changing state of the upper ocean and the patterns of ocean climate variability from months to decades, including heat and freshwater storage and their transport. Argo data are being used to initialize ocean and coupled ocean-atmosphere forecast models, for data assimilation and for model testing. A primary focus of Argo is to document seasonal to decadal climate variability and to aid our understanding of its predictability.
The Global Ocean Ship-Based Hydrographic Investigations Programme (GO-SHIP) is an international network of global class research vessels engaging in repeated transect hydrographic surveys. GO-SHIP is the only comprehensive oceanographic program documenting, with high accuracy, ocean physical and biogeochemical changes throughout the water column, including for the deep ocean below 2 km. It also provides coincident, comprehensive, high quality of key carbon observations. The measurements taken are critical to validate new generation sensors including those on floats, gliders and buoys. GO-SHIP is aimed at understanding and documenting the large-scale ocean water property distributions, their changes, and drivers of those changes, addressing questions of how a future ocean that will increase in dissolved inorganic carbon, become more acidic and more stratified, less oxygenated, and experience changes in circulation and ventilation processes due to global warming, altered water cycle and sea-ice, will interact with natural ocean variability. An evolving objective is determining ecological changes, systematically studying large scale decadal changes in the ocean.
The OceanGliders network is an international array of autonomous underwater gliders, which measure physical variables such as pressure, temperature, salinity, and current, as well as biological variables relevant to the abundance of phytoplankton, zooplankton, fishes and ecologically important chemical variables such as dissolved oxygen. They can be deployed and recovered from a wide range of platforms, including small boats and chartered fishing vessels, which facilitates logistics. The glider program is designed as an array of long-term repeat sections in key areas over the global oceans, documenting the variability of the boundary circulation and addressing questions of how a future ocean will change in many respects and at many different scales.
The Global HF Radar Network uses coast-based high-frequency radar technology to measure surface currents, waves (height, direction, period) and wind. The network helps determine the movement of surface waters, providing critical information to support pollutant tracking, search and rescue operations, harmful algal bloom monitoring, vessel navigation, ecosystem-based management, and marine spatial planning. The Global HF Radar team works to connect the countries operating HF Radar while supporting the transition of these systems to a sustained effort. Assimilation of HF radar data into ocean models has significantly improved forecasting.
The newly endorsed Animal Borne Ocean Sensors (AniBOS) network provides a cost-effective and complementary observing capability to the GOOS. AniBOS monitors several
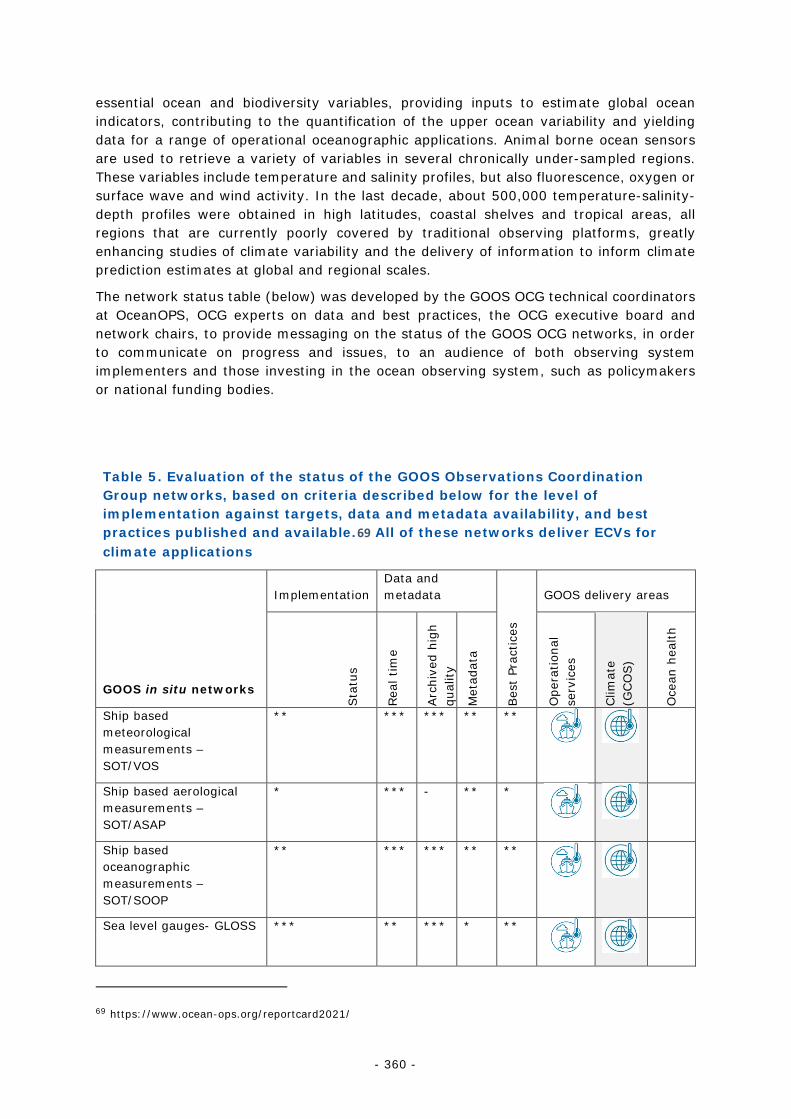
- 360 -
essential ocean and biodiversity variables, providing inputs to estimate global ocean indicators, contributing to the quantification of the upper ocean variability and yielding data for a range of operational oceanographic applications. Animal borne ocean sensors are used to retrieve a variety of variables in several chronically under-sampled regions. These variables include temperature and salinity profiles, but also fluorescence, oxygen or surface wave and wind activity. In the last decade, about 500,000 temperature-salinity-depth profiles were obtained in high latitudes, coastal shelves and tropical areas, all regions that are currently poorly covered by traditional observing platforms, greatly enhancing studies of climate variability and the delivery of information to inform climate prediction estimates at global and regional scales.
The network status table (below) was developed by the GOOS OCG technical coordinators at OceanOPS, OCG experts on data and best practices, the OCG executive board and network chairs, to provide messaging on the status of the GOOS OCG networks, in order to communicate on progress and issues, to an audience of both observing system implementers and those investing in the ocean observing system, such as policymakers or national funding bodies.
Table 5. Evaluation of the status of the GOOS Observations Coordination Group networks, based on criteria described below for the level of implementation against targets, data and metadata availability, and best practices published and available.69 All of these networks deliver ECVs for climate applications
GOOS in situ networks
Implementation Data and metadata
Bes
t Pr
actic
es
GOOS delivery areas
Sta
tus
Rea
l tim
e
Arc
hive
d hi
gh
qual
ity
Met
adat
a
Ope
ratio
nal
serv
ices
Clim
ate
(GCO
S)
Oce
an h
ealth
Ship based meteorological measurements – SOT/VOS
** *** *** ** **
Ship based aerological measurements – SOT/ASAP
* *** - ** *
Ship based oceanographic measurements – SOT/SOOP
** *** *** ** **
Sea level gauges- GLOSS *** ** *** * **
69 https://www.ocean-ops.org/reportcard2021/
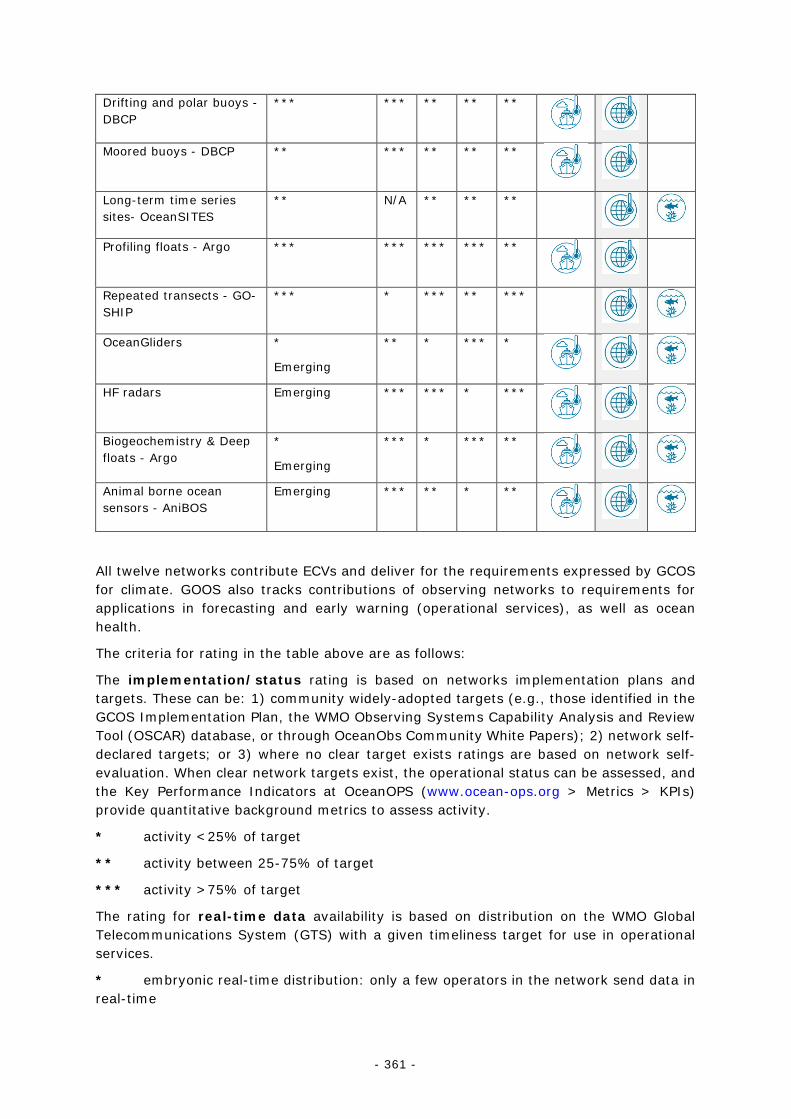
- 361 -
Drifting and polar buoys - DBCP
*** *** ** ** **
Moored buoys - DBCP ** *** ** ** **
Long-term time series sites- OceanSITES
** N/A ** ** **
Profiling floats - Argo *** *** *** *** **
Repeated transects - GO-SHIP
*** * *** ** ***
OceanGliders *
Emerging
** * *** *
HF radars
Emerging *** *** * ***
Biogeochemistry & Deep floats - Argo
*
Emerging
*** * *** **
Animal borne ocean sensors - AniBOS
Emerging *** ** * **
All twelve networks contribute ECVs and deliver for the requirements expressed by GCOS for climate. GOOS also tracks contributions of observing networks to requirements for applications in forecasting and early warning (operational services), as well as ocean health.
The criteria for rating in the table above are as follows:
The implementation/status rating is based on networks implementation plans and targets. These can be: 1) community widely-adopted targets (e.g., those identified in the GCOS Implementation Plan, the WMO Observing Systems Capability Analysis and Review Tool (OSCAR) database, or through OceanObs Community White Papers); 2) network self-declared targets; or 3) where no clear target exists ratings are based on network self-evaluation. When clear network targets exist, the operational status can be assessed, and the Key Performance Indicators at OceanOPS (www.ocean-ops.org > Metrics > KPIs) provide quantitative background metrics to assess activity.
* activity <25% of target
** activity between 25-75% of target
*** activity >75% of target
The rating for real-time data availability is based on distribution on the WMO Global Telecommunications System (GTS) with a given timeliness target for use in operational services.
* embryonic real-time distribution: only a few operators in the network send data in real-time
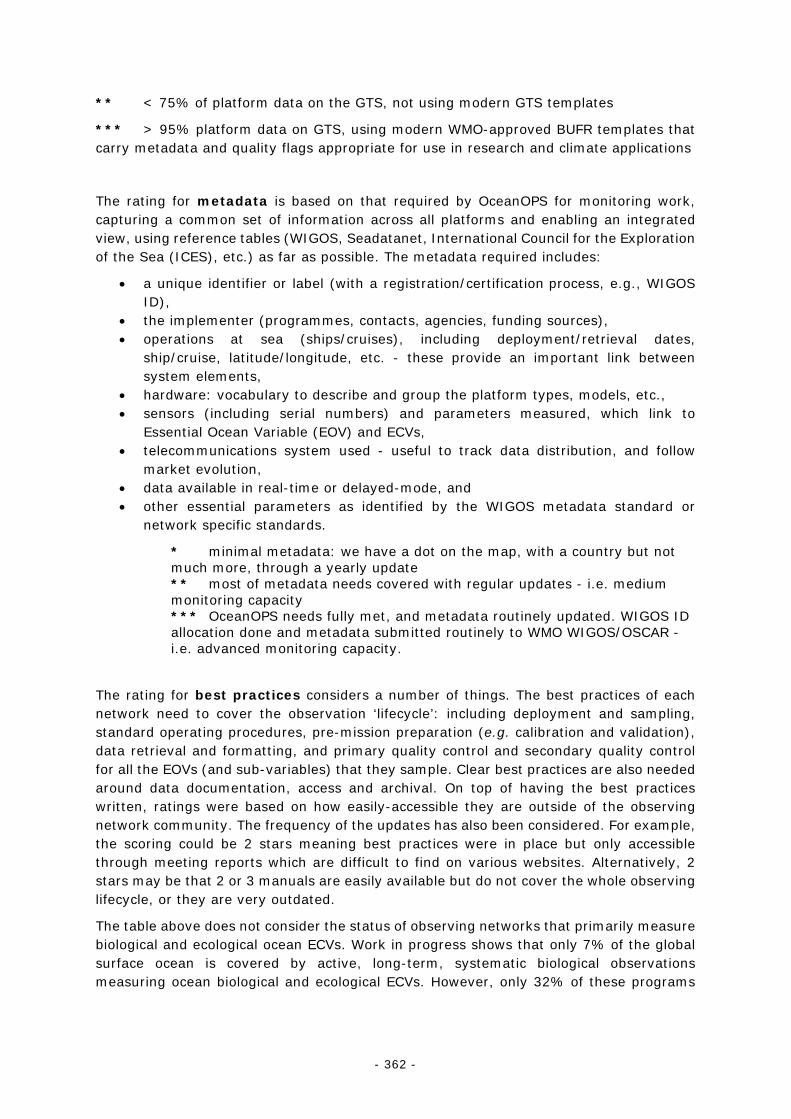
- 362 -
** < 75% of platform data on the GTS, not using modern GTS templates
*** > 95% platform data on GTS, using modern WMO-approved BUFR templates that carry metadata and quality flags appropriate for use in research and climate applications
The rating for metadata is based on that required by OceanOPS for monitoring work, capturing a common set of information across all platforms and enabling an integrated view, using reference tables (WIGOS, Seadatanet, International Council for the Exploration of the Sea (ICES), etc.) as far as possible. The metadata required includes:
• a unique identifier or label (with a registration/certification process, e.g., WIGOS ID),
• the implementer (programmes, contacts, agencies, funding sources), • operations at sea (ships/cruises), including deployment/retrieval dates,
ship/cruise, latitude/longitude, etc. - these provide an important link between system elements,
• hardware: vocabulary to describe and group the platform types, models, etc., • sensors (including serial numbers) and parameters measured, which link to
Essential Ocean Variable (EOV) and ECVs, • telecommunications system used - useful to track data distribution, and follow
market evolution, • data available in real-time or delayed-mode, and • other essential parameters as identified by the WIGOS metadata standard or
network specific standards.
* minimal metadata: we have a dot on the map, with a country but not much more, through a yearly update ** most of metadata needs covered with regular updates - i.e. medium monitoring capacity *** OceanOPS needs fully met, and metadata routinely updated. WIGOS ID allocation done and metadata submitted routinely to WMO WIGOS/OSCAR - i.e. advanced monitoring capacity.
The rating for best practices considers a number of things. The best practices of each network need to cover the observation ‘lifecycle’: including deployment and sampling, standard operating procedures, pre-mission preparation (e.g. calibration and validation), data retrieval and formatting, and primary quality control and secondary quality control for all the EOVs (and sub-variables) that they sample. Clear best practices are also needed around data documentation, access and archival. On top of having the best practices written, ratings were based on how easily-accessible they are outside of the observing network community. The frequency of the updates has also been considered. For example, the scoring could be 2 stars meaning best practices were in place but only accessible through meeting reports which are difficult to find on various websites. Alternatively, 2 stars may be that 2 or 3 manuals are easily available but do not cover the whole observing lifecycle, or they are very outdated.
The table above does not consider the status of observing networks that primarily measure biological and ecological ocean ECVs. Work in progress shows that only 7% of the global surface ocean is covered by active, long-term, systematic biological observations measuring ocean biological and ecological ECVs. However, only 32% of these programs
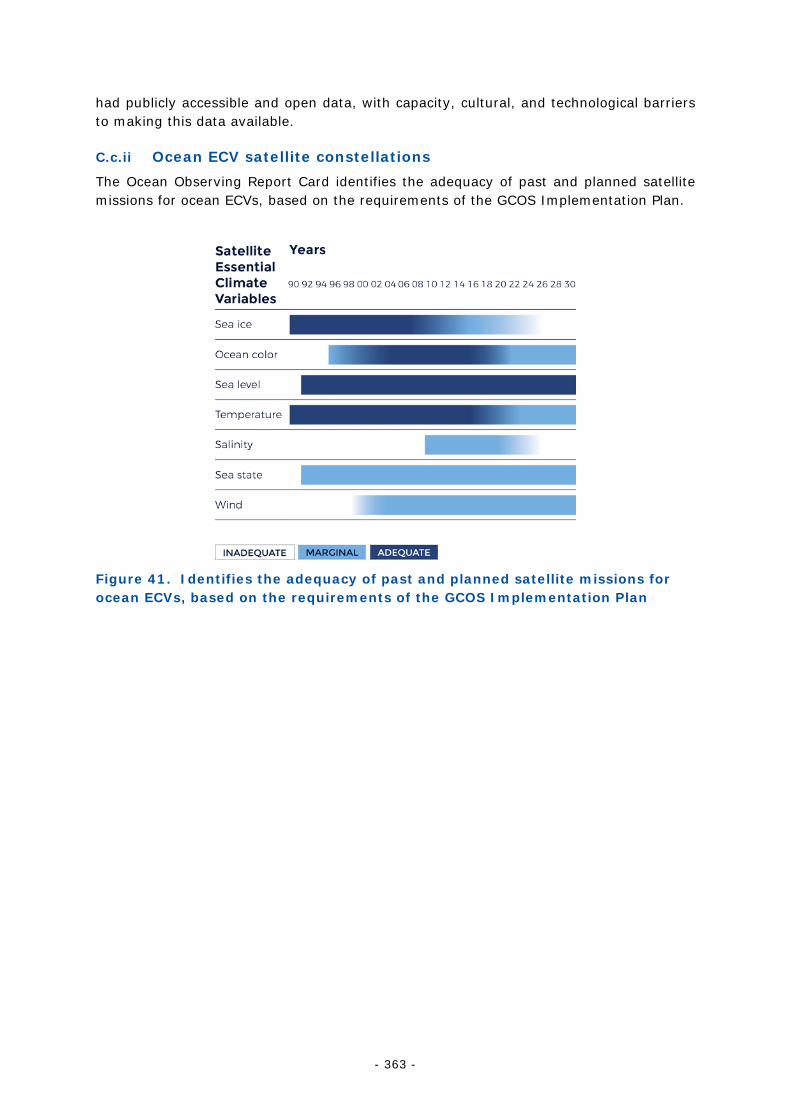
- 363 -
had publicly accessible and open data, with capacity, cultural, and technological barriers to making this data available.
C.c.ii Ocean ECV satellite constellations The Ocean Observing Report Card identifies the adequacy of past and planned satellite missions for ocean ECVs, based on the requirements of the GCOS Implementation Plan.
Figure 41. Identifies the adequacy of past and planned satellite missions for ocean ECVs, based on the requirements of the GCOS Implementation Plan
- 364 -
References Farinotti, D., M. Huss and J. J. Fürst et al. 2019: A consensus estimate for the ice thickness distribution of all glaciers on Earth. Nature Geoscience, 12, 168–173, doi.org/10.1038/s41561-019-0300-3
Farinotti, D., V. Round and M. Huss et al. 2019: Large hydropower and water-storage potential in future glacier-free basins. Nature, 575, 341–344, doi.org/10.1038/s41586-019-1740-z
Gärtner-Roer, I., S.U. Nussbaumer, F. Hüsler, and M. Zemp. 2019: Worldwide Assessment of National Glacier Monitoring and Future Perspectives. Mountain Research and Development, 39, doi.org/10.1659/MRD-JOURNAL-D-19-00021.1
Haeberli, W. and M. Beniston. 1998: Climate Change and its Impacts on Glaciers and Permafrost in the Alps. Ambio, 27, 258-265.
Haeberli, W., J. Cihlar and R. Barry, R. 2000: Glacier monitoring within the Global Climate Observing System. Annals of Glaciology, 31, 241-246, doi:10.3189/17275640078182019
Haeberli, W. and C. Wilfried. 2015: Snow and Ice-Related Hazards, Risks, and Disasters, doi:10.1016/B978-0-12-394849-6.00001-9.
Hock, R., A. Bliss and B Marzeion et al. 2019: GlacierMIP – A model intercomparison of global-scale glacier mass-balance models and projections. Journal of Glaciology, 65(251), 453-467, doi:10.1017/jog.2019.22
Huss, M. and R. Hock. 2018: Global-scale hydrological response to future glacier mass loss. Nature Climate Change, 8, 135–140. https://doi.org/10.1038/s41558-017-0049-x
Marzeion, B and J. G. Cogley, K. Richter and D. Parkes, 2014: Science, 345(6199), 919-921, doi: 10.1126/science.1254702
Marzeion, B., R. Hock, B. Anderson, A. Bliss, N. Champollion, K. Fujita, M. Huss, W. W. Immerzeel, P. Kraaijenbrink, J. H. Malles, F. Maussion, V. Radić, D. R. Rounce, A. Sakai, S. Shannon, R. Wal and H. Zekollari. 2020: Partitioning the uncertainty of ensemble projections of global glacier mass change. Earth’s Future, 8, doi.org/10.1029/2019EF001470
Randolph Glacier Inventory 6.0, doi.org/10.7265/N5-RGI-60
Zemp M., H. Frey, I. Gärtner-Roer, S.U. Nussbaumer, M. Hoelzle, F. Paul et al. 2015: Historically unprecedented global glacier decline in the early 21st century. Journal of Glaciology. Cambridge University Press; 61(228):745–62, doi: 10.3189/2015JoG15J017
Zemp, M., M. Huss, N.Eckert, E. Thibert, F. Paul, S.U. Nussbaumer and I. Gärtner-Roer. 2020: Brief communication: Ad hoc estimation of glacier contributions to sea-level rise from the latest glaciological observations. The Cryosphere, 14(3), 1043-1050, doi.org/10.5194/tc-14-1043-2020
Zemp, M., M. Huss, E. Thibert et al. 2019: Global glacier mass changes and their contributions to sea-level rise from 1961 to 2016. Nature, 568, 382–386, doi.org/10.1038/s41586-019-1071-0
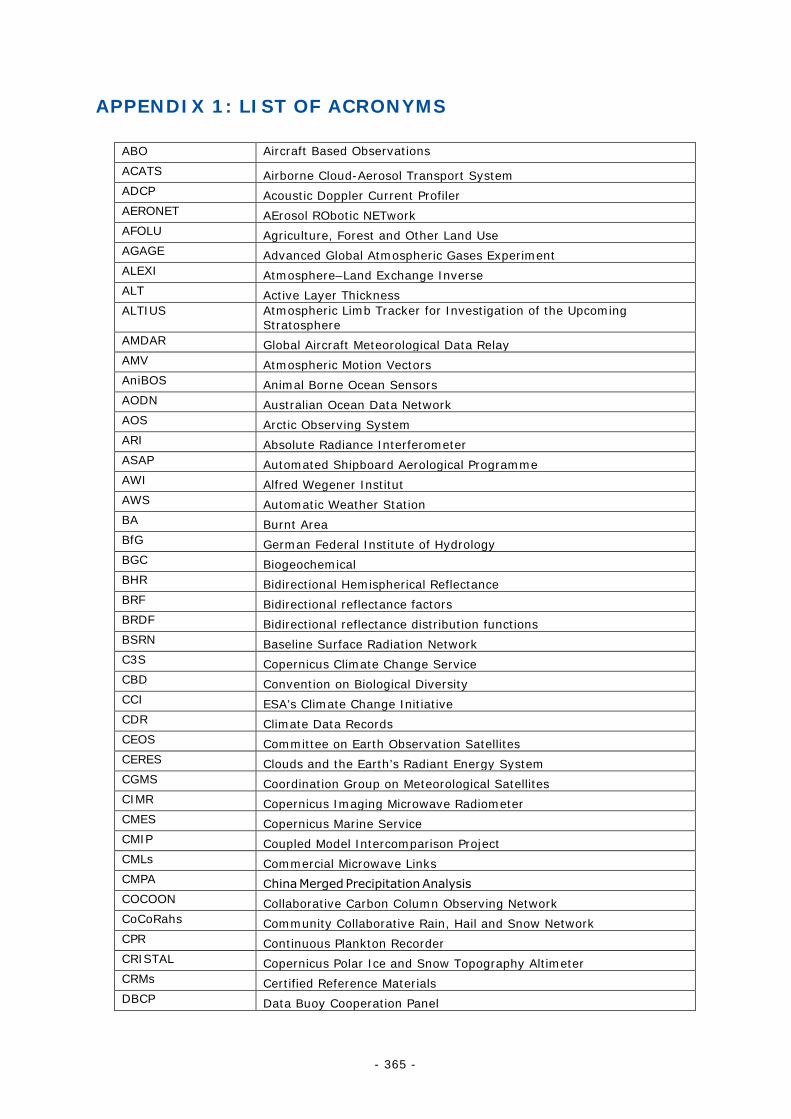
- 365 -
APPENDIX 1: LIST OF ACRONYMS
ABO Aircraft Based Observations ACATS Airborne Cloud-Aerosol Transport System ADCP Acoustic Doppler Current Profiler AERONET AErosol RObotic NETwork AFOLU Agriculture, Forest and Other Land Use AGAGE Advanced Global Atmospheric Gases Experiment ALEXI Atmosphere–Land Exchange Inverse ALT Active Layer Thickness ALTIUS Atmospheric Limb Tracker for Investigation of the Upcoming
Stratosphere AMDAR Global Aircraft Meteorological Data Relay AMV Atmospheric Motion Vectors AniBOS Animal Borne Ocean Sensors AODN Australian Ocean Data Network AOS Arctic Observing System ARI Absolute Radiance Interferometer ASAP Automated Shipboard Aerological Programme AWI Alfred Wegener Institut AWS Automatic Weather Station BA Burnt Area BfG German Federal Institute of Hydrology BGC Biogeochemical BHR Bidirectional Hemispherical Reflectance BRF Bidirectional reflectance factors BRDF Bidirectional reflectance distribution functions BSRN Baseline Surface Radiation Network C3S Copernicus Climate Change Service CBD Convention on Biological Diversity CCI ESA’s Climate Change Initiative CDR Climate Data Records CEOS Committee on Earth Observation Satellites CERES Clouds and the Earth’s Radiant Energy System CGMS Coordination Group on Meteorological Satellites CIMR Copernicus Imaging Microwave Radiometer CMES Copernicus Marine Service CMIP Coupled Model Intercomparison Project CMLs Commercial Microwave Links CMPA China Merged Precipitation Analysis COCOON Collaborative Carbon Column Observing Network CoCoRahs Community Collaborative Rain, Hail and Snow Network CPR Continuous Plankton Recorder CRISTAL Copernicus Polar Ice and Snow Topography Altimeter CRMs Certified Reference Materials DBCP Data Buoy Cooperation Panel
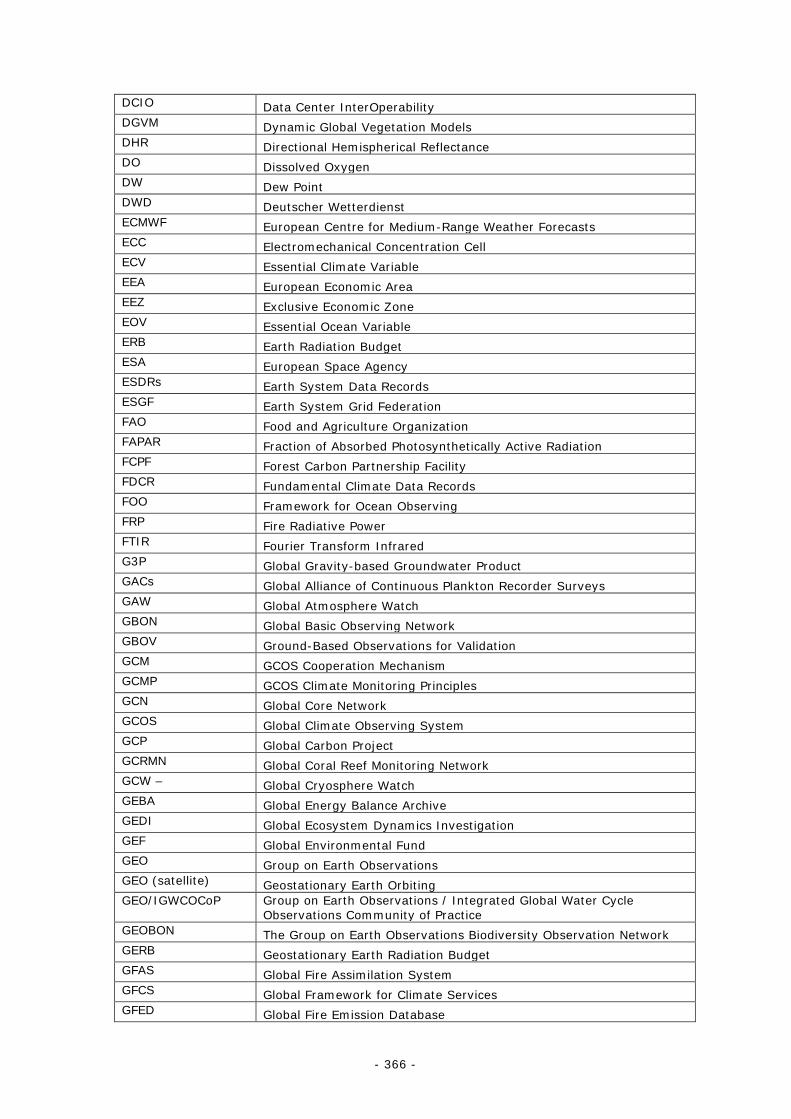
- 366 -
DCIO Data Center InterOperability DGVM Dynamic Global Vegetation Models DHR Directional Hemispherical Reflectance DO Dissolved Oxygen DW Dew Point DWD Deutscher Wetterdienst ECMWF European Centre for Medium-Range Weather Forecasts ECC Electromechanical Concentration Cell ECV Essential Climate Variable EEA European Economic Area EEZ Exclusive Economic Zone EOV Essential Ocean Variable ERB Earth Radiation Budget ESA European Space Agency ESDRs Earth System Data Records ESGF Earth System Grid Federation FAO Food and Agriculture Organization FAPAR Fraction of Absorbed Photosynthetically Active Radiation FCPF Forest Carbon Partnership Facility FDCR Fundamental Climate Data Records FOO Framework for Ocean Observing FRP Fire Radiative Power FTIR Fourier Transform Infrared G3P Global Gravity-based Groundwater Product GACs Global Alliance of Continuous Plankton Recorder Surveys GAW Global Atmosphere Watch GBON Global Basic Observing Network GBOV Ground-Based Observations for Validation GCM GCOS Cooperation Mechanism GCMP GCOS Climate Monitoring Principles GCN Global Core Network GCOS Global Climate Observing System GCP Global Carbon Project GCRMN Global Coral Reef Monitoring Network GCW – Global Cryosphere Watch GEBA Global Energy Balance Archive GEDI Global Ecosystem Dynamics Investigation GEF Global Environmental Fund GEO Group on Earth Observations GEO (satellite) Geostationary Earth Orbiting GEO/IGWCOCoP Group on Earth Observations / Integrated Global Water Cycle
Observations Community of Practice GEOBON The Group on Earth Observations Biodiversity Observation Network GERB Geostationary Earth Radiation Budget GFAS Global Fire Assimilation System GFCS Global Framework for Climate Services GFED Global Fire Emission Database
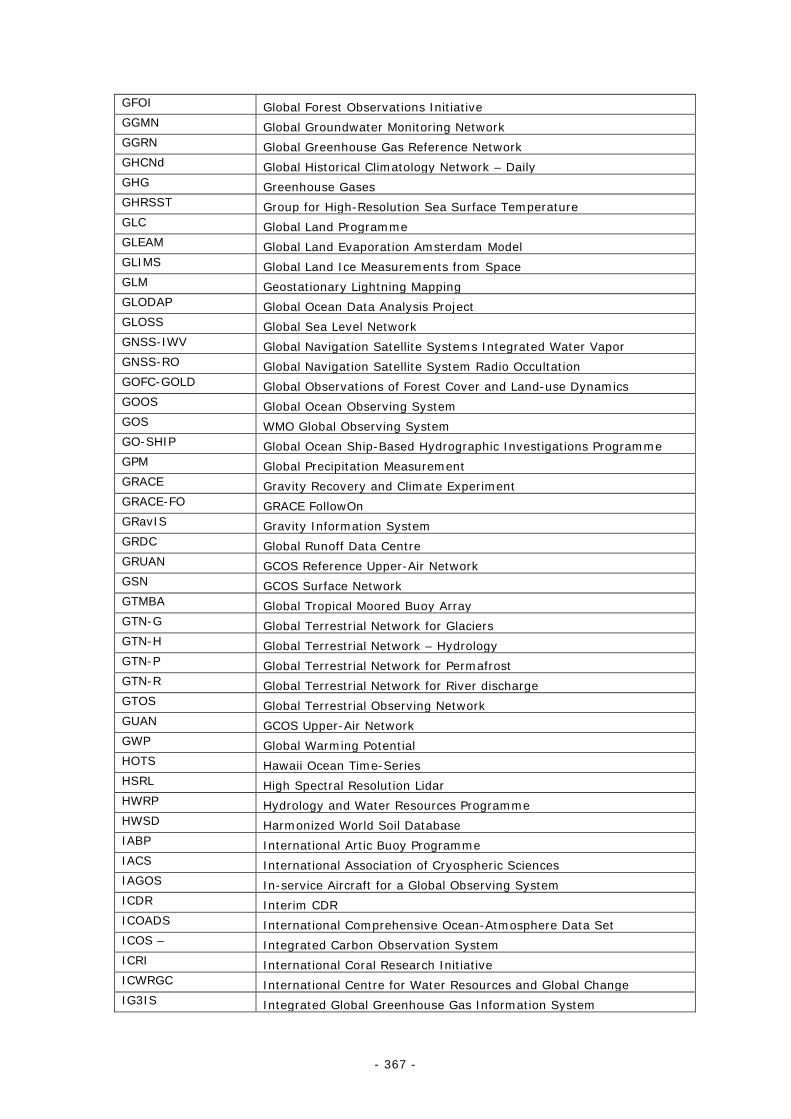
- 367 -
GFOI Global Forest Observations Initiative GGMN Global Groundwater Monitoring Network GGRN Global Greenhouse Gas Reference Network GHCNd Global Historical Climatology Network – Daily GHG Greenhouse Gases GHRSST Group for High-Resolution Sea Surface Temperature GLC Global Land Programme GLEAM Global Land Evaporation Amsterdam Model GLIMS Global Land Ice Measurements from Space GLM Geostationary Lightning Mapping GLODAP Global Ocean Data Analysis Project GLOSS Global Sea Level Network GNSS-IWV Global Navigation Satellite Systems Integrated Water Vapor GNSS-RO Global Navigation Satellite System Radio Occultation GOFC-GOLD Global Observations of Forest Cover and Land-use Dynamics GOOS Global Ocean Observing System GOS WMO Global Observing System GO-SHIP Global Ocean Ship-Based Hydrographic Investigations Programme GPM Global Precipitation Measurement GRACE Gravity Recovery and Climate Experiment GRACE-FO GRACE FollowOn GRavIS Gravity Information System GRDC Global Runoff Data Centre GRUAN GCOS Reference Upper-Air Network GSN GCOS Surface Network GTMBA Global Tropical Moored Buoy Array GTN-G Global Terrestrial Network for Glaciers GTN-H Global Terrestrial Network – Hydrology GTN-P Global Terrestrial Network for Permafrost GTN-R Global Terrestrial Network for River discharge GTOS Global Terrestrial Observing Network GUAN GCOS Upper-Air Network GWP Global Warming Potential HOTS Hawaii Ocean Time-Series HSRL High Spectral Resolution Lidar HWRP Hydrology and Water Resources Programme HWSD Harmonized World Soil Database IABP International Artic Buoy Programme IACS International Association of Cryospheric Sciences IAGOS In-service Aircraft for a Global Observing System ICDR Interim CDR ICOADS International Comprehensive Ocean-Atmosphere Data Set ICOS – Integrated Carbon Observation System ICRI International Coral Research Initiative ICWRGC International Centre for Water Resources and Global Change IG3IS Integrated Global Greenhouse Gas Information System
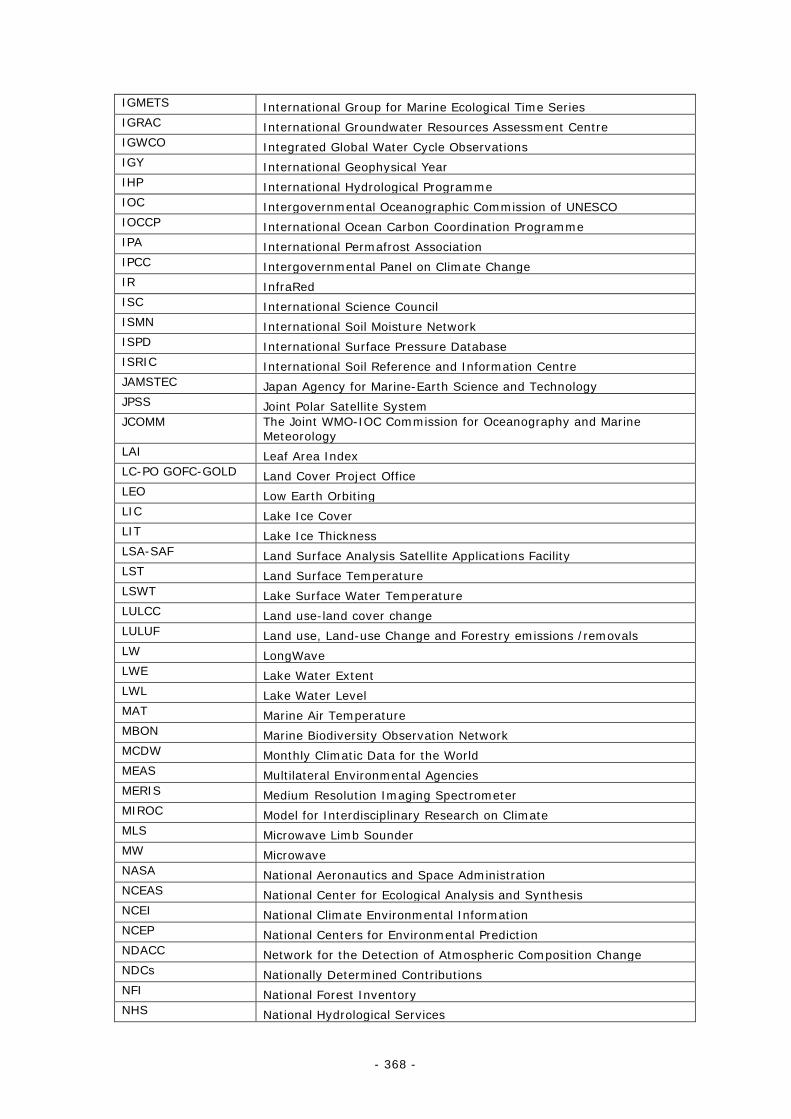
- 368 -
IGMETS International Group for Marine Ecological Time Series IGRAC International Groundwater Resources Assessment Centre IGWCO Integrated Global Water Cycle Observations IGY International Geophysical Year IHP International Hydrological Programme IOC Intergovernmental Oceanographic Commission of UNESCO IOCCP International Ocean Carbon Coordination Programme IPA International Permafrost Association IPCC Intergovernmental Panel on Climate Change IR InfraRed ISC International Science Council ISMN International Soil Moisture Network ISPD International Surface Pressure Database ISRIC International Soil Reference and Information Centre JAMSTEC Japan Agency for Marine-Earth Science and Technology JPSS Joint Polar Satellite System JCOMM The Joint WMO-IOC Commission for Oceanography and Marine
Meteorology LAI Leaf Area Index LC-PO GOFC-GOLD Land Cover Project Office LEO Low Earth Orbiting LIC Lake Ice Cover LIT Lake Ice Thickness LSA-SAF Land Surface Analysis Satellite Applications Facility LST Land Surface Temperature LSWT Lake Surface Water Temperature LULCC Land use-land cover change LULUF Land use, Land-use Change and Forestry emissions /removals LW LongWave LWE Lake Water Extent LWL Lake Water Level MAT Marine Air Temperature MBON Marine Biodiversity Observation Network MCDW Monthly Climatic Data for the World MEAS Multilateral Environmental Agencies MERIS Medium Resolution Imaging Spectrometer MIROC Model for Interdisciplinary Research on Climate MLS Microwave Limb Sounder MW Microwave NASA National Aeronautics and Space Administration NCEAS National Center for Ecological Analysis and Synthesis NCEI National Climate Environmental Information NCEP National Centers for Environmental Prediction NDACC Network for the Detection of Atmospheric Composition Change NDCs Nationally Determined Contributions NFI National Forest Inventory NHS National Hydrological Services
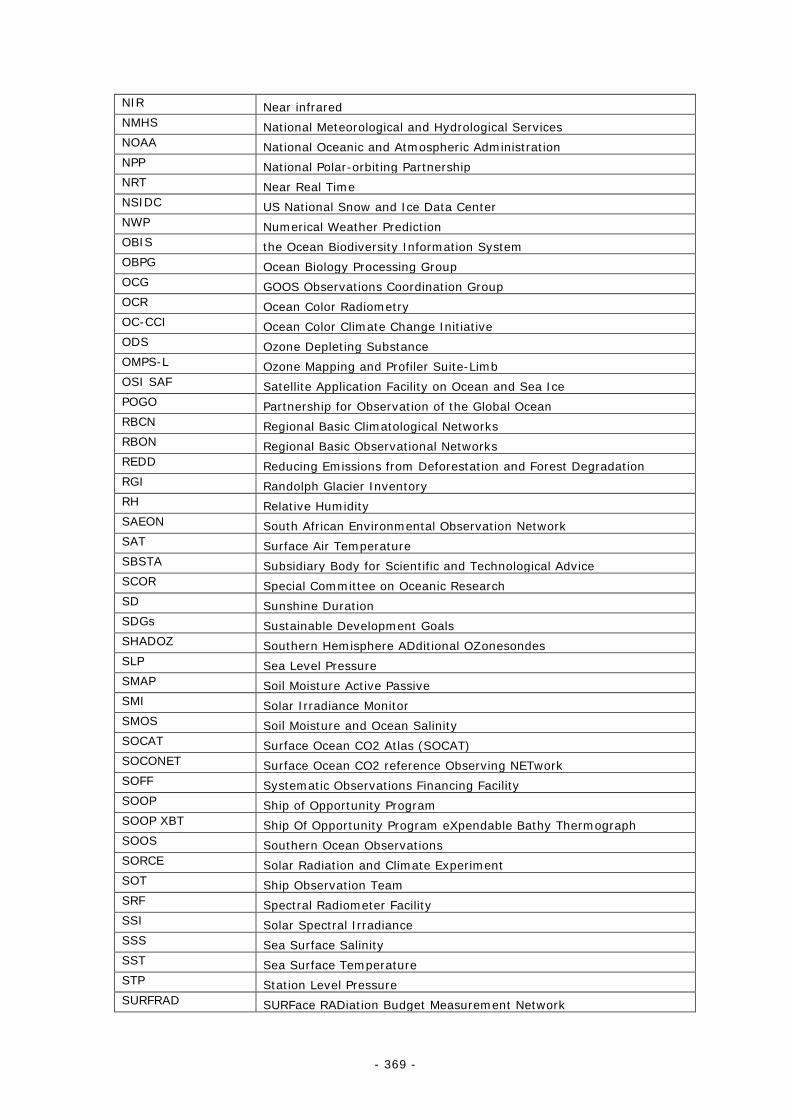
- 369 -
NIR Near infrared NMHS National Meteorological and Hydrological Services NOAA National Oceanic and Atmospheric Administration NPP National Polar-orbiting Partnership NRT Near Real Time NSIDC US National Snow and Ice Data Center NWP Numerical Weather Prediction OBIS the Ocean Biodiversity Information System OBPG Ocean Biology Processing Group OCG GOOS Observations Coordination Group OCR Ocean Color Radiometry OC-CCI Ocean Color Climate Change Initiative ODS Ozone Depleting Substance OMPS-L Ozone Mapping and Profiler Suite-Limb OSI SAF Satellite Application Facility on Ocean and Sea Ice POGO Partnership for Observation of the Global Ocean RBCN Regional Basic Climatological Networks RBON Regional Basic Observational Networks REDD Reducing Emissions from Deforestation and Forest Degradation RGI Randolph Glacier Inventory RH Relative Humidity SAEON South African Environmental Observation Network SAT Surface Air Temperature SBSTA Subsidiary Body for Scientific and Technological Advice SCOR Special Committee on Oceanic Research SD Sunshine Duration SDGs Sustainable Development Goals SHADOZ Southern Hemisphere ADditional OZonesondes SLP Sea Level Pressure SMAP Soil Moisture Active Passive SMI Solar Irradiance Monitor SMOS Soil Moisture and Ocean Salinity SOCAT Surface Ocean CO2 Atlas (SOCAT) SOCONET Surface Ocean CO2 reference Observing NETwork SOFF Systematic Observations Financing Facility SOOP Ship of Opportunity Program SOOP XBT Ship Of Opportunity Program eXpendable Bathy Thermograph SOOS Southern Ocean Observations SORCE Solar Radiation and Climate Experiment SOT Ship Observation Team SRF Spectral Radiometer Facility SSI Solar Spectral Irradiance SSS Sea Surface Salinity SST Sea Surface Temperature STP Station Level Pressure SURFRAD SURFace RADiation Budget Measurement Network
- 370 -
SW ShortWave SWH Significant Wave Height SWOT Surface Water and Ocean Topography TCCON Total Carbon Column Observing Network TOAR Tropospheric Ozone Assessment Report TROPOMI TROPOspheric Monitoring Instrument TSIS Total and Spectral Solar Irradiance Sensor TSP Thermal State of Permafrost TTLOCA Task Team on Lightning Observations for Climate Applications ULS Upward Looking Sonar UNEP United Nations Environment Programme UNESCO IHP United Nations Educational, Scientific and Cultural Organization
Intergovernmental Hydrological Programme UNFCCC United Nations Framework Convention on Climate Change UTLS Upper Troposphere Lower Stratosphere UV Ultraviolet VOS Voluntary Observing Ship Scheme WCMC World Conservation Monitoring Centre WCRP World Climate Research Programme WDCGG WMO World Data Centre for Greenhouse Gases WDCRG WMO World Data Centre for Reactive Gases WGClimate Joint Working Group on Climate WGMS World Glacier Monitoring Service WIGOS WMO Integrated Global Observing System WIS WMO Information System WMO GTS Global Telecommunications System WMO OSCAR WMO Observing Systems Capability Analysis and Review Tool WMO World Meteorological Organization WOUDC World Ozone and Ultraviolet Radiation Data Centre WRDC World Radiation Data Center WRMC World Radiation Monitoring Center WWW/GOS World Weather Watch/Global Observing System
- 371 -
APPENDIX 2: REFERENCES (This Appendix contains references for Chapters 1-7. Annexes A-C have their own lists of references.)
Beck, H. E., E.F. Wood, T.R. McVicar, M. Zambrano-Bigiarini, C. Alvarez-Garreton, O.M. Baez-Villanueva, J. Sheffield, and D.N. Karger, 2020: Bias Correction of Global High-Resolution Precipitation Climatologies Using Streamflow Observations from 9372 Catchments. Journal of Climate, 33(4); 1299-1315. https://doi.org/10.1175/JCLI-D-19-0332.1
Brönnimann S., O. Martius, C. Rohr, D.N. Bresch and K.E. Lin, 2019: Historical weather data for climate risk assessment. Ann N Y Acad Sci.,1436(1):121-137. 10.1111/nyas.13966
Cheng, L., J. Abraham, J. Zhu, K. E. Trenberth, J. Fasullo, T. Boyer, R. Locarnini, B. Zhang, F. Yu, L. Wan, X. Chen, X. Song, Y. Liu an M. E. Mann, 2020: Record-Setting Ocean Warmth Continued in 2019. Adv. Atmos. Sci. 37, 137–142. https://doi.org/10.1007/s00376-020-9283-7
Crisp D., H. Dolman, T. Tanhua, G.A. McKinley, J. Hauck, S. Eggleston and V. Aich: How Well Do We Understand the Land-Ocean-Atmosphere Carbon Cycle? (in preparation) https://doi.org/10.1002/essoar.10506293.1
Dorigo, W., S. Dietrich, F. Aires, L. Brocca, S. Carter, J. Cretaux, D. Dunkerley, H. Enomoto, R. Forsberg, A. Güntner, M. I. Hegglin, R. Hollmann, D.F. Hurst, DJ.A. Johannessen, C. Kummerow, T. Lee, K. Luojus, U. Looser, D.G. Miralles, V. Pellet, T. Recknagel, C. Ruz Vargas, U. Schneider, P. Schoeneich, M. Schröder, N. Tapper, V. Vuglinsky, W. Wagner, L. Yu, L. Zappa, M. Zemp and V. Aich, 2021: Closing the water cycle from observations across scales: Where do we stand? Bulletin of the American Meteorological Society (published online ahead of print 2021). https://doi.org/10.1175/BAMS-D-19-0316.1
Dowell M., P. Lecomte, R. Husband, J. Schulz, T. Mohr, Y. Tahara, R. Eckman, E. Lindstrom, C. Wooldridge, S. Hilding, J.Bates, B. Ryan, J. Lafeuille, and S. Bojinski, 2013: Strategy Towards an Architecture for Climate Monitoring from Space. Pp. 39. This report is available from: www.ceos.org; www.wmo.int/sat; http://www.cgms-info.org/
Frederikse, T., F. Landerer, L. Caron, S. Adhikari, D. Parkes, V. W. Humphrey, S. Dangendorf, P. Hogarth, L.Zanna, L. Cheng and Y.-H. Wu, 2020: The causes of sea-level rise since 1900. Nature 584, 393–397. https://doi.org/10.1175/BAMS-D-19-0316.1
Frey, M., M. K. Sha, F.Hase, M. Kiel, T. Blumenstock, R. Harig, G. Surawicz, N. M. Deutscher, K. Shiomi, J. E. Franklin, H. Bösch, J. Chen, M. Grutter, H. Ohyama, Y. Sun, A. Butz, G. M. Tsidu, D. Ene, D. Wunch, Z. Cao, O. Garcia, M. Ramonet, F. Vogel, and J. Orphal, 2019: Building the COllaborative Carbon Column Observing Network (COCCON): long-term stability and ensemble performance of the EM27/SUN Fourier transform spectrometer. Atmos. Meas. Tech., 12, 1513–1530. https://doi.org/10.5194/amt-12-1513-2019
Friedlingstein P., M.W.Jones, M. O’Sullivan, R.M. Andrew, J. Hauck, G. P. Peters, W. Peters, J. Pongratz, S. Sitch, C. Le Quéré, D. C. E. Bakker, J. G. Canadell, P. Ciais, R. B.
- 372 -
Jackson, P. Anthoni, L. Barbero, A. Bastos, V. Bastrikov, M. Becker, L. Bopp, E. Buitenhuis, N. Chandra, F. Chevallier, L. P. Chini, K.I. Currie, R. A. Feely, M. Gehlen, D. Gilfillan, T. Gkritzalis, D. S. Goll, N. Gruber, S. Gutekunst, I. Harris, V. Haverd, R. A. Houghton, G. Hurtt, T. Ilyina, A. K. Jain, E. Joetzjer, J. O. Kaplan, E. Kato, K. Goldewijk, J.I. Korsbakken, P. Landschützer, S. K. Lauvset, N. Lefèvre, A. Lenton, S. Lienert, D. Lombardozzi, G. Marland, P. C. McGuire, J. R. Melton, N. Metzl, D. R. Munro, J. E. M. S. Nabel, S-I Nakaoka, C. Neill, A. M. Omar,T. Ono, A. Peregon, D. Pierrot, B. Poulter, G. Rehder, L. Resplandy, E. Robertson, C. Rödenbeck, R. Séférian, J. Schwinger, N. Smith, P.P. Tans, H. Tian, B. Tilbrook, F. N. Tubiello, G. R. van der Werf, A. J. Wiltshire and S. Zaehlem 2019: Global Carbon Budget 2019. Earth Syst. Sci. Data, 11, 1783–1838, 2019. https://doi.org/10.5194/essd-11-1783-2019
Friedlingstein, P., M. O'Sullivan, M. W. Jones, R. M. Andrew, J. Hauck, A. Olsen,G. P. Peters, W. Peters, J. Pongratz, S. Sitch, C. Le Quéré, J. G. Canadell, P. Ciais, R. B. Jackson, S. Alin, L. E. O. C. Aragão, A. Arneth, V. Arora, N. R. Bates, M. Becker, A. Benoit-Cattin, H. C. Bittig, L. Bopp, S. Bultan, N. Chandra, F. Chevallier, L. P. Chini, W. Evans, L. Florentie, P. M. Forster, T. Gasser, M. Gehlen, D. Gilfillan, T. Gkritzalis, L. Gregor, N. Gruber, I. Harris, K. Hartung, V. Haverd, R. A. Houghton, T. Ilyina, A.l K. Jain, E. Joetzjer, K. Kadono, Ei. Kato, V. Kitidis, J. I. Korsbakken, P. Landschützer, N. Lefèvre, A. Lenton, S. Lienert, Z. Liu, D. Lombardozzi, G. Marland, N. Metzl, D. R. Munro, J. E. M. S. Nabel, S.-I. Nakaoka, Y. Niwa, K. O'Brien, T. Ono, P. I. Palmer, D. Pierrot, B. Poulter, L. Resplandy, E. Robertson, C. Rödenbeck, J. Schwinger, R. Séférian, I. Skjelvan, A. J. P. Smith, A. J. Sutton, T. Tanhua, P. P. Tans, H. Tian, B. Tilbrook, G. van der Werf, N. Vuichard, A. P. Walker, R. Wanninkhof, A. J. Watson, D. Willis, A. J. Wiltshire, W. Yuan, X. Yue and S. Zaehle, 2020: Global Carbon Budget 2020. Earth Syst. Sci. Data, 12, 3269–3340, 2020. https://doi.org/10.5194/essd-12-3269-2020
GCOS-195: Status of the Global Observing System for Climate, World Meteorological Organization (WMO) WMO, 2015. https://library.wmo.int/doc_num.php?explnum_id=7213
GCOS-200: The Global Observing System for Climate: Implementation Needs, World Meteorological Organization (WMO) WMO, 2016. https://library.wmo.int/doc_num.php?explnum_id=3417
GCOS-223. Weather Radar Data Requirements for Climate Monitoring, 2019. https://library.wmo.int/doc_num.php?explnum_id=6260
GCOS-226: GCOS Surface Reference Network (GSRN): Justification, requirements, siting and instrumentation options, February 2019. https://library.wmo.int/doc_num.php?explnum_id=6261
GCOS-227: Lightning for Climate. A Study by the Task Team on Lightning Observation For Climate Applications (TT-LOCA) Of the Atmospheric Observation Panel for Climate (AOPC), 2019. https://library.wmo.int/doc_num.php?explnum_id=6262
Giri,C., E. Ochieng, L. L. Tieszen, Z. Zhu, A. Singh, T. Loveland, J. Masek and N. Duke, 2010: Status and distribution of mangrove forests of the world using earth observation satellite data. Goblal Ecology and Biogeography, volume 20, issue1, January 2011. Pages 154-159. https://doi.org/10.1111/j.1466-8238.2010.00584.x
- 373 -
Hays, G. C., T. Alcoverro, M. J.A. Christianen Marjolijn, C.M. Duarte, M. Hamann, P.I. Macreadie, H.D.Marsh, M.A. Rasheed, M. Thums, R.F.K. Unsworth, P.H. York and N. Esteban, 2018: New Tools to Identify the Location of Seagrass Meadows: Marine Grazers as Habitat Indicators. Frontiers in Marine Science, 5. https://doi.org/10.3389/fmars.2018.00009
Hirschi M. and S. I. Seneviratne, 2017: Basin-scale water-balance dataset (BSWB): an update. Earth Syst. Sci. Data, 9, 251–258. https://doi.org/10.5194/essd-9-251-2017
IPCC, 2014: Summary for policymakers. In: Climate Change 2014: Impacts, Adaptation, and Vulnerability. Part A: Global and Sectoral Aspects. Contribution of Working Group II to the Fifth Assessment Report of the Intergovernmental Panel on Climate Change [Field, C.B., V.R. Barros, D.J. Dokken, K.J. Mach, M.D. Mastrandrea, T.E. Bilir, M. Chatterjee, K.L. Ebi, Y.O. Estrada, R.C. Genova, B. Girma, E.S. Kissel, A.N. Levy, S. MacCracken, P.R. Mastrandrea, and L.L.White (eds.)]. Cambridge University Press, Cambridge, United Kingdom and New York, NY, USA, pp. 1-32. https://www.ipcc.ch/report/ar5/wg2/
IPCC, 2018: Global Warming of 1.5°C. An IPCC Special Report on the impacts of global warming of 1.5°C above pre-industrial levels and related global greenhouse gas emission pathways, in the context of strengthening the global response to the threat of climate change, sustainable development, and efforts to eradicate poverty. In Press. https://www.ipcc.ch/site/assets/uploads/sites/2/2019/06/SR15_Full_Report_High_Res.pdf
IPCC, 2019: Climate Change and Land: an IPCC special report on climate change, desertification, land degradation, sustainable land management, food security, and greenhouse gas fluxes in terrestrial ecosystems. https://www.ipcc.ch/report/srccl/
IPCC, 2019: IPCC Special Report on the Ocean and Cryosphere in a Changing Climate. https://www.ipcc.ch/srocc/
Janssens-Maenhout, G., B. Pinty, M. Dowell, H. Zunker, E. Andersson, G. Balsamo, J.-L. Bézy, T. Brunhes, H. Bösch, B. Bojkov, D. Brunner, M. Buchwitz, D. Crisp, P. Ciais, P. Counet, D. Dee, H. Denier van der Gon, H.Dolman, M.R. Drinkwater, O. Dubovik, R. Engelen, T. Fehr, V. Fernandez, M. Heimann, K. Holmlund, S. Houweling, R. Husband, O. Juvyns, A. Kentarchos, J. Landgraf, R. Lang, A: Löscher, J. Marshall, Y. Meijer, M. Nakajima, P.I. Palmer, P. Peylin, P. Rayner, M. Scholze, B Sierk, J. Tamminen, and P. Veefkind, 2020: Toward an Operational Anthropogenic CO2 Emissions Monitoring and Verification Support Capacity, Bulletin of the American Meteorological Society, 101(8), E1439-E1451. https://doi.org/10.1175/BAMS-D-19-0017.1
L’Ecuyer, T. S., H.K. Beaudoing, M. Rodell, W. Olson, B. Lin, S. Kato, C.A: Clayson, E. Wood, J. Sheffield, R. Adler, G. Huffman, M. Bosilovich, G. Gu, F. Robertson, P.R. Houser, D. Chambers, J.S. Famiglietti, E. Fetzer, W.T. Liu, X. Gao, C.A. Schlosser, E. Clark, D.P. Lettenmaier and K. Hilburn, 2015: The Observed State of the Energy Budget in the Early Twenty-First Century, Journal of Climate, 28(21), 8319-8346. https://doi.org/10.1175/JCLI-D-14-00556.1
Le Quéré, C., J.I. Korsbakken, C. Wilson, J. Tosun, R. Andrew, R. J. Andres, J. G. Canadell, A. Jordan, G. P. Peters and D. P. van Vuuren, 2019: Drivers of declining CO2 emissions in 18 developed economies. Nat. Clim. Chang. 9, 213–217. https://doi.org/10.1038/s41558-019-0419-7
- 374 -
Li X., M. Ting, Y. You, D.-E. Lee, D. M. Westervelt and Y. Ming, 2020: South Asian Summer Monsoon Response to Aerosol-Forced Sea Surface Temperatures. Geophysical Research Letters. https://doi.org/10.1029/2019GL085329
Lin D., J. Crabtree, I. Dillo, R. R. Downs, R. Edmunds, D. Giaretta, M. De Giusti, H. L’Hours, W. Hugo, R. Jenkyns, V. Khodiyar, M. E. Martone, M. Mokrane, V. Navale, J. Petters, B. Sierman, D. V. Sokolova, M. Stockhause and J. Westbrook, 2020: The TRUST Principles for digital repositories. Sci Data 7, 144. https://doi.org/10.1038/s41597-020-0486-7
National Academies of Sciences, Engineering, and Medicine. 2017: Sustaining Ocean Observations to Understand Future Changes in Earth’s Climate. Washington, DC. The National Academies Press. https://doi.org/10.17226/24919
Pellet V., F. Aires, S. Munier, D. F. Prieto, G. Jordá, W. A. Dorigo, J. Polcher, and L. Brocca, 2019: Integrating multiple satellite observations into a coherent dataset to monitor the full water cycle – application to the Mediterranean region, Hydrol. Earth Syst. Sci., 23, 465–491. https://doi.org/10.5194/hess-23-465-2019
Ramo, R., E. Roteta, I. Bistinas, D. van Wees, A. Bastarrika, E. Chuvieco. Qnd G.R. van der Werf, 2021: African burned area and fire carbon emissions are strongly impacted by small fires undetected by coarse resolution satellite data. Proceedings of the National Academy of Sciences, 118, e2011160118.
Rodell, M., H.K. Beaudoing, T.S. L’Ecuyer, W. S. Olson, J. S. Famiglietti, P.R. Houser, R. Adler, M.G. Bosilovich, C.A. Clayson, D. Chambers, E. Clark, E.J. Fetzer, X. Gao, G. Gu, K. Hilburn, G.J. Huffman, D.P. Lettenmaier, W.T. Liu, F.R. Robertson, C.A. Schlosser, J. Sheffield and E.F. Wood, E. F., 2015: The Observed State of the Water Cycle in the Early Twenty-First Century, Journal of Climate, 28(21), 8289-8318. https://doi.org/10.1175/JCLI-D-14-00555.1
Ryan, C., C. Duffy, C. Broderick, P.W. Thorne, M. Curley, S. Walsh, C. Daly, M. Treanor and C. Murphy, 2018: Integrating Data Rescue into the Classroom, Bulletin of the American Meteorological Society, 99(9), 1757-1764. https://doi.org/10.1175/BAMS-D-17-0147.1
Slater T., I. R. Lawrence, I. N. Otosaka, A. Shepherd, Gourmelen, L. Jakob, P. Tepes, L. Gilbert, and P. Nienow, 2021: Review article: Earth’s ice imbalance. The Cryosphere, 15, 233–246. https://doi.org/10.5194/tc-15-233-2021
Sahoo A.K., M. Pan, T. J. Troy, R. K. Vinukollu, J. Sheffield, E. F. Wood, 2011: Reconciling the global terrestrial water budget using satellite remote sensing, Remote Sensing of Environment, Volume 115, Issue 8. https://doi.org/10.1016/j.rse.2011.03.009
Saltikoff, E., K. Friedrich, J. Soderholm, K. Lengfeld, B. Nelson, A. Becker, R. Hollmann, B. Urban, M. Heistermann and C. Tassone, 2019: An Overview of Using Weather Radar for Climatological Studies: Successes, Challenges, and Potential, Bulletin of the American Meteorological Society, 100(9), 1739-1752. https://doi.org/10.1175/BAMS-D-18-0166.1
- 375 -
Stephens, G., J. Li, M. Wild, C.A.Clayson, N. Loeb, S. Kato, T. l’Ecuyer, P.W.Stackhouse Jr, M. Lebsock and T. Andrews, 2012: An update on Earth's energy balance in light of the latest global observations. Nature Geosci 5, 691–696. https://doi.org/10.1038/ngeo1580
Tanhua T., S. Pouliquen, J. Hausman, K. O’Brien, P. Bricher, T. de Bruin, J. J. H. Buck, E. F. Burger, T. Carval, K. S. Casey, S. Diggs, A. Giorgetti, H. Glaves, V. Harscoat, D. Kinkade, J. H. Muelbert, A. Novellino, B. Pfeil, P. L. Pulsifer, A. Van de Putte, E. Robinson, D. Schaap, A. Smirnov, N. Smith, D. Snowden, T. Spears, S. Stall, M. Tacoma, P. Thijsse, S. Tronstad, T. Vandenberghe, M. Wengren, L. Wyborn and Z. Zhao, 2019: Ocean FAIR Data Services. Front. Mar. Sci. https://doi.org/10.3389/fmars.2019.00440
Tanhua, T., S.K. Lauvset, N. Lange, A. Olsen, M. Álvarez, S. Diggs, H.C. Bittig, P.J. Brown, B.R. Carter, L.C. Da Cunha, R.A. Feely, M. Hoppema, M. Ishii, E. Jeansson, A. Kozyr, A. Murata, F.F. Pérez, B. Pfeil, C. Schirnick, R. Steinfeldt, M. Telszewski, B. Tilbrook, A. Velo, R. Wanninkhof, E. Burger, K. O’Brien, R.M. and Key, 2021: A vision for FAIR ocean data products. Communications Earth & Environment 2, 136, doi:10.1038/s43247-021-00209-4.
von Schuckmann, K., M. Palmer, K. Trenberth, A. Cazenave, D. Chambers, N. Champollion, J. Hansen, S. A. Josey, N. Loeb, P.-P. Mathieu, B. Meyssignac and M. Wild, 2016: An imperative to monitor Earth's energy imbalance. Nature Clim Change 6, 138–144. https://doi.org/10.1038/nclimate2876
von Schuckmann, K., L. Cheng, M.D. Palmer, J. Hansen, C. Tassone, V. Aich, S. Adusumilli, H. Beltrami, T. Boyer, F.J. Cuesta-Valero, D. Desbruyères, C. Domingues, A. García-García, P. Gentine, J. Gilson, M. Gorfer, L. Haimberger, M. Ishii, G. C. Johnson, R. Killick, B.A.King, G. Kirchengast, N. Kolodziejczyk, J. Lyman, B. Marzeion, M. Mayer, M. Monier, D.P. Monselesan, S. Purkey, D. Roemmich, A. Schweiger, S.I. Seneviratne, A. Shepherd, D. Slater, A.K. Steiner, F. Straneo, M.-L. Timmermans, M.-L and S.E. Wijffels, 2020: Heat stored in the Earth system: where does the energy go?, Earth Syst. Sci. Data, 12, 2013–2041, https://doi.org/10.5194/essd-12-2013-2020
Wild, M., 2020: The global energy balance as represented in CMIP6 climate models. Clim Dyn 55, 553–577. https://doi.org/10.1007/s00382-020-05282-7
Wilkinson, M., M. Dumontier, I. Aalbersberg, G. Appleton, M. Axton, A. Baak, N. Blomberg, J.-W. Boiten, L. Bonino da Silva Santos, P. E. Bourne, J. Bouwman, A. J. Brookes, T. Clark, M. Crosas, I. Dillo, O. Dumon, S. Edmunds, C. T. Evelo, R. Finkers, A. Gonzalez-Beltran, A. J.G. Gray, P. Groth, C. Goble, J. S. Grethe, J. Heringa, P. A.C ’t Hoen, Rob Hooft, T. Kuhn, R. Kok, J. Kok, S. J. Lusher, M. E. Martone, A. Mons, A. L. Packer, B. Persson, P. Rocca-Serra, M. Roos, R. van Schaik, S.-A. Sansone, E. Schultes, T. Sengstag, T. Slater, G. Strawn, M. A. Swertz, M. Thompson, J. van der Lei, E. van Mulligen, J. Velterop, A. Waagmeester, P. Wittenburg, K. Wolstencroft, J. Zhao and B. Monset, 2016: The FAIR Guiding Principles for scientific data management and stewardship. Sci Data 3, 160018. https://doi.org/10.1038/sdata.2016.18
Witze A., 2018: World’s first wind-mapping satellite set to launch. Nature 560, 420-421. https://doi.org/10.1038/d41586-018-05976-3
WMO, 2019: Vision for the WMO Integrated Global Observing System in 2040. https://library.wmo.int/doc_num.php?explnum_id=10278

- 376 -
- 377 -
APPENDIX 3: ACKNOWLEDGEMENTS AND LIST OF CONTRIBUTORS The contributions from GCOS experts, who provided most of the content to the report, are gratefully acknowledged. Thanks are also due to the participants in GCOS public review, whose comments greatly improved the document. Below is the full list of writing team, editors, contributors and reviewers.
WRITING TEAM Qingchen Chao (GCOS Steering Committee), China Meteorological Administration, China
Albertus Johannes Han Dolman (GCOS Steering Committee Chair), VU University Amsterdam, The Netherlands
Thelma Krug (TOPC Co-Chair), IPCC Vice-Chair, Brazil
Sabrina Speich (OOPC Co-Chair), Ecole Normale Supérieure (Paris), Laboratoire de Météorologie, France
Toste Tanhua, GEOMAR - Helmholtz Centre for Ocean Research, Germany
Peter Thorne (AOPC Co-Chair), National University of Ireland Maynooth, Ireland
Michael Zemp (GCOS Steering Committee), University of Zurich, Switzerland
EDITED BY THE GCOS SECRETARIAT Simon Eggleston, Belén Martín Míguez, Tim Oakley, Anthony Rea, Magaly Robbez, Caterina Tassone
CONTRIBUTORS Alice Andral (TOPC), Centre National d’Etudes Spatiales (LEGOS/CNES), France
Hermann Bange, GEOMAR - Helmholtz Centre for Ocean Research, Germany
Sue Barrell (GCOS Steering Committee), Honorary Affiliate, Bureau of Meteorology, Melbourne, Australia
Lisa Beal (OOPC), University of Miami, United States
Lisandro Benedetti-Cecchi, University of Pisa, Italy
Emmanuel Boss, University of Maine, United States
Chiara Cagnazzo (AOPC), European Centre for Medium-Range Weather Forecasts (ECMWF), United Kingdom
Sarah Carter (TOPC), GOFC-GOLD Wageningen University, The Netherlands
Maria Paz Chidichimo (OOPC), Universidad de Buenos Aires, Argentina
Emilio Chuvieco (TOPC), University of Alcalá, Spain
Jean-Francois Crétaux, National Centre for Space Studies (CNES), France
Meghan Cronin (OOPC), National Oceanic and Atmospheric Administration (NOAA), United States
Kim Currie, National Institute of Water and Atmospheric (NIWA), University of Otago, New Zealand
- 378 -
Stephan Dietrich, Federal Institute of Hydrology (Bundesanstalt für Gewässerkunde, BfG), Germany
Wöuter Dorigo, Vienna University of Technology, Austria
Emmett Duffy, Smithsonian’s Tennenbaum Marine Observatories Network, United States
Imke Durre (AOPC), National Oceanic and Atmospheric Administration (NOAA)/National Centers for Environmental Information (NCEI), United States
Hiroyuki Enomoto (TOPC), National Institute of Polar Research (NIPR), Japan
Véronique Garçon, Centre National d’Etudes Spatiales (LEGOS/CNES), France
Darren John Ghent (TOPC), University of Leicester - National Centre for Earth Observation (NCEO), United Kingdom
Nadine Gobron (TOPC), European Commission Joint Research Centre, Italy
Steven J. Goodman, Thunderbolt Global Analytics, United States
Andreas Güntner (TOPC), GFZ German Research Centre For Geosciences, Germany
Maria Hakuba (AOPC), National Aeronautics and Space Administration (NASA) Jet Propulsion Laboratory, United States
Martin Herold (TOPC Co-Chair), GOFC-GOLD. Wageningen University, The Netherlands
Katherine Hill, National Oceanography Centre (NOC), United Kingdom
Rainer Hollmann (AOPC), Deutscher Wetterdienst, Germany
Kenneth Holmlund, World Meteorological Organization, Switzerland
Robert H. Holzworth, University of Washington, United States
Maria Hood, Mercator Océan International, France
Dale F. Hurst (AOPC), NOAA Earth System Research Laboratory, United States
Masao Ishii, Japan Meteorological Agency - Meteorological Research Institute, Japan
Greet Janssens-Maenhout, Directorate-General Joint Research Centre, European Commission, Belgium
Johnny Johannessen (GCOS Steering Committee), Nansen Environmental and Remote Sensing Center, Norway
Philip Jones, University of East Anglia, United Kingdom
Amos Kabo-Bah (GCOS Steering Committee), Department of Energy and Environmental Engineering, UENR, Ghana
Elizabeth Kent (AOPC), University of Southampton Waterfront Campus, United Kingdom
Shinya Kobayashi (AOPC), Japan Meteorological Agency, Japan
Hartwig Kremer (GCOS Steering Committee), UN Environment (UNEP), Kenya
Marjolaine Krug (OOPC), Department of Environment, Forestry and Fisherie, South Africa
Raphael Kudela, University of California, Santa Cruz, Ocean Sciences, United States
Werner Kutsch (TOPC), Intergrated Carbon Observation System (ICOS ERIC), Finland
Paolo Laj, Université Grenoble Alpes, France
- 379 -
Christian Lanconelli, European Commission, Joint Research Centre, Italy
Siv Kari Lauvset, Norwegian Research Centre (NORCE), Norway
Tony Lee (OOPC), NASA Jet Propulsion Laboratory, United States
Huilin Li, Cold and Arid Regions Environmental and Engineering Research Institute, Chinese Academy of Sciences (CAREERI/CAS), China
Dean Lockett, WMO, Switzerland
Ulrich Looser, Federal Institute of Hydrology (BfG), Germany
Diego Miralles (TOPC), Ghent University, Belgium
Frank Muller-Karger, University of South Florida - College of Marine Science, United States
David Obura, Coastal Oceans Research and Development – Indian Ocean (CORDIO), Kenya
Eitarou Oka (OOPC), University of Tokyo, Japan
Peter Oke (OOPC), Commonwealth Scientific and Industrial Research Organisation (CSIRO), Australia
Artur Palacz, International Ocean Carbon Coordination Project (IOCCP), Poland
Matthew Palmer (OOPC), Met Office, United Kingdom
Satya Prakash (OOPC), Indian National Centre for Ocean Information Services, India
Benjamin Rabe (OOPC), Alfred-Wegener-Institut, Germany
Lisa Marie Rebelo, International Water Management Institute, CGIAR, Sri Lanka
Matilde Rusticucci (AOPC), Universidad de Buenos Aires, Argentina
Claudia Andrea Ruz Vargas (TOPC), International Groundwater Resources Assessment Centre (IGRAC), The Netherlands
Sassan Saatchi, Jet Propulsion Laboratory, California Institute of Technology, United States
Philippe Schoeneich, Institut de Géographie Alpine, France
Joerg Schulz, European Organisation for the Exploitation of Meteorological Satellites (EUMETSAT), Germany
Sybil Seitzinger (GCOS Steering Committee), University of Victoria, Sweden
Bernadette Sloyan, Commonwealth Scientific and Industrial Research Organisation (CSIRO), Australia
Nadia Smith (AOPC Co-Chair), Science and Technology Corporation, United States
Youba Sokona (GCOS Steering Committee), Special Advisor on Sustainable Development South Centre, Switzerland
Kazuto Suda (GCOS Steering Committee), Japan Meteorological Agency, Japan
Toshio Suga (GCOS Steering Committee), Tohoku University, Japan
Johanna Tamminen (AOPC), Finnish Meteorological Institute, Finland
Nigel Tapper (TOPC), Monash University, Australia
- 380 -
Maciej Telszewski, International Ocean Carbon Coordination Project (IOCCP), Poland
Albrecht von Bargen, German Aerospace Center (DLR), Germany
Karina Von Schuckman (OOPC), Mercator Océan International, France
Valery Vuglinsky, International Data Centre on the Hydrology of Lakes and Reservoirs (HYDROLARE), The State Hydrological Institute (SHI), Russian Federation
Weidong Yu (OOPC Co-Chair), Center for Ocean and Climate Research, SOA First Institute of Oceanography, China
Markus Ziese, Global Precipitation Climatology Centre (GPCC), Deutscher Wetterdienst, Germany
REVIEWERS Islam Abou El-Magd, National Authority for Remote Sensing and Space Sciences, Egypt
Susana Beatriz Adamo, CIESIN-Columbia University, United States of America
Carolina Adler, Mountain Research Initiative, Switzerland
Igor Appel, Treatment Action Group, United States
Michael Buchwitz, University of Bremen, Institute of Environmental Physics (IUP), Germany
Susanne Burri, ETH Zurich, Switzerland
Nico Caltabiano, World Meteorological Organization, Switzerland
Jean-Christophe Calvet, Centre National de Recherches Météorologiques Université de Toulouse, France
Gerardo Carbajal Benitez, Servicio Meteorológico Naconal, Argentina
Frederic Chevallier, Laboratoire des Sciences du Climat et de l'Environnement (LSCE), France
Owen Cooper, CIRES, University of Colorado Boulder/NOAA CSL, United States
Chris Derksen, Environment and Climate Change Canada, Canada
Leo Ehrnrooth, UK Space Agency, United Kingdom
Atsushi Goto, Japan Meteorological Agency, Japan
Patrick Heimbach, University of Texas at Austin, United States
Klemens Hocke, University of Bern, Switzerland
Rong-Ming Hu, Laboratoire Atmosphères, Observations Spatiales (LATMOS)/Institut Pierre Simon Laplace (IPSL), CNRS, France
Matthias Huss, ETH Zürich, Switzerland
Bruce Ingleby, ECMWF, United Kingdom
Régis Juvanon du Vachat, Retired from Météo France, France
Thomas Lavergne, Norwegian Meteorological Institute, Norway
Stoyka Netcheva, World Meteorological Organization, Switzerland
- 381 -
Artur Palacz, International Ocean Carbon Coordination Project (IOCCP), Poland (on behalf of GOOS Biogeochemistry experts panel)
Xiaoduo Pan, Institute of Tibetan Plateau Research, Chinese Academy of Sciences, China
Frank Paul, University of Zurich, Switzerland
Joanna Post, United Nations Framework Convention on Climate Change, Germany
Nick Rayner, Met Office Hadley Centre, United Kingdom
Roger Saunders, Met Office, United Kingdom
Alexander Scheid, World Meteorological Organization, Switzerland
Adrian Simmons, European Centre for Medium-Range Weather Forecasts (ECMWF), United Kingdom
Martin Steinbacher, Empa, Switzerland
Oksana Tarasova, World Meteorological Organization, Switzerland
Josh Willis, National Aeronautics and Space Administration (NASA) Jet Propulsion Laboratory, United States
Glenn Wolfe, National Aeronautics and Space Administration (NASA), United States
Yijian Zeng, University of Twente, The Netherlands
Related Documents