The Global Burden of Ischemic Stroke Findings of the GBD 2010 Study Derrick A. Bennett*, Rita V. Krishnamurthi y , Suzanne Barker-Collo z , Mohammad H. Forouzanfar x , Mohsen Naghavi x , Myles Connor jj ,{,# , Carlene M. M. Lawes**, Andrew E. Moran yy , Laurie M. Anderson zz , Gregory A. Roth x,xx , George A. Mensah kk , Majid Ezzati {{ , Christopher J. L. Murray x , Valery L. Feigin y , for the Global Burden of Diseases, Injuries, and Risk Factors 2010 Study Stroke Expert Group Oxford, United Kingdom; Auckland, New Zealand; Seattle, WA, USA; Melrose, United Kingdom; Edinburg, United Kingdom; Johannesburg, South Africa; New York, NY, USA; Bethesda, MD, USA; and London, United Kingdom ABSTRACT This study sought to summarize the findings of the GBD 2010 (Global Burden of Diseases, Injuries, and Risk Factors) study for ischemic stroke (IS) and to report the impact of tobacco smoking on IS burden in specific countries. The GBD 2010 searched multiple databases to identify relevant studies published between 1990 and 2010. The GBD 2010 analytical tools were used to calculate region-specific IS incidence, mortality, mortality-to-incidence ratio, and disability-adjusted life years (DALY) lost, including 95% uncertainty intervals (UI). In 2010, there were approximately 11,569,000 incident IS events (63% in low- and middle- income countries [LMIC]), approximately 2,835,000 deaths from IS (57% in LMIC), and approximately 39,389,000 DALY lost due to IS (64% in LMIC). From 1990 to 2010, there was a significant increase in global IS burden in terms of absolute number of people with incident IS (37% increase), deaths from IS (21% increase), and DALY lost due to IS (18% increase). Age-standardized IS incidence, DALY lost, mortality, and mortality-to-incidence ratios in high-income countries declined by about 13% (95% UI: 6% to 18%), 34% (95% UI: 16% to 36%), and 37% (95% UI: 19% to 39%), 21% (95% UI: 10% to 27%), respectively. However, in LMIC there was a modest 6% increase in the age-standardized incidence of IS (95% UI: 7% to 18%) despite modest reductions in mortality rates, DALY lost, and mortality-to- incidence ratios. There was considerable variability among country-specific estimates within broad GBD regions. China, Russia, and India were ranked highest in both 1990 and 2010 for IS deaths attributable to tobacco consumption. Although age-standardized IS mortality rates have declined over the last 2 decades, the absolute global burden of IS is increasing, with the bulk of DALY lost in LMIC. Tobacco consumption is an important modifiable risk factor for IS, and in both 1990 and 2010, the top ranked countries for IS deaths that could be attributed to tobacco consumption were China, Russia, and India. Tobacco control policies that target both smoking initiation and smoking cessation can play an important role in the prevention of IS. In China, Russia, and India, even modest reductions in the number of current smokers could see millions of lives saved due to prevention of IS alone. Evaluating stroke burden by its major pathological subtypes and studying secular trends of stroke subtypes in different regions of the world is important for targeted re- gion- and country-specific stroke prevention and healthcare planning. Ischemic stroke (IS) is the most common subtype worldwide, but there has been little information on the global and regional IS incidence, mortality, disability- adjusted life-years (DALY) lost in high-income countries (HIC) versus in low- and middle-income countries (LMIC). The GBD 2010 (Global Burden of Diseases, Injuries, and Risk Factors) study ranked stroke as the second most common cause of death [1] and the third leading cause of disability in 2010 [2]. The aim of this report is to summarize the key findings of the GBD 2010 study for IS incidence, mortality, mortality-to-incidence (MI) ratio, and DALY lost for IS in 1990 and 2010. Prior GBD 2010 study publications have presented IS estimates by country, age group, and country income category (HIC vs. LMIC) [3]. This report will review region-specific data on incidence, mortality, and DALY lost for IS for the 21 GBD regions. The burden of IS attributable to tobacco, one of the leading preventable risk factors [4] associated with IS was also investigated. METHODS A systematic review was conducted to identify suitable IS and total stroke epidemiological studies for inclusion in the GBD 2010 study. The literature search strategy, selection criteria, and full details of the methodology are reported elsewhere [5,6]. Pathological types of stroke were analyzed only for studies that had computed tomography or The authors report no re- lationships that could be construed as a conflict of interest. The sponsor of the study had no role in the study design, data collection, data analysis, data inter- pretation, or writing of the report. The Writing and GBD Global Analysis Group had access to all data sources and has re- sponsibility for the content of the report and the de- cision to submit for publication. The views expressed in this article are those of the authors and do not neces- sarily represent the views of the National Heart, Lung, and Blood Institute, National Institutes of Health, Department of Health and Human Ser- vices, or any other govern- ment entity. This work was undertaken as a part of the Global Burden of Diseases, In- juries, and Risk Factors 2010 study. The results in this paper are prepared independently of the final estimates of the Global Burden of Diseases, In- juries, and Risk Factors study. GBD Stroke Expert Group members are listed at the end of the paper. From the *Clinical Trial Service Unit and Epidemi- ological Studies Unit, Nuf- field Department of Population Health, Univer- sity of Oxford, Oxford, UK; yFaculty of Health and Environmental Studies, Na- tional Institute for Stroke and Applied Neurosci- ences, AUT University, Auckland, New Zealand; zDepartment of Psychol- ogy, the University of Auckland, Auckland, New Zealand; xInstitute for Health Metrics and Evalua- tion, University of Wash- ington, Seattle, WA, USA; jjNHS Borders, Melrose, UK; {Division of Clinical Neurosciences, University of Edinburgh, Edinburgh, UK; #School of Public Health, University of the Witwatersrand, GLOBAL HEART, VOL. 9, NO. 1, 2014 107 March 2014: 107-112 REVIEW gREVIEW j

Welcome message from author
This document is posted to help you gain knowledge. Please leave a comment to let me know what you think about it! Share it to your friends and learn new things together.
Transcript
REVIEW gREVIEWj
The authors report no re-lationships that could beconstrued as a conflict ofinterest.The sponsor of the studyhad no role in the studydesign, data collection,data analysis, data inter-pretation, or writing of thereport. The Writing andGBD Global Analysis Grouphad access to all datasources and has re-
The Global Burden of Ischemic StrokeFindings of the GBD 2010 Study
Derrick A. Bennett*, Rita V. Krishnamurthiy, Suzanne Barker-Colloz, Mohammad H. Forouzanfarx,Mohsen Naghavix, Myles Connorjj,{,#, Carlene M. M. Lawes**, Andrew E. Moranyy, Laurie M. Andersonzz,Gregory A. Rothx,xx, George A. Mensahkk, Majid Ezzati{{, Christopher J. L. Murrayx, Valery L. Feiginy, for theGlobal Burden of Diseases, Injuries, and Risk Factors 2010 Study Stroke Expert Group
Oxford, United Kingdom; Auckland, New Zealand; Seattle, WA, USA; Melrose, United Kingdom; Edinburg,United Kingdom; Johannesburg, South Africa; New York, NY, USA; Bethesda, MD, USA; and London,United Kingdom
sponsibility for the contentof the report and the de-cision to submit forpublication.The views expressed in thisarticle are those of the
authors and do not neces-sarily represent the viewsof the National Heart,Lung, and Blood Institute,National Institutes ofHealth, Department ofHealth and Human Ser-
vices, or any other govern-ment entity.This work was undertakenas a part of the GlobalBurden of Diseases, In-juries, and Risk Factors
2010 study. The results inthis paper are preparedindependently of the finalestimates of the GlobalBurden of Diseases, In-juries, and Risk Factorsstudy.
GBD Stroke Expert Groupmembers are listed at theend of the paper.From the *Clinical TrialService Unit and Epidemi-ological Studies Unit, Nuf-
field Department ofPopulation Health, Univer-sity of Oxford, Oxford, UK;
ABSTRACT
This study sought to summarize the findings of the GBD 2010 (Global Burden of Diseases, Injuries, and RiskFactors) study for ischemic stroke (IS) and to report the impact of tobacco smoking on IS burden in specificcountries. The GBD 2010 searched multiple databases to identify relevant studies published between 1990and 2010. The GBD 2010 analytical tools were used to calculate region-specific IS incidence, mortality,mortality-to-incidence ratio, and disability-adjusted life years (DALY) lost, including 95% uncertaintyintervals (UI). In 2010, there were approximately 11,569,000 incident IS events (63% in low- and middle-income countries [LMIC]), approximately 2,835,000 deaths from IS (57% in LMIC), and approximately39,389,000 DALY lost due to IS (64% in LMIC). From 1990 to 2010, there was a significant increase inglobal IS burden in terms of absolute number of people with incident IS (37% increase), deaths from IS(21% increase), and DALY lost due to IS (18% increase). Age-standardized IS incidence, DALY lost,mortality, and mortality-to-incidence ratios in high-income countries declined by about 13% (95% UI: 6%to 18%), 34% (95% UI: 16% to 36%), and 37% (95% UI: 19% to 39%), 21% (95% UI: 10% to 27%),respectively. However, in LMIC there was a modest 6% increase in the age-standardized incidence of IS(95% UI: �7% to 18%) despite modest reductions in mortality rates, DALY lost, and mortality-to-incidence ratios. There was considerable variability among country-specific estimates within broad GBDregions. China, Russia, and India were ranked highest in both 1990 and 2010 for IS deaths attributable totobacco consumption. Although age-standardized IS mortality rates have declined over the last 2 decades,the absolute global burden of IS is increasing, with the bulk of DALY lost in LMIC. Tobacco consumptionis an important modifiable risk factor for IS, and in both 1990 and 2010, the top ranked countries for ISdeaths that could be attributed to tobacco consumption were China, Russia, and India. Tobacco controlpolicies that target both smoking initiation and smoking cessation can play an important role in theprevention of IS. In China, Russia, and India, even modest reductions in the number of current smokerscould see millions of lives saved due to prevention of IS alone.
yFaculty of Health andEnvironmental Studies, Na-tional Institute for Strokeand Applied Neurosci-
ences, AUT University,Auckland, New Zealand;zDepartment of Psychol-ogy, the University ofAuckland, Auckland, NewZealand; xInstitute for
Health Metrics and Evalua-tion, University of Wash-ington, Seattle, WA, USA;jjNHS Borders, Melrose,UK; {Division of ClinicalNeurosciences, Universityof Edinburgh, Edinburgh,
UK; #School of PublicHealth, University of theWitwatersrand,
Evaluating stroke burden by its major pathologicalsubtypes and studying secular trends of stroke subtypes indifferent regions of the world is important for targeted re-gion- and country-specific stroke prevention and healthcareplanning. Ischemic stroke (IS) is the most common subtypeworldwide, but there has been little information on theglobal and regional IS incidence, mortality, disability-adjusted life-years (DALY) lost in high-income countries(HIC) versus in low- and middle-income countries (LMIC).The GBD 2010 (Global Burden of Diseases, Injuries, andRisk Factors) study ranked stroke as the second mostcommon cause of death [1] and the third leading cause ofdisability in 2010 [2]. The aim of this report is to summarizethe key findings of the GBD 2010 study for IS incidence,mortality, mortality-to-incidence (MI) ratio, and DALY lost
GLOBAL HEART, VOL. 9, NO. 1, 2014March 2014: 107-112
for IS in 1990 and 2010. Prior GBD 2010 study publicationshave presented IS estimates by country, age group, andcountry income category (HIC vs. LMIC) [3]. This reportwill review region-specific data on incidence, mortality, andDALY lost for IS for the 21 GBD regions. The burden of ISattributable to tobacco, one of the leading preventable riskfactors [4] associated with IS was also investigated.
METHODSA systematic review was conducted to identify suitable ISand total stroke epidemiological studies for inclusion in theGBD 2010 study. The literature search strategy, selectioncriteria, and full details of the methodology are reportedelsewhere [5,6]. Pathological types of stroke were analyzedonly for studies that had computed tomography or
107
Johannesburg, South Af-rica; **National Institutefor Health Innovation, Uni-versity of Auckland, Auck-land, New Zealand;
yyDivision of GeneralMedicine, Columbia Uni-versity Medical Center,New York, NY, USA;zzDepartment of Epidemi-ology, School of Public
Health, University ofWashington, Seattle, WA,USA; xxDivision of Cardiol-ogy, University of Wash-ington, Seattle, WA, USA;kkCenter for TranslationResearch and Implementa-tion Science (CTRIS), Na-tional Heart, Lung, andBlood Institute, NationalInstitutes of Health,Bethesda, MD, USA; andthe {{MRC-HPA Centre for
Environment and Health,Department of Epidemi-ology and Biostatistics,School of Public Health,Imperial College London,Medical Faculty Building,
Norfolk Place, London, UK.Correspondence: D. A.Bennett ([email protected]).
GLOBAL HEART© 2014 World HeartFederation (Geneva).Published by Elsevier Ltd.
All rights reserved.VOL. 9, NO. 1, 2014ISSN 2211-8160/$36.00.http://dx.doi.org/10.1016/j.gheart.2014.01.001
j gREVIEW
108
magnetic resonance imaging of the head, or brain autopsyfindings available for �70% of stroke cases. Only first-ever-in-a-lifetime IS events were analyzed in this report.Briefly, the GBD 2010 study analytical tool, DisMod-MR, aBayesian mixed-effects negative binomial meta-regressionmodel, was applied to calculate region- and country-specific estimates (including 95% uncertainty intervals[UI]) of IS incidence rates per 100,000 person-years [7].The cause-of-death model used ensemble models to esti-mate region- and country-level IS mortality rates per100,000 person-years [8,9]. Years lived with disability dueto nonfatal IS and years of life lost due to IS were summedto equal the summary measure of disease burden, DALYlost. IS deaths and DALY lost per 100,000 people by agegroup (<75 years, �75 years, total) and country incomelevel (HIC and LMIC) are reported for 1990, 2005, and2010. Incidence and mortality rates per 100,000 person-years and DALY estimates per 100,000 people were age-standardized using the direct method with World HealthOrganization (WHO) standard population as a referencepopulation. Box and whisker plots were used to display themeasure of spread (or dispersion) of the computed inci-dence, mortality, and DALY estimates by country withinregion. The bottom and top of the box are the first andthird quartiles of the metric for countries within that re-gion, and the band inside the box is the median value ofthe particular metric for country-specific estimates withinthat region. The ends of the whiskers represent the mini-mum and maximum values of the metric for countrieswithin a particular region.
The MI ratio for each region/country is used as anindicator disease severity as well as the success or failure ofstroke clinical management strategies in a particular region/country (MI ratio numbers were based on the total numberof incident cases and deaths) were also calculated. Themain GBD 2010 study results on HIC versus LMIC and age<75 years versus age �75 years have been published indetail elsewhere and shall only be summarized here [3].For IS deaths attributable to tobacco, the estimates werebased on the GBD 2010 study generic approach to assessburden due to risk factors. In brief, the GBD 2010 studyused the fraction of the population in each country, age,sex, and year exposed to the risk factor using all availablepublished and unpublished data. These estimates, togetherwith strength of association between risk factor exposureand IS (i.e., relative risks) and estimates of cause-specificdeaths and DALY from the GBD 2010 study were usedto calculate the burden attributable to each risk factorexposure compared with the theoretical-minimum-riskexposure (population-attributable fraction analysis). Un-certainty was incorporated into the estimates of diseaseburden, relative risks, and exposures by drawing 1,000times from the posterior distributions of these parameters.This was done for mortality and disability parametersseparately from attributable burden and for risk factorevaluation [10].
RESULTSThe GBD 2010 study literature search identified 119 strokestudies that met the inclusion criteria for the systematicreview, and these were included in the subsequent ana-lyses. The GBD 2010 study estimated that in 2010 therewere about 11,569,000 incident IS events (7,316,000[63%] in LMIC), about 2,835,000 deaths from IS(1,625,000 [57%] in LMIC), and that the total number ofDALY lost due to IS were about 39,389,000 (25,137,000[64%] in LMIC). The GBD 2010 study estimated that in2010, total age-standardized incidence rates (per 100,000person-years) of IS ranged from 51.88 (Qatar; 95% UI:36.92 to 70.28) to 433.97 (Lithuania; 95% UI: 369.12 to505.59). Age-standardized mortality rates (per 100,000person-years) of IS ranged from 9.17 (Qatar; 95% UI: 7.71to 10.60) to 137.70 (Russia; 95% UI: 108.71 to 150.90),and for DALY lost from 163.89 (Israel; 95% UI: 132.32 to207.45) to 2,032.11 (Afghanistan; 95% UI: 1,576.6 to2,886.65).
In the first decade of the 21st century, the highestincidence rates of IS were seen in Eastern Europe, CentralAsia, East Asia, and North Africa/Middle East (Fig. 1A).There was a considerable amount of heterogeneity amongcountries within GBD regions for age-standardized IS inci-dence rates, mortality rates, and DALY lost in 2010. Thelargest variation in incidence rates was seen in East Asia(lower quartile [Q1]: 144.75, upper quartile [Q3]: 205.95),whereas the smallest variation was seen in Australasia (Q1:76.27, Q3: 79.45) (Fig. 1A). In 2010, the lowest IS inci-dence rate was seen in Australasia and the highest was inEastern Europe (Fig. 1A). Considering mortality rates, thelargest variation was seen in Central Asia (Q1: 36.88, Q3:86.97) (Fig. 1B), whereas the smallest variation was seen inSouth Asia (Q1: 28.94, Q3: 38.83). In 2010, the lowestmortality rates for IS were observed in High Income NorthAmerica and the highest mortality rates for IS were observedin Eastern Europe (Fig. 1B). Finally for DALY, in 2010, thelargest variation was seen in Oceania (Q1: 633.65, Q3:1569.27) and the smallest in North America High Income(Q1: 287.30, Q3: 295.76) (Fig. 1C). In 2010, the lowestDALY lost were in Australasia and North America and thehighest DALY lost were in Eastern Europe.
Table 1 presents the median and interquartile ranges(IQR) for age-standardized incidence, mortality per100,000 person-years and DALY lost per 100,000 peoplefor IS by countries within each of the 21 GBD regionsbetween 1990 and 2010. These results show that in generalincidence, mortality and DALY lost have decreased in high-income regions (e.g., Western Europe) but were veryvariable in low- and middle-income regions (e.g., increasedincidence, but decreased mortality and DALY lost in Sub-Saharan Africa). Specifically, for countries in WesternEurope, the median age-standardized incidence rate (IQR),median age-standardized mortality rate (IQR), and medianDALY lost (IQR) in 1990 was 127.65 (13.31), 39.10(16.37), and 516.51 (194.33), respectively. In 2010, these
GLOBAL HEART, VOL. 9, NO. 1, 2014March 2014: 107-112
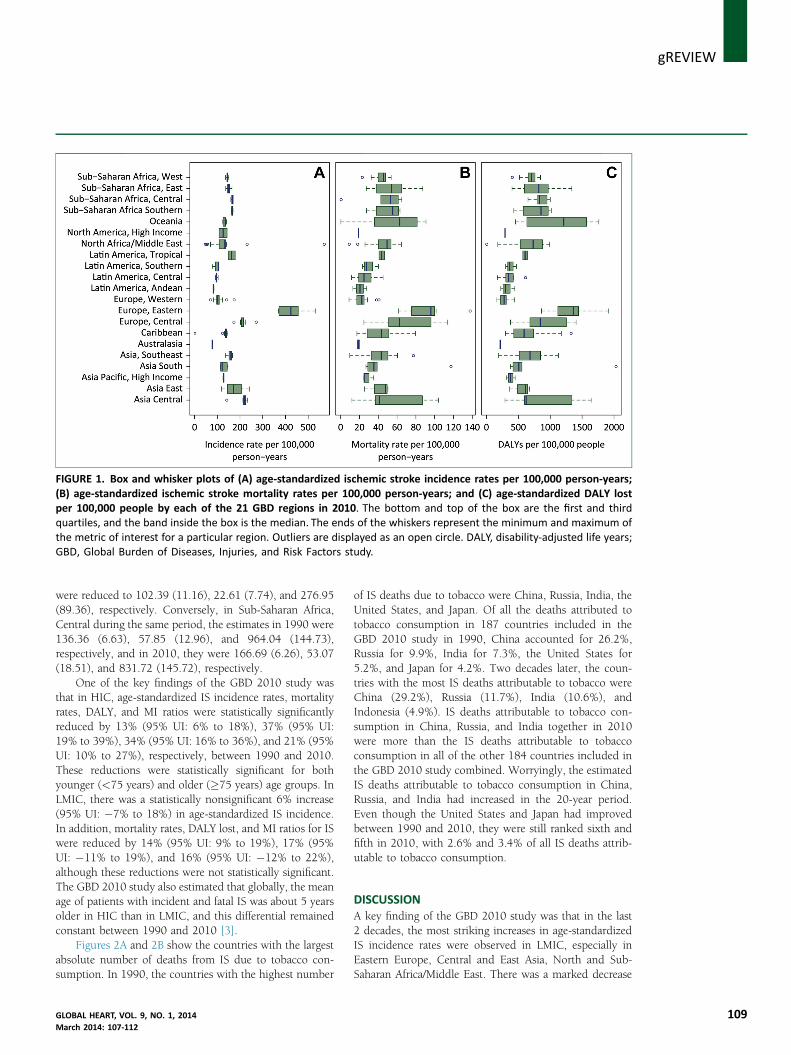
FIGURE 1. Box and whisker plots of (A) age-standardized ischemic stroke incidence rates per 100,000 person-years;(B) age-standardized ischemic stroke mortality rates per 100,000 person-years; and (C) age-standardized DALY lostper 100,000 people by each of the 21 GBD regions in 2010. The bottom and top of the box are the first and thirdquartiles, and the band inside the box is the median. The ends of the whiskers represent the minimum and maximum ofthe metric of interest for a particular region. Outliers are displayed as an open circle. DALY, disability-adjusted life years;GBD, Global Burden of Diseases, Injuries, and Risk Factors study.
gREVIEWj
were reduced to 102.39 (11.16), 22.61 (7.74), and 276.95(89.36), respectively. Conversely, in Sub-Saharan Africa,Central during the same period, the estimates in 1990 were136.36 (6.63), 57.85 (12.96), and 964.04 (144.73),respectively, and in 2010, they were 166.69 (6.26), 53.07(18.51), and 831.72 (145.72), respectively.
One of the key findings of the GBD 2010 study wasthat in HIC, age-standardized IS incidence rates, mortalityrates, DALY, and MI ratios were statistically significantlyreduced by 13% (95% UI: 6% to 18%), 37% (95% UI:19% to 39%), 34% (95% UI: 16% to 36%), and 21% (95%UI: 10% to 27%), respectively, between 1990 and 2010.These reductions were statistically significant for bothyounger (<75 years) and older (�75 years) age groups. InLMIC, there was a statistically nonsignificant 6% increase(95% UI: �7% to 18%) in age-standardized IS incidence.In addition, mortality rates, DALY lost, and MI ratios for ISwere reduced by 14% (95% UI: 9% to 19%), 17% (95%UI: �11% to 19%), and 16% (95% UI: �12% to 22%),although these reductions were not statistically significant.The GBD 2010 study also estimated that globally, the meanage of patients with incident and fatal IS was about 5 yearsolder in HIC than in LMIC, and this differential remainedconstant between 1990 and 2010 [3].
Figures 2A and 2B show the countries with the largestabsolute number of deaths from IS due to tobacco con-sumption. In 1990, the countries with the highest number
GLOBAL HEART, VOL. 9, NO. 1, 2014March 2014: 107-112
of IS deaths due to tobacco were China, Russia, India, theUnited States, and Japan. Of all the deaths attributed totobacco consumption in 187 countries included in theGBD 2010 study in 1990, China accounted for 26.2%,Russia for 9.9%, India for 7.3%, the United States for5.2%, and Japan for 4.2%. Two decades later, the coun-tries with the most IS deaths attributable to tobacco wereChina (29.2%), Russia (11.7%), India (10.6%), andIndonesia (4.9%). IS deaths attributable to tobacco con-sumption in China, Russia, and India together in 2010were more than the IS deaths attributable to tobaccoconsumption in all of the other 184 countries included inthe GBD 2010 study combined. Worryingly, the estimatedIS deaths attributable to tobacco consumption in China,Russia, and India had increased in the 20-year period.Even though the United States and Japan had improvedbetween 1990 and 2010, they were still ranked sixth andfifth in 2010, with 2.6% and 3.4% of all IS deaths attrib-utable to tobacco consumption.
DISCUSSIONA key finding of the GBD 2010 study was that in the last2 decades, the most striking increases in age-standardizedIS incidence rates were observed in LMIC, especially inEastern Europe, Central and East Asia, North and Sub-Saharan Africa/Middle East. There was a marked decrease
109
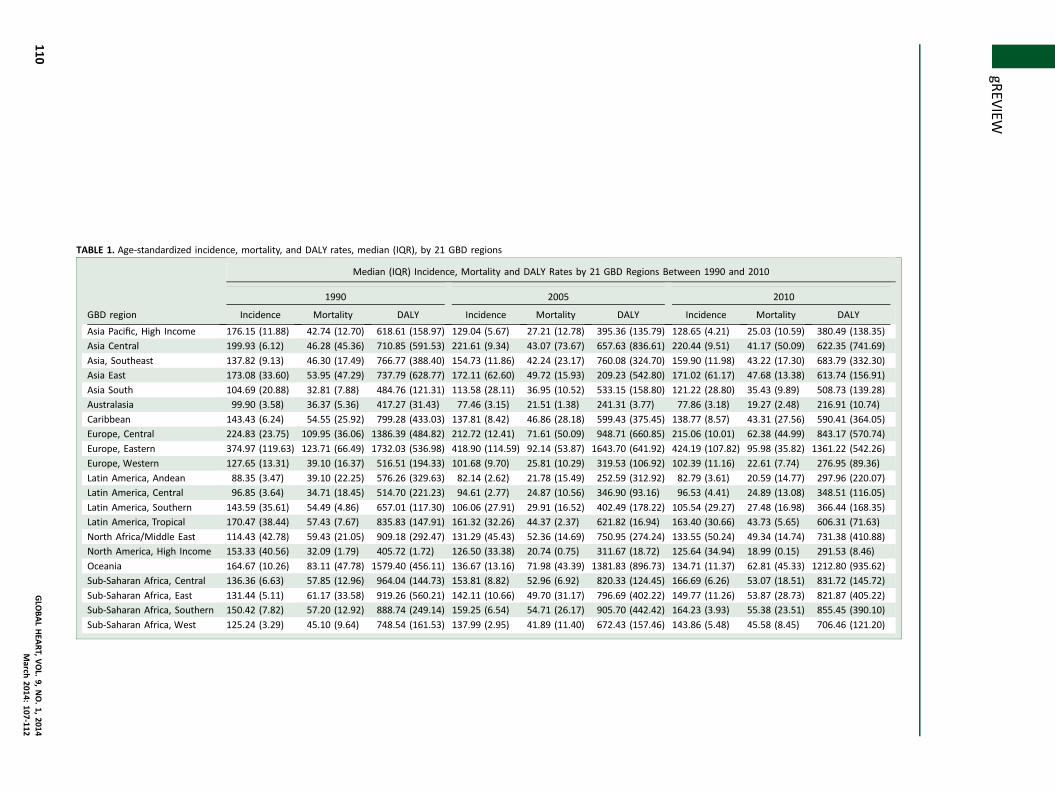
TABLE 1. Age-standardized incidence, mortality, and DALY rates, median (IQR), by 21 GBD regions
GBD region
Median (IQR) Incidence, Mortality and DALY Rates by 21 GBD Regions Between 1990 and 2010
1990 2005 2010
Incidence Mortality DALY Incidence Mortality DALY Incidence Mortality DALY
Asia Pacific, High Income 176.15 (11.88) 42.74 (12.70) 618.61 (158.97) 129.04 (5.67) 27.21 (12.78) 395.36 (135.79) 128.65 (4.21) 25.03 (10.59) 380.49 (138.35)
Asia Central 199.93 (6.12) 46.28 (45.36) 710.85 (591.53) 221.61 (9.34) 43.07 (73.67) 657.63 (836.61) 220.44 (9.51) 41.17 (50.09) 622.35 (741.69)
Asia, Southeast 137.82 (9.13) 46.30 (17.49) 766.77 (388.40) 154.73 (11.86) 42.24 (23.17) 760.08 (324.70) 159.90 (11.98) 43.22 (17.30) 683.79 (332.30)
Asia East 173.08 (33.60) 53.95 (47.29) 737.79 (628.77) 172.11 (62.60) 49.72 (15.93) 209.23 (542.80) 171.02 (61.17) 47.68 (13.38) 613.74 (156.91)
Asia South 104.69 (20.88) 32.81 (7.88) 484.76 (121.31) 113.58 (28.11) 36.95 (10.52) 533.15 (158.80) 121.22 (28.80) 35.43 (9.89) 508.73 (139.28)
Australasia 99.90 (3.58) 36.37 (5.36) 417.27 (31.43) 77.46 (3.15) 21.51 (1.38) 241.31 (3.77) 77.86 (3.18) 19.27 (2.48) 216.91 (10.74)
Caribbean 143.43 (6.24) 54.55 (25.92) 799.28 (433.03) 137.81 (8.42) 46.86 (28.18) 599.43 (375.45) 138.77 (8.57) 43.31 (27.56) 590.41 (364.05)
Europe, Central 224.83 (23.75) 109.95 (36.06) 1386.39 (484.82) 212.72 (12.41) 71.61 (50.09) 948.71 (660.85) 215.06 (10.01) 62.38 (44.99) 843.17 (570.74)
Europe, Eastern 374.97 (119.63) 123.71 (66.49) 1732.03 (536.98) 418.90 (114.59) 92.14 (53.87) 1643.70 (641.92) 424.19 (107.82) 95.98 (35.82) 1361.22 (542.26)
Europe, Western 127.65 (13.31) 39.10 (16.37) 516.51 (194.33) 101.68 (9.70) 25.81 (10.29) 319.53 (106.92) 102.39 (11.16) 22.61 (7.74) 276.95 (89.36)
Latin America, Andean 88.35 (3.47) 39.10 (22.25) 576.26 (329.63) 82.14 (2.62) 21.78 (15.49) 252.59 (312.92) 82.79 (3.61) 20.59 (14.77) 297.96 (220.07)
Latin America, Central 96.85 (3.64) 34.71 (18.45) 514.70 (221.23) 94.61 (2.77) 24.87 (10.56) 346.90 (93.16) 96.53 (4.41) 24.89 (13.08) 348.51 (116.05)
Latin America, Southern 143.59 (35.61) 54.49 (4.86) 657.01 (117.30) 106.06 (27.91) 29.91 (16.52) 402.49 (178.22) 105.54 (29.27) 27.48 (16.98) 366.44 (168.35)
Latin America, Tropical 170.47 (38.44) 57.43 (7.67) 835.83 (147.91) 161.32 (32.26) 44.37 (2.37) 621.82 (16.94) 163.40 (30.66) 43.73 (5.65) 606.31 (71.63)
North Africa/Middle East 114.43 (42.78) 59.43 (21.05) 909.18 (292.47) 131.29 (45.43) 52.36 (14.69) 750.95 (274.24) 133.55 (50.24) 49.34 (14.74) 731.38 (410.88)
North America, High Income 153.33 (40.56) 32.09 (1.79) 405.72 (1.72) 126.50 (33.38) 20.74 (0.75) 311.67 (18.72) 125.64 (34.94) 18.99 (0.15) 291.53 (8.46)
Oceania 164.67 (10.26) 83.11 (47.78) 1579.40 (456.11) 136.67 (13.16) 71.98 (43.39) 1381.83 (896.73) 134.71 (11.37) 62.81 (45.33) 1212.80 (935.62)
Sub-Saharan Africa, Central 136.36 (6.63) 57.85 (12.96) 964.04 (144.73) 153.81 (8.82) 52.96 (6.92) 820.33 (124.45) 166.69 (6.26) 53.07 (18.51) 831.72 (145.72)
Sub-Saharan Africa, East 131.44 (5.11) 61.17 (33.58) 919.26 (560.21) 142.11 (10.66) 49.70 (31.17) 796.69 (402.22) 149.77 (11.26) 53.87 (28.73) 821.87 (405.22)
Sub-Saharan Africa, Southern 150.42 (7.82) 57.20 (12.92) 888.74 (249.14) 159.25 (6.54) 54.71 (26.17) 905.70 (442.42) 164.23 (3.93) 55.38 (23.51) 855.45 (390.10)
Sub-Saharan Africa, West 125.24 (3.29) 45.10 (9.64) 748.54 (161.53) 137.99 (2.95) 41.89 (11.40) 672.43 (157.46) 143.86 (5.48) 45.58 (8.45) 706.46 (121.20)
jgR
EVIEW
110GLO
BALHEA
RT,VOL.
9,NO.1,
2014March
2014:107-112
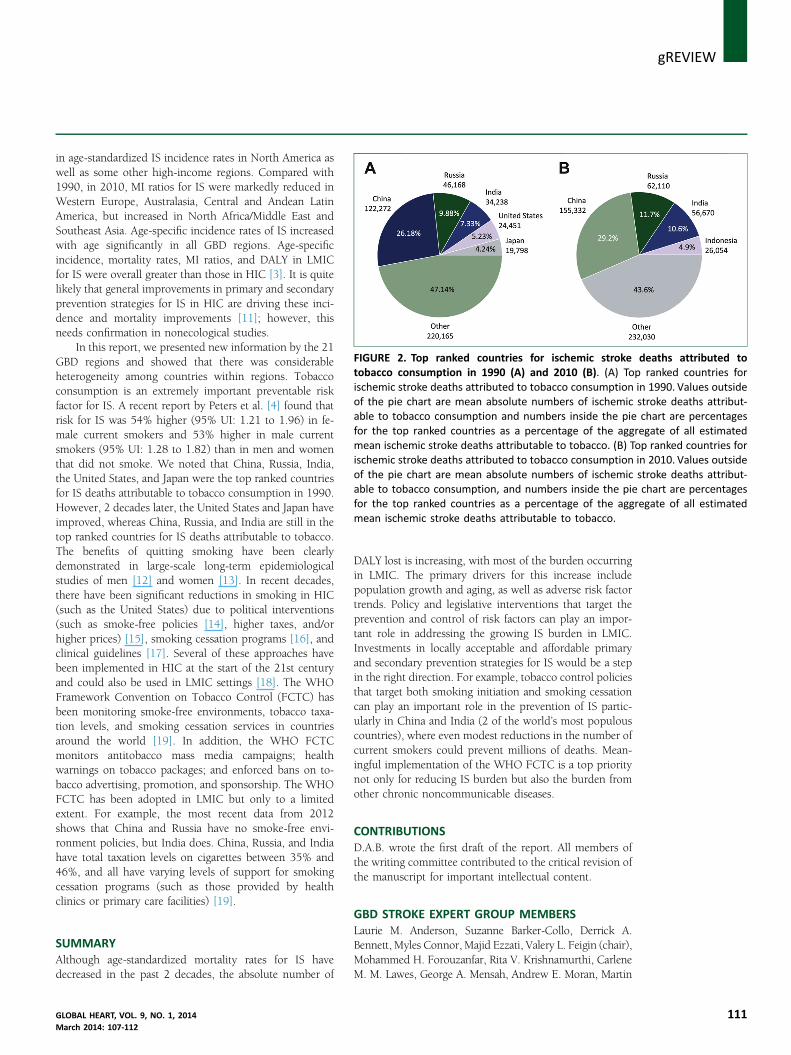
FIGURE 2. Top ranked countries for ischemic stroke deaths attributed totobacco consumption in 1990 (A) and 2010 (B). (A) Top ranked countries forischemic stroke deaths attributed to tobacco consumption in 1990. Values outsideof the pie chart are mean absolute numbers of ischemic stroke deaths attribut-able to tobacco consumption and numbers inside the pie chart are percentagesfor the top ranked countries as a percentage of the aggregate of all estimatedmean ischemic stroke deaths attributable to tobacco. (B) Top ranked countries forischemic stroke deaths attributed to tobacco consumption in 2010. Values outsideof the pie chart are mean absolute numbers of ischemic stroke deaths attribut-able to tobacco consumption, and numbers inside the pie chart are percentagesfor the top ranked countries as a percentage of the aggregate of all estimatedmean ischemic stroke deaths attributable to tobacco.
gREVIEWj
in age-standardized IS incidence rates in North America aswell as some other high-income regions. Compared with1990, in 2010, MI ratios for IS were markedly reduced inWestern Europe, Australasia, Central and Andean LatinAmerica, but increased in North Africa/Middle East andSoutheast Asia. Age-specific incidence rates of IS increasedwith age significantly in all GBD regions. Age-specificincidence, mortality rates, MI ratios, and DALY in LMICfor IS were overall greater than those in HIC [3]. It is quitelikely that general improvements in primary and secondaryprevention strategies for IS in HIC are driving these inci-dence and mortality improvements [11]; however, thisneeds confirmation in nonecological studies.In this report, we presented new information by the 21GBD regions and showed that there was considerableheterogeneity among countries within regions. Tobaccoconsumption is an extremely important preventable riskfactor for IS. A recent report by Peters et al. [4] found thatrisk for IS was 54% higher (95% UI: 1.21 to 1.96) in fe-male current smokers and 53% higher in male currentsmokers (95% UI: 1.28 to 1.82) than in men and womenthat did not smoke. We noted that China, Russia, India,the United States, and Japan were the top ranked countriesfor IS deaths attributable to tobacco consumption in 1990.However, 2 decades later, the United States and Japan haveimproved, whereas China, Russia, and India are still in thetop ranked countries for IS deaths attributable to tobacco.The benefits of quitting smoking have been clearlydemonstrated in large-scale long-term epidemiologicalstudies of men [12] and women [13]. In recent decades,there have been significant reductions in smoking in HIC(such as the United States) due to political interventions(such as smoke-free policies [14], higher taxes, and/orhigher prices) [15], smoking cessation programs [16], andclinical guidelines [17]. Several of these approaches havebeen implemented in HIC at the start of the 21st centuryand could also be used in LMIC settings [18]. The WHOFramework Convention on Tobacco Control (FCTC) hasbeen monitoring smoke-free environments, tobacco taxa-tion levels, and smoking cessation services in countriesaround the world [19]. In addition, the WHO FCTCmonitors antitobacco mass media campaigns; healthwarnings on tobacco packages; and enforced bans on to-bacco advertising, promotion, and sponsorship. The WHOFCTC has been adopted in LMIC but only to a limitedextent. For example, the most recent data from 2012shows that China and Russia have no smoke-free envi-ronment policies, but India does. China, Russia, and Indiahave total taxation levels on cigarettes between 35% and46%, and all have varying levels of support for smokingcessation programs (such as those provided by healthclinics or primary care facilities) [19].
SUMMARYAlthough age-standardized mortality rates for IS havedecreased in the past 2 decades, the absolute number of
GLOBAL HEART, VOL. 9, NO. 1, 2014March 2014: 107-112
DALY lost is increasing, with most of the burden occurringin LMIC. The primary drivers for this increase includepopulation growth and aging, as well as adverse risk factortrends. Policy and legislative interventions that target theprevention and control of risk factors can play an impor-tant role in addressing the growing IS burden in LMIC.Investments in locally acceptable and affordable primaryand secondary prevention strategies for IS would be a stepin the right direction. For example, tobacco control policiesthat target both smoking initiation and smoking cessationcan play an important role in the prevention of IS partic-ularly in China and India (2 of the world’s most populouscountries), where even modest reductions in the number ofcurrent smokers could prevent millions of deaths. Mean-ingful implementation of the WHO FCTC is a top prioritynot only for reducing IS burden but also the burden fromother chronic noncommunicable diseases.
CONTRIBUTIONSD.A.B. wrote the first draft of the report. All members ofthe writing committee contributed to the critical revision ofthe manuscript for important intellectual content.
GBD STROKE EXPERT GROUP MEMBERSLaurie M. Anderson, Suzanne Barker-Collo, Derrick A.Bennett, Myles Connor, Majid Ezzati, Valery L. Feigin (chair),Mohammed H. Forouzanfar, Rita V. Krishnamurthi, CarleneM. M. Lawes, George A. Mensah, Andrew E. Moran, Martin
111
j gREVIEW
112
O’Donnell, Jeyaraj Durai Pandian, Varsha Parag, RalphSacco, Yukito Shinohara, Thomas Truelsen, NarayanaswamyVenketasubramanian, Emma Witt, Wenzhi Wang.
ACKNOWLEDGMENTSThe authors thank Sarah Safranek, University of Wash-ington Health Sciences Library, for her help in developingthe systematic review literature search strategies; Michael F.Macintyre, Brittany Wurtz, and Summer Ohno, Universityof Washington, Institute for Health Metrics and Evaluation,for research coordination; and Helen McDonald, AUTUniversity, University National Institute for Stroke andApplied Neurosciences, for organizing teleconferences andsecretarial support. The authors alone are responsible forthe views expressed in this publication.
REFERENCES1. Lozano R, Naghavi M, Foreman K, et al. Global and regional mortality
from 235 causes of death for 20 age groups in 1990 and 2010: asystematic analysis for the Global Burden of Disease Study 2010.Lancet 2012;380:2095–128.
2. Murray CJ,Vos T, Lozano R, et al. Disability-adjusted life years (DALYs) for291diseases and injuries in 21 regions, 1990e2010: a systematic analysis
for theGlobal BurdenofDisease Study2010. Lancet 2012;380:2197–223.3. Krishnamurthi RV, Feigin VL, Forouzanfar MH, et al. Global and
regional burden of first-ever ischaemic and haemorrhagic strokeduring 1990e2010: findings from the Global Burden of Disease Study2010. Lancet Global Health 2013;1:e259–81.
4. Peters SA, Huxley RR, Woodward M. Smoking as a risk factor forstroke in women compared with men: a systematic review and meta-
analysis of 81 cohorts, including 3,980,359 individuals and 42,401strokes. Stroke 2013;44:2821–8.
5. Bennett DA. Global Burden of Disease Expert Group. Methodology ofthe global and regional burden of stroke study. Neuroepidemiology2012;38:30–40.
6. Feigin VL, Forouzanfar MH, Krishnamurthi R, et al. Global and
regional burden of stroke during 1990e2010: findings from theglobal burden of disease study 2010. Lancet 2014;383:245–55.
7. Vos T, Flaxman AD, Naghavi M, et al. Years lived with disability (YLDs)for 1160 sequelae of 289 diseases and injuries 1990e2010: a sys-
tematic analysis for the Global Burden of Disease Study 2010. Lancet2012;380:2163–96.
8. Wang H, Dwyer-Lindgren L, Lofgren KT, et al. Age-specific andsex-specific mortality in 187 countries, 1970e2010: a systematicanalysis for the Global Burden of Disease Study 2010. Lancet 2012;
380:2071–94.9. Foreman KJ, Lozano R, Lopez AD, Murray CJ. Modeling causes of
death: an integrated approach using CODEm. Popul Health Metr2012;10:1.
10. Lim SS, Vos T, Flaxman AD, et al. A comparative risk assessment ofburden of disease and injury attributable to 67 risk factors and risk
factor clusters in 21 regions, 1990e2010: a systematic analysis forthe Global Burden of Disease Study 2010. Lancet 2012;380:2224–60.
11. Yusuf S, Islam S, Chow CK, et al., for the PURE Study Investigators.Use of secondary prevention drugs for cardiovascular disease in thecommunity in high-income, middle-income, and low-income coun-
tries (the PURE study): a prospective epidemiological survey. Lancet2011;378:1231–43.
12. Doll R, Peto R, Boreham J, Sutherland I. Mortality in relation tosmoking: 50 years’ observations on male British doctors. BMJ 2004;328:1519.
13. Pirie K, Peto R, Reeves GK, et al., for the Million Women StudyCollaborators. The 21st century hazards of smoking and benefits of
stopping: a prospective study of one million women in the UK. Lancet2013;381:133–41.
14. Hauri DD, Lieb CM, Rajkumar S, Kooijman C, Sommer HL, Röösli M.Direct health costs of environmental tobacco smoke exposure andindirect health benefits due to smoking ban introduction. Eur J PublicHealth 2011;21:316–22.
15. Bader P, Boisclair D, Ferrence R. Effects of tobacco taxation andpricing on smoking behavior in high risk populations: a knowledgesynthesis. Int J Environ Res Public Health 2011;8:4118–39.
16. Mottillo S, Filion KB, Bélisle P, et al. Behavioural interventions forsmoking cessation: a meta-analysis of randomized controlled trials.Eur Heart J 2009;30:718–30.
17. Furie KL, Kasner SE, Adams RJ, et al. Guidelines for the prevention of
stroke in patients with stroke or transient ischemic attack: a guidelinefor healthcare professionals from the American Heart Association/American Stroke Association. Stroke 2011;42:227–76.
18. Koh HK, Joossens LX, Connolly GN. Making smoking history world-wide. N Engl J Med 2007;356:1496–8.
19. World Health Organization. Tobacco Free Initiative: Tobacco Control
Country Profiles. Available at: http://www.who.int/tobacco/surveillance/policy/country_profile/en. Accessed December 31, 2013.
GLOBAL HEART, VOL. 9, NO. 1, 2014March 2014: 107-112
Related Documents