2004 UPDATE THE GLOBAL BURDEN OF DISEASE

Welcome message from author
This document is posted to help you gain knowledge. Please leave a comment to let me know what you think about it! Share it to your friends and learn new things together.
Transcript
2004 UPDATETHE GLOBAL BURDEN OF DISEASE

2004 UPDATE
THE GLOBAL BURDEN OF DISEASE
ii
World Health Organization
WHO Library Cataloguing-in-Publication Data
The global burden of disease: 2004 update.
1.Cost of illness. 2.World health - statistics. 3.Mortality - trends. I.World Health Organization.
ISBN 978 92 4 156371 0 (NLM classification: W 74)
© World Health Organization 2008
All rights reserved. Publications of the World Health Organization can be obtained from WHO Press, World Health Organization, 20 Avenue Appia, 1211 Geneva 27, Switzerland (tel.: +41 22 791 3264; fax: +41 22 791 4857; e-mail: [email protected]). Requests for permission to reproduce or translate WHO publications – whether for sale or for noncommercial distribution – should be addressed to WHO Press, at the above address (fax: +41 22 791 4806; e-mail: [email protected]).
The designations employed and the presentation of the material in this publication do not imply the expression of any opinion whatsoever on the part of the World Health Organization concerning the legal status of any country, territory, city or area or of its authorities, or concerning the delimitation of its fron-tiers or boundaries. Dotted lines on maps represent approximate border lines for which there may not yet be full agreement.
The mention of specific companies or of certain manufacturers’ products does not imply that they are endorsed or recommended by the World Health Organization in preference to others of a similar nature that are not mentioned. Errors and omissions excepted, the names of proprietary products are distin-guished by initial capital letters.
All reasonable precautions have been taken by the World Health Organization to verify the information contained in this publication. However, the published material is being distributed without warranty of any kind, either expressed or implied. The responsibility for the interpretation and use of the material lies with the reader. In no event shall the World Health Organization be liable for damages arising from its use.
Printed in Switzerland.
Acknowledgements
This publication was produced by the Department of Health Statistics and Informatics in the Information, Evidence and Research Cluster of WHO. The 2004 update of the Global burden of disease was primarily carried out by Colin Mathers and Doris Ma Fat, in collaboration with other WHO staff, WHO technical programmes and UNAIDS. The report was written by Colin Mathers, Ties Boerma and Doris Ma Fat.
Valuable inputs were provided by WHO staff from many departments and by experts outside WHO. While it is not possible to name all those who contributed to this effort, we would like to note the assistance and inputs provided by Elisabeth Aahman, Steve Begg, Bob Black, Cynthia Boschi-Pinto, Somnath Chatterji, Richard Cibulskis, Simon Cousens, Chris Dye, Mercedes de Onis, Dirk Engels, Majid Ezzati, Eric Fevre, Marta Gacic Dobo, Marc Gastellu-Etchegorry, Biswas Gautam, Peter Ghys, Kim Iburg, Mie Inoue, Robert Jakob, Jean Jannin, Sherrie Kelly, Eline Korenremp, Andre L’Hours, Joy Lawn, Steve Lim, Silvio Mari-otti, Erin McLean, Nirmala Naidoo, Mike Nathan, Donatella Pascolini, Annette Pruess-Ustun, Juergen Rehm, Serge Resnikoff, Lisa Rogers, Gojke Roglic, Alexander Rowe, Florence Rusciano, Robert Salvatella, Lale Say, Suzanne Scheele, Kenji Shibuya, Perez Simaro, Andrew Smith, Karen Stanecki, Kate Strong, Jose Suaya, Jos Vandelaer, Theo Vos, Catherine Watt, Brian Williams and Lara Wolfson.
Figures were prepared by Florence Rusciano and design and layout were by Reto Schürch.
iii
Global Burden of Disease 2004
ContentsTables ................................................................................................................................................................................................................ v
Figures ............................................................................................................................................................................................................. vi
Abbreviations ...................................................................................................................................................................................................vii
Part 1: Introduction 1Overview of the Global Burden of Disease Study ............................................................................................................................................... 2
What is new in this update for 2004? ................................................................................................................................................................ 3
Regional estimates for 2004 .............................................................................................................................................................................. 5
Part 2: Causes of death 7 1. Deaths in 2004: who and where? .............................................................................................................................................................. 8
2. Deaths by broad cause groups .................................................................................................................................................................. 8
3. Leading causes of death ......................................................................................................................................................................... 11
4. Cancer mortality ..................................................................................................................................................................................... 12
5. Causes of death among children aged under five years .......................................................................................................................... 14
6. Causes of death among adults aged 15–59 years ................................................................................................................................... 17
7. Years of life lost: taking age at death into account .................................................................................................................................. 21
8. Projected trends in global mortality: 2004–2030 ................................................................................................................................... 22
Part 3: Disease incidence, prevalence and disability 27 9. How many people become sick each year? ............................................................................................................................................. 28
10. Cancer incidence by site and region ........................................................................................................................................................ 29
11. How many people are sick at any given time? ........................................................................................................................................ 31
12. Prevalence of moderate and severe disability ......................................................................................................................................... 31
13. Leading causes of years lost due to disability in 2004 ............................................................................................................................. 36
Part 4: Burden of disease: DALYs 39 14. Broad cause composition ........................................................................................................................................................................ 40
15. The age distribution of burden of disease ............................................................................................................................................... 42
16. Leading causes of burden of disease ....................................................................................................................................................... 42
17. The disease and injury burden for women .............................................................................................................................................. 46
18. The growing burden of noncommunicable disease................................................................................................................................. 47
19. The unequal burden of injury ................................................................................................................................................................. 48
20. Projected burden of disease in 2030 ....................................................................................................................................................... 49
Annex A: Deaths and DALYs 2004: Annex tables 53Table A1: Deaths by cause, sex and income group in WHO regions, estimates for 2004 ................................................................................... 54
Table A2: Burden of disease in DALYs by cause, sex and income group in WHO regions, estimates for 2004 .................................................... 60
Table A3: Deaths by cause and broad age group, countries grouped by income per capita, 2004 .................................................................... 66
Table A4: Burden of disease in DALYs by cause and broad age group, countries grouped by income per capita, 2004 ..................................... 69
Table A5: Deaths by cause, sex and age group, countries grouped by income per capita, 2004 ....................................................................... 72
Table A6: Burden of disease in DALYs by cause, sex and age group, countries grouped by income per capita, 2004 ......................................... 84
iv
World Health Organization
Annex B: Data sources and methods 97B1. Population and all-cause mortality estimates for 2004 .......................................................................................................................... 98
B2. Estimation of deaths by cause ................................................................................................................................................................ 98
B3. Causes of death for children aged under five years ............................................................................................................................... 103
B4. YLD revisions ........................................................................................................................................................................................ 106
B5. Cause-specific revisions and updates .................................................................................................................................................... 106
B6. Prevalence of long-term disability ........................................................................................................................................................ 116
B7. Projections of mortality and burden of disease ..................................................................................................................................... 117
B8. Uncertainty of estimates and projections ............................................................................................................................................. 117
Annex C: Analysis categories and mortality data sources 119Table C1: Countries grouped by WHO region and income per capita, 2004 .................................................................................................... 120
Table C2: Countries grouped by income per capita, 2004............................................................................................................................... 121
Table C3: GBD cause categories and ICD codes ............................................................................................................................................... 122
Table C4: Data sources and methods for estimation of mortality by cause, age and sex ................................................................................ 126
References 133
v
Global Burden of Disease 2004
TablesTable 1: Leading causes of death, all ages, 2004 ............................................................................................................................................. 11
Table 2: Leading causes of death by income group, 2004 ................................................................................................................................ 12
Table 3: Ranking of most common cancers among men and women according to the number of deaths, by cancer site and region, 2004..... 13
Table 4: Distribution of child deaths for selected causes by selected WHO region, 2004 .................................................................................. 16
Table 5: Incidence of selected conditions by WHO region, 2004....................................................................................................................... 28
Table 6 : Cancer incidence by site, by WHO region, 2004 .................................................................................................................................. 30
Table 7: Prevalence of selected conditions by WHO region, 2004..................................................................................................................... 32
Table 8: Disability classes for the GBD study, with examples of long-term disease and injury sequelae falling in each class ........................... 33
Table 9: Estimated prevalence of moderate and severe disability for leading disabling conditions by age,
for high-income and low- and middle-income countries, 2004 .............................................................................................................. 35
Table 10: Leading global causes of YLD by sex, 2004 ....................................................................................................................................... 37
Table 11: Leading global causes of YLD, high-income and low- and middle-income countries, 2004 .............................................................. 37
Table 12: Leading causes of burden of disease (DALYs), all ages, 2004 ............................................................................................................ 43
Table 13: Leading causes of burden of disease (DALYs), countries grouped by income, 2004 ........................................................................... 44
Table 14: Leading causes of burden of disease (DALYs) by WHO region, 2004 .................................................................................................. 45
Table A1: Deaths by cause, sex and income group in WHO regions, estimates for 2004 ................................................................................... 54
Table A2: Burden of disease in DALYs by cause, sex and income group in WHO regions, estimates for 2004 .................................................... 60
Table A3: Deaths by cause and broad age group, countries grouped by income per capita, 2004 .................................................................... 66
Table A4: Burden of disease in DALYs by cause and broad age group, countries grouped by income per capita, 2004 ..................................... 69
Table A5: Deaths by cause, sex and age group, countries grouped by income per capita, 2004 ....................................................................... 72
Table A5a: Deaths by age, sex, cause in the world, 2004 ........................................................................................................................... 72
Table A5b: Deaths by age, sex, cause in high-income countries, 2004 ....................................................................................................... 75
Table A5c: Deaths by age, sex, cause in middle-income countries, 2004 ................................................................................................... 78
Table A5d: Deaths by age, sex, cause in low-income countries, 2004 ........................................................................................................ 81
Table A6: Burden of disease in DALYs by cause, sex and age group, countries grouped by income per capita, 2004 ......................................... 84
Table A6a: DALYs by age, sex, cause in the world, 2004 ............................................................................................................................. 84
Table A6b: DALYs by age, sex, cause in high-income countries, 2004 ......................................................................................................... 87
Table A6c: DALYs by age, sex, cause in middle-income countries, 2004 ..................................................................................................... 90
Table A6d: DALYs by age, sex, cause in low-income countries, 2004 .......................................................................................................... 93
Table B1: Methods and data for cause-of-death estimation for 2004, by WHO region................................................................................... 100
Table B2: Distribution of deaths by stratum from the Chinese sample vital registration system (VR)
and the Disease Surveillance Points system (DSP) ................................................................................................................................ 101
Table B3: Mapping of severe neonatal infection deaths to GBD cause categories .......................................................................................... 105
Table B4: Data inputs and assumptions for estimation of postneonatal deaths by cause .............................................................................. 105
Table B5: Estimated malaria cases (episodes of illness) by WHO region, 2004 ............................................................................................... 109
Table C1: Countries grouped by WHO region and income per capita, 2004 .................................................................................................... 120
Table C2: Countries grouped by income per capita, 2004............................................................................................................................... 121
Table C3: GBD cause categories and ICD codes ............................................................................................................................................... 122
Table C4: Data sources and methods for estimation of mortality by cause, age and sex ................................................................................ 126
vi
World Health Organization
FiguresMap 1: Low- and middle-income countries grouped by WHO region, 2004 ....................................................................................................... 5
Figure 1: Distribution of age at death and numbers of deaths, world, 2004 ..................................................................................................... 9
Figure 2: Per cent distribution of age at death by region, 2004 ......................................................................................................................... 9
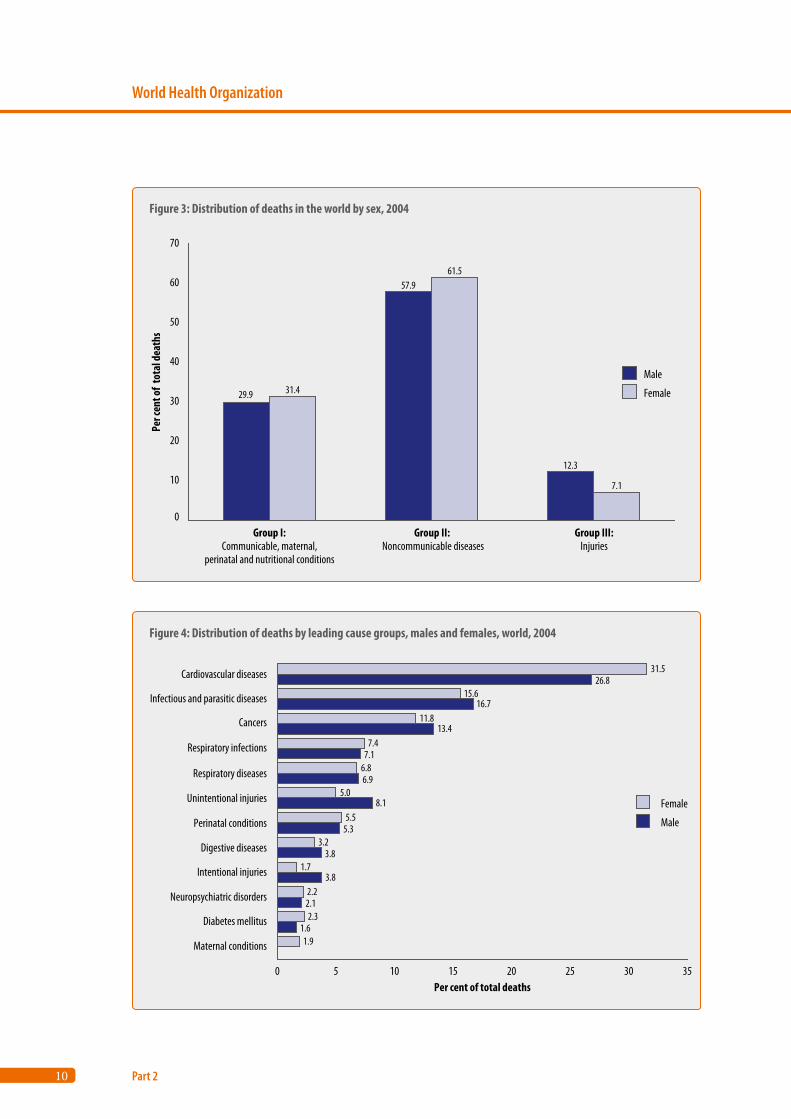
Figure 3: Distribution of deaths in the world by sex, 2004 ............................................................................................................................... 10
Figure 4: Distribution of deaths by leading cause groups, males and females, world, 2004 ............................................................................ 10
Figure 5 : Distribution of causes of death among children aged under five years and within the neonatal period, 2004 ................................ 14
Figure 6: Child mortality rates by cause and region, 2004 ............................................................................................................................... 15
Figure 7: Adult mortality rates by major cause group and region, 2004 .......................................................................................................... 17
Figure 8: Mortality rates among men and women aged 15–59 years, region and cause-of-death group, 2004 .............................................. 18
Figure 9: Adult mortality rates among those aged 15–59 years in the African Region, by sex and major cause group, 2004 .......................... 19
Figure 10: Causes of injury deaths among men aged 15–59 years, Eastern Mediterranean Region, 2004 ....................................................... 20
Figure 11: Adult mortality among those aged 15–59 years in the low- and middle-income countries of the European Region
by sex and major cause grouping, 2004 .................................................................................................................................................. 20
Figure 12: Adult mortality among those aged 15–59 years in the low- and middle-income countries of the Americas
by sex and major cause grouping, 2004 .................................................................................................................................................. 21
Figure 13: Comparison of the proportional distribution of deaths and YLL by region, 2004 ............................................................................. 22
Figure 14: Comparison of the proportional distribution of deaths and YLL by leading cause of death, 2004 ................................................... 23
Figure 15: Projected deaths by cause for high-, middle- and low-income countries ........................................................................................ 24
Figure 16: Projected global deaths for selected causes, 2004–2030 ................................................................................................................ 25
Figure 17: Decomposition of projected changes in annual numbers of deaths by income group, 2004-2030 ................................................. 26
Figure 18: Age-standardized incidence rates for cancers by WHO region, 2004 .............................................................................................. 30
Figure 19: Estimated prevalence of moderate and severe disability by region, sex and age, global burden of disease estimates for 2004 ..... 33
Figure 20 : YLL, YLD and DALYs by region, 2004 ............................................................................................................................................... 41
Figure 21: Burden of disease by broad cause group and region, 2004 ............................................................................................................. 41
Figure 22: Age distribution of burden of disease by income group, 2004 ........................................................................................................ 42
Figure 23: Leading causes of disease burden for women aged 15–44 years, high-income countries,
and low- and middle-income countries, 2004 ........................................................................................................................................ 46
Figure 24: Major causes of disease burden for women aged 15–59 years, high-income countries,
and low- and middle-income countries by WHO region, 2004 ................................................................................................................ 47
Figure 25: Age-standardized DALYs for noncommunicable diseases by major cause group, sex and country income group, 2004................... 48
Figure 26: Burden of injuries (DALYs) by external cause, sex and WHO region, 2004........................................................................................ 49
Figure 27: Ten leading causes of burden of disease, world, 2004 and 2030 ..................................................................................................... 51
Figure B1: Comparison of major cause group proportional mortality for the WHO African Region, GBD 2004 and GBD 2002 ........................ 101
vii
Global Burden of Disease 2004
AbbreviationsAIDS ........... acquired immune deficiency syndromeAMI ............ acute myocardial infarctionCHERG ........ Child Health Epidemiology Reference GroupCodMod ...... GBD cause of death modelCOPD .......... chronic obstructive pulmonary diseaseDALY........... disability-adjusted life yearDSP ............ Disease Surveillance Points system (China)GBD ........... global burden of disease HIV ............ human immunodeficiency virusIARC ........... International Agency for Research on CancerICD ............. International Classification of DiseasesINDEPTH International Network for field sites with continuous Demographic Evaluation of Populations and Their Health in developing countriesMERG ......... Malaria Epidemiology Reference GroupRBM ........... Roll Back Malaria PartnershipSTD ............ sexually transmitted diseaseTB .............. tuberculosisUNAIDS ....... Joint United Nations Programme on HIV/AIDSUNICEF ....... United Nations Children’s FundVR .............. vital registration systemWHO .......... World Health OrganizationYLD ............ years lost due to disability YLL ............. years of life lost (due to premature mortality)

1
Part 1
Introduction
Overview of the Global Burden of Disease Study 2
What is new in this update for 2004? 3
Regional estimates for 2004 5
2
World Health Organization
Part 1
Overview of the Global Burden of Disease Study
A consistent and comparative description of the burden of diseases and injuries, and risk factors that cause them, is an important input to health deci-sion-making and planning processes. Information that is available on mortality and health in popu-lations in all regions of the world is fragmentary and sometimes inconsistent. Thus, a framework for integrating, validating, analysing and disseminating such information is needed to assess the compara-tive importance of diseases and injuries in causing premature death, loss of health and disability in dif-ferent populations.
The first Global Burden of Disease (GBD) Study quantified the health effects of more than 100 dis-eases and injuries for eight regions of the world in 1990 (1–3). It generated comprehensive and inter-nally consistent estimates of mortality and morbid-ity by age, sex and region (4). The study also intro-duced a new metric – the disability-adjusted life year (DALY) – as a single measure to quantify the burden of diseases, injuries and risk factors (5). The DALY is based on years of life lost from premature death and years of life lived in less than full health; more information is given in Box 1.
Drawing on extensive databases and informa-tion provided by Member States, the World Health Organization (WHO) prepared updated burden of disease assessments for the years 2000–2002, the most recent version being published in the World health report 2004 (6). Following a country consul-tation process, country-specific estimates for 2002 were also published on the WHO web site (7). The GBD results for the year 2001 also provided a frame-work for cost-effectiveness and priority setting anal-yses carried out for the Disease Control Priorities Project (DCPP), a joint project of the World Bank, WHO and the National Institutes of Health, funded by the Bill & Melinda Gates Foundation (8). The GBD results were documented in detail, with infor-mation on data sources and methods, and analyses of uncertainty and sensitivity, in a book published as part of the DCPP (9).
The production and dissemination of health information for health action at the country, regional and global levels are core WHO activities mandated by the Member States in the Constitution. In her speech to the World Health Assembly in May 2007, the WHO Director-General, Dr Margaret Chan, noted, “Reliable health data and statistics are the foundation of health policies, strategies, and evalu-ation and monitoring”. She also noted, “Evidence is also the foundation for sound health information for the general public”.
World Health Assembly Resolution 60.27 (WHA60.27), adopted at the Assembly in 2007, requested the WHO Director-General to “…strengthen the information and evidence culture of the Organization and to ensure the use of accurate and timely health statistics in order to generate evi-dence for major policy decisions and recommenda-tions within WHO”. As part of the response to this request, the WHO Department of Health Statistics and Informatics has undertaken an update of the 1990 GBD study to produce comprehensive, compa-rable and consistent estimates of mortality and bur-den of disease by cause for all regions of the world in 2004. This update builds on the previous GBD analysis for 2002; revisions, new data and meth-ods are summarized below. The standard DALYs reported here use 3% discounting and non-uniform age weights and differ from the discounted but non-age-weighted DALYs used in the DCPP (9).
The Bill & Melinda Gates Foundation has pro-vided funding for a new GBD 2005 study to be pub-lished in late 2010. The study is led by the Institute for Health Metrics and Evaluation at the University of Washington, with key collaborating institutions including WHO, Harvard University, Johns Hop-kins University and the University of Queensland (10). The GBD 2005 study will develop improved methods to make full use of the increasing amount of health data, particularly from developing coun-tries, and will include a comprehensive and consist-ent revision of disability weights. The study will also assess trends in the global burden of disease from 1990 to 2005.
3
Global Burden of Disease 2004
Introduction
1
2
3
4
Annex A
Annex B
Annex C
References
Box 1: The disability-adjusted life year
The disability-adjusted life year (DALY) extends the concept of potential years of life lost due to premature death to include
equivalent years of “healthy” life lost by virtue of being in states of poor health or disability (3). One DALY can be thought of
as one lost year of “healthy” life, and the burden of disease can be thought of as a measurement of the gap between current
health status and an ideal situation where everyone lives into old age, free of disease and disability.
DALYs for a disease or injury cause are calculated as the sum of the years of life lost due to premature mortality (YLL) in the
population and the years lost due to disability (YLD) for incident cases of the disease or injury. YLL are calculated from the
number of deaths at each age multiplied by a global standard life expectancy for each age. YLD for a particular cause in a
particular time period are estimated as follows:
YLD = number of incident cases in that period × average duration of the disease × weight factor
The weight factor reflects the severity of the disease on a scale from 0 (perfect health) to 1 (death). The weights used for the
GBD 2004 are listed in Annex Table A6 of Mathers et al. (11).
In the standard DALYs reported here and in recent World Health Reports, calculations of YLL and YLD used an additional 3%
time discounting and non-uniform age weights that give less weight to years lived at young and older ages (6). Using dis-
counting and age weights, a death in infancy corresponds to 33 DALYs, and deaths at ages 5–20 years to around 36 DALYs.
What is new in this update for 2004?
This update for 2004 builds on previous analyses for 2002 (6). It does not include a complete review and revision of data inputs and estimates for every cause. The methods and data sources are described in more detail in Annex B. The main changes in the 2004 estimates are listed below.• A complete update was undertaken for estimated
deaths by age, sex and cause for all WHO Mem-ber States. There were 192 Member States in 2004. The update was based on:• all-cause mortality estimates from WHO
life tables for 2004, adjusted for revisions in estimates for deaths from acquired immune deficiency syndrome (AIDS) resulting from infection with human immunodeficiency virus (HIV), wars, civil conflicts and natural disasters;
• latest death registration data reported to WHO for 112 Member States;
• updated country-level mortality estimates for all Member States for 17 specific causes: HIV/AIDS, tuberculosis (TB), diphtheria, mea-sles, pertussis, poliomyelitis, tetanus, dengue, malaria, schistosomiasis, trypanosomiasis, Japanese encephalitis, Chagas disease, mater-nal conditions, abortion, cancers, war and
conflict;• incorporation of cause-specific and multicause
models – developed by the WHO Child Health Epidemiology Reference Group (CHERG) – for causes of child deaths under five years of age and for neonatal deaths (deaths within the first four weeks after birth), with model inputs updated for the year 2004; the resulting cause-specific estimates were adjusted country by country for consistency with estimated total deaths for neonates, infants and children aged under five years;
• revision of cause-of-death models for coun-tries without usable death registration data; regional patterns for detailed cause-of-death distributions were updated for African coun-tries using a greater range of information on cause-of-death distributions in Africa.
• Estimates of years lost due to disability (YLD) were revised for 52 causes where updated infor-mation for incidence or prevalence was available. Revisions resulting in significant change are noted below. For other causes, YLD estimates from the GBD 2002 were projected from 2002 to 2004 (see Annex Section B5 for details).
• Incidence, prevalence and mortality for HIV/AIDS were based on the most recent esti-mates released by WHO and the Joint United
4
World Health Organization
Part 1
Nations Programme on HIV/AIDS (UNAIDS) (12). Advances in methodology, applied to an increased range of country data, have resulted in substantial changes in estimates. The global prevalence of HIV infections for 2004 was revised from the 38 million estimated in 2006 down to 32 million – a reduction of 16%. Similarly, the estimated global deaths due to HIV/AIDS were revised from 2.7 million to 2.0 million for 2004. YLD estimates for HIV/AIDS were also revised to take into account coverage of antiretroviral drugs and associated increased survival times.
• Updated estimates for vaccine-preventable childhood diseases were prepared by the WHO Department of Immunization, Vaccines and Bio-logicals using estimates for vaccine coverage in 2004 prepared by WHO and UNICEF (United Nations Children’s Fund).
• Revised incidence and mortality estimates for all forms of malaria, and for Plasmodium falciparum specifically, were based on estimates and analyses prepared by the Roll Back Malaria (RBM) Part-nership, CHERG and the Malaria Epidemiology Reference Group (MERG), together with data from national case reports. Estimates for mortal-ity for ages five years and above were revised using a transmission-intensity-based model, resulting in an increased proportion of such deaths (21% globally in 2004, compared to 10% in the GBD 2002 estimates).
• Estimates for tropical diseases, including dengue fever and Japanese encephalitis, were revised to take into account the latest WHO data on popula-tions at risk, levels of endemicity, reported cases, treatment coverage and case fatality.
• Recent WHO updates of country-level preva-lences of underweight, stunting and wasting in children (based on the new WHO growth standards), and anaemia prevalence, were used to update estimates for protein–energy malnutri-tion and iron-deficiency anaemia.
• Site-specific cancer incidence and mortality estimates were updated using revised estimates of site-specific survival probabilities for 2004, together with site-specific incidence distributions
from the Globocan 2002 database of the Interna-tional Agency for Research on Cancer (IARC).
• Diabetes incidence and prevalence estimates were updated to take into account a number of recently published population surveys that used oral glu-cose tolerance tests and WHO criteria to measure diabetes prevalence.
• Incidence and prevalence estimates for alcohol dependence and problem use were revised based on a new review restricted to studies conducted after 1990 that used one of three high-quality survey instruments. Disability weights for alcohol use disorders were revised downwards from 0.18 to 0.122–0.137 (depending on age and sex), based on analyses of the WHO Multi-country Survey Study.
• Prevalence estimates for low vision and blindness due to specific disease and injury causes were revised to take into account WHO analysis of regional distributions for causes of blindness. A recent WHO analysis of surveys measuring pre-senting vision loss was used to estimate YLD for an additional cause – “refractive errors”. Previous GBD estimates for vision loss based on “best cor-rected” vision did not include correctable refrac-tive errors.
• For the calculation of YLD for ischaemic heart disease, the model used to estimate the incidence and prevalence of angina pectoris was revised using recent analyses in national burden of disease studies. These revisions resulted in an increase in the estimated global prevalence of angina pectoris from 25 million in 2002 to 54 million in 2004, and a corresponding 78% increase in YLD and 7% increase in DALYs for ischaemic heart disease.
• Data from two recent national burden of disease studies were used to recalibrate the long-term case fatality rates for stroke survivors, resulting in a reduction in the estimated prevalence of stroke survivors from 50 million to 30 million, and a 30% reduction in YLD for cerebrovascular disease.
• Population estimates for 2004 were based on the latest revisions by the United Nations Population Division (13).
5
Global Burden of Disease 2004
Introduction
1
2
3
4
Annex A
Annex B
Annex C
References
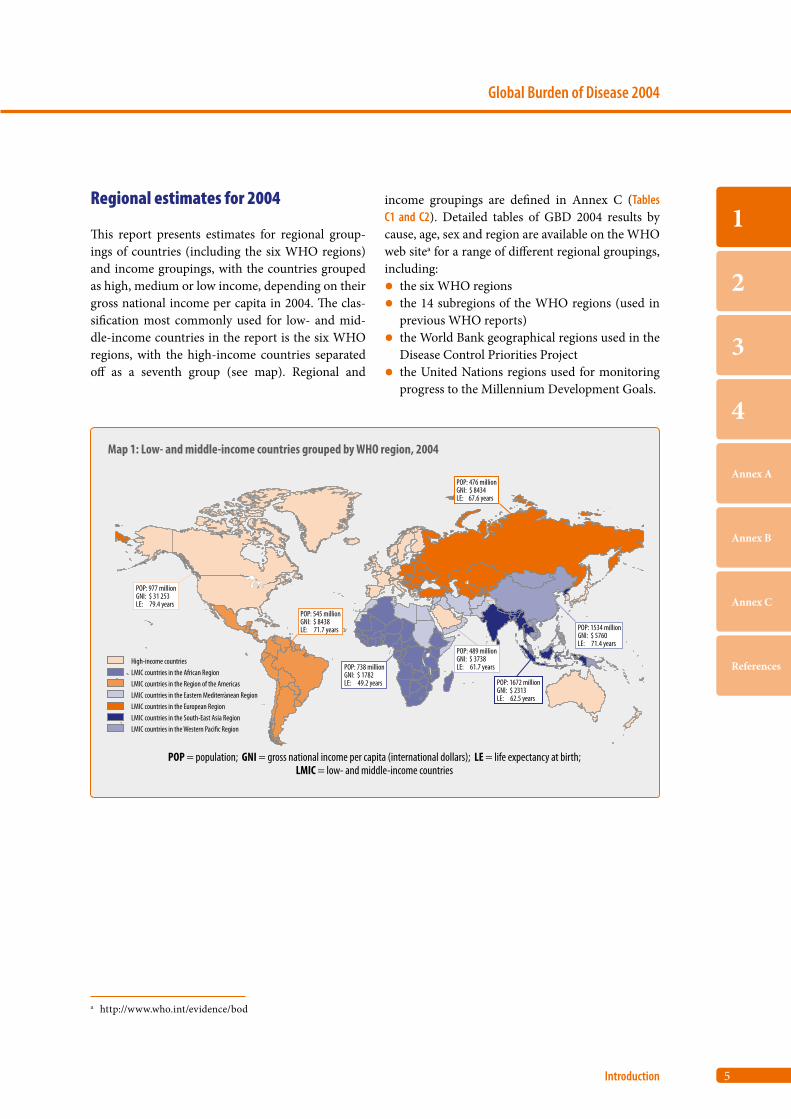
Regional estimates for 2004
This report presents estimates for regional group-ings of countries (including the six WHO regions) and income groupings, with the countries grouped as high, medium or low income, depending on their gross national income per capita in 2004. The clas-sification most commonly used for low- and mid-dle-income countries in the report is the six WHO regions, with the high-income countries separated off as a seventh group (see map). Regional and
income groupings are defined in Annex C (Tables C1 and C2). Detailed tables of GBD 2004 results by cause, age, sex and region are available on the WHO web sitea for a range of different regional groupings, including:• the six WHO regions• the 14 subregions of the WHO regions (used in
previous WHO reports)• the World Bank geographical regions used in the
Disease Control Priorities Project• the United Nations regions used for monitoring
progress to the Millennium Development Goals.
a http://www.who.int/evidence/bod
Map 1: Low- and middle-income countries grouped by WHO region, 2004
High-income countriesLMIC countries in the African RegionLMIC countries in the Region of the AmericasLMIC countries in the Eastern Mediterranean RegionLMIC countries in the European RegionLMIC countries in the South-East Asia Region LMIC countries in the Western Paci�c Region
POP: 977 millionGNI: $ 31 253LE: 79.4 years
POP = population; GNI = gross national income per capita (international dollars); LE = life expectancy at birth;LMIC = low- and middle-income countries
POP: 545 millionGNI: $ 8438LE: 71.7 years
POP: 738 millionGNI: $ 1782LE: 49.2 years POP: 1672 million
GNI: $ 2313LE: 62.5 years
POP: 1534 millionGNI: $ 5760LE: 71.4 years
POP: 489 millionGNI: $ 3738LE: 61.7 years
POP: 476 millionGNI: $ 8434LE: 67.6 years

Part 2
Causes of death
1. Deaths in 2004: who and where? 8
2. Deaths by broad cause groups 8
3. Leading causes of death 11
4. Cancer mortality 12
5. Causes of death among children aged under five years 14
6. Causes of death among adults aged 15–59 years 17
7. Years of life lost: taking age at death into account 21
8. Projected trends in global mortality: 2004–2030 22
8
World Health Organization
Part 2
1. Deaths in 2004: who and where?
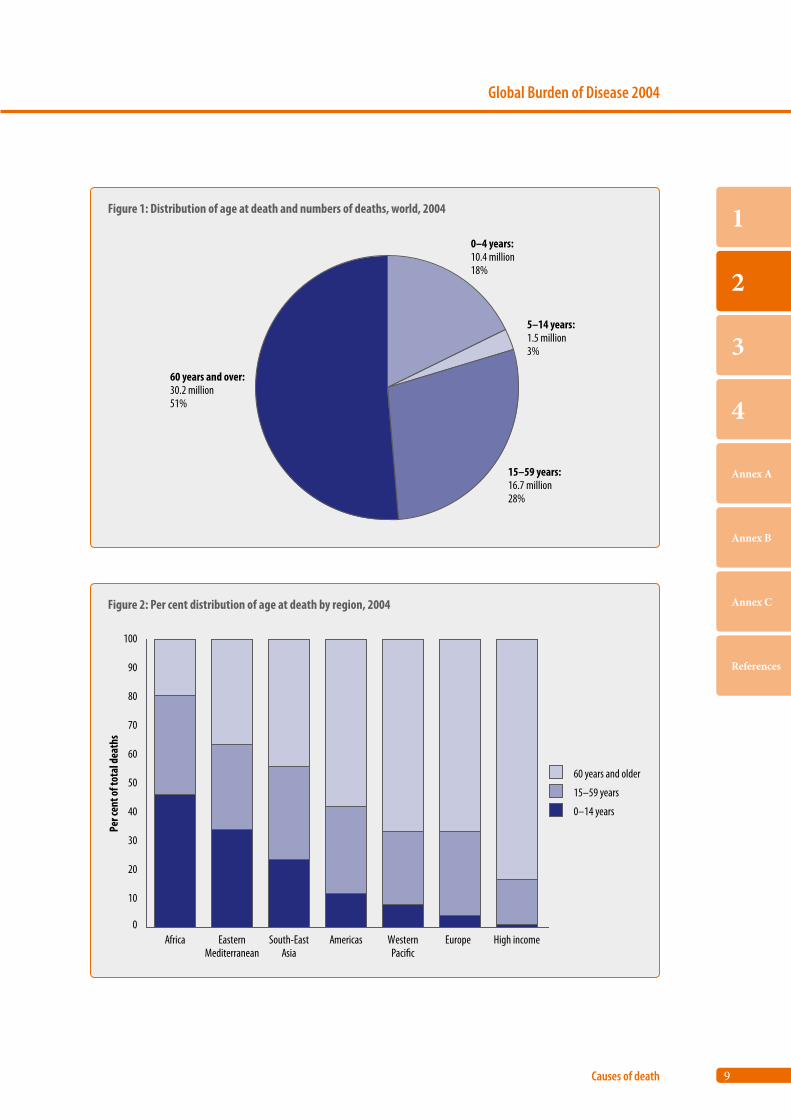
Almost one in five of all deaths are of children aged under five years
In 2004, an estimated 58.8 million deaths occurred globally, of which 27.7 million were females and 31.1 million males. More than half of all deaths involved people 60 years and older, of whom 22 million were people aged 70 years and older, and 10.7 million were people aged 80 years and older. Almost one in five deaths in the world was of a child under the age of five years (Figure 1).
In Africa, death takes the young; in high-income countries, death takes the old
The distribution of deaths by age differs markedly between regions. In the African Region, 46% of all deaths were children aged under 15 years, whereas only 20% were people aged 60 years and over. In contrast, in the high-income countries, only 1% of deaths were children aged under 15 years, whereas 84% were people aged 60 years and older. There were also large differences in the Asia and Pacific regions. In the South-East Asia Region, 24% of deaths were of children aged under 15 years, compared with 8% in the low- and middle-income countries of the Western Pacific Region, where 67% of deaths were of people aged 60 years and older (Figure 2).
2. Deaths by broad cause groups
Out of every 10 deaths, 6 are due to noncommunica-ble conditions; 3 to communicable, reproductive or nutritional conditions; and 1 to injuries
The GBD study classifies disease and injury, causes of death and burden of disease into three broad cause groups:
• Group I – communicable, maternal, perinatal and nutritional conditions
• Group II – noncommunicable diseases• Group III – injuries.
Group I causes are conditions that occur largely in poorer populations, and typically decline at a faster pace than all-cause mortality during the epidemio-logical transition (in which the pattern of mortality shifts from high death rates from Group I causes at younger ages to chronic diseases at older ages). Among both men and women, most deaths are due to noncommunicable conditions (Group II), and they account for about 6 out of 10 deaths globally. Communicable, maternal, perinatal and nutritional conditions are responsible for just under one third of deaths in both males and females. The largest dif-ference between the sexes occurs for Group III, with injuries accounting for almost 1 in 8 male deaths and 1 in 14 female deaths (Figure 3).
Cardiovascular diseases are the leading cause of death
Figure 4 shows the distribution of deaths at all ages for 12 major cause groups (groups responsible for at least 2% of all deaths, plus maternal conditions). This illustrates the relative importance of the respective causes of death and of male–female differences. Car-diovascular diseases are the leading cause of death in the world, particularly among women; such diseases caused almost 32% of all deaths in women and 27% in men in 2004. Infectious and parasitic diseases are the next leading cause, followed by cancers, but these groupings show much smaller overall sex dif-ferentials. The largest differences between men and women are observed for intentional injuries (twice as high among men) and unintentional injuries. Maternal conditions account for 1.9% of all female deaths. The respiratory infections are treated by the GBD as a separate cause group from infectious and parasitic diseases, and are to be distinguished from respiratory diseases, which refers to noncommuni-cable respiratory diseases (refer to Annex Table C3).
9
Global Burden of Disease 2004
Causes of death
1
2
3
4
Annex A
Annex B
Annex C
References
Figure 1: Distribution of age at death and numbers of deaths, world, 2004
0–4 years:10.4 million18%
5–14 years:1.5 million3%
15–59 years:16.7 million28%
60 years and over:30.2 million51%
Figure 2: Per cent distribution of age at death by region, 2004
0
10
20
30
40
50
60
70
80
90
100
Africa EasternMediterranean
South-EastAsia
Americas WesternPaci�c
Europe High income
Per c
ent o
f tot
al de
aths
60 years and older
15–59 years
0–14 years
10
World Health Organization
Part 2
Figure 4: Distribution of deaths by leading cause groups, males and females, world, 2004
0 5 10 15 20 25 30 35
Maternal conditions
Diabetes mellitus
Neuropsychiatric disorders
Intentional injuries
Digestive diseases
Perinatal conditions
Unintentional injuries
Respiratory diseases
Respiratory infections
Cancers
Infectious and parasitic diseases
Cardiovascular diseases
Per cent of total deaths
31.526.8
15.616.7
11.813.4
7.47.1
6.86.9
5.08.1
5.55.3
3.23.8
1.73.8
2.22.12.3
1.61.9
Female
Male
Figure 3: Distribution of deaths in the world by sex, 2004
29.9
0
10
20
30
40
50
60
70
Group I:Communicable, maternal,
perinatal and nutritional conditions
Group II: Noncommunicable diseases
Group III:Injuries
Per c
ent o
f to
tal d
eath
s
31.4
57.961.5
12.3
7.1
Male
Female
11
Global Burden of Disease 2004
Causes of death
1
2
3
4
Annex A
Annex B
Annex C
References
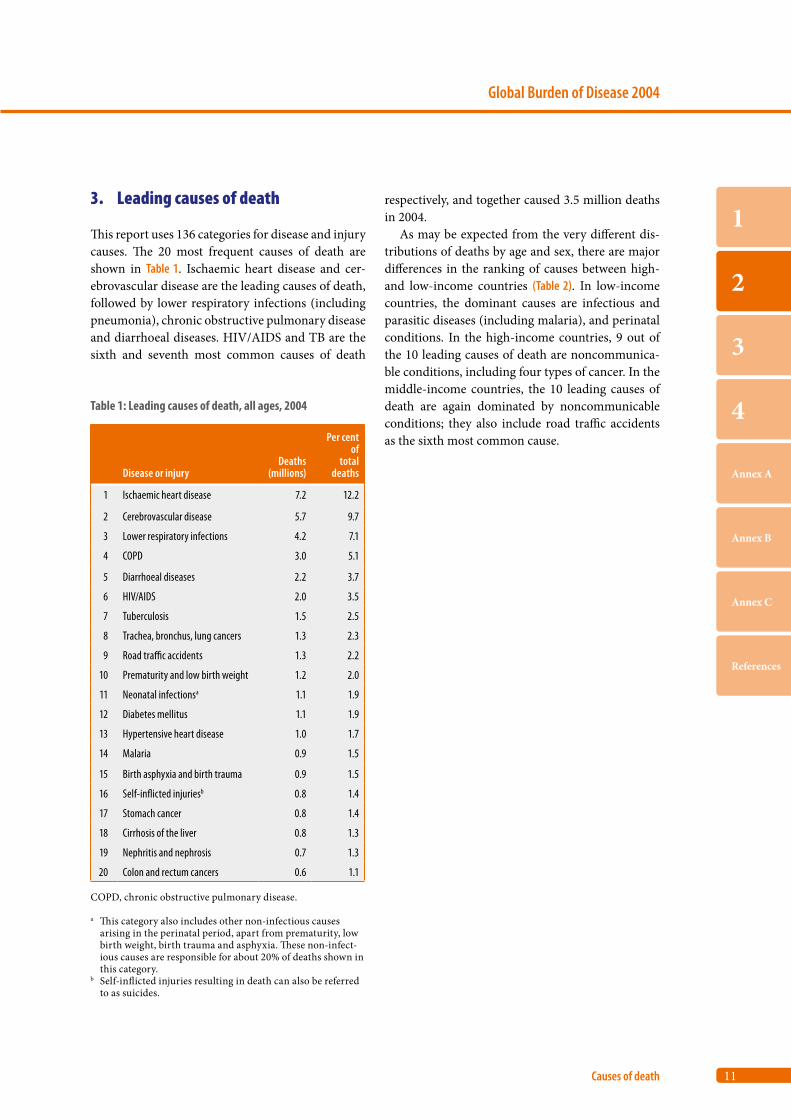
3. Leading causes of death
This report uses 136 categories for disease and injury causes. The 20 most frequent causes of death are shown in Table 1. Ischaemic heart disease and cer-ebrovascular disease are the leading causes of death, followed by lower respiratory infections (including pneumonia), chronic obstructive pulmonary disease and diarrhoeal diseases. HIV/AIDS and TB are the sixth and seventh most common causes of death
respectively, and together caused 3.5 million deaths in 2004.
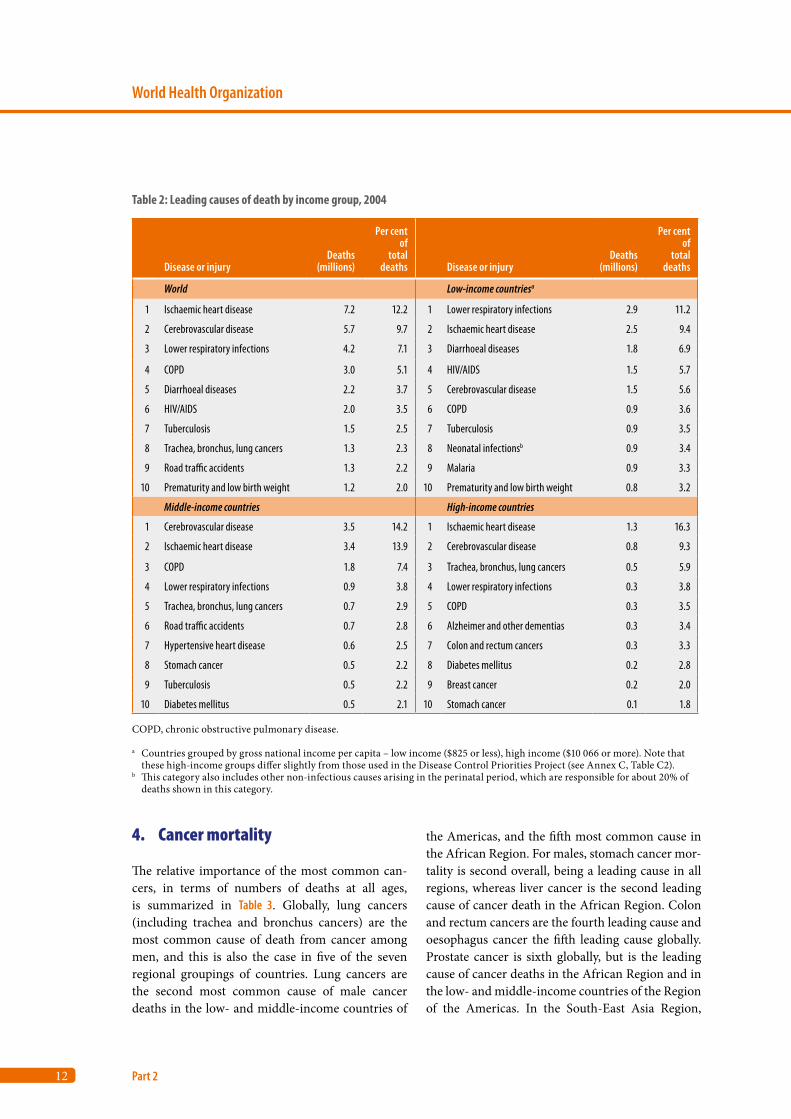
As may be expected from the very different dis-tributions of deaths by age and sex, there are major differences in the ranking of causes between high- and low-income countries (Table 2). In low-income countries, the dominant causes are infectious and parasitic diseases (including malaria), and perinatal conditions. In the high-income countries, 9 out of the 10 leading causes of death are noncommunica-ble conditions, including four types of cancer. In the middle-income countries, the 10 leading causes of death are again dominated by noncommunicable conditions; they also include road traffic accidents as the sixth most common cause.
Table 1: Leading causes of death, all ages, 2004
Disease or injuryDeaths
(millions)
Per cent of
totaldeaths
1 Ischaemic heart disease 7.2 12.2
2 Cerebrovascular disease 5.7 9.7
3 Lower respiratory infections 4.2 7.1
4 COPD 3.0 5.1
5 Diarrhoeal diseases 2.2 3.7
6 HIV/AIDS 2.0 3.5
7 Tuberculosis 1.5 2.5
8 Trachea, bronchus, lung cancers 1.3 2.3
9 Road traffic accidents 1.3 2.2
10 Prematurity and low birth weight 1.2 2.0
11 Neonatal infectionsa 1.1 1.9
12 Diabetes mellitus 1.1 1.9
13 Hypertensive heart disease 1.0 1.7
14 Malaria 0.9 1.5
15 Birth asphyxia and birth trauma 0.9 1.5
16 Self-inflicted injuriesb 0.8 1.4
17 Stomach cancer 0.8 1.4
18 Cirrhosis of the liver 0.8 1.3
19 Nephritis and nephrosis 0.7 1.3
20 Colon and rectum cancers 0.6 1.1
COPD, chronic obstructive pulmonary disease.
a This category also includes other non-infectious causes arising in the perinatal period, apart from prematurity, low birth weight, birth trauma and asphyxia. These non-infect-ious causes are responsible for about 20% of deaths shown in this category.
b Self-inflicted injuries resulting in death can also be referred to as suicides.
12
World Health Organization
Part 2
Table 2: Leading causes of death by income group, 2004
Disease or injuryDeaths
(millions)
Per cent of
total deaths Disease or injury
Deaths(millions)
Per cent of
total deaths
World Low-income countriesa
1 Ischaemic heart disease 7.2 12.2 1 Lower respiratory infections 2.9 11.2
2 Cerebrovascular disease 5.7 9.7 2 Ischaemic heart disease 2.5 9.4
3 Lower respiratory infections 4.2 7.1 3 Diarrhoeal diseases 1.8 6.9
4 COPD 3.0 5.1 4 HIV/AIDS 1.5 5.7
5 Diarrhoeal diseases 2.2 3.7 5 Cerebrovascular disease 1.5 5.6
6 HIV/AIDS 2.0 3.5 6 COPD 0.9 3.6
7 Tuberculosis 1.5 2.5 7 Tuberculosis 0.9 3.5
8 Trachea, bronchus, lung cancers 1.3 2.3 8 Neonatal infectionsb 0.9 3.4
9 Road traffic accidents 1.3 2.2 9 Malaria 0.9 3.3
10 Prematurity and low birth weight 1.2 2.0 10 Prematurity and low birth weight 0.8 3.2
Middle-income countries High-income countries
1 Cerebrovascular disease 3.5 14.2 1 Ischaemic heart disease 1.3 16.3
2 Ischaemic heart disease 3.4 13.9 2 Cerebrovascular disease 0.8 9.3
3 COPD 1.8 7.4 3 Trachea, bronchus, lung cancers 0.5 5.9
4 Lower respiratory infections 0.9 3.8 4 Lower respiratory infections 0.3 3.8
5 Trachea, bronchus, lung cancers 0.7 2.9 5 COPD 0.3 3.5
6 Road traffic accidents 0.7 2.8 6 Alzheimer and other dementias 0.3 3.4
7 Hypertensive heart disease 0.6 2.5 7 Colon and rectum cancers 0.3 3.3
8 Stomach cancer 0.5 2.2 8 Diabetes mellitus 0.2 2.8
9 Tuberculosis 0.5 2.2 9 Breast cancer 0.2 2.0
10 Diabetes mellitus 0.5 2.1 10 Stomach cancer 0.1 1.8
COPD, chronic obstructive pulmonary disease.
a Countries grouped by gross national income per capita – low income ($825 or less), high income ($10 066 or more). Note that these high-income groups differ slightly from those used in the Disease Control Priorities Project (see Annex C, Table C2).
b This category also includes other non-infectious causes arising in the perinatal period, which are responsible for about 20% of deaths shown in this category.
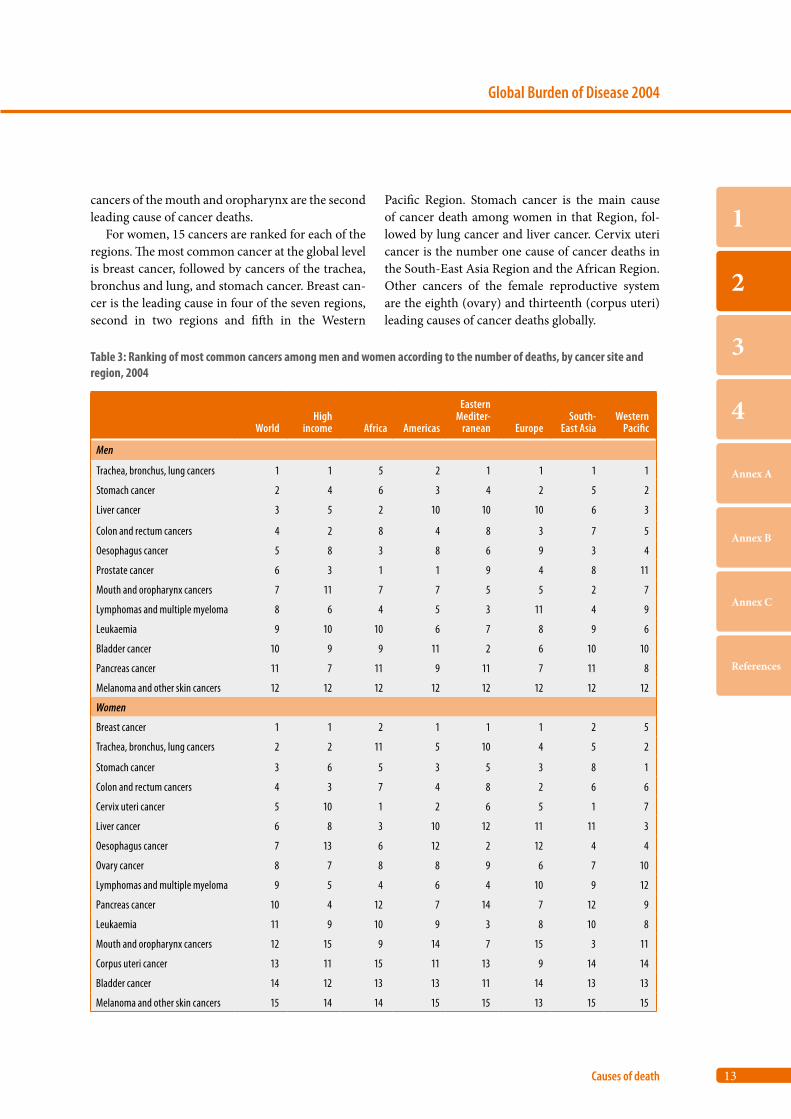
4. Cancer mortality
The relative importance of the most common can-cers, in terms of numbers of deaths at all ages, is summarized in Table 3. Globally, lung cancers (including trachea and bronchus cancers) are the most common cause of death from cancer among men, and this is also the case in five of the seven regional groupings of countries. Lung cancers are the second most common cause of male cancer deaths in the low- and middle-income countries of
the Americas, and the fifth most common cause in the African Region. For males, stomach cancer mor-tality is second overall, being a leading cause in all regions, whereas liver cancer is the second leading cause of cancer death in the African Region. Colon and rectum cancers are the fourth leading cause and oesophagus cancer the fifth leading cause globally. Prostate cancer is sixth globally, but is the leading cause of cancer deaths in the African Region and in the low- and middle-income countries of the Region of the Americas. In the South-East Asia Region,
13
Global Burden of Disease 2004
Causes of death
1
2
3
4
Annex A
Annex B
Annex C
References
cancers of the mouth and oropharynx are the second leading cause of cancer deaths.
For women, 15 cancers are ranked for each of the regions. The most common cancer at the global level is breast cancer, followed by cancers of the trachea, bronchus and lung, and stomach cancer. Breast can-cer is the leading cause in four of the seven regions, second in two regions and fifth in the Western
Pacific Region. Stomach cancer is the main cause of cancer death among women in that Region, fol-lowed by lung cancer and liver cancer. Cervix uteri cancer is the number one cause of cancer deaths in the South-East Asia Region and the African Region. Other cancers of the female reproductive system are the eighth (ovary) and thirteenth (corpus uteri) leading causes of cancer deaths globally.
Table 3: Ranking of most common cancers among men and women according to the number of deaths, by cancer site and region, 2004
WorldHigh
income Africa Americas
Eastern Mediter-
ranean EuropeSouth-
East AsiaWestern
Pacific
Men
Trachea, bronchus, lung cancers 1 1 5 2 1 1 1 1
Stomach cancer 2 4 6 3 4 2 5 2
Liver cancer 3 5 2 10 10 10 6 3
Colon and rectum cancers 4 2 8 4 8 3 7 5
Oesophagus cancer 5 8 3 8 6 9 3 4
Prostate cancer 6 3 1 1 9 4 8 11
Mouth and oropharynx cancers 7 11 7 7 5 5 2 7
Lymphomas and multiple myeloma 8 6 4 5 3 11 4 9
Leukaemia 9 10 10 6 7 8 9 6
Bladder cancer 10 9 9 11 2 6 10 10
Pancreas cancer 11 7 11 9 11 7 11 8
Melanoma and other skin cancers 12 12 12 12 12 12 12 12
Women
Breast cancer 1 1 2 1 1 1 2 5
Trachea, bronchus, lung cancers 2 2 11 5 10 4 5 2
Stomach cancer 3 6 5 3 5 3 8 1
Colon and rectum cancers 4 3 7 4 8 2 6 6
Cervix uteri cancer 5 10 1 2 6 5 1 7
Liver cancer 6 8 3 10 12 11 11 3
Oesophagus cancer 7 13 6 12 2 12 4 4
Ovary cancer 8 7 8 8 9 6 7 10
Lymphomas and multiple myeloma 9 5 4 6 4 10 9 12
Pancreas cancer 10 4 12 7 14 7 12 9
Leukaemia 11 9 10 9 3 8 10 8
Mouth and oropharynx cancers 12 15 9 14 7 15 3 11
Corpus uteri cancer 13 11 15 11 13 9 14 14
Bladder cancer 14 12 13 13 11 14 13 13
Melanoma and other skin cancers 15 14 14 15 15 13 15 15
14
World Health Organization
Part 2
5. Causes of death among children aged under five years
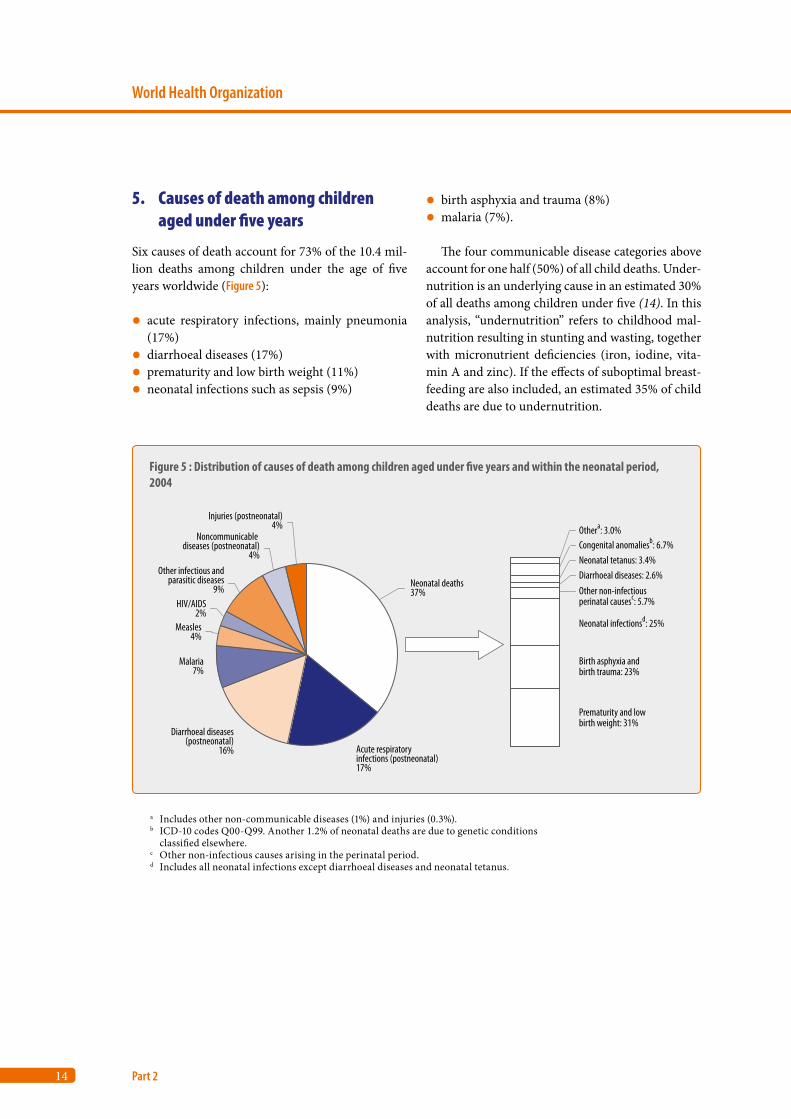
Six causes of death account for 73% of the 10.4 mil-lion deaths among children under the age of five years worldwide (Figure 5):
• acute respiratory infections, mainly pneumonia (17%)
• diarrhoeal diseases (17%)• prematurity and low birth weight (11%)• neonatal infections such as sepsis (9%)
• birth asphyxia and trauma (8%)• malaria (7%).
The four communicable disease categories above account for one half (50%) of all child deaths. Under-nutrition is an underlying cause in an estimated 30% of all deaths among children under five (14). In this analysis, “undernutrition” refers to childhood mal-nutrition resulting in stunting and wasting, together with micronutrient deficiencies (iron, iodine, vita-min A and zinc). If the effects of suboptimal breast-feeding are also included, an estimated 35% of child deaths are due to undernutrition.
a Includes other non-communicable diseases (1%) and injuries (0.3%). b ICD-10 codes Q00-Q99. Another 1.2% of neonatal deaths are due to genetic conditions
classified elsewhere. c Other non-infectious causes arising in the perinatal period.d Includes all neonatal infections except diarrhoeal diseases and neonatal tetanus.
Figure 5 : Distribution of causes of death among children aged under five years and within the neonatal period, 2004
Injuries (postneonatal)4%
Noncommunicable diseases (postneonatal)
4%Other infectious and
parasitic diseases9%
HIV/AIDS2%
Measles4%
Malaria7%
Diarrhoeal diseases(postneonatal)
16% Acute respiratory infections (postneonatal)17%
Neonatal deaths37%
Othera: 3.0%Congenital anomaliesb: 6.7%Neonatal tetanus: 3.4%Diarrhoeal diseases: 2.6%Other non-infectiousperinatal causesc: 5.7%
Neonatal infectionsd: 25%
Birth asphyxia andbirth trauma: 23%
Prematurity and lowbirth weight: 31%
15
Global Burden of Disease 2004
Causes of death
1
2
3
4
Annex A
Annex B
Annex C
References
Deaths in the neonatal period (0–27 days) account for more than one third of all deaths in chil-dren. Among neonatal deaths, three main causes account for 80% of all neonatal deaths: prematurity and low birth weight (31%), neonatal infections (mainly sepsis and pneumonia and excluding diar-rhoeal diseases) (26%) and birth asphyxia and birth trauma (23%).
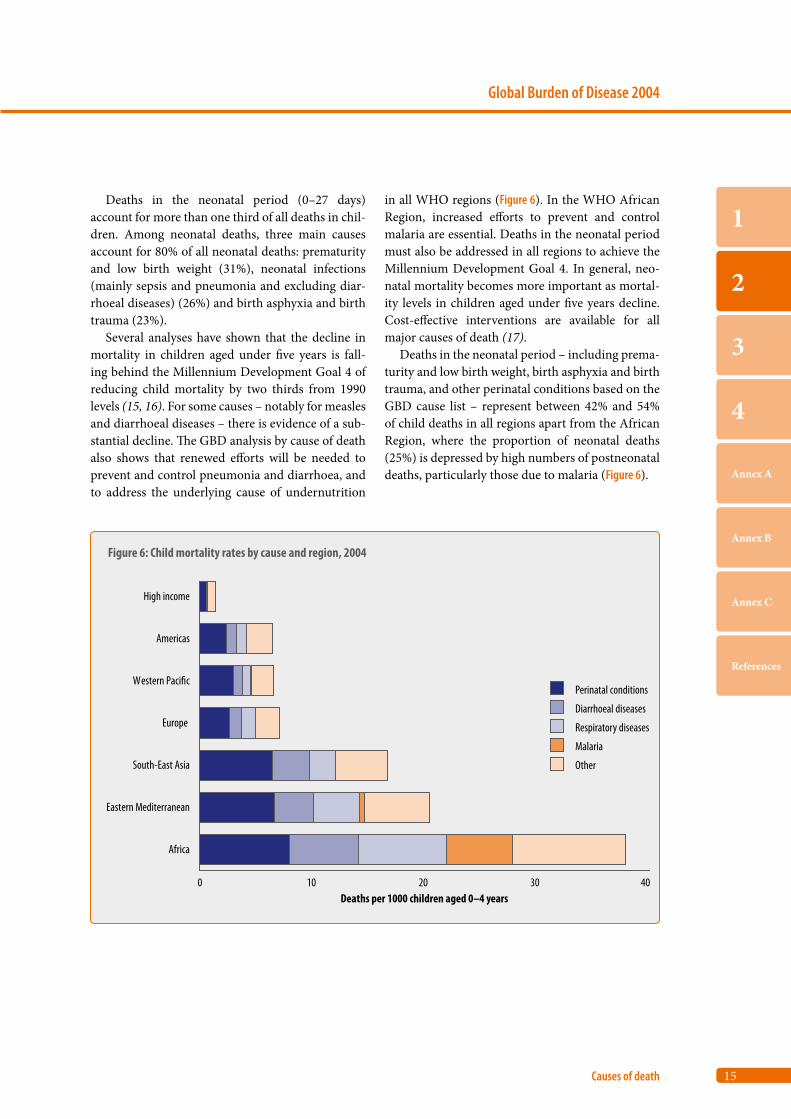
Several analyses have shown that the decline in mortality in children aged under five years is fall-ing behind the Millennium Development Goal 4 of reducing child mortality by two thirds from 1990 levels (15, 16). For some causes – notably for measles and diarrhoeal diseases – there is evidence of a sub-stantial decline. The GBD analysis by cause of death also shows that renewed efforts will be needed to prevent and control pneumonia and diarrhoea, and to address the underlying cause of undernutrition
in all WHO regions (Figure 6). In the WHO African Region, increased efforts to prevent and control malaria are essential. Deaths in the neonatal period must also be addressed in all regions to achieve the Millennium Development Goal 4. In general, neo-natal mortality becomes more important as mortal-ity levels in children aged under five years decline. Cost-effective interventions are available for all major causes of death (17).
Deaths in the neonatal period – including prema-turity and low birth weight, birth asphyxia and birth trauma, and other perinatal conditions based on the GBD cause list – represent between 42% and 54% of child deaths in all regions apart from the African Region, where the proportion of neonatal deaths (25%) is depressed by high numbers of postneonatal deaths, particularly those due to malaria (Figure 6).
Figure 6: Child mortality rates by cause and region, 2004
0 10 20 30 40
Africa
Eastern Mediterranean
South-East Asia
Europe
Western Paci�c
Americas
High income
Deaths per 1000 children aged 0–4 years
Perinatal conditions
Diarrhoeal diseases
Respiratory diseases
Malaria
Other
16
World Health Organization
Part 2
Among the 10.4 million deaths in children aged under five years worldwide, 4.7 million (45%) occur in the African Region, and an additional 3.1 mil-lion (30%) occur in the South-East Asia Region. The death rate per 1000 children aged 0–4 years in the African Region is almost double that of the region with the next highest rate, the Eastern Medi-terranean, and more than double that of any other region (Figure 6). The two leading communicable disease killers in all regions are diarrhoeal diseases and respiratory infections. Deaths directly attribut-able to malaria occur almost entirely in the African Region, representing 16% of all under-five deaths in that region.
HIV/AIDS and measles are important causes of death summarized in the “other” category. Glo-bally, estimates suggest that 2.5% of all child deaths are associated with HIV infection. In the African Region, however – where more than 9 out of 10 of
the total global number of child deaths due to HIV/AIDS in 2004 occurred – 5% of all child deaths are associated with HIV. Measles mortality, which has declined considerably in recent years, is estimated to be responsible for 4% of deaths among children aged under five years worldwide and also 4% of such deaths in the African Region.
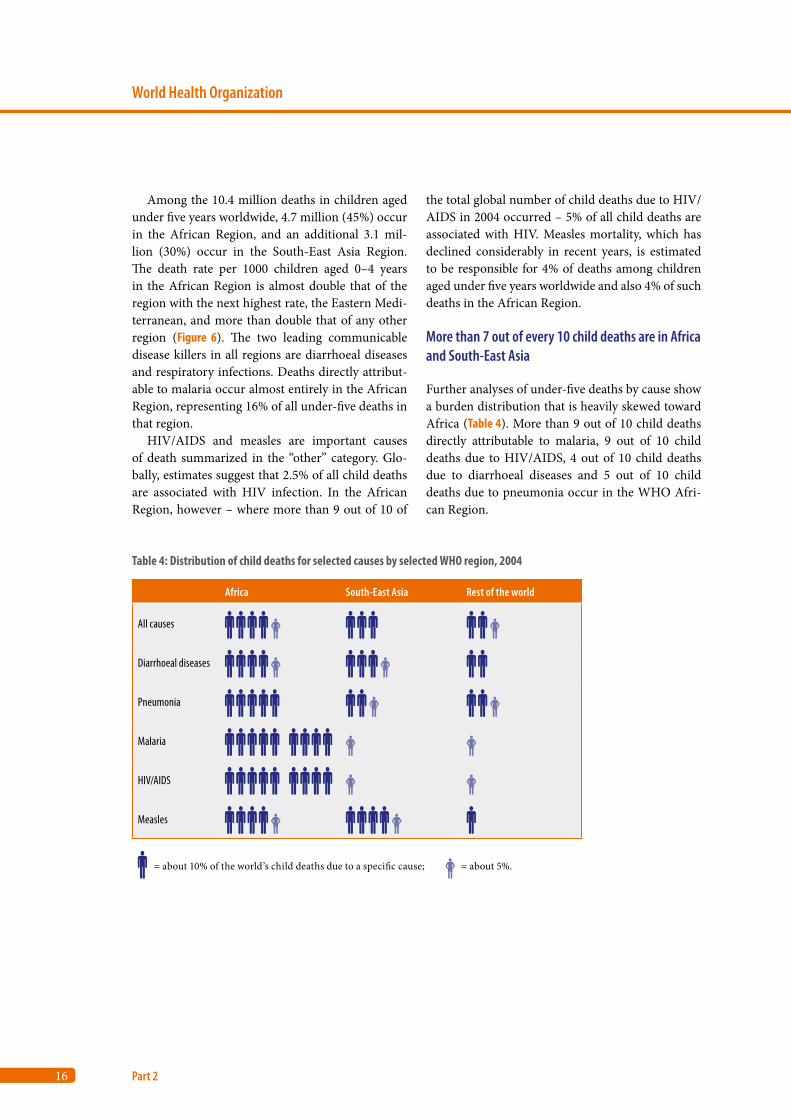
More than 7 out of every 10 child deaths are in Africa and South-East Asia
Further analyses of under-five deaths by cause show a burden distribution that is heavily skewed toward Africa (Table 4). More than 9 out of 10 child deaths directly attributable to malaria, 9 out of 10 child deaths due to HIV/AIDS, 4 out of 10 child deaths due to diarrhoeal diseases and 5 out of 10 child deaths due to pneumonia occur in the WHO Afri-can Region.
Table 4: Distribution of child deaths for selected causes by selected WHO region, 2004
Africa South-East Asia Rest of the world
All causes
Diarrhoeal diseases
Pneumonia
Malaria
HIV/AIDS
Measles
= about 10% of the world’s child deaths due to a specific cause; = about 5%.
17
Global Burden of Disease 2004
Causes of death
1
2
3
4
Annex A
Annex B
Annex C
References
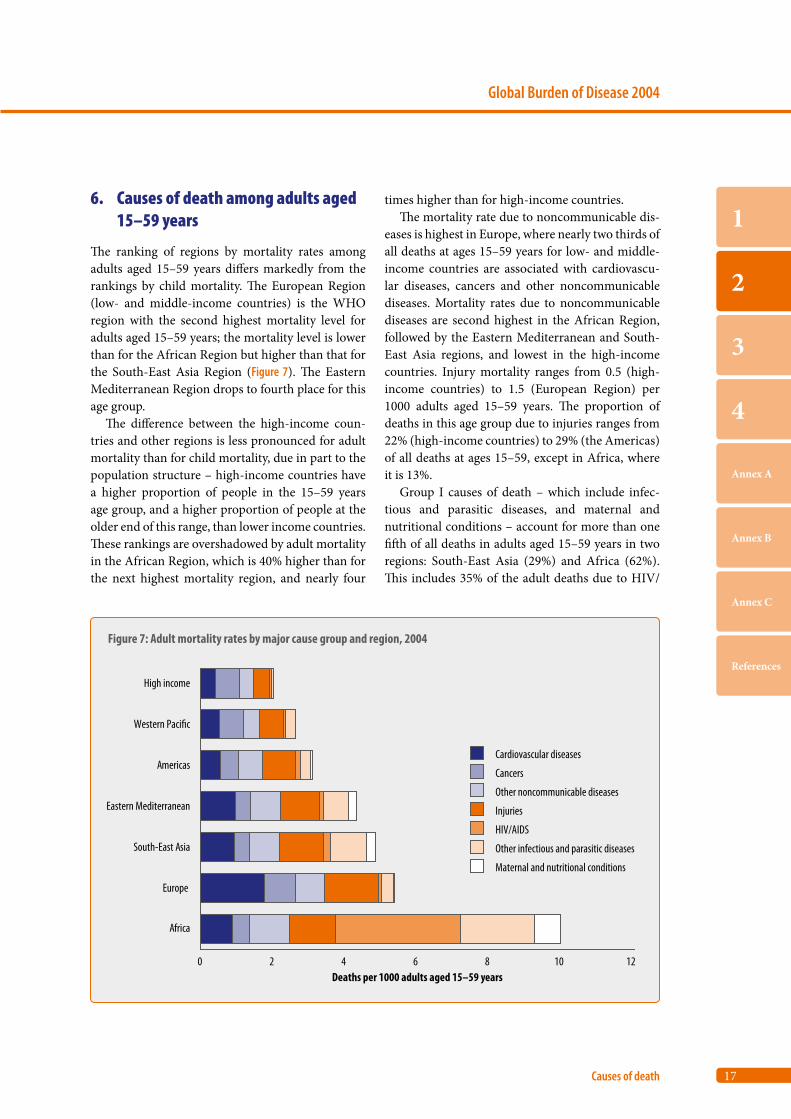
6. Causes of death among adults aged 15–59 years
The ranking of regions by mortality rates among adults aged 15–59 years differs markedly from the rankings by child mortality. The European Region (low- and middle-income countries) is the WHO region with the second highest mortality level for adults aged 15–59 years; the mortality level is lower than for the African Region but higher than that for the South-East Asia Region (Figure 7). The Eastern Mediterranean Region drops to fourth place for this age group.
The difference between the high-income coun-tries and other regions is less pronounced for adult mortality than for child mortality, due in part to the population structure – high-income countries have a higher proportion of people in the 15–59 years age group, and a higher proportion of people at the older end of this range, than lower income countries. These rankings are overshadowed by adult mortality in the African Region, which is 40% higher than for the next highest mortality region, and nearly four
times higher than for high-income countries.The mortality rate due to noncommunicable dis-
eases is highest in Europe, where nearly two thirds of all deaths at ages 15–59 years for low- and middle-income countries are associated with cardiovascu-lar diseases, cancers and other noncommunicable diseases. Mortality rates due to noncommunicable diseases are second highest in the African Region, followed by the Eastern Mediterranean and South-East Asia regions, and lowest in the high-income countries. Injury mortality ranges from 0.5 (high-income countries) to 1.5 (European Region) per 1000 adults aged 15–59 years. The proportion of deaths in this age group due to injuries ranges from 22% (high-income countries) to 29% (the Americas) of all deaths at ages 15–59, except in Africa, where it is 13%.
Group I causes of death – which include infec-tious and parasitic diseases, and maternal and nutritional conditions – account for more than one fifth of all deaths in adults aged 15–59 years in two regions: South-East Asia (29%) and Africa (62%). This includes 35% of the adult deaths due to HIV/
Figure 7: Adult mortality rates by major cause group and region, 2004
0 2 4 6 8 10 12
Africa
Europe
South-East Asia
Eastern Mediterranean
Americas
Western Paci�c
High income
Deaths per 1000 adults aged 15–59 years
Cardiovascular diseases
Cancers
Other noncommunicable diseases
Injuries
HIV/AIDS
Other infectious and parasitic diseases
Maternal and nutritional conditions
18
World Health Organization
Part 2
AIDS in Africa. In fact, the mortality rate among adults due to HIV/AIDS alone in Africa is higher than mortality at 15–59 years due to all causes in three other regions: high-income countries, the Americas and the Western Pacific Region.
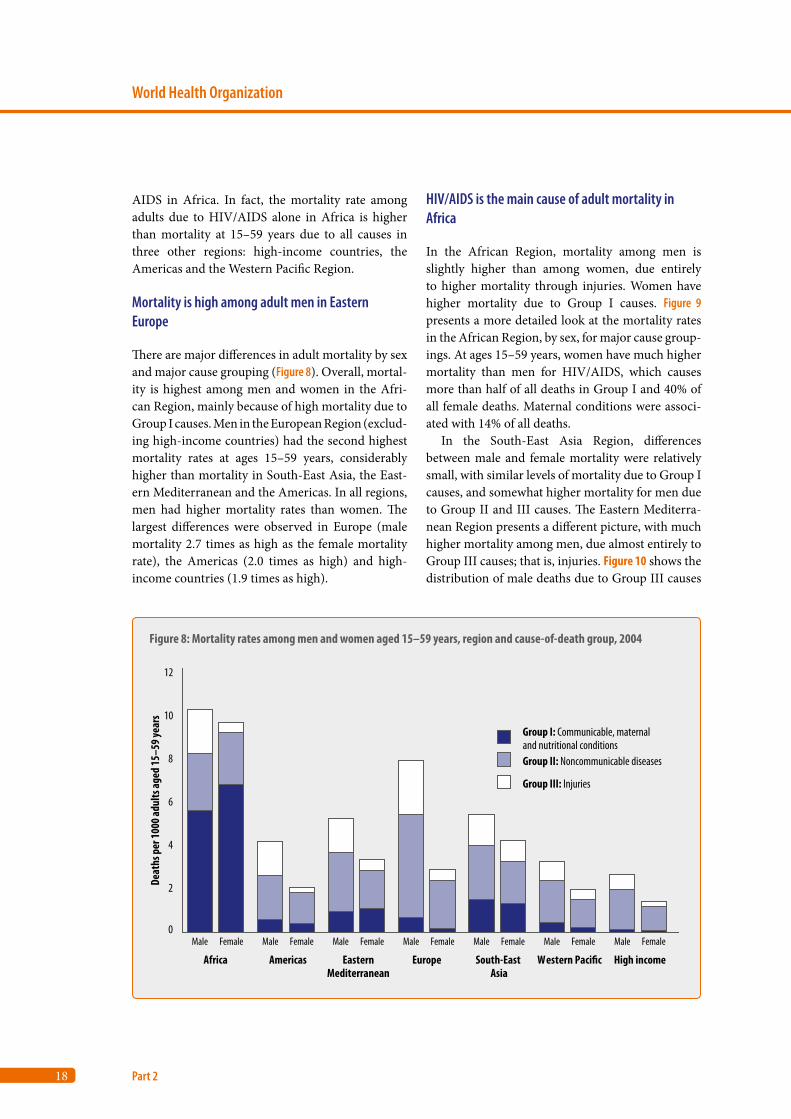
Mortality is high among adult men in Eastern Europe
There are major differences in adult mortality by sex and major cause grouping (Figure 8). Overall, mortal-ity is highest among men and women in the Afri-can Region, mainly because of high mortality due to Group I causes. Men in the European Region (exclud-ing high-income countries) had the second highest mortality rates at ages 15–59 years, considerably higher than mortality in South-East Asia, the East-ern Mediterranean and the Americas. In all regions, men had higher mortality rates than women. The largest differences were observed in Europe (male mortality 2.7 times as high as the female mortality rate), the Americas (2.0 times as high) and high-income countries (1.9 times as high).
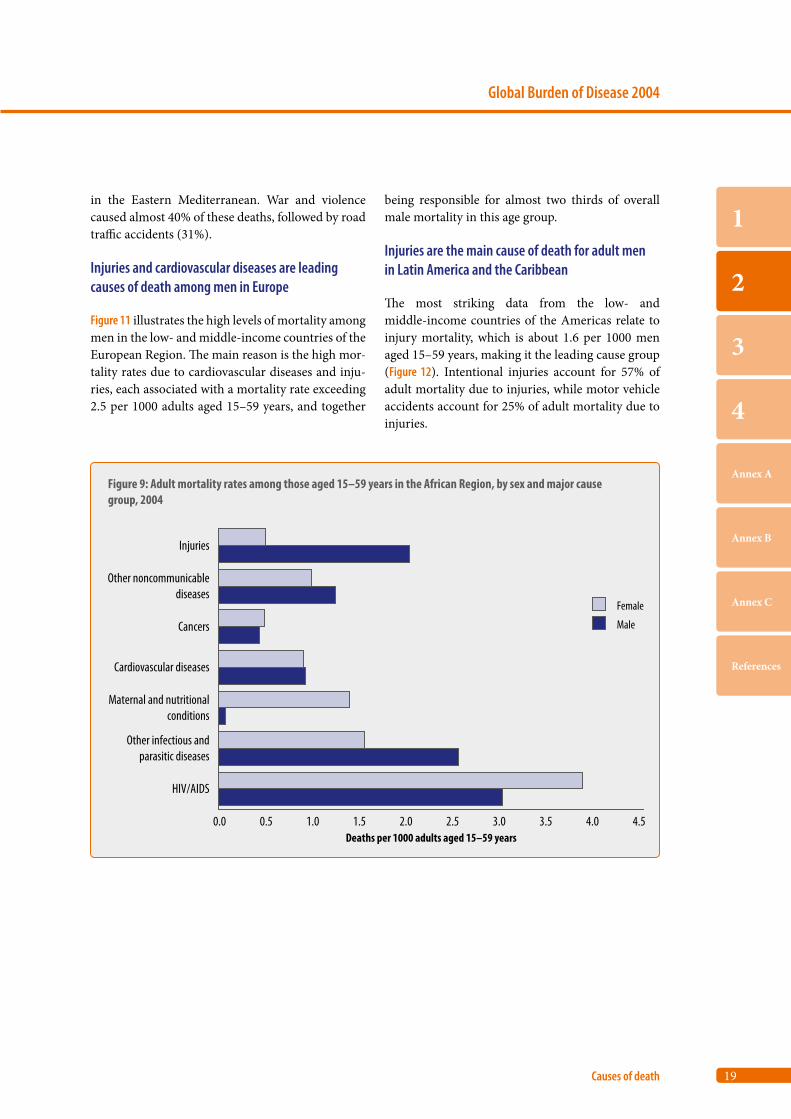
HIV/AIDS is the main cause of adult mortality in Africa
In the African Region, mortality among men is slightly higher than among women, due entirely to higher mortality through injuries. Women have higher mortality due to Group I causes. Figure 9 presents a more detailed look at the mortality rates in the African Region, by sex, for major cause group-ings. At ages 15–59 years, women have much higher mortality than men for HIV/AIDS, which causes more than half of all deaths in Group I and 40% of all female deaths. Maternal conditions were associ-ated with 14% of all deaths.
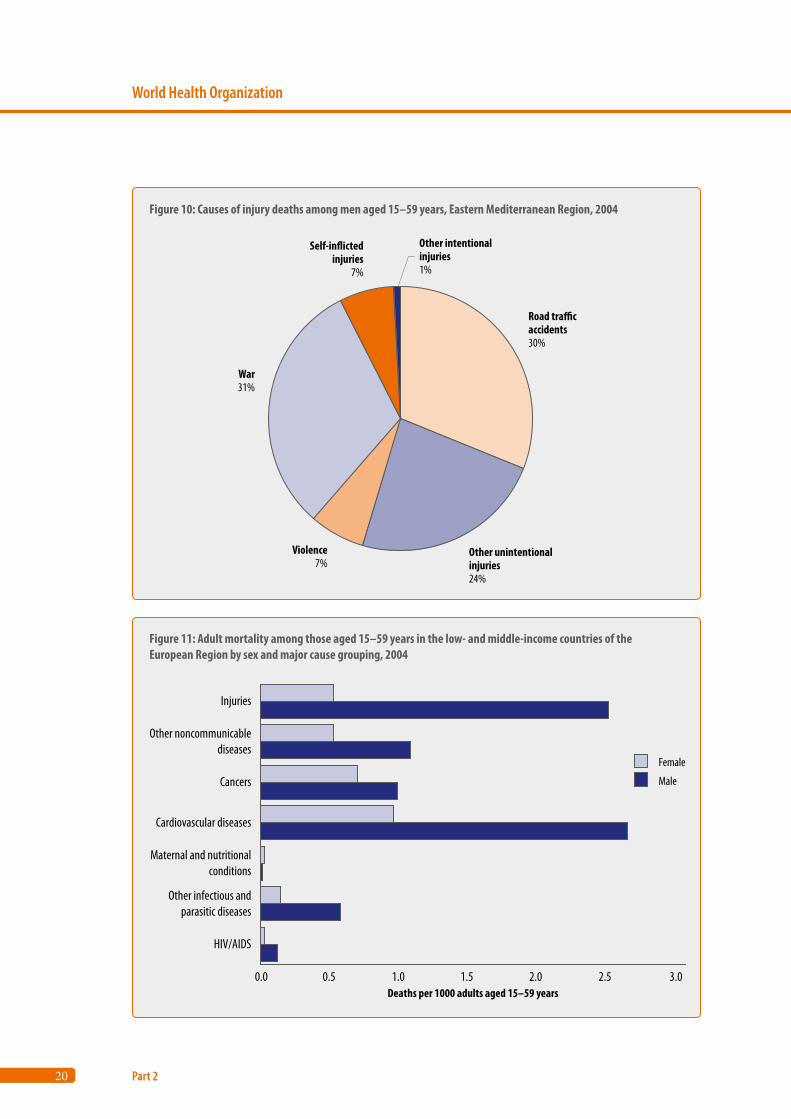
In the South-East Asia Region, differences between male and female mortality were relatively small, with similar levels of mortality due to Group I causes, and somewhat higher mortality for men due to Group II and III causes. The Eastern Mediterra-nean Region presents a different picture, with much higher mortality among men, due almost entirely to Group III causes; that is, injuries. Figure 10 shows the distribution of male deaths due to Group III causes
Figure 8: Mortality rates among men and women aged 15–59 years, region and cause-of-death group, 2004
0
2
4
6
8
10
12
Male Female Male Female Male Female Male Female Male Female Male Female Male Female
Africa Americas EasternMediterranean
Europe South-East Asia
Western Paci�c High income
Deat
hs p
er 10
00 ad
ults
aged
15–5
9 yea
rs
Group III: Injuries
Group II: Noncommunicable diseases
Group I: Communicable, maternaland nutritional conditions
19
Global Burden of Disease 2004
Causes of death
1
2
3
4
Annex A
Annex B
Annex C
References
in the Eastern Mediterranean. War and violence caused almost 40% of these deaths, followed by road traffic accidents (31%).
Injuries and cardiovascular diseases are leading causes of death among men in Europe
Figure 11 illustrates the high levels of mortality among men in the low- and middle-income countries of the European Region. The main reason is the high mor-tality rates due to cardiovascular diseases and inju-ries, each associated with a mortality rate exceeding 2.5 per 1000 adults aged 15–59 years, and together
being responsible for almost two thirds of overall male mortality in this age group.
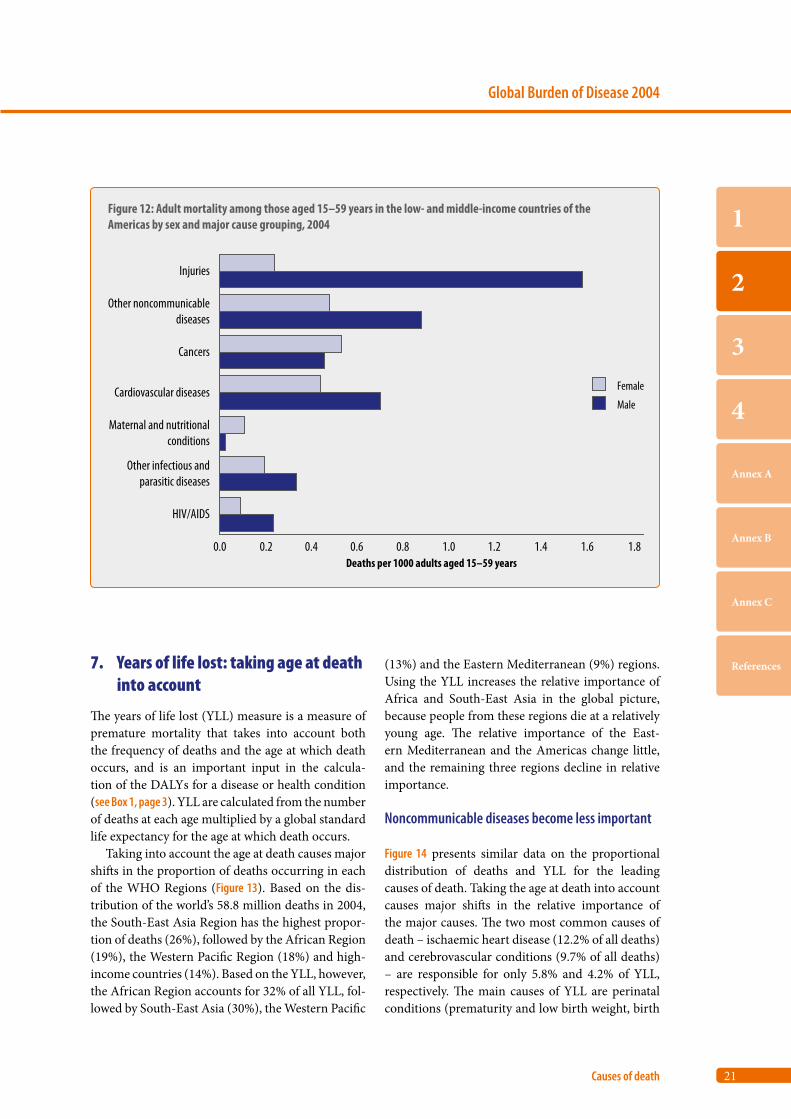
Injuries are the main cause of death for adult men in Latin America and the Caribbean
The most striking data from the low- and middle-income countries of the Americas relate to injury mortality, which is about 1.6 per 1000 men aged 15–59 years, making it the leading cause group (Figure 12). Intentional injuries account for 57% of adult mortality due to injuries, while motor vehicle accidents account for 25% of adult mortality due to injuries.
Figure 9: Adult mortality rates among those aged 15–59 years in the African Region, by sex and major cause group, 2004
0.0 0.5 1.0 1.5 2.0 2.5 3.0 3.5 4.0 4.5
HIV/AIDS
Other infectious andparasitic diseases
Maternal and nutritionalconditions
Cardiovascular diseases
Cancers
Other noncommunicablediseases
Injuries
Deaths per 1000 adults aged 15–59 years
Female
Male
20
World Health Organization
Part 2
Figure 10: Causes of injury deaths among men aged 15–59 years, Eastern Mediterranean Region, 2004
Road tra�caccidents30%
Other unintentionalinjuries24%
Violence7%
War31%
Self-in�ictedinjuries
7%
Other intentionalinjuries1%
Figure 11: Adult mortality among those aged 15–59 years in the low- and middle-income countries of the European Region by sex and major cause grouping, 2004
0.0 0.5 1.0 1.5 2.0 2.5 3.0
HIV/AIDS
Other infectious andparasitic diseases
Maternal and nutritionalconditions
Cardiovascular diseases
Cancers
Other noncommunicablediseases
Injuries
Deaths per 1000 adults aged 15–59 years
Female
Male
21
Global Burden of Disease 2004
Causes of death
1
2
3
4
Annex A
Annex B
Annex C
References7. Years of life lost: taking age at death into account
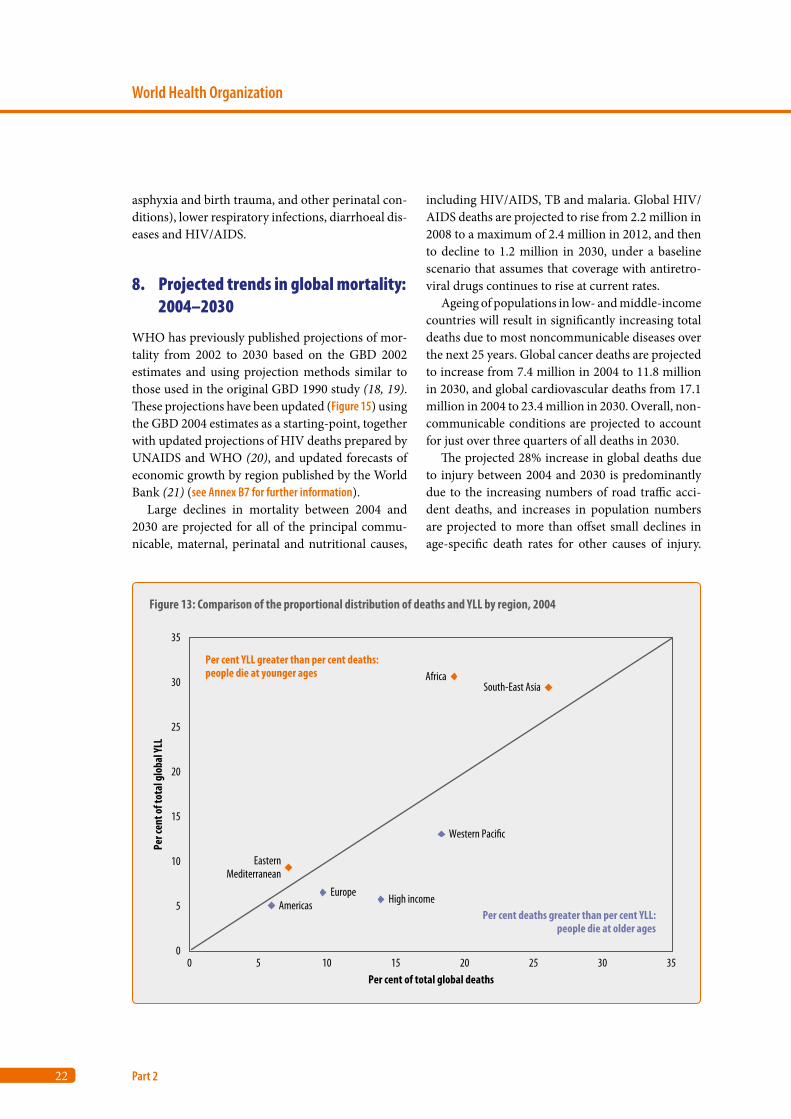
The years of life lost (YLL) measure is a measure of premature mortality that takes into account both the frequency of deaths and the age at which death occurs, and is an important input in the calcula-tion of the DALYs for a disease or health condition (see Box 1, page 3). YLL are calculated from the number of deaths at each age multiplied by a global standard life expectancy for the age at which death occurs.
Taking into account the age at death causes major shifts in the proportion of deaths occurring in each of the WHO Regions (Figure 13). Based on the dis-tribution of the world’s 58.8 million deaths in 2004, the South-East Asia Region has the highest propor-tion of deaths (26%), followed by the African Region (19%), the Western Pacific Region (18%) and high-income countries (14%). Based on the YLL, however, the African Region accounts for 32% of all YLL, fol-lowed by South-East Asia (30%), the Western Pacific
(13%) and the Eastern Mediterranean (9%) regions. Using the YLL increases the relative importance of Africa and South-East Asia in the global picture, because people from these regions die at a relatively young age. The relative importance of the East-ern Mediterranean and the Americas change little, and the remaining three regions decline in relative importance.
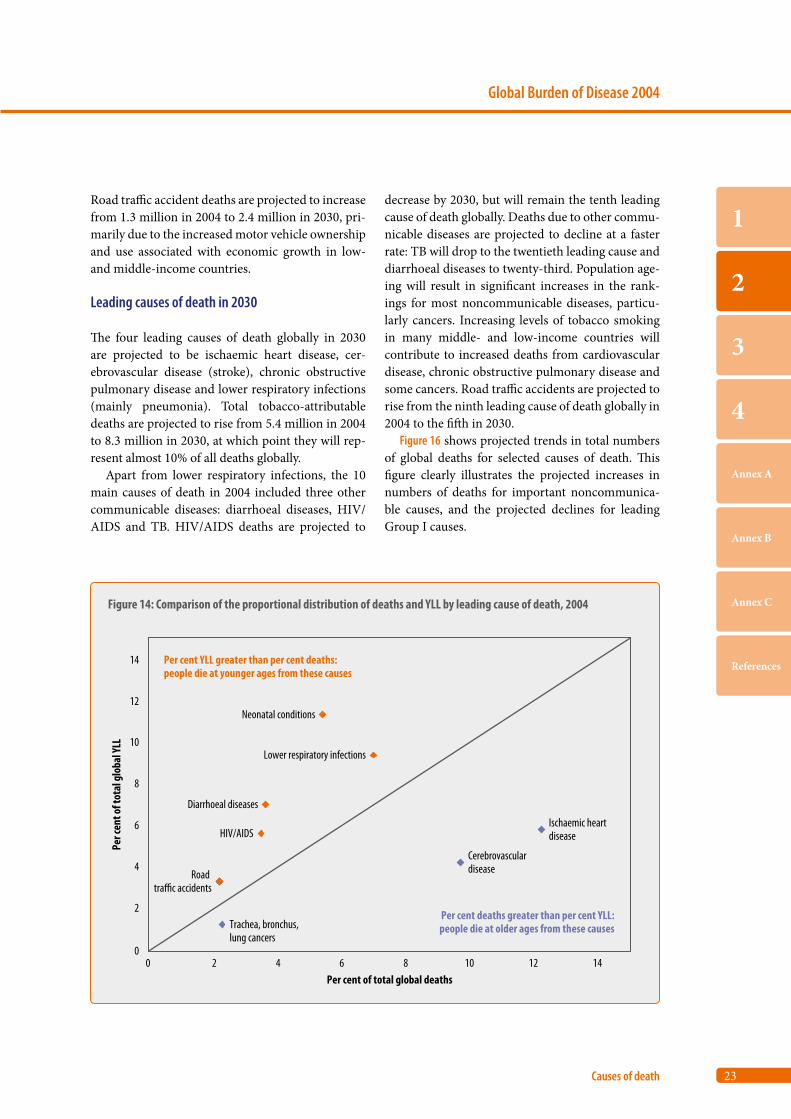
Noncommunicable diseases become less important
Figure 14 presents similar data on the proportional distribution of deaths and YLL for the leading causes of death. Taking the age at death into account causes major shifts in the relative importance of the major causes. The two most common causes of death – ischaemic heart disease (12.2% of all deaths) and cerebrovascular conditions (9.7% of all deaths) – are responsible for only 5.8% and 4.2% of YLL, respectively. The main causes of YLL are perinatal conditions (prematurity and low birth weight, birth
Figure 12: Adult mortality among those aged 15–59 years in the low- and middle-income countries of the Americas by sex and major cause grouping, 2004
0.0 0.2 0.4 0.6 0.8 1.0 1.2 1.6 1.8
HIV/AIDS
Other infectious andparasitic diseases
Maternal and nutritionalconditions
Cardiovascular diseases
Cancers
Other noncommunicablediseases
Injuries
Deaths per 1000 adults aged 15–59 years
Female
Male
1.4
22
World Health Organization
Part 2
asphyxia and birth trauma, and other perinatal con-ditions), lower respiratory infections, diarrhoeal dis-eases and HIV/AIDS.
8. Projected trends in global mortality: 2004–2030
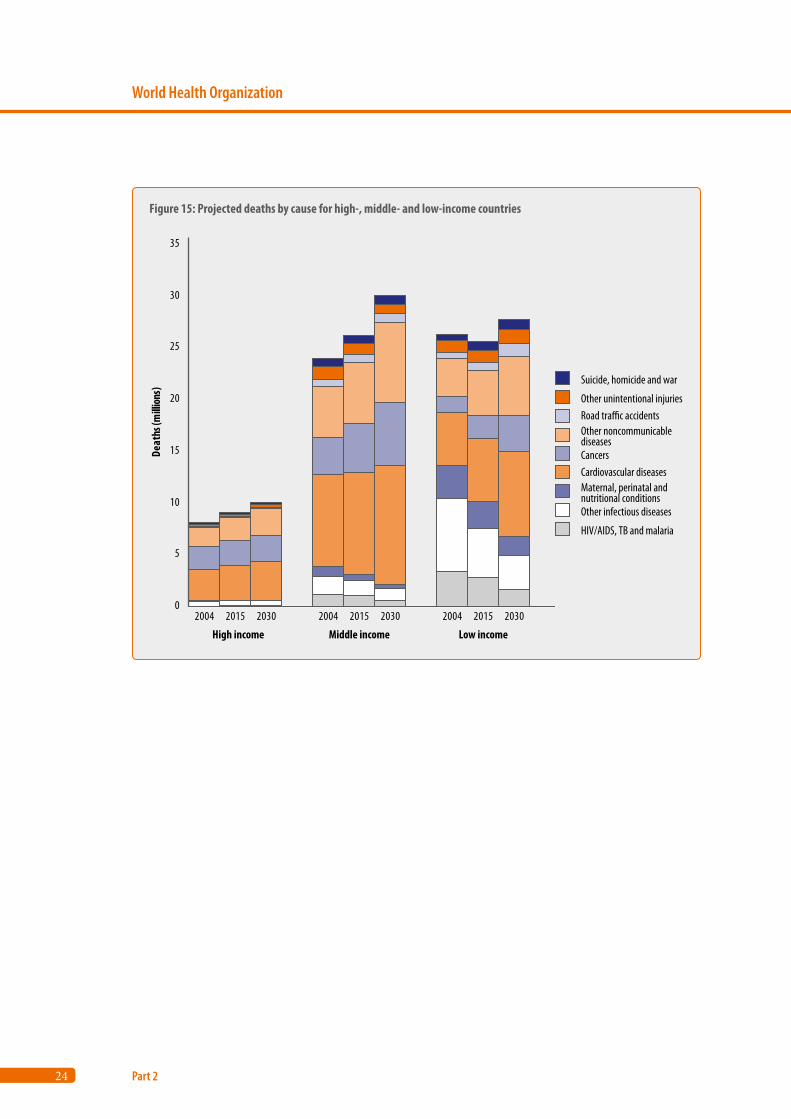
WHO has previously published projections of mor-tality from 2002 to 2030 based on the GBD 2002 estimates and using projection methods similar to those used in the original GBD 1990 study (18, 19). These projections have been updated (Figure 15) using the GBD 2004 estimates as a starting-point, together with updated projections of HIV deaths prepared by UNAIDS and WHO (20), and updated forecasts of economic growth by region published by the World Bank (21) (see Annex B7 for further information).
Large declines in mortality between 2004 and 2030 are projected for all of the principal commu-nicable, maternal, perinatal and nutritional causes,
including HIV/AIDS, TB and malaria. Global HIV/AIDS deaths are projected to rise from 2.2 million in 2008 to a maximum of 2.4 million in 2012, and then to decline to 1.2 million in 2030, under a baseline scenario that assumes that coverage with antiretro-viral drugs continues to rise at current rates.
Ageing of populations in low- and middle-income countries will result in significantly increasing total deaths due to most noncommunicable diseases over the next 25 years. Global cancer deaths are projected to increase from 7.4 million in 2004 to 11.8 million in 2030, and global cardiovascular deaths from 17.1 million in 2004 to 23.4 million in 2030. Overall, non-communicable conditions are projected to account for just over three quarters of all deaths in 2030.
The projected 28% increase in global deaths due to injury between 2004 and 2030 is predominantly due to the increasing numbers of road traffic acci-dent deaths, and increases in population numbers are projected to more than offset small declines in age-specific death rates for other causes of injury.
Figure 13: Comparison of the proportional distribution of deaths and YLL by region, 2004
0
5
10
15
20
25
30
35
0 5 10 15 20 25 30 35Per cent of total global deaths
Per c
ent o
f tot
al g
loba
l YLL
Per cent YLL greater than per cent deaths:people die at younger ages
Per cent deaths greater than per cent YLL:people die at older ages
AmericasEurope
EasternMediterranean
High income
Western Paci�c
AfricaSouth-East Asia
23
Global Burden of Disease 2004
Causes of death
1
2
3
4
Annex A
Annex B
Annex C
References
Road traffic accident deaths are projected to increase from 1.3 million in 2004 to 2.4 million in 2030, pri-marily due to the increased motor vehicle ownership and use associated with economic growth in low- and middle-income countries.
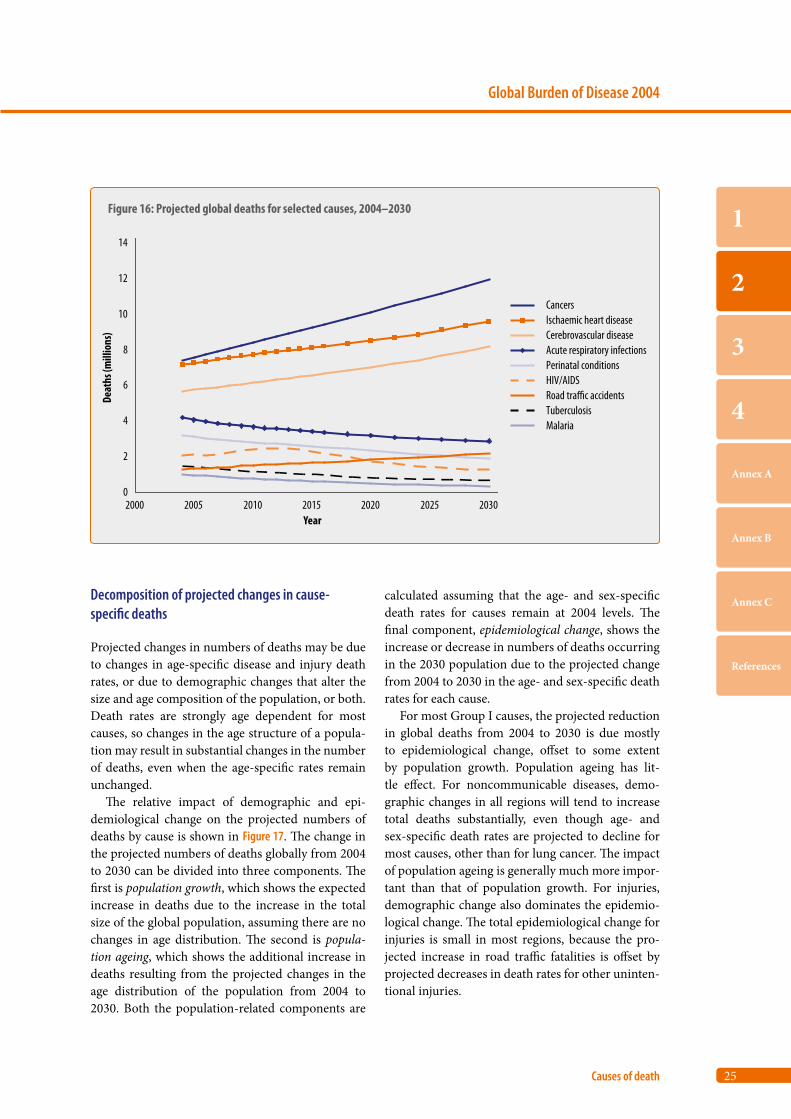
Leading causes of death in 2030
The four leading causes of death globally in 2030 are projected to be ischaemic heart disease, cer-ebrovascular disease (stroke), chronic obstructive pulmonary disease and lower respiratory infections (mainly pneumonia). Total tobacco-attributable deaths are projected to rise from 5.4 million in 2004 to 8.3 million in 2030, at which point they will rep-resent almost 10% of all deaths globally.
Apart from lower respiratory infections, the 10 main causes of death in 2004 included three other communicable diseases: diarrhoeal diseases, HIV/AIDS and TB. HIV/AIDS deaths are projected to
decrease by 2030, but will remain the tenth leading cause of death globally. Deaths due to other commu-nicable diseases are projected to decline at a faster rate: TB will drop to the twentieth leading cause and diarrhoeal diseases to twenty-third. Population age-ing will result in significant increases in the rank-ings for most noncommunicable diseases, particu-larly cancers. Increasing levels of tobacco smoking in many middle- and low-income countries will contribute to increased deaths from cardiovascular disease, chronic obstructive pulmonary disease and some cancers. Road traffic accidents are projected to rise from the ninth leading cause of death globally in 2004 to the fifth in 2030.
Figure 16 shows projected trends in total numbers of global deaths for selected causes of death. This figure clearly illustrates the projected increases in numbers of deaths for important noncommunica-ble causes, and the projected declines for leading Group I causes.
Figure 14: Comparison of the proportional distribution of deaths and YLL by leading cause of death, 2004
0
2
4
6
8
10
12
14
0 2 4 6 8 10 12 14Per cent of total global deaths
Per c
ent o
f tot
al g
loba
l YLL
Per cent YLL greater than per cent deaths:people die at younger ages from these causes
Per cent deaths greater than per cent YLL:people die at older ages from these causes
Neonatal conditions
Lower respiratory infections
Diarrhoeal diseases
HIV/AIDS
Road tra�c accidents
Ischaemic heartdisease
Cerebrovasculardisease
Trachea, bronchus,lung cancers
24
World Health Organization
Part 2
Figure 15: Projected deaths by cause for high-, middle- and low-income countries
0
5
10
15
20
25
30
35
2004 2015 2030 2004 2015 2030 2004 2015 2030
Deat
hs (m
illion
s)
Suicide, homicide and war
Other unintentional injuriesRoad tra�c accidentsOther noncommunicable diseasesCancersCardiovascular diseasesMaternal, perinatal and nutritional conditionsOther infectious diseases
HIV/AIDS, TB and malaria
High income Middle income Low income
25
Global Burden of Disease 2004
Causes of death
1
2
3
4
Annex A
Annex B
Annex C
References
Decomposition of projected changes in cause-specific deaths
Projected changes in numbers of deaths may be due to changes in age-specific disease and injury death rates, or due to demographic changes that alter the size and age composition of the population, or both. Death rates are strongly age dependent for most causes, so changes in the age structure of a popula-tion may result in substantial changes in the number of deaths, even when the age-specific rates remain unchanged.
The relative impact of demographic and epi-demiological change on the projected numbers of deaths by cause is shown in Figure 17. The change in the projected numbers of deaths globally from 2004 to 2030 can be divided into three components. The first is population growth, which shows the expected increase in deaths due to the increase in the total size of the global population, assuming there are no changes in age distribution. The second is popula-tion ageing, which shows the additional increase in deaths resulting from the projected changes in the age distribution of the population from 2004 to 2030. Both the population-related components are
calculated assuming that the age- and sex-specific death rates for causes remain at 2004 levels. The final component, epidemiological change, shows the increase or decrease in numbers of deaths occurring in the 2030 population due to the projected change from 2004 to 2030 in the age- and sex-specific death rates for each cause.
For most Group I causes, the projected reduction in global deaths from 2004 to 2030 is due mostly to epidemiological change, offset to some extent by population growth. Population ageing has lit-tle effect. For noncommunicable diseases, demo-graphic changes in all regions will tend to increase total deaths substantially, even though age- and sex-specific death rates are projected to decline for most causes, other than for lung cancer. The impact of population ageing is generally much more impor-tant than that of population growth. For injuries, demographic change also dominates the epidemio-logical change. The total epidemiological change for injuries is small in most regions, because the pro-jected increase in road traffic fatalities is offset by projected decreases in death rates for other uninten-tional injuries.
Figure 16: Projected global deaths for selected causes, 2004–2030
0
2
4
6
8
10
12
14
2000 2005 2010 2015 2020 2025 2030
Deat
hs (m
illio
ns)
Year
CancersIschaemic heart diseaseCerebrovascular diseaseAcute respiratory infectionsPerinatal conditionsHIV/AIDSRoad tra�c accidentsTuberculosisMalaria
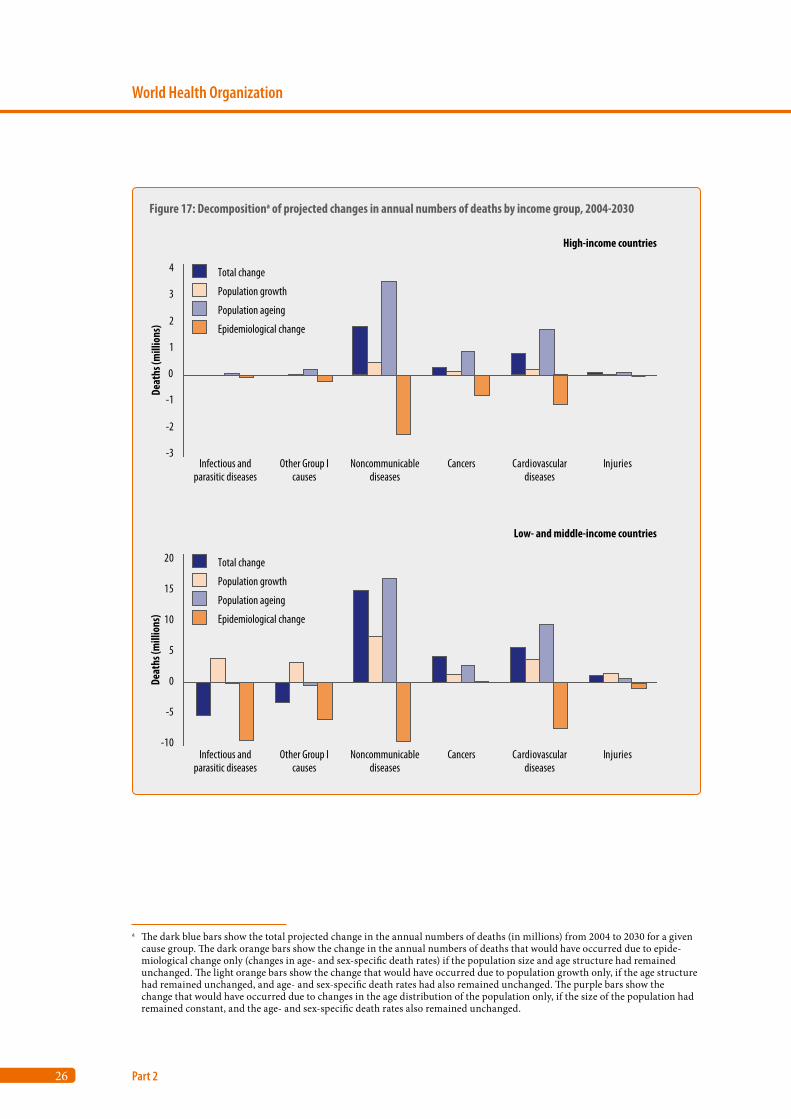
26
World Health Organization
Part 2
Figure 17: Decompositiona of projected changes in annual numbers of deaths by income group, 2004-2030
-3
-2
-1
0
1
2
3
4
Cardiovasculardiseases
Injuries
-10
-5
0
5
10
15
20
High-income countries
Low- and middle-income countries
Total change
Population growth
Population ageing
Epidemiological change
Total change
Population growth
Population ageing
Epidemiological change
Infectious andparasitic diseases
Other Group Icauses
Noncommunicablediseases
Cancers
Cardiovasculardiseases
InjuriesInfectious andparasitic diseases
Other Group Icauses
Noncommunicablediseases
Cancers
Deat
hs (m
illio
ns)
Deat
hs (m
illio
ns)
a The dark blue bars show the total projected change in the annual numbers of deaths (in millions) from 2004 to 2030 for a given cause group. The dark orange bars show the change in the annual numbers of deaths that would have occurred due to epide-miological change only (changes in age- and sex-specific death rates) if the population size and age structure had remained unchanged. The light orange bars show the change that would have occurred due to population growth only, if the age structure had remained unchanged, and age- and sex-specific death rates had also remained unchanged. The purple bars show the change that would have occurred due to changes in the age distribution of the population only, if the size of the population had remained constant, and the age- and sex-specific death rates also remained unchanged.
Part 3
Disease incidence, prevalence and disability
9. How many people become sick each year? 28
10. Cancer incidence by site and region 29
11. How many people are sick at any given time? 31
12. Prevalence of moderate and severe disability 31
13. Leading causes of years lost due to disability in 2004 36
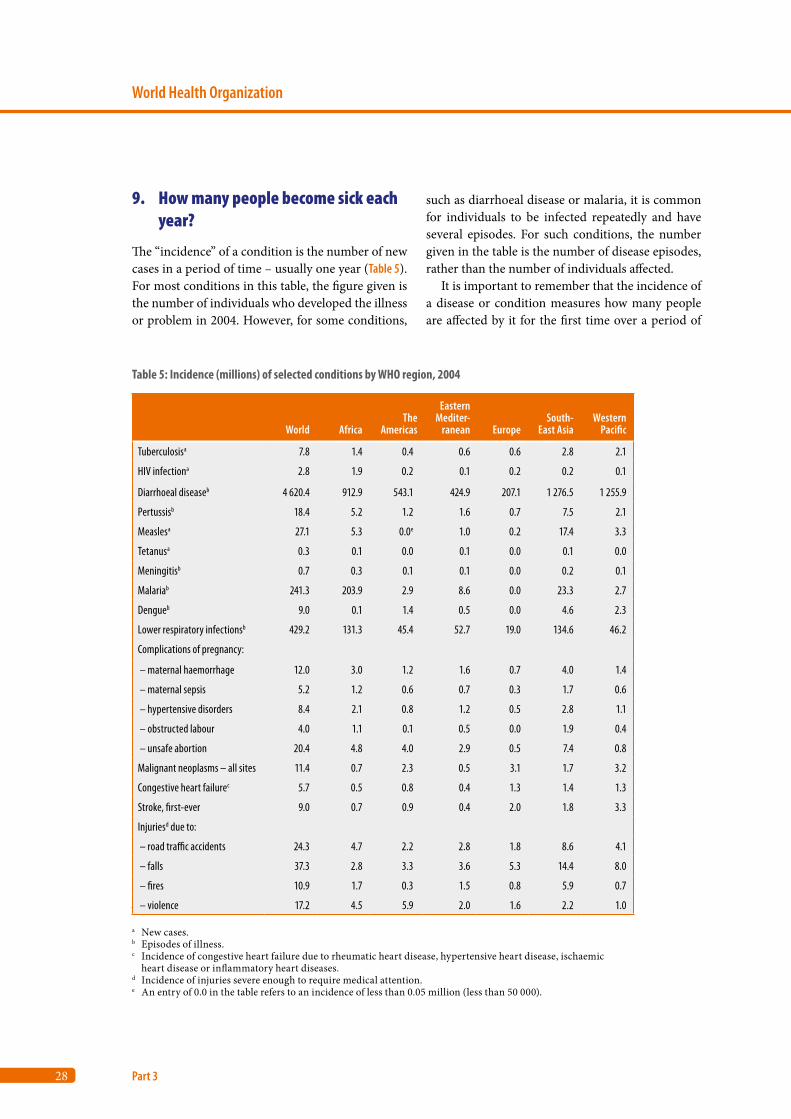
28
World Health Organization
Part 3
9. How many people become sick each year?
The “incidence” of a condition is the number of new cases in a period of time – usually one year (Table 5). For most conditions in this table, the figure given is the number of individuals who developed the illness or problem in 2004. However, for some conditions,
such as diarrhoeal disease or malaria, it is common for individuals to be infected repeatedly and have several episodes. For such conditions, the number given in the table is the number of disease episodes, rather than the number of individuals affected.
It is important to remember that the incidence of a disease or condition measures how many people are affected by it for the first time over a period of
Table 5: Incidence (millions) of selected conditions by WHO region, 2004
World AfricaThe
Americas
Eastern Mediter-
ranean EuropeSouth-
East AsiaWestern
Pacific
Tuberculosisa 7.8 1.4 0.4 0.6 0.6 2.8 2.1
HIV infectiona 2.8 1.9 0.2 0.1 0.2 0.2 0.1
Diarrhoeal diseaseb 4 620.4 912.9 543.1 424.9 207.1 1 276.5 1 255.9
Pertussisb 18.4 5.2 1.2 1.6 0.7 7.5 2.1
Measlesa 27.1 5.3 0.0e 1.0 0.2 17.4 3.3
Tetanusa 0.3 0.1 0.0 0.1 0.0 0.1 0.0
Meningitisb 0.7 0.3 0.1 0.1 0.0 0.2 0.1
Malariab 241.3 203.9 2.9 8.6 0.0 23.3 2.7
Dengueb 9.0 0.1 1.4 0.5 0.0 4.6 2.3
Lower respiratory infectionsb 429.2 131.3 45.4 52.7 19.0 134.6 46.2
Complications of pregnancy:
– maternal haemorrhage 12.0 3.0 1.2 1.6 0.7 4.0 1.4
– maternal sepsis 5.2 1.2 0.6 0.7 0.3 1.7 0.6
– hypertensive disorders 8.4 2.1 0.8 1.2 0.5 2.8 1.1
– obstructed labour 4.0 1.1 0.1 0.5 0.0 1.9 0.4
– unsafe abortion 20.4 4.8 4.0 2.9 0.5 7.4 0.8
Malignant neoplasms – all sites 11.4 0.7 2.3 0.5 3.1 1.7 3.2
Congestive heart failurec 5.7 0.5 0.8 0.4 1.3 1.4 1.3
Stroke, first-ever 9.0 0.7 0.9 0.4 2.0 1.8 3.3
Injuriesd due to:
– road traffic accidents 24.3 4.7 2.2 2.8 1.8 8.6 4.1
– falls 37.3 2.8 3.3 3.6 5.3 14.4 8.0
– fires 10.9 1.7 0.3 1.5 0.8 5.9 0.7
– violence 17.2 4.5 5.9 2.0 1.6 2.2 1.0
a New cases.b Episodes of illness.c Incidence of congestive heart failure due to rheumatic heart disease, hypertensive heart disease, ischaemic
heart disease or inflammatory heart diseases.d Incidence of injuries severe enough to require medical attention.e An entry of 0.0 in the table refers to an incidence of less than 0.05 million (less than 50 000).
29
Global Burden of Disease 2004
Disease incidence, prevalence and disability
1
2
3
4
Annex A
Annex B
Annex C
References
time (mostly one year). Incidence does not meas-ure how many people have a disease at any given moment (this is “prevalence”) or how badly their lives are affected. A health problem or disease can have a relatively low incidence but cause death or disability, and will therefore result in a high burden of disease or many life years lost. Conversely, some common illnesses may cause a much smaller burden of disease or fewer life years lost. Data on the con-tribution of various conditions and diseases to the burden of disease in a community are given in later sections.
Diarrhoeal disease is the most common cause of illness
Of the diseases listed in Table 5, diarrhoeal disease affects far more individuals than any other illness, even in regions that include high-income countries. Pneumonia and other lower respiratory tract infec-tions are the second most common cause of illness globally, and in all regions except Africa. Other common illnesses – such as upper respiratory tract infections (including the common cold) and aller-gic rhinitis (hay fever) – have not been included in Table 5.
10. Cancer incidence by site and region
11.4 million people were diagnosed with cancer in 2004
More cancers occur in high-income countries than in low- and middle-income countries. Cervix can-cer is the only type of cancer more common in the African and South-East Asia regions than in high-income countries. In part, this is due to the age of the populations in different regions, because most cancers affect older adults; also, some cancers, such as prostate cancer, are much more common in older men than in younger men. Another factor contrib-uting to the distribution of a type of cancer is the number of people exposed to causes, such as ciga-rette smoking in the case of lung cancer, and hepati-tis B virus in the case of liver cancer. Globally, lung cancer is the most common cancer (Table 6), followed
by breast cancer, then colon and rectum cancer, and stomach cancer. Lung cancer is also the lead-ing cancer in the Western Pacific Region, but is less common than colon and rectum cancers or breast cancers in most other regions. Cervix cancer is the cancer with the highest incidence in the African and South-East Asia regions, even though it occurs only in women.
Variations across regions in the risk of cancer are best shown using age-standardized incidence rates that apply the estimated age- and sex-specific inci-dence rates for cancers in each region to the WHO World Standard Population (22). This estimates how many cases of cancer would occur in that population if it experienced the cancer incidence rates of a given region (Figure 18).
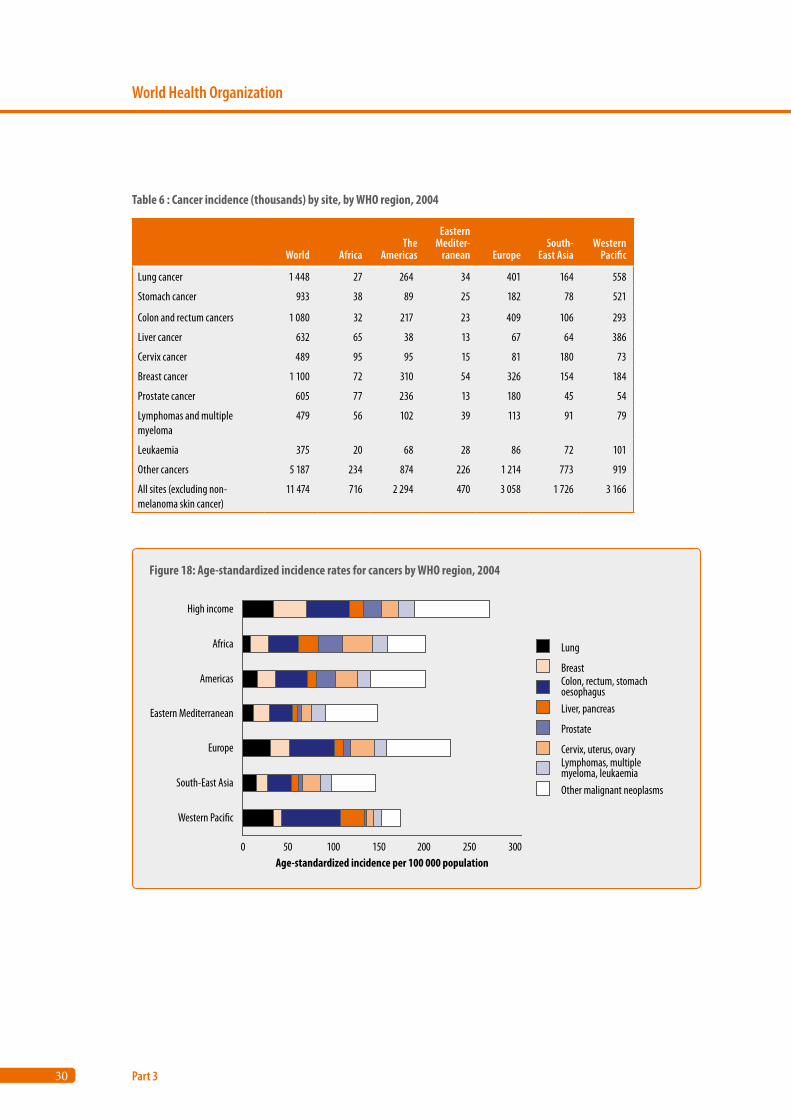
30
World Health Organization
Part 3
Table 6 : Cancer incidence (thousands) by site, by WHO region, 2004
World AfricaThe
Americas
Eastern Mediter-
ranean EuropeSouth-
East AsiaWestern
Pacific
Lung cancer 1 448 27 264 34 401 164 558
Stomach cancer 933 38 89 25 182 78 521
Colon and rectum cancers 1 080 32 217 23 409 106 293
Liver cancer 632 65 38 13 67 64 386
Cervix cancer 489 95 95 15 81 180 73
Breast cancer 1 100 72 310 54 326 154 184
Prostate cancer 605 77 236 13 180 45 54
Lymphomas and multiple myeloma
479 56 102 39 113 91 79
Leukaemia 375 20 68 28 86 72 101
Other cancers 5 187 234 874 226 1 214 773 919
All sites (excluding non-melanoma skin cancer)
11 474 716 2 294 470 3 058 1 726 3 166
Figure 18: Age-standardized incidence rates for cancers by WHO region, 2004
0 50 100 150 200 250 300
High income
Africa
Americas
Eastern Mediterranean
Europe
South-East Asia
Western Paci�c
Age-standardized incidence per 100 000 population
Lung
Breast
Liver, pancreas
Prostate
Cervix, uterus, ovary
Other malignant neoplasms
Lymphomas, multiplemyeloma, leukaemia
Colon, rectum, stomachoesophagus
31
Global Burden of Disease 2004
Disease incidence, prevalence and disability
1
2
3
4
Annex A
Annex B
Annex C
References
11. How many people are sick at any given time?
The prevalence of an illness or condition is the number of individuals who have the condition at any moment. In some cases, such as epilepsy or migraine, individuals will not have symptoms most of the time, but still have the condition. The effects of the illness and the loss of health will vary from one individual to another. The result may be serious impairments and disability affecting a person’s abil-ity to work or take part in family and community activities, or only mild impairments or disability. Prevalence data therefore do not capture the burden of disease experienced by individuals in terms of lost health.
Anaemia, hearing loss and migraine are the three most prevalent conditions
The conditions that affect the largest number of individuals at any given moment are not dramatic, and are thus easily overlooked and underestimated (Table 7). Worldwide, at any given moment, more individuals have iron-deficiency anaemia than any other health problem. Even in high-income coun-tries, iron deficiency anaemia is common. Other very common conditions, with varying levels of severity, include asthma, arthritis, vision and hear-ing problems, migraine, major depressive episodes and intestinal worms.
12. Prevalence of moderate and severe disability
The previous sections presented estimates of num-bers of new and current cases for various diseases and injuries. A disease or injury may have multiple disabling effects of various levels of severity, and cause varying degrees of health problems. The GBD links average loss of health to disease and injury causes through the disability weights (see Box 1, page 3). The term disability has a number of differ-ent meanings and, in particular, is not seen by some
as a synonym or proxy for “loss of health”. However, the GBD uses the term disability to refer to loss of health, where health is conceptualized in terms of functioning capacity in a set of health domains such as mobility, cognition, hearing and vision.
The original GBD study established severity weights for approximately 500 disabling sequelae of diseases and injury, in a formal study involving health workers from all regions of the world. These weights were then grouped into seven classes, where class I has a weight between 0 and 0.02, and class VII a weight between 0.7 and 1 (Table 8). Participants in the study estimated distributions across the seven classes for each sequela. Distributions across disabil-ity classes were estimated separately for treated and untreated cases where relevant; distributions could also vary by age group and sex.
These distributions were applied to prevalence estimates from the GBD 2004 study to estimate the prevalence of disability by severity class in 2004. Results are presented here for the prevalence of:• “severe” disability, defined as severity classes
VI and VII (the equivalent of having blindness, Down syndrome, quadriplegia, severe depression or active psychosis) – see Table 8;
• “moderate and severe” disability, defined as severity classes III and greater (the equivalent of having angina, arthritis, low vision or alcohol dependence).
Prevalence estimates were restricted to sequelae last-ing, on average, six months or more.
The GBD prevalence estimates cannot be added easily, because they were calculated without regard for multiple pathologies or comorbidities; thus, a given individual would be counted more than once if they had more than one diagnosis. Overall disability prevalence estimates presented here were adjusted for comorbidity using a method that takes account of the increased probability of having certain pairs of conditions (23). Limited self-reported data were available on comorbidity levels in populations, so the adjusted disability prevalences presented here have quite high levels of uncertainty.
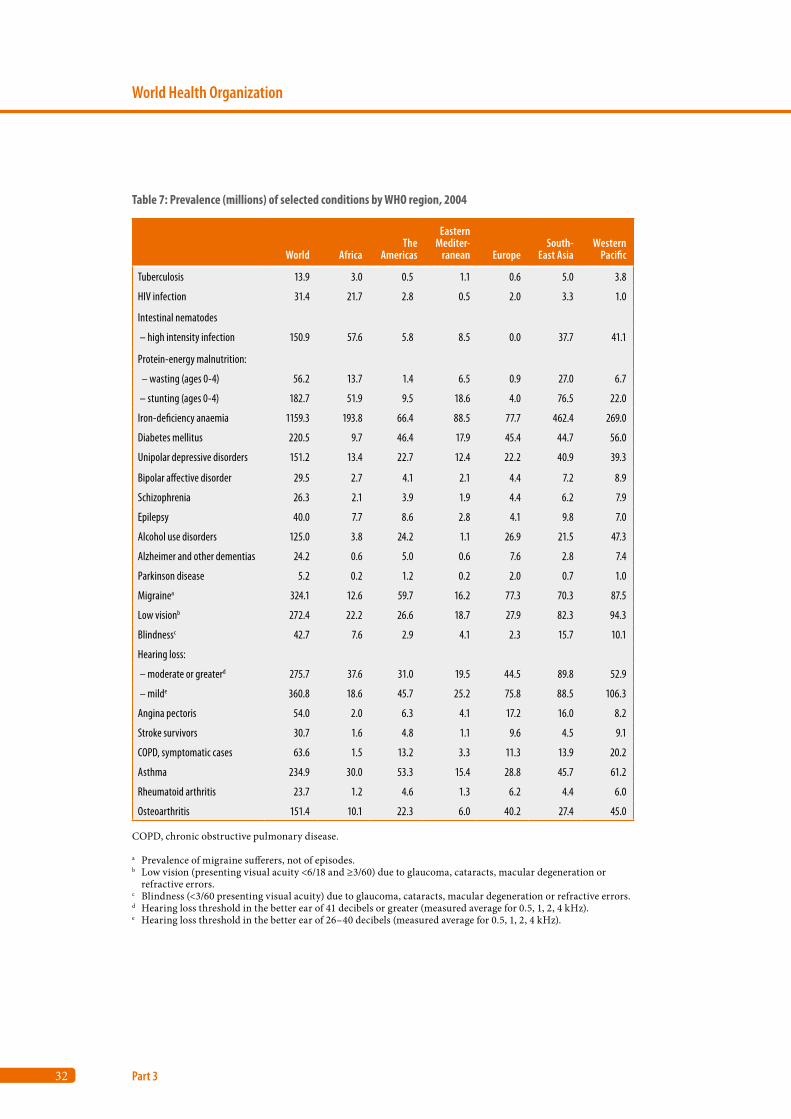
32
World Health Organization
Part 3
Table 7: Prevalence (millions) of selected conditions by WHO region, 2004
World AfricaThe
Americas
Eastern Mediter-
ranean EuropeSouth-
East AsiaWestern
Pacific
Tuberculosis 13.9 3.0 0.5 1.1 0.6 5.0 3.8
HIV infection 31.4 21.7 2.8 0.5 2.0 3.3 1.0
Intestinal nematodes
– high intensity infection 150.9 57.6 5.8 8.5 0.0 37.7 41.1
Protein-energy malnutrition:
– wasting (ages 0-4) 56.2 13.7 1.4 6.5 0.9 27.0 6.7
– stunting (ages 0-4) 182.7 51.9 9.5 18.6 4.0 76.5 22.0
Iron-deficiency anaemia 1159.3 193.8 66.4 88.5 77.7 462.4 269.0
Diabetes mellitus 220.5 9.7 46.4 17.9 45.4 44.7 56.0
Unipolar depressive disorders 151.2 13.4 22.7 12.4 22.2 40.9 39.3
Bipolar affective disorder 29.5 2.7 4.1 2.1 4.4 7.2 8.9
Schizophrenia 26.3 2.1 3.9 1.9 4.4 6.2 7.9
Epilepsy 40.0 7.7 8.6 2.8 4.1 9.8 7.0
Alcohol use disorders 125.0 3.8 24.2 1.1 26.9 21.5 47.3
Alzheimer and other dementias 24.2 0.6 5.0 0.6 7.6 2.8 7.4
Parkinson disease 5.2 0.2 1.2 0.2 2.0 0.7 1.0
Migrainea 324.1 12.6 59.7 16.2 77.3 70.3 87.5
Low visionb 272.4 22.2 26.6 18.7 27.9 82.3 94.3
Blindnessc 42.7 7.6 2.9 4.1 2.3 15.7 10.1
Hearing loss:
– moderate or greaterd 275.7 37.6 31.0 19.5 44.5 89.8 52.9
– milde 360.8 18.6 45.7 25.2 75.8 88.5 106.3
Angina pectoris 54.0 2.0 6.3 4.1 17.2 16.0 8.2
Stroke survivors 30.7 1.6 4.8 1.1 9.6 4.5 9.1
COPD, symptomatic cases 63.6 1.5 13.2 3.3 11.3 13.9 20.2
Asthma 234.9 30.0 53.3 15.4 28.8 45.7 61.2
Rheumatoid arthritis 23.7 1.2 4.6 1.3 6.2 4.4 6.0
Osteoarthritis 151.4 10.1 22.3 6.0 40.2 27.4 45.0
COPD, chronic obstructive pulmonary disease.
a Prevalence of migraine sufferers, not of episodes.b Low vision (presenting visual acuity <6/18 and ≥3/60) due to glaucoma, cataracts, macular degeneration or
refractive errors.c Blindness (<3/60 presenting visual acuity) due to glaucoma, cataracts, macular degeneration or refractive errors.d Hearing loss threshold in the better ear of 41 decibels or greater (measured average for 0.5, 1, 2, 4 kHz).e Hearing loss threshold in the better ear of 26–40 decibels (measured average for 0.5, 1, 2, 4 kHz).
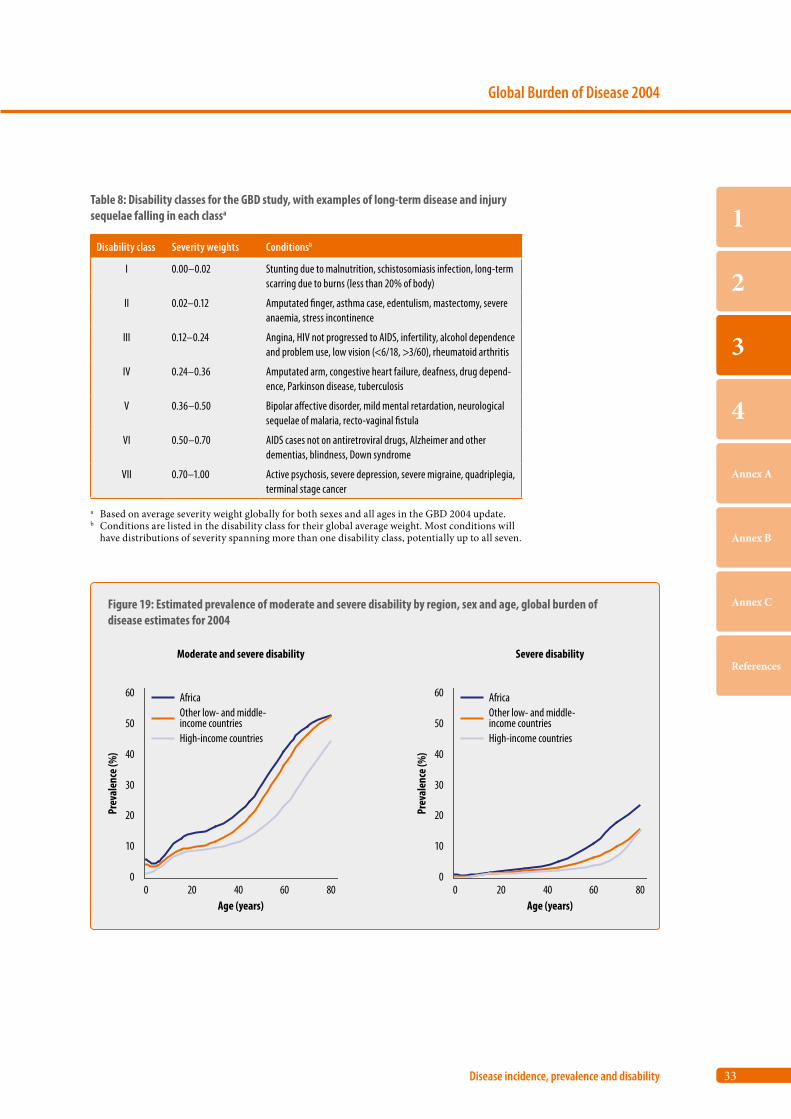
33
Global Burden of Disease 2004
Disease incidence, prevalence and disability
1
2
3
4
Annex A
Annex B
Annex C
References
Table 8: Disability classes for the GBD study, with examples of long-term disease and injury sequelae falling in each classa
Disability class Severity weights Conditionsb
I 0.00–0.02 Stunting due to malnutrition, schistosomiasis infection, long-term scarring due to burns (less than 20% of body)
II 0.02–0.12 Amputated finger, asthma case, edentulism, mastectomy, severe anaemia, stress incontinence
III 0.12–0.24 Angina, HIV not progressed to AIDS, infertility, alcohol dependence and problem use, low vision (<6/18, >3/60), rheumatoid arthritis
IV 0.24–0.36 Amputated arm, congestive heart failure, deafness, drug depend-ence, Parkinson disease, tuberculosis
V 0.36–0.50 Bipolar affective disorder, mild mental retardation, neurological sequelae of malaria, recto-vaginal fistula
VI 0.50–0.70 AIDS cases not on antiretroviral drugs, Alzheimer and other dementias, blindness, Down syndrome
VII 0.70–1.00 Active psychosis, severe depression, severe migraine, quadriplegia, terminal stage cancer
a Based on average severity weight globally for both sexes and all ages in the GBD 2004 update. b Conditions are listed in the disability class for their global average weight. Most conditions will
have distributions of severity spanning more than one disability class, potentially up to all seven.
Figure 19: Estimated prevalence of moderate and severe disability by region, sex and age, global burden of disease estimates for 2004
0
10
20
30
40
50
60
0 20 40 60 80
Prev
alen
ce (%
)
Age (years)
0
10
20
30
40
50
60
0 20 40 60 80
Prev
alen
ce (%
)
Age (years)
Africa
High-income countries
Other low- and middle-income countries
Africa
High-income countries
Other low- and middle-income countries
Moderate and severe disability Severe disability
34
World Health Organization
Part 3
Almost 19 million people were severely disabled in 2004
Of the world’s population of nearly 6.5 billion in 2004, 18.6 million (2.9%) were severely disabled and another 79.7 million (12.4%) had moderate long-term disability, according to the definitions given above. Disability prevalences rise strongly with age (Figure 19). The average global prevalence of moder-ate and severe disability ranges from 5% in children aged 0–14 years, to 15% in adults aged 15–59 years, and 46% in adults aged 60 years and older. At all ages, both moderate and severe levels of disability are higher in low- and middle-income countries than in high-income countries; they are also higher in Africa than in other low- and middle-income countries (Figure 19). Older people make up a greater proportion of the population in high-income coun-tries, but have lower levels of disability than their counterparts in low- and middle-income countries. Disability is also more common among children in the low- and middle-income countries. Moderate disability rates are similar for males and females in high-income countries, but females have somewhat higher rates of severe disability. In low- and middle-income countries, male and female disability rates are similar, although females aged 15–59 years tend to have higher levels of moderate disability in Africa, the Eastern Mediterranean and the Western Pacific.
Hearing loss, vision problems and mental disorders are the most common causes of disability
The most common causes of disability globally are adult-onset hearing loss and refractive errors. Mental disorders such as depression, alcohol use disorders and psychoses (e.g. bipolar disorder and schizophre-nia) are also among the 20 leading causes of disabil-ity (Table 9). The pattern differs between the high-income countries and the low- and middle-income countries. In the lower income countries, many more people are disabled due to preventable causes such as unintentional injuries and infertility arising
from unsafe abortion and maternal sepsis. The data also demonstrate the lack of interventions for eas-ily treated conditions such as hearing loss, refractive errors and cataracts in low-income countries.
Disability due to mental disorders is more com-mon among people aged 0–59 years, whereas chronic diseases such as dementias, chronic obstructive pul-monary disease and cerebrovascular disease are more common in older populations. In low-income coun-tries, disability due to unintentional injuries, among the younger population, and cataracts, among the older population, are far more common.
Much uncertainty around the disability estimates
The GBD prevalence estimates are based on system-atic assessments of the available data on incidence, prevalence, duration and severity of a wide range of conditions. However, these assessments are often based on inconsistent, fragmented and partial data from different studies, meaning that there are still substantial data gaps and uncertainties. Improving the population-level information on the incidence, prevalence and states of health associated with major health conditions remains a major priority for national and international health and statistical agencies. Clinically and conceptually, it is not usual practice to infer disability from diagnoses. In future revisions of the GBD study, increased effort will be devoted to direct estimation of the prevalences of impairments and disabilities, and to ensuring con-sistency with the estimates for disease- and injury-specific sequelae.
Population survey data on disability prevalence are limited in availability and comparability. The estimates derived from the GBD have the virtue of comprehensiveness, and at least some grounding in disease prevalence. However, they are very much approximations, and are subject to very clear limita-tions in the way they were compiled. These estimates are presented to give an indication of the regional prevalences of long-term disability implied by the GBD analyses.
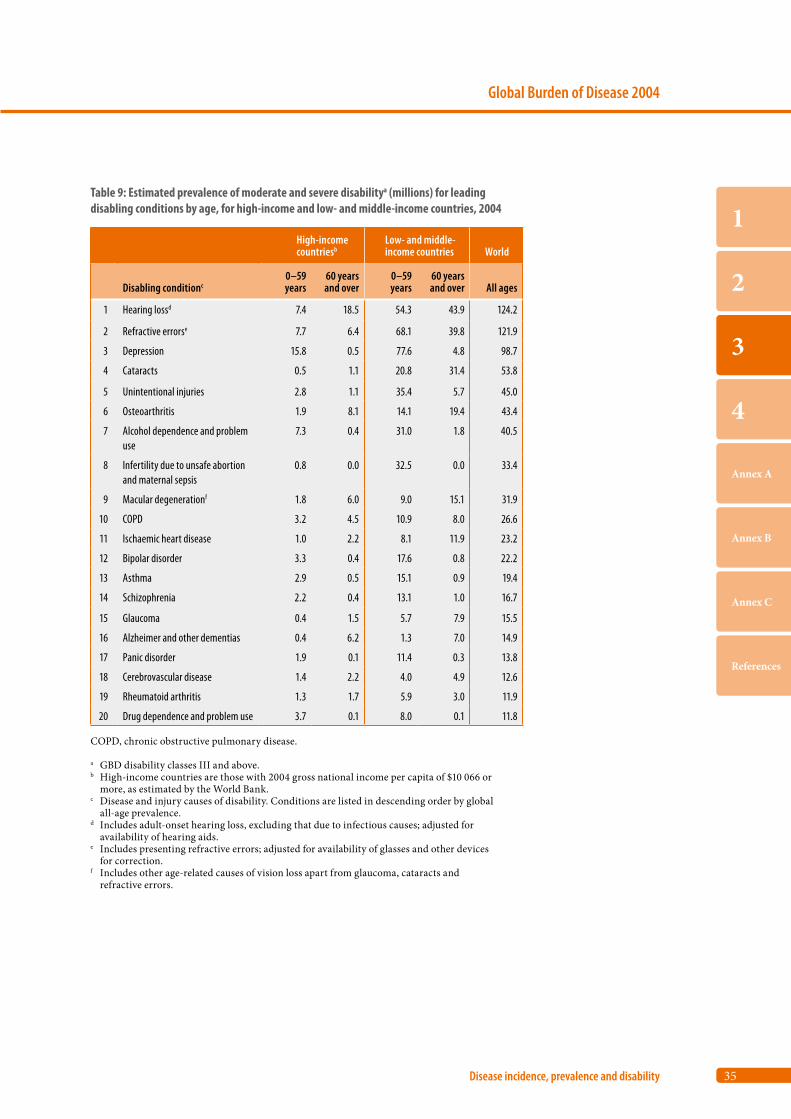
35
Global Burden of Disease 2004
Disease incidence, prevalence and disability
1
2
3
4
Annex A
Annex B
Annex C
References
Table 9: Estimated prevalence of moderate and severe disabilitya (millions) for leading disabling conditions by age, for high-income and low- and middle-income countries, 2004
High-income countriesb
Low- and middle-income countries World
Disabling conditionc0–59 years
60 years and over
0–59 years
60 years and over All ages
1 Hearing lossd 7.4 18.5 54.3 43.9 124.2
2 Refractive errorse 7.7 6.4 68.1 39.8 121.9
3 Depression 15.8 0.5 77.6 4.8 98.7
4 Cataracts 0.5 1.1 20.8 31.4 53.8
5 Unintentional injuries 2.8 1.1 35.4 5.7 45.0
6 Osteoarthritis 1.9 8.1 14.1 19.4 43.4
7 Alcohol dependence and problem use
7.3 0.4 31.0 1.8 40.5
8 Infertility due to unsafe abortion and maternal sepsis
0.8 0.0 32.5 0.0 33.4
9 Macular degenerationf 1.8 6.0 9.0 15.1 31.9
10 COPD 3.2 4.5 10.9 8.0 26.6
11 Ischaemic heart disease 1.0 2.2 8.1 11.9 23.2
12 Bipolar disorder 3.3 0.4 17.6 0.8 22.2
13 Asthma 2.9 0.5 15.1 0.9 19.4
14 Schizophrenia 2.2 0.4 13.1 1.0 16.7
15 Glaucoma 0.4 1.5 5.7 7.9 15.5
16 Alzheimer and other dementias 0.4 6.2 1.3 7.0 14.9
17 Panic disorder 1.9 0.1 11.4 0.3 13.8
18 Cerebrovascular disease 1.4 2.2 4.0 4.9 12.6
19 Rheumatoid arthritis 1.3 1.7 5.9 3.0 11.9
20 Drug dependence and problem use 3.7 0.1 8.0 0.1 11.8
COPD, chronic obstructive pulmonary disease.
a GBD disability classes III and above.b High-income countries are those with 2004 gross national income per capita of $10 066 or
more, as estimated by the World Bank.c Disease and injury causes of disability. Conditions are listed in descending order by global
all-age prevalence.d Includes adult-onset hearing loss, excluding that due to infectious causes; adjusted for
availability of hearing aids.e Includes presenting refractive errors; adjusted for availability of glasses and other devices
for correction.f Includes other age-related causes of vision loss apart from glaucoma, cataracts and
refractive errors.
36
World Health Organization
Part 3
13. Leading causes of years lost due to disability in 2004
The data presented in the sections above concern the number of new cases of diseases and injuries (incidence), and the number of individuals living with diseases or injuries and their sequelae (preva-lence). These counts of incidence or prevalence of diseases in populations do not take into account the relative severity or health loss associated with differ-ent conditions, and hence do not capture the burden of disease experienced by individuals. The disability weights used in the GBD convert the years lived with various health conditions to equivalent lost years of full health. The disability weights used in the GBD 2004 are listed in detail elsewhere (24).
As explained in Box 1 (see page 3), YLD measure the equivalent years of healthy life lost through time spent in states of less than full health. When all the years of life with reduced capability for all the suf-ferers of each condition are added up and weighted by the disability weight, a total of YLD for each con-dition is obtained. YLD estimates are restricted to loss of health experienced by individuals, and do not take into account other aspects of quality of life or well-being, or the impacts of a person’s health con-dition on other people (except as far as they experi-ence directly assessed losses of health themselves).
Neuropsychiatric disorders cause one third of YLD
The 10 leading causes of YLD are shown in Table 10 for males and females, and in Table 11 for high-income and low- and middle-income countries. The overall burden of non-fatal disabling conditions is domi-nated by a relatively short list of causes, particularly a number of neuropsychiatric conditions and sense organ disorders. In all regions, neuropsychiatric conditions are the most important causes of disabil-ity, accounting for around one third of YLD among adults aged 15 years and over.
Depression is particularly common among women
The disabling burden of neuropsychiatric condi-tions is almost the same for males and females, but the major contributing causes are different. While depression is the leading cause for both males and
females, the burden of depression is 50% higher for females than males. Females also have a higher bur-den from anxiety disorders, migraine and Alzheimer and other dementias. In contrast, the male burden for alcohol and drug use disorders is nearly seven times higher than that for females, and accounts for almost one third of the male neuropsychiatric bur-den. In both low- and middle-income countries, and high-income countries, alcohol use disorders are among the 10 leading causes of YLD. This includes only the direct burden of alcohol dependence and problem use. The total attributable burden of dis-ability due to alcohol use is much larger.
One in four adults aged 45 years and older have hearing loss
Curable disorders of vision (cataracts and refractive errors) cause 9% of YLD in men and women aged 15 years and over; adult-onset hearing loss accounts for another 6.5% in men and 5.6% in women. Adult-onset hearing loss is extremely prevalent – more than 27% of males and 24% of females aged 45 years and over experience mild hearing loss or greater (hearing threshold of 26 decibels or greater in the better ear). The GBD 2004 has estimated only the burden of moderate or greater hearing loss (hearing threshold of 41 decibels or greater in the better ear). Childhood-onset hearing loss is not included in this cause category because most childhood hearing loss is due to congenital causes, infectious diseases, or other diseases or injury. It is included as sequelae for such causes in the estimation of burden of disease.
Ninety per cent of the burden of non-fatal health outcomes is in low- and middle-income countries
Perhaps surprisingly, around 90% of global non-fatal health outcomes (as measured by YLD) occur in low- and middle-income countries, and nearly half (44%) of all YLD fall in low-income countries. Although the prevalence of disabling conditions such as dementia and musculoskeletal disease are higher in countries with long life expectancies, this is offset by lower contributions to disability from conditions such as cardiovascular disease, chronic respiratory diseases and long-term sequelae of com-municable diseases and nutritional deficiencies. In
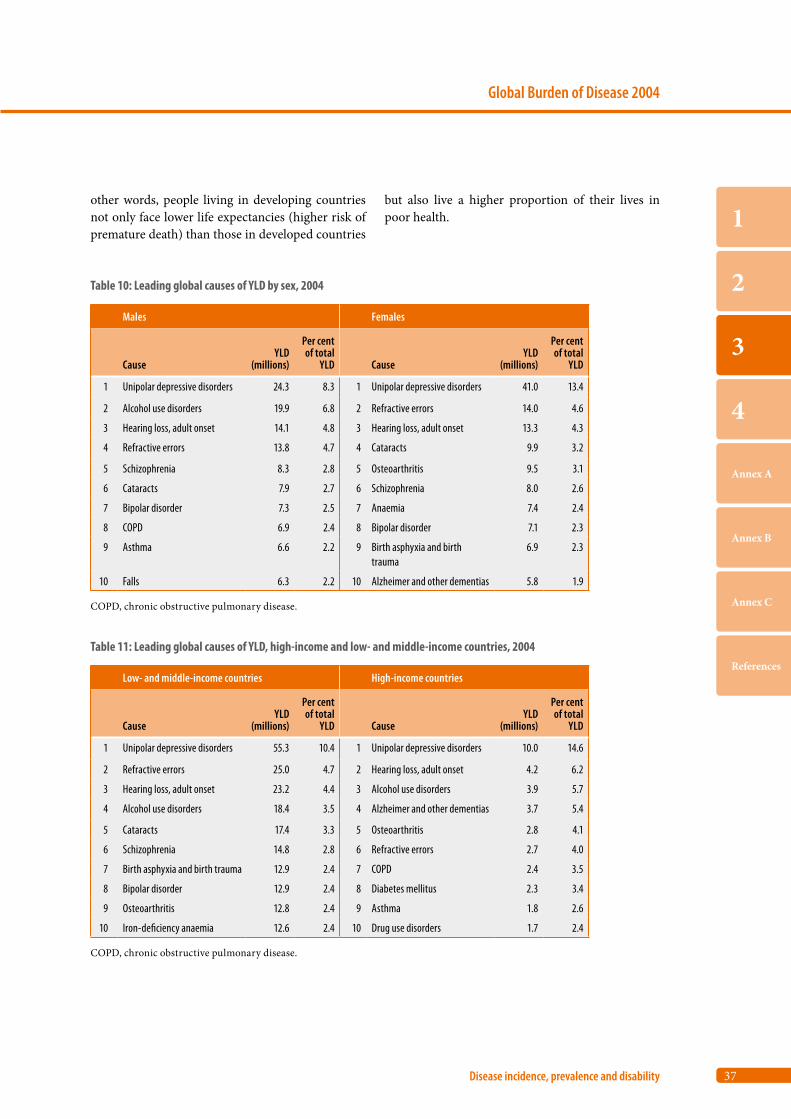
37
Global Burden of Disease 2004
Disease incidence, prevalence and disability
1
2
3
4
Annex A
Annex B
Annex C
References
other words, people living in developing countries not only face lower life expectancies (higher risk of premature death) than those in developed countries
Table 11: Leading global causes of YLD, high-income and low- and middle-income countries, 2004
Low- and middle-income countries High-income countries
CauseYLD
(millions)
Per cent of total
YLD CauseYLD
(millions)
Per cent of total
YLD
1 Unipolar depressive disorders 55.3 10.4 1 Unipolar depressive disorders 10.0 14.6
2 Refractive errors 25.0 4.7 2 Hearing loss, adult onset 4.2 6.2
3 Hearing loss, adult onset 23.2 4.4 3 Alcohol use disorders 3.9 5.7
4 Alcohol use disorders 18.4 3.5 4 Alzheimer and other dementias 3.7 5.4
5 Cataracts 17.4 3.3 5 Osteoarthritis 2.8 4.1
6 Schizophrenia 14.8 2.8 6 Refractive errors 2.7 4.0
7 Birth asphyxia and birth trauma 12.9 2.4 7 COPD 2.4 3.5
8 Bipolar disorder 12.9 2.4 8 Diabetes mellitus 2.3 3.4
9 Osteoarthritis 12.8 2.4 9 Asthma 1.8 2.6
10 Iron-deficiency anaemia 12.6 2.4 10 Drug use disorders 1.7 2.4
COPD, chronic obstructive pulmonary disease.
but also live a higher proportion of their lives in poor health.
Table 10: Leading global causes of YLD by sex, 2004
Males Females
CauseYLD
(millions)
Per cent of total
YLD CauseYLD
(millions)
Per cent of total
YLD
1 Unipolar depressive disorders 24.3 8.3 1 Unipolar depressive disorders 41.0 13.4
2 Alcohol use disorders 19.9 6.8 2 Refractive errors 14.0 4.6
3 Hearing loss, adult onset 14.1 4.8 3 Hearing loss, adult onset 13.3 4.3
4 Refractive errors 13.8 4.7 4 Cataracts 9.9 3.2
5 Schizophrenia 8.3 2.8 5 Osteoarthritis 9.5 3.1
6 Cataracts 7.9 2.7 6 Schizophrenia 8.0 2.6
7 Bipolar disorder 7.3 2.5 7 Anaemia 7.4 2.4
8 COPD 6.9 2.4 8 Bipolar disorder 7.1 2.3
9 Asthma 6.6 2.2 9 Birth asphyxia and birth trauma
6.9 2.3
10 Falls 6.3 2.2 10 Alzheimer and other dementias 5.8 1.9
COPD, chronic obstructive pulmonary disease.

Part 4
Burden of disease: DALYs
14. Broad cause composition 40
15. The age distribution of burden of disease 42
16. Leading causes of burden of disease 42
17. The disease and injury burden for women 46
18. The growing burden of noncommunicable disease 47
19. The unequal burden of injury 48
20. Projected burden of disease in 2030 49
40
World Health Organization
Part 4
14. Broad cause composition
The measures of ill-health used so far (incidence, prevalence and YLL) do not give a good indication of the burden of disease borne by individuals in dif-ferent communities. The summary measure used to give an indication of the burden of disease is the DALY (see Box 1, page 3). One DALY represents the loss of the equivalent of one year of full health. Using DALYs, the burden of diseases that cause early death but little disability (eg. drowning or measles) can be compared to that of diseases that do not cause death but do cause disability (e.g. cataract causing blindness).
Globally, 60% of DALYs are due to premature mortality
As described in the Introduction, DALYs for 2004 combine the following:
• YLL for years of life lost due to deaths in 2004 • YLD for equivalent healthy years of life lost
through living in states of less than full health for cases of disease and injury incident in 2004.
The global average burden of disease across all regions in 2004 was 237 DALYs per 1000 population, of which about 60% was due to premature death and 40% to non-fatal health outcomes.
DALYs in Africa are at least two times higher than in any other region
The contribution of premature death varied dra-matically across regions, with YLL rates seven times higher in Africa than in high-income coun-tries (Figure 20). In contrast, the YLD rates were less varied, with Africa having 80% higher rates than high-income countries. South-East Asia and Africa together bore 54% of the total global burden of dis-ease in 2004, although they account for only about 40% of the world’s population. The Western Pacific
Region has the “healthiest” low- and middle-income countries, with countries such as China now hav-ing life expectancies similar to those of many Latin American countries, and higher than those in some European countries.
The greatest variation between regions is for Group I conditions
The high levels of burden of disease for the WHO African, South-East Asia and Eastern Mediterra-nean regions compared to other regions are pre-dominantly due to Group I conditions (communica-ble diseases, and maternal, perinatal and nutritional conditions), although injury DALY rates are also higher than in other regions (Figure 21). European low-and middle-income countries have a substan-tially higher noncommunicable disease burden than high-income countries (Figure 21). They also have a higher burden due to Group I causes and Group III causes (injuries). In fact, these countries have the highest proportion of burden due to injuries (16%) of all the regions, followed by the low- and middle-income countries of the Americas.
Noncommunicable diseases now cause almost half of the burden of disease in low- and middle-income countries
Almost one half of the disease burden in low- and middle-income countries is now from noncommu-nicable diseases. Ischaemic heart disease and stroke are the largest sources of this burden, especially in the low- and middle-income countries of Europe, where cardiovascular diseases account for more than one quarter of the total disease burden. Injuries accounted for 17% of the disease burden in adults aged 15–59 years in 2004. In the low- and middle-income countries of the Americas, Europe and the Eastern Mediterranean Region, more than 30% of the entire disease and injury burden among men aged 15–44 years was from injuries.
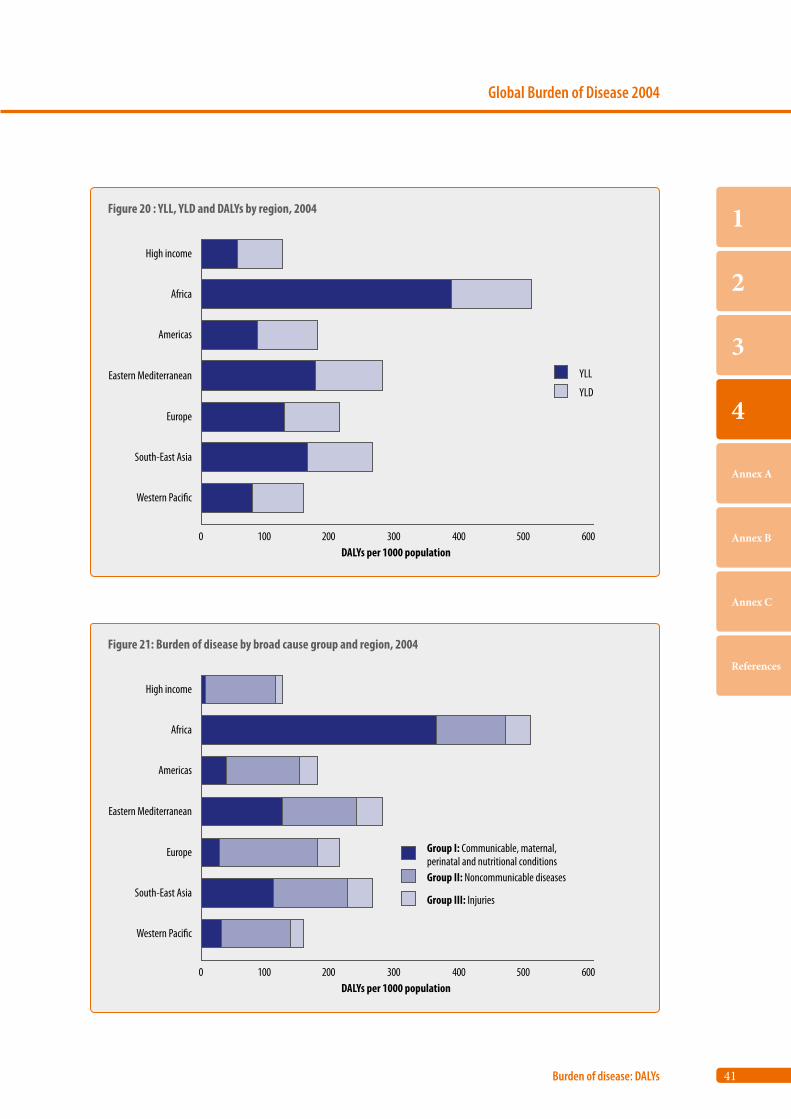
41
Global Burden of Disease 2004
Burden of disease: DALYs
1
2
3
4
Annex A
Annex B
Annex C
References
Figure 20 : YLL, YLD and DALYs by region, 2004
0 100 200 300 400 500 600
High income
Africa
Americas
Eastern Mediterranean
Europe
South-East Asia
Western Paci�c
DALYs per 1000 population
YLL
YLD
Figure 21: Burden of disease by broad cause group and region, 2004
0 100 200 300 400 500 600
High income
Africa
Americas
Eastern Mediterranean
Europe
South-East Asia
Western Paci�c
DALYs per 1000 population
Group III: Injuries
Group II: Noncommunicable diseases
Group I: Communicable, maternal, perinatal and nutritional conditions
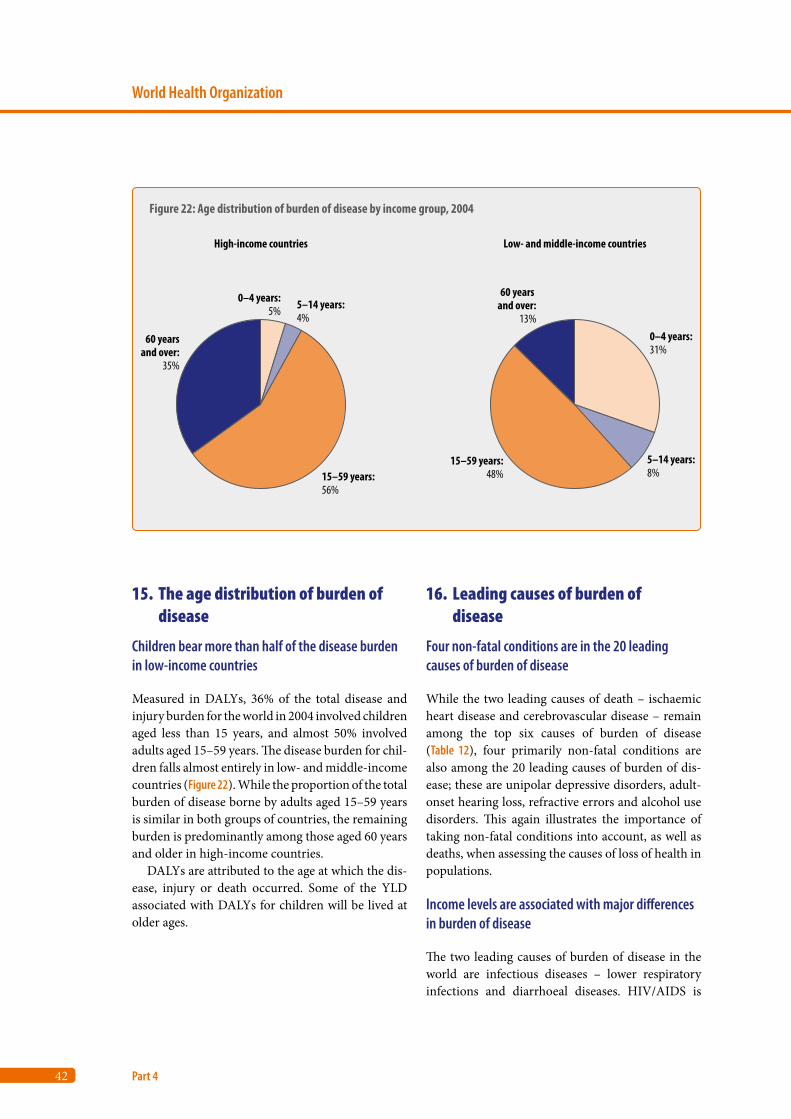
42
World Health Organization
Part 4
15. The age distribution of burden of disease
Children bear more than half of the disease burden in low-income countries
Measured in DALYs, 36% of the total disease and injury burden for the world in 2004 involved children aged less than 15 years, and almost 50% involved adults aged 15–59 years. The disease burden for chil-dren falls almost entirely in low- and middle-income countries (Figure 22). While the proportion of the total burden of disease borne by adults aged 15–59 years is similar in both groups of countries, the remaining burden is predominantly among those aged 60 years and older in high-income countries.
DALYs are attributed to the age at which the dis-ease, injury or death occurred. Some of the YLD associated with DALYs for children will be lived at older ages.
16. Leading causes of burden of disease
Four non-fatal conditions are in the 20 leading causes of burden of disease
While the two leading causes of death – ischaemic heart disease and cerebrovascular disease – remain among the top six causes of burden of disease (Table 12), four primarily non-fatal conditions are also among the 20 leading causes of burden of dis-ease; these are unipolar depressive disorders, adult-onset hearing loss, refractive errors and alcohol use disorders. This again illustrates the importance of taking non-fatal conditions into account, as well as deaths, when assessing the causes of loss of health in populations.
Income levels are associated with major differences in burden of disease
The two leading causes of burden of disease in the world are infectious diseases – lower respiratory infections and diarrhoeal diseases. HIV/AIDS is
Figure 22: Age distribution of burden of disease by income group, 2004
0–4 years:31%
5–14 years:8%
15–59 years:48%
60 years and over:
13%
60 yearsand over:
35%
15–59 years:56%
5–14 years:4%
0–4 years:5%
High-income countries Low- and middle-income countries
43
Global Burden of Disease 2004
Burden of disease: DALYs
1
2
3
4
Annex A
Annex B
Annex C
References
Table 12: Leading causes of burden of disease (DALYs), all ages, 2004
Disease or injuryDALYs
(millions)
Per cent of total
DALYs
1 Lower respiratory infections 94.5 6.2
2 Diarrhoeal diseases 72.8 4.8
3 Unipolar depressive disorders 65.5 4.3
4 Ischaemic heart disease 62.6 4.1
5 HIV/AIDS 58.5 3.8
6 Cerebrovascular disease 46.6 3.1
7 Prematurity and low birth weight 44.3 2.9
8 Birth asphyxia and birth trauma 41.7 2.7
9 Road traffic accidents 41.2 2.7
10 Neonatal infections and othera 40.4 2.7
11 Tuberculosis 34.2 2.2
12 Malaria 34.0 2.2
13 COPD 30.2 2.0
14 Refractive errors 27.7 1.8
15 Hearing loss, adult onset 27.4 1.8
16 Congenital anomalies 25.3 1.7
17 Alcohol use disorders 23.7 1.6
18 Violence 21.7 1.4
19 Diabetes mellitus 19.7 1.3
20 Self-inflicted injuries 19.6 1.3
COPD, chronic obstructive pulmonary disease.
a This category also includes other non-infectious causes arising in the perinatal period apart from prematurity, low birth weight, birth trauma and asphyxia. These non-infec- tious causes are responsible for about 20% of DALYs shown in this category.
now the fifth cause of burden of disease globally, and three other infectious diseases also appear in the top 15 causes (Table 12).
The leading causes of burden of disease in low- income countries were broadly similar to those for the world in 2004, apart from malaria and TB (Table 13). Of the top 10 causes, 8 were Group I, but the leading causes in high-income countries were all noncommunicable diseases, with the exception of road traffic accidents (tenth leading cause). The leading causes in high-income countries included
three diseases (unipolar major depression, adult-onset hearing loss and alcohol use disorders) for which direct mortality is low.
Unipolar depression makes a large contribution to the burden of disease, being at third place world-wide and eighth place in low-income countries, but at first place in middle- and high-income countries. Effective treatments for depression are available, suggesting that this burden could be reduced.
Cigarette smoking is a major and entirely pre-ventable cause of burden of disease in middle- and high-income countries. Chronic obstructive pulmo-nary disease is in fifth place in middle-income coun-tries and seventh place in high-income countries, and lung cancer is in ninth place in high-income countries. Cigarette smoking also contributes to the burden of disease from ischaemic heart disease and cerebrovascular disease, and affects communities in low-income countries as well. Alcohol use disor-ders are another important preventable contributor to burden of disease in middle- and high-income countries.
Considerable variation between regions in the burden of disease
The WHO regions fall into two groups – those in which the burden of disease is dominated by infec-tious disease, and those in which the burden of dis-ease is dominated by vascular disease and depres-sion (Table 14).
In Africa, HIV/AIDS, lower respiratory infec-tions and diarrhoeal disease are the leading causes of burden of disease, whereas in the Eastern Medi-terranean and in South-East Asia, lower respiratory infections and diarrhoeal disease are the two lead-ing causes. In all three of these regions, problems during pregnancy and childbirth are important and preventable causes of burden of disease. The role of road traffic accidents in these regions, and of war and conflict in the Eastern Mediterranean, should also be noted.
Unipolar depression is one of the three leading causes of burden of disease in the WHO regions of the Americas, Europe and the Western Pacific. Ischaemic heart disease or cerebrovascular disease are also consistently leading causes of death in these
44
World Health Organization
Part 4
regions. The role of violence in the Americas as the second leading cause of burden of disease, and the role of chronic obstructive pulmonary disease in the Western Pacific as the third leading cause, are also notable. Alcohol use and road traffic accidents, consistently causing about 6% of DALYs, are also important in these regions.
The leading 10 causes of the burden of disease in 2004 included 4 communicable diseases. HIV/AIDS was the fifth leading cause of the burden of disease globally in 2004 and the leading cause in the WHO
African Region, where it was followed by lower res-piratory infections, diarrhoeal diseases and malaria. The WHO regions of South-East Asia, the Eastern Mediterranean and Africa are affected by a dual burden of disease (Table 14). These WHO regions are much more heavily burdened by infectious disease and conditions related to pregnancy and childbirth than other regions, but they also suffer severely from the problems that affect people in high-income countries – cardiovascular disease, depression and injury.
Table 13: Leading causes of burden of disease (DALYs), countries grouped by income, 2004
Disease or injuryDALYs
(millions)
Per cent of total
DALYs Disease or injuryDALYs
(millions)
Per cent of total
DALYs
World Low-income countriesa
1 Lower respiratory infections 94.5 6.2 1 Lower respiratory infections 76.9 9.3
2 Diarrhoeal diseases 72.8 4.8 2 Diarrhoeal diseases 59.2 7.2
3 Unipolar depressive disorders 65.5 4.3 3 HIV/AIDS 42.9 5.2
4 Ischaemic heart disease 62.6 4.1 4 Malaria 32.8 4.0
5 HIV/AIDS 58.5 3.8 5 Prematurity and low birth weight 32.1 3.9
6 Cerebrovascular disease 46.6 3.1 6 Neonatal infections and otherb 31.4 3.8
7 Prematurity and low birth weight 44.3 2.9 7 Birth asphyxia and birth trauma 29.8 3.6
8 Birth asphyxia and birth trauma 41.7 2.7 8 Unipolar depressive disorders 26.5 3.2
9 Road traffic accidents 41.2 2.7 9 Ischaemic heart disease 26.0 3.1
10 Neonatal infections and otherb 40.4 2.7 10 Tuberculosis 22.4 2.7
Middle-income countries High-income countries
1 Unipolar depressive disorders 29.0 5.1 1 Unipolar depressive disorders 10.0 8.2
2 Ischaemic heart disease 28.9 5.0 2 Ischaemic heart disease 7.7 6.3
3 Cerebrovascular disease 27.5 4.8 3 Cerebrovascular disease 4.8 3.9
4 Road traffic accidents 21.4 3.7 4 Alzheimer and other dementias 4.4 3.6
5 Lower respiratory infections 16.3 2.8 5 Alcohol use disorders 4.2 3.4
6 COPD 16.1 2.8 6 Hearing loss, adult onset 4.2 3.4
7 HIV/AIDS 15.0 2.6 7 COPD 3.7 3.0
8 Alcohol use disorders 14.9 2.6 8 Diabetes mellitus 3.6 3.0
9 Refractive errors 13.7 2.4 9 Trachea, bronchus, lung cancers 3.6 3.0
10 Diarrhoeal diseases 13.1 2.3 10 Road traffic accidents 3.1 2.6
COPD, chronic obstructive pulmonary disease.
a Countries grouped by gross national income per capita (see Annex C, Table C2).b This category also includes other non-infectious causes arising in the perinatal period apart from prematurity, low birth weight,
birth trauma and asphyxia. These non-infectious causes are responsible for about 20% of DALYs shown in this category.
45
Global Burden of Disease 2004
Burden of disease: DALYs
1
2
3
4
Annex A
Annex B
Annex C
References
Table 14: Leading causes of burden of disease (DALYs) by WHO region, 2004
Disease or injuryDALYs
(millions)
Per cent of total
DALYs Disease or injuryDALYs
(millions)
Per cent of total
DALYs
African Region Region of the Americas
1 HIV/AIDS 46.7 12.4 1 Unipolar depressive disorders 10.8 7.5
2 Lower respiratory infections 42.2 11.2 2 Violence 6.6 4.6
3 Diarrhoeal diseases 32.2 8.6 3 Ischaemic heart disease 6.5 4.6
4 Malaria 30.9 8.2 4 Alcohol use disorders 4.8 3.4
5 Neonatal infections and othera 13.4 3.6 5 Road traffic accidents 4.6 3.2
6 Birth asphyxia and birth trauma 13.4 3.6 6 Diabetes mellitus 4.1 2.9
7 Prematurity and low birth weight 11.3 3.0 7 Cerebrovascular disease 4.0 2.8
8 Tuberculosis 10.8 2.9 8 Lower respiratory infections 3.6 2.5
9 Road traffic accidents 7.2 1.9 9 COPD 3.1 2.2
10 Protein-energy malnutrition 7.1 1.9 10 Congenital anomalies 2.9 2.1
Eastern Mediterranean Region European Region
1 Lower respiratory infections 12.1 8.5 1 Ischaemic heart disease 16.8 11.1
2 Diarrhoeal diseases 8.3 5.9 2 Cerebrovascular disease 9.5 6.3
3 Ischaemic heart disease 6.2 4.3 3 Unipolar depressive disorders 8.4 5.6
4 Neonatal infections and othera 6.1 4.3 4 Alcohol use disorders 5.0 3.3
5 Birth asphyxia and birth trauma 5.5 3.9 5 Hearing loss, adult onset 3.9 2.6
6 Prematurity and low birth weight 5.3 3.8 6 Road traffic accidents 3.7 2.4
7 Unipolar depressive disorders 5.2 3.7 7 Trachea, bronchus, lung cancers 3.3 2.2
8 Road traffic accidents 5.1 3.6 8 Osteoarthritis 3.1 2.1
9 War and conflict 3.8 2.7 9 Cirrhosis of the liver 3.1 2.0
10 Congenital anomalies 3.7 2.6 10 Self-inflicted injuries 3.1 2.0
South-East Asia Region Western Pacific Region
1 Lower respiratory infections 28.3 6.4 1 Cerebrovascular disease 15.8 6.0
2 Diarrhoeal diseases 23.0 5.2 2 Unipolar depressive disorders 15.2 5.7
3 Ischaemic heart disease 21.6 4.9 3 COPD 11.9 4.5
4 Unipolar depressive disorders 21.1 4.8 4 Refractive errors 10.6 4.0
5 Prematurity and low birth weight 18.3 4.1 5 Road traffic accidents 9.6 3.6
6 Neonatal infections and othera 14.3 3.2 6 Alcohol use disorders 8.6 3.2
7 Birth asphyxia and birth trauma 13.9 3.1 7 Ischaemic heart disease 7.9 3.0
8 Tuberculosis 12.4 2.8 8 Hearing loss, adult onset 7.0 2.6
9 Road traffic accidents 11.0 2.5 9 Birth asphyxia and birth trauma 5.7 2.1
10 Cerebrovascular disease 9.6 2.2 10 Tuberculosis 5.6 2.1
COPD, chronic obstructive pulmonary disease.
a This category also includes other non-infectious causes arising in the perinatal period apart from prematurity, low birth weight, birth trauma and asphyxia. These non-infectious causes are responsible for about 20% of DALYs shown in this category.
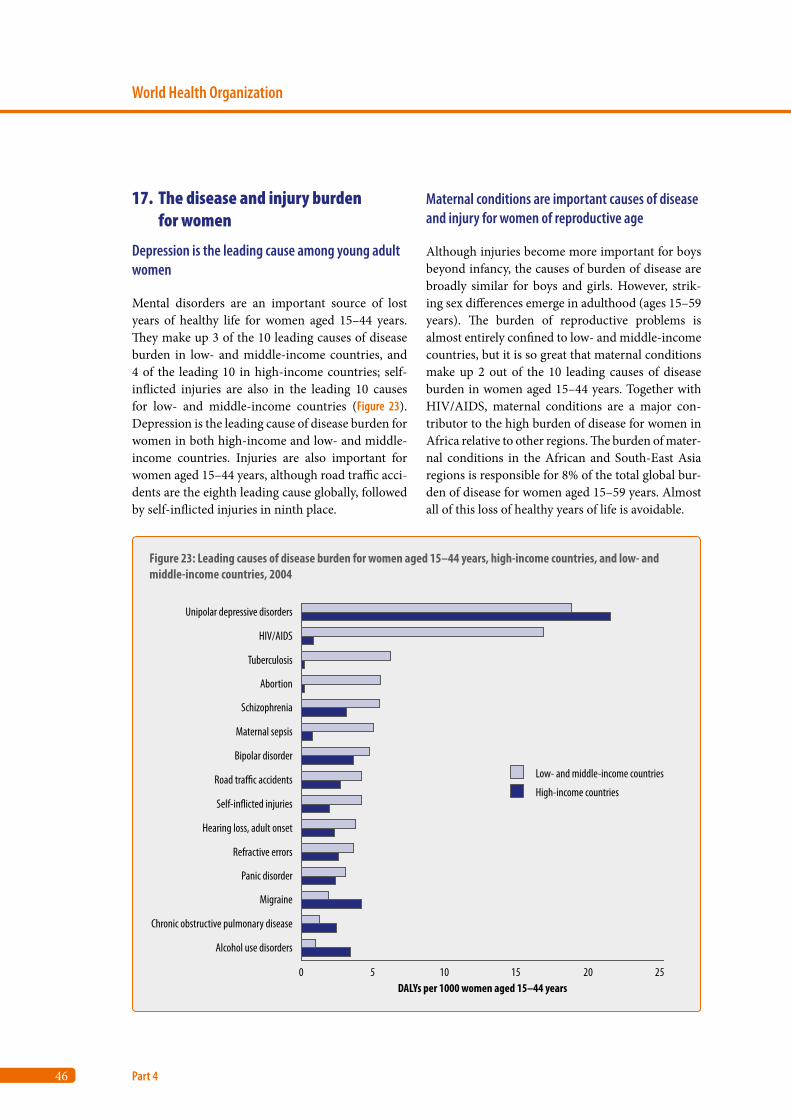
46
World Health Organization
Part 4
17. The disease and injury burden for women
Depression is the leading cause among young adult women
Mental disorders are an important source of lost years of healthy life for women aged 15–44 years. They make up 3 of the 10 leading causes of disease burden in low- and middle-income countries, and 4 of the leading 10 in high-income countries; self-inflicted injuries are also in the leading 10 causes for low- and middle-income countries (Figure 23). Depression is the leading cause of disease burden for women in both high-income and low- and middle-income countries. Injuries are also important for women aged 15–44 years, although road traffic acci-dents are the eighth leading cause globally, followed by self-inflicted injuries in ninth place.
Maternal conditions are important causes of disease and injury for women of reproductive age
Although injuries become more important for boys beyond infancy, the causes of burden of disease are broadly similar for boys and girls. However, strik-ing sex differences emerge in adulthood (ages 15–59 years). The burden of reproductive problems is almost entirely confined to low- and middle-income countries, but it is so great that maternal conditions make up 2 out of the 10 leading causes of disease burden in women aged 15–44 years. Together with HIV/AIDS, maternal conditions are a major con-tributor to the high burden of disease for women in Africa relative to other regions. The burden of mater-nal conditions in the African and South-East Asia regions is responsible for 8% of the total global bur-den of disease for women aged 15–59 years. Almost all of this loss of healthy years of life is avoidable.
Figure 23: Leading causes of disease burden for women aged 15–44 years, high-income countries, and low- and middle-income countries, 2004
0 5 10 15 20 25
Unipolar depressive disorders
HIV/AIDS
Tuberculosis
Abortion
Schizophrenia
Maternal sepsis
Bipolar disorder
Road tra�c accidents
Self-in�icted injuries
Hearing loss, adult onset
Refractive errors
Panic disorder
Migraine
Chronic obstructive pulmonary disease
Alcohol use disorders
DALYs per 1000 women aged 15–44 years
Low- and middle-income countries
High-income countries
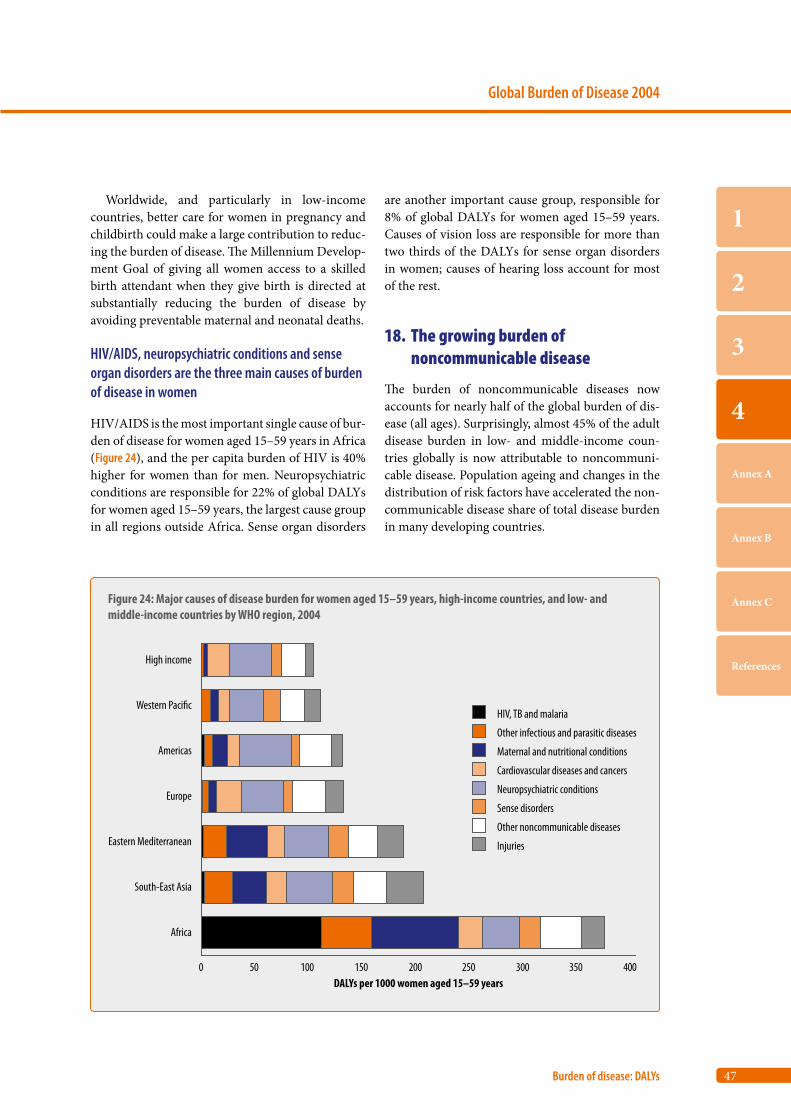
47
Global Burden of Disease 2004
Burden of disease: DALYs
1
2
3
4
Annex A
Annex B
Annex C
References
Figure 24: Major causes of disease burden for women aged 15–59 years, high-income countries, and low- and middle-income countries by WHO region, 2004
0 50 100 150 200 250 300 350 400
High income
Western Paci�c
Americas
Europe
Eastern Mediterranean
South-East Asia
Africa
DALYs per 1000 women aged 15–59 years
HIV, TB and malaria
Other infectious and parasitic diseases
Maternal and nutritional conditions
Cardiovascular diseases and cancers
Neuropsychiatric conditions
Sense disorders
Other noncommunicable diseases
Injuries
Worldwide, and particularly in low-income countries, better care for women in pregnancy and childbirth could make a large contribution to reduc-ing the burden of disease. The Millennium Develop-ment Goal of giving all women access to a skilled birth attendant when they give birth is directed at substantially reducing the burden of disease by avoiding preventable maternal and neonatal deaths.
HIV/AIDS, neuropsychiatric conditions and sense organ disorders are the three main causes of burden of disease in women
HIV/AIDS is the most important single cause of bur-den of disease for women aged 15–59 years in Africa (Figure 24), and the per capita burden of HIV is 40% higher for women than for men. Neuropsychiatric conditions are responsible for 22% of global DALYs for women aged 15–59 years, the largest cause group in all regions outside Africa. Sense organ disorders
are another important cause group, responsible for 8% of global DALYs for women aged 15–59 years. Causes of vision loss are responsible for more than two thirds of the DALYs for sense organ disorders in women; causes of hearing loss account for most of the rest.
18. The growing burden of noncommunicable disease
The burden of noncommunicable diseases now accounts for nearly half of the global burden of dis-ease (all ages). Surprisingly, almost 45% of the adult disease burden in low- and middle-income coun-tries globally is now attributable to noncommuni-cable disease. Population ageing and changes in the distribution of risk factors have accelerated the non-communicable disease share of total disease burden in many developing countries.
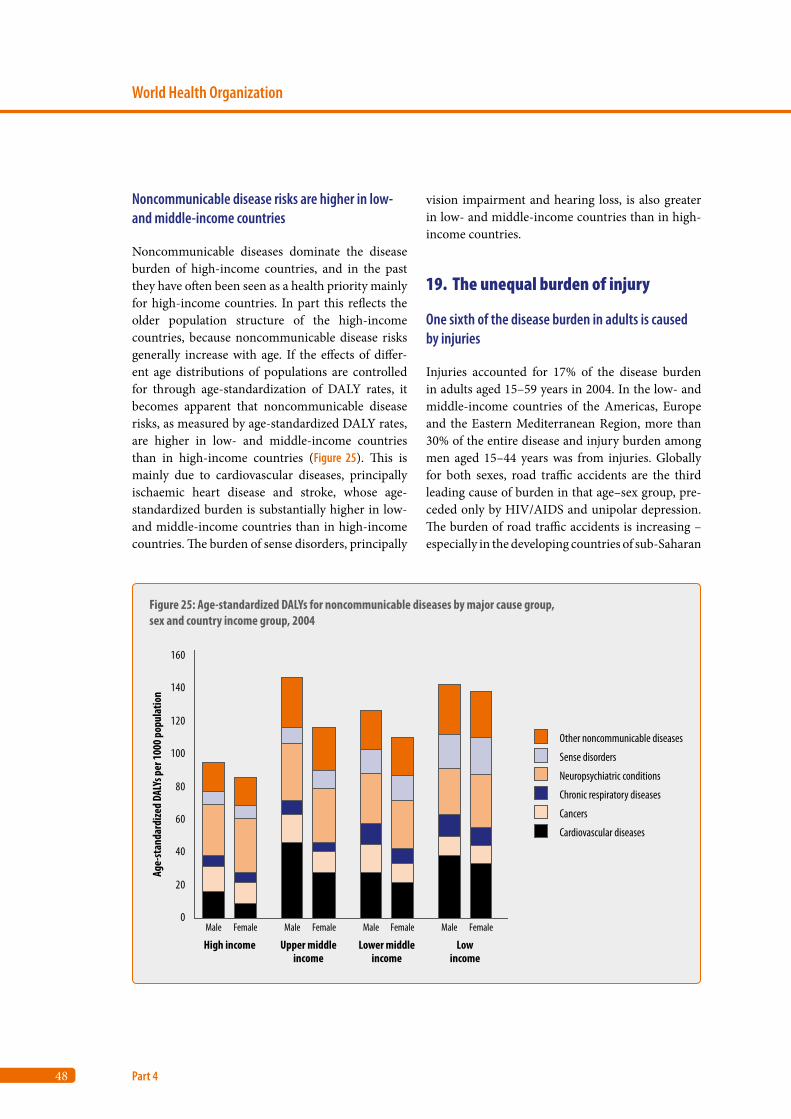
48
World Health Organization
Part 4
Noncommunicable disease risks are higher in low- and middle-income countries
Noncommunicable diseases dominate the disease burden of high-income countries, and in the past they have often been seen as a health priority mainly for high-income countries. In part this reflects the older population structure of the high-income countries, because noncommunicable disease risks generally increase with age. If the effects of differ-ent age distributions of populations are controlled for through age-standardization of DALY rates, it becomes apparent that noncommunicable disease risks, as measured by age-standardized DALY rates, are higher in low- and middle-income countries than in high-income countries (Figure 25). This is mainly due to cardiovascular diseases, principally ischaemic heart disease and stroke, whose age-standardized burden is substantially higher in low- and middle-income countries than in high-income countries. The burden of sense disorders, principally
vision impairment and hearing loss, is also greater in low- and middle-income countries than in high-income countries.
19. The unequal burden of injury
One sixth of the disease burden in adults is caused by injuries
Injuries accounted for 17% of the disease burden in adults aged 15–59 years in 2004. In the low- and middle-income countries of the Americas, Europe and the Eastern Mediterranean Region, more than 30% of the entire disease and injury burden among men aged 15–44 years was from injuries. Globally for both sexes, road traffic accidents are the third leading cause of burden in that age–sex group, pre-ceded only by HIV/AIDS and unipolar depression. The burden of road traffic accidents is increasing – especially in the developing countries of sub-Saharan
Figure 25: Age-standardized DALYs for noncommunicable diseases by major cause group, sex and country income group, 2004
0
20
40
60
80
100
120
140
160
Male Female Male Female Male Female Male Female
High income Upper middleincome
Lower middleincome
Lowincome
Age-
stan
dard
ized
DALY
s per
1000
pop
ulat
ion
Other noncommunicable diseases
Sense disorders
Neuropsychiatric conditions
Chronic respiratory diseases
Cancers
Cardiovascular diseases
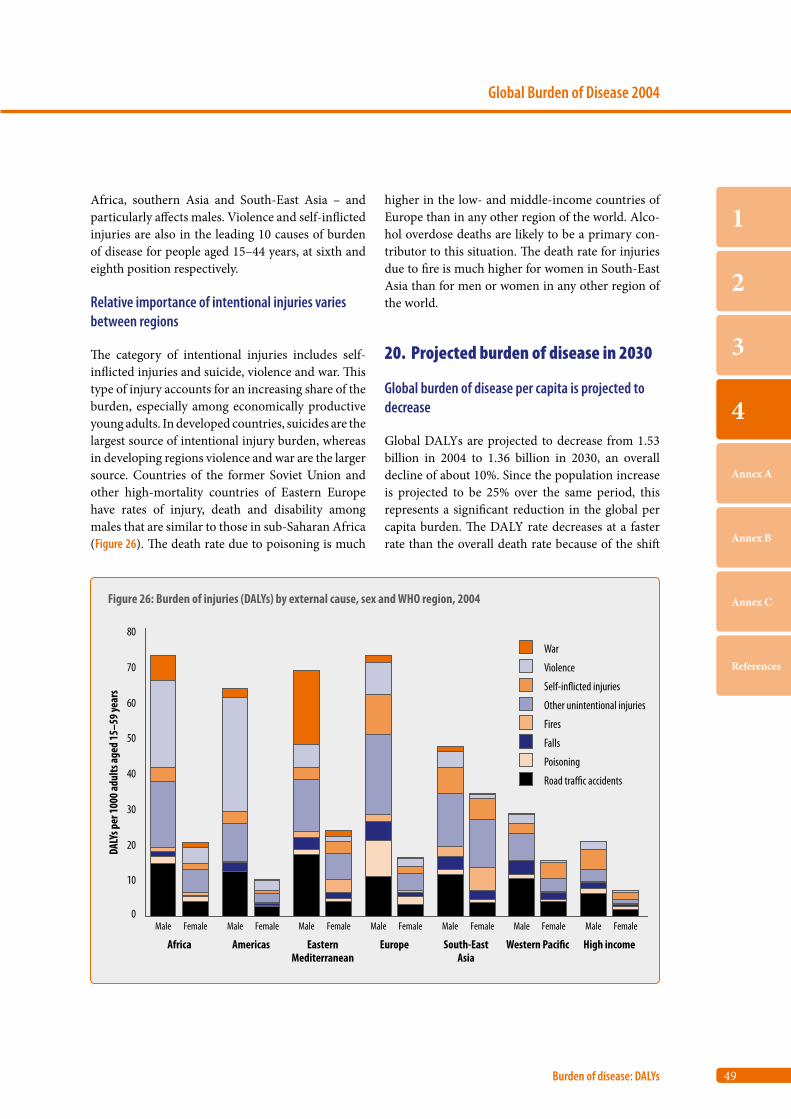
49
Global Burden of Disease 2004
Burden of disease: DALYs
1
2
3
4
Annex A
Annex B
Annex C
References
Africa, southern Asia and South-East Asia – and particularly affects males. Violence and self-inflicted injuries are also in the leading 10 causes of burden of disease for people aged 15–44 years, at sixth and eighth position respectively.
Relative importance of intentional injuries varies between regions
The category of intentional injuries includes self-inflicted injuries and suicide, violence and war. This type of injury accounts for an increasing share of the burden, especially among economically productive young adults. In developed countries, suicides are the largest source of intentional injury burden, whereas in developing regions violence and war are the larger source. Countries of the former Soviet Union and other high-mortality countries of Eastern Europe have rates of injury, death and disability among males that are similar to those in sub-Saharan Africa (Figure 26). The death rate due to poisoning is much
higher in the low- and middle-income countries of Europe than in any other region of the world. Alco-hol overdose deaths are likely to be a primary con-tributor to this situation. The death rate for injuries due to fire is much higher for women in South-East Asia than for men or women in any other region of the world.
20. Projected burden of disease in 2030
Global burden of disease per capita is projected to decrease
Global DALYs are projected to decrease from 1.53 billion in 2004 to 1.36 billion in 2030, an overall decline of about 10%. Since the population increase is projected to be 25% over the same period, this represents a significant reduction in the global per capita burden. The DALY rate decreases at a faster rate than the overall death rate because of the shift
Figure 26: Burden of injuries (DALYs) by external cause, sex and WHO region, 2004
0
10
20
30
40
50
60
70
80
Male Female Male Female Male Female Male Female Male Female Male Female Male Female
Africa Americas EasternMediterranean
Europe South-EastAsia
Western Paci�c High income
DALY
s per
1000
adul
ts ag
ed 15
–59 y
ears
Road tra�c accidents
Poisoning
Falls
Fires
Other unintentional injuries
Self-in�icted injuries
Violence
War
50
World Health Organization
Part 4
in age at death to older ages, associated with fewer YLL. Even assuming that the age-specific burden for most non-fatal causes remains constant into the future, and hence that the overall burden for these conditions increases with the ageing of the popula-tion, there is still an overall projected decrease in the global burden of disease per capita of 30% from 2004 to 2030. This decrease is largely driven by pro-jected levels of economic growth in the projection model. If economic growth is slower than in recent World Bank projections, or risk factor trends in low- and middle-income regions are adverse, then the global burden of disease will fall more slowly than projected.
Halving the contribution of Group I causes
The proportional contribution of the three major cause groups to the total disease burden is projected to change substantially. Group I causes are projected to account for 20% of total DALYs lost in 2030, com-pared with just under 40% in 2004. The noncom-municable disease (Group II) burden is projected to increase to 66% in 2030, and to represent a greater burden of disease than Group I conditions in all income groups, including low-income countries.
Figure 27 shows the changes in the leading causes of DALYs globally from 2004 to 2030. The three lead-ing causes of DALYs in 2030 are projected to be uni-polar depressive disorders, ischaemic heart disease and road traffic accidents. Lower respiratory infec-tions drop from leading cause in 2004 to sixth lead-ing cause, and HIV/AIDS drops from fifth leading
cause in 2004 to ninth leading cause in 2030. Lower respiratory infections, perinatal conditions
and diarrhoeal diseases are all projected to decline substantially in importance. On the other hand, diabetes mellitus, road traffic accidents, chronic obstructive pulmonary disease, hearing loss and refractive errors are all projected to move up three or more places in the rankings. Ischaemic heart dis-ease, cerebrovascular disease and unipolar depres-sive disorders move up two places in the rankings to become three of the four leading causes of disease and injury burden in 2030. These projections represent a vision of an improving future for population health under:
• an explicit set of assumptions• specific projections of income and human capital• specific projections of future trends in tobacco
smoking, HIV/AIDS transmission and survival, and overweight and obesity.
Under these projections, people in all regions of the world will live longer and with lower levels of dis-ability, particularly from infectious, maternal, peri-natal and nutritional conditions. But if there is no sustained and additional effort to address Millen-nium Development Goals, neglected tropical dis-eases, tobacco smoking and other chronic disease risks, or if economic growth in low-income coun-tries is lower than the forecasts used here, then the world may achieve slower progress and experience widening of health inequalities.
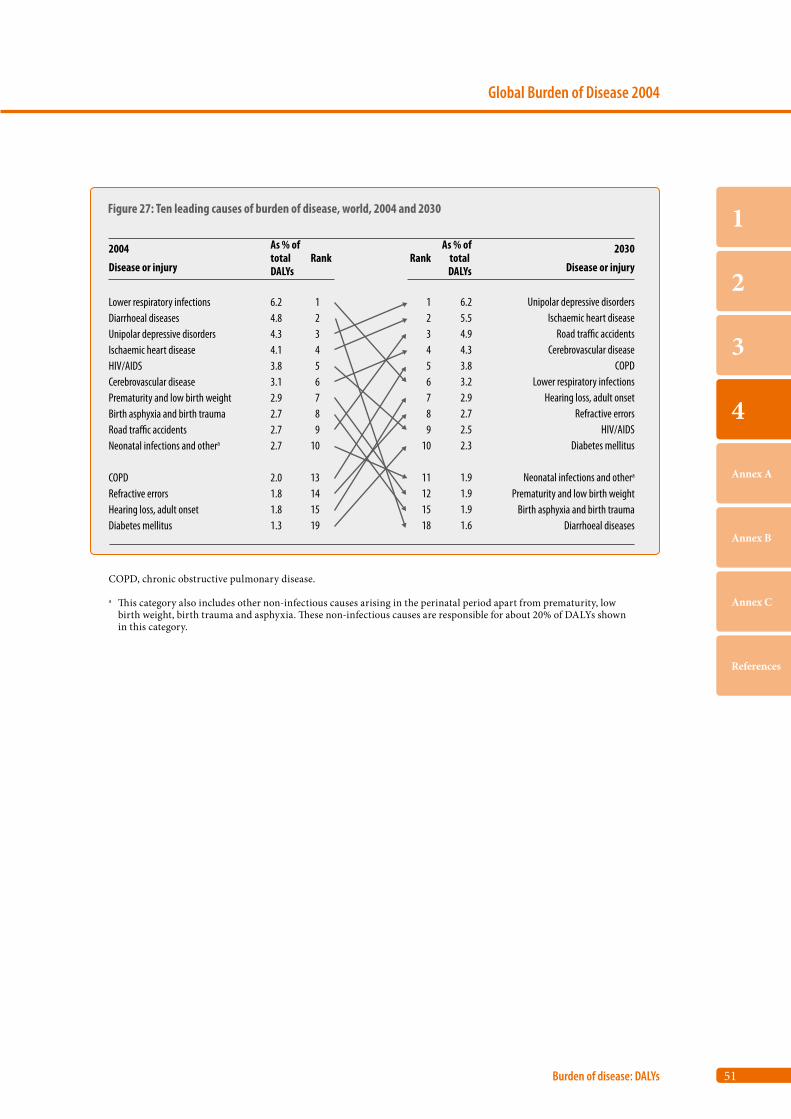
51
Global Burden of Disease 2004
Burden of disease: DALYs
1
2
3
4
Annex A
Annex B
Annex C
References
COPD, chronic obstructive pulmonary disease.
a This category also includes other non-infectious causes arising in the perinatal period apart from prematurity, low birth weight, birth trauma and asphyxia. These non-infectious causes are responsible for about 20% of DALYs shown in this category.
Figure 27: Ten leading causes of burden of disease, world, 2004 and 2030
Lower respiratory infectionsDiarrhoeal diseasesUnipolar depressive disordersIschaemic heart diseaseHIV/AIDSCerebrovascular diseasePrematurity and low birth weightBirth asphyxia and birth traumaRoad tra�c accidentsNeonatal infections and othera
COPDRefractive errorsHearing loss, adult onsetDiabetes mellitus
6.24.84.34.13.83.12.92.72.72.7
2.01.81.81.3
123456789
10
13141519
2004
Disease or injury
As % oftotal DALYs
As % oftotal DALYs
Rank Rank2030
Disease or injury
123456789
10
11121518
6.25.54.94.33.83.22.92.72.52.3
1.91.91.91.6
Unipolar depressive disordersIschaemic heart disease
Road tra�c accidentsCerebrovascular disease
COPDLower respiratory infections
Hearing loss, adult onsetRefractive errors
HIV/AIDSDiabetes mellitus
Neonatal infections and othera
Prematurity and low birth weightBirth asphyxia and birth trauma
Diarrhoeal diseases

Annex A
Deaths and DALYs 2004: Annex tables
Table A1: Deaths by cause, sex and income group in WHO regions,
estimates for 2004 54
Table A2: Burden of disease in DALYs by cause, sex and income group
in WHO regions, estimates for 2004 60
Table A3: Deaths by cause and broad age group, countries grouped
by income per capita, 2004 66
Table A4: Burden of disease in DALYs by cause and broad age group,
countries grouped by income per capita, 2004 69
Table A5: Deaths by cause, sex and age group, countries grouped by
income per capita, 2004 72
Table A6: Burden of disease in DALYs by cause, sex and age group,
countries grouped by income per capita, 2004 84

54
World Health Organization
Annex A
Causeb Sexc AfricaSouth
East Asia The Americas
Both sexes Males Females
Low and middle income
Low and middle income Total
High income
Low and middle income
Population (millions) 6 437 3 244 3 193 738 1 672 874 329 545(000) % total (000) % total (000) % total (000) (000) (000) (000) (000)
Total deaths 58 772 100 31 082 100 27 690 100 11 248 15 279 6 158 2 695 3 464Communicable, maternal, perinatal and nutritional conditions
17 971 30.6 9 284 29.9 8 687 31.4 7 682 5 636 835 165 669
Infectious and parasitic diseases 9 519 16.2 5 198 16.7 4 321 15.6 4 849 2 674 350 72 278
Tuberculosis 1 464 2.5 969 3.1 494 1.8 405 519 46 1 45 STDs excluding HIV 128 0.2 71 0.2 57 0.2 44 58 2 0 2 Syphilis 99 0.2 60 0.2 39 0.1 36 42 1 0 1 Chlamydia 9 0.0 0 0.0 9 0.0 0 8 0 0 0 Gonorrhoea 1 0.0 0 0.0 0 0.0 0 0 0 0 0 HIV/AIDS 2 040 3.5 1 027 3.3 1 013 3.7 1 651 206 74 14 60 Diarrhoeal diseases 2 163 3.7 1 127 3.6 1 037 3.7 1 005 684 70 5 64 Childhood-cluster diseases 847 1.4 458 1.5 390 1.4 356 363 6 0 6 Pertussis 254 0.4 129 0.4 125 0.5 102 116 4 0 4 Poliomyelitisd 1 0.0 1 0.0 1 0.0 0 0 0 0 0 Diphtheria 5 0.0 3 0.0 3 0.0 2 2 0 0 0 Measles 424 0.7 220 0.7 204 0.7 182 191 0 0 0 Tetanus 163 0.3 105 0.3 58 0.2 69 54 1 0 1 Meningitis 340 0.6 181 0.6 159 0.6 156 103 13 1 12 Hepatitis Be 105 0.2 74 0.2 31 0.1 12 37 5 1 4 Hepatitis Ce 54 0.1 36 0.1 18 0.1 5 14 8 5 3 Malaria 889 1.5 456 1.5 433 1.6 806 36 2 0 2 Tropical-cluster diseases 152 0.3 94 0.3 58 0.2 95 32 13 0 13 Trypanosomiasis 52 0.1 33 0.1 19 0.1 50 0 0 0 0 Chagas disease 11 0.0 7 0.0 5 0.0 0 0 11 0 11 Schistosomiasis 41 0.1 26 0.1 15 0.1 36 0 1 0 1 Leishmaniasis 47 0.1 29 0.1 18 0.1 9 32 0 0 0 Lymphatic filariasis 0 0.0 0 0.0 0 0.0 0 0 0 0 0 Onchocerciasis 0 0.0 0 0.0 0 0.0 0 0 0 0 0 Leprosy 5 0.0 4 0.0 1 0.0 1 3 0 0 0 Dengue 18 0.0 9 0.0 9 0.0 0 11 2 0 2 Japanese encephalitis 11 0.0 5 0.0 6 0.0 0 8 0 0 0 Trachoma 0 0.0 0 0.0 0 0.0 0 0 0 0 0 Intestinal nematode infections 6 0.0 4 0.0 3 0.0 0 3 1 0 1 Ascariasis 2 0.0 1 0.0 1 0.0 0 1 0 0 0 Trichuriasis 2 0.0 1 0.0 1 0.0 0 1 0 0 0 Hookworm disease 0 0.0 0 0.0 0 0.0 0 0 0 0 0Respiratory infections 4 259 7.2 2 207 7.1 2 052 7.4 1 437 1 416 261 68 193 Lower respiratory infections 4 177 7.1 2 163 7.0 2 014 7.3 1 417 1 395 258 68 190 Upper respiratory infections 77 0.1 41 0.1 36 0.1 17 20 2 0 2 Otitis media 5 0.0 3 0.0 2 0.0 3 1 0 0 0Maternal conditions 527 0.9 0 0.0 527 1.9 259 169 16 1 16 Maternal haemorrhage 140 0.2 0 0.0 140 0.5 62 52 3 0 3 Maternal sepsis 62 0.1 0 0.0 62 0.2 30 23 1 0 1 Hypertensive disorders of pregnancy 62 0.1 0 0.0 62 0.2 22 24 4 0 4 Obstructed labour 34 0.1 0 0.0 34 0.1 13 17 0 0 0 Abortion 68 0.1 0 0.0 68 0.2 36 21 2 0 2Perinatal conditionsf 3 180 5.4 1 657 5.3 1 523 5.5 977 1 198 150 17 133 Prematurity and low birth weight 1 179 2.0 612 2.0 567 2.0 309 478 68 8 60 Birth asphyxia and birth trauma 857 1.5 446 1.4 411 1.5 285 312 28 3 26 Neonatal infections and other conditionsg 1 144 1.9 599 1.9 546 2.0 382 408 54 7 47
Table A1: Deaths by cause, sex and income group in WHO regions,a estimates for 2004
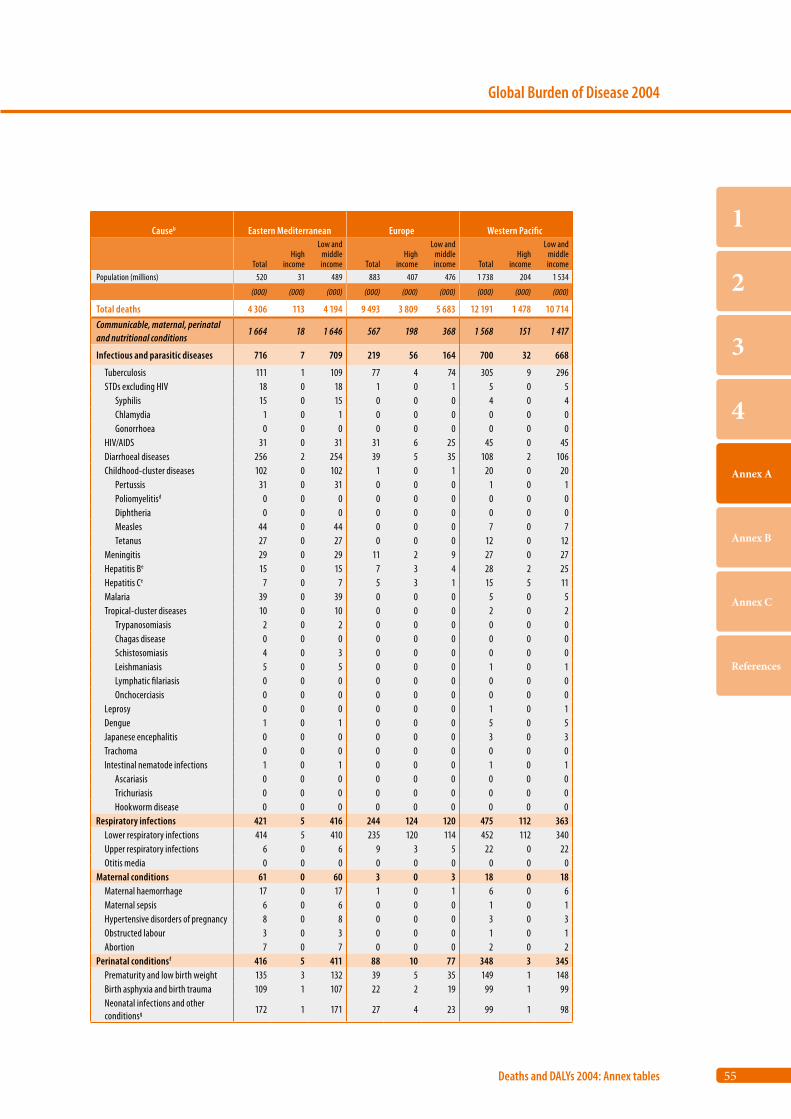
55
Global Burden of Disease 2004
Deaths and DALYs 2004: Annex tables
1
2
3
4
Annex A
Annex B
Annex C
References
Causeb Eastern Mediterranean Europe Western Pacific
TotalHigh
income
Low and middle income Total
High income
Low and middle income Total
High income
Low and middle income
Population (millions) 520 31 489 883 407 476 1 738 204 1 534
(000) (000) (000) (000) (000) (000) (000) (000) (000)
Total deaths 4 306 113 4 194 9 493 3 809 5 683 12 191 1 478 10 714Communicable, maternal, perinatal and nutritional conditions
1 664 18 1 646 567 198 368 1 568 151 1 417
Infectious and parasitic diseases 716 7 709 219 56 164 700 32 668
Tuberculosis 111 1 109 77 4 74 305 9 296 STDs excluding HIV 18 0 18 1 0 1 5 0 5 Syphilis 15 0 15 0 0 0 4 0 4 Chlamydia 1 0 1 0 0 0 0 0 0 Gonorrhoea 0 0 0 0 0 0 0 0 0 HIV/AIDS 31 0 31 31 6 25 45 0 45 Diarrhoeal diseases 256 2 254 39 5 35 108 2 106 Childhood-cluster diseases 102 0 102 1 0 1 20 0 20 Pertussis 31 0 31 0 0 0 1 0 1 Poliomyelitisd 0 0 0 0 0 0 0 0 0 Diphtheria 0 0 0 0 0 0 0 0 0 Measles 44 0 44 0 0 0 7 0 7 Tetanus 27 0 27 0 0 0 12 0 12 Meningitis 29 0 29 11 2 9 27 0 27 Hepatitis Be 15 0 15 7 3 4 28 2 25 Hepatitis Ce 7 0 7 5 3 1 15 5 11 Malaria 39 0 39 0 0 0 5 0 5 Tropical-cluster diseases 10 0 10 0 0 0 2 0 2 Trypanosomiasis 2 0 2 0 0 0 0 0 0 Chagas disease 0 0 0 0 0 0 0 0 0 Schistosomiasis 4 0 3 0 0 0 0 0 0 Leishmaniasis 5 0 5 0 0 0 1 0 1 Lymphatic filariasis 0 0 0 0 0 0 0 0 0 Onchocerciasis 0 0 0 0 0 0 0 0 0 Leprosy 0 0 0 0 0 0 1 0 1 Dengue 1 0 1 0 0 0 5 0 5 Japanese encephalitis 0 0 0 0 0 0 3 0 3 Trachoma 0 0 0 0 0 0 0 0 0 Intestinal nematode infections 1 0 1 0 0 0 1 0 1 Ascariasis 0 0 0 0 0 0 0 0 0 Trichuriasis 0 0 0 0 0 0 0 0 0 Hookworm disease 0 0 0 0 0 0 0 0 0Respiratory infections 421 5 416 244 124 120 475 112 363 Lower respiratory infections 414 5 410 235 120 114 452 112 340 Upper respiratory infections 6 0 6 9 3 5 22 0 22 Otitis media 0 0 0 0 0 0 0 0 0Maternal conditions 61 0 60 3 0 3 18 0 18 Maternal haemorrhage 17 0 17 1 0 1 6 0 6 Maternal sepsis 6 0 6 0 0 0 1 0 1 Hypertensive disorders of pregnancy 8 0 8 0 0 0 3 0 3 Obstructed labour 3 0 3 0 0 0 1 0 1 Abortion 7 0 7 0 0 0 2 0 2Perinatal conditionsf 416 5 411 88 10 77 348 3 345 Prematurity and low birth weight 135 3 132 39 5 35 149 1 148 Birth asphyxia and birth trauma 109 1 107 22 2 19 99 1 99 Neonatal infections and other conditionsg 172 1 171 27 4 23 99 1 98
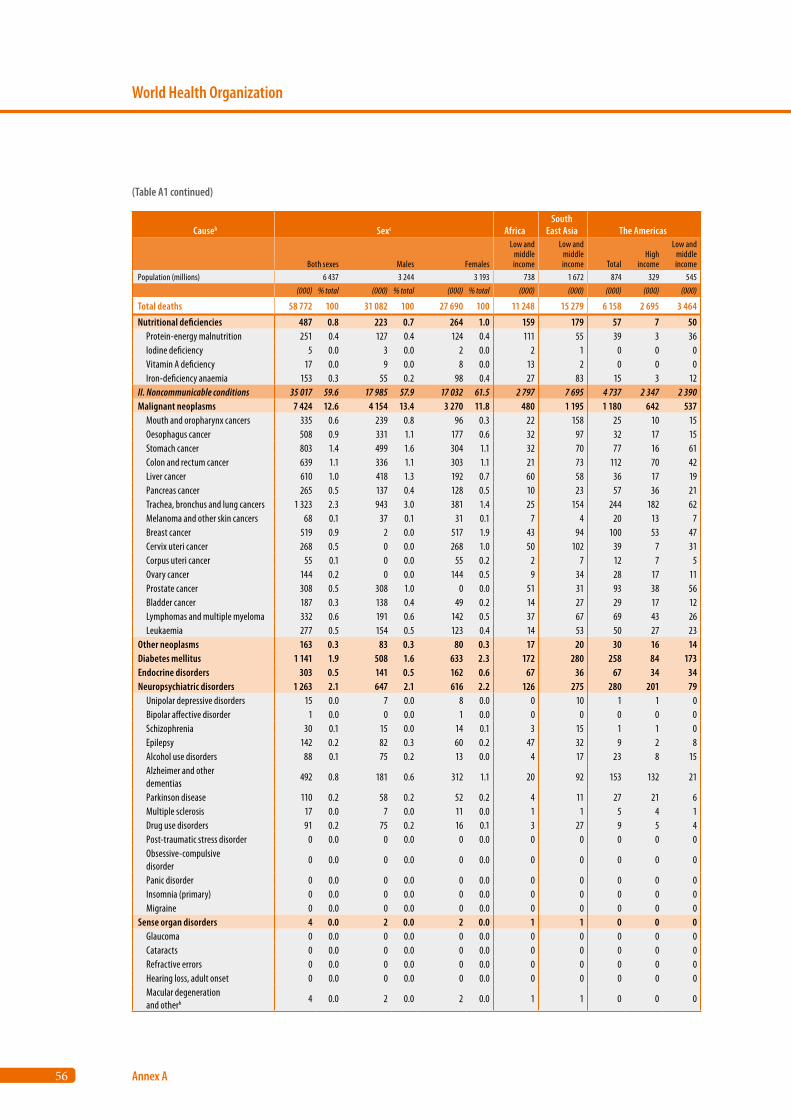
56
World Health Organization
Annex A
Causeb Sexc AfricaSouth
East Asia The Americas
Both sexes Males Females
Low and middle income
Low and middle income Total
High income
Low and middle income
Population (millions) 6 437 3 244 3 193 738 1 672 874 329 545(000) % total (000) % total (000) % total (000) (000) (000) (000) (000)
Total deaths 58 772 100 31 082 100 27 690 100 11 248 15 279 6 158 2 695 3 464
Nutritional deficiencies 487 0.8 223 0.7 264 1.0 159 179 57 7 50 Protein-energy malnutrition 251 0.4 127 0.4 124 0.4 111 55 39 3 36 Iodine deficiency 5 0.0 3 0.0 2 0.0 2 1 0 0 0 Vitamin A deficiency 17 0.0 9 0.0 8 0.0 13 2 0 0 0 Iron-deficiency anaemia 153 0.3 55 0.2 98 0.4 27 83 15 3 12II. Noncommunicable conditions 35 017 59.6 17 985 57.9 17 032 61.5 2 797 7 695 4 737 2 347 2 390Malignant neoplasms 7 424 12.6 4 154 13.4 3 270 11.8 480 1 195 1 180 642 537 Mouth and oropharynx cancers 335 0.6 239 0.8 96 0.3 22 158 25 10 15 Oesophagus cancer 508 0.9 331 1.1 177 0.6 32 97 32 17 15 Stomach cancer 803 1.4 499 1.6 304 1.1 32 70 77 16 61 Colon and rectum cancer 639 1.1 336 1.1 303 1.1 21 73 112 70 42 Liver cancer 610 1.0 418 1.3 192 0.7 60 58 36 17 19 Pancreas cancer 265 0.5 137 0.4 128 0.5 10 23 57 36 21 Trachea, bronchus and lung cancers 1 323 2.3 943 3.0 381 1.4 25 154 244 182 62 Melanoma and other skin cancers 68 0.1 37 0.1 31 0.1 7 4 20 13 7 Breast cancer 519 0.9 2 0.0 517 1.9 43 94 100 53 47 Cervix uteri cancer 268 0.5 0 0.0 268 1.0 50 102 39 7 31 Corpus uteri cancer 55 0.1 0 0.0 55 0.2 2 7 12 7 5 Ovary cancer 144 0.2 0 0.0 144 0.5 9 34 28 17 11 Prostate cancer 308 0.5 308 1.0 0 0.0 51 31 93 38 56 Bladder cancer 187 0.3 138 0.4 49 0.2 14 27 29 17 12 Lymphomas and multiple myeloma 332 0.6 191 0.6 142 0.5 37 67 69 43 26 Leukaemia 277 0.5 154 0.5 123 0.4 14 53 50 27 23Other neoplasms 163 0.3 83 0.3 80 0.3 17 20 30 16 14Diabetes mellitus 1 141 1.9 508 1.6 633 2.3 172 280 258 84 173Endocrine disorders 303 0.5 141 0.5 162 0.6 67 36 67 34 34Neuropsychiatric disorders 1 263 2.1 647 2.1 616 2.2 126 275 280 201 79 Unipolar depressive disorders 15 0.0 7 0.0 8 0.0 0 10 1 1 0 Bipolar affective disorder 1 0.0 0 0.0 1 0.0 0 0 0 0 0 Schizophrenia 30 0.1 15 0.0 14 0.1 3 15 1 1 0 Epilepsy 142 0.2 82 0.3 60 0.2 47 32 9 2 8 Alcohol use disorders 88 0.1 75 0.2 13 0.0 4 17 23 8 15 Alzheimer and other dementias
492 0.8 181 0.6 312 1.1 20 92 153 132 21
Parkinson disease 110 0.2 58 0.2 52 0.2 4 11 27 21 6 Multiple sclerosis 17 0.0 7 0.0 11 0.0 1 1 5 4 1 Drug use disorders 91 0.2 75 0.2 16 0.1 3 27 9 5 4 Post-traumatic stress disorder 0 0.0 0 0.0 0 0.0 0 0 0 0 0 Obsessive-compulsive disorder
0 0.0 0 0.0 0 0.0 0 0 0 0 0
Panic disorder 0 0.0 0 0.0 0 0.0 0 0 0 0 0 Insomnia (primary) 0 0.0 0 0.0 0 0.0 0 0 0 0 0 Migraine 0 0.0 0 0.0 0 0.0 0 0 0 0 0Sense organ disorders 4 0.0 2 0.0 2 0.0 1 1 0 0 0 Glaucoma 0 0.0 0 0.0 0 0.0 0 0 0 0 0 Cataracts 0 0.0 0 0.0 0 0.0 0 0 0 0 0 Refractive errors 0 0.0 0 0.0 0 0.0 0 0 0 0 0 Hearing loss, adult onset 0 0.0 0 0.0 0 0.0 0 0 0 0 0 Macular degeneration and otherh 4 0.0 2 0.0 2 0.0 1 1 0 0 0
(Table A1 continued)
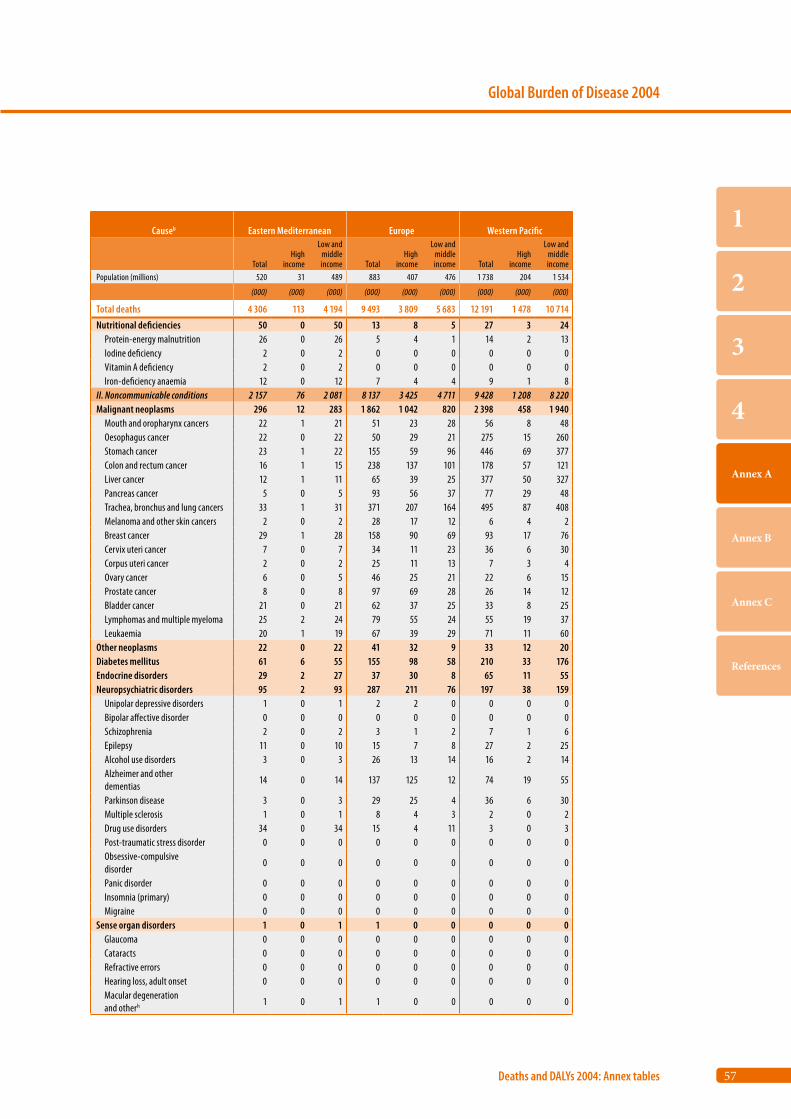
57
Global Burden of Disease 2004
Deaths and DALYs 2004: Annex tables
1
2
3
4
Annex A
Annex B
Annex C
References
Causeb Eastern Mediterranean Europe Western Pacific
TotalHigh
income
Low and middle income Total
High income
Low and middle income Total
High income
Low and middle income
Population (millions) 520 31 489 883 407 476 1 738 204 1 534
(000) (000) (000) (000) (000) (000) (000) (000) (000)
Total deaths 4 306 113 4 194 9 493 3 809 5 683 12 191 1 478 10 714
Nutritional deficiencies 50 0 50 13 8 5 27 3 24 Protein-energy malnutrition 26 0 26 5 4 1 14 2 13 Iodine deficiency 2 0 2 0 0 0 0 0 0 Vitamin A deficiency 2 0 2 0 0 0 0 0 0 Iron-deficiency anaemia 12 0 12 7 4 4 9 1 8II. Noncommunicable conditions 2 157 76 2 081 8 137 3 425 4 711 9 428 1 208 8 220Malignant neoplasms 296 12 283 1 862 1 042 820 2 398 458 1 940 Mouth and oropharynx cancers 22 1 21 51 23 28 56 8 48 Oesophagus cancer 22 0 22 50 29 21 275 15 260 Stomach cancer 23 1 22 155 59 96 446 69 377 Colon and rectum cancer 16 1 15 238 137 101 178 57 121 Liver cancer 12 1 11 65 39 25 377 50 327 Pancreas cancer 5 0 5 93 56 37 77 29 48 Trachea, bronchus and lung cancers 33 1 31 371 207 164 495 87 408 Melanoma and other skin cancers 2 0 2 28 17 12 6 4 2 Breast cancer 29 1 28 158 90 69 93 17 76 Cervix uteri cancer 7 0 7 34 11 23 36 6 30 Corpus uteri cancer 2 0 2 25 11 13 7 3 4 Ovary cancer 6 0 5 46 25 21 22 6 15 Prostate cancer 8 0 8 97 69 28 26 14 12 Bladder cancer 21 0 21 62 37 25 33 8 25 Lymphomas and multiple myeloma 25 2 24 79 55 24 55 19 37 Leukaemia 20 1 19 67 39 29 71 11 60Other neoplasms 22 0 22 41 32 9 33 12 20Diabetes mellitus 61 6 55 155 98 58 210 33 176Endocrine disorders 29 2 27 37 30 8 65 11 55Neuropsychiatric disorders 95 2 93 287 211 76 197 38 159 Unipolar depressive disorders 1 0 1 2 2 0 0 0 0 Bipolar affective disorder 0 0 0 0 0 0 0 0 0 Schizophrenia 2 0 2 3 1 2 7 1 6 Epilepsy 11 0 10 15 7 8 27 2 25 Alcohol use disorders 3 0 3 26 13 14 16 2 14 Alzheimer and other dementias
14 0 14 137 125 12 74 19 55
Parkinson disease 3 0 3 29 25 4 36 6 30 Multiple sclerosis 1 0 1 8 4 3 2 0 2 Drug use disorders 34 0 34 15 4 11 3 0 3 Post-traumatic stress disorder 0 0 0 0 0 0 0 0 0 Obsessive-compulsive disorder
0 0 0 0 0 0 0 0 0
Panic disorder 0 0 0 0 0 0 0 0 0 Insomnia (primary) 0 0 0 0 0 0 0 0 0 Migraine 0 0 0 0 0 0 0 0 0Sense organ disorders 1 0 1 1 0 0 0 0 0 Glaucoma 0 0 0 0 0 0 0 0 0 Cataracts 0 0 0 0 0 0 0 0 0 Refractive errors 0 0 0 0 0 0 0 0 0 Hearing loss, adult onset 0 0 0 0 0 0 0 0 0 Macular degeneration and otherh 1 0 1 1 0 0 0 0 0
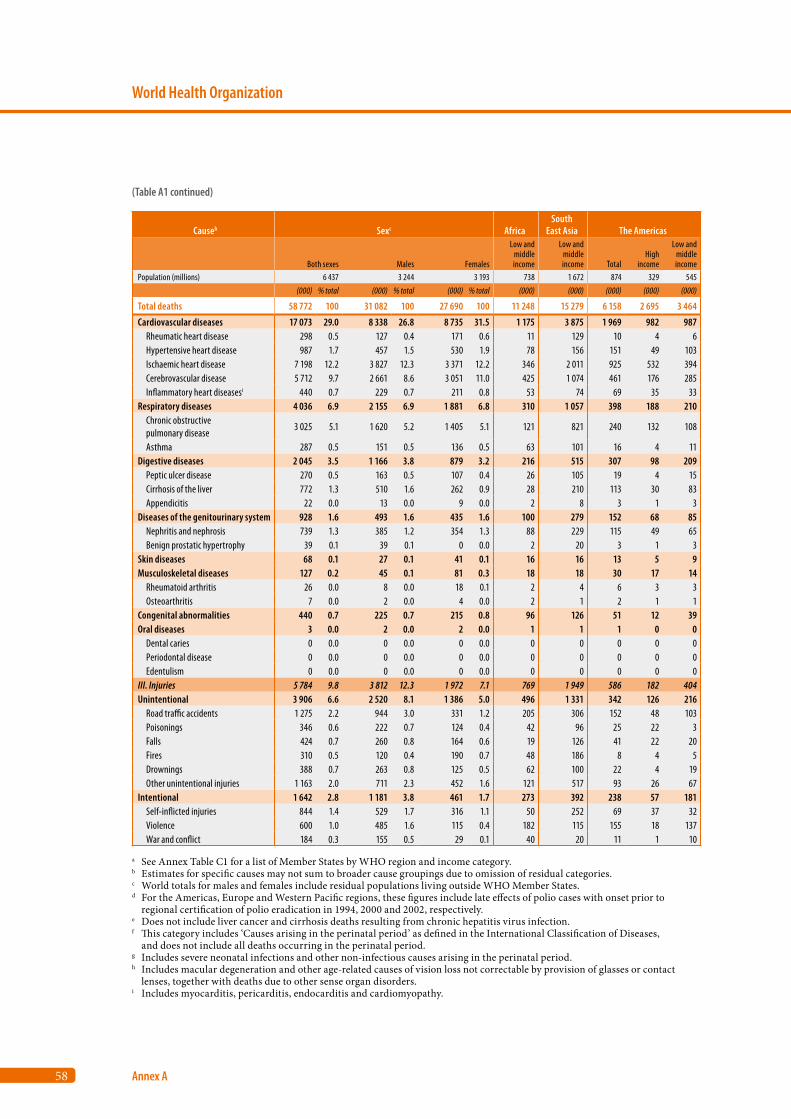
58
World Health Organization
Annex A
Causeb Sexc AfricaSouth
East Asia The Americas
Both sexes Males Females
Low and middle income
Low and middle income Total
High income
Low and middle income
Population (millions) 6 437 3 244 3 193 738 1 672 874 329 545(000) % total (000) % total (000) % total (000) (000) (000) (000) (000)
Total deaths 58 772 100 31 082 100 27 690 100 11 248 15 279 6 158 2 695 3 464
Cardiovascular diseases 17 073 29.0 8 338 26.8 8 735 31.5 1 175 3 875 1 969 982 987 Rheumatic heart disease 298 0.5 127 0.4 171 0.6 11 129 10 4 6 Hypertensive heart disease 987 1.7 457 1.5 530 1.9 78 156 151 49 103 Ischaemic heart disease 7 198 12.2 3 827 12.3 3 371 12.2 346 2 011 925 532 394 Cerebrovascular disease 5 712 9.7 2 661 8.6 3 051 11.0 425 1 074 461 176 285 Inflammatory heart diseasesi 440 0.7 229 0.7 211 0.8 53 74 69 35 33Respiratory diseases 4 036 6.9 2 155 6.9 1 881 6.8 310 1 057 398 188 210 Chronic obstructive pulmonary disease
3 025 5.1 1 620 5.2 1 405 5.1 121 821 240 132 108
Asthma 287 0.5 151 0.5 136 0.5 63 101 16 4 11Digestive diseases 2 045 3.5 1 166 3.8 879 3.2 216 515 307 98 209 Peptic ulcer disease 270 0.5 163 0.5 107 0.4 26 105 19 4 15 Cirrhosis of the liver 772 1.3 510 1.6 262 0.9 28 210 113 30 83 Appendicitis 22 0.0 13 0.0 9 0.0 2 8 3 1 3Diseases of the genitourinary system 928 1.6 493 1.6 435 1.6 100 279 152 68 85 Nephritis and nephrosis 739 1.3 385 1.2 354 1.3 88 229 115 49 65 Benign prostatic hypertrophy 39 0.1 39 0.1 0 0.0 2 20 3 1 3Skin diseases 68 0.1 27 0.1 41 0.1 16 16 13 5 9Musculoskeletal diseases 127 0.2 45 0.1 81 0.3 18 18 30 17 14 Rheumatoid arthritis 26 0.0 8 0.0 18 0.1 2 4 6 3 3 Osteoarthritis 7 0.0 2 0.0 4 0.0 2 1 2 1 1Congenital abnormalities 440 0.7 225 0.7 215 0.8 96 126 51 12 39Oral diseases 3 0.0 2 0.0 2 0.0 1 1 1 0 0 Dental caries 0 0.0 0 0.0 0 0.0 0 0 0 0 0 Periodontal disease 0 0.0 0 0.0 0 0.0 0 0 0 0 0 Edentulism 0 0.0 0 0.0 0 0.0 0 0 0 0 0III. Injuries 5 784 9.8 3 812 12.3 1 972 7.1 769 1 949 586 182 404Unintentional 3 906 6.6 2 520 8.1 1 386 5.0 496 1 331 342 126 216 Road traffic accidents 1 275 2.2 944 3.0 331 1.2 205 306 152 48 103 Poisonings 346 0.6 222 0.7 124 0.4 42 96 25 22 3 Falls 424 0.7 260 0.8 164 0.6 19 126 41 22 20 Fires 310 0.5 120 0.4 190 0.7 48 186 8 4 5 Drownings 388 0.7 263 0.8 125 0.5 62 100 22 4 19 Other unintentional injuries 1 163 2.0 711 2.3 452 1.6 121 517 93 26 67Intentional 1 642 2.8 1 181 3.8 461 1.7 273 392 238 57 181 Self-inflicted injuries 844 1.4 529 1.7 316 1.1 50 252 69 37 32 Violence 600 1.0 485 1.6 115 0.4 182 115 155 18 137 War and conflict 184 0.3 155 0.5 29 0.1 40 20 11 1 10
a See Annex Table C1 for a list of Member States by WHO region and income category.b Estimates for specific causes may not sum to broader cause groupings due to omission of residual categories.c World totals for males and females include residual populations living outside WHO Member States.d For the Americas, Europe and Western Pacific regions, these figures include late effects of polio cases with onset prior to
regional certification of polio eradication in 1994, 2000 and 2002, respectively. e Does not include liver cancer and cirrhosis deaths resulting from chronic hepatitis virus infection.f This category includes ‘Causes arising in the perinatal period’ as defined in the International Classification of Diseases,
and does not include all deaths occurring in the perinatal period.g Includes severe neonatal infections and other non-infectious causes arising in the perinatal period.h Includes macular degeneration and other age-related causes of vision loss not correctable by provision of glasses or contact
lenses, together with deaths due to other sense organ disorders.i Includes myocarditis, pericarditis, endocarditis and cardiomyopathy.
(Table A1 continued)

59
Global Burden of Disease 2004
Deaths and DALYs 2004: Annex tables
1
2
3
4
Annex A
Annex B
Annex C
References
Causeb Eastern Mediterranean Europe Western Pacific
TotalHigh
income
Low and middle income Total
High income
Low and middle income Total
High income
Low and middle income
Population (millions) 520 31 489 883 407 476 1 738 204 1 534
(000) (000) (000) (000) (000) (000) (000) (000) (000)
Total deaths 4 306 113 4 194 9 493 3 809 5 683 12 191 1 478 10 714
Cardiovascular diseases 1 163 42 1 121 4 767 1 520 3 247 4 094 467 3 627 Rheumatic heart disease 25 0 24 30 10 19 93 3 90 Hypertensive heart disease 103 10 93 179 69 110 316 16 300 Ischaemic heart disease 579 20 559 2 296 622 1 674 1 029 151 878 Cerebrovascular disease 254 5 249 1 364 380 984 2 128 196 1 932 Inflammatory heart diseasesi 33 0 33 123 33 90 87 9 78Respiratory diseases 164 3 161 374 203 171 1 728 79 1 649 Chronic obstructive pulmonary disease
99 1 97 234 122 112 1 508 30 1 478
Asthma 23 0 22 36 8 28 49 8 41Digestive diseases 160 3 156 420 182 238 422 62 360 Peptic ulcer disease 13 0 13 37 15 22 70 5 65 Cirrhosis of the liver 69 1 68 185 60 125 166 25 141 Appendicitis 1 0 1 2 1 1 5 0 4Diseases of the genitourinary system 89 3 86 117 67 50 187 33 154 Nephritis and nephrosis 74 3 71 80 45 35 152 29 123 Benign prostatic hypertrophy 3 0 3 5 1 4 6 0 6Skin diseases 6 1 5 12 8 3 5 2 3Musculoskeletal diseases 4 0 4 28 22 6 28 8 20 Rheumatoid arthritis 1 0 1 6 3 2 8 2 5 Osteoarthritis 0 0 0 2 2 0 0 0 0Congenital abnormalities 69 3 67 36 11 24 61 4 56Oral diseases 0 0 0 0 0 0 0 0 0 Dental caries 0 0 0 0 0 0 0 0 0 Periodontal disease 0 0 0 0 0 0 0 0 0 Edentulism 0 0 0 0 0 0 0 0 0III. Injuries 485 19 466 789 186 604 1 196 119 1 077Unintentional 321 16 305 564 131 432 846 68 778 Road traffic accidents 146 7 139 129 38 91 336 21 314 Poisonings 17 0 17 107 6 101 59 2 57 Falls 24 2 23 79 40 38 134 12 122 Fires 29 0 29 23 3 20 16 2 14 Drownings 30 2 28 34 4 30 139 7 132 Other unintentional injuries 76 5 71 191 40 152 163 23 140Intentional 163 3 160 226 54 171 348 51 297 Self-inflicted injuries 36 2 35 151 49 102 286 49 236 Violence 25 1 24 65 5 60 57 2 55 War and conflict 99 0 99 10 0 9 2 0 2
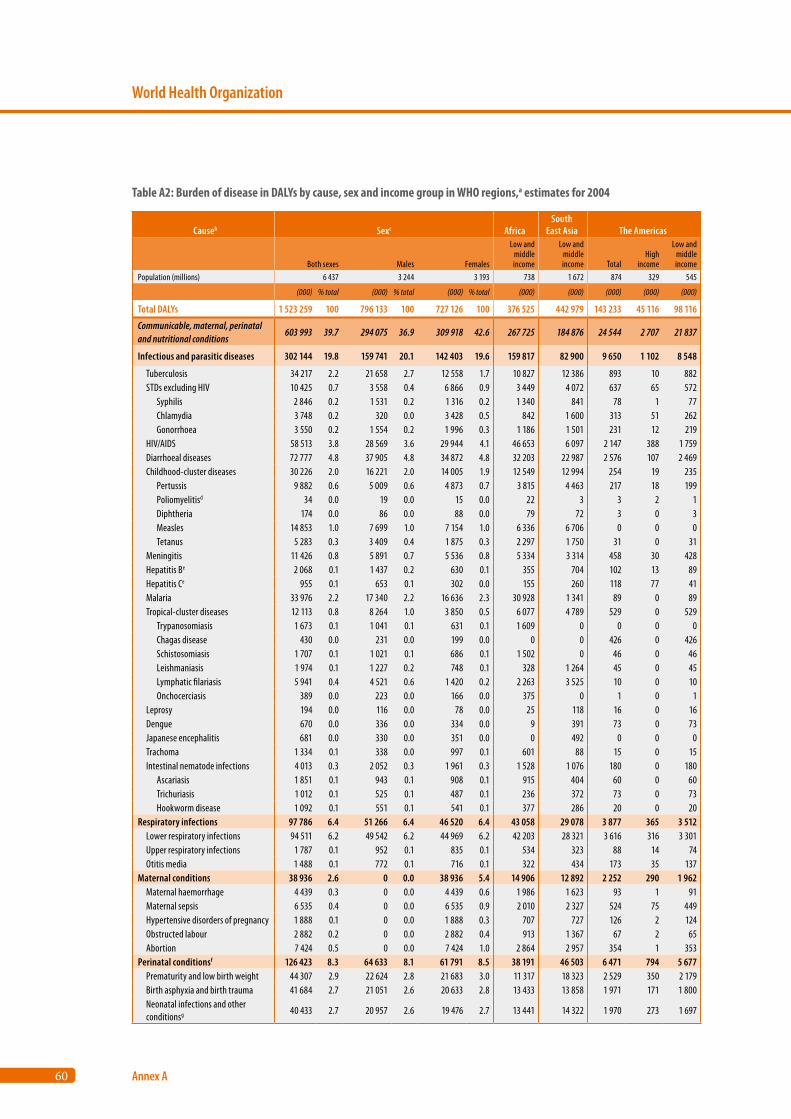
60
World Health Organization
Annex A
Causeb Sexc AfricaSouth
East Asia The Americas
Both sexes Males Females
Low and middle income
Low and middle income Total
High income
Low and middle income
Population (millions) 6 437 3 244 3 193 738 1 672 874 329 545
(000) % total (000) % total (000) % total (000) (000) (000) (000) (000)
Total DALYs 1 523 259 100 796 133 100 727 126 100 376 525 442 979 143 233 45 116 98 116
Communicable, maternal, perinatal and nutritional conditions
603 993 39.7 294 075 36.9 309 918 42.6 267 725 184 876 24 544 2 707 21 837
Infectious and parasitic diseases 302 144 19.8 159 741 20.1 142 403 19.6 159 817 82 900 9 650 1 102 8 548
Tuberculosis 34 217 2.2 21 658 2.7 12 558 1.7 10 827 12 386 893 10 882 STDs excluding HIV 10 425 0.7 3 558 0.4 6 866 0.9 3 449 4 072 637 65 572 Syphilis 2 846 0.2 1 531 0.2 1 316 0.2 1 340 841 78 1 77 Chlamydia 3 748 0.2 320 0.0 3 428 0.5 842 1 600 313 51 262 Gonorrhoea 3 550 0.2 1 554 0.2 1 996 0.3 1 186 1 501 231 12 219 HIV/AIDS 58 513 3.8 28 569 3.6 29 944 4.1 46 653 6 097 2 147 388 1 759 Diarrhoeal diseases 72 777 4.8 37 905 4.8 34 872 4.8 32 203 22 987 2 576 107 2 469 Childhood-cluster diseases 30 226 2.0 16 221 2.0 14 005 1.9 12 549 12 994 254 19 235 Pertussis 9 882 0.6 5 009 0.6 4 873 0.7 3 815 4 463 217 18 199 Poliomyelitisd 34 0.0 19 0.0 15 0.0 22 3 3 2 1 Diphtheria 174 0.0 86 0.0 88 0.0 79 72 3 0 3 Measles 14 853 1.0 7 699 1.0 7 154 1.0 6 336 6 706 0 0 0 Tetanus 5 283 0.3 3 409 0.4 1 875 0.3 2 297 1 750 31 0 31 Meningitis 11 426 0.8 5 891 0.7 5 536 0.8 5 334 3 314 458 30 428 Hepatitis Be 2 068 0.1 1 437 0.2 630 0.1 355 704 102 13 89 Hepatitis Ce 955 0.1 653 0.1 302 0.0 155 260 118 77 41 Malaria 33 976 2.2 17 340 2.2 16 636 2.3 30 928 1 341 89 0 89 Tropical-cluster diseases 12 113 0.8 8 264 1.0 3 850 0.5 6 077 4 789 529 0 529 Trypanosomiasis 1 673 0.1 1 041 0.1 631 0.1 1 609 0 0 0 0 Chagas disease 430 0.0 231 0.0 199 0.0 0 0 426 0 426 Schistosomiasis 1 707 0.1 1 021 0.1 686 0.1 1 502 0 46 0 46 Leishmaniasis 1 974 0.1 1 227 0.2 748 0.1 328 1 264 45 0 45 Lymphatic filariasis 5 941 0.4 4 521 0.6 1 420 0.2 2 263 3 525 10 0 10 Onchocerciasis 389 0.0 223 0.0 166 0.0 375 0 1 0 1 Leprosy 194 0.0 116 0.0 78 0.0 25 118 16 0 16 Dengue 670 0.0 336 0.0 334 0.0 9 391 73 0 73 Japanese encephalitis 681 0.0 330 0.0 351 0.0 0 492 0 0 0 Trachoma 1 334 0.1 338 0.0 997 0.1 601 88 15 0 15 Intestinal nematode infections 4 013 0.3 2 052 0.3 1 961 0.3 1 528 1 076 180 0 180 Ascariasis 1 851 0.1 943 0.1 908 0.1 915 404 60 0 60 Trichuriasis 1 012 0.1 525 0.1 487 0.1 236 372 73 0 73 Hookworm disease 1 092 0.1 551 0.1 541 0.1 377 286 20 0 20Respiratory infections 97 786 6.4 51 266 6.4 46 520 6.4 43 058 29 078 3 877 365 3 512 Lower respiratory infections 94 511 6.2 49 542 6.2 44 969 6.2 42 203 28 321 3 616 316 3 301 Upper respiratory infections 1 787 0.1 952 0.1 835 0.1 534 323 88 14 74 Otitis media 1 488 0.1 772 0.1 716 0.1 322 434 173 35 137Maternal conditions 38 936 2.6 0 0.0 38 936 5.4 14 906 12 892 2 252 290 1 962 Maternal haemorrhage 4 439 0.3 0 0.0 4 439 0.6 1 986 1 623 93 1 91 Maternal sepsis 6 535 0.4 0 0.0 6 535 0.9 2 010 2 327 524 75 449 Hypertensive disorders of pregnancy 1 888 0.1 0 0.0 1 888 0.3 707 727 126 2 124 Obstructed labour 2 882 0.2 0 0.0 2 882 0.4 913 1 367 67 2 65 Abortion 7 424 0.5 0 0.0 7 424 1.0 2 864 2 957 354 1 353Perinatal conditionsf 126 423 8.3 64 633 8.1 61 791 8.5 38 191 46 503 6 471 794 5 677 Prematurity and low birth weight 44 307 2.9 22 624 2.8 21 683 3.0 11 317 18 323 2 529 350 2 179 Birth asphyxia and birth trauma 41 684 2.7 21 051 2.6 20 633 2.8 13 433 13 858 1 971 171 1 800 Neonatal infections and other conditionsg 40 433 2.7 20 957 2.6 19 476 2.7 13 441 14 322 1 970 273 1 697
Table A2: Burden of disease in DALYs by cause, sex and income group in WHO regions,a estimates for 2004

61
Global Burden of Disease 2004
Deaths and DALYs 2004: Annex tables
1
2
3
4
Annex A
Annex B
Annex C
References
Causeb Eastern Mediterranean Europe Western Pacific
TotalHigh
income
Low and middle income Total
High income
Low and middle income Total
High income
Low and middle income
Population (millions) 520 31 489 883 407 476 1 738 204 1 534
(000) (000) (000) (000) (000) (000) (000) (000) (000)
Total DALYs 141 993 4 379 137 614 151 461 49 331 102 130 264 772 22 305 242 466
Communicable, maternal, perinatal and nutritional conditions
62 440 790 61 650 15 391 2 297 13 094 48 409 1 383 47 027
Infectious and parasitic diseases 23 691 241 23 450 6 041 838 5 203 19 763 490 19 272
Tuberculosis 2 720 33 2 686 1 735 40 1 695 5 631 94 5 537 STDs excluding HIV 1 290 29 1 261 366 77 290 595 38 557 Syphilis 478 1 477 16 3 13 89 1 87 Chlamydia 437 19 417 237 58 179 313 28 285 Gonorrhoea 344 9 335 98 14 83 185 9 176 HIV/AIDS 920 8 912 1 180 196 983 1 453 15 1 439 Diarrhoeal diseases 8 349 100 8 249 1 393 114 1 279 5 225 106 5 119 Childhood-cluster diseases 3 567 5 3 562 67 20 47 772 7 765 Pertussis 1 158 2 1 156 48 18 30 175 7 169 Poliomyelitisd 3 0 3 3 2 1 0 0 0 Diphtheria 17 0 17 1 0 1 1 0 1 Measles 1 533 0 1 533 12 1 12 252 0 252 Tetanus 856 2 854 3 0 2 343 0 343 Meningitis 1 068 12 1 056 333 50 284 910 13 897 Hepatitis Be 281 6 275 136 32 104 487 30 457 Hepatitis Ce 121 2 119 71 34 37 229 40 188 Malaria 1 412 1 1 411 4 1 3 169 0 169 Tropical-cluster diseases 574 11 563 7 0 7 128 0 128 Trypanosomiasis 62 0 62 0 0 0 0 0 0 Chagas disease 0 0 0 0 0 0 0 0 0 Schistosomiasis 145 8 136 0 0 0 13 0 13 Leishmaniasis 281 3 278 6 0 6 51 0 51 Lymphatic filariasis 75 0 75 1 0 1 65 0 65 Onchocerciasis 11 0 11 0 0 0 0 0 0 Leprosy 22 0 22 0 0 0 13 0 13 Dengue 28 6 22 0 0 0 169 0 169 Japanese encephalitis 0 0 0 4 0 4 186 2 183 Trachoma 208 0 208 0 0 0 419 0 419 Intestinal nematode infections 269 0 269 0 0 0 955 22 933 Ascariasis 162 0 161 0 0 0 308 5 303 Trichuriasis 61 0 61 0 0 0 269 6 264 Hookworm disease 43 0 43 0 0 0 364 11 353Respiratory infections 12 421 110 12 311 2 907 488 2 419 6 363 390 5 973 Lower respiratory infections 12 060 101 11 959 2 618 424 2 194 5 616 361 5 256 Upper respiratory infections 211 2 209 196 29 167 434 10 425 Otitis media 151 8 143 94 35 58 313 20 293Maternal conditions 5 081 99 4 982 862 171 691 2 901 95 2 805 Maternal haemorrhage 541 3 538 19 1 18 173 1 172 Maternal sepsis 824 15 809 232 38 194 612 14 598 Hypertensive disorders of pregnancy 238 1 237 13 1 12 76 1 76 Obstructed labour 325 3 322 9 2 7 197 6 190 Abortion 977 22 955 38 5 33 225 0 225Perinatal conditionsf 16 958 258 16 699 3 687 515 3 173 14 463 170 14 293 Prematurity and low birth weight 5 345 99 5 246 1 490 221 1 269 5 249 61 5 188 Birth asphyxia and birth trauma 5 472 107 5 366 1 230 150 1 080 5 661 52 5 609 Neonatal infections and other conditionsg 6 141 53 6 088 967 143 824 3 552 57 3 495
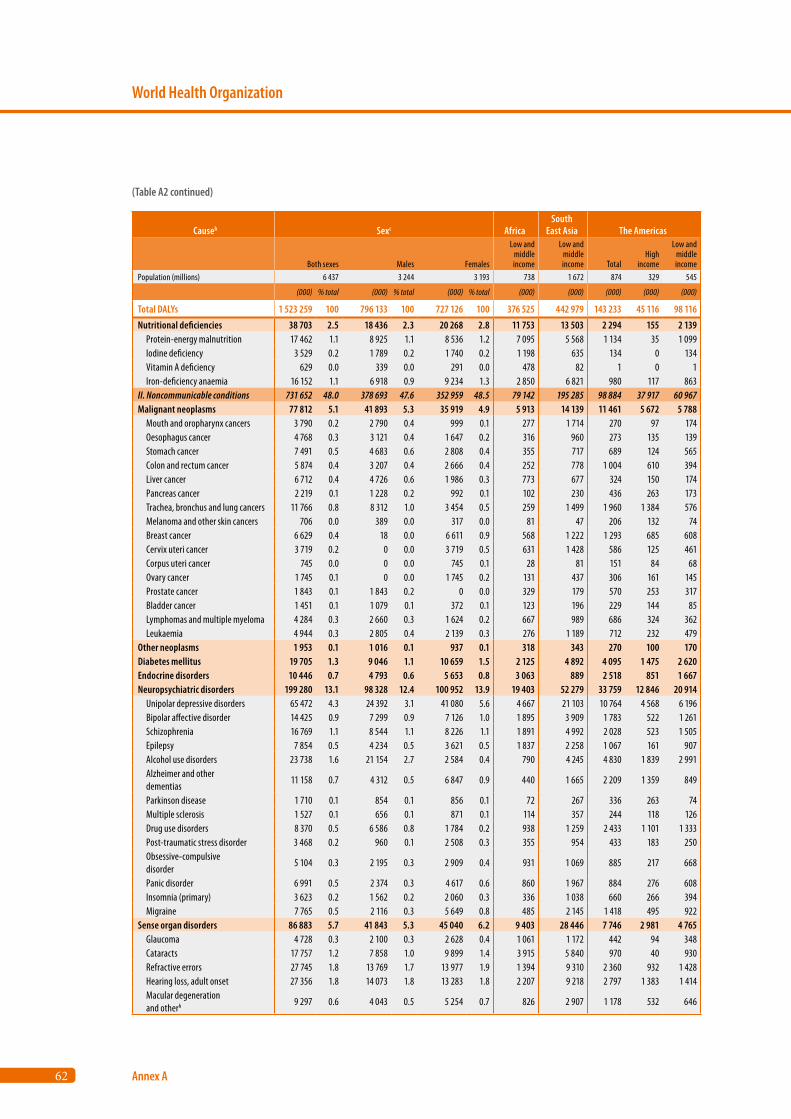
62
World Health Organization
Annex A
Causeb Sexc AfricaSouth
East Asia The Americas
Both sexes Males Females
Low and middle income
Low and middle income Total
High income
Low and middle income
Population (millions) 6 437 3 244 3 193 738 1 672 874 329 545
(000) % total (000) % total (000) % total (000) (000) (000) (000) (000)
Total DALYs 1 523 259 100 796 133 100 727 126 100 376 525 442 979 143 233 45 116 98 116
Nutritional deficiencies 38 703 2.5 18 436 2.3 20 268 2.8 11 753 13 503 2 294 155 2 139 Protein-energy malnutrition 17 462 1.1 8 925 1.1 8 536 1.2 7 095 5 568 1 134 35 1 099 Iodine deficiency 3 529 0.2 1 789 0.2 1 740 0.2 1 198 635 134 0 134 Vitamin A deficiency 629 0.0 339 0.0 291 0.0 478 82 1 0 1 Iron-deficiency anaemia 16 152 1.1 6 918 0.9 9 234 1.3 2 850 6 821 980 117 863II. Noncommunicable conditions 731 652 48.0 378 693 47.6 352 959 48.5 79 142 195 285 98 884 37 917 60 967Malignant neoplasms 77 812 5.1 41 893 5.3 35 919 4.9 5 913 14 139 11 461 5 672 5 788 Mouth and oropharynx cancers 3 790 0.2 2 790 0.4 999 0.1 277 1 714 270 97 174 Oesophagus cancer 4 768 0.3 3 121 0.4 1 647 0.2 316 960 273 135 139 Stomach cancer 7 491 0.5 4 683 0.6 2 808 0.4 355 717 689 124 565 Colon and rectum cancer 5 874 0.4 3 207 0.4 2 666 0.4 252 778 1 004 610 394 Liver cancer 6 712 0.4 4 726 0.6 1 986 0.3 773 677 324 150 174 Pancreas cancer 2 219 0.1 1 228 0.2 992 0.1 102 230 436 263 173 Trachea, bronchus and lung cancers 11 766 0.8 8 312 1.0 3 454 0.5 259 1 499 1 960 1 384 576 Melanoma and other skin cancers 706 0.0 389 0.0 317 0.0 81 47 206 132 74 Breast cancer 6 629 0.4 18 0.0 6 611 0.9 568 1 222 1 293 685 608 Cervix uteri cancer 3 719 0.2 0 0.0 3 719 0.5 631 1 428 586 125 461 Corpus uteri cancer 745 0.0 0 0.0 745 0.1 28 81 151 84 68 Ovary cancer 1 745 0.1 0 0.0 1 745 0.2 131 437 306 161 145 Prostate cancer 1 843 0.1 1 843 0.2 0 0.0 329 179 570 253 317 Bladder cancer 1 451 0.1 1 079 0.1 372 0.1 123 196 229 144 85 Lymphomas and multiple myeloma 4 284 0.3 2 660 0.3 1 624 0.2 667 989 686 324 362 Leukaemia 4 944 0.3 2 805 0.4 2 139 0.3 276 1 189 712 232 479Other neoplasms 1 953 0.1 1 016 0.1 937 0.1 318 343 270 100 170Diabetes mellitus 19 705 1.3 9 046 1.1 10 659 1.5 2 125 4 892 4 095 1 475 2 620Endocrine disorders 10 446 0.7 4 793 0.6 5 653 0.8 3 063 889 2 518 851 1 667Neuropsychiatric disorders 199 280 13.1 98 328 12.4 100 952 13.9 19 403 52 279 33 759 12 846 20 914 Unipolar depressive disorders 65 472 4.3 24 392 3.1 41 080 5.6 4 667 21 103 10 764 4 568 6 196 Bipolar affective disorder 14 425 0.9 7 299 0.9 7 126 1.0 1 895 3 909 1 783 522 1 261 Schizophrenia 16 769 1.1 8 544 1.1 8 226 1.1 1 891 4 992 2 028 523 1 505 Epilepsy 7 854 0.5 4 234 0.5 3 621 0.5 1 837 2 258 1 067 161 907 Alcohol use disorders 23 738 1.6 21 154 2.7 2 584 0.4 790 4 245 4 830 1 839 2 991 Alzheimer and other dementias
11 158 0.7 4 312 0.5 6 847 0.9 440 1 665 2 209 1 359 849
Parkinson disease 1 710 0.1 854 0.1 856 0.1 72 267 336 263 74 Multiple sclerosis 1 527 0.1 656 0.1 871 0.1 114 357 244 118 126 Drug use disorders 8 370 0.5 6 586 0.8 1 784 0.2 938 1 259 2 433 1 101 1 333 Post-traumatic stress disorder 3 468 0.2 960 0.1 2 508 0.3 355 954 433 183 250 Obsessive-compulsive disorder
5 104 0.3 2 195 0.3 2 909 0.4 931 1 069 885 217 668
Panic disorder 6 991 0.5 2 374 0.3 4 617 0.6 860 1 967 884 276 608 Insomnia (primary) 3 623 0.2 1 562 0.2 2 060 0.3 336 1 038 660 266 394 Migraine 7 765 0.5 2 116 0.3 5 649 0.8 485 2 145 1 418 495 922Sense organ disorders 86 883 5.7 41 843 5.3 45 040 6.2 9 403 28 446 7 746 2 981 4 765 Glaucoma 4 728 0.3 2 100 0.3 2 628 0.4 1 061 1 172 442 94 348 Cataracts 17 757 1.2 7 858 1.0 9 899 1.4 3 915 5 840 970 40 930 Refractive errors 27 745 1.8 13 769 1.7 13 977 1.9 1 394 9 310 2 360 932 1 428 Hearing loss, adult onset 27 356 1.8 14 073 1.8 13 283 1.8 2 207 9 218 2 797 1 383 1 414 Macular degeneration and otherh 9 297 0.6 4 043 0.5 5 254 0.7 826 2 907 1 178 532 646
(Table A2 continued)
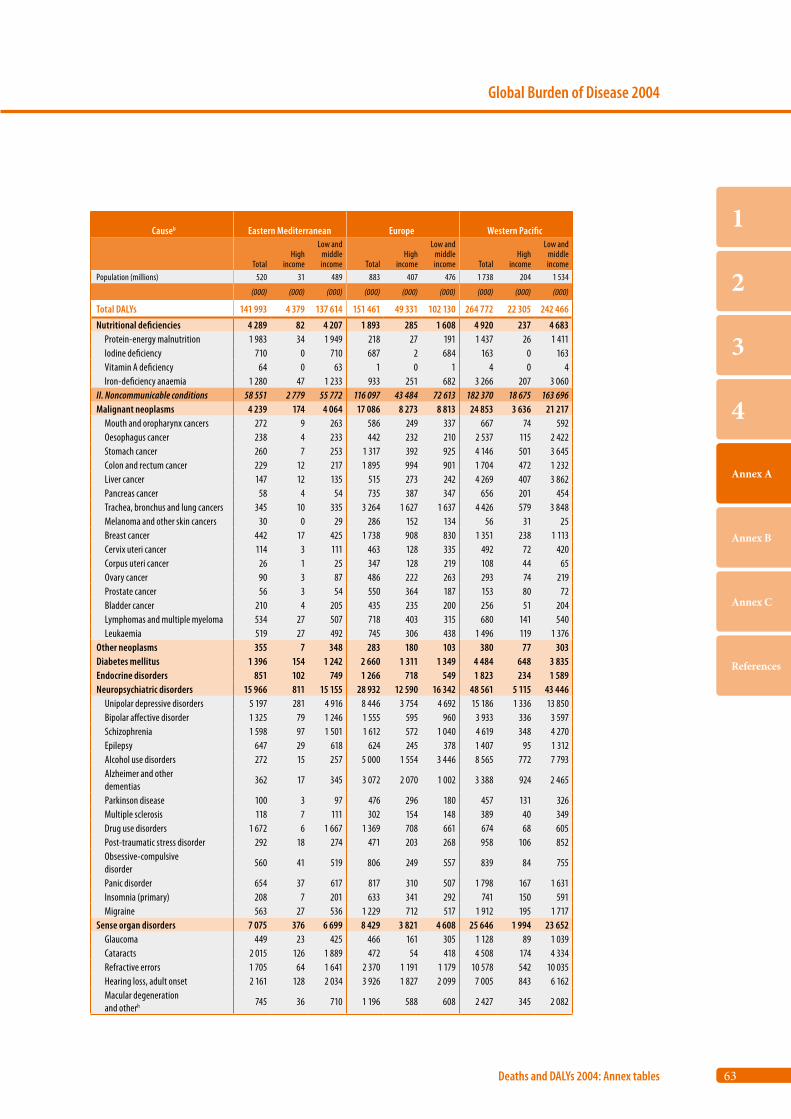
63
Global Burden of Disease 2004
Deaths and DALYs 2004: Annex tables
1
2
3
4
Annex A
Annex B
Annex C
References
Causeb Eastern Mediterranean Europe Western Pacific
TotalHigh
income
Low and middle income Total
High income
Low and middle income Total
High income
Low and middle income
Population (millions) 520 31 489 883 407 476 1 738 204 1 534
(000) (000) (000) (000) (000) (000) (000) (000) (000)
Total DALYs 141 993 4 379 137 614 151 461 49 331 102 130 264 772 22 305 242 466
Nutritional deficiencies 4 289 82 4 207 1 893 285 1 608 4 920 237 4 683 Protein-energy malnutrition 1 983 34 1 949 218 27 191 1 437 26 1 411 Iodine deficiency 710 0 710 687 2 684 163 0 163 Vitamin A deficiency 64 0 63 1 0 1 4 0 4 Iron-deficiency anaemia 1 280 47 1 233 933 251 682 3 266 207 3 060II. Noncommunicable conditions 58 551 2 779 55 772 116 097 43 484 72 613 182 370 18 675 163 696Malignant neoplasms 4 239 174 4 064 17 086 8 273 8 813 24 853 3 636 21 217 Mouth and oropharynx cancers 272 9 263 586 249 337 667 74 592 Oesophagus cancer 238 4 233 442 232 210 2 537 115 2 422 Stomach cancer 260 7 253 1 317 392 925 4 146 501 3 645 Colon and rectum cancer 229 12 217 1 895 994 901 1 704 472 1 232 Liver cancer 147 12 135 515 273 242 4 269 407 3 862 Pancreas cancer 58 4 54 735 387 347 656 201 454 Trachea, bronchus and lung cancers 345 10 335 3 264 1 627 1 637 4 426 579 3 848 Melanoma and other skin cancers 30 0 29 286 152 134 56 31 25 Breast cancer 442 17 425 1 738 908 830 1 351 238 1 113 Cervix uteri cancer 114 3 111 463 128 335 492 72 420 Corpus uteri cancer 26 1 25 347 128 219 108 44 65 Ovary cancer 90 3 87 486 222 263 293 74 219 Prostate cancer 56 3 54 550 364 187 153 80 72 Bladder cancer 210 4 205 435 235 200 256 51 204 Lymphomas and multiple myeloma 534 27 507 718 403 315 680 141 540 Leukaemia 519 27 492 745 306 438 1 496 119 1 376Other neoplasms 355 7 348 283 180 103 380 77 303Diabetes mellitus 1 396 154 1 242 2 660 1 311 1 349 4 484 648 3 835Endocrine disorders 851 102 749 1 266 718 549 1 823 234 1 589Neuropsychiatric disorders 15 966 811 15 155 28 932 12 590 16 342 48 561 5 115 43 446 Unipolar depressive disorders 5 197 281 4 916 8 446 3 754 4 692 15 186 1 336 13 850 Bipolar affective disorder 1 325 79 1 246 1 555 595 960 3 933 336 3 597 Schizophrenia 1 598 97 1 501 1 612 572 1 040 4 619 348 4 270 Epilepsy 647 29 618 624 245 378 1 407 95 1 312 Alcohol use disorders 272 15 257 5 000 1 554 3 446 8 565 772 7 793 Alzheimer and other dementias
362 17 345 3 072 2 070 1 002 3 388 924 2 465
Parkinson disease 100 3 97 476 296 180 457 131 326 Multiple sclerosis 118 7 111 302 154 148 389 40 349 Drug use disorders 1 672 6 1 667 1 369 708 661 674 68 605 Post-traumatic stress disorder 292 18 274 471 203 268 958 106 852 Obsessive-compulsive disorder
560 41 519 806 249 557 839 84 755
Panic disorder 654 37 617 817 310 507 1 798 167 1 631 Insomnia (primary) 208 7 201 633 341 292 741 150 591 Migraine 563 27 536 1 229 712 517 1 912 195 1 717Sense organ disorders 7 075 376 6 699 8 429 3 821 4 608 25 646 1 994 23 652 Glaucoma 449 23 425 466 161 305 1 128 89 1 039 Cataracts 2 015 126 1 889 472 54 418 4 508 174 4 334 Refractive errors 1 705 64 1 641 2 370 1 191 1 179 10 578 542 10 035 Hearing loss, adult onset 2 161 128 2 034 3 926 1 827 2 099 7 005 843 6 162 Macular degeneration and otherh 745 36 710 1 196 588 608 2 427 345 2 082
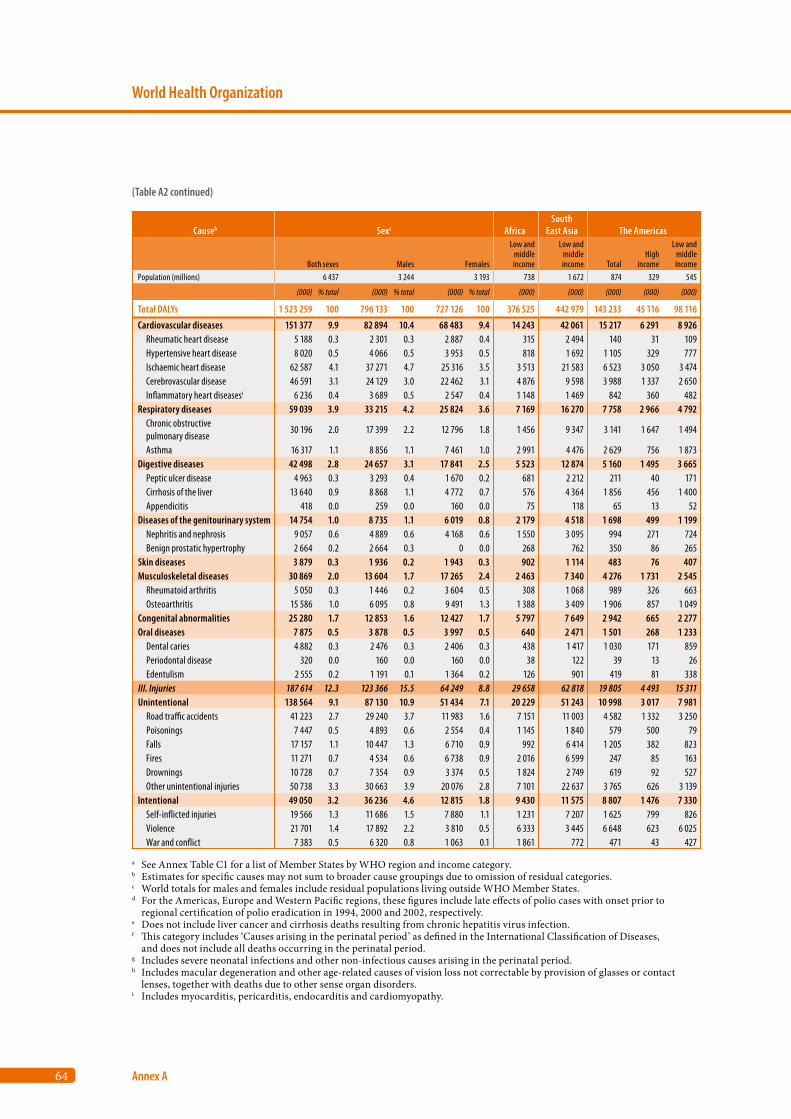
64
World Health Organization
Annex A
Causeb Sexc AfricaSouth
East Asia The Americas
Both sexes Males Females
Low and middle income
Low and middle income Total
High income
Low and middle income
Population (millions) 6 437 3 244 3 193 738 1 672 874 329 545
(000) % total (000) % total (000) % total (000) (000) (000) (000) (000)
Total DALYs 1 523 259 100 796 133 100 727 126 100 376 525 442 979 143 233 45 116 98 116
Cardiovascular diseases 151 377 9.9 82 894 10.4 68 483 9.4 14 243 42 061 15 217 6 291 8 926 Rheumatic heart disease 5 188 0.3 2 301 0.3 2 887 0.4 315 2 494 140 31 109 Hypertensive heart disease 8 020 0.5 4 066 0.5 3 953 0.5 818 1 692 1 105 329 777 Ischaemic heart disease 62 587 4.1 37 271 4.7 25 316 3.5 3 513 21 583 6 523 3 050 3 474 Cerebrovascular disease 46 591 3.1 24 129 3.0 22 462 3.1 4 876 9 598 3 988 1 337 2 650 Inflammatory heart diseasesi 6 236 0.4 3 689 0.5 2 547 0.4 1 148 1 469 842 360 482Respiratory diseases 59 039 3.9 33 215 4.2 25 824 3.6 7 169 16 270 7 758 2 966 4 792 Chronic obstructive pulmonary disease
30 196 2.0 17 399 2.2 12 796 1.8 1 456 9 347 3 141 1 647 1 494
Asthma 16 317 1.1 8 856 1.1 7 461 1.0 2 991 4 476 2 629 756 1 873Digestive diseases 42 498 2.8 24 657 3.1 17 841 2.5 5 523 12 874 5 160 1 495 3 665 Peptic ulcer disease 4 963 0.3 3 293 0.4 1 670 0.2 681 2 212 211 40 171 Cirrhosis of the liver 13 640 0.9 8 868 1.1 4 772 0.7 576 4 364 1 856 456 1 400 Appendicitis 418 0.0 259 0.0 160 0.0 75 118 65 13 52Diseases of the genitourinary system 14 754 1.0 8 735 1.1 6 019 0.8 2 179 4 518 1 698 499 1 199 Nephritis and nephrosis 9 057 0.6 4 889 0.6 4 168 0.6 1 550 3 095 994 271 724 Benign prostatic hypertrophy 2 664 0.2 2 664 0.3 0 0.0 268 762 350 86 265Skin diseases 3 879 0.3 1 936 0.2 1 943 0.3 902 1 114 483 76 407Musculoskeletal diseases 30 869 2.0 13 604 1.7 17 265 2.4 2 463 7 340 4 276 1 731 2 545 Rheumatoid arthritis 5 050 0.3 1 446 0.2 3 604 0.5 308 1 068 989 326 663 Osteoarthritis 15 586 1.0 6 095 0.8 9 491 1.3 1 388 3 409 1 906 857 1 049Congenital abnormalities 25 280 1.7 12 853 1.6 12 427 1.7 5 797 7 649 2 942 665 2 277Oral diseases 7 875 0.5 3 878 0.5 3 997 0.5 640 2 471 1 501 268 1 233 Dental caries 4 882 0.3 2 476 0.3 2 406 0.3 438 1 417 1 030 171 859 Periodontal disease 320 0.0 160 0.0 160 0.0 38 122 39 13 26 Edentulism 2 555 0.2 1 191 0.1 1 364 0.2 126 901 419 81 338III. Injuries 187 614 12.3 123 366 15.5 64 249 8.8 29 658 62 818 19 805 4 493 15 311Unintentional 138 564 9.1 87 130 10.9 51 434 7.1 20 229 51 243 10 998 3 017 7 981 Road traffic accidents 41 223 2.7 29 240 3.7 11 983 1.6 7 151 11 003 4 582 1 332 3 250 Poisonings 7 447 0.5 4 893 0.6 2 554 0.4 1 145 1 840 579 500 79 Falls 17 157 1.1 10 447 1.3 6 710 0.9 992 6 414 1 205 382 823 Fires 11 271 0.7 4 534 0.6 6 738 0.9 2 016 6 599 247 85 163 Drownings 10 728 0.7 7 354 0.9 3 374 0.5 1 824 2 749 619 92 527 Other unintentional injuries 50 738 3.3 30 663 3.9 20 076 2.8 7 101 22 637 3 765 626 3 139Intentional 49 050 3.2 36 236 4.6 12 815 1.8 9 430 11 575 8 807 1 476 7 330 Self-inflicted injuries 19 566 1.3 11 686 1.5 7 880 1.1 1 231 7 207 1 625 799 826 Violence 21 701 1.4 17 892 2.2 3 810 0.5 6 333 3 445 6 648 623 6 025 War and conflict 7 383 0.5 6 320 0.8 1 063 0.1 1 861 772 471 43 427
a See Annex Table C1 for a list of Member States by WHO region and income category.b Estimates for specific causes may not sum to broader cause groupings due to omission of residual categories.c World totals for males and females include residual populations living outside WHO Member States.d For the Americas, Europe and Western Pacific regions, these figures include late effects of polio cases with onset prior to
regional certification of polio eradication in 1994, 2000 and 2002, respectively. e Does not include liver cancer and cirrhosis deaths resulting from chronic hepatitis virus infection.f This category includes ‘Causes arising in the perinatal period’ as defined in the International Classification of Diseases,
and does not include all deaths occurring in the perinatal period.g Includes severe neonatal infections and other non-infectious causes arising in the perinatal period.h Includes macular degeneration and other age-related causes of vision loss not correctable by provision of glasses or contact
lenses, together with deaths due to other sense organ disorders.i Includes myocarditis, pericarditis, endocarditis and cardiomyopathy.
(Table A2 continued)
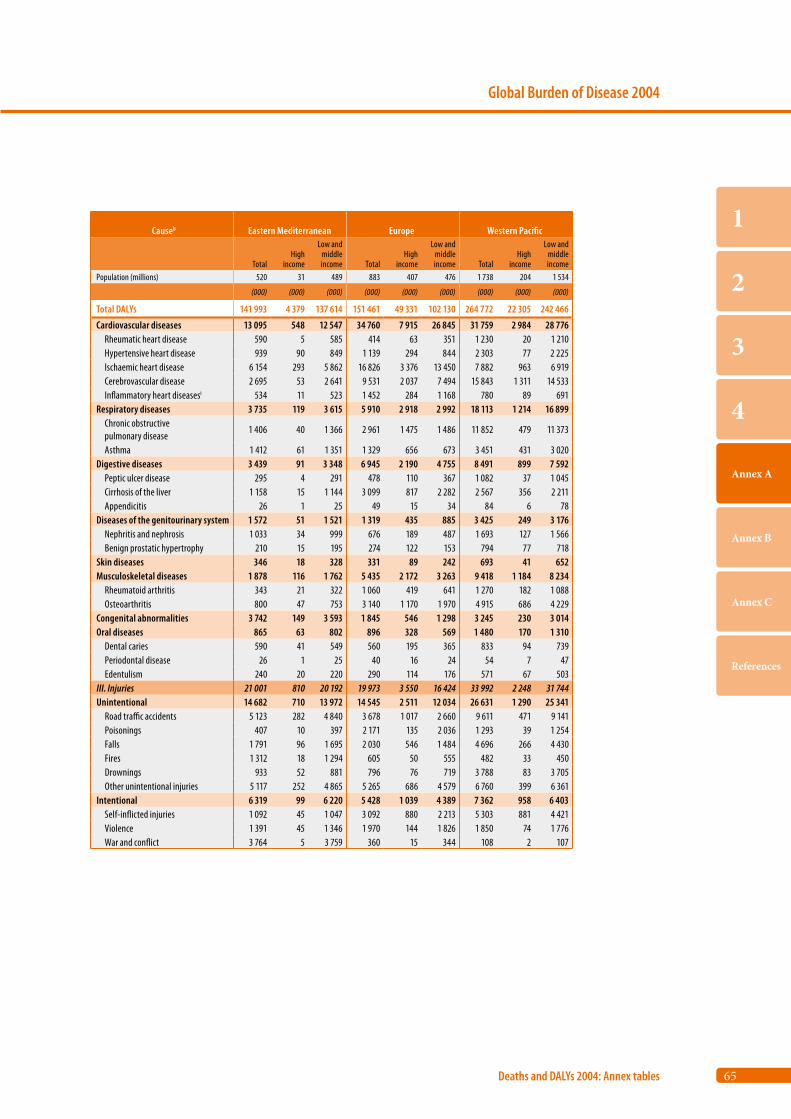
65
Global Burden of Disease 2004
Deaths and DALYs 2004: Annex tables
1
2
3
4
Annex A
Annex B
Annex C
References
Causeb Eastern Mediterranean Europe Western Pacific
TotalHigh
income
Low and middle income Total
High income
Low and middle income Total
High income
Low and middle income
Population (millions) 520 31 489 883 407 476 1 738 204 1 534
(000) (000) (000) (000) (000) (000) (000) (000) (000)
Total DALYs 141 993 4 379 137 614 151 461 49 331 102 130 264 772 22 305 242 466
Cardiovascular diseases 13 095 548 12 547 34 760 7 915 26 845 31 759 2 984 28 776 Rheumatic heart disease 590 5 585 414 63 351 1 230 20 1 210 Hypertensive heart disease 939 90 849 1 139 294 844 2 303 77 2 225 Ischaemic heart disease 6 154 293 5 862 16 826 3 376 13 450 7 882 963 6 919 Cerebrovascular disease 2 695 53 2 641 9 531 2 037 7 494 15 843 1 311 14 533 Inflammatory heart diseasesi 534 11 523 1 452 284 1 168 780 89 691Respiratory diseases 3 735 119 3 615 5 910 2 918 2 992 18 113 1 214 16 899 Chronic obstructive pulmonary disease
1 406 40 1 366 2 961 1 475 1 486 11 852 479 11 373
Asthma 1 412 61 1 351 1 329 656 673 3 451 431 3 020Digestive diseases 3 439 91 3 348 6 945 2 190 4 755 8 491 899 7 592 Peptic ulcer disease 295 4 291 478 110 367 1 082 37 1 045 Cirrhosis of the liver 1 158 15 1 144 3 099 817 2 282 2 567 356 2 211 Appendicitis 26 1 25 49 15 34 84 6 78Diseases of the genitourinary system 1 572 51 1 521 1 319 435 885 3 425 249 3 176 Nephritis and nephrosis 1 033 34 999 676 189 487 1 693 127 1 566 Benign prostatic hypertrophy 210 15 195 274 122 153 794 77 718Skin diseases 346 18 328 331 89 242 693 41 652Musculoskeletal diseases 1 878 116 1 762 5 435 2 172 3 263 9 418 1 184 8 234 Rheumatoid arthritis 343 21 322 1 060 419 641 1 270 182 1 088 Osteoarthritis 800 47 753 3 140 1 170 1 970 4 915 686 4 229Congenital abnormalities 3 742 149 3 593 1 845 546 1 298 3 245 230 3 014Oral diseases 865 63 802 896 328 569 1 480 170 1 310 Dental caries 590 41 549 560 195 365 833 94 739 Periodontal disease 26 1 25 40 16 24 54 7 47 Edentulism 240 20 220 290 114 176 571 67 503III. Injuries 21 001 810 20 192 19 973 3 550 16 424 33 992 2 248 31 744Unintentional 14 682 710 13 972 14 545 2 511 12 034 26 631 1 290 25 341 Road traffic accidents 5 123 282 4 840 3 678 1 017 2 660 9 611 471 9 141 Poisonings 407 10 397 2 171 135 2 036 1 293 39 1 254 Falls 1 791 96 1 695 2 030 546 1 484 4 696 266 4 430 Fires 1 312 18 1 294 605 50 555 482 33 450 Drownings 933 52 881 796 76 719 3 788 83 3 705 Other unintentional injuries 5 117 252 4 865 5 265 686 4 579 6 760 399 6 361Intentional 6 319 99 6 220 5 428 1 039 4 389 7 362 958 6 403 Self-inflicted injuries 1 092 45 1 047 3 092 880 2 213 5 303 881 4 421 Violence 1 391 45 1 346 1 970 144 1 826 1 850 74 1 776 War and conflict 3 764 5 3 759 360 15 344 108 2 107
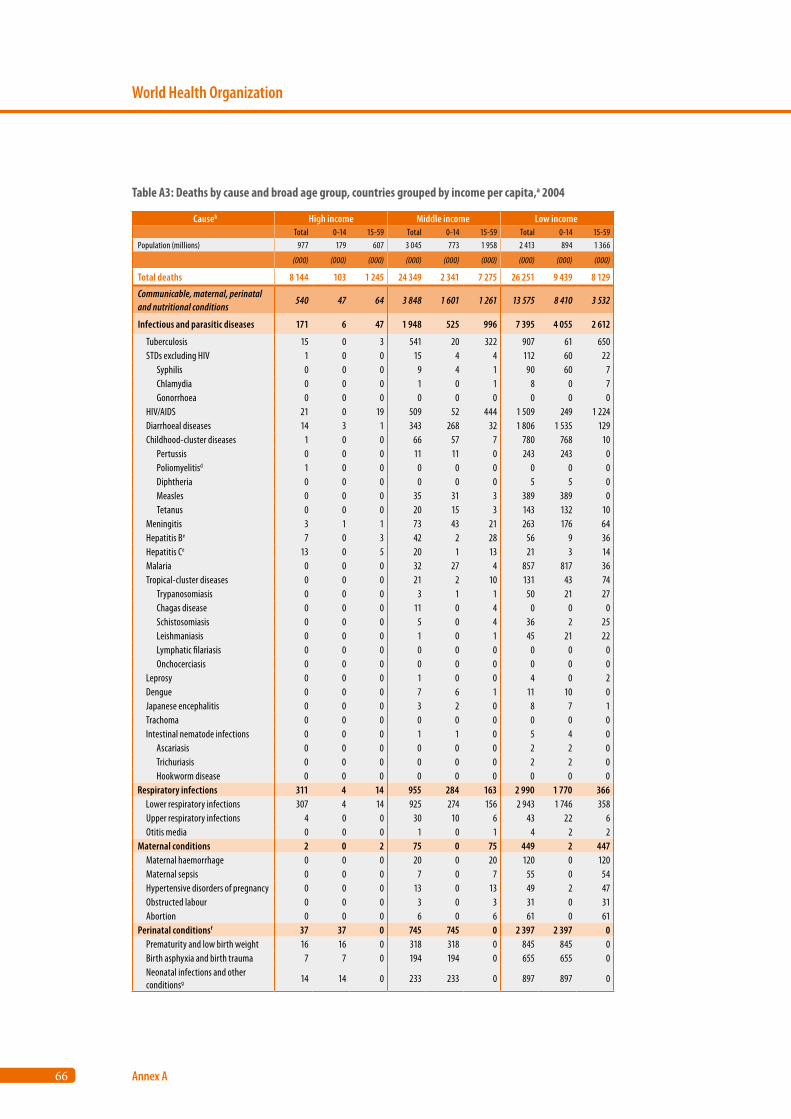
66
World Health Organization
Annex A
Causeb High income Middle income Low income Total 0-14 15-59 Total 0-14 15-59 Total 0-14 15-59
Population (millions) 977 179 607 3 045 773 1 958 2 413 894 1 366
(000) (000) (000) (000) (000) (000) (000) (000) (000)
Total deaths 8 144 103 1 245 24 349 2 341 7 275 26 251 9 439 8 129
Communicable, maternal, perinatal and nutritional conditions
540 47 64 3 848 1 601 1 261 13 575 8 410 3 532
Infectious and parasitic diseases 171 6 47 1 948 525 996 7 395 4 055 2 612
Tuberculosis 15 0 3 541 20 322 907 61 650 STDs excluding HIV 1 0 0 15 4 4 112 60 22 Syphilis 0 0 0 9 4 1 90 60 7 Chlamydia 0 0 0 1 0 1 8 0 7 Gonorrhoea 0 0 0 0 0 0 0 0 0 HIV/AIDS 21 0 19 509 52 444 1 509 249 1 224 Diarrhoeal diseases 14 3 1 343 268 32 1 806 1 535 129 Childhood-cluster diseases 1 0 0 66 57 7 780 768 10 Pertussis 0 0 0 11 11 0 243 243 0 Poliomyelitisd 1 0 0 0 0 0 0 0 0 Diphtheria 0 0 0 0 0 0 5 5 0 Measles 0 0 0 35 31 3 389 389 0 Tetanus 0 0 0 20 15 3 143 132 10 Meningitis 3 1 1 73 43 21 263 176 64 Hepatitis Be 7 0 3 42 2 28 56 9 36 Hepatitis Ce 13 0 5 20 1 13 21 3 14 Malaria 0 0 0 32 27 4 857 817 36 Tropical-cluster diseases 0 0 0 21 2 10 131 43 74 Trypanosomiasis 0 0 0 3 1 1 50 21 27 Chagas disease 0 0 0 11 0 4 0 0 0 Schistosomiasis 0 0 0 5 0 4 36 2 25 Leishmaniasis 0 0 0 1 0 1 45 21 22 Lymphatic filariasis 0 0 0 0 0 0 0 0 0 Onchocerciasis 0 0 0 0 0 0 0 0 0 Leprosy 0 0 0 1 0 0 4 0 2 Dengue 0 0 0 7 6 1 11 10 0 Japanese encephalitis 0 0 0 3 2 0 8 7 1 Trachoma 0 0 0 0 0 0 0 0 0 Intestinal nematode infections 0 0 0 1 1 0 5 4 0 Ascariasis 0 0 0 0 0 0 2 2 0 Trichuriasis 0 0 0 0 0 0 2 2 0 Hookworm disease 0 0 0 0 0 0 0 0 0Respiratory infections 311 4 14 955 284 163 2 990 1 770 366 Lower respiratory infections 307 4 14 925 274 156 2 943 1 746 358 Upper respiratory infections 4 0 0 30 10 6 43 22 6 Otitis media 0 0 0 1 0 1 4 2 2Maternal conditions 2 0 2 75 0 75 449 2 447 Maternal haemorrhage 0 0 0 20 0 20 120 0 120 Maternal sepsis 0 0 0 7 0 7 55 0 54 Hypertensive disorders of pregnancy 0 0 0 13 0 13 49 2 47 Obstructed labour 0 0 0 3 0 3 31 0 31 Abortion 0 0 0 6 0 6 61 0 61Perinatal conditionsf 37 37 0 745 745 0 2 397 2 397 0 Prematurity and low birth weight 16 16 0 318 318 0 845 845 0 Birth asphyxia and birth trauma 7 7 0 194 194 0 655 655 0 Neonatal infections and other conditionsg 14 14 0 233 233 0 897 897 0
Table A3: Deaths by cause and broad age group, countries grouped by income per capita,a 2004

67
Global Burden of Disease 2004
Deaths and DALYs 2004: Annex tables
1
2
3
4
Annex A
Annex B
Annex C
References
Causeb High income Middle income Low income Total 0-14 15-59 Total 0-14 15-59 Total 0-14 15-59
Population (millions) 977 179 607 3 045 773 1 958 2 413 894 1 366
(000) (000) (000) (000) (000) (000) (000) (000) (000)
Total deaths 8 144 103 1 245 24 349 2 341 7 275 26 251 9 439 8 129
Nutritional deficiencies 19 0 1 124 46 28 344 186 107 Protein-energy malnutrition 9 0 1 76 38 10 166 133 25 Iodine deficiency 0 0 0 0 0 0 5 4 0 Vitamin A deficiency 0 0 0 1 1 0 16 16 0 Iron-deficiency anaemia 8 0 0 38 5 15 107 22 70II. Noncommunicable conditions 7 096 39 903 17 547 347 4 023 10 358 580 3 106Malignant neoplasms 2 163 5 394 3 698 38 1 268 1 560 43 563 Mouth and oropharynx cancers 43 0 14 112 0 51 180 1 64 Oesophagus cancer 61 0 13 315 0 93 132 0 41 Stomach cancer 145 0 24 548 0 169 110 0 38 Colon and rectum cancer 266 0 38 300 0 82 73 0 27 Liver cancer 108 0 21 401 1 166 100 1 42 Pancreas cancer 122 0 19 114 0 33 29 0 10 Trachea, bronchus and lung cancers 478 0 83 694 0 205 151 0 45 Melanoma and other skin cancers 34 0 9 24 0 9 10 0 4 Breast cancer 162 0 48 232 0 116 125 0 59 Cervix uteri cancer 24 0 9 102 0 50 142 0 62 Corpus uteri cancer 21 0 3 26 0 8 8 0 2 Ovary cancer 48 0 12 58 0 25 38 0 15 Prostate cancer 122 0 4 112 0 8 73 0 6 Bladder cancer 63 0 5 85 0 16 39 0 6 Lymphomas and multiple myeloma 119 0 20 117 5 51 97 11 41 Leukaemia 78 2 15 134 18 69 64 13 34Other neoplasms 61 1 7 63 3 26 40 5 19Diabetes mellitus 224 0 27 523 1 125 393 5 118Endocrine disorders 76 3 16 132 23 43 94 22 32Neuropsychiatric disorders 453 4 55 405 22 172 404 50 145 Unipolar depressive disorders 3 0 0 1 0 1 10 0 8 Bipolar affective disorder 0 0 0 0 0 0 0 0 0 Schizophrenia 2 0 1 9 0 7 18 0 12 Epilepsy 11 1 5 53 8 38 78 28 37 Alcohol use disorders 23 0 15 47 0 36 18 0 13 Alzheimer and other dementias
277 0 2 101 1 9 113 1 2
Parkinson disease 51 0 1 43 0 4 15 0 0 Multiple sclerosis 8 0 4 7 0 4 2 0 1 Drug use disorders 10 0 10 37 0 36 44 0 43 Post-traumatic stress disorder 0 0 0 0 0 0 0 0 0 Obsessive-compulsive disorder
0 0 0 0 0 0 0 0 0
Panic disorder 0 0 0 0 0 0 0 0 0 Insomnia (primary) 0 0 0 0 0 0 0 0 0 Migraine 0 0 0 0 0 0 0 0 0Sense organ disorders 0 0 0 2 0 0 2 0 1 Glaucoma 0 0 0 0 0 0 0 0 0 Cataracts 0 0 0 0 0 0 0 0 0 Refractive errors 0 0 0 0 0 0 0 0 0 Hearing loss, adult onset 0 0 0 0 0 0 0 0 0 Macular degeneration and otherh 0 0 0 2 0 0 2 0 1
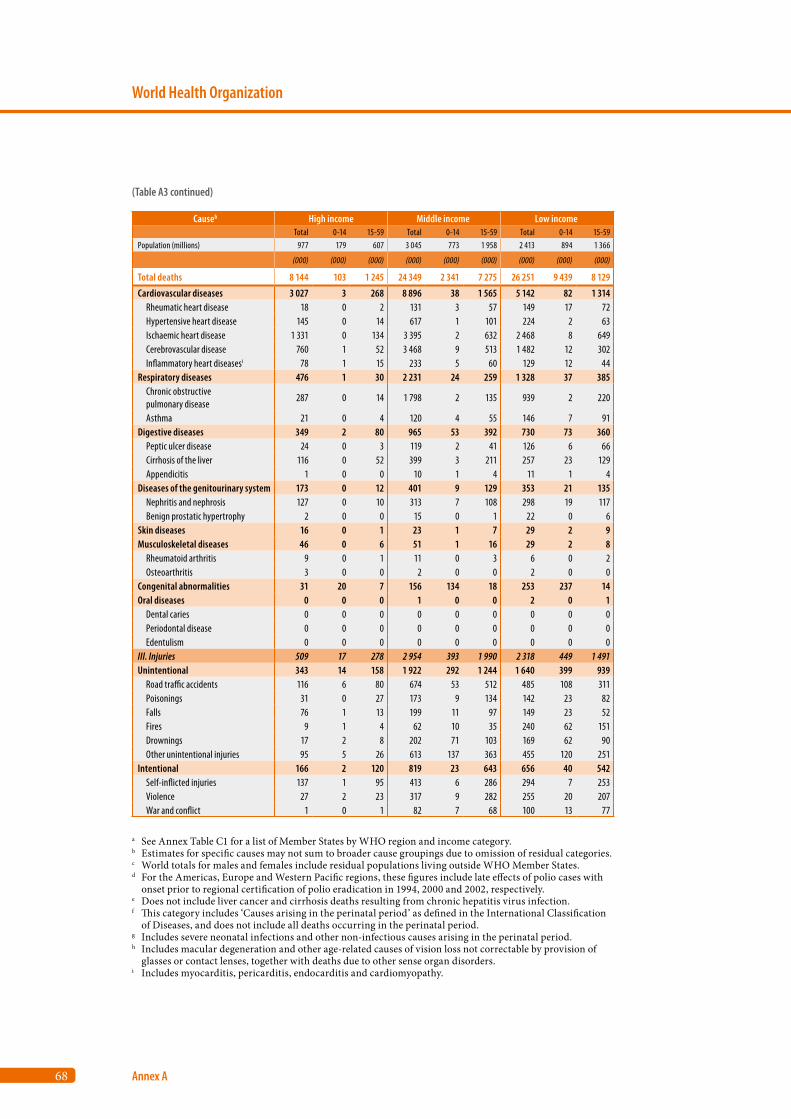
68
World Health Organization
Annex A
Causeb High income Middle income Low income Total 0-14 15-59 Total 0-14 15-59 Total 0-14 15-59
Population (millions) 977 179 607 3 045 773 1 958 2 413 894 1 366
(000) (000) (000) (000) (000) (000) (000) (000) (000)
Total deaths 8 144 103 1 245 24 349 2 341 7 275 26 251 9 439 8 129
Cardiovascular diseases 3 027 3 268 8 896 38 1 565 5 142 82 1 314 Rheumatic heart disease 18 0 2 131 3 57 149 17 72 Hypertensive heart disease 145 0 14 617 1 101 224 2 63 Ischaemic heart disease 1 331 0 134 3 395 2 632 2 468 8 649 Cerebrovascular disease 760 1 52 3 468 9 513 1 482 12 302 Inflammatory heart diseasesi 78 1 15 233 5 60 129 12 44Respiratory diseases 476 1 30 2 231 24 259 1 328 37 385 Chronic obstructive pulmonary disease
287 0 14 1 798 2 135 939 2 220
Asthma 21 0 4 120 4 55 146 7 91Digestive diseases 349 2 80 965 53 392 730 73 360 Peptic ulcer disease 24 0 3 119 2 41 126 6 66 Cirrhosis of the liver 116 0 52 399 3 211 257 23 129 Appendicitis 1 0 0 10 1 4 11 1 4Diseases of the genitourinary system 173 0 12 401 9 129 353 21 135 Nephritis and nephrosis 127 0 10 313 7 108 298 19 117 Benign prostatic hypertrophy 2 0 0 15 0 1 22 0 6Skin diseases 16 0 1 23 1 7 29 2 9Musculoskeletal diseases 46 0 6 51 1 16 29 2 8 Rheumatoid arthritis 9 0 1 11 0 3 6 0 2 Osteoarthritis 3 0 0 2 0 0 2 0 0Congenital abnormalities 31 20 7 156 134 18 253 237 14Oral diseases 0 0 0 1 0 0 2 0 1 Dental caries 0 0 0 0 0 0 0 0 0 Periodontal disease 0 0 0 0 0 0 0 0 0 Edentulism 0 0 0 0 0 0 0 0 0III. Injuries 509 17 278 2 954 393 1 990 2 318 449 1 491Unintentional 343 14 158 1 922 292 1 244 1 640 399 939 Road traffic accidents 116 6 80 674 53 512 485 108 311 Poisonings 31 0 27 173 9 134 142 23 82 Falls 76 1 13 199 11 97 149 23 52 Fires 9 1 4 62 10 35 240 62 151 Drownings 17 2 8 202 71 103 169 62 90 Other unintentional injuries 95 5 26 613 137 363 455 120 251Intentional 166 2 120 819 23 643 656 40 542 Self-inflicted injuries 137 1 95 413 6 286 294 7 253 Violence 27 2 23 317 9 282 255 20 207 War and conflict 1 0 1 82 7 68 100 13 77
a See Annex Table C1 for a list of Member States by WHO region and income category.b Estimates for specific causes may not sum to broader cause groupings due to omission of residual categories.c World totals for males and females include residual populations living outside WHO Member States.d For the Americas, Europe and Western Pacific regions, these figures include late effects of polio cases with
onset prior to regional certification of polio eradication in 1994, 2000 and 2002, respectively. e Does not include liver cancer and cirrhosis deaths resulting from chronic hepatitis virus infection.f This category includes ‘Causes arising in the perinatal period’ as defined in the International Classification
of Diseases, and does not include all deaths occurring in the perinatal period.g Includes severe neonatal infections and other non-infectious causes arising in the perinatal period.h Includes macular degeneration and other age-related causes of vision loss not correctable by provision of
glasses or contact lenses, together with deaths due to other sense organ disorders.i Includes myocarditis, pericarditis, endocarditis and cardiomyopathy.
(Table A3 continued)
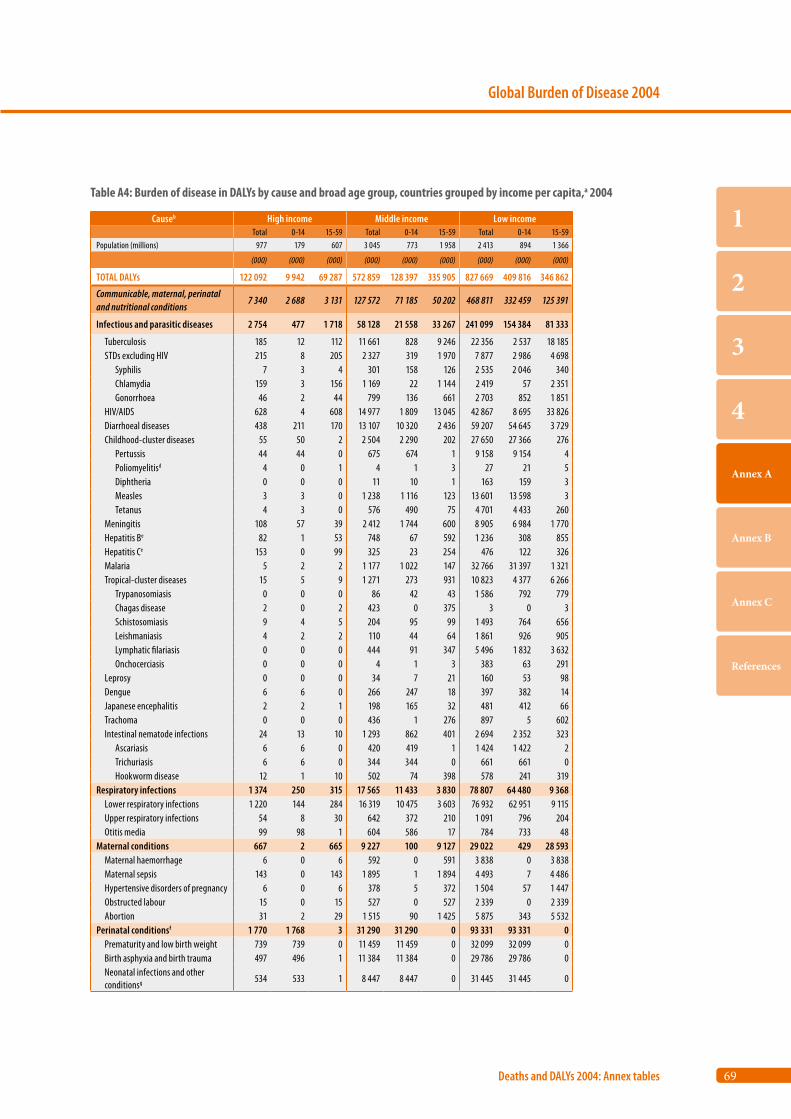
69
Global Burden of Disease 2004
Deaths and DALYs 2004: Annex tables
1
2
3
4
Annex A
Annex B
Annex C
References
Causeb High income Middle income Low income Total 0-14 15-59 Total 0-14 15-59 Total 0-14 15-59
Population (millions) 977 179 607 3 045 773 1 958 2 413 894 1 366
(000) (000) (000) (000) (000) (000) (000) (000) (000)
TOTAL DALYs 122 092 9 942 69 287 572 859 128 397 335 905 827 669 409 816 346 862
Communicable, maternal, perinatal and nutritional conditions
7 340 2 688 3 131 127 572 71 185 50 202 468 811 332 459 125 391
Infectious and parasitic diseases 2 754 477 1 718 58 128 21 558 33 267 241 099 154 384 81 333
Tuberculosis 185 12 112 11 661 828 9 246 22 356 2 537 18 185 STDs excluding HIV 215 8 205 2 327 319 1 970 7 877 2 986 4 698 Syphilis 7 3 4 301 158 126 2 535 2 046 340 Chlamydia 159 3 156 1 169 22 1 144 2 419 57 2 351 Gonorrhoea 46 2 44 799 136 661 2 703 852 1 851 HIV/AIDS 628 4 608 14 977 1 809 13 045 42 867 8 695 33 826 Diarrhoeal diseases 438 211 170 13 107 10 320 2 436 59 207 54 645 3 729 Childhood-cluster diseases 55 50 2 2 504 2 290 202 27 650 27 366 276 Pertussis 44 44 0 675 674 1 9 158 9 154 4 Poliomyelitisd 4 0 1 4 1 3 27 21 5 Diphtheria 0 0 0 11 10 1 163 159 3 Measles 3 3 0 1 238 1 116 123 13 601 13 598 3 Tetanus 4 3 0 576 490 75 4 701 4 433 260 Meningitis 108 57 39 2 412 1 744 600 8 905 6 984 1 770 Hepatitis Be 82 1 53 748 67 592 1 236 308 855 Hepatitis Ce 153 0 99 325 23 254 476 122 326 Malaria 5 2 2 1 177 1 022 147 32 766 31 397 1 321 Tropical-cluster diseases 15 5 9 1 271 273 931 10 823 4 377 6 266 Trypanosomiasis 0 0 0 86 42 43 1 586 792 779 Chagas disease 2 0 2 423 0 375 3 0 3 Schistosomiasis 9 4 5 204 95 99 1 493 764 656 Leishmaniasis 4 2 2 110 44 64 1 861 926 905 Lymphatic filariasis 0 0 0 444 91 347 5 496 1 832 3 632 Onchocerciasis 0 0 0 4 1 3 383 63 291 Leprosy 0 0 0 34 7 21 160 53 98 Dengue 6 6 0 266 247 18 397 382 14 Japanese encephalitis 2 2 1 198 165 32 481 412 66 Trachoma 0 0 0 436 1 276 897 5 602 Intestinal nematode infections 24 13 10 1 293 862 401 2 694 2 352 323 Ascariasis 6 6 0 420 419 1 1 424 1 422 2 Trichuriasis 6 6 0 344 344 0 661 661 0 Hookworm disease 12 1 10 502 74 398 578 241 319Respiratory infections 1 374 250 315 17 565 11 433 3 830 78 807 64 480 9 368 Lower respiratory infections 1 220 144 284 16 319 10 475 3 603 76 932 62 951 9 115 Upper respiratory infections 54 8 30 642 372 210 1 091 796 204 Otitis media 99 98 1 604 586 17 784 733 48Maternal conditions 667 2 665 9 227 100 9 127 29 022 429 28 593 Maternal haemorrhage 6 0 6 592 0 591 3 838 0 3 838 Maternal sepsis 143 0 143 1 895 1 1 894 4 493 7 4 486 Hypertensive disorders of pregnancy 6 0 6 378 5 372 1 504 57 1 447 Obstructed labour 15 0 15 527 0 527 2 339 0 2 339 Abortion 31 2 29 1 515 90 1 425 5 875 343 5 532Perinatal conditionsf 1 770 1 768 3 31 290 31 290 0 93 331 93 331 0 Prematurity and low birth weight 739 739 0 11 459 11 459 0 32 099 32 099 0 Birth asphyxia and birth trauma 497 496 1 11 384 11 384 0 29 786 29 786 0 Neonatal infections and other conditionsg 534 533 1 8 447 8 447 0 31 445 31 445 0
Table A4: Burden of disease in DALYs by cause and broad age group, countries grouped by income per capita,a 2004
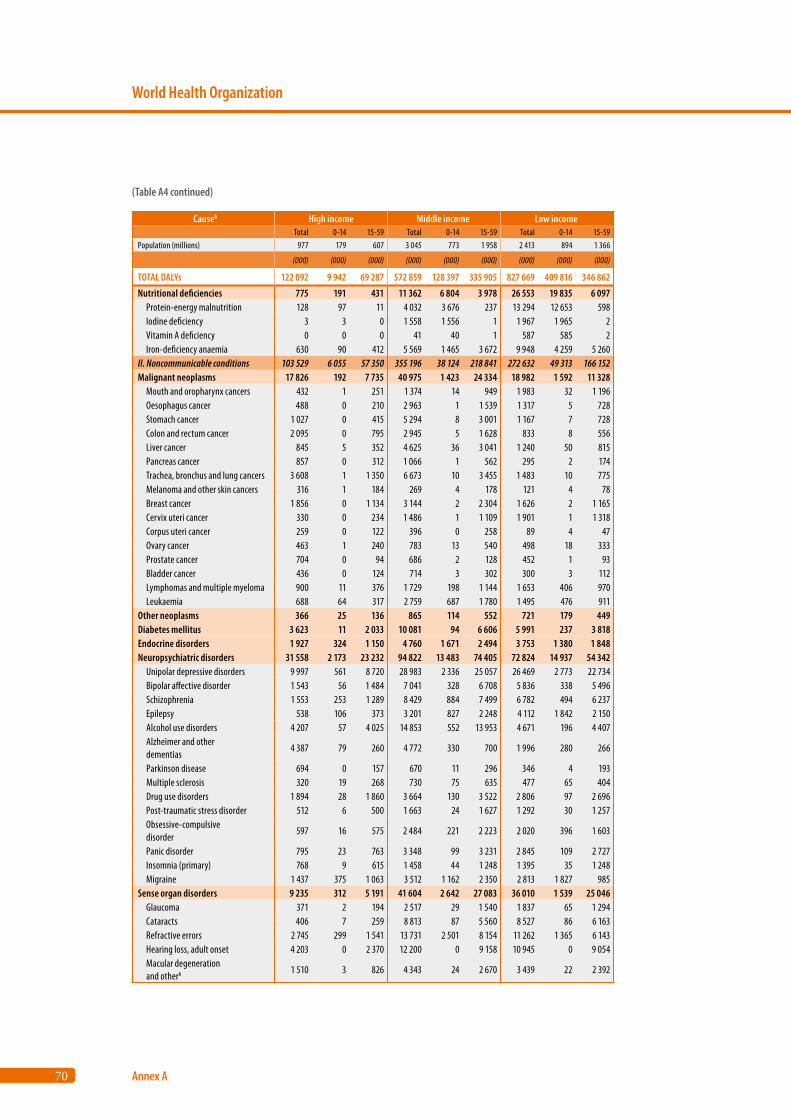
70
World Health Organization
Annex A
Causeb High income Middle income Low income Total 0-14 15-59 Total 0-14 15-59 Total 0-14 15-59
Population (millions) 977 179 607 3 045 773 1 958 2 413 894 1 366
(000) (000) (000) (000) (000) (000) (000) (000) (000)
TOTAL DALYs 122 092 9 942 69 287 572 859 128 397 335 905 827 669 409 816 346 862
Nutritional deficiencies 775 191 431 11 362 6 804 3 978 26 553 19 835 6 097 Protein-energy malnutrition 128 97 11 4 032 3 676 237 13 294 12 653 598 Iodine deficiency 3 3 0 1 558 1 556 1 1 967 1 965 2 Vitamin A deficiency 0 0 0 41 40 1 587 585 2 Iron-deficiency anaemia 630 90 412 5 569 1 465 3 672 9 948 4 259 5 260II. Noncommunicable conditions 103 529 6 055 57 350 355 196 38 124 218 841 272 632 49 313 166 152Malignant neoplasms 17 826 192 7 735 40 975 1 423 24 334 18 982 1 592 11 328 Mouth and oropharynx cancers 432 1 251 1 374 14 949 1 983 32 1 196 Oesophagus cancer 488 0 210 2 963 1 1 539 1 317 5 728 Stomach cancer 1 027 0 415 5 294 8 3 001 1 167 7 728 Colon and rectum cancer 2 095 0 795 2 945 5 1 628 833 8 556 Liver cancer 845 5 352 4 625 36 3 041 1 240 50 815 Pancreas cancer 857 0 312 1 066 1 562 295 2 174 Trachea, bronchus and lung cancers 3 608 1 1 350 6 673 10 3 455 1 483 10 775 Melanoma and other skin cancers 316 1 184 269 4 178 121 4 78 Breast cancer 1 856 0 1 134 3 144 2 2 304 1 626 2 1 165 Cervix uteri cancer 330 0 234 1 486 1 1 109 1 901 1 1 318 Corpus uteri cancer 259 0 122 396 0 258 89 4 47 Ovary cancer 463 1 240 783 13 540 498 18 333 Prostate cancer 704 0 94 686 2 128 452 1 93 Bladder cancer 436 0 124 714 3 302 300 3 112 Lymphomas and multiple myeloma 900 11 376 1 729 198 1 144 1 653 406 970 Leukaemia 688 64 317 2 759 687 1 780 1 495 476 911Other neoplasms 366 25 136 865 114 552 721 179 449Diabetes mellitus 3 623 11 2 033 10 081 94 6 606 5 991 237 3 818Endocrine disorders 1 927 324 1 150 4 760 1 671 2 494 3 753 1 380 1 848Neuropsychiatric disorders 31 558 2 173 23 232 94 822 13 483 74 405 72 824 14 937 54 342 Unipolar depressive disorders 9 997 561 8 720 28 983 2 336 25 057 26 469 2 773 22 734 Bipolar affective disorder 1 543 56 1 484 7 041 328 6 708 5 836 338 5 496 Schizophrenia 1 553 253 1 289 8 429 884 7 499 6 782 494 6 237 Epilepsy 538 106 373 3 201 827 2 248 4 112 1 842 2 150 Alcohol use disorders 4 207 57 4 025 14 853 552 13 953 4 671 196 4 407 Alzheimer and other dementias
4 387 79 260 4 772 330 700 1 996 280 266
Parkinson disease 694 0 157 670 11 296 346 4 193 Multiple sclerosis 320 19 268 730 75 635 477 65 404 Drug use disorders 1 894 28 1 860 3 664 130 3 522 2 806 97 2 696 Post-traumatic stress disorder 512 6 500 1 663 24 1 627 1 292 30 1 257 Obsessive-compulsive disorder
597 16 575 2 484 221 2 223 2 020 396 1 603
Panic disorder 795 23 763 3 348 99 3 231 2 845 109 2 727 Insomnia (primary) 768 9 615 1 458 44 1 248 1 395 35 1 248 Migraine 1 437 375 1 063 3 512 1 162 2 350 2 813 1 827 985Sense organ disorders 9 235 312 5 191 41 604 2 642 27 083 36 010 1 539 25 046 Glaucoma 371 2 194 2 517 29 1 540 1 837 65 1 294 Cataracts 406 7 259 8 813 87 5 560 8 527 86 6 163 Refractive errors 2 745 299 1 541 13 731 2 501 8 154 11 262 1 365 6 143 Hearing loss, adult onset 4 203 0 2 370 12 200 0 9 158 10 945 0 9 054 Macular degeneration and otherh 1 510 3 826 4 343 24 2 670 3 439 22 2 392
(Table A4 continued)
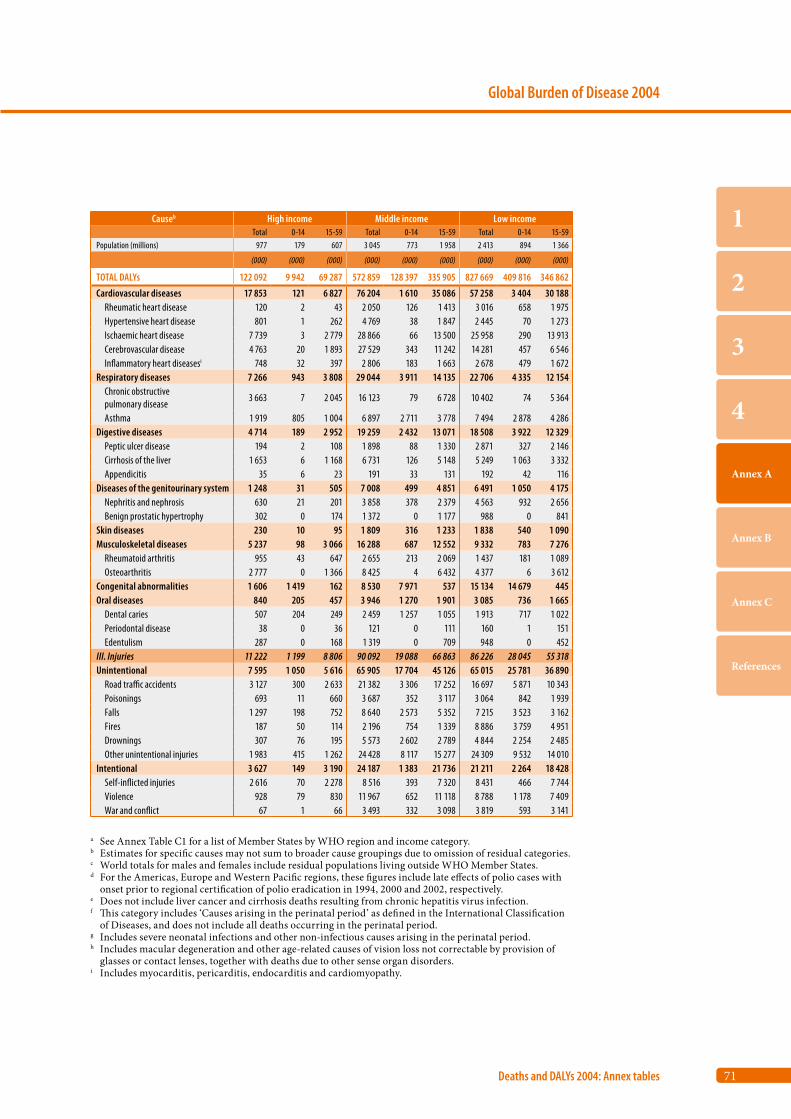
71
Global Burden of Disease 2004
Deaths and DALYs 2004: Annex tables
1
2
3
4
Annex A
Annex B
Annex C
References
Causeb High income Middle income Low income Total 0-14 15-59 Total 0-14 15-59 Total 0-14 15-59
Population (millions) 977 179 607 3 045 773 1 958 2 413 894 1 366
(000) (000) (000) (000) (000) (000) (000) (000) (000)
TOTAL DALYs 122 092 9 942 69 287 572 859 128 397 335 905 827 669 409 816 346 862
Cardiovascular diseases 17 853 121 6 827 76 204 1 610 35 086 57 258 3 404 30 188 Rheumatic heart disease 120 2 43 2 050 126 1 413 3 016 658 1 975 Hypertensive heart disease 801 1 262 4 769 38 1 847 2 445 70 1 273 Ischaemic heart disease 7 739 3 2 779 28 866 66 13 500 25 958 290 13 913 Cerebrovascular disease 4 763 20 1 893 27 529 343 11 242 14 281 457 6 546 Inflammatory heart diseasesi 748 32 397 2 806 183 1 663 2 678 479 1 672Respiratory diseases 7 266 943 3 808 29 044 3 911 14 135 22 706 4 335 12 154 Chronic obstructive pulmonary disease
3 663 7 2 045 16 123 79 6 728 10 402 74 5 364
Asthma 1 919 805 1 004 6 897 2 711 3 778 7 494 2 878 4 286Digestive diseases 4 714 189 2 952 19 259 2 432 13 071 18 508 3 922 12 329 Peptic ulcer disease 194 2 108 1 898 88 1 330 2 871 327 2 146 Cirrhosis of the liver 1 653 6 1 168 6 731 126 5 148 5 249 1 063 3 332 Appendicitis 35 6 23 191 33 131 192 42 116Diseases of the genitourinary system 1 248 31 505 7 008 499 4 851 6 491 1 050 4 175 Nephritis and nephrosis 630 21 201 3 858 378 2 379 4 563 932 2 656 Benign prostatic hypertrophy 302 0 174 1 372 0 1 177 988 0 841Skin diseases 230 10 95 1 809 316 1 233 1 838 540 1 090Musculoskeletal diseases 5 237 98 3 066 16 288 687 12 552 9 332 783 7 276 Rheumatoid arthritis 955 43 647 2 655 213 2 069 1 437 181 1 089 Osteoarthritis 2 777 0 1 366 8 425 4 6 432 4 377 6 3 612Congenital abnormalities 1 606 1 419 162 8 530 7 971 537 15 134 14 679 445Oral diseases 840 205 457 3 946 1 270 1 901 3 085 736 1 665 Dental caries 507 204 249 2 459 1 257 1 055 1 913 717 1 022 Periodontal disease 38 0 36 121 0 111 160 1 151 Edentulism 287 0 168 1 319 0 709 948 0 452III. Injuries 11 222 1 199 8 806 90 092 19 088 66 863 86 226 28 045 55 318Unintentional 7 595 1 050 5 616 65 905 17 704 45 126 65 015 25 781 36 890 Road traffic accidents 3 127 300 2 633 21 382 3 306 17 252 16 697 5 871 10 343 Poisonings 693 11 660 3 687 352 3 117 3 064 842 1 939 Falls 1 297 198 752 8 640 2 573 5 352 7 215 3 523 3 162 Fires 187 50 114 2 196 754 1 339 8 886 3 759 4 951 Drownings 307 76 195 5 573 2 602 2 789 4 844 2 254 2 485 Other unintentional injuries 1 983 415 1 262 24 428 8 117 15 277 24 309 9 532 14 010Intentional 3 627 149 3 190 24 187 1 383 21 736 21 211 2 264 18 428 Self-inflicted injuries 2 616 70 2 278 8 516 393 7 320 8 431 466 7 744 Violence 928 79 830 11 967 652 11 118 8 788 1 178 7 409 War and conflict 67 1 66 3 493 332 3 098 3 819 593 3 141
a See Annex Table C1 for a list of Member States by WHO region and income category.b Estimates for specific causes may not sum to broader cause groupings due to omission of residual categories.c World totals for males and females include residual populations living outside WHO Member States.d For the Americas, Europe and Western Pacific regions, these figures include late effects of polio cases with
onset prior to regional certification of polio eradication in 1994, 2000 and 2002, respectively. e Does not include liver cancer and cirrhosis deaths resulting from chronic hepatitis virus infection.f This category includes ‘Causes arising in the perinatal period’ as defined in the International Classification
of Diseases, and does not include all deaths occurring in the perinatal period.g Includes severe neonatal infections and other non-infectious causes arising in the perinatal period.h Includes macular degeneration and other age-related causes of vision loss not correctable by provision of
glasses or contact lenses, together with deaths due to other sense organ disorders.i Includes myocarditis, pericarditis, endocarditis and cardiomyopathy.
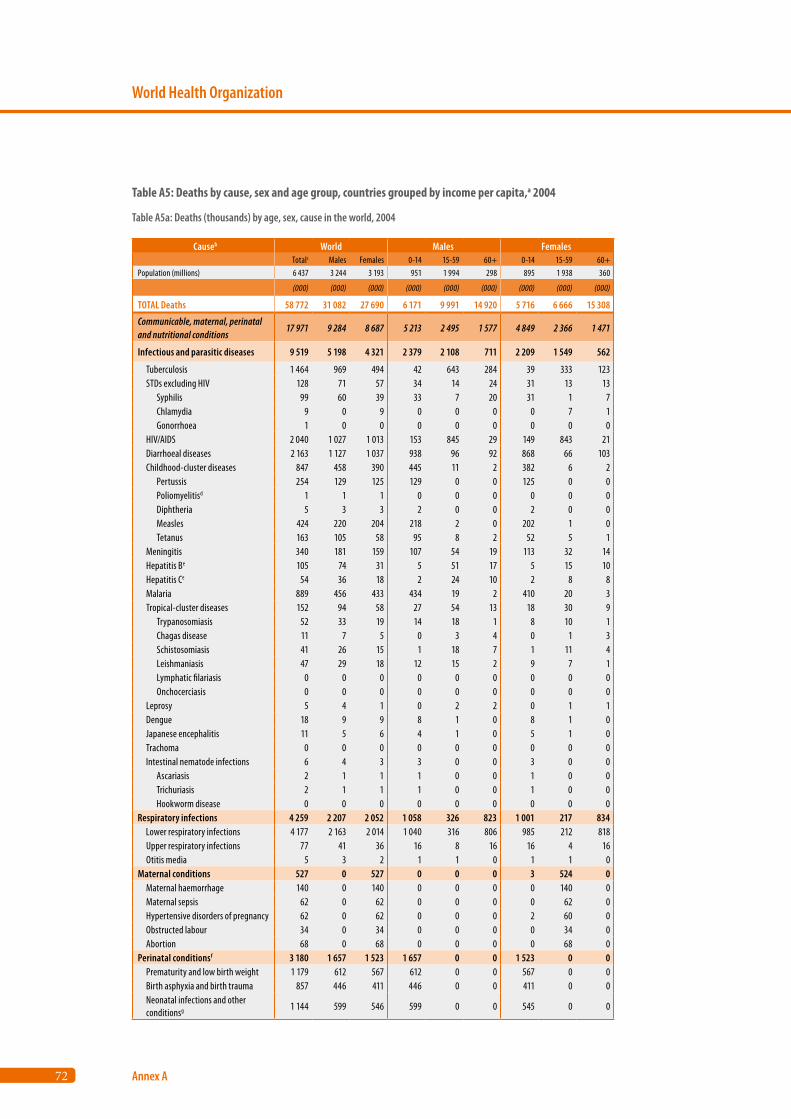
72
World Health Organization
Annex A
Causeb World Males Females Totalc Males Females 0-14 15-59 60+ 0-14 15-59 60+
Population (millions) 6 437 3 244 3 193 951 1 994 298 895 1 938 360
(000) (000) (000) (000) (000) (000) (000) (000) (000)
TOTAL Deaths 58 772 31 082 27 690 6 171 9 991 14 920 5 716 6 666 15 308
Communicable, maternal, perinatal and nutritional conditions
17 971 9 284 8 687 5 213 2 495 1 577 4 849 2 366 1 471
Infectious and parasitic diseases 9 519 5 198 4 321 2 379 2 108 711 2 209 1 549 562
Tuberculosis 1 464 969 494 42 643 284 39 333 123 STDs excluding HIV 128 71 57 34 14 24 31 13 13 Syphilis 99 60 39 33 7 20 31 1 7 Chlamydia 9 0 9 0 0 0 0 7 1 Gonorrhoea 1 0 0 0 0 0 0 0 0 HIV/AIDS 2 040 1 027 1 013 153 845 29 149 843 21 Diarrhoeal diseases 2 163 1 127 1 037 938 96 92 868 66 103 Childhood-cluster diseases 847 458 390 445 11 2 382 6 2 Pertussis 254 129 125 129 0 0 125 0 0 Poliomyelitisd 1 1 1 0 0 0 0 0 0 Diphtheria 5 3 3 2 0 0 2 0 0 Measles 424 220 204 218 2 0 202 1 0 Tetanus 163 105 58 95 8 2 52 5 1 Meningitis 340 181 159 107 54 19 113 32 14 Hepatitis Be 105 74 31 5 51 17 5 15 10 Hepatitis Ce 54 36 18 2 24 10 2 8 8 Malaria 889 456 433 434 19 2 410 20 3 Tropical-cluster diseases 152 94 58 27 54 13 18 30 9 Trypanosomiasis 52 33 19 14 18 1 8 10 1 Chagas disease 11 7 5 0 3 4 0 1 3 Schistosomiasis 41 26 15 1 18 7 1 11 4 Leishmaniasis 47 29 18 12 15 2 9 7 1 Lymphatic filariasis 0 0 0 0 0 0 0 0 0 Onchocerciasis 0 0 0 0 0 0 0 0 0 Leprosy 5 4 1 0 2 2 0 1 1 Dengue 18 9 9 8 1 0 8 1 0 Japanese encephalitis 11 5 6 4 1 0 5 1 0 Trachoma 0 0 0 0 0 0 0 0 0 Intestinal nematode infections 6 4 3 3 0 0 3 0 0 Ascariasis 2 1 1 1 0 0 1 0 0 Trichuriasis 2 1 1 1 0 0 1 0 0 Hookworm disease 0 0 0 0 0 0 0 0 0Respiratory infections 4 259 2 207 2 052 1 058 326 823 1 001 217 834 Lower respiratory infections 4 177 2 163 2 014 1 040 316 806 985 212 818 Upper respiratory infections 77 41 36 16 8 16 16 4 16 Otitis media 5 3 2 1 1 0 1 1 0Maternal conditions 527 0 527 0 0 0 3 524 0 Maternal haemorrhage 140 0 140 0 0 0 0 140 0 Maternal sepsis 62 0 62 0 0 0 0 62 0 Hypertensive disorders of pregnancy 62 0 62 0 0 0 2 60 0 Obstructed labour 34 0 34 0 0 0 0 34 0 Abortion 68 0 68 0 0 0 0 68 0Perinatal conditionsf 3 180 1 657 1 523 1 657 0 0 1 523 0 0 Prematurity and low birth weight 1 179 612 567 612 0 0 567 0 0 Birth asphyxia and birth trauma 857 446 411 446 0 0 411 0 0 Neonatal infections and other conditionsg 1 144 599 546 599 0 0 545 0 0
Table A5: Deaths by cause, sex and age group, countries grouped by income per capita,a 2004
Table A5a: Deaths (thousands) by age, sex, cause in the world, 2004
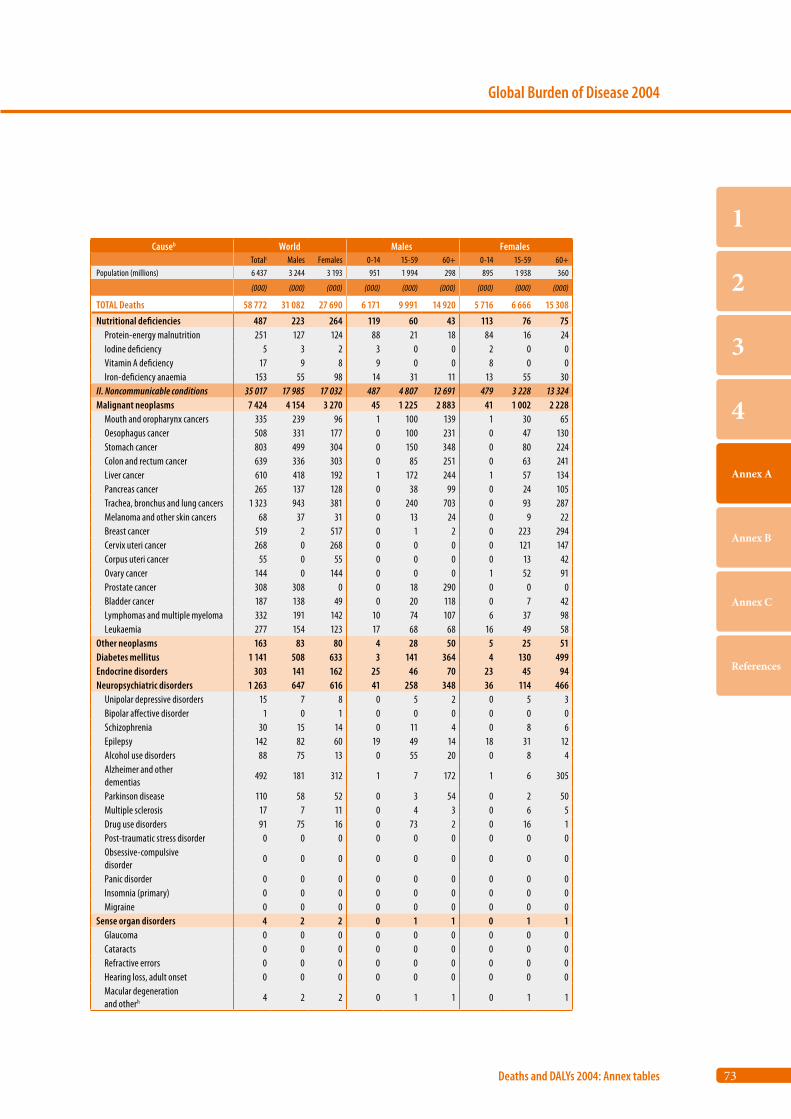
73
Global Burden of Disease 2004
Deaths and DALYs 2004: Annex tables
1
2
3
4
Annex A
Annex B
Annex C
References
Causeb World Males Females Totalc Males Females 0-14 15-59 60+ 0-14 15-59 60+
Population (millions) 6 437 3 244 3 193 951 1 994 298 895 1 938 360
(000) (000) (000) (000) (000) (000) (000) (000) (000)
TOTAL Deaths 58 772 31 082 27 690 6 171 9 991 14 920 5 716 6 666 15 308
Nutritional deficiencies 487 223 264 119 60 43 113 76 75 Protein-energy malnutrition 251 127 124 88 21 18 84 16 24 Iodine deficiency 5 3 2 3 0 0 2 0 0 Vitamin A deficiency 17 9 8 9 0 0 8 0 0 Iron-deficiency anaemia 153 55 98 14 31 11 13 55 30II. Noncommunicable conditions 35 017 17 985 17 032 487 4 807 12 691 479 3 228 13 324Malignant neoplasms 7 424 4 154 3 270 45 1 225 2 883 41 1 002 2 228 Mouth and oropharynx cancers 335 239 96 1 100 139 1 30 65 Oesophagus cancer 508 331 177 0 100 231 0 47 130 Stomach cancer 803 499 304 0 150 348 0 80 224 Colon and rectum cancer 639 336 303 0 85 251 0 63 241 Liver cancer 610 418 192 1 172 244 1 57 134 Pancreas cancer 265 137 128 0 38 99 0 24 105 Trachea, bronchus and lung cancers 1 323 943 381 0 240 703 0 93 287 Melanoma and other skin cancers 68 37 31 0 13 24 0 9 22 Breast cancer 519 2 517 0 1 2 0 223 294 Cervix uteri cancer 268 0 268 0 0 0 0 121 147 Corpus uteri cancer 55 0 55 0 0 0 0 13 42 Ovary cancer 144 0 144 0 0 0 1 52 91 Prostate cancer 308 308 0 0 18 290 0 0 0 Bladder cancer 187 138 49 0 20 118 0 7 42 Lymphomas and multiple myeloma 332 191 142 10 74 107 6 37 98 Leukaemia 277 154 123 17 68 68 16 49 58Other neoplasms 163 83 80 4 28 50 5 25 51Diabetes mellitus 1 141 508 633 3 141 364 4 130 499Endocrine disorders 303 141 162 25 46 70 23 45 94Neuropsychiatric disorders 1 263 647 616 41 258 348 36 114 466 Unipolar depressive disorders 15 7 8 0 5 2 0 5 3 Bipolar affective disorder 1 0 1 0 0 0 0 0 0 Schizophrenia 30 15 14 0 11 4 0 8 6 Epilepsy 142 82 60 19 49 14 18 31 12 Alcohol use disorders 88 75 13 0 55 20 0 8 4 Alzheimer and other dementias
492 181 312 1 7 172 1 6 305
Parkinson disease 110 58 52 0 3 54 0 2 50 Multiple sclerosis 17 7 11 0 4 3 0 6 5 Drug use disorders 91 75 16 0 73 2 0 16 1 Post-traumatic stress disorder 0 0 0 0 0 0 0 0 0 Obsessive-compulsive disorder
0 0 0 0 0 0 0 0 0
Panic disorder 0 0 0 0 0 0 0 0 0 Insomnia (primary) 0 0 0 0 0 0 0 0 0 Migraine 0 0 0 0 0 0 0 0 0Sense organ disorders 4 2 2 0 1 1 0 1 1 Glaucoma 0 0 0 0 0 0 0 0 0 Cataracts 0 0 0 0 0 0 0 0 0 Refractive errors 0 0 0 0 0 0 0 0 0 Hearing loss, adult onset 0 0 0 0 0 0 0 0 0 Macular degeneration and otherh 4 2 2 0 1 1 0 1 1
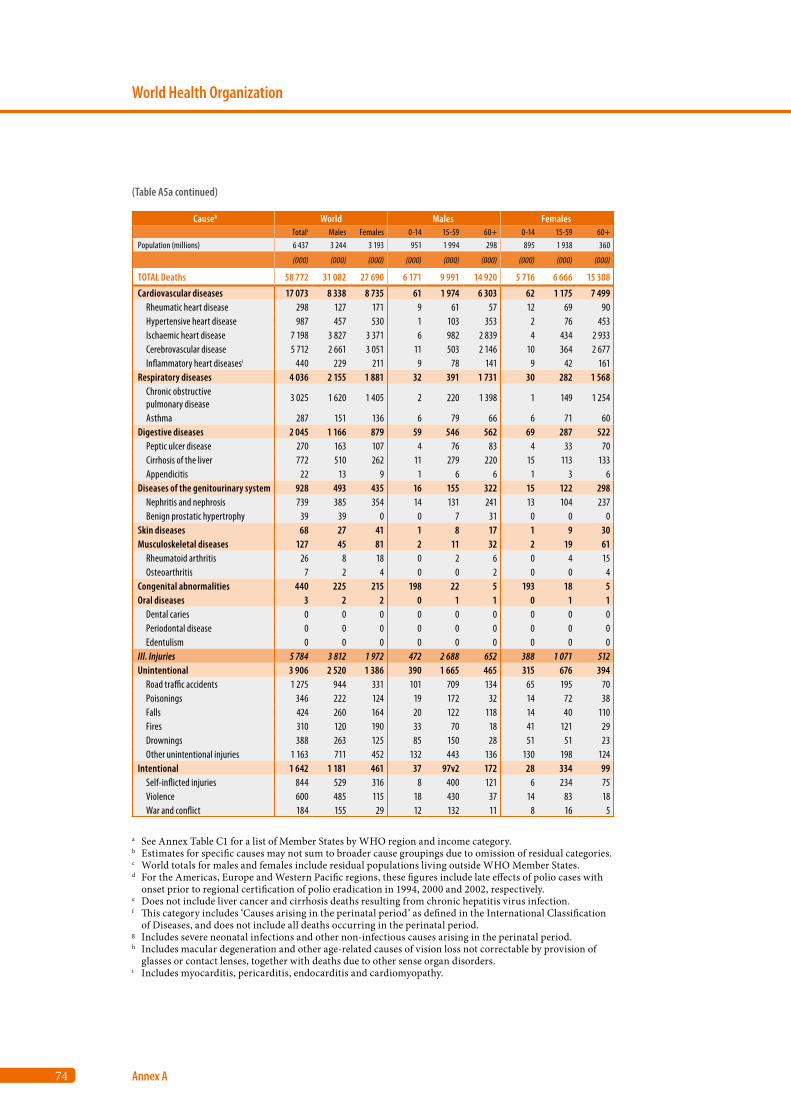
74
World Health Organization
Annex A
Causeb World Males Females Totalc Males Females 0-14 15-59 60+ 0-14 15-59 60+
Population (millions) 6 437 3 244 3 193 951 1 994 298 895 1 938 360
(000) (000) (000) (000) (000) (000) (000) (000) (000)
TOTAL Deaths 58 772 31 082 27 690 6 171 9 991 14 920 5 716 6 666 15 308
Cardiovascular diseases 17 073 8 338 8 735 61 1 974 6 303 62 1 175 7 499 Rheumatic heart disease 298 127 171 9 61 57 12 69 90 Hypertensive heart disease 987 457 530 1 103 353 2 76 453 Ischaemic heart disease 7 198 3 827 3 371 6 982 2 839 4 434 2 933 Cerebrovascular disease 5 712 2 661 3 051 11 503 2 146 10 364 2 677 Inflammatory heart diseasesi 440 229 211 9 78 141 9 42 161Respiratory diseases 4 036 2 155 1 881 32 391 1 731 30 282 1 568 Chronic obstructive pulmonary disease
3 025 1 620 1 405 2 220 1 398 1 149 1 254
Asthma 287 151 136 6 79 66 6 71 60Digestive diseases 2 045 1 166 879 59 546 562 69 287 522 Peptic ulcer disease 270 163 107 4 76 83 4 33 70 Cirrhosis of the liver 772 510 262 11 279 220 15 113 133 Appendicitis 22 13 9 1 6 6 1 3 6Diseases of the genitourinary system 928 493 435 16 155 322 15 122 298 Nephritis and nephrosis 739 385 354 14 131 241 13 104 237 Benign prostatic hypertrophy 39 39 0 0 7 31 0 0 0Skin diseases 68 27 41 1 8 17 1 9 30Musculoskeletal diseases 127 45 81 2 11 32 2 19 61 Rheumatoid arthritis 26 8 18 0 2 6 0 4 15 Osteoarthritis 7 2 4 0 0 2 0 0 4Congenital abnormalities 440 225 215 198 22 5 193 18 5Oral diseases 3 2 2 0 1 1 0 1 1 Dental caries 0 0 0 0 0 0 0 0 0 Periodontal disease 0 0 0 0 0 0 0 0 0 Edentulism 0 0 0 0 0 0 0 0 0III. Injuries 5 784 3 812 1 972 472 2 688 652 388 1 071 512Unintentional 3 906 2 520 1 386 390 1 665 465 315 676 394 Road traffic accidents 1 275 944 331 101 709 134 65 195 70 Poisonings 346 222 124 19 172 32 14 72 38 Falls 424 260 164 20 122 118 14 40 110 Fires 310 120 190 33 70 18 41 121 29 Drownings 388 263 125 85 150 28 51 51 23 Other unintentional injuries 1 163 711 452 132 443 136 130 198 124Intentional 1 642 1 181 461 37 97v2 172 28 334 99 Self-inflicted injuries 844 529 316 8 400 121 6 234 75 Violence 600 485 115 18 430 37 14 83 18 War and conflict 184 155 29 12 132 11 8 16 5
a See Annex Table C1 for a list of Member States by WHO region and income category.b Estimates for specific causes may not sum to broader cause groupings due to omission of residual categories.c World totals for males and females include residual populations living outside WHO Member States.d For the Americas, Europe and Western Pacific regions, these figures include late effects of polio cases with
onset prior to regional certification of polio eradication in 1994, 2000 and 2002, respectively. e Does not include liver cancer and cirrhosis deaths resulting from chronic hepatitis virus infection.f This category includes ‘Causes arising in the perinatal period’ as defined in the International Classification
of Diseases, and does not include all deaths occurring in the perinatal period.g Includes severe neonatal infections and other non-infectious causes arising in the perinatal period.h Includes macular degeneration and other age-related causes of vision loss not correctable by provision of
glasses or contact lenses, together with deaths due to other sense organ disorders.i Includes myocarditis, pericarditis, endocarditis and cardiomyopathy.
(Table A5a continued)

75
Global Burden of Disease 2004
Deaths and DALYs 2004: Annex tables
1
2
3
4
Annex A
Annex B
Annex C
References
Causeb High-income countries Males Females Totalc Males Females 0-14 15-59 60+ 0-14 15-59 60+
Population (millions) 977 482 495 92 308 83 87 300 108
(000) (000) (000) (000) (000) (000) (000) (000) (000)
TOTAL Deaths 8 144 4 106 4 038 57 820 3 229 45 425 3 568
Communicable, maternal, perinatal and nutritional conditions
540 263 277 26 42 195 21 22 234
Infectious and parasitic diseases 171 89 81 3 32 54 3 15 63
Tuberculosis 15 10 6 0 2 7 0 1 4 STDs excluding HIV 1 0 0 0 0 0 0 0 0 Syphilis 0 0 0 0 0 0 0 0 0 Chlamydia 0 0 0 0 0 0 0 0 0 Gonorrhoea 0 0 0 0 0 0 0 0 0 HIV/AIDS 21 16 5 0 14 1 0 5 0 Diarrhoeal diseases 14 5 9 1 0 4 1 0 7 Childhood-cluster diseases 1 0 0 0 0 0 0 0 0 Pertussis 0 0 0 0 0 0 0 0 0 Poliomyelitisd 1 0 0 0 0 0 0 0 0 Diphtheria 0 0 0 0 0 0 0 0 0 Measles 0 0 0 0 0 0 0 0 0 Tetanus 0 0 0 0 0 0 0 0 0 Meningitis 3 2 2 0 1 1 0 0 1 Hepatitis Be 7 4 3 0 2 2 0 1 2 Hepatitis Ce 13 7 6 0 4 4 0 1 4 Malaria 0 0 0 0 0 0 0 0 0 Tropical-cluster diseases 0 0 0 0 0 0 0 0 0 Trypanosomiasis 0 0 0 0 0 0 0 0 0 Chagas disease 0 0 0 0 0 0 0 0 0 Schistosomiasis 0 0 0 0 0 0 0 0 0 Leishmaniasis 0 0 0 0 0 0 0 0 0 Lymphatic filariasis 0 0 0 0 0 0 0 0 0 Onchocerciasis 0 0 0 0 0 0 0 0 0 Leprosy 0 0 0 0 0 0 0 0 0 Dengue 0 0 0 0 0 0 0 0 0 Japanese encephalitis 0 0 0 0 0 0 0 0 0 Trachoma 0 0 0 0 0 0 0 0 0 Intestinal nematode infections 0 0 0 0 0 0 0 0 0 Ascariasis 0 0 0 0 0 0 0 0 0 Trichuriasis 0 0 0 0 0 0 0 0 0 Hookworm disease 0 0 0 0 0 0 0 0 0Respiratory infections 311 145 166 2 9 135 2 5 159 Lower respiratory infections 307 143 164 2 9 133 2 5 157 Upper respiratory infections 4 2 2 0 0 2 0 0 2 Otitis media 0 0 0 0 0 0 0 0 0Maternal conditions 2 0 2 0 0 0 0 2 0 Maternal haemorrhage 0 0 0 0 0 0 0 0 0 Maternal sepsis 0 0 0 0 0 0 0 0 0 Hypertensive disorders of pregnancy 0 0 0 0 0 0 0 0 0 Obstructed labour 0 0 0 0 0 0 0 0 0 Abortion 0 0 0 0 0 0 0 0 0Perinatal conditionsf 37 21 16 21 0 0 16 0 0 Prematurity and low birth weight 16 9 7 9 0 0 7 0 0 Birth asphyxia and birth trauma 7 4 3 4 0 0 3 0 0 Neonatal infections and other conditionsg 14 8 6 8 0 0 6 0 0
Table A5b: Deaths (thousands) by age, sex, cause in high-income countries, 2004
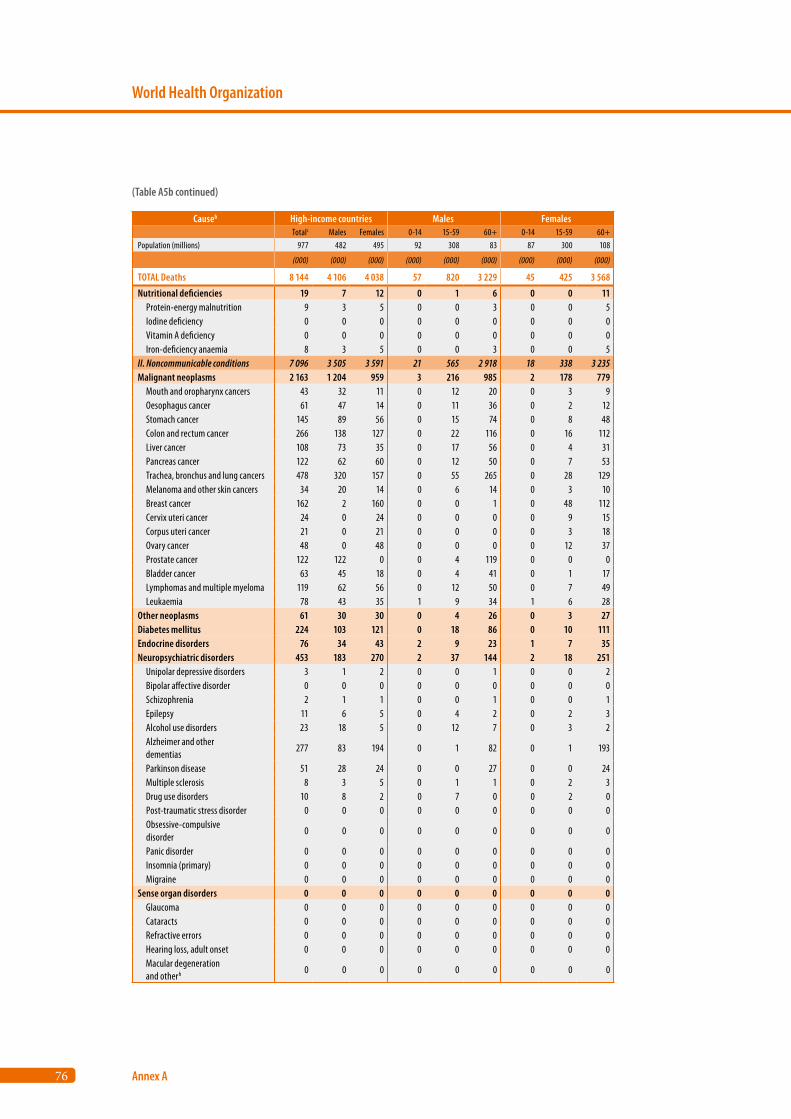
76
World Health Organization
Annex A
Causeb High-income countries Males Females Totalc Males Females 0-14 15-59 60+ 0-14 15-59 60+
Population (millions) 977 482 495 92 308 83 87 300 108
(000) (000) (000) (000) (000) (000) (000) (000) (000)
TOTAL Deaths 8 144 4 106 4 038 57 820 3 229 45 425 3 568
Nutritional deficiencies 19 7 12 0 1 6 0 0 11 Protein-energy malnutrition 9 3 5 0 0 3 0 0 5 Iodine deficiency 0 0 0 0 0 0 0 0 0 Vitamin A deficiency 0 0 0 0 0 0 0 0 0 Iron-deficiency anaemia 8 3 5 0 0 3 0 0 5II. Noncommunicable conditions 7 096 3 505 3 591 21 565 2 918 18 338 3 235Malignant neoplasms 2 163 1 204 959 3 216 985 2 178 779 Mouth and oropharynx cancers 43 32 11 0 12 20 0 3 9 Oesophagus cancer 61 47 14 0 11 36 0 2 12 Stomach cancer 145 89 56 0 15 74 0 8 48 Colon and rectum cancer 266 138 127 0 22 116 0 16 112 Liver cancer 108 73 35 0 17 56 0 4 31 Pancreas cancer 122 62 60 0 12 50 0 7 53 Trachea, bronchus and lung cancers 478 320 157 0 55 265 0 28 129 Melanoma and other skin cancers 34 20 14 0 6 14 0 3 10 Breast cancer 162 2 160 0 0 1 0 48 112 Cervix uteri cancer 24 0 24 0 0 0 0 9 15 Corpus uteri cancer 21 0 21 0 0 0 0 3 18 Ovary cancer 48 0 48 0 0 0 0 12 37 Prostate cancer 122 122 0 0 4 119 0 0 0 Bladder cancer 63 45 18 0 4 41 0 1 17 Lymphomas and multiple myeloma 119 62 56 0 12 50 0 7 49 Leukaemia 78 43 35 1 9 34 1 6 28Other neoplasms 61 30 30 0 4 26 0 3 27Diabetes mellitus 224 103 121 0 18 86 0 10 111Endocrine disorders 76 34 43 2 9 23 1 7 35Neuropsychiatric disorders 453 183 270 2 37 144 2 18 251 Unipolar depressive disorders 3 1 2 0 0 1 0 0 2 Bipolar affective disorder 0 0 0 0 0 0 0 0 0 Schizophrenia 2 1 1 0 0 1 0 0 1 Epilepsy 11 6 5 0 4 2 0 2 3 Alcohol use disorders 23 18 5 0 12 7 0 3 2 Alzheimer and other dementias
277 83 194 0 1 82 0 1 193
Parkinson disease 51 28 24 0 0 27 0 0 24 Multiple sclerosis 8 3 5 0 1 1 0 2 3 Drug use disorders 10 8 2 0 7 0 0 2 0 Post-traumatic stress disorder 0 0 0 0 0 0 0 0 0 Obsessive-compulsive disorder
0 0 0 0 0 0 0 0 0
Panic disorder 0 0 0 0 0 0 0 0 0 Insomnia (primary) 0 0 0 0 0 0 0 0 0 Migraine 0 0 0 0 0 0 0 0 0Sense organ disorders 0 0 0 0 0 0 0 0 0 Glaucoma 0 0 0 0 0 0 0 0 0 Cataracts 0 0 0 0 0 0 0 0 0 Refractive errors 0 0 0 0 0 0 0 0 0 Hearing loss, adult onset 0 0 0 0 0 0 0 0 0 Macular degeneration and otherh 0 0 0 0 0 0 0 0 0
(Table A5b continued)
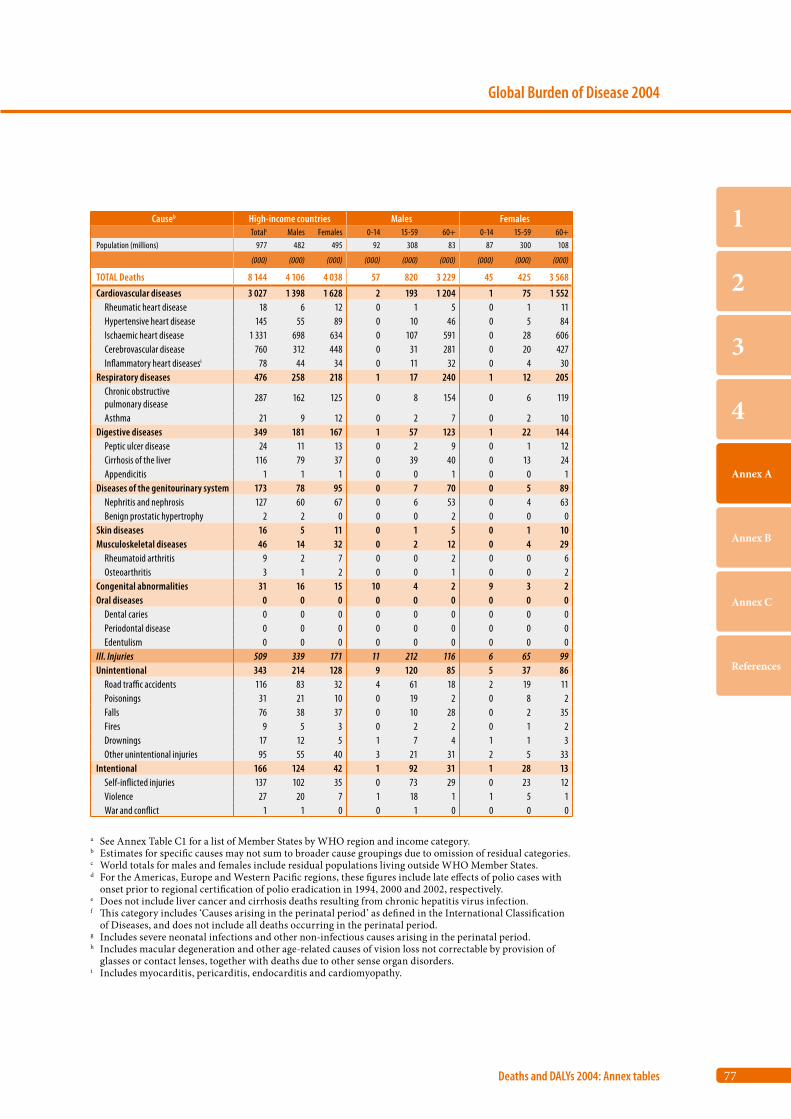
77
Global Burden of Disease 2004
Deaths and DALYs 2004: Annex tables
1
2
3
4
Annex A
Annex B
Annex C
References
Causeb High-income countries Males Females Totalc Males Females 0-14 15-59 60+ 0-14 15-59 60+
Population (millions) 977 482 495 92 308 83 87 300 108
(000) (000) (000) (000) (000) (000) (000) (000) (000)
TOTAL Deaths 8 144 4 106 4 038 57 820 3 229 45 425 3 568
Cardiovascular diseases 3 027 1 398 1 628 2 193 1 204 1 75 1 552 Rheumatic heart disease 18 6 12 0 1 5 0 1 11 Hypertensive heart disease 145 55 89 0 10 46 0 5 84 Ischaemic heart disease 1 331 698 634 0 107 591 0 28 606 Cerebrovascular disease 760 312 448 0 31 281 0 20 427 Inflammatory heart diseasesi 78 44 34 0 11 32 0 4 30Respiratory diseases 476 258 218 1 17 240 1 12 205 Chronic obstructive pulmonary disease
287 162 125 0 8 154 0 6 119
Asthma 21 9 12 0 2 7 0 2 10Digestive diseases 349 181 167 1 57 123 1 22 144 Peptic ulcer disease 24 11 13 0 2 9 0 1 12 Cirrhosis of the liver 116 79 37 0 39 40 0 13 24 Appendicitis 1 1 1 0 0 1 0 0 1Diseases of the genitourinary system 173 78 95 0 7 70 0 5 89 Nephritis and nephrosis 127 60 67 0 6 53 0 4 63 Benign prostatic hypertrophy 2 2 0 0 0 2 0 0 0Skin diseases 16 5 11 0 1 5 0 1 10Musculoskeletal diseases 46 14 32 0 2 12 0 4 29 Rheumatoid arthritis 9 2 7 0 0 2 0 0 6 Osteoarthritis 3 1 2 0 0 1 0 0 2Congenital abnormalities 31 16 15 10 4 2 9 3 2Oral diseases 0 0 0 0 0 0 0 0 0 Dental caries 0 0 0 0 0 0 0 0 0 Periodontal disease 0 0 0 0 0 0 0 0 0 Edentulism 0 0 0 0 0 0 0 0 0III. Injuries 509 339 171 11 212 116 6 65 99Unintentional 343 214 128 9 120 85 5 37 86 Road traffic accidents 116 83 32 4 61 18 2 19 11 Poisonings 31 21 10 0 19 2 0 8 2 Falls 76 38 37 0 10 28 0 2 35 Fires 9 5 3 0 2 2 0 1 2 Drownings 17 12 5 1 7 4 1 1 3 Other unintentional injuries 95 55 40 3 21 31 2 5 33Intentional 166 124 42 1 92 31 1 28 13 Self-inflicted injuries 137 102 35 0 73 29 0 23 12 Violence 27 20 7 1 18 1 1 5 1 War and conflict 1 1 0 0 1 0 0 0 0
a See Annex Table C1 for a list of Member States by WHO region and income category.b Estimates for specific causes may not sum to broader cause groupings due to omission of residual categories.c World totals for males and females include residual populations living outside WHO Member States.d For the Americas, Europe and Western Pacific regions, these figures include late effects of polio cases with
onset prior to regional certification of polio eradication in 1994, 2000 and 2002, respectively. e Does not include liver cancer and cirrhosis deaths resulting from chronic hepatitis virus infection.f This category includes ‘Causes arising in the perinatal period’ as defined in the International Classification
of Diseases, and does not include all deaths occurring in the perinatal period.g Includes severe neonatal infections and other non-infectious causes arising in the perinatal period.h Includes macular degeneration and other age-related causes of vision loss not correctable by provision of
glasses or contact lenses, together with deaths due to other sense organ disorders.i Includes myocarditis, pericarditis, endocarditis and cardiomyopathy.
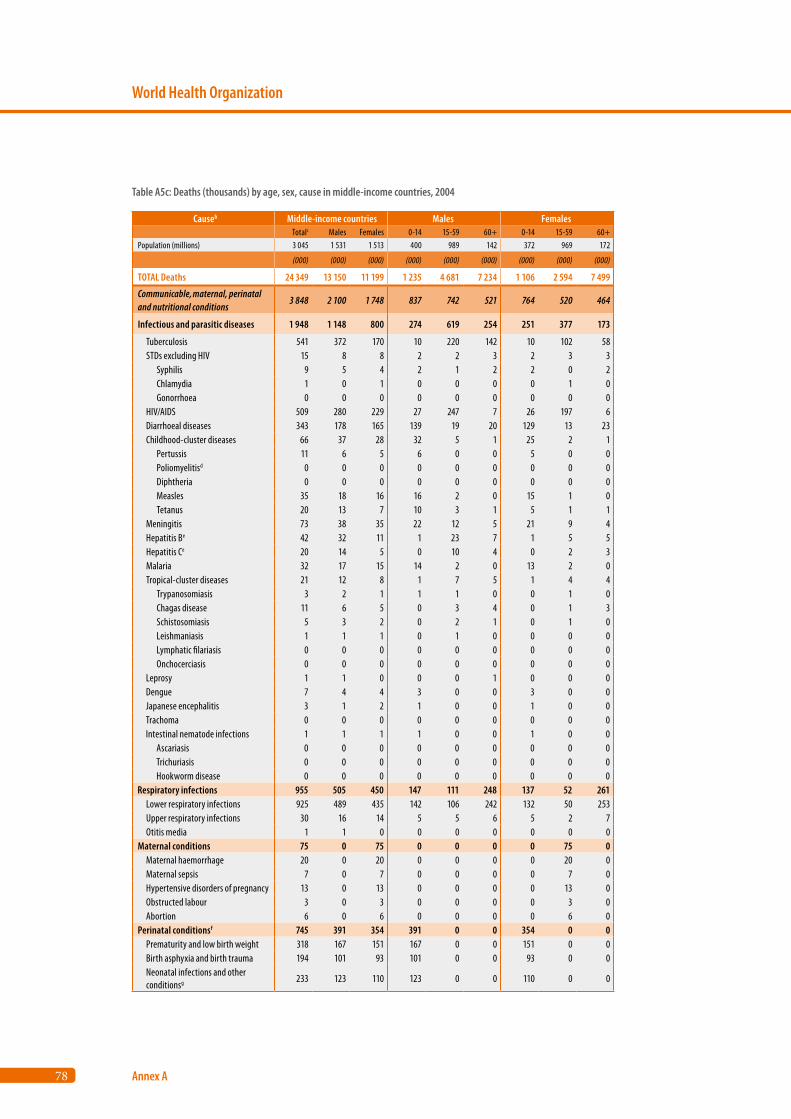
78
World Health Organization
Annex A
Causeb Middle-income countries Males Females Totalc Males Females 0-14 15-59 60+ 0-14 15-59 60+
Population (millions) 3 045 1 531 1 513 400 989 142 372 969 172
(000) (000) (000) (000) (000) (000) (000) (000) (000)
TOTAL Deaths 24 349 13 150 11 199 1 235 4 681 7 234 1 106 2 594 7 499
Communicable, maternal, perinatal and nutritional conditions
3 848 2 100 1 748 837 742 521 764 520 464
Infectious and parasitic diseases 1 948 1 148 800 274 619 254 251 377 173
Tuberculosis 541 372 170 10 220 142 10 102 58 STDs excluding HIV 15 8 8 2 2 3 2 3 3 Syphilis 9 5 4 2 1 2 2 0 2 Chlamydia 1 0 1 0 0 0 0 1 0 Gonorrhoea 0 0 0 0 0 0 0 0 0 HIV/AIDS 509 280 229 27 247 7 26 197 6 Diarrhoeal diseases 343 178 165 139 19 20 129 13 23 Childhood-cluster diseases 66 37 28 32 5 1 25 2 1 Pertussis 11 6 5 6 0 0 5 0 0 Poliomyelitisd 0 0 0 0 0 0 0 0 0 Diphtheria 0 0 0 0 0 0 0 0 0 Measles 35 18 16 16 2 0 15 1 0 Tetanus 20 13 7 10 3 1 5 1 1 Meningitis 73 38 35 22 12 5 21 9 4 Hepatitis Be 42 32 11 1 23 7 1 5 5 Hepatitis Ce 20 14 5 0 10 4 0 2 3 Malaria 32 17 15 14 2 0 13 2 0 Tropical-cluster diseases 21 12 8 1 7 5 1 4 4 Trypanosomiasis 3 2 1 1 1 0 0 1 0 Chagas disease 11 6 5 0 3 4 0 1 3 Schistosomiasis 5 3 2 0 2 1 0 1 0 Leishmaniasis 1 1 1 0 1 0 0 0 0 Lymphatic filariasis 0 0 0 0 0 0 0 0 0 Onchocerciasis 0 0 0 0 0 0 0 0 0 Leprosy 1 1 0 0 0 1 0 0 0 Dengue 7 4 4 3 0 0 3 0 0 Japanese encephalitis 3 1 2 1 0 0 1 0 0 Trachoma 0 0 0 0 0 0 0 0 0 Intestinal nematode infections 1 1 1 1 0 0 1 0 0 Ascariasis 0 0 0 0 0 0 0 0 0 Trichuriasis 0 0 0 0 0 0 0 0 0 Hookworm disease 0 0 0 0 0 0 0 0 0Respiratory infections 955 505 450 147 111 248 137 52 261 Lower respiratory infections 925 489 435 142 106 242 132 50 253 Upper respiratory infections 30 16 14 5 5 6 5 2 7 Otitis media 1 1 0 0 0 0 0 0 0Maternal conditions 75 0 75 0 0 0 0 75 0 Maternal haemorrhage 20 0 20 0 0 0 0 20 0 Maternal sepsis 7 0 7 0 0 0 0 7 0 Hypertensive disorders of pregnancy 13 0 13 0 0 0 0 13 0 Obstructed labour 3 0 3 0 0 0 0 3 0 Abortion 6 0 6 0 0 0 0 6 0Perinatal conditionsf 745 391 354 391 0 0 354 0 0 Prematurity and low birth weight 318 167 151 167 0 0 151 0 0 Birth asphyxia and birth trauma 194 101 93 101 0 0 93 0 0 Neonatal infections and other conditionsg 233 123 110 123 0 0 110 0 0
Table A5c: Deaths (thousands) by age, sex, cause in middle-income countries, 2004
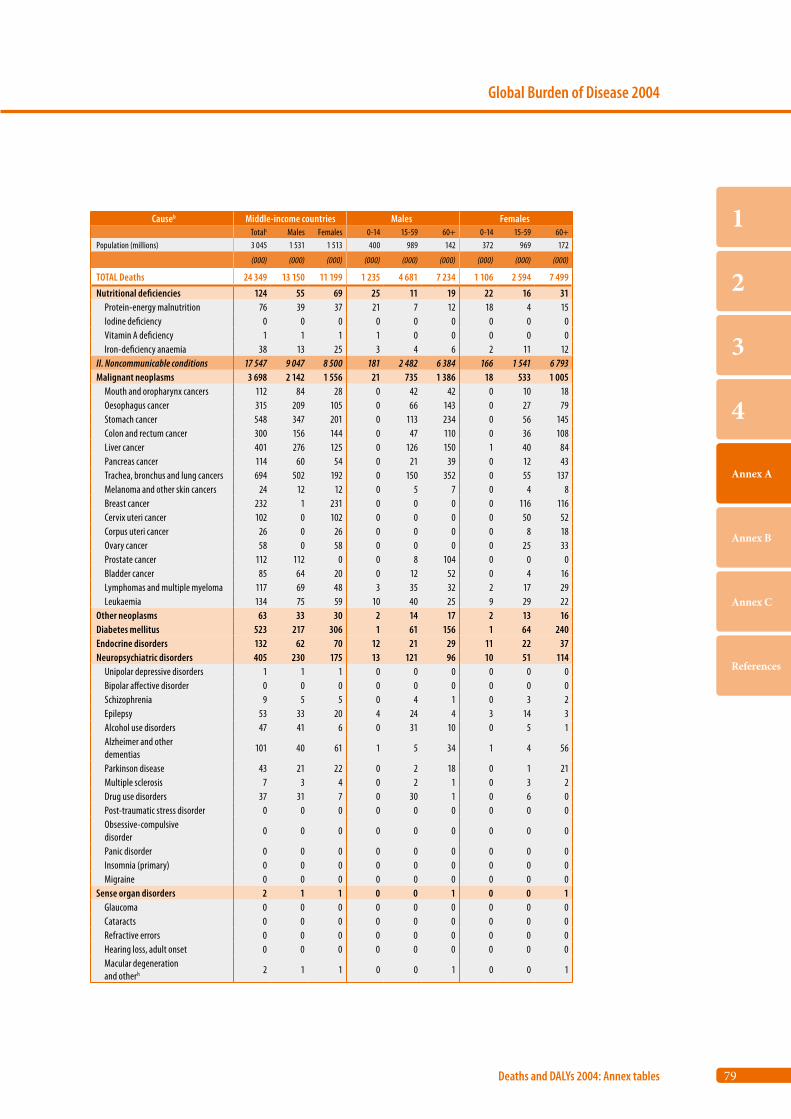
79
Global Burden of Disease 2004
Deaths and DALYs 2004: Annex tables
1
2
3
4
Annex A
Annex B
Annex C
References
Causeb Middle-income countries Males Females Totalc Males Females 0-14 15-59 60+ 0-14 15-59 60+
Population (millions) 3 045 1 531 1 513 400 989 142 372 969 172
(000) (000) (000) (000) (000) (000) (000) (000) (000)
TOTAL Deaths 24 349 13 150 11 199 1 235 4 681 7 234 1 106 2 594 7 499
Nutritional deficiencies 124 55 69 25 11 19 22 16 31 Protein-energy malnutrition 76 39 37 21 7 12 18 4 15 Iodine deficiency 0 0 0 0 0 0 0 0 0 Vitamin A deficiency 1 1 1 1 0 0 0 0 0 Iron-deficiency anaemia 38 13 25 3 4 6 2 11 12II. Noncommunicable conditions 17 547 9 047 8 500 181 2 482 6 384 166 1 541 6 793Malignant neoplasms 3 698 2 142 1 556 21 735 1 386 18 533 1 005 Mouth and oropharynx cancers 112 84 28 0 42 42 0 10 18 Oesophagus cancer 315 209 105 0 66 143 0 27 79 Stomach cancer 548 347 201 0 113 234 0 56 145 Colon and rectum cancer 300 156 144 0 47 110 0 36 108 Liver cancer 401 276 125 0 126 150 1 40 84 Pancreas cancer 114 60 54 0 21 39 0 12 43 Trachea, bronchus and lung cancers 694 502 192 0 150 352 0 55 137 Melanoma and other skin cancers 24 12 12 0 5 7 0 4 8 Breast cancer 232 1 231 0 0 0 0 116 116 Cervix uteri cancer 102 0 102 0 0 0 0 50 52 Corpus uteri cancer 26 0 26 0 0 0 0 8 18 Ovary cancer 58 0 58 0 0 0 0 25 33 Prostate cancer 112 112 0 0 8 104 0 0 0 Bladder cancer 85 64 20 0 12 52 0 4 16 Lymphomas and multiple myeloma 117 69 48 3 35 32 2 17 29 Leukaemia 134 75 59 10 40 25 9 29 22Other neoplasms 63 33 30 2 14 17 2 13 16Diabetes mellitus 523 217 306 1 61 156 1 64 240Endocrine disorders 132 62 70 12 21 29 11 22 37Neuropsychiatric disorders 405 230 175 13 121 96 10 51 114 Unipolar depressive disorders 1 1 1 0 0 0 0 0 0 Bipolar affective disorder 0 0 0 0 0 0 0 0 0 Schizophrenia 9 5 5 0 4 1 0 3 2 Epilepsy 53 33 20 4 24 4 3 14 3 Alcohol use disorders 47 41 6 0 31 10 0 5 1 Alzheimer and other dementias
101 40 61 1 5 34 1 4 56
Parkinson disease 43 21 22 0 2 18 0 1 21 Multiple sclerosis 7 3 4 0 2 1 0 3 2 Drug use disorders 37 31 7 0 30 1 0 6 0 Post-traumatic stress disorder 0 0 0 0 0 0 0 0 0 Obsessive-compulsive disorder
0 0 0 0 0 0 0 0 0
Panic disorder 0 0 0 0 0 0 0 0 0 Insomnia (primary) 0 0 0 0 0 0 0 0 0 Migraine 0 0 0 0 0 0 0 0 0Sense organ disorders 2 1 1 0 0 1 0 0 1 Glaucoma 0 0 0 0 0 0 0 0 0 Cataracts 0 0 0 0 0 0 0 0 0 Refractive errors 0 0 0 0 0 0 0 0 0 Hearing loss, adult onset 0 0 0 0 0 0 0 0 0 Macular degeneration and otherh 2 1 1 0 0 1 0 0 1

80
World Health Organization
Annex A
Causeb Middle-income countries Males Females Totalc Males Females 0-14 15-59 60+ 0-14 15-59 60+
Population (millions) 3 045 1 531 1 513 400 989 142 372 969 172
(000) (000) (000) (000) (000) (000) (000) (000) (000)
TOTAL Deaths 24 349 13 150 11 199 1 235 4 681 7 234 1 106 2 594 7 499
Cardiovascular diseases 8 896 4 303 4 593 20 1 009 3 274 18 556 4 019 Rheumatic heart disease 131 49 81 1 23 24 2 33 47 Hypertensive heart disease 617 299 318 1 60 238 0 40 277 Ischaemic heart disease 3 395 1 738 1 657 1 456 1 281 1 177 1 480 Cerebrovascular disease 3 468 1 629 1 839 5 303 1 322 4 210 1 624 Inflammatory heart diseasesi 233 122 111 3 43 76 2 17 91Respiratory diseases 2 231 1 158 1 073 13 157 989 11 102 960 Chronic obstructive pulmonary disease
1 798 925 873 1 82 842 1 53 819
Asthma 120 66 54 2 30 33 2 25 27Digestive diseases 965 580 385 27 275 278 26 117 241 Peptic ulcer disease 119 72 47 1 28 43 1 12 34 Cirrhosis of the liver 399 270 129 1 154 114 1 57 71 Appendicitis 10 6 4 0 3 2 0 1 2Diseases of the genitourinary system 401 210 191 5 69 137 4 61 126 Nephritis and nephrosis 313 160 154 4 58 98 3 50 100 Benign prostatic hypertrophy 15 15 0 0 1 14 0 0 0Skin diseases 23 10 13 0 3 6 0 3 10Musculoskeletal diseases 51 18 33 1 6 12 1 11 22 Rheumatoid arthritis 11 4 8 0 1 3 0 2 6 Osteoarthritis 2 1 1 0 0 1 0 0 1Congenital abnormalities 156 82 74 69 11 2 64 8 2Oral diseases 1 1 0 0 0 0 0 0 0 Dental caries 0 0 0 0 0 0 0 0 0 Periodontal disease 0 0 0 0 0 0 0 0 0 Edentulism 0 0 0 0 0 0 0 0 0III. Injuries 2 954 2 003 952 217 1 457 329 177 533 242Unintentional 1 922 1 308 614 164 922 222 127 322 165 Road traffic accidents 674 504 170 33 398 72 19 114 37 Poisonings 173 121 52 5 100 17 5 34 12 Falls 199 129 70 6 75 48 4 22 44 Fires 62 33 29 5 20 8 5 15 8 Drownings 202 137 65 46 76 15 25 27 13 Other unintentional injuries 613 384 229 69 253 62 68 110 51Intentional 819 594 225 13 488 93 10 156 59 Self-inflicted injuries 413 247 165 4 173 70 2 113 50 Violence 317 267 50 5 245 17 4 38 8 War and conflict 82 74 8 4 64 6 3 4 1
a See Annex Table C1 for a list of Member States by WHO region and income category.b Estimates for specific causes may not sum to broader cause groupings due to omission of residual categories.c World totals for males and females include residual populations living outside WHO Member States.d For the Americas, Europe and Western Pacific regions, these figures include late effects of polio cases with
onset prior to regional certification of polio eradication in 1994, 2000 and 2002, respectively. e Does not include liver cancer and cirrhosis deaths resulting from chronic hepatitis virus infection.f This category includes ‘Causes arising in the perinatal period’ as defined in the International Classification
of Diseases, and does not include all deaths occurring in the perinatal period.g Includes severe neonatal infections and other non-infectious causes arising in the perinatal period.h Includes macular degeneration and other age-related causes of vision loss not correctable by provision of
glasses or contact lenses, together with deaths due to other sense organ disorders.i Includes myocarditis, pericarditis, endocarditis and cardiomyopathy.
(Table A5c continued)
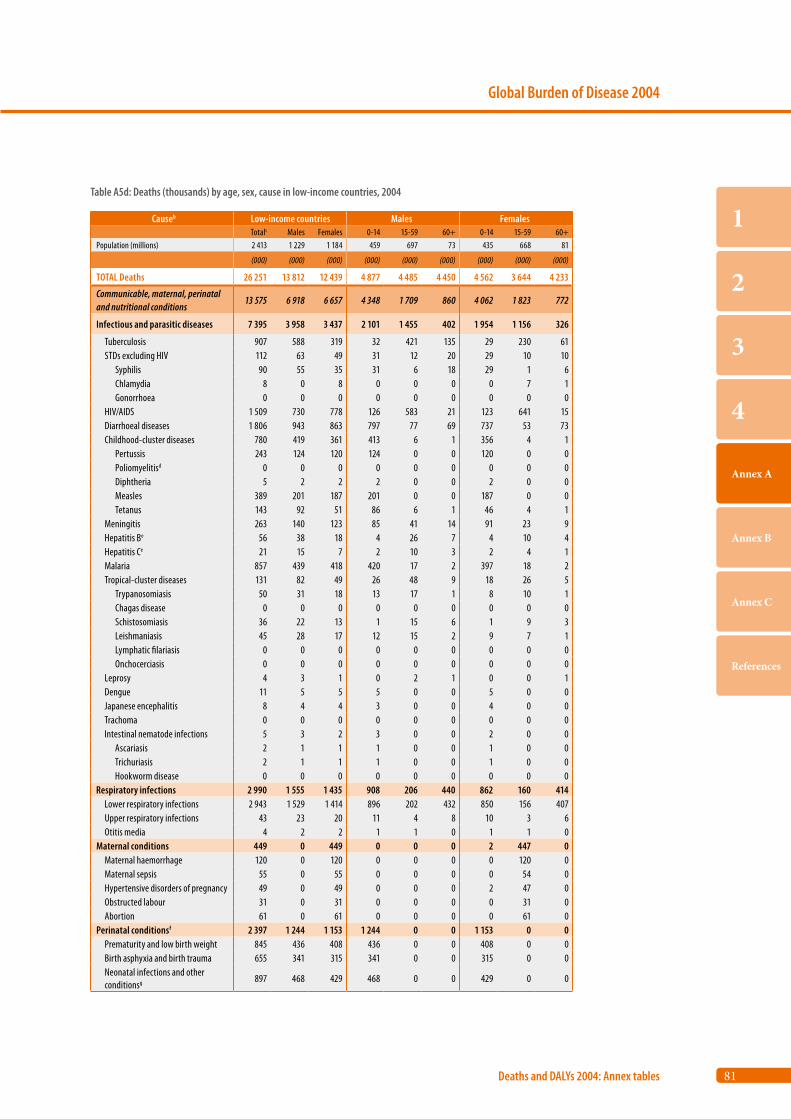
81
Global Burden of Disease 2004
Deaths and DALYs 2004: Annex tables
1
2
3
4
Annex A
Annex B
Annex C
References
Causeb Low-income countries Males Females Totalc Males Females 0-14 15-59 60+ 0-14 15-59 60+
Population (millions) 2 413 1 229 1 184 459 697 73 435 668 81
(000) (000) (000) (000) (000) (000) (000) (000) (000)
TOTAL Deaths 26 251 13 812 12 439 4 877 4 485 4 450 4 562 3 644 4 233
Communicable, maternal, perinatal and nutritional conditions
13 575 6 918 6 657 4 348 1 709 860 4 062 1 823 772
Infectious and parasitic diseases 7 395 3 958 3 437 2 101 1 455 402 1 954 1 156 326
Tuberculosis 907 588 319 32 421 135 29 230 61 STDs excluding HIV 112 63 49 31 12 20 29 10 10 Syphilis 90 55 35 31 6 18 29 1 6 Chlamydia 8 0 8 0 0 0 0 7 1 Gonorrhoea 0 0 0 0 0 0 0 0 0 HIV/AIDS 1 509 730 778 126 583 21 123 641 15 Diarrhoeal diseases 1 806 943 863 797 77 69 737 53 73 Childhood-cluster diseases 780 419 361 413 6 1 356 4 1 Pertussis 243 124 120 124 0 0 120 0 0 Poliomyelitisd 0 0 0 0 0 0 0 0 0 Diphtheria 5 2 2 2 0 0 2 0 0 Measles 389 201 187 201 0 0 187 0 0 Tetanus 143 92 51 86 6 1 46 4 1 Meningitis 263 140 123 85 41 14 91 23 9 Hepatitis Be 56 38 18 4 26 7 4 10 4 Hepatitis Ce 21 15 7 2 10 3 2 4 1 Malaria 857 439 418 420 17 2 397 18 2 Tropical-cluster diseases 131 82 49 26 48 9 18 26 5 Trypanosomiasis 50 31 18 13 17 1 8 10 1 Chagas disease 0 0 0 0 0 0 0 0 0 Schistosomiasis 36 22 13 1 15 6 1 9 3 Leishmaniasis 45 28 17 12 15 2 9 7 1 Lymphatic filariasis 0 0 0 0 0 0 0 0 0 Onchocerciasis 0 0 0 0 0 0 0 0 0 Leprosy 4 3 1 0 2 1 0 0 1 Dengue 11 5 5 5 0 0 5 0 0 Japanese encephalitis 8 4 4 3 0 0 4 0 0 Trachoma 0 0 0 0 0 0 0 0 0 Intestinal nematode infections 5 3 2 3 0 0 2 0 0 Ascariasis 2 1 1 1 0 0 1 0 0 Trichuriasis 2 1 1 1 0 0 1 0 0 Hookworm disease 0 0 0 0 0 0 0 0 0Respiratory infections 2 990 1 555 1 435 908 206 440 862 160 414 Lower respiratory infections 2 943 1 529 1 414 896 202 432 850 156 407 Upper respiratory infections 43 23 20 11 4 8 10 3 6 Otitis media 4 2 2 1 1 0 1 1 0Maternal conditions 449 0 449 0 0 0 2 447 0 Maternal haemorrhage 120 0 120 0 0 0 0 120 0 Maternal sepsis 55 0 55 0 0 0 0 54 0 Hypertensive disorders of pregnancy 49 0 49 0 0 0 2 47 0 Obstructed labour 31 0 31 0 0 0 0 31 0 Abortion 61 0 61 0 0 0 0 61 0Perinatal conditionsf 2 397 1 244 1 153 1 244 0 0 1 153 0 0 Prematurity and low birth weight 845 436 408 436 0 0 408 0 0 Birth asphyxia and birth trauma 655 341 315 341 0 0 315 0 0 Neonatal infections and other conditionsg 897 468 429 468 0 0 429 0 0
Table A5d: Deaths (thousands) by age, sex, cause in low-income countries, 2004
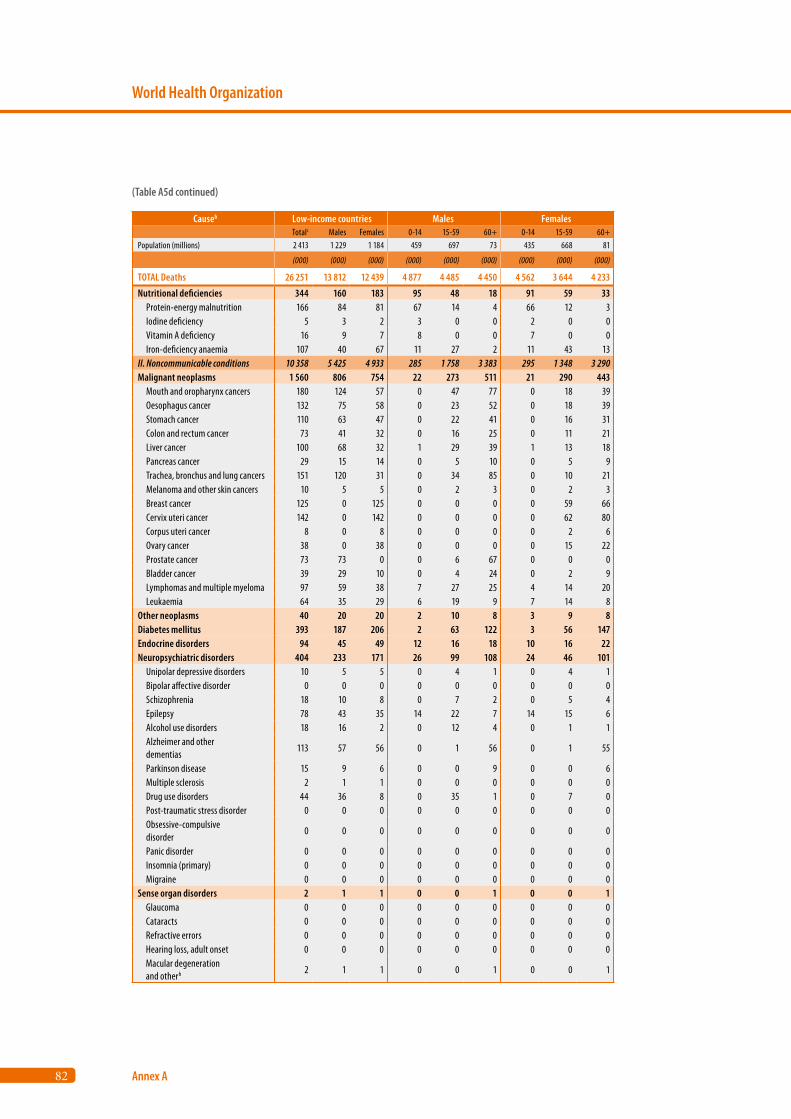
82
World Health Organization
Annex A
Causeb Low-income countries Males Females Totalc Males Females 0-14 15-59 60+ 0-14 15-59 60+
Population (millions) 2 413 1 229 1 184 459 697 73 435 668 81
(000) (000) (000) (000) (000) (000) (000) (000) (000)
TOTAL Deaths 26 251 13 812 12 439 4 877 4 485 4 450 4 562 3 644 4 233
Nutritional deficiencies 344 160 183 95 48 18 91 59 33 Protein-energy malnutrition 166 84 81 67 14 4 66 12 3 Iodine deficiency 5 3 2 3 0 0 2 0 0 Vitamin A deficiency 16 9 7 8 0 0 7 0 0 Iron-deficiency anaemia 107 40 67 11 27 2 11 43 13II. Noncommunicable conditions 10 358 5 425 4 933 285 1 758 3 383 295 1 348 3 290Malignant neoplasms 1 560 806 754 22 273 511 21 290 443 Mouth and oropharynx cancers 180 124 57 0 47 77 0 18 39 Oesophagus cancer 132 75 58 0 23 52 0 18 39 Stomach cancer 110 63 47 0 22 41 0 16 31 Colon and rectum cancer 73 41 32 0 16 25 0 11 21 Liver cancer 100 68 32 1 29 39 1 13 18 Pancreas cancer 29 15 14 0 5 10 0 5 9 Trachea, bronchus and lung cancers 151 120 31 0 34 85 0 10 21 Melanoma and other skin cancers 10 5 5 0 2 3 0 2 3 Breast cancer 125 0 125 0 0 0 0 59 66 Cervix uteri cancer 142 0 142 0 0 0 0 62 80 Corpus uteri cancer 8 0 8 0 0 0 0 2 6 Ovary cancer 38 0 38 0 0 0 0 15 22 Prostate cancer 73 73 0 0 6 67 0 0 0 Bladder cancer 39 29 10 0 4 24 0 2 9 Lymphomas and multiple myeloma 97 59 38 7 27 25 4 14 20 Leukaemia 64 35 29 6 19 9 7 14 8Other neoplasms 40 20 20 2 10 8 3 9 8Diabetes mellitus 393 187 206 2 63 122 3 56 147Endocrine disorders 94 45 49 12 16 18 10 16 22Neuropsychiatric disorders 404 233 171 26 99 108 24 46 101 Unipolar depressive disorders 10 5 5 0 4 1 0 4 1 Bipolar affective disorder 0 0 0 0 0 0 0 0 0 Schizophrenia 18 10 8 0 7 2 0 5 4 Epilepsy 78 43 35 14 22 7 14 15 6 Alcohol use disorders 18 16 2 0 12 4 0 1 1 Alzheimer and other dementias
113 57 56 0 1 56 0 1 55
Parkinson disease 15 9 6 0 0 9 0 0 6 Multiple sclerosis 2 1 1 0 0 0 0 0 0 Drug use disorders 44 36 8 0 35 1 0 7 0 Post-traumatic stress disorder 0 0 0 0 0 0 0 0 0 Obsessive-compulsive disorder
0 0 0 0 0 0 0 0 0
Panic disorder 0 0 0 0 0 0 0 0 0 Insomnia (primary) 0 0 0 0 0 0 0 0 0 Migraine 0 0 0 0 0 0 0 0 0Sense organ disorders 2 1 1 0 0 1 0 0 1 Glaucoma 0 0 0 0 0 0 0 0 0 Cataracts 0 0 0 0 0 0 0 0 0 Refractive errors 0 0 0 0 0 0 0 0 0 Hearing loss, adult onset 0 0 0 0 0 0 0 0 0 Macular degeneration and otherh 2 1 1 0 0 1 0 0 1
(Table A5d continued)
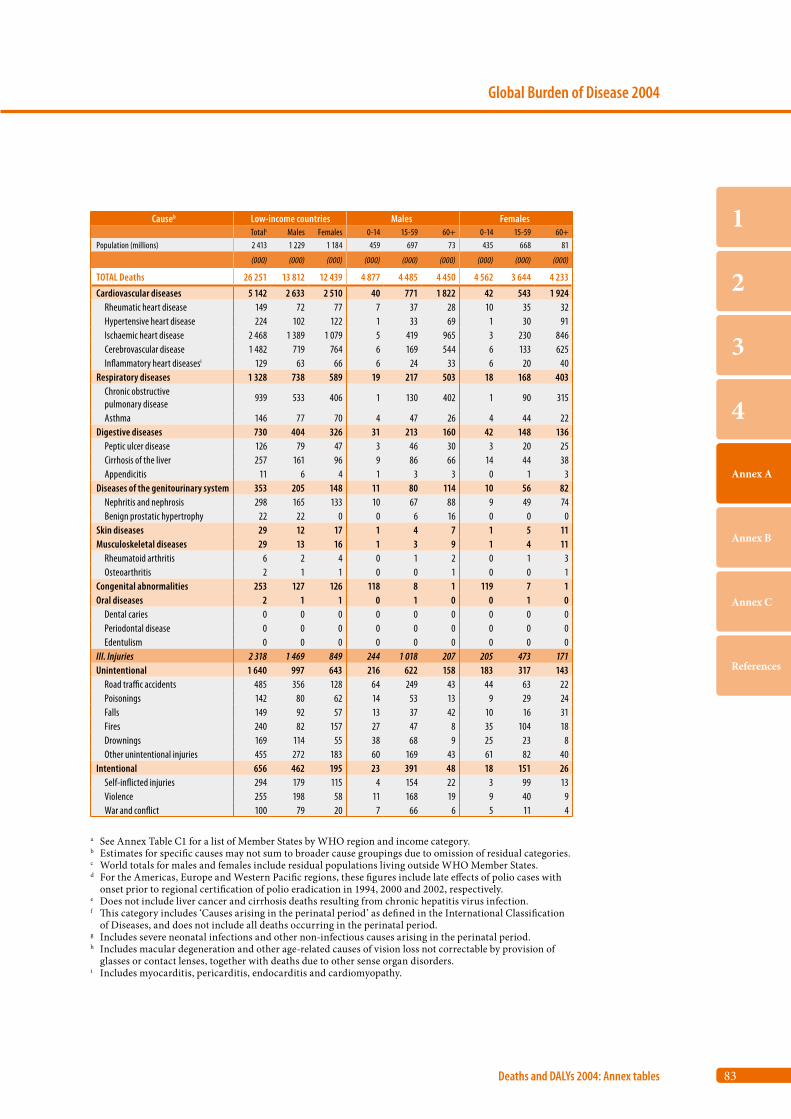
83
Global Burden of Disease 2004
Deaths and DALYs 2004: Annex tables
1
2
3
4
Annex A
Annex B
Annex C
References
Causeb Low-income countries Males Females Totalc Males Females 0-14 15-59 60+ 0-14 15-59 60+
Population (millions) 2 413 1 229 1 184 459 697 73 435 668 81
(000) (000) (000) (000) (000) (000) (000) (000) (000)
TOTAL Deaths 26 251 13 812 12 439 4 877 4 485 4 450 4 562 3 644 4 233
Cardiovascular diseases 5 142 2 633 2 510 40 771 1 822 42 543 1 924 Rheumatic heart disease 149 72 77 7 37 28 10 35 32 Hypertensive heart disease 224 102 122 1 33 69 1 30 91 Ischaemic heart disease 2 468 1 389 1 079 5 419 965 3 230 846 Cerebrovascular disease 1 482 719 764 6 169 544 6 133 625 Inflammatory heart diseasesi 129 63 66 6 24 33 6 20 40Respiratory diseases 1 328 738 589 19 217 503 18 168 403 Chronic obstructive pulmonary disease
939 533 406 1 130 402 1 90 315
Asthma 146 77 70 4 47 26 4 44 22Digestive diseases 730 404 326 31 213 160 42 148 136 Peptic ulcer disease 126 79 47 3 46 30 3 20 25 Cirrhosis of the liver 257 161 96 9 86 66 14 44 38 Appendicitis 11 6 4 1 3 3 0 1 3Diseases of the genitourinary system 353 205 148 11 80 114 10 56 82 Nephritis and nephrosis 298 165 133 10 67 88 9 49 74 Benign prostatic hypertrophy 22 22 0 0 6 16 0 0 0Skin diseases 29 12 17 1 4 7 1 5 11Musculoskeletal diseases 29 13 16 1 3 9 1 4 11 Rheumatoid arthritis 6 2 4 0 1 2 0 1 3 Osteoarthritis 2 1 1 0 0 1 0 0 1Congenital abnormalities 253 127 126 118 8 1 119 7 1Oral diseases 2 1 1 0 1 0 0 1 0 Dental caries 0 0 0 0 0 0 0 0 0 Periodontal disease 0 0 0 0 0 0 0 0 0 Edentulism 0 0 0 0 0 0 0 0 0III. Injuries 2 318 1 469 849 244 1 018 207 205 473 171Unintentional 1 640 997 643 216 622 158 183 317 143 Road traffic accidents 485 356 128 64 249 43 44 63 22 Poisonings 142 80 62 14 53 13 9 29 24 Falls 149 92 57 13 37 42 10 16 31 Fires 240 82 157 27 47 8 35 104 18 Drownings 169 114 55 38 68 9 25 23 8 Other unintentional injuries 455 272 183 60 169 43 61 82 40Intentional 656 462 195 23 391 48 18 151 26 Self-inflicted injuries 294 179 115 4 154 22 3 99 13 Violence 255 198 58 11 168 19 9 40 9 War and conflict 100 79 20 7 66 6 5 11 4
a See Annex Table C1 for a list of Member States by WHO region and income category.b Estimates for specific causes may not sum to broader cause groupings due to omission of residual categories.c World totals for males and females include residual populations living outside WHO Member States.d For the Americas, Europe and Western Pacific regions, these figures include late effects of polio cases with
onset prior to regional certification of polio eradication in 1994, 2000 and 2002, respectively. e Does not include liver cancer and cirrhosis deaths resulting from chronic hepatitis virus infection.f This category includes ‘Causes arising in the perinatal period’ as defined in the International Classification
of Diseases, and does not include all deaths occurring in the perinatal period.g Includes severe neonatal infections and other non-infectious causes arising in the perinatal period.h Includes macular degeneration and other age-related causes of vision loss not correctable by provision of
glasses or contact lenses, together with deaths due to other sense organ disorders.i Includes myocarditis, pericarditis, endocarditis and cardiomyopathy.
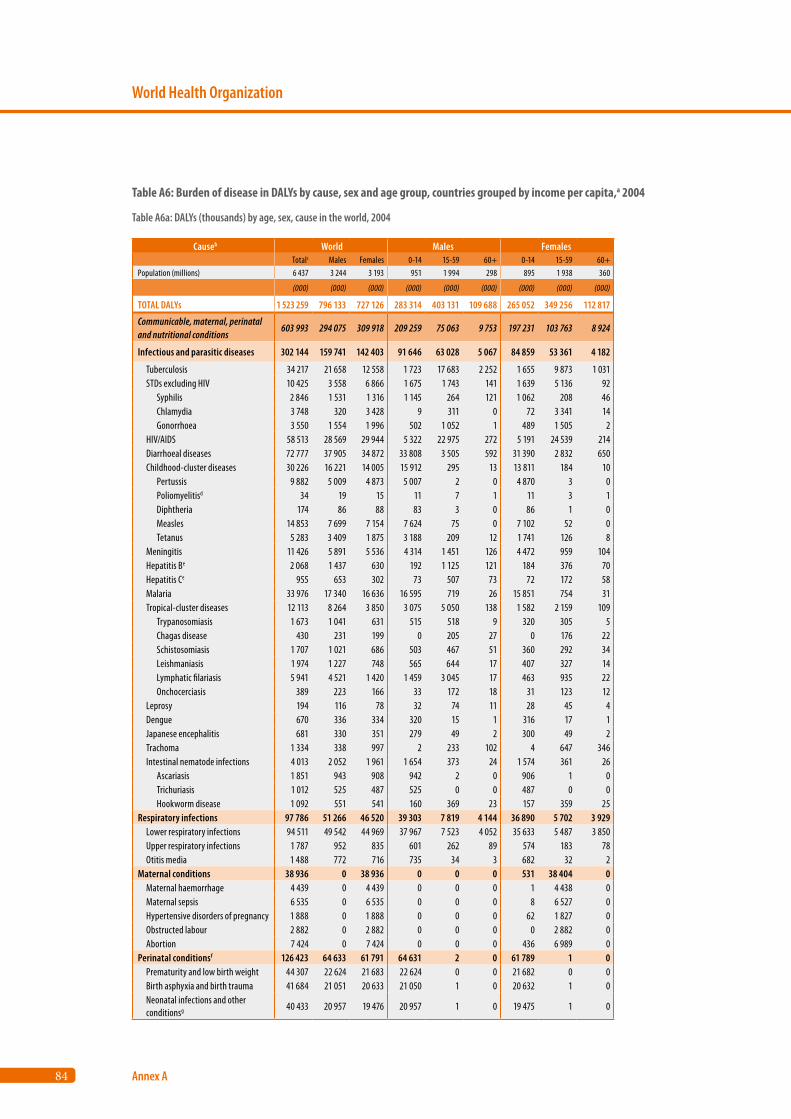
84
World Health Organization
Annex A
Causeb World Males Females Totalc Males Females 0-14 15-59 60+ 0-14 15-59 60+
Population (millions) 6 437 3 244 3 193 951 1 994 298 895 1 938 360
(000) (000) (000) (000) (000) (000) (000) (000) (000)
TOTAL DALYs 1 523 259 796 133 727 126 283 314 403 131 109 688 265 052 349 256 112 817
Communicable, maternal, perinatal and nutritional conditions
603 993 294 075 309 918 209 259 75 063 9 753 197 231 103 763 8 924
Infectious and parasitic diseases 302 144 159 741 142 403 91 646 63 028 5 067 84 859 53 361 4 182
Tuberculosis 34 217 21 658 12 558 1 723 17 683 2 252 1 655 9 873 1 031 STDs excluding HIV 10 425 3 558 6 866 1 675 1 743 141 1 639 5 136 92 Syphilis 2 846 1 531 1 316 1 145 264 121 1 062 208 46 Chlamydia 3 748 320 3 428 9 311 0 72 3 341 14 Gonorrhoea 3 550 1 554 1 996 502 1 052 1 489 1 505 2 HIV/AIDS 58 513 28 569 29 944 5 322 22 975 272 5 191 24 539 214 Diarrhoeal diseases 72 777 37 905 34 872 33 808 3 505 592 31 390 2 832 650 Childhood-cluster diseases 30 226 16 221 14 005 15 912 295 13 13 811 184 10 Pertussis 9 882 5 009 4 873 5 007 2 0 4 870 3 0 Poliomyelitisd 34 19 15 11 7 1 11 3 1 Diphtheria 174 86 88 83 3 0 86 1 0 Measles 14 853 7 699 7 154 7 624 75 0 7 102 52 0 Tetanus 5 283 3 409 1 875 3 188 209 12 1 741 126 8 Meningitis 11 426 5 891 5 536 4 314 1 451 126 4 472 959 104 Hepatitis Be 2 068 1 437 630 192 1 125 121 184 376 70 Hepatitis Ce 955 653 302 73 507 73 72 172 58 Malaria 33 976 17 340 16 636 16 595 719 26 15 851 754 31 Tropical-cluster diseases 12 113 8 264 3 850 3 075 5 050 138 1 582 2 159 109 Trypanosomiasis 1 673 1 041 631 515 518 9 320 305 5 Chagas disease 430 231 199 0 205 27 0 176 22 Schistosomiasis 1 707 1 021 686 503 467 51 360 292 34 Leishmaniasis 1 974 1 227 748 565 644 17 407 327 14 Lymphatic filariasis 5 941 4 521 1 420 1 459 3 045 17 463 935 22 Onchocerciasis 389 223 166 33 172 18 31 123 12 Leprosy 194 116 78 32 74 11 28 45 4 Dengue 670 336 334 320 15 1 316 17 1 Japanese encephalitis 681 330 351 279 49 2 300 49 2 Trachoma 1 334 338 997 2 233 102 4 647 346 Intestinal nematode infections 4 013 2 052 1 961 1 654 373 24 1 574 361 26 Ascariasis 1 851 943 908 942 2 0 906 1 0 Trichuriasis 1 012 525 487 525 0 0 487 0 0 Hookworm disease 1 092 551 541 160 369 23 157 359 25Respiratory infections 97 786 51 266 46 520 39 303 7 819 4 144 36 890 5 702 3 929 Lower respiratory infections 94 511 49 542 44 969 37 967 7 523 4 052 35 633 5 487 3 850 Upper respiratory infections 1 787 952 835 601 262 89 574 183 78 Otitis media 1 488 772 716 735 34 3 682 32 2Maternal conditions 38 936 0 38 936 0 0 0 531 38 404 0 Maternal haemorrhage 4 439 0 4 439 0 0 0 1 4 438 0 Maternal sepsis 6 535 0 6 535 0 0 0 8 6 527 0 Hypertensive disorders of pregnancy 1 888 0 1 888 0 0 0 62 1 827 0 Obstructed labour 2 882 0 2 882 0 0 0 0 2 882 0 Abortion 7 424 0 7 424 0 0 0 436 6 989 0Perinatal conditionsf 126 423 64 633 61 791 64 631 2 0 61 789 1 0 Prematurity and low birth weight 44 307 22 624 21 683 22 624 0 0 21 682 0 0 Birth asphyxia and birth trauma 41 684 21 051 20 633 21 050 1 0 20 632 1 0 Neonatal infections and other conditionsg 40 433 20 957 19 476 20 957 1 0 19 475 1 0
Table A6: Burden of disease in DALYs by cause, sex and age group, countries grouped by income per capita,a 2004
Table A6a: DALYs (thousands) by age, sex, cause in the world, 2004
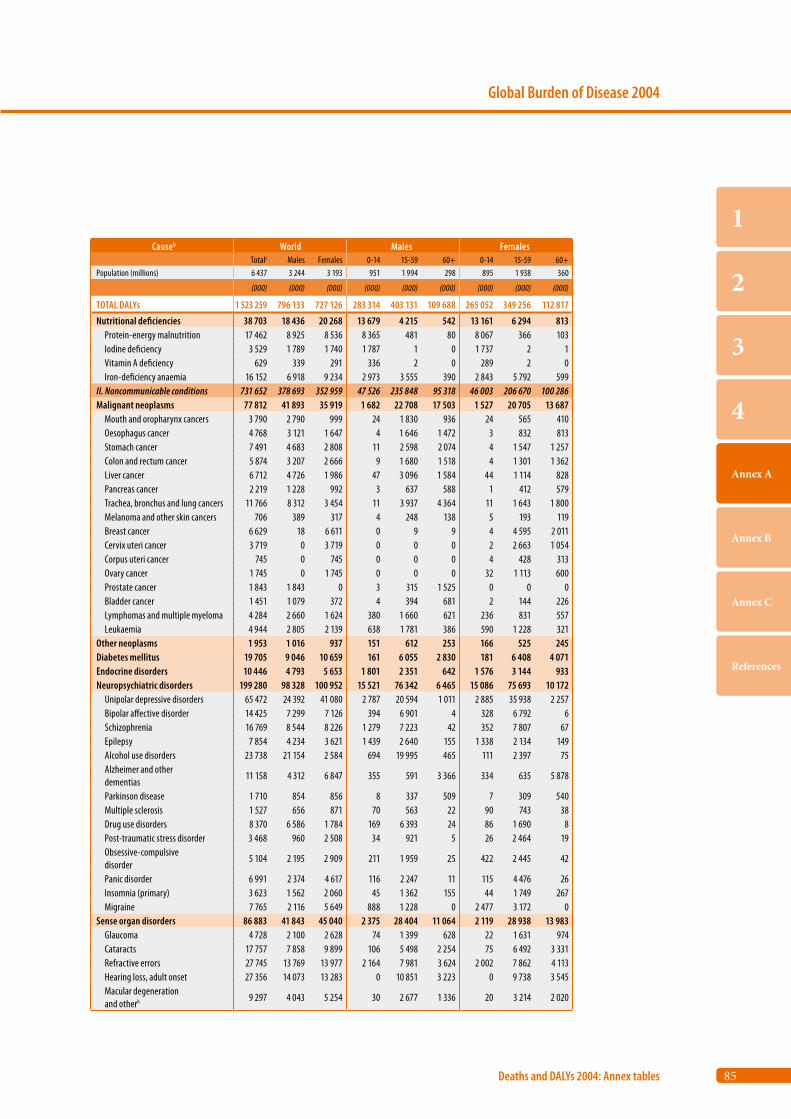
85
Global Burden of Disease 2004
Deaths and DALYs 2004: Annex tables
1
2
3
4
Annex A
Annex B
Annex C
References
Causeb World Males Females Totalc Males Females 0-14 15-59 60+ 0-14 15-59 60+
Population (millions) 6 437 3 244 3 193 951 1 994 298 895 1 938 360
(000) (000) (000) (000) (000) (000) (000) (000) (000)
TOTAL DALYs 1 523 259 796 133 727 126 283 314 403 131 109 688 265 052 349 256 112 817
Nutritional deficiencies 38 703 18 436 20 268 13 679 4 215 542 13 161 6 294 813 Protein-energy malnutrition 17 462 8 925 8 536 8 365 481 80 8 067 366 103 Iodine deficiency 3 529 1 789 1 740 1 787 1 0 1 737 2 1 Vitamin A deficiency 629 339 291 336 2 0 289 2 0 Iron-deficiency anaemia 16 152 6 918 9 234 2 973 3 555 390 2 843 5 792 599II. Noncommunicable conditions 731 652 378 693 352 959 47 526 235 848 95 318 46 003 206 670 100 286Malignant neoplasms 77 812 41 893 35 919 1 682 22 708 17 503 1 527 20 705 13 687 Mouth and oropharynx cancers 3 790 2 790 999 24 1 830 936 24 565 410 Oesophagus cancer 4 768 3 121 1 647 4 1 646 1 472 3 832 813 Stomach cancer 7 491 4 683 2 808 11 2 598 2 074 4 1 547 1 257 Colon and rectum cancer 5 874 3 207 2 666 9 1 680 1 518 4 1 301 1 362 Liver cancer 6 712 4 726 1 986 47 3 096 1 584 44 1 114 828 Pancreas cancer 2 219 1 228 992 3 637 588 1 412 579 Trachea, bronchus and lung cancers 11 766 8 312 3 454 11 3 937 4 364 11 1 643 1 800 Melanoma and other skin cancers 706 389 317 4 248 138 5 193 119 Breast cancer 6 629 18 6 611 0 9 9 4 4 595 2 011 Cervix uteri cancer 3 719 0 3 719 0 0 0 2 2 663 1 054 Corpus uteri cancer 745 0 745 0 0 0 4 428 313 Ovary cancer 1 745 0 1 745 0 0 0 32 1 113 600 Prostate cancer 1 843 1 843 0 3 315 1 525 0 0 0 Bladder cancer 1 451 1 079 372 4 394 681 2 144 226 Lymphomas and multiple myeloma 4 284 2 660 1 624 380 1 660 621 236 831 557 Leukaemia 4 944 2 805 2 139 638 1 781 386 590 1 228 321Other neoplasms 1 953 1 016 937 151 612 253 166 525 245Diabetes mellitus 19 705 9 046 10 659 161 6 055 2 830 181 6 408 4 071Endocrine disorders 10 446 4 793 5 653 1 801 2 351 642 1 576 3 144 933Neuropsychiatric disorders 199 280 98 328 100 952 15 521 76 342 6 465 15 086 75 693 10 172 Unipolar depressive disorders 65 472 24 392 41 080 2 787 20 594 1 011 2 885 35 938 2 257 Bipolar affective disorder 14 425 7 299 7 126 394 6 901 4 328 6 792 6 Schizophrenia 16 769 8 544 8 226 1 279 7 223 42 352 7 807 67 Epilepsy 7 854 4 234 3 621 1 439 2 640 155 1 338 2 134 149 Alcohol use disorders 23 738 21 154 2 584 694 19 995 465 111 2 397 75 Alzheimer and other dementias
11 158 4 312 6 847 355 591 3 366 334 635 5 878
Parkinson disease 1 710 854 856 8 337 509 7 309 540 Multiple sclerosis 1 527 656 871 70 563 22 90 743 38 Drug use disorders 8 370 6 586 1 784 169 6 393 24 86 1 690 8 Post-traumatic stress disorder 3 468 960 2 508 34 921 5 26 2 464 19 Obsessive-compulsive disorder
5 104 2 195 2 909 211 1 959 25 422 2 445 42
Panic disorder 6 991 2 374 4 617 116 2 247 11 115 4 476 26 Insomnia (primary) 3 623 1 562 2 060 45 1 362 155 44 1 749 267 Migraine 7 765 2 116 5 649 888 1 228 0 2 477 3 172 0Sense organ disorders 86 883 41 843 45 040 2 375 28 404 11 064 2 119 28 938 13 983 Glaucoma 4 728 2 100 2 628 74 1 399 628 22 1 631 974 Cataracts 17 757 7 858 9 899 106 5 498 2 254 75 6 492 3 331 Refractive errors 27 745 13 769 13 977 2 164 7 981 3 624 2 002 7 862 4 113 Hearing loss, adult onset 27 356 14 073 13 283 0 10 851 3 223 0 9 738 3 545 Macular degeneration and otherh 9 297 4 043 5 254 30 2 677 1 336 20 3 214 2 020
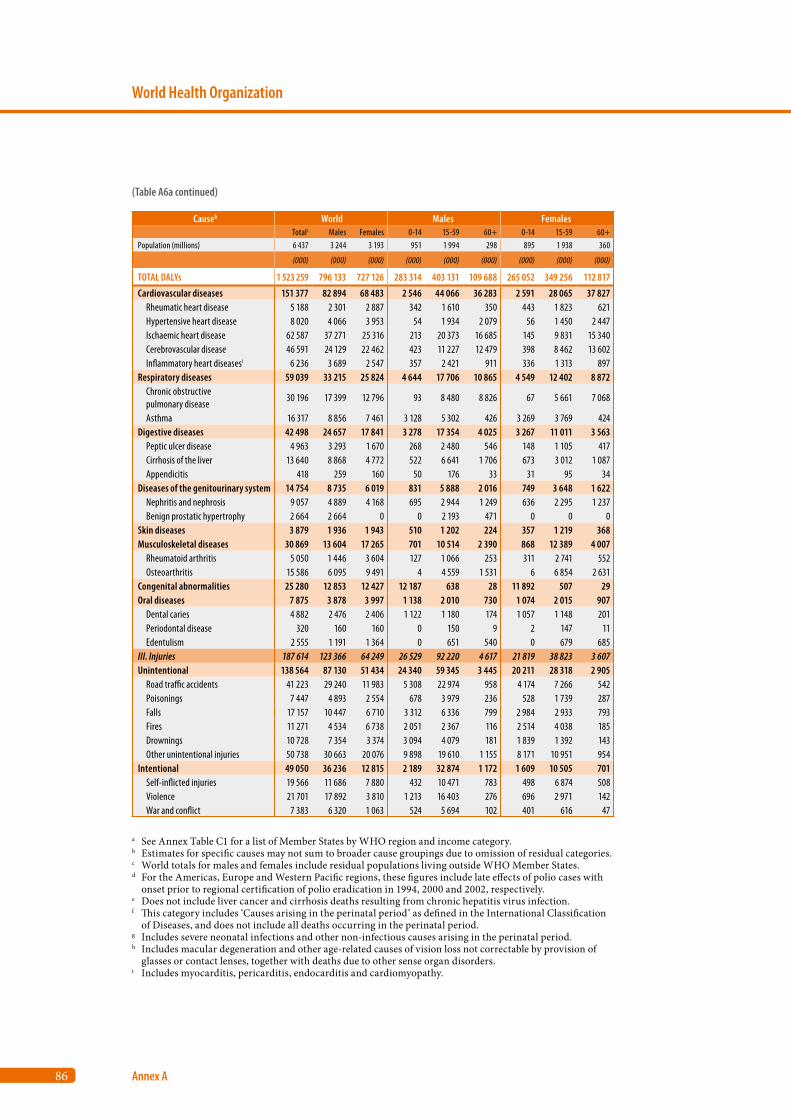
86
World Health Organization
Annex A
Causeb World Males Females Totalc Males Females 0-14 15-59 60+ 0-14 15-59 60+
Population (millions) 6 437 3 244 3 193 951 1 994 298 895 1 938 360
(000) (000) (000) (000) (000) (000) (000) (000) (000)
TOTAL DALYs 1 523 259 796 133 727 126 283 314 403 131 109 688 265 052 349 256 112 817
Cardiovascular diseases 151 377 82 894 68 483 2 546 44 066 36 283 2 591 28 065 37 827 Rheumatic heart disease 5 188 2 301 2 887 342 1 610 350 443 1 823 621 Hypertensive heart disease 8 020 4 066 3 953 54 1 934 2 079 56 1 450 2 447 Ischaemic heart disease 62 587 37 271 25 316 213 20 373 16 685 145 9 831 15 340 Cerebrovascular disease 46 591 24 129 22 462 423 11 227 12 479 398 8 462 13 602 Inflammatory heart diseasesi 6 236 3 689 2 547 357 2 421 911 336 1 313 897Respiratory diseases 59 039 33 215 25 824 4 644 17 706 10 865 4 549 12 402 8 872 Chronic obstructive pulmonary disease
30 196 17 399 12 796 93 8 480 8 826 67 5 661 7 068
Asthma 16 317 8 856 7 461 3 128 5 302 426 3 269 3 769 424Digestive diseases 42 498 24 657 17 841 3 278 17 354 4 025 3 267 11 011 3 563 Peptic ulcer disease 4 963 3 293 1 670 268 2 480 546 148 1 105 417 Cirrhosis of the liver 13 640 8 868 4 772 522 6 641 1 706 673 3 012 1 087 Appendicitis 418 259 160 50 176 33 31 95 34Diseases of the genitourinary system 14 754 8 735 6 019 831 5 888 2 016 749 3 648 1 622 Nephritis and nephrosis 9 057 4 889 4 168 695 2 944 1 249 636 2 295 1 237 Benign prostatic hypertrophy 2 664 2 664 0 0 2 193 471 0 0 0Skin diseases 3 879 1 936 1 943 510 1 202 224 357 1 219 368Musculoskeletal diseases 30 869 13 604 17 265 701 10 514 2 390 868 12 389 4 007 Rheumatoid arthritis 5 050 1 446 3 604 127 1 066 253 311 2 741 552 Osteoarthritis 15 586 6 095 9 491 4 4 559 1 531 6 6 854 2 631Congenital abnormalities 25 280 12 853 12 427 12 187 638 28 11 892 507 29Oral diseases 7 875 3 878 3 997 1 138 2 010 730 1 074 2 015 907 Dental caries 4 882 2 476 2 406 1 122 1 180 174 1 057 1 148 201 Periodontal disease 320 160 160 0 150 9 2 147 11 Edentulism 2 555 1 191 1 364 0 651 540 0 679 685III. Injuries 187 614 123 366 64 249 26 529 92 220 4 617 21 819 38 823 3 607Unintentional 138 564 87 130 51 434 24 340 59 345 3 445 20 211 28 318 2 905 Road traffic accidents 41 223 29 240 11 983 5 308 22 974 958 4 174 7 266 542 Poisonings 7 447 4 893 2 554 678 3 979 236 528 1 739 287 Falls 17 157 10 447 6 710 3 312 6 336 799 2 984 2 933 793 Fires 11 271 4 534 6 738 2 051 2 367 116 2 514 4 038 185 Drownings 10 728 7 354 3 374 3 094 4 079 181 1 839 1 392 143 Other unintentional injuries 50 738 30 663 20 076 9 898 19 610 1 155 8 171 10 951 954Intentional 49 050 36 236 12 815 2 189 32 874 1 172 1 609 10 505 701 Self-inflicted injuries 19 566 11 686 7 880 432 10 471 783 498 6 874 508 Violence 21 701 17 892 3 810 1 213 16 403 276 696 2 971 142 War and conflict 7 383 6 320 1 063 524 5 694 102 401 616 47
a See Annex Table C1 for a list of Member States by WHO region and income category.b Estimates for specific causes may not sum to broader cause groupings due to omission of residual categories.c World totals for males and females include residual populations living outside WHO Member States.d For the Americas, Europe and Western Pacific regions, these figures include late effects of polio cases with
onset prior to regional certification of polio eradication in 1994, 2000 and 2002, respectively. e Does not include liver cancer and cirrhosis deaths resulting from chronic hepatitis virus infection.f This category includes ‘Causes arising in the perinatal period’ as defined in the International Classification
of Diseases, and does not include all deaths occurring in the perinatal period.g Includes severe neonatal infections and other non-infectious causes arising in the perinatal period.h Includes macular degeneration and other age-related causes of vision loss not correctable by provision of
glasses or contact lenses, together with deaths due to other sense organ disorders.i Includes myocarditis, pericarditis, endocarditis and cardiomyopathy.
(Table A6a continued)
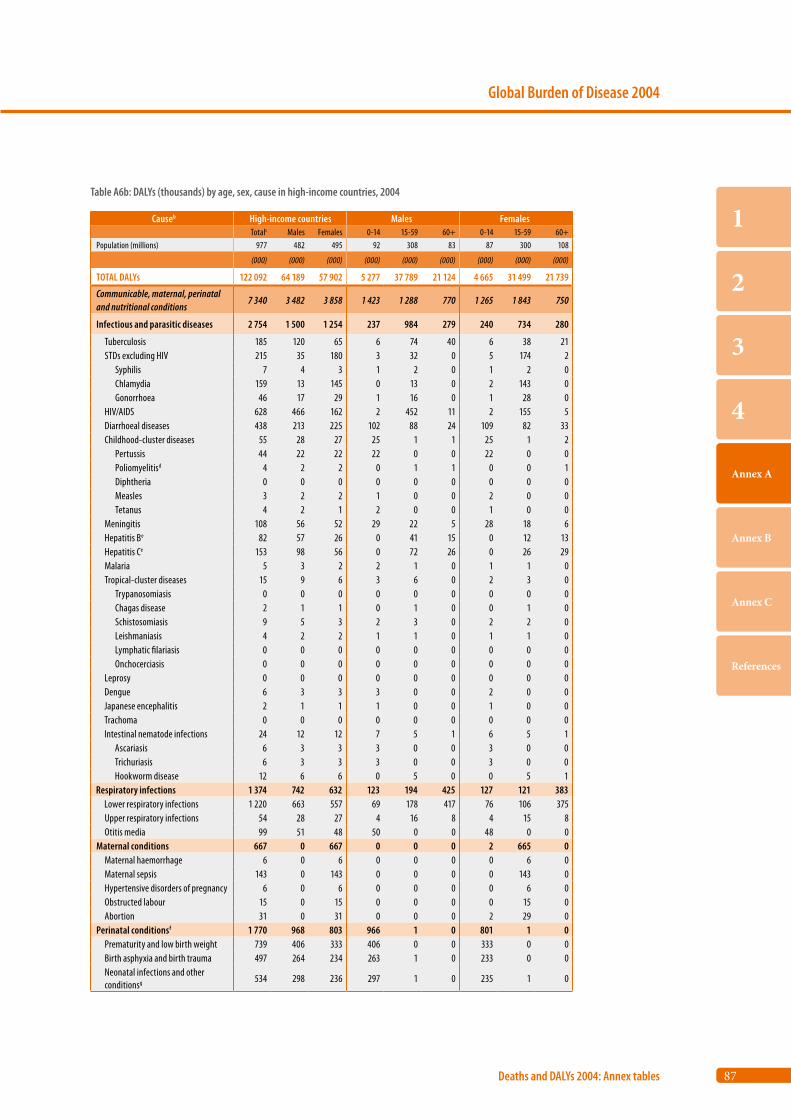
87
Global Burden of Disease 2004
Deaths and DALYs 2004: Annex tables
1
2
3
4
Annex A
Annex B
Annex C
References
Causeb High-income countries Males Females Totalc Males Females 0-14 15-59 60+ 0-14 15-59 60+
Population (millions) 977 482 495 92 308 83 87 300 108
(000) (000) (000) (000) (000) (000) (000) (000) (000)
TOTAL DALYs 122 092 64 189 57 902 5 277 37 789 21 124 4 665 31 499 21 739
Communicable, maternal, perinatal and nutritional conditions
7 340 3 482 3 858 1 423 1 288 770 1 265 1 843 750
Infectious and parasitic diseases 2 754 1 500 1 254 237 984 279 240 734 280
Tuberculosis 185 120 65 6 74 40 6 38 21 STDs excluding HIV 215 35 180 3 32 0 5 174 2 Syphilis 7 4 3 1 2 0 1 2 0 Chlamydia 159 13 145 0 13 0 2 143 0 Gonorrhoea 46 17 29 1 16 0 1 28 0 HIV/AIDS 628 466 162 2 452 11 2 155 5 Diarrhoeal diseases 438 213 225 102 88 24 109 82 33 Childhood-cluster diseases 55 28 27 25 1 1 25 1 2 Pertussis 44 22 22 22 0 0 22 0 0 Poliomyelitisd 4 2 2 0 1 1 0 0 1 Diphtheria 0 0 0 0 0 0 0 0 0 Measles 3 2 2 1 0 0 2 0 0 Tetanus 4 2 1 2 0 0 1 0 0 Meningitis 108 56 52 29 22 5 28 18 6 Hepatitis Be 82 57 26 0 41 15 0 12 13 Hepatitis Ce 153 98 56 0 72 26 0 26 29 Malaria 5 3 2 2 1 0 1 1 0 Tropical-cluster diseases 15 9 6 3 6 0 2 3 0 Trypanosomiasis 0 0 0 0 0 0 0 0 0 Chagas disease 2 1 1 0 1 0 0 1 0 Schistosomiasis 9 5 3 2 3 0 2 2 0 Leishmaniasis 4 2 2 1 1 0 1 1 0 Lymphatic filariasis 0 0 0 0 0 0 0 0 0 Onchocerciasis 0 0 0 0 0 0 0 0 0 Leprosy 0 0 0 0 0 0 0 0 0 Dengue 6 3 3 3 0 0 2 0 0 Japanese encephalitis 2 1 1 1 0 0 1 0 0 Trachoma 0 0 0 0 0 0 0 0 0 Intestinal nematode infections 24 12 12 7 5 1 6 5 1 Ascariasis 6 3 3 3 0 0 3 0 0 Trichuriasis 6 3 3 3 0 0 3 0 0 Hookworm disease 12 6 6 0 5 0 0 5 1Respiratory infections 1 374 742 632 123 194 425 127 121 383 Lower respiratory infections 1 220 663 557 69 178 417 76 106 375 Upper respiratory infections 54 28 27 4 16 8 4 15 8 Otitis media 99 51 48 50 0 0 48 0 0Maternal conditions 667 0 667 0 0 0 2 665 0 Maternal haemorrhage 6 0 6 0 0 0 0 6 0 Maternal sepsis 143 0 143 0 0 0 0 143 0 Hypertensive disorders of pregnancy 6 0 6 0 0 0 0 6 0 Obstructed labour 15 0 15 0 0 0 0 15 0 Abortion 31 0 31 0 0 0 2 29 0Perinatal conditionsf 1 770 968 803 966 1 0 801 1 0 Prematurity and low birth weight 739 406 333 406 0 0 333 0 0 Birth asphyxia and birth trauma 497 264 234 263 1 0 233 0 0 Neonatal infections and other conditionsg 534 298 236 297 1 0 235 1 0
Table A6b: DALYs (thousands) by age, sex, cause in high-income countries, 2004
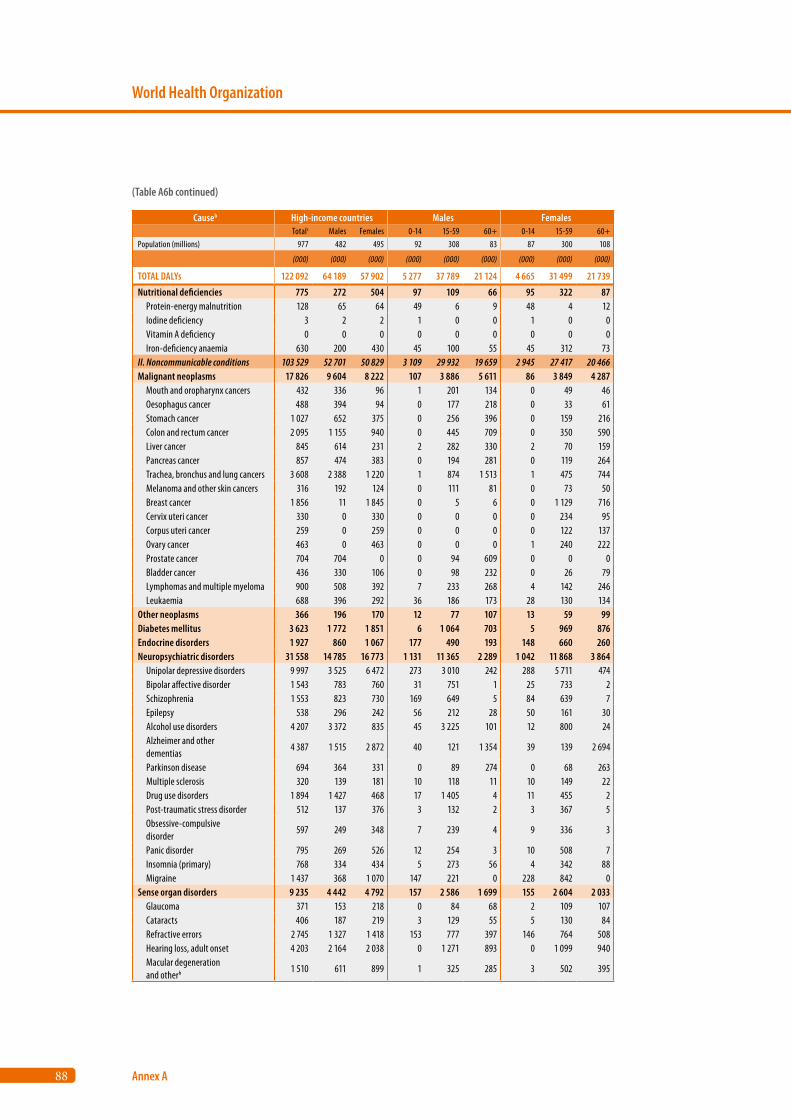
88
World Health Organization
Annex A
Causeb High-income countries Males Females Totalc Males Females 0-14 15-59 60+ 0-14 15-59 60+
Population (millions) 977 482 495 92 308 83 87 300 108
(000) (000) (000) (000) (000) (000) (000) (000) (000)
TOTAL DALYs 122 092 64 189 57 902 5 277 37 789 21 124 4 665 31 499 21 739
Nutritional deficiencies 775 272 504 97 109 66 95 322 87 Protein-energy malnutrition 128 65 64 49 6 9 48 4 12 Iodine deficiency 3 2 2 1 0 0 1 0 0 Vitamin A deficiency 0 0 0 0 0 0 0 0 0 Iron-deficiency anaemia 630 200 430 45 100 55 45 312 73II. Noncommunicable conditions 103 529 52 701 50 829 3 109 29 932 19 659 2 945 27 417 20 466Malignant neoplasms 17 826 9 604 8 222 107 3 886 5 611 86 3 849 4 287 Mouth and oropharynx cancers 432 336 96 1 201 134 0 49 46 Oesophagus cancer 488 394 94 0 177 218 0 33 61 Stomach cancer 1 027 652 375 0 256 396 0 159 216 Colon and rectum cancer 2 095 1 155 940 0 445 709 0 350 590 Liver cancer 845 614 231 2 282 330 2 70 159 Pancreas cancer 857 474 383 0 194 281 0 119 264 Trachea, bronchus and lung cancers 3 608 2 388 1 220 1 874 1 513 1 475 744 Melanoma and other skin cancers 316 192 124 0 111 81 0 73 50 Breast cancer 1 856 11 1 845 0 5 6 0 1 129 716 Cervix uteri cancer 330 0 330 0 0 0 0 234 95 Corpus uteri cancer 259 0 259 0 0 0 0 122 137 Ovary cancer 463 0 463 0 0 0 1 240 222 Prostate cancer 704 704 0 0 94 609 0 0 0 Bladder cancer 436 330 106 0 98 232 0 26 79 Lymphomas and multiple myeloma 900 508 392 7 233 268 4 142 246 Leukaemia 688 396 292 36 186 173 28 130 134Other neoplasms 366 196 170 12 77 107 13 59 99Diabetes mellitus 3 623 1 772 1 851 6 1 064 703 5 969 876Endocrine disorders 1 927 860 1 067 177 490 193 148 660 260Neuropsychiatric disorders 31 558 14 785 16 773 1 131 11 365 2 289 1 042 11 868 3 864 Unipolar depressive disorders 9 997 3 525 6 472 273 3 010 242 288 5 711 474 Bipolar affective disorder 1 543 783 760 31 751 1 25 733 2 Schizophrenia 1 553 823 730 169 649 5 84 639 7 Epilepsy 538 296 242 56 212 28 50 161 30 Alcohol use disorders 4 207 3 372 835 45 3 225 101 12 800 24 Alzheimer and other dementias
4 387 1 515 2 872 40 121 1 354 39 139 2 694
Parkinson disease 694 364 331 0 89 274 0 68 263 Multiple sclerosis 320 139 181 10 118 11 10 149 22 Drug use disorders 1 894 1 427 468 17 1 405 4 11 455 2 Post-traumatic stress disorder 512 137 376 3 132 2 3 367 5 Obsessive-compulsive disorder
597 249 348 7 239 4 9 336 3
Panic disorder 795 269 526 12 254 3 10 508 7 Insomnia (primary) 768 334 434 5 273 56 4 342 88 Migraine 1 437 368 1 070 147 221 0 228 842 0Sense organ disorders 9 235 4 442 4 792 157 2 586 1 699 155 2 604 2 033 Glaucoma 371 153 218 0 84 68 2 109 107 Cataracts 406 187 219 3 129 55 5 130 84 Refractive errors 2 745 1 327 1 418 153 777 397 146 764 508 Hearing loss, adult onset 4 203 2 164 2 038 0 1 271 893 0 1 099 940 Macular degeneration and otherh 1 510 611 899 1 325 285 3 502 395
(Table A6b continued)
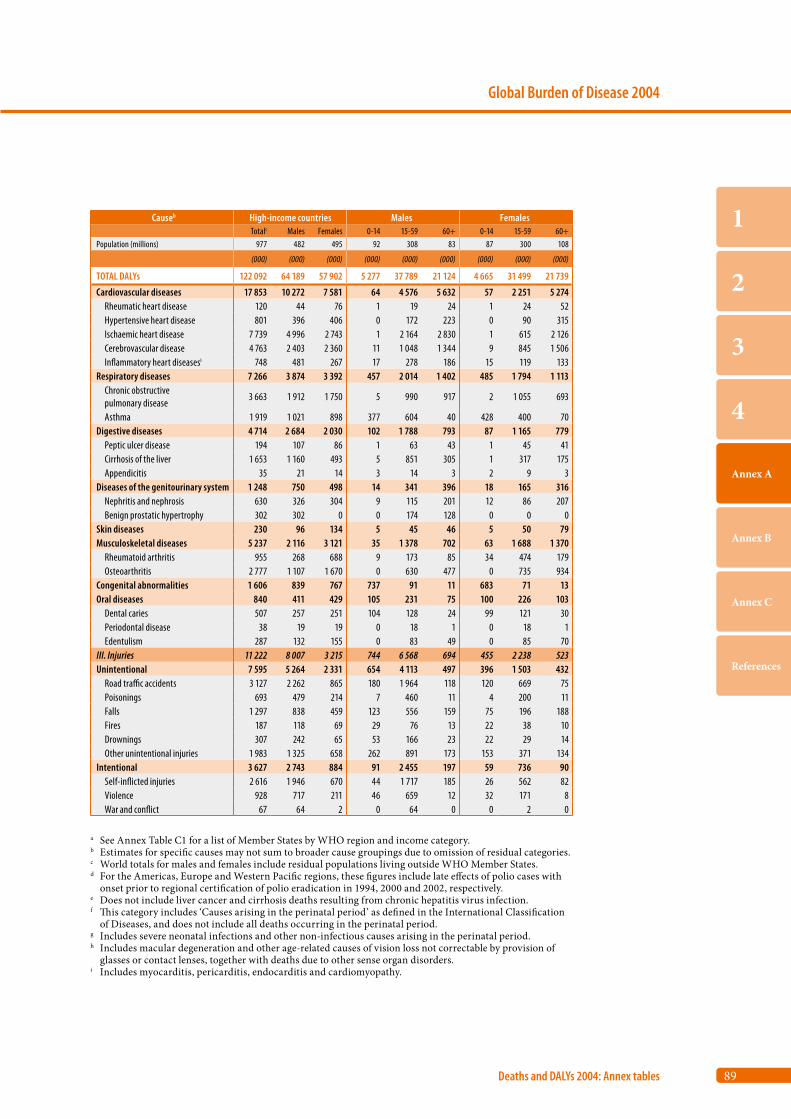
89
Global Burden of Disease 2004
Deaths and DALYs 2004: Annex tables
1
2
3
4
Annex A
Annex B
Annex C
References
Causeb High-income countries Males Females Totalc Males Females 0-14 15-59 60+ 0-14 15-59 60+
Population (millions) 977 482 495 92 308 83 87 300 108
(000) (000) (000) (000) (000) (000) (000) (000) (000)
TOTAL DALYs 122 092 64 189 57 902 5 277 37 789 21 124 4 665 31 499 21 739
Cardiovascular diseases 17 853 10 272 7 581 64 4 576 5 632 57 2 251 5 274 Rheumatic heart disease 120 44 76 1 19 24 1 24 52 Hypertensive heart disease 801 396 406 0 172 223 0 90 315 Ischaemic heart disease 7 739 4 996 2 743 1 2 164 2 830 1 615 2 126 Cerebrovascular disease 4 763 2 403 2 360 11 1 048 1 344 9 845 1 506 Inflammatory heart diseasesi 748 481 267 17 278 186 15 119 133Respiratory diseases 7 266 3 874 3 392 457 2 014 1 402 485 1 794 1 113 Chronic obstructive pulmonary disease
3 663 1 912 1 750 5 990 917 2 1 055 693
Asthma 1 919 1 021 898 377 604 40 428 400 70Digestive diseases 4 714 2 684 2 030 102 1 788 793 87 1 165 779 Peptic ulcer disease 194 107 86 1 63 43 1 45 41 Cirrhosis of the liver 1 653 1 160 493 5 851 305 1 317 175 Appendicitis 35 21 14 3 14 3 2 9 3Diseases of the genitourinary system 1 248 750 498 14 341 396 18 165 316 Nephritis and nephrosis 630 326 304 9 115 201 12 86 207 Benign prostatic hypertrophy 302 302 0 0 174 128 0 0 0Skin diseases 230 96 134 5 45 46 5 50 79Musculoskeletal diseases 5 237 2 116 3 121 35 1 378 702 63 1 688 1 370 Rheumatoid arthritis 955 268 688 9 173 85 34 474 179 Osteoarthritis 2 777 1 107 1 670 0 630 477 0 735 934Congenital abnormalities 1 606 839 767 737 91 11 683 71 13Oral diseases 840 411 429 105 231 75 100 226 103 Dental caries 507 257 251 104 128 24 99 121 30 Periodontal disease 38 19 19 0 18 1 0 18 1 Edentulism 287 132 155 0 83 49 0 85 70III. Injuries 11 222 8 007 3 215 744 6 568 694 455 2 238 523Unintentional 7 595 5 264 2 331 654 4 113 497 396 1 503 432 Road traffic accidents 3 127 2 262 865 180 1 964 118 120 669 75 Poisonings 693 479 214 7 460 11 4 200 11 Falls 1 297 838 459 123 556 159 75 196 188 Fires 187 118 69 29 76 13 22 38 10 Drownings 307 242 65 53 166 23 22 29 14 Other unintentional injuries 1 983 1 325 658 262 891 173 153 371 134Intentional 3 627 2 743 884 91 2 455 197 59 736 90 Self-inflicted injuries 2 616 1 946 670 44 1 717 185 26 562 82 Violence 928 717 211 46 659 12 32 171 8 War and conflict 67 64 2 0 64 0 0 2 0
a See Annex Table C1 for a list of Member States by WHO region and income category.b Estimates for specific causes may not sum to broader cause groupings due to omission of residual categories.c World totals for males and females include residual populations living outside WHO Member States.d For the Americas, Europe and Western Pacific regions, these figures include late effects of polio cases with
onset prior to regional certification of polio eradication in 1994, 2000 and 2002, respectively. e Does not include liver cancer and cirrhosis deaths resulting from chronic hepatitis virus infection.f This category includes ‘Causes arising in the perinatal period’ as defined in the International Classification
of Diseases, and does not include all deaths occurring in the perinatal period.g Includes severe neonatal infections and other non-infectious causes arising in the perinatal period.h Includes macular degeneration and other age-related causes of vision loss not correctable by provision of
glasses or contact lenses, together with deaths due to other sense organ disorders.i Includes myocarditis, pericarditis, endocarditis and cardiomyopathy.
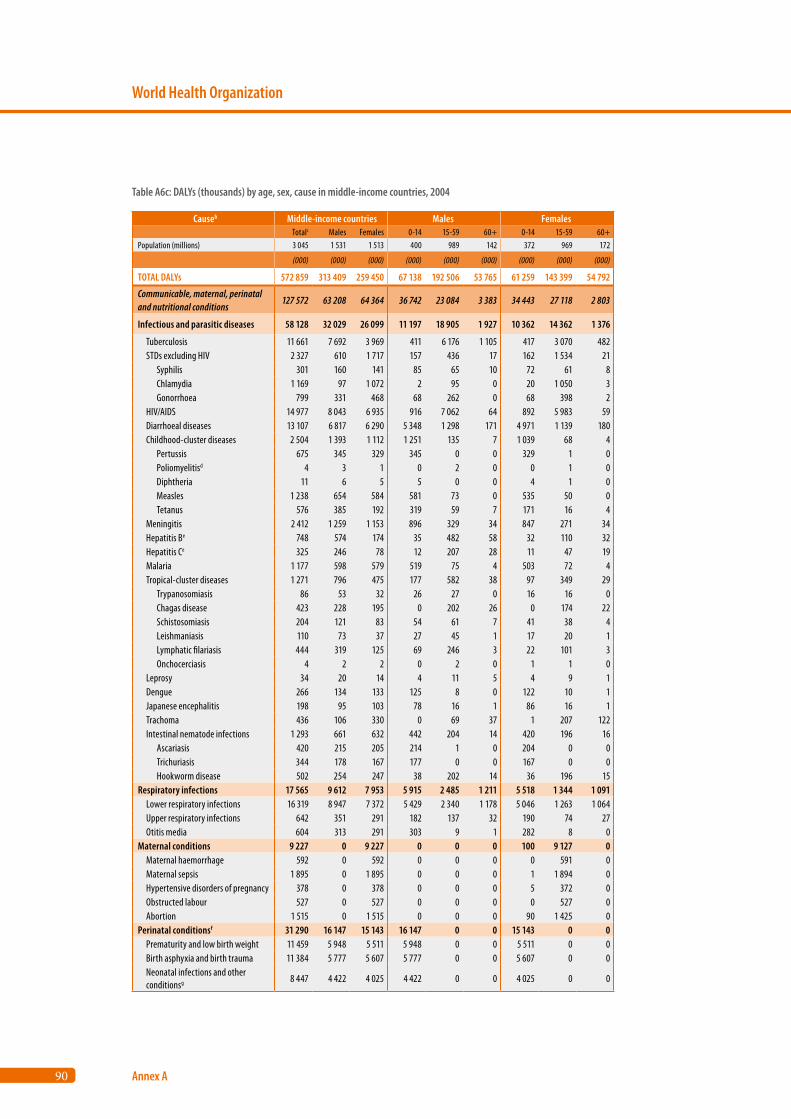
90
World Health Organization
Annex A
Causeb Middle-income countries Males Females Totalc Males Females 0-14 15-59 60+ 0-14 15-59 60+
Population (millions) 3 045 1 531 1 513 400 989 142 372 969 172
(000) (000) (000) (000) (000) (000) (000) (000) (000)
TOTAL DALYs 572 859 313 409 259 450 67 138 192 506 53 765 61 259 143 399 54 792
Communicable, maternal, perinatal and nutritional conditions
127 572 63 208 64 364 36 742 23 084 3 383 34 443 27 118 2 803
Infectious and parasitic diseases 58 128 32 029 26 099 11 197 18 905 1 927 10 362 14 362 1 376
Tuberculosis 11 661 7 692 3 969 411 6 176 1 105 417 3 070 482 STDs excluding HIV 2 327 610 1 717 157 436 17 162 1 534 21 Syphilis 301 160 141 85 65 10 72 61 8 Chlamydia 1 169 97 1 072 2 95 0 20 1 050 3 Gonorrhoea 799 331 468 68 262 0 68 398 2 HIV/AIDS 14 977 8 043 6 935 916 7 062 64 892 5 983 59 Diarrhoeal diseases 13 107 6 817 6 290 5 348 1 298 171 4 971 1 139 180 Childhood-cluster diseases 2 504 1 393 1 112 1 251 135 7 1 039 68 4 Pertussis 675 345 329 345 0 0 329 1 0 Poliomyelitisd 4 3 1 0 2 0 0 1 0 Diphtheria 11 6 5 5 0 0 4 1 0 Measles 1 238 654 584 581 73 0 535 50 0 Tetanus 576 385 192 319 59 7 171 16 4 Meningitis 2 412 1 259 1 153 896 329 34 847 271 34 Hepatitis Be 748 574 174 35 482 58 32 110 32 Hepatitis Ce 325 246 78 12 207 28 11 47 19 Malaria 1 177 598 579 519 75 4 503 72 4 Tropical-cluster diseases 1 271 796 475 177 582 38 97 349 29 Trypanosomiasis 86 53 32 26 27 0 16 16 0 Chagas disease 423 228 195 0 202 26 0 174 22 Schistosomiasis 204 121 83 54 61 7 41 38 4 Leishmaniasis 110 73 37 27 45 1 17 20 1 Lymphatic filariasis 444 319 125 69 246 3 22 101 3 Onchocerciasis 4 2 2 0 2 0 1 1 0 Leprosy 34 20 14 4 11 5 4 9 1 Dengue 266 134 133 125 8 0 122 10 1 Japanese encephalitis 198 95 103 78 16 1 86 16 1 Trachoma 436 106 330 0 69 37 1 207 122 Intestinal nematode infections 1 293 661 632 442 204 14 420 196 16 Ascariasis 420 215 205 214 1 0 204 0 0 Trichuriasis 344 178 167 177 0 0 167 0 0 Hookworm disease 502 254 247 38 202 14 36 196 15Respiratory infections 17 565 9 612 7 953 5 915 2 485 1 211 5 518 1 344 1 091 Lower respiratory infections 16 319 8 947 7 372 5 429 2 340 1 178 5 046 1 263 1 064 Upper respiratory infections 642 351 291 182 137 32 190 74 27 Otitis media 604 313 291 303 9 1 282 8 0Maternal conditions 9 227 0 9 227 0 0 0 100 9 127 0 Maternal haemorrhage 592 0 592 0 0 0 0 591 0 Maternal sepsis 1 895 0 1 895 0 0 0 1 1 894 0 Hypertensive disorders of pregnancy 378 0 378 0 0 0 5 372 0 Obstructed labour 527 0 527 0 0 0 0 527 0 Abortion 1 515 0 1 515 0 0 0 90 1 425 0Perinatal conditionsf 31 290 16 147 15 143 16 147 0 0 15 143 0 0 Prematurity and low birth weight 11 459 5 948 5 511 5 948 0 0 5 511 0 0 Birth asphyxia and birth trauma 11 384 5 777 5 607 5 777 0 0 5 607 0 0 Neonatal infections and other conditionsg 8 447 4 422 4 025 4 422 0 0 4 025 0 0
Table A6c: DALYs (thousands) by age, sex, cause in middle-income countries, 2004
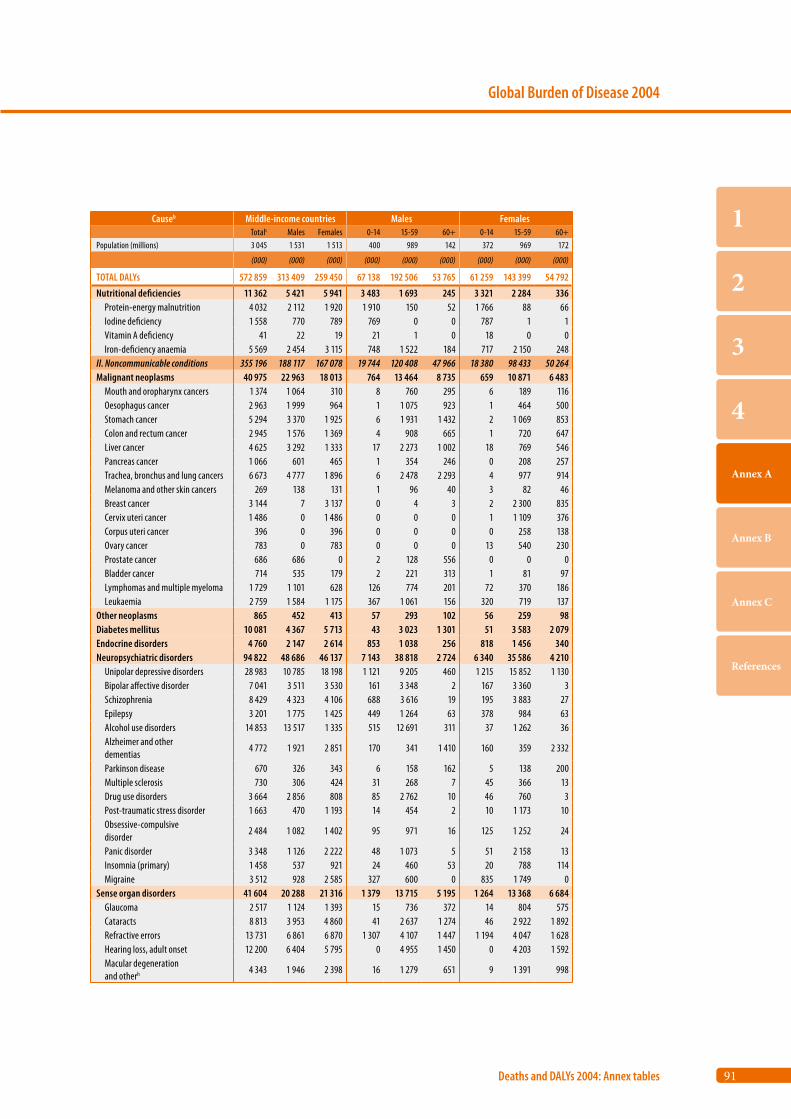
91
Global Burden of Disease 2004
Deaths and DALYs 2004: Annex tables
1
2
3
4
Annex A
Annex B
Annex C
References
Causeb Middle-income countries Males Females Totalc Males Females 0-14 15-59 60+ 0-14 15-59 60+
Population (millions) 3 045 1 531 1 513 400 989 142 372 969 172
(000) (000) (000) (000) (000) (000) (000) (000) (000)
TOTAL DALYs 572 859 313 409 259 450 67 138 192 506 53 765 61 259 143 399 54 792
Nutritional deficiencies 11 362 5 421 5 941 3 483 1 693 245 3 321 2 284 336 Protein-energy malnutrition 4 032 2 112 1 920 1 910 150 52 1 766 88 66 Iodine deficiency 1 558 770 789 769 0 0 787 1 1 Vitamin A deficiency 41 22 19 21 1 0 18 0 0 Iron-deficiency anaemia 5 569 2 454 3 115 748 1 522 184 717 2 150 248II. Noncommunicable conditions 355 196 188 117 167 078 19 744 120 408 47 966 18 380 98 433 50 264Malignant neoplasms 40 975 22 963 18 013 764 13 464 8 735 659 10 871 6 483 Mouth and oropharynx cancers 1 374 1 064 310 8 760 295 6 189 116 Oesophagus cancer 2 963 1 999 964 1 1 075 923 1 464 500 Stomach cancer 5 294 3 370 1 925 6 1 931 1 432 2 1 069 853 Colon and rectum cancer 2 945 1 576 1 369 4 908 665 1 720 647 Liver cancer 4 625 3 292 1 333 17 2 273 1 002 18 769 546 Pancreas cancer 1 066 601 465 1 354 246 0 208 257 Trachea, bronchus and lung cancers 6 673 4 777 1 896 6 2 478 2 293 4 977 914 Melanoma and other skin cancers 269 138 131 1 96 40 3 82 46 Breast cancer 3 144 7 3 137 0 4 3 2 2 300 835 Cervix uteri cancer 1 486 0 1 486 0 0 0 1 1 109 376 Corpus uteri cancer 396 0 396 0 0 0 0 258 138 Ovary cancer 783 0 783 0 0 0 13 540 230 Prostate cancer 686 686 0 2 128 556 0 0 0 Bladder cancer 714 535 179 2 221 313 1 81 97 Lymphomas and multiple myeloma 1 729 1 101 628 126 774 201 72 370 186 Leukaemia 2 759 1 584 1 175 367 1 061 156 320 719 137Other neoplasms 865 452 413 57 293 102 56 259 98Diabetes mellitus 10 081 4 367 5 713 43 3 023 1 301 51 3 583 2 079Endocrine disorders 4 760 2 147 2 614 853 1 038 256 818 1 456 340Neuropsychiatric disorders 94 822 48 686 46 137 7 143 38 818 2 724 6 340 35 586 4 210 Unipolar depressive disorders 28 983 10 785 18 198 1 121 9 205 460 1 215 15 852 1 130 Bipolar affective disorder 7 041 3 511 3 530 161 3 348 2 167 3 360 3 Schizophrenia 8 429 4 323 4 106 688 3 616 19 195 3 883 27 Epilepsy 3 201 1 775 1 425 449 1 264 63 378 984 63 Alcohol use disorders 14 853 13 517 1 335 515 12 691 311 37 1 262 36 Alzheimer and other dementias
4 772 1 921 2 851 170 341 1 410 160 359 2 332
Parkinson disease 670 326 343 6 158 162 5 138 200 Multiple sclerosis 730 306 424 31 268 7 45 366 13 Drug use disorders 3 664 2 856 808 85 2 762 10 46 760 3 Post-traumatic stress disorder 1 663 470 1 193 14 454 2 10 1 173 10 Obsessive-compulsive disorder
2 484 1 082 1 402 95 971 16 125 1 252 24
Panic disorder 3 348 1 126 2 222 48 1 073 5 51 2 158 13 Insomnia (primary) 1 458 537 921 24 460 53 20 788 114 Migraine 3 512 928 2 585 327 600 0 835 1 749 0Sense organ disorders 41 604 20 288 21 316 1 379 13 715 5 195 1 264 13 368 6 684 Glaucoma 2 517 1 124 1 393 15 736 372 14 804 575 Cataracts 8 813 3 953 4 860 41 2 637 1 274 46 2 922 1 892 Refractive errors 13 731 6 861 6 870 1 307 4 107 1 447 1 194 4 047 1 628 Hearing loss, adult onset 12 200 6 404 5 795 0 4 955 1 450 0 4 203 1 592 Macular degeneration and otherh 4 343 1 946 2 398 16 1 279 651 9 1 391 998

92
World Health Organization
Annex A
Causeb Middle-income countries Males Females Totalc Males Females 0-14 15-59 60+ 0-14 15-59 60+
Population (millions) 3 045 1 531 1 513 400 989 142 372 969 172
(000) (000) (000) (000) (000) (000) (000) (000) (000)
TOTAL DALYs 572 859 313 409 259 450 67 138 192 506 53 765 61 259 143 399 54 792
Cardiovascular diseases 76 204 42 151 34 053 814 22 230 19 107 796 12 856 20 401 Rheumatic heart disease 2 050 812 1 238 57 600 154 68 813 356 Hypertensive heart disease 4 769 2 496 2 273 21 1 095 1 380 17 752 1 504 Ischaemic heart disease 28 866 17 179 11 687 36 9 501 7 641 29 3 998 7 659 Cerebrovascular disease 27 529 14 467 13 062 187 6 561 7 720 156 4 681 8 225 Inflammatory heart diseasesi 2 806 1 759 1 047 99 1 181 479 83 482 481Respiratory diseases 29 044 16 936 12 109 1 968 8 972 5 995 1 943 5 163 5 002 Chronic obstructive pulmonary disease
16 123 9 586 6 536 42 4 447 5 098 37 2 281 4 218
Asthma 6 897 3 800 3 097 1 291 2 294 216 1 420 1 484 193Digestive diseases 19 259 11 836 7 423 1 251 8 553 2 032 1 181 4 518 1 724 Peptic ulcer disease 1 898 1 252 646 52 921 279 36 409 201 Cirrhosis of the liver 6 731 4 625 2 106 67 3 681 877 59 1 467 581 Appendicitis 191 116 76 19 84 13 15 48 13Diseases of the genitourinary system 7 008 4 049 2 959 251 2 906 891 248 1 945 767 Nephritis and nephrosis 3 858 2 019 1 839 187 1 296 536 191 1 083 565 Benign prostatic hypertrophy 1 372 1 372 0 0 1 177 196 0 0 0Skin diseases 1 809 841 967 168 573 100 147 660 160Musculoskeletal diseases 16 288 7 054 9 234 296 5 580 1 177 391 6 972 1 871 Rheumatoid arthritis 2 655 718 1 937 56 552 111 157 1 517 262 Osteoarthritis 8 425 3 234 5 191 2 2 464 768 2 3 968 1 220Congenital abnormalities 8 530 4 418 4 112 4 099 307 12 3 872 230 10Oral diseases 3 946 1 930 2 016 656 935 339 614 967 435 Dental caries 2 459 1 243 1 216 649 528 66 608 527 81 Periodontal disease 121 60 61 0 55 5 0 55 6 Edentulism 1 319 607 712 0 342 265 0 368 345III. Injuries 90 092 62 083 28 009 10 653 49 014 2 416 8 435 17 848 1 725Unintentional 65 905 43 401 22 504 9 832 31 806 1 763 7 873 13 320 1 312 Road traffic accidents 21 382 15 328 6 053 1 847 12 950 531 1 459 4 301 293 Poisonings 3 687 2 572 1 115 169 2 276 127 183 842 91 Falls 8 640 5 396 3 244 1 312 3 716 367 1 261 1 636 347 Fires 2 196 1 121 1 074 370 702 49 384 637 53 Drownings 5 573 3 856 1 717 1 673 2 079 104 929 710 78 Other unintentional injuries 24 428 15 127 9 301 4 460 10 083 584 3 657 5 194 450Intentional 24 187 18 682 5 504 821 17 208 653 562 4 528 413 Self-inflicted injuries 8 516 5 040 3 476 193 4 385 461 200 2 935 341 Violence 11 967 10 292 1 675 432 9 722 139 220 1 396 58 War and conflict 3 493 3 166 327 192 2 924 50 140 174 13
a See Annex Table C1 for a list of Member States by WHO region and income category.b Estimates for specific causes may not sum to broader cause groupings due to omission of residual categories.c World totals for males and females include residual populations living outside WHO Member States.d For the Americas, Europe and Western Pacific regions, these figures include late effects of polio cases with
onset prior to regional certification of polio eradication in 1994, 2000 and 2002, respectively. e Does not include liver cancer and cirrhosis deaths resulting from chronic hepatitis virus infection.f This category includes ‘Causes arising in the perinatal period’ as defined in the International Classification
of Diseases, and does not include all deaths occurring in the perinatal period.g Includes severe neonatal infections and other non-infectious causes arising in the perinatal period.h Includes macular degeneration and other age-related causes of vision loss not correctable by provision of
glasses or contact lenses, together with deaths due to other sense organ disorders.i Includes myocarditis, pericarditis, endocarditis and cardiomyopathy.
(Table A6c continued)
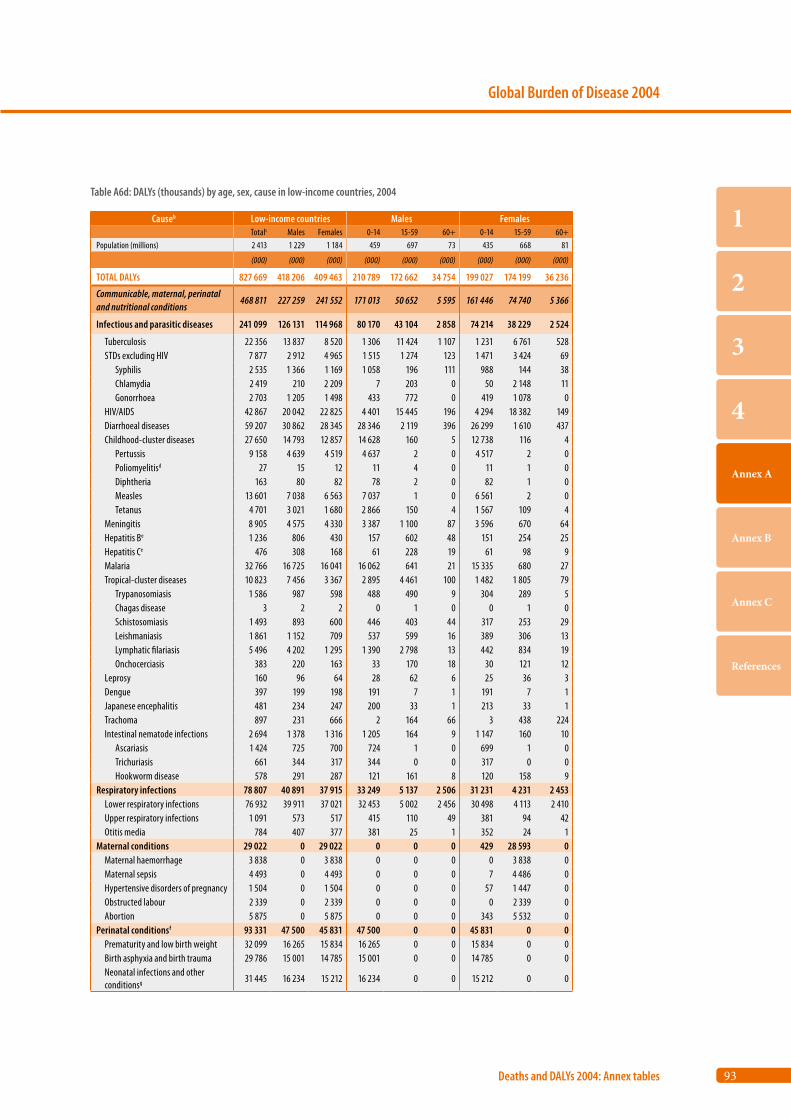
93
Global Burden of Disease 2004
Deaths and DALYs 2004: Annex tables
1
2
3
4
Annex A
Annex B
Annex C
References
Causeb Low-income countries Males Females Totalc Males Females 0-14 15-59 60+ 0-14 15-59 60+
Population (millions) 2 413 1 229 1 184 459 697 73 435 668 81
(000) (000) (000) (000) (000) (000) (000) (000) (000)
TOTAL DALYs 827 669 418 206 409 463 210 789 172 662 34 754 199 027 174 199 36 236
Communicable, maternal, perinatal and nutritional conditions
468 811 227 259 241 552 171 013 50 652 5 595 161 446 74 740 5 366
Infectious and parasitic diseases 241 099 126 131 114 968 80 170 43 104 2 858 74 214 38 229 2 524
Tuberculosis 22 356 13 837 8 520 1 306 11 424 1 107 1 231 6 761 528 STDs excluding HIV 7 877 2 912 4 965 1 515 1 274 123 1 471 3 424 69 Syphilis 2 535 1 366 1 169 1 058 196 111 988 144 38 Chlamydia 2 419 210 2 209 7 203 0 50 2 148 11 Gonorrhoea 2 703 1 205 1 498 433 772 0 419 1 078 0 HIV/AIDS 42 867 20 042 22 825 4 401 15 445 196 4 294 18 382 149 Diarrhoeal diseases 59 207 30 862 28 345 28 346 2 119 396 26 299 1 610 437 Childhood-cluster diseases 27 650 14 793 12 857 14 628 160 5 12 738 116 4 Pertussis 9 158 4 639 4 519 4 637 2 0 4 517 2 0 Poliomyelitisd 27 15 12 11 4 0 11 1 0 Diphtheria 163 80 82 78 2 0 82 1 0 Measles 13 601 7 038 6 563 7 037 1 0 6 561 2 0 Tetanus 4 701 3 021 1 680 2 866 150 4 1 567 109 4 Meningitis 8 905 4 575 4 330 3 387 1 100 87 3 596 670 64 Hepatitis Be 1 236 806 430 157 602 48 151 254 25 Hepatitis Ce 476 308 168 61 228 19 61 98 9 Malaria 32 766 16 725 16 041 16 062 641 21 15 335 680 27 Tropical-cluster diseases 10 823 7 456 3 367 2 895 4 461 100 1 482 1 805 79 Trypanosomiasis 1 586 987 598 488 490 9 304 289 5 Chagas disease 3 2 2 0 1 0 0 1 0 Schistosomiasis 1 493 893 600 446 403 44 317 253 29 Leishmaniasis 1 861 1 152 709 537 599 16 389 306 13 Lymphatic filariasis 5 496 4 202 1 295 1 390 2 798 13 442 834 19 Onchocerciasis 383 220 163 33 170 18 30 121 12 Leprosy 160 96 64 28 62 6 25 36 3 Dengue 397 199 198 191 7 1 191 7 1 Japanese encephalitis 481 234 247 200 33 1 213 33 1 Trachoma 897 231 666 2 164 66 3 438 224 Intestinal nematode infections 2 694 1 378 1 316 1 205 164 9 1 147 160 10 Ascariasis 1 424 725 700 724 1 0 699 1 0 Trichuriasis 661 344 317 344 0 0 317 0 0 Hookworm disease 578 291 287 121 161 8 120 158 9Respiratory infections 78 807 40 891 37 915 33 249 5 137 2 506 31 231 4 231 2 453 Lower respiratory infections 76 932 39 911 37 021 32 453 5 002 2 456 30 498 4 113 2 410 Upper respiratory infections 1 091 573 517 415 110 49 381 94 42 Otitis media 784 407 377 381 25 1 352 24 1Maternal conditions 29 022 0 29 022 0 0 0 429 28 593 0 Maternal haemorrhage 3 838 0 3 838 0 0 0 0 3 838 0 Maternal sepsis 4 493 0 4 493 0 0 0 7 4 486 0 Hypertensive disorders of pregnancy 1 504 0 1 504 0 0 0 57 1 447 0 Obstructed labour 2 339 0 2 339 0 0 0 0 2 339 0 Abortion 5 875 0 5 875 0 0 0 343 5 532 0Perinatal conditionsf 93 331 47 500 45 831 47 500 0 0 45 831 0 0 Prematurity and low birth weight 32 099 16 265 15 834 16 265 0 0 15 834 0 0 Birth asphyxia and birth trauma 29 786 15 001 14 785 15 001 0 0 14 785 0 0 Neonatal infections and other conditionsg 31 445 16 234 15 212 16 234 0 0 15 212 0 0
Table A6d: DALYs (thousands) by age, sex, cause in low-income countries, 2004
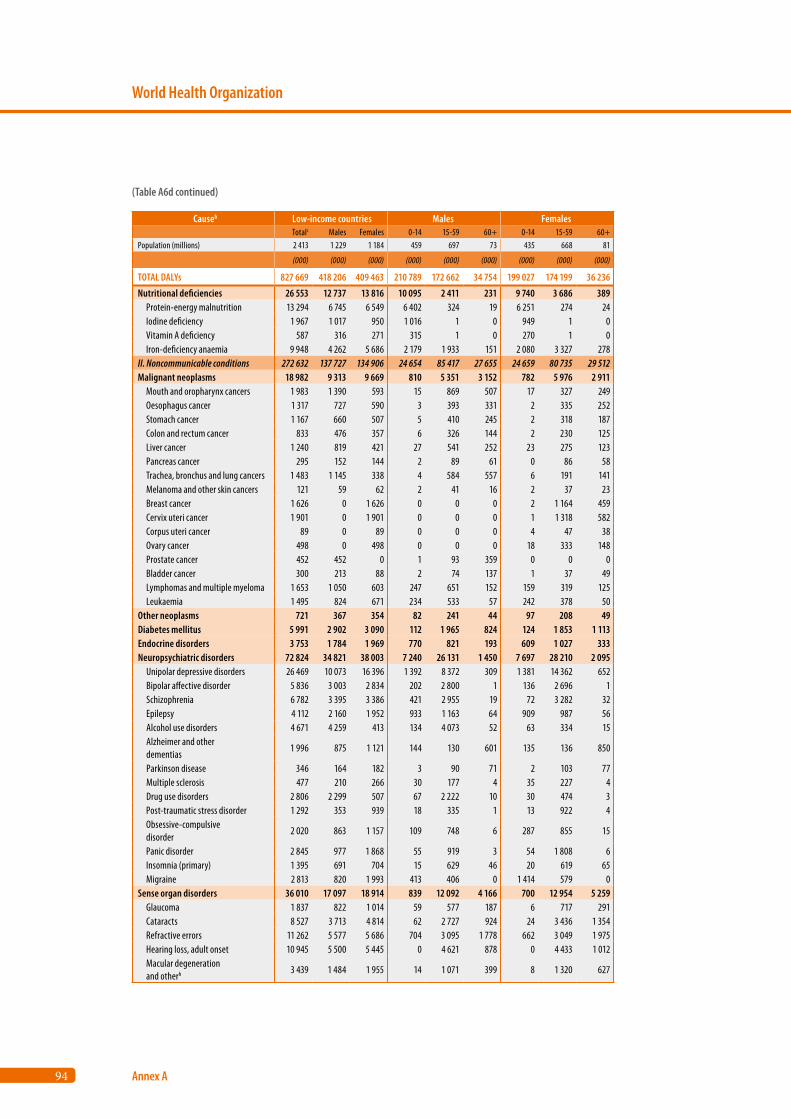
94
World Health Organization
Annex A
Causeb Low-income countries Males Females Totalc Males Females 0-14 15-59 60+ 0-14 15-59 60+
Population (millions) 2 413 1 229 1 184 459 697 73 435 668 81
(000) (000) (000) (000) (000) (000) (000) (000) (000)
TOTAL DALYs 827 669 418 206 409 463 210 789 172 662 34 754 199 027 174 199 36 236
Nutritional deficiencies 26 553 12 737 13 816 10 095 2 411 231 9 740 3 686 389 Protein-energy malnutrition 13 294 6 745 6 549 6 402 324 19 6 251 274 24 Iodine deficiency 1 967 1 017 950 1 016 1 0 949 1 0 Vitamin A deficiency 587 316 271 315 1 0 270 1 0 Iron-deficiency anaemia 9 948 4 262 5 686 2 179 1 933 151 2 080 3 327 278II. Noncommunicable conditions 272 632 137 727 134 906 24 654 85 417 27 655 24 659 80 735 29 512Malignant neoplasms 18 982 9 313 9 669 810 5 351 3 152 782 5 976 2 911 Mouth and oropharynx cancers 1 983 1 390 593 15 869 507 17 327 249 Oesophagus cancer 1 317 727 590 3 393 331 2 335 252 Stomach cancer 1 167 660 507 5 410 245 2 318 187 Colon and rectum cancer 833 476 357 6 326 144 2 230 125 Liver cancer 1 240 819 421 27 541 252 23 275 123 Pancreas cancer 295 152 144 2 89 61 0 86 58 Trachea, bronchus and lung cancers 1 483 1 145 338 4 584 557 6 191 141 Melanoma and other skin cancers 121 59 62 2 41 16 2 37 23 Breast cancer 1 626 0 1 626 0 0 0 2 1 164 459 Cervix uteri cancer 1 901 0 1 901 0 0 0 1 1 318 582 Corpus uteri cancer 89 0 89 0 0 0 4 47 38 Ovary cancer 498 0 498 0 0 0 18 333 148 Prostate cancer 452 452 0 1 93 359 0 0 0 Bladder cancer 300 213 88 2 74 137 1 37 49 Lymphomas and multiple myeloma 1 653 1 050 603 247 651 152 159 319 125 Leukaemia 1 495 824 671 234 533 57 242 378 50Other neoplasms 721 367 354 82 241 44 97 208 49Diabetes mellitus 5 991 2 902 3 090 112 1 965 824 124 1 853 1 113Endocrine disorders 3 753 1 784 1 969 770 821 193 609 1 027 333Neuropsychiatric disorders 72 824 34 821 38 003 7 240 26 131 1 450 7 697 28 210 2 095 Unipolar depressive disorders 26 469 10 073 16 396 1 392 8 372 309 1 381 14 362 652 Bipolar affective disorder 5 836 3 003 2 834 202 2 800 1 136 2 696 1 Schizophrenia 6 782 3 395 3 386 421 2 955 19 72 3 282 32 Epilepsy 4 112 2 160 1 952 933 1 163 64 909 987 56 Alcohol use disorders 4 671 4 259 413 134 4 073 52 63 334 15 Alzheimer and other dementias
1 996 875 1 121 144 130 601 135 136 850
Parkinson disease 346 164 182 3 90 71 2 103 77 Multiple sclerosis 477 210 266 30 177 4 35 227 4 Drug use disorders 2 806 2 299 507 67 2 222 10 30 474 3 Post-traumatic stress disorder 1 292 353 939 18 335 1 13 922 4 Obsessive-compulsive disorder
2 020 863 1 157 109 748 6 287 855 15
Panic disorder 2 845 977 1 868 55 919 3 54 1 808 6 Insomnia (primary) 1 395 691 704 15 629 46 20 619 65 Migraine 2 813 820 1 993 413 406 0 1 414 579 0Sense organ disorders 36 010 17 097 18 914 839 12 092 4 166 700 12 954 5 259 Glaucoma 1 837 822 1 014 59 577 187 6 717 291 Cataracts 8 527 3 713 4 814 62 2 727 924 24 3 436 1 354 Refractive errors 11 262 5 577 5 686 704 3 095 1 778 662 3 049 1 975 Hearing loss, adult onset 10 945 5 500 5 445 0 4 621 878 0 4 433 1 012 Macular degeneration and otherh 3 439 1 484 1 955 14 1 071 399 8 1 320 627
(Table A6d continued)
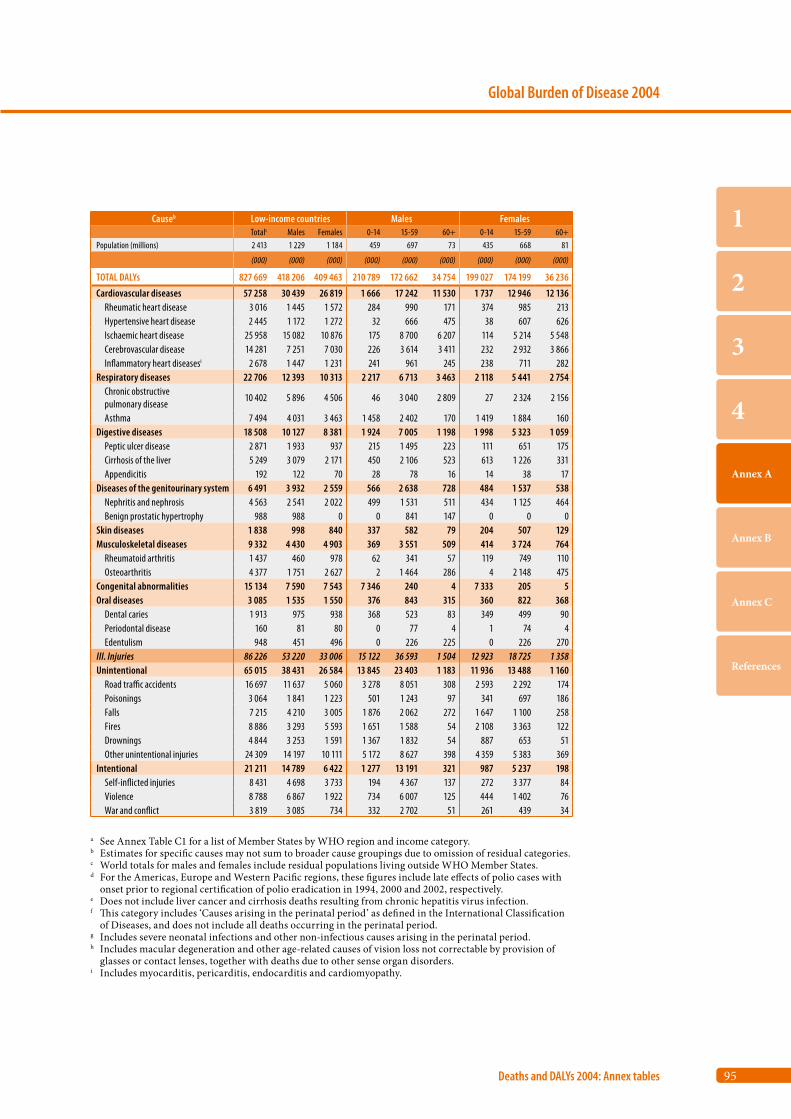
95
Global Burden of Disease 2004
Deaths and DALYs 2004: Annex tables
1
2
3
4
Annex A
Annex B
Annex C
References
Causeb Low-income countries Males Females Totalc Males Females 0-14 15-59 60+ 0-14 15-59 60+
Population (millions) 2 413 1 229 1 184 459 697 73 435 668 81
(000) (000) (000) (000) (000) (000) (000) (000) (000)
TOTAL DALYs 827 669 418 206 409 463 210 789 172 662 34 754 199 027 174 199 36 236
Cardiovascular diseases 57 258 30 439 26 819 1 666 17 242 11 530 1 737 12 946 12 136 Rheumatic heart disease 3 016 1 445 1 572 284 990 171 374 985 213 Hypertensive heart disease 2 445 1 172 1 272 32 666 475 38 607 626 Ischaemic heart disease 25 958 15 082 10 876 175 8 700 6 207 114 5 214 5 548 Cerebrovascular disease 14 281 7 251 7 030 226 3 614 3 411 232 2 932 3 866 Inflammatory heart diseasesi 2 678 1 447 1 231 241 961 245 238 711 282Respiratory diseases 22 706 12 393 10 313 2 217 6 713 3 463 2 118 5 441 2 754 Chronic obstructive pulmonary disease
10 402 5 896 4 506 46 3 040 2 809 27 2 324 2 156
Asthma 7 494 4 031 3 463 1 458 2 402 170 1 419 1 884 160Digestive diseases 18 508 10 127 8 381 1 924 7 005 1 198 1 998 5 323 1 059 Peptic ulcer disease 2 871 1 933 937 215 1 495 223 111 651 175 Cirrhosis of the liver 5 249 3 079 2 171 450 2 106 523 613 1 226 331 Appendicitis 192 122 70 28 78 16 14 38 17Diseases of the genitourinary system 6 491 3 932 2 559 566 2 638 728 484 1 537 538 Nephritis and nephrosis 4 563 2 541 2 022 499 1 531 511 434 1 125 464 Benign prostatic hypertrophy 988 988 0 0 841 147 0 0 0Skin diseases 1 838 998 840 337 582 79 204 507 129Musculoskeletal diseases 9 332 4 430 4 903 369 3 551 509 414 3 724 764 Rheumatoid arthritis 1 437 460 978 62 341 57 119 749 110 Osteoarthritis 4 377 1 751 2 627 2 1 464 286 4 2 148 475Congenital abnormalities 15 134 7 590 7 543 7 346 240 4 7 333 205 5Oral diseases 3 085 1 535 1 550 376 843 315 360 822 368 Dental caries 1 913 975 938 368 523 83 349 499 90 Periodontal disease 160 81 80 0 77 4 1 74 4 Edentulism 948 451 496 0 226 225 0 226 270III. Injuries 86 226 53 220 33 006 15 122 36 593 1 504 12 923 18 725 1 358Unintentional 65 015 38 431 26 584 13 845 23 403 1 183 11 936 13 488 1 160 Road traffic accidents 16 697 11 637 5 060 3 278 8 051 308 2 593 2 292 174 Poisonings 3 064 1 841 1 223 501 1 243 97 341 697 186 Falls 7 215 4 210 3 005 1 876 2 062 272 1 647 1 100 258 Fires 8 886 3 293 5 593 1 651 1 588 54 2 108 3 363 122 Drownings 4 844 3 253 1 591 1 367 1 832 54 887 653 51 Other unintentional injuries 24 309 14 197 10 111 5 172 8 627 398 4 359 5 383 369Intentional 21 211 14 789 6 422 1 277 13 191 321 987 5 237 198 Self-inflicted injuries 8 431 4 698 3 733 194 4 367 137 272 3 377 84 Violence 8 788 6 867 1 922 734 6 007 125 444 1 402 76 War and conflict 3 819 3 085 734 332 2 702 51 261 439 34
a See Annex Table C1 for a list of Member States by WHO region and income category.b Estimates for specific causes may not sum to broader cause groupings due to omission of residual categories.c World totals for males and females include residual populations living outside WHO Member States.d For the Americas, Europe and Western Pacific regions, these figures include late effects of polio cases with
onset prior to regional certification of polio eradication in 1994, 2000 and 2002, respectively. e Does not include liver cancer and cirrhosis deaths resulting from chronic hepatitis virus infection.f This category includes ‘Causes arising in the perinatal period’ as defined in the International Classification
of Diseases, and does not include all deaths occurring in the perinatal period.g Includes severe neonatal infections and other non-infectious causes arising in the perinatal period.h Includes macular degeneration and other age-related causes of vision loss not correctable by provision of
glasses or contact lenses, together with deaths due to other sense organ disorders.i Includes myocarditis, pericarditis, endocarditis and cardiomyopathy.

Annex B
Data sources and methods
B1. Population and all-cause mortality estimates for 2004 98
B2. Estimation of deaths by cause 98
B3. Causes of death for children aged under five years 103
B4. YLD revisions 106
B5. Cause-specific revisions and updates 106
B6. Prevalence of long-term disability 116
B7. Projections of mortality and burden of disease 117
B8. Uncertainty of estimates and projections 117
98
World Health Organization
Annex B
This update of the Global Burden of Disease (GBD) Study for the year 2004 uses the same general meth-ods as previous revisions carried out by the World Health Organization (WHO) for 2001 and 2002 (11). Country groupings and regions used in this report are defined in Tables C1 and C2 (Annex C). GBD 2004 estimates are also available for other regional groupings on the WHO web site.a Table C3 (Annex C) lists the GBD cause categories and their definitions in terms of the International classification of diseases, tenth revision (ICD-10). The GBD cause categories are grouped into three broad cause groups: Group I (communicable, maternal, perinatal and nutritional conditions), Group II (noncommunicable diseases) and Group III (injuries). General methods and data sources for the GBD estimates have been docu-mented elsewhere (11); this part of the report docu-ments the specific revisions for the 2004 estimates.
Apart from the incorporation of new epidemio-logical data for specific causes, the GBD 2004 has incorporated:• more recent death registration data for many
countries;• new African mortality data using verbal autopsy
methods to assign cause of death;• improvements in methods used for the estima-
tion of causes of child deaths in countries without good death registration data.
For these reasons, and also because of revisions to the United Nations population estimates, the GBD estimates for 2004 are not directly comparable with the previous GBD 2002 estimates.
B1. Population and all-cause mortality estimates for 2004
Life tables for the 192 WHO Member States in 2004 were published in the World health report 2006 (25), with data and methods described in the Sta-tistical Annex Notes. Age- and sex-specific all-cause mortality rates from these life tables were further adjusted for revisions in estimates of human immu-nodeficiency virus (HIV) mortality and deaths due to conflict and natural disasters. These cause-
specific revisions and updates are outlined in Section B5. Total deaths by age and sex were estimated for each Member State by applying these death rates to the estimated 2004 de facto resident populations prepared by the United Nations Population Division in its 2006 revision (13). Total deaths in the neona-tal period (the first four weeks of life) for 2004 were estimated country by country using methods docu-mented elsewhere in collaboration with the Depart-ment of Making Pregnancy Safer (26).
For China, recorded age-specific death rates for ages over five years from the 2000 census were adjusted for estimated underreporting of 11.3% for males and 18.1% for females (27), projected forward to 2004 assuming an annual rate of mortality decline of 1.5%, based on the estimated rates of mortality for the two intercensal periods, 1982–1990 and 1990–2000. The projection of child mortality rate takes into account other sources of data such as the Child Mortality Surveillance System (28).
For India, the all-cause mortality envelope was derived from a time series analysis of age-specific death rates from the sample registration system for years 1990–2002, after correction for underregis-tration (88% completeness) (29). Child and adult mortality rates were then projected to 2004 using a regression model that gave more weight to recent years of observation. The child mortality rate was projected independently taking into account other sources such as the Demographic and Health Survey 2005/2006 (30).
B2. Estimation of deaths by cause
Death registration data containing usable informa-tion on cause-of-death distributions were available for 112 countries; the majority of these countries were in the high-income group, Latin America and the Caribbean, and Europe and Central Asia. The data sources and methods for estimation of mortal-ity are outlined in Table C4 (Annex C). Population-based epidemiological studies, disease registers and noti-fications systems also contributed to the estimation of mortality due to 21 specific communicable causes of death, including HIV/AIDS (acquired immune
a http://www.who.int/evidence/bod
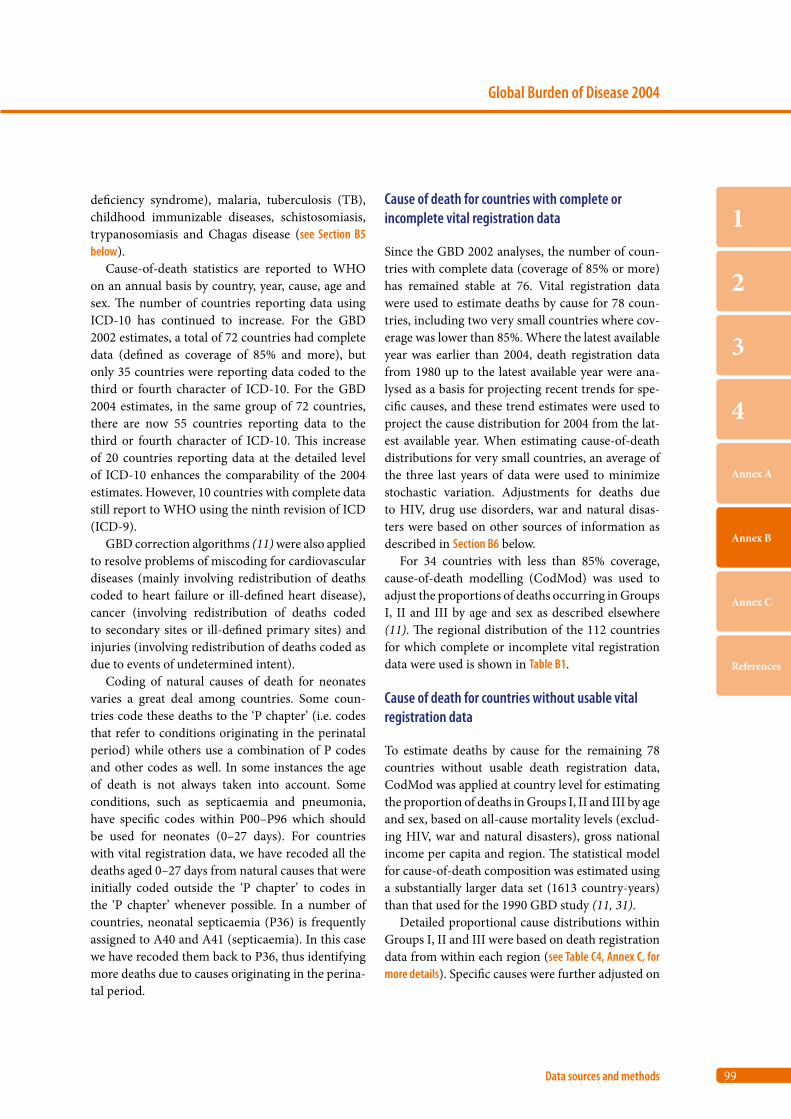
99
Global Burden of Disease 2004
Data sources and methods
1
2
3
4
Annex A
Annex B
Annex C
References
deficiency syndrome), malaria, tuberculosis (TB), childhood immunizable diseases, schistosomiasis, trypanosomiasis and Chagas disease (see Section B5 below).
Cause-of-death statistics are reported to WHO on an annual basis by country, year, cause, age and sex. The number of countries reporting data using ICD-10 has continued to increase. For the GBD 2002 estimates, a total of 72 countries had complete data (defined as coverage of 85% and more), but only 35 countries were reporting data coded to the third or fourth character of ICD-10. For the GBD 2004 estimates, in the same group of 72 countries, there are now 55 countries reporting data to the third or fourth character of ICD-10. This increase of 20 countries reporting data at the detailed level of ICD-10 enhances the comparability of the 2004 estimates. However, 10 countries with complete data still report to WHO using the ninth revision of ICD (ICD-9).
GBD correction algorithms (11) were also applied to resolve problems of miscoding for cardiovascular diseases (mainly involving redistribution of deaths coded to heart failure or ill-defined heart disease), cancer (involving redistribution of deaths coded to secondary sites or ill-defined primary sites) and injuries (involving redistribution of deaths coded as due to events of undetermined intent).
Coding of natural causes of death for neonates varies a great deal among countries. Some coun-tries code these deaths to the ‘P chapter’ (i.e. codes that refer to conditions originating in the perinatal period) while others use a combination of P codes and other codes as well. In some instances the age of death is not always taken into account. Some conditions, such as septicaemia and pneumonia, have specific codes within P00–P96 which should be used for neonates (0–27 days). For countries with vital registration data, we have recoded all the deaths aged 0–27 days from natural causes that were initially coded outside the ‘P chapter’ to codes in the ‘P chapter’ whenever possible. In a number of countries, neonatal septicaemia (P36) is frequently assigned to A40 and A41 (septicaemia). In this case we have recoded them back to P36, thus identifying more deaths due to causes originating in the perina-tal period.
Cause of death for countries with complete or incomplete vital registration data
Since the GBD 2002 analyses, the number of coun-tries with complete data (coverage of 85% or more) has remained stable at 76. Vital registration data were used to estimate deaths by cause for 78 coun-tries, including two very small countries where cov-erage was lower than 85%. Where the latest available year was earlier than 2004, death registration data from 1980 up to the latest available year were ana-lysed as a basis for projecting recent trends for spe-cific causes, and these trend estimates were used to project the cause distribution for 2004 from the lat-est available year. When estimating cause-of-death distributions for very small countries, an average of the three last years of data were used to minimize stochastic variation. Adjustments for deaths due to HIV, drug use disorders, war and natural disas-ters were based on other sources of information as described in Section B6 below.
For 34 countries with less than 85% coverage, cause-of-death modelling (CodMod) was used to adjust the proportions of deaths occurring in Groups I, II and III by age and sex as described elsewhere (11). The regional distribution of the 112 countries for which complete or incomplete vital registration data were used is shown in Table B1.
Cause of death for countries without usable vital registration data
To estimate deaths by cause for the remaining 78 countries without usable death registration data, CodMod was applied at country level for estimating the proportion of deaths in Groups I, II and III by age and sex, based on all-cause mortality levels (exclud-ing HIV, war and natural disasters), gross national income per capita and region. The statistical model for cause-of-death composition was estimated using a substantially larger data set (1613 country-years) than that used for the 1990 GBD study (11, 31).
Detailed proportional cause distributions within Groups I, II and III were based on death registration data from within each region (see Table C4, Annex C, for more details). Specific causes were further adjusted on
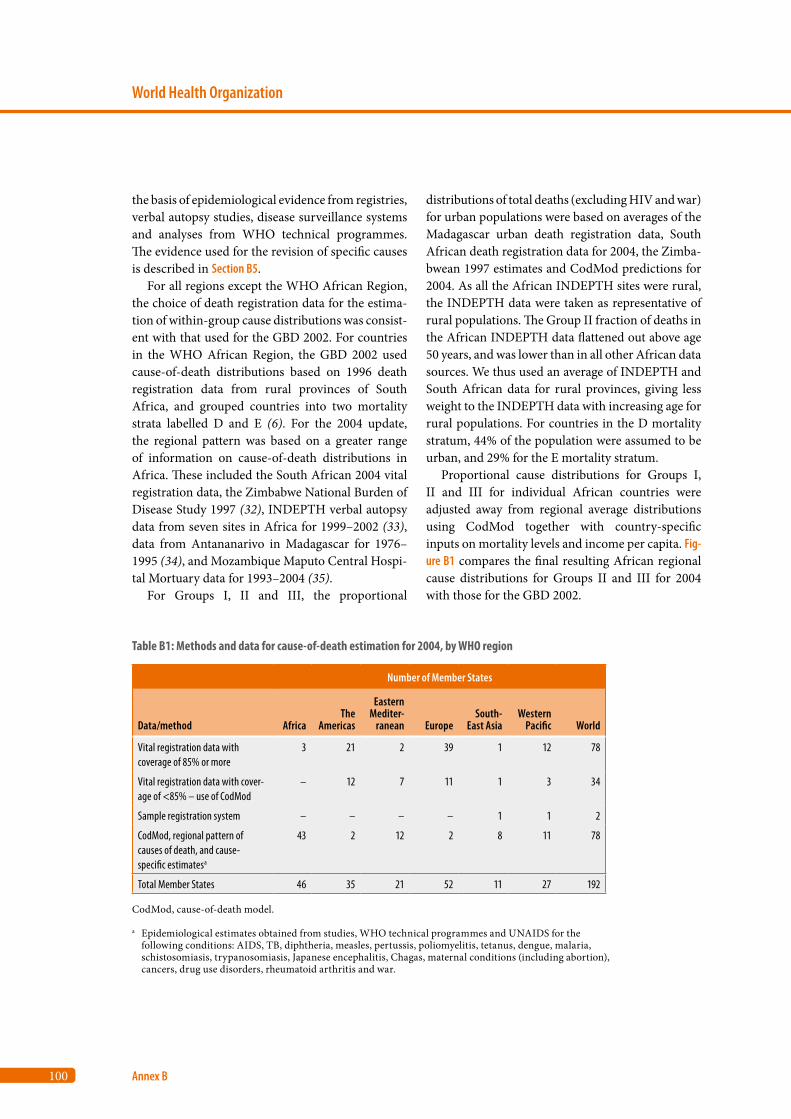
100
World Health Organization
Annex B
the basis of epidemiological evidence from registries, verbal autopsy studies, disease surveillance systems and analyses from WHO technical programmes. The evidence used for the revision of specific causes is described in Section B5.
For all regions except the WHO African Region, the choice of death registration data for the estima-tion of within-group cause distributions was consist-ent with that used for the GBD 2002. For countries in the WHO African Region, the GBD 2002 used cause-of-death distributions based on 1996 death registration data from rural provinces of South Africa, and grouped countries into two mortality strata labelled D and E (6). For the 2004 update, the regional pattern was based on a greater range of information on cause-of-death distributions in Africa. These included the South African 2004 vital registration data, the Zimbabwe National Burden of Disease Study 1997 (32), INDEPTH verbal autopsy data from seven sites in Africa for 1999–2002 (33), data from Antananarivo in Madagascar for 1976–1995 (34), and Mozambique Maputo Central Hospi-tal Mortuary data for 1993–2004 (35).
For Groups I, II and III, the proportional
distributions of total deaths (excluding HIV and war) for urban populations were based on averages of the Madagascar urban death registration data, South African death registration data for 2004, the Zimba-bwean 1997 estimates and CodMod predictions for 2004. As all the African INDEPTH sites were rural, the INDEPTH data were taken as representative of rural populations. The Group II fraction of deaths in the African INDEPTH data flattened out above age 50 years, and was lower than in all other African data sources. We thus used an average of INDEPTH and South African data for rural provinces, giving less weight to the INDEPTH data with increasing age for rural populations. For countries in the D mortality stratum, 44% of the population were assumed to be urban, and 29% for the E mortality stratum.
Proportional cause distributions for Groups I, II and III for individual African countries were adjusted away from regional average distributions using CodMod together with country-specific inputs on mortality levels and income per capita. Fig-ure B1 compares the final resulting African regional cause distributions for Groups II and III for 2004 with those for the GBD 2002.
Table B1: Methods and data for cause-of-death estimation for 2004, by WHO region
Number of Member States
Data/method AfricaThe
Americas
Eastern Mediter-
ranean EuropeSouth-
East AsiaWestern
Pacific World
Vital registration data with coverage of 85% or more
3 21 2 39 1 12 78
Vital registration data with cover-age of <85% – use of CodMod
– 12 7 11 1 3 34
Sample registration system – – – – 1 1 2
CodMod, regional pattern of causes of death, and cause-specific estimatesa
43 2 12 2 8 11 78
Total Member States 46 35 21 52 11 27 192
CodMod, cause-of-death model.
a Epidemiological estimates obtained from studies, WHO technical programmes and UNAIDS for the following conditions: AIDS, TB, diphtheria, measles, pertussis, poliomyelitis, tetanus, dengue, malaria, schistosomiasis, trypanosomiasis, Japanese encephalitis, Chagas, maternal conditions (including abortion), cancers, drug use disorders, rheumatoid arthritis and war.
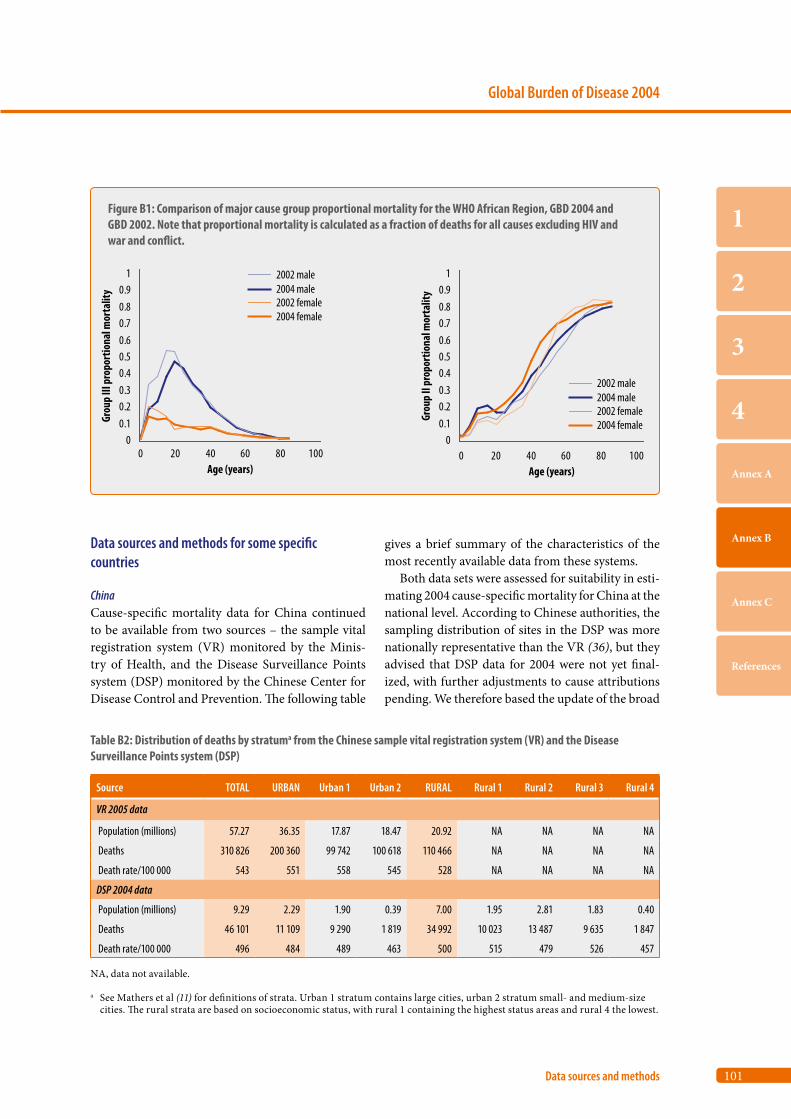
101
Global Burden of Disease 2004
Data sources and methods
1
2
3
4
Annex A
Annex B
Annex C
References
Data sources and methods for some specific countries
ChinaCause-specific mortality data for China continued to be available from two sources – the sample vital registration system (VR) monitored by the Minis-try of Health, and the Disease Surveillance Points system (DSP) monitored by the Chinese Center for Disease Control and Prevention. The following table
gives a brief summary of the characteristics of the most recently available data from these systems.
Both data sets were assessed for suitability in esti-mating 2004 cause-specific mortality for China at the national level. According to Chinese authorities, the sampling distribution of sites in the DSP was more nationally representative than the VR (36), but they advised that DSP data for 2004 were not yet final-ized, with further adjustments to cause attributions pending. We therefore based the update of the broad
Table B2: Distribution of deaths by stratuma from the Chinese sample vital registration system (VR) and the Disease Surveillance Points system (DSP)
Source TOTAL URBAN Urban 1 Urban 2 RURAL Rural 1 Rural 2 Rural 3 Rural 4
VR 2005 data
Population (millions) 57.27 36.35 17.87 18.47 20.92 NA NA NA NA
Deaths 310 826 200 360 99 742 100 618 110 466 NA NA NA NA
Death rate/100 000 543 551 558 545 528 NA NA NA NA
DSP 2004 data
Population (millions) 9.29 2.29 1.90 0.39 7.00 1.95 2.81 1.83 0.40
Deaths 46 101 11 109 9 290 1 819 34 992 10 023 13 487 9 635 1 847
Death rate/100 000 496 484 489 463 500 515 479 526 457
NA, data not available.
a See Mathers et al (11) for definitions of strata. Urban 1 stratum contains large cities, urban 2 stratum small- and medium-size cities. The rural strata are based on socioeconomic status, with rural 1 containing the highest status areas and rural 4 the lowest.
Figure B1: Comparison of major cause group proportional mortality for the WHO African Region, GBD 2004 and GBD 2002. Note that proportional mortality is calculated as a fraction of deaths for all causes excluding HIV and war and conflict.
00.10.20.30.40.50.60.70.80.9
1
0 20 40 60 80 100
Grou
p III
pro
port
iona
l mor
talit
y
00.10.20.30.40.50.60.70.80.9
1
Grou
p II
prop
ortio
nal m
orta
lity
Age (years)0 20 40 60 80 100
Age (years)
2002 male
2002 female2004 female
2004 male
2002 male
2002 female2004 female
2004 male
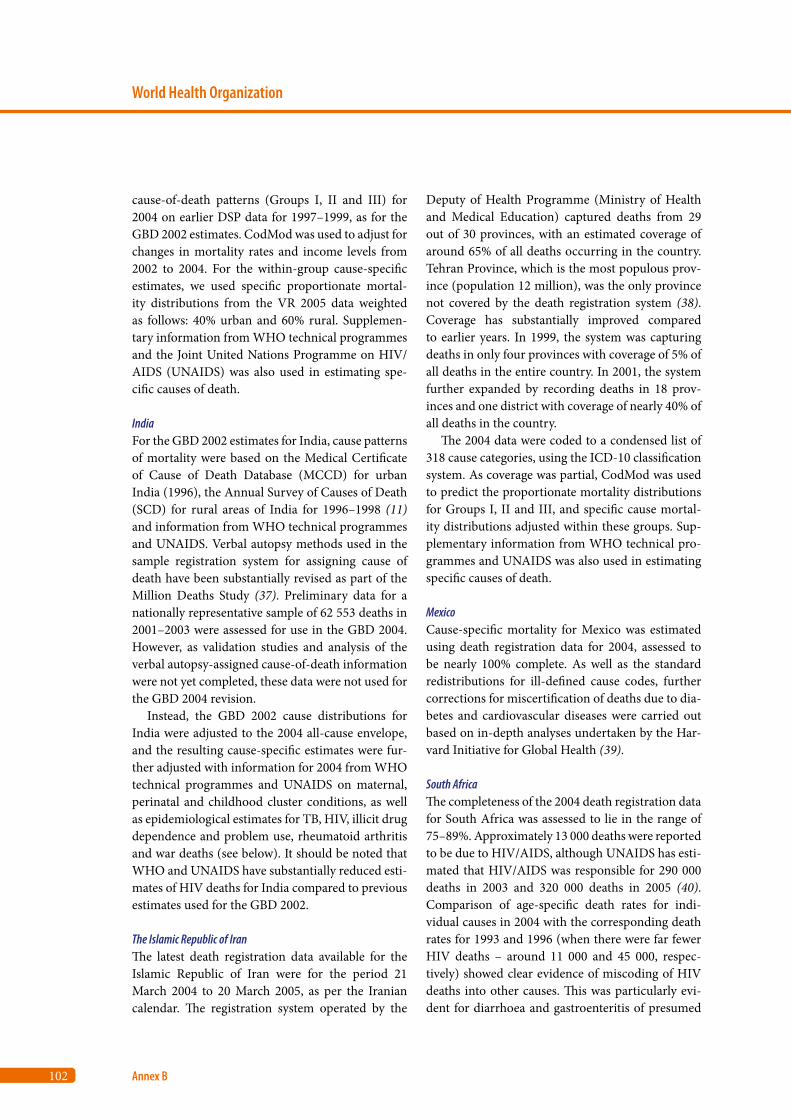
102
World Health Organization
Annex B
cause-of-death patterns (Groups I, II and III) for 2004 on earlier DSP data for 1997–1999, as for the GBD 2002 estimates. CodMod was used to adjust for changes in mortality rates and income levels from 2002 to 2004. For the within-group cause-specific estimates, we used specific proportionate mortal-ity distributions from the VR 2005 data weighted as follows: 40% urban and 60% rural. Supplemen-tary information from WHO technical programmes and the Joint United Nations Programme on HIV/AIDS (UNAIDS) was also used in estimating spe-cific causes of death.
IndiaFor the GBD 2002 estimates for India, cause patterns of mortality were based on the Medical Certificate of Cause of Death Database (MCCD) for urban India (1996), the Annual Survey of Causes of Death (SCD) for rural areas of India for 1996–1998 (11) and information from WHO technical programmes and UNAIDS. Verbal autopsy methods used in the sample registration system for assigning cause of death have been substantially revised as part of the Million Deaths Study (37). Preliminary data for a nationally representative sample of 62 553 deaths in 2001–2003 were assessed for use in the GBD 2004. However, as validation studies and analysis of the verbal autopsy-assigned cause-of-death information were not yet completed, these data were not used for the GBD 2004 revision.
Instead, the GBD 2002 cause distributions for India were adjusted to the 2004 all-cause envelope, and the resulting cause-specific estimates were fur-ther adjusted with information for 2004 from WHO technical programmes and UNAIDS on maternal, perinatal and childhood cluster conditions, as well as epidemiological estimates for TB, HIV, illicit drug dependence and problem use, rheumatoid arthritis and war deaths (see below). It should be noted that WHO and UNAIDS have substantially reduced esti-mates of HIV deaths for India compared to previous estimates used for the GBD 2002.
The Islamic Republic of IranThe latest death registration data available for the Islamic Republic of Iran were for the period 21 March 2004 to 20 March 2005, as per the Iranian calendar. The registration system operated by the
Deputy of Health Programme (Ministry of Health and Medical Education) captured deaths from 29 out of 30 provinces, with an estimated coverage of around 65% of all deaths occurring in the country. Tehran Province, which is the most populous prov-ince (population 12 million), was the only province not covered by the death registration system (38). Coverage has substantially improved compared to earlier years. In 1999, the system was capturing deaths in only four provinces with coverage of 5% of all deaths in the entire country. In 2001, the system further expanded by recording deaths in 18 prov-inces and one district with coverage of nearly 40% of all deaths in the country.
The 2004 data were coded to a condensed list of 318 cause categories, using the ICD-10 classification system. As coverage was partial, CodMod was used to predict the proportionate mortality distributions for Groups I, II and III, and specific cause mortal-ity distributions adjusted within these groups. Sup-plementary information from WHO technical pro-grammes and UNAIDS was also used in estimating specific causes of death.
MexicoCause-specific mortality for Mexico was estimated using death registration data for 2004, assessed to be nearly 100% complete. As well as the standard redistributions for ill-defined cause codes, further corrections for miscertification of deaths due to dia-betes and cardiovascular diseases were carried out based on in-depth analyses undertaken by the Har-vard Initiative for Global Health (39).
South AfricaThe completeness of the 2004 death registration data for South Africa was assessed to lie in the range of 75–89%. Approximately 13 000 deaths were reported to be due to HIV/AIDS, although UNAIDS has esti-mated that HIV/AIDS was responsible for 290 000 deaths in 2003 and 320 000 deaths in 2005 (40). Comparison of age-specific death rates for indi-vidual causes in 2004 with the corresponding death rates for 1993 and 1996 (when there were far fewer HIV deaths – around 11 000 and 45 000, respec-tively) showed clear evidence of miscoding of HIV deaths into other causes. This was particularly evi-dent for diarrhoea and gastroenteritis of presumed
103
Global Burden of Disease 2004
Data sources and methods
1
2
3
4
Annex A
Annex B
Annex C
References
infectious origin, respiratory TB and herpes zoster, causes which the national statistical office had also found to be often associated with HIV/AIDS (41). In addition, deaths classified as ill-defined showed spurious peaks in the same adult age groups as for deaths from HIV/AIDS. AIDS-defining diseases such as Kaposi sarcoma were also examined. Aver-aged age distributions for cause-specific mortality rates for 1993 and 1996 were used to remove the embedded misdiagnosed HIV/AIDS deaths in the 2004 data, in order to obtain HIV/AIDS-free sex-age-cause distribution patterns. A total of 224 000 deaths were reassigned from other causes to HIV/AIDS, resulting in an estimated national total for HIV/AIDS deaths of 292 000 in 2004, close to the UNAIDS estimate of 295 000, derived independ-ently from prevalence data.
The HIV/AIDS-free sex-age-cause distribution patterns thus obtained were then proportionately adjusted to the WHO estimated number of deaths by sex and age for South Africa in 2004. Supplemen-tary information from WHO technical programmes for some specific diseases and causes was also used to adjust final estimates by cause. Nearly 70% of all injury deaths in the 2004 death registration data were classified as due to events of undetermined intent, and less than 10% of all injury deaths were classified as caused by homicides. We used separate estimates of the external cause distribution for injury deaths based on data from the National Injury Mortality Surveillance System prepared for the revised South African Burden of Disease study (42).
ThailandDeath registration data were available for the year 2002, with an estimated coverage of about 85%. However, the proportion of ill-defined conditions was nearly 50%, since many deaths in Thailand occur at home, and the cause of death is reported by lay people. In order to improve the usability of the death registration data, the Thai Ministry of Health conducted a re-test survey on a sample of about 33 000 deaths, using verbal autopsy methods, to ascertain the true cause of death (43). This included a sample of 12 000 deaths with ill-defined causes. The reallocation algorithm for ill-defined causes from the verbal autopsy study was used to correct the high proportion of ill-defined deaths from the
death registration data. Deaths from septicaemia and pneumonia (approximately 27 000 in total in the 2002 data) were also reallocated based on the outcomes of the verbal autopsy study. The resultant cause-specific proportionate mortality was inflated to the national mortality envelope derived from the life table analysis. Supplementary information from WHO technical programmes and UNAIDS was also used in estimating specific causes of death.
TurkeyDeath registration data for 2003 were only available for urban areas of Turkey, with an estimated national coverage of 45%. Causes of death were coded using the condensed list of the ICD eighth revision. Instead of using these data, we used a detailed analysis of causes of death for the year 2000, from a national burden of disease study conducted by the national authorities in Turkey (44). Proportional distribu-tions for Groups I, II and III in 2004 were derived using CodMod. Supplementary information from WHO technical programmes and UNAIDS was also used in estimating specific causes of death.
B3. Causes of death for children aged under five years
In the World health report 2005, WHO published esti-mates of deaths of children aged under five years by cause for the years 2000–2003 that drew on extensive analyses carried out by the WHO Child Health Epi-demiology Reference Group as well as cause-specific estimates from WHO technical programmes and UNAIDS (45). For the GBD 2004, cause-specific and multicause models for causes of child deaths under five years (46, 47) and for neonatal deaths (48, 49) were rerun with updated inputs for the year 2004. Outputs were adjusted and mapped to GBD cause categories as described below. Together with cause-specific inputs from WHO technical programmes and UNAIDS, the resulting cause-specific inputs were adjusted country by country to fit neonatal, infant and child under-five death envelopes.
For 76 countries with death registration data cov-ering 85% or more of deaths, deaths by cause were estimated using the most recent death registration data, after adjusting for deaths coded to ill-defined
104
World Health Organization
Annex B
categories (see above). For the other 116 countries, available mortality data together with CodMod (see above) were used to estimate the broad cause-of-death patterns (Groups I, II and III) for infant deaths (under one year) and child deaths at ages one to four years.
Neonatal deaths
Total estimated deaths in the neonatal period were distributed to specific causes using a model developed by the Child Health Epidemiology Reference Group (CHERG) for countries without usable death regis-tration data (48, 49). The CHERG neonatal working group undertook an extensive exercise to derive glo-bal estimates for seven programme-relevant causes of neonatal death, including preterm birth, asphyxia, severe infection, neonatal tetanus, diarrhoea, con-genital malformation and other causes, based on 56 studies of neonatal deaths from 29 countries that met inclusion criteria. Multinomial models devel-oped to estimate simultaneously the distribution of these seven causes of death by country were rerun for 2004 using updated input data for covariates, and then mapped to GBD cause categories.
The GBD 2002 residual cause category “Other conditions” for the cause group “Conditions arising in the perinatal period” includes a number of infec-tious disease categories as well as some non-infec-tion causes. For the GBD 2004, this cause category has been renamed “Neonatal infections and other conditions” (arising in the perinatal period). Under ICD rules, some deaths due to neonatal infections should be coded to specific infectious causes (e.g. meningitis, syphilis) and others to codes within the perinatal conditions chapter (e.g. neonatal sepsis). Clinically, it may be difficult to distinguish pneumo-nia, sepsis and other causes of neonatal infection. The cause category “Severe infection” was mapped to GBD cause categories based on an analysis of available death registration data and expert advice on the evidence from neonatal mortality studies, as summarized in Table B3.
The GBD cause category “Neonatal infections and other conditions” also includes other non-infec-tious causes arising in the perinatal period (such as deaths resulting from maternal factors such as maternal hypertension and surgery, umbilical and
other neonatal haemorrhage, haemolytic disease, neonatal jaundice, hypothermia). Mapping of the CHERG “Other neonatal category” to GBD catego-ries resulted in 21% of the “Neonatal infections and other conditions” deaths being due to non-infectious causes, reasonably consistent with the low end of the proportions in death registration data.
The GBD cause category “Prematurity and low birth weight” (formerly labelled “Low birth weight” in the GBD 2001 and 2002) includes the CHERG neonatal category “Preterm birth” as well as deaths of infants born at term but small for gestational age. Based on expert advice, together with an analysis of available death registration data, term but small-for-gestational age deaths were assumed to be 0.4% of total neonatal deaths, and this fraction was added to the CHERG estimate for deaths of preterm infants.
The CHERG neonatal category “Congenital abnormalities” includes the GBD cause “Congenital anomalies” plus other Group II causes which com-prise genetic conditions (e.g. inherited neurological and metabolic conditions and miscoded congenital heart conditions). Non-genetic Group II conditions include cancers, endocrine and skin conditions. In mapping the CHERG neonatal congenital category to GBD cause groups, it was assumed that 90% of the deaths in the CHERG group were in the GBD con-genital cause group, based on an analysis of previous mortality estimates for GBD Group II conditions in infants.
Outputs from the CHERG neonatal model were used for all causes except neonatal tetanus. Outputs for neonatal tetanus deaths were compared country by country with estimates prepared by the WHO Department of Immunization, Vaccines and Bio-logicals (see Section B5). Final estimates from these models were reasonably consistent and the estimates prepared by this department were used for the GBD 2004.
Postneonatal deaths
Table B4 summarizes the data inputs and assumptions used for preparing estimates of postneonatal deaths by cause (ages one month to under five years) for the 116 countries without usable death registration data for child deaths. There were 63 countries where the resulting sum of the cause fractions for Group I
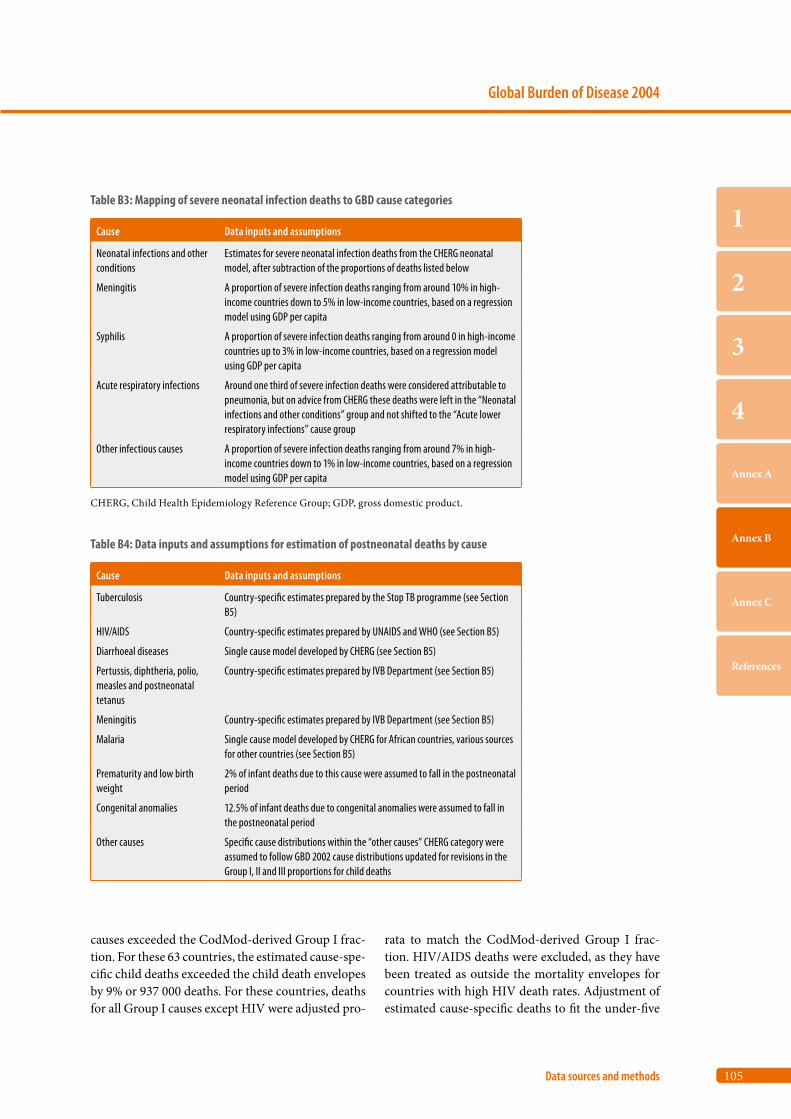
105
Global Burden of Disease 2004
Data sources and methods
1
2
3
4
Annex A
Annex B
Annex C
References
causes exceeded the CodMod-derived Group I frac-tion. For these 63 countries, the estimated cause-spe-cific child deaths exceeded the child death envelopes by 9% or 937 000 deaths. For these countries, deaths for all Group I causes except HIV were adjusted pro-
rata to match the CodMod-derived Group I frac-tion. HIV/AIDS deaths were excluded, as they have been treated as outside the mortality envelopes for countries with high HIV death rates. Adjustment of estimated cause-specific deaths to fit the under-five
Table B3: Mapping of severe neonatal infection deaths to GBD cause categories
Cause Data inputs and assumptions
Neonatal infections and other conditions
Estimates for severe neonatal infection deaths from the CHERG neonatal model, after subtraction of the proportions of deaths listed below
Meningitis A proportion of severe infection deaths ranging from around 10% in high-income countries down to 5% in low-income countries, based on a regression model using GDP per capita
Syphilis A proportion of severe infection deaths ranging from around 0 in high-income countries up to 3% in low-income countries, based on a regression model using GDP per capita
Acute respiratory infections Around one third of severe infection deaths were considered attributable to pneumonia, but on advice from CHERG these deaths were left in the “Neonatal infections and other conditions” group and not shifted to the “Acute lower respiratory infections” cause group
Other infectious causes A proportion of severe infection deaths ranging from around 7% in high-income countries down to 1% in low-income countries, based on a regression model using GDP per capita
CHERG, Child Health Epidemiology Reference Group; GDP, gross domestic product.
Table B4: Data inputs and assumptions for estimation of postneonatal deaths by cause
Cause Data inputs and assumptions
Tuberculosis Country-specific estimates prepared by the Stop TB programme (see Section B5)
HIV/AIDS Country-specific estimates prepared by UNAIDS and WHO (see Section B5)
Diarrhoeal diseases Single cause model developed by CHERG (see Section B5)
Pertussis, diphtheria, polio, measles and postneonatal tetanus
Country-specific estimates prepared by IVB Department (see Section B5)
Meningitis Country-specific estimates prepared by IVB Department (see Section B5)
Malaria Single cause model developed by CHERG for African countries, various sources for other countries (see Section B5)
Prematurity and low birth weight
2% of infant deaths due to this cause were assumed to fall in the postneonatal period
Congenital anomalies 12.5% of infant deaths due to congenital anomalies were assumed to fall in the postneonatal period
Other causes Specific cause distributions within the “other causes” CHERG category were assumed to follow GBD 2002 cause distributions updated for revisions in the Group I, II and III proportions for child deaths
106
World Health Organization
Annex B
envelopes differentially affected specific causes. For example, the total estimated malaria deaths before adjustment were 932 000 and after adjustment 812 000, a 12% reduction.
B4. YLD revisions
Years lost due to disability (YLD) estimates were revised for a number of causes where updated esti-mates for incidence or prevalence for national or regional populations were available (see Section B5 for details). For other causes, YLD estimates from the GBD 2002 were projected forwards to 2004 using one of the four methods outlined below. Except as noted in Section B5, disability weights used for YLD calculations are the same as those used in previous versions of the GBD for years 2000 to 2002 and tabu-lated in Annex Table A6 of Mathers et al. (11).
Constant YLD rates
For disease and injury causes where mortality is not responsible for a significant proportion of the total burden, or where there is insufficient evidence to predict variations in YLD rates from variations in mortality rates, YLD rates per 1000 population by age and sex for 2002 were applied to the 2004 population estimates to estimate YLD for 2004. Causes for which constant YLD rates were assumed included sexually transmitted diseases excluding HIV infections, diarrhoeal diseases, trypanosomia-sis, leishmaniasis, Japanese encephalitis, intestinal nematode infections, upper respiratory infections, otitis media, obstructed labour, vitamin A deficiency, bipolar affective disorder, schizophrenia, epilepsy, Alzheimer and other dementias, multiple sclerosis, post-traumatic stress disorder, obsessive-compul-sive disorder, panic disorder, insomnia (primary), migraine, appendicitis, benign prostatic hypertro-phy, skin diseases, musculoskeletal diseases, cleft lip and palate, Down syndrome, dental caries and peri-odontal disease.
Declining YLD rates
Age-sex-specific YLD rates for leprosy were assumed to have declined by 4% from 2002 to 2004.
YLD/YLL ratios
For disease and injury causes where mortality was responsible for a significant proportion of the total burden, regional estimates of YLD/YLL ratios by age and sex for 2002 were used together with 2004 YLL to estimate 2004 YLD. The causes for which this ratio method were used included meningitis, hepa-titis B and C, lower respiratory infections, endocrine disorders, rheumatic heart disease, hypertensive heart disease, inflammatory heart disease, chronic obstructive pulmonary disease, peptic ulcer disease, cirrhosis of the liver, and nephritis/nephrosis.
Group cause YLD/YLL ratios
For certain causes, regional age-sex-specific YLD/YLL ratios for the overall cause group were used for estimating YLD for 2004. These causes included maternal haemorrhage and sepsis, hypertensive dis-orders of pregnancy, causes arising in the perinatal period, congenital malformations excluding cleft lip and palate and Down syndrome, and all the injury causes apart from war and conflict.
B5. Cause-specific revisions and updates
Tuberculosis
Estimates of incidence, average case duration for treated and untreated cases, and deaths due to TB (excluding HIV-infected individuals) for all coun-tries in 2004 formed the basis of estimates of TB prevalence in 2004 (50). For countries with VR data for TB deaths, incidence estimates have been revised to be consistent with estimated deaths.
HIV/AIDS
Country-specific estimates of HIV/AIDS mortality are revised annually by UNAIDS and WHO to take into account new data and improved methods (12). For the most recent round of estimates released in November 2007, advances in methodology applied to an increased range of country data have resulted in substantial changes in estimates of incidence, prevalence and mortality for HIV. The estimated
107
Global Burden of Disease 2004
Data sources and methods
1
2
3
4
Annex A
Annex B
Annex C
References
global prevalence of HIV infections for 2004 was revised to 32 million, a reduction of 16% compared to the estimate of 38 million for 2004 prepared in 2006. Similarly, the estimated global deaths due to HIV were revised from 2.7 million to 2.0 million for 2004. The single biggest reason for this reduction was the intensive exercise to assess India’s HIV epidemic, which resulted in a major revision to that country’s estimates, with almost a halving of estimated preva-lence to 2.5 million. Around 70% of the reduction in HIV infection estimates are due to changes in India and five African countries: Angola, Kenya, Mozam-bique, Nigeria and Zimbabwe.
For countries with death registration data, HIV/AIDS mortality estimates were generally based on the most recently available vital registration data except where there was evidence of miscoding of HIV/AIDS deaths. In such cases, a time series anal-ysis of causes where there was likely miscoding of HIV/AIDS deaths was carried out to identify and re-assign miscoded HIV/AIDS deaths. For other countries, estimates were based on UNAIDS and WHO estimated HIV/AIDS mortality for 2004, or in some cases where that was not available, on esti-mated prevalence of HIV infections and AIDS in 2004 multiplied by the average subregional mortal-ity to prevalence ratio.
For the 2004 incremental update, the disease model for estimating YLD for HIV was updated to include three sequelae: HIV cases (not progressed to AIDS), AIDS cases not receiving antiretroviral therapy and AIDS cases receiving antiretroviral therapy. Average durations for these three sequelae were revised in line with the most recent UNAIDS estimates of survival with and without antiretroviral therapy (20). The disability weight for AIDS cases receiving antiretroviral therapy was set to be the same as that for HIV cases, apart from the terminal stage assumed to be have the same duration and dis-ability weight as AIDS cases not receiving antiretro-viral therapy.
Diarrhoeal diseases
For countries with usable death registration data, deaths due to diarrhoeal diseases were estimated directly from these data. For other countries, a regression model was used to estimate proportional
mortality from diarrhoea for children aged under five years (51). The final regression model for the GBD 2004 included the logit of the proportional mortality from diarrhoeal diseases in children aged 0–4 years as a dependent variable and total under-five mortality rates, mid-year of study and WHO regions as explanatory variables. The regression data were drawn from more than 60 community-based studies since 1980 with study durations of multiples of 12 months. This model was validated and supple-mented with vital statistics from developing coun-tries where coverage was high. Estimates of child deaths due to diarrhoeal disease for 2004 from this model were assumed to include the neonatal diar-rhoea deaths estimated using the CHERG neonatal model.
Vaccine-preventable childhood diseases
PertussisPertussis cases and deaths were based on a natural history model using vaccine coverage and age-spe-cific case fatality rates from community-based stud-ies (52). Updated estimates for 2004 were prepared by the WHO Department of Immunization, Vac-cines and Biologicals using WHO–United Nations Children’s Fund (UNICEF) estimates for vaccine coverage in 2004, interpolated for missing data (53, 54).
PolioIncidence estimates for polio were based on reported cases in 2004 (55) with adjustments for underreport-ing. Mortality estimates were derived from incidence estimates assuming a 10% case fatality rate.
DiphtheriaUpdated incidence estimates for 2004 were prepared by the WHO Department of Immunization, Vaccines and Biologicals using WHO–UNICEF estimates for vaccine coverage in 2004, interpolated for missing data (53). A case fatality rate of 10% was assumed for diphtheria in countries without high vital events coverage (56).
MeaslesMeasles incidence and mortality for 2004 were esti-mated using a revised natural history model whose
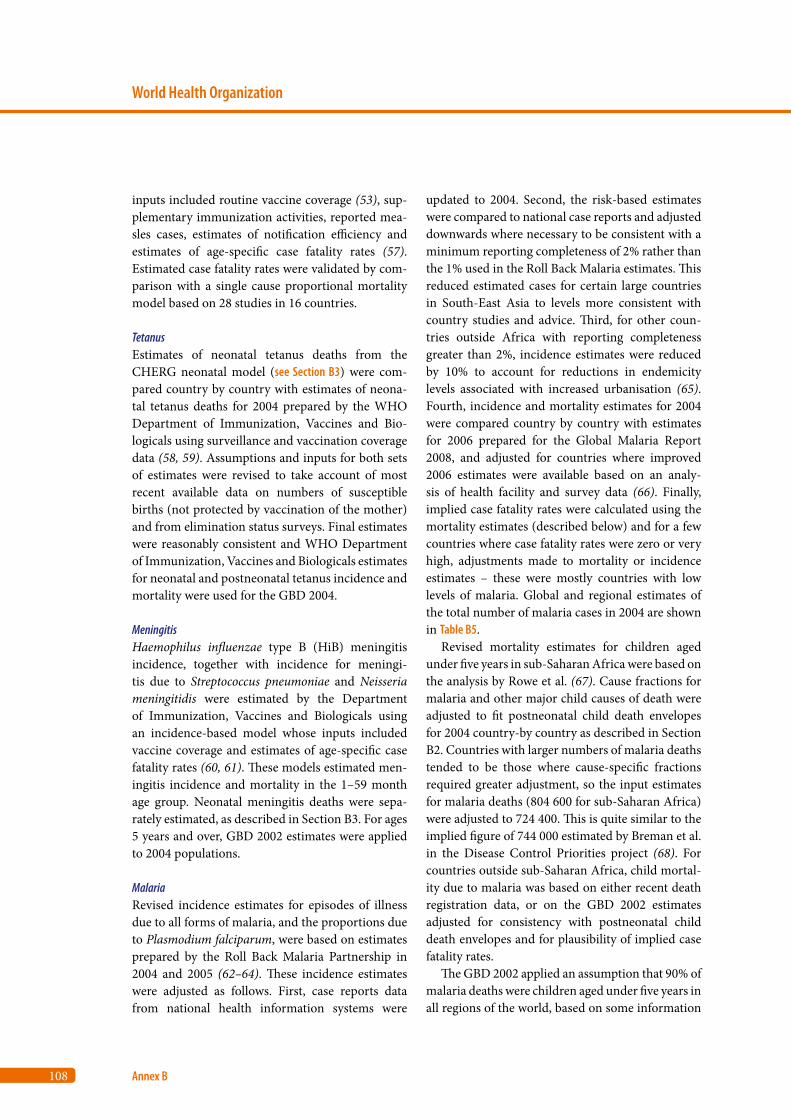
108
World Health Organization
Annex B
inputs included routine vaccine coverage (53), sup-plementary immunization activities, reported mea-sles cases, estimates of notification efficiency and estimates of age-specific case fatality rates (57). Estimated case fatality rates were validated by com-parison with a single cause proportional mortality model based on 28 studies in 16 countries.
TetanusEstimates of neonatal tetanus deaths from the CHERG neonatal model (see Section B3) were com-pared country by country with estimates of neona-tal tetanus deaths for 2004 prepared by the WHO Department of Immunization, Vaccines and Bio-logicals using surveillance and vaccination coverage data (58, 59). Assumptions and inputs for both sets of estimates were revised to take account of most recent available data on numbers of susceptible births (not protected by vaccination of the mother) and from elimination status surveys. Final estimates were reasonably consistent and WHO Department of Immunization, Vaccines and Biologicals estimates for neonatal and postneonatal tetanus incidence and mortality were used for the GBD 2004.
MeningitisHaemophilus influenzae type B (HiB) meningitis incidence, together with incidence for meningi-tis due to Streptococcus pneumoniae and Neisseria meningitidis were estimated by the Department of Immunization, Vaccines and Biologicals using an incidence-based model whose inputs included vaccine coverage and estimates of age-specific case fatality rates (60, 61). These models estimated men-ingitis incidence and mortality in the 1–59 month age group. Neonatal meningitis deaths were sepa-rately estimated, as described in Section B3. For ages 5 years and over, GBD 2002 estimates were applied to 2004 populations.
MalariaRevised incidence estimates for episodes of illness due to all forms of malaria, and the proportions due to Plasmodium falciparum, were based on estimates prepared by the Roll Back Malaria Partnership in 2004 and 2005 (62–64). These incidence estimates were adjusted as follows. First, case reports data from national health information systems were
updated to 2004. Second, the risk-based estimates were compared to national case reports and adjusted downwards where necessary to be consistent with a minimum reporting completeness of 2% rather than the 1% used in the Roll Back Malaria estimates. This reduced estimated cases for certain large countries in South-East Asia to levels more consistent with country studies and advice. Third, for other coun-tries outside Africa with reporting completeness greater than 2%, incidence estimates were reduced by 10% to account for reductions in endemicity levels associated with increased urbanisation (65). Fourth, incidence and mortality estimates for 2004 were compared country by country with estimates for 2006 prepared for the Global Malaria Report 2008, and adjusted for countries where improved 2006 estimates were available based on an analy-sis of health facility and survey data (66). Finally, implied case fatality rates were calculated using the mortality estimates (described below) and for a few countries where case fatality rates were zero or very high, adjustments made to mortality or incidence estimates – these were mostly countries with low levels of malaria. Global and regional estimates of the total number of malaria cases in 2004 are shown in Table B5.
Revised mortality estimates for children aged under five years in sub-Saharan Africa were based on the analysis by Rowe et al. (67). Cause fractions for malaria and other major child causes of death were adjusted to fit postneonatal child death envelopes for 2004 country-by country as described in Section B2. Countries with larger numbers of malaria deaths tended to be those where cause-specific fractions required greater adjustment, so the input estimates for malaria deaths (804 600 for sub-Saharan Africa) were adjusted to 724 400. This is quite similar to the implied figure of 744 000 estimated by Breman et al. in the Disease Control Priorities project (68). For countries outside sub-Saharan Africa, child mortal-ity due to malaria was based on either recent death registration data, or on the GBD 2002 estimates adjusted for consistency with postneonatal child death envelopes and for plausibility of implied case fatality rates.
The GBD 2002 applied an assumption that 90% of malaria deaths were children aged under five years in all regions of the world, based on some information
109
Global Burden of Disease 2004
Data sources and methods
1
2
3
4
Annex A
Annex B
Annex C
References
on age distribution in endemic areas of Africa. However, in areas with low intensity transmission, fewer children develop immunity and the propor-tion of deaths at older ages is higher. Breman et al. (68) quoted estimates prepared by Snow et al. (69) that the age distribution in Africa was 65% for ages under five years, 19% for ages 5–14 years, and 16% for ages over 15 years. Recent verbal autopsy data from the INDEPTH network for malaria (excluding fever of unknown origin) also gave around 62% of deaths for children aged under five years, but only 7% for those aged 5–14 years (33).
For the 2004 estimates of malaria mortality, the relationship between malaria mortality rates at ages 5–19 years and 20–39 years and child malaria mor-tality rates for ages 0–4 years was estimated using a model of age-specific malaria mortality by trans-mission intensity (70). The revised death rates for malaria at ages five years and over result in an esti-mated 10% of malaria deaths at ages five years and over in the African region, and 13% globally. For the lower transmission areas outside Africa, the death rates are lower for children and higher for adults. At very low transmission, the death rates are similar across all ages, but slightly higher for younger chil-dren and older adults. The resulting global age dis-tribution of malaria deaths is very similar to that in the original GBD study for 1990 (3). Estimated total malaria deaths for 2004 were 0.89 million, of which 771 000 were in children aged under five years. These estimates are lower than those in the GBD 2002 (1.27 million deaths, of which 1.15 million deaths were of children aged under five years).
Other tropical diseases
Human African trypanosomiasis (sleeping sickness)The GBD 2002 disease model for human African trypanosomiasis (HAT) did not distinguish the two forms of HAT (infection with Trypanosoma brucei
gambiense or Trypanosoma brucei rhodesiense) and assumed an average five-year duration with close to 100% case fatality. For GBD 2004 calculations, sepa-rate estimates were made for incidence of cases of infection with T.b. gambiense and T.b. rhodesiense. An average duration of five years was assumed for T.b. gambiense and one year for T.b. rhodesiense, so giving a lower prevalence than 2002 estimates. For the mortality estimates, 85% of cases were assumed to be untreated with 100% case fatality, and 15% treated with 5% case fatality.
WHO programme data on populations at risk and levels of endemicity in African countries, the form of HAT present in each country, and numbers of reported cases of disease were used to develop estimates of the incidence of the two forms of HAT for 2004. Completeness of reporting of cases was assumed to be around 33% for T.b. gambiense and 5% for T.b. rhodesiense (71). The resulting total inci-dence of HAT in 2004 is estimated at 60 300, consist-ent with recent WHO estimates of global incidence in the range 50 000–70 000 (72).
Chagas diseaseUpdated Chagas disease incidence and prevalence estimates for 2005 were provided by the Pan Ameri-can Health Organization (73). These estimates were supplemented with and validated against vital sta-tistics from Latin American countries where cover-age was high. Over 9000 deaths due to Chagas dis-ease were recorded in death registration data for the region and the implied annual case fatality rate for prevalent cases in countries with good registration data was 0.18%. For a number of countries where the number of deaths in the death registration data for 2004 was much lower than that implied by the prevalence and case fatality estimates, a conserva-tive estimate of numbers of Chagas disease deaths was based on an average of the number estimated from the prevalence estimates and the death
Table B5: Estimated malaria cases (episodes of illness) by WHO region, 2004
AfricaThe
Americas
Eastern Mediter-
ranean EuropeSouth-
East AsiaWestern
Pacific World
Total cases (millions) 203.9 2.9 8.6 0.0 23.3 2.7 241.3
P. falciparum cases (millions) 190.7 0.7 6.8 0.0 13.4 1.5 213.2
110
World Health Organization
Annex B
registration number.
SchistosomiasisThe GBD 1990 estimated 1.5 million DALYs and 8000 deaths due to schistosoma infections. Schisto-somiasis cases were treated as a single sequela, with an average disability weight of 0.006 (74). The GBD 2002 used the same disease model with updated prevalence estimates to estimate that 1.7 million DALYs and 15 371 deaths were due to schistosomia-sis in 2002.
There are five different types of schistosoma spe-cies: Schistosoma haematobium (the most prevalent and widespread species in Africa and the Middle East), S. mansoni (found in Africa and the only spe-cies seen in Latin America), S. japonicum (restricted to the Pacific region including China and the Philip-pines), S. mekongi (found in limited areas of the Lao People’s Democratic Republic and Cambodia) and S. intercalatum (found in 10 countries in the rainfor-est belt of Africa). For the 2004 revision, the incidence and prevalence of cases of infection were separately estimated by country for S. mansoni, S. haemato-bium and S. japonicum plus S. mekongi. Severe renal damage (S. haematobium) and severe liver damage (other forms) were also modelled, assuming the incidence of these sequelae was the same as the esti-mated numbers of deaths, and the disability weights were the same as those for end-stage renal disease. Cancer outcomes were not included as sequelae for schistosomiasis, but are included with overall cancer burden estimates. A separate calculation would be required to estimate attributable cancer burden for schistosomiasis.
Estimates of prevalence for infection with S. mansoni and S. haematobium in African countries were based on information provided by the WHO programme for Control of Neglected Tropical Dis-eases for 2003–2004. For countries in the Eastern Mediterranean region, the previous 2002 prevalence estimates were used. For the 2004 revision, inci-dence rates were estimated assuming zero remission rates (except for a period in early adulthood when prevalence rates decline). The estimated durations are much longer than the one year assumed in the GBD 2002 and GBD 1990, and as a result of time discounting, the YLD estimated for the 2004 revi-sion (0.88 million globally) are lower than those
published for 2002 (1.5 million).The GBD 2002 estimated that schistosomiasis
was responsible for around 15 000 deaths globally (excluding attributable cancer deaths), although others have argued that the figure should be much higher (75). Van der Werf et al. (76), using limited data from Africa, estimated that schistosomiasis caused 210 000 deaths annually. A literature review found limited data from studies with small sample sizes, limiting ability to extrapolate to population level. In the absence of usable studies, a back-calcu-lation method was employed to estimate approxi-mate case fatality rates for two populations with sig-nificant numbers of schistosomiasis deaths recorded in death registration data.
Egyptian death registration data for 2000 gave an estimate of 3303 schistosomiasis deaths in 2000 after adjustment for incompleteness of reporting. Reported deaths did not distinguish between S. mansoni and S. haematobium. Estimates of population prevalence for the 1980s and 1990s vary widely (20–40%); see for example Mansour et al. (77). Assuming a preva-lence rate of 30% in the 1980s, this gives an approxi-mate case fatality rate of around 0.03%. This method was also applied to Brazil, where only S. mansoni is endemic. An analysis of Brazilian death registration data for 1990 to 1995 found that annual numbers of deaths due to schistosomiasis averaged around 570. Based on a conservative estimate of infection preva-lence of around 8 million in 1980 (78), this gives a case fatality rate of around 0.007%.
These estimates are generally consistent with those reported in the literature, and also with the known lower fatality rates for S. mansoni compared with S. haematobium. For the GBD 2004 update, annual case fatality rates for prevalent cases were conserva-tively assumed to be 0.01% for S. mansoni, 0.02% for S. haematobium, and 0.03% for S. japonicum and S. mekongi. Applying these case fatality rates to the revised prevalence estimates gave a revised global estimate for deaths due to schistosomiasis (exclud-ing cancers caused by schistosomiasis) of 41 000 for 2004. The sex ratio of schistosomiasis deaths was assumed to be similar to the 1990 estimates (62.5% male in the African and Eastern Mediterranean regions, 66% in the Americas and Asia, and 80% male in China).
111
Global Burden of Disease 2004
Data sources and methods
1
2
3
4
Annex A
Annex B
Annex C
References
LeishmaniasisGBD 2002 estimates for visceral and cutaneous leish-maniasis were revised to resolve some inconsisten-cies between prevalence and mortality estimates, using information provided by the WHO Depart-ment of Control of Neglected Tropical Diseases on reported cases by country, and on the presence and endemicity of each form of leishmaniasis infection by country. The regional and global estimates for mortality and DALYs for 2004 remain similar to those for 2002.
Lymphatic filiariasisGBD 2002 incidence and prevalence of lympho-edema and hydrocele due to lymphatic filiariasis were revised using information provided by the WHO Department of Control of Neglected Tropical Diseases on mapping status, areas endemic and pop-ulation at risk for countries with endemic lymphatic filiariasis. Lymphatic filiariasis was considered to be eliminated in China and the Republic of Korea for 2004.
OnchocerciasisThe prevalences of onchocerciasis-caused low vision and blindness were updated using country-specific estimates provided by the WHO Programme for Prevention of Blindness and Visual Impairment.
Dengue
The GBD 2002 estimates for dengue were based on country-level estimates of dengue mortality in the year 2000 from the WHO Department of Control of Neglected Tropical Diseases and on an earlier review of nearly 300 population-based incidence studies (79). For the GBD 2004, country-specific mortal-ity estimates were revised, drawing on a review of dengue mortality studies and on deaths reported by DengueNet (80).
The incidence of dengue haemorrhagic fever or dengue shock syndrome was back-estimated from the mortality estimates assuming case fatality rates of 0.025 in China and the Americas, and 0.04 in other regions. The incidence of dengue fever was then esti-mated assuming that 6% of symptomatic cases were dengue haemorrhagic fever and 94% were dengue fever (81).The disease model was revised to include
two sequelae:
1. Dengue fever with an average duration of 5.5 days, and an average disability weight of 0.2 (from the GBD 1990 weight for dengue haemorrhagic fever).
2. Dengue haemorrhagic fever/dengue shock syn-drome with an average duration of 11 days and an average disability weight of 0.5 (adjusted so that disability weight multiplied by duration is the same as for GBD 1990 (0.2 multiplied by 1 month)).
Trachoma
The prevalences of trachoma-caused low vision and blindness were updated using country-specific esti-mates provided by the WHO Programme for Pre-vention of Blindness and Visual Impairment (82).
Acute respiratory infections
A single-cause proportional model was used to esti-mate child mortality due to acute lower respiratory infections (mainly pneumonia) for countries with-out usable death registration data. Community-based studies with durations of one year or longer, and published since 1980, were used to estimate the proportional mortality from acute respiratory infections in children aged 0–4 years in developing countries (83). Data from seven separate studies that compared verbal autopsies with hospital-based diag-noses were used to adjust for under-identification of acute respiratory infection deaths by verbal autopsy instruments. Estimated acute respiratory infection deaths for 2004 from this model were assumed to exclude neonatal deaths due to pneumonia, and the latter were included in the CHERG neonatal model estimates for severe infection.
Maternal mortality
WHO and UNICEF recently released new estimates of mortality from maternal conditions for WHO Member States for the year 2005 (84). To estimate maternal mortality in 2004, the 2005 country-spe-cific estimates of the proportion of non-HIV deaths of women of reproductive age (ages 15–49 years) that
112
World Health Organization
Annex B
are due to maternal causes (proportion of maternal deaths of females of reproductive age – PMDF) were applied to the 2004 country-specific estimates of the total number of non-HIV deaths of women aged 15–49 years.
Abortion-related mortality occurs mainly as a result of unsafe induced abortion. GBD estimates for 2004 were updated using WHO estimates of incidence and mortality rates due to unsafe induced abortion in 2003 based on published and unpub-lished reports for more than 130 countries together with other information on legal and social contexts (85, 86).
Protein–energy malnutrition
The prevalences of underweight, stunting and wasting were based on analysis of 388 nationally representa-tive studies for 139 countries from the WHO Global Database on Child Growth and Malnutritiona. These were used to estimate prevalence of child stunting and wasting for each country in the world according to the new WHO Child Growth Standards (87–90). In 2004, an estimated 32% of children aged under five years were stunted (height-for-age more than two standard deviations below the standard) and 20% were wasted (weight-for-age more than two standard deviations below the standard).
Iron-deficiency anaemia
The WHO Department of Nutrition for Health and Development has prepared global, regional and national estimates of anaemia prevalence in pre-school-aged children, pregnant women and non-pregnant women, using data collected for the Vitamin and Mineral Nutrition Information System (VMNIS)b. These estimates were based on the most recent national and subnational surveys measuring blood haemoglobin concentration carried out in the years 1993–2005 (91, 92). These surveys cov-ered around two thirds of the world’s population and were used to calculate regional age- and sex-specific prevalence estimates for mild, moderate and severe anaemia. According to these estimates, 42% of pregnant women and 47% of preschool children
worldwide have anaemia. As for the GBD 2002 esti-mates, it was assumed that 60% of anaemia was due to iron deficiency in non-malaria areas and 50% in malaria areas.
Cancer
Previous GBD estimates for the site-specific distribu-tion of cancer mortality for Member States without good vital registration data, and for site-specific inci-dence of cancers, were based on a model for relative interval survival applied to country-level estimates of cancer incidence distributions by site published by the International Agency for Research on Cancer (IARC) in its Globocan 2000 database (93–95). For the GBD 2004, regional site-specific survival prob-abilities were updated based on regional trends in gross domestic product per capita (in international dollars) and applied to revised site-specific inci-dence distributions for 2002 published by IARC in Globocan 2002 (96).
Diabetes mellitus
Diabetes prevalence estimates were updated to take account of a number of recently published popula-tion surveys that used oral glucose tolerance tests and WHO criteria to measure diabetes prevalence (97–110). For countries and regions for which more recent prevalence studies were not available, previ-ous diabetes prevalence estimates (111) were pro-jected from those for 2000–2004 using projected trends in population body mass index distributions (112) together with recent estimates of the relative risk of diabetes associated with each unit increase in body mass index from a large meta-analysis of the Asia Pacific Cohort Studies (113). These revisions increased the estimated prevalence of diabetes mel-litus from 191 million (if GBD 2002 prevalence rates are applied to the 2004 population) to 220 million in 2004.
Depressive disorders
Point prevalence estimates for episodes of unipo-lar major depression were derived for the GBD
a http://www.who.int/nutgrowthdb/b http://www.who.int/vmnis
113
Global Burden of Disease 2004
Data sources and methods
1
2
3
4
Annex A
Annex B
Annex C
References
2000–2002 from a systematic review of all available published and non-published population studies on depressive disorders. This review identified 56 stud-ies, with studies coming from all six WHO regions (114). Variations in the prevalence of unipolar depressive disorders in some European countries, Australia, New Zealand and Japan were estimated directly from relevant population studies (115).
In the GBD 2002, all comorbid cases of depres-sion and alcohol use disorder were included in the burden of depressive disorders. For the GBD 2004, one half of these comorbid cases were included in depressive disorders and the other half in alcohol use disorders. Age-sex-specific prevalence rates from the GBD 2002 were adjusted downwards by one half of the estimated prevalence rate of comorbid cases of depression and alcohol use disorder (see follow-ing section) and then applied to the 2004 population estimates to calculate the prevalence and burden of depressive disorders.
Alcohol and drug use disorders
Previous global estimates for alcohol dependence and harmful use (alcohol use disorders) were based on a range of assessment instruments with varying quality including screening instruments such as the CAGE or the AUDIT, which may not be completely comparable across populations (116). A new review was carried out for the GBD 2004 update using only studies conducted after 1990, which used ICD-10, DSM-IIIR or DSM-IV criteria for alcohol depend-ence and one of the following diagnostic instru-ments: the Composite International Diagnostic Interview (CIDI), the Schedules for Clinical Assess-ment in Neuropsychiatry (SCAN) or the Alcohol Use Disorder and Associated Disabilities Interview Schedule-Alcohol/Drug-Revised (AUDADIS-ADR) (117).
Population estimates of the point prevalence of alcohol use disorders in the age range 18–64 years were obtained from 37 studies (118). Published data on alcohol production, trade and sales, and adjusted for estimates of illegally produced alcohol were used to estimate country averages for volumes of alcohol consumed. These preliminary estimates were then further adjusted on the basis of the survey data on alcohol consumption to estimate prevalence
of alcohol use disorders for countries where recent population-based survey data were not available.
Estimated regional prevalence rates for alco-hol dependence by age and sex were then adjusted upwards by 39% for men and 61% for women to account for the additional prevalence of harmful use of alcohol. To correct for comorbidity with depres-sion, prevalence was reduced by a proportional sub-traction of 9% (males) and 21% (females) for the WHO regions of Europe and the Americas. For all other regions, prevalence was reduced by 5% (males) and 10% (females) to correct for comorbidity with depression. Incidence rates and average durations for alcohol use disorders were estimated from preva-lence, relative risk of mortality and remission rates using DISMOD II (118). Instantaneous remission rates of 0.175 were assumed for ages 15 years and over; the relative risk of mortality averaged 1.8 for males and 3.8 for females.
The original GBD 1990 disability weight of 0.18 for alcohol dependence was applied to both alcohol dependence and harmful use in the GBD 2000–2002. Recent analyses of disability associated with harmful use of alcohol from the Australian Burden of Disease Study (119) and of health state valuations collected in the WHO Multi-country Survey Study (MCSS) (120) suggest that the average disability weight for harmful use of alcohol is much lower than for alco-hol dependence. Weights derived from the multi-country study were used for the harmful use pro-portion of alcohol use disorders resulting in average disability weights for alcohol use disorders of 0.137 (males) and 0.132 (females) in people aged under 30 years, and 0.134 (males) and 0.122 (females) for those aged 30 years and over.
Applying these weights, the overall YLD for alco-hol use disorders for 2004 are 22.0 million com-pared to 19.1 million if GBD 2000 assumptions and estimates were maintained for the 2004 popu-lation. However, the revised prevalence estimates have resulted in increases in the estimated burden for China, India and countries of the former Soviet Union, and decreases for high-income countries, Latin America and Africa.
Estimating mortality directly attributable to illicit drug use, such as overdose death, is difficult because of variations in the quality and quantity of mortality data. For some regions where there is known to be a
114
World Health Organization
Annex B
substantial prevalence of illicit drug dependence, no deaths are recorded in available data sources as being due to drug dependence. As a result, it is necessary to make indirect estimates, involving estimates of the prevalence of illicit drug use and case fatality rates, and adjustments to death registration data (121, 122). For the GBD 2004, estimates of deaths due to drug use disorders for 2002 were updated using regional trends in the use of illicit opiate drugs reported by the United Nations Office on Drugs and Crime (123).
Mental retardation (lead-caused)
Estimates of YLD for mental retardation caused by environmental lead exposure prepared for the GBD 2000 were updated to 2004 using projected trends in the incidence of lead-caused mental retardation (124, 125).
Causes of vision loss
Prevalence rates for blindness and low vision due to all causes were updated for the GBD 2002 based on data from available population-based surveys since 1980. Low vision and blindness were defined in terms of measured visual acuity in the better eye with best possible correction (126, 127). These revi-sions were carried out before the regional distribu-tions for causes of vision loss were available.
For the GBD 2004, prevalence estimates for causes with low vision and blindness sequelae were revised to take account of the regional distribu-tions for causes of blindness published by Resnikoff et al. (127). Relevant causes included gonorrhoea, onchocerciasis, trachoma, vitamin A deficiency, injury, diabetic retinopathy, glaucoma, cataract, and macular degeneration and other age-related causes of vision loss not correctable by provision of glasses or contact lenses. The GBD 2002 cause category “Age-related vision disorders” was renamed “Macu-lar degeneration and other” (age-related causes of vision loss).
The GBD 2002 did not include refractive errors (myopia, hyperopia and astigmatism) correctable with spectacles or other refractive corrections. The definition of vision impairment based on “best pos-sible correction” excludes these impairments in
people who do not normally use spectacles or other refractive corrections. For the GBD 2004, an addi-tional cause “refractive errors” was added to the sense organ disorders cause group. Prevalence esti-mates were based on recent WHO estimates of the regional prevalences of uncorrected refractive errors for all ages over five years (128).
The original GBD 1990 weight for low vision (visual acuity less than 6/18 and greater than 3/60) was quite high at about 0.24, and low vision was only included as a sequela for a few infectious causes, but not for glaucoma or cataracts. For the GBD 2004, the disability weight for low vision has been revised to 0.17 based on the Netherlands disability weights study (129). The disability weight for blindness has been maintained at 0.60 for blindness with best pos-sible correction, but the Netherlands study weight of 0.43 used for blindness due to uncorrected refractive errors.
Ischaemic heart disease
The GBD 2000–2002 study developed a model for ischaemic heart disease YLD which included three sequelae: acute myocardial infarction (AMI), angina pectoris and congestive heart failure following AMI (130). The GBD 1990 study estimated a regression relationship between the prevalence of AMI survi-vors and the prevalence of angina pectoris (both pre- and post-AMI) using data from developed country studies, and then applied this regression relationship in other developing regions. For the GBD 2000–2002 revisions, the same methodology was followed, but the regression relationships were re-estimated using data from the US Burden of Disease Study for 1996 (131). Two recent national burden of disease stud-ies have made estimates of the prevalence of angina pectoris for Australia in 2003, a developed country population (119), and for Thailand in 2004, a devel-oping country population (132). These were used to re-estimate the regression equations, in order to estimate angina pectoris prevalence for each region from updated estimates of the prevalence of 24- hour AMI survivors for 2004. These revisions resulted in an increase in the estimated global prevalence of angina pectoris from 25 million in 2002 to 54 mil-lion in 2004.
DISMOD II was used to estimate the incidence
115
Global Burden of Disease 2004
Data sources and methods
1
2
3
4
Annex A
Annex B
Annex C
References
and average duration of angina pectoris for the cal-culation of YLD from estimated prevalence rates, relative risks of mortality and remission rates (due to revascularization procedures). Mortality relative risks were revised for high-income countries based on a study of mortality by cause following first-ever AMI in the Danish MONICA study (133). Based on the ratio of the regional 28-day case fatality rates, it was assumed that the excess mortality risk was 40% higher in B and C strata, and 50% higher in D and E strata. These letters denote mortality strata used to group countries in the GBD 2002 (6). Disability weights for angina pectoris were also revised based on the revisions in the Australian and Thai studies (119, 132). The revised disability weights ranged from 0.104 in high-income countries to 0.141 in the WHO African Region, compared with a previous range of 0.108–0.207.
The proportion of incident AMI cases who go on to develop congestive heart failure was assumed to be 0.17 in A strata, 0.20 in B and C strata, 0.20 in D strata other than countries in the African Region, and 0.25 in D and E strata in the African Region. Case fatality rates for A strata were based on those estimated in the United States Burden of Disease and Injury Study (131). Case fatality rates were assumed to be 10% higher in B and C strata, and 20% higher in D and E strata.
Cerebrovascular disease
The GBD 2000–2002 study developed a model for stroke based on available population data on case fatality within 28 days for incident cases of first-ever stroke and on long-term survival in cases surviving this initial period in which the risk of mortality is highest (134). For the GBD 2004, estimated preva-lence rates for stroke survivors from this model were compared with results from available population studies. GBD estimates for stroke survivor preva-lence rates were generally around 10–30% higher than prevalence rates reported in available studies from developing countries, but most of the studies dated from the 1980s or 1990s, and may not fully identify survivors of mild strokes without noticeable neurological problems.
Two recent national burden of disease studies have made estimates of the prevalence of stroke
survivors for Australia in 2003, a developed coun-try population (119), and for Thailand in 2004, a developing country population (132). The Austral-ian stroke estimates were based on detailed analysis of linked databases for Western Australia to iden-tify incidence of first-ever stroke, and mortality for cases. Provisional Thai stroke prevalence estimates were based on data from the Third National Health Examination Survey 2004 (135). Data from these studies were used to recalibrate the long-term case fatality rates for first-ever stroke survivors across all regions for the GBD 2004 estimates, resulting in a reduction in the estimated prevalence of stroke survivors from 50 million to 30 million, and a 30% reduction in YLD for cerebrovascular disease.
Edentulism
Regional prevalence estimates for edentulism (loss of all natural teeth) were updated using data from the World Health Surveys for 60 countries in 2002–2004 (136), together with a review of other published prevalence estimates (137).
Conflicts and natural disasters
The GBD 2004 includes estimates of deaths occur-ring in 2004 for which the underlying cause (follow-ing ICD conventions) was an injury due to war, civil insurrection or organized conflict, whether or not that injury occurred during the time of war or after cessation of hostilities. The GBD estimates include injury deaths resulting from all organized conflicts, including organized terrorist groups, whether or not a national government was involved. They do not include deaths from other causes (such as starva-tion, infectious disease epidemics, lack of medical intervention for chronic diseases), which may be counterfactually attributable to war or civil conflict.
Country-specific estimates of war and conflict deaths were updated to 2004 using information on conflict intensity, time trends and mortality obtained from a variety of published and unpublished war mortality databases (138–142). Murray et al. (143) have summarized the issues with estimation of war deaths, and emphasized the very considerable uncer-tainty in the GBD estimates for conflict deaths.
Additional information from epidemiological
116
World Health Organization
Annex B
studies and surveys was also used for certain specific conflicts in the Democratic Republic of the Congo (144), Iraq (145) and the Sudan (146–149). Deaths due to landmines and unexploded ordinance were estimated separately by country (150, 151).
Deaths due to major natural disasters in 2004 are included in the external cause of injury category “Other unintentional injuries”. Such deaths will not be included in mortality data sources and estimates except for countries with death registration data for 2004. Estimated deaths for natural disasters in 2004 were obtained from the Office of United States Foreign Disaster Assistance/Centre for Research on the Epidemiology of Disasters (OFDA/CRED) International Disaster Database (152). An estimated 226 321 deaths from the Asian tsunami on 26 Dec-ember 2004 were added to estimated injury deaths for India, Indonesia, Malaysia, Maldives, Somalia, Sri Lanka and Thailand. Additional natural disas-ter deaths in 2004 were also added to injury deaths for the Dominican Republic, Haiti, Madagascar, Morocco, Paraguay, the Philippines and the Sudan. Age distributions were based on a number of studies of earthquake deaths (153, 154) and tsunami deaths (155, 156).
B6. Prevalence of long-term disability
GBD 2004 updates were used to estimate the preva-lence of people with long-term disability by age, sex and region for two severity thresholds of disability. The GBD links loss of full health to disease and injury causes through the concepts of cases and sequelae. For incident cases of a given disease or injury in the population, there will be a distribution of current and future health states (conceptualized in terms of functioning capacity in a set of health domains) in the population, aggregated across individuals. The term disability was used in the naming of the DALY to stress the vision of health that goes beyond the absence of disease and the emphasis on difficulties in functioning. Although the term disability has a number of different meanings and connotations and is not seen by some as a synonym or proxy for “loss of health”, the GBD uses “disability” to refer to a sub-construct of “diminution of health”, where health is conceptualized in terms of functioning capacity in a
set of health domains.The GBD 1990 study established severity weights
for 22 sample “indicator conditions” using an explicit “person trade-off ” protocol in a formal exer-cise involving health workers from all regions of the world. These weights were then grouped into seven classes where class I has a weight between 0 and 0.02 and class VII a weight between 0.7 and 1 (see Table 8). To generate disability weights for the remainder of the approximately 500 disabling sequelae in the study, participants in the study were asked to esti-mate distributions across the seven classes for each sequela. Distributions across disability classes were estimated separately for treated and untreated cases where relevant, and distributions could also vary by age group and sex.
These severity distributions for GBD sequelae, together with updated severity distributions for those sequelae for which disability weights have been revised in the GBD 2004, were used to estimate the prevalence of long-term disability by severity class in 2004. Results are presented here for the prevalence of “severe” disability, defined as severity classes VI and VII (the equivalent of having blindness, Down syndrome, quadriplegia, severe depression or active psychosis) and for “moderate and severe” disability, defined as severity classes III and greater (severity class III is the equivalent of having angina, arthri-tis, low vision or alcohol dependence). The disability prevalence estimates also excluded conditions with average durations of less than six months.
The GBD prevalence estimates cannot be simply added, because they were calculated without regard for multiple pathologies or comorbidities (that is, it is possible for a given individual to fall within more than one disability level if they have more than one diagnosis). Murray & Lopez adjusted for comorbid-ity assuming that all conditions were statistically independent and that the probability of having two conditions was the product of the probability of having each condition alone (3). For the disability estimates presented here, a comorbidity adjustment method was used that takes account of the increased probability of having certain pairs of conditions (23). Only very limited data were available on comorbid-ity, so the resulting disability prevalences have an additional level of uncertainty above the cause-spe-cific prevalence estimates.
117
Global Burden of Disease 2004
Data sources and methods
1
2
3
4
Annex A
Annex B
Annex C
References
Clinically and conceptually it is not usual prac-tice to infer disability from diagnoses. Disabilities are limitations or problems in the performance of actions or tasks. They are identified and assessed in their own right – and in some cases may only sub-sequently be explained in terms of pathology, or may never be adequately explained at all. In future revisions of the GBD study, increased effort will be devoted to the estimation of the prevalences of impairments and disabilities directly, and to ensur-ing consistency with the disease- and injury-specific sequelae estimates. The GBD disability prevalence estimates have the virtue of comprehensiveness, and at least some grounding in disease prevalence. However, they are very much approximations, and are subject to very clear limitations in the way they were compiled and in the way that comorbidity was addressed in adding across causes.
B7. Projections of mortality and burden of disease
WHO recently published mortality projections from 2003 to 2030 using methods similar to those applied in the original GBD study and starting from the GBD 2002 estimates (19). A set of relatively simple models were used to project future health trends for baseline, optimistic and pessimistic scenarios, based largely on projections of economic and social devel-opment, and using the historically observed relation-ships of these with cause-specific mortality rates.
Updated projections to the year 2030 have been prepared using the updated GBD 2004 results as a starting-point. The methods used are essentially the same as those previously published (19), with the following changes:
• Projections of income per capita were revised to take account of World Bank revisions to purchas-ing power parity (PPP) conversion rates (157) and latest World Bank regional projections of real growth per annum in income per capita (21);
• Countries for which low-income regression coef-ficients were used were revised to take account of revised country income levels and projections;
• The projection regression equations were recali-brated so that back projections of child mortality
rates from 2004 to 1990 matched observed trends for World Bank regions. In the recalibrated pro-jections, the regression coefficient for human cap-ital was left unchanged and the regression coeffi-cient for time (a proxy for technological change) was set to zero for low-income countries in the African, European, South-East Asia and Western Pacific Regions;
• Revised UNAIDS projections for HIV mortality were used, based on projections of current trends in scale-up of antiretroviral therapy coverage;
• Relative risks for diabetes mellitus mortality asso-ciated with increasing levels of body mass index (kg/m2) were revised downwards based on latest information from the Asia Pacific Cohorts study.
B8. Uncertainty of estimates and projections
There remain substantial data gaps and deficiencies, particularly for regions with limited death registra-tion data. The GBD 2004 includes results for these regions, albeit with wider uncertainty ranges, based on the best possible assessment of the available evi-dence. Uncertainty ranges for all-cause mortality rates for WHO Member States were published in the World health report 2006 (25). Uncertainty analysis for the GBD 2004 cause-specific estimates has not been carried out, but uncertainty ranges are likely to be similar to those assessed for the GBD 2001 (158).
Ninety-five per cent uncertainty ranges for regional cause-specific mortality estimates were cal-culated using simulation methods based on estimated uncertainty ranges for input data (158). Uncertainty in estimated all-cause mortality for 2001 ranged from ±1% for high-income countries to ±15–20% for sub-Saharan Africa, reflecting differential data availability. Uncertainty ranges were generally larger for deaths from specific diseases. For example, the relative uncertainty for deaths from ischaemic heart disease ranged from ±12% for high-income coun-tries to ±25–35% for sub-Saharan Africa.
Assessments of 2001 YLD uncertainty for specific causes took into account not only typical levels of measurement error in the input data sets, but also expert judgment about the degree of uncertainty
118
World Health Organization
Annex B
arising from the lack of representativeness of the available data for each region. The resulting uncer-tainty varied considerably across causes, ranging from relatively certain estimates for diseases such as polio, for which intensive surveillance systems are in place, to highly uncertain estimates for those such as osteoarthritis, where for some regions no usable data source was found, and for others the latest available data were decades old. Typical uncertainty for regional prevalence estimates ranged from ±10% to ±90%, with a median value of ±41%, among a subset of diseases for which uncertainty analysis was carried out (158).
Although the GBD 2004 estimates have similarly large uncertainty ranges for some causes and some regions, they continue to provide useful information on broad relativities of disease burden, on the rela-tive importance of mortality and disability, and on regional patterns of disease burden. The analysis of the levels of uncertainty in the GBD 2001 estimates reinforces the need for caution when interpreting global comparative epidemiological assessments and the need for increased investment in population health measurement systems and in improved meth-ods for analysing available population health data.
The projected declining age-specific death rates for most chronic diseases reflect the observed declines in age-specific chronic disease death rates
with increasing levels of development in the availa-ble death registration data for 107 countries between 1950 and 2002. Adverse trends for some chronic disease risk factors such as overweight and physical inactivity were probably more than offset in these countries by improved control of other risk factors such as high blood pressure, high blood cholesterol and tobacco smoking, and improved access to effec-tive treatment interventions.
Projected chronic disease mortality rates are not highly sensitive to a reasonably broad range of assumptions about future economic growth and trends in the tobacco epidemic. The projected decline in communicable disease mortality rates is more sensitive to these assumptions, and may be optimistic if future trends in economic growth are not as high as projected. The mortality and burden of disease projections are less firm than the base year assessments, and provide “business as usual” projec-tions under specified assumptions that do not spe-cifically take account of trends in major risk factors apart from tobacco smoking and, to a limited extent, overweight and obesity. If risk factor exposures do not generally decline with economic development and with improving health systems in developing countries, then these projections may underestimate future deaths in low- and middle-income countries.
Annex C
Analysis categories and mortality data sources
Table C1: Countries grouped by WHO region and income per capita, 2004 120
Table C2: Countries grouped by income per capita, 2004 121
Table C3: GBD cause categories and ICD codes 122
Table C4: Data sources and methods for estimation of mortality by cause,
age and sex 126
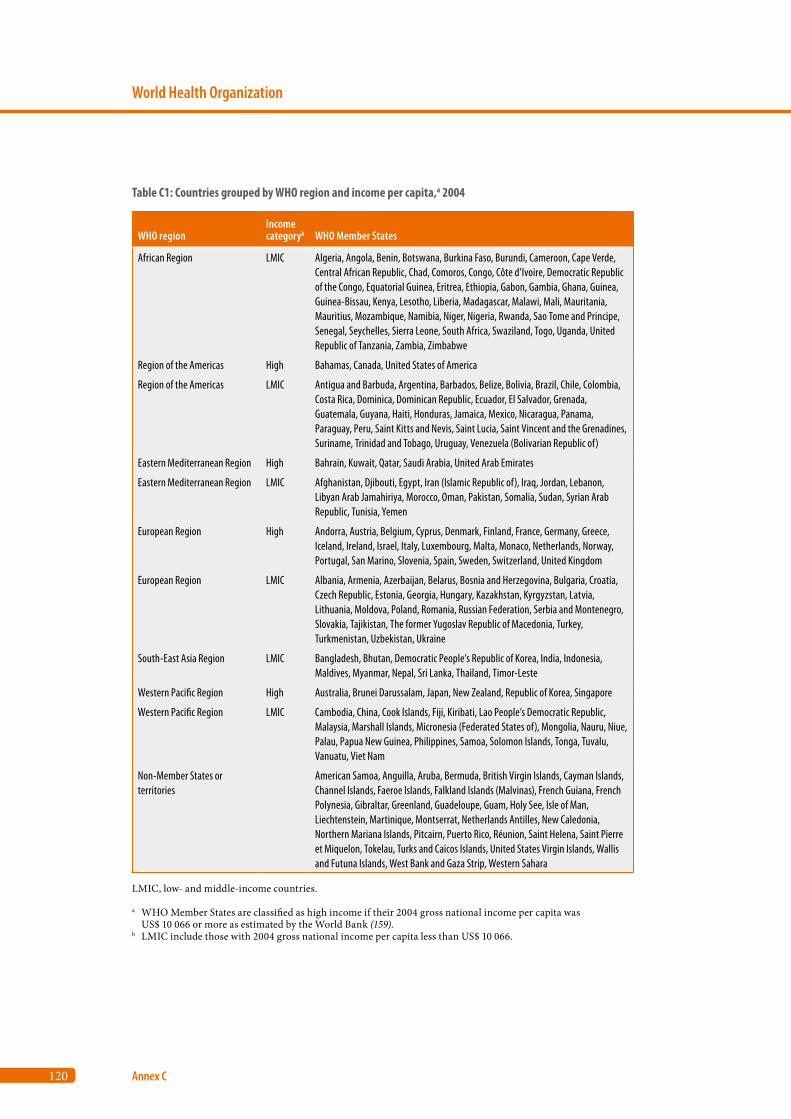
120
World Health Organization
Annex C
Table C1: Countries grouped by WHO region and income per capita,a 2004
WHO regionIncome categoryb WHO Member States
African Region LMIC Algeria, Angola, Benin, Botswana, Burkina Faso, Burundi, Cameroon, Cape Verde, Central African Republic, Chad, Comoros, Congo, Côte d’Ivoire, Democratic Republic of the Congo, Equatorial Guinea, Eritrea, Ethiopia, Gabon, Gambia, Ghana, Guinea, Guinea-Bissau, Kenya, Lesotho, Liberia, Madagascar, Malawi, Mali, Mauritania, Mauritius, Mozambique, Namibia, Niger, Nigeria, Rwanda, Sao Tome and Principe, Senegal, Seychelles, Sierra Leone, South Africa, Swaziland, Togo, Uganda, United Republic of Tanzania, Zambia, Zimbabwe
Region of the Americas High Bahamas, Canada, United States of America
Region of the Americas LMIC Antigua and Barbuda, Argentina, Barbados, Belize, Bolivia, Brazil, Chile, Colombia, Costa Rica, Dominica, Dominican Republic, Ecuador, El Salvador, Grenada, Guatemala, Guyana, Haiti, Honduras, Jamaica, Mexico, Nicaragua, Panama, Paraguay, Peru, Saint Kitts and Nevis, Saint Lucia, Saint Vincent and the Grenadines, Suriname, Trinidad and Tobago, Uruguay, Venezuela (Bolivarian Republic of)
Eastern Mediterranean Region High Bahrain, Kuwait, Qatar, Saudi Arabia, United Arab Emirates
Eastern Mediterranean Region LMIC Afghanistan, Djibouti, Egypt, Iran (Islamic Republic of), Iraq, Jordan, Lebanon, Libyan Arab Jamahiriya, Morocco, Oman, Pakistan, Somalia, Sudan, Syrian Arab Republic, Tunisia, Yemen
European Region High Andorra, Austria, Belgium, Cyprus, Denmark, Finland, France, Germany, Greece, Iceland, Ireland, Israel, Italy, Luxembourg, Malta, Monaco, Netherlands, Norway, Portugal, San Marino, Slovenia, Spain, Sweden, Switzerland, United Kingdom
European Region LMIC Albania, Armenia, Azerbaijan, Belarus, Bosnia and Herzegovina, Bulgaria, Croatia, Czech Republic, Estonia, Georgia, Hungary, Kazakhstan, Kyrgyzstan, Latvia, Lithuania, Moldova, Poland, Romania, Russian Federation, Serbia and Montenegro, Slovakia, Tajikistan, The former Yugoslav Republic of Macedonia, Turkey, Turkmenistan, Uzbekistan, Ukraine
South-East Asia Region LMIC Bangladesh, Bhutan, Democratic People’s Republic of Korea, India, Indonesia, Maldives, Myanmar, Nepal, Sri Lanka, Thailand, Timor-Leste
Western Pacific Region High Australia, Brunei Darussalam, Japan, New Zealand, Republic of Korea, Singapore
Western Pacific Region LMIC Cambodia, China, Cook Islands, Fiji, Kiribati, Lao People’s Democratic Republic, Malaysia, Marshall Islands, Micronesia (Federated States of), Mongolia, Nauru, Niue, Palau, Papua New Guinea, Philippines, Samoa, Solomon Islands, Tonga, Tuvalu, Vanuatu, Viet Nam
Non-Member States or territories
American Samoa, Anguilla, Aruba, Bermuda, British Virgin Islands, Cayman Islands, Channel Islands, Faeroe Islands, Falkland Islands (Malvinas), French Guiana, French Polynesia, Gibraltar, Greenland, Guadeloupe, Guam, Holy See, Isle of Man, Liechtenstein, Martinique, Montserrat, Netherlands Antilles, New Caledonia, Northern Mariana Islands, Pitcairn, Puerto Rico, Réunion, Saint Helena, Saint Pierre et Miquelon, Tokelau, Turks and Caicos Islands, United States Virgin Islands, Wallis and Futuna Islands, West Bank and Gaza Strip, Western Sahara
LMIC, low- and middle-income countries.
a WHO Member States are classified as high income if their 2004 gross national income per capita was US$ 10 066 or more as estimated by the World Bank (159).
b LMIC include those with 2004 gross national income per capita less than US$ 10 066.
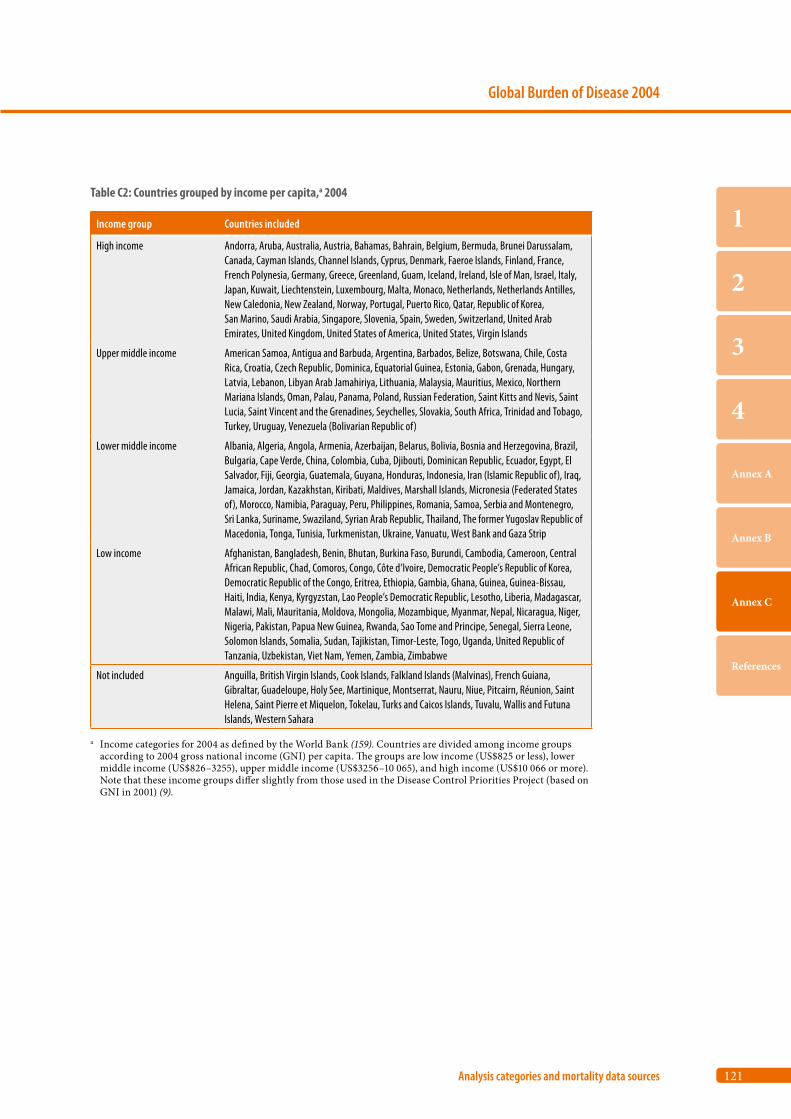
121
Global Burden of Disease 2004
Analysis categories and mortality data sources
1
2
3
4
Annex A
Annex B
Annex C
References
Table C2: Countries grouped by income per capita,a 2004
Income group Countries included
High income Andorra, Aruba, Australia, Austria, Bahamas, Bahrain, Belgium, Bermuda, Brunei Darussalam, Canada, Cayman Islands, Channel Islands, Cyprus, Denmark, Faeroe Islands, Finland, France, French Polynesia, Germany, Greece, Greenland, Guam, Iceland, Ireland, Isle of Man, Israel, Italy, Japan, Kuwait, Liechtenstein, Luxembourg, Malta, Monaco, Netherlands, Netherlands Antilles, New Caledonia, New Zealand, Norway, Portugal, Puerto Rico, Qatar, Republic of Korea, San Marino, Saudi Arabia, Singapore, Slovenia, Spain, Sweden, Switzerland, United Arab Emirates, United Kingdom, United States of America, United States, Virgin Islands
Upper middle income American Samoa, Antigua and Barbuda, Argentina, Barbados, Belize, Botswana, Chile, Costa Rica, Croatia, Czech Republic, Dominica, Equatorial Guinea, Estonia, Gabon, Grenada, Hungary, Latvia, Lebanon, Libyan Arab Jamahiriya, Lithuania, Malaysia, Mauritius, Mexico, Northern Mariana Islands, Oman, Palau, Panama, Poland, Russian Federation, Saint Kitts and Nevis, Saint Lucia, Saint Vincent and the Grenadines, Seychelles, Slovakia, South Africa, Trinidad and Tobago, Turkey, Uruguay, Venezuela (Bolivarian Republic of)
Lower middle income Albania, Algeria, Angola, Armenia, Azerbaijan, Belarus, Bolivia, Bosnia and Herzegovina, Brazil, Bulgaria, Cape Verde, China, Colombia, Cuba, Djibouti, Dominican Republic, Ecuador, Egypt, El Salvador, Fiji, Georgia, Guatemala, Guyana, Honduras, Indonesia, Iran (Islamic Republic of), Iraq, Jamaica, Jordan, Kazakhstan, Kiribati, Maldives, Marshall Islands, Micronesia (Federated States of), Morocco, Namibia, Paraguay, Peru, Philippines, Romania, Samoa, Serbia and Montenegro, Sri Lanka, Suriname, Swaziland, Syrian Arab Republic, Thailand, The former Yugoslav Republic of Macedonia, Tonga, Tunisia, Turkmenistan, Ukraine, Vanuatu, West Bank and Gaza Strip
Low income Afghanistan, Bangladesh, Benin, Bhutan, Burkina Faso, Burundi, Cambodia, Cameroon, Central African Republic, Chad, Comoros, Congo, Côte d’Ivoire, Democratic People’s Republic of Korea, Democratic Republic of the Congo, Eritrea, Ethiopia, Gambia, Ghana, Guinea, Guinea-Bissau, Haiti, India, Kenya, Kyrgyzstan, Lao People’s Democratic Republic, Lesotho, Liberia, Madagascar, Malawi, Mali, Mauritania, Moldova, Mongolia, Mozambique, Myanmar, Nepal, Nicaragua, Niger, Nigeria, Pakistan, Papua New Guinea, Rwanda, Sao Tome and Principe, Senegal, Sierra Leone, Solomon Islands, Somalia, Sudan, Tajikistan, Timor-Leste, Togo, Uganda, United Republic of Tanzania, Uzbekistan, Viet Nam, Yemen, Zambia, Zimbabwe
Not included Anguilla, British Virgin Islands, Cook Islands, Falkland Islands (Malvinas), French Guiana, Gibraltar, Guadeloupe, Holy See, Martinique, Montserrat, Nauru, Niue, Pitcairn, Réunion, Saint Helena, Saint Pierre et Miquelon, Tokelau, Turks and Caicos Islands, Tuvalu, Wallis and Futuna Islands, Western Sahara
a Income categories for 2004 as defined by the World Bank (159). Countries are divided among income groups according to 2004 gross national income (GNI) per capita. The groups are low income (US$825 or less), lower middle income (US$826–3255), upper middle income (US$3256–10 065), and high income (US$10 066 or more). Note that these income groups differ slightly from those used in the Disease Control Priorities Project (based on GNI in 2001) (9).
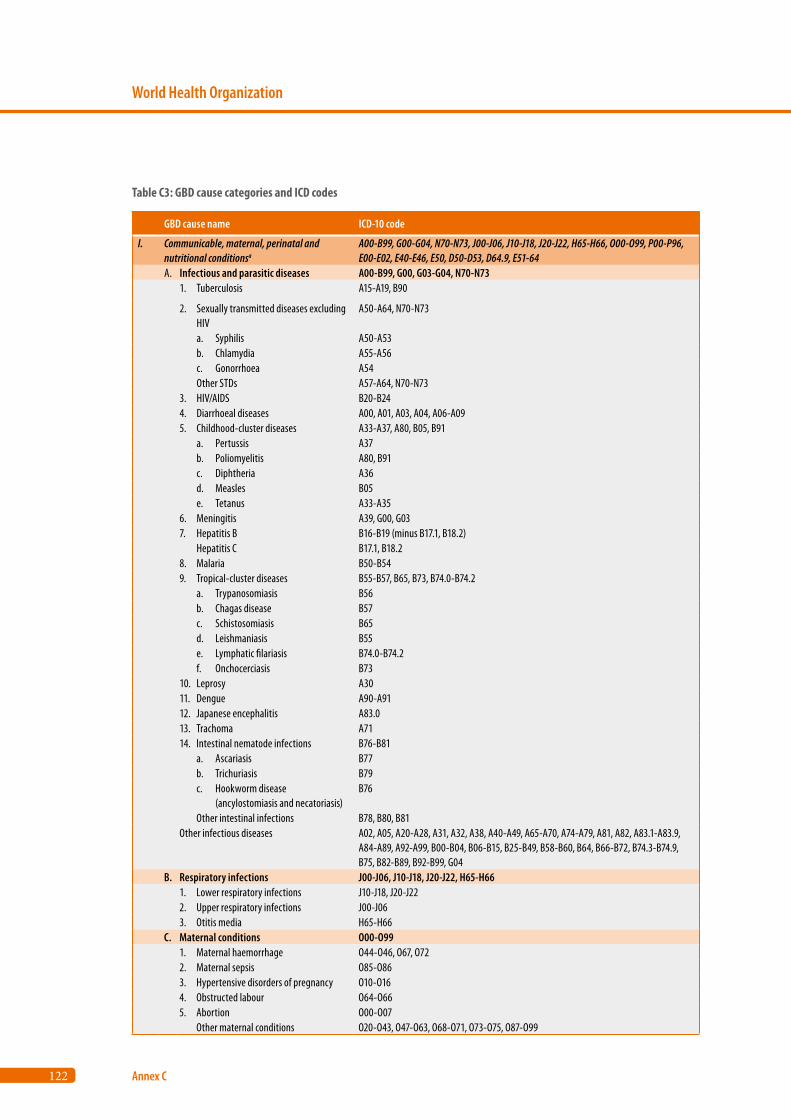
122
World Health Organization
Annex C
GBD cause name ICD-10 code
I. Communicable, maternal, perinatal andnutritional conditionsa
A00-B99, G00-G04, N70-N73, J00-J06, J10-J18, J20-J22, H65-H66, O00-O99, P00-P96, E00-E02, E40-E46, E50, D50-D53, D64.9, E51-64
A. Infectious and parasitic diseases A00-B99, G00, G03-G04, N70-N731. Tuberculosis A15-A19, B90
2. Sexually transmitted diseases excluding HIV
A50-A64, N70-N73
a. Syphilis A50-A53b. Chlamydia A55-A56c. Gonorrhoea A54Other STDs A57-A64, N70-N73
3. HIV/AIDS B20-B244. Diarrhoeal diseases A00, A01, A03, A04, A06-A095. Childhood-cluster diseases A33-A37, A80, B05, B91
a. Pertussis A37b. Poliomyelitis A80, B91c. Diphtheria A36d. Measles B05e. Tetanus A33-A35
6. Meningitis A39, G00, G037. Hepatitis B B16-B19 (minus B17.1, B18.2)
Hepatitis C B17.1, B18.28. Malaria B50-B549. Tropical-cluster diseases B55-B57, B65, B73, B74.0-B74.2
a. Trypanosomiasis B56b. Chagas disease B57c. Schistosomiasis B65d. Leishmaniasis B55e. Lymphatic filariasis B74.0-B74.2f. Onchocerciasis B73
10. Leprosy A3011. Dengue A90-A9112. Japanese encephalitis A83.013. Trachoma A7114. Intestinal nematode infections B76-B81
a. Ascariasis B77b. Trichuriasis B79c. Hookworm disease (ancylostomiasis and necatoriasis)
B76
Other intestinal infections B78, B80, B81Other infectious diseases A02, A05, A20-A28, A31, A32, A38, A40-A49, A65-A70, A74-A79, A81, A82, A83.1-A83.9,
A84-A89, A92-A99, B00-B04, B06-B15, B25-B49, B58-B60, B64, B66-B72, B74.3-B74.9, B75, B82-B89, B92-B99, G04
B. Respiratory infections J00-J06, J10-J18, J20-J22, H65-H661. Lower respiratory infections J10-J18, J20-J222. Upper respiratory infections J00-J063. Otitis media H65-H66
C. Maternal conditions O00-O991. Maternal haemorrhage O44-O46, O67, O722. Maternal sepsis O85-O863. Hypertensive disorders of pregnancy O10-O164. Obstructed labour O64-O665. Abortion O00-O07
Other maternal conditions O20-O43, O47-O63, O68-O71, O73-O75, O87-O99
Table C3: GBD cause categories and ICD codes
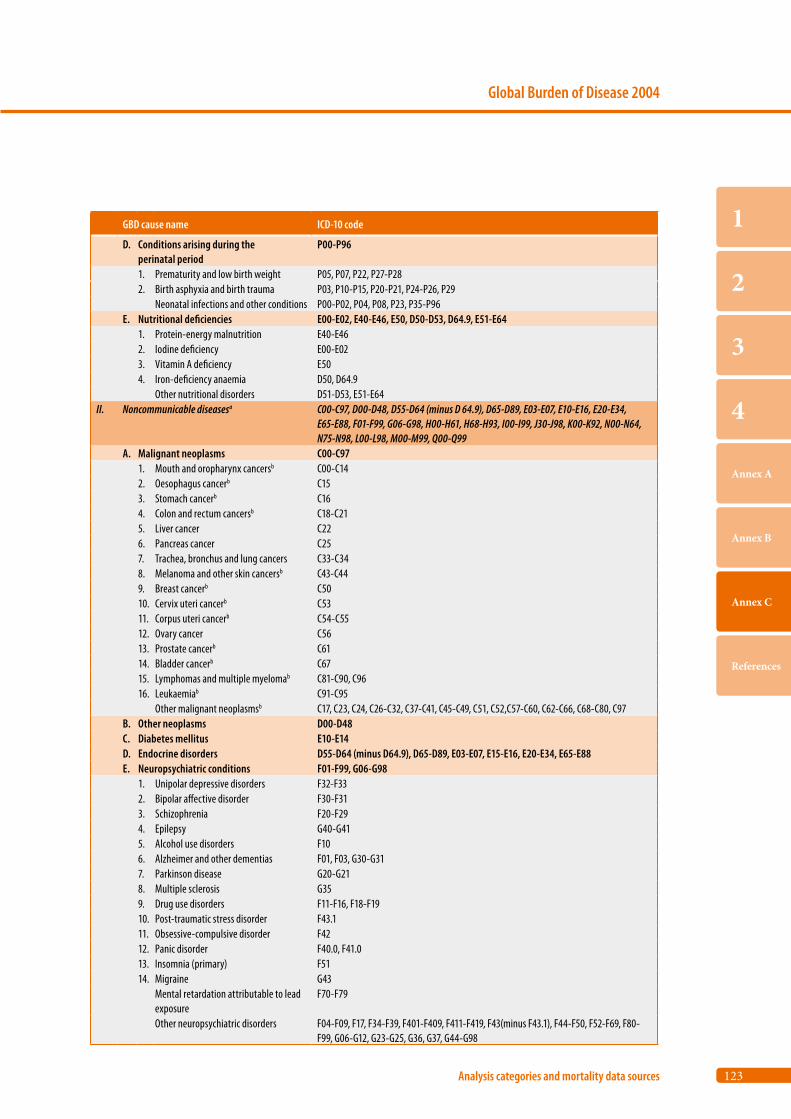
123
Global Burden of Disease 2004
Analysis categories and mortality data sources
1
2
3
4
Annex A
Annex B
Annex C
References
GBD cause name ICD-10 code
D. Conditions arising during the perinatal period
P00-P96
1. Prematurity and low birth weight P05, P07, P22, P27-P282. Birth asphyxia and birth trauma P03, P10-P15, P20-P21, P24-P26, P29
Neonatal infections and other conditions P00-P02, P04, P08, P23, P35-P96E. Nutritional deficiencies E00-E02, E40-E46, E50, D50-D53, D64.9, E51-E64
1. Protein-energy malnutrition E40-E462. Iodine deficiency E00-E023. Vitamin A deficiency E504. Iron-deficiency anaemia D50, D64.9
Other nutritional disorders D51-D53, E51-E64II. Noncommunicable diseasesa C00-C97, D00-D48, D55-D64 (minus D 64.9), D65-D89, E03-E07, E10-E16, E20-E34,
E65-E88, F01-F99, G06-G98, H00-H61, H68-H93, I00-I99, J30-J98, K00-K92, N00-N64, N75-N98, L00-L98, M00-M99, Q00-Q99
A. Malignant neoplasms C00-C971. Mouth and oropharynx cancersb C00-C142. Oesophagus cancerb C153. Stomach cancerb C164. Colon and rectum cancersb C18-C215. Liver cancer C226. Pancreas cancer C257. Trachea, bronchus and lung cancers C33-C348. Melanoma and other skin cancersb C43-C449. Breast cancerb C5010. Cervix uteri cancerb C5311. Corpus uteri cancerb C54-C5512. Ovary cancer C5613. Prostate cancerb C6114. Bladder cancerb C6715. Lymphomas and multiple myelomab C81-C90, C9616. Leukaemiab C91-C95
Other malignant neoplasmsb C17, C23, C24, C26-C32, C37-C41, C45-C49, C51, C52,C57-C60, C62-C66, C68-C80, C97B. Other neoplasms D00-D48C. Diabetes mellitus E10-E14D. Endocrine disorders D55-D64 (minus D64.9), D65-D89, E03-E07, E15-E16, E20-E34, E65-E88E. Neuropsychiatric conditions F01-F99, G06-G98
1. Unipolar depressive disorders F32-F332. Bipolar affective disorder F30-F313. Schizophrenia F20-F294. Epilepsy G40-G415. Alcohol use disorders F106. Alzheimer and other dementias F01, F03, G30-G317. Parkinson disease G20-G218. Multiple sclerosis G359. Drug use disorders F11-F16, F18-F1910. Post-traumatic stress disorder F43.111. Obsessive-compulsive disorder F4212. Panic disorder F40.0, F41.013. Insomnia (primary) F5114. Migraine G43
Mental retardation attributable to lead exposure
F70-F79
Other neuropsychiatric disorders F04-F09, F17, F34-F39, F401-F409, F411-F419, F43(minus F43.1), F44-F50, F52-F69, F80-F99, G06-G12, G23-G25, G36, G37, G44-G98
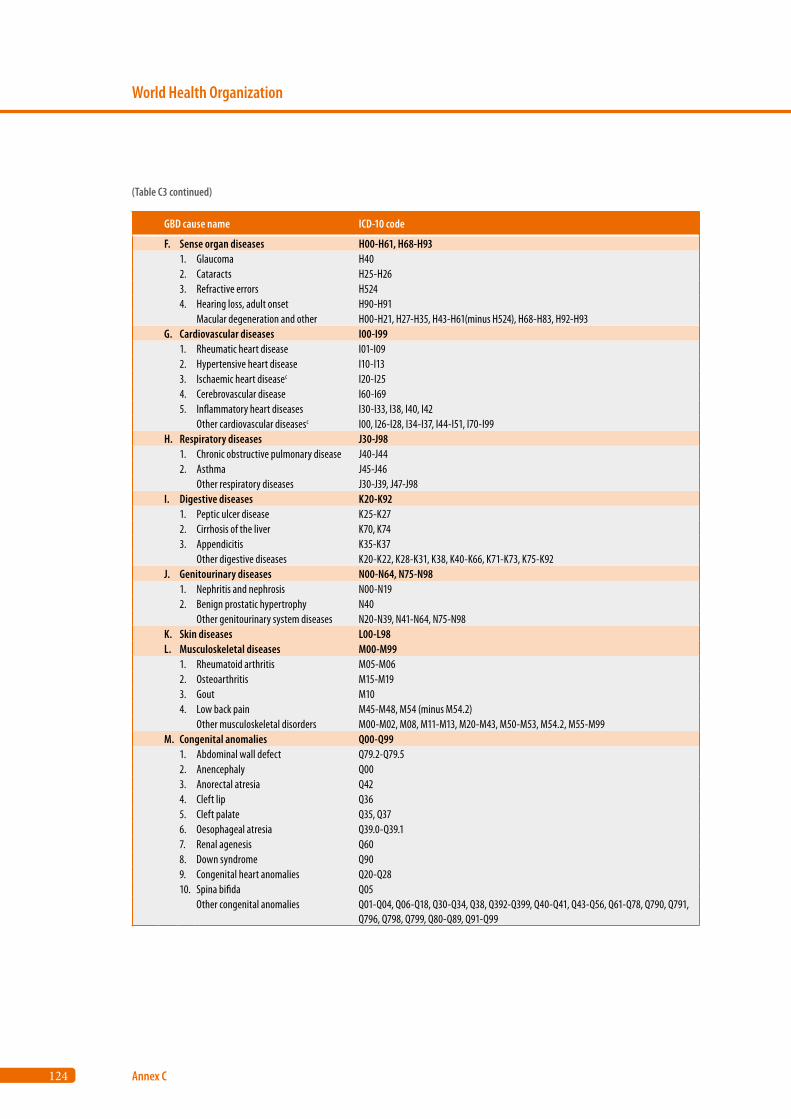
124
World Health Organization
Annex C
GBD cause name ICD-10 code
F. Sense organ diseases H00-H61, H68-H931. Glaucoma H402. Cataracts H25-H263. Refractive errors H5244. Hearing loss, adult onset H90-H91
Macular degeneration and other H00-H21, H27-H35, H43-H61(minus H524), H68-H83, H92-H93G. Cardiovascular diseases I00-I99
1. Rheumatic heart disease I01-I092. Hypertensive heart disease I10-I133. Ischaemic heart diseasec I20-I254. Cerebrovascular disease I60-I695. Inflammatory heart diseases I30-I33, I38, I40, I42
Other cardiovascular diseasesc I00, I26-I28, I34-I37, I44-I51, I70-I99H. Respiratory diseases J30-J98
1. Chronic obstructive pulmonary disease J40-J442. Asthma J45-J46
Other respiratory diseases J30-J39, J47-J98I. Digestive diseases K20-K92
1. Peptic ulcer disease K25-K272. Cirrhosis of the liver K70, K743. Appendicitis K35-K37
Other digestive diseases K20-K22, K28-K31, K38, K40-K66, K71-K73, K75-K92J. Genitourinary diseases N00-N64, N75-N98
1. Nephritis and nephrosis N00-N192. Benign prostatic hypertrophy N40
Other genitourinary system diseases N20-N39, N41-N64, N75-N98K. Skin diseases L00-L98L. Musculoskeletal diseases M00-M99
1. Rheumatoid arthritis M05-M062. Osteoarthritis M15-M193. Gout M104. Low back pain M45-M48, M54 (minus M54.2)
Other musculoskeletal disorders M00-M02, M08, M11-M13, M20-M43, M50-M53, M54.2, M55-M99M. Congenital anomalies Q00-Q99
1. Abdominal wall defect Q79.2-Q79.52. Anencephaly Q003. Anorectal atresia Q424. Cleft lip Q365. Cleft palate Q35, Q376. Oesophageal atresia Q39.0-Q39.17. Renal agenesis Q608. Down syndrome Q909. Congenital heart anomalies Q20-Q2810. Spina bifida Q05
Other congenital anomalies Q01-Q04, Q06-Q18, Q30-Q34, Q38, Q392-Q399, Q40-Q41, Q43-Q56, Q61-Q78, Q790, Q791, Q796, Q798, Q799, Q80-Q89, Q91-Q99
(Table C3 continued)
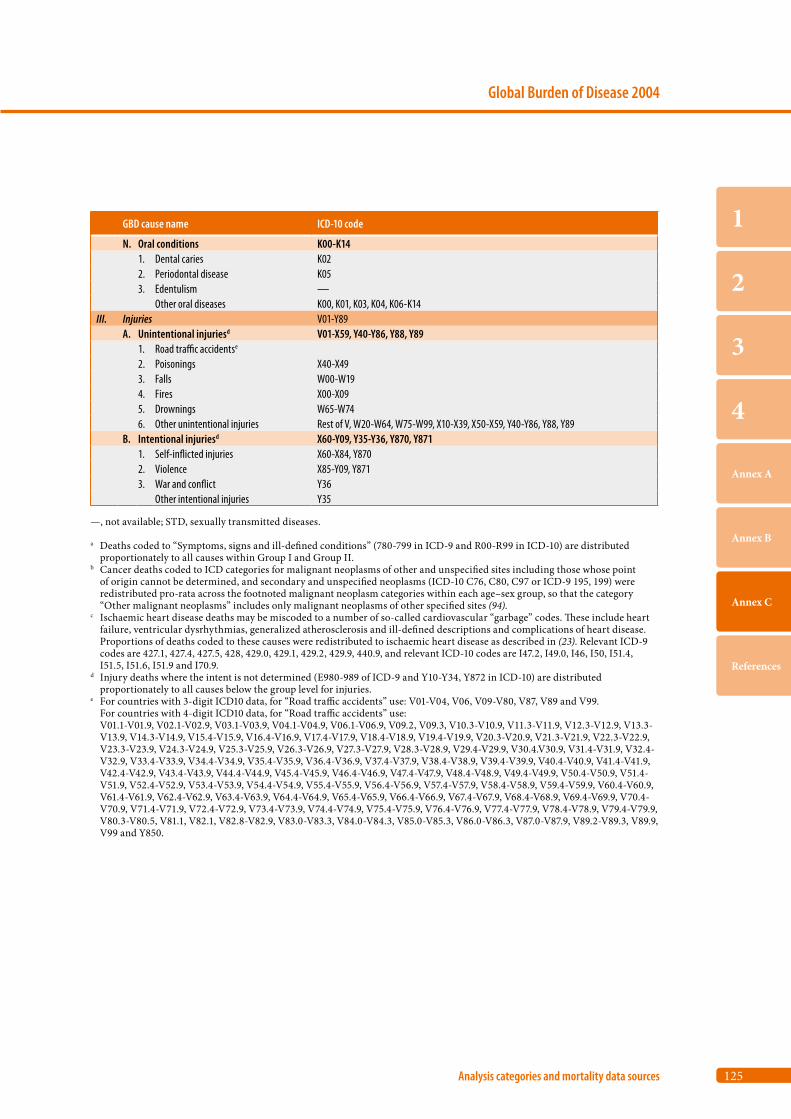
125
Global Burden of Disease 2004
Analysis categories and mortality data sources
1
2
3
4
Annex A
Annex B
Annex C
References
GBD cause name ICD-10 code
N. Oral conditions K00-K141. Dental caries K022. Periodontal disease K053. Edentulism —
Other oral diseases K00, K01, K03, K04, K06-K14III. Injuries V01-Y89
A. Unintentional injuriesd V01-X59, Y40-Y86, Y88, Y891. Road traffic accidentse
2. Poisonings X40-X493. Falls W00-W194. Fires X00-X095. Drownings W65-W746. Other unintentional injuries Rest of V, W20-W64, W75-W99, X10-X39, X50-X59, Y40-Y86, Y88, Y89
B. Intentional injuriesd X60-Y09, Y35-Y36, Y870, Y8711. Self-inflicted injuries X60-X84, Y8702. Violence X85-Y09, Y8713. War and conflict Y36
Other intentional injuries Y35
—, not available; STD, sexually transmitted diseases.
a Deaths coded to “Symptoms, signs and ill-defined conditions” (780-799 in ICD-9 and R00-R99 in ICD-10) are distributed proportionately to all causes within Group I and Group II.
b Cancer deaths coded to ICD categories for malignant neoplasms of other and unspecified sites including those whose point of origin cannot be determined, and secondary and unspecified neoplasms (ICD-10 C76, C80, C97 or ICD-9 195, 199) were redistributed pro-rata across the footnoted malignant neoplasm categories within each age–sex group, so that the category “Other malignant neoplasms” includes only malignant neoplasms of other specified sites (94).
c Ischaemic heart disease deaths may be miscoded to a number of so-called cardiovascular “garbage” codes. These include heart failure, ventricular dysrhythmias, generalized atherosclerosis and ill-defined descriptions and complications of heart disease. Proportions of deaths coded to these causes were redistributed to ischaemic heart disease as described in (23). Relevant ICD-9 codes are 427.1, 427.4, 427.5, 428, 429.0, 429.1, 429.2, 429.9, 440.9, and relevant ICD-10 codes are I47.2, I49.0, I46, I50, I51.4, I51.5, I51.6, I51.9 and I70.9.
d Injury deaths where the intent is not determined (E980-989 of ICD-9 and Y10-Y34, Y872 in ICD-10) are distributed proportionately to all causes below the group level for injuries.
e For countries with 3-digit ICD10 data, for “Road traffic accidents” use: V01-V04, V06, V09-V80, V87, V89 and V99. For countries with 4-digit ICD10 data, for “Road traffic accidents” use:
V01.1-V01.9, V02.1-V02.9, V03.1-V03.9, V04.1-V04.9, V06.1-V06.9, V09.2, V09.3, V10.3-V10.9, V11.3-V11.9, V12.3-V12.9, V13.3- V13.9, V14.3-V14.9, V15.4-V15.9, V16.4-V16.9, V17.4-V17.9, V18.4-V18.9, V19.4-V19.9, V20.3-V20.9, V21.3-V21.9, V22.3-V22.9, V23.3-V23.9, V24.3-V24.9, V25.3-V25.9, V26.3-V26.9, V27.3-V27.9, V28.3-V28.9, V29.4-V29.9, V30.4.V30.9, V31.4-V31.9, V32.4- V32.9, V33.4-V33.9, V34.4-V34.9, V35.4-V35.9, V36.4-V36.9, V37.4-V37.9, V38.4-V38.9, V39.4-V39.9, V40.4-V40.9, V41.4-V41.9, V42.4-V42.9, V43.4-V43.9, V44.4-V44.9, V45.4-V45.9, V46.4-V46.9, V47.4-V47.9, V48.4-V48.9, V49.4-V49.9, V50.4-V50.9, V51.4- V51.9, V52.4-V52.9, V53.4-V53.9, V54.4-V54.9, V55.4-V55.9, V56.4-V56.9, V57.4-V57.9, V58.4-V58.9, V59.4-V59.9, V60.4-V60.9, V61.4-V61.9, V62.4-V62.9, V63.4-V63.9, V64.4-V64.9, V65.4-V65.9, V66.4-V66.9, V67.4-V67.9, V68.4-V68.9, V69.4-V69.9, V70.4- V70.9, V71.4-V71.9, V72.4-V72.9, V73.4-V73.9, V74.4-V74.9, V75.4-V75.9, V76.4-V76.9, V77.4-V77.9, V78.4-V78.9, V79.4-V79.9, V80.3-V80.5, V81.1, V82.1, V82.8-V82.9, V83.0-V83.3, V84.0-V84.3, V85.0-V85.3, V86.0-V86.3, V87.0-V87.9, V89.2-V89.3, V89.9, V99 and Y850.
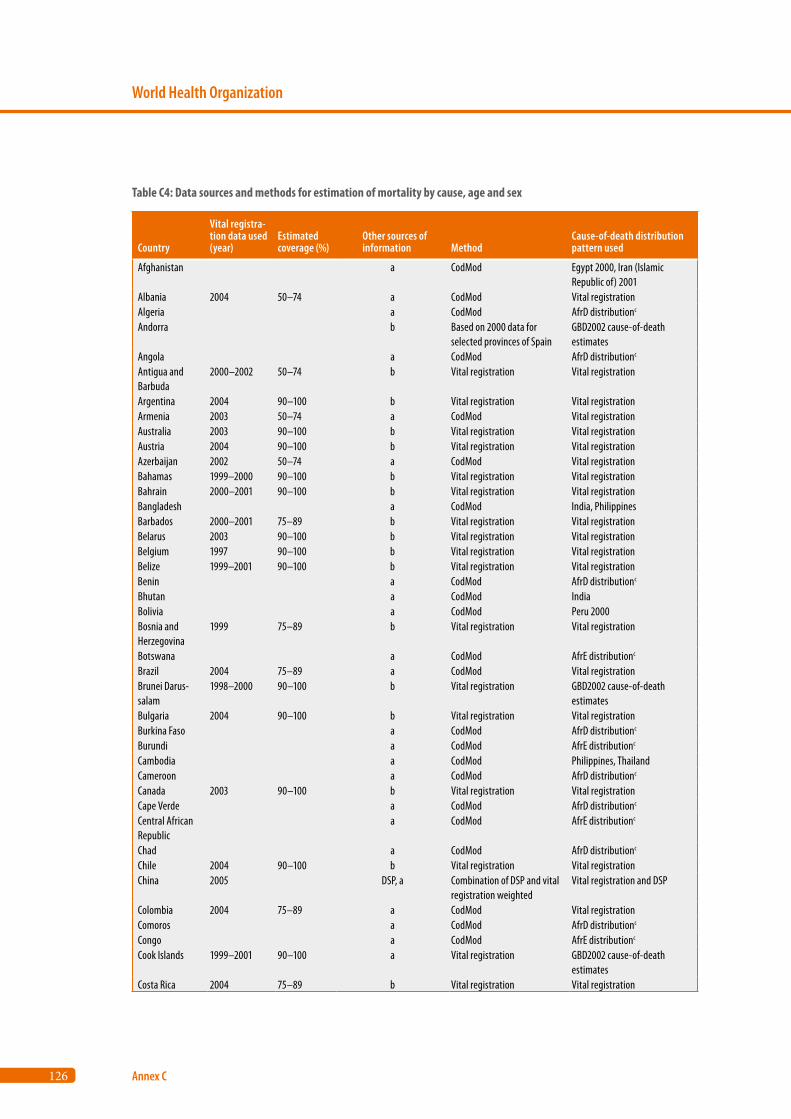
126
World Health Organization
Annex C
Country
Vital registra-tion data used (year)
Estimated coverage (%)
Other sources of information Method
Cause-of-death distribution pattern used
Afghanistan a CodMod Egypt 2000, Iran (Islamic Republic of) 2001
Albania 2004 50–74 a CodMod Vital registrationAlgeria a CodMod AfrD distributionc
Andorra b Based on 2000 data for selected provinces of Spain
GBD2002 cause-of-death estimates
Angola a CodMod AfrD distributionc
Antigua and Barbuda
2000–2002 50–74 b Vital registration Vital registration
Argentina 2004 90–100 b Vital registration Vital registrationArmenia 2003 50–74 a CodMod Vital registrationAustralia 2003 90–100 b Vital registration Vital registrationAustria 2004 90–100 b Vital registration Vital registrationAzerbaijan 2002 50–74 a CodMod Vital registrationBahamas 1999–2000 90–100 b Vital registration Vital registrationBahrain 2000–2001 90–100 b Vital registration Vital registrationBangladesh a CodMod India, PhilippinesBarbados 2000–2001 75–89 b Vital registration Vital registrationBelarus 2003 90–100 b Vital registration Vital registrationBelgium 1997 90–100 b Vital registration Vital registrationBelize 1999–2001 90–100 b Vital registration Vital registrationBenin a CodMod AfrD distributionc
Bhutan a CodMod IndiaBolivia a CodMod Peru 2000Bosnia and Herzegovina
1999 75–89 b Vital registration Vital registration
Botswana a CodMod AfrE distributionc
Brazil 2004 75–89 a CodMod Vital registrationBrunei Darus-salam
1998–2000 90–100 b Vital registration GBD2002 cause-of-death estimates
Bulgaria 2004 90–100 b Vital registration Vital registrationBurkina Faso a CodMod AfrD distributionc
Burundi a CodMod AfrE distributionc
Cambodia a CodMod Philippines, ThailandCameroon a CodMod AfrD distributionc
Canada 2003 90–100 b Vital registration Vital registrationCape Verde a CodMod AfrD distributionc
Central African Republic
a CodMod AfrE distributionc
Chad a CodMod AfrD distributionc
Chile 2004 90–100 b Vital registration Vital registrationChina 2005 DSP, a Combination of DSP and vital
registration weightedVital registration and DSP
Colombia 2004 75–89 a CodMod Vital registrationComoros a CodMod AfrD distributionc
Congo a CodMod AfrE distributionc
Cook Islands 1999–2001 90–100 a Vital registration GBD2002 cause-of-death estimates
Costa Rica 2004 75–89 b Vital registration Vital registration
Table C4: Data sources and methods for estimation of mortality by cause, age and sex
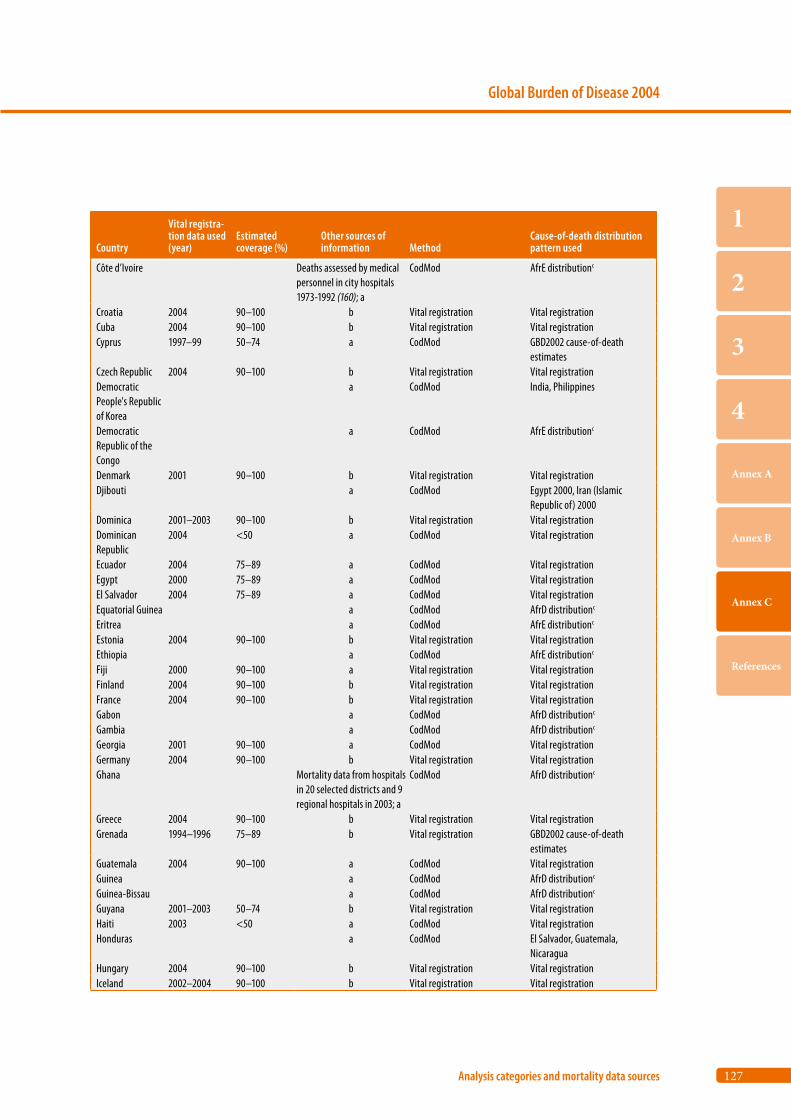
127
Global Burden of Disease 2004
Analysis categories and mortality data sources
1
2
3
4
Annex A
Annex B
Annex C
References
Country
Vital registra-tion data used (year)
Estimated coverage (%)
Other sources of information Method
Cause-of-death distribution pattern used
Côte d’Ivoire Deaths assessed by medical personnel in city hospitals 1973-1992 (160); a
CodMod AfrE distributionc
Croatia 2004 90–100 b Vital registration Vital registrationCuba 2004 90–100 b Vital registration Vital registrationCyprus 1997–99 50–74 a CodMod GBD2002 cause-of-death
estimates Czech Republic 2004 90–100 b Vital registration Vital registrationDemocratic People's Republic of Korea
a CodMod India, Philippines
Democratic Republic of the Congo
a CodMod AfrE distributionc
Denmark 2001 90–100 b Vital registration Vital registrationDjibouti a CodMod Egypt 2000, Iran (Islamic
Republic of) 2000Dominica 2001–2003 90–100 b Vital registration Vital registrationDominican Republic
2004 <50 a CodMod Vital registration
Ecuador 2004 75–89 a CodMod Vital registrationEgypt 2000 75–89 a CodMod Vital registrationEl Salvador 2004 75–89 a CodMod Vital registrationEquatorial Guinea a CodMod AfrD distributionc
Eritrea a CodMod AfrE distributionc
Estonia 2004 90–100 b Vital registration Vital registrationEthiopia a CodMod AfrE distributionc
Fiji 2000 90–100 a Vital registration Vital registrationFinland 2004 90–100 b Vital registration Vital registrationFrance 2004 90–100 b Vital registration Vital registrationGabon a CodMod AfrD distributionc
Gambia a CodMod AfrD distributionc
Georgia 2001 90–100 a CodMod Vital registrationGermany 2004 90–100 b Vital registration Vital registrationGhana Mortality data from hospitals
in 20 selected districts and 9 regional hospitals in 2003; a
CodMod AfrD distributionc
Greece 2004 90–100 b Vital registration Vital registrationGrenada 1994–1996 75–89 b Vital registration GBD2002 cause-of-death
estimates Guatemala 2004 90–100 a CodMod Vital registrationGuinea a CodMod AfrD distributionc
Guinea-Bissau a CodMod AfrD distributionc
Guyana 2001–2003 50–74 b Vital registration Vital registrationHaiti 2003 <50 a CodMod Vital registrationHonduras a CodMod El Salvador, Guatemala,
NicaraguaHungary 2004 90–100 b Vital registration Vital registrationIceland 2002–2004 90–100 b Vital registration Vital registration
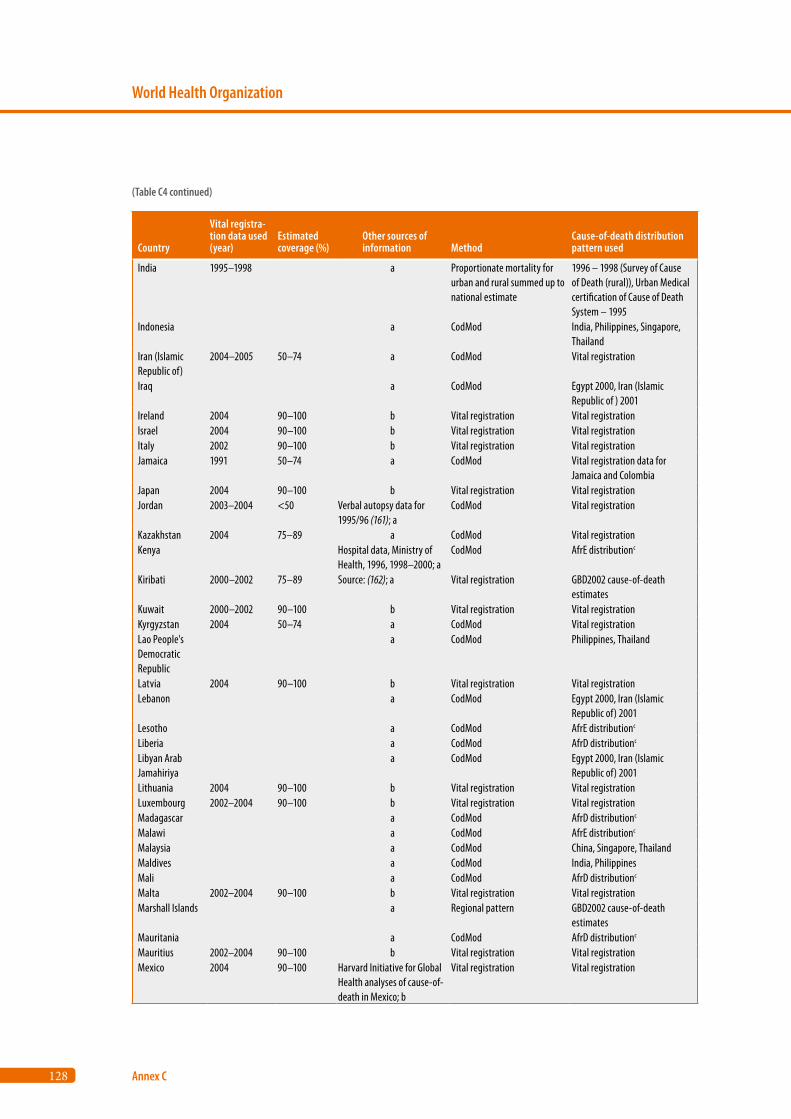
128
World Health Organization
Annex C
Country
Vital registra-tion data used (year)
Estimated coverage (%)
Other sources of information Method
Cause-of-death distribution pattern used
India 1995–1998 a Proportionate mortality for urban and rural summed up to national estimate
1996 – 1998 (Survey of Cause of Death (rural)), Urban Medical certification of Cause of Death System – 1995
Indonesia a CodMod India, Philippines, Singapore, Thailand
Iran (Islamic Republic of)
2004–2005 50–74 a CodMod Vital registration
Iraq a CodMod Egypt 2000, Iran (Islamic Republic of ) 2001
Ireland 2004 90–100 b Vital registration Vital registrationIsrael 2004 90–100 b Vital registration Vital registrationItaly 2002 90–100 b Vital registration Vital registrationJamaica 1991 50–74 a CodMod Vital registration data for
Jamaica and Colombia Japan 2004 90–100 b Vital registration Vital registrationJordan 2003–2004 <50 Verbal autopsy data for
1995/96 (161); aCodMod Vital registration
Kazakhstan 2004 75–89 a CodMod Vital registrationKenya Hospital data, Ministry of
Health, 1996, 1998–2000; aCodMod AfrE distributionc
Kiribati 2000–2002 75–89 Source: (162); a Vital registration GBD2002 cause-of-death estimates
Kuwait 2000–2002 90–100 b Vital registration Vital registrationKyrgyzstan 2004 50–74 a CodMod Vital registrationLao People's Democratic Republic
a CodMod Philippines, Thailand
Latvia 2004 90–100 b Vital registration Vital registrationLebanon a CodMod Egypt 2000, Iran (Islamic
Republic of) 2001Lesotho a CodMod AfrE distributionc
Liberia a CodMod AfrD distributionc
Libyan Arab Jamahiriya
a CodMod Egypt 2000, Iran (Islamic Republic of) 2001
Lithuania 2004 90–100 b Vital registration Vital registrationLuxembourg 2002–2004 90–100 b Vital registration Vital registrationMadagascar a CodMod AfrD distributionc
Malawi a CodMod AfrE distributionc
Malaysia a CodMod China, Singapore, ThailandMaldives a CodMod India, PhilippinesMali a CodMod AfrD distributionc
Malta 2002–2004 90–100 b Vital registration Vital registrationMarshall Islands a Regional pattern GBD2002 cause-of-death
estimates Mauritania a CodMod AfrD distributionc
Mauritius 2002–2004 90–100 b Vital registration Vital registrationMexico 2004 90–100 Harvard Initiative for Global
Health analyses of cause-of-death in Mexico; b
Vital registration Vital registration
(Table C4 continued)
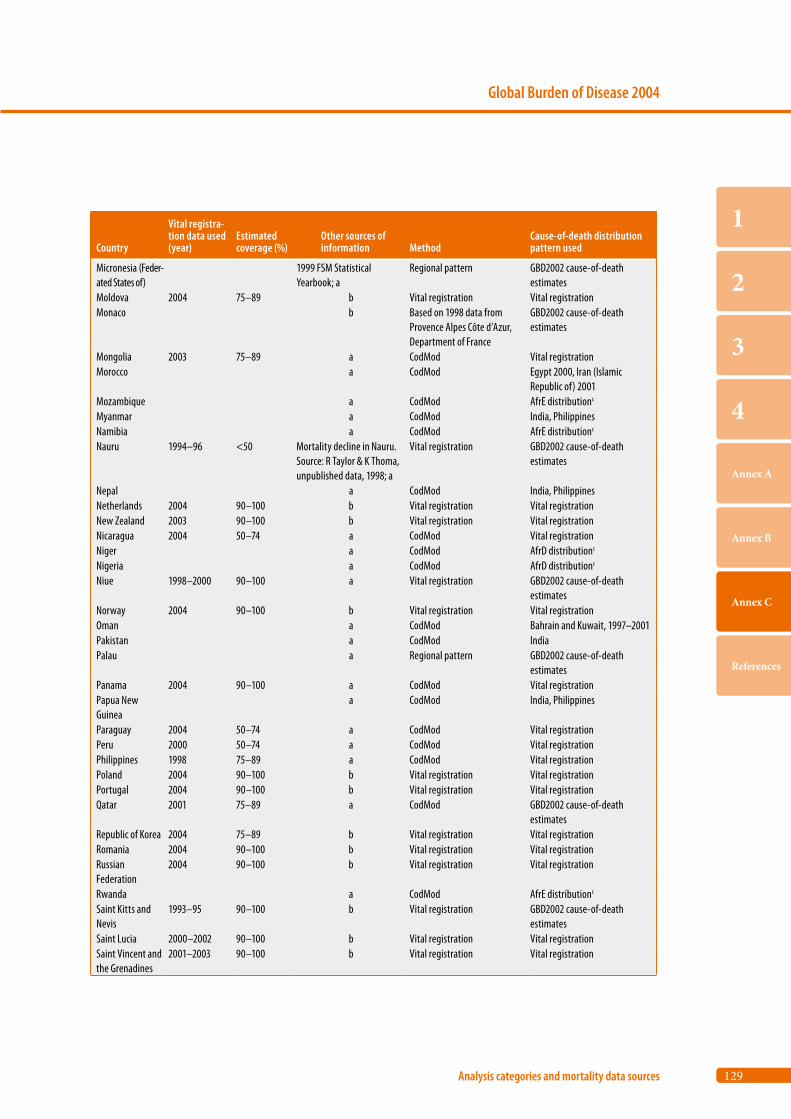
129
Global Burden of Disease 2004
Analysis categories and mortality data sources
1
2
3
4
Annex A
Annex B
Annex C
References
Country
Vital registra-tion data used (year)
Estimated coverage (%)
Other sources of information Method
Cause-of-death distribution pattern used
Micronesia (Feder-ated States of)
1999 FSM Statistical Yearbook; a
Regional pattern GBD2002 cause-of-death estimates
Moldova 2004 75–89 b Vital registration Vital registrationMonaco b Based on 1998 data from
Provence Alpes Côte d’Azur, Department of France
GBD2002 cause-of-death estimates
Mongolia 2003 75–89 a CodMod Vital registrationMorocco a CodMod Egypt 2000, Iran (Islamic
Republic of) 2001Mozambique a CodMod AfrE distributionc
Myanmar a CodMod India, PhilippinesNamibia a CodMod AfrE distributionc
Nauru 1994–96 <50 Mortality decline in Nauru. Source: R Taylor & K Thoma, unpublished data, 1998; a
Vital registration GBD2002 cause-of-death estimates
Nepal a CodMod India, Philippines Netherlands 2004 90–100 b Vital registration Vital registrationNew Zealand 2003 90–100 b Vital registration Vital registrationNicaragua 2004 50–74 a CodMod Vital registrationNiger a CodMod AfrD distributionc
Nigeria a CodMod AfrD distributionc
Niue 1998–2000 90–100 a Vital registration GBD2002 cause-of-death estimates
Norway 2004 90–100 b Vital registration Vital registrationOman a CodMod Bahrain and Kuwait, 1997–2001Pakistan a CodMod IndiaPalau a Regional pattern GBD2002 cause-of-death
estimates Panama 2004 90–100 a CodMod Vital registrationPapua New Guinea
a CodMod India, Philippines
Paraguay 2004 50–74 a CodMod Vital registrationPeru 2000 50–74 a CodMod Vital registrationPhilippines 1998 75–89 a CodMod Vital registrationPoland 2004 90–100 b Vital registration Vital registrationPortugal 2004 90–100 b Vital registration Vital registrationQatar 2001 75–89 a CodMod GBD2002 cause-of-death
estimates Republic of Korea 2004 75–89 b Vital registration Vital registrationRomania 2004 90–100 b Vital registration Vital registrationRussian Federation
2004 90–100 b Vital registration Vital registration
Rwanda a CodMod AfrE distributionc
Saint Kitts and Nevis
1993–95 90–100 b Vital registration GBD2002 cause-of-death estimates
Saint Lucia 2000–2002 90–100 b Vital registration Vital registrationSaint Vincent and the Grenadines
2001–2003 90–100 b Vital registration Vital registration
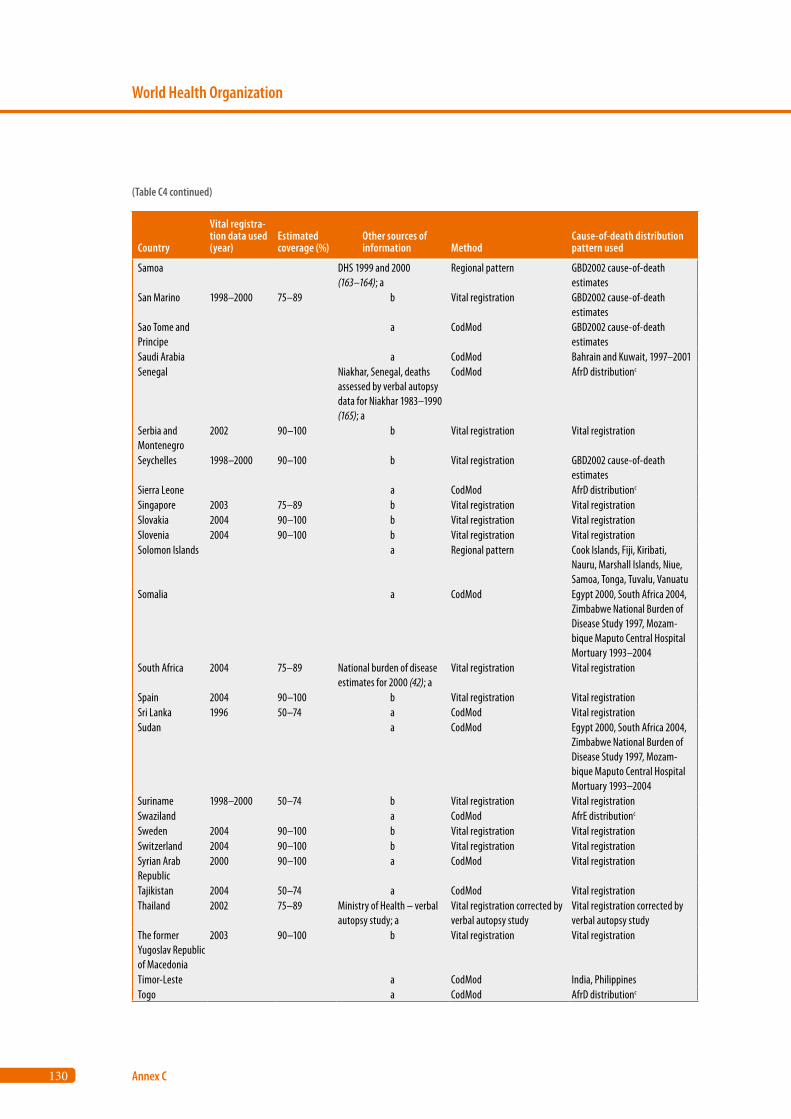
130
World Health Organization
Annex C
Country
Vital registra-tion data used (year)
Estimated coverage (%)
Other sources of information Method
Cause-of-death distribution pattern used
Samoa DHS 1999 and 2000 (163–164); a
Regional pattern GBD2002 cause-of-death estimates
San Marino 1998–2000 75–89 b Vital registration GBD2002 cause-of-death estimates
Sao Tome and Principe
a CodMod GBD2002 cause-of-death estimates
Saudi Arabia a CodMod Bahrain and Kuwait, 1997–2001Senegal Niakhar, Senegal, deaths
assessed by verbal autopsy data for Niakhar 1983–1990 (165); a
CodMod AfrD distributionc
Serbia and Montenegro
2002 90–100 b Vital registration Vital registration
Seychelles 1998–2000 90–100 b Vital registration GBD2002 cause-of-death estimates
Sierra Leone a CodMod AfrD distributionc
Singapore 2003 75–89 b Vital registration Vital registrationSlovakia 2004 90–100 b Vital registration Vital registrationSlovenia 2004 90–100 b Vital registration Vital registrationSolomon Islands a Regional pattern Cook Islands, Fiji, Kiribati,
Nauru, Marshall Islands, Niue, Samoa, Tonga, Tuvalu, Vanuatu
Somalia a CodMod Egypt 2000, South Africa 2004, Zimbabwe National Burden of Disease Study 1997, Mozam-bique Maputo Central Hospital Mortuary 1993–2004
South Africa 2004 75–89 National burden of disease estimates for 2000 (42); a
Vital registration Vital registration
Spain 2004 90–100 b Vital registration Vital registrationSri Lanka 1996 50–74 a CodMod Vital registrationSudan a CodMod Egypt 2000, South Africa 2004,
Zimbabwe National Burden of Disease Study 1997, Mozam-bique Maputo Central Hospital Mortuary 1993–2004
Suriname 1998–2000 50–74 b Vital registration Vital registrationSwaziland a CodMod AfrE distributionc
Sweden 2004 90–100 b Vital registration Vital registrationSwitzerland 2004 90–100 b Vital registration Vital registrationSyrian Arab Republic
2000 90–100 a CodMod Vital registration
Tajikistan 2004 50–74 a CodMod Vital registrationThailand 2002 75–89 Ministry of Health – verbal
autopsy study; aVital registration corrected by verbal autopsy study
Vital registration corrected by verbal autopsy study
The former Yugoslav Republic of Macedonia
2003 90–100 b Vital registration Vital registration
Timor-Leste a CodMod India, PhilippinesTogo a CodMod AfrD distributionc
(Table C4 continued)
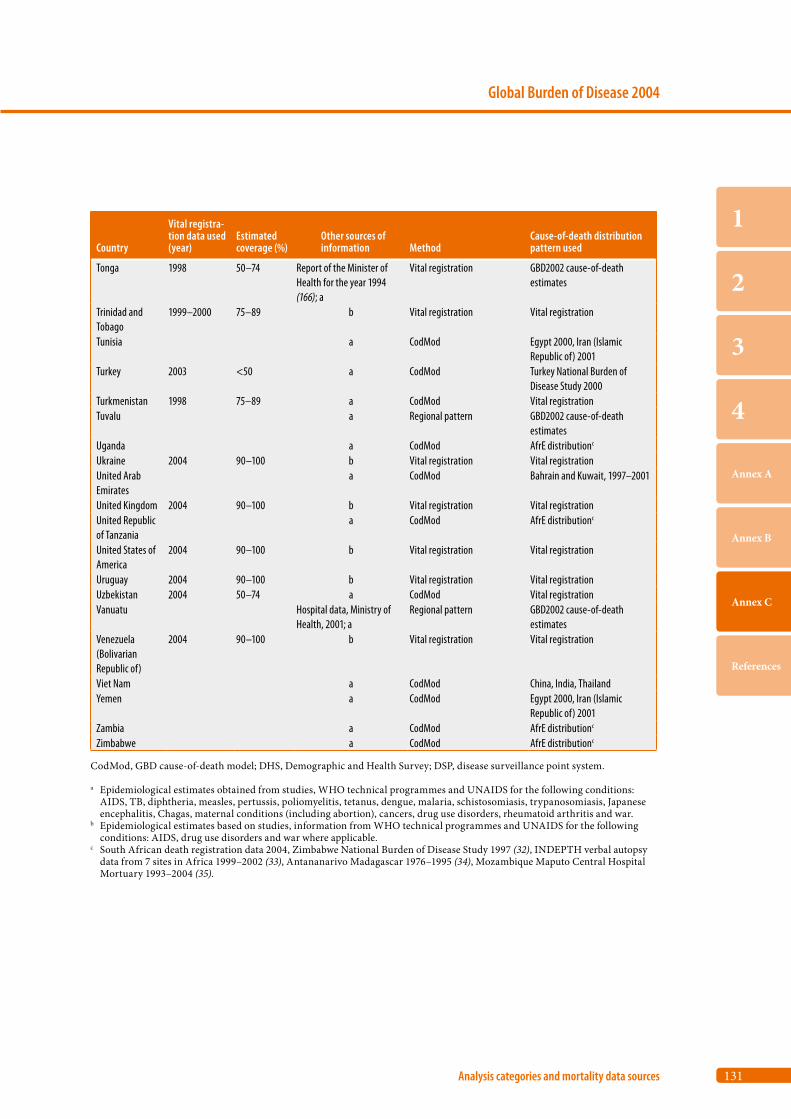
131
Global Burden of Disease 2004
Analysis categories and mortality data sources
1
2
3
4
Annex A
Annex B
Annex C
References
Country
Vital registra-tion data used (year)
Estimated coverage (%)
Other sources of information Method
Cause-of-death distribution pattern used
Tonga 1998 50–74 Report of the Minister of Health for the year 1994 (166); a
Vital registration GBD2002 cause-of-death estimates
Trinidad and Tobago
1999–2000 75–89 b Vital registration Vital registration
Tunisia a CodMod Egypt 2000, Iran (Islamic Republic of) 2001
Turkey 2003 <50 a CodMod Turkey National Burden of Disease Study 2000
Turkmenistan 1998 75–89 a CodMod Vital registrationTuvalu a Regional pattern GBD2002 cause-of-death
estimates Uganda a CodMod AfrE distributionc
Ukraine 2004 90–100 b Vital registration Vital registrationUnited Arab Emirates
a CodMod Bahrain and Kuwait, 1997–2001
United Kingdom 2004 90–100 b Vital registration Vital registrationUnited Republic of Tanzania
a CodMod AfrE distributionc
United States of America
2004 90–100 b Vital registration Vital registration
Uruguay 2004 90–100 b Vital registration Vital registrationUzbekistan 2004 50–74 a CodMod Vital registrationVanuatu Hospital data, Ministry of
Health, 2001; aRegional pattern GBD2002 cause-of-death
estimates Venezuela (Bolivarian Republic of)
2004 90–100 b Vital registration Vital registration
Viet Nam a CodMod China, India, ThailandYemen a CodMod Egypt 2000, Iran (Islamic
Republic of) 2001Zambia a CodMod AfrE distributionc
Zimbabwe a CodMod AfrE distributionc
CodMod, GBD cause-of-death model; DHS, Demographic and Health Survey; DSP, disease surveillance point system.
a Epidemiological estimates obtained from studies, WHO technical programmes and UNAIDS for the following conditions: AIDS, TB, diphtheria, measles, pertussis, poliomyelitis, tetanus, dengue, malaria, schistosomiasis, trypanosomiasis, Japanese encephalitis, Chagas, maternal conditions (including abortion), cancers, drug use disorders, rheumatoid arthritis and war.
b Epidemiological estimates based on studies, information from WHO technical programmes and UNAIDS for the following conditions: AIDS, drug use disorders and war where applicable.
c South African death registration data 2004, Zimbabwe National Burden of Disease Study 1997 (32), INDEPTH verbal autopsy data from 7 sites in Africa 1999–2002 (33), Antananarivo Madagascar 1976–1995 (34), Mozambique Maputo Central Hospital Mortuary 1993–2004 (35).

References
134
World Health Organization
References
1. World Bank. World development report 1993. Investing in health. New York, Oxford University Press for the World Bank, 1993.
2. Murray CJL, Lopez AD. Evidence-based health policy – lessons from the Global Burden of Disease Study. Science, 1996, 274:740–743.
3. Murray CJL, Lopez AD, eds. The global burden of disease: a comprehensive assessment of mortality and disability from diseases, injuries and risk factors in 1990 and projected to 2020. Cambridge, Harvard School of Public Health on behalf of the World Health Organization and the World Bank, 1996.
4. Murray CJL, Lopez AD. Global health statistics. Cambridge, Harvard School of Public Health on behalf of the World Health Organization and the World Bank, 1996.
5. Murray CJL. Rethinking DALYs. In: Murray CJL, Lopez AD, eds. The global burden of disease. Cambridge, Harvard School of Public Health on behalf of the World Health Organization and the World Bank, 1996:1–98.
6. World health report 2004: changing history. Geneva, World Health Organiza-tion, 2004.
7. Death and DALY estimates for 2002 by cause for WHO Member States. Geneva, World Health Organization, 2004 (http://www.who.int/evidence/bod).
8. Jamison DT, Breman JG, Measham AR, Alleyne G, Evans D, Claeson M et al. Disease control priorities in developing countries, 2nd ed. New York, Oxford University Press, 2006.
9. Lopez AD, Mathers CD, Ezzati M, Murray CJL, Jamison DT. Global burden of disease and risk factors. New York, Oxford University Press, 2006.
10. Murray CJL, Lopez AD, Black RE, Mathers CD, Shibuya K, Ezzati M et al. Global Burden of Disease 2005: call for collaborators. Lancet, 2007, 370:109–110.
11. Mathers CD, Lopez AD, Murray CJL. The burden of disease and mortality by condition: data, methods and results for 2001. In: Lopez AD, Mathers CD, Ezzati M, Murray CJL, Jamison DT, eds. Global burden of disease and risk factors. New York, Oxford University Press, 2006:45–240.
12. UNAIDS, World Health Organization. AIDS epidemic update: December 2007. Geneva, UNAIDS, 2007.
13. United Nations Population Division. World population prospects – the 2006 revision. New York, United Nations, 2007.
14. Black RE, Allen LH, Bhutta Z, Caulfield LE, de Onis M, Ezzati M et al. Mater-nal and child undernutrition: global and regional exposures and health con-sequences. Lancet, 2008, 371:243–260.
15. Murray CJL, Laakso T, Shibuya K, Hill K, Lopez AD. Can we achieve Mil-lennium Development Goal 4? New analysis of country trends and forecasts of under-5 mortality to 2015. Lancet, 2007, 370:1040–1054.
135
Global Burden of Disease 2004
References
1
2
3
4
Annex A
Annex B
Annex C
References
16. The state of the world’s children 2008. New York, United Nations Children’s Fund, 2008.
17. Bryce J, Black RE, Walker N, Bhutta ZA, Lawn JE, Steketee RW. Can the world afford to save the lives of 6 million children each year? Lancet, 2005, 365:2193–2200.
18. Preventing chronic diseases: a vital investment: WHO global report. Geneva, World Health Organization, 2005.
19. Mathers CD, Loncar D. Projections of global mortality and burden of dis-ease from 2002 to 2030. PLoS Medicine, 2006, 3:e442.
20. UNAIDS, WHO. Resource needs for AIDS in low- and middle-income coun-tries: estimation process and methods. Methodological Annex II: Revised projections of the number of people in need of ART. Geneva, Joint United Nations Programme on HIV/AIDS, 2007.
21. Global economic prospects 2008. Washington, DC, The World Bank, 2008.
22. Ahmad O, Boschi-Pinto C, Lopez AD, Murray CJL, Lozano R, Inoue M. Age standardization of rates: a new WHO standard. Geneva, World Health Organization, 2001 (GPE Discussion Paper No. 31).
23. Mathers CD, Iburg KM, Begg S. Adjusting for comorbidity in the calcula-tion of health-adjusted life expectancies. Population Health Metrics, 2003, 4:4.
24. Mathers CD, Bernard C, Iburg KM, Inoue M, Ma Fat D, Shibuya K et al. Global burden of disease in 2002: data sources, methods and results. Geneva, World Health Organization, 2003 (GPE Discussion Paper No. 54).
25. World health report 2006: working together for health. Geneva, World Health Organization, 2006.
26. Ahman E, Zupan J. Neonatal and perinatal mortality: country, regional and global estimates 2004. Geneva, World Health Organization, Department of Making Pregnancy Safer, 2007.
27. Bannister J, Hill K. Mortality in China, 1964-2000. Population Studies, 2004, 58:55–75.
28. Yang GH, Hu J, Rao KQ, Ma J, Rao C, Lopez AD. Mortality registration and surveillance in China: history, current situation and challenges. Population Health Metrics, 2005, 3:3.
29. Mari Bhat PN. Completeness of India’s sample registration system: an assessment using the general growth balance method. Population Studies, 2002, 56:119–134.
30. International Institute for Population Sciences, Macro International. National Family Health Survey (NFHS-3), 2005–06, Vol. I. India, Mumbai, International Institute for Population Sciences, 2007.
136
World Health Organization
References
31. Salomon JA, Murray CJL. The epidemiologic transition revisited: composi-tional models for causes of death by age and sex. Population and Develop-ment Review, 2002, 28:205–228.
32. Chapman G, Hansen K, Jelsma J, Ndhlovu C, Piotti B, Byskov J et al. The burden of disease in Zimbabwe in 1997 as measured by disability-adjusted life years lost. Tropical Medicine and International Health, 2006, 11:660–671.
33. Adjuik M, Smith T, Clark S, Todd J, Garrib A, Ashraf A et al. Cause-specific mortality rates in sub-Saharan Africa and Bangladesh. Bulletin of the World Health Organization, 2006, 84:181–188.
34. Waltisperger D, Cantrelle P, Ralijaona O. La Mortalité à Antananarivo de 1984 à 1995. Les Documents et Manuels CEPED no 7, mai 1998.
35. Injury Mortality Database. Department of Legal Medicine, Maputo Central Hospital, Ministry of Health, Mozambique, 2005.
36. Rao C, Lopez AD, Yang G, Begg S, Ma J. Evaluating national cause-of-death statistics: principles and application to the case of China. Bulletin of the World Health Organization, 2005, 83:618–624.
37. Jha P, Gajalakshmi V, Gupta PC, Kumar R, Mony P, Dhingra N et al. Pro-spective study of one million deaths in India: rationale, design, and valida-tion results. PLoS Medicine, 2006, 3:e18.
38. Khosravi A, Taylor R, Naghavi N, Lopez AD. Mortality in the Islamic Republic of Iran, 1964–2004. Bulletin of the World Health Organization, 2007, 85:607–614.
39. Stevens G, Dias RH, Thomas KJ, Rivera JA, Carvalho N, Barquera S et al. Characterizing the epidemiological transition in Mexico: national and subnational burden of diseases, injuries, and risk factors. PLoS Medicine, 2008, 5:e125 (http://medicine.plosjournals.org/perlserv/?request=get-document&doi=10.1371/journal.pmed.0050125, accessed 19 September 2008).
40. Report on the global HIV/AIDS epidemic – June 2000. Geneva, Joint United Nations Programme on HIV/AIDS, 2000.
41. Bah S. HIV/AIDS in South Africa in the light of death registration data: In search of elusive estimates. In: Zuberi T, Sibanda A, Udjo E, eds. The demog-raphy of South Africa. Armonk, ME Sharpe, 2005.
42. Norman R, Bradshaw D, Schneider M, Pieterse D, Groenewald P. Revised burden of disease estimates for the comparative risk factor assessment, South Africa 2000. Cape Town, South African Medical Research Council, 2006.
43. Tangcharoensathien V, Faramnuayphol P, Teokul W, Bundhamcharoen K, Wibulpholprasert S. A critical assessment of mortality statistics in Thailand: potential for improvements. Bulletin of the World Health Organization, 2006, 84:233–237.
137
Global Burden of Disease 2004
References
1
2
3
4
Annex A
Annex B
Annex C
References
44. Akgün S, Rao C, Yardim N, Basara B, Aydin O, Mollahaliloglu S et al. Esti-mating mortality and causes of death in Turkey: methods, results and pol-icy implications. The European Journal of Public Health, 2007, 17:593–599.
45. World health report 2005: child and maternal survival. Geneva, World Health Organization, 2005.
46. Bryce J, Boschi-Pinto C, Shibuya K, Black RE, WHO Child Health Epide-miology Reference Group. WHO estimates of the causes of death in chil-dren. Lancet, 2005, 365:1147–1152.
47. Morris SS, Black RE, Tomaskovic L. Predicting the distribution of under-five deaths by cause in countries without adequate vital registration sys-tems. International Journal of Epidemiology, 2003, 32:1041–1051.
48. Lawn JE, Cousens S, Zupan J. 4 million neonatal deaths: when? where? why? Lancet, 2005, 365:891–900.
49. Lawn JE, Wilczynska-Ketende K, Cousens SN. Estimating the causes of 4 million neonatal deaths in the year 2000. International Journal of Epidemi-ology, 2006, 35:706–718.
50. Global tuberculosis control: surveillance, planning and financing: WHO report 2006. Geneva, World Health Organization, 2006.
51. Boschi-Pinto C, Velebit L, Shibuya K. Estimating the child mortality due to diarrhoea in developing countries. Bulletin of the World Health Organiza-tion, 2008, (in press).
52. Crowcroft NS, Stein C, Duclos P, Birmingham M. How best to estimate the global burden of pertussis? Lancet Infectious Diseases, 2003, 3:413–418.
53. WHO/UNICEF estimates of national immunization coverage. Geneva, World Health Organization, 2007 (http://www.who.int/immunization_monitoring/routine/immunization_coverage/en/index.html, accessed 11 November 2007).
54. Wolfson LJ. WHO ICE-T: immunization coverage estimates and trajec-tories, version 4.0. Geneva, World Health Organization, Department of Immunization, Vaccines and Biologicals, 2007 (http://www.who.int/ immunization_financing/analyses/givs_costing_annex1.pdf, accessed 15 January 2008).
55. Polio case count. Geneva, World Health Organization, 2008 (http://www.who.int/vaccines/immunization_monitoring/en/diseases/poliomyelitis/case_count.cfm, accessed 16 January 2008).
56. Brenzel L, Wolfson LJ, Fox-Rushby JA, Miller M, Halsey N. Vaccine-preventable diseases. In: Jamison DT, Breman JG, Measham AR, Alleyne G, Evans D, Claeson M et al., eds. Disease control priorities in devel-oping countries, 2nd ed. New York, Oxford University Press, 2006:389–411.
138
World Health Organization
References
57. Wolfson LJ, Strebel PM, Gacic-Dobo M, Hoekstra EJ, McFarland JW, Hersh BS. Has the 2005 measles mortality reduction goal been achieved? A nat ural history modelling study. Lancet, 2007, 369:191–200.
58. Roper MH, Vandelaer JH, Gasse FL. Maternal and neonatal tetanus. Lancet, 2007, 370:1947–1959.
59. Wolfson LJ, Vandelaer JH, Gasse FL, Garnier S, Birmingham ME. A model-based approach to monitoring global progress in the elimination of neonatal tetanus. Paper presented to WHO Quantitative Immunization and Vaccines Related Research Advisory Committee, Geneva 27–28 September, 2007.
60. WHO Department of Immunization. Meningitis estimates. Paper presented to the expert review of estimates of morbidity and mortality associated with Haemophilus influenzae type b (Hib) and Streptococcus pneumoniae (SP), London, 24–25 October 2006.
61. WHO Department of Immunization. General analytic methods. Paper pre-sented to the expert review of estimates of morbidity and mortality associ-ated with Haemophilus influenzae type b (Hib) and Streptococcus pneumo-niae (SP), London, 24–25 October 2006.
62. Korenromp EL. Malaria incidence estimates at country level for the year 2004 – proposed estimates and draft report. Geneva, World Health Organization. Roll Back Malaria Monitoring and Evaluation Reference Group & MERG Task Force on Malaria Morbidity, 2005.
63. Roll Back Malaria, World Health Organization, UNICEF. World malaria report 2005. Geneva, World Health Organization, 2005.
64. Nahlen BL, Korenremp EL, Miller JM, Shibuya K. Malaria risk: estimating clinical episodes of malaria. Nature, 2005, 437:E3.
65. Malaria Epidemiology Reference Group. Minutes of the MERG Taskforce Meeting on malaria morbidity, 19–21 October 2004. Geneva, World Health Organization, 2004.
66. World Malaria Report, 2008. Geneva, World Health Organization, 2005.
67. Rowe AK, Rowe SY, Snow RW, Korenromp EL, Schellenberg JA, Stein C et al. The burden of malaria mortality among African children in the year 2000. International Journal of Epidemiology, 2006, 35:691–704.
68. Breman JG, Mills A, Snow RW, Mulligan J-A, Lengeler C, Mendis K et al. Conquering malaria. In: Jamison DT, Breman JG, Measham AR, Alleyne G, Evans D, Claeson M et al., eds. Disease control priorities in developing coun-tries, 2nd ed. New York, Oxford University Press, 2006:413–431.
69. Snow RW, Craig MH, Newton CRJC, Steketee RW. The public health burden of Plasmodium falciparum malaria in Africa: deriving the numbers. DCPP Working Paper No. 11. Washington, DC, Fogarty International Centre, National Institutes of Health, 2003.

139
Global Burden of Disease 2004
References
1
2
3
4
Annex A
Annex B
Annex C
References
70. Ross A, Maire N, Molineaux L, Smith T. An epidemiologic model of severe morbidity and mortality caused by Plasmodium falciparum. American Journal of Tropical Medicine and Hygiene, 2006, 75:63–73.
71. Odiit M, Coleman PG, Liu WC, McDermott JJ, Fevre EM, Welburn SC et al. Quantifying the level of under-detection of Trypanosoma brucei rhode-siense sleeping sickness cases. Tropical Medicine & International Health, 2005, 10:840–849.
72. African trypanosomiasis (sleeping sickness). Geneva, World Health Organization, 2006 (Fact Sheet No. 259) (http://www.who.int/mediacen-tre/factsheets/fs259/en/, accessed 15 January 2008).
73. Pan American Health Organization, WHO Program on Neglected Tropical Diseases. Estimación cuantitativa de la enfermedad de Chagas en les Améri-cas [In Spanish]. Washington, Pan American Health Organization, 2007 (OPS/HDM/CD/425-06).
74. Mott KE. Schistosomiasis. In: Murray CJL, Lopez AD, Mathers CD, eds. The global epidemiology of infectious diseases. Geneva, World Health Organization, 2004:349–391 (http://whqlibdoc.who.int/publications/2004/9241592303.pdf, accessed 17 January 2008).
75. Hotez PJ, Bundy DA, Beegle K, Brooker S, Drake L, de Silva NR et al. Helminth infections: soil-transmitted helminth infections and schisto-somiasis. In: Jamison DT , Breman JG, Measham AR, Alleyne G, Evans D, Claeson M et al., eds. Disease control priorities in developing countries, 2nd ed. New York, Oxford University Press, 2006:467–482.
76. van der Werf MJ, de Vlas SJ. Morbidity and infection with schistosomes or soil-transmitted helminths. Rotterdam, Erasmus University, 2001.
77. Mansour NS, Higashi GI, Schinski VD, Murrell KD. A longitudinal study of Schistosoma haematobium infection in Qena governorate, Upper Egypt. 1. Initial epidemiological findings. American Journal of Tropical Medicine and Hygiene, 1981, 30:795–805.
78. Machado PA. The Brazilian program for schistosomiasis control, 1975–1979. American Journal of Tropical Medicine and Hygiene, 1982, 31:76–86.
79. LeDuc JW, Esteves K, Gratz NG. Dengue and dengue haemorrhagic fever. In: Murray CJL, Lopez AD, Mathers CD, eds. The global epidemiology of infectious diseases. Geneva, World Health Organization, 2004:219–242.
80. World Health Organization. DengueNet: WHO’s internet-based system for the global surveillance of dengue fever and dengue haemorrhagic fever. Weekly Epidemiological Record, 2002, 77:297–304.
81. Shepard DS, Suaya JA, Halstead SB, Nathan MB, Gubler DJ, Mahoney RT et al. Cost-effectiveness of a pediatric dengue vaccine. Vaccine, 2004, 22:1275–1280.
140
World Health Organization
References
82. Global elimination of trachoma documents. Geneva, World Health Organiza-tion, 2004 (http://www.who.int/blindness/publications/get2020/en/index.html, accessed 18 January 2008).
83. Williams BG, Gouws E, Boschi-Pinto C, Bryce J, Dye C. Estimates of world-wide distribution of child deaths from acute respiratory infections. Lancet, 2002, 2:25–32.
84. WHO, UNICEF, UNFPA, World Bank. Maternal mortality in 2005: esti-mates developed by WHO, UNICEF, UNFPA and the World Bank. Geneva, World Health Organization, 2007.
85. Sedgh G, Henshaw SK, Singh S, Åhman E, Shah I. Induced abortion: esti-mated rates and trends worldwide. Lancet, 2007, 370:1338–1345.
86. Unsafe abortion: global and regional estimates of the incidence of unsafe abor-tion and associated mortality in 2003. Geneva, World Health Organization, 2007.
87. de Onis M, Blossner M. The World Health Organization Global Database on Child Growth and Malnutrition: methodology and applications. Inter-national Journal of Epidemiology, 2003, 32:518–526.
88. de Onis M, Blossner M, Borghi E, Morris R, Frongillo EA. Methodology for estimating regional and global trends of child malnutrition. International Journal of Epidemiology, 2004, 33:1260–1270.
89. WHO child growth standards: length/height-for-age, weight-for-age, weight-for-length, weight-for-height and body mass index-for-age: methods and development. Geneva, World Health Organization, 2006.
90. de Onis M, Garza C, Onyango AW, Martorell R. WHO child growth stand-ards. Acta paediatrica, 2006, 450(Suppl.):1–101.
91. McLean E , Egli I, Cogswell M, de Benoist B, Wojdyla D. Worldwide prev-alence of anemia in preschool aged children, pregnant women and non-pregnant women of reproductive age. In: Kramer K, Zimmermann MB, eds. Nutritional anaemia. Basel, Sight and Life Press, 2007:1–12.
92. WHO Nutrition Program. WHO global database on anaemia. Geneva, World Health Organization (http://www.who.int/vmnis/anaemia/en/, accessed 8 June 2008).
93. Ferlay J, Bray F, Pisani P, Parkin DM. Globocan 2000: cancer incidence, mor-tality and prevalence worldwide, version 1.0. Lyon, IARCPress, 2001.
94. Mathers CD, Shibuya K, Boschi-Pinto C, Lopez AD, Murray CJ. Global and regional estimates of cancer mortality and incidence by site: I. Application of regional cancer survival model to estimate cancer mortality distribution by site. BMC Cancer, 2002, 2:36.
95. Shibuya K, Mathers CD, Boschi-Pinto C, Lopez AD, Murray CJL. Global and regional estimates of cancer mortality and incidence by site: II. Results for the Global Burden of Disease Study 2000. BMC Cancer, 2002, 2:37.

141
Global Burden of Disease 2004
References
1
2
3
4
Annex A
Annex B
Annex C
References
96. Ferlay J, Bray F, Pisani P, Parkin DM. GLOBOCAN 2002: cancer incidence, mortality and prevalence worldwide. Lyon, IARCPress, 2004.
97. Cowie CC, Rust KF, Byrd-Holt DD, Eberhardt MS, Flegal KM, Engelgau MM et al. Prevalence of diabetes and impaired fasting glucose in adults in the U.S. population: national health and nutrition examination survey 1999–2002. Diabetes Care, 2006, 29:1263–1268.
98. Aguilar-Salinas CA, Velazquez-Monroy O, Gómez-Pérez FJ, Gonzalez Chávez A, Esqueda AL, Molina Cuevas V et al. Characteristics of patients with type 2 diabetes in Mexico: results from a large population-based nationwide survey. Diabetes Care, 2003, 26:2021–2026.
99. Sánchez-Castillo CP, Velásquez-Monroy O, Lara-Esqueda A, Berber A, Sepulveda J, Tapia-Conyer R et al. Diabetes and hypertension increases in a society with abdominal obesity: results of the Mexican National Health Survey 2000. Public Health Nutrition, 2005, 8:53–60.
100. Torquato MT, Montenegro Júnior RM, Viana LA, de Souza RA, Lanna CM, Lucas JC et al. Prevalence of diabetes mellitus and impaired glucose tol-erance in the urban population aged 30–69 years in Ribeirão Preto (São Paulo), Brazil. São Paulo Medical Journal, 2003, 121:224–230.
101. Chodick G, Heymann AD, Shalev V, Kookia E. The epidemiology of dia-betes in a large Israeli HMO. European Journal of Epidemiology, 2003, 18:1143–1146.
102. Panagiotakos DB, Pitsavos C, Chrysohoou C, Stefanadis C. The epidemiol-ogy of type 2 diabetes mellitus in Greek adults: the ATTICA study. Diabetic Medicine, 2005, 22:1581–1588.
103. Ubink-Veltmaat LJ, Bilo HJ, Groenier KH, Houweling ST, Rischen RO. Prevalence, incidence and mortality of type 2 diabetes mellitus revisited: a prospective population-based study in The Netherlands (ZODIAC-1). European Journal of Epidemiology, 2003, 18:793–800.
104. Szurkowska M, Szybinski Z, Nazim A, Zafraniec K, Edrychowski W. Preva-lence of type II diabetes mellitus in population of Krakow. Polskie Archi-wum Medycyny Wewnetrznej, 2001, 106:771–779.
105. Szybinski Z. Polish Multicenter Study on Diabetes Epidemiology (PMSDE). Polskie Archiwum Medycyny Wewnetrznej, 2001, 106:751–758.
106. Lopatynski J, Mardarowicz G, Nicer T, Szczesniak G, Krol H, Matej A et al. The prevalence of type II diabetes mellitus in rural urban population over 35 years of age in Lublin region (Eastern Poland). Polskie Archiwum Medy-cyny Wewnetrznej, 2001, 106:781–786.
107. Aekplakorn W, Stolk RP, Neal B, Suriyawongpaisal P, Chongsuvivatwong V, Cheepudomwit S et al. The prevalence and management of diabetes in Thai adults. Diabetes Care, 2003, 26:2758–2763.
142
World Health Organization
References
108. Gu D, Reynolds K, Duan X, Xin X, Chen J, Wu X et al. Prevalence of dia-betes and impaired fasting glucose in the Chinese adult population: Inter-national Collaborative Study of Cardiovascular Disease in Asia (InterASIA). Diabetologia, 2003, 46:1190–1198.
109. Hussain A, Rahim MA, Azad Khan AK, Ali SMK, Vaaler S. Type 2 diabetes in rural and urban population: diverse prevalence and associated risk fac-tors in Bangladesh. Diabetic Medicine, 2005, 22:931–936.
110. Sadikot SM, Nigam A, Das S, Bajaj S, Zargar AH, Prasannakumar KM et al. The burden of diabetes and impaired glucose tolerance in India using the WHO 1999 criteria: prevalence of diabetes in India Study (PODIS). Dia-betes Research and Clinical Practice, 2004, 66:301–307.
111. Wild S, Roglic G, Green A, Sicree R, King H. Global prevalence of diabetes: estimates for the year 2000 and projections for 2030. Diabetes Care, 2004, 27:1047–1053.
112. Strong KL, WHO Global Infobase Team. The SuRF Report. Surveillance of chronic disease risk factors: country level data and comparable estimates. Geneva, World Health Organization, 2005.
113. Asia Pacific Cohort Studies Collaboration. Body mass index and risk of dia-betes mellitus in the Asia-Pacific region. Asian Pacific Journal of Clinical Nutrition, 2006, 15:127–133.
114. Ustun TB, Ayuso-Mateos JL, Chatterji S, Mathers CD, Murray CJL. Global burden of depressive disorders in the year 2000. British Journal of Psychiatry, 2005, 184:386–392.
115. Ayuso-Mateos JL, Vazquez-Barquero JL, Dowrick C, Lehtinen V, Dalgard OS, Casey P et al. Depressive disorders in Europe: prevalence figures from the ODIN study. The British Journal of Psychiatry, 2001, 179:308–316.
116. Mathers CD, Ayuso-Mateos JL. Global burden of alcohol use disorders in the year 2000: summary of methods and data sources. Global burden of disease 2000 working paper. Geneva, World Health Organization, 2003.
117. Kehoe T, Rehm J, Chatterji S. Global burden of alcohol use disorders in the year 2004. Report prepared for WHO. Zurich, Switzerland, WHO Col-laborating Centre at the Research Centre for Public Health and Addiction, 2007.
118. Barendregt J, van Oortmarssen GJ, Vos T, Murray CJL. A generic model for the assessment of disease epidemiology: the computational basis of DisMod II. Population Health Metrics, 2003, 1:4.
119. Begg S, Vos T, Barker B, Stevenson C, Stanley L, Lopez A. The burden of dis-ease and injury in Australia 2003. Canberra, Australian Institute of Health and Welfare, 2007.
143
Global Burden of Disease 2004
References
1
2
3
4
Annex A
Annex B
Annex C
References
120. Ustun TB, Chatterji S, Villanueva M, Bendib L, Celik C, Sadana R et al. The WHO multicountry household survey study on health and respon-siveness 2000-2001. In: Murray CJL, Evans D, eds. Health systems perform-ance assessment: debates, methods and empiricism. Geneva, World Health Organization, 2003.
121. Degenhardt L, Hall W, Warner-Smith M, Lynskey M. Illicit drugs. In: Ezzati M, Lopez A, Rodgers A, Murray CJL, eds. Comparative quantification of health risks: global and regional burden of disease attributable to selected major risk factors. Geneva, World Health Organization, 2003.
122. Single E, Robson L, Xie X, Rehm J. The costs of substance abuse in Canada. Ottawa, Canadian Centre on Substance Abuse, 2002.
123. 2006 World drug report. Vienna, United Nations Office on Drugs and Crime, 2007.
124. Fewtrell LJ, Pruss-Ustun A, Landrigan P, Ayuso-Mateos JL. Estimating the global burden of disease of mild mental retardation and cardiovascular diseases from environmental lead exposure. Environmental Research, 2004, 94:120–133.
125. Pruss-Ustun A, Fewtrell LJ, Landrigan P, Ayuso-Mateos JL. Lead exposure. In: Ezzati M , Lopez A, Rodgers A, Murray CJL, eds. Comparative quanti-fication of health risks: global and regional burden of disease attributable to selected major risk factors. Geneva, World Health Organization, 2004:1495–1542.
126. Thylefors B, Negrel AD, Pararajasegaram R, Dadzie KY. Global data on blindness. Bulletin of the World Health Organization, 1995, 73:115–121.
127. Resnikoff S, Pascolini D, Etya’ale D, Kocur I, Pararajasegaram R, Pokharel GP et al. Global data on visual impairment in the year 2002. Bulletin of the World Health Organization, 2004, 82:844–851.
128. Resnikoff S, Pascolini D, Mariotti SP, Pokharel GP. Global magnitude of visual impairment caused by uncorrected refractive errors in 2004. Bulletin of the World Health Organization, 2008, 86:63–70.
129. Stouthard M , Essink-Bot M, Bonsel G, Barendregt J, Kramers P. Disability weights for diseases in the Netherlands. Rotterdam, Department of Public Health, Erasmus University, 1997.
130. Mathers CD , Truelsen T, Begg S, Satoh T. Global burden of ischaemic heart disease in the year 2000. Global burden of disease 2000 working paper. Geneva, World Health Organization, 2004 (http://www.who.int/health-info/statistics/bod_ischaemicheartdisease.pdf, accessed 6 June 2008).
131. Michaud CM, McKenna MT, Begg S, Tomijima N, Majmudar M, Bulzac-chelli M et al. The burden of disease and injury in the United States 1996. Population Health Metrics, 2006, 4:11.
144
World Health Organization
References
132. Lim S, unpublished data, 2007.
133. Bronnum-Hansen H, Jorgensen T, Davidsen M, Madsen M, Osler M, Gerdes LU et al. Survival and cause of death after myocardial infarction: the Danish MONICA study. Journal of Clinical Epidemiology, 2001, 54:1244–1250.
134. Truelsen T, Begg S, Mathers CD, Satoh T. Global burden of cerebrovascu-lar disease in the year 2000. Global burden of disease 2000 working paper. Geneva, World Health Organization, 2000 (http://www.who.int/healthinfo/statistics/bod_cerebrovasculardisease.pdf, accessed 6 June 2008).
135. Aekplakorn W, Abbott-Klafter J, Premgamone A, Dhanamun B, Chaikitti-porn C, Chongsuvivatwong V et al. Prevalence and management of diabetes and associated risk factors by regions of Thailand: third National Health Examination Survey 2004. Diabetes Care, 2007, 30:2007–2012.
136. Ustun TB, Chatterji S, Mechbal A, Murray CJL, WHS Collaborating Groups. The world health surveys. In: Murray CJL, Evans D, eds. Health systems performance assessment: debates, methods and empiricism. Geneva, World Health Organization, 2003.
137. Petersen PE, Bourgeois D, Ogawa H, Estupinan-Day S, Ndiaye C. The global burden of oral diseases and risks to oral health. Bulletin of the World Health Organization, 2005, 83:661–669.
138. Heidelberg Institute on International Conflict Research. Conflict barometer 2003: 12th annual conflict analysis. Heidelberg, Department of Political Sci-ence, University of Heidelberg, 2004.
139. Heidelberg Institute on International Conflict Research. Conflict barometer 2004: 13th annual conflict analysis. Heidelberg, Department of Political Sci-ence, University of Heidelberg, 2005.
140. Project Ploughshares. Armed conflicts report 2005. Waterloo, Canada, Project Ploughshares, 2005 (http://www.ploughshares.ca/, accessed 26 November 2007).
141. Project Ploughshares. Armed conflicts report 2006. Waterloo, Canada, Project Ploughshares, 2006 (http://www.ploughshares.ca/, accessed 26 November 2007).
142. Marshall MG, Gurr TR. Peace and conflict 2005: a global survey of armed conflicts, self-determination movements, and democracy. University of Mary-land, Center for International Development and Conflict Management, 2005.
143. Murray CJ, King G, Lopez AD, Tomijima N, Krug EG. Armed conflict as a public health problem. BMJ, 2002, 324:346–349.
144. Coghlan B, Brennan RJ, Ngoy P, Nofara D, Otto B, Clements M et al. Mortal-ity in the Democratic Republic of Congo: a nationwide survey. Lancet, 2006, 367:44–51.
145. Iraq Family Health Survey Study Group. Violence-related mortality in Iraq from 2002 to 2006. New England Journal of Medicine, 2008, 358:484–493.
145
Global Burden of Disease 2004
References
1
2
3
4
Annex A
Annex B
Annex C
References
146. Hagan J, Palloni A. Death in Darfur. Science, 2006, 313:1578–1579.
147. Guha-Sapir D, Degomme O. Darfur: counting the deaths. Mortality esti-mates from multiple survey data. Brussels, Université Catholique de Louvain, Centre for Research on the Epidemiology of Disasters, 2005 (http://www1.cedat.be/Documents/Analysis_Paper/DarfurCountingThe Deaths-withClarifications.pdf, accessed 19 September 2008).
148. Guha-Sapir D, Degomme O. Darfur: Counting the deaths (2). What are the trends? Brussels, Université Catholique de Louvain, Centre for Research on the Epidemiology of Disasters, 2005 (http://www1.cedat.be/Documents/Analysis_Paper/DarfurCountingTheDeaths2.pdf, accessed 19 September 2008).
149. World Health Organization, European Programme for Intervention Epi-demiology Training. Retrospective mortality survey among the internally displaced population, Greater Darfur, Sudan, August 2004. Geneva, World Health Organization, 2004 (http://www.who.int/disasters/repo/14652.pdf, accessed 18 January 2008).
150. International Campaign to Ban Landmines. Landmine monitor report 2005: toward a mine-free world. New York, Human Rights Watch, 2005.
151. International Campaign to Ban Landmines. Landmine monitor report 2006: toward a mine-free world. 2006. New York, Human Rights Watch, 2006.
152. EM-DAT: the OFDA/CRED international disaster database [online database]. Belgium, Centre for Research on the Epidemiology of Disasters, 2006.
153. He H, Oguchi T, Zhou R, Zhang J, Qiao S. Damage and seismic intensity of the 1996 Lijiang earthquake, Vhina: a GIS analysis. Technical report. Tokyo, Center for Spatial Information Science, University of Tokyo, 2001 (http://www.csis.u-tokyo.ac.jp/english/dp/dp.html, accessed 18 January 2008)
154. Naghii MR. Public health impact and medical consequences of earth-quakes. Pan American Journal of Public Health, 2005, 18:216–221.
155. Nishikiori N, Abe T, Costa DG, Dharmaratne SD, Kunii O, Moji K. Who died as a result of the tsunami? Risk factors of mortality among internally displaced persons in Sri Lanka: a retrospective cohort analysis. BMC Public Health, 2006, 6:73.
156. Doocy S, Rofi A, Moodie C, Spring E, Bradley S, Burnham G et al. Tsunami mortality in Aceh Province, Indonesia. Bulletin of the World Health Organi-zation, 2007, 85:273–278.
157. 2005 International Comparison Programme preliminary results. Washing-ton, DC, World Bank, 2007.
158. Mathers CD, Salomon JA, Ezzati M, Begg S, Lopez AD. Sensitivity and uncertainty analyses for burden of disease and risk factor estimates. In: Lopez AD, Mathers CD, Ezzati M, Murray CJL, Jamison DT, eds. Global burden of disease and risk factors. New York, Oxford University Press, 2006:399–426.
146
World Health Organization
References
159. World development report 2004: equity and development. Washington, DC, World Bank, 2006.
160. Zanou MB. Deaths assessed by medical personnel in city hospitals 1973-1992 (159). Dataset provided by Ecole Nationale de Statistique et d’Economie Appliquée, Abidjan, Cote d’Ivoire, 2000.
161. Khoury SA, Massad D, Fardous T. Mortality and causes of death in Jordan 1995–96: assessment by verbal autopsy. Bulletin of the World Health Organi-zation, 1999, 77:641–650.
162. Third national health family planning and social welfare plan 1992–1995. Ministry of Health Family Planning and Social Welfare, Kiribati, 1991.
163. Demographic and Health Survey, 1999. Department of Statistics, Samoa, undated.
164. Demographic and Vital Statistics Survey, 2000. Department of Statistics, Samoa, undated.
165. Deaths assessed by verbal autopsy, Niakhar, Senegal 1983–1990. Dataset pro-vided by Centre Population et Développement, Paris.
166. Report of the Minister of Health, 1994, Government of Tonga.


The Global Burden of Disease: 2004 Update provides a comprehensive assessment of the health of the world‘s population in 2004. Consistent and comparative description of the burden of diseases and injuries is an important input to health decision-making and planning processes. The Global Burden of Disease provides a framework for integrating the available information on mortality and health in populations to assess the comparative importance of diseases and injuries in causing premature death, loss of health and disability in all regions of the world.
This report draws on the extensive databases of the World Health Organization and information provided by Member States to provide detailed estimates of premature mortality, disability and loss of health for 135 causes by age and sex for the world, for regions of the world, and for countries grouped by average income per capita. It builds on previous assessments for the years 2000-2002 published in The World Health Report 2001 to 2004 and World Health Statistics 2006 to 2008.
This report is part of ongoing efforts by WHO to monitor and analyse the global health situation and trends and to foster increased comparability of data between countries. The report builds upon the work of technical programmes within WHO at country, regional and global levels, and collaboration with partners, including UN agencies, the private sector and academic institutions.
www.who.int/evidence/bod
ISBN 978 92 4 156371 0
Related Documents


