THE GENERATION AND EXPERIMENTAL STUDY OF MICROSCALE DROPLETS IN DROP-ON-DEMAND INKJET PRINTING LI ERQIANG (B.Eng., Xi’an Jiaotong University) A THESIS SUBMITTED FOR THE DEGREE OF DOCTOR OF PHILOSOPHY DEPARTMENT OF MECHANICAL ENGINEERING NATIONAL UNIVERSITY OF SINGAPORE 2010

Welcome message from author
This document is posted to help you gain knowledge. Please leave a comment to let me know what you think about it! Share it to your friends and learn new things together.
Transcript

THE GENERATION AND EXPERIMENTAL STUDY
OF MICROSCALE DROPLETS IN
DROP-ON-DEMAND INKJET PRINTING
LI ERQIANG
(B.Eng., Xi’an Jiaotong University)
A THESIS SUBMITTED
FOR THE DEGREE OF DOCTOR OF PHILOSOPHY
DEPARTMENT OF MECHANICAL ENGINEERING
NATIONAL UNIVERSITY OF SINGAPORE
2010

Acknowledgements
i
Acknowledgements
First I would like to express my deepest appreciation to my advisor Professor
Jerry Fuh Ying Hsi for his guidance and supervision throughout this project.
This thesis would never been written without his continuous support and
encouragement. He is very helpful, generous and is very considerate of and
patient with his students. Becoming his student is my great honor.
I most sincerely thank my co-advisor Professor Wong Yoke San, for his
constructive guidance and valuable time on my research. He is very kind,
helpful, considerate, enthusiastic and productive. Furthermore, his hands-on
approaches for research will have a lasting impact on my career in the future.
I would like to express my deepest appreciation to my co-advisor Professor
Sigurdur Tryggvi Thoroddsen, for his continuous support, endless encourage,
constructive guidance and supervision throughout this project. I have learned
from him not only knowledge but also rigorous attitude towards scientific
research.
I am very grateful to Associate Professor Loh Han Tong for his concern and
suggestions in project related issues.
My sincere thanks go to Dr. Zhou Jinxin for his support and enthusiastic
encouragement. During nearly the whole process of my research, he gave me a
lot of advice and help. My sincere gratitude should also go to Dr. Sun Jie, Dr.
Wang Furong, Dr. Feng Wei, Miss. Xu Qian, Miss. Wu Yaqun, Mr. Thian
Chen Hai Stanley, Mr. Zhang Fenghua, Mr. Wang Shouhua, Mr. Ng Jinh Hao
and Mr. Yang Lei for their assistance and knowledge in carrying out the
project.
I had the privilege of working with exceptional students from the department,
including Chang Lei, Li Jinlan, Tan Wei Qiang Emil, Wu Yong Hao Benjamin,
Tan Eng Khoon, Ng Lai Xing, Shareen Chan and Lim Wei Ren Farand. They
have all worked together with me and given me great help in the development
of my research project. They are also my friends and made my graduate study
in Singapore colorful and memorable.
My sincere gratitude should also go to the members of the Fluid Mechanics
Lab, Advanced Manufacturing Lab (AML), Workshop 2 (WS2), Impact
Mechanics Lab, Tissue Engineering Lab, Cellular and Molecular
Bioengineering Lab, and the various Laboratories and Workshops of IMRE
and NUS and their technical staff for their support and technical expertise in
overcoming the many difficulties encountered during the course of the project.
Lastly, but most important, I would like to thank my grandparent, my parents,
my brother, and my girl friend Li Xinxiu (all I can say is that I have the best
girl I could ever hope to have), for their unconditional love and support. They
always believe in me and have done all they can to support my choices.

Table of Contents
ii
Table of Contents
Acknowledgements .............................................................................................. i
Table of Contents ................................................................................................ ii
Summary ............................................................................................................ vi
List of Tables ...................................................................................................... x
List of Figures .................................................................................................... xi
List of Symbols ................................................................................................. xx
1. INTRODUCTION..................................................................................... 1
1.1 Background .............................................................................................. 1
1.2 Challenges ................................................................................................ 5
1.3 Objectives ................................................................................................. 7
1.4 Organization ............................................................................................. 8
2. LITERATURE REVIEW ...................................................................... 10
2.1 Introduction to Inkjet Printing ................................................................ 10
2.1.1 Classification of Inkjet Printing Techniques ................................... 10
2.1.1.1 Continuous Inkjet Printing ........................................................ 11
2.1.1.2 Drop-on-Demand Inkjet Printing .............................................. 14
2.1.2 Advantages and Disadvantages of Inkjet Printing ........................... 21
2.1.3 Printing System Evaluation ............................................................. 23
2.1.3.1 Print Resolution ........................................................................ 23
2.1.3.2 Jetting Frequency ...................................................................... 24
2.1.3.3 Drop Positioning Error .............................................................. 25
2.1.3.4 Nozzle Hydrophobicity Treatment ........................................... 26
2.1.3.5 Inkjet-Printed Droplet Feature after Drying ............................. 27

Table of Contents
iii
2.1.3.6 Inkjet-Printed Line Morphology ............................................... 30
2.2 Squeeze Mode Piezo-Driven Printhead ................................................. 32
2.2.1 Theory of Droplet Formation ........................................................... 32
2.2.1.1 Principle of Squeeze Mode Piezo-Driven Printhead ................ 32
2.2.1.2 Droplet Generation Conditions ................................................. 35
2.2.1.3 Droplet Velocity and Droplet Size ............................................ 39
2.2.1.4 Satellite Droplet ........................................................................ 41
2.2.2 Printhead Fabrication ....................................................................... 45
2.2.2.1 The Overall Printhead Structure ............................................... 45
2.2.2.2 Ejection Nozzle Requirements .................................................. 46
2.2.2.3 Ejection Nozzle Fabrication Methods ....................................... 47
2.3 Creation of Ultra-Small Droplets ........................................................... 52
2.3.1 Needs for Generation of Ultra-Small Droplets ................................ 52
2.3.2 Methods for Printing Ultra-Small Droplets ..................................... 55
2.3.2.1 Reducing Nozzle Size ............................................................... 55
2.3.2.2 Controlling of Waveform .......................................................... 55
2.3.2.3 Electrohydrodynamic Jetting .................................................... 58
2.4 Organ Printing - Science Rather Than Fiction ....................................... 62
2.4.1 How to Realize ................................................................................. 63
2.4.2 Challenges and Requirements .......................................................... 69
3. NOVEL PRINTHEAD DESIGN ........................................................... 72
3.1 Introduction ............................................................................................ 72
3.2 Printhead Fabrication ............................................................................. 74
3.2.1 Printhead Chamber .......................................................................... 75
3.2.2 Interchangeable Nozzle Design ....................................................... 78

Table of Contents
iv
3.3 Experimental Testing of the New Printhead .......................................... 83
3.3.1 Experimental Setup .......................................................................... 83
3.3.2 Experimental Conditions ................................................................. 86
3.3.3 Testing Liquids ................................................................................ 87
3.4 Experimental Results ............................................................................. 89
3.4.1 Comparison of PET/PTFE-Based and Glass-Based Printhead ........ 89
3.4.2 Effect of Pulse Width ....................................................................... 91
3.4.3 Effects of Voltage Pulse Amplitude ................................................ 94
3.4.4 Nozzle Size ...................................................................................... 96
3.4.5 Repeatability .................................................................................... 97
3.4.6 Maximum Jetting Frequency ........................................................... 98
3.4.7 Jetting of Non-Newtonian Liquid .................................................. 101
3.5 Conclusions .......................................................................................... 104
4. FORMING A FINE JET IN INKJET PRINTING ............................ 106
4.1 Introduction .......................................................................................... 106
4.2 Experimental Setup .............................................................................. 108
4.3 Experimental Results ........................................................................... 108
4.3.1 Jet I ................................................................................................. 108
4.3.2 Type II Jetting from Entrained Bubble .......................................... 111
4.3.3 More on Surfaces Collapse Jets ..................................................... 124
4.3.4 Viscosity Effects on Jet Velocity ................................................... 126
4.3.5 Relationship between Jet Velocity and Jet Diameter ..................... 128
4.4 Conclusions .......................................................................................... 130
5. CELL PRINTING ................................................................................. 132
5.1 Introduction .......................................................................................... 132

Table of Contents
v
5.2 Material Preparation and Experimental Procedure .............................. 135
5.2.1 Preparation of Cells, Alginate and Collagen ................................. 135
5.2.2 Printing Experimental Setup .......................................................... 136
5.2.3 Survivability Tests ......................................................................... 139
5.3 Results and Discussion ......................................................................... 140
5.3.1 Cell Survivability Study ................................................................. 140
5.3.1.1 Cell Printing ............................................................................ 140
5.3.1.2 Cell Survivability: Effects of the Mean Shear Rate ................ 142
5.3.2 The Number of Cells in Each Droplet ........................................... 146
5.3.3 The Location of Cells inside Each Droplet .................................... 151
5.3.4 Printing Patterns ............................................................................. 153
5.5 Conclusions .......................................................................................... 156
6. RECOMMENDATIONS FOR FUTURE WORK ............................. 158
6.1 Printhead Design .................................................................................. 158
6.2 Reducing Droplet Size ......................................................................... 159
6.3 Cell Printing ......................................................................................... 159
Bibliography ................................................................................................... 161
Publications ..................................................................................................... 176

Summary
vi
Summary
For environmental conservation and the realization of a sustainable society, it
is necessary that industrial manufacturing processes undergo a transformation
with reduction of environmental impact. From this viewpoint, additive
manufacturing technologies have attracted considerable attention because they
have the potential to greatly reduce ecological footprints as well as the energy
consumed in manufacturing. Inkjet printing is one of the most successful
additive manufacturing technologies. It develops at a rapid pace and has been
expanded from conventional graphic printing to various new applications,
such as organ printing, displays, integrated circuits (ICs), optical devices,
MEMS and drug delivery. Accordingly, the dispensed liquids have been
expanded from the conventional pigmented ink (or standard dye-based ink) to
polymers, gels, cell ink or other materials which often have higher viscosities
or even contain large particles or cells. Consequently, the traditional inkjet
printer designed for graphic printing is unable to fulfill the new challenges,
one of which is to dispense fluids of very high viscosities. For most of the
commercial inkjet printheads, only liquids with viscosities lower than 20 cps
can be consistently dispensed. Fluids with even higher viscosities have to be
diluted before printing or warmed up during the printing, which will adversely
affect the properties of the liquids. Another challenge is raised by nozzle
clogging. Fluids containing particles, or cells, can easily block the nozzle
orifice, resulting in time-consuming nozzle cleaning or even damage of the
entire conventional printhead. To solve the problem, the easiest way is to use a
nozzle with a bigger orifice, as bigger orifices are less likely to clog. However,

Summary
vii
this is often not desirable in inkjet printing as bigger nozzles result in bigger
droplets and lower printing resolution. The poor printability and nozzle
clogging may result in unreliable or failed dispensing when using the
traditional inkjet printhead design for complex liquids.
In this research, a PET/PTFE-based piezoelectric DOD inkjet printhead with
an interchangeable nozzle design was proposed and fabricated by the authors.
The printhead chamber is made of PET or Teflon tube, which is much softer
than the commonly used glass tube. The ejecting capacity of this novel
printhead was compared with commercial printheads, and found to have
superior performance and versatility. Our printhead succeeded in dispensing
aqueous glycerin solutions with viscosity as high as 100 cps, while the
corresponding commercial printheads could only dispense liquids with
viscosities lower than 20 cps. PTFE-based printhead provides excellent anti-
corrosive property when strongly corrosive inks are involved. The
interchangeable nozzle design largely alleviates the difficulty in cleaning of
clogged nozzles and greatly reduces the occurrence of printhead damage. The
effects of operating parameters, including voltage pulse amplitude, pulse
width and jetting frequency, on droplet size and droplet velocity were
characterized. The new printhead shows excellent repeatability.
The formation of fine jets during the piezoelectric drop-on-demand inkjet
printing was investigated using ultra-high-speed video imaging. The speed of
the jet could exceed 90 m/s, which was much higher than the general droplet
velocity during inkjet printing. The diameters of the thinnest jets were of the

Summary
viii
order of a few microns. The generation of such fine jets was studied over a
wide range of viscosities, using 7 different concentrations of water-glycerin
solutions. This jetting was associated with the collapse of an airpocket which
was sucked into the nozzle during the printing. This occurred for longer
expansion times for the piezo-element. Two types of jet were identified during
the printing. The relationships between the speed of the fine-jet and other
parameters like the diameter of the jet and the physical properties of the liquid,
were also characterized. The study provides a possible way to improve inkjet
printing resolution without reducing nozzle diameter.
The in-house-developed printhead was also used for cell printing. The study
has demonstrated that piezoelectric DOD inkjet printing is able to successfully
deliver L929 rat fibroblast cells through nozzles as small as 36 µm. There was
no significant cell death when dispensing the cells through the 81 µm and the
119 µm nozzle, with the mean survival rates only reducing from 98% to 85%.
This is in good agreement with the existing study, in which a commercial
printer was used to print human fibroblast cells. When the orifice was reduced
to 36 µm, the corresponding cell survival rates fell from 95% to 76% when the
excitation pulse amplitude increased from 60 V to 130 V. These results
indicate that the droplet ejection out of the nozzle has exerted large shear
stresses on the cells and possibly disrupted the cell membrane and killed about
20% of the cells. Mean shear rate was estimated by combining the effects of
droplet velocity and orifice diameter and was correlated with the cell survival
rate. A large range of mean shear rates from 1.3×10⁴ s
-1 to 9.2×10
5 s
-1 were
generated and cell survival rates were found to be strongly affected by the

Summary
ix
higher mean shear rates, especially when the shear rate exceeds 5×10⁵ s
-1. The
distribution of the number of cells within each droplet was also investigated.
This was done to find out the minimal cell concentration in the medium, which
is required to avoid the appearance of empty droplets, since droplets
containing no cells may be detrimental to pattern printing. The distribution of
cell numbers is found to have a binomial form, which consistent with a
uniform distribution of cells inside the medium in the reservoir.
For pattern printing, L929 fibroblast cells were delivered by using a 60 µm
nozzle. Printed cells successfully kept their patterns in the crosslinked gel
made from 1.0% (w/v) alginate and 0.5% (w/v) calcium chloride. However, it
was found that the cells failed to adhere to alginate. On the other hand, cells
dispensed onto collagen gel were found to successfully maintain their viability,
adhere to the gel, spread and proliferate, forming a denser pattern. However,
unlike the crosslinked calcium-alginate which can immobilize cells quite
rapidly, cell adhesion to collagen needs a relatively long time to get
established. Therefore, some of the printed cells were slightly moved from
their initial position when the sample was disturbed, by the addition of fresh
medium or unintended shaking of the sample, which will reduce the resolution
of the printing. The smallest nozzle, with orifice diameter of 36 µm, was not
used for pattern printing, due to issues concerning the reliability of the printing
process, as it can easily get clogged.

List of Tables
x
List of Tables
Table 2-1: The minimum actuation pressure for droplet generation in DOD
inkjet devices [58]. ............................................................................................ 37

List of Figures
xi
List of Figures
Fig. 1.1: A typical flow diagram of photolithograph-based and inkjet printing
based process. ..................................................................................................... 3
Fig. 2.1: Layout of the different inkjet printing technologies. .......................... 11
Fig. 2.2: A Binary-Deflection continuous inkjet system. ................................. 13
Fig. 2.3: A Multilevel-Deflection continuous inkjet system............................. 13
Fig. 2.4: Droplets generated from a continuous inkjet system with multi-
nozzles............................................................................................................... 14
Fig. 2.5: Schematic of the DOD inkjet printing process. .................................. 15
Fig. 2.6: Droplet formation process within the ink chamber of a thermal inkjet
device. ............................................................................................................... 16
Fig. 2.7: Roof-shooter Thermal inkjet. ............................................................. 16
Fig. 2.8: Side-shooter Thermal inkjet. .............................................................. 17
Fig. 2.9: Schematic of the squeeze-mode inkjet. .............................................. 17
Fig. 2.10: Schematic of the bend-mode inkjet. ................................................. 18
Fig. 2.11: Schematic of the push-mode inkjet. ................................................. 19
Fig. 2.12: Schematic of the shear-mode inkjet. ................................................ 19
Fig. 2.13: Jet straightness error in both X and Y directions for Spectra SX-128
printhead [42]. ................................................................................................... 26
Fig. 2.14: Two nozzles to show the effects of hydrophobic treatment. (a).
Nozzle without hydrophobic treatment. (b). Nozzle with hydrophobic
treatment. .......................................................................................................... 27
Fig. 2.15: Image showing profiles of dried droplets printed on hydrophobic
and hydrophilic surfaces [44]............................................................................ 28
Fig. 2.16: Distinct dried droplet patterns under different temperature [45]. ..... 29
Fig. 2.17: Examples of five typical inkjet-printed line morphologies. (a).
Individual droplets. (b). Scalloped line. (c). Uniform line. (d). Bulging line. (e).
Stacked coins. Droplet spacing decreases from left to right [46]. .................... 31

List of Figures
xii
Fig. 2.18: Schematic representation of wave propagation and reflection in a
squeeze-mode piezoelectric inkjet printhead. ................................................... 32
Fig. 2.19: Schematic representation the basic energy requirement for ejecting a
droplet. .............................................................................................................. 37
Fig. 2.20: Effects of pulse amplitude on droplet velocity and droplet volume
[60]. ................................................................................................................... 39
Fig. 2.21: Effects of pulse width on droplet velocity and droplet volume [60].40
Fig. 2.22: Effects of jetting frequency on droplet velocity and droplet volume
[62]. ................................................................................................................... 41
Fig. 2.23: Sequence of images of DOD droplet formation for water [63]. ....... 43
Fig. 2.24: Different kinds of commercial printheads. ....................................... 45
Fig. 2.25: Schematic of the construction of a piezoelectric squeeze mode DOD
printhead. .......................................................................................................... 46
Fig. 2.26: Ejection nozzle orifice cross section requirements. ......................... 47
Fig. 2.27: KOH etching for a (100) silicon wafer. (a). Slice orientations for
silicon material. (b). Slice orientations shown in a plan view of a (100) silicon
wafer. Etching process proceeds downward until (111) planes are reached. (c).
“A-A” cross-section view. ................................................................................ 49
Fig. 2.28: Nozzle fabricated by silicon micromachining method comprising
KOH etching and Deep Reactive Ion Etching. (a). Plan view of the etched
wafer. (b). “A-A” cross-section view of the etched wafer. ............................... 50
Fig. 2.29: Schematic of photolithographically predefined inkjet printing. (a).
Schematic diagram of high-resolution inkjet printing onto a prepatterned
substrate. (b). AFM showing accurate alignment of inkjet-printed PEDOT/PSS
source and drain electrodes separated by a repelling polyimide (PI) line with L
= 5 µm. [20] ...................................................................................................... 53
Fig. 2.30: Schematic of pulse waveforms used for driving the inkjet printhead.
(a). A uni-polar waveform. (b). A bi-polar waveform. (c). The new waveform
for small droplet generation. [21] ..................................................................... 56
Fig. 2.31: (a) – (c) Images showing appearance and disappearance of a tongue
and formation of droplet with a diameter similar to that of the nozzle. (d) – (f)
Images showing formation of a droplet with a diameter much small than that
of the nozzle orifice. [21] .................................................................................. 56
Fig. 2.32: Schematic of an electrohydrodynamic jet system. [86] .................... 58

List of Figures
xiii
Fig. 2.33: Time-lapse images of the pulsating Taylor cone with the four stages
of the complete jetting cycle. Each frame is an average of 100 exposures with
the same delay. [89] .......................................................................................... 60
Fig. 2.34: High-resolution e-jet printing with printed feature size smaller than
1 µm. [86] ......................................................................................................... 61
Fig. 2.35: Printed cells. (a). 3-D tube structure made from printed cells. The
image shows an inner layer of human umbilical endothelial cells (green) and
an outer layer of human aortic smooth muscle cells (red). (b). Printed yeast
patterns after 3 days of culture. [2] ................................................................... 63
Fig. 2.36: 3D scaffold and the cells seeded into it. (a). A 3D scaffold
fabricated by rapid prototyping method. (b). Big view of the scaffold shown in
(a). (c). Human fibroblast cells seeded into a 3D scaffold, after 18 days of
culture. [121] ..................................................................................................... 66
Fig. 2.37: Fabrication of a scaffold by 3D plotting. (a). One layer. (b). Two
layers. [122] ...................................................................................................... 66
Fig. 2.38: Schematic diagram of organ printing. [138] ..................................... 68
Fig. 3.1: The novel printhead. (a) Schematic showing of the design (out of
proportion). (b) A self-fabricated printhead following the novel design. ........ 76
Fig. 3.2: Schematic showing the fabrication of the printhead chamber: (a) PET
tube before shrink. (b) Teflon tube before etching. (c) The steel tube used as a
mould during heating of PET. (d) PET tube after shrink. (e) Teflon tube after
etching. (f) Piezoelectric tube. (g) Shrunken PET tube bonded to the
piezoelectric tube. ............................................................................................. 77
Fig. 3.3: Schematic showing the design of the printhead housing and the
nozzle adaptor. .................................................................................................. 78
Fig. 3.4: Fabrication of a glass nozzle by heating and pulling glass tubing. (a)
Drawing of the glass tubing heating system (out of proportion). (b) Glass
tubing containing a hollow cone with a closed end. (c) A 50 µm orifice
fabricated by polishing the end of the tubing showing in (b). .......................... 79
Fig. 3.5: Fabricating glass nozzle by heating and pulling 1.0 mm glass
capillary with a micropipette puller. (a). The P-97 Flaming/Brown type
micropipette puller. (b). Heating the capillary. (c). Hit the sharp tip to from an
orifice. ............................................................................................................... 80
Fig. 3.6: Different shapes of tips fabricated by the micropipette puller. (a). A
too “sharp” tip. (b). A tip with a moderate converging shape. ......................... 81
Fig. 3.7: A 13-micron-tip fabricated by the micropipette puller. ...................... 82
Fig. 3.8: Inkjet printhead nozzles fabricated from glass tube. .......................... 82

List of Figures
xiv
Fig. 3.9: Schematic showing of the drop-on-demand inkjet printing system
used in the experiment. ..................................................................................... 85
Fig. 3.10: Image sequences showing the formation of a 50 µm droplet from a
36 µm inkjet nozzle. The times shown are 0, 144, 322, 367, 389, 400, 522 and
1122 µs relative to the first frame. The droplet velocity is here determined to
be 0.69 m/s. ....................................................................................................... 85
Fig. 3.11: Schematic showing of the uni-polar pulse waveform. ..................... 86
Fig. 3.12: Measured viscosities for different concentrations of sodium alginate
solutions. Measurement at 20 ˚C. ..................................................................... 87
Fig. 3.13: Threshold voltages for PET-based printhead (–○–), PTFE-based
printhead (–*–) and glass-based printhead (–■–). Nozzle diameter is 119 µm.89
Fig. 3.14: Effects of pulse width on droplet velocity and droplet size. The
pulse amplitude is 50 V. Nozzle diameter is 119 µm. ...................................... 91
Fig. 3.15: Effects of pulse amplitude on droplet velocity and droplet size. The
pulse width is 100 µs. Nozzle diameter is 119 µm. ......................................... 94
Fig. 3.16: Effects of nozzle size on droplet diameter. (–*–) denotes the
diameters of the smallest single droplets can be generated; (–■–) denotes the
diameters of the biggest single droplets can be generated; (–▲–) denotes the
diameters of the biggest droplets which can be generated using the maximum
voltage. .............................................................................................................. 97
Fig. 3.17: Repeatability test of the PET-based printhead. Nozzle diameter is
119 µm. ............................................................................................................. 98
Fig. 3.18: Effects of jetting frequency on droplet velocity and droplet size. The
pulse width is 100 µs. The pulse amplitude is 30 V. Nozzle diameter is 119
µm. .................................................................................................................... 99
Fig. 3.19: Threshold voltages for sodium alginate solutions of concentrations
from 0.2% to 2.8% (w/v). ............................................................................... 102
Fig. 3.20: Schematic showing of drop formation for 2.2% SA solutions. ...... 103
Fig. 4.1: Jet formation observed just after impact of the tube with a solid wall
when the free surface is initially deformed with a meniscus [168]. ............... 107
Fig. 4.2: A 93 µm jet with a velocity of 7 m/s. The diameter of the orifice
is 150 µm. Liquid used is 70% aqueous glycerin (w/w) solution.
Printing parameters: bi-polar piezo-driving signal with tdwell and techo equal to
700 µs; driving pulse amplitude equals to 140 V. Negative pressure inside the
reservoir is -2.2 kPa relative to the atmospheric pressure. Images were taken at
a frame rate of 8 kfps. Ambient temperature is 25 ˚C. ................................... 109

List of Figures
xv
Fig. 4.3: The 150 µm nozzle used for fine jetting experiments. The scale bar is
2 mm. This image was taken when the nozzle was placed inside a 60%
aqueous glycerin (w/w) solution, which had an index of refraction similar to
that of the glass. .............................................................................................. 110
Fig. 4.4: An 8 µm jet with a velocity of 29 m/s. is 150 µm. The liquid
used is 70% aqueous glycerin (w/w) solution. Printing parameters: bi-polar
piezo-driving signal with tdwell and techo equal to 700 µs; driving pulse
amplitude equals to 140 V. The negative pressure inside the reservoir is -2.3
kPa relative to the atmospheric pressure. Images were taken at a frame rate of
165 kfps. Ambient temperature is 25 ˚C. The scale bar is 500 µm. ............... 110
Fig. 4.5: A 16 µm jet with a velocity of 35 m/s. is 150 µm. The liquid
used is 70% aqueous glycerin (w/w) solution. Printing parameters: bi-polar
piezo-driving signal with tdwell and techo equal to 700 µs; driving pulse
amplitude equals to 140 V. Negative pressure inside the reservoir is -2.3 kPa
relative to the atmospheric pressure. Images were taken at a frame rate of 16
kfps. Ambient temperature is 25 ˚C. ............................................................... 111
Fig. 4.6: A 10 µm jet with a velocity of 24 m/s. is 150 µm. The liquid
used is 10% aqueous glycerin (w/w) solution. Printing parameters: bi-polar
piezo-driving signal with 450 µs tdwell and 70 µs techo; driving pulse amplitude
equals to 140 V. The negative pressure inside the reservoir is -2.3 kPa relative
to the atmospheric pressure. Images were taken at a frame rate of 27 kfps.
Ambient temperature is 25 ˚C. The scale bar is 500 µm. ............................... 112
Fig. 4.7: A 9 µm jet with a velocity of 26 m/s. is 150 µm. The liquid
used is water. Printing parameters: bi-polar piezo-driving signal with 700 µs
tdwell and 700 µs techo; driving pulse amplitude equals to 140 V. The negative
pressure inside the reservoir is -2.3 kPa relative to the atmospheric pressure.
Images were taken at a frame rate of 330 kfps. Ambient temperature is 25 ˚C.
The scale bar is 500 µm. (a). The time interval between successive frames, dt,
equals to 9.09 µs. (b). dt equals to 3.03 µs. (c). dt equals to 9.09 µs. ............. 114
Fig. 4.8: Schematic showing the free surface shapes...................................... 116
Fig. 4.9: A 8 µm jet with a velocity of 28 m/s. is 150 µm. The liquid
used is water. Printing parameters: bi-polar piezo-driving signal with 500 µs
tdwell and 500 µs techo; driving pulse amplitude equals to 140 V. Negative
pressure inside the reservoir is -2.3 kPa relative to the atmospheric pressure.
Images were taken at a frame rate of 330 kfps. The numbers of the frames
shown in the figure are n = 1, 4, 7 …… 52. Ambient temperature is 25 ˚C. The
scale bar is 500 µm. ........................................................................................ 117
Fig. 4.10: Images showing jetting produced when no coalescence happens
between the two cavities. is 150 µm. The liquid used is 70% aqueous
glycerin (w/w) solution. Printing parameters: bi-polar piezo-driving signal
with 550 µs tdwell and 550 µs techo; driving pulse amplitude equals to 140 V.
The negative pressure inside the reservoir is -2.3 kPa relative to the
atmospheric pressure. Images were taken at a frame rate of 330 kfps. Ambient

List of Figures
xvi
temperature is 25 ˚C. The scale bar is 500 µm. (a). dt equals to 6.06 µs. (b). dt
equals to 3.03 µs. (c). dt equals to 9.09 µs. (c). dt equals to 6.06 µs. ............. 118
Fig. 4.11: Images showing the cavity jet pierces the thin liquid film. is
150 µm. The liquid used is 30% aqueous glycerin (w/w) solution. Printing
parameters: bi-polar piezo-driving signal with 750 µs tdwell and 750 µs techo;
driving pulse amplitude equals to 140 V. The negative pressure inside the
reservoir is -2.3 kPa relative to the atmospheric pressure. Images were taken at
a frame rate of 330 kfps. Ambient temperature is 25 ˚C. The scale bar is 200
µm. (a). dt equals to 6.06 µs. (b). dt equals to 3.03 µs. .................................. 120
Fig. 4.12: Images showing the cavity jet fails to pierces the cavity. is
150 µm. The liquid used is 85% aqueous glycerin (w/w) solution. Printing
parameters: bi-polar piezo-driving signal with 650 µs tdwell and 650 µs techo;
driving pulse amplitude equals to 140 V. The negative pressure inside the
reservoir is -2.3 kPa relative to the atmospheric pressure. Images were taken at
a frame rate of 330 kfps. Ambient temperature is 25 ˚C. The scale bar is 200
µm. (a). dt equals to 18.18 µs. (b). dt equals to 3.03 µs. (c). dt equals to 15.15
µs. .................................................................................................................... 121
Fig. 4.13: A thin liquid thread generated during the jetting. is 150 µm.
The liquid used is 70% aqueous glycerin (w/w) solution. Printing parameters:
bi-polar piezo-driving signal with 550 µs tdwell and 550 µs techo; driving pulse
amplitude equals to 140 V. The negative pressure inside the reservoir is -2.3
kPa relative to the atmospheric pressure. Images were taken at a frame rate of
330 kfps. Ambient temperature is 25 ˚C. The scale bar is 200 µm. (a). dt
equals to 3.03 µs. (b). dt equals to 12.12 µs. (c). dt equals to 6.06 µs. ........... 122
Fig. 4.14: Images showing the interaction between the piezo-generated cavity
and the preexisting bubble inside the nozzle. is 150 µm. The liquid used
is 75% aqueous glycerin (w/w) solution. Printing parameters: bi-polar piezo-
driving signal with 550 µs tdwell and 550 µs techo; driving pulse amplitude
equals to 140 V. The negative pressure inside the reservoir is -2.3 kPa relative
to the atmospheric pressure. Images were taken at a frame rate of 330 kfps.
Ambient temperature is 25 ˚C. The scale bar is 500 µm. dt equals to 6.06 µs.123
Fig. 4.15: Surfaces collapse jet upward into the nozzle. is 150 µm. The
liquid used is 85% aqueous glycerin (w/w) solution. Printing parameters: bi-
polar piezo-driving signal with 650 µs tdwell and 650 µs techo; driving pulse
amplitude equals to 140 V. The negative pressure inside the reservoir is -2.3
kPa relative to the atmospheric pressure. Images were taken at a frame rate of
165 kfps. Ambient temperature is 25 ˚C. (a). The scale bar is 1 mm. dt equals
to 24.24 µs. (b). The scale bar is 1 mm. dt equals to 18.18 µs. (c). The scale
bar is 500 µm. dt equals to 12.12 µs. .............................................................. 125
Fig. 4.16: Surfaces collapse jets. is 150 µm. The liquid used is 50%
aqueous glycerin (w/w) solution. Printing parameters: bi-polar piezo-driving
signal with 550 µs tdwell and 550 µs techo; driving pulse amplitude equals to 140
V. The negative pressure inside the reservoir is -2.3 kPa relative to the
atmospheric pressure. Images were taken at a frame rate of 330 kfps. Ambient

List of Figures
xvii
temperature is 25 ˚C. The scale bar is 200 µm. Image for frame number n = 1,
3, 5 …… 13, 15............................................................................................... 126
Fig. 4.17: Jetting velocities obtained for different concentration of aqueous
glycerin solutions (w/w): 0%, 10%, 30%, 50%, 70%, 75%, 80%, and 85%. . 126
Fig. 4.18: The fastest jet observed in the experiment: a 9 µm jet with a velocity
of about 100 m/s. is 150 µm. The liquid used is 50% aqueous glycerin
(w/w) solution. Printing parameters: bi-polar piezo-driving signal with 550 µs
tdwell and 550 µs techo; driving pulse amplitude equals to 140 V. The negative
pressure inside the reservoir is -2.3 kPa relative to the atmospheric pressure.
Images were taken at a frame rate of 330 kfps. Ambient temperature is 25 ˚C.
The scale bar is 200 µm. Time interval between frames is dt = 3.03 µs. ....... 128
Fig. 4.19: Images showing the relationship between jet velocity and jet
diameter. Jets belong to type II. is 150 µm. The liquid used is 70%
aqueous glycerin (w/w) solution. Printing parameters: bi-polar piezo-driving
signal with 550 µs tdwell and 550 µs techo; driving pulse amplitude equals to 140
V. The negative pressure inside the reservoir is -2.3 kPa relative to the
atmospheric pressure. Images were taken at a frame rate of 330 kfps. Ambient
temperature is 25 ˚C. The scale bar is 200 µm. (a). A 1 µm jet with a velocity
of 66 m/s. (b). A 3 µm jet with a velocity of 51 m/s. (c). A 10 µm jet with a
velocity of 15 m/s............................................................................................ 129
Fig. 4.20: Images showing the relationship between jet velocity and jet
diameter. Data collected for both Jet I and Jet II. is 150 µm. Liquid used
is 0%, 10%, 30%, 50%, 70%, 75%, 80% and 85% aqueous glycerin (w/w)
solutions. Printing parameters: bi-polar piezo-driving signal; driving pulse
amplitude equals to 140 V. Ambient temperature is 25 ˚C............................. 130
Fig. 5.1: Schematic showing the DOD setup for cell printing experiment. .... 137
Fig. 5.2: Images taken by using the high-speed-video camera. (a). Image
sequence showing the formation of a 160 µm droplet from a 119 µm nozzle,
taken at a frame rate of 8,000 fps, giving time between frames of 125 µs.
Liquid used was 1.0% (w/v) aqueous solution of sodium alginate. Drop
velocity is 0.74 m/s. (b). Images showing cell motion inside the nozzle. Nozzle
opening diameter is 119 µm. ........................................................................... 137
Fig. 5.3: Graph showing influence of excitation pulse on droplet velocity. The
orifice diameters of the nozzles used were 36, 81 and 119 µm. ..................... 140
Fig. 5.4: Graph showing influence of excitation pulse voltage on droplet
diameter. The orifice diameters of the nozzles used were 36, 81 and 119 µm.141
Fig. 5.5: Graph showing a 95% survival rate of L929 rat fibroblast cells
stained with Calcein AM and Ethidium homodimer-1. Printed with an
excitation pulse amplitude of 116 V, at a frequency of 1.5 kHz, with rising and
falling times of 3 µs. The orifice used was 119 µm. ....................................... 142

List of Figures
xviii
Fig. 5.6: Mean cell survival rate with respect to excitation pulse amplitude for
the samples printed through the 36 µm orifice, with excitation pulse amplitude
from 60 V to 130 V, at a frequency of 1.5 kHz, with rising and falling times of
3 µs. Error bars show the standard error from 5 replicates. ............................ 143
Fig. 5.7: Graph showing the mean cell survival rate against excitation pulse
amplitude. Samples printed through orifices with the diameter of 36, 81 and
119 µm, with excitation pulse amplitude from 52 to 140 V, at frequency of 1.5
kHz, with rising and falling times of 3 µs. Each cell survival rate data was the
average value from 5 replicates. ..................................................................... 144
Fig. 5.8: Graph showing percentage of cell death against the mean shear rate.
Samples printed through orifices with the diameter of 36 µm, 81 µm and 119
µm. Each cell death rate data was the average value from 5 replicates. ......... 145
Fig. 5.9: Droplets printed onto a dry substrate from a suspension with a
concentration of 2×10⁶ cells per ml. Each droplet contains 1 to 5 cells. The
orifice diameter of the nozzle used was 60 µm. ............................................. 147
Fig. 5.10: Graph showing the probability density distribution of the number of
cells in each droplet. For a range of different average cell concentration in the
cell medium, from dN = 0.5, 1.0, 1.5 … 3.0 cells per droplet. ...................... 149
Fig. 5.11: Optical micrographs of L929 rat fibroblast cells after 5 days in
culture following printing. Cell division can be observed (indicated by green
circle) apparently. ........................................................................................... 150
Fig. 5.12: Images of printed cells. (a). Cells inside dried droplet residues. The
scale bar is 50 µm. (b). Schematic showing the measurement of the radial
location of each cell, away from the center of the dried droplet residue. ....... 150
Fig. 5.13: Graph showing the probability density distribution of the number of
cells in each droplet. The (□) stands for the experimental results and (--+--)
stands for the values calculated from eq. 5.3. Determined from microscope
counting of cells in 800 droplets, which were dispensed within the first 4
minutes. ........................................................................................................... 151
Fig. 5.14: Graph showing the probability of cell location within the dried
droplet splatter. The “radius” is the distance from the center of the cell to the
center of the dried droplet. The “Radius” is the radius of the dried droplet.
“Rcell” is the radius of the round-shaped L929 rat fibroblast cells, which has a
value of approximately 10 µm. ....................................................................... 152
Fig. 5.15: Graph showing the average number of cells per droplet vs. time
from start of printing. Printing was carried out continuously over a period of
2.5 hours, at 120 Hz driving frequency........................................................... 153
Fig. 5.16: Image showing cells printed onto a dry Petri-dish, forming an
“NUS” pattern. Each droplet contains 2 to 6 cells. The orifice diameter of the
nozzle used was 60 µm. .................................................................................. 154

List of Figures
xix
Fig. 5.17: Image showing a continuous line of overlapping droplets with
around 6 to 8 cells per droplet in the crosslinked gel. The orifice diameter of
the nozzle used was 60 µm. ............................................................................ 154
Fig. 5.18: Image showing live cells printed onto a collagen gel, forming an
“NUS” pattern. The orifice diameter of the nozzle used was 60 µm. Picture
taken 5 day after printing. ............................................................................... 155

List of Symbols
xx
List of Symbols
f Jetting frequency
c Sound speed
v Droplet velocity
d Droplet diameter
Dynamic viscosity of liquid
Surface tension of liquid
Density of fluid
Piezoelectric strain constant
Kinematic viscosity of liquid
N Average cell concentration per unit volume
Droplet volume
Average number of cells per droplet volume
Droplet impact velocity
Contact angle
Surface tension force at the liquid-gas interface

Chapter 1: Introduction
1 of 176
1. INTRODUCTION
1.1 Background
For environmental conservation and the realization of a sustainable society, it
is necessary that industrial manufacturing processes undergo a transformation
with reduction of environmental impact. From this viewpoint, additive
manufacturing technologies have attracted considerable attention because they
have the potential to greatly reduce ecological footprints as well as the energy
consumed in manufacturing. An additive manufacturing process is one
whereby a product is made by adding successive layers of material onto a
substrate. Examples are electron beam melting, laser sintering, aerosol jet
printing and inkjet printing. Rapid Prototyping (RP) is the name generally
given to the various additive processes. Besides the above mentioned
advantage of environmental benignity, additive manufacturing process is also
a low cost production method for reducing the material wastage, especially for
the specialty polymers and precious metals.
Drop-on-Demand Inkjet Printing (DOD IJP) is an additive manufacturing
process, a data-driven process that patterns directly onto the substrate with
ejected droplets. It is capable of precise deposition of picoliter volumes (down
to 2 pL, 15 m in diameter) of liquids at high speed (up to 60 kHz [1]) and
accuracy (< 5 m) on a target surface, even onto non-planar surface. Due to its
advantages in high resolution, automation, low cost, non-contact, flexible,
environmental benignity and ease of material handling, the application of

Chapter 1: Introduction
2 of 176
DOD inkjet printing technology has been expanded from conventional graphic
printing to new areas, such as organ printing, displays, integrated circuits (ICs),
solar cells, memory devices, optical devices, MEMS and drug delivery.
One of the aims of tissue engineering is to position cells into 3-D structures
and arrange them in a specific pattern. The generation of such structures
forms the basis of tissue regeneration and possibly, organ building [2]. Inkjet
printing is a suitable candidate for this purpose. It has been used successfully
in a similar manner for automated rapid prototyping technology which
precisely positions droplets onto a substrate. To date, many different cell types
have been printed successfully by different printing methods and their viability
has been verified [3-10]. The power of inkjet printing lies in its ability to
deliver picoliter volumes of materials at high speed and accuracy on a target
interface (probably non-planar surface), and to deliver active substances to a
developing structure in timing sequence. By using different cell types as
different bio-inks, and delivering them to exact positions to mimic tissue
structures of the original tissue, inkjet printing offers a possible solution for
building whole structures such as bone, cornea, ligament, cartilage etc, to
solve the organ transplantation crisis.
With improving living standards, requirements for low-power, fast response
time, lightweight, wide viewing angle and portable communication devices are
rising and galvanizing the display industry to loot at a new technology known
as polymer light-emitting-diode (PLED) display. Monochromatic displays can
be prepared by spin-coating; however, to fabricate a full-color PLED flat-

Chapter 1: Introduction
3 of 176
panel display (FPD), a micro-patterned array of red, green, and blue PLED
subpixels must be fabricated on the display backplane. This requires the three
differently colored electroluminescent polymers to be deposited onto the exact
position of the substrate [11, 12]. The spin-coating technique is clearly not
suitable for such displays. Subtractive patterning, such as the
photolithographic technique, is also not appropriate for such task due to its
high cost, and complicated process as a multi-stage approach. Among all the
manufacturing processes, inkjet printing has been proved to be the most
promise technique for full-color PLED displays fabrication, and PLED devices
have been demonstrated by plenty of companies such as Seiko-Epson, Philips,
CDT, DuPont, Samsung SDI, TM (Toshiba-Matsushita) Display and Delta.
Fig. 1.1: A typical flow diagram of photolithograph-based and inkjet printing based
process.
Applying inkjet printing technology to electronics patterning is quite
straightforward, as material can be deposited on-demand, which reduces
material wastage. It is also well-known that a conventional silicon patterning

Chapter 1: Introduction
4 of 176
process usually involves photolithography and etching processes (either
reactive ion etching or anisotropic wet chemical etching), which consist of
many sub-processes and lead to long processing time and high cost, as shown
in Fig. 1.1; all these complicated processes are avoided in inkjet printing as it
is a non-lithographic patterning method. Besides saving the cost of lithography
masks and materials, DOD inkjet printing also has many other advantages.
Firstly, as a low temperature process, micro-patterning process can be even
performed on paper or plastics, which makes it well suited to roll-to-roll
fabrication and makes it especially attractive for fabricating large-area, ultra-
low cost electronic circuits on flexible substrates [13, 14, 15]. Secondly,
applications of the above photolithographic patterning and etching processes
to polymer multilayer structures is difficult because of the plasma-induced
degradation of electroactive polymers and the lack of suitable anisotropic
etching techniques for polymers [16]. However, inkjet printing can handle a
wide range of materials including solution-based materials, suspended nano-
particles and polymers; it also allows the use of inviscid ink without added
binders [17]. This feature makes it a possible technique for low-cost
fabrication of solution-processible polymer field-effect electronics devices
[18]. Thirdly, inkjet printing is a data-driven process that can directly transfer
computer-aided designs into device patterns, which can greatly save the
process time and accommodate customization. To conclude, electronics
fabricated by direct inkjet printing of functional electronic materials has
gained significant interest as an alternative to conventional silicon integrated
circuit (IC) process.

Chapter 1: Introduction
5 of 176
1.2 Challenges
As discussed in above section, because of its unique advantages, DOD inkjet
printing has emerged as an attractive patterning technique for a variety of new
areas in the last two decades. Accordingly, the dispensed liquids have been
expanded from the conventional pigmented ink (or standard dye-based ink) to
polymers, gels, cell ink or other materials which often have higher viscosities
or even contain large particles or cells. For simplicity, the word “ink” is still
used to represent the liquid to be dispensed. Ink viscosity is the most crucial
parameter which will affect printing. When the actuator is activated, energy
goes into kinetic energy, viscous flow and surface tension of the free-surface
flow. Viscous dissipation causes partial energy loss in the printhead. As a
result, ink viscosity must be low enough to ensure the success of droplet
dispensing. For most of the commercial inkjet printheads supplied by
companies like Microdrop, Microfab, Dimatix and XAAR, only liquids with
viscosities lower than 20 cps [12] can be consistently dispensed. Fluids with
even higher viscosities have to be diluted before printing or warmed up during
the printing, which will either adversely affect the properties of the liquids or
lead to long processing times in printing.
Another major concern in inkjet printhead design is the “first drop problem”,
which is the clogging of nozzles by dried ink at the nozzle tip. Especially,
when inkjet printing is applied to the above new areas, inks containing
particles, or even cells, can easily block the nozzle orifice, resulting in time-
consuming nozzle cleaning or even damage of the entire printhead. To solve

Chapter 1: Introduction
6 of 176
the problem, the easiest way is to use a nozzle with a bigger orifice, as bigger
orifices are less likely to clog. However, this is often not desirable in inkjet
printing as bigger nozzles result in bigger droplets and lower printing
resolution. Especially, for applications such as fabricating organic transistor
circuits or MEMS devices, the resolution of current inkjet printing is still too
low (normally limited to 20 µm by droplet size and the spreading of the
droplet on the substrate [19, 20]) and droplet size needs to be further reduced.
Besides reducing the nozzle size, when using piezoelectric-based DOD inkjet
printhead, it has been proved that smaller droplets could be produced by
judiciously controlling the piezoelectric parameters [21, 24, 25]. These studies
reveal a possible way to alleviate the nozzle clogging problem without
sacrificing printing resolution. However, these methods only work over a
limited range of Ohnesorge numbers and their effects are also limited: the
diameter of the dispensed droplets can be only reduced to a maximum of 60 %
of the orifice diameter. Consequently, reducing nozzle size seems the only
efficient way to reduce droplet size, to fulfill the resolution requirement by the
new applications of inkjet printing, such as fabrication of organic transistor
circuits or MEMS devices. As can be foreseen, the clogging problem would
become even worse during printing.
The poor printability and nozzle clogging may result in unreliable or even
failed dispensing and thus impose tremendous challenges on the printhead
design and printing process.

Chapter 1: Introduction
7 of 176
1.3 Objectives
Main objectives of this research are:
To study drop generation conditions and ejection nozzle requirements
in DOD inkjet printing. Two methods for fabricating microscale inkjet
nozzles, based on micro-pipette fabrication technology and silicon
micro-machined technology, will be proposed and tested.
To design and fabricate a new type of PET/PTFE-based piezoelectric
squeeze mode inkjet printhead. The new printhead should have the
ability to dispense liquids with much higher viscosities (> 100 cps).
The new printhead should also have interchangeable nozzle design, so
the clogged nozzle can be easily removed and cleaned. Especially, the
damaged nozzle can be easily changed, avoiding the destruction of the
whole printhead assembly.
To characterize the in-house-developed printhead: investigating the
printability and the printing repeatability of the new printhead by
comparing it with the conventional glass-based printheads;
investigating the effects of printing parameters (pulse amplitude, pulse
width, nozzle size, jetting frequency etc.) on droplet velocity and
droplet diameter; optimizing the printhead design to improve the
maximum jetting frequency.

Chapter 1: Introduction
8 of 176
To investigate the efficiency of three different methodologies on
generation of microscale droplets: reducing the droplet size by directly
reducing the nozzle size down to 1 to 2 microns; carefully controlling
the piezoelectric waveforms to generate droplets smaller than the
nozzle size; generating much smaller droplets or fine jet by combining
DOD inkjet printing with the conventional electrospinning technique.
To carry out the cell printing experiments. Investigate the survivability
of the cells subjected to the large stresses during the printing process.
Fibroblast cells will be printed onto different substrates (alginate,
collagen etc) and cultured over a period of days to verify their long-
term viability. Pattern printing, cell agglomeration in the cell ink, cell
number in each printed droplet and cell location inside the dried-
droplet will also be studied.
1.4 Organization
The layout of this thesis is organized as follows:
Chapter 2 presents an essential introductory knowledge on the inkjet
printing technology, which includes the classification of different DOD
inkjet printing methods and their work principles, conditions for
dispensing a droplet from an inkjet nozzle, different ejection nozzle
fabrication methods and different criteria for evaluating printing

Chapter 1: Introduction
9 of 176
quality. It also presents the state-of-the-art work in the areas of
generating ultra-small droplets and cell printing.
Based on our theoretical study, a PET/PTFE-based piezoelectric
squeeze-mode DOD inkjet printhead with interchangeable nozzles, has
been designed and fabricated, which will be discussed in Chapter 3.
The detailed printhead chamber design and the ejection nozzle
fabrication process will be given. The advantages of the in-house-
developed printhead, as well as its characterizations will also be
discussed in detailed.
In Chapter 4, the fine jet generated in DOD inkjet printing will also be
systematically studied, with the help of an ultra-high-speed, high
space-resolution video camera system.
Chapter 5 presents the results of the cell printing experiments. The
effects of shear stresses on cell survivability, the long-term viability of
the cells printed onto different substrates (coated by alginate or
collagen), and the results of pattern printing will all be discussed in
detailed.
Chapter 7 outlines future working directions that could further improve
the printhead resolution and the maximum jetting frequency, based on
the theoretical and experimental work presented in this dissertation.

Chapter 2: Literature Review
10 of 176
2. LITERATURE REVIEW
2.1 Introduction to Inkjet Printing
Inkjet printing is a contact-free dot-matrix printing technique in which an
image is created by directly jetting ink droplets onto specific locations on a
substrate [26]. The concept of inkjet printing can trace its history to the 19th
century and the inkjet printing technology was first developed in the early
1950s. Inkjet printers that capable of reproducing digital images generated by
computers were developed in the late 1970s, mainly by Hewlett-Packard,
Epson and Canon. The booming of the personal computer industry in 1980s
has led to a substantial growth of the printer market and nowadays personal
printer is present in almost every office and home. Inkjet printing technology
is developing at a rapid pace. It has been expanded from conventional graphic
printing to various applications, such as organ printing, displays, integrated
circuits (ICs), optical devices, MEMS and drug delivery.
2.1.1 Classification of Inkjet Printing Techniques
Inkjet printing technology has been developed in a wide variety of ways. In
Fig. 2.1, the inkjet tree structure shows a layout for most of the better known
inkjet printing techniques and some of the corresponding adopters. As can be
seen, there are two categories of inkjet printing technology: Continuous inkjet
printing and Drop-on-Demand inkjet printing.

Chapter 2: Literature Review
11 of 176
Fig. 2.1: Layout of the different inkjet printing technologies.
2.1.1.1 Continuous Inkjet Printing
The earliest inkjet devices operated in a continuous mode. The idea was first
patented by Lord Kelvin in 1867 and the first commercial model was
introduced by Siemens in 1951. In this technique, a continuous jet of the liquid
ink is formed by applying pressure to the ink chamber with a small orifice at
one end. A fluid jet is inherently unstable and will break up into droplets,
which is entirely a consequence of the surface tension effects. This
phenomenon was firstly noted by Savart in 1833 and described mathematically
by Lord Rayleigh [27]. If surface tension force is the only force acting on the

Chapter 2: Literature Review
12 of 176
free surface of the jet, it will break up into droplets of varying size and
velocity; when a periodic perturbation of an appropriate frequency is applied
to the liquid, typically using a piezoelectric transducer, the jet will break up
into droplets of uniform size and velocity. The droplets separate from the jet in
the presence of a properly-controlled electrostatic field which generated by an
electrode that surrounds the region where break-off occurs. As a result, an
electric charge can be induced on the drops selectively. Subsequently, when
the droplets pass through another electric filed, the charged droplets are
directed to their desired location on the substrate to form an image; those
uncharged droplets will drift into a catcher for recirculation. Continuous inkjet
can be classified into binary deflection or multilevel deflection according to
the drop deflection methodology, as can be seen in Fig. 2.1.
Fig. 2.2 and Fig. 2.3 schematically show streams of droplets generated from
binary deflection and multilevel deflection mode continuous inkjet,
respectively. A piezoelectric transducer is used to generate a periodic
perturbation onto the jet. In the both modes, the charged droplets are directed
to deposit onto the substrate, while in the multilevel, the charged droplets are
allowed to deposit onto the substrate at different levels. By using the
multilevel deflection system, a small image swath can be created by a single
nozzle. Fig. 2.4 shows droplets generated by a continuous inkjet system with
multi-nozzles. Continuous inkjet is widely used in the industrial coding,
marking, and labeling markets [26]. Extensive studies, both theoretical and
experimental, have been conducted to analysis different continuous inkjet
systems, especially the process of disturbance growth on the jet stream which

Chapter 2: Literature Review
13 of 176
leads to droplet formation. Typically the droplets generated by a continuous
inkjet system have a diameter of approximately twice of the orifice diameter.
Droplets sizes range from 20 µm to 500 µm can be generated at rates of up to
1 MHz by continuous inkjet.
Fig. 2.2: A Binary-Deflection continuous inkjet system.
Fig. 2.3: A Multilevel-Deflection continuous inkjet system.

Chapter 2: Literature Review
14 of 176
Fig. 2.4: Droplets generated from a continuous inkjet system with multi-nozzles.
The major advantage of continuous inkjet is that it can generate ink droplets
with very high velocity, which can reach to 50 m/s. This feature allows for the
usage of a relatively long distance between printhead and substrate. It also
allows for rapid droplet formation rate, also known as high speed printing.
Another advantage of continuous inkjet is no waste of ink, due to droplet
recycling. Furthermore, since the jet is always in use, nozzle clogging can be
avoided in continuous inkjet. Therefore volatile solvents such as alcohol and
ketone can be employed to promote drying of droplets onto the substrate.
The major disadvantage of continuous inkjet is that the ink to be used must be
electrically conducting, to ensure that ink droplets can be charged and directed
to the desired location. Furthermore, due to ink recycling process, ink can be
contaminated.
2.1.1.2 Drop-on-Demand Inkjet Printing
Drop-on-Demand inkjet systems were developed in the 1970s, when different
actuation principles were utilized [28]. In this technique, ink droplets are

Chapter 2: Literature Review
15 of 176
produced only when they are required. According to the mechanism used
during the droplet formation process, DOD inkjet can be categorized into four
major types: thermal mode, piezoelectric mode, electrostatic mode, and
acoustic mode, as can be seen from Fig. 2.1. Most of the DOD systems in the
market are using the thermal or the piezoelectric modes. Nevertheless, no
matter which mode is used, the basic principles of all these different inkjet
methods are similar: a transducer, normally a piezoelectric element or a
thermal heater, generates a pressure pulse into the ink and forces a droplet out
of the orifice, as schematically shown in Fig. 2.5. The only difference lies in
that the way how this pressure pulse is generated.
Fig. 2.5: Schematic of the DOD inkjet printing process.
The first thermal inkjet device was designed in 1977 by Canon engineer Ichiro
Endo. In this technique, when a droplet is required, a current pulse of less than
a few microseconds is produced and passes through a heating element located
nearby the nozzle. Heat is transferred from the heater to the ink, causing a
rapid vaporization of the ink to form a vapor bubble inside the ink chamber.
As the ink chamber volume is fixed, this instantaneous expansion of bubble
will cause a large pressure increase inside the chamber, propelling the ink out

Chapter 2: Literature Review
16 of 176
of the nozzle. Simultaneously with the later bubble collapse, the pushed-out
ink column will break off from the nozzle and form a droplet, flying to the
substrate. The duration of the air bubble formation and collapse is less than 10
µs. Fig. 2.6 schematically shows the droplet formation process in a thermal
inkjet chamber. As the bubble collapses, a vacuum is created. The ink then
flow back into the chamber and recover to its equilibrium state, waiting the
next round of jetting. According to its configuration, thermal inkjet device can
be classified into a roof shooter or a side-shooter type. The orifice is located
on top of the heating element in a roof-shooter thermal inkjet, while it is
located on a side nearby the heating element, as shown in Fig. 2.7 and Fig. 2.8.
Most of the consumer inkjet printers designed by companies such as Hewlett-
Packard and Canon are in thermal bubble type.
Fig. 2.6: Droplet formation process within the ink chamber of a thermal inkjet device.
Fig. 2.7: Roof-shooter Thermal inkjet.

Chapter 2: Literature Review
17 of 176
Fig. 2.8: Side-shooter Thermal inkjet.
The earliest piezoelectric inkjet printhead was designed by Zoltan in 1972. In
this technique, when a droplet is required, an electric pulse will be applied to a
piezoelectric element located behind the nozzle. Then the piezoelectric
element changes its shape, causing a pressure pulse inside the ink that
propelling a droplet from the nozzle. Depending on the deformation method of
the piezoelectric element used in the device, piezoelectric inkjet printing can
be classified into four categories: squeeze mode, bend mode, push mode and
shear mode.
Fig. 2.9: Schematic of the squeeze-mode inkjet.
In squeeze mode piezoelectric inkjet, a thin piezoelectric tube is tightly
attached onto a glass tube which with an orifice at one end, as shown in Fig.
2.9. The piezoelectric tube is radially polarized and is with electrodes on its
outer and inner surfaces. When a droplet is desired, an electrical pulse will be

Chapter 2: Literature Review
18 of 176
applied to the piezoelectric transducer, the polarity is selected to cause a
contraction of the transducer. As a result, the glass tube as well as the ink will
also be squeezed, and a droplet of ink will be ejected from the nozzle. Squeeze
mode piezoelectric inkjet is implemented by companies, such as Siemens,
Microdrop and MicroFab.
Fig. 2.10: Schematic of the bend-mode inkjet.
Fig. 2.10 schematically shows a piezoelectric actuator operating in bend mode.
The device consists of an ink chamber with one side of it formed by a
conductive diaphragm. A piezoelectric plate is tightly bonded to the
diaphragm. When an electric pulse is applied, the piezoelectric element will
contract in the radial direction, causing the diaphragm to flex inwardly into the
ink chamber. This instantaneous motion of diaphragm will cause a large
pressure increase inside the chamber and forces a droplet to be jetted from the
orifice. Successful implementation of the bend mode piezoelectric inkjet can
be found in printheads from companies, such as Epson and Sharp.
In a push mode piezoelectric design as shown in Fig. 2.11, when the
piezoelectric rod expands in the horizontal direction, it pushes against the ink
to eject a droplet from the orifice. Similar as in the bend mode, a thin

Chapter 2: Literature Review
19 of 176
diaphragm is incorporated between the piezoelectric element and the ink, to
prevent undesirable interaction between ink and the piezoelectric materials
[29]. Push mode inkjet is implemented by companies, such as Epson and
Trident.
Fig. 2.11: Schematic of the push-mode inkjet.
Fig. 2.12: Schematic of the shear-mode inkjet.
In all above 3 types of inkjet devices, the electric field generated between
electrodes is parallel with the polarization of the piezoelectric plate. However,
in the shear mode piezoelectric inkjet device, the imposed electric fields are
orthogonal to the polarization direction of the piezoelectric element [30]. As
schematically shown in Fig. 2.12, P denotes the polarization directions; the
electrodes are mounted on the different locations of the piezoelectric plate.
Therefore, the resulting shear motion of the transducer decreases the volume

Chapter 2: Literature Review
20 of 176
of the ink chamber and pushes the ink, ejecting a droplet from the orifice. In
shear mode piezoelectric inkjet, since the piezoelectric transducer directly
forms one wall of the ink chamber, thus interaction between ink and
piezoelectric materials is typically inevitable. It is also one of the key
parameters of shear mode inkjet [26]. Successful implementation of the shear
mode piezoelectric inkjet can be found in printheads from companies, such as
Spectra and Xaar.
Most of the industrial inkjet printers and some of the consumer printers (those
produced by Epson) are designed in piezoelectric type.
As can be seen from above discussion, the DOD actuation principle eliminates
the need for droplet charging system, droplet deflection system and ink
recycling system, thus the whole jetting device is more compact as compared
to continuous inkjet device. Furthermore, wider range of inks can be used in
DOD system as droplet charging is not required. Finally, since ink
recirculation is avoided, thus ink contamination can be eliminated. Currently
the majority of interest in inkjet printing is in the DOD methods.
The main disadvantage of DOD inkjet is the clogging of jet nozzles. Clogging
may result from particles inside the ink, especially when pigment-based ink is
used. Therefore, fine filters must be adopted upstream from the nozzle to
prevent relatively big particles from reaching the nozzle. Furthermore, during
the off working state, a solid deposit in the nozzle will form due to dry of ink,
which will also lead to nozzle clogging. This is well known as the “first drop

Chapter 2: Literature Review
21 of 176
problem” [31]. Another disadvantage of DOD inkjet is the lower droplet
velocity. Typically DOD inkjet produce droplet with velocity lower than 10
m/s. Finally, DOD inkjet also has the advantage of low jetting speed. When a
droplet is produced, acceleration of a mass of ink is always required, and this
acceleration is created only by the actuating signal itself. Thus the droplet
generation rate, as well as the printing speed is limited for DOD devices [28].
2.1.2 Advantages and Disadvantages of Inkjet Printing
As a Rapid Prototyping technique, inkjet is an additive manufacturing process.
It ejects droplets only when required and hence reduces the material wastage.
This implies a lower cost for the applications that requires expensive materials,
which is sponsored for conservation and the realization of a sustainable
society.
As compared to the traditional photolithography-based patterning process,
which consists of many sub-processes and leads to long processing time and
high cost, inkjet printing is much more compact. It avoids all those
complicated sub-processes. Furthermore, it also saves the cost for lithography
masks as well as the huge work for storing the hundreds of masks.
Inkjet printing is a data-driven direct-write process that can directly transfer
Computer Aided Design (CAD) into device patterns, which can greatly save
the process time and accommodate customization.

Chapter 2: Literature Review
22 of 176
Inkjet printing offers the advantage of non-contact between the nozzle and the
substrate, thus there is no mechanical wear on the printed sample. The
possibility of cross-contamination is also reduced to a minimum.
To conclude, inkjet printing offers advantages in low cost, compact,
automation, non-contact, environmental benignity and ease of material
handling. It is a highly flexible technology that is able to accurately deposit
small volumes of materials in almost any pattern.
There are two main disadvantages in inkjet printing. Firstly, the anisotropic
nature of the inkjet process, due to the intrinsic pinhole nature of the deposited
ink, results in the uneven surface roughness of the printed features [32].
Furthermore, this film non-uniformity can also be produced by the inevitable
“coffee stain” effect, which arises from interaction of multiple effects of the
solvent drying process [33, 34, 35]. This disadvantage in film uniformity does
not exist in planar processing currently used in industry. Secondly, the
resolution of inkjet method is limited by the dispensed droplets size. The
minimum diameter of an inkjet droplet for a state of the art inkjet printhead is
around 10 µm. The resulting printing resolution is enough for document
printing use, but for nanotechnology use and many other industrial
applications, such resolution is not good enough and a more precise inkjet
device needs to be developed. Furthermore, the attainable feature size of a
component fabricated by inkjet printing is also affected by how the droplet
interacts with the substrate. Thus the impact behaviour of the droplets onto a
substrate also needs to be carefully studied.

Chapter 2: Literature Review
23 of 176
2.1.3 Printing System Evaluation
2.1.3.1 Print Resolution
Print resolution is normally measured by the number of individual dots that
can be placed in a line within the span of 1 inch, namely DPI (dots per inch). It
represents the spatial printing dot density and indicates the available printed
fine-feature size. Obviously, print resolution is greatly influenced by the
printed droplet volume. Smaller droplet size is able to provide a higher
resolution printing. Another ongoing measurement of the resolution of inkjet
printing is to use drop pitch in favor of metrication. Drop pitch gives the
spacing between the two adjacent printing dots, and has a direct relationship
with DPI as below:
(2.1)
For example, a resolution of 720 DPI equals to a drop pitch of about 35 µm,
indicating the inter-dot spacing of 35 µm. The resolution of drop-on-demand
inkjet printing is usually in the range of 70-100 µm. However, the droplet size
of commercial inkjet printers has been decreasing in order to achieve higher
print resolution. Droplets of 8-30 picoliters in volume, i.e., droplet size about
25-40 µm, can be generated by commercial inkjet printheads [36, 37].
In practice, due to the changes in droplet size and shape during the droplet
spreading and drying process, resolution of inkjet printing is also greatly
influenced by surface energy of the substrate and the conditions of the ink
solvent evaporation. By heating the substrate near or over the boiling point of
the ink solvent, the liquid in the droplet can be evaporated immediately upon

Chapter 2: Literature Review
24 of 176
contact and providing a finer resolution than one in printed at room
temperature. However, it should be noted that by applying higher substrate
temperature also increases the risk of the nozzle clogging at the printhead.
Fundamental studies to obtain a constant width and shape of printed droplet,
lines and areas on the solid substrate are not fully developed.
2.1.3.2 Jetting Frequency
As a manufacturing tool in industry, product throughput or productivity for
inkjet printing systems is an important requirement, which is closely related to
the droplet jetting process and printing speed. The productivity of an inkjet
printhead is mainly determined by the jetting frequency, defined as the number
of droplets jetted from a nozzle within a certain time. As such, high jetting
frequency is desirable to attain high throughput for inkjet printing system.
On the other hand, print speed (the traveling distance in a unit time for a
printhead or motion stage) has the relationship with jetting frequency and
printing resolution (DPI), given as below:
(2.2)
This is shown that with the increase of the maximum jetting frequency, the
maximum print speed of an inkjet printer will be increased accordingly, and
thus extremely high throughput can be achieved. In 2009, Kyocera claimed the
world’s fastest inkjet printhead (KJ4B-JF06) with the jetting frequency up to
60 kHz [1]. With binary printing mode, each nozzle can eject 60,000 dots per
second (40,000 dots per second in multiple-value printing); with the 2,656
nozzles per printhead, the printhead can print approximately 150 million dots

Chapter 2: Literature Review
25 of 176
per second. Its corresponding print speed can reach 150 m/min at the ultra
high resolution of 1200 × 1200 DPI.
Reliability is another important requirement for an inkjet printhead. For a
reliable jetting, a subsequent droplet should not be dispensed until the
meniscus oscillation from the previous droplet ejection cycle has sufficiently
damped [38, 39]. As this damping takes time, the maximum jetting frequency
is limited for the printhead. For a specific printhead, its maximum jetting
frequency is mainly dependent on the printhead construction and its driving
pulse signal [40]. Thus to obtain higher frequency jetting, a proper driving
waveform needs to be designed such that residual meniscus oscillation can be
effectively suppressed after each droplet ejection cycle. Typical drop-on-
demand inkjet printheads generate droplets at rates in the range of 0.1 to 10
kHz.
2.1.3.3 Drop Positioning Error
Inkjet printing process usually requires accurate placement of ink droplets into
predefined regions. Many of the error sources, affecting drop placement
accuracy, are applied in the design process to improve the stability and
precision of inkjet printing system [41]. Jet straightness and the location error
of the jet onto the substrate are two critical factors producing drop positioning
error. In Fig. 2.13, per nozzle straightness of the Spectra SX-128 inkjet
printhead is measured as shown for example. Jet straightness error less than ±5
mrads, i.e. ± 0.3°, shows a good performance in display applications [42].

Chapter 2: Literature Review
26 of 176
Fig. 2.13: Jet straightness error in both X and Y directions for Spectra SX-128
printhead [42].
The total positioning error is a function of jet straightness, machine inaccuracy
and deviations in drop velocity, respectively [43]. Shimoda et al. [43] also
demonstrated that positioning errors derived from jet straightness and
mechanical inaccuracy can be compensated by a surface wetting effect caused
by a droplet and a substrate. It is worth pointing out that the flatness of the
precision substrate allows for small stand-off distances, which can reduce the
effect of flight-trace errors.
2.1.3.4 Nozzle Hydrophobicity Treatment
To improve printing performance of the printhead, the ink has to be jetted in
the form of complete droplets in a stable manner. Due to repeated droplet
ejection, the surface of a nozzle is wetted by the ink. As such, a nozzle surface
without proper hydrophobic treatment will be suffered from wetting. When
such wetting takes place, the droplet being jetted may be accumulated together
to form a lump on the nozzle surface, which will adversely affect the droplet
formation process. Both the size and placement accuracy of the ink droplets

Chapter 2: Literature Review
27 of 176
ejected are then influenced. And finally, the quality of the printing is
deteriorated. Therefore, to guarantee a reliable inkjet printing, it is essential to
provide effective hydrophobicity treatment on the nozzle surface of an inkjet
printhead.
Fig. 2.14 shows total different inkjet printing behavior, for inkjet nozzles both
with and without hydrophobic treatment. It can be clearly seen that without
hydrophobic treatment, the jetted droplets are likely to accumulate on the
nozzle surface, which will deteriorate the printing or even totally stop the
printing.
Fig. 2.14: Two nozzles to show the effects of hydrophobic treatment. (a). Nozzle
without hydrophobic treatment. (b). Nozzle with hydrophobic treatment.
2.1.3.5 Inkjet-Printed Droplet Feature after Drying
Inkjet printing onto a nonabsorbent hard substrate is quite different from
printing onto absorbent paper due to the complex wetting and drying processes.
The shape or surface morphology of droplets and formed patterns are greatly
influenced by surface energy of the substrate and the ink solvent evaporation

Chapter 2: Literature Review
28 of 176
process. The evaporation can be controlled by changing drying environment
such as substrate temperature, vapor pressure, etc. Generally, a circular droplet
on the solid surface evaporates from the boundary and flows outward. This
capillary flow tends to carry most of the dispersed materials to the boundary, a
phenomenon well-known as the coffee-stain effect [34]. It should be noted that
fundamental studies to obtain a constant width and shape of printed droplets,
lines and even areas on the solid substrate are not fully developed. In practice,
a considerable variety of the conditions of substrate surface and drop drying
can produce various dried droplet patterns. They are introduced in the
following sections.
Influence of Substrate Surface Wettability
Surface wettability of the substrate has a great influence on the printed droplet
feature after drying. Fig. 2.15 shows different shapes of printed droplets after
the ink solvent has evaporated, for both hydrophobic and hydrophilic substrate
surfaces [44]. On the contrary, the hydrophobic surface constrains the spread
of the droplet and gives a smaller drying droplet in diameter without the
coffee-stain effect.
Fig. 2.15: Image showing profiles of dried droplets printed on hydrophobic and
hydrophilic surfaces [44].

Chapter 2: Literature Review
29 of 176
Influence of Drying Temperature
Fig. 2.16: Distinct dried droplet patterns under different temperature [45].
For super fine droplets such as ≤ 10 pl, the drying behavior of the droplets is
extremely sensitive to the substrate temperature. Under different range of
temperatures, printed droplet may achieve different dried patterns.
Representative images of dried droplet 3D profile and 2D cross-sectional

Chapter 2: Literature Review
30 of 176
profile through their center are shown in Fig. 2.16 [45], wherein dried profile
of inkjet printed droplets under different substrate temperatures from 25 °C to
60 °C is characterized in order to obtain some reference information on
making a uniform thin film.
Dried droplet profiles that are achievable are categorized into three types:
Gaussian shape, transition shape and ring-like shape corresponding to low
temperatures (< 40°C), medium temperatures and high temperatures (> 50°C),
respectively [45]. At lower temperatures between 25 °C to 35 °C, droplets
finished their spreading stages before drying. Hence, the profiles obtained are
of Gaussian shapes. At temperatures between 40°C to 45°C, a change occurs
in shape of the dried profiles. This could be due to the higher evaporation rates
that prevented the droplet from spreading fully before it dried. At higher
temperatures above 50°C, droplets are dried immediately upon impact before
droplet spreading can occur. Therefore, droplets splash and simply solidify on
impact so as to form a ring-like structure.
2.1.3.6 Inkjet-Printed Line Morphology
Ideally, inkjet-printed straight lines would be smooth and even. But sometimes
it is difficult to fulfill all these features (straight, smooth and even)
concurrently. A few different behaviors come out when examining inkjet-
printed line formation under the various conditions such as droplet spacing,
droplet frequency, and substrate temperature. Fig. 2.17 shows five typical line

Chapter 2: Literature Review
31 of 176
morphologies [46]. They can be labeled respectively as individual drops, a
scalloped line, a uniform line, a bulging line, and stacked coins.
Fig. 2.17: Examples of five typical inkjet-printed line morphologies. (a). Individual
droplets. (b). Scalloped line. (c). Uniform line. (d). Bulging line. (e). Stacked coins.
Droplet spacing decreases from left to right [46].
In the case of Fig. 2.17(c), Smith and Shin et al. [47] provided a calculation to
estimate the width of the printed line:
(2.3)
where d is the droplet diameter, w is the line width, θ is the contact angle, N is
the number of droplets printed for a line length L.

Chapter 2: Literature Review
32 of 176
2.2 Squeeze Mode Piezo-Driven Printhead
As have been discussed in Section 2.1.1.2, there are four types of piezoelectric
drop-on-demand inkjet: squeeze mode, bend mode, push mode and shear
mode. This research is focused on squeeze mode piezo-driven DOD inkjet
printing.
2.2.1 Theory of Droplet Formation
2.2.1.1 Principle of Squeeze Mode Piezo-Driven Printhead
Fig. 2.18: Schematic representation of wave propagation and reflection in a squeeze-
mode piezoelectric inkjet printhead.
A typically squeeze mode piezo-driven DOD inkjet printhead is schematically
shown in the left top part of Fig. 2.18. The operating principle can be basically
explained as follows: when a voltage pulse is applied to the piezoelectric
actuator, it causes a sudden, quasi-adiabatic reduction of the ink chamber

Chapter 2: Literature Review
33 of 176
volume, resulting in the generation of positive pressure waves inside the
chamber. These pressure waves propagate throughout and reflect inside the
chamber. Ink is propelled outwards when a positive pressure wave approaches
the nozzle. A droplet is ejected when the amount of kinetic energy transferred
outwards is larger than the viscous energy dissipation plus the energy needed
to form the surface of the droplet [48]. Besides the above two parts, the kinetic
energy left determines the initial velocity of the ejected droplet. For reliable
jetting, this initial velocity of a droplet needs to be several meters per second,
to overcome the drag action of ambient air [49].
The droplet formation process can be explained in more detail by referring to
the phenomena of wave propagation and deflection in the inkjet printhead,
which is a function of fluid properties, printhead design, and constituent
materials [50, 51]. The first investigation of such phenomena was conducted
by Bogy and Talke [52], followed by the extensive studies of other researchers
[53, 54]. As can be seen from Fig. 2.18, a typical bio-polar voltage signal
which normally used for printing is shown in the bottom of the diagram. In the
top part of the diagram is the propagation and reflection of the acoustic waves
related to each portion of that voltage signal.
At time “a”, the piezoelectric actuator moves radially outward due to a sudden
fall in the voltage. As a result, a negative pressure wave is produced inside the
ink. Point “b” represents that this pressure wave splits into two halves and
propagate in opposite directions to the reservoir side and nozzle side.
According to acoustic wave theory, the reservoir side can be treated as being

Chapter 2: Literature Review
34 of 176
open since the inner diameter of the ink supply tube is comparable to that of
the ink chamber. Whereas the nozzle end can be treated as being closed since
the orifice diameter is negligible as compared to that of the ink chamber. The
pressure wave keeps its phase after reflecting from the closed end while
changes its phase to reverse after reflecting from the open end. The reason is:
for the open end, the boundary condition is zero pressure and this condition is
satisfied by superimposing an opposite phase pressure wave on the incident
pressure wave; the nozzle end is simply treated as a dead end with no flow rate
passing through it, to satisfy the governing equations for wave propagation,
pressure wave only changes its direction after reflecting from this end [50].
After travelling a distance of L, the two halves pressure waves travel back and
meet in the middle of the printhead chamber. At the same time “f”, an increase
of the voltage pulse causes the piezoelectric actuator to move radially inward,
which in turn producing a positive pressure wave propagating to the two ends.
The newly generated positive pressure waves coincide with the former two
halves reflected waves (“f” in Fig. 2.18) and superpose with them. As a result,
the negative pressure wave traveling to the open end is annihilated while the
positive pressure wave traveling to the closed end is doubled (“h” in Fig. 2.18).
This enhanced positive pressure wave propagates to the closed end and
reflects again from it at time , where c represents the speed of
sound in the ink. The drop ejection also occurs at this time “i”.
Bogy and Talke calculated the pressure history at the orifice and concluded
that the operation of DOD inkjet depends strongly on the length of the cavity.
They also found that the four important quantities in wave propagation were

Chapter 2: Literature Review
35 of 176
linearly dependent on the cavity length and the sound speed in the ink. These
four quantities are: the optimum pulse width for generation of maximum
droplet velocity, which equals to ; the delay time for the first protrusion of
the meniscus, which equals to ; the period of meniscus oscillation,
which equals to ; and the period of low-frequency resonant and
antiresonant synchronous operation, which also equals to . The
calculations of these quantities have been extensively verified [40, 55].
The acoustic wave propagation theory is also utilized to help the printhead
design for high-speed inkjet. It is worthy to note that as a manufacturing tool,
high speed jetting is required to increase productivity of inkjet printing
technology. Thus there is a continuous requirement for increasing the
maximum jetting frequency for inkjet printing devices. However, for a reliable
jetting, a subsequent droplet should not be ejected until the pressure wave
from the previous pulse signal has sufficiently damped. This damping takes
time and thus limits the maximum jetting frequency [38, 56]. By utilizing the
self-sensing capability of the piezoelectric element, Kwon et al. proposed a
way to effectively measure the pressure wave inside the ink chamber through
the piezo current. Based on the measurement results, they designed a two-
pulse waveform which could greatly improve the jetting speed of the printhead
[40].
2.2.1.2 Droplet Generation Conditions
The governing equations for the 3-D drop-on-demand inkjet printing are:
0u v w
x y z
(2.4)

Chapter 2: Literature Review
36 of 176
2
x x
p u v uu Vu
t x x x y x y
u wF g
z z x
(2.5)
2
y y
p v u vv Vv
t y x x y y y
v wF g
z z y
(2.6)
2 z z
p u w v ww Vw
t z x z x y z y
wF g
z z
(2.7)
where is the velocity vector with u, v and w in the x-, y- and z-axes; p, ρ and
µ represent the pressure, density and dynamic viscosity of liquid, respectively;
and denote the gravitational force and the surface tension force at the
liquid-gas interface [57]. There are hydrostatic pressure, viscosity force, fluid
inertia and surface tension force which will dominantly influence liquid flow
in a drop-on-demand device. It can be seen from Fig. 2.19 that to eject a
droplet out of the nozzle, the acoustic energy obtained from the piezoelectric
actuator must be sufficient to compensate the energy loss due to viscous
dissipation and the formation of liquid free surfaces.
In a fluid system with characteristic velocity V and characteristic length L, the
Weber number, ,is a measure of the relative importance of
the fluid’s inertia compared to its surface tension. Wang et al. [19] claimed
that it was reasonable to choose as the condition for droplet
generation, giving a initial droplet velocity . For simplicity,
the acoustic pressure was treated as a square hydrostatic pressure pulse with a

Chapter 2: Literature Review
37 of 176
magnitude of P0 and a pulse width of t0. According to the law of conservation
of energy, the kinetic energy of the ejected droplet with such a velocity V,
should equals to the work done by the acoustic pressure. As a result, P0 can be
estimated. Later this hydrostatic pressure was refined by adopting a
commercial inkjet simulation tool: Conventor Inkjet Developer. Table 2.1
shows the minimum hydrostatic pressure required to generate different size of
water droplets. The results indicate that the required actuation pressure
increase is almost directly inversely proportional to the droplet size, which is
reasonable as surface tension is the dominant factor influencing droplet
generation [58].
Fig. 2.19: Schematic representation the basic energy requirement for ejecting a
droplet.
Table 2-1: The minimum actuation pressure for droplet generation in DOD inkjet
devices [58].
d (μm) 10 2 0.4 0.1
Volume (pl) 7.1e-1
6e-3
3.8e-5
7.1e-7
P0 (MPa) 0.2 1 4 20
Besides nozzle size, the fluid properties of the ink also influence droplet
formation. Fromm rescaled the governing equations (eq. 2.4 to eq. 2.7) and

Chapter 2: Literature Review
38 of 176
used the following grouping of fluid properties to provide a dimensionless
analysis of the mechanics of drop formation in DOD inkjet [49]:
(2.8)
The relation is equivalent to the inverse of the Ohnesorge number Oh, where ,
ρ, and are the viscosity, density, and surface tension of the liquid,
respectively, and d is the characteristic length. For an inkjet printhead, d is the
diameter of the nozzle orifice. Fromm predicted that successful droplet
ejection was only possible when Z > 2 and that for a given pressure pulse
droplet volume increases as the value of Z increase [49]. This prediction was
later refined by Reis and Derby, who carried out experiments for dispensing
different concentrated alumina wax suspensions and then concluded that
successful DOD printing could be achieved in the range 1 < Z < 10 [51]. Here
the lower limit represents no droplet ejection due to too much energy
dissipated by viscosity forces, and the upper limit represents the formation of
satellite droplets. In reality, inkjet printing can be reliably utilized for
industrial applications even when satellite droplets are produced, just provided
that the satellites can merge with the main droplet. For example, polymer
solutions with Z numbers bigger than 50 have been successfully dispensed by
Schubert et al. [59].

Chapter 2: Literature Review
39 of 176
2.2.1.3 Droplet Velocity and Droplet Size
Fig. 2.20: Effects of pulse amplitude on droplet velocity and droplet volume [60].
The driving signal to the piezoelectric actuator has significant influence on
droplet formation. Results from different research groups have shown that the
droplet velocity and droplet volume are linearly dependent on the amplitude of
the driving pulse (for simple rectangular input pulse), as shown in Fig. 2.20.
This is understandable as referring to the fractional volume change due to the
piezoelectric effect:
(2.9)
where V is the volume of the piezoelectric actuator, d31 is the piezoelectric
strain constant, U is the applied voltage and t is the thickness of the
piezoelectric tube [61]. The negative sign indicates contraction when the
applied pulse has the same polarity as the original polarizing voltage for the
piezoelectric element. From eq. 2.9 is can be seen that the volume change of
the piezoelectric tube is liner to the amplitude of the input pulse. An increase
in voltage amplitude will lead to a greater volume change in the ink chamber

Chapter 2: Literature Review
40 of 176
and correspondingly larger induced acoustic waves and fluid acceleration,
ultimately, a bigger droplet with higher velocity.
Fig. 2.21: Effects of pulse width on droplet velocity and droplet volume [60].
Fig. 2.21 shows the effects of pulse width on droplet velocity and droplet
volume. Both of the quantities exhibit a maximum as the pulse width is varied.
Derby et al. showed that the location of this maximum value of droplet
velocity remained unchanged when the driving pulse amplitude was increased,
but it shifted when the fluid properties were changed [62]. Similar behavior
was also observed for droplet volume. Derby et al. also observed the periodic
behavior of droplet as the driving frequency f of the piezo signal is varied, as
shown in Fig. 2.22. The x-axis represents “inverse of the jetting frequency”,
rather than the “pulse width”. They are two different parameters, although
both of them have a unit of micro-second. In practice, pulse width is normally
smaller than the “inverse of the jetting frequency” as there are intervals
between successive piezo signals. From Fig. 2.22, this periodicity
phenomenon is also dependent on the fluid properties. This is reasonable as
the maximum in droplet velocity correspond to conditions of resonance, which

Chapter 2: Literature Review
41 of 176
are dependent on the ink chamber geometry as well as the speed of acoustic
wave in the ink, which is dependent on the ink properties.
Fig. 2.22: Effects of jetting frequency on droplet velocity and droplet volume [62].
2.2.1.4 Satellite Droplet
As have been mentioned before, Reis and Derby predicted that satellite
droplets would be produced during inkjet printing when the Ohnesorge
number smaller than 0.1 [51]. Since satellite droplets can negatively impact
the printing resolution, there has being a great interest in understanding the
satellite droplet formation process, and also the methods to avoid it [63-65].
A sequence of images captured during DOD droplet formation is shown in Fig.
2.23, revealing the main features of this process. When the piezoelectric
transducer contracts, ink inside the chamber is accelerated and squeezed out of
the nozzle. Initially, the meniscus extends rapidly outward until a liquid

Chapter 2: Literature Review
42 of 176
column with a round leading edge is formed (images 1-3 in Fig. 2.23). After a
short time (normally several tens of micro-seconds after the contraction
behavior of the transducer, starting at approximately 12 µs in the figure, as
image 4), the outward flow rate decreases. The resulting difference in Z-axial
velocity between the column head and the liquid at the nozzle exit causes the
liquid column to stretch. The velocity of the liquid at the orifice continuously
decreases until no flow into the column, or even decreases further due to some
inverse flow caused by the extension of the piezoelectric transducer to its
equilibrium position. The liquid column is continuously extended due to the
inertia and this extension rate decreases with time as new surface is formed
which resulting the increase of surface energy. With the extension and
stretching of the liquid column, the liquid at nozzle exit necks, with a necking
position at the nozzle exit. Almost concurrent with the liquid column
stretching, a second necking point appears (image 5 in Fig. 2.23) at the top of
the column head. Finally, the liquid thread pinches off from the nozzle,
forming a free long liquid thread with a bulbous head [63]. Following the
pinch-off, the tail recoils toward the bulbous head, to reduce the surface
energy of the whole liquid column. As has been mentioned in above, there is a
new neck near the bulbous head. The new necking continues to evolve until
the liquid thread pinches off from the bulbous head, forming a primary droplet
and a new free thin liquid thread. The lower end of this liquid thread recoils
rapidly toward the upper end, again, to reduce the surface energy of the thread.
Depending on its length, this new liquid thread may shrink into a smaller
droplet (or satellite, image 16 in Fig. 2.23), or break up into two or even more
droplets [63].

Chapter 2: Literature Review
43 of 176
Fig. 2.23: Sequence of images of DOD droplet formation for water [63].
To conclude, the main reason for satellite generation is due to the existence
and later break up of a long liquid thread which connecting the bulbous head
with the nozzle exit, before the liquid column pinching off from the nozzle.
Dong et al. [63] predicted that this liquid thread would contract and combine
into the bulbous head without breaking up if the length of liquid thread at
pinch-off, lb, does not exceed a limiting value .
(2.10)
(2.11)
(2.12)
where is the nozzle radius, is a constant for water, is the first pinch-
off time, is the second pinch-off time, is the ejection time (time from
emergence of liquid form the nozzle until the ejected volume reaches its
maximum), is the capillary time. is the grow rate of the most
unstable disturbances. To suppress satellite droplets formation, a bigger is
desired. According to Dong et al., this can be achieved by increasing liquid
viscosity and decreasing surface tension, or optimize the piezoelectric
waveform. Another common attempt to eliminate satellite droplets generation
is to reduce the magnitude of the piezoelectric pulse, which will decrease the

Chapter 2: Literature Review
44 of 176
droplet ejection velocity and may shorten the liquid thread. However, droplets
with low jetting velocity suffer from the droplet scattering and the loss of
accuracy in positioning [66].
As can be imaged, the formation of the liquid thread connecting the primary
droplet and the nozzle exit is related to the physical properties of the liquid
itself. Shore et al. [65] found that by adding small amounts of polymers in
Newtonian solvents, satellite droplets generation were effectively eliminated.
This is understandable as when the polymer molecules are stretched out during
the droplet formation, the elasticity of the solution will cause the liquid thread
which connecting the primary droplet and the nozzle to snap back and
combine with the primary droplet, forming a monodisperse droplet. While
remember that this liquid thread normally pinches off from the primary droplet
and breaks up into satellite droplets for a purely Newtonian fluid. Shore et al.
also found that to efficiently suppress satellite droplets formation, there was a
minimum required concentration for the polymers to be added, for a fixed
molecular weight. Consequently, the resultant elasticity of the solution will
increase and a stronger piezoelectric pulse is required to eject the droplet. The
solution containing polymers will also have a longer liquid thread, a longer
droplet separation time, and a lower droplet velocity as compared to the purely
Newtonian fluids with similar shear viscosity [65]. Furthermore, the method
requires the change of the ink properties, which might be undesirable for
practical applications.

Chapter 2: Literature Review
45 of 176
2.2.2 Printhead Fabrication
2.2.2.1 The Overall Printhead Structure
Fig. 2.24: Different kinds of commercial printheads.
Currently, printheads for research purposes can be bought from companies
such as Microdrop and Microfab. Fig. 2.24 shows several dispensers from
these companies. Regardless of the internal components it contains, the basic
design idea for all the squeeze mode piezo-driven printhead is the same. Fig.
2.25 schematically shows the construction of a typical piezoelectric squeeze
mode printhead. By using epoxy adhesive, a piezoelectric element is tightly
attached onto a conventionally used glass tube which with an orifice at one
end. When an electrical pulse is applied, the piezoelectric element will
contract inward, squeezing the glass tube as well as the liquid inside, and
ejecting a droplet from the nozzle. The piezo tube is made from a ceramic
material that changes shape when a voltage is applied to it. There are several

Chapter 2: Literature Review
46 of 176
kinds of piezoelectric ceramic materials: PZT-5H, PZT-5A, PZT-8 and PZT-4.
Different materials have different piezoelectric constants thus have different
stresses-strains relationships [67].
Fig. 2.25: Schematic of the construction of a piezoelectric squeeze mode DOD
printhead.
A new printhead with interchangeable nozzles will be designed in this study.
Accordingly, the printhead will be separated into two main parts: the printhead
chamber and the interchangeable nozzle.
2.2.2.2 Ejection Nozzle Requirements
Lee [68] claimed that an ideal ejection nozzle should have a tapered cross
section ending up in a short hole with an aspect ratio round one-to-one. The
purpose of the overall conical taper is to minimize the flow resistance without
compromising mechanical strength. To illustrate the effects of different aspect
ratios on nozzle behavior, three types of nozzles, a tapered one with a
proposed aspect ratio, a very thin one and a very thick one, are compared. As
shown in Fig. 2.26, the left one in a proposed geometry works properly during
the droplet generation cycle. However, air can be easily sucked into the ink
chamber for the second nozzle, during the fluid withdrawal phase. The
existence of air bubbles will cause an increase in the ejection threshold due to
air bubbles absorbing the pressure impulse which is supposed to squeeze out

Chapter 2: Literature Review
47 of 176
the ink. Worst case is the stop of jetting due to big air bubbles inside the ink
chamber. Air entrapment will not occur for the nozzle has a high aspect ratio,
as the third nozzle shown in the figure. However, the local flow resistance is
too much for this nozzle and thus will also raise the threshold for jetting. To
conclude, a desirable nozzle should have an orifice shape similar to that of the
first one.
Fig. 2.26: Ejection nozzle orifice cross section requirements.
2.2.2.3 Ejection Nozzle Fabrication Methods
Various techniques can be used to fabricate small holes. A definitive paper on
such techniques is published by [69].
Thermally Tapered Glass Pipettes:
By simply heating a glass tube and pulling it while hot, a closed cone with an
included angle will come out. This closed end is then polished until a hole of a
desired diameter is produced. All the nozzles of the printheads shown in Fig.

Chapter 2: Literature Review
48 of 176
2.24 are fabricated by this method. It is a simple and low-cost fabrication
method. Meanwhile, it has following disadvantages. Firstly, it is difficult to
achieve a perfectly axially symmetric nozzle, due to the polishing of a conical
tip. This asymmetric nozzle will produce offset jets, which will destroy the
accuracy of printing, especially when the jetting velocity is relatively low.
Furthermore, glass material is so fragile that a simple touching or wiping the
nozzle tip against a rigid object may destroy the orifice and, again, lead to an
asymmetric nozzle. Secondly, the fabrication method is so sensitive to the
heating process that it is virtual impossible to replicate the exact profile of the
nozzle. This nonuniformity is obviously undesirable for industrial applications
that require parallel, identically operating channels of interchangeable spare
units [68]. For these reasons, a silicon micromachining method is proposed for
fabricating inkjet nozzles.
Silicon Micro-Machined Nozzles:
For crystal wafers, slice orientation is used to denote the crystallographic
orientation of their surface. It is well-known that there are three most common
used slice orientations for silicon wafers: (100), (110) and (111). Accordingly,
the surfaces perpendicular to such orientations are denoted by (100) plane,
(110) plane and (111) plane, respectively. For a (100) silicon wafer, such
orientations and planes are shown in Fig. 2.27. Wet orientation-dependent
etches (ODEs) can be used to etch silicon wafers for nozzle fabrication. It is
an anisotropic etching method at rates that vary with crystallographic direction
[70]. For example, for KOH etching at 85 ˚C,
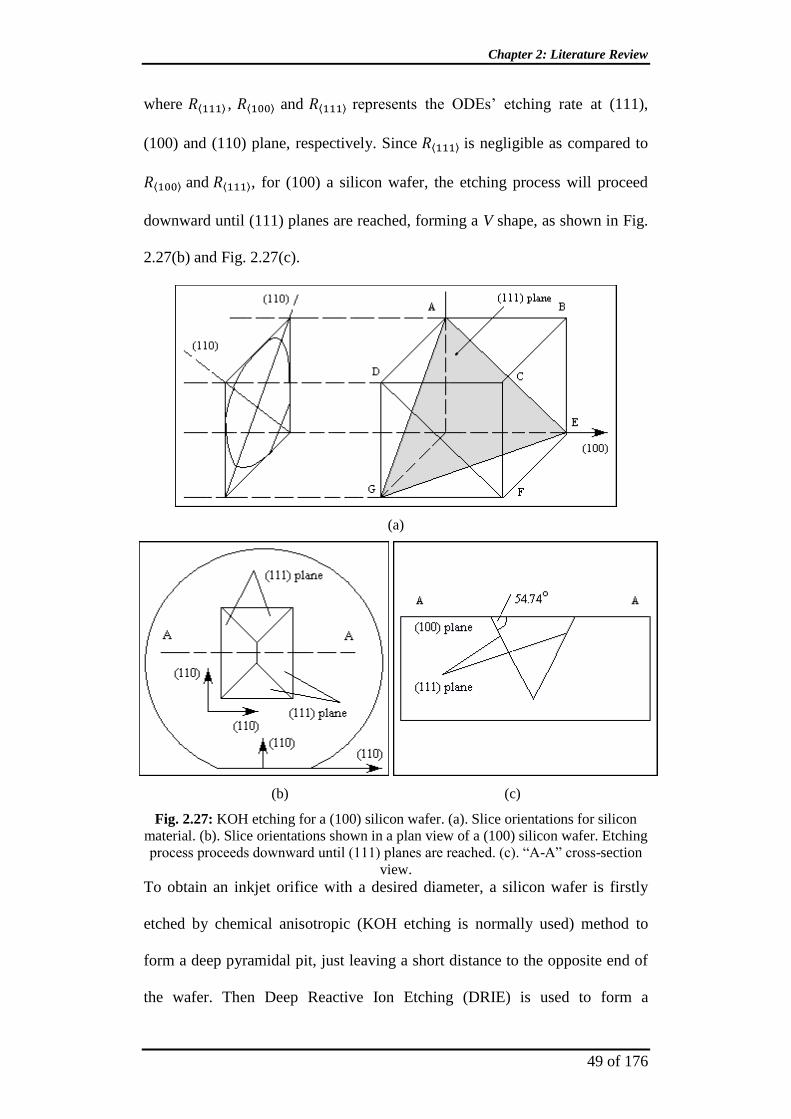
Chapter 2: Literature Review
49 of 176
where , and represents the ODEs’ etching rate at (111),
(100) and (110) plane, respectively. Since is negligible as compared to
and , for (100) a silicon wafer, the etching process will proceed
downward until (111) planes are reached, forming a V shape, as shown in Fig.
2.27(b) and Fig. 2.27(c).
(a)
(b) (c)
Fig. 2.27: KOH etching for a (100) silicon wafer. (a). Slice orientations for silicon
material. (b). Slice orientations shown in a plan view of a (100) silicon wafer. Etching
process proceeds downward until (111) planes are reached. (c). “A-A” cross-section
view.
To obtain an inkjet orifice with a desired diameter, a silicon wafer is firstly
etched by chemical anisotropic (KOH etching is normally used) method to
form a deep pyramidal pit, just leaving a short distance to the opposite end of
the wafer. Then Deep Reactive Ion Etching (DRIE) is used to form a

Chapter 2: Literature Review
50 of 176
cylindrical aperture of a desired diameter through this thin layer, as shown in
Fig. 2.28.
(a)
(b)
Fig. 2.28: Nozzle fabricated by silicon micromachining method comprising KOH
etching and Deep Reactive Ion Etching. (a). Plan view of the etched wafer. (b). “A-
A” cross-section view of the etched wafer.
The optimal thickness of this thin plateau, or the optimal thickness of the
aperture, is determined by the diameter of the orifice. An aperture thickness of
one to two orifice diameters is sufficient to suppress air entrapment. Another
concern is the thickness of this plateau should be enough to ensure sufficient
mechanical strength, avoiding nozzle damage due to the common nozzle
cleaning process such as being immersed in an ultrasonic bath, or the
accidental touching of the nozzle against a rigid object [68].

Chapter 2: Literature Review
51 of 176
Silicon micromachining method is more complicated and more costly as
compared to the glass heating and pulling method; however, the method
provides good mass productability and exact reproducible desired nozzle
profile for large production runs [71-73].
Electro-Discharge-Machining (EDM)
In EDM method, a spark discharge between a cutting electrode and the
workpiece is utilized to remove material. EDM can cut extremely hard
material to very close tolerance, but it also has the disadvantages of inability to
cut non-conductive materials and a slow cutting rate.
Laser Drilling
To date, laser drilling can produce holes as small as 1 micron. Due to its non-
contact feature, it can drill holes on curved surfaces and can handle both hard
and soft material.
Plenty of methods have been adopted to fabricate nozzles for inkjet purpose.
This research is more concentrated on the fabrication of glass nozzles.

Chapter 2: Literature Review
52 of 176
2.3 Creation of Ultra-Small Droplets
2.3.1 Needs for Generation of Ultra-Small Droplets
The manufacture of flat panel displays (FPD) for computer monitors and
televisions are a $ 60 billion industry. The state-of-the-art facilities are capable
of fabricating panels on ~ 2 m × 2 m substrate, and the substrate size has
doubled every two to three years since 1990 [44]. Traditional display
manufacturing utilizes photolithography techniques, which is a well-
established patterning method for silicon integrated circuits (ICs). However, to
build the photolithography and etching systems for huge substrates is
challenging and extremely expensive. From this viewpoint, emerging direct
printing of functional electronic materials [74-77] has attracted consideration
attention. Inkjet printing is a data-driven direct-write method without the
complicated photolithography and etching processes, thus leading to a great
reduction in manufacturing cost and processing time.
However, the requirements for patterning display pixel are more challenging
than the traditional document printing: a document pixel element is formed by
a drop of ink, while a display pixel is a circuit comprising different materials
[44]. Currently, there is a wide gap between the resolution required for display
manufacturing and the resolution of a typical inkjet device. Consequently, a
more precise ink jet system that capable of producing subpicoliter or even
subfemtoliter droplet is required. It is also the most critical requirement for
applying inkjet printing to the fabrication of high-performance electronics

Chapter 2: Literature Review
53 of 176
devices, in where thin-film transistors (TFTs) with a channel length of 1 to 2
µm is commonly required [78, 79].
Fig. 2.29: Schematic of photolithographically predefined inkjet printing. (a).
Schematic diagram of high-resolution inkjet printing onto a prepatterned substrate.
(b). AFM showing accurate alignment of inkjet-printed PEDOT/PSS source and drain
electrodes separated by a repelling polyimide (PI) line with L = 5 µm. [20]
Actually, several methods have been proposed and verified to eliminate such a
gap between the resolution required for those high-performance electronic
devices and the typical resolution of conventional inkjet printing devices. For
example, photolithographically predefined features [18, 20, 80, 81] or surface
pretreatment [15, 82] in the form of hydrophobic and hydrophilic patterns can
confine and guide the flow and spread of the printed droplets when they land
on the substrate. As shown in Fig. 2.29(a), a photolithographically predefined
substrate was fabricated as follows: a glass substrate with a 500 Å
hydrophobic polyimide film was spin-coated with photoresist. The photoresist
above the source-drain regions on the bare glass was removed and the
corresponding parts of polyimide were etched through. Then Oxygen plasma
was used to burn up the hydrophobic groups of the source-drain regions and
make it hydrophilic, whereas the polyimide line (PI line in Fig. 2.29(a))
defining the thin film transistor channel was still covered and protected by
photoresist and remained hydrophobic [20]. Lines of PEDOT droplets were

Chapter 2: Literature Review
54 of 176
deposited into the source-drain regions at a distance d from the mid polyimide
line. This distance d was small enough to ensure that the spreading droplets
could reach the repelling line. Atomic force microscopy (AFM) showed that
the deposited PEDOT electrodes extended accurately up to the repelling
polyimide line, without destroying the narrow gap (5 µm) between them.
With above methods [15, 18, 20, 80], the gaps between printed droplets can be
controlled at the submicrometre level, which is important for electronics
fabrication as such gaps define the transistor channel lengths. However, above
methods do not offer a universal approach to high resolution. Furthermore,
complicated photolithography and etching processes are required to deal with
the substrate. By this token, reducing droplet size maybe the most general and
direct way to obtain high printing resolution. Actually, inkjet printing
technology is also developing at a rapid pace and the size of the dispensed
droplets halved every four-and-half years during the last two decades, in a way
similar to Moore’s Law for transistors [83]. Thus, it can be foreseen that a
more precise inkjet system that is capable of producing ultra-small droplet will
be designed and fabricated in the near future.

Chapter 2: Literature Review
55 of 176
2.3.2 Methods for Printing Ultra-Small Droplets
2.3.2.1 Reducing Nozzle Size
Typically drop-on-demand systems eject droplets with the radius roughly the
same as the radius of the nozzles. To date the most direct and reliable way of
reducing the droplet volume has been reducing the orifice size. Wang et al.
[19, 58] have demonstrated the fabrication of inkjet nozzles with orifice size
as small as 2.5 µm, based on silicon micro-machining technology. Their
printhead was composed of a large array of inkjet devices, operated in the
thermal bubble mode. Stable generation of water droplets down to 3.5 µm has
been demonstrated. Kung et al. [84] have reported the generation of 3 to 4 µm
water droplets by a piezo-driven printhead with a very small orifice measuring
only 1 µm in diameter. Their nozzle tips were fabricated by heating and
pulling 3-mm-diameter Pyrex tubing. The diameter of the dispensed droplets
reduced from 4 to 1 µm after a short travel distance (several millimeters), due
to evaporation. Although micro-scale droplets have been successfully
generated by reducing the size of the printhead orifice, the problem of
clogging and breaking of the nozzle becomes an obstacle to reliable operation.
Thus there is a need for effectively reducing droplet volume without reducing
nozzle radius in DOD inkjet printing.
2.3.2.2 Controlling of Waveform
The phenomenon of much smaller, faster droplets ejected from an inkjet
printhead with a relatively bigger orifice was firstly described by researchers
from Xaar. The mechanism was explained by Temple [85], who modeled the

Chapter 2: Literature Review
56 of 176
acoustic waves of the fluid in the printhead chamber and claimed that a special
configuration of interacting pressure pulses is responsible for the phenomenon.
Fig. 2.30: Schematic of pulse waveforms used for driving the inkjet printhead. (a). A
uni-polar waveform. (b). A bi-polar waveform. (c). The new waveform for small
droplet generation. [21]
Fig. 2.31: (a) – (c) Images showing appearance and disappearance of a tongue and
formation of droplet with a diameter similar to that of the nozzle. (d) – (f) Images
showing formation of a droplet with a diameter much small than that of the nozzle
orifice. [21]

Chapter 2: Literature Review
57 of 176
Later Basaran et al. [21] confirmed that droplet with one order of magnitude
reduction in its volume could be produced by judiciously controlling the
capillary, viscous, and inertial time scales that govern the flow within the
nozzle and the forming droplet. They investigated the effects of different piezo
driving waveforms on droplet formation. Their results show that as compared
to a conventionally used uni-polar signal (Fig. 2.30(a)), a bi-polar piezo (Fig.
2.30(b)) signal will cause a “tongue” protruding from the tip of the primary
droplet, as shown in Fig. 2.31(a). The tongue is resulted from a small volume
of liquid traveling at a high velocity relative to the surrounding liquid.
However, the tongue was found to be absorbed into the primary droplet later,
forming a droplet with a similar diameter to the nozzle orifice, as shown in Fig.
2.31(b). In order to suppress the formation of the large primary droplet and
help the tongue detaching from the primary droplet, a new waveform (Fig.
2.30(c)) consisting of a succession of three square-wave pulses is suggested.
As shown in Fig. 2.31(e), the tongue successfully detached from the primary
droplet, forming a much smaller droplet.
Similar effects of reducing droplet size are also found when utilizing M-
shaped, W-shaped, and other types of waveforms [23, 24, 25]. However, all
above methods only work over a limited range of Ohnesorge numbers [21] and
their effects are also limited: the diameter of the dispensed droplets can be
only reduced to a maximum of 60 % of the orifice diameter. Different methods
are required to reduce droplet size to micro-scale or even submicro scale.

Chapter 2: Literature Review
58 of 176
2.3.2.3 Electrohydrodynamic Jetting
Fig. 2.32: Schematic of an electrohydrodynamic jet system. [86]
Electrohydrodynamic jet (E-jet) process is a unique and versatile jet-based
technique, which utilizes electric field, rather than acoustic or thermal energy,
to create the fluid flow required for ejection of liquid [86, 87, 88]. Fig. 2.32
shows a schematic diagram of a typical e-jet system. It comprises of a liquid
reservoir, a pneumatic pressure controller connected to a needle, and a
grounded electrode located centrally below the needle. By applying a potential
difference between the needle and the grounded electrode, the liquid inside the
needle can be charged. This charged liquid exits the needle and enters the
high-intensity electric field, forming different liquid geometries from which a
jet or multi-jets, or even dispersed droplets evolve. The size of these jets or
droplets can be controlled by the intensity of the electric field, the liquid
properties, and the flow rate into the needle. As has been mentioned before,
conventional inkjet devices generate drops with diameter approximately the
same as that of the nozzle orifice. In contrast, e-jet does not suffer from this

Chapter 2: Literature Review
59 of 176
disadvantage and droplets of a few micrometers in diameter can be produced
from needles that are a few hundred micrometers in diameter.
To better understand the fundamental dynamics of this electric-field-driven
jetting behavior, sequential images of the liquid ejection process were
obtained by reference Marginean et al. [89] with a high-speed-video camera.
As shown in Fig. 2.33, the meniscus at the needle tip expands and contracts
periodically due to the electric field. Correspondingly, a complete jetting cycle
is divided into four stages: liquid accumulation, formation of the well-known
Taylor cone [90, 91], droplet ejection (or jet ejection), and relaxation. The
entire sequence takes about 0.5 ms.
During the first stage, the liquid accumulates at the end of the needle tip due to
the net flow from the liquid reservoir. The almost spherical meniscus indicates
that the surface tension is the dominant force during this stage. The application
of the electric field will cause mobile ions in the liquid to accumulate near the
surface of the liquid meniscus. Consequently, a tangential electrostatic stress,
known as the Maxwell stress [86], will be induced on the liquid surface, due to
the mutual coulombic repulsion between these ions. With the accumulation of
surface charges, the initial spherical meniscus changes its shape gradually into
a conical form under the tangential Maxwell stress, as shown in the second
stage. The decrease in the radius of curvature at the cone apex continues until
the Maxwell stress matches the maximum capillary stress. At sufficiently high
surface charges, the Maxwell stress overcomes the capillary tension and jet (or
droplets) ejects from the apex (the third stage, 252-412 µs) to expel some of

Chapter 2: Literature Review
60 of 176
these surface charges (known as the Rayleigh limit). Both the cone volume
and the charges decrease due to the ejection, resulting in a Maxwell stress less
than the capillary tension. As a result, the ejection stops; a fast retraction of the
liquid is observed and the cycle repeated, as shown in the fourth stage.
Fig. 2.33: Time-lapse images of the pulsating Taylor cone with the four stages of the
complete jetting cycle. Each frame is an average of 100 exposures with the same
delay. [89]
The above jetting process is well-known as the pulsating mode jetting. It is
found that at sufficiently high electric field, a stable jet mode could be
obtained, in which a continuous liquid stream rather than pulsating jet
emerging from the needle. Both jetting modes can be used for high-resolution
printing, while the pulsating mode jetting might be preferred in the sense of
jet-on-demand, as in drop-on-demand inkjet printing. Different research
groups [78, 86, 92, 93] have demonstrated the success of the method in

Chapter 2: Literature Review
61 of 176
patterning structures with critical dimensions as small as 1 µm, as shown in
Fig. 2.34.
Fig. 2.34: High-resolution e-jet printing with printed feature size smaller than 1 µm.
[86]
It is worth noting that the complete jetting cycle for above pulsating mode e-
jetting normally lasts for 3 to 10 ms [86], which corresponding to a maximum
jetting frequency of around 300 Hz. Unlike using DC high electric field in
pulsating jetting, there is another type of e-jet, the pulsed-voltage mode, in
which pulse waves of high voltage are used to switch electrohydrodynamic
force (“on” or “off”) [94, 95-98]. It also requires more than 3 ms [95] for
Taylor cone formation, after applying the pulsed voltage. Consequently, it is
also theoretically impossible to produce jets (or droplets) of a frequency
higher than 300 Hz. Kim et al. [99] demonstrated that this maximum jetting

Chapter 2: Literature Review
62 of 176
frequency could be increased to 5 kHz, by combining electrohydrodynamic
force and the mechanical actuation from a traditional drop-on-demand
printhead. The basic idea of this so-called hybrid jetting system (HJS) is: by
utilizing the expansion and contraction of the piezoelectric element, to
accelerate the “liquid accumulation”, “Taylor cone formation” and the
“relaxation” stages during the pulsating mode e-jetting. As a result, the jetting
frequency can be increased [100]. However, this hybrid jetting technique is
still of low throughput, as compared to the conventional drop-on-demand
inkjet which generally has a maximum jetting frequency above 10 kHz.
To conclude, the e-jetting technique allows the generation of ultra-fine
droplets (or jets) down to 1 µm; however, at the cost of reduced throughput.
Furthermore, it has rigid restrictions on the liquid to be used, such as the
conductivity and other physical properties.
2.4 Organ Printing - Science Rather Than
Fiction
Positioning of living cells in a desired pattern onto a substrate is extremely
important to cell-based technologies, including the fundamental investigation
of cell functions and tissue engineering [101, 102]. The more exciting thing is
that nowadays the self-organizing properties of cells and tissues are used by
material scientists and tissue engineer to build 3-D living structures, as shown
in Fig. 2.35. The generation of such structures forms the basis of tissue
regeneration and possibly, the fabrication of implantable organs [2].

Chapter 2: Literature Review
63 of 176
Fig. 2.35: Printed cells. (a). 3-D tube structure made from printed cells. The image
shows an inner layer of human umbilical endothelial cells (green) and an outer layer
of human aortic smooth muscle cells (red). (b). Printed yeast patterns after 3 days of
culture. [2]
2.4.1 How to Realize
Inkjet printing is a suitable candidate for organ printing. The power of inkjet
printing lies in its ability to deliver picoliter volumes of materials at high
speed and accuracy on a target interface (probably non-planar surface), and to
deliver active substances to a developing structure in a well-defined timing
sequence. By using different cell types as different bio-inks, and delivering
them to exact positions to mimic tissue structures of the original tissue, inkjet
printing offers a possible solution for building whole structures such as bone,
cornea, ligament, cartilage etc, to solve the organ transplantation crisis. It has
been used successfully in a similar manner for automated rapid prototyping
technology which precisely positions droplets onto a substrate. However,
printing living cells into a desired structure which can ultimately grow to an
implantable organ is a much more challenging task.

Chapter 2: Literature Review
64 of 176
Firstly, cells have to survival from the shear stress during the printing, and
keep their viability. Fortunately, to date, many different cell types have been
printed successfully by different printing methods and their viability has been
verified [3-10, 103]. By dispensing human fibroblast cells through a 60 µm
nozzle, Saunders et al. carried out a comprehensive study to investigate the
relationship between cell survivability and the inkjet printing parameters [9].
Their study supported previous claims [4, 5, 8, 10] that cell survivability was
not significantly affected by the printing process since cell survival rates only
fell from 98% to 94% when the excitation pulse was increased from 40 to 80
V. However, in all above studies, the printing process was carried out with
relatively bigger nozzle diameters (normally bigger than 60 µm) and lower
droplet velocities (1.0 to 3.0 m/s). These limitations may be of importance,
because the shear stresses, which are expected to be the main factor in the
killing of cells during the printing process, are proportional to the velocity
gradients within the nozzle. In fact, shear stresses have been studied
extensively to predict the damage of animal cells suspended in various laminar
or turbulent flows [104-107]. To conclude, high rate of cell death might be
possible during printing when smaller nozzle and high droplet velocity are
required.
After verifying viability of the printed cells, the second step towards organ
printing should be successful generating of 2D cell patterns. The number of
cells inside each printed droplet will be one important factor for reliable cell
printing, as “empty droplet” and cell-less droplets may be undesirable. For
well prepared cell ink, this number mainly depended on the cell concentration
of the cell ink as well as droplet volume [8, 103]. However, during the printing,

Chapter 2: Literature Review
65 of 176
cell agglomeration or sedimentation may be occurs [9, 108], thus undesired
variations in this number can be produced. The most direct and effective way
to avoid such “empty droplet” should be increasing cell concentration of the
cell ink. Another important issue is that the printed cells should be able to
adhere, spread and proliferate on the substrate. Thus cells are normally printed
on gels, such as alginate or collagen. Alginate has been increasingly utilized in
tissue engineering to support encapsulated cells and to regulate cells function,
in a manner similar to the extracellular matrices of mammalian tissues [109].
Alginate’s popularity comes from its advantages of biocompatibility,
nonimmunogenicity [110] and gentle gelling behavior [111]. However,the
major limitation to its use as extracellular matrices is that alginate does not
mediate mammalian cell adhesion [112, 113]. To promote cell adhesion within
alginate gel, ligands such as arginine-glycine-aspartic acid (RGD) [114-117],
GRGDY [118], KGD and VAPG [115] have been used. Collagen is another
widely used hydrogel with a number of advantages including biodegradability,
low immunogenicity and controllable stability. Furthermore, collagen contains
cell adhesion domain sequences such as RGD, thus can facilitate cell adhesion
for anchorage-dependent cell types [119, 120].
Thirdly, the most ambitious, also the most challenging step is to create 3D
living structures. The conversion from cell suspension into 3D organ
structures needs to be guided by 3D scaffolds as cells normally do not self-
assemble into organ-like structures [122]. There are two possible ways to
incorporate cells into such a scaffold. The first method is to create a
degradable 3D scaffold first, and then seed cells into it, as shown in Fig. 2.36.

Chapter 2: Literature Review
66 of 176
The scaffold has following important functions: serving as an adhesion
substrate for the cell, promoting cell proliferation and cell-specific matrix
production [123]; providing mechanical support in the initial tissue growth
stage; guiding the development of new tissues with appropriate function [124].
The porosity and the internal pore organization of the scaffold have an
important influence on its biodegradation dynamics, mechanical stability and
nutrient diffusion, as well as on cell migration [125]. Conventional methods
for fabricating scaffolds include phase separation [126], particulate leaching
[127], gas foaming [128], freeze-drying [129, 130] and electrospinning [131].
Fig. 2.36: 3D scaffold and the cells seeded into it. (a). A 3D scaffold fabricated by
rapid prototyping method. (b). Big view of the scaffold shown in (a). (c). Human
fibroblast cells seeded into a 3D scaffold, after 18 days of culture. [121]
Fig. 2.37: Fabrication of a scaffold by 3D plotting. (a). One layer. (b). Two layers.
[122]

Chapter 2: Literature Review
67 of 176
However, above processing methods have inherent limitations in precise
control of pore size, pore geometry, pore interconnectivity, spatial distribution
of pores, and construction of internal channels within the scaffold [123].
Different new techniques have been proposed to eliminate these limitations,
among them, a new Rapid Prototyping technology based upon 3D plotting
technology, was developed to produce scaffold with complex architectures
according to computer design [132]. A key feature of the technology is its
ability to create 3D structures from liquids and pastes in liquid media. As
shown in Fig. 2.37, by positioning individual microdroplets and in situ
bonding them, it is possible to layer-by-layer fabricate scaffolds with desired
interconnecting pore design, thus meeting the demands for cell attachment and
cell growth. Currently this method has been widely used for 3D scaffold
manufacture [123, 133, 134, 135].
It is worth noting that above method of creating 3D living structures is based
on the premise that seeding cells into porous biodegradable scaffolds will be
sufficient to generate organs. However, Boland et al. [136] claimed that there
were at least four limitations for the method:
cell penetration and seeding is still far from optimal;
organs generally consist of several different cell types, it is a
challenging task to “seed” different types of cells in specific positions
of the 3D scaffold;
the rigid, solid scaffolds are not optimal for engineering contractile
tissue, such as heart and vascular tubes;

Chapter 2: Literature Review
68 of 176
absence of vascularization is the main problem with using solid
scaffold seeding technology.
Consequently, there is an increasing interest in the using of the second method,
in which the 3D living structures is fabricated by directly incorporating cells
into the scaffold fabrication process. As shown in Fig. 2.38, cells and a kind of
“thermo-reversible” gel are positioned by inkjet printheads, to form alternate
layers onto a glass slide. This method is also termed as “organ printing” [137].
The closely packed layers will coalesce providing that the alternating layers
are thin enough. After the whole tissue grows up, the gel will degrade by
simply cooling it.
Fig. 2.38: Schematic diagram of organ printing. [138]
Herein the “thermo-reversible” gel, such as collagen, which behaves as
extracellular matrix (ECM) to build 3D structures for long-term culture
(similar to the 3D scaffold used in previous method), is generally squeezed out
[139] from the nozzle rather than ejected by a printhead. The reason why not
to directly print the thermo-reversible gel, or even straightforward, the cell-

Chapter 2: Literature Review
69 of 176
laden gel is that the conventional piezo-based (or thermal-based) inkjet
printhead is not easily adapted for solutions with high viscosity such as
collagen. Solutions with quite low concentration of collagen (normally less
than 0.5%, w/v), certainly, can be successfully printed, but is undesired when
acting as extracellular matrix. To overcome this limitation, one method is to
design and fabricate inkjet printhead that capable of printing liquids with high
viscosities [140]. Another method is to utilize liquid materials that capable of
solidifying after ejection, such as sodium alginate (SA) solution and
fibrinogen solution [141]. For example, cell-laden alginate can be printed onto
substrate which contains calcium chloride solution. Crosslink happens once
the two liquids meet together, and the crosslinked alginate is able to control
the position of the ejected cells.
Besides printing of cells, inkjet is also used to print different solutions [101],
polymers [142], proteins [143-145] and growth factors into the living-
structures, for mediating cell viability.
2.4.2 Challenges and Requirements
Although it has been widely acknowledged that “organ printing” is a
promising technology for creating 3D living structures, plenty of challenges
are still there and successful organ printing should most importantly fulfill the
following requirements:
Cells in suspensions tend to agglomerate over around half an hour, which will
lead to the non-uniformity in the cell ink. Moreover, bulks of cells can easily

Chapter 2: Literature Review
70 of 176
clog the nozzle of the inkjet printhead and interrupt the printing process. Thus
either the organ printing process should be rapid enough, or devices that can
eliminate cell agglomeration should be designed and equipped into the cell ink
chamber.
Despite the high resolution provided by inkjet printing method, it is difficult to
exactly control a number of cells in one droplet, especially when small nozzle
and/or low-concentration cell ink is used. To eliminate “empty droplet” and
cell-less droplets, cell concentration in the ink, or the ink concentration, should
sufficiently high.
Furthermore, cells should get rapid and continuous deposition and
solidification onto the thermo-reversible gel; the gel must provide adequate
mechanical support to the living structures; the gel should also allow adhesion,
spreading and proliferation of multiple cell types; sufficient oxygen and
nutrients have to be supplied to the cells which deep within the 3D structures;
the gel should degrade in a regular and predictable fashion; mechanical
strength of the grown-up tissue should also be considered as huge structure
might not be strong enough to hold together by itself once the gel is removed.
To conclude, despite the various existing challenges, “organ printing” is
feasible, fast-developing and predicted to be one of the most promising
technologies in tissue engineering. It uses the principle of cellular self-
assembly into tissues [146] and aims to build implantable organs to treat
diverse diseases such as cancer, loss of tissue function, or organ failure. “It is

Chapter 2: Literature Review
71 of 176
safe to predict that in the 21st century, cell and organ printers will be as
broadly used as biomedical research tools as was the electron microscope in
the 20th
century”. [137]

Chapter 3: Novel Printhead Design
72 of 176
3. NOVEL PRINTHEAD DESIGN
The design and fabrication of a PET/PTFE-based piezoelectric squeeze-mode
DOD inkjet printhead with interchangeable nozzles is presented in this section.
The two methods, heating and pulling glass tubing, and silicon micro-
machining, which are used to fabricate nozzles for the printhead, will also be
reported. The characteristics of this novel printhead are studied by dispensing
glycerin-water solutions and non-Newtonian sodium alginate (SA) solutions,
and the experiment results with discussions are also documented in this
section.
3.1 Introduction
As has been mentioned before, due to its unique advantages, the application of
DOD inkjet printing technology has been expanded from conventional graphic
printing to new areas, such as fabrication of integrated circuits (ICs) [20, 147],
LED [44], rapid prototyping (RP) [148], MEMS, cell printing [2, 8, 9] and
drug delivery [149]. Accordingly, the dispensed liquids have been expanded
from the conventional pigmented ink (or standard dye-based ink) to polymers
[12, 150-152], gels, cell ink or other materials which often have higher
viscosities or even contain large particles or cells. Consequently, the
traditional inkjet printer designed for graphic printing is unable to fulfill the
new challenges, one of which is to dispense fluids of very high viscosities. For
most of the commercial inkjet printheads supplied by companies like
Microdrop, Microfab, Dimatix and XAAR, only liquids with viscosities lower
than 20 cps [12] can be consistently dispensed. Fluids with even higher

Chapter 3: Novel Printhead Design
73 of 176
viscosities have to be diluted before printing or warmed up during the printing,
which will adversely affect the properties of the liquids.
Another challenge is raised by nozzle clogging. Fluids containing particles, or
cells, can easily block the nozzle orifice, resulting in time-consuming nozzle
cleaning or even damage of the entire conventional printhead. To solve the
problem, the easiest way is to use a nozzle with a bigger orifice, as bigger
orifices are less likely to clog. However, this is often not desirable in inkjet
printing as bigger nozzles result in bigger droplets and lower printing
resolution. In [21], Chen and Basaran reported that by judiciously controlling
the piezoelectric parameters governing the flow within the nozzle and thereby
the drop formation, droplets with diameters less than 40% of the orifice
diameter could be produced. A similar study was carried out by Goghari and
Chandra [22]. These studies reveal a possible way to solve this nozzle
clogging problem without sacrificing printing resolution. However, their
methods only work over a limited range of Ohnesorge numbers.
The poor printability and nozzle clogging may result in unreliable or failed
dispensing when using the traditional inkjet printhead design for complex
liquids.
In this section, we will present an in-house-developed PET/PTFE-based
piezoelectric squeeze mode inkjet printhead with an interchangeable nozzle
design. PET (polyethylene terephthalate) tubing, comprising of a much softer
material, is used as the printhead chamber to substitute for the conventionally

Chapter 3: Novel Printhead Design
74 of 176
used glass tubing [140]. Liquids with viscosities of up to 100 cps have been
successfully dispensed by this novel printhead. When strongly corrosive inks
are involved, Teflon tubing is served as the printhead chamber. The
interchangeable nozzle design allows one to easily clean or change the
clogged or damaged nozzle, avoiding the destruction of the whole printhead
assembly.
3.2 Printhead Fabrication
Fig. 2.25 schematically shows the construction of a traditional piezoelectric
squeeze mode printhead. By using epoxy adhesive, a piezoelectric element is
tightly attached onto a glass tube which with an orifice at one end. When an
electrical pulse is applied, the piezoelectric element will contract inward,
squeezing the glass tube as well as the liquid inside. In order to eject a droplet
from the orifice, the volume change within the piezoelectric transducer, due to
the electrical pulse, must exceeds the volume of liquid to be ejected.
Furthermore, the volume change must be sufficient to develop enough
pressure inside the liquid to overcome the surface tension at the orifice. The
fractional volume change due to the piezoelectric effect is approximately:
(3.1)
where d31 is the piezoelectric strain constant, U is the applied voltage and t is
the thickness of the piezoelectric tube [61]. The negative sign indicates
contraction when the applied pulse has the same polarity as the original
polarizing voltage for the piezoelectric element. Equation 3.1 shows that the
printability of a printhead is mainly depended on the piezoelectric strain
constant and the geometry of the piezoelectric transducer. In this study, we

Chapter 3: Novel Printhead Design
75 of 176
focus on how to improve the printability of piezoelectric squeeze printheads
without pursuing high piezoelectric strain constant. All the piezoceramic tubes
(PZT-5H, from Boston Piezo-Optics Inc.) have the same piezoelectric strain
constant d31, approximately -275×10-12
m/V, at 25 ˚C.
The basic idea is to reduce the energy loss during the deformation of the liquid
chamber, by replacing the traditionally used glass tube with PET or Teflon
tube. Accordingly, the printhead is divided into two parts: a printhead chamber
and an interchangeable nozzle attachment fitted tightly to the chamber by
screw threading. These will now be described in turn.
3.2.1 Printhead Chamber
The design of the printhead chamber is illustrated in Fig. 3.1. The PET heat-
shrink tubing has a relative low shrinking temperature ranges from 85 ˚C to
190 ˚C. Thus a hair drier is recommended to be the heat source, rather than a
burner which could burn up the tubing if overheated. To get a uniform
shrunken tubing with a desired diameter, a steel tube with 4.9 mm OD is
inserted into the PET tubing during the heating process, as a mould. The PET
tube with 6.0 mm OD and 0.1 mm wall thickness (230400CHGS, from
Advanced Polymers, Inc.) is evenly heated, shrinking it to a tubing with
approximately 5.2 mm OD, so that it can fit exactly inside the piezoceramic
tube. This shrunken PET tubing is used as the inner wall for the printhead
chamber, which directly contacts with the liquid to be dispensed. By using
electrical conductive epoxy (CW2400, from ITW Chemtronics Inc.), the
shrunken PET tubing is glued to the inner wall of the piezoceramic tube (PZT-

Chapter 3: Novel Printhead Design
76 of 176
5H, from Boston Piezo-Optics Inc.) with 6.35 mm OD, 0.5 mm wall thickness
and 25.4 mm in length.
Fig. 3.1: The novel printhead. (a) Schematic showing of the design (out of
proportion). (b) A self-fabricated printhead following the novel design.
Teflon tubing serves as the printhead chamber when strongly corrosive inks
are involved, due to its perfect anti-corrsive property; however, it is such a
non-stick material to be directly bonded to the inner surface of the
piezoceramic tube. Fortunately, sodium-based chemical etchant can be used to
etch the surfaces of the Teflon material, to make it bondable to another
material. In this study, the PrimeEtch® Plus solution, provided by Plastomer
Technologies, an EnPro Industries company, is used as the etchant. Teflon
tubing (from Zeus, Inc.) with 5.22 mm OD and 0.25 mm wall thickness is
dipped into the etchant for 5 minutes. The etching takes place to a depth of a

Chapter 3: Novel Printhead Design
77 of 176
few hundred angstroms and modifies only the surface composition of the
Teflon tubing, leaving other properties of the tubing unaffected, even the
dimensions. The etched Teflon tube is then rinsed in alcohol for 2 minutes,
dried, and glued to the inner wall of the piezoceramic tube by using electrical
conductive epoxy (CW2400, from ITW Chemtronics Inc.), forming the
printhead chamber.
Fig. 3.2: Schematic showing the fabrication of the printhead chamber: (a) PET tube
before shrink. (b) Teflon tube before etching. (c) The steel tube used as a mould
during heating of PET. (d) PET tube after shrink. (e) Teflon tube after etching. (f)
Piezoelectric tube. (g) Shrunken PET tube bonded to the piezoelectric tube.
In the next step, two wires are separately attached to the inner and outer wall
of the piezoceramic tube by using electrical conductive epoxy, for connecting
the printhead to the piezo–driver, as shown in Fig. 3.2(g). Then the whole part
is fixed inside a brass housing by araldite epoxy adhesive for protection. The
solidified araldite epoxy can also prevent short circuit which can be caused by
liquid permeation to the piezoceramic tube. The two connecting wires are
pulled out through a hole in the housing, and the hole is also sealed with

Chapter 3: Novel Printhead Design
78 of 176
araldite epoxy, as shown in Fig. 3.1(b). An outside thread is cut on the bottom
of the brass housing for connecting the housing to the nozzle adaptor. Fig. 3.3
schematically shows the design of the brass housing and the nozzle adaptor.
Fig. 3.3: Schematic showing the design of the printhead housing and the nozzle
adaptor.
3.2.2 Interchangeable Nozzle Design
The glass nozzle is fabricated by heating and pulling a glass tube, as
demonstrated by Lee [68]. The setup is graphically shown in Fig. 3.4(a). A
glass tube with 5.0 mm OD and 3.5 mm ID is vertically fixed to a motor which
rotates the tube about its axis. By applying local heat to the lower section of
the rotating glass with a propane torch, the glass tube is melted at the location
of the flame, and pulled longer by the weight of its lower portion until it

Chapter 3: Novel Printhead Design
79 of 176
finally breaks into two parts, each of which contains a hollow cone with a
closed end. The closed end is then polished by fine sand papers until an orifice
of a desired diameter is exposed, as shown in Fig. 3.4(c). By this method,
orifices of 13 µm to 300 µm have been fabricated in this study. A similar
glass-fabricated nozzle was also adopted by Fan et al. [153].
Fig. 3.4: Fabrication of a glass nozzle by heating and pulling glass tubing. (a)
Drawing of the glass tubing heating system (out of proportion). (b) Glass tubing
containing a hollow cone with a closed end. (c) A 50 µm orifice fabricated by
polishing the end of the tubing showing in (b).
As recommended by Lee [68], to generate an axisymmetric conical nozzle
profile, the rotation speed of the motor is maintained around 600 rpm.

Chapter 3: Novel Printhead Design
80 of 176
Fig. 3.5: Fabricating glass nozzle by heating and pulling 1.0 mm glass capillary with
a micropipette puller. (a). The P-97 Flaming/Brown type micropipette puller. (b).
Heating the capillary. (c). Hit the sharp tip to from an orifice.
The major advantage of this nozzle fabrication method is ease of manufacture
and low cost. However, it is difficult to precisely control the taper angle of the
nozzle.

Chapter 3: Novel Printhead Design
81 of 176
Fig. 3.6: Different shapes of tips fabricated by the micropipette puller. (a). A too
“sharp” tip. (b). A tip with a moderate converging shape.
To eliminate this limitation, a professional micropipette puller (the P-97
Flaming/Brown type micropipette puller, from Sutter Instrument Company)
can be used to heat and pull the glass capillary (TW100-4, from World
Precision Instruments) with 1.0 to 2.0 mm OD diameter. As shown in Fig.
3.5(b), a glass capillary is inserted through the heating element. Two screws
are used to fix the two ends of the capillary. Two separate springs are
connected to the screws, thus the screws will pull the two capillary ends to
opposite directions. After setting a desired program, the capillary is heated and
pulled, breaking into two parts, each of which contains a hollow cone with a
sharp tip. The sharp tip is then hit by a heated hitting wire under microscope,
forming a tiny orifice, as shown in Fig. 3.5(c).
Using this method, a sharp tip with an outer diameter of even 60 nm can be
fabricated. However, such a sharp tip normally has a slender shape, as shown
in Fig. 3.6(a). It is not suitable for inkjet printhead nozzle usage as it has too
much flow resistance, which will lead to difficult jetting even failure of jetting.
Actually, the shape of the sharp tip can be controlled by setting different
program, in other words, by changing the heating temperature and the pulling
speed. Fig. 3.6(b) shows a desired tip shape for inkjet printhead nozzle

Chapter 3: Novel Printhead Design
82 of 176
application. The second tip has a moderate converging shape and will have a
lower flow resistance. However, in turn, leads to a relatively bigger orifice
diameter. A tip with an orifice diameter of 13 µm is shown in Fig. 3.7. Tip
with an orifice as small as 7 µm has been successfully adopted for jetting in
this study.
Fig. 3.7: A 13-micron-tip fabricated by the micropipette puller.
Fig. 3.8: Inkjet printhead nozzles fabricated from glass tube.
Fig. 3.1 also shows how the interchangeable nozzle design is implemented.
After being fixed to a short brass cylinder (Cap 2 in Fig. 3.1) by araldite epoxy
adhesive, the nozzle is placed inside another brass cap (Cap 1 in Fig. 3.1) that
has an inside thread which is tightly fitted to the outside thread of the

Chapter 3: Novel Printhead Design
83 of 176
printhead chamber. An O-ring must be used here to prevent cracking of the
nozzle from overtightening of the threads. Fig. 3.8 shows different glass
nozzles fabricated in this study.
Although tips with uniform shapes can be fabricated by this micropipette
puller, nozzles fabricated from such tips are normally quite fragile.
Furthermore, when it goes to the tip hitting process to form the orifice, non-
uniformity emerges again. To obtain mass productability and exact
reproducible desired nozzle profile for large production runs, silicon
micromachining method can be used [68].
3.3 Experimental Testing of the New Printhead
3.3.1 Experimental Setup
Experimental tests were carried out to investigate the characteristics and
repeatability of the PET/PTFE-based printhead, as well as to compare the
ejection capacity of the PET/PTFE-based and the glass-based printheads.
The experimental setup is comprised of an air compressor, a pressure regulator,
a liquid reservoir, a piezoelectric actuated printhead, a piezo driver, a
stroboscope light and a CCD camera, as shown in Fig. 3.9.
The fluid to be dispensed is filled into a 60 ml stainless steel reservoir which is
mounted on a XYZ motion stage. The combination of the air compressor and
the pressure regulator (AD 3000D, from Iwashita Instruments Pte Ltd.)

Chapter 3: Novel Printhead Design
84 of 176
provides a negative pressure in the reservoir to hold up and prevent the liquid
from leaking out of the orifice of the printhead. Before getting into the
printhead, the liquid is filtered by passing it through a syringe filter with 0.2
µm pore size membrane (Ref. 4652, from Pall Corporation) to remove large
particles which might block the nozzle. Electric signals are sent by a
JetDriveTM
III (from Microfab Technologies Inc.) to the piezoelectric
transducer, causing alternating expansion and contraction of the transducer as
well as the printhead chamber, ultimately, squeezing the liquid inside the
chamber and ejecting a droplet from the orifice.
The inkjet process is produced by a periodic driving voltage and the resulting
droplet ejection is repeatable from one droplet to the next. This allows for
stroboscopic imaging to determine the formation and the ejection velocity of
the droplets. Concurrently with the printing, signals are also sent by the driver
to a stroboscope (MS-200, from Nissin Electronic Co., Ltd.) which has pulse
duration of 2 s and is therefore capable of freezing an image of the high-
speed droplet with minimum blur. The droplet shape is illuminated by the
flashing of the strobe light and the images are captured by a JAI CV-A11
camera (from Ultravision Pte Ltd.). To determine the droplet velocity, the
stroboscope was operated at the same frequency as the printhead driver. By
varying the time delay between the signal for the stroboscope and signal for
the piezoelectric transducer, sequential images of the droplet during its motion
are captured with known time differences. The droplet velocity can then be
derived by dividing the spacing between the droplets by the time difference

Chapter 3: Novel Printhead Design
85 of 176
between two frames. Fig. 3.10 shows a representative typical droplet
formation sequence, the droplet is 50 µm and its velocity is 0.69 m/s.
Fig. 3.9: Schematic showing of the drop-on-demand inkjet printing system used in
the experiment.
Fig. 3.10: Image sequences showing the formation of a 50 µm droplet from a 36 µm
inkjet nozzle. The times shown are 0, 144, 322, 367, 389, 400, 522 and 1122 µs
relative to the first frame. The droplet velocity is here determined to be 0.69 m/s.
The droplet size is determined by two different methods, i.e. either measured
directly from the images, or by a weight method. In the latter method, printing
is carried out in a vapor-saturated environment to suppress the evaporation of

Chapter 3: Novel Printhead Design
86 of 176
the printed liquid, and then 7200 droplets are collected and then weighed for
each test condition. Droplet diameter can then be calculated from its weight
and the corresponding liquid density.
3.3.2 Experimental Conditions
The jet driver made by Microfab Technologies Inc. is able to send out voltage
pulses with designed profiles. Up to 12 points can be set to form the signal
waveform. Commonly used signals are of uni-polar, bi-polar or sinusoidal
shape. The maximum allowable amplitude and frequency for the pulse is ±140
V and 30 kHz, respectively.
Fig. 3.11: Schematic showing of the uni-polar pulse waveform.
Fig. 3.11 shows a uni-polar pulse employed in the experimental study. The
zero line represents the equilibrium state of the piezoceramic tubing, without
any external voltage. During the time of trise, the piezoceramic tubing expands
outward to its maximum inner volume and holds that state for a time of tdwell.
During the time of tfall, the piezoceramic tubing contracts inward, to its
equilibrium state. The expansion and contraction of the piezoceramic tubing
causes negative and positive pressure waves propagating and reflecting inside
the printhead, which ultimately leads to droplet ejection [52]. During all the

Chapter 3: Novel Printhead Design
87 of 176
experiments, trise and tfall were kept at 3 µs, which are the minimum permitted
values of the jet driver, with the purpose of introducing instant action of the
piezoeceramic tubing.
Static pressure needs to be applied to the reservoir, so that the liquid will not
flow out of the nozzle under the hydrostatic pressure. The negative pressure
applied to the reservoir was determined by direct observation showing no
liquid leaking and no air entertainment.
3.3.3 Testing Liquids
Fig. 3.12: Measured viscosities for different concentrations of sodium alginate
solutions. Measurement at 20 ˚C.
The conventional pigmented ink or standard dye-based ink for graphic printing
normally has a viscosity of less than 5 cps. However, to apply inkjet printing
in the new areas mentioned earlier, various complex liquids like polymers,
gels and other materials with much higher viscosities need to be effectively

Chapter 3: Novel Printhead Design
88 of 176
dispensed. Thus, two types of liquids are used to test the new printhead:
aqueous glycerin solutions with viscosities from 1 to 120 cps, and aqueous
sodium alginate (A2158, low viscosity, Sigma-Aldrich) solutions with
concentrations from 0.2% to 2.8% (w/v).
Aqueous solutions of sodium alginate were prepared by suspending the
polymer in distilled water. After 6 hours of stirring by a magnetic stirrer, the
solution was sterilized by sterile filtration, using 0.2 µm pore size membrane
filters. The filtration did not change the concentration of the solution as the
polymer has been totally dissolved.
The viscosity of the sodium alginate solutions was measured using the ARES
Rheometer (TA Instruments, Inc.). The geometry involved consists of two
parallel plates of 50 mm diameter with a gap of 0.5 mm. 1 ml sample was used
for each measurement. The shear rates ranged from 1.0 to 4000 s-1
. As shown
in Fig. 3.12, aqueous sodium alginate (A2158, low viscosity, Sigma-Aldrich)
solutions behave as Newtonian fluids at low concentration of 0.2% to 1.6%
(w/v) as the corresponding viscosities remain almost constant over a wide
range of shear rates (1.0 to 4000 s-1
). The solution shows significant shear
thinning behavior once the concentration exceeds 1.8% (w/v).

Chapter 3: Novel Printhead Design
89 of 176
3.4 Experimental Results
3.4.1 Comparison of PET/PTFE-Based and Glass-
Based Printhead
Fig. 3.13: Threshold voltages for PET-based printhead (–○–), PTFE-based printhead
(–*–) and glass-based printhead (–■–). Nozzle diameter is 119 µm.
The commercial printheads fabricated by Dimatix, XAAR, Microfab and
Microdrop can only dispense liquids with viscosity less than 20 cps [12]. In
our printhead design, PET or Teflon tubing was used as the printhead chamber,
but a separate glass-based printhead of similar configuration was also
fabricated for this study to compare the dispensing capacity of the new type
printhead and that of the glass-based printhead. Aqueous glycerin solutions
with viscosities from 1 to 120 cps were used for the test. Fig. 3.13 shows the
threshold voltage needed for dispensing glycerin solutions of different

Chapter 3: Novel Printhead Design
90 of 176
viscosities. During the printing, the same nozzle of 119 µm diameter was used
for both of the PET/PTFE-based and glass-based printheads.
It can be seen that the threshold voltage increases with the increase of fluid
viscosity, for all of the printheads. However, for the same viscosity, the
PET/PTFE-based printhead requires a much smaller threshold voltage than the
glass-based printhead. Furthermore, the PET/PTFE-based printhead can
dispense liquids with viscosity of up to 100 cps, which far exceeds the
performance of the glass-based ones which are typically used in commercial
printheads. The main reason for the lower voltage is that PET or Teflon is
much softer than glass. When an electrical pulse is applied, the liquid chamber
made of PET or Teflon tube is much easier to be squeezed by the
piezoceramic element, thus less energy will be dissipated in the deformation of
the liquid chamber. Consequently, a larger volumetric change will be achieved
in the liquid, leading to a better dispensing capacity.
Furthermore, from eq. 3.1, for the piezoelectric tubes of the same wall
thickness, the one with the larger diameter can generate a greater change in its
volume. This is the reason why the self-fabricating glass-based printhead can
only dispense glycerin solution with viscosity of 30 cps, which still exceeds
the limitation of most commercial printheads. However, when the diameter of
the piezoelectric tube increases, the diameter of the inner glass tube or
PET/PTFE tube should also increase. Glass material is quite stiff and brittle;
therefore, with the increase of its diameter, it becomes more fragile when the
same wall thickness is used. However, with a thicker wall, more energy is
absorbed in the glass and less volume change can be obtained. Fortunately,

Chapter 3: Novel Printhead Design
91 of 176
PET or Teflon is quite pliable; by adopting them as the printhead chamber, the
piezoelectric tube with a bigger diameter can be used to further improve the
printhead behavior for dispensing materials with high viscosity.
3.4.2 Effect of Pulse Width
For PET-based printhead, the effects of pulse width on droplet diameter and
droplet velocity were investigated by keeping the pulse amplitude constant at
50 V. Note that here the pulse width represents the duration of tdwell in Fig.
3.11. The jetting frequency was kept constant at 120 Hz. The PET-based
printhead and PTFE-based printhead behave almost the same, for
simplification, only the results for PET-based printhead will be represented
and discussed.
Fig. 3.14: Effects of pulse width on droplet velocity and droplet size. The pulse
amplitude is 50 V. Nozzle diameter is 119 µm.

Chapter 3: Novel Printhead Design
92 of 176
It is observed from Fig. 3.14 that both droplet velocity and droplet diameter
initially increase with the increase of pulse width. The maximum droplet
velocity 4.3 m/s is obtained when the pulse width reaches a value of 100 µs.
Then droplet velocity rapidly decreases with a further increase of pulse width,
reaching a minimum value of 1.2 m/s at 360 µs pulse width. The increase of
droplet diameter continues until the pulse width is 120 µs. Then the droplet
diameter is almost constant at a value of 188 µm until the pulse width reaches
270 µs, followed by a dramatic fall to the value of 135 µm. Both the droplet
velocity and droplet diameter reach a near constant value after the pulse width
exceeds 420 µs. With further increase of pulse width to 990 µs, air gets easily
sucked into the nozzle, leading to a slight decrease of droplet velocity and
droplet diameter.
According to De Jong et al. [154], there are two types or two reasons for this
air entrapment. In the first type, the air entrapment is often related to the
presence of an ink layer on the nozzle plate, especially for a nozzle plate
without hydrophobic treatment. Within this ink layer, dust particles, which are
deposited from the ambient air, can be transported toward the inkjet nozzle
[155]. The reason for this transport lies in the fact that: during the time trise and
tdwell, the piezoelectric element has expanded outward, resulting in a negative
pressure in the printhead which drives the ink (with the dust particles) toward
the nozzle. Furthermore, according to Beulen et al. [156], the jet of droplets
will transfer momentum to the ambient air, which will result in a suction of air
towards the jet. Friction between the ink layer and the air flow induced by the

Chapter 3: Novel Printhead Design
93 of 176
jet will also cause a flow of ink towards the jet nozzle. This so-called pulled
back flow will also cause the transport of particles toward the inkjet nozzle.
When the particles reach the jetting nozzle, they will cause a local surface
tension distortion and thus an asymmetry of the droplet formation. This
asymmetry of the retracted meniscus in combination with the next symmetric
pressure wave then will cause air entrapment [154, 157]. The entrained tiny
bubbles will oscillate and coalesce with the neighbouring bubbles, moving
along the inner wall of the printhead and growing through coalescence and
rectified diffusion, forming a bigger bubble [158]. When this bubble grows big
enough, normally much bigger than the diameter of the nozzle, it will absorb
too much of the pressure energy generated by the piezoelectric element and
thus stop the jetting. From this point of view, at a higher jetting frequency,
more particles are likely to be driven toward the nozzle, thus air entrapment is
more likely to happen.
In the second type, the air entrapment is also related to the presence of an ink
layer on the nozzle plate. A void is formed once the meniscus is pulled back,
due to the expansion of the piezo element. At the meantime, the pulled back
ink from the ink layer closes the void, forming an air bubble inside the nozzle.
In this experiment, the nozzle plate does not have any hydrophobic treatment,
thus a thin layer of ink will exist on the nozzle plate during printing.
Furthermore, the jetting frequency was kept constant at 120 Hz here, while the
air entrapment only happened when the pulse width exceeded 990 µs. Thus we

Chapter 3: Novel Printhead Design
94 of 176
would like to say that the air suction in this experiment belongs to the second
type of air entrapment. When a waveform of a very big pulse width is applied,
the piezoelectric element expands for a longer time. As a result, meniscus is
pulled too far into the nozzle during each dispensing process, allowing air to
be easily sucked into the nozzle, forming a void inside the nozzle. At the same
time, the pulled back ink from the ink layer on the nozzle plate closes the void,
forming an air bubble inside the nozzle. Finally, a much bigger air bubble is
formed inside the nozzle and totally stops the dispensing at a pulse width of
1160 µs. Single droplets without satellites can now be obtained in two ranges
of pulse widths: 25 µs to 32 µs, and 420 µs to 1130 µs.
3.4.3 Effects of Voltage Pulse Amplitude
Fig. 3.15: Effects of pulse amplitude on droplet velocity and droplet size. The pulse
width is 100 µs. Nozzle diameter is 119 µm.

Chapter 3: Novel Printhead Design
95 of 176
The effects of the pulse amplitude on the behavior of the PET-based printhead
were investigated by dispensing 5 cps aqueous glycerin solution through a 119
µm nozzle. From Fig. 3.14, it can be seen that the optimal tdwell for generating
a high velocity droplet is 100 µs. Herein the tdwell was kept constant at 100 µs.
The pulse amplitude was varied to the maximum which can be generated by
the jet driver, i.e. 140 V. The jetting frequency was kept constant at 120 Hz.
As shown in Fig. 3.15, both drop velocity and drop volume increase initially
with an increase of pulse amplitude. However, single droplets can only be
obtained using pulse amplitudes from 21 to 40 V. Further increase in pulse
amplitude generates a primary droplet followed by a small satellite droplet.
This is understandable as a higher voltage causes a bigger volume change
within the piezoelectric element, thus a longer column of liquid squeezed out
and a satellite will be generated. The satellite droplet becomes bigger and
tends to break into multiple satellite droplets as the pulse amplitude is further
increased. The maximum droplet velocity is 3.24 m/s and the droplet diameter
varies from 150 µm to 200 µm.
A slight decrease in droplet velocity is observed once pulse amplitude exceeds
76 V. The reason for this decrease lies in the fact that: during the time trise and
tdwell, the piezoelectric element has expanded outward, resulting in a negative
pressure in the printhead which causes the meniscus to move into the nozzle.
When very high voltage is applied, the piezoelectric element expands more.
As a result, meniscus is pulled too far into the nozzle during each dispensing
process, allowing air to be easily sucked into the nozzle. The sucked air forms

Chapter 3: Novel Printhead Design
96 of 176
small air bubbles inside the nozzle which leads to the decrease of droplet
velocity [159].
3.4.4 Nozzle Size
For a specific printhead with a fixed nozzle size, it is of interest to determine
the smallest droplet and the biggest droplet that can be generated.
Eight different nozzle sizes were investigated for this printhead. For each
nozzle size, the pulse width was 22 µs. Then the pulse amplitude was slowly
increased from 10 V to 140 V in steps of 1.0 V, until the liquid can be
regularly dispensed. The corresponding droplet diameter is recorded as
indicating for the smallest single droplet. The pulse amplitude was further
increased, until satellite droplet was generated along with the main droplet.
Then the pulse amplitude was decreased by 1 V step length and droplets were
collected. Droplet diameter was calculated and recorded as that for the biggest
regular droplets, i.e. without a satellite.
To determine the largest droplet, irrespective whether a satellite was produced,
a different approach was used. In accordance with the results of Fig. 3.14 and
Fig. 3.15, to obtain the biggest droplet diameter, the pulse amplitude was set to
be 140 V. The pulse width was increased from 25 µs to 625 µs at intervals of
50 µs. Droplets were collected and weighed to determine their size. The
biggest value among the 13 samples was recorded as the biggest droplet
diameter.

Chapter 3: Novel Printhead Design
97 of 176
Fig. 3.16 shows the relationship between the droplet size and the nozzle size,
for all nozzles tested. It is shown that all the above three types of droplet sizes
increase monotonically with increasing nozzle sizes. The droplets are always
larger than the nozzle diameter indicated by the broken line. An excellent rule-
of-thumb states that the droplets are between 120 to 220% of the nozzle
diameter.
Fig. 3.16: Effects of nozzle size on droplet diameter. (–*–) denotes the diameters of
the smallest single droplets can be generated; (–■–) denotes the diameters of the
biggest single droplets can be generated; (–▲–) denotes the diameters of the biggest
droplets which can be generated using the maximum voltage.
3.4.5 Repeatability
A good inkjet printhead should have nice repeatability, allowing generation of
a rapid sequence of droplets without big variation in droplet velocity and
droplet size. To test the repeatability of our novel PET-based printhead, water
was dispensed through a 119 µm nozzle. In accordance with Fig. 3.14, to
generate stable single droplets, the printing was carried out by using a signal

Chapter 3: Novel Printhead Design
98 of 176
of 50 V pulse amplitude and 600 µs pulse width. As shown in Fig. 3.17, over a
one hour test run at 120 Hz, the variation in droplet diameter is only 0.18%
and 0.46% for droplet velocity.
Fig. 3.17: Repeatability test of the PET-based printhead. Nozzle diameter is 119 µm.
3.4.6 Maximum Jetting Frequency
As a manufacturing tool, high speed jetting is required to increase productivity
of inkjet printing technology. For industrial printer with multi-nozzle, this can
be realized by increasing number of nozzles or increasing jetting frequency of
each nozzle. While for printhead with single nozzle, as designed in this study
(also for Microfab and Microdrop), jetting speed can only be improved by
increasing jetting frequency. However, for a reliable jetting, a subsequent
droplet should not be ejected until the pressure wave from the previous pulse
signal has sufficiently damped. This damping takes time and thus limits the
maximum jetting frequency [38]. For a specific printhead, its maximum jetting
frequency is mainly depended on the construction of the printhead as well as

Chapter 3: Novel Printhead Design
99 of 176
the driving signal [40]. Typical DOD printheads generate droplets at rates in
the range 0.1-10 kHz.
Fig. 3.18: Effects of jetting frequency on droplet velocity and droplet size. The pulse
width is 100 µs. The pulse amplitude is 30 V. Nozzle diameter is 119 µm.
If a droplet is ejected before the pressure waves from the previous pulse signal
have sufficiently damped, the new droplet ejection cycle will be affected by
the non-zero flow field inside the printhead. Consequently, the droplet velocity
and the droplet size will increase or decrease, depending on whether the
residual movement of the meniscus is in-phase or out-of-phase with the new
droplet ejection cycle [160].
Fig. 3.18 shows the effects of jetting frequency on droplet velocity and droplet
diameter, for the PET-based printhead. Printing was carried out by dispensing
water through a 119 µm nozzle. The tdwell was kept constant at 100 µs, the
optimal value for the printhead. The pulse amplitude was kept constant at 30 V.

Chapter 3: Novel Printhead Design
100 of 176
The printing was operated with a variation in frequency between 1 Hz to 5
kHz. It is shown that below 1.5 kHz, jetting frequency has relatively small
effects on drop velocity and drop diameter. The reason was that below this
frequency, there was sufficient time (670 µs, according to a jetting frequency
of 1.5 kHz) between droplet ejection cycles for the acoustic pressure waves to
get damped. Thus the droplet ejection cycles were independent of each other
and were irrelevant with the jetting frequency.
However, when jetting frequency exceeds 1.5 kHz, both drop velocity and
drop volume rapidly increase with an increase of jetting frequency. The
maximum droplet velocity 5.7 m/s is obtained when the jetting frequency
reaches a value of 2.1 kHz. Then droplet velocity decreases with a further
increase of jetting frequency. The increase of droplet diameter continues until
the jetting frequency is 2.3 kHz. Then the droplet diameter also decreases with
a further increase of jetting frequency. The dispensing is stopped at a
frequency of 3.7 kHz. The maximum jetting frequency of 3.6 kHz is higher
than that of the Microdrop printhead (2.0 kHz), while much lower than that of
the Dimatix, XAAR, and Microfab printhead (20 kHz).
The strong variation of droplet velocity and droplet diameter with changing of
jetting frequency indicates that, above 1.5 kHz, the time interval between two
consecutive droplet ejection cycles was not sufficiently long for the acoustic
pressure waves to get adequately damped. With the meniscus motion method
proposed by Kwon [161], one can estimate the time needed for the damping of
the pressure waves. For the printhead designed in our study, it has an optimal

Chapter 3: Novel Printhead Design
101 of 176
tdwell around 100 µs; and it takes around 800 to 1000 µs for the acoustic
pressure waves to get sufficiently damped. As a result, our printhead should
has a much lower threshold frequency [160], above which jetting frequency
will have great effects on droplet speed as well as droplet volume. This is
verified by the experiment results, as shown in Fig. 3.18. The threshold
frequency for the designed printhead is only 1.5 kHz.
The maximum droplet velocity is produced with a driving frequency of around
2.1 kHz, corresponding to the resonance frequency of the inkjet channel. This
resonance frequency is much lower as compared to other commercial
printheads. The reason is that the first mode resonance frequency of the
printhead is inversely proportional to the length of the pressure channel [160];
in the meantime, the designed printhead has a liquid channel of 50 mm length,
which is much larger than that of the commercial printheads. As a result, a
much lower resonance frequency is reasonably expected.
3.4.7 Jetting of Non-Newtonian Liquid
Aqueous sodium alginate (SA) solutions were used to estimate the printing
behavior for non-Newtonian liquid of our PET-based printhead. The threshold
voltages for different concentrations of SA solutions are compared with those
values for glycerin solutions (which have been shown in Fig. 3.13). To do the
comparison, the viscosity used for the non-Newtonian SA solutions is that
predicted from Fig. 3.12, corresponding to the mean shear rate of 1.0×10⁴ s
-1.
The selection of this mean shear rate to represent the real values is reasonable.
The reason is that the nozzle used in the test has a diameter of 119 µm, and the

Chapter 3: Novel Printhead Design
102 of 176
velocity of the liquid thread ejected from the nozzle is around 1.5 to 3.0 m/s
before the droplet formation. Thus the mean shear rate determined by ,
where v and r are the drop velocity and radius, respectively, does have the
order of 104
s-1
.
Fig. 3.19: Threshold voltages for sodium alginate solutions of concentrations from
0.2% to 2.8% (w/v).
Fig. 3.19 shows that for SA solutions, the threshold voltage increases from 13
V to 110 V when the SA concentration increases from 0.2% to 2.8% (w/v). In
the initial stage, for the same viscosity, the threshold voltage required by the
SA solution and glycerin solution is nearly the same. However, when the
concentration of the SA solution further increases to 2.0% (w/v), the SA
solution needs a larger threshold voltage than the glycerin solution having the
same viscosity, especially when the SA solution concentration exceeds 2.4%
(w/v). It is noticeable that although 110 cps glycerin solution is dispensable,
the dispensing of 3.0 % (w/v) SA solution with a viscosity of 63 cps failed.

Chapter 3: Novel Printhead Design
103 of 176
There is a big jump of threshold pulse amplitude from 58 V for 2.6% (w/v) SA
solution to 134 V for 2.8% (w/v) SA solution, despite that the viscosity
difference is only around 4 cps.
Fig. 3.20: Schematic showing of drop formation for 2.2% SA solutions.
The results indicate that during the inkjet printing, sodium alginate solutions
behave more like a Newtonian fluid when its concentration is below 2.0%
(w/v). However, with the increase of concentration, sodium alginate exhibits
more non-Newtonian behavior. The dispensing of non-Newtonian liquid
generates longer threads than the Newtonian fluids with similar viscosity [65],
which has been observed from the experiment. A droplet formation for 2.2%
(w/v) SA solution is shown in Fig. 3.20. It is shown that a quite long liquid
thread is formed before the droplet separation from the nozzle. The breakup of
the non-Newtonian liquid thread causes much energy dissipation due to the
elasticity in the fluid, leading to a significantly lower droplet velocity. For the
3.0% (w/v) SA solution, energy dissipation is so much that the dispensed

Chapter 3: Novel Printhead Design
104 of 176
liquid does not have enough kinetic energy to overcome the surface energy,
leading to the failure of droplet separation.
It also can be seen that the long liquid thread snaps back and combines with
the primary droplet, rather than pinching off from the primary droplet and
breaking up into a satellite droplet. The phenomenon verifies the previous
claim that an increase in elasticity of the solution will effectively eliminate
satellite generation [65].
3.5 Conclusions
A PET/PTFE-based piezoelectric DOD inkjet printhead with an
interchangeable nozzle design has been proposed and fabricated by the authors.
The printhead chamber is made of PET or Teflon tube, which is much softer
than the commonly used glass tube. The ejecting capacity of this novel
printhead has been compared with commercial printheads, and found to have
superior performance and versatility. Aqueous glycerin solutions with
viscosity as high as 100 cps have been successfully dispensed, while the
corresponding commercial printheads can only dispense liquids with
viscosities lower than 20 cps. PTFE-based printhead provides excellent anti-
corrosive property when strongly corrosive inks are involved. The
interchangeable nozzle design largely alleviates the difficulty in cleaning of
clogged nozzles and greatly reduces the occurrence of printhead damage. One
of the printhead which was fabricated in 2007 still works properly now The
effects of operating parameters, including voltage pulse amplitude, pulse

Chapter 3: Novel Printhead Design
105 of 176
width and jetting frequency, on droplet size and droplet velocity have been
characterized. The new printhead shows excellent repeatability.
Finally, non-Newtonian aqueous sodium alginate (SA) solutions with
concentrations from 0.2% to 2.8% (w/v) have been successfully dispensed.
For relatively low concentrations, the threshold voltages required by SA
solutions and glycerin solutions take nearly the same values, implying that the
printhead characteristics calibrated from dispensing Newtonian liquid can also
be used as a reference to predict dispensing of the non-Newtonian liquids.
However, for higher concentrations of the polymers there is a sharp transition
where printing can no longer be achieved.

Chapter 4: Forming A Fine Jet In Inkjet Printing
106 of 176
4. FORMING A FINE JET IN INKJET
PRINTING
The formation of fine jet during the piezoelectric DOD inkjet printing will be
presented in this section. An ultra-high-speed video camera is used to record
the fast jetting process. The characteristics of this fine jet are studied by
dispensing different concentrations of aqueous glycerin solutions, and the
experimental results are presented and discussed in this section.
4.1 Introduction
Jet eruptions from free liquid surface can be found in a number of flow
configurations. These include Worthington jets [162, 163], which are
generated by the collapse of an impact crater; granular jets, discovered by
Thoroddsen and Shen [164], which are generated by the impact of a solid
sphere onto a deep bulk of granular material [165, 166]; the Cavity jets [167,
168], which are produced inside cavitation bubbles when they collapse and are
capable of severely damaging a solid surface, such as the blades of turbines
and kidney stones; apex jets [169], and many other kinds of jets [170, 171, 172,
173].
Over the years, there has been a consensus that jet formation in many different
cases is related to a singularity on a free surface [174, 175]. Fig. 4.1 [168]
shows a micro-jet formed by impact of a tube filled with perfectly wetting
liquid, on a rigid floor. In the gravity-free reference frame, when the tube falls

Chapter 4: Forming A Fine Jet In Inkjet Printing
107 of 176
axially under its own weight, surface tension deforms its liquid interface into a
hemispherical shape. It is believed that the jet is generated by the violent
reversion of the interface curvature resulting from the impact. This is a typical
example to show that the jet formation is closely related to a singularity on a
free surface. Now it is quite interesting to us whether such needle-like jet can
also be produced by DOD inkjet printing, as the similar processes which
existing in a typical droplet ejection cycle: firstly an inwards hemispherical
meniscus is produced by the expansion of the piezoceramic element, then a
positive acoustic pressure generated by the contraction of the piezoceramic
element suddenly squeezes the liquid inside the printhead chamber, behaving
as the impact in Fig. 4.1. This is the part which will to be covered in the next
two subsections.
Fig. 4.1: Jet formation observed just after impact of the tube with a solid wall when
the free surface is initially deformed with a meniscus [168].

Chapter 4: Forming A Fine Jet In Inkjet Printing
108 of 176
4.2 Experimental Setup
Printing experiments were carried out by using the self-developed squeeze
mode piezoelectric inkjet printing system. The setup is almost the same as that
shown in Fig. 3.9. The only difference is that an ultrahigh-speed video camera
(maximum frame rate: 1,000,000 fps) developed by Etoh et al. [176] is used to
record the jetting process here. Eight different concentrations of aqueous
glycerin solutions will be used as the ink, to obtain a wide range of viscosities.
4.3 Experimental Results
The jets are classified into two types: Type I is the typical fine jet, and Type II
is the jet produced when there is a bubble locating inside the nozzle.
4.3.1 Jet I
Fig. 4.2 shows a typical process of Type I jet. In the first 4 frames, a backflow
is generated by the expansion of the piezo-element and air gets sucked into the
nozzle due to the negative pressure produced inside the liquid. Surface tension
forces deform this liquid interface into a spherical shape, or a partial cavity.
The later sudden contraction of the piezo-element squeezes the fluid and
induces pressure gradients which in turn produce a sudden change in the liquid
velocity, and, finally causes the collapse of the cavity and the generation of the
fine jet. The principle is similar to that of the cavity jet shown in Fig. 4.1. Here
the differences between these two jets are the way of generating the free
surface (with singularity) and realizing the sudden change in the velocity field,

Chapter 4: Forming A Fine Jet In Inkjet Printing
109 of 176
as well as the geometry of the liquid channels. Fig. 4.3 shows the converged
inner profile of the nozzle used for the experiments to study the fine jet.
Fig. 4.2: A 93 µm jet with a velocity of 7 m/s. The diameter of the orifice is 150
µm. Liquid used is 70% aqueous glycerin (w/w) solution. Printing parameters: bi-
polar piezo-driving signal with tdwell and techo equal to 700 µs; driving pulse amplitude
equals to 140 V. Negative pressure inside the reservoir is -2.2 kPa relative to the
atmospheric pressure. Images were taken at a frame rate of 8 kfps. Ambient
temperature is 25 ˚C.
As compared to the regular printing cycle shown in Fig. 3.10, here the time
durations for the expansion and contraction of the piezoelement are much
longer of around 700 µs. The jetting is found to be extremely sensitive to the
negative pressure in the reservoir which is used to hold up and prevent the
liquid from leaking out of the orifice of the printhead. Fig. 4.4 shows another
jet process almost under the same conditions as that one shown in Fig. 4.2. As
can be clearly seen, by slightly changing the negative pressure, a much finer
jet with a much higher velocity can be produced.

Chapter 4: Forming A Fine Jet In Inkjet Printing
110 of 176
Fig. 4.3: The 150 µm nozzle used for fine jetting experiments. The scale bar is 2 mm.
This image was taken when the nozzle was placed inside a 60% aqueous glycerin
(w/w) solution, which had an index of refraction similar to that of the glass.
Fig. 4.4: An 8 µm jet with a velocity of 29 m/s. is 150 µm. The liquid used is
70% aqueous glycerin (w/w) solution. Printing parameters: bi-polar piezo-driving
signal with tdwell and techo equal to 700 µs; driving pulse amplitude equals to 140 V.
The negative pressure inside the reservoir is -2.3 kPa relative to the atmospheric
pressure. Images were taken at a frame rate of 165 kfps. Ambient temperature is 25
˚C. The scale bar is 500 µm.
Fig. 4.4 also clearly shows the evolution of the cavity during the jet formation
process, as a much higher frame rate is used. Frames 1 and 2 record the
growth to maximum size of the cavity, as the liquid goes into tension due to

Chapter 4: Forming A Fine Jet In Inkjet Printing
111 of 176
the expansion of the piezo-element. When the positive acoustic pressure
arrives, the cavity rapidly collapses towards the free surface (start from frame
3 to frame 16), followed immediately by the formation of a downward thin
liquid jet which rapidly grows in length (frame 17). It can be seen that the
shock flattens the lower surface of the cavity. Similar jet behaviors have been
also reported by Barrow et al. [177], in their study of cavitation damage.
4.3.2 Type II Jetting from Entrained Bubble
Fig. 4.5: A 16 µm jet with a velocity of 35 m/s. is 150 µm. The liquid used is
70% aqueous glycerin (w/w) solution. Printing parameters: bi-polar piezo-driving
signal with tdwell and techo equal to 700 µs; driving pulse amplitude equals to 140 V.
Negative pressure inside the reservoir is -2.3 kPa relative to the atmospheric pressure.
Images were taken at a frame rate of 16 kfps. Ambient temperature is 25 ˚C.
The jet in Fig. 4.2 and Fig. 4.4 result from the collapse of a hemispheric crater.
In some cases, there is already an entrained bubble inside the nozzle before the

Chapter 4: Forming A Fine Jet In Inkjet Printing
112 of 176
actuation of the piezo-element, the second type of jet will occur. This earlier
bubble is entrained in the late stage of the previous droplet ejection cycle, due
to the long duration of the piezo expansion. As shown in Fig. 4.5, the
preexisting bubble coalesces with the new piezo-generated hemispheric crater,
forming a new cavity which finally collapses and produces the fine jet.
Fig. 4.6: A 10 µm jet with a velocity of 24 m/s. is 150 µm. The liquid used is
10% aqueous glycerin (w/w) solution. Printing parameters: bi-polar piezo-driving
signal with 450 µs tdwell and 70 µs techo; driving pulse amplitude equals to 140 V. The
negative pressure inside the reservoir is -2.3 kPa relative to the atmospheric pressure.
Images were taken at a frame rate of 27 kfps. Ambient temperature is 25 ˚C. The
scale bar is 500 µm.
Fig. 4.6 provides a close view for the cavities evolution inside the nozzle.
Frames 1 to frame 11 (a time duration of around 370 µs) record the growth to
maximum size of the piezo-generated cavity, as the liquid goes into tension
due to the expansion of the piezo-element. Concurrently, the preexisting

Chapter 4: Forming A Fine Jet In Inkjet Printing
113 of 176
bubble is slightly pulled up. Starting from frame 10, the piezo-generated
cavity contacts and coalesces with the preexisting bubble. The neck
connecting the two cavities grows rapidly as studied by Thoroddsen et al.
[178]. The neck shapes form perfect circular arcs (marked by a blue arrow), as
demonstrated in Frame 12. A crest is developed when these circular arcs meet
the undisturbed bubble, as marked by the green arrow. With the growing of
the neck, this crest moves up the bubble and generates a series of capillary
waves, which propagate along the bubble surface and converge at the apex,
and finally, leading to the pinch-off of the small bubble (as marked by the
green circles in frame 13 and 14). A similar pinch-off phenomenon during
bubble coalescence has been comprehensively studied by Zhang and
Thoroddsen [179], who also provided a nice view of the capillary waves
focusing at the bubble apex, at a slight downwards angle. Finally, the shock
waves produced by the piezo-element arrive and cause the collapse of the
coalesced cavity, bringing about the fine jet. The jet is expelled out of the
nozzle by the positive acoustic pressures.

Chapter 4: Forming A Fine Jet In Inkjet Printing
114 of 176
Fig. 4.7: A 9 µm jet with a velocity of 26 m/s. is 150 µm. The liquid used is
water. Printing parameters: bi-polar piezo-driving signal with 700 µs tdwell and 700 µs
techo; driving pulse amplitude equals to 140 V. The negative pressure inside the
reservoir is -2.3 kPa relative to the atmospheric pressure. Images were taken at a
frame rate of 330 kfps. Ambient temperature is 25 ˚C. The scale bar is 500 µm. (a).
The time interval between successive frames, dt, equals to 9.09 µs. (b). dt equals to
3.03 µs. (c). dt equals to 9.09 µs.

Chapter 4: Forming A Fine Jet In Inkjet Printing
115 of 176
Fig. 4.7: A 9 µm jet with a velocity of 26 m/s. is 150 µm. The liquid used is
water. Printing parameters: bi-polar piezo-driving signal with 700 µs tdwell and 700 µs
techo; driving pulse amplitude equals to 140 V. The negative pressure inside the
reservoir is -2.3 kPa relative to the atmospheric pressure. Images were taken at a
frame rate of 330 kfps. Ambient temperature is 25 ˚C. The scale bar is 500 µm. (a).
The time interval between successive frames, dt, equals to 9.09 µs. (b). dt equals to
3.03 µs. (c). dt equals to 9.09 µs.
Fig. 4.7 shows the details of the coalescence process with a very high frame
rate of 330 kfps. It is remarkable that we discovered that with the pinch-off of
the small bubble, a downward fine jet was produced simultaneously, as
marked by the arrows in Fig. 4.7(b). We conclude that this fine jet is different
from the one which produced by the cavity collapse. As shown in Fig. 4.2 and
Fig. 4.4, the cavity collapses when almost all the gas has been expulsed out of
the nozzle (frame 5 in Fig. 4.2); then the jet is produced (frame 6 in Fig. 4.2).
While here in Fig. 4.7(b), when this jet was produced (at frame 7 or frame 8)

Chapter 4: Forming A Fine Jet In Inkjet Printing
116 of 176
inside nozzle, the big coalescence-generated cavity was still far away from
collapsing. Thus we can conclude that rather than the cavity collapse, both the
small bubble pinch-off and the jet formation are consequences of the local
surface collapse during the radial focusing flow, perhaps in a singular (self-
similar) fashion, as schematically shown in Fig. 4.8. Similar free surface
geometries evolution has also been reported for others’ study of cavity jet [180]
and impact jet [171, 173]. Here we can name this jet as the “surfaces collapse”
jet, to differentiate it from the cavity jet.
Cavity collapse occurs only after frame 6 in Fig. 4.7(c), followed immediately
by the cavity jet. Frame 8 in Fig. 4.7(c) shows that this cavity jet finally
catches up and collides with the first jet, forming a much thicker jet with a
complicated structure. Fig. 4.9 provides a much more clear view of this
collision.
Fig. 4.8: Schematic showing the free surface shapes.

Chapter 4: Forming A Fine Jet In Inkjet Printing
117 of 176
Fig. 4.9: A 8 µm jet with a velocity of 28 m/s. is 150 µm. The liquid used is
water. Printing parameters: bi-polar piezo-driving signal with 500 µs tdwell and 500 µs
techo; driving pulse amplitude equals to 140 V. Negative pressure inside the reservoir
is -2.3 kPa relative to the atmospheric pressure. Images were taken at a frame rate of
330 kfps. The numbers of the frames shown in the figure are n = 1, 4, 7 …… 52.
Ambient temperature is 25 ˚C. The scale bar is 500 µm.
In Fig. 4.6 to Fig. 4.9, it was shown that a small bubble can be pinched off
during the coalescence of the two cavities, for the 10% aqueous glycerin (w/w)
solution and pure water. Fig. 4.10 shows a very complicated jetting process for
the 70% aqueous glycerin (w/w) solution. From Fig. 4.10(b), we can conclude
that the two cavities did not coalesce when they got into contact with each
other, as a balloon-like bubble was generated here. So the process evolved as
following: a piezo-generated cavity was sucked into the nozzle and got into
contact with a preexisting bubble, without coalescing with it. The later piezo-
generated radial focusing flow pushed out the lower cavity as well as the
lower cap of the preexisting bubble, forming the balloon-like bubble extending

Chapter 4: Forming A Fine Jet In Inkjet Printing
118 of 176
far out of the nozzle. This balloon-like bubble ruptures later close to its tip,
followed by a cavity jet which has been shown in Fig. 4.4.
Fig. 4.10: Images showing jetting produced when no coalescence happens between
the two cavities. is 150 µm. The liquid used is 70% aqueous glycerin (w/w)
solution. Printing parameters: bi-polar piezo-driving signal with 550 µs tdwell and 550
µs techo; driving pulse amplitude equals to 140 V. The negative pressure inside the
reservoir is -2.3 kPa relative to the atmospheric pressure. Images were taken at a
frame rate of 330 kfps. Ambient temperature is 25 ˚C. The scale bar is 500 µm. (a). dt
equals to 6.06 µs. (b). dt equals to 3.03 µs. (c). dt equals to 9.09 µs. (c). dt equals to
6.06 µs.

Chapter 4: Forming A Fine Jet In Inkjet Printing
119 of 176
Fig. 4.10: Images showing jetting produced when no coalescence happens between
the two cavities. is 150 µm. The liquid used is 70% aqueous glycerin (w/w)
solution. Printing parameters: bi-polar piezo-driving signal with 550 µs tdwell and 550
µs techo; driving pulse amplitude equals to 140 V. The negative pressure inside the
reservoir is -2.3 kPa relative to the atmospheric pressure. Images were taken at a
frame rate of 330 kfps. Ambient temperature is 25 ˚C. The scale bar is 500 µm. (a). dt
equals to 6.06 µs. (b). dt equals to 3.03 µs. (c). dt equals to 9.09 µs. (c). dt equals to
6.06 µs.
Fig. 4.11 shows another jetting process with almost the same conditions as that
in Fig. 4.10, but for a 30% aqueous glycerin (w/w) solution. It shows that the
cavity jet occurs much earlier for the less viscous solution. As a result, the
cavity jet pierced the balloon-like film before it becomes thin enough to
rupture on its own. For comparison, the similar jetting process for a much
higher viscosity liquid of 85% aqueous glycerin (w/w) solution is shown in
Fig. 4.12. Here the jet passed through the viscous film, without piercing it.

Chapter 4: Forming A Fine Jet In Inkjet Printing
120 of 176
Fig. 4.11: Images showing the cavity jet pierces the thin liquid film. is 150 µm.
The liquid used is 30% aqueous glycerin (w/w) solution. Printing parameters: bi-polar
piezo-driving signal with 750 µs tdwell and 750 µs techo; driving pulse amplitude equals
to 140 V. The negative pressure inside the reservoir is -2.3 kPa relative to the
atmospheric pressure. Images were taken at a frame rate of 330 kfps. Ambient
temperature is 25 ˚C. The scale bar is 200 µm. (a). dt equals to 6.06 µs. (b). dt equals
to 3.03 µs.

Chapter 4: Forming A Fine Jet In Inkjet Printing
121 of 176
Fig. 4.12: Images showing the cavity jet fails to pierces the cavity. is 150 µm.
The liquid used is 85% aqueous glycerin (w/w) solution. Printing parameters: bi-polar
piezo-driving signal with 650 µs tdwell and 650 µs techo; driving pulse amplitude equals
to 140 V. The negative pressure inside the reservoir is -2.3 kPa relative to the
atmospheric pressure. Images were taken at a frame rate of 330 kfps. Ambient
temperature is 25 ˚C. The scale bar is 200 µm. (a). dt equals to 18.18 µs. (b). dt equals
to 3.03 µs. (c). dt equals to 15.15 µs.
Fig. 4.13 shows a totally different kind of jet. It seems that two bubbles broke
up during the printing cycle, and the most interesting thing was that, there
emerged a long liquid thread between these two bubbles during the jetting. It
is also remarkable that following the bursting of the first bubble, an upstream
pressure wave was generated, which slightly deformed the lower head of the
liquid thread (as marked by the arrow in Fig. 4.13(a)).

Chapter 4: Forming A Fine Jet In Inkjet Printing
122 of 176
Fig. 4.13: A thin liquid thread generated during the jetting. is 150 µm. The
liquid used is 70% aqueous glycerin (w/w) solution. Bi-polar piezo-driving signal
with 550 µs tdwell and 550 µs techo; 140 V. The negative pressure inside the reservoir is
-2.3 kPa. Images were taken at a frame rate of 330 kfps. Ambient temperature is 25
˚C. The scale bar is 200 µm. (a). dt equals to 3.03 µs. (b). dt equals to 12.12 µs. (c). dt
equals to 6.06 µs.
It is obviously interesting to find out how this liquid thread was produced.
However, the initial stage is missing here in Fig. 4.13, because the ultrahigh-
speed video camera [176] used to capture the jetting process can only take 103
successive frames each time. Thus we captured another similar jetting process
with a slightly earlier camera trigger and the result is shown in Fig. 4.14. As
can be seen from frame 5 in Fig. 4.14(a), when the piezo-generated cavity gets
sucked into the nozzle, a bulk of liquid was captured between it and the
preexisting bubble. When the piezo-element contracted, the preexisting bubble
pushed this bulk of liquid, deforming the bottom of the piezo-generated cavity,
and finally expelled the liquid out of the nozzle, forming a long liquid thread.

Chapter 4: Forming A Fine Jet In Inkjet Printing
123 of 176
Fig. 4.14: Images showing the interaction between the piezo-generated cavity and the
preexisting bubble inside the nozzle. is 150 µm. The liquid used is 75% aqueous
glycerin (w/w) solution. Printing parameters: bi-polar piezo-driving signal with 550
µs tdwell and 550 µs techo; driving pulse amplitude equals to 140 V. The negative
pressure inside the reservoir is -2.3 kPa relative to the atmospheric pressure. Images
were taken at a frame rate of 330 kfps. Ambient temperature is 25 ˚C. The scale bar is
500 µm. dt equals to 6.06 µs.

Chapter 4: Forming A Fine Jet In Inkjet Printing
124 of 176
4.3.3 More on Surfaces Collapse Jets
Fig. 4.15 shows another type of “surfaces collapse” jet which occurs during
inkjet printing. Initially an air bubble stays deep inside the nozzle. When the
piezo-generated positive acoustic pressures reach the bubble, the focusing
flow squeezes the bubble and causes part of the air and the liquid being
expelled out of the nozzle. The squeezed air blows the liquid to an elongated
crown shape and breaks it to release part of the air. Thus the pressure inside
the cavity decreases rapidly. After only around 50 µs, the conical wall of the
broken crown contracts on the lower sections and closes up again. Due to
inertia, the expelled liquid, which constituting of the crown wall, will travel
downward along the crown wall and accumulates at the vertex of the crown.
Meanwhile, the piezo-element expands to its equilibrium state, causing a
negative pressure inside the nozzle. Thus the atmosphere pressure squeezes
the air inside the crown into the nozzle, as marked by the arrows in Fig.
4.15(b). The combination of these two effects causes a “necking” effect on the
crown, with a decreasing in the crown height and a decreasing in the angle at
the crown vertex, forming a cusp shown in closeup. The arrow in the first
frame of Fig. 4.15(c) marks this angle at the crown vertex. Finally, the crown
wall meets and collapses with itself, sending an upward fine jet into the nozzle,
as can be seen clearly in frame 4 of Fig. 4.15(c). Furthermore, a tiny air bubble
is also trapped by the collapse (frame 5 in Fig. 4.15(c)). Fig. 4.16 provides a
close view of a similar kind of surfaces collapse jet. It clearly shows that the
jets are produced when the hyperbolic surface collapses. Two jets are
generated, one upward and one downward, as marked by the arrows.

Chapter 4: Forming A Fine Jet In Inkjet Printing
125 of 176
Fig. 4.15: Surfaces collapse jet upward into the nozzle. is 150 µm. 85% water
glycerin (w/w) solution. Bi-polar piezo signal: 650 µs tdwell and 650 µs techo; 140 V.
The negative pressure inside the reservoir is -2.3 kPa. Images were taken at 165 kfps.
Ambient temperature is 25 ˚C. (a). The scale bar is 1 mm. dt equals to 24.24 µs. (b).
The scale bar is 1 mm. dt equals to 18.18 µs. (c). The scale bar is 500 µm. dt equals to
12.12 µs.

Chapter 4: Forming A Fine Jet In Inkjet Printing
126 of 176
Fig. 4.16: Surfaces collapse jets. is 150 µm. The liquid used is 50% aqueous
glycerin (w/w) solution. Printing parameters: bi-polar piezo-driving signal with 550
µs tdwell and 550 µs techo; driving pulse amplitude equals to 140 V. The negative
pressure inside the reservoir is -2.3 kPa relative to the atmospheric pressure. Images
were taken at a frame rate of 330 kfps. Ambient temperature is 25 ˚C. The scale bar is
200 µm. Image for frame number n = 1, 3, 5 …… 13, 15.
4.3.4 Viscosity Effects on Jet Velocity
Fig. 4.17: Jetting velocities obtained for different concentration of aqueous glycerin
solutions (w/w): 0%, 10%, 30%, 50%, 70%, 75%, 80%, and 85%.

Chapter 4: Forming A Fine Jet In Inkjet Printing
127 of 176
For each concentration of the aqueous glycerin solution, the printing
parameters were varied to obtain different jetting velocities as well as jet
diameters. Fig. 4.17 shows the velocities obtained during the experiments. As
can be seen, for the typical jet (Jet I), the highest jetting velocity for different
solutions fairly decreases monotonously with the increase of viscosity. While
for Jet II, the highest velocity occurs for intermediate, with a maximum peak
when 50% glycerin-water solution is printed.
Fig. 4.18 shows the fastest jet generated in the experiment. The jetting process
is similar to the one shown in Fig. 4.10(d). A piezo-generated cavity was
sucked into the nozzle and got into contact with a preexisting bubble, without
coalescing with it. The later piezo-generated radial focusing flow pushed out
the lower cavity as well as the lower cap of the preexisting bubble, forming
the balloon-like bubble. This balloon-like bubble collapsed later, followed by
the cavity jet shown here.
From extensive experiment results, it became clear that the jets produced in
this way normally have much higher velocities. Also from Fig. 4.17, it seems
that a solution with a moderate viscosity is optimal to produce a fast jet. The
reason may be due to the fact that for solutions with lower viscosities, the two
cavities inside the nozzle are more likely to coalesce (as shown in Fig. 4.6);
while for solutions with much higher viscosities, it becomes more difficult for
the viscous balloon-like bubble (as shown in Fig. 4.12) to rupture. The
bubble’s oscillation dissipates much energy; the viscous film itself exerts flow
resistance to the jet, and finally this two effects lead to a slower jet.

Chapter 4: Forming A Fine Jet In Inkjet Printing
128 of 176
Fig. 4.18: The fastest jet observed in the experiment: a 9 µm jet with a velocity of
about 100 m/s. is 150 µm. The liquid used is 50% aqueous glycerin (w/w)
solution. Printing parameters: bi-polar piezo-driving signal with 550 µs tdwell and 550
µs techo; driving pulse amplitude equals to 140 V. The negative pressure inside the
reservoir is -2.3 kPa relative to the atmospheric pressure. Images were taken at a
frame rate of 330 kfps. Ambient temperature is 25 ˚C. The scale bar is 200 µm. Time
interval between frames is dt = 3.03 µs.
4.3.5 Relationship between Jet Velocity and Jet
Diameter
Fig. 4.17 shows that the jets velocities generated during the experiments vary
over a wide range; same is true for the diameters of the jets. Fig. 4.19 shows 3
jets with different diameters as well as velocities. The only difference in their
printing conditions was slight change of the negative pressure inside the
reservoir. As was mentioned before, both type I and type II jets are quite
sensitive to this back pressure. As a result, big differences were obtained in
jetting velocity. From Fig. 4.19, it appears that the jet velocity decreases with
the increasing of the jet diameter. To verify this, Fig. 4.20 combines all the
obtained jet velocities with their corresponding jet diameters into one graph.
An inverse relationship can be clearly seen from the figure.

Chapter 4: Forming A Fine Jet In Inkjet Printing
129 of 176
Fig. 4.19: Images showing the relationship between jet velocity and jet diameter. Jets
belong to type II. is 150 µm. The liquid used is 70% aqueous glycerin (w/w)
solution. Printing parameters: bi-polar piezo-driving signal with 550 µs tdwell and 550
µs techo; driving pulse amplitude equals to 140 V. The negative pressure inside the
reservoir is -2.3 kPa relative to the atmospheric pressure. Images were taken at a
frame rate of 330 kfps. Ambient temperature is 25 ˚C. The scale bar is 200 µm. (a). A
1 µm jet with a velocity of 66 m/s. (b). A 3 µm jet with a velocity of 51 m/s. (c). A 10
µm jet with a velocity of 15 m/s.

Chapter 4: Forming A Fine Jet In Inkjet Printing
130 of 176
Fig. 4.20: Images showing the relationship between jet velocity and jet diameter.
Data collected for both Jet I and Jet II. is 150 µm. Liquid used is 0%, 10%, 30%,
50%, 70%, 75%, 80% and 85% aqueous glycerin (w/w) solutions. Printing
parameters: bi-polar piezo-driving signal; driving pulse amplitude equals to 140 V.
Ambient temperature is 25 ˚C.
4.4 Conclusions
The formation of fine jets during the piezoelectric drop-on-demand inkjet
printing has been investigated using ultra-high-speed video imaging. The
speed of the jet can be as high as 100 m/s, which is much higher than the
typical droplet velocity during regular inkjet printing. The generation of such
fine jets has been studied over a wide range of viscosities, using 7 different
concentrations of water-glycerin solutions, giving viscosities as high as 100
times that of water. This jetting is associated with the inertial focusing of an
airpocket which is sucked into the nozzle during the printing. This occurs for
longer expansion times for the piezo-element. Two types of jets have been

Chapter 4: Forming A Fine Jet In Inkjet Printing
131 of 176
identified during these experiments. The relationship between the speed of the
fine-jet and its diameter has also been characterized, over a range of
viscosities.
These fine jets are very sensitive to slight variations of reservoir back-pressure,
suggesting chaotic behavior. However, the diameters of the thinnest jets are of
the order of a few microns, indicating the successful generation of smaller
droplets (or jets) to diameters of smaller than 1 % of the orifice diameter.
While in existing studies [21, 24, 25], the diameter of the dispensed droplets
can be only reduced to a maximum of 60 % of the orifice diameter.
Consequently, the study provides a possible way to improve inkjet printing
resolution without reducing nozzle diameter.

Chapter 5: Cell Printing
132 of 176
5. CELL PRINTING
5.1 Introduction
Organ printing, is defined as “a rapid prototyping computer-aided 3D printing
technology, based on using layer by layer deposition of cells and/or cell
aggregates into a 3D gel with sequential maturation of the printed construct
into perfused and vascularized living tissue or organ” [137]. It is a feasible and
fast-developing technology which aims to build implantable organs to treat
diverse diseases such as cancer, loss of tissue function, or organ failure. As has
been mentioned in section 2.4, inkjet printing is a highly suitable candidate for
organ printing. The power of inkjet printing lies in its ability to deliver
picoliter volumes of materials (solutions, polymers, gels or cell ink) at high
speed (a jetting frequency of 2-10 kHz is quite common) and accuracy (several
tens of microns) on a target interface (probably non-planar surface, for
example, an organ surface), and to deliver active substances to a developing
structure in a well defined time-and-space sequence.
To guarantee successful organ printing, plenty of fundamental requirements
must be fulfilled: cells should be accurately placed into desired patterns; cells
have to survive the shear stresses experienced during the printing, and must
keep their viability. The number of cells inside each printed droplet should
also be well controlled as “empty droplet” and cell-less droplets are
undesirable for building living structures. Printed cells should be able to

Chapter 5: Cell Printing
133 of 176
adhere, spread and proliferate on the substrate, which are generally different
gels.
To date, different types of cells have been printed successfully and their
viability has been verified [3-10, 103]. The most comprehensive studies was
carried out by Saunders et al. [9], who used a commercial desktop printer to
dispense human fibroblast cells, for the investigation of the relationship
between cell survivability and the inkjet printing parameters. Their study
supported previous claims [4, 5, 8, 10] that cell survivability was not
significantly affected by the printing process since cell survival rates only fell
from 98% to 94% in their case, when the excitation pulse was increased from
40 to 80 V. However, in their study, the entire printing process was carried out
using a modified commercial printer, thus limiting their experiments to a fixed
nozzle diameter (60 µm) and a small range of the drop velocities (lower than
1.0 m/s). These limitations may be of importance, because the shear stresses,
which are expected to be the main factor in the killing of cells during the
printing process, are proportional to the velocity gradients within the nozzle.
To eliminate above two limitations, a squeeze mode piezoelectric DOD inkjet
printhead was designed and fabricated in-house, as has been represented in
detail in Chapter 3. A much larger range of droplet velocities can be obtained
by the novel printhead, compared to this earlier study [9]. Furthermore, the
improved design of the printhead allows us to change the nozzles while using
the same printhead main-body, thus enabling us to investigate the effects of
varying the orifice diameters on cell survival rates. It will be shown that by

Chapter 5: Cell Printing
134 of 176
using a small diameter nozzle and a high excitation voltage, the printing
process generates large enough shear stresses to cause significant decrease in
the cell survival rates. In fact, shear stresses have been studied extensively to
predict the damage of animal cells suspended in various laminar or turbulent
flows. This part of our study provides quantitative estimate of these effects on
cell survivability in DOD inkjet printing.
The number of cells in each printed droplet is one important factor in
optimizing cell printing, as empty droplets may be undesirable. The
probability distribution of cell numbers to ascertain desirable mean cell
concentration in the medium has been studied, to avoid “empty droplets” and
cell-less droplets. To form cell patterns, L929 rat fibroblast cells were firstly
printed onto alginate. Alginate has been increasingly utilized in tissue
engineering to support encapsulated cells and to regulate cell function, in a
manner similar to the extracellular matrices of mammalian tissues. However,
the major limitation to its use as an extracellular matrix is that alginate does
not mediate mammalian cell adhesion. To promote cell adhesion within
alginate gel, ligands such as arginine-glycine-aspartic acid (RGD), GRGDY,
KGD and VAPG can be used. Collagen is another widely used hydrogel with a
number of advantages including biodegradability, low immunogenicity and
controllable stability. Furthermore, collagen contains cell adhesion domain
sequences such as RGD, which facilitate cell adhesion for anchorage-
dependent cell types. Therefore, in later part of the study L929 cells were
printed onto collagen to form patterns.

Chapter 5: Cell Printing
135 of 176
5.2 Material Preparation and Experimental
Procedure
5.2.1 Preparation of Cells, Alginate and Collagen
L929 rat fibroblasts were cultured in 1× Dulbeccos Modified Eagles Medium
(DMEM, D1152). The medium was supplemented with 10% foetal bovine
serum (FBS, Gibco) and 1% Penicillin Streptomycin. FBS is widely used in
cell culture as cell growth promoting factor. Penicillin Streptomycin is a broad
spectrum bacteriostatic and bacteriocidal, with activity against gram negative
and gram positive organisms. Cells were cultured and sub-cultured in 150 cm3
culture flasks at 37 ºC, 5% CO2 and were observed under a microscope at
intervals until they grew to a full layer in the flasks. Cells were harvested by
trypsinizing with the utilization of 0.25%, 1 mM EDTA Na (Gibco) and
washing with phosphate-buffered saline (PBS, Gibco). DMEM was mixed
with the trypsinised cell solution and transferred to 50 cm3 conical tubes which
were then centrifuged at 1500 rpm for 5 min. After centrifugation, the
supernatant liquid was removed leaving the cell pellet and fresh media was
added. The final cell solution was gently agitated using a pipette to ensure
uniform distribution as well as to disrupt cell clumps. The required cell
concentrations of solutions for experiments were quantified by using a
haemocytometer (Fisher Scientific UK, Loughborough, UK).
A 1.0% (w/v) aqueous solution of sodium alginate (A2158, Sigma-Aldrich)
was prepared by suspending the polymer in distilled water. After 6 hours of

Chapter 5: Cell Printing
136 of 176
stirring by a magnetic stirrer, the solution was sterilized by sterile filtration,
using 0.22 µm membrane filters.
The 3 mg/ml collagen solution, (C4243, Sigma-Aldrich) was prepared by
mixing 8 parts of chilled collagen solution with 1 part of 10× PBS. The pH of
mixture was adjusted to 7.2–7.6 using 0.1 M NaOH. The pH value was
monitored carefully using pH paper. To prevent gelation, the resulting solution
was then maintained at temperature of 4 °C until ready for use.
5.2.2 Printing Experimental Setup
Printing experiments were carried out by using the self-developed squeeze
mode piezoelectric inkjet printing system. The setup is comprised of a
compressor, a pressure regulator, a reservoir, a piezo-actuated printhead, a
piezo driver, an Arrisun-5 lamp and a Photron Fastcam SA-1 camera (high-
speed-video camera), as shown in Fig. 5.1. The present printhead design is a
great improvement over conventional pintheads, as it allows for the use of
interchangeable nozzles, for the same piezoelectric transducer. The
interchangeable nozzle design allows one to easily clean or change a clogged
or damaged nozzle. The details of the design can be referred to Chapter 3 or
Ref. [140]. Before printing, all the components that will contact with cell ink
during printing process, which include the liquid reservoir, the printhead
chamber and the interchangeable nozzle, need to be properly sterilized by
autoclaving to 121 ˚C at 15 psi (pounds per square inch) for 60 minutes. The
inkjet process is highly periodic. Fig. 5.2(a) shows the droplet formation
process in a time sequence. Drop velocity can be calculated by dividing the

Chapter 5: Cell Printing
137 of 176
spacing between two droplets by their time difference. Fig. 5.2(b) shows
images of a few cells inside the nozzle.
Fig. 5.1: Schematic showing the DOD setup for cell printing experiment.
Fig. 5.2: Images taken by using the high-speed-video camera. (a). Image sequence
showing the formation of a 160 µm droplet from a 119 µm nozzle, taken at a frame
rate of 8,000 fps, giving time between frames of 125 µs. Liquid used was 1.0% (w/v)
aqueous solution of sodium alginate. Drop velocity is 0.74 m/s. (b). Images showing
cell motion inside the nozzle. Nozzle opening diameter is 119 µm.

Chapter 5: Cell Printing
138 of 176
For the study of cell survival rates, L929 rat fibroblast cell suspensions were
printed through orifices of three different diameters (119 µm, 81 µm and 36
µm) onto well plates (Costars) which contained the live-dead assay solution.
Preparation of the live-dead assay solution will be introduced later. The
electric pulses which were used to drive the piezoelectric transducer were in
the range of 52 to 140 V. Each sample was printed for approximately 20 s
with a driving frequency of 1.5 kHz for the printhead. Prior to the printing
process, a 15 µl cell suspension was deposited with a pipette into a well plate
in the same environment as the printing system, to act as a control.
For pattern printing, either alginate or collagen served as the substrate. The
1.0% (w/v) alginate was coated onto well-plate surfaces (Costar) to form
around 100-µm-thick film. Cells were dispensed onto this film using a cell ink
which contained 0.5% (w/v) calcium chloride and had a cell concentration
about 3×10⁶ cells per ml. The crosslinking reaction occurs once the droplets
contact the alginate film. Printed samples were immediately placed into an
incubator. One hour after printing, fresh medium was carefully added into the
well plates, covering the gel surface and protecting the cells from dehydration.
Samples were transferred into incubator again and observed under a
microscope at intervals. When collagen served as substrate, 0.3% (w/v)
collagen solution was coated onto well plate surfaces to around 2-mm-thick
films and warmed up to 37 ºC for around 1 hour for gel formation. The well
plates were then placed onto a XY motion stage and L929 cell suspensions
were printed onto the gel according to the desired pattern. Printed samples
were immediately transferred into an incubator. Fresh medium was carefully

Chapter 5: Cell Printing
139 of 176
added into the well plates 1 hour following the printing, preventing cells death
from dehydration. Samples were transferred into incubator again and observed
under a microscope at intervals.
5.2.3 Survivability Tests
A Live-Dead Viability/Cytotoxicity Kit (L3224, Molecular Probes, Invitrogen)
was used to assess the survivability of the cells after the printing. The frozen
vials containing the assay were thawed and centrifuged briefly before use. 20
µl of the supplied 2 mM EthD-1 solution and 5 µl of the supplied 4 mM
calcein AM solution were added into 10 ml of 1× DMEM solution and mixed
thoroughly, which gave an approximately 4 µM EthD-1 and 2 µM calcein AM
working solution.
Cells were directly dispensed into well plates which each contained 100 µl of
the assay mixture, then incubated for 30 min. For each printing condition, cells
were dispensed into 5 separate petri dishes, to study the variation of survival
rates. Controls were taken directly from the cell ink before printing and put on
a set of separate petri dishes, undergoing the same environment and procedure.
The stained samples were then partly transferred onto microscope slides and
observed under a fluorescence microscope. Six images were captured from
each perti dish for cell counting. Cells that remained alive after the printing
were stained green and the damaged cells were stained red. The numbers of
alive and dead cells for each sample were tallied with respect to that of the
control which was taken prior to the printing.

Chapter 5: Cell Printing
140 of 176
5.3 Results and Discussion
5.3.1 Cell Survivability Study
5.3.1.1 Cell Printing
L929 cells were printed into Petri dishes containing the live-dead assay
solution, through 3 different orifices with the diameters of 119 µm, 81 µm and
36 µm. Printing was carried out over a range of excitation pulse amplitudes
from 52 to 140 V, while the rising/falling time was kept constant at 3 µs and
the dwell time, i.e. the time duration of the excitation pulse, was kept at 70 µs.
The driving frequency was held constant at 1.5 kHz. Each sample was printed
for approximately 20 s. The concentration of the cell suspension was about 1
million cells per ml.
Fig. 5.3: Graph showing influence of excitation pulse on droplet velocity. The orifice
diameters of the nozzles used were 36, 81 and 119 µm.

Chapter 5: Cell Printing
141 of 176
Fig. 5.4: Graph showing influence of excitation pulse voltage on droplet diameter.
The orifice diameters of the nozzles used were 36, 81 and 119 µm.
The initial average number of cells inside each droplet is fairly independent of
the voltage used to drive the piezo-element. This was verified by observations
under the microscope done within 2 hours of the printing, i.e. before
proliferation occurs. This result is consistent with the existing study [9];
however, the average number of cells depends strongly on the nozzle/droplet
size, as discussed below.
Fig. 5.3 and Fig. 5.4 show the effect of the excitation pulse (which is imparted
to the piezoelectric actuator) on the droplet velocity and droplet diameter,
respectively. It is shown that for all of the three nozzles, drop velocity and
droplet diameter increase with the increase of excitation pulse. This increase in
droplet velocity is especially pronounced for the 36 µm nozzle, where droplet
velocity increases from 2.4 to 16.6 m/s as the driving voltage increases from
60 V to 130 V. However, for the 36 µm nozzle, small satellite droplet is

Chapter 5: Cell Printing
142 of 176
generated once the driving voltage exceeds 70 V. To avoid satellite formation
typical DOD inkjet printing cannot generate such high velocities as used
herein. In fact, for specific nozzle size and pulse duration, there exists a
critical pulse amplitude, above which satellite droplets are produced [63].
When a satellite droplet is generated, the drop velocity is determined based on
the main droplet. The presence of the small satellite droplets is of no direct
relevance to the survival study, but will interfere with pattern printing.
Fig. 5.5: Graph showing a 95% survival rate of L929 rat fibroblast cells stained with
Calcein AM and Ethidium homodimer-1. Printed with an excitation pulse amplitude
of 116 V, at a frequency of 1.5 kHz, with rising and falling times of 3 µs. The orifice
used was 119 µm.
5.3.1.2 Cell Survivability: Effects of the Mean Shear Rate
Cell survivability after printing was quantitatively investigated by using the
LIVE-DEAD Viability/Cytotoxicity Kit as explained above. Fig. 5.5 shows a
stained sample which has a 95% survival rate.

Chapter 5: Cell Printing
143 of 176
Fig. 5.6: Mean cell survival rate with respect to excitation pulse amplitude for the
samples printed through the 36 µm orifice, with excitation pulse amplitude from 60 V
to 130 V, at a frequency of 1.5 kHz, with rising and falling times of 3 µs. Error bars
show the standard error from 5 replicates.
Fig. 5.6 shows the effects of excitation pulse amplitude on the mean cell
survival rate, for the 36 µm nozzle. It is shown that the survival rate falls from
95% to 78% as the excitation pulse is increased from 60 to 130 V, and the
lowest survival rate of 76% is observed when the highest voltage is
approached. The excitation pulse amplitude represents the power for the
piezoelectric actuator to dispense the droplets and this power directly affects
the droplet velocity and thereby the shear stress in the liquid. In Fig. 5.7, the
mean cell survival rates against excitation pulse amplitude for all of the three
different orifices are drawn together to compare the effects of different orifice
sizes on cell survivability.

Chapter 5: Cell Printing
144 of 176
Fig. 5.7: Graph showing the mean cell survival rate against excitation pulse
amplitude. Samples printed through orifices with the diameter of 36, 81 and 119 µm,
with excitation pulse amplitude from 52 to 140 V, at frequency of 1.5 kHz, with
rising and falling times of 3 µs. Each cell survival rate data was the average value
from 5 replicates.
It shows that survival rates fall from 99% to 85% for the 119 µm nozzle and
from 96% to 85% for the 81 µm nozzle. It can be seen that for the bigger
orifices, especially the 119 µm one, the printing did not produce a significant
reduction in cell survivability as the excitation pulse amplitude is increased.
This may be due to the fact that the cells used here were much smaller than the
two bigger orifices. The round-shaped L929 rat fibroblast cells are measured
to have a diameter of approximately 20 µm. It is known that shear stress in a
Newtonian fluid is proportioned to the velocity gradient in radial direction,
thus the highest shear stress is always generated in the region near the wall
during droplet dispensing. For the larger nozzles the fraction of cells moving
next to the wall is reduced, on average the cells will therefore experience less
shear stresses, which would ultimately lead to a higher survival rate.

Chapter 5: Cell Printing
145 of 176
Fig. 5.8: Graph showing percentage of cell death against the mean shear rate.
Samples printed through orifices with the diameter of 36 µm, 81 µm and 119 µm.
Each cell death rate data was the average value from 5 replicates.
Comparing the 3 different trendlines in Fig. 5.7, we conclude that it is not the
strength of the electric field which directly affects cell survival rate; rather it is
the fluid shear stress. Due to the highly transient nature of the flow driven
through the nozzle (see Fig. 5.2(a)), the detailed knowledge of the velocity
profile within the droplet at the nozzle tip is lacked here. Thus the mean shear
rate, which can be estimated by , where v and r are the drop velocity
and the nozzle radius, respectively, is used as a substitute for effective shear
stresses. Fig. 5.8 shows the percentage of cells that died against the mean
shear rate during the printing. It is shown that the cell death rate increases
approximately from 5% to 24% as the mean shear rate increases from 1.4×10⁴
s-1
to 9.2×10⁵ s
-1. The trend is more evident for the last eight data points which
correspond to the results for the 36 µm orifice. The results clearly show that
cell death does occur during the printing, especially under the effects of high
shear rates, above 5×10⁵ s
-1.

Chapter 5: Cell Printing
146 of 176
One can roughly estimate the displacement thickness of the boundary layer δ
using the time duration of the piezo-signal T and the kinematic viscosity of the
liquid ν, with the well-known approximation [181], . The total
duration of the signal is T = 76 s and the viscosity of the cell ink is very
similar to that of water, i.e. ν = 10-3
m2/s, which gives δ = 15 m. The two
boundary layers therefore span 30 m, which is close to the diameter of the
smallest nozzle. The large velocity gradients inside the boundary layers are
therefore likely to submit many of the cells to the high shear stresses. The
geometry of the converging nozzle will certainly affect the true thickness of
these boundary layers, but this simple calculation suggests that their size
becomes quite significant for the smallest nozzle diameter of 36 m.
5.3.2 The Number of Cells in Each Droplet
Having investigated cell viability from the inkjet printing, the next step in
optimizing the use of such printing in tissue engineering is to uniformly
position cells in desired configurations.
Fig. 5.9 shows sections of two adjacent straight lines printed with a 60 µm
nozzle. The space between the lines is around 30 µm. There are between 1 to 5
cells observed in each droplet. This large deviation in cell numbers highlights
the random distribution of the cells inside the medium when it reaches the
nozzle, from which the droplets are dispensed. Therefore, a large average cell
concentration will be needed in the suspension to guarantee at least one cell
per droplet, with a certain high probability. To investigate the associated

Chapter 5: Cell Printing
147 of 176
probabilities, we performed a set of separate experiments described in what
follows.
Fig. 5.9: Droplets printed onto a dry substrate from a suspension with a concentration
of 2×10⁶ cells per ml. Each droplet contains 1 to 5 cells. The orifice diameter of the
nozzle used was 60 µm.
The number of cells in each droplet can be thought of as a random variable,
whose distribution can then be estimated using basic probability theory [7].
The distribution of cells in the original medium is assumed to be random with
a uniform probability density. With this assumption the printing simply
represents random sampling of the liquid volume in the reservoir, with a
sphere of the same volume as the droplet . The aim is to determine the
probability that a certain number of cells are present in this volume. This can
be formulated in terms of a Bernoulli sequence of trials [182]. Each trial
consists of randomly assigning the position of the center of one cell inside the
whole liquid volume of the media . Successful trial occurs when the cell
lands inside the specified droplet. The probability of success in each trial is
therefore very small, i.e.
(5.1)

Chapter 5: Cell Printing
148 of 176
with a correspondingly very high probability of failure – . We do
however have a very large number of cells, i.e. a very large number of trials
are performed. Elementary probability theory shows that the probability of
getting k cells into a specific droplet in n trials becomes
(5.2)
where are the binomial coefficients. In our treatment n is a very large
number, i.e. essentially the total number of cells. In other words, ,
where N is the average cell concentration per unit volume. The above eq. 5.2
is therefore quite difficult to evaluate. However, the Poisson theorem can be
utilized to simplify this calculation, which gives
(5.3)
where the product now corresponds to the average number of cells
per droplet volume, which is denote by .
Fig. 5.10 shows this probability density function for a few different values of
, highlighting the variability of the number of cells in different droplets. As
the concentration increases the most likely number of cells shifts to larger k,
while the distribution also widens. The figure shows clearly, that there is a
finite probability of producing droplets containing no cells. The above eq. 5.3
shows that the probability of “empty droplets” is
(5.4)
which reduces exponentially with higher cell concentration in the medium.
Using this formula, it can be seen that to guarantee, with a 99% probability,
that each droplet contains at least one cell the average cell density in the

Chapter 5: Cell Printing
149 of 176
solution must be above cells/drop-volume.
Fig. 5.10: Graph showing the probability density distribution of the number of cells
in each droplet. For a range of different average cell concentration in the cell medium,
from dN = 0.5, 1.0, 1.5 … 3.0 cells per droplet.
To investigate the validity of our assumptions we carried out a set of
experiments where thousands of droplets were printed onto dry Petri dishes.
The diameter of the nozzle used was 130 µm, giving droplet diameter of 170
µm. The resulting diameter of the dry droplet residue was 268 µm, indicating
a spreading factor of around 1.6. Therefore the average height of the liquid
film was 46 µm. The drops dried out within about 1 min, leaving the dead
cells (as compared to the living cells in Fig. 5.11, which adhere to the
substrate and extend long filopodia) encased inside the remaining residue of
dried medium, as is shown in Fig. 5.12(a). The number of cells inside each
drop was then counted under the microscope.

Chapter 5: Cell Printing
150 of 176
Fig. 5.11: Optical micrographs of L929 rat fibroblast cells after 5 days in culture
following printing. Cell division can be observed (indicated by green circle)
apparently.
Fig. 5.12: Images of printed cells. (a). Cells inside dried droplet residues. The scale
bar is 50 µm. (b). Schematic showing the measurement of the radial location of each
cell, away from the center of the dried droplet residue.
Fig. 5.13 compares the distribution of the number of cells inside each droplet
with the theory in eq. 5.3. The theory shows excellent agreement except that
we observe slightly fewer empty drops that predicted and slightly more
droplets containing only one cell. The theory shows perfect agreement for
. Keep in mind that there are no free parameters in this relationship, with
the mean cell concentration coming directly from the experimental

Chapter 5: Cell Printing
151 of 176
results. This excellent agreement with the theory is expected to become even
better when the average number of cells in the medium increases.
Fig. 5.13: Graph showing the probability density distribution of the number of cells
in each droplet. The (□) stands for the experimental results and (--+--) stands for the
values calculated from eq. 5.3. Determined from microscope counting of cells in 800
droplets, which were dispensed within the first 4 minutes.
5.3.3 The Location of Cells inside Each Droplet
The spatial distribution of the cells within the dried drop was also studied. Fig.
5.12(b) shows how the radial location of each cell, away from the center of the
dried droplet residue, was measured. It is firstly verified that the horizontal
motion of the substrate, during the printing, does not move the cells towards a
specific direction. This might be introduced by the effective angle of impact of
the droplet, which is always less than 6˚ from the vertical. The evaporation of
the liquid during drying, could also introduce capillary-driven motions of the
cells to the edge of the drop, as is well-known from the everyday experience
of coffee stains [33, 34]. This was not observed in the resulting distribution of

Chapter 5: Cell Printing
152 of 176
cells in the dried spot, which is normalized by the area.
Fig. 5.14: Graph showing the probability of cell location within the dried droplet
splatter. The “radius” is the distance from the center of the cell to the center of the
dried droplet. The “Radius” is the radius of the dried droplet. “Rcell” is the radius of
the round-shaped L929 rat fibroblast cells, which has a value of approximately 10 µm.
Fig. 5.14 shows that the cells are most likely to be located near the center, with
clear reduction in cell numbers near the edge. This might be explained if the
thin lamella of liquid which is generated by the impact and precedes the
spreading, is of similar thickness as the cells. This is likely to occur in our
setup, as the Reynolds number of the impacts
, suggesting a
weak lamella traveling along the substrate. Here and are respectively the
liquid density and dynamic viscosity. and D are the impact velocity and
droplet diameter.

Chapter 5: Cell Printing
153 of 176
Fig. 5.15: Graph showing the average number of cells per droplet vs. time from start
of printing. Printing was carried out continuously over a period of 2.5 hours, at 120
Hz driving frequency.
Fig. 5.15 shows the long-time evolution of the average number of cells in each
droplet. The cell number is fairly uniform for the first hour and then reduces at
approximately a uniform rate, which is probably due to slow coagulating or
settling of the cells in the liquid chamber.

Chapter 5: Cell Printing
154 of 176
5.3.4 Printing Patterns
Fig. 5.16: Image showing cells printed onto a dry Petri-dish, forming an “NUS”
pattern. Each droplet contains 2 to 6 cells. The orifice diameter of the nozzle used
was 60 µm.
Fig. 5.17: Image showing a continuous line of overlapping droplets with around 6 to
8 cells per droplet in the crosslinked gel. The orifice diameter of the nozzle used was
60 µm.
For the printing of cell patterns, a manual micro-meter x-y-stage is used, for a
proof-of-concept demonstration. Fig. 5.16 shows cells fired onto a dry Petri-
dish through a 60 µm orifice, forming an “NUS” pattern. Using the manually
operated stage and single-drop printing the formation of this entire pattern
took about 5 min. As a result, most of the droplets dried up during the printing,
leaving only dead cells (due to dehydration) inside the dried outline of the
droplets. A viable substrate is necessary in order to maintain suitable moisture

Chapter 5: Cell Printing
155 of 176
to prevent cell death from dehydration. Fig. 5.17 shows the printed cells inside
the crosslinked gel made from 1.0% (w/v) alginate and 0.5% (w/v) calcium
chloride. (Alginate was coated onto a well-plate before printing, while calcium
chloride was mixed within the cell ink). The overlapping droplets form a
continuous straight edged line. It was subsequently found that fibroblast cells
retained their spherical shape rather than extending filopodia, which meant
that the cells failed to adhere to the alginate. The same result has also been
reported by Kuo et al. [183].
Fig. 5.18: Image showing live cells printed onto a collagen gel, forming an “NUS”
pattern. The orifice diameter of the nozzle used was 60 µm. Picture taken 5 day after
printing.
In Fig. 5.18, the same “NUS” pattern was created by dispensing the cells onto
a collagen gel. Printed cells were immediately placed into an incubator. 1 hour
following the printing, fresh medium was added into the well plates. The
samples were transferred into the incubator again and observed under
microscope at intervals. After 5 days, Live/Dead assay was applied to the
samples. A bright green fluorescence was observed after incubation for 30 min.
The cells were shown to survive after printing, adhere to the gel, spread and
proliferate, forming a denser pattern. It is worth noting that the cells were

Chapter 5: Cell Printing
156 of 176
slightly moved from their initial position, perhaps caused by the addition of
the fresh medium, thereby slightly reducing the resolution of the printing.
5.5 Conclusions
The study has demonstrated that piezoelectric DOD inkjet printing is able to
successfully deliver L929 rat fibroblast cells through nozzles as small as 36
µm. There was no significant cell death when dispensing the cells through the
81 µm and the 119 µm nozzle, with the mean survival rates only reducing
from 98% to 85%. This is in good agreement with the study of Saunders et al.
[9], in which a commercial printer was used to print human fibroblast cells.
When the orifice was reduced to 36 µm, the corresponding cell survival rates
fell from 95% to 76% when the excitation pulse amplitude increased from 60
V to 130 V. These results indicate that the droplet ejection out of the nozzle
has exerted large shear stresses on the cells and possibly disrupted the cell
membrane and killed about 20% of the cells. Mean shear rate was estimated
by combining the effects of droplet velocity and orifice diameter and was
correlated with the cell survival rate. A large range of mean shear rates from
1.3×10⁴ s
-1 to 9.2×10
5 s
-1 were generated and cell survival rates were found to
be strongly affected by the higher mean shear rates, especially when the shear
rate exceeds 5×10⁵ s
-1.
The distribution of the number of cells within each droplet was also
investigated. This was done to find the minimal cell concentration in the
medium, which is required to avoid the appearance of empty droplets, since

Chapter 5: Cell Printing
157 of 176
droplets containing no cells may be detrimental to pattern printing. The
distribution of cell numbers is found to have a binomial form, which
consistent with a uniform distribution of cells inside the medium in the
reservoir.
For pattern printing, L929 fibroblast cells were delivered by using a 60 µm
nozzle. Printed cells successfully kept their patterns in the crosslinked gel
made from 1.0% (w/v) alginate and 0.5% (w/v) calcium chloride. However, it
was found that the cells failed to adhere to alginate. On the other hand, cells
dispensed onto collagen gel were found to successfully maintain their viability,
adhere to the gel, spread and proliferate, forming a denser pattern. However,
unlike the crosslinked calcium-alginate which can immobilize cells quite
rapidly, cell adhesion to collagen needs a relatively long time to get
established. Therefore, some of the printed cells were slightly moved from
their initial position when the sample was disturbed, by the addition of fresh
medium or unintended shaking of the sample, which will reduce the resolution
of the printing. The smallest nozzle, with orifice diameter of 36 µm, was not
used for pattern printing, due to issues concerning the reliability of the printing
process, as it can easily get clogged.
Future studies should involve experiment with more mammalian cell types. It
is also of interest to check whether adding ligands or collagen into alginate
(before the crosslinking reactions) will promote cell adhesion onto the
substrate. If this can be successfully implemented, the accuracy of the pattern
printing will be significantly improved.

Chapter 6: Recommendations For Future Work
158 of 176
6. RECOMMENDATIONS FOR FUTURE
WORK
6.1 Printhead Design
As a manufacturing tool, high speed jetting is required to increase productivity
of inkjet printing technology. For a specific printhead, its maximum jetting
frequency is mainly depended on the construction of the printhead as well as
the driving signal. Typical DOD printheads generate droplets at rates in the
range 0.1-10 kHz. While the maximum jetting frequency for our in-house-
developed printhead is only 3.6 kHz. Furthermore, our printhead has a
relatively lower threshold frequency, above which jetting frequency starts to
have great effects on droplet velocity and droplet diameter. This threshold
frequency is also mainly determined by the construction of the prinhtead. Thus
future work should include a systematic study of the relationship between this
threshold frequency and printhead construction, to optimize the printhead
design, which includes parameters such as the piezo-ceramic material, the
dimensions of the piezo-element, the dimensions of the printhead chamber, the
nozzle profile, etc..
The dispensing of relatively high concentration of sodium alginate solutions
shows that the printing behavior of non-Newtonian liquid is distinctly different
from that of Newtonian liquids. Thus more experiments need to be carried out

Chapter 6: Recommendations For Future Work
159 of 176
to investigate the characteristics of our printhead for printing non-Newtonian
liquids or even particle-laden liquids.
6.2 Reducing Droplet Size
The results in Chapter 3 show that by carefully control the driving signal, fine
jets can be produced with a relatively bigger nozzle size. The results show the
possibility of reducing droplet size (or improving printing resolution) without
reducing nozzle size. However, the repeatability of the method is still far from
perfect. It is interesting to find out whether the repeatability of the generation
of such fine jet will be improved by adopting different nozzle profiles.
Furthermore, current experiments are collected only from the printing of
Newtonian liquids; more experiments also need to be carried out to investigate
the generation of fine jets with non-Newtonian liquids.
6.3 Cell Printing
To fully understand the long-term effects of stress forces on cell viability,
more experiments need to be carried out to collect quantitative data for cell
adhesion, cell spreading and cell migration, and cell proliferation. It is also of
interesting to compare our cell viability results with cells in other fluidic
systems, under similar shear stress forces. Future studies could also involve
experiment with more mammalian cell types. It is also of interest to check
whether adding ligands or collagen into the alginate (before the crosslinking
reactions) will promote cell adhesion onto the substrate. If this can be

Chapter 6: Recommendations For Future Work
160 of 176
successfully implemented, the accuracy of the pattern printing will be
significantly improved.

Bibliography
161 of 176
Bibliography
1. Kyocera Corporation, website cited:
http://global.kyocera.com/news/2009/0903_kdos.html
2. P. Calvert: “Printing cells”, Science, Vol. 318, No. 5848, 2007, pp. 208-
209.
3. R. Chang, J. Nam, W. Sun: “Effects of dispensing pressure and nozzle
diameter on cell survival from solid freeform fabrication-based direct cell
writing”, Tissue Engineering Part A, Vol. 14, No. 1, 2008, pp. 41-48.
4. T. Xu, J. Jin, C. Gregory, J. J. Hichman, T. Boland: “Inkjet printing of
viable mammalian cells”, Biomaterials, Vol. 26, No. 1, 2005, pp. 93-99.
5. T. Xu, S. Petridou, E. H. Lee, E. A. Roth, N. R. Vyavahare, J. J. Hickman,
T. Boland: “Construction of high-density bacterial colony arrays and
patterns by the ink-jet method”, Biotechnology and Bioengineering, Vol.
85, No. 1, 2004, pp. 29-33.
6. C. Y. Chen, J. A. Barron, B. R. Ringeisen: “Cell patterning without
chemical surface modification: Cell-cell interactions between printed
bovine aortic endothelial cells (BAEC) on a homogeneous cell-adherent
hydrogel”, Applied Surface Science, Vol. 252, No. 24, 2006, pp. 8641-
8645.
7. J. A. Barron, D. B. Krizman, B. R. Ringeisen: “Laser printing of single
cells: statistical analysis, cell viability, and stress”, Annals of Biomedical
Engineering, Vol. 33, No. 2, 2005, pp. 121-130.
8. M. Nakamura, A. Kobayashi, F. Takagi, A. Watanabe, Y. Hiruma, K.
Ohuchi, Y. Iwasaki, M. Horie, I. Morita, S. Takatani: “Biocompatible
inkjet printing technique for designed seeding of individual living cells”,
Tissue Engineering, Vol. 11, No. 11-12, 2005, pp. 1658-1666.
9. R. E. Saunders, J. E. Gough, B. Derby: “Delivery of human fibroblast
cells by piezoelectric drop-on-demand inkjet printing”, Biomaterials, Vol.
29, No. 2, 2008, pp. 193-203.
10. T. Xu, C. A. Gregory, P. Molnar, X. Cui, S. Jalota, S. B. Bhaduri, T.
Boland: “Viability and electrophysiology of neural cell structures
generated by the inkjet printing method”, Biomaterials, Vol. 27, No. 19,
2006, pp. 3580-3588.
11. Cambridge Display Technology, Ltd., website cited:
http://www.tinhoahoc.com/Semiconductor/IJ-PLED1.pdf

Bibliography
162 of 176
12. B. J. de Gans, P. C. Duineveld, U. S. Schubert: “Inkjet printing of
polymers: state of the art and future developments”, Advanced Materials,
Vol. 16, No. 3, 2004, pp. 203-213.
13. S. E. Molesa: “Ultra-low-cost printed electronics”, Ph.D thesis from
University of California at Berkeley, 2006.
14. D. H. Redinger: “Solution processing techniques for low-cost circuit
fabrication”, Ph.D thesis from University of California at Berkeley, 2007.
15. C. W. Sele, T. von Werne, R. H. Friend, H. Sirringhaus: “Lithography-
free, self-aligned inkjet printing with sub-hundred-nanometer resolution”,
Advanced Materials, Vol. 17, No. 8, 2005, pp. 997-1001.
16. D. J. Gundlach, T. N. Jackson, D. G. Schlom, S. F. Nelson: “Solvent-
induced phase transition in thermally evaporated pentacene films”,
Applied Physics Letters, Vol. 74, No. 22, 1999, pp. 3302-3304.
17. J. Perelaer, B. J. de Gans, U. S. Schubert: “Ink-jet printing and microwave
sintering of conductive silver tracks”, Advanced Materials, Vol. 18, No.
16, 2006, pp. 2101-2104.
18. N. Stutzmann, R. H. Friend, H. Sirringhaus: “Self-aligned, vertical-
channel, polymer field-effect transistors”, Science, Vol. 299, No. 5614,
2009, pp. 1881-1884.
19. Y. Wang: “Applying drop-on-demand inkjet printing method to maskless
lithography”, Ph.D thesis from University of California at Berkeley, 2005.
20. H. Sirringhaus, T. Kawase, R. H. Friend, T. Shimoda, M. Inbasekaran, W.
Wu, E. P. Woo: “High-resolution inkjet printing of all-polymer transistor
circuits”, Science, Vol. 290, 2000, pp. 2123-2126.
21. A. U. Chen, O. A. Basaran: “A new method for significantly reducing
drop radius without reducing nozzle radius in drop-on-demand drop
production”, Physics of Fluids, Vol. 14, No. 1, 2002, pp. L1-L4.
22. A. A. Goghari, S. Chandra: “Producing droplets smaller than the nozzle
diameter by using a pneumatic drop-on-demand droplet generator”,
Experiments in Fluids, Vol. 44, No. 1, 2008, pp. 105-114.
23. C. Rensch: “Creation of small microdrops”, MicroFab Technologies Inc.,
Oct 2006.
24. H. Y. Gan, X. Shan, T. Eriksson, B. K. Lok, Y. C. Lam: “Reduction of
droplet volume by controlling actuating waveforms in inkjet printing for
micro-pattern formation”, Journal of micromechanics and
microengineering, Vol. 19, 2009, 055010.

Bibliography
163 of 176
25. N. Riefler, T. Wriedt: “Generation of monodisperse micron-sized droplets
using free adjustable signals”, Particle & Particle Systems
Characterization, Vol. 25, No. 2, 2008, pp. 176-182.
26. H. P. Le: “Progress and Trends in Ink-jet Printing Technology”, Journal
of Imaging Science and Technology, Vol. 42, No. 1, 1998, pp. 49-62.
27. L. Rayleigh: “On the instability of jets”, Proceedings of the London
Mathematical Society, Vol. 10, No. 4, 1878, pp. 4-13.
28. J. Heinzl, C. H. Hertz: “Ink-jet printing,” Advances in Electronics and
Electron Physics, Vol. 65, 1985, pp. 91–171.
29. A. Mikalesen: “Ink jet apparatus and method employing phase change
ink”, US Patent No. 4,742,364, 1988.
30. A. Benjeddou: “Shear-mode piezoceramic advanced materials and
structures: a state of the art”, Mechanics of Advances Materials and
Structures, Vol. 14, No. 4, 2007, pp. 263-275.
31. H. R. Kang: “Water-based ink-jet ink. 3. performances studies”, Journal
of Imaging Science, Vol. 35, No. 3, 1991, pp. 195-201.
32. S. C. Chang, J. Liu, J. Bharathan, Y, Yang, J. Onohara, J. Kido:
“Multicolor Organic Light-Emitting Diodes Processed by Hybrid Inkjet
Printing”, Advanced Materials, Vol. 11, No. 9, 1999, pp. 734-737.
33. M. Singh, H. M. Haverinen, P. Dhagat, G. E. Jabbour: “Inkjet printing -
progress and its applications”, Advanced Materials, Vol. 22, 2010, pp.
673-685.
34. R. D. Deegan, O. Bakajin, T. F. Dupont, G. Huber, S. R. Nagel, T. A.
Witten: “Capillary flow as the cause of ring stains from dried liquid
drops”, Nature, Vol. 389, 1997, pp. 827-829.
35. M. Ikegawa, H. Azuma: “Droplet behaviors on substrates in thin-film
formation using ink-jet printing”, JSME International Journal Series B:
Fluids and Thermal Engineering, Vol. 47, No. 3, 2004, pp. 490-496.
36. Xaar, website cited: http://www.xaar.com/printheads.aspx
37. MicroFab Technologies, Inc., website cited:
http://www.microfab.com/equipment/systems.html
38. M. A. Groninger, P. G. M. Kruijt, H. Reinten, R. H. Schippers, J. M. M.
Simons: “Method of controlling an inkjet printhead, an inkjet printhead
suitable for use of said method, and an inkjet printer comprising said
printhead”, US Patent 7,357,474, 2008.

Bibliography
164 of 176
39. K. S. Kwon: “Waveform design methods for piezo inkjet dispensers based
on measured meniscus motion”, Journal of Microelectromechanical
Systems, Vol. 18, No. 5, 2009, pp. 1118-1125.
40. K. S. Kwon, W. Kim: “A waveform design method for high-speed inkjet
printing based on self-sensing measurement”, Sensors and Actuators: A,
Vol. 140, 2007, pp. 75-83.
41. S. Bruner, D. Xu, C. Phillips: “Drop landing accuracy improvements in
inkjet printed OLED displays”, SID Symposium Digest of Technical
Papers, Vol. 38, 2007, pp. 1611-1612.
42. M. McDonald: “Manufacture of flat panel displays using piezoelectric
drop-on-demand ink jet”, SID Symposium Digest of Technical Papers,
Vol. 34, 2003, pp. 1186-1189.
43. T. Shimoda, K. Morii, S. Seki, H. Kiguchi: “Inkjet printing of light-
emitting polymer displays”, MRS Bulletin, Vol. 28, 2003, pp. 821-827.
44. R. A. Street, W. S. Wong, S. E. Ready, M. L. Chabinyc, A. C. Arias, S.
Limb, A. Salleo, R. Lujan: “Jet printing flexible displays”, Materials
Today, Vol. 9, No. 4, 2006, pp. 32-37.
45. J. X. Zhou, J. Y. H. Fuh, H. T. Loh, Y. S. Wong, Y. S. Ng, J. G. Jeffrey, S.
J. Chua: “Characterization of drop-on-demand microdroplet printing”,
The International Journal of Advanced Manufacturing Technology, Vol.
48, 2010, pp. 243-250.
46. D. Soltman, V. Subramanian: “Inkjet-printed line morphologies and
temperature control of the coffee ring effect”, Langmuir, Vol. 24, No. 5,
2008, pp. 2224-2231.
47. P. J. Smith, D. Y. Shin, J. E. Stringer, B. Derby, N. Reis: “Direct ink-jet
printing and low temperature conversion of conductive silver patterns”,
Journal of Materials Science, Vol. 41, 2006, pp. 4153-4158.
48. J. F. Dijksman: “Hydrodynamics of small tubular pumps”, Journal of
Fluid Mechanics, Vol. 139, 1984, pp. 173-191.
49. J. E. Fromm: “Numerical calculation of the fluid dynamics of drop-on-
demand jets”, IBM Journal of Research and Development, Vol. 28, No. 3,
1984, pp. 322-333.
50. E. B. Wylie, V. L. Streeter: “Fluid Transients”, New York: McGraw-Hill,
1978.
51. N. Reis, C. Ainsley, B. Derby: “Ink-jet delivery of particle suspensions by
piezoelectric droplet ejectors”, Journal of Applied Physics, Vol. 97, 2005,
094903.

Bibliography
165 of 176
52. D. B. Bogy, F. E. Talke: “Experimental and theoretical study of wave
propagation phenomena in drop-on-demand ink jet devices”, IBM Journal
of Research and Development, Vol. 28, No. 3, 1984, pp. 314-321.
53. H. Wijshoff: “Free surface flow and acousto-elastic interaction in piezo
inkjet”, Technical Proceedings of the 2004 NSTI Nanotechnology
Conference and Trade Show, Vol. 2, 2004, 215-218.
54. H. C. Wu, H. J. Lin, W. S. Hwang: “A numerical study of the effect of
operating parameters on drop formation in a squeeze mode inkjet device”,
Modelling and Simulation in Materials Science and Engineering, Vol. 13,
2005, pp. 17-34.
55. H. C. Wu, T. R. Shan, W. S. Hwang, H. J. Lin: “Study of micro-droplet
behavior for a piezoelectric inkjet printing device using a single pulse
voltage pattern”, Materials Transactions, Vol. 45, No. 5, 2004, pp. 1794-
1801.
56. R. Li, N. Ashgriz, S. Chandra: “Droplet generation from pulsed micro-
jets”, Experimental Thermal and Fluid Science, Vol. 32, No. 8, 2008, pp.
1679-1686.
57. A. S. Yang, W. M. Tsai: “Ejection process simulation for a piezoelectric
microdroplet generator”, Transactions of the American Society of
Mechanical Engineers, Vol. 128, No. 6, 2006, pp. 1144-1152.
58. Y. Wang, J. Bokor, A. Lee: “Maskless lithography using drop-on-demand
inkjet printing method”, Proceedings of SPIE, Vol. 5374, 2004, pp. 628-
636.
59. B. J. de Gans, E. Kazancioglu, W. Meyer, U. S. Schubert: “Ink-jet
printing polymers and polymer libraries using micropipettes”,
Macromolecular Rapid Communications, Vol. 25, No. 1, 2004, pp. 292-
296.
60. Microfab Technote 99-03: “Drive waveform effects on ink-jet device
performance”, 1999.
61. S. L. Zoltan: “Pulse droplet ejection system”, US Patent 3,683,212, 1974.
62. K. A. M. Seerden, N. Reis, J. R. G. Evans, P. S. Grant, J. W. Halloran, B.
Derby: “Ink-jet printing of wax-based alumina suspensions”, Journal of
The American Ceramic Society, Vol. 84, No. 11, 2001, pp. 2514-2520.
63. H. Dong, W. W. Carr, J. F. Morris: “An experimental study of drop-on-
demand drop formation”, Physics of Fluids, Vol. 18, 2006, 072102.
64. H. Dong, W. W. Carr, J. F. Morris: “Visualization of drop-on-demand
inkjet: Drop formation and deposition”, Review of Scientific Instruments,
Vol. 77, 2006, 085101.

Bibliography
166 of 176
65. H. J. Shore, G. M. Harrison: “The effect of added polymers on the
formation of drops ejected from a nozzle”, Physics of Fluids, Vol. 17,
2005, 033104.
66. F. G. Tseng, C. J. Kim, C. M. Ho: “A high-resolution high-frequency
monolithic top-shooting microinjector free of satellite drops-Part I:
concept, design, and model”, Journal of Microelectromechanical Systems,
Vol. 11, No. 5, 2002, pp. 427-436.
67. Boston Piezo-Optics Inc, website cited:
http://bostonpiezooptics.com/?D=6
68. E. R. Lee: “Microdrop generation”, London: CRC Press, 2003.
69. D. J. Hayes, D. B. Wallace: “Overview of small holes”, Non Traditional
Machining Conference, MS89184, Orlando, Florida, November 1989.
70. H. Robert: “Properties of crystalline silicon”, London: The Institution of
Electrical Engineers, 1999.
71. E. Bassous, H. H. Taub, L. Kuhn: “Ink jet printing nozzle arrays etched in
silicon”, Applied Physics Letters, Vol. 31, No. 2, 1977, pp. 135-137.
72. L. Kuhn, E. Bassous, R. Lane: “Silicon charge electrode array for ink jet
printing”, IEEE Transactions on Electron Devices, Vol. ED-25, No. 10,
1978, pp. 1257-1260.
73. T. Laurell, L. Wallman, J. Nilsson: “Design and development of a silicon
microfabricated flow-through dispenser for on-line picolitre sample
handling”, Journal of Micromechanics and Micro engineering, Vol. 9,
1999, pp. 369-376.
74. R. F. Service: “Printable electronics that stick around”, Science, Vol. 304,
No. 5671, 2004, pp. 675.
75. H. E. Katz: “Recent advances in semiconductor performance and printing
processes for organic transistor-based electronics”, Chemistry of
Materials, Vol. 16, No. 23, 2004, pp. 4748-4756.
76. J. A. Rogers, Z. Bao: “Printed plastic electronics and paperlike displays”,
Journal of Polymer Science: Part A: Polymer Chemistry, Vol. 40, No. 20,
2002, pp. 3327-3334.
77. J. A. Rogers, Z. Bao, K. Baldwin, A. Dodabalapur, B. Crone, V. R. Raju,
V. Kuck, H. Katz, K. Amundson, J. Ewing, P. Drzaic: “Paper-like
electronic displays: large-area rubber-stamped plastic sheets of electronics
and microencapsulated electrophoretic inks”, Proceedings of the National
Academy of Science of the United States of America, Vol. 98, No. 9,
2001, pp. 4835-4840.

Bibliography
167 of 176
78. T. Sekitani, Y. Noguchi, U. Zschieschang, H. Klauk, T. Someya:
“Organic transistors manufactured using inkjet technology with
subfemtoliter accuracy”, Proceedings of the National Academy of
Sciences of the United States of America, Vol. 105, No. 13, 2008, pp.
4976-4980.
79. N. Zhao, M. Chiesa, H. Sirringhaus, Y. Li, Y. Wu, B. Ong: “Self-aligned
inkjet printing of highly conducting gold electrodes with submicron
resolution”, Journal of Applied Physics, Vol. 101, No. 6, 2007, 064513.
80. J. Z. Wang, J. Gu, F. Zenhausern, H. Sirringhaus: “Low-cost fabrication
of submicron all polymer field effect transistors”, Applied Physics Letters,
Vol. 88, No. 13, 2006, 133502.
81. J. Z. Wang, Z. H. Zheng, H. W. Li, W. T. S. Huck, H. Sirringhaus:
“Dewetting of conducting polymer inkjet droplets on patterned surfaces”,
Nature Materials, Vol. 3, No. 3, 2004, pp. 171-176.
82. M. Caironi, E. Gili, T. Sakanoue, X. Cheng, H. Sirringhaus: “High yield,
single droplet electrode arrays for nanoscale printed electronics”, Acs
Nano, Vol. 4, No. 3, 2010, pp. 1451-1456.
83. B. J. de Gans, S. Hoeppener, U. S. Schubert: “Polymer relief
microstructures by inkjet etching”, Journal of Materials Chemistry, Vol.
17, 2007, pp. 3045-3050.
84. C. Y. Kung, M. D. Barnes, N. Lermer, W. B. Whitten, J. M. Ramsey:
“Single-molecule analysis of ultradilute solutions with guided streams of
1-µm water droplets”, Applied Optics, Vol. 38, No. 9, 1999, pp. 1481-
1487.
85. S. Temple: “Small fast inkdrop emission from a nozzle”, 43rd
European
Study Group with Industry Technical Report, Lancaster University, UK
2002.
86. J. U. Park, M. Hardy, S. J. Kang, K. Barton, K. Adair, D. K.
Mukhopadhyay, C. Y. Lee, M. S. Strano, A. G. Alleyne, J. G. Georgiadis,
P. M. Ferreira, J. A. Rogers: “High-resolution electrohydrodynamic jet
printing”, Nature Materials, Vol. 6, No. 10, 2007, pp. 782-789.
87. S. N. Jayasinghe, M. J. Edirisinghe: “Electric-field driven jetting from
dielectric liquids”, Applied Physics Letters, Vol. 85, No. 18, 2004, pp.
4243-4245.
88. S. N. Jayasinghe, A. N. Qureshi, P. A. M. Eagles: “Electrohydrodynamic
jet processing: an advanced electric-field-driven jetting phenomenon for
processing living cells”, Small, Vol. 2, No. 2, 2006, pp. 216-219.

Bibliography
168 of 176
89. I. Marginean, L. Parvin, L. Heffernan, A. Vertes: “Flexing the electrified
meniscus: the birth of a jet in electrosprays”, Analytical Chemistry, Vol.
76, No. 14, 2004, pp. 4202-4207.
90. G. Taylor: “Disintegration of water drops in an electric field”,
Proceedings of the Royal Society of London. Series A, Mathematical and
Physical Sciences, Vol. 280, No. 1382, 1964, pp. 383-397.
91. J. F. de la Mora: “The fluid dynamics of Taylor cones”, Annual Review of
Fluid Mechanics, Vol. 39, 2007, pp. 217-243.
92. H. K. Choi, J. U. Park, O. O. Park, P. M. Ferreira, J. G. Georgiadis, J. A.
Rogers: “Scaling laws for jet pulsations associated with high-resolution
electrohydrodynamic printing”, Applied Physics Letters, Vol. 92, No. 12,
2008, 123109.
93. K. Murata, J. Matsumoto, A. Tezuka, Y. Matsuba, H. Yokoyama: “Super-
fine ink-jet printing: toward the minimal manufacturing system”,
Microsystem Technologies-Micro-and Nanosystems-Information Storage
and Processing Systems, Vol. 12, 2005, pp. 2-7.
94. C. H. Chen, D. A. Saville, I. A. Aksay: “Scaling laws for pulsed
electrohydrodynamic drop formation”, Applied Physics Letters, Vol. 89,
No. 12, 2006, 124103.
95. J. L. Li: “On the meniscus deformation when the pulsed voltage is
applied”, Journal of Electrostatics, Vol. 64, No. 1, 2006, pp. 44-52.
96. J. L. Li: “EHD sprayings induced by the pulsed voltage superimposed to a
bias voltage”, Journal of Electrostatics, Vol. 65, No. 12, 2007, pp. 750-
757.
97. J. L. Li: “On the stability of electrohydrodynamic spraying in the cone-jet
mode”, Journal of Electrostatics, Vol. 65, No. 4, 2007, pp. 251-255.
98. W. Balachandran, W. Machowski, C. N. Ahmad: “Electrostatic
atomization of conducting liquids using AC superimposed on DC fields”,
IEEE Transactions on Industry Applications, Vol. 30, No. 4, 1994, pp.
850-855.
99. Y. J. Kim, J. S. Lee, S. Y. Kim, S. E. Park, J. Hwang, Y. J. Kim: “Hybrid
on demand jetting system for ultra fine droplet based on
electrohydrodynamic and piezoelectric actuation”, IEEE 22nd
International Conference on Micro Electro Mechanical Systems, 2009, pp.
491-494.
100. Y. J. Kim, S. Y. Kim, J. S. Lee, J. Hwang, Y. J. Kim: “On-demand
electrohydrodynamic jetting with meniscus control by a piezoelectric
actuator for ultra-fine patterns”, Journal of Micromechanics and
Microengineering, Vol. 19, No. 10, 2009, 107001.

Bibliography
169 of 176
101. H. Yamazoe, T. Tanabe: “Cell micropatterning on an albumin-based
substrate using an inkjet printing technique”, Journal of Biomedical
Materials Research: Part A, Vol. 91A, No. 4, 2009, pp. 1202-1209.
102. Y. Ito: “Surface micropatterning to regulate cell functions”, Biomaterials,
Vol. 20, No. 23-24, 1999, pp. 2333-2342.
103. S. Takahashi, Y. Tomikawa: “A study of handling of living mammalian
cells using a piezoelectric dispensing head”, Japanese Journal of Applied
Physics, Vol. 42, 2003, pp. 3098-3101.
104. Y. Chisti: “Hydrodynamic damage to animal cells”, Critical Reviews in
Biotechnology, Vol. 21, No. 2, 2001, pp. 67-110.
105. C. Born, Z. Zhang, M. Alrubeai, C. R. Thomas: “Estimation of disruption
of animal cells by laminar shear stress”, Biotechnology and
Bioengineering, Vol. 40, No. 9, 1992, pp. 1004-1010.
106. Z. Zhang, M. Alrubeai, C. R. Thomas: “Estimation of disruption of
animal cells by turbulent capillary flow”, Biotechnology and
Bioengineering, Vol. 42, No. 8, 1993, pp. 987-993.
107. B. J. H. Zoro, S. Owen, R. A. L. Drake, M. Hoare: “The impact of process
stress on suspended anchorage-dependent mammalian cells as an indicator
of likely challenges for regenerative medicines”, Biotechnology and
Bioengineering, Vol. 99, No. 2, 2008, pp. 468-474.
108. R. E. Saunders, J. E. Gough, B. Derby: “Inkjet printing of mammalian
primary cells for tissue engineering applications”, In: Laurencin CT,
Botchwey, EA, editors, Nanoscale Materials Science in Biology and
Medicine, Boston: MRS, 2005, pp. 57-62.
109. H. J. Kong, M. K. Smith, D. J. Mooney: “Designing alginate hydrogels to
maintain viability of immobilized cells”, Biomaterials, Vol. 24, No. 22,
2003, pp. 4023-4029.
110. L. Shapiro, S. Cohen: “Novel alginate sponges for cell culture and
transplantation”, Biomaterials, Vol. 18, No. 8, 1997, pp. 583-590.
111. G. Klock, A. Pfeffermann, C. Ryser, P. Grohn, B. Kuttler, H. J. Hahn, U.
Zimmermann: “Biocompatibility of mannuronic acid-rich alginates”,
Biomaterials, Vol. 18, No. 10, 1997, pp. 707-713.
112. E. Alsberg, K.W. Anderson, A. Albeiruti, R. T. Franceschi, D. J. Mooney:
“Cell-interactive alginate hydrogels for bone tissue engineering”, Journal
of Dental Research, Vol. 80, No. 11, 2001, pp. 2025-2029.
113. A. D. Augst, H. J. Kong, D. J. Mooney: “Alginate hydrogels as
biomaterials”, Macromolecular Bioscience, Vol. 6, No. 8, 2006, pp. 623-
633.

Bibliography
170 of 176
114. N. E. Fedorovich, J. Alblas, J. R. de Wijn, W. E. Hennink, A. J. Verbout,
W. J. A. Dhert: “Hydrogels as extracellular matrices for skeletal tissue
engineering: state-of-the-art and novel application in organ printing”,
Tissue Engineering, Vol. 13, No. 8, 2007, pp. 1905-1925.
115. B. K. Mann, A. T. Tsai, T. Scott-Burden, J. L. West: “Modification of
surfaces with cell adhesion peptides alters extracellular matrix deposition”,
Biomaterials, Vol. 20, No. 23-24, 1999, pp. 2281-2286.
116. S. P. Massia, J. A. Hubbell: “Covalent surface immobilization of Arg-
Gly-Asp- and Tyr-Ile-Glv-Ser-Arg-containing peptides to obtain well-
defined cell-adhesive substrates”, Analytical Biochemistry, Vol. 187, No.
2, 1990, pp. 292-301.
117. K. C. Olbrich, T. T. Andersen, F. A. Blumenstock, R. Bizios: “Surfaces
modified with covalently-immobilized adhesive peptides affect fibroblast
population motility”, Biomaterials, Vol. 17, No. 8, 1996, pp. 759-764.
118. J. A. Rowley, G. Madlambayan, D. J. Mooney: “Alginate hydrogels as
synthetic extracellular matrix materials”, Biomaterials, Vol. 20, No. 1,
1999, pp. 45-53.
119. M. G. Patino, M. E. Neiders, S. Andreana, B. Noble, R. E. Cohen:
“Collagen: an overview”, Implant Dentistry, Vol. 11, No. 3, 2002, pp.
280-285.
120. F. H. Silver, G. Pins: “Cell-growth on collagen-a review of tissue
engineering using scaffolds containing extracellular-matrix”, Journal of
Long-Term Effects of Medical Implants, Vol. 2, No. 1, 1992, pp. 67-80.
121. W. Sun: “Computer-aided tissue engineering, Part II”, Tutorial
Presentation at CAD/CG’05, Hong Kong University of Science and
Technology, 2005.
122. R. Landers, U. Hübner, R. Schmelzeisen, R. Mülhaupt: “Rapid
prototyping of scaffolds derived from thermoreversible hydrogels and
tailored for applications in tissue engineering”, Biomaterials, Vol. 23, No.
23, 2002, pp. 4437-4447.
123. W. Y. Yeong, C. K. Chua, K. F. Leong, M. Chandrasekaran: “Rapid
prototyping in tissue engineering: challenges and potential”, Trends in
Biotechnology, Vol. 22, No. 12, 2004, pp. 643-652.
124. B. S. Kim, D. J. Mooney: “Development of biocompatible synthetic
extracellular matrices for tissue engineering”, Trends in Biotechnology,
Vol. 16, No. 5, 1998, pp. 224-230.
125. A. Ovsianikov, M. Gruene, M. Pflaum, L. Koch, F. Maiorana, M.
Wilhelmi, A. Haverich, B. Chichkov: “Laser printing of cells into 3D
scaffolds”, Biofabrication, Vol. 2, No. 1, 2010, 014104.

Bibliography
171 of 176
126. H. Lo, M. S. Ponticiello, K. W. Leong: “Fabrication of controlled release
biodegradable foams by phase separation”, Tissue Engineering, Vol. 1.
No. 1, 1995, pp. 15-28.
127. A. G. Mikos, A. J. Thorsen, L. A. Czerwonka, Y. Bao, R. Langer, D. N.
Winslow, J. P. Vacanti: “Preparation and characterization of poly (L-
lactic acid) foams”, Polymer, Vol. 35, 1994, pp. 1068-1077.
128. D. J. Mooney, D. F. Baldwin, N. P. Suh, J. P. Vacanti, R. Langer: “Novel
approach to fabricate porous sponges of poly (D, L-lactic-co-glycolic acid)
without the use of organic solvents”, Biomaterials, Vol. 17, No. 14, 1996,
pp. 1417-1422.
129. K. Whang, C. H. Thomas, K. E. Healy, G. Nuber: “A novel method to
fabricate bioabsorbable scaffolds”, Polymer, Vol. 36, No. 4, 1995, pp.
837-842.
130. P. X. Ma, R. Y. Zhang: “Microtubular architecture of biodegradable
polymer scaffolds”, Journal of Biomedical Materials Research, Vol. 56,
No. 4, 2001, pp. 469-477.
131. D. W. Hutmacher: “Scaffold design and fabrication technologies for
engineering tissues state of the art and future perspectives”, Journal of
Biomaterials Science, Polymer Edition, Vol. 12, No. 1, 2001, pp. 107-124.
132. R. Landers, R. Mülhaupt: “Desktop manufacturing of complex objects,
prototypes and biomedical scaffolds by means of computer-assisted
design combined with computer-guided 3D plotting of polymers and
reactive oligomers”, Macromolecular Materials and Engineering, Vol. 282,
No. 1, 2000, pp. 17-21.
133. W. Sun, A. Darling, B. Starly, J. Nam: “Computer-aided tissue
engineering: overview, scope and challenges”, Biotechnology and
Applied Biochemistry, Vol. 39, 2004, pp. 29-47.
134. R. A. Barry, R. F. Shepherd, J. N. Hanson, R. G. Nuzzo, P. Wiltzius, J. A.
Lewis: “Direct-write assembly of 3D hydrogel scaffolds for guided cell
growth”, Advanced Materials, Vol. 21, No. 23, 2009, pp. 2407-2410.
135. T. Boland, X. Tao, B. J. Damon, B. Manley, P. Kesari, S. Jalota, S.
Bhaduri: “Drop-on-demand printing of cells and materials for designer
tissue constructs”, Materials Science and Engineering C: Biomimetic and
Supramolecular Systems, Vol. 27, No. 3, 2007, pp. 372-376.
136. T. Boland, V. Mironov, A. Gutowska, E. A. Roth, R. R. Markwald: “Cell
and organ printing 2: fusion of cell aggregates in three-dimensional gels”,
Anatomical Record Part A: Discoveries in Molecular Cellular and
Evolutionary Biology, Vol. 272A, No. 2, 2003, pp. 497-502.

Bibliography
172 of 176
137. V. Mironov, T. Boland, G. Forgacs, R. R. Markwald: “Organ printing:
computer-aided jet-based 3D tissue engineering”, Trends in
Biotechnology, Vol. 21, No. 4, 2003, pp. 157-161.
138. Website cited:
http://images.google.com.sg/imglanding?q=organ%20printing&imgurl=ht
tp://www.newscientist.com/data/images/ns/cms/dn3292/dn3292-
2_587.jpg&imgrefurl=http://3d-
print.in/%3Fp%3D10&usg=__x2XuY73RdyXWWQpViuXNmmpmDrI=
&h=388&w=587&sz=35&hl=en&um=1&itbs=1&tbnid=0j4Vymt6KgiHh
M:&tbnh=89&tbnw=135&prev=/images%3Fq%3Dorgan%2Bprinting%2
6um%3D1%26hl%3Den%26sa%3DN%26rlz%3D1R2ADFA_enSG346%
26tbs%3Disch:1&um=1&sa=N&rlz=1R2ADFA_enSG346&tbs=isch:1&s
tart=11#tbnid=0j4Vymt6KgiHhM&start=15
139. S. Moon, S. K. Hasan, Y. S. Song, F. Xu, H. O. Keles, F. Manzur, S.
Mikkilineni, J. W. Hong, J. Nagatomi, E. Haeggstrom, A.
Khademhosseini, U. Demirci: “Layer by layer three-dimensional tissue
epitaxy by cell-laden hydrogel droplets”, Tissue Engineering Part C:
Methods, Vol. 16, No. 1, 2010, pp. 157-166.
140. E.Q. Li, S.T. Thoroddsen, J.Y.H. Fuh, S.C.H. Thian, Y.S. Wong, H.T.
Loh, L. Lu, PET-based piezoelectric squeeze mode microjetting printhead
with interchangeable nozzles, Provisional US Patent (2009) Serial No.
61/226781.
141. Y. Nishiyama, M. Nakamura, C. Henmi, K. Yamaguchi, S. Mochizuki, H.
Nakagawa, K. Takiura: “Development of a three-dimensional bioprinter:
construction of cell supporting structures using hydrogel and state-of-the-
art inkjet technology”, Journal of Biomechanical Engineering -
Transaction of The ASME, Vol. 131, No. 3, 2009, 035001.
142. J. D. Kim, J. S. Choi, B. S. Kim, Y. C. Choi, Y. W. Cho: “Piezoelectric
inkjet printing of polymers: stem cell patterning on polymer substrates”,
Polymer, 2010, article in press.
143. S. Ilkhanizadeh, A. I. Teixeira, O. Hermanson: “Inkjet printing of
macromolecules on hydrogels to steer neural stem cell differentiation”,
Biomaterials, Vol. 28, No. 27, 2007, pp. 3936-3943.
144. E. A. Roth, T. Xu, M. Das, C. Gregory, J. J. Hickman, T. Boland: “Inkjet
printing for high-throughput cell patterning”, Biomaterials, Vol. 25, No.
17, 2004, pp. 3707-3715.
145. N. E. Sanjana, S. B. Fuller: “A fast flexible ink-jet printing method for
patterning dissociated neurons in culture”, Journal of Neuroscience
Methods, Vol. 136, No. 2, 2004, pp. 151-163.
146. G. M. Whitesides, B. Grzybowski: “Self-assembly at all scales”, Science,
Vol. 295, No. 5564, 2002, pp. 2418-2421.

Bibliography
173 of 176
147. Z. C. Liu, Y. Su, K. Varahramyan: “Inkjet-printed silver conductors using
silver nitrate ink and their electrical contacts with conducting polymers”,
Thin Solid Films, Vol. 478, No. 1-2, 2005, pp. 275–279.
148. W. Feng, J. Y. H. Fuh, Y. S. Wong: “Development of a drop-on-demand
micro dispensing system”, Materials Science Forum, Vol. 505-507, 2006,
pp. 25-29.
149. B. M. Wu, S. W. Borland, R. A. Giordano, L. G. Cima, E. M. Sachs, M. J.
Cima: “Solid free-form fabrication of drug delivery devices”, Journal of
Controlled Release, Vol. 40, No. 1-2, 1996, pp. 77-87.
150. T. Kawase, T. Shimoda, C. Newsome, H. Sirringhaus, R. H. Friend:
“Inkjet printing of polymer thin film transistors”, Thin Solid Films, Vol.
438, 2003, pp. 279-287.
151. K. X. Steirer, J. J. Berry, M. O. Reese, M. F. A. M. van Hest, A. Miedaner,
M. W. Liberatore, R. T. Collins, D. S. Ginley: “Ultrasonically sprayed
and inkjet printed thin film electrodes for organic solar cells”, Thin Solid
Films, Vol. 517, No. 8, 2009, pp. 2781-2786.
152. D. Xu, V. Sanchez-Romaguera, S. Barbosa, W. Travis, J. de Wit, P. Swan,
S. G. Yeates: “Inkjet printing of polymer solutions and the role of chain
entanglement”, Journal of Materials Chemistry, Vol. 17, No. 46, 2007, pp.
4902-4907.
153. K. C. Fan, J. Y. Chen, C. H. Wang, W. C. Pan: “Development of a drop-
on-demand droplet generator for one-drop-fill technology”, Sensors and
Actuators: A - Physical, Vol. 147, No. 2, 2008, pp. 649-655.
154. J. de Jong, G. de Bruin, H. Reinten, M. van den Berg, H. Wijshoff, M.
Versluis, D. Lohse: “Air entrapment in piezo-driven inkjet printheads”,
Journal of Acoustical Society of America, Vol. 120, No. 3, 2006, pp.
1257-1265.
155. J. de Jong, H. Reinten, H. Wijshoff, M. van den Berg, K. Delescen, R. van
Dongen, F. Mugele, M. Versluis, D. Lohse: “Marangoni flow on an inkjet
nozzle plate”, Applied Physics Letters, Vol. 91, No. 20, 2007, 204102.
156. B. Beulen, J. de Jong, H. Reinten, M. van den Berg, H. Wijshoff, R. van
Dongen: “Flows on the nozzle plate of an inkjet printhead”, Experiments
in Fluids, Vol. 42, No. 2, 2007, pp. 217-224.
157. B. H. Kim, T. G. Kim, T. K. Lee, S. Kim, S. J. Shin, S. J. Kim, S. J. Lee:
“Effects of trapped air bubbles on frequency responses of the piezo-driven
inkjet printheads and visualization of the bubbles using synchrotron X-
ray”, Sensors and Actuators A: Physical, Vol. 154, No. 1, 2009, pp. 132-
139.

Bibliography
174 of 176
158. S. J. Lee, D. H. Kwon, Y. S. Choi: “Dynamics of entrained air bubbles
inside a piezodriven inkjet printhead”, Applied Physics Letters, Vol. 95,
No. 22, 2009, 221902.
159. J. de Jong, R. Jeurissen, H. Borel, M. van den Berg, H. Wijshoff, H.
Reinten, M. Versluis, A. Prosperetti, D. Lohse: “Entrapped air bubbles in
piezo-driven inkjet printing: Their effect on the droplet velocity”, Physics
of Fluids, Vol. 18, No. 12, 2006, 121511.
160. H. Wijshoff: “Structure- and fluid-dynamics in piezo inkjet printheads”,
Ph.D. Thesis, University of Twente, The Netherlands, 2008.
161. K.S. Kwon: “Methods for detecting air bubble in piezo inkjet dispensers”,
Sensors and Actuators A: Physical, Vol. 153, 2009, pp. 50-56.
162. A. M. Worthington: “A study of Splashes”, Longmans and Green, London,
1908; reprint by Macmillan, Basingstoke, 1963.
163. M. Rein: “Phenomena of liquid drop impact on solid and liquid surfaces,”
Fluid Dynamics Research, Vol. 12, No. 2, 1993, pp. 61-93.
164. S. T. Thoroddsen, A. Q. Shen: “Granular jets,” Physics of Fluids, Vol. 13,
No. 1, 2001, pp. 4-6.
165. D. Lohse, R. Bergmann, R. Mikkelsen, C. Zeilstra, D. van der Meer, M.
Versluis, K. van der Weele, M. van der Hoef, H. Kuipers: “Impact on soft
sand: Void collapse and jet formation,” Physical Review Letters, Vol. 93,
No. 19, 2004, 198003.
166. J. R. Royer, E. I. Corwin, A. Flior, M.-L. Cordera, M. L. Rivers, P. J. Eng,
H. M. Jeager: “Formation of granular jets observed by high-speed x-ray
radiography,” Nature Physics, Vol. 1, 2005, pp. 164-167.
167. A. Antkowiak, N. Bremond, J. Duplat, S. Le Dizes, E. Villermaux:
“Cavity jets”, Physics of Fluids, Vol. 19, No. 9, 2007, 091112.
168. A. Antkowiak, N. Bremond, S. Le Dizes, E. Villermaux: “Short-term
dynamics of a density interface following an impact”, Journal of Fluid
Mechanics, Vol. 577, 2007, pp. 241-250.
169. J. O. Marston, S. T. Thoroddsen: “Apex jets from impacting drops”, The
Journal of Fluid Mechanics, Vol. 614, 2008, pp. 293-302.
170. S. T. Thoroddsen, K. Takehara, T. G. Etoh, C. D. Ohl: “Spray and
microjets produced by focusing a laser into a hemispherical drop”,
Physics of Fluids, Vol. 21, No. 11, 2009, 112101.
171. S. T. Thoroddsen, T. G. Etoh, K. Takehara: “Microjetting from wave
focusing on oscillating drops”, Physics of Fluids, Vol. 19, No. 5, 2007,
052101.

Bibliography
175 of 176
172. A. L. Yarin: “Drop impact dynamics: Splashing, spreading, receding,
bouncing”, Annual Review of Fluid Mechanics, Vol. 38, 2006, pp. 159-
192.
173. D. Bartolo, C. Josserand, D. Bonn: “Singular jets and bubbles in drop
impact”, Physical Review Letters, Vol. 96, No. 12, 2006, 124501.
174. B. W. Zeff, B. Kleber, J. Fineberg, D. P. Lathrop: “Singularity dynamics
in curvature collapse and jet eruption on a fluid surface”, Nature, Vol. 403,
No. 6768, 2000, pp. 401-404.
175. M. P. Brenner: “Fluid mechanics - jets from a singular surface”, Nature,
Vol. 403, No. 6768, 2000, pp. 377-378.
176. T. G. Etoh, D. Poggemann, G. Kreider, H. Mutoh, A. J. P. Theuwissen, A.
Ruckelshausen, Y. Kondo, H. Maruno, K. Takubo, H. Soya, K. Takehara,
T. Okinaka, Y. Takano: “An image sensor which captures 100
consecutive frames at 1,000,000 frames/s”, IEEE Transactions on
Electron Devices, Vol. 50, No. 1, 2003, pp. 144-151.
177. M. S. Barrow, S. W. J. Brown, P. R. Williams: “Extensional flow of
liquid jets formed by bubble collapse in oils under cavitation-generated
pressure waves”, Experiments in Fluids, Vol. 36, 2004, pp. 463-472.
178. S. T. Thoroddsen, T. G. Etoh, K. Takehara, N. Ootsuka: “On the
coalescence speed of bubbles”, Physics of Fluids, Vol. 17, 2005, 071703.
179. F. H. Zhang, S. T. Thoroddsen: “Satellite generation during bubble
coalescence”, Physics of Fluids, Vol. 20, No. 2, 2008, 022104.
180. L. Duchemin, S. Popinet, C. Josserand, S. Zaleski: “Jet formation in
bubbles bursting at a free surface”, Physics of Fluids, Vol. 14, No. 9, 2002,
pp. 3000-3008.
181. G. K. Batchelor: “An introduction to fluid dynamics”, London:
Cambridge University Press, 1967.
182. A. Papoulis: “Probability, random variables, and stochastic processes”, 1st
Edition, New York: McGraw-Hill, 1965.
183. C. K. Kuo, P. X. Ma: “Ionically corsslinked alginate hydrogels as
scaffolds for tissue engineering: Part 1. Structure, gelation rate and
mechanical properties”, Biomaterials, Vol. 22, 2001, pp. 511-521.

Publications
176 of 176
Publications
1. E. Q. Li, S. T. Thoroddsen, J. Y. H. Fuh, S. C. H. Thian, Y. S. Wong, H. T.
Loh, L. Lu, PET-based piezoelectric squeeze mode microjetting printhead
with interchangeable nozzles, Provisional US Patent (2009) Serial No.
61/226781.
2. F. H. Zhang, E. Q. Li, S. T. Thoroddsen: “Satellite formation during
coalescence of unequal size drops”, Physics Review Letters, Vol. 102,
104502, 2009.
3. E. Q. Li, J. Y. H. Fuh, Y. S. Wong, S. T. Thoroddsen: “Forming a fine jet in
inkjet printing”, American Physical Society, 62nd
Annual Meeting of the
APS Division of Fluid Dynamics, November 22-24, 2009.
4. E. Q. Li, Q. Xu, J. Sun, J. Y. H. Fuh, Y. S. Wong, S. T. Thoroddsen:
“Design and fabrication of a PET/PTFE-based piezoelectric squeeze mode
drop-on-demand inkjet printhead with interchangeable nozzle”, Sensors
and Actuators A: Physical, article accepted, 2010.
5. E. Q. Li, E. K. Tan, S. T. Thoroddsen: “Piezoelectric Drop-on-Demand
Inkjet Printing of Rat Fibroblast Cells: Survivability Study and Pattern
Printing”, Biotechnology and Bioengineering, 2011. (In Preparation)
Related Documents