STRICTLY CONFIDENTIAL THE FUND’S LENDING FRAMEWORK AND SOVEREIGN DEBT—ANNEXES Approved by Olivier Blanchard, Sean Hagan, Siddharth Tiwari, and José Viñals Prepared by a team from four departments (LEG, MCM, RES, and SPR) led by Geneviève Verdier. Annex I was prepared by Cesar Serra with input from Suchanan Tambunlertchai, Varapat Chensavasdijai, Francisco Roch (all SPR) and Julianne Ams (LEG). Annex II was prepared by Nelson Sobrinho, Charlotte Lundgren and Cesar Serra with input from Christopher Dielmann (all SPR). Annex III was prepared by Kay Chung, Anastasia Guscina, Michael Papaioannou, Gabriel Presciuttini, Miguel Segoviano (all MCM) and Heiko Hesse with input from Tamon Asonuma, Christopher Dielmann, Charlotte Lundgren and Nelson Sobrinho (all SPR). Annex IV was prepared by Heiko Hesse with input from Christopher Dielmann (SPR). Annex V was prepared by Damiano Sandri (RES) and Suchanan Tambunlertchai (SPR). CONTENTS ANNEX I. THE FUND’S EVOLVING APPROACH IN SOVEREIGN DEBT CRISES __________ 4 A. Overview ________________________________________________________________________________ 4 B. The Emerging Markets Debt Crises of the 1980s _________________________________________ 5 C. The Capital Account Crises of 1995–2002 ________________________________________________ 9 D. The Exceptional Access Policy and Sovereign Debt Crises since 2003___________________ 14 References ________________________________________________________________________________ 21 ANNEX II. A REVIEW OF SOVEREIGN DEBT RESTRUCTURINGS SINCE THE 1980s ____ 24 A. Introduction ____________________________________________________________________________ 24 B. Successful Avoidance of Sovereign Debt Restructuring _________________________________ 25 C. Has Debt Restructuring Been Deployed Effectively? ____________________________________ 32 D. Conclusion _____________________________________________________________________________ 45 Appendix Table A1. Samples of Large Public Debt Reductions in Emerging Economies _____________ 46 Table A2. Samples of Debt Distress Episodes Identified Through Rating Downgrades_____ 47 References ________________________________________________________________________________ 49 May 22, 2014

Welcome message from author
This document is posted to help you gain knowledge. Please leave a comment to let me know what you think about it! Share it to your friends and learn new things together.
Transcript

STRICTLY CONFIDENTIAL
THE FUND’S LENDING FRAMEWORK AND SOVEREIGN DEBT—ANNEXES
Approved by Olivier Blanchard,
Sean Hagan,
Siddharth Tiwari, and
José Viñals
Prepared by a team from four departments (LEG, MCM, RES,
and SPR) led by Geneviève Verdier. Annex I was prepared by
Cesar Serra with input from Suchanan Tambunlertchai, Varapat
Chensavasdijai, Francisco Roch (all SPR) and Julianne Ams
(LEG). Annex II was prepared by Nelson Sobrinho, Charlotte
Lundgren and Cesar Serra with input from Christopher
Dielmann (all SPR). Annex III was prepared by Kay Chung,
Anastasia Guscina, Michael Papaioannou, Gabriel Presciuttini,
Miguel Segoviano (all MCM) and Heiko Hesse with input from
Tamon Asonuma, Christopher Dielmann, Charlotte Lundgren
and Nelson Sobrinho (all SPR). Annex IV was prepared by
Heiko Hesse with input from Christopher Dielmann (SPR).
Annex V was prepared by Damiano Sandri (RES) and Suchanan
Tambunlertchai (SPR).
CONTENTS
ANNEX I. THE FUND’S EVOLVING APPROACH IN SOVEREIGN DEBT CRISES __________ 4
A. Overview ________________________________________________________________________________ 4
B. The Emerging Markets Debt Crises of the 1980s _________________________________________ 5
C. The Capital Account Crises of 1995–2002 ________________________________________________ 9
D. The Exceptional Access Policy and Sovereign Debt Crises since 2003 ___________________ 14
References ________________________________________________________________________________ 21
ANNEX II. A REVIEW OF SOVEREIGN DEBT RESTRUCTURINGS SINCE THE 1980s ____ 24
A. Introduction ____________________________________________________________________________ 24
B. Successful Avoidance of Sovereign Debt Restructuring _________________________________ 25
C. Has Debt Restructuring Been Deployed Effectively? ____________________________________ 32
D. Conclusion _____________________________________________________________________________ 45
Appendix
Table A1. Samples of Large Public Debt Reductions in Emerging Economies _____________ 46
Table A2. Samples of Debt Distress Episodes Identified Through Rating Downgrades _____ 47
References ________________________________________________________________________________ 49
May 22, 2014

THE FUND’S LENDING FRAMEWORK AND SOVEREIGN DEBT—ANNEXES
2 INTERNATIONAL MONETARY FUND
ANNEX III. COMPARATIVE COSTS AND BENEFITS OF REPROFILING, BAILOUT, AND
RESTRUCTURING IN GRAY ZONE CASES—MARKET DYNAMICS AND INTERNATIONAL
SPILLOVERS ______________________________________________________________________________ 51
A. Implications of a Reformed Fund Policy Framework on Spreads and Maturity Structures
of Government Debt ______________________________________________________________________ 51
B. Do Reprofilings and Restructurings Have Significantly Different Impacts on Spreads,
Credit Ratings, and Market Access? _______________________________________________________ 58
C. What Factors Affect the Speed at Which Market Conditions Normalize After Different
Types of Restructuring? ___________________________________________________________________ 65
D. How Did Sovereign Distress Spill Across International Borders? ________________________ 70
References ________________________________________________________________________________ 90
ANNEX IV. REPROFILING AND DOMESTIC FINANCIAL STABILITY: RECENT
EXPERIENCES _____________________________________________________________________________ 92
References _______________________________________________________________________________ 102
ANNEX V: POTENTIAL GAINS FROM SLOWER FISCAL CONSOLIDATION ___________ 103
A. Model _________________________________________________________________________________ 104
B. Calibration _____________________________________________________________________________ 105
C. Results _________________________________________________________________________________ 107
References _______________________________________________________________________________ 110
BOXES
AI1. Fund Support for Debt and Debt Service Reduction (DDSR) Operations _______________ 8
AI2. Creditor Bailout in Fund-Supported Programs ________________________________________ 12
AII1. Exiting Debt Distress without Deep Restructuring: Brazil and Turkey _________________ 30
AII2. Estimating the Probability of a Cured Restructuring __________________________________ 40
AII3. Reprofiling in Uruguay _______________________________________________________________ 43
AIII1. The Long-Term Effects of Reprofiling on EM Borrowing Costs _______________________ 54
AIII2. The Vulnerability Index ______________________________________________________________ 79
AIII3. Determinants of Sovereign Risk _____________________________________________________ 82
AIII4. Multivariate GARCH _________________________________________________________________ 88
AIV1. Impact of Sovereign Debt Maturity Extensions on Domestic Bank’s Balance Sheets _ 97
AIV2. Central Bank Liquidity Provision in Past Reprofiling Cases ___________________________ 98
AIV3. Accounting Treatment of Bank Holdings of Government Bonds_____________________ 99
AIV4. Banking Sector Developments in Greece during the Crisis _________________________ 101

THE FUND’S LENDING FRAMEWORK AND SOVEREIGN DEBT—ANNEXES
INTERNATIONAL MONETARY FUND 3
FIGURES
AII1. Exit from Debt Distress _______________________________________________________________ 27
AII2. Cumulative Debt Change in Large Debt Reduction Episodes _________________________ 29
AII3. Delayed Restructurings_______________________________________________________________ 34
AII4. Repeat Restructurings, 1983–2012 ___________________________________________________ 34
AII5. Restructuring Episodes by Country, Type and Year, 1980-2012 ______________________ 36
AII6. Average Nominal and NPV Reduction in Debt Restructurings with Private Foreign
Creditors, 1980–2012 ______________________________________________________________________ 39
AII7. Estimated Probabilities Implied by Different NPV Reduction and Initial Debt ________ 39
AIII1. Spreads: Restructuring vs Reprofiling Cases _________________________________________ 59
AIII2. Spreads at the Time of the Announcement of Restructuring/Reprofiling ____________ 60
AIII3. Spreads at the Time of the Debt Exchange __________________________________________ 61
AIII4. Credit Downgrade in the Year of Restructuring/Reprofiling _________________________ 62
AIII5. Credit Rating Recovery a Year After Restructuring/Reprofiling ______________________ 62
AIII6. Credit Rating Recovery to Pre-crisis Levels __________________________________________ 63
AIII7. Time to Market Access—Defined as International Security Issuance _________________ 64
AIII8. Time to Market Access—Defined as Spreads Normalization _________________________ 65
AIII9. Market Access Loss and NPV Haircut ________________________________________________ 66
AIII10. Market Access Loss and Debt to GDP Ratio ________________________________________ 67
AIII11. Market Access Loss and Fiscal Slippage ____________________________________________ 68
AIII12. Market Access Loss and Global Risk Aversion or Volatility (VIX) ____________________ 69
AIII13. Contagion: Restructuring Cases ____________________________________________________ 74
AIII14. Contagion: Reprofiling Cases _______________________________________________________ 76
AIII15. Contributions to Contagion ________________________________________________________ 78
AIII16. Euro Countries: Sovereign Spreads _________________________________________________ 81
AIII17. Contributions to Changes in Euro Area Swap Spreads _____________________________ 85
AV1. Simulations of Frontloaded and Gradual Fiscal Adjustments ________________________ 109
TABLES
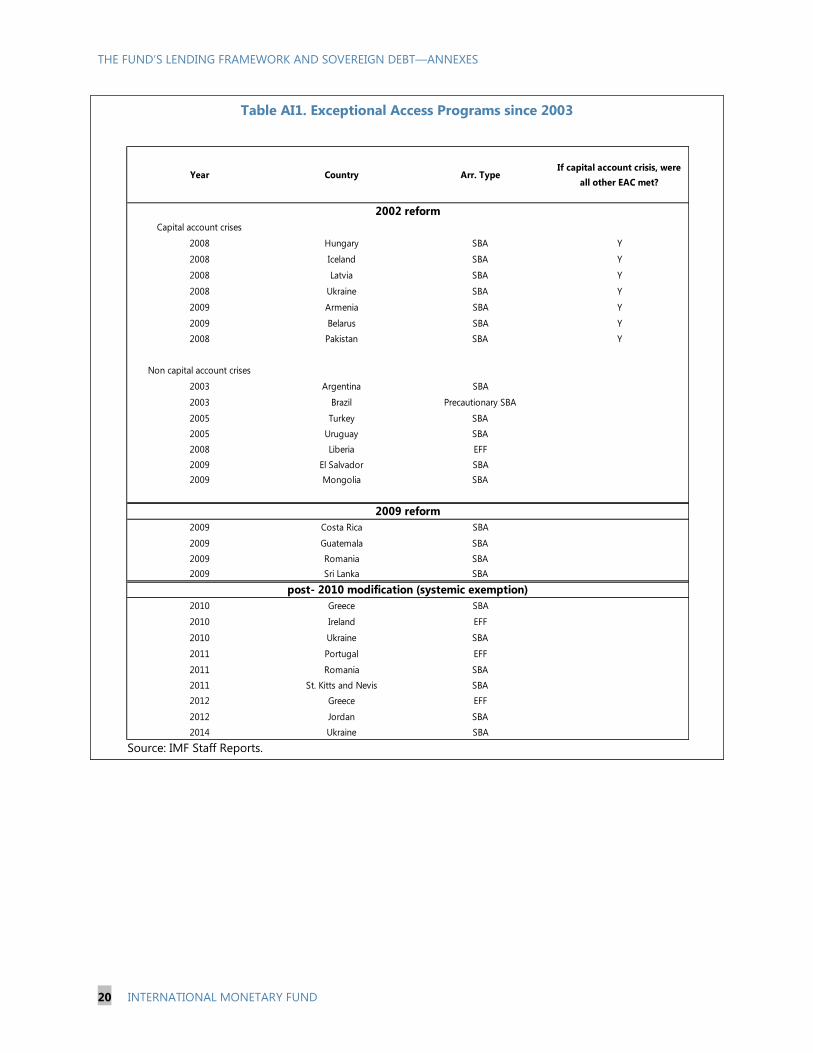
AI1. Exceptional Access Programs since 2003 _____________________________________________ 20
AII1. Initial Conditions Prevailing before Large Debt Reductions in Emerging Economies _ 28
AII2. Restructuring Episodes by Country and Type, 1980–2012 ____________________________ 37
AV1. Average Initial Conditions in Countries with Exceptional Access Programs __________ 106
AV2. Calibrated Parameters ______________________________________________________________ 107

THE FUND’S LENDING FRAMEWORK AND SOVEREIGN DEBT—ANNEXES
4 INTERNATIONAL MONETARY FUND
ANNEX I. THE FUND’S EVOLVING APPROACH IN
SOVEREIGN DEBT CRISES1
This annex describes how the Fund's approach to lending in sovereign debt crises has evolved with
changing circumstances since the early 1980s, with a focus on the origins and evolution of the current
framework for exceptional access. In the sovereign debt crises of the 1980s, concerted financial support
from the private sector was a standard feature of Fund-supported programs, most of which were
within the normal access limits. By contrast, the spate of capital account crises that began in the mid
1990s occurred at a time when the creditor base had become much more diffuse, and the Fund’s
strategy sought instead to entice a resumption of private flows through programs involving large-scale
Fund and other official resources. While this strategy worked well in some circumstances, it failed to
play its catalytic role in cases where, amongst other factors, the member's debt sustainability prospects
were uncertain. In response to this varied experience, and to ensure effective use of its resources, the
Fund concluded that decisions to grant access above normal limits should henceforth be guided by
defined criteria. These were established in the 2002 Exceptional Access Policy, which included a
requirement that public debt be judged as sustainable with "high probability.” The framework applied
initially only in capital account cases, but in 2009 became applicable to all exceptional access
decisions. When Greece requested exceptional access in May 2010, the policy would have required
deep debt reduction to reach the high probability threshold for debt sustainability. Fearing that such
an operation would be highly disruptive in the circumstances prevailing at the time, the Fund decided
to create an exemption to the high probability requirement for cases where there was a high risk of
international systemic spillovers—an exemption that has since been invoked repeatedly in programs
for Greece, Portugal, and Ireland.
A. Overview
1. This annex examines how the Fund’s strategic approach to resolving sovereign debt
distress has changed since the 1980s. The analysis broadly defines three phases of the Fund’s
crisis involvement:
During the emerging market debt crises of the 1980s, the resolution strategy relied initially
on policy adjustment with rescheduling and new money as an interim source of finance, but
eventually resorted to debt reduction when adjustment proved insufficient.
1This annex was prepared by Cesar Serra with input from Suchanan Tambunlertchai, Varapat Chensavasdijai,
Francisco Roch (all SPR) and Julianne Ams (LEG).

THE FUND’S LENDING FRAMEWORK AND SOVEREIGN DEBT—ANNEXES
INTERNATIONAL MONETARY FUND 5
Capital account crises during 1995–2002 were non-sovereign in nature, with sudden stops
typically triggered by broader balance sheet concerns rather than excessive public debt per
se. Rescue programs relied on exceptional access of Fund resources to catalyze a return of
private flows, but in some cases these failed to materialize, forcing excessive adjustment.
In light of the experience in the 1990s, and especially in the wake of the Argentina and
Russia defaults, concerns about excessive use of Fund resources and insufficient attention to
debt sustainability led to reform of the exceptional access policy in 2002, adoption of a more
rigorous DSA framework, consideration of the idea of a statutory approach to sovereign
debt restructuring, a Sovereign Debt Restructuring Mechanism (SDRM), and Fund advocacy
for the use of collective action clauses in sovereign bonds. The global financial crisis
triggered an unprecedented demand for Fund resources, and out of concerns for potential
systemic effects from debt restructuring, the exceptional access policy was amended in 2010
to facilitate support to euro area countries.
B. The Emerging Markets Debt Crises of the 1980s
2. The early years of the 1980s witnessed severe stress in Latin American economies. The
debt crisis of 1982–83 was the product of massive external shocks and policy errors that significantly
reduced developing countries’ capacity to service their external debts. The turnaround of easy
borrowing conditions that prevailed during the 1970s, after the Fed set out to reverse the
inflationary excesses of preceding years, led to a moratorium on Mexico’s debt in 1982, triggering
the onset of the Latin American debt crisis that lasted through the early 1990s. The Mexican default
and the ensuing retrenchment of external financing accelerated the eruption of crises elsewhere,
with most Latin American countries turning to the Fund for financial support.
3. In response to the strains which emerged in the global economy following the second
oil price shock in the late 1970s, access policy allowed the flexibility to provide large-scale
Fund resources. By the end of the 1970s, many members with large payments imbalances were
approaching their cumulative limits. The Supplementary Financing Facility (SFF), under which the
Fund would on-lend borrowed resources, was introduced in 1979, partly in response to these
THE FUND’S LENDING FRAMEWORK AND SOVEREIGN DEBT—ANNEXES
6 INTERNATIONAL MONETARY FUND
developments.2 The SFF provided for access above normal limits “in special circumstances,”
establishing what would become known as the “exceptional circumstances” clause in 1983.3
4. The Fund played a major role in managing the strategy for overcoming the debt crisis,
with private sector involvement providing a significant portion of overall financing. The
central role for the Fund was to negotiate adjustment programs and to support those programs with
resources covering a limited portion of financing needs. Such a strategy, which in most cases
provided access below normal limits, was underpinned by the Fund’s position of not bailing out
private creditors.4 In a first phase through 1986, the Fund’s strategy followed a “concerted lending”
approach, whereby firm commitments were required from creditor banks to support debt
rescheduling and new lending as a precondition for Fund financing.5 In a second phase starting in
early 1987, as it became clear that previous efforts had not meaningfully reduced the present value
of debt, the Fund recognized the need for market-based debt operations aimed at lightening the
burden of debt. This shift in approach preceded the Brady plan of early 1989 that ultimately, with
Fund-supported programs, delivered debt sustainability.
5. The “concerted lending” approach to resolve the debt crisis initially helped prevent
widespread defaults and the collapse of sovereign lending. The Fund sought to contain the debt
crisis through a “case-by-case” strategy aimed at providing enough additional financing to buy time
for debtor countries to implement adjustment programs and generate enough growth to restore
normal financial conditions.6 Fund support was conditional upon countries reaching agreement on
debt rescheduling and new financing with creditor banks. Several rounds of rescheduling followed,
initially extending only debt maturing in the short term, before introducing multiyear rescheduling
agreements beginning in 1984.
6. The initial response to resolve the debt crisis was clearly designed to address a
liquidity problem. It reflected the Fund’s prevailing view during this initial phase that prospects of
most indebted countries were sufficiently strong for a combination of policy adjustment and
2The SFF permitted countries under either the credit tranches or the EFF to obtain supplementary and parallel Fund
resources (see IMF 2001b).
3The “exceptional circumstances” clause was established as such in the context of the review of the Enlarged Access
Policy (EAP) in 1983, when the Board decided to “retain the flexibility to approve stand-by or extended arrangements
for amounts above the access limits in exceptional circumstances” (see IMF 2004a). The EAP replaced the SFF in 1981.
4In the context of the Latin America debt crisis, the “exceptional circumstances” clause was only invoked once, for
Mexico’s 1989 extended arrangement (see Boughton, 2001).
5Op. cit.
6Op. cit.

THE FUND’S LENDING FRAMEWORK AND SOVEREIGN DEBT—ANNEXES
INTERNATIONAL MONETARY FUND 7
financing to restore sustainable growth and the countries’ capacity to service their debt. The Fund
viewed the threat of unilateral default as having potentially dire consequences for debtor countries
and global financial stability.
7. By 1987, the restoration of growth remained an elusive goal, creditor banks had
reduced their exposure, and debt overhang continued to weigh on prospects for growing out
of debt. Commodity price declines during the critical early years of adjustment contributed to
faltering growth, as did the fact that the importance of structural reforms to promote sustainable
growth gained traction only gradually as the decade progressed.7 But the debt overhang also
continued to weigh on growth, as over-optimistic growth projections led to policy adjustment that
fell short of what was needed.8
8. A second phase started with the Fund urging creditor countries to develop debt
reduction plans. During 1987, staff took a clear stand in favor of debt relief for the most heavily
indebted countries and some early debt operations were supported through Fund arrangements
(e.g., Bolivia’s buybacks, Chile’s debt-equity swaps, and Mexico’s exchange of bank debt with lower
face value collateralized bonds).9 In May 1988, the Managing Director publicly endorsed “additions
to the menu of options that in effect work to reduce the existing stock of debt, while countries
simultaneously pursue a return to more normal debtor-creditor relationships”.10
Furthermore, in
September 1988 at the IMF Annual Meetings in Berlin, the Managing Director clearly stated the
need for debt relief: “… we have to recognize that the burden of current and prospective debt service
obligations places significant economic and political constraints on policy formulation … techniques
must be found, not just to provide additional finance, but also to lighten, in a mutually agreeable,
market-based way, the relative burden of existing indebtedness.”11
9. The Brady Plan, introduced in March 1989, provided the debt relief needed to address
the debt overhang problem once and for all. It was acknowledged that countries could not
extricate themselves from a depressed growth path unless their debt overhang was eliminated and
debt-service obligations were reduced to a sustainable level.12
The Fund played a pivotal role in the
7The Baker Plan, not introduced until October 1985, aimed at strengthening the role of multilateral development
banks in promoting structural reforms.
8Op. cit.
9See Boughton (2001).
10At a speech to the seminar on “Latin America in the World Economy,” organized by the Aspen Institute in Caracas.
11ICMS Meeting 31 (September 25, 1988).
12See Boughton (2001).

THE FUND’S LENDING FRAMEWORK AND SOVEREIGN DEBT—ANNEXES
8 INTERNATIONAL MONETARY FUND
implementation of the Brady Plan by providing financing to member countries that was earmarked
for the repurchase of their own debt at discounted prices and/or the establishment of escrow
accounts to guarantee future debt service in exchange for cuts in interest rates (see Box AI1). The
agreement with creditor banks was facilitated by the strategy followed during the earlier phase of
the crisis, which allowed banks time to provision for the losses that debt reduction would entail,13
as
well as by the offer of a menu of options tailored to creditors’ divergent business goals.
Box AI1. Fund Support for Debt and Debt Service Reduction (DDSR) Operations
Evolution of the debt strategy
In 1989, the Fund adopted a new debt strategy to allow countries to use Fund resources, in conjunction with
other official support, to finance upfront costs of DDSR operations with commercial banks, such as
repurchases of their own debt at discounted prices (buybacks) and the establishment of escrow accounts as
collateral for principal and/or interest payments in exchange for cuts in interest rates.1 Before 1989, the
Fund’s role in debt reduction operations had been limited to a facilitator, mainly “unlocking” financing for
LICs.
The purpose of Fund support for DDSR operations was to help catalyze commercial banks’ participation in
such operations by financing the associated upfront costs through set-asides (25 percent of access under
Fund arrangements) and additional resources from augmentations (up to 30 percent of quota).2 The set-
asides and additional resources were released only after a member had reached an agreement with its
commercial bank creditors, and so long as the Executive Board agreed that Fund resources would be used
effectively in support of DDSR. The set-asides must leave adequate margins to meet the member’s general
balance of payments need.
During the early 1990s, more than ten indebted countries—such as Venezuela, Costa Rica, Mexico, and the
Philippines—benefited from Fund support to reach agreements with commercial creditors on debt
restructuring. Such a support was provided to countries that pursued strong economic policies and in which
the implementation of market-based debt reduction was expected to contribute to the restoration of
external viability.
The Fund’s policy on support for DDSR operations was pivotal in resolving the long debt crisis that started in
the early 1980s, but it had limited use by the late 1990s, as countries increasingly turned to capital markets
rather than bank lending for their financing needs. In 1997, the Board noted that “… this phase of the
evolving approach to dealing with the debt crisis that erupted 15 years ago is drawing to a close. The
remaining cases of commercial bank debt to be dealt with are a small residual.”3 In light of such
developments, the policy was terminated in 2000.
13
As reflected in Citibank’s decision of May 1987 to add US$3 billion to its reserves as a provision against possible
losses on sovereign loans.

THE FUND’S LENDING FRAMEWORK AND SOVEREIGN DEBT—ANNEXES
INTERNATIONAL MONETARY FUND 9
Box AI1. Fund Support for Debt and Debt Service Reduction (DDSR) Operations (concluded)
Poland and DDSR operations
The experience of Poland provides a practical example of how the policy was applied. In the context of the
1994 stand-by arrangement, Poland received Fund support for DDSR operations through both set-asides
and augmented access. Upon agreement with commercial bank creditors, the authorities requested an
augmentation of access and a release of the accumulated set-asides to assist with the financing of the
commercial bank debt operation. The operation regularized USD 14.4 billion of commercial debt at an
upfront cost of USD 1.9 billion, divided among debt buybacks and the purchase of collateral for principal.
The Fund determined that Poland’s DDSR operation was consistent with Fund guidelines: commercial bank
participation was voluntary; the package was market-based and the terms of the operation were more
favorable than secondary market conditions prevailing at that time; the authorities contributed a significant
amount from the country’s own resources; and the package constituted a crucial step in Poland’s progress
toward external viability.
______________________________ 1See IMF 2000a.
2Initially, Fund support for DDSR operations was segmented between set-asides and augmentations. While set-aside resources
were use to finance debt reduction in the form of buybacks and principal and interest collateral on discount bond exchanges,
augmentations funded interest collateral for both discount bond and reduced-interest par bond exchanges. In 1992, confronted
by the rise in the cost of principal support relative to interest support given the decline of U.S. interest rates, the Board revised
the DDSR guidelines to permit the use of augmentations to finance the collateralization of principal in reduced-interest par bond
exchanges. Eventually, the Board eliminated the segmentation requirement in 1994, making it possible to use both set-asides
and augmentations to support operations involving debt reduction, interest support for DDSR, and principal collateral for
reduced-interest par bonds.
3See IMF 2000a.
C. The Capital Account Crises of 1995–2002
10. Capital account crises took different forms in the 1990s, reflecting distinctive domestic
and external vulnerabilities. In the first wave—beginning with Mexico’s “tequila crisis” in 1995 and
followed by the Asian crisis of 1997—the sudden reversals of private capital flows were not related
directly to high public indebtedness but rather to investor concerns about excessive dependence on
short-term funding, currency and maturity mismatches, and perceived weaknesses in the financial
and corporate sectors in the countries involved. Nevertheless, the ensuing exchange rate pressures
and banking sector problems transformed a purely private external financing gap into sovereign
funding stress. After 1998, the sovereign defaults of Russia and Argentina marked a new bout of
sovereign debt crises engendered by significant fiscal imbalances and structural rigidities.
11. In contrast to the engagement with Latin American countries in the 1980s, rescue
programs were based on massive Fund and other official financing, aimed at catalyzing a
return of private capital flows. A strategy combining exceptionally large Fund access (and
sometimes other official financing) with economic adjustment and reform by the member was
intended to help restore confidence, halt capital outflows, and support a transition back to access to

THE FUND’S LENDING FRAMEWORK AND SOVEREIGN DEBT—ANNEXES
10 INTERNATIONAL MONETARY FUND
private capital markets.14
Given the large up-front needs, and an assumption that the crisis of
confidence would be short-lived, access was heavily frontloaded in all cases.15
12. Such exceptional provision of Fund resources above normal access limits was made
possible by the highly discretionary access policy prevailing at the time. The “exceptional
circumstances” clause—the use of which was not governed by any established criteria—was invoked
14 times between 1995 and 2002, in order to provide access above normal limits in the credit
tranches or the EFF. In addition, in the midst of the Asian crisis in 1997, the Fund created the
Supplemental Reserve Facility (SRF), which was not subject to access limits.16, 17
13. While the approach relied primarily on the pure catalytic effect of Fund financing,
limited forms of concerted private sector involvement were attempted in some programs. By
the late 1990s, bonded debt had become more prevalent, and the creditor base more diffuse,
making private creditor coordination more difficult than it had been in the 1980s. Attempts at
private sector involvement were generally cautious, for fear of exacerbating the massive capital
outflows experienced at the time as well as adding to contagion effects. In some early programs—
Argentina (1995), Mexico (1994), Turkey (1994), and the Philippines (1997)—private sector
involvement was not needed or was not attempted. However, in crises where the catalytic effect of
programs was much weaker than had been hoped—leading to large financing shortfalls and
excessive adjustment—some form of private sector involvement was pursued, though its detailed
form varied depending on individual country circumstances.18
While in some cases the approach
14
The Fund lent more in these exceptional access cases than it had in any previous arrangements in its history, with
cumulative access committed under most of the arrangements in the range of 500-700 percent of quota (see IMF
2002a).
15The Fund expected a quick turnaround of capital outflows and as such the average length of arrangements was 2½
years and purchases of more than 70 percent of total access during the first year of the arrangement were available
in all cases.
16The SRF could provide large-scale financial assistance to members experiencing “exceptional balance of payments
difficulties due to a large short-term financing need resulting from a sudden and disruptive loss of market confidence
reflected in pressure on the capital account and the member’s reserves” and where there was “a reasonable expectation
that the implementation of strong adjustment policies and adequate financing will result, within a short period of time,
in an early correction of such difficulties” (Press Release Number 97/59). The first use of Fund resources under the SRF
was agreed for Korea on December 1997 and since then it has been used by Argentina, Brazil, Russia, Turkey and
Uruguay.
17The SRF decision stated that such financing would be available to members where “the projected access in the
credit tranches or under the extended Fund facility, taking into account outstanding purchases, would otherwise
exceed either the annual or cumulative limit. In those cases, unless the member’s medium-term financing needs
require access in the credit tranches or under the extended Fund facility beyond the annual or cumulative limit,
financing in the credit tranches or under the extended Fund facility will not be provided beyond the annual or
cumulative limit, and financing beyond either limit will be provided only [with SRF resources]”.
18See Lane and others, (1999), IMF (2000), and Ghosh and others, (2002).

THE FUND’S LENDING FRAMEWORK AND SOVEREIGN DEBT—ANNEXES
INTERNATIONAL MONETARY FUND 11
relied on informal pressure on international banks to maintain their exposure (Thailand, 1997; Brazil,
1999), in others direct pressure was applied to transform existing interbank credit lines into new
short- to medium-term instruments, although in both cases the rescheduled bank debt benefited
from an explicit government guarantee (Korea and Indonesia, 1998).
14. By the early 2000s, concerns were growing in the Fund—and within the official sector
more generally—that large-scale Fund financing packages were creating adverse systemic
risks. The pure catalytic approach had had limited success, and there was a perception that the use
of Fund resources by the sovereign simply to repay maturing debt obligations generated moral
hazard, particularly in situations where debt sustainability was in doubt (see Box AI2). This concern
was heightened when Russia and Argentina defaulted on their debt shortly after approval of
augmentations of their Fund arrangements. Moreover, the degree of discretion and flexibility in the
existing framework at that time was seen as making the Fund more vulnerable to pressure to
provide exceptional access even when prospects for success were quite poor and the debt burden of
the sovereign was likely to be unsustainable.19
Additionally, market participants argued that the lack
of clarity in the framework was creating uncertainty in financial markets when a country approached
the Fund. Last, but certainly not least, the provision of exceptional access under these circumstances
called into question the adequacy of safeguards for Fund resources.
15. These concerns were reflected in the “Prague Framework for Private Sector
Involvement,” which was endorsed by the IMFC in September 2000. The Prague Framework stated
that extraordinary access to Fund resources should be exceptional, and noted that a “spectrum of
actions by private creditors, including comprehensive debt restructuring, may be warranted to provide
for an adequately financed program and a viable medium-term payments profile.” The IMFC further
agreed that any operational framework for private sector involvement must be based on the Fund’s
assessment of a country’s underlying payment capacity and prospects of regaining market access,
and should rely as much as possible on market-oriented solutions and voluntary approaches.20
These principles set the stage for the development of a new Exceptional Access Policy in 2002.
19
See IMF 2002a.
20See Annex I, IMF2002a.

THE FUND’S LENDING FRAMEWORK AND SOVEREIGN DEBT—ANNEXES
12 INTERNATIONAL MONETARY FUND
Box AI2. Creditor Bailout in Fund-Supported Programs
This box examines external debt restructuring episodes between 1995 and 2012 that took place during a
Fund-supported program and evaluates whether Fund (and other official) resources were used to pay out
private creditors in periods leading up to an eventual debt restructuring or default. For cases where data
are available, we compare the amounts of financing received against the debt service schedule. Net
positive financing from the official sector, including the IMF, that offsets reduced financing from the private
sector is taken as evidence of a “bailout” (see table below).
We find that private sector bailouts have tended to take place in larger (more “systemic”) countries, albeit
to varying degrees. Bailouts were seen in Argentina, Russia, Pakistan, Greece, and to a smaller extent,
Turkey. The Fund and the official sector in fact stepped up disbursements in Argentina, Russia, and Turkey
as the crises intensified and private creditors exited.
In the months leading up to its default in December 2001, Argentina received large net financing
from the Fund which helped meet its external private debt service.
In Russia, private sector bailout took place over a longer period, as the Fund had been disbursing
to Russia since 1995, when signs of insolvency had already begun to emerge. During 1995 and
1996, Fund financing did make up for a shortfall in private sector financing. However, the extent to
which the IMF, and the official sector more broadly, bailed out private creditors immediately
before the August 1998 default is more difficult to assess as Russia received net positive external
financing from both the official and private sector creditors at that time.
In Pakistan, official sector financing, of which the Fund’s share was relatively small, began replacing
private sector flows as the crisis intensified in 1998.
In Greece, financial support from the Fund and the EU were used in part to finance the exit of
private creditors in the two years leading up to the restructuring of private debt in 2012. The
amount of official resources deployed in this way totaled about €48 billion, or 23 percent of
Greece’s GDP.
In Turkey, Fund financing was used to contribute to the sovereign’s large debt repayments.
However, the extent of the bailout was limited as shortly after the program began Turkey
successfully negotiated a voluntary PSI which maintained private sector exposure (foreign and
domestic) in the country.
In the less systemic economies, Fund support was conditional on, or came after, debt restructuring. This
was the case in Dominican Republic, Ecuador, St. Kitts & Nevis, Seychelles, and Uruguay. For all these
countries, debt restructuring was assumed in the program baseline. In Ukraine, IMF financing and the
program’s NIR targets were coordinated in such a way that the authorities had no choice but to reschedule
debt that was falling due.

THE FUND’S LENDING FRAMEWORK AND SOVEREIGN DEBT—ANNEXES
INTERNATIONAL MONETARY FUND 13
Box AI2. Creditor Bailout in Fund-Supported Programs (concluded)
Countries with External Debt Restructuring between 1995 and 2012
Source: IMF Staff Reports.
Country IMF program External debt
restructuring
Private creditor
bailout
Summary
Argentina Mar-00 Apr-05 Yes IMF disbursements were stepped up as crisis intensified; IMF
provided net positive financing, making up for net negative
private external financing prior to default in December 2001.
Dominican Republic Jan-05 May-05 No Restructuring was announced prior to IMF program. Ne IMF
financing during program was small.
Ecuador Jan-00 Jul-00 No Restructuring was announced prior to IMF program. Roughly
zero net IMF and official sector funding during the program.
Greece May-10 Mar-12 Yes IMF and EU financing of around €48 billion, or 23 percent of
Greece’s GDP, was used to pay out private creditors in the years
leading up to the restructuring in 2012.
Pakistan Oct-97 Nov-99 Yes, partially IMF disbursements were made until debt restructuring.
Pakistan serviced international bonds, domestic debt, IFIs' debt
in the meantime, but net IMF financing was small.
Russia Jul-98 Jul-98 Yes, partially IMF disbursements were stepped up as crisis intensified; IMF
and external private sector provided net positive financing,
some of which was used to repay domestic debt falling due.
Seychelles Nov-08 Feb-10 No Defaulted prior to IMF program; restructuring was assumed in
program baseline.
St. Kitts & Nevis Jul-11 Apr-12 No Defaulted prior to IMF program; restructuring was assumed in
program baseline.
Turkey Dec-00 n/a Yes Turkey serviced its debt up until debt exchange in June 2001,
significant IMF disbursements in the interim.
Ukraine Sep-98 Sep-98 to Aug-99 No Program was designed to avoid private sector bailout. Net
purchases were small, and together with tight NIR targets the
government had no choice but to reschedule debt falling due.
Uruguay Mar-02 May-03 No IMF disbursements were deposited at the central bank as Fund
for the Stability of the Banking Sector. Restructuring was
announced prior to continued use of Fund resources.

THE FUND’S LENDING FRAMEWORK AND SOVEREIGN DEBT—ANNEXES
14 INTERNATIONAL MONETARY FUND
D. The Exceptional Access Policy and Sovereign Debt Crises since 2003
Development of the exceptional access policy
16. The new exceptional access policy (EAP) in capital account crises was adopted in 2002
and became fully operational in February 2003. In response to shareholders’ concerns, the reform
was intended to move from a regime that allowed excessive discretion in the use of Fund resources
above normal access limits to a more systematic framework that would constrain that discretion. In
particular, the Board agreed that the following set of substantive criteria would need to be met to
justify exceptional access for members facing a capital account crisis:
1) The member is experiencing exceptional balance of payments pressures on the capital
account resulting in a need for Fund financing that cannot be met within the normal limits.
2) A rigorous and systematic analysis indicates that there is a high probability that debt will
remain sustainable.
3) The member has good prospects of regaining access to private markets within the time
Fund resources would be outstanding.
4) The policy program of the member country provides a reasonably strong prospect of
success, including not only the member’s adjustment plans but also its institutional and
political capacity to deliver that adjustment.
17. The “rigorous and systematic analysis of debt sustainability” (required under Criterion
2) gave more prominence to the recently improved DSA.21
The DSA was seen as a crucial input
for the decision on whether exceptional access was justified or a debt restructuring was warranted
instead. In 2003, the Board agreed that access in cases where a debt restructuring was needed
would normally be expected to be within the normal access limits, although there could be rare
circumstances warranting exceptional access.22
Staff argued that such exceptional circumstances
could arise when a country was not in a position to repay the Fund or where there was a need for
additional financing to support the member’s strategy to limit the economic disruption associated
with debt reduction. In addition, it was recognized that Fund financing should not unduly increase
21
A modified debt sustainability framework for market access countries, including standardized sensitivity analysis,
was developed in May 2002.
22The Board also agreed that the procedures for decision-making on exceptional access would apply to any
exceptional access cases, even when the member was not experiencing a capital account crisis (see IMF 2003e).

THE FUND’S LENDING FRAMEWORK AND SOVEREIGN DEBT—ANNEXES
INTERNATIONAL MONETARY FUND 15
the rigidity of the member’s debt stock (e.g., by leaving member countries heavily dependent on
official financing).23
18. The Prague Framework for PSI however, did not provide a clear mechanism to prevent
holdouts. This led the Fund to consider the idea of a statutory approach that would provide strong
incentives for debtors and their creditors to reach cooperative agreements and facilitate orderly
debt restructuring. The staff’s proposal—SDRM—aimed at preventing potential holdouts by
considering imposing a binding majority of creditors to accept a restructuring offer, and promoted
the establishment of an arbitration body, the Debt Resolution Forum, responsible for approving
members’ restructuring plans as well as assisting with the resolution of debt disputes.24
However,
the SDRM did not receive sufficient support from the international community and, at the time of
the 2003 Spring Meetings, the IMFC recognized that its establishment was not feasible. Instead, it
welcomed the enhancement of the contractual approach, namely the inclusion of collective action
clauses (CACs) in international sovereign bond issues.25
19. In the context of the 2002 EAP reform, the Board also discussed the merits of
considering regional and systemic contagion as a potential justification for exceptional
access. Staff argued that cross-border contagion should not be used to justify exceptional access
when the other criteria were not met. Such an exemption would provide higher access, in relation to
quota, to large systemic countries which—it was argued—may be inconsistent with uniformity of
treatment under the Articles of Agreement.26
Moreover, it could also revive moral hazard concerns
that the EAP reform aimed to mitigate. The Board concurred with staff, recognizing that the Fund
should be prepared to provide exceptional access where the member’s problems have regional or
systemic contagion effects only when the other criteria are met.27
20. In late 2003, Argentina and Brazil were granted exceptional access, though neither
country satisfied all the EAP criteria. This was possible because the EAP applied only to members
experiencing severe capital account pressures (Criterion 1), which was not considered to be the case
for either country. In cases where a debt restructuring was needed, the Board had agreed that
exceptional access could be provided under rare circumstances as noted above. In light of such
23
See IMF 2003a.
24See IMF 2003d.
25See “Communiqué of the International Monetary and Financial Committee of the Board of Governors of the
International Monetary Fund,” Washington, D.C., April 12, 2003.
26See IMF 2002a.
27See IMF 2002b.

THE FUND’S LENDING FRAMEWORK AND SOVEREIGN DEBT—ANNEXES
16 INTERNATIONAL MONETARY FUND
flexibility, Argentina was granted exceptional access on the basis of sizable external financing gaps
projected over the program period (424 percent of quota, with more than half available during the
first year of the program).28
Brazil’s case was somewhat different: it was seeking precautionary
support, which by definition fell outside of the scope of Criterion 1.
21. Staff sought to address these apparent anomalies through a revision of the framework
in early 2004, but the proposed amendments were not approved at that time. The changes
would have allowed lending to proceed when there was a potential rather than existing balance of
payments need or when debt sustainability could be achieved on a “forward looking” basis, i.e.,
taking into account planned policy adjustment and/or debt restructuring.29
Based on such a revision,
staff recommended that any request for exceptional access would need to satisfy all EAP criteria. The
Board declined to support this proposal, given the limited experience under the new framework.
However, it was agreed that, in cases where the member is not experiencing a capital account crisis,
the procedures for exceptional access would apply and the request would be judged "in light of the
four substantive criteria"—meaning that, in noncapital account cases, approval of the request would
not necessarily be conditioned on meeting all of these criteria.30
22. It was not until 2009 that the Board adopted reforms aimed at resolving the perceived
inconsistencies in the EAP.31
Foremost amongst these problems was the asymmetry of treatment
between capital and noncapital account crises (see Table 1).32
In capital account crisis cases, the
framework effectively precluded the use of exceptional access when the debt position at the time of
the member’s request for financial support was judged to be unsustainable even if sustainability
could have been restored through policy adjustment and/or debt restructuring. By contrast, in
28
The Report on Exceptional Access for Request of Stand-by Arrangement at the time of the 2003 SBA request
argued that the exceptional high proposed access reflected the need to restructure public and private debt, rebuild
reserves, and repay the Fund (see IMF 2003b).
29Staff proposed the following revised criteria. Criterion 1: The member has an actual or potential need for Fund
financing that cannot be met within the normal limits. Criterion 2: A rigorous and systematic analysis indicates that
there is a high probability that its debt will remain or be made sustainable (see IMF 2004a).
30See IMF 2004b.
31See “Review of Fund Facilities—Analytical Basis for Fund Lending and Reform Options,” (February 2009) and “GRA
Lending Toolkit and Conditionality: Reform Proposals,” (March 2009).
32At the time of the “Review of Access Policy in the Credit Tranches and Under the Extended Fund Facility and the
Poverty Reduction and Growth Facility, and Exceptional Access Policy” in 2008, staff already recognized that the
asymmetric treatment between capital account and noncapital account crises cases in the EAP had led to a
perception that exceptional access decisions in the latter cases were ad hoc. However, given the limited recourse to
the exceptional access framework since 2005, staff did not propose any changes. In addition to the cases of
Argentina and Brazil discussed above, the exceptional access stand-by arrangements of Turkey and Uruguay in 2005
did not meet the EAP criterion 1.

THE FUND’S LENDING FRAMEWORK AND SOVEREIGN DEBT—ANNEXES
INTERNATIONAL MONETARY FUND 17
situations where financing needs did not stem from a capital account shock, the policy was far more
permissive of access requests above normal limits.33
Additionally, as noted above, the framework
was incompatible with the provision of exceptional access under potential rather than existing
balance of payments needs. The staff’s proposal was intended to streamline and clarify the EAP
criteria by adopting the general principle that lending above access limits was permitted as long as
there was a credible strategy to address the debt situation and restore debt sustainability.
23. Under the 2009 reform all revised criteria for exceptional access would henceforth
need to be satisfied for the approval of any request involving GRA access beyond the normal
limits. Criterion 1 to 3 were revised (revisions underlined) as follows:
1) The member is experiencing or has the potential to experience exceptional balance of
payments pressures on the current account or the capital account, resulting in a need for
Fund financing that cannot be met within the normal limits.
2) A rigorous and systematic analysis indicates that there is a high probability that the
member’s public debt is sustainable in the medium term. Debt sustainability for these
purposes will be evaluated on a forward-looking basis and may take into account, inter alia,
the intended restructuring of debt to restore sustainability. This criterion applies only to
public (domestic and external) debt. However, the analysis of such public debt sustainability
will incorporate any potential contingent liabilities of the government, including those
potentially arising from private external indebtedness.
3) The member has prospects of gaining or regaining access to private capital markets within
the timeframe when Fund resources are outstanding.
4) The policy program of the member country provides a reasonably strong prospect of
success, including not only the member’s adjustment plans but also its institutional and
political capacity to deliver that adjustment.
33
In addition to the changes to the EAP described above, the 2009 reform doubled access limits to an annual limit of
200 percent of quota and cumulative limit of 600 percent of quota and added to the GRA lending toolkit new
“precautionary” facilities to help contain contagion risks for countries with broadly sound fundamentals and policies.
The 2009 reform also eliminated the SRF given its relative inflexibility and limited used as the evidence shows that
capital account crisis do not quickly turnaround. In the most recent exceptional access arrangements (Georgia,
Iceland, Hungary, Latvia, Pakistan, and Ukraine), the SRF was considered inappropriate due in part to the mismatch
between its short maturity and the expected duration of the crises affecting these countries.

THE FUND’S LENDING FRAMEWORK AND SOVEREIGN DEBT—ANNEXES
18 INTERNATIONAL MONETARY FUND
Recent experience under the EAP framework
24. The global financial crisis brought an unprecedented demand for Fund-supported
programs after 2008. While between 2004 and 2007 only two exceptional access stand-by
arrangements were approved (Turkey and Uruguay in 2005), the global financial crisis led to a spate
of high-access programs and the commitment of more than US$250 billion in loans to member
countries.
25. Unlike past crises, which mostly involved emerging markets, the global financial crisis
exposed deep-rooted external imbalances in advanced economies. With the exception of
Cyprus, whose extended arrangement was under normal access limits, other Euro Area (EA) program
countries required a historically unprecedented level of Fund and official support to deal with their
high fiscal financing requirements, structural imbalances, and financial market turbulence. In
contrast with the Fund’s catalytic role in past crises, EA program countries were taken out of the
market for extended periods. As a result, EA program financing has relied almost entirely on the
official sector.
26. In May 2010, the EAP was once more revised in the context of the Greek program
approval. An important rigidity of the EAP came to the fore when Greece requested financial
support in early 2010. When “significant uncertainties” surrounding the sustainability assessment
prevented staff from affirming that debt was sustainable with high probability, the existing EAP
framework would call for a debt reduction operation to deliver such high probability as a condition
for the provision of exceptional access.34
In the case of Greece, where the high probability
requirement was not met, however, there were fears that an upfront debt restructuring would have
potentially systemic adverse consequences on the euro area. Given the inflexibility of the EAP, and
the crisis at hand, the Fund decided to create an exemption to the requirement for achieving debt
sustainability with a high probability when there was a “high risk of international systemic spillovers”.
Since then, the systemic exemption has been invoked 34 times by end-May, 2014 in the three EA
programs for Greece, Portugal, and Ireland.
34
Such a higher evidentiary requirement is not binding when countries request Fund financial support below normal
access limits. In the past, countries in this group that experienced a debt crisis have used lighter forms of
restructurings—face-value preserving maturity extensions with moderate NPV reductions—that together with strong
implementation of adjustment programs put debt into a sustainable path. However, such a practice in cases where
debt was too high, and especially for too long, has not been successful (see Box 3 in the main paper).

THE FUND’S LENDING FRAMEWORK AND SOVEREIGN DEBT—ANNEXES
INTERNATIONAL MONETARY FUND 19
27. In the context of a deep and prolonged recession, massive financing needs and an
undercapitalized banking system, it became clear in 2011 that a debt restructuring would be
needed for Greece. At the time of the 4th Greece review, in mid-2011, the staff report
acknowledged that PSI would be necessary to close financing gaps and address debt sustainability
concerns.35
The debt exchange in March/April 2012 resulted in a reduction of more than 50 percent
of eligible debt (about €200 billion) after attracting a participation rate of close to 97 percent. In late
2012, a second round of PSI was implemented through a buyback operation that retired sovereign
bonds issued in the context of the debt exchange. By the time of these debt restructurings, however,
private creditors had been paid out a total of almost €50 billion, drawing on resources provided by
the Fund and other official creditors to support Greece’s program.
35
See IMF 2011.
THE FUND’S LENDING FRAMEWORK AND SOVEREIGN DEBT—ANNEXES
20 INTERNATIONAL MONETARY FUND
Year Country Arr. TypeIf capital account crisis, were
all other EAC met?
Capital account crises
2008 Hungary SBA Y
2008 Iceland SBA Y
2008 Latvia SBA Y
2008 Ukraine SBA Y
2009 Armenia SBA Y
2009 Belarus SBA Y
2008 Pakistan SBA Y
Non capital account crises
2003 Argentina SBA
2003 Brazil Precautionary SBA
2005 Turkey SBA
2005 Uruguay SBA
2008 Liberia EFF
2009 El Salvador SBA
2009 Mongolia SBA
2009 Costa Rica SBA
2009 Guatemala SBA
2009 Romania SBA
2009 Sri Lanka SBA
2010 Greece SBA
2010 Ireland EFF
2010 Ukraine SBA
2011 Portugal EFF
2011 Romania SBA
2011 St. Kitts and Nevis SBA
2012 Greece EFF
2012 Jordan SBA
2014 Ukraine SBA
2002 reform
post- 2010 modification (systemic exemption)
2009 reform
Table AI1. Exceptional Access Programs since 2003
Source: IMF Staff Reports.
THE FUND’S LENDING FRAMEWORK AND SOVEREIGN DEBT—ANNEXES
INTERNATIONAL MONETARY FUND 21
References
Boughton, J., 2001, “Silent Revolution: The International Monetary Fund 1979–1989,” (Washington:
International Monetary Fund).
———, 2012, “Tearing Down Walls: The International Monetary Fund, 1990–99,” (Washington:
International Monetary Fund).
Chui, M., and Gai, P., 2005, “Private Sector Involvement and International Financial Crises: An
Analytical Perspective,” Oxford University Press.
Diaz-Alejandro, C., 1984, “Latin America Debt: I Don’t Think We Are in Kansas Anymore,” Brookings
Papers on Economic Activity, 2:1984.
Ghosh, A., and others, 2002, “IMF-supported Programs in Capital Account Crises,” (Washington:
International Monetary Fund).
International Monetary Fund, 1997, “IMF Approves Supplemental Reserve Facility,” Press Release
Number 97/59, (Washington).
———, 2000a, “Review of Fund Facilities-Preliminary Considerations.” (Washington). Available via
the internet: http://www.imf.org/external/np/pdr/fac/200/faciliti.pdf
———, 2000b, “Recovery from the Asian Crisis and the Role of the IMF,” (Washington).
———, 2001a, “Review of Access Policy in the Credit Tranches and under the Extended Fund
Facility,” (Washington).
———, 2001b, “Review of Access Policy in the Credit Trances and under the Extended Fund
Facility—Background Paper,” (Washington).
———, 2002a, “Access Policy in Capital Account Crises.” (Washington). Available via the Internet:
http://www.imf.org/external/np/tre/access/2003/pdf/072902.pdf
———, 2002b, “Summing Up by the Acting Chair: Access Policy in Capital Account Crises,”
(Washington). Available via the Internet:
http://www.imf.org/external/pubs/ft/sd/index.asp?decision=EBM/02/94

THE FUND’S LENDING FRAMEWORK AND SOVEREIGN DEBT—ANNEXES
22 INTERNATIONAL MONETARY FUND
———, 2003a, “Access Policy in Capital Account Crises - Modifications to the Supplemental Reserve
Facility (SRF) and Follow-up Issues Related to Exceptional Access Policy.” (Washington).
Available via the internet: http://www.imf.org/external/np/tre/access/2003/pdf/011403/pdf
———, 2003b, “Argentina—Request for Stand-By Arrangement and Request for Extension of
Repurchase Expectations,” (Washington). Available via the Internet:
http://www.imf.org/external/pubs/ft/scr/2003/cr03392.pdf
———, 2003c, “Communiqué of the International Monetary and Financial Committee of the Board
of Governors of the International Monetary Fund,” (April 12) (Washington).
———, 2003d, “Proposed Features of a Sovereign Debt Restructuring Mechanism,” (Washington).
Available via the Internet: http://www.imf.org/external/np/pdr/sdrm/2003/021203.pdf
———, 2003e, “The Acting Chair’s Summing Up: Review of Access Policy under the Credit Tranches
and the Extended Fund Facility, and Access Policy in Capital Account Crises—Modifications
to the Supplemental Reserve Facility and Follow-Up Issues Related to Exceptional Access
Policy,” (Washington). Available via the Internet:
http://www.imf.org/external/pubs/ft/sd/index.asp?decision=EBM/03/16
———, 2004a, “Review of Exceptional Access Policy,” (Washington). Available via the Internet:
https://www.imf.org/external/np/acc/2004/eng/032304.pdf
———, 2004b, “Summing Up by the Acting Chair: Review of Exceptional Access Policy,”
(Washington). Available via the Internet:
http://www.imf.org/external/pubs/ft/sd/index.asp?decision=EBM/04/36
———, 2008, “Review of Access Policy in the Credit Tranches and Under the Extended Fund Facility
and the Poverty Reduction and Growth Facility, and Exceptional Access Policy,”
(Washington).
———, 2009a, “GRA Lending Toolkit and Conditionality: Reform Proposals,” (Washington).
———, 2009b, “Review of Fund Facilities—Analytical Basis for Fund Lending and Reform Options,”
(Washington).
———, 2011, “Greece—Fourth Review under the Stand-By Arrangement and Request for
Modification and Waiver of Applicability of Performance Criteria,” (Washington). Available
via the Internet: http://www.imf.org/external/pubs/ft/scr/2011/cr11175.pdf

THE FUND’S LENDING FRAMEWORK AND SOVEREIGN DEBT—ANNEXES
INTERNATIONAL MONETARY FUND 23
Lane, T., and others, 1999, “IMF-supported Programs in Indonesia, Korea, and Thailand: A
Preliminary Assessment,” (Washington: International Monetary Fund).

THE FUND’S LENDING FRAMEWORK AND SOVEREIGN DEBT—ANNEXES
24 INTERNATIONAL MONETARY FUND
ANNEX II. A REVIEW OF SOVEREIGN DEBT RESTRUCTURINGS
SINCE THE 1980s36
A. Introduction
28. In May 2013, the Board reviewed the Fund’s recent experience with sovereign debt
restructurings. Looking at the experience with restructurings since 2005, the staff paper argued that
unsustainable debt situations often fester before they are resolved and, when restructurings do
occur, they do not always restore sustainability and market access in a durable manner, leading to
repeated restructurings.
29. During the Board discussion, and in subsequent interactions with market participants,
some questioned whether this assessment holds over a broader period and sample. Many noted, in
particular, that the case of Greece—which featured prominently in the staff’s analysis—was sui
generis and some argued that, in general, restructurings have been timely and effective in restoring
sustainability, compared to reasonable counterfactuals. It was also suggested that countries are
often able to get out of debt distress without requiring a restructuring, and hence the Fund’s
lending framework should allow a case-by-case treatment in high debt situations.
30. This broader retrospective addresses these points, based on experience with debt
distress and restructurings over a much longer period than considered in the 2013 Board
paper. The analysis draws on both country case studies and cross-country empirical work to answer
the following questions:
When countries experience debt distress, how often and under what circumstances are they
able to exit stress without needing a restructuring? The finding is that, in many cases,
countries were indeed able to avoid a debt restructuring. Nevertheless, in a significant
number of cases an exit from distress entailed a restructuring. Not surprisingly, lower initial
debt levels and stronger fundamentals made it more likely that a country could exit debt
distress without a restructuring.
When restructurings have been used, have they generally been timely and adequately-sized?
This review confirms the earlier assessment that countries often delayed needed debt
reduction and debt overhangs tended to persist for several years before a restructuring was
36
This Annex was prepared by Nelson Sobrinho, Charlotte Lundgren, and Cesar Serra with input from Christopher
Dielmann under the supervision of Geneviève Verdier (SPR).
THE FUND’S LENDING FRAMEWORK AND SOVEREIGN DEBT—ANNEXES
INTERNATIONAL MONETARY FUND 25
undertaken. Restructurings also often appear to have been insufficient to bring debt down
to lower and safer levels. This suggests that, although a debt reprofiling may be the
appropriate option under certain conditions, if it fails to pave the way to a sustainable
outcome, it should be followed by definitive debt reduction—“repeat” reprofilings should be
avoided.
In what circumstances have restructurings been effective in establishing sustainability? On
average, two-thirds of a representative sample of restructurings with private foreign
creditors in market access countries resulted in a “non-cured” outcome, requiring further
restructuring. In cases where initial debt was high a significant NPV reduction was needed to
help increase the likelihood of a successful restructuring. In cases where initial debt was at
more moderate levels, a relatively small NPV reduction was enough to raise the likelihood of
a successful restructuring. These findings suggest that a reprofiling has a good chance of
working at moderate levels of debt but should be avoided in favor of a debt reduction at
higher levels of debt.
B. Successful Avoidance of Sovereign Debt Restructuring
When countries experience debt distress, how often and under what circumstances are they able to exit
stress without needing a restructuring?
31. To address this question, staff examined episodes of exit from debt distress in both
advanced and emerging markets between 1980 and 2012.37
Staff used two complementary ways
to measure debt distress: (i) on the basis of the level of debt (when public debt exceeded 60 percent
of GDP) and (ii) using sovereign debt ratings (when such ratings fell to a trough before eventually
recovering). This dual approach, though very stylized, is intended to capture the fact that countries
can face difficulties even at comparatively low levels of debt.38
Exit from distress was defined in two
alternative ways:
37
The sample comprises 107 countries (34 advanced and 73 emerging economies) for which public debt data are
available for at least 10 consecutive years over the period 1980–2012. A total of 229 debt restructuring episodes over
the same period are considered in the sample, of which 15 are associated with domestic debt, 99 with private foreign
creditors, and 115 with official creditors (see Figure 5 and Table 2). Multiple restructurings of the same type
(domestic, private foreign or official) and in the sample year are aggregated and count as a single episode. Sources
for data on debt restructurings include Reinhart and Rogoff (2009), Cruces and Trebesch (2013), Das and others
(2012), and IMF staff reports. The main sources for debt and other macroeconomic data are Abbas and others (2010),
Mauro and others (2013), the World Bank’s World Development Indicators and WEO. Data on credit ratings come
from the three rating agencies (S&P, Moody’s and Fitch) and go through 2013.
38Nevertheless, these indicators may not capture all debt distress cases. For example, countries may experience debt
distress at debt levels lower than 60 percent, while others may be able to sustain much higher debt levels with no
(continued)

THE FUND’S LENDING FRAMEWORK AND SOVEREIGN DEBT—ANNEXES
26 INTERNATIONAL MONETARY FUND
A large debt reduction (LDR), defined as cases where (i) initial debt at the beginning of the
episode exceeded 60 percent of GDP; (ii) debt fell for at least 5 years subsequently;39
and
(iii) the total reduction was at least 10 percentage points of GDP (Appendix, Table A1).
A durable recovery in sovereign debt ratings, defined as cases where (i) ratings reached a
trough and recovered to at least an average B- rating;40
(ii) they remained above the trough
5 years later; and (iii) negative blips of at most one notch were allowed during the 5 years
following the trough. Credit ratings are averages of comparable numerical values assigned
to the letter ratings on foreign and local currency debt from Standard and Poor’s, Moody’s
and Fitch (Appendix, Table A2). The selected sample includes countries that experienced a
significant ratings downgrade (the average rating downgrade was about 4 notches) and a
few countries that, despite experiencing mild downgrades, were clearly facing significant
stress (e.g., Brazil in 1998 and 2002, and Turkey in 1996 and 2001). The selected sample
excludes ongoing distress episodes (e.g., Greece, Jamaica, Belize) and cases of ratings
downgrades leading to a final rating above A-/A3 (Appendix, Table A2).41
32. While many countries were able to exit from debt distress without a restructuring, a
significant number of cases involved a debt restructuring. As shown in Figure AII1, out of 68
cases of large debt reductions, about one half (32, all in emerging economies) entailed a
restructuring of debt owed to private foreign, official, or domestic creditors. Most restructurings
occurred when debt peaked or during the 5 years thereafter.42
When measured on the basis of
recovery in credit ratings, one fifth of all cases (7 out of 34) entailed a debt restructuring. The lower
adverse effects. However, this level is consistent with debt burden benchmarks estimated for the Fund’s debt
sustainability framework for market-access countries (MAC DSA). A signal approach was used to estimate
benchmarks which indicate the level of the debt-to-GDP ratio which best predicts the occurrence of a debt distress
event. This level was estimated at 60 percent for emerging markets and 70 percent for advanced economies. An
alternative would be to use the full range of debt burden indicators used in the MAC DSA. Unfortunately,
comprehensive data are not available for most of these indicators over a long time horizon.
39This criterion implies that debt is clearly on a downward trajectory. It does not require that debt is falling in every
single year. Instead, it allows for small increases as long as long the debt level does not exceed its initial level which
by construction is the peak over the episode.
40No country has been able to regain market access with a rating below B-.
41Such cases were excluded as credit agencies consider that the payment capacity of sovereigns with ratings above
A-/A3 is strong. A downgrade from AAA to the AA segment, for example, is therefore not included in a sample meant
to include episodes of debt distress.
42Some of the 32 cases were preceded by other debt restructurings; however, only those restructurings that strictly
coincided with the debt reduction episodes were considered in the analysis. The remaining 36 cases (15 in advanced
and 21 in emerging economies) entailed only two restructurings in the three years preceding the reduction episodes
and none during or thereafter.

THE FUND’S LENDING FRAMEWORK AND SOVEREIGN DEBT—ANNEXES
INTERNATIONAL MONETARY FUND 27
share of restructurings in this case is likely due to the fact that sovereign ratings can fall below B-
even if debt is not too high if the country faces temporary liquidity problems.
Figure AII1. Exit from Debt Distress
1/Large debt reduction episodes are defined as: (i) initial debt was larger than 60 percent of GDP; (ii) debt fell for at least 5 years
subsequently; and (iii) the total reduction was at least 10 p.p. of GDP. *The 32 debt reduction episodes correspond to 93 debt
restructurings during the episode. The latter is larger because several restructurings may occur during a debt reduction episode and
because restructurings of different types may occur in a single year (these were not aggregated in a single event in this exercise).
2/Durable rating recoveries are defined as: (i) ratings downgrades and recovery to at least B- rating; (ii) ratings remained above the
trough 5 years later; and (iii) ratings experienced blips of at most one notch 5 years after the trough.
Sources: Fund staff calculations. Restructuring episodes: Reinhard and Rogoff (2009); Das, Papaioannou and Trebesch (2012); and
Cruces and Trebesch (2013). Debt data: Abbas, Belhocine, El-Ganainy and Horton (2010); Mauro, Romeo, Binder and Zaman (2013);
WEO; and Moody's.
33. Countries that exited debt distress without the need for a restructuring generally
faced milder initial conditions. As shown in Table AII1, countries that were able to avoid a
restructuring had lower initial levels of total public and public external debt and a smaller rise in
debt in the years preceding the debt peak. They also had higher primary and current account
balances, stronger growth, lower spreads, and smaller exchange rate depreciation in the preceding
years. Thus, the data suggest that a country has a better chance of avoiding a debt restructuring if it
has lower initial indebtedness and more favorable macroeconomic indicators. These qualitative
results are robust to reducing or increasing the debt-to-GDP threshold for debt distress (from
60 percent to 40 or 80 percent).
Debt restructuring and large debt reductions, 1980-2012 1/
36 136 27 7 1132*
Debt restructuring and durable recovery in ratings, 1980-2013 2/
large debt reduction = 68 debt restructuring = 229 durable recovery = 34 debt restructuring = 18

THE FUND’S LENDING FRAMEWORK AND SOVEREIGN DEBT—ANNEXES
28 INTERNATIONAL MONETARY FUND
Table AII1. Initial Conditions Prevailing before Large Debt Reductions in Emerging Economies 1/
(percent GDP, unless otherwise stated)
34. A closer look at public debt before and during the debt reduction episodes
accompanied by restructurings can shed some light on the source of the differences between
large debt reductions with and without restructuring. Figure AII2 suggests real exchange rate
changes played an important role during both the debt buildup and the debt reduction. The latter
was also driven by the recovery of growth, some fiscal adjustment, debt treatment (nominal haircut),
and lower real interest rate payments. In the large debt reduction episodes without the need for
restructuring, the bulk of the debt reduction was achieved through strong growth and fiscal
discipline.
Variable DescriptionLDR associated with
debt restructuring 2/
LDR without
debt restructuring 3/
Number of LDR episodes 32 21
Number of debt restructurings 93 0
Public debt level at t = 0 100.4 79.8
Public debt build-up increase from t = -3 to t = 0 43.8 7.1
External public debt level at t = 0 66.0 47.2
External public debt build-up increase from t = -3 to t = 0 24.1 10.7
Primary balance average, t =-3 and t = 0 0.8 1.7
Current account deficit average, t =-3 and t = 0 3.0 2.0
GDP growth average, t =-3 and t = 0, in percent 1.1 1.8
Bond spreads average, t =-3 and t = 0, in basis points 1108 462
Depreciation of the REER average, t =-3 and t = 0, in percent 4.6 1.9
Sources: Fund staff calculations. Restructuring episodes: Reinhard and Rogoff (2009); Das, Papaioannou and Trebesch (2012); Cruces and Trebesch (2013).
Debt data: Abbas, Belhocine, El-Ganainy and Horton (2010); Mauro, Romeo, Binder and Zaman (2013); and WEO. Macro data: WEO and Bloomberg.
1/ An LDR episode starts at the debt peak (t = 0) and ends at the debt trough, and lasts at least 5 years. A debt reduction is at least 10 p.p. of GDP with
initial debt at least 60 percent of GDP. The calculations are based on the median values across LDR episodes.
2/ In the selected sample, only emerging economies experienced sovereign debt restructurings.
3/ Restructurings are possible before the debt peak but not during the LDR episode. In the sample, only two restructurings occurred before the debt peak.

THE FUND’S LENDING FRAMEWORK AND SOVEREIGN DEBT—ANNEXES
INTERNATIONAL MONETARY FUND 29
Figure AII2. Cumulative Debt Change in Large Debt Reduction Episodes
Source: Fund staff calculations. 1/
Considers only the episodes for which data on the determinants of debt are available for most of the years.
Note: The debt decomposition is based on a standard equation that breaks down the debt changes into the contributions of real
interest rate (RIR), GDP growth, real exchange rate (RER), primary balance (PB), nominal reduction (Haircut), and a residual
component. The latter reflects both data limitations (e.g., incomplete reconciliation between stocks and flows) and economic factors
(e.g., privatization receipts, recognition of contingent liabilities, bank recapitalization, etc). The contribution of the nominal
reduction is probably understated because of data availability. Real interest rate payments are lower in LDR episodes with
restructurings in part because they probably reflect flow treatment but also because of higher average inflation.
35. A review of specific country cases can also shed light on exit from debt distress.43
Brazil
and Turkey experienced crises in the early 2000s and both were able to avoid deep debt reductions.
However, although Brazil’s experience in the early 2000s illustrates how more favorable initial
conditions can help exit from debt distress without restructuring, weaker fundamentals in Turkey
necessitated some mild form of private sector involvement (Box AII1).
43
Staff reviewed a number of country cases that underwent a restructuring of external debt including sovereign
bonds from the mid-1990 and onwards. They include 14 countries (17 cases): Argentina (2005), Belize (2007 and
2013), Dominican Republic (2005), Ecuador (2000 and 2009), Greece (2012), Grenada (2005), Jamaica (2010 and 2013),
Moldova (2002), Pakistan (1999), Russia (1999–2000), Seychelles (2010), St. Kitts and Nevis (2012), Ukraine (1998–
2000) and Uruguay (2003). Brazil and Turkey were also reviewed as examples of countries which exited debt distress
without requiring a restructuring.
-60
-50
-40
-30
-20
-10
0
10
20
30
40
t = -3 to t =0 t = 0 to t = 5
RIR Growth RER PB Haircut Residual
Large debt reduction episodes with restructurings 1/
(in percentage points)
-60
-50
-40
-30
-20
-10
0
10
20
30
40
t = -3 to t =0 t = 0 to t = 5
RIR Growth RER PB Haircut Residual
Large debt reduction episodes without restructurings 1/
(in percentage points)

THE FUND’S LENDING FRAMEWORK AND SOVEREIGN DEBT—ANNEXES
30 INTERNATIONAL MONETARY FUND
Box AII1. Exiting Debt Distress without Deep Restructuring: Brazil and Turkey
Brazil and Turkey are often cited as examples of countries which exited debt distress without the need for a debt
restructuring. This box examines the circumstances that led to debt distress in each case and how a deep debt
reduction was avoided. In addition, the implications of the proposed framework for these countries are analyzed. The
main finding is that initial conditions mattered in both cases but that neither would have been reprofiled, though for
different reasons. While Brazil had lost market access, staff expressed confidence in its fiscal fundamentals and did
not express concerns about debt sustainability. By contrast, staff assessed Turkey to have weaker fundamentals going
into the crisis and its prospects for being able to service its debts were less certain. Nevertheless, the proposed new
framework would not have called for debt reprofiling since Turkey did not lose market access.
Turkey and Brazil both experienced crises in the early 2000s, but for different reasons.
In Brazil, despite successful fiscal consolidation initiated in the late 1990’s, the continued depreciation of the
currency and the large share of foreign-currency denominated debt led to a large increase of public debt. A
crisis of confidence in 2002—brought about by the concern that the winner of the October presidential
election might not stay committed to the fiscal targets—caused a sharp increase in spreads, ratings
downgrades and eventual loss of market access.
Turkey experienced a full-blown crisis in late 2000 on account of a widening current account, a fragile banking
system heavily reliant on short term funding, and, more generally, years of weak economic and policy
performance as evidenced by continued high inflation. Market pressure returned in early 2001, eventually
requiring an augmentation of the Fund-supported program in mid-2001.
The Fund responded by providing exceptional access in large amounts in each case. In both countries, the
crisis occurred in the context of an ongoing Fund lending relationship. In Brazil, the Fund had provided two Stand-
by Arrangements previously: one in December 1998 with access of SDR 13 billion, followed by another in
September 2001 with access of SDR 12.1 billion. But the largest program came in September 2002 with access of
SDR 22.8 billion (US$30 billion, 752 percent of quota). Similarly, Turkey had been provided an SBA in December
1999 with access of SDR 2.9 billion. When the crisis worsened at end 2000 and early 2001, the SBA was augmented
(twice), to SDR 15 billion (about US$19 billion, 1560 percent of quota) by May 2001. The key question addressed in
this box is whether, at the time that the Fund provided the largest access—August 2002 for Brazil and end-
2000/early 2001 for Turkey—and based on the information available to staff at the time, would it would have
required a reprofiling of the debt stock under the proposed new policy.
Figure 1. Brazil and Turkey (1998-2005)
Source: IMF Staff Reports.
0
10
20
30
40
50
60
70
80
90
100
Net
Pu
blic
Deb
t, %
of
GD
P
Brazil (1998-2005)
Approval of
SBA
Approval of SBA
Approval of SBA
Elections
Lossofmarket
access
Market Re-access
0
10
20
30
40
50
60
70
80
90
100
Net
Pu
blic
Deb
t, %
of
GD
P
Turkey (1998-2005)
Approval of
SBA
1st agreement
with foreign
2nd agreement with foreign
banks and domestic debt
swap
Augmentation
under SRF
Bond
issuances

THE FUND’S LENDING FRAMEWORK AND SOVEREIGN DEBT—ANNEXES
INTERNATIONAL MONETARY FUND 31
Box AII1. Exiting debt distress without deep restructuring: Brazil and Turkey (continued)
On the eve of the crisis, while Brazil benefited from milder initial conditions, Turkey’s macroeconomic
performance was more mixed (Text Table). At the onset of the 2002 crisis, Brazil benefited from three factors: a
healthy fiscal position, a few years of positive growth and controlled debt accumulation. Turkey, however, had been
through several years of macroeconomic imbalances and volatile growth, despite successive reform programs and
renewed commitments to policy prudence.
This assessment of economic performance was also reflected in Fund documents around the time of the
respective crises:
For Brazil, the Fund credited the authorities with a strong track record in meeting previous programs’ fiscal
targets and improvements in fiscal institutions in prior years. It was noted that the key cause of the crisis was
political uncertainty and a worsening external environment, which even in the context of good fundamentals
presented challenges for public debt management.
In Turkey, the Fund had noted mixed macroeconomic and policy performance. At the time of the
December 2000 augmentation of the program, there was recognition that the crisis was a result of both external
shocks as well as domestic policy slippages in privatization, banking and fiscal areas. Similarly, at the time of the
May 2001 augmentation, the Fund noted that further policy slippages, political uncertainty, and deterioration in
economic fundamentals had undermined the credibility of the authorities’ disinflation program and pushed the
country into a severe financial crisis.
A reprofiling of Brazil’s debt would not have been considered appropriate even though it had lost market
access. The key purpose of the exceptional access Fund arrangement in August 2002 in the run-up to presidential
elections was to provide a framework to coordinate the presidential candidates’ public endorsement of the Fund-
supported adjustment program. With political parties having signed on to the core elements of the Fund-supported
program, the Fund was able to assert that continued prudent macroeconomic policies with the support of the Fund
would allow Brazil to regain public debt sustainability and investors’ confidence which would help avert a potentially
systemic crisis in the region as well as in emerging markets.1 This strategy worked. While market pressures did not
immediately abate, the new government delivered on its commitment to the program, and spreads eventually came
down. Market access was regained in April 2003, less than a year from when it was lost (Figure A).
Brazil Turkey
Real GDP growth (annual percent change) 2.0 1.4
Overall fiscal balance -3.8 -14.6
Primary balance 3.3 1.9
Net public debt 50.7 55.7
Net public debt (projected for 1st program year) 58.5 79.7
Current account balance -4.1 -1.1
Conditions prevailing at program request / augmentation
(in percent of GDP, unless otherwise stated)
Sources: Fund staff reports and VEE data. All indicators except projected public debt are
averages between t-1 and t-3 where t = 2001 for Turkey and 2002 for Brazil.

THE FUND’S LENDING FRAMEWORK AND SOVEREIGN DEBT—ANNEXES
32 INTERNATIONAL MONETARY FUND
Box AII1. Exiting Debt Distress without Deep Restructuring: Brazil and Turkey (concluded)
Even though the prospects for debt sustainability were less certain in Turkey, its debt would not have been
considered appropriate for reprofiling because it did not lose market access. The staff report for the May 2001
augmentation noted that deterioration in market sentiment since the beginning of the year had put “the
sustainability of public debt dynamics…in question” (IMF 2001a). It also noted that an immediate task facing the
authorities was to lengthen maturities of debt falling due. Nevertheless, Turkey was able to maintain market access,
though at high interest rates. Even as market sentiment had been deteriorating, the government was able to place a
€0.7 billion bond with European retail investors in January 2001, and the staff report planned financing of more than
US$7 billion from Eurobond issues during 2001–02. Turkey was never downgraded to “selective default” during this
period, and by the last quarter of 2001 it was able to issue a series of U.S. dollar and euro-denominated bonds
(Figure 1). Staff also noted in the April 2013 sovereign debt restructuring paper that “throughout the stressful
period, Turkey was able to preserve market access albeit at very high interest rates.”
Even though the proposed new framework would not have called for a debt reprofiling, Turkey undertook a
voluntary creditor bail-in to manage the crisis. When the first crisis hit in late 2000, the authorities effectively
managed it through efforts at correcting policy imbalances while also reaching agreement with external private
creditors to maintain their support. In December 2000, major foreign creditors agreed to maintain aggregate
exposure to the Turkish banking system on assurances that macroeconomic and financial instability would not
recur, a commitment that was supported by an enhanced Fund-supported program. In February 2001, Turkey was
hit by a second major crisis. This was brought about by a dramatic increase in real interest rates and ensuing
concerns over debt dynamics, prompting capital outflows. Based on a commitment to further strengthen domestic
policies, the authorities were able to negotiate restored exposure from foreign creditors. They also organized a
voluntary and market-priced domestic debt swap that markedly improved Turkey’s debt profile. On account of
these measures, the staff report for the 8th review noted the following: “To further reduce the government’s
borrowing need and to address the debt roll-over problem, besides intending to use available external financing,
the authorities are relying on voluntary private sector involvement (PSI). On the domestic side, the recent debt
swap, alongside continued strong fiscal policy and the ongoing use of external assistance, should keep the
Treasury’s domestic borrowing need well below redemptions during the second half of 2001. Regarding foreign PSI,
in mid-June the authorities recently secured a voluntary commitment from foreign commercial bank creditors to
maintain their interbank and trade credit lines to Turkish banks, with a view to rebuilding their exposure as the
program is implemented” (IMF 2001b).
_____________________________________
1The 2002 Brazil program was agreed shortly before the 2002 Exceptional Access framework was ratified by the Board. This
program did not therefore include any reference to exceptional access.
C. Has Debt Restructuring Been Deployed Effectively?
When restructurings have been used, have they been timely and adequately sized?
36. A broader sample corroborates the message of the 2013 paper that restructurings
have tended to be “too little too late.” In cases where a debt treatment is eventually needed, debt
has often remained high for a long period of time before any action is taken, suggesting that
restructurings have tended to be unduly delayed. As shown in Figure AII3, debt overhang had been
lingering for a number of years before a restructuring.
37. As noted in the 2013 paper, there may be many reasons for delaying a restructuring.
While the costs of delaying a restructuring are well known, country authorities and other
stakeholders may weigh this against risks to financial stability, contagion and perceived risk of

THE FUND’S LENDING FRAMEWORK AND SOVEREIGN DEBT—ANNEXES
INTERNATIONAL MONETARY FUND 33
protracted loss of market access. For example, in Jamaica (2010), where 65 percent of the debt was
held by domestic financial institutions, there were concerns about the risks of financial sector
distress. In the case of Greece (2010), spillovers on other euro area countries were a particular
concern. Ongoing initiatives on the part of official creditors, who may have an interest in accepting
or encouraging overly sanguine assessments of the debt sustainability, may also play a role. Indeed,
while this may also reflect concerns about possible adverse market reactions or true uncertainties,
the review of country cases shows that staff reports prior to restructurings were often not very
explicit about whether the country’s debt problem was assessed to be one of liquidity or solvency,
even in some cases with very high debt levels. Furthermore, the recent IEO report (2014) on IMF
forecasts suggest that short-term forecasts of GDP growth and inflation made in the context of IMF-
supported programs, while unbiased in the majority of cases, tended to be optimistic in high-profile
cases characterized by exceptional access to IMF resources.
38. Debt reduction operations also often appear to have been insufficient to bring debt
down to safer levels while creating much needed fiscal space. From 1980 to 2012, of the 44
countries that restructured their debt in the sample, 86 percent had more than one restructuring.
This pattern emerges in restructurings with both private and official creditors; on average each
country had over 5 restructurings, of which about half were with private foreign creditors (Table
AII2). Repeat restructurings suggest that a one-time restructuring was often not enough to solve the
debt problem (Figures AII4 and AII5).44
For example, Poland went through six restructurings with
private creditors and four with the Paris Club between 1981 and 1990, mostly consisting of
rescheduling of principal and interest. The debt problem was not fully resolved until the Paris Club
granted 50 percent debt forgiveness in 1991 and, after lengthy negotiations, private banks agreed
to a 45 percent debt reduction in 1994.45
39. Inadequately-sized restructuring may be linked to the desire to avoid the costs
associated with large debt reductions. The available literature finds that significant debt
reductions often have higher economic costs, with lengthier market exclusion (see Cruces and
Trebesch 2013). Annex III also argues that light restructurings have smaller economic costs.
44
These results are consistent with some of the existing literature. See for example, Moody’s (2013b). Note that it may
be that when there are consecutive restructurings, they are meant to cure the same debt distress episode and are
part of one drawn out restructuring negotiation process. The findings documented in Figures AII4 and AII5—the
presence of repeat restructurings—are robust to grouping two or more consecutive restructuring as one long
restructuring episode.
45Cline (1995).

THE FUND’S LENDING FRAMEWORK AND SOVEREIGN DEBT—ANNEXES
34 INTERNATIONAL MONETARY FUND
Figure AII3. Delayed Restructurings
Sources: Fund staff calculations. Restructuring episodes: Reinhart and Rogoff (2009); Das, Papaioannou, and Trebesch (2012); and Cruces and
Trebesch (2013). Debt data: Abbas, Belhocine, El-Ganainy, and Horton (2010); Mauro, Romeo, Binder, and Zaman (2013); and WEO.
Figure AII4. Repeat Restructurings, 1983–2012
Sources: Fund staff calculations; Reinhart and Rogoff (2009); Das, Papaioannou, and Trebesch (2012); and Cruces and Trebesch (2013).
Note: The bars for each year denote the total number of restructurings broken down by countries that did not have a restructuring in the
previous three years versus those that had at least one restructuring in the previous three years. For instance, the sample comprises a total of
16 restructurings in 1983, of which 9 episodes were not preceded by any restructuring during 1980–82, and 7 episodes were preceded by at
least 1 restructuring in the same period. The sample comprises domestic, private foreign and official foreign restructurings.
0
50
100
150
200
250
300
0 50 100 150 200 250 300
Deb
t-to
-GD
P 3
years
befo
re r
est
ructu
rin
g
Debt-to-GDP ratio 1 year before restructuring
Debt was "high" 3 years before restructuring
Debt was much lower 3 years before restructuring
Proportion = 19%
"High": debt at t = -3 is less that 15 p.p. lower than debt
at t = -1 or at least 60% of GDP
0
2
4
6
8
10
12
14
16
18
20
1983
1984
1985
1986
1987
1988
1989
1990
1991
1992
1993
1994
1995
1996
1997
1998
1999
2000
2001
2002
2003
2004
2005
2006
2007
2008
2009
2010
2011
2012
Episodes with no prior restructurings in the preceding 3 years
Episodes with prior restructurings in the preceding 3 years

THE FUND’S LENDING FRAMEWORK AND SOVEREIGN DEBT—ANNEXES
INTERNATIONAL MONETARY FUND 35
In what circumstances have restructurings been effective in establishing sustainability?
40. On average, two-thirds of all restructurings with private foreign creditors did not
successfully establish sustainability and led to repeat restructurings. To address the question
posed in this section, staff distinguished between “cured” and “non-cured” restructurings. Following
the literature, a cured restructuring is defined as follows: (i) it is not followed by another
restructuring with private foreign creditors in the next four years; (ii) the country does not remain in
state of default; and (iii) the country regains market access some time following the restructuring
and before another restructuring with private foreign creditors occurs.46
Market re-access is
measured as the first international bond/loan issuance after the restructuring (as long as it led to an
increase in the public and publicly guaranteed external debt with private creditors) and/or by
positive net transfers (through bonds or loans) from private creditors to the public sector.47
The
results show that of the 99 restructurings with private foreign creditors in the sample, only about a
third met the criteria for a ‘cured’ outcome and hence resulted in long-lasting solution to the debt
problem.
46
See Richmond and others (2009), Gelos and others (2011), and Cruces and Trebesch (2013).
47See, for instance, Cruces and Trebesch (2013). Four years is slightly above the average time of market exclusion in
the sample. The definitions of “cured” and “non-cured” only involve restructurings with private foreign creditors
given data availability on debt reduction in both nominal and net-present-value (NPV) terms. Finally, we follow
Cruces and Trebesch (2013) and consider the Argentine 2005 restructuring as cured. This case also satisfies the
criteria for market re-access.

Figure AII5. Restructuring Episodes by Country, Type and Year, 1980–2012
Sources: Cruces and Trebesch (2013); Das, Papaioannou, and Trebesch (2012); Reinhart and Rogoff (2009); and Fund staff calculations.
Note: The 2005 official foreign restructuring in Sri Lanka and Indonesia refers to a debt deferral which was related to the Indian Ocean Tsunami in 2004.
19
80
19
81
19
82
19
83
19
84
19
85
19
86
19
87
19
88
19
89
19
90
19
91
19
92
19
93
19
94
19
95
19
96
19
97
19
98
19
99
20
00
20
01
20
02
20
03
20
04
20
05
20
06
20
07
20
08
20
09
20
10
20
11
20
12
◆ Private foreign ("cured" = large diamond) ◆ Private domestic ◆ Official foreign
AlbaniaAlgeriaAngola
ArgentinaBelize
Bosnia and HerzegovinaBrazil
BulgariaChile
Costa RicaCroatia
Dominican RepublicEcuador
EgyptEl Salvador
Equatorial GuineaFYR Macedonia
GabonGreece
GrenadaGuatemala
IndonesiaJamaicaMexico
MoroccoPakistanPanama
Paraguay
PeruPhilippines
PolandRomania
RussiaSerbia
SeychellesSlovenia
South AfricaSri Lanka
St. Kitts and NevisTrinidad and Tobago
TurkeyUkraine
UruguayVenezuela
36
IN
TER
NA
TIO
NA
L MO
NETA
RY F
UN
D
TH
E F
UN
D’S
LEN
DIN
G F
RA
MEW
OR
K A
ND
TH
E S
OV
ER
EIG
N D
EB
T—
AN
NEX
ES

THE FUND’S LENDING FRAMEWORK AND THE SOVEREIGN DEBT—ANNEXES
INTERNATIONAL MONETARY FUND 37
Table AII2. Restructuring Episodes by Country and Type, 1980–2012
Sources: Cruces and Trebesch (2013); Das, Papaioannou, and Trebesch (2012); Reinhart and Rogoff (2009); and Fund staff
calculations.
Note: The 2005 official foreign restructuring in Sri Lanka and Indonesia refers to a debt deferral which was related to the Indian
Ocean Tsunami in 2004.
Country Private Foreign Official Domestic Total
Ecuador 6 8 1 15
Jamaica 5 7 1 13
Poland 7 5 12
Argentina 5 5 1 11
Brazil 6 4 1 11
Gabon 2 8 10
Philippines 4 6 10
Mexico 5 3 1 9
Morocco 3 6 9
Peru 3 5 1 9
Russia 3 5 1 9
Costa Rica 3 5 8
Dominican Republic 3 4 1 8
Chile 5 2 7
Indonesia 5 1 6
Panama 3 2 1 6
Romania 3 2 5
Uruguay 5 5
Albania 1 3 4
Algeria 2 2 4
Bulgaria 1 3 4
Equatorial Guinea 4 4
Pakistan 1 3 4
Turkey 2 1 1 4
Ukraine 3 1 4
Venezuela 3 1 4
Bosnia and Herzegovina 1 2 3
FYR Macedonia 1 2 3
South Africa 3 3
Trinidad and Tobago 1 2 3
Angola 1 1 2
Croatia 1 1 2
Egypt 2 2
Grenada 1 1 2
Paraguay 1 1 2
Seychelles 1 1 2
Sri Lanka 1 1
St. Kitts and Nevis 1 1 2
Belize 1 1
El Salvador 1 1
Greece 1 1
Guatemala 1 1
Serbia 1 1
Slovenia 1 1
Total 99 115 14 228

THE FUND’S LENDING FRAMEWORK AND SOVEREIGN DEBT—ANNEXES
38 INTERNATIONAL MONETARY FUND
41. Successful restructurings starting from high initial debt typically required larger
principal reduction but also benefited from a good policy framework and benign external
conditions. To help understand the characteristics of successful restructurings, staff estimated the
probability of a cured restructuring as a function of exogenous shocks (e.g., natural disasters or
global liquidity conditions), policies and institutions, macroeconomic fundamentals and initial
conditions, and the terms and characteristics of the restructuring (see Box AII2). Comparing the
unconditional mean of the debt treatment in cured and non-cured restructurings reveals that a
larger debt reduction was needed for a successful end to debt problems particularly when initial
debt was high. Successful exit from debt distress may be also achieved through low to moderate
debt reduction when initial debt is relatively low (Figure AII6). This evidence is corroborated by the
estimated probability of a cured restructuring. Figure AII7 shows the estimated probability of a
successful restructuring for two different types of restructurings: one with a high (40 percent) and
the other with a low (20 percent) NPV reduction. As is to be expected, the probability of success is
inversely related to the initial debt levels, as countries that enter a debt crisis at a higher debt level
usually have many other macro-economic problems in addition to high debt. As the figure shows,
the beneficial effect of a NPV reduction on the probability of success (the vertical difference
between the blue and gray bars) is more pronounced for high debt levels. For example, for a country
with an initial debt level of 50 percent of GDP, there is a 50 percent chance it would reestablish
sustainability with a small NPV reduction. However, at an initial debt level of 70 percent of GDP, a
small NPV reduction is more likely to perpetuate the problem and there is a bigger premium to a
larger debt reduction in successfully reestablishing sustainability. These findings support the
conclusion that a reprofiling (even small) is more beneficial at more moderate levels of initial debt
and should generally be avoided at high initial debt levels. The existence of an IMF program at the
time of restructuring also improves the likelihood of success.48
On the other hand, unfavorable
global conditions, high initial debt level and exogenous shocks (e.g., a natural disaster) have the
opposite effect.
48
Also see Erce (2013), and Moody’s (2013a).

THE FUND’S LENDING FRAMEWORK AND THE SOVEREIGN DEBT—ANNEXES
INTERNATIONAL MONETARY FUND 39
Figure AII6. Average Nominal and NPV Reduction in Debt Restructurings with Private Foreign
Creditors, 1980–2012
Sources: Fund staff calculations; Cruces and Trebesch (2013); Das, Papaioannou, and Trebesch (2012); and Reinhart and Rogoff (2009).
Note: A cured restructuring is defined as in paragraph 40: (i) it is not followed by another restructuring with private foreign creditors
in the next four years; (ii) the country does not remain in state of default; and (iii) the country regains market access some time
following the restructuring and before another restructuring with private foreign creditors occurs.
Figure AII7. Estimated Probabilities Implied by Different NPV Reduction and Initial Debt
(in percent)
Source: Fund staff estimates.
Note: The bars are estimated probabilities implied by the Probit “long” model as described in Box 2,considering a low (20 percent)
and a high (40 percent) NPV reduction and low (50 percent of GDP) and high (70 percent of GDP) initial debt. To calculate the
probabilities, only statistically significant coefficients are used, and all the right-hand side variables (except NPV reduction and
initial debt) are kept at their sample mean.
0
5
10
15
20
25
Initial debt < 60 Initial debt > 60
Noncured Cured
Average nominal reduction(in percent of debt treated)
0
10
20
30
40
50
Initial debt < 60 Initial debt > 60
Noncured Cured
Average NPV reduction (in percent of the present value of the old debt)
0
10
20
30
40
50
60
70
80
90
Debt = 70 percent of GDP Debt = 50 percent of GDP
NPV reduction = 20 percent
NPV reduction = 40 percent

THE FUND’S LENDING FRAMEWORK AND SOVEREIGN DEBT—ANNEXES
40 INTERNATIONAL MONETARY FUND
Box AII2. Estimating the Probability of a Cured Restructuring
Econometric model. A “cured” restructuring, the event of interest, is measured by the binary variable
which takes the value 1 if the restructuring is deemed cured and 0 otherwise, and where the index i
denotes “a restructuring episode” with private foreign creditors. It is assumed that the conditional
probabilities of a cured restructuring, , follow a normal distribution, where is
the normal cumulative distribution function (CDF), is the set of control variables and is the vector of
coefficients to be estimated. The vector of parameters and the probabilities are estimated through a Probit
regression using cross-section data, where the cross-sectional unit is the restructuring episode.
Data. The left-hand side variable is based on the definition of a “cured” default, as defined in paragraph
40, and involves only restructurings with private foreign creditors. There are in total 96 such cases, after
excluding a few cases in the beginning of the sample for which there is no information available on initial
conditions, and cases at the end for which there is no history after restructuring. The relevant control
variables included in the vector Xi fall in four broad groups:1
i. Terms/characteristics of the restructuring. Controls include: size of face value reduction, in
percent of debt treated (expected sign: positive); size of haircut (NPV reduction), in percent of PV
of old debt (expected sign: positive); instrument, measured by a dummy that takes the value 1 if
the restructuring involved a bond exchange, and zero otherwise (expected sign: uncertain); debt
treatment, measured by a dummy variable that takes the value 1 if the restructuring involved debt
treated previously, and zero otherwise (expected sign: positive).
ii. External shocks. Controls include: natural disasters, measured by the average cost (as a fraction
of GDP) of natural disasters occurring during the four years following the restructuring; data come
from the International Disaster Database (expected sign: negative); global liquidity, measured by
the average spread between the 30-year U.S. bond yields and 30-years Baa corporate bond yields
from Moody’s in the four years after each restructuring. (This variable also measures investor risk
appetite, as suggested by Richmond and Dias (2009) among others. A low spread is associated
with higher liquidity in global financial markets and stronger demand for riskier assets, including
sovereign debt (expected sign: negative)).
iii. Policy/institutions. Controls include: IMF program, measured by a dummy that takes the value of
1 for the first year of an IMF program starting in the year of restructuring or in the previous two
years, and zero otherwise—as argued by Gelos and others (2011), this variable acts as a “seal of
approval” of sound economic policies (expected sign: positive); political institutions, as in Cruces
and Trebesch (2013), measured by a dummy that takes the value of 1 for the first two years of a
new government over the four-year period preceding the restructuring, from the Database of
Political Institutions (Beck and others, 2000) (expected sign: positive).
THE FUND’S LENDING FRAMEWORK AND THE SOVEREIGN DEBT—ANNEXES
INTERNATIONAL MONETARY FUND 41
Box AII2. Estimating the Probability of a Cured Restructuring (concluded)
iv. Initial conditions/macro fundamentals. Controls include: debt level in the year before the
restructuring (expected sign: negative); to capture potential nonlinear effects from the debt level,
the
v. interaction between initial debt and debt reduction (either in nominal or in NPV terms) (expected
sign: positive); level of development, measured by (the log of) real GDP per capita in the year
before the restructuring. (According to Gelos and others (2011) this variable also captures the
country’s vulnerability to shocks. Expected sign: positive); openness, measured by the average ratio
of exports and imports to GDP in the four years before the restructuring (expected sign: positive);
macro volatility, measured by the standard deviation of GDP growth in a 10-year window before
the restructuring, in the spirit of Gelos and others (2011) (expected sign: negative); domestic
liquidity or coverage ratio, measured by the average reserves-to-imports ratio (in months) in the
four years prior the restructuring (expected sign: positive).
Results. Four baseline models were estimated, two “long” models (i.e., including the full set of controls
described above), and two “short” models that excluded four controls (political institutions, income
volatility, openness and coverage ratio), in both cases one variant considered the face-value reduction and
the other considered the NPV reduction on the right-hand side. Most estimated coefficients are
statistically significant at conventional levels and have the expected sign (GDP per capita being the notable
exception), including the three key coefficients of interest (size of debt reduction, initial debt level, and
interaction between debt reduction and initial debt). The results suggest that there is a tension between
the size of the debt treatment and the size of the overall debt: while a high initial debt reduces the odds of
success, an appropriately large haircut tends to improve it. The estimated probabilities implied by the
“long model” in the case of NPV reduction are shown in Figure AII7.
_______________________________
1Robustness checks using alternative controls (e.g., global growth, terms of trade shocks, country size) did not
overturn the baseline results but generally yielded regressions with a lower fit.
42. Evidence on the effectiveness of restructurings can also be drawn from case studies.
They provide information regarding staff’s assessment before the restructuring on whether the debt
operations were expected to be successful in establishing sustainability, as well as the assessment of
the result after the restructuring. Success was often seen to depend not only on the debt treatment
itself but also on continued adjustment:
Ex-ante assessment. The case studies show that, ex ante, staff was not always confident that
planned debt restructurings would re-establish debt sustainability (Ecuador 2000, Belize
2007, Jamaica 2010 and 2013, Moldova, Greece 2012) and the expected outcome was often
made conditional upon continued ambitious adjustment. For example, in the January 29,
2010, request for an SBA for Jamaica, staff states that: “The debt exchange is expected to
THE FUND’S LENDING FRAMEWORK AND SOVEREIGN DEBT—ANNEXES
42 INTERNATIONAL MONETARY FUND
result in a significant extension of maturities and interest savings”, but that “Given Jamaica’s
debt overhang problem, public sustainability risks remain high.”49
Ex-post assessment. Similarly, in many cases it is unclear whether staff assessed debt
sustainability to have been achieved ex post. In several cases, re-establishing sustainability
still hinged on further adjustments (Argentina, Greece, Jamaica 2010, Grenada) and/or
overall positive macroeconomic developments (Argentina, Greece). For example, in 2006,
reporting on Grenada after its debt restructuring, staff noted that “All told, the adjustment
envisaged under the program would bring public debt on a sustainable path. As shown above,
however, accomplishment of both fiscal and growth objectives are crucial to obtain this result.
Failure to adhere to program targets would rapidly result in an unsustainable debt
trajectory.”50
Final outcomes. Out of eight cases that were assessed to have solvency issues before
restructuring, only five included a cut in face value. Two of the three cases that only
underwent a reprofiling continue to have debt problems (Grenada and Jamaica).
Examples of reprofiling. In some cases, a reprofiling of debt was sufficient to restore
market access and debt sustainability. When debt sustainability was uncertain or countries
faced a liquidity problem, reprofiling proved to be a useful element in addressing debt
problems provided program implementation was strong (Dominican Republic, Pakistan,
Uruguay). It was not successful in cases where debt was too high or financial stability
concerns dictated its use without addressing the fragility in the financial sector (Grenada,
Jamaica 2010). Although it was mostly used in normal access cases, Uruguay (2003) stands
out as an example of reprofiling in the context of a Fund-supported program with
exceptional access (Box AII3); this case was possible only because the 2002 exceptional
access reform had not yet gone into effect
49
Jamaica Art. IV Consultation and Request for Stand-By Arrangement, January 2010, Country Report No. 10/267,
August 2010.
50Grenada: Request for Three-Year Arrangement Under the Poverty Reduction and Growth Facility, IMF Country
Report No. 06/277, July 2006.

THE FUND’S LENDING FRAMEWORK AND THE SOVEREIGN DEBT—ANNEXES
INTERNATIONAL MONETARY FUND 43
0
2
4
6
8
10
12
14
0
200
400
600
800
1000
1200
1400
1600
2000 2001 2002 2003 2004 2005 2006
EMBI Spread (left) Credit ratings (right)
Uruguay: Market Access Indicators(EMBI spreads in basis points, credit ratings from 0 (D) to 20 (AAA) 1/)
Sources: Bloomberg; rating agencies; and Fund staff calculations.
1/ Averages S&P, Moody's and Fitch.
-50
-40
-30
-20
-10
0
10
20
30
40
50
-8
-6
-4
-2
0
2
4
6
8
1998 1999 2000 2001 2002 2003 2004 2005 2006 2007 2008
GDP growth (left)
Primary balance-to-GDP (left)
Change in the RER (right)
Uruguay: Macro Fundamentals
(in percent, positive RER change is a depreciation)
Sources: WEO; and Fund staff calculations.
Box AII3. Reprofiling in Uruguay
This box reviews the experience of Uruguay with a face-value preserving maturity extension.1
Trigger. After years of moderate debt ratios and healthy growth,
macroeconomic fundamentals in Uruguay deteriorated very quickly
following the Brazilian and Argentine crises of the late 1990s and
early 2000s. By early 2000s, the high dollarization of the banking
sector, dependence of its funding on nonresident deposits (mainly
from Argentina) and the large share of public debt in foreign
currency made Uruguay vulnerable to negative shocks stemming
from its two most important neighbors. In 2001, the Argentine
default triggered a run on bank deposits that caused a depletion of
international reserves and rising borrowing costs, and culminated in
a ratings downgrade, a 50 percent exchange rate devaluation, and a
severe recession in 2002. As a result, public debt rose from
40 percent of GDP in 2001 to about 100 percent in 2003, making it difficult for the government to rescue distressed
banks. A full-blown banking crisis was averted with measures to restrict deposit withdrawals and a Fund-supported
program was approved in March 2002, which was subsequently augmented in June 2002 and August 2002. The large
increase in debt and debt service led authorities to seek an extension of maturities with creditors in May 2003.2
Debt exchange. The debt exchange intended to achieve debt service relief in a creditor-friendly way, entailing low
NPV haircut and no nominal reduction. The debt treatment was “preemptive” (prior to any unilateral default, with
authorities remaining committed to full debt service), comprehensive (targeted about half of total debt), and
comprised distinct instruments offered to domestic and external creditors. The exchange offered most bondholders
a choice between two options, both involving approximately a
par-for-par exchange: a maturity extension option and a
benchmark bond option. Under the maturity extension option
each existing bond could be exchanged for a bond with similar
coupon and extended maturity (5 years longer, generally) while
under the benchmark bond option each bond could be exchanged
for one of a number of benchmark bonds, longer-dated but more
liquid than under the maturity extension option. Nearly two-thirds
of the bond holders chose the maturity extension option. The
maturity of international bonds issued under foreign law was
extended by an average of 6.4 years while that of domestically
issued bonds and treasury bills was extended by 8.6 years on
average. Since the reprofiling was implemented at the interest rates at which the bonds were issued (when Uruguay
had investment grade ratings) rather than at the market rates prevailing at the exchange, it entailed a positive but
small NPV reduction—about 13.3 percent for the international bonds and 23.3 percent for domestic bonds. To
ensure inter-creditor equity the debt treatment involved
(i) asymmetric exchange ratio among creditors, that is, creditors
received new instruments whose face value varied depending on
the maturity of old instruments while having the same aggregate
face value of the old; and (ii) asymmetric cash payments, that is,
some bondholders received small upfront cash payments to
compensate for accrued interest on the old bonds. The exchange
was completed relatively quickly:
It was launched on April 10 and closed on May 29, 2003. Though
the participation rate varied across bonds, the average
participation was 89 percent for international bonds and
99 percent for domestic obligations.
0
20
40
60
80
100
120
1998 1999 2000 2001 2002 2003 2004 2005 2006 2007 2008
Total External
Uruguay: Public Debt
(in percent of GDP)
Sources: Mauro and others (2013); and Fund staff calculations.

THE FUND’S LENDING FRAMEWORK AND SOVEREIGN DEBT—ANNEXES
44 INTERNATIONAL MONETARY FUND
Box AII3. Reprofiling in Uruguay (concluded)
Risks. Fund staff explicitly flagged the risks to the debt exchange, including potential problems in
implementation, the difficult economic environment and the impact of the operation on the banking system.
This uncertainty even persisted after successful completion of the exchange: “vulnerability has decreased but risks
to the program remain significant…The main risks are in the still-fragile banking system and the continuing
challenges to meeting the primary surplus targets required for debt sustainability” (IMF 2003).
Outcome. The reprofiling was a success and allowed Uruguay to regain market access relatively quickly and
improve economic fundamentals in a durable way.
o Macro fundamentals. Strong program implementation, coupled with a more favorable external
environment, gradually dissipated the uncertainty regarding debt sustainability. Public debt came down
to more moderate levels, driven by robust growth recovery, sizeable fiscal balances and some reversal
of the exchange rate devaluation.
o Policies. The sound policies implemented under the program were important to restore Uruguay’s
credit standing and debt sustainability. For instance, tight control over current expenditure and
adjustment of public tariffs in line with costs strengthened the fiscal position; the implementation of a
bank’s restructuring program limited fiscal costs; maintaining a floating exchange rate helped to boost
exports and rebuild externals buffers; and implementation of a prudent debt management strategy
resulted in debt issuances with longer maturities and better terms.
o Market access. Following the exchange, Uruguay successfully regained market access in June 2003,
issuing a US$53 million dollar-denominated bond with 7.7-year maturity and 10.6 percent yield to
maturity. In October 2003, Uruguay was able to issue again, this time an international bond
denominated in domestic currency and 3-year maturity. As market confidence continued to improve
and the international environment turned more favorable (higher commodity prices, resumption of
growth in Brazil and Argentina), spreads returned to pre-crisis levels and credit ratings recovered in the
following months. The investor-friendly nature of the restructuring also contributed to the quick fall in
spreads and fast market re-access. Although the selective default downgrade was very short (less than a
month), investment grade was regained only in 2012.
o Domestic financial stability. The maturity extension had a small impact on domestic banks in part
because they had low exposure to government bonds. In addition, the bank supervisory authorities
provided strong regulatory incentives for banks to participate in the exchange (e.g., the central bank
only allowed new bonds as eligible collateral).3
__________________________
1Also see Sturzenegger and Zettelmeyer (2006).
2The Fund program involved exceptional access which was approved before the 2002 framework became effective. An SBA of
SDR 594.1 million was approved in March 2003 but in June 2003 the Board recommended an augmentation of SDR 1.2 billion
upon request from Uruguayan authorities.
3See Annex IV.

THE FUND’S LENDING FRAMEWORK AND THE SOVEREIGN DEBT—ANNEXES
INTERNATIONAL MONETARY FUND 45
D. Conclusion
43. The main conclusions of this retrospective illustrate the importance of reforming the
Fund’s lending framework to help resolve debt problems in a timely and effective manner.
Three main lessons can be drawn from the evidence: (i) a debt restructuring has often been part of
the solution to addressing debt overhang; (ii) however, restructurings have often been delayed and
inadequately sized; and (iii) ‘curing’ debt distress often requires not only resilience to shocks,
prudent macroeconomic policy but also adequate debt reduction when initial debt is high. A light
debt restructuring is sufficient to address debt distress when initial debt is low to moderate. Taken
together, this evidence suggests that, considering the costs associated with deep restructurings,
light restructurings have reasonable prospects for restoring sustainability at moderate levels of
public debt. Light restructurings should generally not be used for high debt cases and, if they are
tried and fail to work, they should not be repeated but instead should be followed by a deeper and
more definitive debt reduction.

Appendix-Table A1. Samples of Large Public Debt Reductions in Emerging Economies 1/
(in percent of GDP unless stated otherwise)
Country Start End 3/
Duration
in years
Initial
Debt
Final
Debt
Reduction
in p.p. Speed 4/ Country Start End 3/
Duration
in years
Initial
Debt
Final
Debt
Reduction
in p.p. Speed 4/
Egypt 1982 1989 7 134.4 87.5 46.8 6.7 Belize 1985 1990 5 68.8 39.8 29.0 5.8
Equatorial Guinea 1982 1987 5 263.3 142.7 120.5 24.1 Malaysia 1987 1997 10 109.0 32.3 76.8 7.7
Costa Rica 1983 1995 12 110.3 34.6 75.7 6.3 Kuwait 1991 2008 17 203.4 9.8 193.6 11.4
Uruguay 1984 1996 12 99.9 31.8 68.1 5.7 Hungary 1991 2001 10 127.6 52.6 75.0 7.5
Chile 1985 2000 15 165.5 13.3 152.3 10.2 Egypt 1992 2000 8 136.6 66.8 69.8 8.7
Dominican Rep. 1985 2000 15 60.7 19.3 41.4 2.8 Morocco 1993 2009 16 90.4 48.0 42.4 2.6
El Salvador 1985 1998 13 108.3 24.5 83.8 6.4 Barbados 1994 1999 5 71.8 34.7 37.1 7.4
Jamaica 1985 1997 12 181.3 69.4 111.9 9.3 Libya 1994 2007 13 78.5 0.0 78.5 6.0
Morocco 1985 1991 6 117.7 85.5 32.2 5.4 Tunisia 1997 2010 13 62.5 40.5 22.0 1.7
Mexico 1986 1994 8 78.1 30.9 47.2 5.9 Turkmenistan 1998 2007 9 64.4 2.4 62.0 6.9
Panama 1988 1995 7 105.6 60.6 45.1 6.4 Qatar 1999 2007 8 72.6 8.9 63.7 8.0
Argentina 1989 1994 5 115.0 28.9 86.2 17.2 Equatorial Guinea 1999 2008 9 61.1 0.7 60.4 6.7
Sri Lanka 1989 1997 8 105.1 83.0 22.1 2.8 Panama 2001 2011 10 71.1 37.8 33.3 3.3
Ecuador 1990 1997 7 100.8 56.7 44.1 6.3 Brazil 2002 2008 6 79.8 63.5 16.3 2.7
Poland 1991 2000 9 70.6 36.8 33.8 3.8 Antigua and Barbuda 2002 2008 6 127.5 76.9 50.7 8.4
Philippines 1993 1998 5 67.7 51.1 16.7 3.3 Jamaica 2002 2007 5 106.3 83.0 23.4 4.7
Bulgaria 1993 2010 17 289.6 14.9 274.6 16.2 Saudi Arabia 2002 2012 10 96.9 3.6 93.3 9.3
Venezuela 1994 2000 6 71.9 31.9 40.0 6.7 Montenegro, Rep. of 2002 2007 5 75.7 27.5 48.2 9.6
Algeria 1994 2008 14 98.0 8.1 89.9 6.4 India 2003 2012 9 84.3 66.8 17.5 1.9
Albania 1994 2007 13 85.2 53.4 31.7 2.4 Philippines 2003 2011 8 68.0 41.9 26.1 3.3
Ecuador 1999 2009 10 93.8 15.7 78.1 7.8 Lebanon 2006 2011 5 179.9 137.4 42.4 8.5
Indonesia 1999 2012 13 95.9 24.0 71.9 5.5 Median 9 79.8 39.8 48.2 6.9
Angola 1999 2007 8 165.3 21.4 143.8 18.0 Mean 9 97.0 41.7 55.3 6.3
Russia 1999 2008 9 88.7 7.9 80.8 9.0
Ukraine 1999 2007 8 61.0 12.3 48.7 6.1 Sources: Abbas, Belhocine, El-Ganainy and Horton (2010); Mauro, Romeo, Binder (2013); WEO;
Serbia 2000 2008 8 241.7 34.2 207.5 25.9 and Fund staff calculations.
Turkey 2001 2007 6 77.9 39.9 38.0 6.3 1/ An LDR episode starts at the debt peak (t = 0 = start) and ends at the debt trough, and lasts at least 5 years.
Pakistan 2001 2007 6 87.9 55.3 32.6 5.4 A debt reduction is at least 10 p.p. of GDP with initial debt at least 60 percent of GDP.
Argentina 2002 2012 10 165.0 44.9 120.1 12.0 2/ Restructurings are possible before the debt peak but not during the LDR episode. In the sample, only two
Gabon 2002 2008 6 87.3 20.9 66.4 11.1 restructurings occurred before the debt peak.
Uruguay 2003 2012 9 99.3 53.7 45.6 5.1 3/ Episodes extending through 2012 (end of the sample) are assumed to end in that year.
Belize 2003 2008 5 104.0 79.2 24.8 5.0 4/ Average reduction per year, defined as total reduction divided by duration.
Median 8 100.4 34.4 57.6 6.4
Mean 9 118.6 42.9 75.7 8.5
LDR episodes associated with debt restructuring LDR episodes without debt restructuring 2/
TH
E F
UN
D’S
LEN
DIN
G F
RA
MEW
OR
K A
ND
TH
E S
OV
ER
EIG
N D
EB
T—
AN
NEX
ES
46
IN
TER
NA
TIO
NA
L MO
NETA
RY F
UN
D

THE FUND’S LENDING FRAMEWORK AND SOVEREIGN DEBT—ANNEXES
INTERNATIONAL MONETARY FUND 47
Appendix-Table A2. Samples of Debt Distress Episodes Identified Through Rating
Downgrades
Duration IMF
Country Peak Trough (years) Peak Trough Diff.
5-year or
latest from
trough Private Paris Club Program
Argentina 1987m11 1992m6 4.6 8.0 5.0 3.0 8.7 Y Y Y
Brazil 2002m5 2003m10 1.4 7.8 6.7 1.1 11.0 Y
Chile 1997m11 1999m6 1.6 16.0 14.8 1.2 15.3
China 1989m10 1993m8 3.8 14.0 12.5 1.5 13.7
Colombia 1999m6 2007m2 7.7 12.5 10.2 2.3 11.5 Y
Cyprus 1997m12 2002m1 4.1 18.0 15.0 3.0 15.7
Dominican Republic 2003m5 2005m4 1.9 8.5 2.5 6.0 6.0 Y Y Y
Estonia 2008m9 2010m5 1.7 15.5 14.5 1.0 16.3
Fiji 2000m6 2011m7 11.1 10.0 6.3 3.7 6.5
Georgia 2008m7 2010m3 1.7 7.5 6.5 1.0 8.0 Y
Greece 1990m6 1996m11 6.4 12.0 11.0 1.0 15.0
Hong Kong SAR 1990m1 1992m11 2.8 16.0 15.0 1.0 17.0
Iceland 2006m11 2012m1 5.2 18.8 11.2 7.6 11.5 Y
Indonesia 2001m4 2002m7 1.3 5.2 4.2 1.0 8.0 Y
Kazakhstan 1998m8 2000m6 1.8 9.0 7.7 1.3 11.7 Y
South Korea 1997m10 1998m1 0.3 17.8 8.5 9.3 15.0 Y
Latvia 2007m4 2010m11 3.6 14.5 10.2 4.3 12.5 Y
Lebanon 1998m5 2008m7 10.2 8.5 4.7 3.8 6.3
Lithuania 2007m12 2013m3 5.3 15.2 12.5 2.7 12.8
Malaysia 1997m11 1999m3 1.3 16.8 11.8 5.0 14.2
Mauritius 2006m5 2012m5 6 13.5 12.0 1.5 13.0
Mexico 1994m8 1997m8 3 12.3 10.0 2.3 12.2 Y
Pakistan 1995m6 1999m6 4 7.5 2.0 5.5 6.5 Y Y Y
Philippines 2001m2 2009m6 8.3 11.0 8.5 2.5 10.8
Romania 1998m4 2000m10 2.5 9 5 4.0 11.0 Y
Romania 2008m9 2011m6 2.8 11.7 10.7 1.0 10.8 Y
Russia 1998m2 1999m4 1.2 9.0 2.0 7.0 10.5 Y Y Y
Seychelles 2008m7 2009m7 1 6.5 3.0 3.5 6.5 Y Y Y
Slovak Republic 1996m7 2001m9 5.2 13.0 11.5 1.5 15.3
Sri Lanka 2008m11 2010m8 1.8 7.5 6.5 1.0 7.0 Y
Thailand 1997m3 1998m4 1.1 15.8 11.3 4.5 12.2 Y
Turkey 2001m1 2003m6 2.4 7.5 5.3 2.2 8.3 Y
Ukraine 1998m8 2001m5 2.8 6.0 3.0 3.0 7.8 Y Y Y
Uruguay 2002m1 2003m4 1.3 11.7 2.3 9.4 7.5 Y Y
Argentina 1999m9 2003m7 3.8 9.2 0.3 8.9 5.0 Y Y
Belize 2001m9 2007m1 5.3 9.5 2.0 7.5 5.0 Y
Brazil 1987m11 1994m10 6.9 10.0 6.0 4.0 6.2 Y Y Y
Brazil 1998m5 1999m11 1.5 7.8 6.2 1.6 8.0 Y
Chile 1994m10 1995m6 0.7 15.5 14.3 1.2 15.3
Dominican Republic 1998m10 2001m5 2.6 8.0 5.3 2.7 5.5
Ecuador 1998m8 2000m7 1.9 7.0 1.8 5.2 4.5 Y Y Y
Ecuador 2006m12 2009m5 0.6 4.5 0.3 4.2 5.0 Y
Grenada 2004m8 2005m10 1.2 8.0 1.5 6.5 5.0 Y Y
Grenada 2007m3 2007m7 0.3 5.0 4.0 1.0 5.0
India 1991m2 1996m9 5.6 12.0 10.0 2.0 9.8 Y
India 1998m5 2000m2 1.8 11.5 9.8 1.7 9.8
Indonesia 1997m9 2000m9 3 12.7 4.2 8.5 7.3 Y Y
Jamaica 1999m10 2001m4 1.5 9.5 8.0 1.5 7.0
Jamaica 2003m4 2010m1 6.8 8.5 1.7 6.8 3.0 Y Y
Moldova 1998m6 2003m1 4.6 9.0 1.8 7.2 4.8 Y Y
Nicaragua 2003m5 2010m4 6.9 6.0 4.5 1.5 5.0 Y Y Y
Pakistan 2008m4 2008m11 0.6 7.5 4.3 3.2 4.5 Y
Paraguay 1998m6 2004m6 6 9.5 2.8 6.7 5.5 Y Y
Turkey 1993m12 1995m8 1.7 11.5 7.0 4.5 7.5 Y
Turkey 1996m11 2000m3 3.3 7.7 6.7 1.0 7.8 Y
Ukraine 2008m5 2010m2 1.8 7.8 5.2 2.6 5.7 Y
Venezuela 1982m7 1991m6 8.9 20.0 7.5 12.5 7.5 Y Y
Venezuela 1994m2 1997m5 3.3 9.5 7.5 2.0 6.0 Y
Venezuela 1998m6 2003m5 4.9 8.0 3.8 4.2 7.5
Belize 2011m7 2013m2 1.6 5.5 1.8 3.7 4.0 Y
Greece 2004m10 2012m2 7.3 16.0 0.3 15.7 3.3 Y Y
Jamaica 2013m1 2013m2 0.1 5.0 1.7 3.3 3.0 Y Y
Sources: Moody’s; S&P; Fitch; Das, Papaioannou, and Trebesch (2011); Cruces & Trebesch (2013); and Fund staff calculations.
Ongoing Distress as of June 2013
Credit Rating Cycle Credit Rating Debt Restructuring
Durable Exit
Nondurable Exit

THE FUND’S LENDING FRAMEWORK AND SOVEREIGN DEBT—ANNEXES
48 INTERNATIONAL MONETARY FUND
Table A2. Samples of Debt Distress Episodes Identified Through Rating Downgrades (concluded)
Numerical
values 1/
Risk
classification
Payment
Capacity
S&P Moody's Fitch
AAA Aaa AAA 20 Prime Extremely strong
AA+ Aa1 AA+ 19
AA Aa2 AA 18
AA- Aa3 AA- 17
A+ A1 A+ 16
A A2 A 15
A- A3 A- 14
BBB+ Baa1 BBB+ 13
BBB Baa2 BBB 12
BBB- Baa3 BBB- 11
BB+ Ba1 BB+ 10
BB Ba2 BB 9
BB- Ba3 BB- 8
B+ B1 B+ 7
B B2 B 6
B- B3 B- 5
CCC+ Caa1 CCC+ 4
CCC Caa2 CCC 3
CCC- Caa3 CCC- 2
CC Ca CC 1 Extremely speculative Currently highly-vulnerable
C C C 0 Currently highly-vulnerable to nonpayment
SD C RD 0
D C DDD 0
D C DD 0
D C D 0
PR P -- Preliminary rating
E Expected -- Expected rating
WR -- Rating withdraw
unsolicited unsolicited -- Rating unrequested
NR NR NR -- Not rated
Sources: Ratings agencies and Fund staff calcultions.
1/ Ad-hoc linear scale from zero (lowest) to 20 (highest), assigned by Fund staff.
Substantial risks Currently vulnerable
In defaultSelected default/Restricted default/Default
lower medium grade Adequate
Non-investment grade
SpeculativeLess vulnerable
Highly speculative More vulnerable
Ratings Scale for Long-Term Securities
Letter Ratings
High grade Very strong
Upper medium grade Strong

THE FUND’S LENDING FRAMEWORK AND SOVEREIGN DEBT—ANNEXES
INTERNATIONAL MONETARY FUND 49
References
Abbas, S. Ali, Nazim Belhocine, Asmaa El-Ganainy, and Mark A. Horton, 2010, “A Historical Public
Debt Database,” IMF Working Paper 10/245 (Washington: International Monetary Fund).
Beck, Thorsten, Clarke George, Alberto Groff, Philip Keefer, and Patrick Walsh, 2000, “New Tools and
New Tests in Comparative Political Economy,” World Bank Policy Research Paper No. 2283
(Washington).
Cline, William, 1995, “International Debt Reexamined,” Institution for International Economics,
(Washington).
Cruces, Juan J., and Christophe Trebesch, 2013, “Sovereign Defaults: The Price of Haircuts,” American
Economic Journal: Macroeconomics, Vol. 5(3), pp. 85–117.
Das, Udaipur S., Michael G. Papaioannou, and Christopher Trebesch, 2012, “Sovereign Debt
Restructurings 1950–2010: Literature Survey, Data, and Stylized Facts,” IMF Working Paper
12/203 (Washington: International Monetary Fund).
Erce, Aitor, 2013, “Sovereign Debt Restructurings and the IMF: Implications for Future Official
Interventions,” Bank of Spain Working Paper No. 143.
Gelos, Gaston R., Ratna Sahay, and Guido Sandleris, 2011, “Sovereign Borrowing by Developing
Countries: What Determines Market Access?” Journal of International Economics, Vol. 83 (2),
pp. 243–54.
Independent Evaluation Office of the International Monetary Fund, 2014, “IMF Forecasts: Process,
Quality, and Country Perspectives.” (Washington: International Monetary Fund).
International Monetary Fund, 2001a, “Turkey: Sixth and Seventh Review Under the Stand-By
Arrangement,” Country Report No. 01/89, (Washington).
———, 2001b, “Turkey: Eighth Review Under the Stand-By Arrangement,” Country Report No.
01/137, (Washington).
———, 2003, “Uruguay: 2003 Article IV Consultation and Third Review Under the Stand-By
Arrangement,” Country Report No. 03/247, (Washington).

THE FUND’S LENDING FRAMEWORK AND SOVEREIGN DEBT—ANNEXES
50 INTERNATIONAL MONETARY FUND
———, 2006, “Grenada: Request for a Three-Year Arrangement Under the Poverty Reduction and
Growth Facility,” Country Report No. 06/277, (Washington).
———, 2010, “Jamaica: 2009 Article IV Consultation and Request for a Stand-By Arrangement,”
Country Report No. 10/267, (Washington).
———, 2013, “Sovereign Debt Restructuring—Recent Developments and Implications for the Fund’s
Legal and Policy Framework,” (Washington).
Mauro, Paulo, Rafael Romeo, Ariel Binder, and Asad Zaman, 2013, “A Modern History of Fiscal
Prudence and Profligacy,” IMF Working Paper 13/5 (Washington: International Monetary
Fund).
Moody’s, 2013a, “IMF Program Participation Underscores Medium-Term Sovereign Credit
Challenges,” in Sovereign Default Series, October 2013.
———, 2013b, “Sovereign Debt Restructurings Provide Liquidity Relief But Often Do Not Reduce
Debt Levels,” in Sovereign Default Series, October 2013.
Reinhart, Carmen, and Kenneth Rogoff, 2009, “This Time is Different,” (Princeton: Princeton University
Press).
Richmond, Christine, and Daniel A. Dias, 2009, “Duration of Capital Market Exclusion: Stylized Facts
and Determining Factors,” Anderson Graduate School of Management (UCLA) Working Paper
(unpublished).
Sturzenegger, Frederico, and Jeromin Zettelmeyer, 2006, Debt Defaults and Lessons from a Decade
of Crises, The MIT Press.

THE FUND’S LENDING FRAMEWORK AND SOVEREIGN DEBT—ANNEXES
INTERNATIONAL MONETARY FUND 51
ANNEX III. COMPARATIVE COSTS AND BENEFITS OF
REPROFILING, BAILOUT, AND RESTRUCTURING IN
GRAY ZONE CASES—MARKET DYNAMICS AND
INTERNATIONAL SPILLOVERS51
This annex examines the implications of past reprofiling, restructuring, and bailout episodes for market
dynamics and cross-border spillovers. In particular, it provides (i) an analysis of the potential impact of
the possible inclusion of reprofiling in Fund lending policy on sovereign spreads and maturity structures
of sovereign debt, both in normal and distressed periods, (ii) empirical evidence on the evolution of
spreads and maturity structures when markets start anticipating a restructuring or reprofiling, (iii) a
description of the factors that determine the speed of market re-access under different restructuring
episodes; and (iv) empirical analysis of international spillovers in crisis episodes that involved
restructuring and reprofiling of sovereign debt.
A. Implications of a Reformed Fund Policy Framework on Spreads and
Maturity Structures of Government Debt
44. This section discusses the likely implications of a reformed Fund lending policy on
market dynamics in the steady state and in periods of heightened stress, assuming that the
adoption of the new framework would lead markets to perceive a lower probability of being bailed
out and a higher probability of being reprofiled.52
While markets may have that perception, some
investors may also view it as an alternative to a deeper debt restructuring for countries in the gray
zone in the current framework. In such cases the reprofiling would be associated with lower
borrowing costs. The discussion also assumes that the reprofiling option would only be applied to
government bonds coming due within the duration of the Fund program.53
As the reformed policy
would represent a new regime, the analysis examines potential theoretical effects to make some
broad inferences.
45. In a steady state, the new Fund lending policy might lead to the following:
51
This annex was prepared by Kay Chung, Anastasia Guscina, Michael Papaioannou, Gabriel Presciuttini, Miguel
Segoviano (all MCM) and Heiko Hesse (SPR) with input from Tamon Asonuma, Christopher Dielmann, Charlotte
Lundgren, Nelson Sobrinho and Geneviève Verdier (all SPR).
52The steady state refers to tranquil periods when a country is not in debt distress.
53This assumption is made for convenience; as discussed in the main paper, this does not need to be the case for the
reprofiling proposal.

THE FUND’S LENDING FRAMEWORK AND SOVEREIGN DEBT—ANNEXES
52 INTERNATIONAL MONETARY FUND
Investors would factor in a greater probability of a credit event in the pricing of risks.54
Spreads may increase, especially in countries that are perceived as more at risk of debt distress.
As moral hazard associated with bailouts is reduced, investors are likely to differentiate better
between sovereigns based on macroeconomic fundamentals and fiscal discipline. Investors will
demand higher interest rates from governments with higher debt levels, fiscal deficits, and
external financing requirements. At the same time, with better pricing of risks, countries with
better economic fundamentals might benefit from increasing demand for their government
bonds, and may actually see their spreads fall. As discussed in Box AIII1, there is evidence
suggesting that this may be a mitigating factor for highly-rated sovereigns
For riskier countries, to the extent that credit risk premia rise, they would tend to do so
across the yield curve and more so in the shorter end.55
Bonds with shorter initial maturity are
refinanced more frequently than longer-term bonds. As a result, at any given point in time,
shorter-term bonds are more likely to fall due in a period of stress when a reprofiling option may
be exercised. Since shorter-term bonds are more likely to be reprofiled than longer-term bonds,
investors will be more hesitant to buy or roll over bonds of shorter duration in the steady state.
Hence, one would expect that the demand for shorter-term bonds will decrease, and the
maturity structure of sovereign debt portfolio would shift increasingly towards longer tenors.56
Assuming a positively-sloping yield curve, a shift towards longer-tenors will imply a higher
average cost of the debt portfolio but reduced rollover risk. Since longer-term bonds are
typically more expensive than shorter-term bonds, this would imply that the average cost of the
debt portfolio would rise, while rollover risk would fall. The impact of this development on
individual countries will depend on their cost-risk preferences. Long term investors who are less
likely to be reprofiled could benefit from the positive effect of the reprofiling on debt
sustainability. In the event that a reprofiling does not work and a debt reduction is needed they
would face a lower haircut due to a bigger creditor base. Compared to the status quo this could
lower yields at the long end.
54
A credit event refers to debt restructuring with face value reduction or reprofiling.
55If the likelihood of bailouts is perceived to decline under the proposed framework, long-term creditors could
anticipate a lower risk of being subordinated to higher levels of (senior) official debt that typically arises from a
bailout. This perception could lead to a further flattening of the yield curve or even a decline in long-term yields when
a bailout becomes less likely. In principle, a removal of the “bailout premium” is expected to shift the yield curve
upwards, while an increased probability of reprofiling shorter-term maturities could change the slope of the yield
curve.
56Short-term treasury bills are typically excluded from debt reprofilings.

THE FUND’S LENDING FRAMEWORK AND SOVEREIGN DEBT—ANNEXES
INTERNATIONAL MONETARY FUND 53
Governments with less developed domestic debt markets might have to rely increasingly
on international bond issuance for their financing needs. Placement of longer-term bonds in
such countries would be limited by the absorption capacity of the domestic investor base. Riskier
countries that rely on shorter-term instruments for the majority of their government financing
will be most affected by the policy change. Such governments may shift towards issuing a higher
share of their bonds on the international market. Since international bonds are usually
denominated in actively traded currencies, this movement would heighten currency risks facing
the sovereign.
If sovereign borrowing costs rise, the cost of borrowing in the corporate sector is likely to
increase in tandem. Since sovereign bonds often serve as benchmarks for corporate debt, an
increase in yields on sovereign debt would also lead to higher spreads and higher costs of
borrowing for the corporate sector, which usually borrows at shorter tenors (in particular, the
banking sector). Further, concerns that sovereign restructuring could lead to a tightening of
credit conditions in the corporate sector, force deleveraging, or impose balance sheet losses,
could also contribute to an increase in spreads. This effect would be mostly felt in countries,
where the transmission of higher borrowing cost from the sovereign to private firms and
households is stronger.

THE FUND’S LENDING FRAMEWORK AND SOVEREIGN DEBT—ANNEXES
54 INTERNATIONAL MONETARY FUND
Box AIII1. The Long-Term Effects of Reprofiling on EM Borrowing Costs
This box looks at the possible steady state impact of reprofiling on borrowing costs for emerging markets. The
net effect on yields is likely to depend on whether the new policy is viewed as a tightening of the existing
framework—relative to a bail-out—or a more flexible approach in designing programs for countries in
distress. The evidence from past episodes of shifts in policy or institutional regime, or episodes of increased risk
aversion suggests that for EM sovereigns with strong fundamentals, the effect of reprofiling would be small or
perhaps even beneficial.
Outside of periods of heightened debt distress, the impact of the modification of Fund policy is
unclear ex-ante as it would be the result of competing effects. One possibility is that markets perceive
the change in policy as an alternative to a bailout, which would tend to increase yields. On the other hand,
investors may view the proposal as an alternative to a deeper debt restructuring for countries in the gray
zone in the current framework. This perception would presumably be associated with lower borrowing
costs. To analyze this question, three episodes of shifts in policy or institutional regime or changes in risk
aversion for emerging markets are examined. Although past experience is not conclusive, it may shed light
on the potential effects of the proposed policy.
The evidence suggests that the effect of the proposed policy change would be negligible or even
beneficial for highly-rated sovereigns. These results are based on the analysis of three specific episodes:
EM yields following the introduction of the 2002 Exceptional Access framework. As noted in
Annex I, this change in Fund policy constituted a tightening of the Fund’s lending framework.
Because the Fund could no longer lend unless debt was sustainable with high probability in capital
account crises, it was perceived as making the incidence of debt restructuring more likely on the
margin. Figure A shows the percentage impact on EM spreads (i.e., if Mexico’s spreads were 100
basis points before the change, they fell to 90 basis points after the change). For strongly rated
countries, the change in policy resulted in falling borrowing costs. Middle-rated countries saw little
change in their yields while yields increased for poorly rated sovereigns.

THE FUND’S LENDING FRAMEWORK AND SOVEREIGN DEBT—ANNEXES
INTERNATIONAL MONETARY FUND 55
Box AIII1. The Long-Term Effects of Reprofiling on EM Borrowing Cost (continued)
Figure A
Marginal effect of 2002 EAP on EMBI spreads 1/
(in percentage change)
Sources: Fitch Ratings; Moody's; S & P; Bloomberg; IFS; WEO; and Fund staff calculations.
1/
Panel of 15 Ems for which EMBI spreads are available since at least Jan 1998: ARG, BRA, BUL, COL, ECU,
MAL, MEX, PAN, PER, PHL, POL, RUS, SAF, TUR, VEN. Date of policy changes: 3/2003. Ratings for countries
displayed on the chart refer to Mar/2014 (average across the three rating agencies). DOM, IND, CHL, and
CHN are not included in the panel.
Borrowing costs and collective action clauses (CACs). In theory, the impact of CACs on sovereign
yields is ambiguous. CACs can make debt restructuring more efficient, lowering yields on sovereign
debt. On the other hand, by reducing the costs of restructuring, they may increase the likelihood of
sovereign default. In 2003, a number of EMs issued sovereign bonds with CACs under New York Law.
At the time CACs were seen as making debt restructurings easier to achieve. Figure B show a non-
discernible difference in maturity adjusted yields between bonds with and without CACs for Mexico
and Turkey. This is consistent with the existing literature. Bardozzetti and Dottori, (2013) for example
find that the amount by which CACs lower borrowing costs depends on the sovereign’s credit rating.
EM yields during the global financial crisis. To analyze how EM borrowing costs behaved during a
generalized increase in risk aversion towards EM as an asset class, staff examined the evolution of
spreads following the Lehman Brothers failure (a large shock to risk aversion). In Figure C, EM
countries are categorized according to their rating in the IMF’s 2008 Vulnerability Exercise using the
overall and fiscal vulnerability indices. The figure suggests that borrowing costs spiked briefly for all
countries but soon decoupled according to macroeconomic fundamentals.

THE FUND’S LENDING FRAMEWORK AND SOVEREIGN DEBT—ANNEXES
56 INTERNATIONAL MONETARY FUND
Box AIII1. The Long-Term Effects of Reprofiling on EM Borrowing Costs (concluded)
Figure B
Sources: Bloomberg; and Fund staff calculations.
Figure C
Sources: JPMorgan EMBI spreads; and Fund staff calculations.
Note: Countries grouped according to VEE as of 09/2008. Indexed to value as of 7/1/2008.
46. In periods of heightened stress, the new Fund lending policy might lead to the following:
The introduction of a reprofiling option may help calm market concerns at times of stress,
though it could advance the onset of distress. In periods of heightened stress, spreads may
rise above levels consistent with debt sustainability and may trigger the loss of market access.
Should investors lose confidence in a government’s ability to honor its commitments, they may
stop purchasing the newly issued government bonds or sell their existing holdings of
government debt. If a reprofiling option is available, it may help calm down market jitters by
signaling that at least temporarily the government will not permit short-term creditors to exit at
-2
0
2
4
6
8
10
Perc
en
t
Mexico. Bond Yields, 2002-07
With CACs (maturity adjusted)
Without CACs
Yield difference
Introduction of CACs in Bonds under New York law
-5
0
5
10
15
20
Pe
rce
nt
Turkey. Bond Yields, 2002-07
With CACs (maturity adjusted)
Without CACs
Yield Difference
Introduction of CACs in Bonds under New York law
70
120
170
220
270
320
370
420
Basi
s P
oin
ts
Emerging Market Spreads
Grouped by Overall Vulnerability
Low Vulnerability
Medium Vulnerability
High Vulnerability
70
120
170
220
270
320
370
420
Basi
s P
oin
ts
Emerging Market Spreads
Grouped by Fiscal Vulnerability
Low Vulnerability
Medium Vulnerability
High Vulnerability

THE FUND’S LENDING FRAMEWORK AND SOVEREIGN DEBT—ANNEXES
INTERNATIONAL MONETARY FUND 57
the expense of longer-term creditors. Nonetheless, if reprofiling is seen to be triggered earlier, it
could advance the advent of stress.
A reprofiling option might reduce spreads volatility in times of stress. Under a situation
when reprofilings become more likely, moral hazard associated with the bailouts is reduced.
While in the steady state the change in policy would be associated with higher spreads (as risk is
more fully reflected in the price), in times of stress, one would expect the spreads to widen less
as the average borrowing costs would be higher in the steady state. In a way, the existence of the
middle option (reprofiling) will smooth the spreads volatility compared to outright bailouts or to
debt restructurings involving higher net present value (NPV) haircuts.
By preventing payments to external creditors, reprofiling would leave more resources in
the domestic economy. If reprofiling involves external debt, by preventing inefficient payments
in the case of bailouts, the sovereign may be able to undertake social expenditures that would
raise growth. In times of crisis, a reprofiling option might give the sovereign more room to
pursue countercyclical fiscal policy and undertake needed reforms (see Annex V). However, if a
large share of government bonds is held domestically, stopping payments may hurt banks’
profitability which could translate to a slowdown in the real economy.57
Contagion might spread to more countries, but the magnitude of the shock will likely be
reduced. Under the assumption that more sovereigns will be considered “at risk” for reprofiling
at any given time, investors might demand higher spreads on sovereign debt from countries with
similar fundamentals to the crisis country. However, given that a reprofiling option might give a
crisis government more room and more time to resolve its issues, the effects of contagion would
not be as pronounced. Spreads are likely to rise in more countries but at a lesser magnitude than
under the status quo (old policy).
Reprofiling would be growth-enhancing and volatility-reducing only if it is successful in
avoiding a restructuring in the future. Reprofilings would fail to resolve a debt crisis if they are
used in a situation where debt is clearly unsustainable. Such reprofilings would eventually be
followed by deeper restructurings. The overall impact of the reprofiling option on borrowing
costs and growth will depend on whether reprofiling was successful in preventing a debt
restructuring.
57
Under a reprofiling, thanks to forbearance, the regulator is likely to allow the banks to accrue the postponed interest
revenue and to carry the government bonds at par.

THE FUND’S LENDING FRAMEWORK AND SOVEREIGN DEBT—ANNEXES
58 INTERNATIONAL MONETARY FUND
B. Do Reprofilings and Restructurings Have Significantly Different Impacts
on Spreads, Credit Ratings, and Market Access?
47. Reprofilings, on average, appeared to be less costly than face value cut restructurings.
Based on a sample of 12 restructuring country episodes, equally divided between cases of reprofiling
and debt restructuring with face value cut, we find some further empirical support for reprofilings
being less costly, on average, than restructurings.58
The scope of this analysis is to assess the relative
costs of restructurings and reprofilings, without judging whether individual debt operations were
appropriate for the individual country.
48. Reprofilings were generally less costly than restructurings with face value cuts in terms
of their effect on spreads, credit ratings, and market access. Restructurings with nominal
reductions have been associated with weaker fundamentals and more disruptive market conditions.
Specifically, in our sample (i) sovereign spreads were generally higher in restructurings compared to
reprofilings, both at the time of the announcement and the time of the debt exchange; (ii) credit
downgrades were more severe in restructurings with nominal reductions than in reprofilings, with
sovereign credit ratings recovering faster in reprofilings than in restructurings within 12 months after
the exchange (it took twice as long for restructurings to recover to precrisis credit ratings); (iii) the
time to re-access the markets was longer for restructuring countries than for reprofiling ones, both in
terms of time to a new global bond issuance or normalization of spreads to precrisis levels; and
(iv) negotiations in restructurings took longer than in reprofilings, while participation rates were
higher and litigations were fewer in reprofilings than in restructurings with nominal debt reductions.
49. The results should be interpreted with caution. While our preliminary results indicate that
past reprofilings have, in general, been less costly than restructurings and are consistent with the
existing literature on the topic, any inferences regarding the applicability of these results on the
proposed new regime should be cautious given (i) the lack of sufficient reprofiling cases to conduct a
rigorous empirical study, leading to low statistical power of the results; (ii) the difficulty of
disentangling the effects of the debt exchange itself from the policies implemented following the
debt operation; and (iii) the uncertainty stemming from the introduction of the new framework on
58
The reprofiling cases included in the sample are Pakistan (1999), Moldova (2002), Uruguay (2003), Grenada (2004),
the Dominican Republic (2005), and Belize (2006), while the restructurings with nominal reductions are Ecuador
(1999), Russia (1999), Dominica (2004), Argentina (2005), Seychelles (2008), St. Kitts and Nevis (2011), Greece (2012),
and Belize (2012). The selection of the country sample for restructurings and reprofilings does not explicitly
differentiate between “successful” vs. “failed” operations. For the purposes of this annex, reprofiling is defined as a
moderate, face- value preserving maturity extension and NPV reduction.

THE FUND’S LENDING FRAMEWORK AND SOVEREIGN DEBT—ANNEXES
INTERNATIONAL MONETARY FUND 59
market dynamics and domestic and cross-border financial stability. Moreover, when restructuring
was necessary to resolve sovereign distress, reprofiling was not a viable alternative.
Effect on spreads
50. Restructurings have been associated with higher spreads at the time of the
announcement of the debt operation than reprofilings. At the time of the announcement of the
credit event, sovereign spreads were generally higher in restructuring cases (median of 2,119 bps)
than in reprofiling cases (median of 1,053 bps), though with a great deal of variation within each
subsample.59
Moreover, spreads increased by 727 bps over the median spread of the previous 12
months in restructurings compared to 216 bps in reprofilings.
Figure AIII1. Spreads: Restructuring vs. Reprofiling Cases
(in bps, t= announcement of restructuring)
Sources: Bloomberg; and Fund staff calculations.
Note: The spread calculations for the country samples are based on the median.
59
Pakistan, with the spread of almost 20,000 bps at the time of the reprofiling, was a clear outlier and is not reported
in Figure AIII2.
0
500
1000
1500
2000
2500
3000
t₀-2
4
t₀-2
2
t₀-2
0
t₀-1
8
t₀-1
6
t₀-1
4
t₀-1
2
t₀-1
0
t₀-8
t₀-6
t₀-4
t₀-2 t₀
t₀+
2
t₀+
4
t₀+
6
t₀+
8
t₀+
10
t₀+
12
t₀+
14
t₀+
16
t₀+
18
t₀+
20
t₀+
22
t₀+
24
Reprofiling cases
Face Value reduction cases
in bps

THE FUND’S LENDING FRAMEWORK AND SOVEREIGN DEBT—ANNEXES
60 INTERNATIONAL MONETARY FUND
Figure AIII2. Spreads at the Time of the Announcement of Restructuring/Reprofiling
(In basis points)
51. Similarly, spreads have been higher in restructuring cases at the time of the debt
exchange, but less so than at the time of the announcement. Sovereign spreads have also been
higher in debt restructuring cases (with the exception of Pakistan) than in reprofiling cases at the
time of the debt exchange. However, the difference between the two groups is typically smaller by
the time the restructuring operation takes place, and statistically not significant (Figure AIII3). This
could reflect the fact that uncertainty was resolved by the time the country concluded the debt
exchange.
0
500
1000
1500
2000
2500
3000
3500
4000
4500
5000
Uru
guay
'03
Do
m. R
ep
. '05
Beli
ze '0
7
at announcement previous 12-month average
Reprofiling Cases
median = 1053st. dev. = 244
0
500
1000
1500
2000
2500
3000
3500
4000
4500
5000
Russ
ia '9
8
Arg
enti
na '0
5
Belize
'13
Ecu
ad
or '0
0
Gre
ece
'12
Seyc
helles
'10
at announcement previous 12-month avg.
Restructuring Cases
median = 2119st. dev. = 1442
Sources: Bloomberg; and Fund staff calculations.Note: EMBI spreads or available external bond yields are used.1/ Announcement date of restructuring (Russia, Argentina and Belize (2013), Greece), reprofiling
(Uruguay, Dominican Rep. and Belize (2007)) or default (Ecuador and Seychelles).

THE FUND’S LENDING FRAMEWORK AND SOVEREIGN DEBT—ANNEXES
INTERNATIONAL MONETARY FUND 61
Figure AIII3. Spreads at the Time of the Debt Exchange
(In basis points)
Effect on Credit Ratings
52. For credit rating agencies that assign a default rating, both reprofilings and
restructurings resulted in a selective default rating. However, selective default ratings are
technical, not judgmental: they apply from the moment a country announces a change in the
contractual terms of its debt or misses a payment to the moment that it returns to servicing its debt.
More importantly, reprofilings were associated with smaller drops in credit ratings than restructuring
cases, measured by the credit rating before and after the period of selective default. Credit
downgrades were more severe in restructuring cases compared to reprofiling cases, with the median
downgrade being almost twice as large (in number of notches) (Figure AIII4).
0
500
1000
1500
2000
2500U
rug
uay
'03
Do
m. R
ep
. '05
Beli
ze '0
7
Reprofiling Cases
median = 491st. dev. = 313
0
500
1000
1500
2000
2500
Ru
ssia
'98
Gre
ece
'12
Ecu
ad
or '0
0
Belize
'13
Seyc
hell
es
'10
Arg
enti
na '0
5
Restructuring Cases
median = 1077st. dev. = 701
Sources: Bloomberg; and Fund staff calculations.Note: EMBI spreads or available external bond yields are used.

THE FUND’S LENDING FRAMEWORK AND SOVEREIGN DEBT—ANNEXES
62 INTERNATIONAL MONETARY FUND
Figure AIII4. Credit Downgrade in the Year of Restructuring/Reprofiling
(In notches)
53. Sovereign credit ratings recovered faster in reprofilings compared to restructurings
within 12 months after the exchange. Figure AIII5 demonstrates that, within 12 months of the debt
operation, credit ratings recovered by an average of 3 notches in reprofiling cases, while they
increased by an average of 2 notches in the restructuring cases.
Figure AIII5. Credit Rating Recovery a Year After Restructuring/Reprofiling
(In notches)
0
1
2
3
4
5
6
7
8
9
Gre
nad
a '0
5
Uru
guay
'03
Pakis
tan '9
9
Mo
ldo
va '0
2
Do
m. R
ep
. '05
Belize
'07
Reprofiling Cases
median = 2.9st. dev. = 2.6
0
1
2
3
4
5
6
7
8
9
Arg
enti
na '0
5
Gre
ece
'12
Russ
ia '9
8
Seyc
helles
'10
Ecu
ad
or '0
0
Belize
'13
Restructuring Cases
median = 5.3st. dev. = 3.4
Sources: S&P; Moody's; Fitch; and Fund staff calculations. Note: average of the 3 agencies.
0
1
2
3
4
5
Gre
nad
a '0
5
Uru
guay
'03
Pakis
tan '9
9
Mo
ldo
va '0
2
Do
m. R
ep
. '05
Belize
'07
Reprofiling Cases
median = 3st. dev. = 0.3
0
1
2
3
4
5
Arg
enti
na '0
5
Gre
ece
'12
Russ
ia '9
8
Seyc
helles
'10
Ecu
ad
or '0
0
Belize
'13
Restructuring Cases
median = 1.7st. dev. = 1.4
Sources: S&P; Moody's; Fitch; and Fund staff calculations. Note: average of the 3 agencies.

THE FUND’S LENDING FRAMEWORK AND SOVEREIGN DEBT—ANNEXES
INTERNATIONAL MONETARY FUND 63
54. Further, it took longer for restructuring cases to recover to the pre-crisis ratings (Figure
AIII6). It took on average four times as long for restructuring cases to recover to precrisis credit
ratings in comparison with reprofilings. The experience is diverse, however: some have risen to
investment grade (Russia and Uruguay), some languished in the B category (Grenada, Ecuador,
Belize, Jamaica, Pakistan, Greece, and Cyprus), while others were withdrawn at the government’s
request (Seychelles).
Figure AIII6. Credit Rating Recovery to Precrisis Levels
(In months)
Effect on Market Access
55. Our analysis suggests that it takes longer for governments that undergo debt
restructurings to re-access the market than those that undergo reprofilings, irrespective of
whether time to reaccess is defined as new global bond issuance or normalization of spreads to
precrisis levels. Obviously, the time to complete the debt exchange is a key factor influencing the
length of time to re-access markets.
56. It took longer for sovereigns that restructured to return to international markets
following the credit event as compared to reprofiling cases. The median time for governments
0
20
40
60
80
100
120
140
160
180
Uru
guay
'03
Pakis
tan '9
9
Mo
ldo
va '0
2
Beli
ze '0
7
Do
m. R
ep
. '05
Reprofiling Cases
median = 10st. dev. = 36
0
20
40
60
80
100
120
140
160
180
Ecu
ad
or '0
0
Russ
ia '9
8
Seyc
helles
'10
Belize
'13
Restructuring Cases
median = 45st. dev. = 65
Sources: S&P; Moody's; Fitch; and Fund staff calculations. Note: average of the 3 agencies.

THE FUND’S LENDING FRAMEWORK AND SOVEREIGN DEBT—ANNEXES
64 INTERNATIONAL MONETARY FUND
that underwent a restructuring to re-access international capital markets and issue global bonds was
57 months, compared to 35 months for reprofiling cases (Figure AIII7).60,
61
Figure AIII7. Time to Market Access—Defined as International Security Issuance
(In months)
57. Likewise, when time to re-access is defined as return of spreads to precrisis levels, the
median time for restructuring cases was 35 months as compared to 8 months for reprofiling
cases (Figure AIII8). This measure of market re-access implies that the government that underwent
reprofiling/restructuring could re-access the market, as rates were not prohibitively high, even if the
government did not issue a global bond.
60
It should be noted that Argentina has not re-accessed international markets since the date of the exchange in April
2005. Moldova has not yet regained market access following its 2002 reprofiling, partly due to conditionalities under
the Fund program not to undertake nonconcessional borrowing.
61Belize (2013) and Cyprus (2013) were not included in the sample (see note 1 of Figure 9).
0
20
40
60
80
100
120
140
160
Mo
ldo
va '0
2 *
Belize
'07 *
Pakis
tan '9
9
Gre
nad
a '0
5
Do
m. R
ep
. '05
Uru
guay
'03
Reprofiling Cases
median = 35st. dev. = 52
0
20
40
60
80
100
120
140
160
Russ
ia '9
8
Arg
enti
na '0
5
Ecu
ad
or '0
0
Seyc
helles
'10 *
St. K
itts
'12 *
Gre
ece
'12
Restructuring Cases
median = 57st. dev. = 42
Sources: Bloomerg; Dealogic; and Fund staff calculations.Note: time to market access is defined bycounting number of months from completion of the debt exchange and until another international security was issued.* As of April 2014, Moldova, Argentina, Belize, Seychelles, and St. Kitts have not yet issued in international security.

THE FUND’S LENDING FRAMEWORK AND SOVEREIGN DEBT—ANNEXES
INTERNATIONAL MONETARY FUND 65
Figure AIII8. Time to Market Access—Defined as Spreads Normalization
(In months; from the time of the debt operation)*
C. What Factors Affect the Speed at Which Market Conditions Normalize
After Different Types of Restructuring?
58. Several factors have been analyzed in the relevant literature as contributing to the
speed of market re-access, including restructuring-related characteristics, domestic policies,
and external risk environment. We have considered two measures of market re-access throughout
this analysis, namely the time it took for a country to tap international markets following the debt
operation and the time it took for spreads to normalize to pre-crisis levels. The second measure may
be more indicative, especially in cases where the fiscal and external positions of a country do not
require the issuance of an international bond (e.g., Russia).
59. Market conditions tended to normalize faster for governments that imposed a smaller
haircut. Related to the restructuring characteristics, empirical studies (Cruces and Trebesch, 2013)
have shown that the size of the NPV loss suffered by investors during the sovereign bond exchange
was correlated with the length of time until market re-access. In particular, there is evidence that
governments that underwent debt reprofilings involving relatively small NPV losses have re-accessed
markets relatively quickly (e.g., Uruguay and the Dominican Republic). In contrast, countries with
0
10
20
30
40
50
60
70
Pakis
tan '9
9
Do
m. R
ep
. '05
Uru
guay
'03
Belize
'07
Reprofiling Cases
median = 8st. dev. = 9
0
10
20
30
40
50
60
70
Ecu
ad
or '0
0
Seyc
helles
'10
Russ
ia '9
8
Arg
enti
na '0
5
Restructuring Cases
median = 35st. dev. = 24
*Should be interpreted with caution for countries that took a long time to finalize the exchange (Argentina).
Sources: Bloomerg; Dealogic; and Fund staff calculations.Note: normalization is defined as the time it took for spreads to drop to the 12-month average prior to the distress event (announcement of default, restructuring, Fund program, suspension of debt payments).

THE FUND’S LENDING FRAMEWORK AND SOVEREIGN DEBT—ANNEXES
66 INTERNATIONAL MONETARY FUND
debt restructurings that involved sizeable nominal reductions and NPV losses have experienced
much longer periods before re-access of markets (e.g., Argentina and Russia) (Figure AIII9).
Figure AIII9. Market Access Loss and NPV Haircut 1/2/
Sources: Moody's Sovereign Default Series, October 7, 2013; and Bloomberg.
1/ Red dots depict restructuring cases and green dots depict reprofiling cases. NPV calculations come from Cruces and Trebesch
(2013) with the exception of St. Kitts where we used Sturzenegger and Zettelmeyer (2006, 2008). Cruces and Trebesch (2013)
compute the NPV reduction based on the NPV of aggregate cash flows of old instruments and of new instruments. Sturzenegger
and Zettelmeyer (2006, 2008) compute the weighted average of NPV reduction for each instrument based on outstanding
instruments (computed using the exit yield of the new instrument).
2/ The analysis excludes cases of Belize (2013) and Cyprus (2013) as it is not clear when these countries will reaccess the markets. For
countries that have not yet regained market access (as defined below), the duration of market access loss is based on April 2014 cut-
off date.
3/ Time to reaccess based on global bond issuance after the last debt exchange.
4/ Time to reaccess based on spreads normalization following the last debt exchange. Normalization is defined as the time it took
for spreads to drop to the 12-month average prior to the distress event (announcement of default, restructuring, Fund program, or
suspension of debt payments).
Note: Reprofilings are proxied by cases involving moderate (face-value preserving) maturity extensions and NPV reductions. In the
case of Argentina, the default occurred in January 2002, while the debt exchange took place in June 2005. In this regard, time to
market reaccess based on spreads normalization may not represent the actual impact of the credit event.
60. Market conditions took longer to normalize in countries with high levels of
government indebtedness at the time of the restructuring.62
Governments with lower debt-to-
GDP ratios at the time of the restructuring achieved normalized spreads faster than governments
with higher debt-to-GDP ratios (Figure AIII10). Since time to re-access is counted from the time of
62
It should be noted that defaulting governments had a large external financing requirement and the country’s
balance of payment and IIP positions were weak as well. The governments that emerged from default successfully
made not only a fiscal adjustment, but also an external adjustment.
BLZ '07
DOM '05 GRD '05
MLD '02
PAK '99
URU '03
ARG '05
ECU '00
RUS '98
SEY '10
SKZ '12
GRE '12
-10
10
30
50
70
90
110
130
150
0% 20% 40% 60% 80% 100%
Tim
e to
Mark
et R
eac
cess
in M
onth
s
NPV Haircut
Market Access Loss and NPV Haircut
(time to reaccess defined based on global bond issuance) 3/
BLZ '07
DOM '05
PAK '99
URU '03ARG '05
ECU '00
RUS '98
SEY '10
0
10
20
30
40
50
60
70
0% 20% 40% 60% 80% 100%
Tim
e to
Mark
et R
eac
cess
in M
onth
sNPV Haircut
Market Access Loss and NPV Reduction
(time to reaccess based on spreads normalization) 4/

THE FUND’S LENDING FRAMEWORK AND SOVEREIGN DEBT—ANNEXES
INTERNATIONAL MONETARY FUND 67
the credit event, the results must be taken with caution for a country like Argentina that took a long
time from the time of the announcement to complete its debt restructuring.
Figure AIII10. Market Access Loss and Debt to GDP Ratio 1/2/
Sources: Moody's Sovereign Default Series, October 7, 2013; Bloomberg; and WEO.
1/ Red dots depict restructuring cases and green dots depict reprofiling cases.
2/ The analysis excludes cases of Belize (2013) and Cyprus (2013) as it is not clear when these countries will reaccess the markets. For
countries that have not yet regained market access (as defined below) the duration of market access loss is based on April 2014 cut-
off date.
3/ Time to reaccess based on global bond issuance after the last debt exchange.
4/ Time to reaccess based on spreads normalization following the last debt exchange. Normalization is defined as the time it took
for spreads to drop to the 12-month average prior to the distress event (announcement of default, restructuring, Fund program, or
suspension of debt payments).
Note: Reprofilings are proxied by cases involving moderate (face-value preserving) maturity extensions and NPV reductions. In the
case of Argentina, the default occured in January 2002, while the debt exchange took place in June 2005. In this regard, time to
market reaccess based on spreads normalization may not represent the actual impact of the credit event.
61. Credibility of fiscal adjustment was associated with faster normalization of market
conditions and quicker market re-access. For both reprofiling and restructuring cases, another
factor that has been stressed in the literature and market reports is the ability of the individual
country to implement appropriate government policies and actions to restore its credibility in
financial markets after the credit event.63
These policies and actions include credible fiscal adjustment
measures. When investors perceive that there is a break with past policies that led to the credit
event, market access will be restored. Often the credibility of the measures is embodied in the
conditionality of Fund-supported programs that accompany debt restructurings and assure medium-
to long-term debt sustainability. Strong creditor relations and a clear communication of policies and
63
See, for example, Gelos, R. Gaston, Ratna Sahay, and Guido Sandleris (2011) and Moody’s (2013).
BLZ '07
DOM '05
GRD '05
MLD '02
PAK '99
URU '03
ARG '05
ECU '00
RUS '98
SEY '10
SKZ '12GRE '12
-10
10
30
50
70
90
110
130
150
0 25 50 75 100 125 150 175 200
Tim
e to
Mark
et R
eac
cess
in M
onth
s
Debt to GDP Ratio
Market Access Loss and Debt to GDP Ratio
(time to reaccess defined based on global bond issuance) 3/
BLZ '07DOM '05
PAK '99
URU '03ARG '05
ECU '00
RUS '98
SEY '10
0
10
20
30
40
50
60
70
0 25 50 75 100 125 150 175 200Tim
e to
Mark
et R
eac
cess
in M
onth
s
Debt to GDP Ratio
Market Access Loss and Debt to GDP Ratio
(time to reaccess based on spreads normalization) 4/

THE FUND’S LENDING FRAMEWORK AND SOVEREIGN DEBT—ANNEXES
68 INTERNATIONAL MONETARY FUND
objectives can also play an important role in reestablishing market access. When Fund programs go
off track, the government’s credibility is damaged and market access recedes farther into the future.
In Figure AIII11, fiscal slippage (horizontal axis) is defined as cumulative deviation (over two years) of
primary balance-to-GDP ratios from the primary balance envisioned at the time of the program
request. Governments that went off track and did not achieve the fiscal consolidation they initially
projected (based on assessments in staff reports) at the time of the credit event took longer to
reaccess the market, at least based on evidence using the global bond issuance measure.
Figure AIII11. Market Access Loss and Fiscal Slippage 1/2/
(Fiscal slippage=difference between actual and projected primary balance at the time of the program
request, cumulative over two-year period)
Sources: Moody's Sovereign Default Series, October 7, 2013; Bloomberg; and WEO.
1 /Red dots depict restructuring cases and green dots depict reprofiling cases.
2/ The analysis excludes cases of Belize (2013) and Cyprus (2013) as it is not clear when these countries will reaccess the markets. For
countries that have not yet regained market access (as defined below), the duration of market access loss is based on April 2014 cut-
off date.
3/ Time to reaccess based on global bond issuance after the last debt exchange.
4/ Time to reaccess based on spreads normalization following the last debt exchange. Normalization is defined as the time it took
for spreads to drop to the 12-month average prior to the distress event (announcement of default, restructuring, Fund program, or
suspension of debt payments).
Note: Reprofilings are proxied by cases involving moderate (face-value preserving) maturity extensions and NPV reductions. In the
case of Argentina, the default occured in January 2002, while the debt exchange took place in June 2005. In this regard, time to
market reaccess based on spreads normalization may not represent the actual impact of the credit event.
BLZ '07
DOM '05GRD '05
MLD '02
PAK '99
URU '03
ECU '00
RUS '98
SEY '10
SKZ '12GRE'12
0
20
40
60
80
100
120
140
-10 -8 -6 -4 -2 0 2 4 6 8 10
Tim
e to
Mark
et R
eac
cess
in M
onth
s
fiscal slippage
Market Access Loss and Fiscal Slippage
(time to reaccess defined based on global bond issuance) 3/
Market Access Loss and Fiscal Slippage
(time to reaccess defined based on global bond issuance) 3/
BLZ '07
DOM '05
PAK '99
URU '03
ECU '00
RUS '98
SEY '10
0
10
20
30
40
50
60
70
-2 0 2 4 6 8 10
Tim
e to
Mark
et R
eac
cess
in M
onth
s
fiscal slippage
Market Access Loss and Fiscal Slippage
(time to reaccess based on spreads normalization) 4/

THE FUND’S LENDING FRAMEWORK AND SOVEREIGN DEBT—ANNEXES
INTERNATIONAL MONETARY FUND 69
62. The international environment also played a significant role for the time taken for
restructuring country to re-access markets (IMF, 2005). In particular, the prevailing international
investors’ risk appetite, global financial liquidity conditions, issuance and volatility in mature bond
markets, and the general economic and financial situation in major countries are often considered to
affect the length of time taken to re-accessing markets. Nevertheless, a favorable external
environment cannot substitute permanently for required domestic policy changes, a prerequisite for
a restructuring country seeking market re-access. Figure AIII12 shows that there was a positive
relationship between global risk aversion and volatility (proxied by VIX index) prevailing at the time
of restructuring/reprofiling and the time it takes for market conditions to normalize.64
Figure AIII12. Market Access Loss and Global Risk Aversion or Volatility (VIX) 1/2/
(Global risk aversion and volatility are proxied by VIX index)
Sources: Moody's Sovereign Default Series, October 7, 2013; and Bloomberg.
1/ Red dots depict restructuring cases and green dots depict reprofiling cases.
2/ The analysis excludes cases of Belize (2013) and Cyprus (2013) as it is not clear when these countries will reaccess the markets. For
countries that have not yet regained market access (as defined below), the duration of market access loss is based on April 2014 cut-
off date.
3/ Time to reaccess based on global bond issuance after the last debt exchange.
4/ Time to reaccess based on spreads normalization following the last debt exchange. Normalization is defined as the time it took
for spreads to drop to the 12-month average prior to the distress event (announcement of default, restructuring, Fund program, or
suspension of debt payments).
Note: Reprofilings are proxied by cases involving moderate (face-value preserving) maturity extensions and NPV reductions. In the
case of Argentina, the default occured in January 2002, while the debt exchange took place in June 2005. In this regard, time to
market reaccess based on spreads normalization may not represent the actual impact of the credit event.
64
Higher risk aversion is reflected by increases in the VIX index.
BLZ '07
DOM '05
GRD '05
MLD '02
PAK '99
URU '03
ARG '05
ECU '00
RUS '98
SEY '10
SKZ '12
0
20
40
60
80
100
120
140
10 12 14 16 18 20 22 24 26 28 30
Tim
e to
Mark
et R
eac
cess
in M
onth
s
Global Risk Aversion (VIX)
Market Access Loss and VIX
(time to reaccess defined based on global bond issuance) 3/
BLZ '07
DOM '05
PAK '99
URU '03ARG '05
ECU '00
RUS '98
SEY '10
0
10
20
30
40
50
60
70
80
8 10 12 14 16 18 20 22 24 26 28 30
Tim
e to
Mark
et R
eac
cess
in M
on
ths
Global Risk Aversion (VIX)
Market Access Loss and VIX
(time to reaccess based on spreads normalization) 4/

THE FUND’S LENDING FRAMEWORK AND SOVEREIGN DEBT—ANNEXES
70 INTERNATIONAL MONETARY FUND
D. How Did Sovereign Distress Spill Across International Borders?
How did sovereign contagion evolve during crisis periods? Was there any difference in the
evolution of sovereign contagion between restructuring and reprofiling cases?
63. This section presents an analysis of international spillovers in crisis episodes that
involved restructuring and reprofiling of sovereign debt. International spillovers were assessed
by the evaluating sovereign contagion across crisis countries and related countries. Sovereign
contagion was quantified by the vulnerability index (VI), which allows contagion to be assessed in
two ways: first, by evaluating how vulnerable crisis countries were to distress in other countries;
second, by quantifying how relevant crisis countries were as a source of contagion to related
countries.65
This assessment was made by estimating the VI for all the related countries and then
quantifying the percentage contribution of crisis countries to the VI of related countries. The VI was
analyzed in five crises episodes, including sovereign debt restructuring cases (Greece, 2010;
Argentina, 2001; Russia, 1998) and reprofiling cases (Uruguay, 2002; Dominican Republic, 2005).66
This section presents empirical evidence on (i) the evolution of contagion in crises episodes; (ii) the
differences in the magnitude of sovereign contagion between restructuring and reprofiling cases;
and (iii) the impact of contagion on sovereign risk. However, past history does not allow an
evaluation of the implications of the proposed regime change for contagion. The transition to the
new regime could be a period of heightened contagion risk as markets adjust and re-price sovereign
debt.
64. Sovereign contagion rose significantly during crises until policy actions to resolve
sovereign distress were taken, irrespective of the sovereign debt exchange decision chosen.
65
The VI characterizes the probability of distress of a country conditional on other countries becoming distressed. The
index ranges from zero to one. A low/high value indicates low/high vulnerability (Segoviano and Goodhart, 2009). The
VI embeds distress dependence across sovereigns and their changes throughout the economic cycle, reflecting the
fact that dependence increases in periods of distress. Distress dependence captures both direct and indirect linkages
among countries. Direct linkages include macro-financial linkages though trade, capital flows, and financial sector.
Indirect linkages include interconnections through common risk factors and contingent liabilities. While distress
dependence does not imply causation, it provides relevant insights about spillovers across sovereigns. The VI is
presented in Box AIII1.
66For each crisis case, contagion was assessed across all (related) countries for which information was available at the
time of the crisis. A country was defined as “related” if it was perceived to have either direct or indirect linkages to a
crisis country. The related county set included Argentina, Brazil, Chile, Colombia, Indonesia, Malaysia, Mexico,
Philippines, Poland, Russia, Thailand, Turkey, the United States of America, Japan, the United Kingdom, France,
Germany, Italy, Spain, the Netherlands, Belgium, Austria, Greece, Ireland, Portugal, and Sweden. The VI was estimated
using EMBI spreads for emerging economies and sovereign CDS spreads for advanced economies. When data
availability allows, the resulting data set spans from at least 12 months before the beginning of each crisis through at
least 12 months after spreads appear to go back to normal levels. Information was not available for all of the related
countries in each crisis case.

THE FUND’S LENDING FRAMEWORK AND SOVEREIGN DEBT—ANNEXES
INTERNATIONAL MONETARY FUND 71
While the nature of each crisis was different, in all cases, sovereign contagion rose significantly as
long as uncertainty about the resolution of sovereign distress prevailed. Once policy responses to
address sovereign distress were embarked upon, sovereign contagion subsided, irrespective of the
debt exchange policy decision taken (i.e., restructuring or reprofiling). This is illustrated by a rising VI
in the run-up to the crises as market access is lost and uncertainty about the resolution of sovereign
distress prevailed (Figures AIII13 and AIII14).67
Similarly, the contribution of crisis countries to
international contagion increased in periods of heightened uncertainty; yet, the relevance of crisis
countries as a source of international contagion declined when uncertainty was diminished (Figure
AIII15).68
A complementary empirical analysis using a different approach, presented in Box AIII4, finds
similar results.
Restructuring Cases
Russia (1998):
Increased uncertainty. The weakening fiscal position of Russia in the first half of 1998 caused
market sentiment to deteriorate and resulted in a rising interest bill. Russia was also negatively
affected by exogenous shocks to oil prices and the Asian crisis. During the second half of 1998,
Russia lost market access while the situation continued to deteriorate. Sovereign default and
currency devaluation in August 1998—one month after the Board approval of a new Fund
program—caused the breakdown of the banking sector. When sovereign debt restructuring was
announced in September 1998, Russian sovereign spreads exploded and Russian contagion
peaked (Figures AIII13 and AIII15).
Diminished uncertainty. By May 1999, the start of debt negotiations in Russia, as well as
improvements in economic prospects (which coincided with an improvement of commodity
prices), seems to have diminished uncertainty of sovereign distress resolution, while sovereign
spreads of other countries gradually decoupled and contagion subsided.
Argentina (2002):
Increased uncertainty. As the economic situation continued to deteriorate from the end of
2000, Argentina experienced a loss of market access. During 2001, the attempts to deal with the
67
The definition of market access loss used in this section is as follows: a country loses market access when it is unable
to place or replace debt in markets typically accessed by foreign investors at maturities and spreads that are within a
reasonable range from its prior pattern of issuance. 68
Periods of uncertainty are periods for which the contagion indicator is high or rising.

THE FUND’S LENDING FRAMEWORK AND SOVEREIGN DEBT—ANNEXES
72 INTERNATIONAL MONETARY FUND
liquidity crisis failed (the “mega-swap” in June, as well as the voluntary debt exchange in
November), culminating in sovereign default in December 2001, while Argentine sovereign risk
significantly increased. During 2002, Argentina devalued and GDP collapsed, while the financial
sector was drastically affected. These developments led to a credit crunch, which put further
pressure on economic activity; contagion soared in the last quarter of 2002, as the situation in
Uruguay and other Latin American countries worsened (Figure AIII13).
Diminished uncertainty. In 2003, the positive expectations of a new government taking office,
and the announcement of the intention to implement a debt exchange, raised hopes for an
orderly resolution of the Argentine situation, thus diminishing contagion.
Greece (2010):
Increased uncertainty. With Greece participating in a monetary union, contagion seemed to be
significantly affected by events happening not only in Greece, but also in other currency union
members, since distress in one country represents a contingent liability for other countries in the
union.69
In October 2009, the government revealed that it had understated debt and deficit
figures. This, along with other negative economic news, triggered an erosion of market
confidence in Greece and its debt sustainability, resulting in a number of rating downgrades in
December 2009. In March 2010, the government announced an agreement with the Troika on an
adjustment program supported by a financing package; all the while, the economic situation
continued deteriorating, with spreads over German bonds soaring during the second quarter of
2010, effectively excluding Greece from access to bond markets. In April 2011, the European
Commission released budget figures for Greece that were worse than expected, leading to a
spike in contagion. At this point, Greece (but also Ireland, Portugal, and to some extent Italy and
Spain) was highly vulnerable to distress in other countries (Figure AIII13), but also was a major
source of contagion to other countries in the euro area (Figure AIII15).
Diminished uncertainty. Various policies implemented not only in Greece but also in other euro
area member countries, which culminated with the announcement of the OMT, appear to have
diminished uncertainty about resolution of sovereign distress in Greece and other euro area
members, henceforth reducing contagion.
69
This is because the market might attribute a high probability to the event that a country experiencing sovereign
distress would be ultimately supported by other countries in the union.
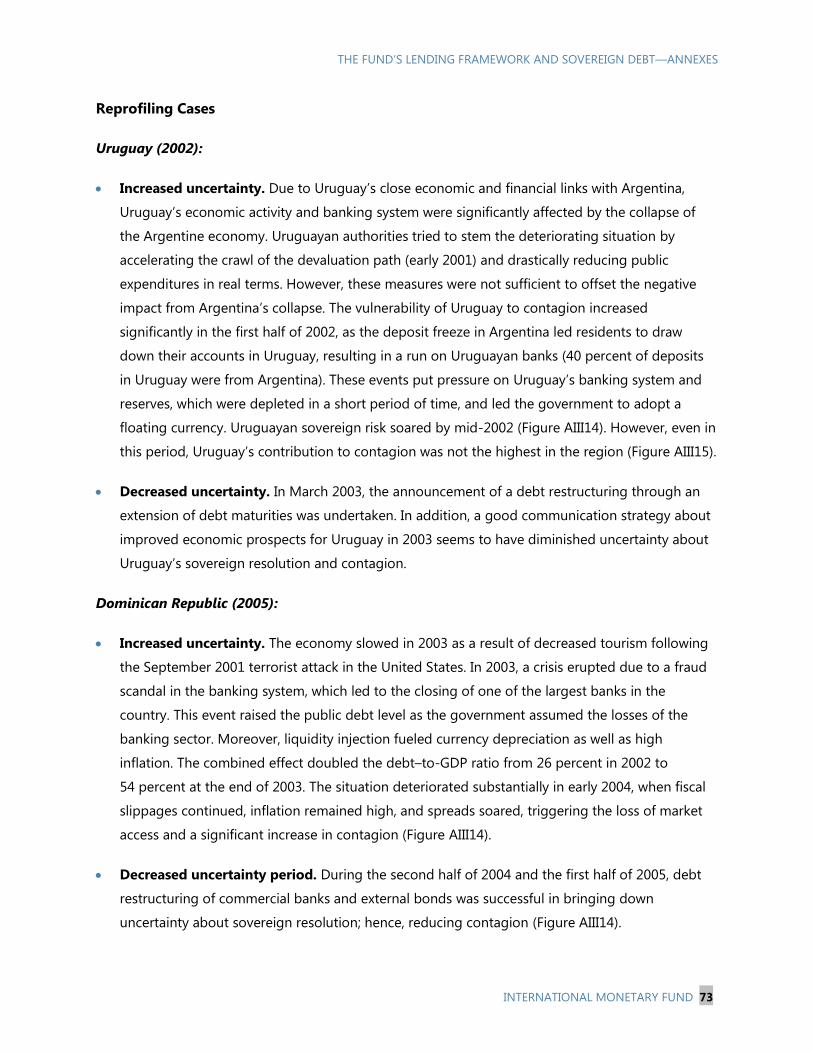
THE FUND’S LENDING FRAMEWORK AND SOVEREIGN DEBT—ANNEXES
INTERNATIONAL MONETARY FUND 73
Reprofiling Cases
Uruguay (2002):
Increased uncertainty. Due to Uruguay’s close economic and financial links with Argentina,
Uruguay’s economic activity and banking system were significantly affected by the collapse of
the Argentine economy. Uruguayan authorities tried to stem the deteriorating situation by
accelerating the crawl of the devaluation path (early 2001) and drastically reducing public
expenditures in real terms. However, these measures were not sufficient to offset the negative
impact from Argentina’s collapse. The vulnerability of Uruguay to contagion increased
significantly in the first half of 2002, as the deposit freeze in Argentina led residents to draw
down their accounts in Uruguay, resulting in a run on Uruguayan banks (40 percent of deposits
in Uruguay were from Argentina). These events put pressure on Uruguay’s banking system and
reserves, which were depleted in a short period of time, and led the government to adopt a
floating currency. Uruguayan sovereign risk soared by mid-2002 (Figure AIII14). However, even in
this period, Uruguay’s contribution to contagion was not the highest in the region (Figure AIII15).
Decreased uncertainty. In March 2003, the announcement of a debt restructuring through an
extension of debt maturities was undertaken. In addition, a good communication strategy about
improved economic prospects for Uruguay in 2003 seems to have diminished uncertainty about
Uruguay’s sovereign resolution and contagion.
Dominican Republic (2005):
Increased uncertainty. The economy slowed in 2003 as a result of decreased tourism following
the September 2001 terrorist attack in the United States. In 2003, a crisis erupted due to a fraud
scandal in the banking system, which led to the closing of one of the largest banks in the
country. This event raised the public debt level as the government assumed the losses of the
banking sector. Moreover, liquidity injection fueled currency depreciation as well as high
inflation. The combined effect doubled the debt–to-GDP ratio from 26 percent in 2002 to
54 percent at the end of 2003. The situation deteriorated substantially in early 2004, when fiscal
slippages continued, inflation remained high, and spreads soared, triggering the loss of market
access and a significant increase in contagion (Figure AIII14).
Decreased uncertainty period. During the second half of 2004 and the first half of 2005, debt
restructuring of commercial banks and external bonds was successful in bringing down
uncertainty about sovereign resolution; hence, reducing contagion (Figure AIII14).

THE FUND’S LENDING FRAMEWORK AND SOVEREIGN DEBT—ANNEXES
74 INTERNATIONAL MONETARY FUND
Figure AIII13. Contagion: Restructuring Cases
Sources: Bloomberg, DataStream, and Fund staff calculations.
Figure 1. Contagion: Restructuring Cases (Cont.)
Source: Datastream and IMF staff calculations.
0
20
40
60
80
100
Jun
-07
Sep
-07
Dec-
07
Mar-
08
Jun
-08
Sep
-08
Dec-
08
Mar-
09
Jun
-09
Sep
-09
Dec-
09
Mar-
10
Jun
-10
Sep
-10
Dec-
10
Mar-
11
Jun
-11
Sep
-11
Dec-
11
Mar-
12
Jun-1
2
Sep
-12
Dec-
12
Mar-
13
Jun-1
3
Sep
-13
Greece 2010: Vulnerability Index
(In percent)
OMT
(Sep. 2012)
IMF Program
(Mar. 2010)
Loss of Market Access
Doubling of budget
deficit announced
(Oct. 2009)
Sovereign ratings
Downgrade
(Dec. 2009)
EC reported deficit
worse than expected
(Apr. 2011)
EFSF
(Oct. 2011)
Greek Debt
Exchange
(Mar. 2012)
ESM
(Feb. 2012)
0
20
40
60
80
100
Jan
-00
Ap
r-00
Jul-
00
Oct
-00
Jan
-01
Ap
r-01
Jul-
01
Oct
-01
Jan
-02
Ap
r-02
Jul-
02
Oct
-02
Jan
-03
Ap
r-03
Jul-
03
Oct
-03
Jan
-04
Ap
r-04
Argentina 2002: Vulnerability Index
(In percent)
Default date
(Dec. 2001)
Announcement of
restructuring
(Oct. 2001)
Final exchange
offer (phase 1)
(Nov. 2001)
Date of
exchange
(Apr. 2005)
IMF Program
(Mar. 2000)
Loss of Market Access
Communication
of intention of
debt exchange
(Mar. 2003)
Official proposal
of debt exchange
(Sep. 2003)
0
20
40
60
80
100
Jan-9
8
Mar-
98
May-
98
Jul-
98
Sep
-98
No
v-98
Jan-9
9
Mar-
99
May-
99
Jul-
99
Sep
-99
No
v-99
Russia 1998: Vulnerability Index
(In percent)
Announcement
of restructuring
(Sep. 1998)
Start of
negotiation
Domestic debt
(May 1999)
Final
exchange
offer
(Feb. 2000)
IMF Program
(Jul. 1998)
Default date
(bank loans)
(Dec. 1998)
Sovereign debt
Default
(Aug. 1998)
Loss of Market Access

THE FUND’S LENDING FRAMEWORK AND SOVEREIGN DEBT—ANNEXES
INTERNATIONAL MONETARY FUND 75
Figure AIII13. Contagion: Restructuring Cases (concluded)
Sources: Bloomberg, DataStream, and Fund staff calculations.
Figure 1. Contagion: Restructuring Cases (Cont.)
Source: Datastream and IMF staff calculations.
0
20
40
60
80
100Ju
n-0
7
Sep
-07
Dec-0
7
Mar-
08
Jun
-08
Sep
-08
Dec-
08
Mar-
09
Jun
-09
Sep
-09
Dec-
09
Mar-
10
Jun
-10
Sep
-10
Dec-
10
Mar-
11
Jun
-11
Sep
-11
Dec-
11
Mar-
12
Jun-1
2
Sep
-12
Dec-
12
Mar-
13
Jun-1
3
Sep
-13
Greece 2010: Vulnerability Index
(In percent)
OMT
(Sep. 2012)
IMF Program
(Mar. 2010)
Loss of Market Access
Doubling of budget
deficit announced
(Oct. 2009)
Sovereign ratings
Downgrade
(Dec. 2009)
EC reported deficit
worse than expected
(Apr. 2011)
EFSF
(Oct. 2011)
Greek Debt
Exchange
(Mar. 2012)
ESM
(Feb. 2012)
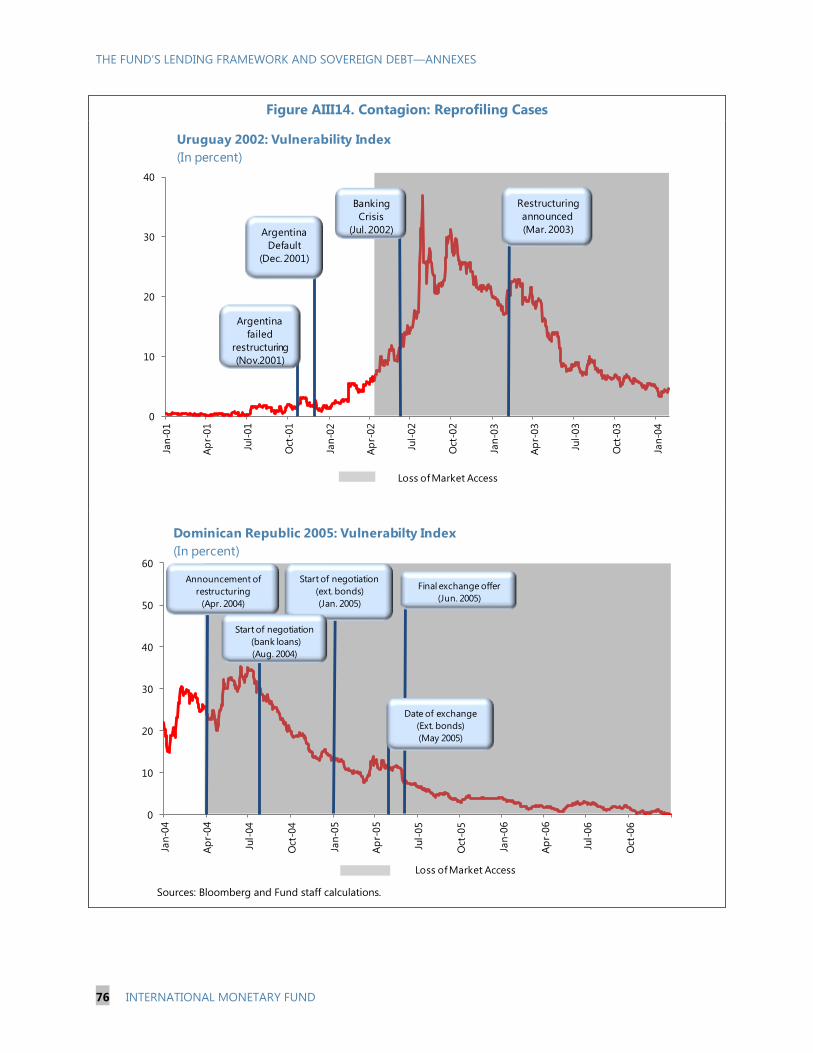
THE FUND’S LENDING FRAMEWORK AND SOVEREIGN DEBT—ANNEXES
76 INTERNATIONAL MONETARY FUND
0
10
20
30
40
50
60
Jan
-04
Ap
r-04
Jul-
04
Oct
-04
Jan
-05
Ap
r-05
Jul-
05
Oct
-05
Jan
-06
Ap
r-06
Jul-
06
Oct
-06
Dominican Republic 2005: Vulnerabilty Index
(In percent)
Announcement of
restructuring
(Apr. 2004)
Final exchange offer
(Jun. 2005)
Loss of Market Access
Date of exchange
(Ext. bonds)
(May 2005)
Start of negotiation
(ext. bonds)
(Jan. 2005)
Start of negotiation
(bank loans)
(Aug. 2004)
Figure AIII14. Contagion: Reprofiling Cases
Sources: Bloomberg and Fund staff calculations.
0
10
20
30
40Ja
n-0
1
Ap
r-01
Jul-
01
Oct
-01
Jan
-02
Ap
r-02
Jul-
02
Oct
-02
Jan
-03
Ap
r-03
Jul-
03
Oct
-03
Jan
-04
Uruguay 2002: Vulnerability Index
(In percent)
Banking
Crisis
(Jul. 2002)
Argentina
failed
restructuring
(Nov.2001)
Argentina
Default
(Dec. 2001)
Restructuring
announced
(Mar. 2003)
Loss of Market Access

THE FUND’S LENDING FRAMEWORK AND SOVEREIGN DEBT—ANNEXES
INTERNATIONAL MONETARY FUND 77
Was the magnitude of sovereign contagion different between restructuring and reprofiling
cases?
65. Empirical results show that contagion appears to be higher in restructuring than in
reprofiling cases in the sample of crises that was analyzed. The contributions to international
contagion from Russia, Argentina, and Greece were significant and in each case the highest among
their related countries in the periods of increased uncertainty. In contrast, even in the periods of
increased uncertainty, the contributions to international contagion from Uruguay and the Dominican
Republic were not the highest among their related countries (Figure AIII15).
66. Nevertheless, empirical results are subject to important caveats. Data availability and
quality restricted the sample size, making it difficult to draw robust inference. It is also important to
note that the crisis countries in our sample that went through reprofiling are not major economies
and do not host major financial centers; therefore, it is possible that contagion from these countries
would have been limited irrespective of the debt exchange decision taken. Moreover it is difficult to
separate the effects of debt exchange decisions stemming from policies that have an effect on
uncertainty about the resolution of sovereign distress from other factors that affect uncertainty. For
example, while contagion in the Greek restructuring dwarfs that observed in all other cases under
analysis, the contribution from other euro area countries (Portugal, Ireland, Italy, and Spain) to
international contagion during the crisis was highly significant even though these countries did not
go through debt exchanges (Figure AIII15). This fact suggests that the magnitude of contagion might
be the effect of a composite of factors. This is further investigated in the next section.
SD
R A
ND
TH
E F
UN
D’S
LEN
DIN
G F
RA
MEW
OR
K
PR
ELIM
INA
RY
CO
NSID
ER
ATIO
NS—
AN
NEX
ES
SD
R A
ND
TH
E F
UN
D’S
LEN
DIN
G F
RA
MEW
OR
K
PR
ELIM
INA
RY
CO
NSID
ER
ATIO
NS—
AN
NEX
ES

Figure AIII15. Contributions to Contagion
(In percent)
Sources: Bloomberg, DataStream, and Fund staff calculations.
Red bars indicate that a “crisis country” had the highest contribution to contagion among its peers in the period of “increased uncertainty.”
0
3
6
9
12
15
18
GRE POR IRE GER FRA ITA SPA NET BEL AUT
Period of Increased Uncertainty
Period of Diminished Uncertainty
Euro Area Countries, 2010
0
3
6
9
12
15
18
DOM MEX BRA CHI COL
Period of Increased Uncertainty
Period of Diminished Uncertainty
Dominican Republic, 2005
0
5
10
15
20
25
RUS TUR POL THA PHI MAL
Period of Increased Uncertainty
Period of Diminished Uncertainty
Russia, 1998
0
5
10
15
20
ARG URU MEX BRA CHI COL THA PHI MAL
Period of Increased Uncertainty
Period of Diminished Uncertainty
Argentina, 2001, and Uruguay, 2002
TH
E F
UN
D’S
LEN
DIN
G F
RA
MEW
OR
K A
ND
SO
VER
EIG
N D
EB
T—
AN
NEX
ES
78
IN
TER
NA
TIO
NA
L MO
NETA
RY F
UN
D

THE FUND’S LENDING FRAMEWORK AND SOVEREIGN DEBT—ANNEXES
INTERNATIONAL MONETARY FUND 79
Sovereign RiskMultivariate DensityCIMDO-distribution
Related Country BPOD
ContagionIndicators
-4
-2
0
2
4
-4
-2
0
2
40
0.05
0.1
0.15
0.2
Sovereign Spreads
Crisis CountryPOD
Related Country APOD
VulnerabilityIndex
Distress DependenceMatrix
Contribution toContagion
Figure A1: Modeling Framework
Source: IMF staff.
Box AIII2. The Vulnerability Index
International spillovers were assessed by the evaluation of sovereign contagion across crisis countries and related countries.
Sovereign contagion was quantified by the vulnerability index (VI), which allows an assessment of how vulnerable a country
is from distress in other countries. Hence, the VI allowed quantification of how vulnerable crisis countries were from distress
in other countries and also how relevant crisis countries were (as a source of contagion) to distress of related countries.
Essentially, the VI characterizes the probability of distress of a country conditional on other countries becoming distressed.
For each country Ai, the VI is computed using the formula:
SC(Ai) = ∑ P(Ai/Aj) · PoD(Aj) for all j ≠ i
Which is essentially the weighted sum of the probability of distress of country Ai given distress in each of the other
countries in the sample, appropriately weighed by the probability of each of these events to occur. In order to assess the
relevance of each country (as a source of contagion) to distress of related countries, we estimated the contribution to
contagion by:
Contribution to Contagion (Ai) = ∑[ [P(Ai/Aj) · PoD(Aj)]/SC(Ai)] for all j ≠ I
This is essentially the percentage contribution of each country to the vulnerability index of all the related countries. The
probability of sovereign distress in country Ai given distress in country Aj, referred here as the probability of Ai given Aj,
denoted by P (Ai/Aj) embeds distress dependence among countries and is obtained in three steps (Figure A1):
(i) The marginal probabilities of distress for countries Ai and Aj, PoD
(Ai) and PoD (Aj) respectively, are extracted from the individual EMBI
or CDS spreads for these countries.
(ii) Then, the joint probability of default of Ai and Aj, P (Ai, Aj), is
obtained using the CIMDO methodology developed by Segoviano
(2006). This methodology is used to estimate the multivariate
empirical distribution (CIMDO-distribution) that characterizes the
probabilities of distress of each of the sovereigns under analysis, their
distress dependence, and how such dependence changes along the
economic cycle. The CIMDO methodology is a non-parametric
methodology, based on the Kullback (1959) cross-entropy approach,
which does not impose parametric pre-determined distributional
forms; whilst being constrained to characterize the empirical
probabilities of distress observed for each institution under analysis
(extracted from the EMBI or CDS spreads). The joint probability of
distress of the entire group of sovereigns under analysis and all the
pair wise combinations of sovereigns within this group, i.e., P (Ai, Aj),
are estimated from the CIMDO-distribution.
(iii) Finally, different contagion indicators, including the conditional
probability of default P(Ai/Aj) is obtained by using the Bayes’ law:
P(Ai/Aj) = P(Ai,Aj) / P(Aj).
Contrary to simple correlations, or relationships based on the first few moments of different default probability series, the
CIMDO methodology enables us to characterize the entire distributional links between these series (i.e., linear (correlations)
and nonlinear distress dependence) and their evolution throughout the economic cycle. This reflects the fact that
dependence increases in periods of distress. This is a key technical improvement over traditional risk models, which usually
account only for linear dependence (correlations) that are assumed to remain constant over the cycle, over a fixed period of
time, or over a rolling window of time. Such dependence structure is characterized by a copula function (CIMDO-copula),
which changes at each period in time, consistently with changes in the empirically observed distress probabilities.

THE FUND’S LENDING FRAMEWORK AND SOVEREIGN DEBT—ANNEXES
80 INTERNATIONAL MONETARY FUND
Box AIII2. The Vulnerability Index (concluded)
The CIMDO Methodology
The detailed formulation of CIMDO is presented in Segoviano (2006). CIMDO is based on the Kullback
(1959) minimum cross-entropy approach (MXED). For illustration purposes, we focus on a portfolio
containing two different types of assets (sovereigns in this application), whose logarithmic returns are
characterized by the random variables x and y, where x, y ∈ɭi s.t. i=1,..,M. Therefore, the objective function
can now be defined as
C[p,q]=∫ ∫p(x,y)ln ( , )
( , )
p x y
q x y
dxdy, where q(x,y) the is prior distribution and p(x,y) the posterior distribution.
It is important to point out that the initial hypothesis is taken in accordance with economic intuition (default
is triggered by a drop in the Sovereigns’ asset value below a threshold value) and with theoretical models
(Structural Approach), but not necessarily with empirical observations. Thus, the information provided by the
frequencies of distress of each type of asset making up the portfolio is of primary importance for the
recovery of the posterior distribution. In order to incorporate this information into the recovered posterior
density, we formulate moment-consistency constraint equations of the form
, ,( , ) , ( , )x y
d d
x y
t tx xp x y dxdy PoD p x y dydx PoD
where p(x,y) is the posterior multivariate distribution that represents the unknown to be solved.
and
are the empirically observed probabilities of distress (PoDs) for each borrower in the
portfolio and
are the indicating functions defined with the distress thresholds for each
sovereign in the portfolio. In order to ensure that p(x,y) represents a valid density, the conditions that p(x,y)
≥0 and the probability additivity constraint,
∫∫p(x,y) dxdy=1, also need to be satisfied. Imposing these constraints on the optimization problem
guarantees that the posterior multivariate distribution contains marginal densities that in the region of
default are equalized to each of the borrowers’ empirically observed probabilities of default. The CIMDO
density is recovered by minimizing the functional
, ( , ) ln ( , ) ( , ) ln ( , )L p q p x y p x y dxdy p x y q x y dxdy
1 [ , )
( , ) xd
x
txp x y dxdy PoD
2 [ , )
( , ) yd
y
txp x y dydx PoD
( , ) 1p x y dxdy
Where represent the Lagrange multipliers of the moment-consistency constraints and represents the
Lagrange multiplier of the probability additivity constraint.
By using the calculus of variations, the optimization procedure is performed. The optimal solution is
represented by the following posterior multivariate density as
How does contagion impact sovereign risk in crisis episodes? How does contagion
compare to other factors that determine sovereign risk?
67. In order to explore this question, we analyzed factors that may have impacted euro
area sovereign spreads during the global financial crisis (GFC) (Figure AIII16). As the GFC
unfolded, several factors may have affected the valuations of sovereign spreads. First, the global
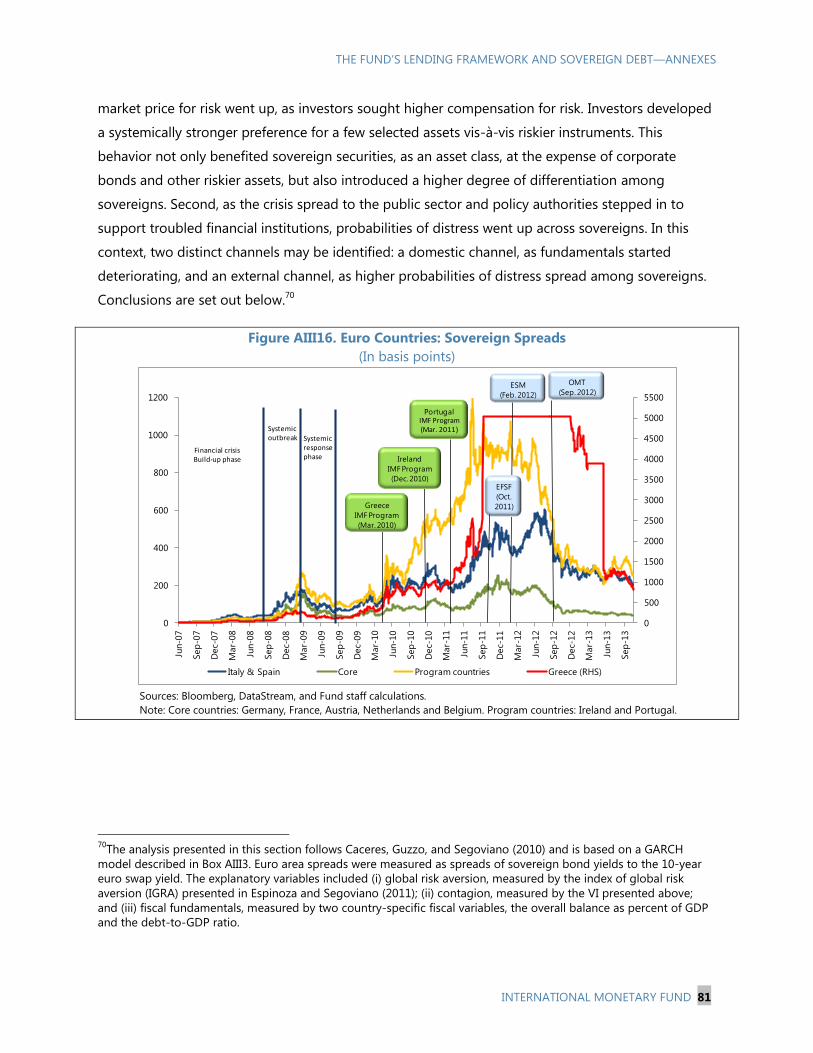
THE FUND’S LENDING FRAMEWORK AND SOVEREIGN DEBT—ANNEXES
INTERNATIONAL MONETARY FUND 81
market price for risk went up, as investors sought higher compensation for risk. Investors developed
a systemically stronger preference for a few selected assets vis-à-vis riskier instruments. This
behavior not only benefited sovereign securities, as an asset class, at the expense of corporate
bonds and other riskier assets, but also introduced a higher degree of differentiation among
sovereigns. Second, as the crisis spread to the public sector and policy authorities stepped in to
support troubled financial institutions, probabilities of distress went up across sovereigns. In this
context, two distinct channels may be identified: a domestic channel, as fundamentals started
deteriorating, and an external channel, as higher probabilities of distress spread among sovereigns.
Conclusions are set out below.70
Figure AIII16. Euro Countries: Sovereign Spreads
(In basis points)
Sources: Bloomberg, DataStream, and Fund staff calculations.
Note: Core countries: Germany, France, Austria, Netherlands and Belgium. Program countries: Ireland and Portugal.
70
The analysis presented in this section follows Caceres, Guzzo, and Segoviano (2010) and is based on a GARCH
model described in Box AIII3. Euro area spreads were measured as spreads of sovereign bond yields to the 10-year
euro swap yield. The explanatory variables included (i) global risk aversion, measured by the index of global risk
aversion (IGRA) presented in Espinoza and Segoviano (2011); (ii) contagion, measured by the VI presented above;
and (iii) fiscal fundamentals, measured by two country-specific fiscal variables, the overall balance as percent of GDP
and the debt-to-GDP ratio.
Figure 4. Euro Countries: Sovereign Spreads
(In basis points)
Source:
0
500
1000
1500
2000
2500
3000
3500
4000
4500
5000
5500
0
200
400
600
800
1000
1200
Jun-0
7
Sep
-07
Dec-
07
Mar-
08
Jun-0
8
Sep
-08
Dec-
08
Mar-
09
Jun-0
9
Sep
-09
Dec-
09
Mar-
10
Jun-1
0
Sep
-10
Dec-
10
Mar-
11
Jun-1
1
Sep
-11
Dec-
11
Mar-
12
Jun-1
2
Sep
-12
Dec-
12
Mar-
13
Jun-1
3
Sep
-13
Italy & Spain Core Program countries Greece (RHS)
Financial crisis Build-up phase
Systemic outbreak Systemic
responsephase
OMT
(Sep. 2012)
Greece
IMF Program
(Mar. 2010)
Ireland
IMF Program
(Dec. 2010)
PortugalIMF Program(Mar. 2011)
Source: Bloomberg, DataStream and IMF staff calculations.
Note: Core countries: Germany, France, Austria, Netherlands and Belgium. Program countries: Ireland and Portugal.
ESM
(Feb. 2012)
EFSF
(Oct.
2011)

THE FUND’S LENDING FRAMEWORK AND SOVEREIGN DEBT—ANNEXES
82 INTERNATIONAL MONETARY FUND
Box AIII3. Determinants of Sovereign Risk
The model specification employed in order to analyze the determinants of sovereign swap spreads at a daily
frequency is essentially a General Autoregressive Conditional Heteroskedasticity model (i.e., GARCH (1,1)), which is
modified to include a set of explanatory variables in the mean equation. The resulting specification can be
formulated as below.
[1]
[2]
In this framework, equation [1] is the so-called “mean” equation, whereas [2] describes the evolution of the
conditional variance of the error term, .
The dependent variable denotes the swap spread which is measured as the spread of sovereign bond yields to a
common numeraire. For the specific case of the euro area, this is chosen to be the 10-year euro swap rate. The
matrix (including a constant term) contains the explanatory variables. These are listed as follows:
Index of Global Risk Aversion (IGRA). The price of an asset reflects both market expectations of the
asset’s returns and the price of risk (i.e., the price that investors are willing to pay for receiving income in “distressed”
states of nature). The IGRA typifies the market price of risk. It allows us to extract from asset prices the effects of the
price of risk and thus to compute the market’s expectation of the probability of distress. This result is achieved by
using the methodology developed in Espinoza and Segoviano (2011).
Contagion, captured by the vulnerability index (VI), which characterizes the probability of distress of a
country conditional on other (related) countries becoming distressed. This indicator embeds distress dependence
across sovereigns and their changes throughout the economic cycle, reflecting the fact that dependence increases in
periods of distress (see Box AIII2).
Country specific fundamentals, identified by each country’s stock of public debt and budget deficit as a
share of GDP.
The inclusion of the lagged dependent variable in equation [1] is motivated by the need to capture the high
persistence inherent in daily frequency swap spread data. In addition, this variable captures lagged interaction
between the dependent and set of explanatory variables.
The framework allows us to quantify the relative contributions of factors in explaining movements in swap spreads
over time while robustly catering for potential data-driven biases which may arise during inference.
_________________________________
Note: The conditional variance is a function of the last period’s conditional variance and lag of squared errors from the mean equation.
68. Empirical analysis of euro area sovereign spreads shows that global risk aversion, fiscal
fundamentals, and contagion have a significant impact on sovereign spreads. Furthermore, the
effect of these factors on sovereign spreads changed at different stages of the crisis (Figure AIII17).
During the financial crisis build-up (July 2007–September 2008), contagion did not seem
to be a particularly significant factor. Germany and, to some extent, other core euro area
sovereigns (France), benefited from global risk aversion (via flight-to-quality flows), whereas
peripheral countries saw their sovereign spreads risk rising as global risk aversion weighed
adversely on these lower-rated issuers. In general, fundamentals were supportive of sovereign

THE FUND’S LENDING FRAMEWORK AND SOVEREIGN DEBT—ANNEXES
INTERNATIONAL MONETARY FUND 83
bonds, as both deficits and debt levels were still improving at this stage in the periphery as well
as core countries. During this phase, contagion did not seem to be a particularly significant
factor in driving up sovereign spreads.
During the systemic outbreak (October 2008–March 2009), contagion gained significance
as problems in the banking sector spilled over to sovereign balance sheets and
fundamentals started to deteriorate. Following the collapse of Lehman Brothers and as
sovereigns stepped in to support financial institutions, spreads rose on contagion from countries
more directly involved in the financial crisis (Austria, the Netherlands, and Ireland) and from
fundamentals which had started deteriorating. Global risk aversion was no longer playing such a
favorable role as crisis-related interventions and fiscal stimulus packages had diluted the
perception of sovereigns as a riskless asset class.
During the systemic response phase (April-September 2009), the effect of contagion on
spreads decreased as lower probability of distress in some countries favorably affected
others. Spreads converged, and the correction was larger among those bonds, such as Italy and
Greece, which had underperformed during the systemic outbreak, as lower contagion was
further offset by deterioration in fundamentals; however, spreads remained wider than before.
In the sovereign risk phase (October 2009–August 2012), swap spreads started to be
driven by country specific developments. Starting in March 2010 a clear decoupling in
sovereign spreads took place in countries with weaker fundamentals, as the emphasis shifted
towards short-term refinancing risk and long-term fiscal sustainability. The effect of contagion
remained unchanged or marginally increased for countries with stronger fundamentals
(especially for core euro area countries), but increased substantially for countries with weak
fundamentals, especially Greece, Portugal, and Ireland, but also Spain and Italy. Finally,
contagion started decreasing from the end of 2011 after the implementation of various pan-
European policies, which aimed to dissipate uncertainty about the impact of sovereign distress
from Greece and other countries with weak fundamentals. These policies included the EFSF,
which became effective October 2011, and the signing of the treaty creating the ESM in
February 2012. From August 2012, sovereign spreads, and hence contagion, decreased
significantly across all European countries with the announcement of the OMT. However,
spreads remained differentiated according to fundamentals, which in some countries started
improving by mid 2012, for instance, as a result of fiscal consolidation.

THE FUND’S LENDING FRAMEWORK AND SOVEREIGN DEBT—ANNEXES
84 INTERNATIONAL MONETARY FUND
69. Moreover, these factors appear to interact, exerting a compounded effect on
sovereign spreads irrespective of debt exchange policy decisions. These results provide
evidence that the magnitude of contagion seems to depend on a compound of factors, irrespective
of debt exchange policy decisions. This is particularly the case when a country transmits contingent
liabilities to related countries (e.g., through interconnected financial systems and/or economies) or
by belonging to a monetary union in which fiscal transfers are absent, since the market might
attribute a high probability to the event that a country experiencing sovereign distress would be
ultimately supported by other related countries.

THE FUND’S LENDING FRAMEWORK AND SOVEREIGN DEBT—ANNEXES
INTERNATIONAL MONETARY FUND 85
Figure AIII17. Contributions to Changes in Euro Area Swap Spreads
(In percent)
Figure 5. Contributions to Changes in Euro Area Swap Spreads(In percent)
-80
-60
-40
-20
0
20
40
60
80
100
Jul 07-Sep 08 Oct 08-Mar 09 Apr 09-Sep 09 Oct 09-Feb 10
Fundamentals
Contagion
Global Risk Aversion
Greece
-80
-60
-40
-20
0
20
40
60
80
100
Jul 07-Sep 08 Oct 08-Mar 09 Apr 09-Sep 09 Oct 09-Feb 10
Fundamentals
Contagion
Global Risk Aversion
Ireland
-80
-60
-40
-20
0
20
40
60
80
100
Jul 07-Sep 08 Oct 08-Mar 09 Apr 09-Sep 09 Oct 09-Feb 10
Fundamentals
Contagion
Global Risk Aversion
Portugal
Source: Bloomberg, DataStream and IMF staf f calculations.

THE FUND’S LENDING FRAMEWORK AND SOVEREIGN DEBT—ANNEXES
86 INTERNATIONAL MONETARY FUND
Figure AIII17. Contributions to Changes in Euro Area Swap Spreads (continued)
(In percent)
-80
-60
-40
-20
0
20
40
60
80
100
Jul 07-Sep 08 Oct 08-Mar 09 Apr 09-Sep 09 Oct 09-Feb 10
Fundamentals
Contagion
Global Risk Aversion
Spain
-80
-60
-40
-20
0
20
40
60
80
100
Jul 07-Sep 08 Oct 08-Mar 09 Apr 09-Sep 09 Oct 09-Feb 10
Fundamentals
Contagion
Global Risk Aversion
Italy
-80
-60
-40
-20
0
20
40
60
80
100
Jul 07-Sep 08 Oct 08-Mar 09 Apr 09-Sep 09 Oct 09-Feb 10
Fundamentals
Contagion
Global Risk Aversion
Germany

THE FUND’S LENDING FRAMEWORK AND SOVEREIGN DEBT—ANNEXES
INTERNATIONAL MONETARY FUND 87
Figure AIII17. Contributions to Changes in Euro Area Swap Spreads (concluded)
(In percent)
Sources: Bloomberg, DataStream, and Fund staff calculations.
-80
-60
-40
-20
0
20
40
60
80
100
Jul 07-Sep 08 Oct 08-Mar 09 Apr 09-Sep 09 Oct 09-Feb 10
Fundamentals
Contagion
Global Risk Aversion
France
-80
-60
-40
-20
0
20
40
60
80
100
Jul 07-Sep 08 Oct 08-Mar 09 Apr 09-Sep 09 Oct 09-Feb 10
Fundamentals
Contagion
Global Risk Aversion
Austria
-80
-60
-40
-20
0
20
40
60
80
100
Jul 07-Sep 08 Oct 08-Mar 09 Apr 09-Sep 09 Oct 09-Feb 10
Fundamentals
Contagion
Global Risk Aversion
Netherlands

THE FUND’S LENDING FRAMEWORK AND SOVEREIGN DEBT—ANNEXES
88 INTERNATIONAL MONETARY FUND
Box AIII4. Multivariate GARCH
To complement the analysis using the Vulnerability Index (VI) (Box AIII2), a multivariate GARCH framework is also
employed.1 This essentially models multiple time-series of daily bond spreads jointly, thus allowing the extraction of
heteroskedasticity and time-varying correlations (co-movements) in the conditional variances which may be present
in these series, specifically, the Dynamic Conditional Correlation (DCC) specification proposed by Engle (2002).2
The underlying intuition is that low estimated co-movements between a crisis country and other related economies
can be indicative of relatively low levels of spillovers. Alternatively, if outward financial spillovers are high, then this
would translate into higher co-movement being seen in the data. The main results from the multivariate GARCH
analysis are as follows:
1. In the run-up to most crisis cases, contagion increased significantly, as evidenced by high bond spread
correlations.
2. Contagion in the specific case of Greece declined once credible policy decisions on the sovereign debt
restructuring were made.
3. In the case of Argentina, sovereign bond spread spillovers with other EMs, such as Brazil, Mexico, and Russia
only started to decisively subside after the eventual default in early 2002.
4. For Uruguay, the magnitude of sovereign debt contagion appears much smaller in comparison to Argentina.
5. Overall, the analysis highlights that credibility in policy decisions are key to the solution of contagion,
whether it is a bailout or debt restructuring.
Estimated GARCH Bond Spread Correlation of Greece with Euro Area Countries
Sources: Bloomberg and Fund staff calculations.
_____________________________
1This is a generalization of the Constant Conditional Correlation (CCC) model by Bollerslev (1990).
2Following Frank and Hesse (2009).
-0.2
-0.1
0
0.1
0.2
0.3
0.4
0.5
0.6
0.7
0.8
0.9
1/2
/20
09
2/2
/20
09
3/2
/20
09
4/2
/20
09
5/2
/20
09
6/2
/20
09
7/2
/20
09
8/2
/20
09
9/2
/20
09
10
/2/2
00
9
11
/2/2
00
9
12
/2/2
00
9
1/2
/20
10
2/2
/20
10
3/2
/20
10
4/2
/20
10
5/2
/20
10
6/2
/20
10
7/2
/20
10
8/2
/20
10
9/2
/20
10
10
/2/2
01
0
11
/2/2
01
0
12
/2/2
01
0
1/2
/20
11
2/2
/20
11
3/2
/20
11
4/2
/20
11
5/2
/20
11
6/2
/20
11
7/2
/20
11
8/2
/20
11
9/2
/20
11
10
/2/2
01
1
11
/2/2
01
1
12
/2/2
01
1
1/2
/20
12
2/2
/20
12
3/2
/20
12
4/2
/20
12
5/2
/20
12
6/2
/20
12
7/2
/20
12
8/2
/20
12
9/2
/20
12
10
/2/2
01
2
11
/2/2
01
2
12
/2/2
01
2
Average of Gr with Ire, It, Por and Sp Average of Gr with Aus, Neth and Fra
Greece - IMF Program, May 9, 2010
Greece - Announces terms of Debt Exchange, February 24, 2012
Deauville Declaration, October 18, 2010
Greece - IMF Approves Second Program, March 15, 2012
Greece: IIFproposal for restructuring,
July 2011
Draghi London Speech, July 26, 2012
OMT,
September 6, 2012
Announcement IMF Program Ireland
Announcement IMF Program Portugal

THE FUND’S LENDING FRAMEWORK AND SOVEREIGN DEBT—ANNEXES
INTERNATIONAL MONETARY FUND 89
Box AIII4. Multivariate GARCH (concluded)
Estimated GARCH Bond Spread Correlations of Argentina with Other EMs
Sources: Bloomberg; and Fund staff calculations.
-0.2
0
0.2
0.4
0.6
0.8
11/
2/19
98
3/2/
1998
5/2/
1998
7/2/
1998
9/2/
1998
11/2
/199
8
1/2/
1999
3/2/
1999
5/2/
1999
7/2/
1999
9/2/
1999
11/2
/199
9
1/2/
2000
3/2/
2000
5/2/
2000
7/2/
2000
9/2/
2000
11/2
/200
0
1/2/
2001
3/2/
2001
5/2/
2001
7/2/
2001
9/2/
2001
11/2
/200
1
1/2/
2002
3/2/
2002
5/2/
2002
7/2/
2002
9/2/
2002
11/2
/200
2
Argentina-Brazil Argentina-Mexico Argentina-Russia
IMF Program,
March 10, 2000
Announcement of
Restructuring, October 2011 Final Exchange offer,
November 2001
Default Date, January 2002

THE FUND’S LENDING FRAMEWORK AND SOVEREIGN DEBT—ANNEXES
90 INTERNATIONAL MONETARY FUND
References
Bollershev, Tim, 1990, “Modelling the Coherence in Short-run Nominal Exchange Rates: A
Multivariate Generalized ARCH Approach,” Review of Economics and Statistics, Vol. 72,
pp. 498–505.
Caceres, C., Guzzo, V. and Segoviano, M., 2010, “Sovereign Spreads: Global Risk Aversion, Contagion
or Fundamentals?” IMF Working Paper 10/120 (Washington: International Monetary Fund).
Cruces, Juan J., and Christoph Trebesch, 2013, “Sovereign Defaults: The Price of Haircuts,” American
Economic Journal: Macroeconomics, Vol. 5, No. 3, pp. 85–117.
Engle, R., 2002, “Dynamic Conditional Correlation: A Simple Class of Multivariate Generalized
Autoregressive Conditional Heteroskedasticity Models,” Journal of Business & Economic
Statistics, Vol. 20, pp. 339–50.
Espinoza, R., and M. Segoviano, 2011, “Probabilities of Default and the Market Price of Risk in a
Distressed Economy,” IMF Working Paper 11/75 (Washington: International Monetary Fund).
Frank, N., and H. Hesse, 2009, “Financial Spillovers to Emerging Markets during the Global Financial
Crisis,” IMF Working Paper 09/104 (Washington: International Monetary Fund).
Golan, A., G. Judge, and D. Miller, 1997, “Maximum entropy Econometrics,” Series in Financial
Economics and Quantitative Analysis, Wiley.
International Monetary Fund, 2005, “Assessing the Determinants and Prospects for the Pace of
Market Access by Countries Emerging from Crises: Further Considerations,” International
Capital Markets Department, March 1 (Washington).
Kullback, J., and R. Leibler, 1951, “On Information and Sufficiency,” Annals of Mathematical Statistics,
Vol. 22, pp. 79–86.
Kullback, J., 1959, “Information Theory and Statistics,” John Wiley, (New York).
Moody’s, 2013, “The Aftermath of Sovereign Default,” Sovereign Default Series.
Segoviano, M., 2006, “Consistent Information Multivariate Density Optimizing Methodology,” FMG
Discussion Paper No. 557 (London: Financial Markets Group, London School of Economics).

THE FUND’S LENDING FRAMEWORK AND SOVEREIGN DEBT—ANNEXES
INTERNATIONAL MONETARY FUND 91
_____, 2006, “The Conditional Probability of Default Methodology,” FMG Discussion Paper No. 558
(London: Financial Markets Group, London School of Economics).
Segoviano, M., and C. Goodhart, 2009, “Banking Stability Measures,” IMF Working Paper 09/4
(Washington: International Monetary Fund).

THE FUND’S LENDING FRAMEWORK AND SOVEREIGN DEBT—ANNEXES
92 INTERNATIONAL MONETARY FUND
ANNEX IV. REPROFILING AND DOMESTIC FINANCIAL
STABILITY: RECENT EXPERIENCES71
This annex analyses the experience with past cases of reprofiling to assess whether they had
destabilizing effects on the domestic banking system. It examines several past maturity extensions
(Cyprus, Jamaica, Pakistan, and Uruguay) and finds that destabilizing effects did not materialized.
Several factors contributed to the generally successful outcomes under maturity extensions: financial
stability concerns were taken into account in the design of the restructuring and program strategy;
banks mainly held their sovereign assets as held-to-maturity (HTM); a reprofiling was not assessed to
be an impairment event requiring a write down of these assets (e.g., Cyprus, Jamaica); regulatory
incentives for banks were provided (e.g., Jamaica or Uruguay); capital and liquidity support
mechanisms were established (e.g., Jamaica) or were present (Cyprus); the amount of bank holdings of
sovereign bonds in most cases was not very large; and some forbearance was used. The Jamaican case
illustrates how a restructuring was designed to be light in order to ensure a limited impact on the
financial system. The annex also proposes possible measures that could help protect the banking
system during a reprofiling and encourage participation by domestic banks in the exchange. Finally,
the annex examines financial stability implications of creditor bailout. Although a reprofiling may have
some disruptive effects, a bailout does not necessarily insulate the domestic financial system, as the
Greek experience demonstrates.72
70. A debt restructuring or reprofiling can potentially have several disruptive effects on
domestic banks and other financial institutions holding government debt. In general, domestic
banks can be affected by sovereign stress because of the role of the sovereign as backstop to the
financial system and through direct exposure to the sovereign. Some of the possible effects include
the following:
Banks can suffer mark-to-market losses on their holdings of government bonds which could
lead them to being undercapitalized.
A concern about the health of domestic banks could lead to deposit runs in the domestic
financial system which could affect otherwise healthy banks.
71
This Annex was prepared by Heiko Hesse with input from Christopher Dielmann under the supervision of Geneviève
Verdier (SPR).
72“Reprofilings” are proxied by cases involving limited (face-value preserving) maturity extensions that lead to
moderate NPV reductions.

THE FUND’S LENDING FRAMEWORK AND SOVEREIGN DEBT—ANNEXES
INTERNATIONAL MONETARY FUND 93
Banks’ short-term external wholesale funding could become more expensive or even
evaporate.
Banks could face larger haircuts on their sovereign exposure for collateral operations (e.g.,
interbank or central bank repo operations) from the increased sovereign yields and asset
valuation changes.
Exchange rate depreciation associated with worsening market sentiment could feed into
higher bank FX funding costs and could expose unhedged FX (corporate) borrowers.
71. A reprofiling can potentially also have beneficial effects on the banking system. If a
reprofiling improves the prospects for debt sustainability and is seen to help avoid a potentially
deeper debt restructuring subsequently, it can speed up the recovery thereby reducing debt
overhang and benefiting the financial sector. Compared to an alternative were markets may have
priced in a deep debt restructuring, a reprofiling would remove the uncertainty and could lead to a
relief rally and market-to-market gains on bank balance sheets. In general, the extent of the gains or
losses on banks’ balance sheets would depend on the portfolio structure of bond holdings.
72. The Fund’s experience indicates that past debt reprofiling cases have not had
destabilizing effects on the domestic financial system. Staff reviewed the experience in four
Fund-supported programs that entailed a reprofiling (Cyprus, Jamaica, Pakistan, and Uruguay). The
detailed analysis finds that in none of these cases did the reprofiling have a disruptive impact on the
domestic banking system. Several factors helped to contain the effects on the banking system:
financial stability considerations were taken into account in the design of reprofiling; banks mainly
held their sovereign assets as HTM and the reprofiling was not assessed to be an impairment event
requiring a write-down of these holdings; regulatory incentives for banks to participate in the bond
exchange were provided (see Boxes AIV1 and AIV2); bank holdings of sovereign debt were not large
in some cases; domestically held debt was excluded from reprofilings in some cases; and capital and
liquidity support mechanisms were established or were present and some forbearance was used.
Box AIV1 provides details on each country case.
For example, in Jamaica, the restructuring was intentionally designed to be light so as to
minimize the impact on the financial system.

THE FUND’S LENDING FRAMEWORK AND SOVEREIGN DEBT—ANNEXES
94 INTERNATIONAL MONETARY FUND
In Cyprus, banks did not need to write down their holdings of domestic sovereign debt as
the reprofiling was not assessed to be an impairment event, given that bonds were close to
maturity and principal and coupon were being preserved.73
Where domestic financial stability was a concern in past reprofiling cases, program design
explicitly provided for bank recapitalization and/or liquidity support to successfully limit the
impact on the financial sector. In any event, such funds often did not need to be fully utilized
or were not used at all.
Finally, Cyprus and Uruguay are examples where a reprofiling worked smoothly and in
parallel with an ongoing program to address vulnerabilities in the banking system and
address problem banks. For example, a bail-in of bank creditors closed the imminent capital
hole in some of the Cypriot banks.
73. Some caveats need to be borne in mind. While the review of experience shows that
reprofilings have worked relatively smoothly in the past, this evidence should not be taken as
conclusive. There are always risks in the design of a restructuring that need to be adequately
addressed through the design of the restructuring, and more generally, the design of the Fund-
supported program. Past reprofilings were also not done under the regime being considered. While
temporary forbearance seems to have worked in the past in containing the impact on the banking
system, it can adversely affect credit growth. It is also possible that the benign outcomes in past
reprofilings could have been the
result of better initial
macroeconomic conditions
compared to those countries
that undertook a deep debt
restructuring. However, this does
not seem to be the case: the text
table shows that initial
macroeconomic conditions were
very similar in past cases of
reprofilings and deeper debt restructurings.
73
Nevertheless, while these measures in the Cyprus and Jamaica cases were important, the debt reprofilings could
have had a market impact on their domestic banking system had there not been a credible design of safety measures
to limit any potential fallout. In addition, the approach in Cyprus was part of a broader program strategy which
included a restructuring of Cypriot banks with the bail-in of bank creditors.
Mean Median Mean Median
Public Debt (percent of GDP, year before
restructuring)96.8 93.0 100.2 101.6
Current Account Balance (percent of GDP, average
over three years before restructuring)-6.4 -7.7 -5.7 -5.5
Overall Fiscal Balance (percent of GDP, average over
three years before restructuring)-5.0 -4.6 -3.4 -2.9
Primary Balance (percent of GDP, average over three
years before restructuring)0.5 0.4 0.7 0.9
Source: Staff reports, WEO
Reprofiling Debt reduction
Indicators of Fundamentals and Policy Track Record
Reprofilings: Belize (2007), Cyprus, Dominican Republic, Grenada, Jamaica (2010), Jamaica (2013),
Pakistan, Paraguay, Uruguay
Debt reductions: Argentina, Belize (2013), Ecuador (2000), Ecuador (2009), Greece, Russia, Seychelles, St.
Kitts & Nevis, Ukraine

THE FUND’S LENDING FRAMEWORK AND SOVEREIGN DEBT—ANNEXES
INTERNATIONAL MONETARY FUND 95
74. These findings notwithstanding, program design would in any event seek to address
such concerns, as typically common in Fund-supported programs. As in past restructurings,
program design would be expected to build in measures to safeguard financial stability during and
after the reprofiling.74
In the specific circumstances of a currency union with highly interconnected
financial markets, limiting the impact on the domestic banking system as well as overall contagion
to other members would also need to rely on credible system-wide backstops, with prompt action
taken to strengthen such backstops if necessary. While the exact set of measures to be used would
depend on country specific considerations, some of the measures used in the past have included the
following:
Creation of backstops, in the event that stress tests suggest possible financial stability
concerns. Examples include Jamaica’s use of a Financial Sector Stability Fund (FSSF) in 2010
and 2013, and the Fund for Fortifying the System of Banks in Uruguay. Fund program
resources could potentially contribute to the backstop.
Increased central bank liquidity provision prior to and during debt reprofiling episodes.
Central banks typically play a fundamental role during debt reprofiling episodes as the
lender-of-last-resort. Central bank liquidity provisions would be especially important if
domestic banks lose market funding on account of an SD rating, and could include a
temporary expansion of eligible collateral if banks face large haircuts on collateral of
government bonds for repo purposes. Where relevant and needed, FX swap lines with other
central banks could provide some temporary FX funding buffers to the domestic banking
sector, and indirectly to corporate, should there be a squeeze on FX funding. The availability
of ample FX funding would also enhance the confidence in the financial sector, including
amongst potentially-fickle depositors. Box AIV2 provides an overview of how central banks
have provided banking sector liquidity during the past reprofiling cases of Cyprus, Jamaica,
Pakistan and Uruguay.
Regulatory measures. Various measures could be taken to help banks and nonbanks
participate in the bond exchange and limit some potential direct as well as indirect impact.
These include applying different risk weights on old versus new bonds, providing liquidity
support subject to eligible collateral for viable financial institutions, and granting some
74
Under the proposal, specific financial sector measures would differ on a case-by-case basis. Past recommendations,
as described above, cannot necessarily be a guide to future advice in different cases.
THE FUND’S LENDING FRAMEWORK AND SOVEREIGN DEBT—ANNEXES
96 INTERNATIONAL MONETARY FUND
temporary forbearance (e.g., on provisioning requirements).75
Box AIV3 provides an overview
of the accounting treatment of banks’ holdings of domestic sovereign debt.
Capital and deposit controls. In the extreme case where nonresident capital outflows (such
as bank deposits) could destabilize the financial system over the short-run, prior to or
following a debt reprofiling, temporary capital controls—as were deployed in Cyprus and
Iceland—might be also part of the crisis management toolkit. Capital controls would need to
be implemented carefully, with clear communication and a credible exit strategy.
Bank resolution tools, such as bail-in. If banks were found to be undercapitalized prior to
or as a consequence of a debt reprofiling, it would be appropriate from a financial stability
perspective—and to safeguard limited public resources—to require bank shareholders and
possibly other bank creditors to contribute to a resolution of the problem. For instance, in
the case of Cyprus, the bail-in of bank creditors closed the imminent capital hole of the main
Cypriot banks.
75. The alternative to reprofiling—bailing out holders of sovereign debt—would not
necessarily eliminate risks of financial instability or the need to build in appropriate program
safeguards.76
In past programs, countries which benefited from access to Fund resources did not
always avoid banking crises, particularly in cases where a restructuring was eventually needed. A
case in point is Greece, where the banking sector was perceived as relatively sound in 2010 when
the first Fund-supported program started. With the severity of the Greek recession, ongoing
sovereign debt problems and fears about a Greece euro exit, the domestic banking system
increasingly faced existential liquidity, asset quality and capital problems even before a restructuring
was envisaged. Strong program measures were taken in response, including on bank recapitalization
and restructuring as well as by the ECB on substantial liquidity support. Box AIV4 provides an
overview of relevant banking sector developments in Greece during the crisis.
75
Regulators would need to strike the right balance in the use of forbearance. In this context, forbearance would
typically involve allowing affected financial institutions more grace time to book any bond losses from the bond
exchange than is stipulated under IFRS accounting standards. Forbearance is in general not recommended, since it
could undermine market confidence in the domestic banks if provisioning and capital holes are suspected as a result
of adverse bond yield developments around and after the time of the bond exchange. If financial stability concerns
are a serious issue following the debt reprofiling, however, temporary relaxation of some regulations could be
justified as a last resort, if considered necessary to avoid “cliff effects” on affected banks.
76For the purposes of this annex, a bailout is defined as cases where creditors are paid out before an eventual
restructuring. See Annex I on past cases of creditor bailout.

THE FUND’S LENDING FRAMEWORK AND SOVEREIGN DEBT—ANNEXES
INTERNATIONAL MONETARY FUND 97
Box AIV1. Impact of Sovereign Debt Maturity Extensions on Domestic Bank’s Balance
Sheets
This box examines several past maturity extensions (Cyprus, Jamaica, Pakistan, and Uruguay) and
finds that they did not have destabilizing effects on the banking system. Staff reports and other sources
were examined for each case to obtain information on the banking system impact. The criterion used to
assess whether the bond exchange had a material impact on the banking sector was if, as a direct result of
the bond exchange, any bank in the country needed either additional provisioning or recapitalization. The
cases highlight a number of factors that contributed to the preservation of financial stability in the wake of a
maturity extension, and may also help explain the short duration of the SD downgrade in most cases (less
than two months except in Pakistan where it lasted 11 months).
Cyprus (2013): A few weeks ahead of when its (primarily domestically-held) bonds were originally due,
Cyprus exchanged them with new bonds with the same coupon, and extended maturities through 2019-
2023 (IMF, 2013a). The main reason Cypriot banks did not have to book losses during the bond exchange
was that banks held the affected sovereign bonds as Hold-to-Maturity (HTM) and they assessed, with the
tacit consent of the regulator, that there was no impairment event. This allowed Cypriot banks to maintain
the newly exchanged bonds as HTM and not move them to the Available for Sale (AFS) portfolio, where fair
value measurement would have been required (as market prices were well below par). The temporary SD
assessment of the rating agencies did not bind Cypriot banks to book losses with the affected sovereign
bond holdings as the sovereign did not default on its payments and issued new bonds with the same face
value and other terms. Finally, the prior bail-in of bank creditors closed the imminent capital hole of the
main Cypriot banks.
Jamaica (2010, 2013): Overall, the restructuring was designed to be light, in order to avoid destabilizing the
financial system. In both bond exchanges, most of the affected domestic debt was primarily held by banks as
HTM, and as there was no impairment event banks did not take any immediate additional provisioning or
capital hit from the debt reprofiling exercise. Rating agencies ruled Jamaica’s domestic government debt as
SD but then upgraded the sovereign following the successful completion of the bond exchange. A Financial
Sector Stability Fund (FSSF)—set up to help with any capital and liquidity support for financial institutions—
was not tapped (see Grigorian and others, 2012).
Pakistan (1999): Pakistan’s restructuring of external sovereign debt in November 1999 had a limited impact
on the domestic banking sector. The restructuring involved a slight nominal increase in principal outstanding
for two of the three Eurobonds, to roll in unpaid interest, and the offered terms were relatively attractive to
the creditors. About 30 percent of restructured bonds were held by domestic investors. One participating
domestic bank received a capital injection 6 months after the exchange following a bank audit, though the
undercapitalization does not seem to be related to the earlier bond exchange (IMF, 2001).
Uruguay (2003): The overall immediate direct impact on the domestic banking system from the domestic
and external bond exchange in 2003 was small. More than 50 percent of the bonds were held by domestic
creditors, mostly retail investors, while domestic bank holdings of government bonds were relatively low, at
less than 5 percent of total bank assets, and mostly held as HTM. In this case, the fact that domestic banks
were mostly holding the sovereign debt as HTM did not matter since the bank supervisor provided strong
regulatory incentives for banks to participate in the exchange (see Box AIV2).
THE FUND’S LENDING FRAMEWORK AND SOVEREIGN DEBT—ANNEXES
98 INTERNATIONAL MONETARY FUND
Box AIV2. Central Bank Liquidity Provision in Past Reprofiling Cases
In general, central banks provide liquidity to banks subject to eligible collateral and appropriate
haircuts. Banks need to be solvent to have access to central bank liquidity (varying maturities and
frameworks). If banks lose eligible collateral, they can often gain access to Emergency Liquidity Assistance
(ELA) with a wider pool of collateral accepted. But this is typically more expensive and with more conditions
attached, given the higher level of credit risk for the central bank.
A debt reprofiling would immediately affect the regular central bank liquidity provision. A debt
reprofiling typically leads to a Selected Default (SD) rating of the affected sovereign debt securities, which
cease to be eligible for regular central bank liquidity. Banks will then have to access ELA until the bond
exchange is successfully completed and the SD rating is lifted. Past experience from some successful debt
reprofiling episodes indicates that the duration of the SD tends to be rather short: 0.2 months in Cyprus (July
2013), 0.5 months in Uruguay (May 2003), and 0.7–1.3 months in Jamaica (2010, 2013), with Pakistan (July
1999) an outlier at 11 months.1 Even in the Greek debt restructuring case in March 2012 the SD rating only
lasted 2¼ months. So the length of ELA provision during a debt reprofiling SD can be typically minimized
unless other factors are at play (e.g., bank collateral scarcity or bank solvency concerns).
The central bank liquidity provision framework in past debt reprofiling cases has been
heterogeneous:
Cyprus (2013): At the time of the debt reprofiling in June 2013, the affected Cypriot banks already had only
liquidity access through ELA from the Central Bank of Cyprus and not the ECB and Eurosystem. Thus, no ECB
and Eurosystem liquidity provision was involved. Even if prior to the bond exchange, Cypriot bank were
drawing regular ECB liquidity, ELA during the SD duration (0.2 months) would have been very short.
Jamaica (2010, 2013): In the case of these bond exchanges, the authorities set up a Financial Stability
Support Fund (FSSF) to help with any liquidity (with new bonds as collateral) and solvency support for
financial institutions that exchanged the majority of their sovereign holdings. For instance in the 2010
exchange, the FSSF was established to provide liquidity in case of external funding or deposits withdrawals,
or if assets under management were affected by the debt reprofiling (Grigorian and others, 2012). Financial
institutions qualified to access the FSSF if they at least exchanged 90 percent of their old bonds. Banks also
had access to the Bank of Jamaica temporary discount window subject to liquid collateral. Affected banks
were subject to a maximum liquidity maturity (6 months) or increased regulatory intervention. In the end, no
Jamaican bank has drawn on the FSSF liquidity support (IMF, 2013c).
Pakistan (1999): Following the bond exchange in December 1999, the State Bank of Pakistan provided
liquidity through its lender-of-last resort (LOLR) discount window and also offered liquidity through its
regular open market operations (though there was no take up in the immediate months after the exchange).
There was no destabilizing impact on the domestic banking sector after the bond exchange.
Uruguay (2003): In the May 2003 bond exchange, the central bank only allowed new bonds as eligible
collateral, thus encouraging domestic banks to participate in the debt reprofiling (IMF, 2003). Prior to the
exchange, the central bank announced that old bonds would no longer be eligible for liquidity assistance.
The old bonds were effectively deemed not-marketable, which would have penalized the banks’ provisioning
and capital adequacy ratios, had they failed to participate in the exchange.
__________________________________
1Pakistan’s sovereign debt was downgraded to selective default in January 1999 because of external arrears accumulated in late
1998. A rescheduling agreement with the Paris Club—reached in January 1999—compelled the Pakistan government to seek
comparable treatment with its private external creditors. The Eurobond exchange was completed in December 1999, with an
upgrade in sovereign rating.

THE FUND’S LENDING FRAMEWORK AND SOVEREIGN DEBT—ANNEXES
INTERNATIONAL MONETARY FUND 99
Box AIV3. Accounting Treatment of Bank Holdings of Government Bonds
The impact of changes in bond valuations on a bank’s balance sheet depends on the account in which
the securities are held. In general, banks’ balance sheets are directly impacted from valuation changes in
their trading sovereign portfolios, while a prudential filter on Available-for-Sale (AFS) securities excludes a
regulatory capital impact (in Basel II), and HTM securities are not marked to market.
Trading Portfolio
Banks have to mark-to-market (MTM) their trading book, typically on a daily basis, affecting their
regulatory capital calculation, via the profit & loss (P&L) account. Thus, if a bank has not already
divested its trading holdings of sovereign bonds by the time of a reprofiling, it would stand to make MTM
gains following the exchange, as yields have usually fallen after past cases of maturity extensions (partially
compensating for any MTM losses prior to the reprofiling).
Available for Sale (AFS) Portfolio
For AFS sovereign securities, unrealized gains and losses are taken to OCI (Other Comprehensive
Income), which is excluded from the capital calculation via a prudential filter in Basel II. This avoids
swings in capital from, for example, large changes in yields. If, as part of an impairment test, a bank assesses
that there is objective evidence that an AFS sovereign asset has become impaired, impairment losses are
recorded in P&L and the cumulative losses that have been recognized in OCI are recycled to P&L (subject to
certain criteria) and would therefore impact capital. The impairment loss can be reversed if, after recognizing
the loss, the fair value of the AFS sovereign asset increases. As a general matter, it is not clear if a reprofiling
would be treated as an impairment event, although the cases reviewed in this annex show that in practice it
has not been treated as such (Cyprus, Jamaica).1
While the prudential filter for AFS is to be phased out under Basel III, the European CRDIV/ CRR
allows an exemption. Basel III eliminates the prudential filter with a 20 percent phase-in period a
year. Thus, after the phase-in period, banks’ regulatory capital could be subject to swings. However, the
European CRDIV/CRR legislation introduced an exemption that allows national discretion to maintain the
prudential filter so that banks’ common tier 1 capital from the exposure to central government securities will
not be subject to any unrealized gains and losses.2 Some EU countries such as Ireland or Italy already
allowed their banks to keep the AFS prudential filter under Basel III.
Held to Maturity (HTM) Portfolio
HTM sovereign securities are held as longer-term investments, and thus are not marked-to-market.
Similar to AFS, HTM securities are also subject to an accounting impairment test. Any impairment loss
recognition and measurement would happen for fair presentation of financial statements at reporting date
(e.g., quarterly or yearly). For both AFS and HTM, incurred impairment losses are taken to the P&L and
directly affect capital. As mentioned above, only market fluctuations for AFS are taken to OCI and recycled
(due to the prudential filter) when there are impairment losses.
In certain conditions, reclassifications from AFS into HTM are allowed. For instance, during the global
financial crisis in October 2008, international accounting standards (IAS 39/ IFRS 7) were amended. As
a consequence, many bank supervisors allowed their banks to reclassify their sovereign assets. For example,
the Turkish bank regulator in October 2008 allowed domestic banks to reclassify on a one-time basis their
AFS securities to HTM, thereby avoiding the need for mark-to-market pricing and recording capital write-
downs when securities prices fall. Philippines allowed a similar one-time reclassification during the 2008
crisis. In contrast, there are conditions by which a HTM security would have to be reclassified as AFS and re-
measured at fair value.3

THE FUND’S LENDING FRAMEWORK AND SOVEREIGN DEBT—ANNEXES
100 INTERNATIONAL MONETARY FUND
Box AIV3. Accounting Treatment of Bank Holdings of Government Bonds (concluded)
If domestic banks hold sovereign bonds as HTM and those are then reprofiled before maturity, there
has been flexibility in practice as to whether banks were able to keep them as HTM or had to classify
them as AFS and re-measure them at fair value. According to paragraph 9 in IAS39, a bank that has sold
or re-classified a sizable amount of HTM before maturity during the current financial year or the previous
two financial years is not allowed to classify any financial assets as HTM. Importantly, there are exceptions if,
for instance, the sale or re-classification of the HTM security occurs close to the maturity date (e.g., three
months), the bank has already collected the significant amounts of the original principal through schedule
payments or prepayments, or they are related to an “isolated event that is beyond the entity’s control, is
nonrecurring and could not have been reasonably anticipated by the entity.”
Overall, there appears to be some accounting scope during a debt reprofiling episode (including
potential forbearance) for a bank not to move its HTM securities to AFS and re-measure at fair value.
This can occur if the debt reprofiling happens just before the maturity date (as e.g., in the case of Cyprus in
2013), or if the bank deems the reprofiling as an isolated and unforeseen event. Forbearance could occur as
a result of (i) an objective assessment at the level of the bank (as part of an impairment test and following
evidence); (ii) a captive auditor or (iii) regulatory rules that might facilitate it. For instance, the 100 percent
risk-weight on FX bonds during the 2010 Jamaica bond exchange was phased-in during a 2-year period.
Even if banks keep the sovereign debt as HTM following the bond exchange, an impairment test based on
objective evidence would eventually indicate that the bank would need to provision if bond prices are well
below the par value. Overall, it is fair to say that a reprofiling will not per se require a reclassification.
___________________________
1The relevant accounting references are made in IAS 39: “The cumulative loss that had been recognized in OCI shall be
reclassified from equity to P&L…,” when there is objective evidence that the AFS asset is impaired. Furthermore, “if, in a
subsequent period, the FV of a debt instrument classified as AFS increases, and the increase can be objectively related to an
event occurring after the impairment loss was recognized in P&L, the impairment loss shall be reversed, with the amount of the
reversal recognized in P&L.”
2The CRR article 467 allows the ASF prudential filter. The forthcoming new accounting rules IFRS 9 are still unclear whether the
AFS category will be eliminated or kept in some form.
3According to IAS39, Article 51, “if, as a result of a change in intention or ability, it is no longer appropriate to classify an
investment as held to maturity, it shall be reclassified as available for sale and re-measured at fair value, and the difference
between its carrying amount and fair value shall be accounted for.”

THE FUND’S LENDING FRAMEWORK AND SOVEREIGN DEBT—ANNEXES
INTERNATIONAL MONETARY FUND101
Box AIV4. Banking Sector Developments in Greece during the Crisis1
The Greece experience showed that a bailout does not necessarily insulate the domestic financial
system. The banking system was perceived to be relatively sound when the Stand-by Arrangement program
began in May 2010. The bank capital ratio was 11.7 percent, aided by a recapitalization in 2009, but balance
sheets came under pressure from higher nonperforming loans (NPLs) once the economy weakened.
Moreover, liquidity conditions tightened in 2009 due to banks losing wholesale market access and some
deposit outflows.
As the recession intensified and liquidity tightened, the Greek financial sector became increasingly
vulnerable. Financial sector distress was a result of the protracted recession and sovereign debt problems.
By 2011, deleveraging in the financial sector and restructuring of state-owned banks was perceived as
necessary. ATE, the largest state-owned bank and the only Greek bank to fail the Europe-wide stress tests in
mid-2010, had to be recapitalized. Sizable deposit outflows began in the second half of 2011, fanned by
fears of a Greek euro exit.
The ECB provided substantial and extraordinary liquidity support. From May 2010, the ECB suspended
the link between sovereign credit ratings and eligibility of collateral for refinancing operations and
intervened directly in the government bond market under the Securities’ Market Program (SMP). The ECB
also began to accept uncovered bank bonds guaranteed by the government as collateral eligible for
refinancing operations.
As expected, the debt restructuring eliminated the banks’ capital but appropriate remedial measures
were implemented under the program. Greek banks were heavily exposed to the sovereign, holding
government bonds with a book value of about €40 billion (after some initial June 2011 impairments). By
contrast, core capital was €22 billion, or about the same magnitude as the capital needs arising from the
Private Sector Involvement (PSI). Only €1.5 billion was drawn from the Hellenic Financial Stabilization Fund
(HFSF) during the SBA-supported program, but the banks’ capital needs subsequently dwarfed the HFSF
provision. As of the fourth review, the purpose of the HFSF changed from a means of topping up capital for
banks that had tried and failed to raise private capital to providing a substantial injection of public funds for
banks that had been severely affected by the PSI and the deep recession: the amount needed for the HFSF in
the context of the EFF was estimated at €50 billion.
__________________________________
1This discussion is based on IMF (2013b).

THE FUND’S LENDING FRAMEWORK AND SOVEREIGN DEBT—ANNEXES
102 INTERNATIONAL MONETARY FUND
References
Grigorian, D. A, T. Alleyne, and A. Guerson, 2012, “Jamaica Debt Exchange,” IMF Working Paper
12/244 (Washington: International Monetary Fund).
International Monetary Fund, 2013a, “Cyprus: First Review under the Extended Arrangement under
the Extended Fund Facility,” IMF Country Report 13/293 (Washington).
———, 2013b, “Greece: Ex Post Evaluation of Exceptional Access under the 2010 Stand-By
Arrangement,” IMF Country Report 13/156 (Washington).
———, 2013c, “Jamaica: Request for an Extended Arrangement under the Extended Fund Facility,”
IMF Country Report 13/126 (Washington).
———, 2003, “Uruguay: Article IV Consultation and Third Review Under the Stand-By
Arrangement—Staff Report,” IMF Country Report 03/247 (Washington).
———, 2001, “Pakistan: 2000 Article IV Consultation and Request for a Stand-By Arrangement—
Staff Report,” IMF Country Report 01/24 (Washington).

THE FUND’S LENDING FRAMEWORK AND SOVEREIGN DEBT—ANNEXES
INTERNATIONAL MONETARY FUND103
ANNEX V: POTENTIAL GAINS FROM SLOWER FISCAL
CONSOLIDATION77
Compared to a bailout, reprofiling can expand the near-term financing envelope for a country in
distress and allow for a more gradual pace of fiscal consolidation. To the extent that fiscal multipliers
are higher in the early stages of a crisis, slower fiscal consolidation may lead to significant benefits for
the country.
76. For countries in debt distress, shortfalls in financing can often force frontloaded
adjustment with adverse effects on output. In debt crises, the IMF often acts as a lender of last
resort to help countries meet their financing needs. Oftentimes, however, the size of the program
and the Fund’s catalytic role are on their own insufficient to meet the obligations coming due. At the
beginning of the crises, financing shortfalls are further exacerbated when private creditors decide
not to roll over their lending. In such circumstances, Fund resources can be used to pay out exiting
creditors while the country must undertake large fiscal adjustments to close the remaining financing
gaps. Given an already vulnerable economic outlook, such adjustments will often further deepen the
recession.
77. Debt reprofiling as an alternative to bailing out creditors can expand the near-term
financing envelope for a country in distress and allow for a more gradual pace of fiscal
consolidation. Maturity extensions on bonds falling due in addition to IMF financing can be
significant in relieving the financing pressure and could allow for a more gradual fiscal adjustment
path. This technical annex provides a framework for assessing the potential benefits of reprofiling
exclusively in reference to allowing for a more gradual pace of fiscal consolidation.78
A stylized
calibrated model of output, fiscal policy and debt accumulation is used to illustrate the tradeoff
between a frontloaded and a more gradual fiscal adjustment path.
78. The rationale for slowing the pace of consolidation relies on the fact that fiscal
multipliers are likely to be higher during a crisis. Recent empirical research (Auerbach and
Gorodnichenko, 2013) suggests that fiscal multipliers vary with the economic cycle. In particular,
multipliers tend to be higher during recessions and in periods of negative output gaps when the
economy operates below potential. One possible reason is that during severe crises, monetary policy
77
Prepared by Damiano Sandri (RES) and Suchanan Tambunlertchai (SPR).
78The implications for debt reprofiling for financial markets, including contagion, are analyzed in other Annexes.

THE FUND’S LENDING FRAMEWORK AND SOVEREIGN DEBT—ANNEXES
104 INTERNATIONAL MONETARY FUND
can become less effective in responding to fiscal policy shocks, for example due to the zero lower
bound problem.
79. A slower pace of consolidation may thus be beneficial since it postpones part of the
fiscal adjustment to a point in time when multipliers will be lower. Delaying fiscal consolidation
provides an immediate benefit to the country since it leads to a temporary increase in GDP.
However, it also requires greater consolidation in the future that weighs on medium-term GDP. If
fiscal multipliers are constant over time, the short-term increase in GDP is exactly offset by the GDP
contraction over the medium-term and there are no net benefits for the country. But if fiscal
multipliers are higher in the early stages of a crisis, postponing consolidation generates an overall
increase in GDP since the fiscal consolidation is achieved under lower average multipliers.
80. The gains from slowing fiscal consolidation are magnified by the presence of
hysteresis effects. The notion of hysteresis captures the fact that a temporary underutilization of
productive resources may feed into a permanent reduction in potential output. For example, a crisis
that determines a temporary increase in unemployment may induce some unemployed to drop out
of the labor force. In this regard, a slower path of fiscal consolidation that reduces the negative
output gaps has the potential to limit hysteresis effects and deliver higher potential growth.
81. The gains from smoother adjustment may go beyond the increase in GDP. A smoother
path for consolidation may help prevent many of the other dislocations that are typically associated
with sharp fiscal consolidations: lack of program ownership, political and social unrest, abrupt
dislocations in the economy as public services are cut. Although some of these economic costs
could be captured as lost output, the model does not fully account for their potential significant
disruptions.
82. The annex is organized as follows. Section A presents the model while section B describes
the calibration. Section C presents the results and discusses some caveats to the analysis.
A. Model
83. In this model of the economy, output evolves according to potential growth.
Deviations from this underlying path are due to fiscal policies and demand shocks. The output level
is given by:
where Pt is potential GDP,

THE FUND’S LENDING FRAMEWORK AND SOVEREIGN DEBT—ANNEXES
INTERNATIONAL MONETARY FUND105
Γt is the output gap defined as the difference between actual and potential GDP,
ρ controls the persistence of the output gap,
μt is the fiscal multiplier which varies over time, depending on the output gap,
St is the primary structural balance, and
εt represents demand shocks which are used to match the model with baseline data.
84. Potential GDP evolves according to an underlying potential growth rate net of
hysteresis effects. The assumption on hysteresis implies that output gaps can have a permanent
effect on the economy’s potential, for example because depressed economic activity leads to older
capital equipment being scrapped and limited new capacity being installed. The equation below
describes the dynamics of potential GDP:
where Gt+1 is the gross growth rate of potential GDP and h captures the strength of hysteresis.
85. The primary fiscal balance evolves as follows:
where τ captures the elasticity of the fiscal balance to the output gap. And the stock of debt is given
by:
where R is the real interest rate.
B. Calibration
86. The starting point of the model is calibrated to reflect the evolution of a typical crisis
country with a Fund program. The calibration point relies on six years of actual and projected data
for ten exceptional access cases between 2009 and 2013, starting with the onset of distress, the
program request, and five years after the outbreak of the crisis.79
79
These countries are Armenia, Belarus, Greece, Ireland, Jordan, Portugal, Romania, Sri Lanka, St. Kitts and Nevis, and
Ukraine. The sample excludes the Maldives and Mongolia, which were PRGT-eligible countries that had exceptional
access GRA programs.

THE FUND’S LENDING FRAMEWORK AND SOVEREIGN DEBT—ANNEXES
106 INTERNATIONAL MONETARY FUND
Table AV1 shows the average initial conditions across these countries. The variables form the
“baseline” scenario in which the distressed country undertakes strong fiscal adjustments in the first
years of the crisis.
Table AV1. Average Initial Conditions in Countries with Exceptional Access Programs
Sources: WEO; and Fund staff calculations.
Note: Time t0 is the year of program request. The last year of actual data is 2013. Programs starting in 2009, therefore, have
actual data up until t4. Later programs have 1–3 years of projection.
87. After t4, output, potential output, and debt follow the dynamics of the model. Starting
at t5, the primary structural balance stabilizes at 1.5 percent of potential GDP; potential growth and
the real interest rate are, respectively, set to 2 percent and 2.5 percent; and demand shocks go to
zero. These variables drive the dynamics of the other variables in the model going forward, as
described in Section A. The calibration of other parameters in the model are described in Table AV2.
The strength of hysteresis follows from Delong and Summers (2012). The persistence of the output
gap and the elasticity of the primary balance with respect to output gap are estimated from the
countries used to construct the baseline scenario.
88. Following the literature, the fiscal multiplier is assumed to be larger in economic
recessions than in economic expansions.80
When the output gap is zero or positive, the economy
is at full employment and thus fiscal expansion will have only a small impact on the economy. This is
also a consequence of the fact that monetary policy operates to stabilize the cycle and offset fiscal
shocks. A negative output gap, on the other hand, creates scope for higher fiscal multipliers. In
particular, a deep recession that pushes nominal rates close to the zero lower bound limits the
ability of monetary policy to counterbalance the contractionary effects of fiscal consolidation. In this
annex, the fiscal multiplier varies nonlinearly with the output gap, ranging between 0.25 and 1.5, as
shown in the bottom left chart of Figure AV1.
80
Auerbach and Gorodnichenko (2011); Woodford (2011); Christiano and others (2011); Blanchard and Leigh (2013).

THE FUND’S LENDING FRAMEWORK AND SOVEREIGN DEBT—ANNEXES
INTERNATIONAL MONETARY FUND107
Table AV2. Calibrated Parameters
Persistence of the output gap 0.5 Growth of potential GDP from t5
onwards 1.02
Hysteresis in the output gap 0.1 Real interest rate from t5 onwards 1.025
Elasticity of primary balance with
respect to output gap 0.48 Intertemporal discount factor 1/R
C. Results
89. The analysis compares the frontloaded fiscal consolidation under the baseline with a
more gradual adjustment path (first row of Figure AV1). As illustrated in the top right chart of
Figure AV1, both consolidation paths bring debt down to 75 percent of GDP in fifteen years. In the
baseline scenario, the country undergoes an initial fairly sharp tightening of the structural primary
balance. The gradual adjustment scenario assumes a more moderate tightening in the first few years
of the crisis which must be later compensated by some additional consolidation to ensure that the
debt ratio comes back down to the baseline level. Benefits from a more gradual pace of fiscal
consolidation are reflected in gains in the present discounted value of GDP over the baseline
scenario as well as a permanent end-point increase in potential GDP due to hysteresis effects.
90. With the more gradual adjustment, GDP growth is preserved at a higher level and the
output gap is smaller in the first years of the crisis (second row of Figure AV1). By containing
the size of the negative output gap in the early stages of the crisis, delaying consolidation also
reduces the fiscal multiplier that in these simulations varies with the output gap (bottom right
panel). This in turn reduces the costs of fiscal consolidation and supports GDP within a beneficial
virtuous circle. However, the additional consolidation required during the medium term to bring the
debt-to-GDP ratio back to the baseline level triggers an opposing vicious cycle of larger negative
output gaps and moderately higher fiscal multipliers.
91. Gradual fiscal consolidation leads to an overall increase in GDP and permanently
higher potential GDP (third row of Figure AV1). The gains from slowing consolidation are
through the increase in the present discounted value of GDP relative to the baseline (third row, left
panel). Delaying consolidation leads to an increase in GDP by more than 0.5 percent during the first
5 years. This increase is partly reversed in the subsequent years when extra consolidation is need,
but it remains positive (at 0.15 percent) over the first 15 years. Furthermore, a more gradual pace of
consolidation has beneficial effects on potential GDP (third row, right panel) since it reduces

THE FUND’S LENDING FRAMEWORK AND SOVEREIGN DEBT—ANNEXES
108 INTERNATIONAL MONETARY FUND
negative output gaps and thus the associated negative hysteresis effects. After 15 years, potential
GDP is 0.1 percent higher than under the baseline. Importantly, this is a permanent gain.
92. A more gradual pace of fiscal consolidation involves a temporary increase in the debt-
to-GDP ratio. The top right chart of Figure AV1 shows that the delay in fiscal consolidation can lead
to a slight increase in the debt-to-GDP ratio during the medium-term, before convergence toward
the baseline path begins. Importantly, this increase can persist beyond the 2–3 year horizon under
reprofiling.81
While this temporary increase in debt reflects a more gradual fiscal adjustment and is
beneficial for the country—it increases overall GDP and should thus be perceived as a beneficial
development—it may pose challenges to countries that are dealing with particularly high debt
levels. In any case, this increase remains limited, less than 10 percentage points of GDP.
93. The results are consistent with the existing literature—the case for delayed adjustment
is strongest when fiscal multipliers are higher at times of crisis and hysteresis effects are
present. Batini, Callegari and Melina (2012) use regime-dependent fiscal multipliers and find that
smooth and gradual fiscal consolidation is preferable than an up-front fiscal consolidation when
output is already contracting. Similarly, Bi, Qu, and Roaf (2013) find that for a highly indebted
economy, hysteresis and time-varying multipliers are important elements in the case for gradual
adjustment.
94. Whether delaying fiscal consolidation is beneficial requires a case-by-case assessment.
The model simulations have been based on the assumption of fiscal multipliers being larger when
the economy operates below potential and on a baseline scenario that involves a large negative
output gap. Under alternative conditions, for example in crises that initiate during periods of
overheating and positive output gaps, delaying consolidation may actually be counterproductive.
Furthermore, a delayed path of consolidation requires that the country is able to commit to greater
fiscal adjustment over the medium term. Whether this is a tenable assumption crucially depends on
country-specific characteristics.
81
This raises the issue of whether a relative short debt reprofiling—for example, that pushes all maturities out by only
1 to 3 years—is able to generate the financing space required by delayed fiscal consolidation over the medium term.
The amount of fiscal space generated by reprofiling and whether it is concentrated over the short of medium term
depends on the maturity structure of the country.

THE FUND’S LENDING FRAMEWORK AND SOVEREIGN DEBT—ANNEXES
INTERNATIONAL MONETARY FUND109
Figure AV1. Simulations of Frontloaded and Gradual Fiscal Adjustments
Source: Fund staff calculations.
-4
-3
-2
-1
0
1
2
3
4
-4
-3
-2
-1
0
1
2
3
4
0 5 10 15Years
Output gap(percent)
0.0
0.1
0.2
0.3
0.4
0.5
0.6
0.0
0.1
0.2
0.3
0.4
0.5
0.6
0 5 10 15Years
Potential GDP under gradual consolidation(percentage increase relative to baseline)
0.0
0.1
0.2
0.3
0.4
0.5
0.6
0.0
0.1
0.2
0.3
0.4
0.5
0.6
0 5 10 15Years
Cumulative discounted GDP under gradual consolidation(percentage increase relative to baseline)
-3
-2
-1
0
1
2
3
4
-3
-2
-1
0
1
2
3
4
0 5 10 15Years
GDP real growth rate(percent)
-8
-6
-4
-2
0
2
4
-8
-6
-4
-2
0
2
4
0 5 10 15Years
Baseline
Gradual consolidation
Cyclically adjusted primary balance(percent of potential GDP)
0
10
20
30
40
50
60
70
80
90
100
0
10
20
30
40
50
60
70
80
90
100
0 5 10 15Years
Government debt(percent of GDP)
0.0
0.2
0.4
0.6
0.8
1.0
1.2
0.0
0.2
0.4
0.6
0.8
1.0
1.2
0 5 10 15
Years
Fiscal multiplier
0.0
0.2
0.4
0.6
0.8
1.0
1.2
1.4
1.6
0.0
0.2
0.4
0.6
0.8
1.0
1.2
1.4
1.6
-4 -3 -2 -1 0 1Output gap (%)
Assumption about fiscal multiplier

THE FUND’S LENDING FRAMEWORK AND SOVEREIGN DEBT—ANNEXES
110 INTERNATIONAL MONETARY FUND
References
Auerbach, Alan, and Yuriy Gorodnichenko, 2012, “Fiscal Multipliers in Recession and Expansion,” in
Fiscal Policy after the Financial Crisis, chapter 2, p. 63-98, Alberto Alesina and Francisco
Giavazzi (eds.), University of Chicago Press.
Batini, Nicoletta, Giovanni Callegari, and Giovanni Melina, 2012, “Successful Austerity in the United
States, Europe, and Japan,” IMF Working Paper No. 12/190 (Washington: International
Monetary Fund).
Bi, Ran, Haonan Qu, and James Roaf, 2013, “Assessing the Impact and Phasing of Multi-year Fiscal
Adjustment: A General Framework,” IMF Working Paper No. 12/182 (Washington:
International Monetary Fund).
Blanchard, Olivier, and Daniel Leigh, 2013, “Growth Forecast Errors and Fiscal Multipliers,” IMF
Working Paper No. 13/1 (Washington: International Monetary Fund).
Christiano, Lawrence, Martin Eichenbaum, and Sergio Rebelo, 2011, “When is the Government
Spending Multiplier Large?” Journal of Political Economy 119(1), pp. 78–121.
Delong, Bradford, and Lawrence Summers, 2012, “Fiscal Policy in a Depressed Economy,” Brookings
Papers on Economic Activity, Spring 2012: pp. 233–97.
Woodford, Michael, 2011, “Simple Analytics of the Government Expenditure Multiplier,” American
Economic Journal: Macroeconomics 3(1), pp. 1–35.

Press Release No. xx/xxx
FOR IMMEDIATE RELEASE
June xx, 2014
IMF Executive Board Discusses the Fund’s Lending Framework and Sovereign Debt
The Executive Board of the International Monetary Fund (IMF) discussed on June 13, 2014 a
staff paper on “The Fund’s Lending Framework and Sovereign Debt—Preliminary
Considerations.”
The staff paper follows up on the Executive Board’s guidance to Fund staff in May 2013,
which stemmed from an earlier staff paper: Sovereign Debt Restructurings–Recent
Developments and Implications for the Fund’s Legal and Policy Framework. That paper
reviewed the recent application of the Fund’s policies and practices on sovereign debt
restructuring and identified a number of issues for further in-depth study. The Board agreed
in May 2013 these issues required follow-up work and asked staff to present options for
reforming the Fund’s policy framework in each of the identified areas.
The latest staff paper focuses on the first of the identified issues: the relationship between the
Fund’s lending framework and sovereign debt vulnerabilities and, in that context, provides
preliminary views regarding a possible direction for reform. The primary focus of the paper
relates to the design of the Fund’s exceptional access policy (governing access above the
normal financing limits). The preliminary considerations in the paper maintain a market-
based approach and would envisage amending the Fund’s lending framework to make it
more flexible and calibrated to members’ debt situations. A complementary paper will be
issued to the Executive Board soon on considerations regarding contractual provisions to
address collective action problems in the context of debt restructuring.
International Monetary Fund
Washington, D.C. 20431 USA

2
Executive Board Assessment1
Executive Directors welcomed the opportunity to discuss a possible direction for
reform of the Fund’s lending framework in the context of sovereign debt vulnerabilities.
They emphasized the preliminary nature of the discussion and welcomed staff plans to
consult further with key stakeholders, including market participants. Directors appreciated
staff efforts to find the right balance among different goals, including ensuring pragmatism
and case-by-case flexibility, addressing moral hazard, safeguarding Fund resources, and
preserving the catalytic role of the Fund.
Directors noted that the exceptional access framework established in 2002 sought to
ensure that Fund lending contributed to the satisfactory resolution of a member’s debt
problems, thereby addressing concerns that had arisen regarding the cost of delaying the
restructuring of unsustainable debt and moral hazard in sovereign debt markets. They
stressed that these objectives should remain central to the Fund’s lending framework. Most
Directors recognized, however, that the 2002 framework had posed some undue constraints
on the Fund’s ability to respond to a member’s debt problems in the least costly manner.
Most Directors welcomed efforts to further explore the possible direction of reforms
that would broaden the range of policy responses under the exceptional access framework to
deal with a member’s sovereign debt distress. These Directors saw merit in an approach
whereby the Fund would be able to provide exceptional access to a member on the basis of a
debt reprofiling that would involve a limited extension of maturities, normally without any
reduction of principal or interest, in circumstances where (a) the member has lost market
access and (b) debt is assessed to be sustainable but not with high probability. While further
analysis would still be needed on the operational implications and market impact, these
Directors noted that a debt reprofiling would generally be less costly to the debtor and
creditors, relative to an upfront debt reduction. They also considered that such an approach
would allow for credible, yet less constrained, economic adjustments that accordingly have a
greater chance of securing debt sustainability for the benefit of not only the debtor but also its
creditors. A few Directors, noting the operational difficulty in judging if both conditions for
reprofiling have been met and the risk that the reprofiling expectation could trigger market
volatility, preferred to maintain the current framework, which they considered more
pragmatic and flexible.
Most Directors stressed that there should be no presumption that a reprofiling of debt
would be required simply because a member seeks Fund support, and that staff would need to
exercise judgment in determining cases where a reprofiling would be called for, taking
account of members’ specific circumstances. Directors underscored that, as required by
exceptional access procedures, it would be important that staff seek guidance from the
1An explanation of any qualifiers used in summings up can be found here:
http://www.imf.org/external/np/sec/misc/qualifiers.htm.

3
Executive Board regarding these judgments prior to initiating discussions on an exceptional
access arrangement.
Directors shared the view that a debt reprofiling would be inappropriate in
circumstances where a member’s debt is unsustainable, in which case an upfront debt
reduction should be pursued, as under current policy. Most Directors also considered it
inappropriate to repeat reprofilings where subsequent developments warrant more definitive
action involving debt reduction, although a few would not rule out circumstances where
repeat reprofilings might be justified.
With the introduction of reprofiling as an additional tool, if the Board so decides,
many Directors favored removing the systemic exemption to the exceptional access
framework, which had raised concerns about inequity and moral hazard associated with a
large scale bail-out. A number of Directors were open to further discussion on this issue
following more in-depth analysis and further consultations. Some others preferred to retain
the systemic exemption, which in their view is a pragmatic way to safeguard financial
stability in an increasingly integrated world and to avoid the perception of lack of
evenhandedness. Directors underscored that for the Fund to remain in a position to address a
member’s balance of payments crisis in the presence of contagion risks, credible, effective
alternatives must be put in place to address debt sustainability concerns, possibly including
assurances of concessional support by other official creditors. Directors asked staff to consult
further with relevant stakeholders on possible approaches to managing contagion before
making concrete proposals.
Directors underlined the importance of adequate creditor support for a market-based
reprofiling, if pursued. This could be facilitated through meaningful engagement with
creditors, including an explanation of the assumptions that underpin the member’s debt
sustainability analysis while respecting the confidentiality of sensitive information. Directors
noted that official creditors would be expected to maintain their exposure during the
reprofiling period.
Directors also offered preliminary views on the length of the reprofiling period, the
scope of debt, and implications of reprofiling for existing programs and for normal access
programs. These issues will be considered in more detail in a follow-up paper.
In concluding the discussion, Directors asked staff to undertake further work along
the lines of the preliminary considerations in this paper, analyze market impacts of different
options, and examine in more detail design and implementation issues pertaining to a debt
reprofiling, reflecting on the lessons from recent cases and the issues raised by Directors
today. They looked forward to a follow-up paper further elaborating on these issues, as well
as forthcoming work on addressing collective action problems, official sector involvement,
and the lending-into-arrears policy, as identified in the May 2013 Board discussion.
Related Documents