School of Business & Public Management IBI – The Institute of Brazilian Issues Minerva Program Spring 2014 The Fiscal Policy to Attract Investments to the State of Pernambuco – Socioeconomic Impacts José da Cruz Lima Júnior Advisor: Professor Reid Click Washington DC April, 2014

Welcome message from author
This document is posted to help you gain knowledge. Please leave a comment to let me know what you think about it! Share it to your friends and learn new things together.
Transcript

School of Business & Public Management
IBI – The Institute of Brazilian Issues
Minerva Program
Spring 2014
The Fiscal Policy to Attract Investments to the
State of Pernambuco – Socioeconomic Impacts
José da Cruz Lima Júnior
Advisor: Professor Reid Click
Washington DC
April, 2014

Acknowledgements
I am grateful to the Institute of Brazilian Issues – IBI and to the George
Washington University - GWU, especially Professor Dr. James Ferrer and to Mr.
Kevin Kellbach, and their assistants for the opportunity to study and improve my
knowledge on Economics, International Trade and Public Finance.
I am thankful to the Finance Secretariat of Pernambuco State, especially
the Secretary Paulo Câmara and the Executive Secretary Oscar Victor, for the
opportunity they have granted to participate in the Minerva Program and for the
financial support, and also the Law Adviser Nilo Otaviano for his decisive
encouragement.
I woud like to acknowlegde the help ant support to my friends and
colleagues, Cosme, Elisângela Araújo, Elízia Romão, Eneida e Diana Ende,
Fausto Pereira, Fernando Coelho, Francisco Sebastião, Zé Luiz, Joseli, Luís
Henrique Loureiro, Manoel Vasconcelos, Marcelo Barros, Márcio Lins, Marília
Lins, Miguel Marcon, Mona Ligia, Paulo Guaragna, Roberto Arraes and
Valdeblan for their incentive and unconditional support.
I also thank my advisor Prof. Reid Click for his guidance and contribution
in this study, my English Professor Alex for his language support, and my
classmates from the Minerva Program for their friendship along this course,
especially Celina Melo, João Maluf e Jorge Dantas. Finally, my eternal gratitude
to God, to my family for their encouragement, especially to my mother Ana
Maria for her prayers, my sons Tiago and Guilherme and my stepson Danilo for
the loving support and my beloved wife Paula for her faith she had in me even
more than I had myself. It was because of all of then I was able to accept and
honor this challenge.
Table of Contents
Introduction .............................................................................................. 5
1 - Fiscal war and Federalism ................................................................ 10
1.1 The Debate on Fiscal Federalism................................................. 10
1.2. Federalism and Fiscal Competition ............................................. 11
1.3 Fiscal Competition in Brazil as Autonomous Development Policy 14
1.4 Concluding Remarks on the Federation Debate .......................... 19
2 - Pernambuco Tax Incentive Programs – Legal Framework ............... 21
2.1 Development Program of the State of Pernambuco – PRODEPE 21
2.1.1 Priority Industrial Clusters ...................................................... 21
2.1.2 Special Industries Clusters .................................................... 23
2.1.3 Relevant Activities ................................................................. 23
2.1.4 Industrial Activities Which Are Not Entitled PRODEPE .......... 24
2.2 Stimulus to Wholesale Trade and Importers of Goods ................. 24
2.3 Fostering Central Distribution ....................................................... 25
2.4 Programs of Incentives by Sector................................................. 26
3 - The Effects of Tax Incentives in the Economy of Pernambuco ......... 28
4 - The New Economy of Pernambuco and National Indicators ............. 41
4.1 GDP Growth (Gross Domestic Product), according to IBGE ........ 41
4.2 Growth of Industrial output according to IBGE ............................. 47
4.3 Retail growth, according to IBGE ................................................. 48
4.4 Unemployment Rate of Major metropolitan areas, according to
IBGE ............................................................................................................. 48
4.5 Growth of Revenue from ICMS, according to Confaz ................... 49
4.6 International Trade Growth ........................................................... 51
4.7 Human Development Index .......................................................... 52
5 - Conclusion ........................................................................................ 54
5
Introduction
The neoliberal industrial policy adopted by capitalist countries reflected in
peripheral countries from the early 1980s, at which time these countries,
including Brazil, adopted the new model of industrial policy. This presented to
investors, the existence of a new variable - the granting of fiscal and financial
incentives - in the field of locational choice.
Given this new variable, and given the global conformation of
globalization, where the world is becoming closer and faster information flows,
companies tend to settle in places that offer greater competitive conditions. As a
result, the fiscal and financial incentives provided by governments have become
a differential for decision making for the entrepreneur, as to where to invest.
In Brazil, especially from 1994, units of the Federation, aware of this new
variable, started to offer individually, their own competitive advantages by
establishing financial and tax incentive schemes, using the main state tax, the
Tax Operations Relating to The Goods and Services (ICMS). This occurred as a
result of inadequate or sometimes even nonexistent national development
policies to deal with deep regional inequalities.
As a result of this investment attraction by each State, there has been a
fierce tax competition among the federating units, known as "fiscal war". This
phenomenon nowadays has reached such a high level that all states without
exception have demanded changes in the tax structure in the main state tax.
Because the ICMS is a tax with a high base, further expanded by the
1988 Constitution, it has allowed States to use as tools for their investment
attraction policy, various fiscal and financial instruments, such as the deferral,
the reduction of calculation base, the presumed credit and financial credit, with
direct and indirect consequences on tax collection.
This has triggered a process of non-compliance with various provisions
laid down in the federal constitution of 1988, the tax laws, especially state laws,
and the Fiscal Responsibility Law (FRL), in the frantic search for investments.
6
With regard to the attraction of investments policies adopted by the state
government of Pernambuco, it closely relate to the Keynesian perspective,
since it relies on state intervention to achieve development in the region. To
attract investment, Pernambuco is using a series of measures ranging from
granting specific benefits to companies that settle in the state, as well as
offering tax cuts, promoting works that help companies with logistics, especially
transportation infrastructure.
This has caused significant advances in the Pernambuco economy in
recent years, with an increased economic turnover in the state.
Public and private investments which are being advertised frequently,
mostly from the year 2007 aroused the interest of the market, motivated by the
increased movement of capital in the economy. Likewise, a large number of
news stories on the recent growth of Pernambuco, both in the media and in
political speeches. Preliminary data from the Brazilian Institute of Geography
and Statistics (IBGE) for the year 2012 rates Pernambuco as the tenth largest
economy in the country, according to the data of Gross Domestic Product
(GDP) of the Brazilian states (IBGE, 2013). The state became a unifying agent
of investments in Brazil. Many hatch evidence to justify the current
performance, and many point to the change that is occurring in the industrial
profile of the state. Industries that did not exist previously, such as oil, gas,
offshore and marine, are being implemented in the state greatly boosting supply
chains in the region. Thus, the gains go beyond the installation of these large
companies, especially in the development of whole production chains which
originate from these driving activities.
Apart from industrial output, other activities are being developed in the
state, especially in the sectors of trade, services, construction, education and
technology. In addition, major infrastructure projects are being implemented in
the state, highlighting the improvement in port and transport infrastructure.
Regarding the changes in port infrastructure in the state, the port complex of
SUAPE is the highlight, with new investments underway to expand its cargo
handling capacity and improve the existing structure. Many companies which
are installed in the SUAPE port complex will benefit directly, as well as those
7
that use the port as a production flow channel, but do not have production
plants within the complex. Although the SUAPE port complex represents an
aggregation center for investments, the government is working to diversify the
location of the plants. For this reason, the Development Program of
Pernambuco (PRODEPE) and other specific programs for certain sectors offer
different incentives that encourage the installation of companies outside the
Recife Metropolitan Region (RMR), like SUAPE. Generally speaking, the idea is
that government action is critical to the greater spatial balance of productive
activity. Therefore, this research seeks to determine through the observation of
indicators of socioeconomic development, how the performance of the state
government of Pernambuco, with regard to tax incentives, impacted in the
recent development of the state.
This process sparked interest in understanding the causes that led states
and, in particular, the state of Pernambuco, to take part so fiercely in this
competition to attract investment. It was established from here, the need to
develop an analysis of the historical process of economic and institutional
development of the Brazilian political system, and the debate about the fiscal
federalism, seeking to identify and correlate this competitive process with the
economic development policies that were adopted in the period that has
elapsed since its origin to the present day, in such an unsystematic and
punctual manner.
To this end, the study will consider the period from 2007 to 2012 (or 2013
whenever possible to get the data for this year), in which will be appreciated the
policies adopted for development and will also identify the characteristics and
the main tax instruments used in the industrial policy of the state government of
Pernambuco in order to attract investment. The economic effects and social
impacts will be measured by the socioeconomic indicators available. So the
work to be presented is intended to cover part of a gap on the subject, and also
awaken the leaders of the institutions to the importance of keeping data records
in order to be able to contribute to further scientific production, capable of
effectively measuring social and economic effects of the tax incentive programs
granted, in the context of a real national “auction”, in the welfare of the Brazilian
society, especially of Pernambuco.

8
This paper will define as its territorial framework of the analysis the State
of Pernambuco as the holder of the infrastructure able to offer comparative
advantages, which added to tax and financial benefits offered by the state
government, especially from the mid -1990s, were sufficient to attract investors,
who moved to this State.
Through direct access to the Brazilian Institute of Geography and
Statistics (IBGE), the State Bureau of Planning and Research -
CONDEPE/FIDEM Pernambuco, Institute of Applied Economic Research
(IPEA) sites, the Treasury of the State of Pernambuco (PE - SEFAZ) and the
Secretariat of Federal Revenue (SRF), relevant data used in this work include
Gross Domestic Product (GDP), Human Development Index (HDI), taxes and
product export value, aiming at achieving the specific objectives of this paper.
For a better understanding of these results, tables and graphs from
quantitative data will be prepared to illustrate:
a) total number of establishments involved;
b) quantity of projects approved;
c) unemployment variation;
d) exportation and importation variation;
e) collection of ICMS in municipalities in the programs;
f) Municipalities Participation Index (IPM) related to these cities;
g) evolution of the ICMS levied by the State;
h) HDI – Human Development Index variation.
From the data obtained, we wish to compare the state tax exempt and
the actually generated by the companies established in Pernambuco, the
number of settled facilities, and the volume of investment, and behaviors of
GDP, IPM and IDH, over the considered period.
In this way, the paper will attempt to investigate whether there was, in
fact, a significant growth of economic activities in the State of Pernambuco and,

9
consequently, an higher performance when compared to the States of Bahia
and Ceará, as well as to the Brazil as a whole, and a greater relative share of
Pernambuco GDP in the Brazilian GDP, or whether the desired objectives have
not been achieved, highlighting the need for improvement of such mechanisms
for the attraction of investments.
10
1 - Fiscal war and Federalism
1.1 The Debate on Fiscal Federalism
The aim of this chapter is not to provide more in-depth discussion of
fiscal federalism, since such a debate lies beyond the scope of this work. The
study will thus be limited to presenting the kernel of such discussions, as they
are being conducted by scholars and academics in terms of the link between
the issue of federalism and theoretical economic proposals.
First, it is worth noting that, for Prado (2006), federations are established
in a geographical space based the historical, social, religious constitution of a
human grouping. In contradistinction to unitary systems (with a single budget,
planning and coordination centralized in a single bureaucracy), federations are
adopted for four main reasons: geographical (countries of continental scope are
resistant to unification); political (to enjoy the advantages of union without losing
regional identity, from a cultural, religious, historical and ethnic point of view);
economic (to increase the efficiency of provision of public goods); and historical
(colonization and the formation of national states) (PRADO, 2006).
According to Moraes (2001), federalism can be understood in three
ways: a) in strictly economic terms, according to which the state is divided into
different levels of government (allocation and distribution of resources,
stabilization of the economy) on the basis of “criteria of economic efficiency”; b)
politically, in terms of the decentralization of political practice (from a unitary
state to federated states), it may be seen as providing a deeper form of
democracy; and c) in broader terms, federalism may be a “doctrine of a global
nature”, such as liberalism or socialism.
Brazil, a federative republic, has three distinct levels of government: a)
the Union (Federal Government), sub-national governments SNGs (States and
the Federal District) and local governments (municipalities). The Brazilian
federative pact is, furthermore, one of the fixed fundamental clauses of the
country’s current constitution. Brazilian federalism underwent significant
changes to its model after the 1988 Constitution, since criticisms of the

11
centralization of federal government power, as promoted by the military regime,
led to a clamor for decentralization in the form of extending the tax-collecting
rights of States and municipalities (REZENDE, 2003).
Thus, the debate regarding fiscal federalism in Brazil rests on three
fundamental pillars: 1. the question of the fiscal structure of federations
(attribution of powers, responsibilities and autonomy, transfers between levels
of government, permission to collect taxes, improvement of intergovernmental
relations); 2.the proposal of normative models regarding the most efficient
federative system; 3. and the link between fiscal federalism and (State and
national) development policies.
1.2. Federalism and Fiscal Competition
This brief overview of fiscal federalism enables us to focus on one of its
most significant manifestations in contemporary Brazil: fiscal competition. First,
however, we must define this concept. Fiscal competition, commonly called
“fiscal war”, is a situation in which federated entities compete for private
investment in their territory, attracting investment by way of fiscal mechanisms,
such as exemption from the ICMS value-added tax, extension of deadlines for
payment of tax, presumed credit, and others.
“Fiscal war” is waged without complying with Complementary Law nº
24/75, which forbids the granting of exemptions and other incentives relating to
the ICMS, except when these are envisaged in contracts drawn up in the course
of meetings with the Treasury Policy Council (Confaz), which brings together
representatives of all the States and the Federal District.
“Fiscal war,” as the name suggests, is a situation of conflict within the
Federation. The federated entity gains—when, in fact, it imposes in most cases,
a loss on one or some of the others, since war is rarely a positive sum game.
Federalism, which is a cooperative relation between government units is
undermined.
Various authors and scholars of the subject understand that “fiscal war”
has become fiercer in recent decades, owing to the absence of regional

12
development policies on the part of the federal government. They argue that the
federated units, faced with a federal government that has abandoned regional
development policies, have taken upon themselves the responsibility for
generating employment and economic growth for their citizens and bringing
development to their territories. The mechanism for promoting such
development is usually fiscal advantages. To sum up, “fiscal war” would seem
to be “a peculiar form of regional development policy” (PRADO, 2005, p. 6), the
“most obvious expression of autonomy of the development policies of the
various States” (FERREIRA, 2005, p. 13).
In other words, a tax at the State level, over whose principal variables
(such the tax base and rates, for example) the Federal Government and Senate
exercise no control would appear to create a “potential for distortion”, which
tends to use taxation as an instrument of regional economic policy to the
detriment of pure revenue generation. Such destructive potential may have
been responsible for the escalation of the “fiscal war” in Brazil (PRADO, 2003).
In fact, according to Rezende(2003, p. 29),
“...the virtual abandonment, by the federal government, of policies related
to the less economically developed regions stalled the reduction in income
disparities between the North and Northeast and South and Southeast regions,
in the mid-1980s, increasing the difficulties States located in poorer regions
experienced in sustaining their policies relating to meeting social needs.”
In other words, the States seem to have waged “fiscal war” as a way of
filling the gap left by federal government omission (the absence of regulation of
national development policies), a situation that would appear to produce ”the
most perverse of systems” (PRADO, 2005). This, VARSANO (1997, p. 5)
argues, is because the federated states take on the responsibility for promoting
development and conduct this by way of “fiscal war”, with disastrous results,
since the winners of fiscal wars are, usually, States with greater economic
power, who come to be the most developed, with the biggest markets and the
best infrastructure. By forgoing revenue generation, the state is also neglecting
the provision of services (health, education, infrastructure and so forth) which
13
are necessary for production and sacrificing fiscal equilibrium, thereby
generating macro-economic instability.
“Fiscal war” would thus seem to be a kind of subordination of some
instruments of political development to a competitive logic. In other words, it is a
peculiar situation resulting from a dynamic of competition between governments
through the use of tax and budget instruments. However, it should be made
clear that the problem of “fiscal war” derives not from State development
policies, but from the perverse character and unbridled competitiveness they
assume for determined periods.
In fact, Prado (2005a) warns that, according to data from the automobile
industry, the main mechanism used in “fiscal war” is the ICMS (other
mechanisms, such donation of land, government spending on infrastructure and
others are not the dominant ones). As a kind of tax on value-added sales tax
levied on company revenues, the benefits are granted through a reduction of
the outstanding balance. Thus, fiscal incentives involving deferral of payment
and extension of deadlines vis-à-vis the ICMS tax, normally with low interest
rates and adjustments for inflation, represent a cost for the State. At a time
when the Brazilian economy is stable, the impact is not so great; however, if
inflation were high, such benefits would appear to be what is called a “true gift”.
Private companies therefore preside over an “auction” among States, in
which, notwithstanding detailed studies of location that consider different
possible destinations for their financial investment–where the issue of fiscal
incentives is only one of the factors, and normally one of the least important—
they end up stoking a “fiscal war” to obtain the greatest possible economic-
financial advantage. This auction would appear only to be possible because of
the disconnected nature of the States, which can thus be easily be manipulated
by companies. It is thus argued that the perverse “fiscal war” in contemporary
Brazil is a process that is entirely controlled by private companies.
It is important to point out that “fiscal war” is understood to be something
deleterious only when it is excessively competitive, i.e. there is no regulation
beyond State level. This provides stronger grounds for the argument that the
State should grant (tax and budgetary) benefits to private companies for the

14
purpose of promoting development and for the ultimate good of the community.
In such “healthy fiscal competition”, the idea is that efficient fiscal competition
would be of benefit to citizens.
1.3 Fiscal Competition in Brazil as Autonomous Development
Policy
As has been noted, the issue of fiscal competition is addressed in terms
of Brazilian federalism, as something intimately linked to regional development
policies. “Fiscal war” is believed to be a response on the part of the States to
the absence of such policies at national level (under the auspices of the central
government) and has thus become a necessary activity for each State to
promote its own economic development.
As a consequence, the economic theory of fiscal federalism argues that
States wage “fiscal war” because they need to take action to protect the
interests of their people, to eliminate poverty, unemployment and inequality. In
other words, “fiscal war” would appear to be a tool that the States of the
Federation have recourse to compensate for the absence of a national or
regional development plan.
According to the science of economics, fiscal subsidies are restrictions
on the functioning of markets and should be eliminated; a generalized subsidies
policy (“fiscal war”) would appear therefore to be questionable. Varsano (1997)
argues that fiscal incentives should be conceded in cases where the private
investment would not be made without the benefit or where benefits result in
new productive units (additional investment) or even in cases where the
benefits of the incentive are appropriated by the residents who are losing out,
because of cuts in the provision of public goods (due to the concession). It can
thus be seen that there are serious questions regarding the efficiency of such
concessions. The same questions are raised by Prado (2005), who argues that
the States always promote regional development programs by way of tax
incentives and that “fiscal war” is merely a savagely competitive form of this
policy. Ferreira (2005, p. 18) likewise comes to the conclusion that tax and
budgetary incentives are “intrinsically inefficient and problematical” and that
autonomous development policies (fiscal competition) should not rule out
15
development policies that are centrally-structured, i.e. run by the current central
government.
As we have seen, the argument defended here is that this is a process
that is not per se malevolent, but which requires control by a central
government to establish a “healthy fiscal war”. Such control is necessary to
ensure the (healthy) fiscal competition between Brazilian States forms part of a
broader context of national development policy.
The idea that the effectiveness of regional development policies as a
mechanism capable of bringing democracy, equality and social justice is
defended by the prevailing theory of economics (represented principally by the
fields of Public Sector Economics and Regional Urban Economics). Having
accepted that the relation between “fiscal war” and development is pertinent
and genuine, it may therefore be possible to list some positive and some
negative aspects of the phenomenon of fiscal competition in Brazil.
According to Varsano (1997), from the point of view of State
governments, the federated unit accumulates gains, albeit temporary ones, by
waging “fiscal war”, since it is the official responsibility of the State Governor to
defend the interests of his or her State as a matter of priority in relation to the
overall interests of the nation and, in cases where interests conflict, to defend
those of his own State, on the grounds of the autonomy of federated units.
This raises an issue that should be highlighted: the autonomy of the
States. As a result of this, the practice of “fiscal war” is defended by governors
and secretaries across the country on the basis of the idea that this is a
manifestation of the freedom that each State has to defend its own (just)
interests and to promote its own policies and strategic development actions.
This is why there is a broad current of thought that sees such competitive
practices [“fiscal war”] as one of the more virtuous aspects of federations. For
authors who lay emphasis on so-called competitive federalism, so long as
certain conditions are complied with, competition between States for investment
may be a way of increasing the systemic efficiency of the local economy. In
other words, from an economic point of view, some degree of conflict is

16
necessary to promote a competitive economy and government efficiency, for
example. (FERREIRA, 2005, p.15).
It is a recurrent feature of meetings or seminars of fiscal federalism for
the Treasury Secretaries of some States to claim this is not “fiscal war”, but
“policies for attracting investment” or “autonomous policies for incentivizing
productive activity”. Such claims, which reject the term “war” for reason of its
negative connotations, show how the Brazilian States understand today’s idea
of autonomy as vital and of the utmost importance in managing their internal
affairs.
This is why, as noted above, theories see the problem of “fiscal war” as
lying, not in its very existence, but in its exacerbation. After all, if it is a
development policy, it must consequently be a powerful tool for business
management and administration. However, this does not mean that any kind of
“fiscal war” is a positive thing for federation. As PRADO (2005) warns, the idea
of the efficiency of “fiscal war” depends on “epic and unreal” suppositions
regarding factors such as the capacity of State governments to recognize the
profile of companies and the weight of each variable they take into account in
their investment decision-making process).
There is thus a need, the author continues, to set up a “higher arbitration
authority” to avoid maximal fiscal costs in fiscal competition. This maximum
fiscal cost occurs because of a phenomenon known in the theory of fiscal
federalism as ‘the race to the bottom’.
Many authors therefore argue that fiscal competition should not be
abolished (it has been around for a long time in Brazil, but only recently has
taken on perverse proportions), since the problem is not fiscal competition per
se, but its unbridled and perversely competitive form. Put differently, the
problem is that, in the absence of an alternative form of State coordination, the
process comes to be controlled by a private sector that aims to maximize its
profits but not the public benefits of the use of fiscal resources. In the end, it
may not be desirable, because of the various advantages provided by ordered
federal autonomy (PRADO, 2005, p. 33).
17
Like the autonomy of States, one argument in favor of “fiscal war” claims
that, as it is a policy to encourage private businesses, it also generates
employment and hence provides additional income for the residents of the
State, which, as VARSANO (1997) puts it, is, from an economic point of view
“good business” for the State that grants the concession.
After all, it is supposed that additional income will translate into greater
consumption in the State, meaning greater circulation of goods and higher
ICMS revenue. The incentive is thus deemed to serve as a “springboard” of a
chain reaction that results—incredibly—in an increase in revenue, as shown by
C. Maranhão in study research to the Finance Secretariat.
Clearly, when competition occurs between States with relatively similar
degrees of development, tax benefits may make a difference, since they provide
similar systemic advantages: one State will not have to cover possible
differences in competitiveness arising from its level of development and, as a
consequence, States end up ensuring that, in the course of the competitive
process, there is growing use of tax instruments. This is one aspect of leveling:
assuming that States have the same economic capacity, each State tends to
offer what the other does. It can thus be concluded that existence of legally
equal State governments competing for investment often leads to a constant
mutual cancelling out of benefits, or “race to the bottom””.
However, it is worth pointing out that another negative aspect of “fiscal
war”, which is closely related to the issue of perverse competition, is the
phenomenon of redundancy. According to FERREIRA (2005, p. 19),
redundancy is the “product of a situation in which the State government
concedes tax and/or budgetary benefits to companies who may invest in some
way in the State even without these benefits”.
In the absence of a central government sponsored coordinated economic
development policy it is easy to see that redundancy is highly likely to occur,
whenever one or more States initiates a “fiscal war”, or as some would prefer to
put it, a process of attracting investment.

18
In such a situation, the main winners of a “fiscal war” are the private
companies, who receive ever increasing fiscal benefits, leading them to conduct
the aforementioned “auction” among the States who are eager for them to
invest.
Fiscal competition, as it is understood here, is what SHAH (2001) calls
“inter-jurisdictional competition”. According to this scholar, fiscal competition
may foster efficiency in a federal economy, primarily as a result of the following
factors: adjustment of public services to the preferences of citizens,
reinforcement of government responsibility, reduction of the influence of
corruption, and improved quality, quantity and access to local public services.
As “fiscal war” fosters competition between federated units for
investment, there is supposedly a process of innovation of the provision of
public services. This idea is founded on so-called “competitive federalism”, in
which the higher degree of decentralization is deemed to make the public sector
more responsible and receptive to the wishes of its citizens. As SHAH (2001)
puts it, “this difference in local public services policy can be seen as a desirable
break with uniform nationwide practices”.
Fiscal competition is also deemed to have the advantage of making
public administration more responsible, in so far as governments seek better
practices. Focus shifts to the results and governments adopt benchmarks for
more attractive and competitive services.
Likewise, as there is supposedly no monopoly (due to competitive
pressure from other federated units), a climate of fiscal competition between
States is deemed to favor the disappearance or reduction of inefficiencies and
personal advantage-taking, since the competitive process entails greater
access to information and an end to regulatory barriers.
However, SHAH (2001) also lists some of the adverse consequences of
inter-jurisdictional competition, which lead this author to call it “do-it-yourself
federalism”. These include a weakening of the common market, a decline in
quality of life, insufficient provision of rewards for merit and adverse social

19
policy, as well as predatory competition among jurisdictions to provide more
attractive tax incentives.
Fiscal competition could have the disadvantage of weakening the
common market, as subnational governments, in their quest to attract qualified
labor and capital, may favor “beggar thy neighbor” style policies. This would
thus provide a source of inefficiency as federated units use their spending and
regulatory powers to improve local conditions at the expense of non-residents.
Here again we have the idea of a State government that primarily looks after its
own State’s interests to the detriment of those of the country as a whole,
adopting “beggar my neighbor” policies to attract economic activity from other
States.
This leads to another deleterious aspect of fiscal competition: a decline in
quality of life. Since States, in an effort to attract labor and capital, make
increasing use of tax and budgetary benefits, they compromise their sources of
revenue and hence the provision of public services. The aforementioned “race
to the bottom” occasions what SHAH (2001) calls “a descending spiral of public
sector activities”. This also impacts the minimum level of quality of services, as
it is harder to attain a minimum quality standard when the level of benefits
conceded exceeds appropriate limits.
1.4 Concluding Remarks on the Federation Debate
Brazil is a federative republic and its national territory is thus divided into
various subnational political-administrative units, whose autonomy is enshrined
in the 1988 Federal Constitution. One of the most decisive aspects of this
constitution was the autonomy granted to the States to legislate regarding the
main state-level tax, the ICMS.
This autonomy, together with growing abandonment of national regional
development policies by the Brazilian central government, laid the ground for
States to take responsibility for their own social and economic development, by
way of independent policies based principally on the conceding fiscal
(budgetary and tax) benefits.
20
In the context of the opening of the Brazilian market, owing to the
(political and economic) pressures of globalization, fiscal competition among
federated units has become ever fiercer, reaching a historic peak with the
arrival in the country of giant automobile manufacturing corporations.
It has been noted, however, that one primary element needs to be borne
in mind regarding fiscal competition. This is the autonomy of the States in
conducting their own affairs and defending their own interests. In a federative
republic that prides itself on having emerged from a long period of military
dictatorship, the importance of this should not be underestimated and, as shown
above, is something that State governors and secretaries vehemently defend.
On the other hand, it should also be borne in mind that current economic
theories have it that the absence of political and economic coordination on the
part of the central government ends up producing undesirable distortions, as
Brazil has experienced in recent years. Fiscal competition is therefore clearly a
subject of great controversy. If, on the one hand, it bolsters a desirable
autonomy of federated units, serves to generate income and employment,
boosts the competitiveness of States and encourages responsible government
and different kinds of innovation in the provision of public services, on the other,
it fosters predatory competition, leads to a decline in the State budget for public
services and quality of life, due to the adoption of “beggar thy neighbor” policies.
Whether one is for or against fiscal competition, one fact remains undeniable:
the way this policy has been practiced in Brazil is a phenomenon that merits in-
depth study and reflection.
21
2 - Pernambuco Tax Incentive Programs – Legal Framework
2.1 Development Program of the State of Pernambuco –
PRODEPE
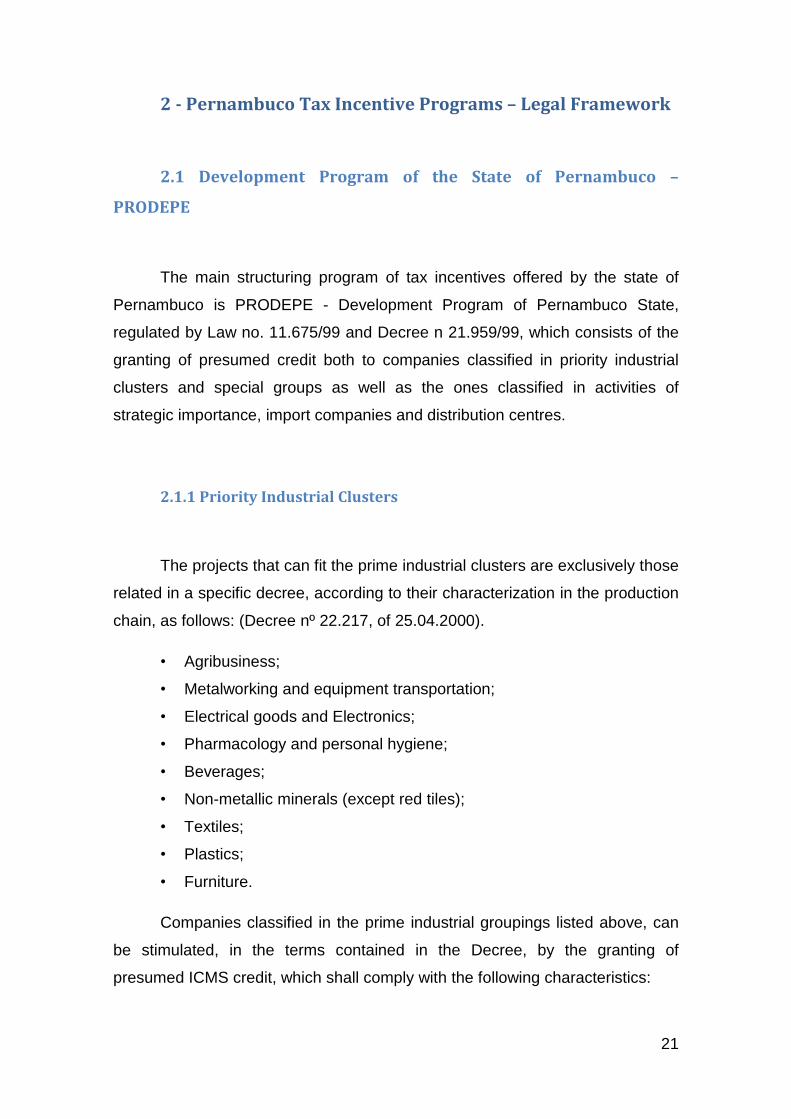
The main structuring program of tax incentives offered by the state of
Pernambuco is PRODEPE - Development Program of Pernambuco State,
regulated by Law no. 11.675/99 and Decree n 21.959/99, which consists of the
granting of presumed credit both to companies classified in priority industrial
clusters and special groups as well as the ones classified in activities of
strategic importance, import companies and distribution centres.
2.1.1 Priority Industrial Clusters
The projects that can fit the prime industrial clusters are exclusively those
related in a specific decree, according to their characterization in the production
chain, as follows: (Decree nº 22.217, of 25.04.2000).
• Agribusiness;
• Metalworking and equipment transportation;
• Electrical goods and Electronics;
• Pharmacology and personal hygiene;
• Beverages;
• Non-metallic minerals (except red tiles);
• Textiles;
• Plastics;
• Furniture.
Companies classified in the prime industrial groupings listed above, can
be stimulated, in the terms contained in the Decree, by the granting of
presumed ICMS credit, which shall comply with the following characteristics:

22
Municipality included in the Metropolitan Region: the amount to be granted is
equivalent to the percentage of up to 75% of the tax value, calculated
monthly during the period of benefit that can reach 12 years. (Art.5, II,
Decree nº 21.959/99 value). Ten percentage points (10%) can be added,
provided that the recipient firms are located in the municipalities of Abreu e
Lima, Araçoiaba, Igarassu, Itamaracá, Itapissuma, Olinda, and Paulista, with
investment project in the amount of at least R$ 100,000,000 00 (one
hundred million reais), and reaching an annual gross income equal to or
greater than R$ 500,000,000.00 (five hundred million reais) [Art.5, §18 of the
Decree. 21.959/99];
Municipality outside the Metropolitan region: the amount to be granted is
equivalent to up to 85% of the tax, for which the taxpayer is directly
responsible, accounted for in each tax period (Article 5, §17, I, of Decree No
21.959/99);
Municipality located in RD “Zona da Mata”:
Art.5, §17, I, of Decree nº 21.959/99: up to 90% of the tax, under the
conditions set below:
be primarily engaged in the manufacturing of food products;
have investment project values of at least R$ 100,000,000.00 (one
hundred million reais);
generate up to 300 (three hundred) direct jobs
Municipality located in the “Agreste Pernambucano”: 90% (ninety percent) of
the tax;
Municipality located the “Sertão Pernambucano”: 95% of the tax (ninety five
percent) [Art.5, §17, I, of the Decree nº 21.959/99].
With regards to the chain production of plastic, the percentage of the
presumed credit will be reduced by 05 (five) percentage points when the
processed product fit into one of the following cases: (§3, and sections I and II,
inserted by Decree nº 23,188, of 10:04:01)
is not biodegradable;
Does not use as raw materials, at least 30% of recycled material.
23
2.1.2 Special Industries Clusters
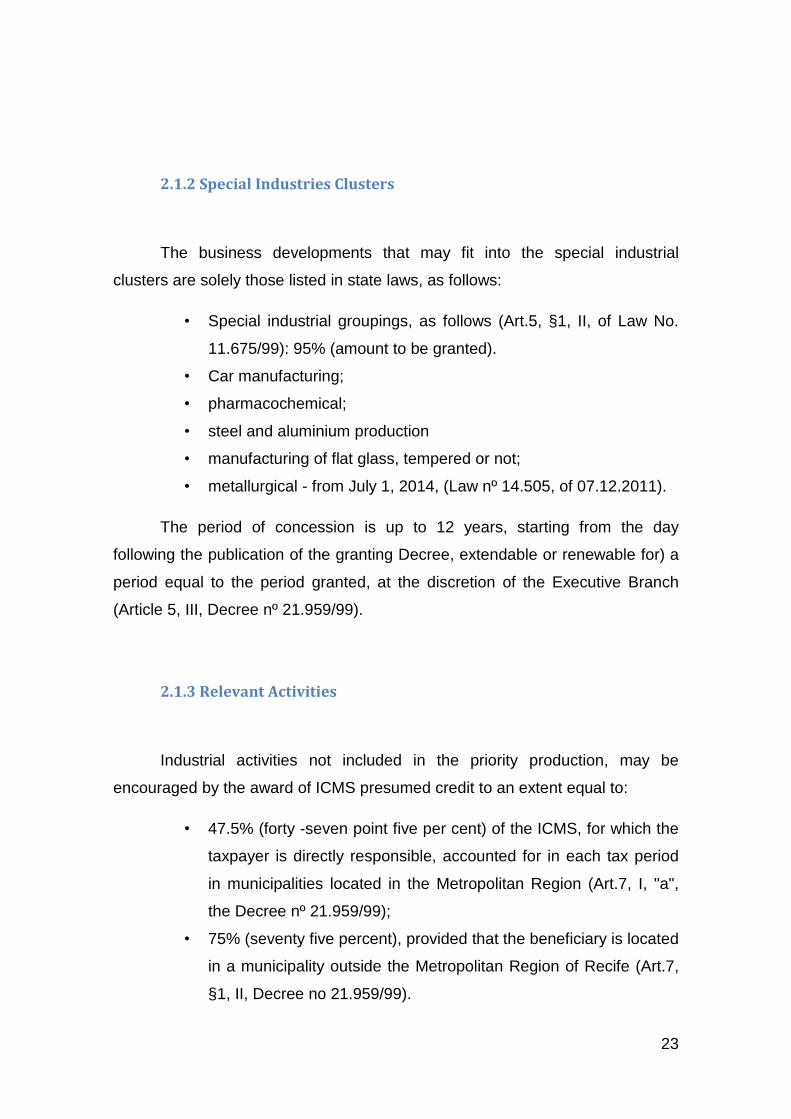
The business developments that may fit into the special industrial
clusters are solely those listed in state laws, as follows:
• Special industrial groupings, as follows (Art.5, §1, II, of Law No.
11.675/99): 95% (amount to be granted).
• Car manufacturing;
• pharmacochemical;
• steel and aluminium production
• manufacturing of flat glass, tempered or not;
• metallurgical - from July 1, 2014, (Law nº 14.505, of 07.12.2011).
The period of concession is up to 12 years, starting from the day
following the publication of the granting Decree, extendable or renewable for) a
period equal to the period granted, at the discretion of the Executive Branch
(Article 5, III, Decree nº 21.959/99).
2.1.3 Relevant Activities
Industrial activities not included in the priority production, may be
encouraged by the award of ICMS presumed credit to an extent equal to:
• 47.5% (forty -seven point five per cent) of the ICMS, for which the
taxpayer is directly responsible, accounted for in each tax period
in municipalities located in the Metropolitan Region (Art.7, I, "a",
the Decree nº 21.959/99);
• 75% (seventy five percent), provided that the beneficiary is located
in a municipality outside the Metropolitan Region of Recife (Art.7,
§1, II, Decree no 21.959/99).
24
The period of concession up to 8 years from the day following the
publication of the granting (concessional)decree and may be extended or
renewed for a maximum equivalent to the same period, at the discretion of the
Executive Branch (Art.7, III of the Decree nº 21.959/99).
2.1.4 Industrial Activities Which Are Not Entitled PRODEPE
No PRODEPE benefits will not be granted to the following industrial
activities (Art.6, §1, of Decree nº 21.959/99).
construction;
extractive industries;
sugarcane agribusiness;
industry related to petroleum liquefied gas.
2.2 Stimulus to Wholesale Trade and Importers of Goods
Ports and airports activities can be stimulated by granting ICMS tax
benefits covering the import of goods from abroad, by offering a deferral of
ICMS on these operations.
In the subsequent transaction by the importer presumed credit will be
limited presumed credit:
in the case of internal operations, to the following maximum
percentage of the value of the operation (Art.9, II, Decree nº
21.959/99).
3,5% (three and a half percent) when the tax burden imposed is less
than or equal to 7% (seven percent);
6% (six percent), when the tax rate applicable is more than 7%
(seven percent) and less than or equal to 12% (twelve percent);
25
8% (eight percent), when applicable tax burden exceeds 12% (twelve
percent) and less than or equal to 17% (seventeen percent);
10% (ten percent), when the tax rate applicable is more than 17%
(seventeen percent);
in the case of interstate transactions, the value corresponding to a
maximum of 47.5% (forty -seven point five percent) of the assessed
tax) (Art.9, II, Decree nº 21.959/99).
The period of concession, up to 07 years counting from the day following
the publication of the concessional decree and may be extended or renewed, at
most, for the same period, at the discretion of the executive branch (Article 9, IV
of the Decree nº 21.959/99).
2.3 Fostering Central Distribution
The Central Distribution can be stimulated by granting ICMS tax benefits,
in the following percentages:
when dealing with interstate operations, estimated (presumed) credit
is granted in the 3% (three percent) of the total value (Art.10, I, of
Decree nº 21.959/99).
in the case of entry of goods being transferred from business located
in another unit of the Federation, is granted credit in the amount of
3% (three percent) of the total value (Article 10, II, Decree no. 21,959
/ 99).
The period of concession is up to fifteen (15) years from the day following
the publication of the granting(concessional) month, the deadline may be, at the
request of the person concerned, extended or renewed, at the most, for the
same period, at the discretion of the Executive Branch (Article 10, sections III
and IV of the Decree. 21.959/99).
26
2.4 Programs of Incentives by Sector
The tax incentive PRODINPE was created to meet a specific demand,
the Atlântico Sul Shipyard, as well as being responsible for the incentive that
benefits the Abreu e Lima Refinery.
From this prompting action, the shipbuilding industry in the state has
expanded, and now is expecting other projects to settle in the state, such as the
STX Promar and BMC Off shore Construction and Installation.
The discovery of an oil reserve in Brazil, located between the states of
Espírito Santo and Santa Catarina, will boost the country's economy. The
reserve is 800 km long by 200 km wide and at a depth of 5 to 6000 meters
below the water surface. The discovery points to a reserve of 100 billion barrels
of oil, making it one of the largest reserves in the world. The new reserve is
seven times the current reserves of oil and gas owned by Petrobrás in Brazil.
To this end, new ships, platforms, pipelines, refineries and petrochemical plants
are going to be needed, to be built in the country. Therefore, the new shipyards
to settle in Pernambuco have a good estimate of future production in order to
meet the demand that will arise from the exploitation of those reserves. Thus,
the state encouraged the settlement of these projects offering different
incentives.
To the benefit of The Metalworking and Mechanical Engineering Industry,
metalworking industry, which provides the framework for both companies, we
use the tax incentive PRODEPE. Therefore, members of the shipbuilding
industry and refinery also have incentives to settle in Pernambuco.
Finally, the PRODEAUTO and Port Activity Incentive Program.
The tax incentive granted by PRODEAUTO to industrial ventures
consists of:
a) Presumed credit of 95% of ICMS outstanding balance;
b) Deferred payment of ICMS on imported resources needed for
manufacturing automotive vehicles.
27
To the wholesale dealer of vehicles is offered:
Presumed credit equivalent to 95% of the outstanding balance of the
ICMS;
Delayed payment of ICMS due on imported vehicles;
Deferral of payment of the outstanding balance of ICMS;
on national vehicles.
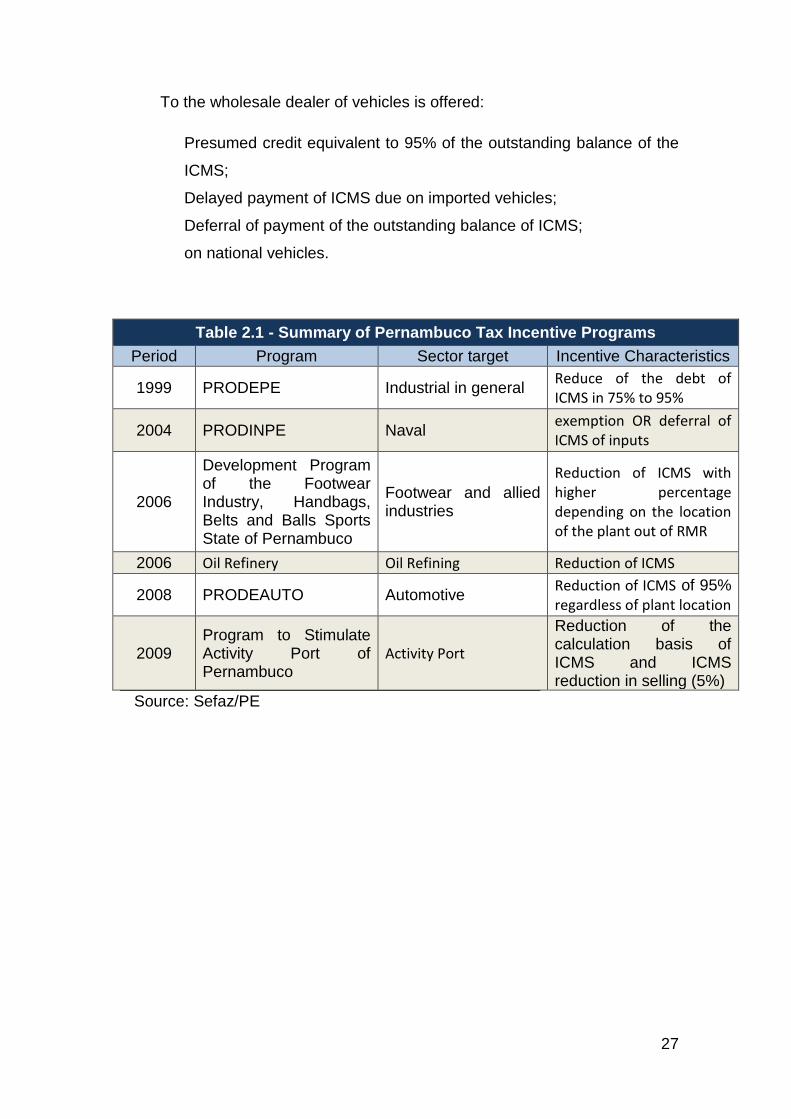
Table 2.1 - Summary of Pernambuco Tax Incentive Programs
Period Program Sector target Incentive Characteristics
1999 PRODEPE Industrial in general Reduce of the debt of ICMS in 75% to 95%
2004 PRODINPE Naval exemption OR deferral of ICMS of inputs
2006
Development Program of the Footwear Industry, Handbags, Belts and Balls Sports State of Pernambuco
Footwear and allied industries
Reduction of ICMS with higher percentage depending on the location of the plant out of RMR
2006 Oil Refinery Oil Refining Reduction of ICMS
2008 PRODEAUTO Automotive Reduction of ICMS of 95%
regardless of plant location
2009 Program to Stimulate Activity Port of Pernambuco
Activity Port
Reduction of the calculation basis of ICMS and ICMS reduction in selling (5%)
Source: Sefaz/PE
28
3 - The Effects of Tax Incentives in the Economy of
Pernambuco
In this scenario of tax incentive program, aimed at encouraging the
installation of new companies within the state, as well as ensuring the support
to local industries in a productive and competitive business scenario, we are
going to analyse the scope of the Development Program of the State of
Pernambuco – PRODEPE, responsible for the greater range of tax benefits
aimed to the industrial sector. To this end, it is necessary to assess the
importance of tax benefits policies offered by the state of Pernambuco, over the
six years in the analysis.
The theme of the tax benefits granted by individual states has generated
a broad national discussion around the effects of the much-talked about "fiscal
war". No definition of procedure can correct existing distortions between the
regions of the federation due to lack of regional development policies at state
level that minimizes the asymmetry of their economic and social indicators. The
agenda of the debate includes not only an economic and fiscal perspective, but
also a political one because it involves definitions about compensation funds,
tax reforms and issues related to the current political environment that is
strongly influenced by the approaching elections.
The national debate originated the filing of several lawsuits involving
discussions of the subject, which are currently under judgement in the Supreme
Court requesting the publication of a legal Precedent, declaring the
unconstitutionality of the tax benefits granted by individual States. There is no
doubt that the use of tax relief policies by the less developed states - generating
the so called fiscal war – were required to keep and or improve the number of
businesses, especially, by attracting more new industries to their territories,
providing them with incentives that allow them to reduce the payment of ICMS
and to trade more competitively than their competitors, both nationally and
globally.
29
The legal actions started by those who feel disadvantaged (mainly Sao
Paulo State) contain allegations that the administrative rite imposed by the
grantor states with reference to tax benefits does not meet the prerogatives of
the National Council of Fiscal Policy - CONFAZ, which bind the granting of
incentives to the unanimous approval of the states represented in CONFAZ.
Due to a strong economic asymmetry between the North and Northeast
and the other Brazilian regions, with the consequent wide differences in
economic and social indicators, this unanimity required by CONFAZ, of course,
has never been achieved, given the conflicting interests among the most
developed regions and the less favored.
As noted above, the absence of a national policy defining the guidelines
for regional development, aimed at minimizing the differences between the
regions has acted as a shelter in favour of the granting of tax benefits as a way
to strengthen the economic development of the state and provide a decent
social environment for its citizens.
It is well known that the publication of a legal Precedent by the Supreme
Court, endorsing the claims of unconstitutionality, have serious implications to
the national economy, creating a climate of legal instability which would reflect
on the economic environment, as the enterprises that enjoyed tax benefits
would face having to return the funds granted by states. This crucial fact has
contributed to the lack of a consensual solution for the matter, allowing the
debate to continue, attempting to find terms of agreement outside the legal
environment in order to accommodate the conflicting interests of states.
To this end, discussions for a possible exit from this fiscal and legal
entanglement are taking place in the Congress, specifically the Senate,
involving the Federal Government and the federated entities, even seeking the
creation of an appropriate tax reform able to meet the current tax demands.
Within this national debate, several proposals are being presented in
favour of the validation of the tax benefits already granted by the States and the
adoption of a new regulatory framework to govern tax incentives. It is also being
suggested the creation of Compensatory Funds (through the Federal
30
Government) to compensate possible losses in ICMS collection suffered by the
States and, finally, the changes in the levels of ICMS interstate rates between
different regions of the Federation, giving a greater taxation burden to the state
of destination.
Owing to the complexity of the agenda in discussion, taking into account
the different economic and fiscal characteristics of each state involved and the
numerous conflicting interests, so far, no solution that meets the aspirations of
each state of the Federation has been achieved.
Turning back to the scope of this study - to highlight the importance of
granting tax benefits to the economy of Pernambuco – we state that the capture
of hundreds of new businesses to join the industrial park of the state, as well as
the keeping and expansion of industrial projects already installed in
Pernambuco, through the adoption of a consistent policy of fiscal incentives has
contributed greatly to the solid socioeconomic development experienced in
recent years by the state, with significant gains in quality of life for the people of
Pernambuco.
It is also worth mentioning the direct and indirect effects of the
implementation of this fiscal stimulus policy carried out by Pernambuco, thus
enabling the provision of funds from the state treasury to the implementation of
public policies that ensure the necessary infrastructure for the expansion of its
economy. We can identify four main points of impact on ICMS collection that
occur when a new industrial development settles in the state:
a) Firstly, we consider the direct ICMS to be collected from the new
enterprise: if the installation did not take place in Pernambuco, this
ICMS, however reduced, would not contribute to the State Treasury,
as in fact, it would not exist;
b) Secondly, we have to take into account the power/gas effect, which
refers to new purchases made by the new business from
Pernambuco power and gas suppliers: indirectly, their purchase will
contribute to increasing ICMS revenue from these energy supplies
providers;

31
c) Thirdly, we emphasize domestic acquisitions made by the new
industry. While settling in the state territory, the businesses tends not
only to preserve their strategic suppliers regardless of location, but
also to seek local partners which can ensure competitive gains in
production, by supply of raw materials and capital goods, at
advantageous prices and with more efficient deliveries. According the
data presented by the industrial sector, 43% of all purchases by local
industries, in 2012, were made here in Pernambuco. Thus, we ought
to take into account the indirect ICMS generated by local suppliers in
their sales to the newly settled business;
d) Finally, but associated with the greatest social impact, we must
consider the effects generated by the extra income, derived from the
creation of jobs by the new enterprises that came to settle in
Pernambuco. Based on the Household Budget Survey (POF/IBGE),
2008 to 2009, it is possible to identify the different types of consumer
spending and what percentage of them are subject to ICMS taxation,
considering the average wage of a new employee. If an average rate
is assigned, based on the majority of taxed goods and a level of
remuneration is set consistently with the Pernambuco industrial park,
we can reach an indicator of the return of ICMS for each job created.
Following this line of reasoning, assuming an average wage of R$
1.000 for employees of the industrial district, taking into account that
around 50% of their wages is spent on goods and products subject to
ICMS taxation (study as POF / IBGE) and, finally, assuming an
average rate of 12% for ICMS taxation (considering the proportionality
of the products consumed), we would get a tax return of R$ 60,00. It
should be emphasized that this amount does not include the indirect
effects of the tax collection of this newly remunerated workforce. For
example: services that are hired by the new employees (schools,
housekeepers, beauty salon, etc.), and of course, they create
transactions subject to ICMS, given that these newly hired staff also
come to buy products subject to ICMS.
32
Within this methodology, aimed to assess direct and indirect gains from
ICMS collection deriving from the development of a tax benefit policy to
industries, we quote a technical study by Cosme Maranhão.
It was based on the four pillars listed above and estimated that for each
R$ 1,00 of tax benefit granted to enterprises that come to settle in the state
(PRODEPE), the return in terms of direct and indirect revenue, resulting from it
(this settlement), is approximately R$ 1,30.
Summing up these positive points and how they reflect directly and
indirectly on the collection of ICMS we can gain an insight of the economic and
social importance attributed to the settlement of new industries within the state.
This will happen by the adoption of a serious policy of tax benefits, especially
when promotes its settlement in less developed areas. And also, even without
considering the whole multiplier effect of the jobs created, as in the case of
professionals, that depending on the position achieved, could afford to employ
others, who in turn could gain access to new income and to consuming new
products.
It was this crucial policy of tax benefits, implemented by the state in
recent years that allowed the creation of a new environment of economic
development. It has been targeted to the interior of the state and promoted the
creation of new industrial development areas. These areas, whether in the
installation or consolidation phase, have favored the expansion of already
present production centers as well as generating new jobs, increasing ICMS
collection and average regional salaries.
This fiscal policy also allowed a greater investment by the government to
meet the needs of the companies. It targeted infrastructures, training for the
qualification of the workforce and the promotion of a higher commercial
dynamism for small and medium enterprises.
In order to provide an idea of the volume of projects submitted to and
approved by CONDIC (Board of Industrial and Commercial Development of
Pernambuco) gaining access to the benefits of PRODEPE fiscal policy in the
period 2007-2012, we present the following table showing the number of
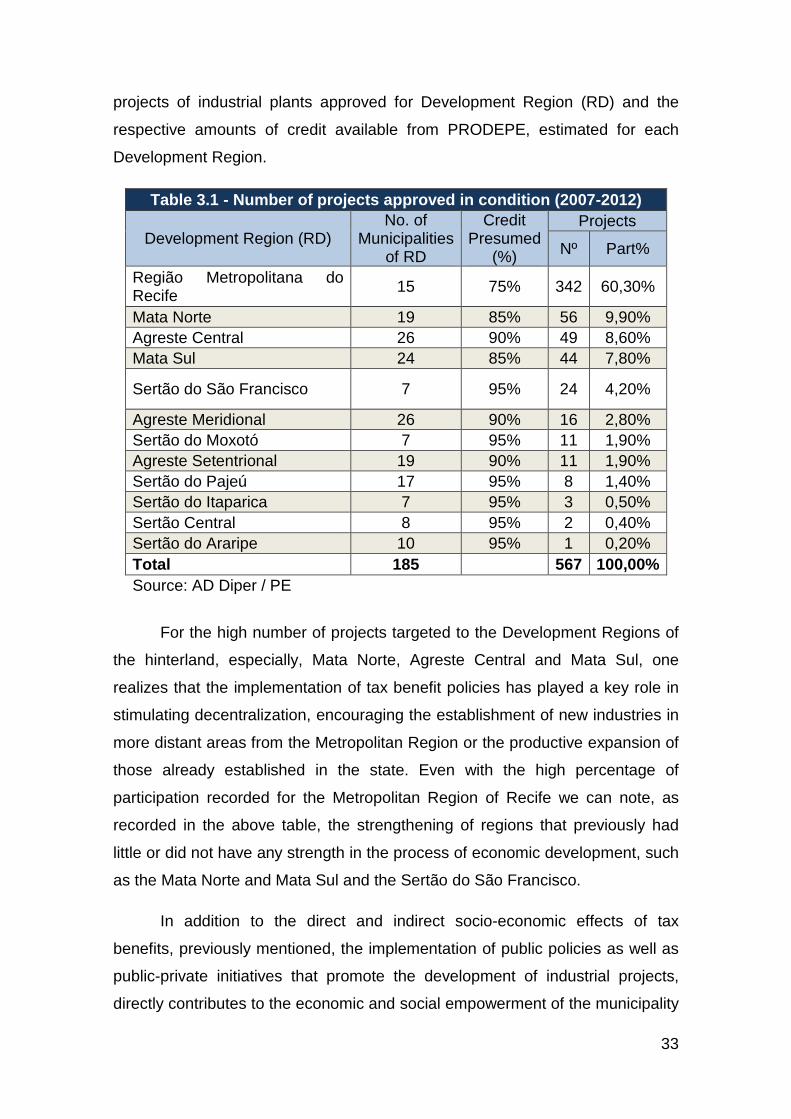
33
projects of industrial plants approved for Development Region (RD) and the
respective amounts of credit available from PRODEPE, estimated for each
Development Region.
Table 3.1 - Number of projects approved in condition (2007-2012)
Development Region (RD) No. of
Municipalities of RD
Credit Presumed
(%)
Projects
Nº Part%
Região Metropolitana do Recife
15 75% 342 60,30%
Mata Norte 19 85% 56 9,90%
Agreste Central 26 90% 49 8,60%
Mata Sul 24 85% 44 7,80%
Sertão do São Francisco 7 95% 24 4,20%
Agreste Meridional 26 90% 16 2,80%
Sertão do Moxotó 7 95% 11 1,90%
Agreste Setentrional 19 90% 11 1,90%
Sertão do Pajeú 17 95% 8 1,40%
Sertão do Itaparica 7 95% 3 0,50%
Sertão Central 8 95% 2 0,40%
Sertão do Araripe 10 95% 1 0,20%
Total 185 567 100,00%
Source: AD Diper / PE
For the high number of projects targeted to the Development Regions of
the hinterland, especially, Mata Norte, Agreste Central and Mata Sul, one
realizes that the implementation of tax benefit policies has played a key role in
stimulating decentralization, encouraging the establishment of new industries in
more distant areas from the Metropolitan Region or the productive expansion of
those already established in the state. Even with the high percentage of
participation recorded for the Metropolitan Region of Recife we can note, as
recorded in the above table, the strengthening of regions that previously had
little or did not have any strength in the process of economic development, such
as the Mata Norte and Mata Sul and the Sertão do São Francisco.
In addition to the direct and indirect socio-economic effects of tax
benefits, previously mentioned, the implementation of public policies as well as
public-private initiatives that promote the development of industrial projects,
directly contributes to the economic and social empowerment of the municipality
34
in which the industrial plant locates. That is determined by the granted annual
access to funds from IPM (Municipalities Participation Index) provided by the
State of Pernambuco, which is directly linked to the economic performance of
companies located in the municipality.
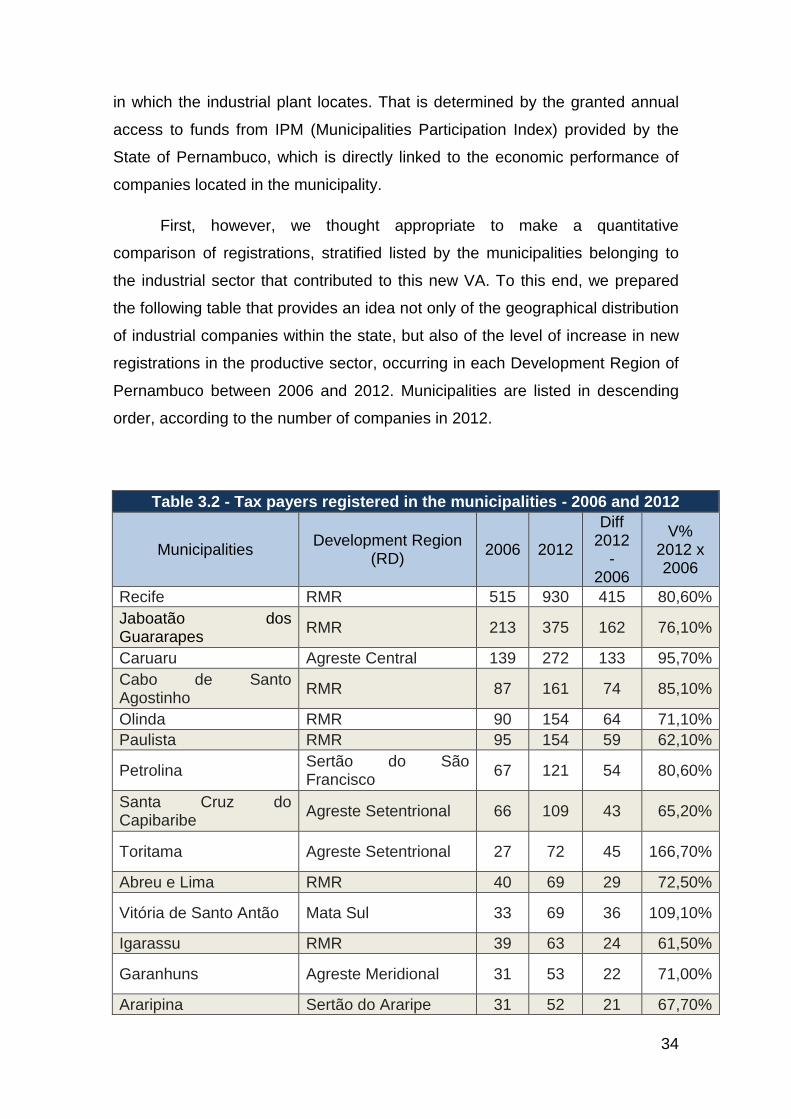
First, however, we thought appropriate to make a quantitative
comparison of registrations, stratified listed by the municipalities belonging to
the industrial sector that contributed to this new VA. To this end, we prepared
the following table that provides an idea not only of the geographical distribution
of industrial companies within the state, but also of the level of increase in new
registrations in the productive sector, occurring in each Development Region of
Pernambuco between 2006 and 2012. Municipalities are listed in descending
order, according to the number of companies in 2012.
Table 3.2 - Tax payers registered in the municipalities - 2006 and 2012
Municipalities Development Region
(RD) 2006 2012
Diff 2012
- 2006
V% 2012 x 2006
Recife RMR 515 930 415 80,60%
Jaboatão dos Guararapes
RMR 213 375 162 76,10%
Caruaru Agreste Central 139 272 133 95,70%
Cabo de Santo Agostinho
RMR 87 161 74 85,10%
Olinda RMR 90 154 64 71,10%
Paulista RMR 95 154 59 62,10%
Petrolina Sertão do São Francisco
67 121 54 80,60%
Santa Cruz do Capibaribe
Agreste Setentrional 66 109 43 65,20%
Toritama Agreste Setentrional 27 72 45 166,70%
Abreu e Lima RMR 40 69 29 72,50%
Vitória de Santo Antão Mata Sul 33 69 36 109,10%
Igarassu RMR 39 63 24 61,50%
Garanhuns Agreste Meridional 31 53 22 71,00%
Araripina Sertão do Araripe 31 52 21 67,70%
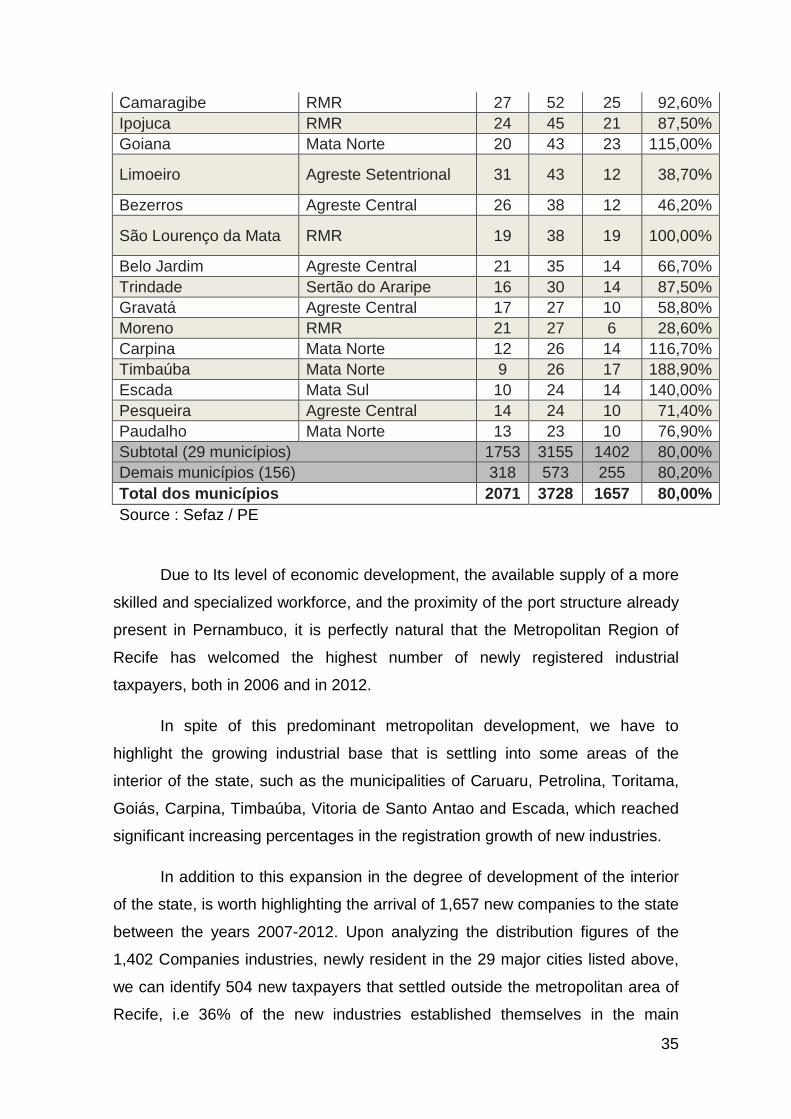
35
Camaragibe RMR 27 52 25 92,60%
Ipojuca RMR 24 45 21 87,50%
Goiana Mata Norte 20 43 23 115,00%
Limoeiro Agreste Setentrional 31 43 12 38,70%
Bezerros Agreste Central 26 38 12 46,20%
São Lourenço da Mata RMR 19 38 19 100,00%
Belo Jardim Agreste Central 21 35 14 66,70%
Trindade Sertão do Araripe 16 30 14 87,50%
Gravatá Agreste Central 17 27 10 58,80%
Moreno RMR 21 27 6 28,60%
Carpina Mata Norte 12 26 14 116,70%
Timbaúba Mata Norte 9 26 17 188,90%
Escada Mata Sul 10 24 14 140,00%
Pesqueira Agreste Central 14 24 10 71,40%
Paudalho Mata Norte 13 23 10 76,90%
Subtotal (29 municípios) 1753 3155 1402 80,00%
Demais municípios (156) 318 573 255 80,20%
Total dos municípios 2071 3728 1657 80,00%
Source : Sefaz / PE
Due to Its level of economic development, the available supply of a more
skilled and specialized workforce, and the proximity of the port structure already
present in Pernambuco, it is perfectly natural that the Metropolitan Region of
Recife has welcomed the highest number of newly registered industrial
taxpayers, both in 2006 and in 2012.
In spite of this predominant metropolitan development, we have to
highlight the growing industrial base that is settling into some areas of the
interior of the state, such as the municipalities of Caruaru, Petrolina, Toritama,
Goiás, Carpina, Timbaúba, Vitoria de Santo Antao and Escada, which reached
significant increasing percentages in the registration growth of new industries.
In addition to this expansion in the degree of development of the interior
of the state, is worth highlighting the arrival of 1,657 new companies to the state
between the years 2007-2012. Upon analyzing the distribution figures of the
1,402 Companies industries, newly resident in the 29 major cities listed above,
we can identify 504 new taxpayers that settled outside the metropolitan area of
Recife, i.e 36% of the new industries established themselves in the main
36
developing regions of the interior. We believe that the policies of state tax
benefits aimed at the industrial sectors, especially, the PRODEPE program,
have greatly contributed to the settlement of companies in peripheric business
centers, given the proportionality of the incentives to the distance of the chosen
location from the metropolitan area of Recife, that is to say, the farthest the
location is from Recife, the highest tax incentives will be.
Coming back to the analysis of the IPM (Municipalities Participation
Index), the state government, under federal law, must annually calculate the
IPM in order to allocate to their municipalities the amount of 25% of all proceeds
resulting from the payment of ICMS, during the current financial year,
(according the constitutional law). The share of IPM, allocated to each
municipality is 75% in proportion to the Value Added (VA) and 25% related to
socio- environmental indicators, which can be regulated by the initiative of the
state governments. As the weight of the VA (75%) is considerably
representative in the calculation of IPM, the recorded annual results and
developments will be taken into analysis to establish the levels of state funds
granted; improving the prospects of municipal budgets which would allow a
greater use of public initiative to their population benefit.
Regarding the VA, resulting from the subtraction between sales declared
by companies and their respective purchases in the last two years preceding
the determination of the VA, is to be considered in the calculation of IPM of the
following year. This calculation reflects the level of economic development of
the municipality, considering all the economic information provided by all its
ICMS taxpayers, regardless of business size and economic sector.
In order to measure the effects of the implementation of industrial
projects sponsored by the PRODEPE program within municipalities and their
Development Regions, it is important to analyse the evolution of the VA
calculated for the years 2006 (period prior to analysis), 2008 and 2011, in the
major cities of the state and, wherever possible, link them to the number of
projects mentioned in Table 3.1.
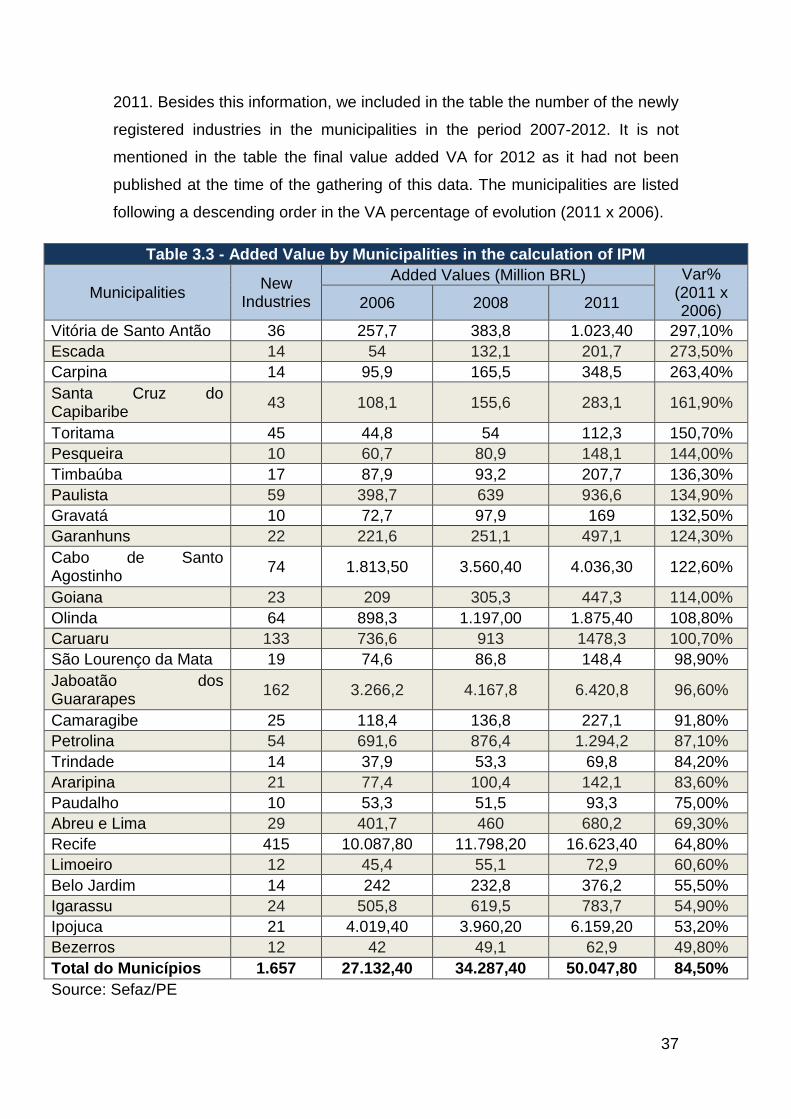
To this end, we can look at table 3.3 that discriminates VA for those
periods and calculates the percentage of evolution achieved between 2006 and
37
2011. Besides this information, we included in the table the number of the newly
registered industries in the municipalities in the period 2007-2012. It is not
mentioned in the table the final value added VA for 2012 as it had not been
published at the time of the gathering of this data. The municipalities are listed
following a descending order in the VA percentage of evolution (2011 x 2006).
Table 3.3 - Added Value by Municipalities in the calculation of IPM
Municipalities New
Industries
Added Values (Million BRL) Var% (2011 x 2006)
2006 2008 2011
Vitória de Santo Antão 36 257,7 383,8 1.023,40 297,10%
Escada 14 54 132,1 201,7 273,50%
Carpina 14 95,9 165,5 348,5 263,40%
Santa Cruz do Capibaribe
43 108,1 155,6 283,1 161,90%
Toritama 45 44,8 54 112,3 150,70%
Pesqueira 10 60,7 80,9 148,1 144,00%
Timbaúba 17 87,9 93,2 207,7 136,30%
Paulista 59 398,7 639 936,6 134,90%
Gravatá 10 72,7 97,9 169 132,50%
Garanhuns 22 221,6 251,1 497,1 124,30%
Cabo de Santo Agostinho
74 1.813,50 3.560,40 4.036,30 122,60%
Goiana 23 209 305,3 447,3 114,00%
Olinda 64 898,3 1.197,00 1.875,40 108,80%
Caruaru 133 736,6 913 1478,3 100,70%
São Lourenço da Mata 19 74,6 86,8 148,4 98,90%
Jaboatão dos Guararapes
162 3.266,2 4.167,8 6.420,8 96,60%
Camaragibe 25 118,4 136,8 227,1 91,80%
Petrolina 54 691,6 876,4 1.294,2 87,10%
Trindade 14 37,9 53,3 69,8 84,20%
Araripina 21 77,4 100,4 142,1 83,60%
Paudalho 10 53,3 51,5 93,3 75,00%
Abreu e Lima 29 401,7 460 680,2 69,30%
Recife 415 10.087,80 11.798,20 16.623,40 64,80%
Limoeiro 12 45,4 55,1 72,9 60,60%
Belo Jardim 14 242 232,8 376,2 55,50%
Igarassu 24 505,8 619,5 783,7 54,90%
Ipojuca 21 4.019,40 3.960,20 6.159,20 53,20%
Bezerros 12 42 49,1 62,9 49,80%
Total do Municípios 1.657 27.132,40 34.287,40 50.047,80 84,50%
Source: Sefaz/PE
38
As mentioned, the value added works as thermometer of the economic
performance of the municipalities as it makes measurements of the dynamics of
purchases made by local taxpayers and citizens, as well as representing the
level of sales of the companies settled in the cities, regardless of the
destination, whether local or directed to other regions. Even the settlement of
few industrial enterprises, provided they are large in business size provides not
only economic and social gains, but also the access to additional funds from the
state government to be received annually by the city, which was awarded the
project.
An example of this reasoning is given by the future arrival of factories
WHB (engine blocks) and Nissin Ajinomoto (food) in the municipality of Glória
do Goitá (Mata Norte). The implementation of the two plants will, in the near
future, determine a large increase in the inflow of state resources (IPM) through
the value added generated by them, allowing the municipality to adopt new
public policies that foster a better quality of life for its citizens.
Regardless of the number of new industries allocated to municipalities -
few large ones are enough, as in the case of Glória do Goitá - we find that
fourteen municipalities, including twelve RDs, belonging to the hinterland so
outside the Metropolitan Region of Recife, achieved a percentage of evolution
2011 x 2006, higher than 100% (when the State average was 84.5%). This
picture confirms, once again, the economic strength that the interior is gaining
by, decentralizing greatly the state economic dynamism, fuelled no doubt by the
settlement of industrial plants benefited by PRODEPE program.
The municipality of Vitoria de Santo Antão (Mata Sul), as is known,
presents itself as a new hub for the development of the interior, and his
leadership reflected in Table 3.2 consolidates its position at the economic
forefront. A major reason of this success is to be found in the opening in
November 2013, of the first major commercial center (Vitória Park Shopping), to
meet the strong demand for consumption, locally and from regions adjacent to
the city.
As the calculation of the value added, includes the performance of
commercial businesses (retail and wholesale) as well as industrial one, the

39
benefits in calculating the VA coming from the commercial sector, is related to
the consumer classes present in the municipalities. This is, of course, linked to
generation of employment and improvements in level of income offered by
companies. This higher level of consumption is found in a very impressive
manner, near the settlement of industrial projects that bring social benefits to
the local and surrounding population, as it has been happening with Vitoria de
Santo Antão, that in a few years, welcomed industrial plants of the size of
Sadia(factories), Kraft Foods and Isoeste. There is no doubt that workers of
these companies, whether or not domiciled in Victoria, began to consume in
establishments present in the city, providing an increase in the level of
commercial sales and thus ensuring a higher level of VA for the municipality.
Analysing further the harmony between the data contained in tables 3.1
and 3.2, we can note the almost symmetrical economic development
performance of the Mata Sul (Vitória and Escada), Mata Norte (Carpina,
Timbaúba and Goiana), Agreste Central (Caruaru and Gravatá) and RMR (the
municipalities of Paulista, Cabo de Santo Agostinho and Olinda). As for the
Metropolitan Region of Recife, mainly Recife city, it appears that seven of the
fifteen municipalities belonging to the region, showed an evolution percentage
of VA of less than 100%. So in terms of VA growth detailed in Table 3.2, we
note that the municipalities that already had more established commercial and
industrial centers (Jaboatão Guararapes and Ipojuca), or that did not receive
new structural projects (Abreu e Lima) or which lacked areas suitable to the
creation of industrial parks (Recife),were not presenting the highest rates of
value added evolution.
We can expect, in the forthcoming years 2015/2016, considerable future
added value with strong local effects on state resources, from the complete
implementation of automotive poles (FIAT), pharmacoquimico (Hemobrás),
glassmaker (Vivix - Flat Glass), structural projects that were granted tax relief,
in the city of Goiana, as well as from Ipojuca, due to the Abreu e Lima Refinery,
Petroquímica Suape and the expansion of the naval construction sector
(Atlantico Sul Shipyard and Vard Promar).

40
From the foregoing, there is no doubt about the strong connection
between the implementation of tax relief policies by PRODEPE Pernambuco,
PRODEAUTO and PRODINPE and the economic advances made in recent
years by many Municipalities, especially those of the interior.
This promising environment of tax incentives, which promoted the settling
of hundreds of industrial plants as well as the consolidation of the wholesale
network, reaffirming its vocation as a distribution center, and, of course, the
booming trade from the retail sector, represent the undeniable responsibility of
the federal government, the federal entities and society as a whole in
determining future national policies aiming to minimize social differences
between different regions of the country, without damaging what has already
been achieved by the less favoured States.
41
4 - The New Economy of Pernambuco and National
Indicators
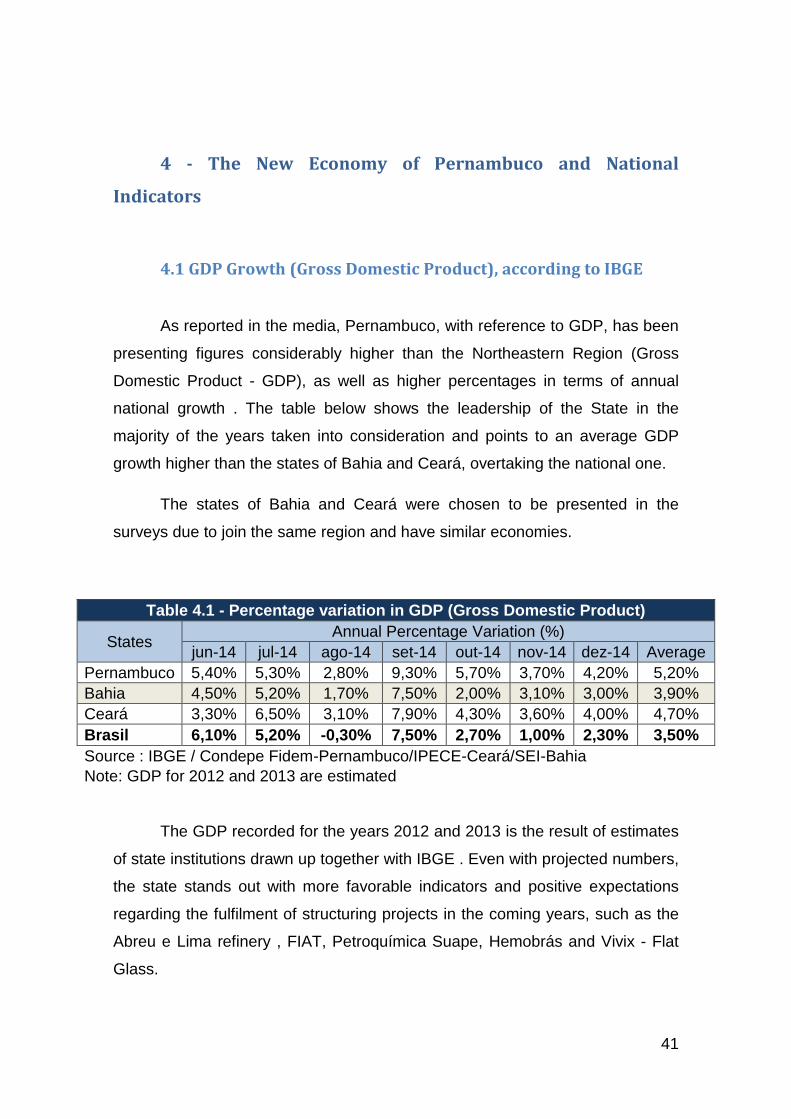
4.1 GDP Growth (Gross Domestic Product), according to IBGE
As reported in the media, Pernambuco, with reference to GDP, has been
presenting figures considerably higher than the Northeastern Region (Gross
Domestic Product - GDP), as well as higher percentages in terms of annual
national growth . The table below shows the leadership of the State in the
majority of the years taken into consideration and points to an average GDP
growth higher than the states of Bahia and Ceará, overtaking the national one.
The states of Bahia and Ceará were chosen to be presented in the
surveys due to join the same region and have similar economies.
Table 4.1 - Percentage variation in GDP (Gross Domestic Product)
States Annual Percentage Variation (%)
jun-14 jul-14 ago-14 set-14 out-14 nov-14 dez-14 Average
Pernambuco 5,40% 5,30% 2,80% 9,30% 5,70% 3,70% 4,20% 5,20%
Bahia 4,50% 5,20% 1,70% 7,50% 2,00% 3,10% 3,00% 3,90%
Ceará 3,30% 6,50% 3,10% 7,90% 4,30% 3,60% 4,00% 4,70%
Brasil 6,10% 5,20% -0,30% 7,50% 2,70% 1,00% 2,30% 3,50%
Source : IBGE / Condepe Fidem-Pernambuco/IPECE-Ceará/SEI-Bahia
Note: GDP for 2012 and 2013 are estimated
The GDP recorded for the years 2012 and 2013 is the result of estimates
of state institutions drawn up together with IBGE . Even with projected numbers,
the state stands out with more favorable indicators and positive expectations
regarding the fulfilment of structuring projects in the coming years, such as the
Abreu e Lima refinery , FIAT, Petroquímica Suape, Hemobrás and Vivix - Flat
Glass.
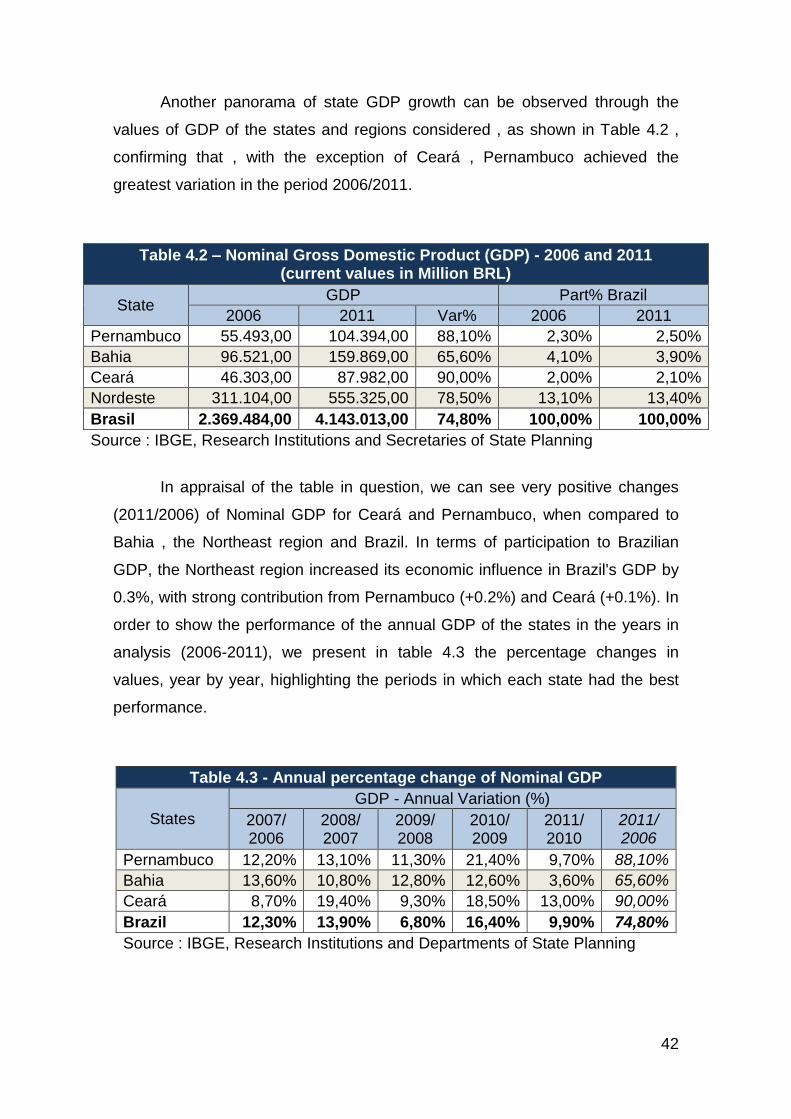
42
Another panorama of state GDP growth can be observed through the
values of GDP of the states and regions considered , as shown in Table 4.2 ,
confirming that , with the exception of Ceará , Pernambuco achieved the
greatest variation in the period 2006/2011.
Table 4.2 – Nominal Gross Domestic Product (GDP) - 2006 and 2011 (current values in Million BRL)
State GDP Part% Brazil
2006 2011 Var% 2006 2011
Pernambuco 55.493,00 104.394,00 88,10% 2,30% 2,50%
Bahia 96.521,00 159.869,00 65,60% 4,10% 3,90%
Ceará 46.303,00 87.982,00 90,00% 2,00% 2,10%
Nordeste 311.104,00 555.325,00 78,50% 13,10% 13,40%
Brasil 2.369.484,00 4.143.013,00 74,80% 100,00% 100,00%
Source : IBGE, Research Institutions and Secretaries of State Planning
In appraisal of the table in question, we can see very positive changes
(2011/2006) of Nominal GDP for Ceará and Pernambuco, when compared to
Bahia , the Northeast region and Brazil. In terms of participation to Brazilian
GDP, the Northeast region increased its economic influence in Brazil's GDP by
0.3%, with strong contribution from Pernambuco (+0.2%) and Ceará (+0.1%). In
order to show the performance of the annual GDP of the states in the years in
analysis (2006-2011), we present in table 4.3 the percentage changes in
values, year by year, highlighting the periods in which each state had the best
performance.
Table 4.3 - Annual percentage change of Nominal GDP
States
GDP - Annual Variation (%)
2007/ 2006
2008/ 2007
2009/ 2008
2010/ 2009
2011/ 2010
2011/ 2006
Pernambuco 12,20% 13,10% 11,30% 21,40% 9,70% 88,10%
Bahia 13,60% 10,80% 12,80% 12,60% 3,60% 65,60%
Ceará 8,70% 19,40% 9,30% 18,50% 13,00% 90,00%
Brazil 12,30% 13,90% 6,80% 16,40% 9,90% 74,80%
Source : IBGE, Research Institutions and Departments of State Planning
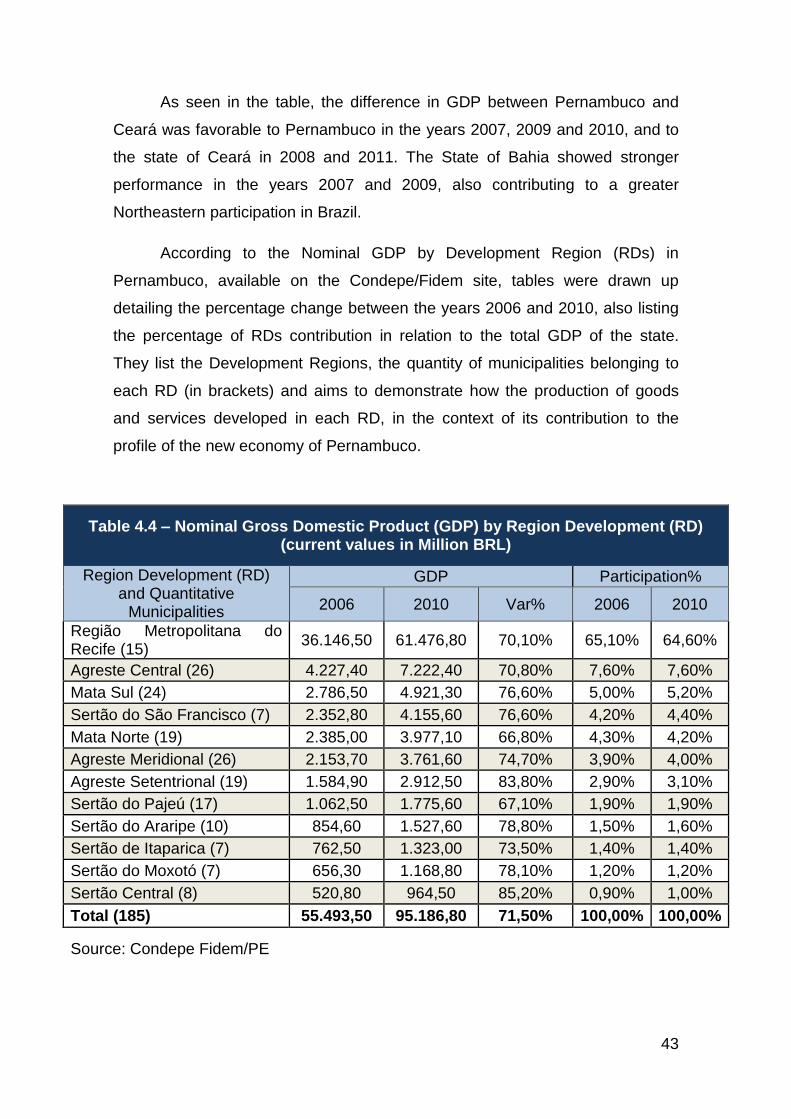
43
As seen in the table, the difference in GDP between Pernambuco and
Ceará was favorable to Pernambuco in the years 2007, 2009 and 2010, and to
the state of Ceará in 2008 and 2011. The State of Bahia showed stronger
performance in the years 2007 and 2009, also contributing to a greater
Northeastern participation in Brazil.
According to the Nominal GDP by Development Region (RDs) in
Pernambuco, available on the Condepe/Fidem site, tables were drawn up
detailing the percentage change between the years 2006 and 2010, also listing
the percentage of RDs contribution in relation to the total GDP of the state.
They list the Development Regions, the quantity of municipalities belonging to
each RD (in brackets) and aims to demonstrate how the production of goods
and services developed in each RD, in the context of its contribution to the
profile of the new economy of Pernambuco.
Table 4.4 – Nominal Gross Domestic Product (GDP) by Region Development (RD) (current values in Million BRL)
Region Development (RD) and Quantitative
Municipalities
GDP Participation%
2006 2010 Var% 2006 2010
Região Metropolitana do Recife (15)
36.146,50 61.476,80 70,10% 65,10% 64,60%
Agreste Central (26) 4.227,40 7.222,40 70,80% 7,60% 7,60%
Mata Sul (24) 2.786,50 4.921,30 76,60% 5,00% 5,20%
Sertão do São Francisco (7) 2.352,80 4.155,60 76,60% 4,20% 4,40%
Mata Norte (19) 2.385,00 3.977,10 66,80% 4,30% 4,20%
Agreste Meridional (26) 2.153,70 3.761,60 74,70% 3,90% 4,00%
Agreste Setentrional (19) 1.584,90 2.912,50 83,80% 2,90% 3,10%
Sertão do Pajeú (17) 1.062,50 1.775,60 67,10% 1,90% 1,90%
Sertão do Araripe (10) 854,60 1.527,60 78,80% 1,50% 1,60%
Sertão de Itaparica (7) 762,50 1.323,00 73,50% 1,40% 1,40%
Sertão do Moxotó (7) 656,30 1.168,80 78,10% 1,20% 1,20%
Sertão Central (8) 520,80 964,50 85,20% 0,90% 1,00%
Total (185) 55.493,50 95.186,80 71,50% 100,00% 100,00%
Source: Condepe Fidem/PE

44
The panorama in Table 4.4 displays an expansion in GDP of the regions
not linked to the Metropolitan Region of Recife, which denotes a
decentralization of state development towards the hinterland Development
Regions. In this sense we can note the increased contribution of Mata Sul
(+0.2%), led by the cities of Vitória de Santo Antão and Escada (industrial
expansion), Sertão do São Francisco (+0.2%), with the strong performance of
the municipality of Petrolina (due to extensive irrigation projects), Agreste
Meridional (+0.1%), led by the municipality of Garanhuns (agriculture),Agreste
Setentrional (+0.2%), driven mainly by economic expansion in the municipalities
of Santa Cruz do Capibaribe, Toritama and Surubim (textile hub); Sertão do
Arararipe (+0.1%) through the representativeness of Araripina (gypsum polo),
and Sertão Central (+0.1%) taking as an example of development the city of
Salgueiro (civil construction).
Even with GDP growth below the average recorded for the State
between 2006 and 2010 (+71.5%), we focus on economic growth in the
Metropolitan Area of Recife (+70.1%), highlighting the municipality of Ipojuca,
with an outstanding variation of 110.0% in GDP, achieved especially through
the business enterprises located in the Port of Suape . With regards to the
performance of Agreste Central (+70.8%), Caruaru presents itself as largely
responsible for the significant progress which took place between 2006 and
2010 with 70.4% increase.
Although the Mata Norte has recorded a GDP growth of 66.8% (below
the average of 71.5%) in the coming years, the region is expecting a new wave
of economic development, which would have a significant impact on its GDP,
given the implementation of auto polo (FIAT), the farmacoquímico (Hemobrás)
and glassmaker (Vivix Windows plans), all to be located in the city of Goiana,
which, between 2006 and 2010, reached its GDP percentage change in the
order of 65.9% (table 4.5).
In line with the analysis of regional development within the state in terms
of Nominal GDP, we list in Table 4.5 the 50 largest cities which recorded GDP
of over R$ 200 million in 2010, amounting to 87% of the state GDP. In Table 4.5
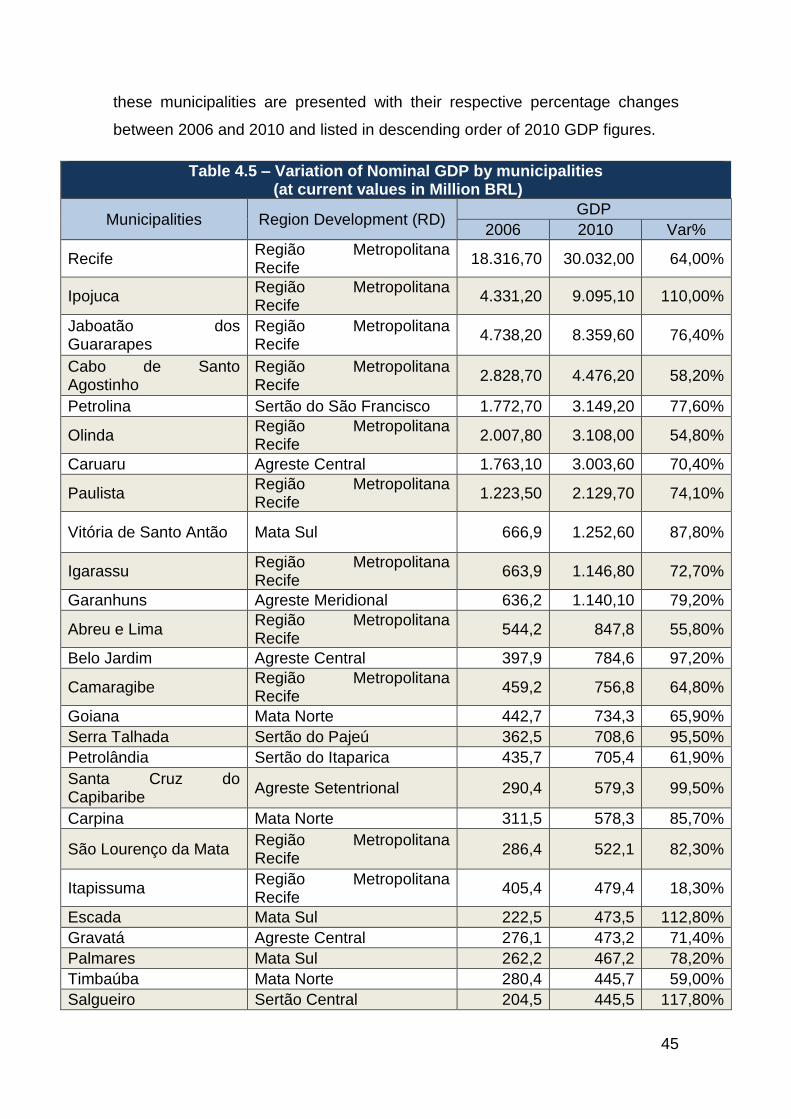
45
these municipalities are presented with their respective percentage changes
between 2006 and 2010 and listed in descending order of 2010 GDP figures.
Table 4.5 – Variation of Nominal GDP by municipalities (at current values in Million BRL)
Municipalities Region Development (RD) GDP
2006 2010 Var%
Recife Região Metropolitana Recife
18.316,70 30.032,00 64,00%
Ipojuca Região Metropolitana Recife
4.331,20 9.095,10 110,00%
Jaboatão dos Guararapes
Região Metropolitana Recife
4.738,20 8.359,60 76,40%
Cabo de Santo Agostinho
Região Metropolitana Recife
2.828,70 4.476,20 58,20%
Petrolina Sertão do São Francisco 1.772,70 3.149,20 77,60%
Olinda Região Metropolitana Recife
2.007,80 3.108,00 54,80%
Caruaru Agreste Central 1.763,10 3.003,60 70,40%
Paulista Região Metropolitana Recife
1.223,50 2.129,70 74,10%
Vitória de Santo Antão Mata Sul 666,9 1.252,60 87,80%
Igarassu Região Metropolitana Recife
663,9 1.146,80 72,70%
Garanhuns Agreste Meridional 636,2 1.140,10 79,20%
Abreu e Lima Região Metropolitana Recife
544,2 847,8 55,80%
Belo Jardim Agreste Central 397,9 784,6 97,20%
Camaragibe Região Metropolitana Recife
459,2 756,8 64,80%
Goiana Mata Norte 442,7 734,3 65,90%
Serra Talhada Sertão do Pajeú 362,5 708,6 95,50%
Petrolândia Sertão do Itaparica 435,7 705,4 61,90%
Santa Cruz do Capibaribe
Agreste Setentrional 290,4 579,3 99,50%
Carpina Mata Norte 311,5 578,3 85,70%
São Lourenço da Mata Região Metropolitana Recife
286,4 522,1 82,30%
Itapissuma Região Metropolitana Recife
405,4 479,4 18,30%
Escada Mata Sul 222,5 473,5 112,80%
Gravatá Agreste Central 276,1 473,2 71,40%
Palmares Mata Sul 262,2 467,2 78,20%
Timbaúba Mata Norte 280,4 445,7 59,00%
Salgueiro Sertão Central 204,5 445,5 117,80%

46
Arcoverde Sertão do Moxotó 259,9 415,9 60,00%
Araripina Sertão do Araripe 235,3 413,7 75,80%
Surubim Agreste Setentrional 186,4 357,5 91,80%
Pesqueira Agreste Central 212,8 345,8 62,50%
Bezerros Agreste Central 213,7 337,2 57,80%
Limoeiro Agreste Setentrional 201,5 324,7 61,10%
Sirinhaém Mata Sul 165,8 319 92,40%
Bom Conselho Agreste Meridional 139,9 310,6 122,00%
Ouricuri Sertão do Araripe 179,6 309 72,00%
Moreno Região Metropolitana Recife
196,5 303,7 54,60%
Floresta Sertão do Itaparica 134,7 286,2 112,50%
São Bento do Uma Agreste Central 174,5 285,3 63,50%
Santa Maria da Boa Vista
Sertão do São Francisco 203,4 274,6 35,00%
Buíque Agreste Meridional 153,1 272,6 78,10%
Paudalho Mata Norte 156,5 264,7 69,10%
Ribeirão Mata Sul 143,9 255,9 77,80%
Lagoa Grande Sertão do São Francisco 134 251,7 87,80%
Nazaré da Mata Mata Norte 145,1 232,4 60,20%
Lagoa de Itaenga Mata Norte 114,7 222,7 94,20%
Toritama Agreste Setentrional 108,3 222,2 105,20%
Custódia Sertão do Moxotó 100,8 207,6 106,00%
Bonito Agreste Central 140 203,3 45,20%
Itambé Mata Norte 133,1 201,6 51,50%
Barreiros Mata Sul 125,4 201,2 60,40%
Total (50 municípios) 48.089,40 82.713,70 72,00%
Source : Condepe Fidem / PE
Even considering that this study aims to identify the new profile of the
economy of Pernambuco from the perspective of revenue in the industrial,
wholesale and retail business for the period 2007-2012, we ought to consider
the relationship between GDP growth in the period 2006-2010 (Table 4.5) and
the increment in the number of registered taxpayers between) 2006 to 2012 in
several municipalities in the state. It is the case of municipalities that have
achieved positive growth (above 80% of GDP) and have recorded an increase
in the number of registered of taxpayers : Ipojuca (110% GDP growth and
taxpayers increase of approximately 166.7%), Vitoria de Santo Antão (87.8%
and 136.1%), Santa Cruz Capibaribe (9.5% and 114.1%), Escada (112.8% and
179.3%), Salgueiro (117.8% and 159.5%), Carpina (85.7% and 108.2%) and
São Lourenço da Mata (2.3% and 150.0%).
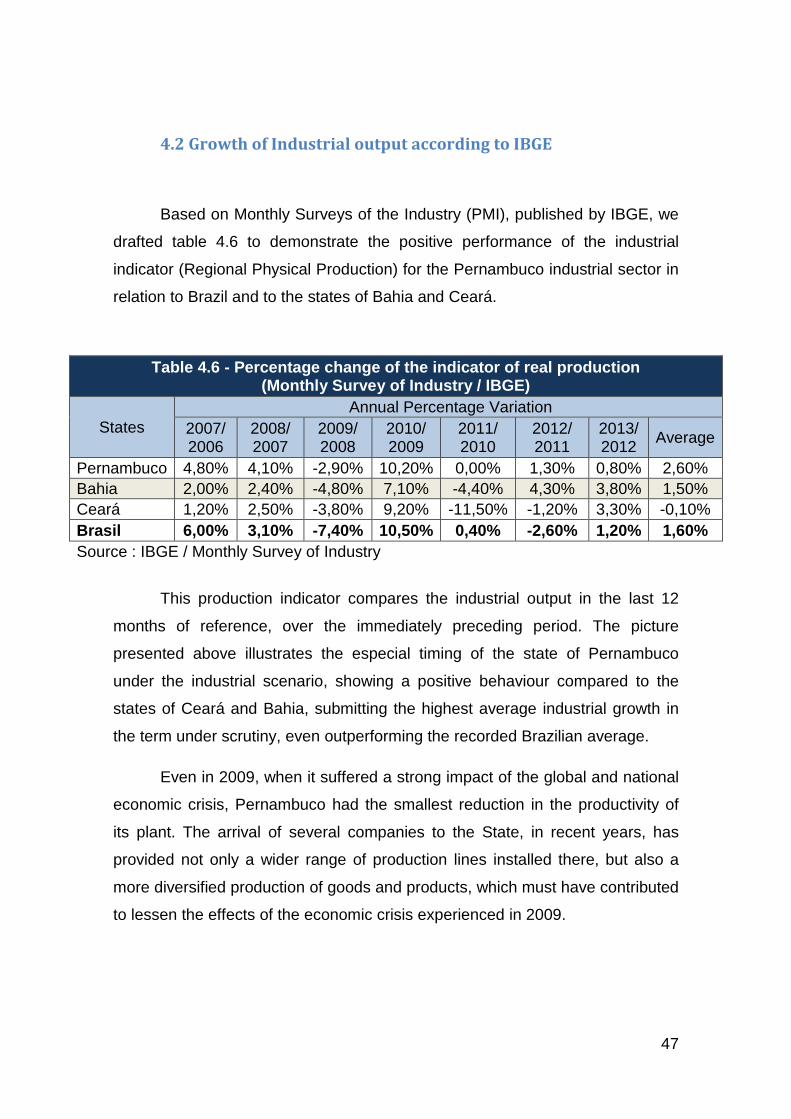
47
4.2 Growth of Industrial output according to IBGE
Based on Monthly Surveys of the Industry (PMI), published by IBGE, we
drafted table 4.6 to demonstrate the positive performance of the industrial
indicator (Regional Physical Production) for the Pernambuco industrial sector in
relation to Brazil and to the states of Bahia and Ceará.
Table 4.6 - Percentage change of the indicator of real production (Monthly Survey of Industry / IBGE)
States
Annual Percentage Variation
2007/ 2006
2008/ 2007
2009/ 2008
2010/ 2009
2011/ 2010
2012/ 2011
2013/ 2012
Average
Pernambuco 4,80% 4,10% -2,90% 10,20% 0,00% 1,30% 0,80% 2,60%
Bahia 2,00% 2,40% -4,80% 7,10% -4,40% 4,30% 3,80% 1,50%
Ceará 1,20% 2,50% -3,80% 9,20% -11,50% -1,20% 3,30% -0,10%
Brasil 6,00% 3,10% -7,40% 10,50% 0,40% -2,60% 1,20% 1,60%
Source : IBGE / Monthly Survey of Industry
This production indicator compares the industrial output in the last 12
months of reference, over the immediately preceding period. The picture
presented above illustrates the especial timing of the state of Pernambuco
under the industrial scenario, showing a positive behaviour compared to the
states of Ceará and Bahia, submitting the highest average industrial growth in
the term under scrutiny, even outperforming the recorded Brazilian average.
Even in 2009, when it suffered a strong impact of the global and national
economic crisis, Pernambuco had the smallest reduction in the productivity of
its plant. The arrival of several companies to the State, in recent years, has
provided not only a wider range of production lines installed there, but also a
more diversified production of goods and products, which must have contributed
to lessen the effects of the economic crisis experienced in 2009.

48
4.3 Retail growth, according to IBGE
In the retail sector, the Monthly Retail Trade Survey, published by IBGE,
which aims to measure the revenue of sales in the retail trade sector, also
reflects a significant growth of consumption in Brazil and the major Northeast
states analysed over six years (2007-2013). Differently from what shown in the
analysis of the industrial sector, Pernambuco has no leadership on the average
of the indicators against the Northeastern states (Ceará had the best
performance), but delivers a sustainable percentage of annual revenue growth
in the commercial sector, as we can see in Table 4.7.
Table 4.7 - Percentage change revenue from the retail trade sector (Monthly Survey of Trade / IBGE)
States
Annual Percentage Variation
2007/ 2006
2008/ 2007
2009/ 2008
2010/ 2009
2011/ 2010
2012/ 2011
2013/ 2012
Average
Pernambuco 16,60% 13,10% 9,30% 17,10% 8,40% 11,00% 11,00% 12,40%
Bahia 14,00% 13,80% 8,60% 13,90% 7,00% 12,40% 7,50% 11,00%
Ceará 15,80% 16,60% 11,80% 20,10% 10,10% 10,90% 6,00% 13,00%
Brasil 15,10% 15,10% 7,80% 15,10% 9,40% 9,50% 8,90% 11,60%
Source : IBGE / Monthly Survey of Trade
4.4 Unemployment Rate of Major metropolitan areas, according
to IBGE
After this introduction of positive signs shown in the economic field, we
are going to evaluate the social repercussions of the economic expansion
recorded in the state, through IBGE (Table 4.8) showing the large reduction in
the unemployment rate experienced over the years in question.
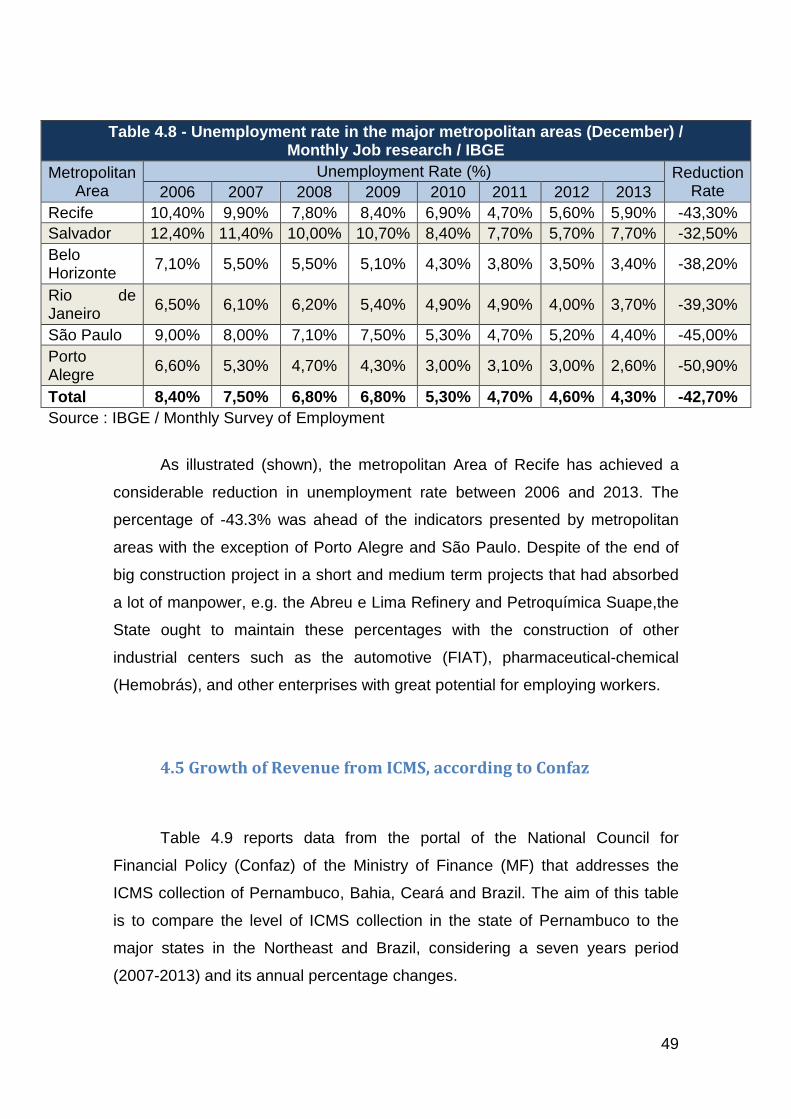
49
Table 4.8 - Unemployment rate in the major metropolitan areas (December) / Monthly Job research / IBGE
Metropolitan Area
Unemployment Rate (%) Reduction Rate 2006 2007 2008 2009 2010 2011 2012 2013
Recife 10,40% 9,90% 7,80% 8,40% 6,90% 4,70% 5,60% 5,90% -43,30%
Salvador 12,40% 11,40% 10,00% 10,70% 8,40% 7,70% 5,70% 7,70% -32,50%
Belo Horizonte
7,10% 5,50% 5,50% 5,10% 4,30% 3,80% 3,50% 3,40% -38,20%
Rio de Janeiro
6,50% 6,10% 6,20% 5,40% 4,90% 4,90% 4,00% 3,70% -39,30%
São Paulo 9,00% 8,00% 7,10% 7,50% 5,30% 4,70% 5,20% 4,40% -45,00%
Porto Alegre
6,60% 5,30% 4,70% 4,30% 3,00% 3,10% 3,00% 2,60% -50,90%
Total 8,40% 7,50% 6,80% 6,80% 5,30% 4,70% 4,60% 4,30% -42,70%
Source : IBGE / Monthly Survey of Employment
As illustrated (shown), the metropolitan Area of Recife has achieved a
considerable reduction in unemployment rate between 2006 and 2013. The
percentage of -43.3% was ahead of the indicators presented by metropolitan
areas with the exception of Porto Alegre and São Paulo. Despite of the end of
big construction project in a short and medium term projects that had absorbed
a lot of manpower, e.g. the Abreu e Lima Refinery and Petroquímica Suape,the
State ought to maintain these percentages with the construction of other
industrial centers such as the automotive (FIAT), pharmaceutical-chemical
(Hemobrás), and other enterprises with great potential for employing workers.
4.5 Growth of Revenue from ICMS, according to Confaz
Table 4.9 reports data from the portal of the National Council for
Financial Policy (Confaz) of the Ministry of Finance (MF) that addresses the
ICMS collection of Pernambuco, Bahia, Ceará and Brazil. The aim of this table
is to compare the level of ICMS collection in the state of Pernambuco to the
major states in the Northeast and Brazil, considering a seven years period
(2007-2013) and its annual percentage changes.
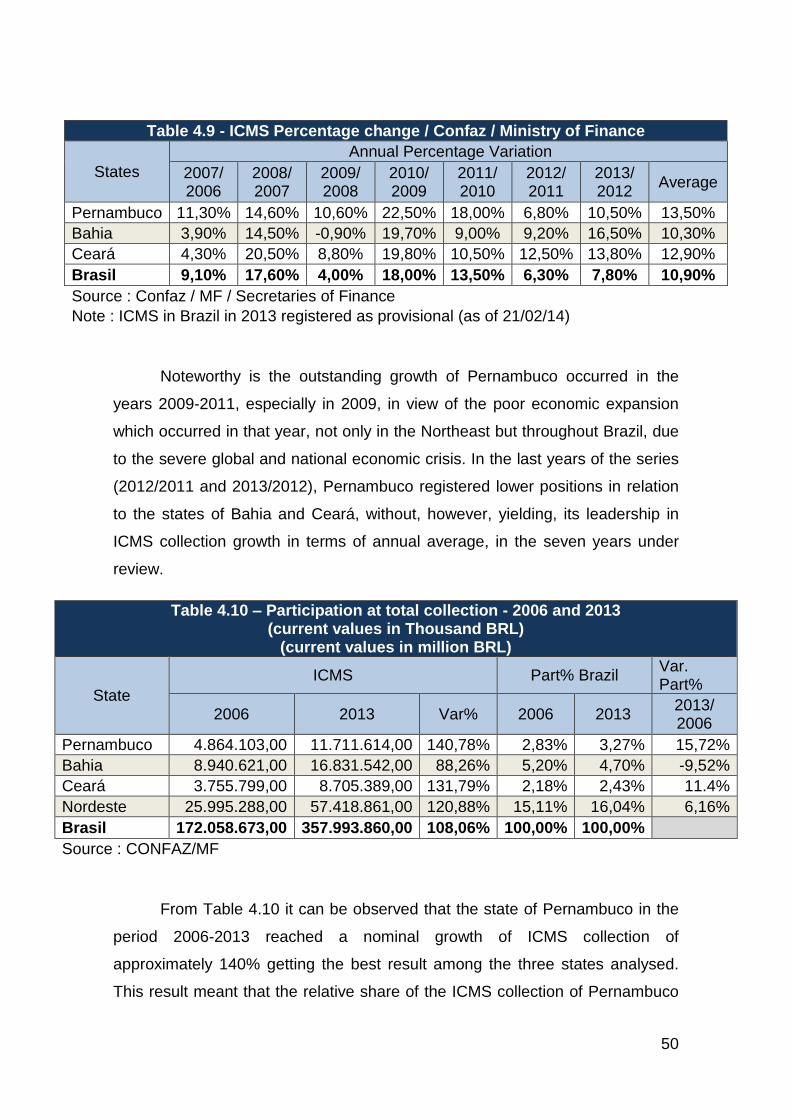
50
Table 4.9 - ICMS Percentage change / Confaz / Ministry of Finance
States
Annual Percentage Variation
2007/ 2006
2008/ 2007
2009/ 2008
2010/ 2009
2011/ 2010
2012/ 2011
2013/ 2012
Average
Pernambuco 11,30% 14,60% 10,60% 22,50% 18,00% 6,80% 10,50% 13,50%
Bahia 3,90% 14,50% -0,90% 19,70% 9,00% 9,20% 16,50% 10,30%
Ceará 4,30% 20,50% 8,80% 19,80% 10,50% 12,50% 13,80% 12,90%
Brasil 9,10% 17,60% 4,00% 18,00% 13,50% 6,30% 7,80% 10,90%
Source : Confaz / MF / Secretaries of Finance
Note : ICMS in Brazil in 2013 registered as provisional (as of 21/02/14)
Noteworthy is the outstanding growth of Pernambuco occurred in the
years 2009-2011, especially in 2009, in view of the poor economic expansion
which occurred in that year, not only in the Northeast but throughout Brazil, due
to the severe global and national economic crisis. In the last years of the series
(2012/2011 and 2013/2012), Pernambuco registered lower positions in relation
to the states of Bahia and Ceará, without, however, yielding, its leadership in
ICMS collection growth in terms of annual average, in the seven years under
review.
Table 4.10 – Participation at total collection - 2006 and 2013 (current values in Thousand BRL)
(current values in million BRL)
State
ICMS Part% Brazil Var. Part%
2006 2013 Var% 2006 2013 2013/ 2006
Pernambuco 4.864.103,00 11.711.614,00 140,78% 2,83% 3,27% 15,72%
Bahia 8.940.621,00 16.831.542,00 88,26% 5,20% 4,70% -9,52%
Ceará 3.755.799,00 8.705.389,00 131,79% 2,18% 2,43% 11.4%
Nordeste 25.995.288,00 57.418.861,00 120,88% 15,11% 16,04% 6,16%
Brasil 172.058.673,00 357.993.860,00 108,06% 100,00% 100,00%
Source : CONFAZ/MF
From Table 4.10 it can be observed that the state of Pernambuco in the
period 2006-2013 reached a nominal growth of ICMS collection of
approximately 140% getting the best result among the three states analysed.
This result meant that the relative share of the ICMS collection of Pernambuco

51
in Brazil's total revenues had increased from 2.83% to 3.27% (up 15.72%),
arguably the best result.
The environment of opportunities generated by the installation of
structural projects such as the Atlântico Sul Shipyard, the Abreu e Lima
Refinery and Petroquímica Suape, as well as the prime location of the state and
the modern infrastructure of the Port of Suape, combined with a consistent
policy of fiscal incentives, have attracted hundreds of companies that are
contributing to the expansion of the tax base, providing impulse to the economy
of Pernambuco.
We also need to consider the high level of investments made by the
State to provide the business community with the necessary conditions for the
successful installation of new enterprises, including the development of policies
that support the creation of industrial districts, the supply of strategic resources
(water, power and gas), and the application of finances resources in order to
improve mobility.
Important to the result achieved, in addition to these strategic factors is
the emergence of a new consumer range that originated from the high
employment rate which occurred in the State.
To this, contributed greatly the installation of new businesses as well as
the implementation of public policies aimed at raising the spending power of the
lower social classes, determining the expansion of the tax base to which we
refer.
4.6 International Trade Growth
Table 4:11 indicates a growth in total exports of Pernambuco between
2007 and 2013 of 128%, leading to an improvement of the state's share of total
exports from Brazil of 0.5% to 0.8%, representing an increase of 51.7%, mainly
due to the start of exports of the shipbuilding industry.
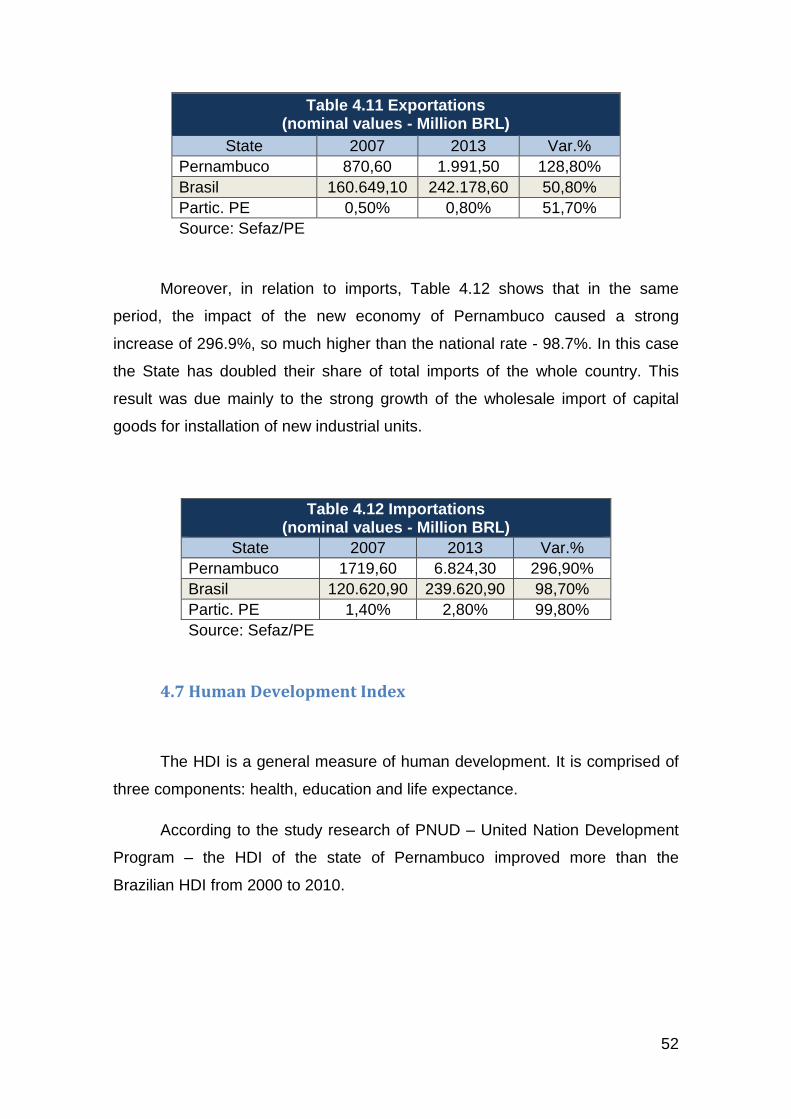
52
Table 4.11 Exportations (nominal values - Million BRL)
State 2007 2013 Var.%
Pernambuco 870,60 1.991,50 128,80%
Brasil 160.649,10 242.178,60 50,80%
Partic. PE 0,50% 0,80% 51,70%
Source: Sefaz/PE
Moreover, in relation to imports, Table 4.12 shows that in the same
period, the impact of the new economy of Pernambuco caused a strong
increase of 296.9%, so much higher than the national rate - 98.7%. In this case
the State has doubled their share of total imports of the whole country. This
result was due mainly to the strong growth of the wholesale import of capital
goods for installation of new industrial units.
Table 4.12 Importations (nominal values - Million BRL)
State 2007 2013 Var.%
Pernambuco 1719,60 6.824,30 296,90%
Brasil 120.620,90 239.620,90 98,70%
Partic. PE 1,40% 2,80% 99,80%
Source: Sefaz/PE
4.7 Human Development Index
The HDI is a general measure of human development. It is comprised of
three components: health, education and life expectance.
According to the study research of PNUD – United Nation Development
Program – the HDI of the state of Pernambuco improved more than the
Brazilian HDI from 2000 to 2010.

53
Table 4.13 HDI – Variation of the Human Development Index 2000- 2010
State 2000 2010 Var.%
Pernambuco 0,544 0,673 23,71%
Brasil 0,612 0,727 18,79%
Source: PNUD
Despite this fact and that there are a few some individual cases of
municipalities in which the HDI has shown some improvement is evident by
comparing the HDI of Pernambuco with the Brazilian one that the expected
development is still under way.
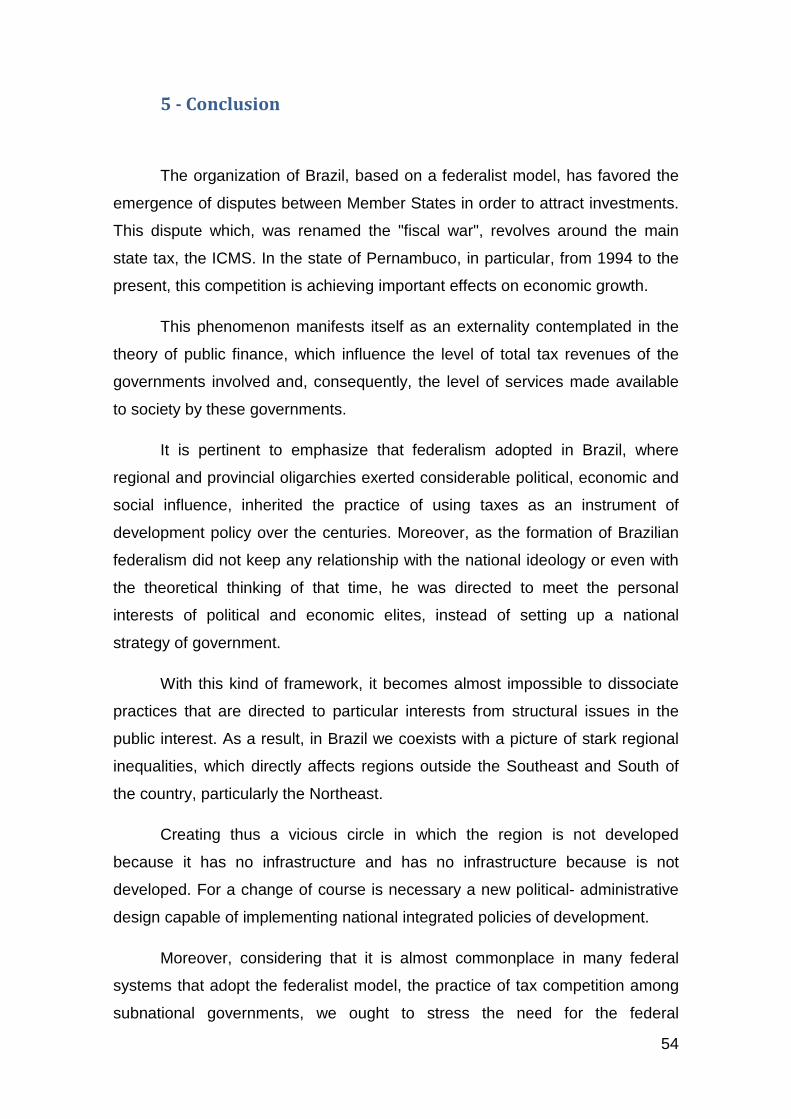
54
5 - Conclusion
The organization of Brazil, based on a federalist model, has favored the
emergence of disputes between Member States in order to attract investments.
This dispute which, was renamed the "fiscal war", revolves around the main
state tax, the ICMS. In the state of Pernambuco, in particular, from 1994 to the
present, this competition is achieving important effects on economic growth.
This phenomenon manifests itself as an externality contemplated in the
theory of public finance, which influence the level of total tax revenues of the
governments involved and, consequently, the level of services made available
to society by these governments.
It is pertinent to emphasize that federalism adopted in Brazil, where
regional and provincial oligarchies exerted considerable political, economic and
social influence, inherited the practice of using taxes as an instrument of
development policy over the centuries. Moreover, as the formation of Brazilian
federalism did not keep any relationship with the national ideology or even with
the theoretical thinking of that time, he was directed to meet the personal
interests of political and economic elites, instead of setting up a national
strategy of government.
With this kind of framework, it becomes almost impossible to dissociate
practices that are directed to particular interests from structural issues in the
public interest. As a result, in Brazil we coexists with a picture of stark regional
inequalities, which directly affects regions outside the Southeast and South of
the country, particularly the Northeast.
Creating thus a vicious circle in which the region is not developed
because it has no infrastructure and has no infrastructure because is not
developed. For a change of course is necessary a new political- administrative
design capable of implementing national integrated policies of development.
Moreover, considering that it is almost commonplace in many federal
systems that adopt the federalist model, the practice of tax competition among
subnational governments, we ought to stress the need for the federal
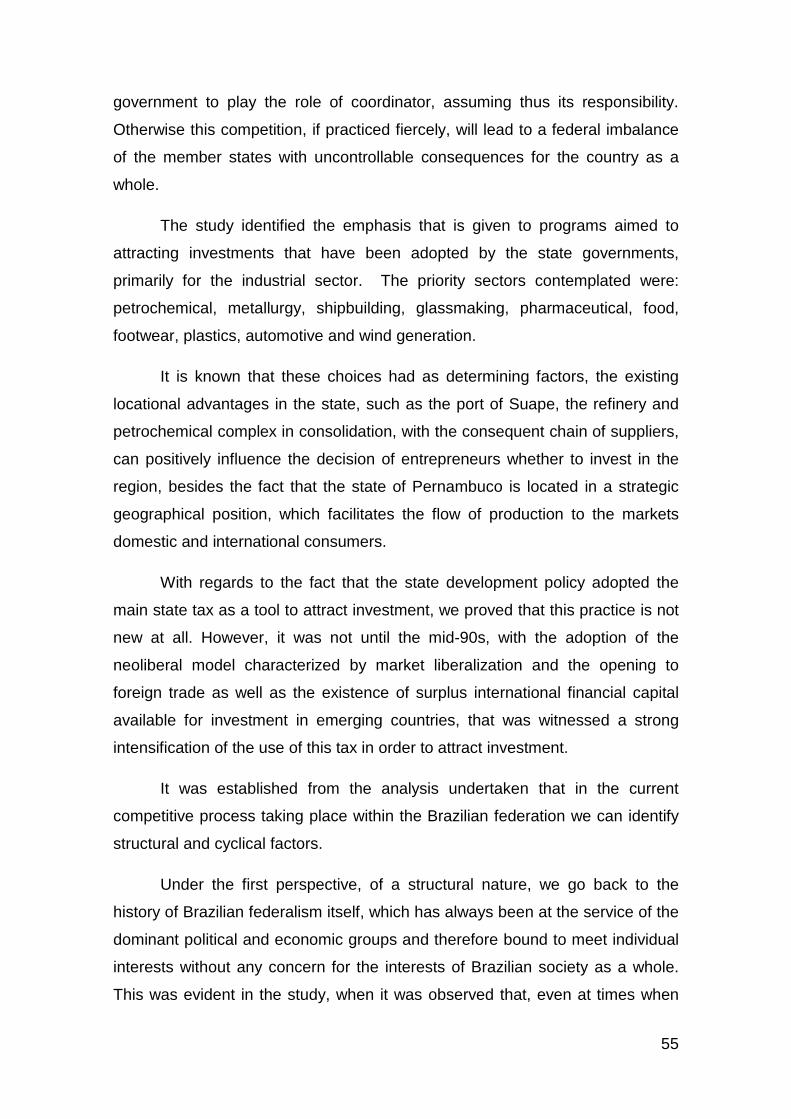
55
government to play the role of coordinator, assuming thus its responsibility.
Otherwise this competition, if practiced fiercely, will lead to a federal imbalance
of the member states with uncontrollable consequences for the country as a
whole.
The study identified the emphasis that is given to programs aimed to
attracting investments that have been adopted by the state governments,
primarily for the industrial sector. The priority sectors contemplated were:
petrochemical, metallurgy, shipbuilding, glassmaking, pharmaceutical, food,
footwear, plastics, automotive and wind generation.
It is known that these choices had as determining factors, the existing
locational advantages in the state, such as the port of Suape, the refinery and
petrochemical complex in consolidation, with the consequent chain of suppliers,
can positively influence the decision of entrepreneurs whether to invest in the
region, besides the fact that the state of Pernambuco is located in a strategic
geographical position, which facilitates the flow of production to the markets
domestic and international consumers.
With regards to the fact that the state development policy adopted the
main state tax as a tool to attract investment, we proved that this practice is not
new at all. However, it was not until the mid-90s, with the adoption of the
neoliberal model characterized by market liberalization and the opening to
foreign trade as well as the existence of surplus international financial capital
available for investment in emerging countries, that was witnessed a strong
intensification of the use of this tax in order to attract investment.
It was established from the analysis undertaken that in the current
competitive process taking place within the Brazilian federation we can identify
structural and cyclical factors.
Under the first perspective, of a structural nature, we go back to the
history of Brazilian federalism itself, which has always been at the service of the
dominant political and economic groups and therefore bound to meet individual
interests without any concern for the interests of Brazilian society as a whole.
This was evident in the study, when it was observed that, even at times when

56
the federal government intervened in the economy through the formulation of
macroeconomic policies, the weight of the oligarchs was ever-present.
Under the second perspective, the situational factors identified, among
other things, that the adoption of the neoliberal model allowed the resumption of
foreign investment. Capitals began to flow to the states, and the foreign
companies obtained public resources for their investments, through expert
consultants, known as "lobbyists".
Thus, the analysis of the effects the policy adopted by the government of
the State of Pernambuco for attracting investments, in the context of a fierce tax
competition environment, even though no additional data for a more accurate
assessment are available, allows the following conclusions:
a) there was industrial growth in Pernambuco with some degree of spatial
decentralization towards the interior of the state;
b) segments characterized by an easy mobility of their capital settled in the
state because of the granting of tax and financial incentives, as is the
case of the food industry in the municipality of Vitoria de Santo Antão,
and industrial beverage complexes, located in some municipalities of
Pernambuco;
c) the segments that have lower mobility of capital, such as, the enterprises
of the petrochemical chain, naval construction and automotive sectors,
settled, not only attracted by higher profit margins, due to the (financial)
tax incentives offered, but also because of the traditional production
factors offered (proximity to consumers, skilled labor, infrastructure), and
the already diversified industrial park in the state.
Therefore, it shows that Pernambuco, of all the states in the Northeast,
which adopted the same development policy model, was the state with the
highest growth in the region in the period between 2006 and 2013. As shown in
Chapter 4, Pernambuco State recorded an increase of its stake in Brazil's GDP
from 2.3% in 2006 to 2.5 % in 2011. It might seem little in nominal terms,
however, represents an increase of 8.7% in its relative contribution.
Another indicator used to measure the level of growth of the state is the
increase in the volume of international trade in goods in the period 2007-2013,

57
as shown in section 4.6. During this period exports grew in the order of 128 %,
while imports that had the remarkable growth of 296 %, which doubled the
participation of Pernambuco in the whole Brazilian imports.
Adding to this indicator, data from ICMS collection we are able to state
this policy has constituted a success for the state. The analysis of the collection
of this tax in the State of Pernambuco, when compared to the collection of other
Brazilian states, reveals that, despite all the tax benefits granted, showed an
increase from 2.83 % in 2006 to 3,27 % in 2013 of the total ICMS collected in
Brazil, while the Northeast Region in the same period increase only from 15,1%
to 16,0% and the Southeast Region in the period considered, recorded a
decrease in its share of the national total, from 55.0 % to 52.3 %.
Considering the effect of the incentives on unemployment rate, which we
presented in Chapter 4, the metropolitan region of Recife achieved a
considerable reduction of 43.3 % in the rate of unemployment between 2006
and 2013, placing it among the top three results for Brazilian metropolitan
regions.
In addition to these indicators, which allow some degree of accuracy in
describing the aggressive tax policy of the state, we took into consideration the
behavior of the participation rate in each municipality, determined by the State
Treasury, which takes into account for its calculation the company’s revenue.
This index has shown positive changes in almost all the municipalities covered
by the program, as demonstrated in Chapter 3.
If, on the one hand, there is no doubt about the recent economic growth
of the State of Pernambuco, supported by an aggressive policy to attract
investments to the state, in terms of GDP increase, tax revenue, jobs created,
IPM increase and intensification of foreign trade arising from the settlement of
new businesses, on the other hand is evident, by analyzing the indicator Human
Development Index - IDH - that the expected social development is still under
way, although there are a few some individual cases in which the HDI of
municipalities has already shown some improvement.

58
Given this setting, it becomes clear the urgent need for a multilateral
effort by federal, state and local governments, which by forgoing their isolated
interests, could find a solution that eliminates the negative aspects of the
predatory competition experienced today. At the same time, suggesting a
federative pact with a healthy level of competition that is able to promote,
among other things, the running of public services according to the preferences
of the citizens, strengthening of the accountability of politicians, the restriction of
tax powers in respect to their ability to extract resources from the private sector
and improving the quality, the amount and the access to public services.
59
Referências Bibliográficas
BRASIL. Ministério da Integração Nacional - Projeto Diretrizes para
formulação de políticas de desenvolvimento regional e de ordenação do
território brasileiro; Relatório Final - Brasília, 2005;
FFEB, Caderno 2º - Competição Fiscal – Baratto, Gedalva – Liebel,
Marlon – Oliveira, Eli – Pereira, Iara – Medeiros Elísia - & outros. Coord Sérgio
Prado- 2006;
BARRATO, Gedalva – Dissertação de Mestrado : CMS – Alternativas
para Tributar as Operações e Prestações Interestaduais e para Partilhar o
Produto da Arrecadação - Universidade Federal do Paraná – Curitiba PR -
2005;
PINTO, E. M. Dissertação de Mestrado - Política fiscal e seus efeitos no
desenvolvimento regional do Estado da Bahia: um estudo sobre os incentivos
fiscais no Estado da Bahia no período de 1994 a 2005. / Elísia Medeiros Pinto –
Salvador – 2006;
EGITO, C. A. Nota Técnica: Programas de Incentivos Fiscais do Estado
de Pernambuco/2013;
FROTA, I. L.N. Tese de Doutorado - Evolução recente da economia
pernambucana: as políticas em curso e seus impactos no crescimento do
Estado / Isabella Leitão Neves Frota. - Recife - 2013;
COUTINHO, J. H. F. M – Tese de Doutorado: A mitigação das
desigualdades socioeconômicas por meio de normas tributárias indutoras -
2011/ João Hélio de Farias Moraes Coutinho;
SILVA, R. G.: Dissertação de Mestrado: As Dificuldades da Reforma
Tributária como um Jogo das Elites na Visão das Elites Pernambucanas – RJ –
2010/ RICARDO GUIMARÃES DA SILVA;
FERREIRA, G. D. Políticas estaduais de desenvolvimento e “guerra
fiscal”- Dissertação de Mestrado. Instituto de Economia UNICAMP/ 2005;
60
MORAES, M. R. de. As relações intergovernamentais na República
Federal da Alemanha: uma análise econômico-institucional. São Paulo:
Fundação Konrad Adenauer, 2001;
PRADO, S. “Distribuição intergovernamental de recursos na Federação
brasileira”.
REZENDE, F.; OLIVEIRA, F. A. Descentralização e federalismo fiscal no
Brasil: desafios da reforma tributária. Rio de Janeiro: Konrad Adenauer
Stiftung, 2003;
PRADO, S. “Guerra fiscal” e políticas de desenvolvimento estadual no
Brasil. Texto para discussão, 2005;
PRADO, S. “Competição fiscal”. In Seminário internacional sobre
competição fiscal e desigualdades regionais, 1, 2005a, Belém;
REZENDE, F. Modernização tributária e federalismo fiscal. In:
REZENDE, F.;
SHAH, A. Competição inter-regional e cooperação federal (competir ou
cooperar? Não é essa a questão). Fórum internacional sobre federalismo.
Veracruz, Novembro, 2001;
VARSANO, R. A “guerra fiscal” do ICMS: quem ganha e quem perde.
Texto para discussão nº 500, Rio de Janeiro, IPEA, 1997.
COSTA, Cosme Maranhão - A Nova Economia de Pernambuco - Análise
Econômico-fiscal dos Setores Industrial, Atacadista e Varejista/ 2014.
Related Documents