ASEAN Journal of Psychiatry ___________________________________________________________ Advisory Board Pichet Udomratn, MD. President of the ASEAN Federation for Psychiatry and Mental Health & President of the Psychiatric Association of Thailand Syamsul Hadi, MD. President of the Indonesian Psychiatric Association Mohamad Hussain Habil, MBBS. President of the Malaysian Psychiatric Association Felicitas Artiaga-Soriano, MD. President of the Philippines Psychiatric Association Hong Choon Chua, MBBS. President of the Singapore Psychiatric Association Editor Manit Srisurapanont, MD. Department of Psychiatry, Faculty of Medicine, Chiang Mai University Muang, Chiang Mai, Thailand 50200 Tel: + 66 53 945 422; Fax: + 66 53 945 426; Email: [email protected] Associate Editors Sawitri Assanangkornchai, MD., Ph.D. (Prince of Songkla University, Songkhla, Thailand) Mohamad Hussain Habil, MBBS. (University of Malaya, Kuala Lumpur, Malaysia) Orawan Silpakit, MD. (Srithanya Hospital, Bangkok, Thailand) Nahathai Wongpakaran, MD. (Chiang Mai University, Chiang Mai, Thailand) Editorial Board Suwanna Arunpongpaisal, MD. (Khon Khen University, Khon Khen, Thailand) Siow-Ann Chong, MBBS. (Institute of Mental Health, Singapore) Irmansyah, MD. (University of Indonesia, Jakarta, Indonesia) Philip George Joseph, MBBS. (International Medical University, Seremban, Malaysia) Thawatchai Leelahanaj, MD. (Phramongkutklao Hospital, Bangkok, Thailand) Manote Lotrakul, MD. (Ramathibodi Hospital, Mahidol University, Bangkok, Thailand) Benchaluk Maneeton, MD. (Chiang Mai University, Chiang Mai, Thailand) Dinah Pacquing-Nadera, MD, MSc, DPBP. (Philippine Psychiatric Association,, Quezon City, Philippines) Wetid Pratoomsri, MD. (Chachoengsao Hospital, Chachoengsao, Thailand) Atapol Sughondhabirom, MD. (Chulalongkorn University, Bangkok, Thailand) Pramote Sukanich, MD. (Ramathibodi Hospital, Mahidol University, Bangkok, Thailand) Tinakorn Wongpakaran, MD. (Chiang Mai University, Chiang Mai, Thailand) The ASEAN Journal of Psychiatry is a peer-reviewed psychiatric and mental health journal published twice a year by the ASEAN Federation for Psychiatry and Mental Health. The journal aims to provide psychiatrists and mental health professionals with continuing education in basic and clinical science to support informed clinical decisions. Its print version is sent to all members of the Psychiatric Associa- tions of Indonesia, Malaysia, The Philippines, Singapore, and Thailand. Unless clearly specified, all articles published represent the opinions of the authors and do not reflect the official policy of the AFPMH. The publisher can not accept responsibility for the correctness or accuracy of the advertisers’ text and/or claims or opinions expressed. The appearance of the advertise- ment in this journal does not necessarily constitute an approval or endorsement by the AFPMH. Adver- tisements are accepted through the Editorial Committee and are subject to approval by the Editor.

Welcome message from author
This document is posted to help you gain knowledge. Please leave a comment to let me know what you think about it! Share it to your friends and learn new things together.
Transcript
ASEAN Journal of Psychiatry ___________________________________________________________ Advisory Board
Pichet Udomratn, MD. President of the ASEAN Federation for Psychiatry and
Mental Health & President of the Psychiatric Association
of Thailand
Syamsul Hadi, MD. President of the Indonesian Psychiatric Association
Mohamad Hussain Habil, MBBS. President of the Malaysian Psychiatric Association
Felicitas Artiaga-Soriano, MD. President of the Philippines Psychiatric Association
Hong Choon Chua, MBBS. President of the Singapore Psychiatric Association
Editor
Manit Srisurapanont, MD.
Department of Psychiatry, Faculty of Medicine, Chiang Mai University
Muang, Chiang Mai, Thailand 50200
Tel: + 66 53 945 422; Fax: + 66 53 945 426; Email: [email protected]
Associate Editors
Sawitri Assanangkornchai, MD., Ph.D. (Prince of Songkla University, Songkhla, Thailand)
Mohamad Hussain Habil, MBBS. (University of Malaya, Kuala Lumpur, Malaysia)
Orawan Silpakit, MD. (Srithanya Hospital, Bangkok, Thailand)
Nahathai Wongpakaran, MD. (Chiang Mai University, Chiang Mai, Thailand)
Editorial Board
Suwanna Arunpongpaisal, MD. (Khon Khen University, Khon Khen, Thailand)
Siow-Ann Chong, MBBS. (Institute of Mental Health, Singapore)
Irmansyah, MD. (University of Indonesia, Jakarta, Indonesia)
Philip George Joseph, MBBS. (International Medical University, Seremban, Malaysia)
Thawatchai Leelahanaj, MD. (Phramongkutklao Hospital, Bangkok, Thailand)
Manote Lotrakul, MD. (Ramathibodi Hospital, Mahidol University, Bangkok, Thailand)
Benchaluk Maneeton, MD. (Chiang Mai University, Chiang Mai, Thailand)
Dinah Pacquing-Nadera, MD, MSc, DPBP. (Philippine Psychiatric Association,, Quezon
City, Philippines)
Wetid Pratoomsri, MD. (Chachoengsao Hospital, Chachoengsao, Thailand)
Atapol Sughondhabirom, MD. (Chulalongkorn University, Bangkok, Thailand)
Pramote Sukanich, MD. (Ramathibodi Hospital, Mahidol University, Bangkok, Thailand)
Tinakorn Wongpakaran, MD. (Chiang Mai University, Chiang Mai, Thailand)
The ASEAN Journal of Psychiatry is a peer-reviewed psychiatric and mental health journal published
twice a year by the ASEAN Federation for Psychiatry and Mental Health. The journal aims to provide
psychiatrists and mental health professionals with continuing education in basic and clinical science to
support informed clinical decisions. Its print version is sent to all members of the Psychiatric Associa-
tions of Indonesia, Malaysia, The Philippines, Singapore, and Thailand.
Unless clearly specified, all articles published represent the opinions of the authors and do not reflect
the official policy of the AFPMH. The publisher can not accept responsibility for the correctness or
accuracy of the advertisers’ text and/or claims or opinions expressed. The appearance of the advertise-
ment in this journal does not necessarily constitute an approval or endorsement by the AFPMH. Adver-
tisements are accepted through the Editorial Committee and are subject to approval by the Editor.
ii
Information for authors
Email manuscript submissions to the Editor, The ASEAN Journal of Psychiatry at the following ad-
dress:
Manit Srisurapanont, MD.
Department of Psychiatry, Faculty of Medicine, Chiang Mai University
Muang, Chiang Mai, Thailand 50200
Email: [email protected]
The Journal encourages all authors to submit their manuscripts to the above email address. For the au-
thors who cannot do so, they may mail 3 copies with a disk containing the file of the manuscript to the
Editor at the above mailing address.
Manuscripts should be concisely written, appropriately referenced, and coherently focused. Manu-
scripts written in American or British English (but not mixed) are accepted. Conclusions should flow
logically from the data presented, and methodological flaws and limitations should be acknowledged.
Manuscript preparation must meet Journal requirements, which are in accordance with “Uniform Re-
quirements for Manuscripts Submitted to Biomedical Journals” developed by the International Com-
mittee of Medical Journal Editors (available at www.cimje.org) and are summarized below.
Originality and copyright policy: Manuscripts are reviewed with the understanding that they repre-
sent original material, have never been published before, are not under consideration for publication
elsewhere, and have been approved by all authors. Prior publication constitutes any form of publication
other than an abstract and includes invited articles, proceedings, symposia, and book chapters. Authors
must fully inform the Editor in the cover letter if the submitted manuscript contains data and/or clinical
observations that have been published or submitted for publication elsewhere, supply copies of such
material, and explain the differences between the previous and submitted works. All accepted manu-
scripts become the property of the ASEAN Federation for Psychiatry and Mental Health and may not
be published elsewhere without written permission from the ASEAN Federation for Psychiatry and
Mental Health.
Authorship: Authorship credit should be based on 1) substantial contributions to conception and de-
sign, or acquisition of data, or analysis and interpretation of data; 2) drafting the article or revising it
critically for important intellectual content; and 3) final approval of the version to be published. Acqui-
sition of funding, collection of data, or general supervision of the research group, alone, does not justify
authorship. All persons designated as authors should qualify for authorship.
Conflict of interest: The authors must state explicitly whether potential conflicts do or do not exist,
including sources of support, in the Title page of the manuscript.
Protection of human subjects: When reporting experiments on human subjects, in the Methods sec-
tion of the manuscript, authors must indicate that: i) the procedures followed were ethically approved
by the responsible committee on human experimentation (institutional and national) and ii) written in-
formed consent was given by subjects and/or their guardians prior to the study participation. If doubt
exists whether the research was conducted in accordance with the Helsinki Declaration, the authors
must explain the rationale for their approach.
Cover Letter: Manuscripts must be accompanied by a cover letter. As well as the full address of the
corresponding author, the letter should include the following statements:
1. Confirmation that the manuscript is original material, has never been published before, is not under
consideration for publication elsewhere, and has been approved by all authors.
2. Confirmation that each author substantially contributed to the intellectual content of the paper and
accepts public responsibility for that content.
iii
Manuscript Format and Style
Type the manuscript on one side of white A4 paper (8.5 * 11 in.), with margins of at least 1 in. Double-
space all portions of the manuscript, including title page, abstract, text, acknowledgements, references,
individual tables, and figures. Each section should begin on a separate page. Number pages consecu-
tively in the upper right-hand corner, beginning with the title page.
The following describes the different types of submissions published in The ASEAN Journal of Psy-
chiatry, including specific requirements for each, such as maximum word count and number of tables
and figures allowed. These restrictions are enforced so the Journal can publish as many papers in each
issue as possible.
Categories of Papers
• Original articles: This category is intended for full-scale basic or clinical studies. Original articles
should not exceed 5,000 words (not including structured abstracts of up to 250 words, 3-5 key words,
references, tables, and figures) with a maximum of 5 figures and 5 tables in total.
• Review articles: This category is for scholarly, comprehensive reviews that summarize and critically
evaluate research in the field addressed and identify future implications. Review articles should not
exceed 5,000 words (not including structured abstracts of up to 250 words, 3-5 key words, references,
tables, and figures) with a maximum of 5 figures and tables in total.
• Opinions: This category is intended for articles expressing views, judgments, and/or advices on the
matters relevant to mental health and psychiatry. Opinions should contain no more than 1,500 words
(not including structured abstracts of up to 150 words, 3-5 key words, references, tables, and figures).
• Short reports: This category is for smaller, self-contained laboratory or clinical studies, including
preliminary reports and case series. Single cases will not be considered in this category and should be
submitted as Case reports. Manuscripts in this category should contain no more than 1,500 words (not
including structured abstracts of up to 150 words, 3-5 key words, references, tables, and figures).
• Case reports: These should briefly report single experiments and cases of clinical interest. Manu-
scripts in this category should contain no more than 1,000 words (not including structured abstracts of
up to 150 words, 3-5 key words, references, tables, and figures).
• Letters to the Editor: These should briefly respond to recent articles. Letters to the Editor should not
exceed 750 words (including text and references) with a maximum of one table or figure.
• Editorials and Book reviews: The body of these articles should not exceed 500 words (including a
maximum of 5 references) without tables or figures.
Title page:
The title page should carry the following information:
1. Title, which should be concise but informative without using acronyms.
2. Authors, including first name, middle initial, and last name along with highest academic degree(s)
and institutional affiliation(s) of each author.
3. A Running Head of 45 characters or less (count letters and spaces).
4. A Corresponding Author with full address, telephone and fax numbers, and email address.
5. Statistical summary of the manuscript, including the total number of words, the number of words
in the abstract, and the numbers of references, tables, and figures.
Abstract:
The abstract should include: Objective: purpose of the study or research question; Methods: study de-
sign, sample selection, setting, subjects, interventions(s) if any and main outcome measure(s); Results:
main findings (giving their statistical significance, if possible); and Conclusions.
Text:
Introduction
Provide a context or background for the study (i.e., the nature of the problem and its significance).
State the specific purpose or research objective of, or hypothesis tested by, the study or observation.
iv
The main and secondary objectives should be made clear, and any pre-specified subgroup analyses
should be described. Give only strictly pertinent references and do not include data or conclusions from
the work being reported.
Methods
The Methods section should include only information that was available at the time the plan or protocol
for the study was written; all information obtained during the conduct of the study belongs in the Re-
sults section.
• Selection and description of participants: Describe your selection of the observational or experimen-
tal participants (patients or laboratory animals, including controls) clearly, including eligibility and
exclusion criteria and a description of the source population. The guiding principle should be clarity
about how and why a study was done in a particular way.
• Technical information: Identify the methods, apparatus (give the manufacturer’s name and address in
parentheses), and procedures in sufficient detail to allow other workers to reproduce the experiment.
Give references to established methods, including statistical methods (see below); provide references
and brief descriptions for methods that have been published but are not well known; describe new or
substantially modified methods, give reasons for using them, and evaluate their limitations. Identify
precisely all drugs and chemicals used, including generic name(s), dose(s), and route(s) of administra-
tion. Authors submitting review manuscripts should include a section describing the methods used for
locating, selecting, extracting, and synthesizing data. These methods should also be summarized in the
abstract.
• Statistics: Describe statistical methods with enough detail to enable a knowledgeable reader with
access to the original data to verify the reported results.
Results
Present your results in logical sequence in the text, tables, and illustrations, giving the main or most
important findings first. Do not repeat in the text all the data in the tables or illustrations; emphasize or
summarize only important observations. When data are summarized in the Results section, give nu-
meric results not only as derivatives (for example, percentages) but also as the absolute numbers from
which the derivatives were calculated. Restrict tables and figures to those needed to explain the argu-
ment of the paper and to assess its support. Use graphs as an alternative to tables with many entries; do
not duplicate data in graphs and tables.
Discussion
Emphasize the new and important aspects of the study and the conclusions that follow from them. Do
not repeat in detail data or other material given in the Introduction or the Results section. For experi-
mental studies it is useful to begin the discussion by summarizing briefly the main findings, then ex-
plore possible mechanisms or explanations for these findings, compare and contrast the results with
other relevant studies, state the limitations of the study, and explore the implications of the findings for
future research and for clinical practice. Avoid claiming priority and alluding to work that has not been
completed.
Acknowledgements
This section may include: i) acknowledgements of financial and material support; ii) contributions that
need acknowledging but do not justify authorship; iii) acknowledgement of technical help; and iv) indi-
cations of previous presentation.
References
Authors are responsible for the accuracy and completeness of the references. Avoid using abstracts as
references. References to papers accepted but not yet published should be designated as “in press” or
“forthcoming”. Information from manuscripts submitted but not accepted should be avoided but, if
necessary, may be cited in the text as “unpublished observations”. Avoid citing a “personal communi-
cation” unless it provides essential information not available from a public source, in which case the
name of the person and date of communication should be cited in parentheses in the text.
v
Only relevant references cited in the text should be included, and numbered consecutively in the order
in which they are first mentioned in the text. Identify references in text, tables, and legends by Arabic
numerals in brackets. References cited only in tables or figure legends should be numbered in accor-
dance with the sequence established by the first identification in the text of the particular table or fig-
ure. The titles of journals should be abbreviated according to the style used in the Index Medicus.
Example citations
Depression is a disease state affecting both the body and the brain, and it contributes to direct and indi-
rect healthcare costs via consequent disability and reduced productivity [1]. Depression affects nearly
340 million people worldwide at any given time [2,3]. In clinical population with depression, physical
symptoms are common [4-6].
The reference style should be in concordance with the International Committee of Medical Journal Edi-
tors Uniform Requirements for Manuscripts Submitted to Biomedical Journals (full details are avail-
able at http://www.nlm.nih.gov/bsd/uniform_requirements.html). Examples are as follows:
ARTICLES IN JOURNALS
1. Standard journal article
List the first six authors followed by et al. (Note: NLM now lists all authors.)
• Halpern SD, Ubel PA, Caplan AL. Solid-organ transplantation in HIV-infected patients. N Engl J
Med. 2002;347:284-7.
More than six authors:
• Rose ME, Huerbin MB, Melick J, Marion DW, Palmer AM, Schiding JK, et al. Regulation of inter-
stitial excitatory amino acid concentrations after cortical contusion injury. Brain Res. 2002;935(1-
2):40-6.
2. Organization as author
• Diabetes Prevention Program Research Group. Hypertension, insulin, and proinsulin in participants
with impaired glucose tolerance. Hypertension. 2002;40(5):679-86.
3. Both personal authors and an organization as author
• Vallancien G, Emberton M, Harving N, van Moorselaar RJ; Alf-One Study Group. Sexual dysfunc-
tion in 1,274 European men suffering from lower urinary tract symptoms. J Urol. 2003;169(6):2257-61.
4. No author given
• 21st century heart solution may have a sting in the tail. BMJ. 2002;325(7357):184.
5. Volume with supplement
• Geraud G, Spierings EL, Keywood C. Tolerability and safety of frovatriptan with short- and long-
term use for treatment of migraine and in comparison with sumatriptan. Headache. 2002;42 Suppl
2:S93-9.
6. Issue with supplement
• Glauser TA. Integrating clinical trial data into clinical practice. Neurology. 2002;58(12 Suppl 7):S6-
12.
7. Volume with part
• Abend SM, Kulish N. The psychoanalytic method from an epistemological viewpoint. Int J Psycho-
anal. 2002;83(Pt 2):491-5.
8. Issue with part
• Ahrar K, Madoff DC, Gupta S, Wallace MJ, Price RE, Wright KC. Development of a large animal
model for lung tumors. J Vasc Interv Radiol. 2002;13(9 Pt 1):923-8.
9. Article published electronically ahead of the print version
• Yu WM, Hawley TS, Hawley RG, Qu CK. Immortalization of yolk sac-derived precursor cells.
Blood. 2002 Nov 15;100(10):3828-31. Epub 2002 Jul 5.
BOOKS AND OTHER MONOGRAPHS
10. Personal author(s)
• Murray PR, Rosenthal KS, Kobayashi GS, Pfaller MA. Medical microbiology. 4th ed. St. Louis:
Mosby; 2002.
11. Editor(s), compiler(s) as author
vi
• Gilstrap LC 3rd, Cunningham FG, VanDorsten JP, editors. Operative obstetrics. 2nd ed. New York:
McGraw-Hill; 2002.
12. Author(s) and editor(s)
• Breedlove GK, Schorfheide AM. Adolescent pregnancy. 2nd ed. Wieczorek RR, editor. White Plains
(NY): March of Dimes Education Services; 2001.
13. Chapter in a book
• Meltzer PS, Kallioniemi A, Trent JM. Chromosome alterations in human solid tumors. In: Vogelstein
B, Kinzler KW, editors. The genetic basis of human cancer. New York: McGraw-Hill; 2002. p. 93-113.
14. Dissertation
• Borkowski MM. Infant sleep and feeding: a telephone survey of Hispanic Americans [dissertation].
Mount Pleasant (MI): Central Michigan University; 2002.
OTHER PUBLISHED MATERIAL
15. Newspaper article
• Tynan T. Medical improvements lower homicide rate: study sees drop in assault rate. The Washing-
ton Post. 2002 Aug 12;Sect. A:2 (col. 4).
16. Audiovisual material
• Chason KW, Sallustio S. Hospital preparedness for bioterrorism [videocassette]. Secaucus (NJ):
Network for Continuing Medical Education; 2002.
17. Dictionary and similar references
• Dorland's illustrated medical dictionary. 29th ed. Philadelphia: W.B. Saunders; 2000. Filamin; p.
675.
UNPUBLISHED MATERIAL
18. In press
• Tian D, Araki H, Stahl E, Bergelson J, Kreitman M. Signature of balancing selection in Arabidopsis.
Proc Natl Acad Sci U S A. In press 2002.
ELECTRONIC MATERIAL
19. CD-ROM
• Anderson SC, Poulsen KB. Anderson's electronic atlas of hematology [CD-ROM]. Philadelphia:
Lippincott Williams & Wilkins; 2002.
20. Journal article on the Internet
• Abood S. Quality improvement initiative in nursing homes: the ANA acts in an advisory role. Am J
Nurs [serial on the Internet]. 2002 Jun [cited 2002 Aug 12];102(6):[about 3 p.]. Available from:
http://www.nursingworld.org/AJN/2002/june/Wawatch.htm
Tables
Tables capture information concisely, and display it efficiently; they also provide information at any
desired level of detail and precision. Including data in tables rather than text frequently makes it possi-
ble to reduce the length of the text.
Type or print each table with double spacing on a separate sheet of paper. Number tables consecu-
tively in the order of their first citation in the text and supply a brief title for each. Do not use internal
horizontal or vertical lines. Give each column a short or abbreviated heading. Authors should place
explanatory matter in footnotes, not in the heading. Explain in footnotes all nonstandard abbreviations.
For footnotes, use the following symbols, in sequence: *,†,‡,§,||,¶,**,††,‡‡
Identify statistical measures of variations, such as standard deviation and standard error of the mean.
Be sure that each table is cited in the text. If you use data from another published or unpublished
source, obtain permission and acknowledge them fully.
Figures
Figures should be numbered consecutively according to the order in which they have been first cited in
the text. Type or print out legends for illustrations using double spacing, starting on a separate page.
vii
ASEAN Journal of Psychiatry
Volume 8, No 2 (December), 2007
Contents
AFPMH News: AFPMH and Regional Meetings of WPA…………………………………...50
Original articles
Personality profile among hypertensive patient undergoing pharmacological treatment in
primary care setting
Azlin Baharudin, Hatta Sidi, Norzila Zakaria, Sharifah Ezat Wan Puteh……………...…….51
The first methadone programme in Malaysia: overcoming obstacles and achieving the
impossible
Jesjeet Singh Gill, Ahmad Hatim Sulaiman, Mohd Hussain Habil…………………………..64
Effects of CBT on children with disruptive behaviour disorders: findings from a Singapore
study
Yoon Phaik Ooi, Rebecca P. Ang, Daniel S. S. Fung, Geraldine Wong, Yiming Cai…….…..71
Translation, validation and psychometric properties of Bahasa Malaysia version of the
depressive anxiety and stress scales (DASS)
Ramli Musa, Mohd Ariff Fadzil, Zaini Zain..............................................................................82
Obesity among patients with schizophrenia, attending outpatient psychiatric clinic, Hospital
Universiti Kebangsaan Malaysia
Salmi Razali, Ainsah Omar, Osman Che Bakar, & Shamsul Azman Shah…..……………….90
The prevalence of genital arousal disorder during sexual activity and potential risk factors that
may impair genital arousal among Malaysian women
Hatta Sidi, Marhani Midin, Sharifah Ezat Wan Puteh, Norni Abdullah…….….....………...97
Benzodiazepine overuse in an internal medicine outpatient department: a prospective study
Sirijit Suttajit, Manit Srisurapanont, Peerasak Lerttrakarnnon..…………...………………106
Fixed-dose schedule and symptom-triggered regimen for alcohol withdrawal: a before-after
study
Surinporn Likhitsathian, Rotjarek Intachote Sakamoto…………………………………….111
Cost analysis of treatment for schizophrenic patients in social security scheme, Thailand
Ronnachai Kongsakon, Buranee Kanchanatawan……………...……...……………………118
Consultation-liaison psychiatry in Maharaj Nakorn Chiang Mai Hospital
Benchalak Maneeton, Wajana Khemawichanurat, Narong Maneeton...................................124

viii
SF-36 normative data of people living in Bangkok Metropolitan, Thailand
Ronnachai Kongsakon, Chatchawan Silpakit, Umaporn Udomsubpayakul…………...……131
ASEAN Journal of Psychiatry 2007;8 (2):50.
AFPMH News
AFPMH and Regional Meetings of WPA
In the year 2007, the ASEAN Federation
for Psychiatry and Mental Health
(AFPMH) joined the World Psychiatric
Association (WPA) Regional Meetings in
Seoul and Shanghai between 18-20 April
and 20-23 September, respectively.
At the WPA Regional Meeting in Seoul,
the AFPMH had a symposium on “Teach-
ing of Psychiatry for Medical Students in
ASEAN: Sharing of Good Practices”.
There were 5 topics as follows:
1. Teaching of Psychiatry: Customising
the Curriculum of Medical Students for
ASEAN
Prof. Pichet Udomratn (President,
AFPMH)
2. From Psychiatric Services to Teach-
ing of Psychiatry: Realigning of Objectives
Prof. M Parameshvara Deva (Conve-
ner, AFPA)
3. What Makes a Good Medical
Teacher?: Perception of Medical Students
and Teachers
Prof. Ee Heok Kua (National Univer-
sity of Singapore)
4. Undergraduate Psychiatric Education
in Malaysia
Prof. Hussain Habil (President, Ma-
laysian Psychiatric Association)
5. Undergraduate Psychiatric Education
in Thailand: Lessons Learned from Prince
of Songkla University (PSU)
Assoc. Prof. Sawitri Assanang-
kornchai (Editorial board, Journal of the
Psychiatric Association of Thailand)
At the WPA Regional Meeting in Shang-
hai, the AFPMH had a symposium on
“Globalization and Suicide in ASEAN:
Sharing Good Practice for Suicide Preven-
tion”. There were 4 topics as follows:
1. Suicide and Suicide Prevention in
Thailand
Dr.Apichai Mongkol (Department of
Mental Health, Thai Ministry of Public
Health)
Prof. Pichet Udomratn (President,
Psychiatric Association of Thailand)
2. Suicide in Singapore: The National
Response
Dr. Hong Choon Chua (President,
Singapore Psychiatric Association)
3. Managing Suicidal Patients: A Ma-
laysian Experience
Dr.Hussain Habil (President, Malay-
sian Psychiatric Association)
4. Suicide in the Philippines
Dr. Dinah Pacquing-Nadera (Secre-
tary-General, Philippines Psychiatric Asso-
ciation)
Both symposiums were arranged to support
the hosting organizations, Korean Neuro-
psychiatric Association (KNPA) and Chi-
nese Society of Psychiatry (CSP). These
activities also strengthened the relationship
between the AFPMH and both societies
under the program called “AFPMH plus 3”
(CSP, JSPN, KNPA) partnership program
initiated by Prof. Pichet Udomratn, the
current president of AFPMH.
ASEAN Journal of Psychiatry 2007;8 (2):51-63.
___________________________________________________________________________________
Correspondence: Azlin Baharudin, Department of Psychiatry, Universiti Kebangsaan Malaysia (UKM),
Jalan Yaakob Latif, 56000, Kuala Lumpur, Malaysia
Email: [email protected]
Received June 12, 2007; Accepted September 29, 2007.
ORIGINAL ARTICLE
Personality profile among hypertensive patient undergoing
pharmacological treatment in primary care setting
AZLIN BAHARUDIN1, HATTA SIDI
1, NORZILA ZAKARIA
2,
& SHARIFAH EZAT WAN PUTEH3
1 Department of Psychiatry, Faculty of Medicine, Universiti Kebangsaan Malaysia, Kuala Lumpur,
Malaysia. 2 Department of Psychiatry, Faculty of Medicine, Universiti Kebangsaan Malaysia, Kuala Lumpur,
Malaysia. 3 Department of Community Medicine, Faculty of Medicine, Universiti Kebangsaan Malaysia, Kuala
Lumpur, Malaysia.
Abstract
Objective: This study aimed to determine the association between the personality traits and
social factors with compliance to anti-hypertensive pharmachotherapy. Methods: This cross
sectional study was conducted from 1st of June until 31st of December 2004, which involved
Hospital Universiti Kebangsaan Malaysia Primary Polyclinic in Bandar Tasik Selatan,
Cheras and Salak Polyclinic in Sepang, Selangor. A total of 200 patients who fulfilled all the
inclusion criteria, were selected as respondents. This study used the Mini International Neu-
ropsychiatric Interview (M.I.N.I) for the psychiatric diagnoses and personality characteristics
were assessed by using Personality Assessment Schedule (PAS) Results: The prevalence rate
of non-compliance was 38.5%. Paranoid personality trait (27.3%) was the most common type
of personality traits that associated with non-compliance to the medications prescribed. The
results of this study revealed a statistically significant difference between drug compliance
and age, race, gender and the site where the study was conducted. No association was found
between patients’ education level, occupation, income, marital status, family history of hyper-
tension and personality traits and drug compliance. Conclusion: This study suggested that
drug compliance among hypertensive patients was influenced by the presence of psychosocial
factors. Hence, it is important for medical practitioners to understand these factors and admin-
ister treatment more individual.
Key words: hypertension, non-compliance, personality
Introduction
In Malaysia, it was estimated that about
14% to 25% of the population aged 15
years and above suffered from hypertension
[1]. As blood pressure increases from
normal to severe elevations, the risk for
coronary heart disease, stroke, end stage
renal disease and peripheral vascular dis-
ease increases markedly [2,3]. Anti-
hypertensive drug therapy can reduce high
blood pressure effectively and thus reduce
the excess risk significantly. However,
despite the existence of efficacious medica-
tions and improvements in awareness of
hypertension, many patients in actual
practice remain with uncontrolled hyper-
tension. Hypertensive patients often experi-
ence poor compliance to treatment, a fre-
52 Baharudin A, et al.
quent cause of uncontrolled blood pressure.
Medication compliance has been defined in
terms of an agreement between patient’s
behaviour of taking medications and the
clinical prescription [4]. Compliance rates
for many long-term drug therapies have
been shown to be strikingly low, often no
more than 40%-50% [5-7]. Non-
compliance with medications is one of the
major factors in the failure of therapeutic
programs in patients having a chronic
disease [4]. Non-compliance can contribute
greatly to the variability observed in a
drug’s therapeutic effect if the clinician
incorrectly attributes the patient’s worsen-
ing condition to an absence of drug activ-
ity. This erroneous conclusion may lead to
unnecessary diagnostic testing and changes
in dose or regimen. Sub-optimal compli-
ance can compromise the patient-provider
relationship, because misconceptions about
the effects of a therapy on the part of either
the patient or the provider may lead to a
breakdown in communication and nega-
tively affect the patient’s views about care.
Generally in Malaysia, the problem of
blood pressure control is not lack of thera-
peutic options but due to patients’ non-
compliance. Lim and colleagues found out
that 26% out of 168 of patients were not
compliance to their medications [8]. Com-
pliance to treatment depends on many
factors, and no simple explanation for non-
compliance exists. Potential determinants
of compliance include sociodemographic
characteristics, specific aspects of the
treatment regimen (type, complexity, side
effects, and duration), and features of the
illness or potential illness (i.e., symptoms,
duration, disability and medically defined
seriousness) [9].
Elevated blood pressure has been associ-
ated with certain personality traits. Som-
mers-Flanagan and Greenberg (1989)
found that hypertensive individuals were
more likely to be characterized by difficul-
ties with anger expression and interpersonal
anxiety and frequently exhibited defence
mechanism such as denial and repression
[10]. Recent meta-analyses revealed con-
flicting findings in studies on the relation-
ship between the blood pressure and per-
sonality [11,12]. Nevertheless, Jorgensen
and colleagues (1996) reported that in-
creased blood pressure and hypertension
were associated with greater negative affect
and defensiveness and less affect expres-
sion [11]. Rosmond and colleagues (2001)
found out that a deficient dopamine D2
receptor formation or action may contribute
to hypertension via an increase of cate-
cholamine release [13]. Paranoid and
schizoid personality disorders are also
associated with a polymorphism of the
DRD2, which demonstrated low density of
this receptor. A cross-sectional community
survey in northern Japan found a relation-
ship between personality and home blood
pressure value [14]. Personality extrover-
sion score positively affected the systolic
blood pressure value, whereas no signifi-
cant relationship was observed between
personality psychoticism or neuroticism
and blood pressure value. In other study,
hypertensive patients had scored signifi-
cantly higher in somatization, aggres-
sion/hostility and neuroticism [15].
Generally there is a lack of consensus on
which personality or psychological traits
related to the blood pressure [16]. The
purpose of this study was to investigate the
relationship between anti-hypertensive drug
compliance with personality profiles. The
results of the study may contribute to
increase the awareness of health care
providers particularly physicians on the
issue of compliance and understanding
their patients. These may aid to develop
strategies for improvement of compliance.
Methods
The study was done after received approval
from the Ethics Committee of Faculty of
Medicine, Universiti Kebangsaan Malaysia
and Research Committee of Psychiatry
Department, Faculty of Medicine, Univer-
Personality profiles among hypertensive patients 53
siti Kebangsaan Malaysia.. Those who
were found to have psychiatric disorder
were referred to the nearest psychiatric
clinic for further evaluation and manage-
ment.
Locations and subjects
This study was conducted at the Universiti
Kebangsaan Malaysia Hospital (HUKM)
Primary Polyclinic, Bandar Tasik Selatan,
Kuala Lumpur and Salak Polyclinic at
Sepang, Selangor. Primary polyclinic is a
primary health care clinic of HUKM. It is
situated in a 5-storey shop houses at Ban-
dar Tasik Selatan commercial area. The
total population for Bandar Tasik Selatan is
11,304. Of these, 5,944 (52.6%) were
Chinese, followed by 4,365 (38.6%) Ma-
lays and 995 (8.8%) Indians. There were
about 5,826 (49.2%) males and 6,016
(50.8%) females in this area [17]. It is an
urban area, situated about 20 kilometers
from the heart of Kuala Lumpur. Among
the population, some of them were doing
their own business, working at private
companies or with the government agen-
cies. The other centre is Salak Polyclinic,
which situated in Selangor. It is a govern-
ment polyclinic that is under the manage-
ment of Ministry of Health, Malaysia. It is
located about 48 kilometers from HUKM.
It also provides primary health services.
The total population here is 51,824. Of
these 27,478 (53.0%) were Malays, fol-
lowed by 13,262 (25.6%) Chinese and
11,075 (21.4%) Indians. This area is a rural
area, majority of the populations’ works as
a farmer or at the palm oil or rubber planta-
tions. As this place is near to the new Kuala
Lumpur International Airport, many of the
younger generation found their employ-
ment there.
This is a cross sectional study conducted at
HUKM Primary Polyclinic in Bandar Tasik
Selatan and Salak Polyclinic in Sepang
from the first week of July 2004 to the last
week of December 2004.
The sample population was all the hyper-
tensive patients who attended the HUKM
Primary Polyclinic in Bandar Tasik Selatan
and Salak Polyclinic in Sepang during the
study period. The sample size was deter-
mined using Epiinfo 2000 Statistical Pack-
age which was based on the power of study
of 80% with alpha-level of 0.05 (95%
confidence interval). Assuming and ex-
pected frequency of poor compliance
towards anti-hypertensive pharmachother-
apy in the population was around 26% [8].
The sample size was calculated to be
around 197. An author had to divide her
time to attend both clinics. To reduce the
sampling bias the author attended the
polyclinics on alternate days. Universal
sampling was used in the recruitment
process. All new and old hypertensive
patients who came for their appointments at
the time of the author presence at the
respective polyclinics were approached.
The inclusion criteria included patients
with essential hypertension, aged 40 years
old and above, on anti-hypertensive phar-
macotherapy for at least 3 months, agreed
to participate in the project and could give
written informed consent. They also must
have sufficient command in Malay or
English. The exclusion criteria included
pregnancy, diagnosed to have secondary
hypertension, no renal impairment (serum
creatinine>125 mmoll/L) within the last six
months of recruitment date, no impaired
liver function tests (>3 times the upper
limit of normal range), no concomitant
disease such as diabetes mellitus, ischaemic
heart disease, congestive cardiac failure,
cerebrovascular accidents, bronchial
asthma and chronic obstructive pulmonary
disease. Patient’s with blood pressure of
200/120 mmHg or more were also ex-
cluded.
Study instruments
1. Biodata and sociodemographic data:
The variables included name, age, sex,
marital status, occupation, total household
monthly income, highest academic qualifi-
cation, hypertension history (i.e., duration
54 Baharudin A, et al.
of hypertension and family history of
hypertension), history of smoking, alcohol
intake, body mass index measurement and
vital signs.
2. Mini international Neuropsychiatric
interview (M.I.N.I): M.I.N.I was used to
assess psychiatric diagnosis among respon-
dents. It was designed as a brief structured
interview for the major Axis I psychiatric
disorders in DSM-IV and ICD-10 psychiat-
ric disorders. The diagnosis is available in
lifetime and 12 months version. M.I.N.I is a
tool designed to meet the need for a short
but accurate structured psychiatric inter-
view that can be use in a variety of cultures,
for epidemiological and clinical research
purposes.
3. Personality Assessment Schedule
(PAS): The personality profile of respond-
ers in this study was assessed by using the
PAS [18]. It is an instrument designed to
formalize the assessment of personality
disorder. It may be used with any subject
irrespective of psychiatric status. The
instrument is a semi-structured, with the
emphasis on the patient’s premorbid status.
The PAS is a standardized interview in
which the interviewee is asked for informa-
tion related to 24 personality characteris-
tics, and where the answer is positive he or
she is asked to provide examples of rele-
vant behaviours. Ratings for each trait are
made on a nine-point scale from 0-8, on
which the ratings of 0-3 are trait accentua-
tions in the absence of impairment of social
functioning or distress to the subject or
those around her. The scores are combined
using formulae described by Tyrer et al.
(1988) to derive either 13 personality
disorder categories, or four summary
categories [18]. The instrument also has
been shown to possess adequate inter-rater
and test-retest reliability and to be predic-
tive of treatment outcome. The Kappa for
this instrument was 0.65. The temporal and
trans-cultural reliability is generally good
to excellent. In this study, inter reliability
assessment on assessing personality disor-
der/traits between researcher and her su-
pervisor shows a good agreement between
them with the Kappa of 0.7.
When the patient had fulfilled the inclusion
criteria, written consent was obtained. The
respondent was then interviewed by the
researcher using the M.I.N.I. It was rec-
ommended that the screening schedule was
used to make the diagnostic formulation of
psychiatric problems. If this was not carried
out there is a danger that the personality
ratings will be contaminated by the mental
state. They were then indulged in another
interview, during which the researcher
assessed their personality by using the
PAS.
Outcomes
In the treatment of hypertension, a mini-
mum compliance of 80% is generally
needed to achieve an adequate reduction in
blood pressure [8]. For this study, medica-
tion compliance is based on the pill count-
ing, the compliance ratio is then calculated
using the formula of Z/T, where X = known
fixed number of tablet dispensed; Y =
residual number of tablets in the container
after eight weeks; Z = number of tablet that
have been removed from the container; and
presumably consumed (X-Y = Z); T =
number of tablets which should have been
consumed for a particular dose regime over
the 8 weeks period. A ratio of 0.8 (80%) to
1.2 (120%) are used as the criteria for
adequate drug compliance [24].
Data analysis
Data were analyzed by using the Statistical
Package for Social Sciences (SPSS) Ver-
sion 12.0. The relationships between the
study parameters were analyzed using
appropriate statistical tests.
Results
A total of 205 patients were approached to
participate in the study. However, only 200
patients were qualified for the study. Out of
5 patients excluded from the study, 2 had
difficulties understanding the interview and
questionnaires because of language prob-
Personality profiles among hypertensive patients 55
lems, 1 was later diagnosed to have diabe-
tes mellitus and another 2 patients refused
to participate in the study. Thus the re-
sponse rate was 97.5%.
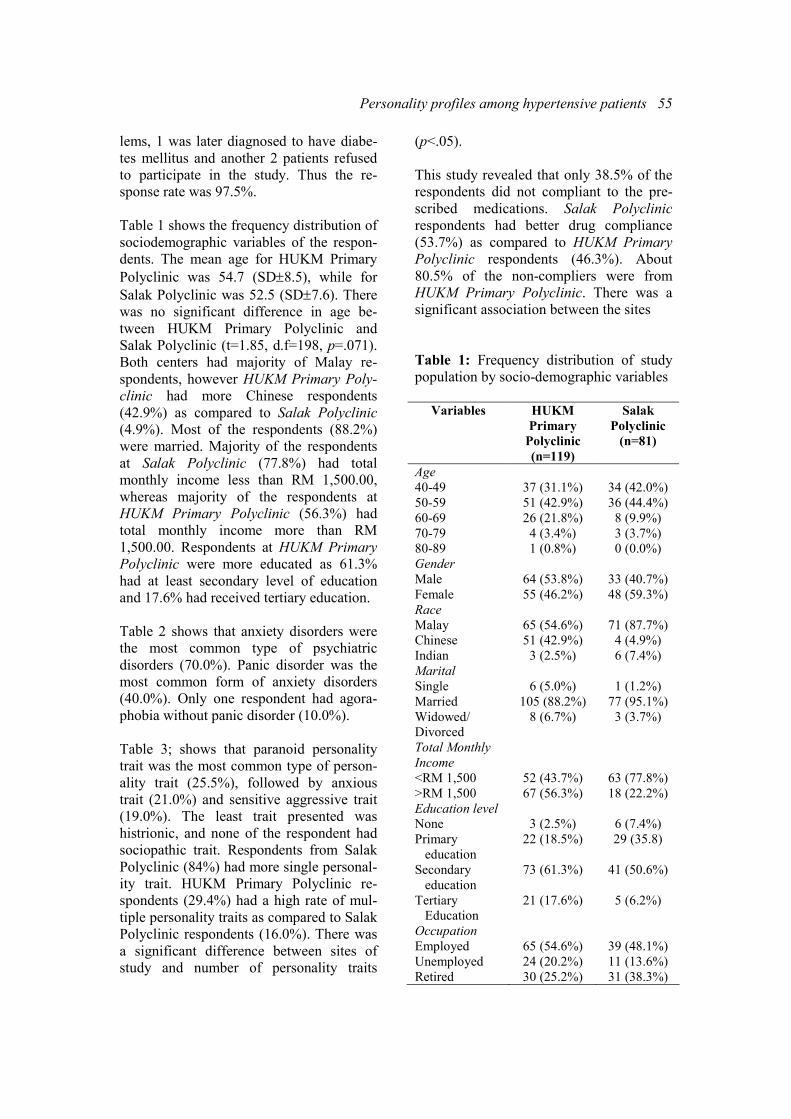
Table 1 shows the frequency distribution of
sociodemographic variables of the respon-
dents. The mean age for HUKM Primary
Polyclinic was 54.7 (SD±8.5), while for
Salak Polyclinic was 52.5 (SD±7.6). There
was no significant difference in age be-
tween HUKM Primary Polyclinic and
Salak Polyclinic (t=1.85, d.f=198, p=.071).
Both centers had majority of Malay re-
spondents, however HUKM Primary Poly-
clinic had more Chinese respondents
(42.9%) as compared to Salak Polyclinic
(4.9%). Most of the respondents (88.2%)
were married. Majority of the respondents
at Salak Polyclinic (77.8%) had total
monthly income less than RM 1,500.00,
whereas majority of the respondents at
HUKM Primary Polyclinic (56.3%) had
total monthly income more than RM
1,500.00. Respondents at HUKM Primary
Polyclinic were more educated as 61.3%
had at least secondary level of education
and 17.6% had received tertiary education.
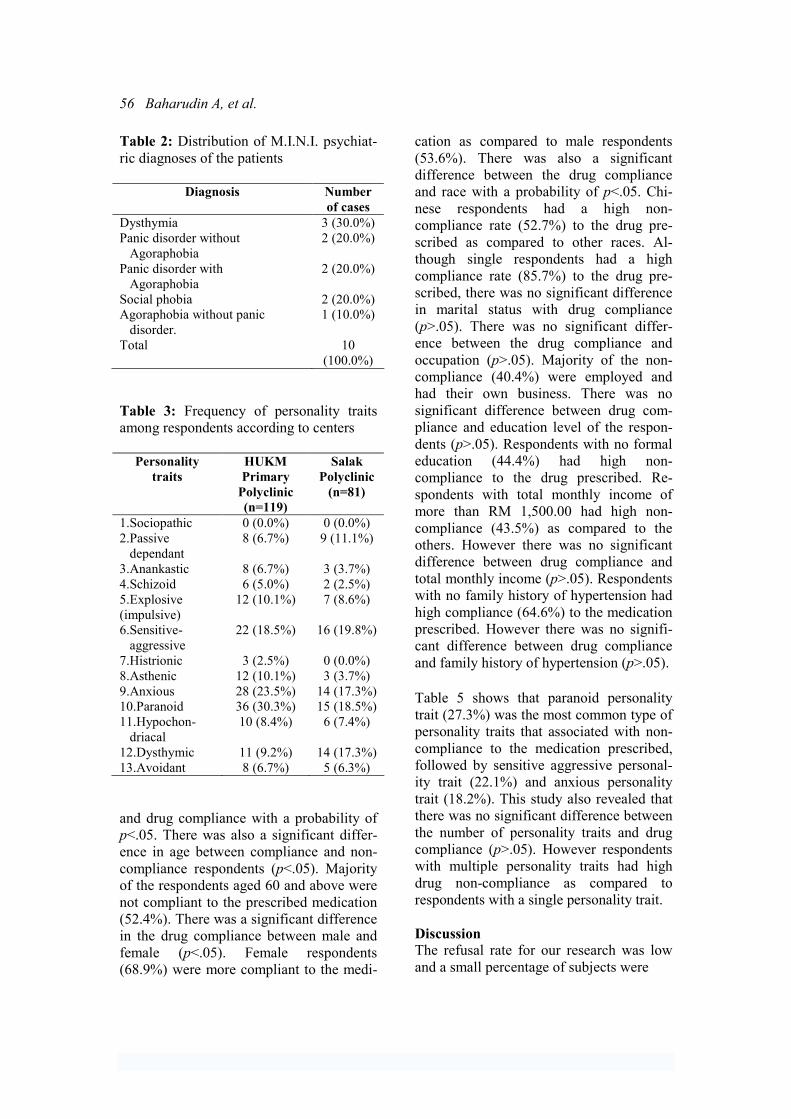
Table 2 shows that anxiety disorders were
the most common type of psychiatric
disorders (70.0%). Panic disorder was the
most common form of anxiety disorders
(40.0%). Only one respondent had agora-
phobia without panic disorder (10.0%).
Table 3; shows that paranoid personality
trait was the most common type of person-
ality trait (25.5%), followed by anxious
trait (21.0%) and sensitive aggressive trait
(19.0%). The least trait presented was
histrionic, and none of the respondent had
sociopathic trait. Respondents from Salak
Polyclinic (84%) had more single personal-
ity trait. HUKM Primary Polyclinic re-
spondents (29.4%) had a high rate of mul-
tiple personality traits as compared to Salak
Polyclinic respondents (16.0%). There was
a significant difference between sites of
study and number of personality traits
(p<.05).
This study revealed that only 38.5% of the
respondents did not compliant to the pre-
scribed medications. Salak Polyclinic
respondents had better drug compliance
(53.7%) as compared to HUKM Primary
Polyclinic respondents (46.3%). About
80.5% of the non-compliers were from
HUKM Primary Polyclinic. There was a
significant association between the sites
Table 1: Frequency distribution of study
population by socio-demographic variables
Variables HUKM
Primary
Polyclinic
(n=119)
Salak
Polyclinic
(n=81)
Age
40-49
50-59
60-69
70-79
80-89
37 (31.1%)
51 (42.9%)
26 (21.8%)
4 (3.4%)
1 (0.8%)
34 (42.0%)
36 (44.4%)
8 (9.9%)
3 (3.7%)
0 (0.0%)
Gender
Male
Female
64 (53.8%)
55 (46.2%)
33 (40.7%)
48 (59.3%)
Race
Malay
Chinese
Indian
65 (54.6%)
51 (42.9%)
3 (2.5%)
71 (87.7%)
4 (4.9%)
6 (7.4%)
Marital
Single
Married
Widowed/
Divorced
6 (5.0%)
105 (88.2%)
8 (6.7%)
1 (1.2%)
77 (95.1%)
3 (3.7%)
Total Monthly
Income
<RM 1,500
>RM 1,500
52 (43.7%)
67 (56.3%)
63 (77.8%)
18 (22.2%)
Education level
None
Primary
education
Secondary
education
Tertiary
Education
3 (2.5%)
22 (18.5%)
73 (61.3%)
21 (17.6%)
6 (7.4%)
29 (35.8)
41 (50.6%)
5 (6.2%)
Occupation
Employed
Unemployed
Retired
65 (54.6%)
24 (20.2%)
30 (25.2%)
39 (48.1%)
11 (13.6%)
31 (38.3%)
56 Baharudin A, et al.
Table 2: Distribution of M.I.N.I. psychiat-
ric diagnoses of the patients
Diagnosis Number
of cases
Dysthymia 3 (30.0%)
Panic disorder without
Agoraphobia
2 (20.0%)
Panic disorder with
Agoraphobia
2 (20.0%)
Social phobia 2 (20.0%)
Agoraphobia without panic
disorder.
1 (10.0%)
Total 10
(100.0%)
Table 3: Frequency of personality traits
among respondents according to centers
Personality
traits
HUKM
Primary
Polyclinic
(n=119)
Salak
Polyclinic
(n=81)
1.Sociopathic 0 (0.0%) 0 (0.0%)
2.Passive
dependant
8 (6.7%) 9 (11.1%)
3.Anankastic 8 (6.7%) 3 (3.7%)
4.Schizoid 6 (5.0%) 2 (2.5%)
5.Explosive
(impulsive)
12 (10.1%) 7 (8.6%)
6.Sensitive-
aggressive
22 (18.5%) 16 (19.8%)
7.Histrionic 3 (2.5%) 0 (0.0%)
8.Asthenic 12 (10.1%) 3 (3.7%)
9.Anxious 28 (23.5%) 14 (17.3%)
10.Paranoid 36 (30.3%) 15 (18.5%)
11.Hypochon-
driacal
10 (8.4%) 6 (7.4%)
12.Dysthymic 11 (9.2%) 14 (17.3%)
13.Avoidant 8 (6.7%) 5 (6.3%)
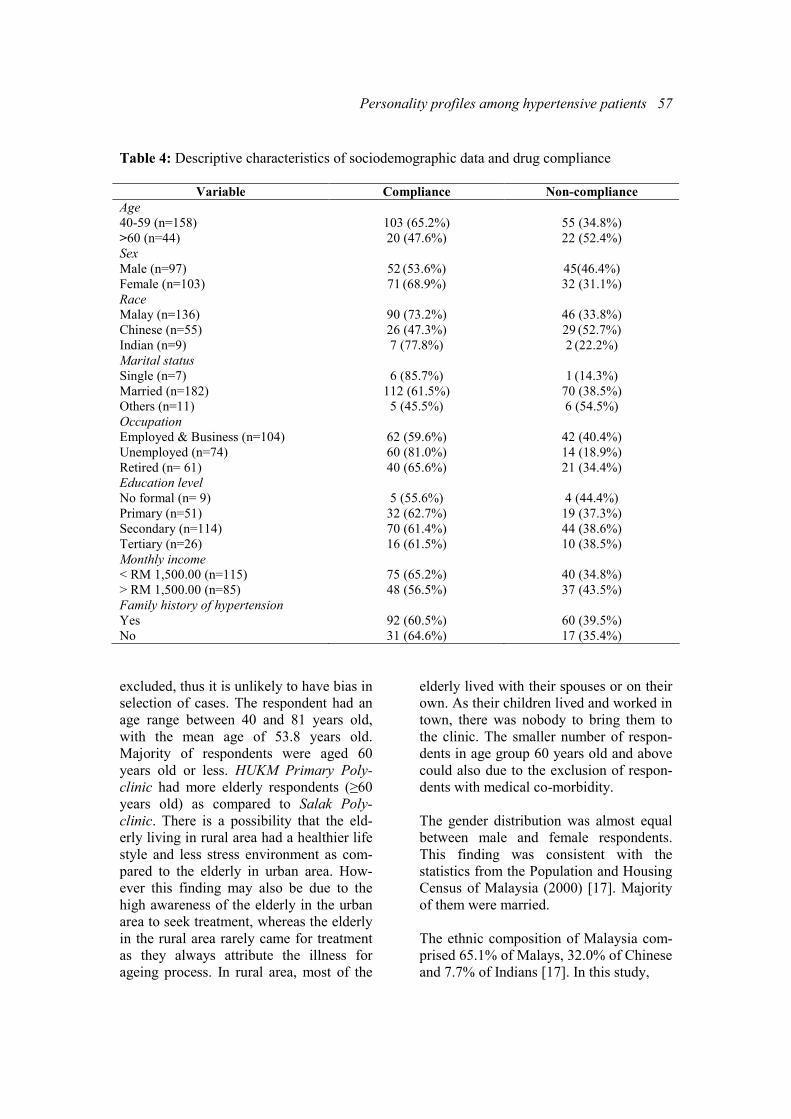
and drug compliance with a probability of
p<.05. There was also a significant differ-
ence in age between compliance and non-
compliance respondents (p<.05). Majority
of the respondents aged 60 and above were
not compliant to the prescribed medication
(52.4%). There was a significant difference
in the drug compliance between male and
female (p<.05). Female respondents
(68.9%) were more compliant to the medi-
cation as compared to male respondents
(53.6%). There was also a significant
difference between the drug compliance
and race with a probability of p<.05. Chi-
nese respondents had a high non-
compliance rate (52.7%) to the drug pre-
scribed as compared to other races. Al-
though single respondents had a high
compliance rate (85.7%) to the drug pre-
scribed, there was no significant difference
in marital status with drug compliance
(p>.05). There was no significant differ-
ence between the drug compliance and
occupation (p>.05). Majority of the non-
compliance (40.4%) were employed and
had their own business. There was no
significant difference between drug com-
pliance and education level of the respon-
dents (p>.05). Respondents with no formal
education (44.4%) had high non-
compliance to the drug prescribed. Re-
spondents with total monthly income of
more than RM 1,500.00 had high non-
compliance (43.5%) as compared to the
others. However there was no significant
difference between drug compliance and
total monthly income (p>.05). Respondents
with no family history of hypertension had
high compliance (64.6%) to the medication
prescribed. However there was no signifi-
cant difference between drug compliance
and family history of hypertension (p>.05).
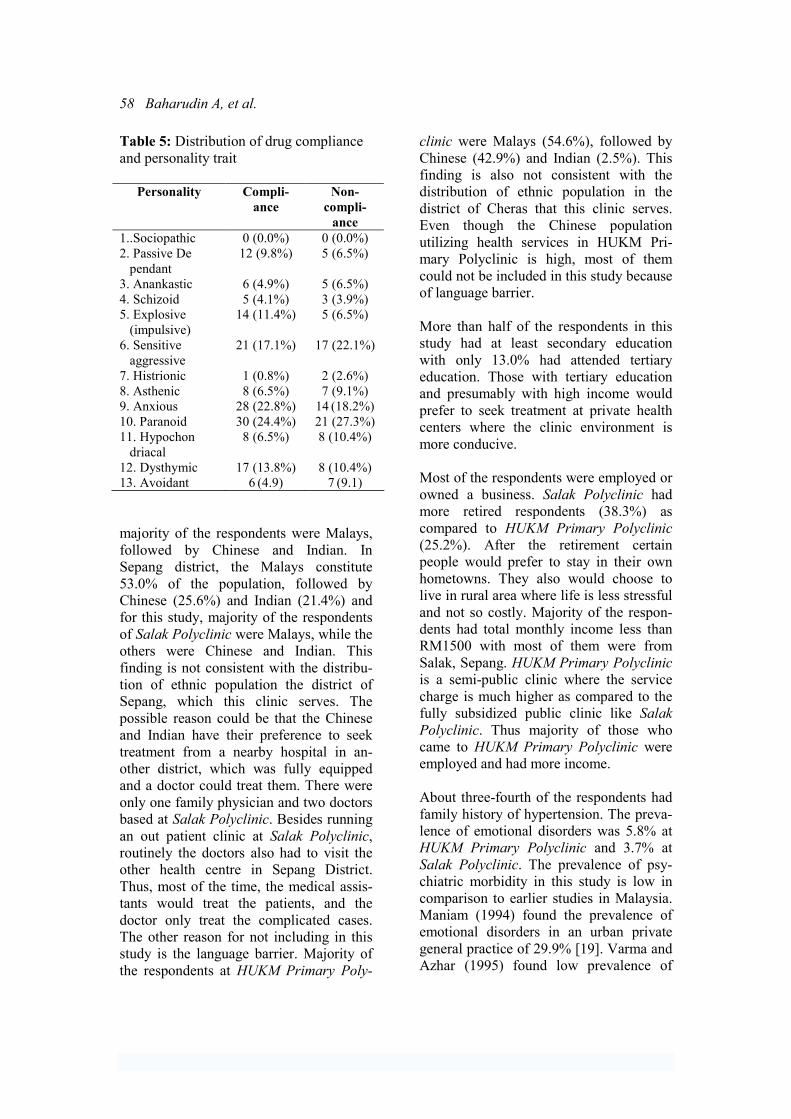
Table 5 shows that paranoid personality
trait (27.3%) was the most common type of
personality traits that associated with non-
compliance to the medication prescribed,
followed by sensitive aggressive personal-
ity trait (22.1%) and anxious personality
trait (18.2%). This study also revealed that
there was no significant difference between
the number of personality traits and drug
compliance (p>.05). However respondents
with multiple personality traits had high
drug non-compliance as compared to
respondents with a single personality trait.
Discussion
The refusal rate for our research was low
and a small percentage of subjects were
Personality profiles among hypertensive patients 57
Table 4: Descriptive characteristics of sociodemographic data and drug compliance
Variable Compliance Non-compliance
Age
40-59 (n=158)
>60 (n=44)
103 (65.2%)
20 (47.6%)
55 (34.8%)
22 (52.4%)
Sex
Male (n=97)
Female (n=103)
52 (53.6%)
71 (68.9%)
45(46.4%)
32 (31.1%)
Race
Malay (n=136)
Chinese (n=55)
Indian (n=9)
90 (73.2%)
26 (47.3%)
7 (77.8%)
46 (33.8%)
29 (52.7%)
2 (22.2%)
Marital status
Single (n=7)
Married (n=182)
Others (n=11)
6 (85.7%)
112 (61.5%)
5 (45.5%)
1 (14.3%)
70 (38.5%)
6 (54.5%)
Occupation
Employed & Business (n=104)
Unemployed (n=74)
Retired (n= 61)
62 (59.6%)
60 (81.0%)
40 (65.6%)
42 (40.4%)
14 (18.9%)
21 (34.4%)
Education level
No formal (n= 9)
Primary (n=51)
Secondary (n=114)
Tertiary (n=26)
5 (55.6%)
32 (62.7%)
70 (61.4%)
16 (61.5%)
4 (44.4%)
19 (37.3%)
44 (38.6%)
10 (38.5%)
Monthly income
< RM 1,500.00 (n=115)
> RM 1,500.00 (n=85)
75 (65.2%)
48 (56.5%)
40 (34.8%)
37 (43.5%)
Family history of hypertension
Yes
No
92 (60.5%)
31 (64.6%)
60 (39.5%)
17 (35.4%)
excluded, thus it is unlikely to have bias in
selection of cases. The respondent had an
age range between 40 and 81 years old,
with the mean age of 53.8 years old.
Majority of respondents were aged 60
years old or less. HUKM Primary Poly-
clinic had more elderly respondents (≥60
years old) as compared to Salak Poly-
clinic. There is a possibility that the eld-
erly living in rural area had a healthier life
style and less stress environment as com-
pared to the elderly in urban area. How-
ever this finding may also be due to the
high awareness of the elderly in the urban
area to seek treatment, whereas the elderly
in the rural area rarely came for treatment
as they always attribute the illness for
ageing process. In rural area, most of the
elderly lived with their spouses or on their
own. As their children lived and worked in
town, there was nobody to bring them to
the clinic. The smaller number of respon-
dents in age group 60 years old and above
could also due to the exclusion of respon-
dents with medical co-morbidity.
The gender distribution was almost equal
between male and female respondents.
This finding was consistent with the
statistics from the Population and Housing
Census of Malaysia (2000) [17]. Majority
of them were married.
The ethnic composition of Malaysia com-
prised 65.1% of Malays, 32.0% of Chinese
and 7.7% of Indians [17]. In this study,
58 Baharudin A, et al.
Table 5: Distribution of drug compliance
and personality trait
Personality Compli-
ance
Non-
compli-
ance
1..Sociopathic 0 (0.0%) 0 (0.0%)
2. Passive De
pendant
12 (9.8%) 5 (6.5%)
3. Anankastic 6 (4.9%) 5 (6.5%)
4. Schizoid 5 (4.1%) 3 (3.9%)
5. Explosive
(impulsive)
14 (11.4%) 5 (6.5%)
6. Sensitive
aggressive
21 (17.1%) 17 (22.1%)
7. Histrionic 1 (0.8%) 2 (2.6%)
8. Asthenic 8 (6.5%) 7 (9.1%)
9. Anxious 28 (22.8%) 14 (18.2%)
10. Paranoid 30 (24.4%) 21 (27.3%)
11. Hypochon
driacal
8 (6.5%) 8 (10.4%)
12. Dysthymic 17 (13.8%) 8 (10.4%)
13. Avoidant 6 (4.9) 7 (9.1)
majority of the respondents were Malays,
followed by Chinese and Indian. In
Sepang district, the Malays constitute
53.0% of the population, followed by
Chinese (25.6%) and Indian (21.4%) and
for this study, majority of the respondents
of Salak Polyclinic were Malays, while the
others were Chinese and Indian. This
finding is not consistent with the distribu-
tion of ethnic population the district of
Sepang, which this clinic serves. The
possible reason could be that the Chinese
and Indian have their preference to seek
treatment from a nearby hospital in an-
other district, which was fully equipped
and a doctor could treat them. There were
only one family physician and two doctors
based at Salak Polyclinic. Besides running
an out patient clinic at Salak Polyclinic,
routinely the doctors also had to visit the
other health centre in Sepang District.
Thus, most of the time, the medical assis-
tants would treat the patients, and the
doctor only treat the complicated cases.
The other reason for not including in this
study is the language barrier. Majority of
the respondents at HUKM Primary Poly-
clinic were Malays (54.6%), followed by
Chinese (42.9%) and Indian (2.5%). This
finding is also not consistent with the
distribution of ethnic population in the
district of Cheras that this clinic serves.
Even though the Chinese population
utilizing health services in HUKM Pri-
mary Polyclinic is high, most of them
could not be included in this study because
of language barrier.
More than half of the respondents in this
study had at least secondary education
with only 13.0% had attended tertiary
education. Those with tertiary education
and presumably with high income would
prefer to seek treatment at private health
centers where the clinic environment is
more conducive.
Most of the respondents were employed or
owned a business. Salak Polyclinic had
more retired respondents (38.3%) as
compared to HUKM Primary Polyclinic
(25.2%). After the retirement certain
people would prefer to stay in their own
hometowns. They also would choose to
live in rural area where life is less stressful
and not so costly. Majority of the respon-
dents had total monthly income less than
RM1500 with most of them were from
Salak, Sepang. HUKM Primary Polyclinic
is a semi-public clinic where the service
charge is much higher as compared to the
fully subsidized public clinic like Salak
Polyclinic. Thus majority of those who
came to HUKM Primary Polyclinic were
employed and had more income.
About three-fourth of the respondents had
family history of hypertension. The preva-
lence of emotional disorders was 5.8% at
HUKM Primary Polyclinic and 3.7% at
Salak Polyclinic. The prevalence of psy-
chiatric morbidity in this study is low in
comparison to earlier studies in Malaysia.
Maniam (1994) found the prevalence of
emotional disorders in an urban private
general practice of 29.9% [19]. Varma and
Azhar (1995) found low prevalence of
Personality profiles among hypertensive patients 59
depression (13.2%) and anxiety disorders
(6.1%) in a primary health setting in
Kelantan [20]. The prevalence of emo-
tional disorders is higher in urban area as
compared to rural area.
Hypertensive personality is among the
most enduring constructs in psychosomatic
medicine. The construct implies that there
is an important relationship between
psychological variables and the likelihood
of developing high blood pressure. Despite
the persistence of hypertensive personality
construct, evidence substantiating its
existence remains equivocal [21]. Hyper-
tension has been associated with certain
personality traits. Hypertensive individuals
were more likely to be characterized by
difficulties with anger expression and
interpersonal anxiety, as well as frequently
exhibited such defence mechanisms as
denial and repression [10]. Research
findings have shown that patients with
hypertension score significantly higher on
neuroticism and somatization traits [15,
22]. In this study, we found that majority
of the respondents had paranoid personal-
ity traits (25.5%), followed by anxious
trait (21%) and sensitive aggressive trait
(19%).
Poor compliance with drug treatment is a
barrier to effective management of hyper-
tension. Compliance is seen as an active,
intentional and responsible process
whereby patients work to maintain their
health in accordance with health regimens
and in collaboration with health care
professionals [23]. In this study, the count-
ing pill method was adopted to measure
medication compliance, where it was done
manually. Every patient was given more
medication than required for the period
under study. The pills were counted with-
out the knowledge of the patients, before it
was given to them. The patients were then
reminded to return the left over medication
during the subsequent follow up. The
tablets left in the container were count
when returned. Therefore part of the
success of this study depends on the trust
of respondents to be truthful of their
compliance. During this study, we noted
that patients who wanted to avoid showing
that they had missed doses might not
return the unused medication. The usual
reported range of non-compliance with
medication is 25-50% [6]. In this study;
the prevalence of non-compliance to the
medication was slightly more than 1/3.
This can be considered relatively low. The
reason for this may be that medications
have developed a great deal during the last
decade. Therefore, they do not have so
many side effects and are more effective
than the predecessors. HUKM Primary
Clinic respondents had a higher rate of
non-compliance to the medication pre-
scribed as compared to Salak Polyclinic.
There was a significant association be-
tween these groups. There were few rea-
sons that can contribute to this significant
association. This significant difference
may be explained by the logistic differ-
ences between these two study sites.
HUKM Primary Polyclinic temporarily
situated at a five-storey shop lot building
at a busy commercial area. However, there
was lack of public transportation for the
patients as the bus/taxi and LRT stations
were quite far from the polyclinic. Besides
that there was not enough parking bay for
the patients. The polyclinic environment is
also not conducive for the patients as the
clinic is always crowded, noisy and small,
thus, most of the time, patients do not have
a place to sit. At HUKM Primary Poly-
clinic, patients have long waiting time
before and during appointments with their
doctor. They were only able to see the
doctor based on the appointments. Patients
who had defaulted were asked to make a
new appointment. On the contrary, Salak
Polyclinic was cozier and less hectic. It is
less crowded and has a large waiting area
with comfortable chairs. It also has ample
parking area and a bus station just outside
the polyclinic area. Patients had shorter
waiting time before and during appoint-
ments. The patients were allowed to see
60 Baharudin A, et al.
their doctors if they had missed their
appointments. Long waiting time before
and during appointments with the physi-
cian are major reasons that the patients’
give for failure to keep subsequent ap-
pointments, and these factors are indirectly
affect their compliance to medications
[24].
The relationship between the patient and
his or her health care practitioners may
affect drug compliance [25-27]. Specific
physician practices and continuity of care
may be important, and compliance can be
improved by good relationships between
the client and the health care provider [24].
The importance of enabling individuals to
take an active part in planning their care
together with the health care personnel
was crucial. At Salak Polyclinic, the
relationship between the health staff and
the patients were closed. Most of the
health staffs live around the polyclinic area
and know most of the attendees. The
doctors and medical assistant in this poly-
clinic are well known among the residents
as most of them are local people and have
been giving services for many years as
compared to those in HUKM Primary
Polyclinic. Most of the time at HUKM
Primary Polyclinic, different doctors will
treat the patients because the doctors were
postgraduate students. A friendly envi-
ronment and good relationship between
the health care provider and the respon-
dents at Salak Polyclinic might have
contributed to the better compliance to
treatment in these respondents.
Study by Monane et al. (1996) found that
increased compliance was associated with
advanced age (85 years and older) but
another study found that age had no influ-
ence on compliance [28,29]. However
Aziz et al. (1999) in their study found that
older age group was statistically signifi-
cant to be non-complier to the prescribed
medication [30]. In this study there was a
significant association between age and
drug compliance, with majority of the
respondents of the older age group (60
years and above) was noted to be non-
complier to the prescribed medication. The
reason for this may be that the elderly has
memory problem and become forgetful,
complexity of drug regimen and more
medication side effects. Drug compliance
among the elderly may be compromised
by an increased number of prescribed
medications, by decreased social support
and by the increased incidence of memory
problems in the population [31].
Majority of the respondents at HUKM
Primary Polyclinic live in the city and
have jobs, thus they were busy with earn-
ing their livelihood and hence forget to
take their medication and attend clinic
appointments. Unlike respondents from
Salak Polyclinic where life is less hectic,
they have more time to come for their
appointments. The service and medication
fees were much higher at HUKM Primary
Polyclinic as compared to Salak Poly-
clinic, where the clients enjoy fully subsi-
dized medical treatment. However, in this
study there was no significant relationship
between drug compliance with occupa-
tional status. There was a significant
association between drug compliance and
gender. Female respondents were found to
be more compliant to the medication as
compared to male respondents.
Aziz et al. (1999) in their study found that
race was not seen to have influence on
compliance [30]. However in this study,
there was a significant association between
drug compliance and race. The Chinese
(52.7%) were found to be non-compliant
to the prescribed medication as compared
to the other major races. The reason could
be that, majority of the Chinese in this
study came from the urban area (94.4%).
Based on the demographic data, most of
them run their own business or work in
private sectors, thus due to busy earned a
living they might forget to take the medi-
cation. The other reason is that the Chinese
community had strong believed on their
Personality profiles among hypertensive patients 61
traditional medications, they like to take
herbs, ginseng and other type of traditional
medicine instead of the drug treatment.
In this study there was no significant
association between drug compliance with
marital status, educational level, income or
family history of hypertension. Although
there was no significant relationship
between educational level and drug com-
pliance, the respondents, who never had
formal education, had a high non-
compliance rate to the medication pre-
scribed. The reasons for this may be that
they are illiterate and have less knowledge
and understanding about the illness. Re-
spondents with income less than RM 1,500
had good compliance. There is a possibil-
ity that this group of people could not
afford to fall sick, as they need to earn a
living. If they fall sick, they could not
work and have to spent the money on the
treatment. Thus, it is better for them to
comply with the medication in order to
prevent complications of the disease.
Mental health generally has not been
studied as a predictor of compliance
among patients with hypertension. The
idea of personality implies that people’s
attitudes and behaviours differ characteris-
tically in ways that persist through chang-
ing situations and over long periods of
time. These traits or habits are assumed to
be largely unconscious approaches to the
world expressed in everything a person
thinks, feels, and does. Thus it caught the
author interest to study the common type
of personality trait among patients with
hypertension. Although, it was found that
respondents with multiple personality
traits had poorer compliance, this study
found no significant association between
drug compliance with a number of person-
ality traits. However, this study found that
majority of the respondents with paranoid
personality trait had poor compliance to
the medication prescribed. A person with
paranoid personality trait often has suspi-
cion and mistrustful to others. There was a
possibility that a person with paranoid
personality trait thence has suspicion with
the medication prescribed.
Nevertheless, in conducting this study, the
researchers were aware of its limitations.
Firstly was the relatively small sample
size, which means that caution should be
applied in generalizing these findings to
the general population. It is recommended
that home visits can be done to administer
questionnaires at patients’ homes or of-
fices. Secondly, the place where the study
was conducted also influences the results
of the assessment. As mentioned earlier, in
HUKM Primary Polyclinic, the clinic
setting was not suitable to be a clinic as it
is located in a shop lot space. The waiting
area was too crowded and has not enough
rooms to see patients. Thus, there was no
proper place to interview the respondents.
Sometimes the respondents were inter-
viewed in the waiting area without any
privacy when the consultation rooms were
fully occupied. The respondents would be
easily distracted by the noise. There were
some patients who did not appear enthusi-
astic about the study despite their volun-
tary participation, given the fact that they
had completed the responses in a rather
short time. Thus, their reply may have
been erratic and unreliable. Nevertheless,
such patients were very small in number.
Thirdly, the urban (HUKM Primary Poly-
clinic) and rural (Salak Polyclinic) cohorts
may not be representative of the general
population. Further studies are recom-
mended to replicate these findings by
using a bigger sample size.
The use of standardized interview sched-
ule such as the PAS, has its limitation too.
The main problem with the use of human
interviewer is observer-bias [32]. There is
a strong tendency for the interviewer
(researcher) to have strong preconceived
views or ideas about the hypothesis or
research subjects, which may influence the
clinical ratings. To minimize this form of
bias, a second rater (supervisor) was called
62 Baharudin A, et al.
in and the degree of agreement (kappa)
calculated between the two.
Many methods have been used to measure
compliance, each of which is limited by
biases and methodological flaws [33]. The
potential effect of the measurement itself,
termed the “hawthorne effect,” must be
considered. This is the effect (often bene-
ficial or positive) of observation itself on
the outcome. Frequently, an individual’s
knowledge that he or she is under study
influences behaviour and may therefore
affects the compliance.
In this study, the researchers had the
problem usually encountered in compli-
ance studies, which results in an incom-
plete picture of compliance. Question-
naires were only received from patients
who visited health providers. The patients
with the poorest compliance do not visit
the health care personnel and frequently do
not participate in the study – therefore
studied a self-selected population.
By identifying different “characteristic’,
“prerequisites” and “difficulties that
describe compliance, it should be possible
to make treatment more individual. It is
also important for the individuals to under-
stand that the significance of their own
contributions. Health care systems have an
important task in informing these indi-
viduals about their ability to affect their
hypertension disease via their behaviour
and treatment.
References 1. Osman A, Rampal KG, Lubis SH. Preva-
lence studies among hypertensive Malays in
Kuala Selangor. Med J Malaysia. 1984;
39:148-50.
2. Frochlich ED, Apstein C, Chobanian AV,
Devereux RB, Dustan HP, Fauad-Tarazi F, et
al. The heart in hypertension. N Engl J Med.
1992;327:998-1008.
3. Chalmers J, Mac Mohan S, Mancia G.
World Health Organization - International
Society of Hypertension Guidelines for the
management of hypertension. J Hypertens.
1999;17:151-83.
4. The sixth report of the Joint National
Committee prevention, detection, evaluation
and treatment of high blood pressure. Arch
Intern Med. 1997;157:2413-8.
5. Cooper JK, Love DW, Raffoul PR. Inten-
tional prescription nonadherence (noncompli-
ance) by the elderly. J Am Geriatr Soc.
1982;30:329-33.
6. Sackett DL, Haynes RB. Compliance with
therapeutic regimens. Baltimore (MD): The
John Hopkins University Press; 1976.
7. Hortwitz RI, Hortwitz SM. Adherence to
treatment and health outcomes. Arch Intern
Med. 1993;153:1863-8.
8. Lim TO, Ngah BA, Rahman RA. The
Mentakab Hypertension Study Project Part V-
drug compliance in hypertensive patient.
Singapore Med J. 1992;33:63-6.
9. Becker MH. Sociobehavioural determi-
nants of compliance. Baltimore (MD): The
John Hopkin University Press; 1976.
10. Sommers-Flanagan JS, Greenberg RP.
Psychosocial variables and hypertension: a
new look at an old controversy. J Nerv Ment
Dis. 1989;177:15-24.
11. Jorgensen RS, Johnson BT, Kolodziej
ME, Schreer GE. Elevated blood pressure and
personality: a meta-analytic review. Psychol
Bull. 1996;120:293-320.
12. Suls J, Wan CK, Costa PT. Relationship
of trait anger to resting blood pressure: a meta-
analysis. Health Psychol. 1995. 14: 444-56.
13. Rosmond R, Rakinen T, Chagnon M,
Perusse L, Chagnon YC, Bouchard C, et al.
Polymorphism in exon 6 of the Dopamine D(2)
receptor gene (DRD2) is associated with
elevated blood pressure and personality disor-
ders in men. J Hum Hypertens. 2001;15: 553-
8.
14. Hozawa A, Onkuba T, Tsuji F, Kikuyu M,
Matsubara M., Suzuki T, et al. Relationship
between personality and self measured blood
pressure value at home; the Ohasama study.
Clin Exp Hypertens (New York). 2002;24:
115-23.
15. Coelho AM, Coelho R, Barres H, Rocha-
Goncalves F, Reis Lima MA. Essential arterial
hypertension: psychopathology, compliance,
and quality of life. Revista Portuegesa de
Cardiologica. 1997;16:873-83.
16. Friedman R, Schwartz J, Scndl P,
Lendsbergies P, Pieper C, Gevin W, et al.
Psychological variables in Hypertension: Rela-
tionship to Causal or ambulatory Blood Pres-
Personality profiles among hypertensive patients 63
sure in men. Psychosom Med. 2001;63:19-31.
17. Department of Statistics, Malaysia. Popu-
lation and Housing Census of Malaysia, Year
2001. Kuala Lumpur; 2001.
18. Peter T, Alexander MS, Cicchetti D,
Cohen MS. Realibility of a schedule for rating
personality disorder. Br J Psychiatry. 1979;
135:168-74.
19. Maniam T. Psychiatric morbidity in an
urban general practice. Med J Malaysia. 1994;
49:242-46.
20. Varma SL, Azhar MZ. Psychiatric symp-
tomatology in primary health setting in Malay-
sia. Med J Malaysia. 1995;50:11-6.
21. Shapiro AP. Psychological factors in
hypertension :an overview. Am Heart J. 1988;
116: 632-7.
22. Irvine MJ, Garner DM, Olmsted MP,
Logan AG. Personality differences between
hypertensive and normotensive individuals:
influence of knowledge of hypertension status.
Psychosom Med. 1989;51:537-41
23. Kyngas H, Hentinen M, Koivukangas P,
Ohinma A. Young diabetics’ compliance in the
framework of MIMIC model. J Adv Nurs.
1996;24: 997-1005.
24. Haynes RB. A critical review of the
‘determinants’ of patient compliance with
therapeutic regimens. The John Hopkins
University Press; 1976.
25. Hulka BS, Cassel JC, Kupper LL,
Burdette JA. Communication, compliance, and
concordance between physicians and patients
with prescribed medications. Am J Public
Health. 1976;66:847-53.
26. Ong LM, de Haes JC, Hoos AM, Lammes
FB. Doctor - patient communication: a review
of the literature. Soc Sci Med. 1995;40:903-18
27. Stewart M, Brown JB, Boon H, Galadja J,
Meredith L, Sangster M. Evidence on patient-
doctor communication. Cancer Prev Control.
1999;3:25-30.
28. Monane M, Bohn RL. Compliance with
anti-hypertensive therapy among elderly
Medicaid enrolles: The role of age, gender and
race. Am J Public Health. 1996;86:1805-8.
29. Bohari H, Ahmad DAR, Abdullah MY.
Compliance towards anti-hypertensive treat-
ment in Besut District, Hospital Terengganu.
Journal Perubatan UKM 1989;12:139-45.
30. Aziz AMA, Ibrahim MIM. Medication
non- compliance – A Thriving problem. Med.
J. Malaysia. 1999;54:192-8.
31. Balakrishnan R. Predictors of medication
adherence in the elderly. Clinical therapy.
1998;20:764-71.
32. Lewis, G., William, P. Clinical judgment
and standardized interview in psychiatry.
Psychol Med. 1989;19:971-9.
33. Nichol, M.B., Venturinni, F., Sung, J.C. A
critical evaluation of the methodology of the
literature on medication compliance. Ann
Pharmachoter. 1999;33:531-40.
ASEAN Journal of Psychiatry 2007;8 (2):64-70.
___________________________________________________________________________________
Correspondence: Jesjeet Singh Gill, Department of Psychological Medicine, Faculty of Medicine,
University Malaya, 50603 Kuala Lumpur, Malaysia.
Email: [email protected]
Received July 9, 2007; Accepted September 10, 2007.
ORIGINAL ARTICLE
The first methadone programme in Malaysia: overcoming
obstacles and achieving the impossible
JESJEET SINGH GILL, AHMAD HATIM SULAIMAN, & MOHD HUSSAIN HABIL
Department of Psychological Medicine, Faculty of Medicine, University Malaya, 50603 Kuala Lumpur,
Malaysia.
Abstract
Objectives: To determine the best possible programme that suits our local setting, to deter-
mine the average dose required, and to determine possible problems that can arise from im-
plementing such a programme locally and how best to address them. Methods: The inclusion
criteria were those above 18, a positive urine test, the presence of a supportive carer and
willing to engage in the programme. Methadone was initiated and observations relating to
dose, adverse events, relationship with carers, work performance, crime and high risk behav-
iours were monitored for 18 weeks. Results: Two thirds of the 45 subjects completed the trial
over the 18 week period. No significant adverse events occurred and improvement in relation-
ship with carers and work performance were noted with reduction in crime and high risk
behaviours. Conclusion: Methadone is a safe and effective drug that can be used in the local
Malaysian setting.
Key words: opioid dependence, methadone, harm reduction
Introduction
Drug abuse in Malaysia is not a recent
phenomenon. Though records show that
locally, drug abuse dates back to the 8th
century among Arab traders, the problem
only escalated with the arrival of Europe-
ans, especially during the British rule.
Chinese migrant labourers, who were
brought in to work in the tin mines, used
opium in large amounts. Similarly, Indian
migrants who were brought to work in
plantations popularized the use of cannabis
[1].
The period of drug use in Malaysia de-
scribed above has been termed the “pre
independence” period. The “post independ-
ence” period started in the 60’s, when
Malay youths gradually took over from
Chinese as the main drug users [2]. Rapid
progress and urbanization brought social,
economical and political changes within the
country, and being still fresh from inde-
pendence, a strong ‘British’ influence still
prevailed. Local youths joined their West-
ern contemporaries in undergoing the
cultural revolution of the 60’s and in em-
bracing the “hippie” movement. [1].
Around this same period, the establishment
of “The Golden Triangle” in Burma, Laos
and Thailand increased the supply of drugs
to the surrounding areas, including Malay-
sia [3].
This problem escalated tremendously in the
70’s and 80’s, where from only 711 addicts
identified in 1970, a total of 26,513 were
identified in 1982 and, only a year later,
this rose to 92,310 [1]. Finally on 19th
February 1983, the Prime Minister declared
The first methadone programme in Malaysia 65
that drugs, as the nations number one
enemy, and a threat to national security [2].
The Drug Dependents (Treatment and
Rehabilitation) Act was passed in 1983,
allowing compulsory detainment of drug
users for up to two years [4].
Currently, there is estimated to be 400,000
to 800,000 drug users in Malaysia [2].
Within the year 2000, 30,593 drug users
were detected nationwide, whereby 14,850
(48.5%) were first time offenders and the
remaining 15,743 (51.5%) were repeat
offenders. The majority of those detected
were males, (98.3%) and 65.9% were
Malay. One of the main methods of treat-
ment has been rehabilitating drug users in
“Pusat Serentis” (Government run rehabili-
tation centres), where drug users can be
detained for up to two years in accord with
“The Drug Dependents (Treatment and
Rehabilitation) Act, 1983”. There are 27
“Pusat Serentis” all over the county which
detains a total of 8,000 to 9,000 drug users
at any one time. The drug users are detoxi-
fied ‘cold turkey’ and kept abstinent with-
out any drug substitution for two years.
This method has largely been ineffective,
where less than 10 % of rehabilitated
opioid dependence patients were able to
eventually stay of drugs.
The current widespread recognition that the
problem of drug usage brings about a wide
array of social, economic and health prob-
lems has created more pressure from the
public for the Government to review its
treatment approaches and to give an in-
creased role to health workers in managing
heroin dependence patients. Corruption,
accidents, prostitution and school drop outs
have all frequently been associated with
drug addiction [5]. Widespread substance
misuse also depletes the human resources
of a nation, as the majority of drug misus-
ers are within the ages where they could be
contributing to the nation’s workforce. In
Malaysia, 83% of drug users detected in
2000 were below the age of 40 years. Drug
usage strains the nation’s budget not only
due to the loss of workforce, but also due to
the cost of carrying out rehabilitation
programs, health education and preventive
programs, medical costs, legal costs and
loss due to crimes. In Malaysia, the Gov-
ernment spends about RM 30 a day on each
drug offender at all the rehabilitation cen-
ters. A history of imprisonment is common
in heroin users in Malaysia. In the year
2000 lone, the total number of arrests under
the “Dangerous Drugs Act” was 17,550.
However, it is the issue of health problems,
particularly HIV, related to the use of
intravenous heroin that has made the gov-
ernment and public sit up and realize the
seriousness of the current situation. The
number of HIV-positive people in Malaysia
has increased dramatically in recent years.
Since the first case of AIDS was detected in
December, 1986, the number of HIV posi-
tive Malaysians has swelled tremendously.
From only four cases in 1986, it has risen to
a total of 992 cases by 1990 and 51,256 by
2002. Malaysia is a country with a HIV
epidemic that primarily affects IVDUs. As
of the end of 2001, 76 per cent of all re-
ported HIV infections were to be found
among IVDUs. The true figure may be
much higher because HIV testing is only
regularly done among drug users and sex
workers rounded up in police raids.
Methadone maintenance was first devel-
oped as a treatment for heroin addiction in
the mid-1960s [6] and has been proven to
be an effective and safe mode of treatment
[7,8]. Methadone maintenance has been
proven beyond a doubt to be important in
the reduction of the spread of HIV via
intravenous drug use [9,10] and a leads to
reduction in crime rates. Despite the over-
whelming evidence on the benefits of
methadone, and intense lobbying by certain
quarters locally, it was only last year that
methadone was registered locally for use in
the treatment of opiate dependence. Even
then, the criticism against its use continued
and widespread resistance was still met.
Many believed in total abstinence and
66 Gill JS, et al.
viewed methadone as just another drug. It
was then that we decided to embark on this
trial to gather local evidence that metha-
done can be a safe and effective drug to use
in the treatment of heroin dependence in
Malaysia. The objectives of this study was
to determine the best possible programme
that suits the local setting, to determine the
average dose required in our local popula-
tion and to determine possible problems
that can arise from implementing such a
programme locally and how best to address
them.
Methods
Subjects were recruited by newspaper
advertisements and word of mouth. The
intended study population was the maxi-
mum recruited (not exceeding 100 subjects
due to budget constraints) within an 18-
week period. Each subject was to be fol-
lowed up for 18 weeks (Day 0-126). The
inclusion criteria set was those who were
above 18, a confirmed heroin user (by urine
test) and with the presence of a supportive
carer, willing to engage in the programme
and come once every 1-3 days for follow
up and willing to buy methadone at their
own cost after completion of the study
(should they still require it). The exclusion
criteria were concurrent use of medication
that interacts with methadone and a grossly
abnormal liver function.
During screening (Day 0), consent was
obtained and physical examination, liver
function test and drug urinalysis done.
Demographics along with drug and crimi-
nal histories were noted. Relationship with
carers was assessed using a visual analog
scale, scored from 0-10. Eligible subjects
would then undergo “Methadone Initiation”
(Day 1), where they would arrive in the
morning while experiencing withdrawals,
and served with 10 mg methadone at 8 a.m.
If withdrawals persist, additional doses of
methadone would be served every 1-2
hours by 5 mg each time until there is a
cessation of withdrawals.
Subjects would then enter the “Titration
Phase” (Day 2-56). Dose can be adjusted
on any day depending on presence of
withdrawals or adverse events. Subjects
with good social support may receive
prescription for up to three days each time,
hence need only to come every three days
(with the condition that the carer handles
the methadone). From Day 56-126 (“Re-
duction Phase”), a gradual reduction of
methadone would be attempted at a dose
reduction of 2.5 – 5mg a week. However,
reduction is not mandatory. An attempt
would only be made depending on patient’s
tolerability and confidence, and the investi-
gator’s judgement.
Throughout the 18 weeks, subjects would
be assessed monthly regarding their rela-
tionship with their carers, work perform-
ance, high-risk behaviour and criminal
activities. Random urine tests were also
done monthly to detect concurrent heroin
use.
Results
Study population
A total of 46 subjects turned up for screen-
ing, of which 1 patient was excluded due to
grossly abnormal liver enzymes. Another 5
subjects dropped out after Day 0 (screen-
ing) and did not undergo methadone initia-
tion. Therefore, only 40 subjects were
given methadone, and results would be
based on these subjects. Though it was
initially planned to recruit 100 subjects,
were had to stop recruitment after 18 weeks
as initially planned due to budget con-
straints and ethical committee stipulations.
We had initially expected to be able to
recruit 100 subjects within the stipulated 18
weeks period, but eventually we were only
able to recruit 46 subjects
The subjects were mainly males, consisting
of 38 (95%) subjects, with only 2 females.
Slightly more than half, 23 (57.5%) of them
were married, 14 (35.0%) were single and 3
(7.5%) were divorced or separated. Only 23
(57.5%) of them were employed at screen-
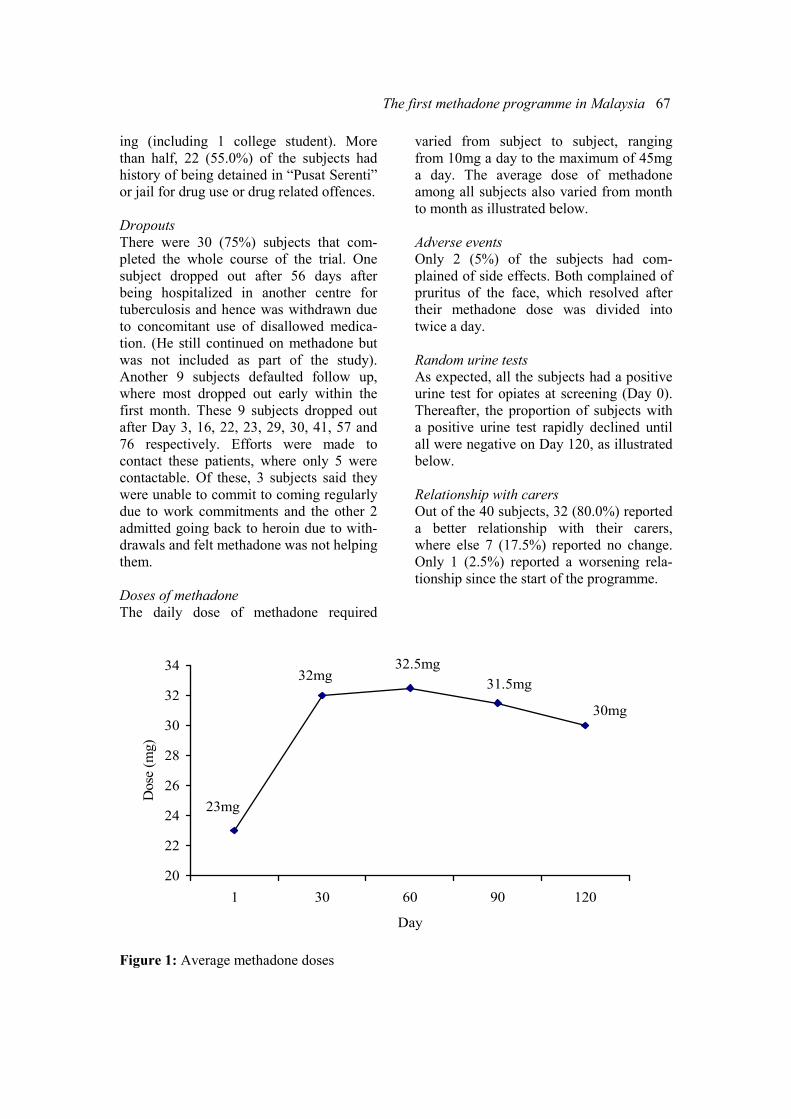
The first methadone programme in Malaysia 67
ing (including 1 college student). More
than half, 22 (55.0%) of the subjects had
history of being detained in “Pusat Serenti”
or jail for drug use or drug related offences.
Dropouts
There were 30 (75%) subjects that com-
pleted the whole course of the trial. One
subject dropped out after 56 days after
being hospitalized in another centre for
tuberculosis and hence was withdrawn due
to concomitant use of disallowed medica-
tion. (He still continued on methadone but
was not included as part of the study).
Another 9 subjects defaulted follow up,
where most dropped out early within the
first month. These 9 subjects dropped out
after Day 3, 16, 22, 23, 29, 30, 41, 57 and
76 respectively. Efforts were made to
contact these patients, where only 5 were
contactable. Of these, 3 subjects said they
were unable to commit to coming regularly
due to work commitments and the other 2
admitted going back to heroin due to with-
drawals and felt methadone was not helping
them.
Doses of methadone
The daily dose of methadone required
varied from subject to subject, ranging
from 10mg a day to the maximum of 45mg
a day. The average dose of methadone
among all subjects also varied from month
to month as illustrated below.
Adverse events
Only 2 (5%) of the subjects had com-
plained of side effects. Both complained of
pruritus of the face, which resolved after
their methadone dose was divided into
twice a day.
Random urine tests
As expected, all the subjects had a positive
urine test for opiates at screening (Day 0).
Thereafter, the proportion of subjects with
a positive urine test rapidly declined until
all were negative on Day 120, as illustrated
below.
Relationship with carers
Out of the 40 subjects, 32 (80.0%) reported
a better relationship with their carers,
where else 7 (17.5%) reported no change.
Only 1 (2.5%) reported a worsening rela-
tionship since the start of the programme.
23mg
32mg32.5mg
31.5mg
30mg
20
22
24
26
28
30
32
34
1 30 60 90 120
Day
Dose (mg)
Figure 1: Average methadone doses
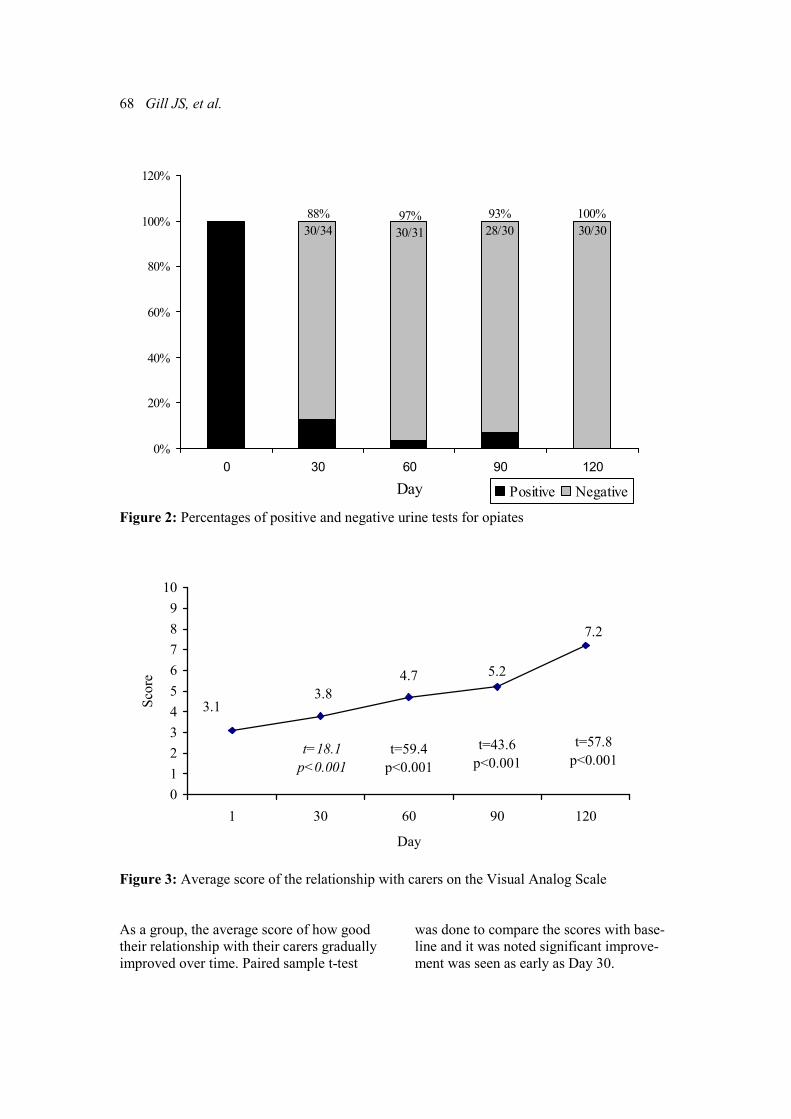
68 Gill JS, et al.
88%
30/34
97%
30/31
93%
28/30
100%
30/30
0%
20%
40%
60%
80%
100%
120%
0 30 60 90 120
Day Positive Negative
Figure 2: Percentages of positive and negative urine tests for opiates
3.13.8
t=18.1
p<0.001
4.7
t=59.4
p<0.001
5.2
t=43.6
p<0.001
7.2
t=57.8
p<0.001
0
1
2
3
4
5
6
7
8
9
10
1 30 60 90 120
Day
Score
Figure 3: Average score of the relationship with carers on the Visual Analog Scale
As a group, the average score of how good
their relationship with their carers gradually
improved over time. Paired sample t-test
was done to compare the scores with base-
line and it was noted significant improve-
ment was seen as early as Day 30.
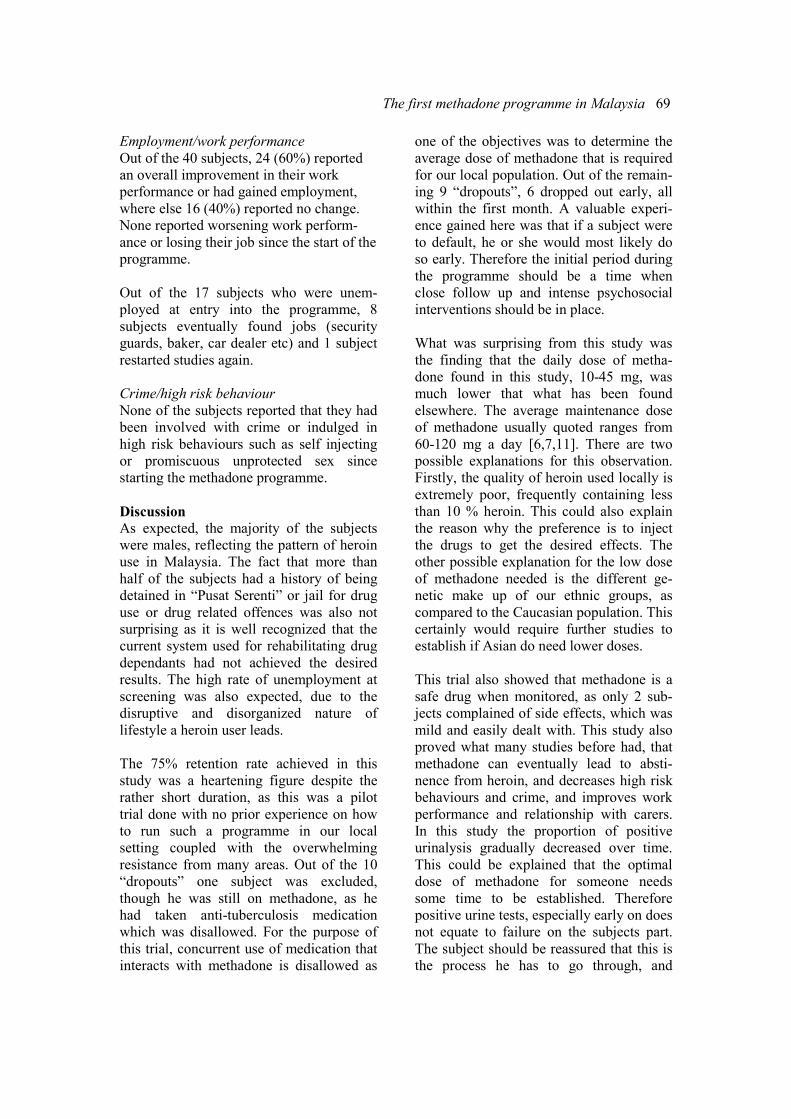
The first methadone programme in Malaysia 69
Employment/work performance
Out of the 40 subjects, 24 (60%) reported
an overall improvement in their work
performance or had gained employment,
where else 16 (40%) reported no change.
None reported worsening work perform-
ance or losing their job since the start of the
programme.
Out of the 17 subjects who were unem-
ployed at entry into the programme, 8
subjects eventually found jobs (security
guards, baker, car dealer etc) and 1 subject
restarted studies again.
Crime/high risk behaviour
None of the subjects reported that they had
been involved with crime or indulged in
high risk behaviours such as self injecting
or promiscuous unprotected sex since
starting the methadone programme.
Discussion
As expected, the majority of the subjects
were males, reflecting the pattern of heroin
use in Malaysia. The fact that more than
half of the subjects had a history of being
detained in “Pusat Serenti” or jail for drug
use or drug related offences was also not
surprising as it is well recognized that the
current system used for rehabilitating drug
dependants had not achieved the desired
results. The high rate of unemployment at
screening was also expected, due to the
disruptive and disorganized nature of
lifestyle a heroin user leads.
The 75% retention rate achieved in this
study was a heartening figure despite the
rather short duration, as this was a pilot
trial done with no prior experience on how
to run such a programme in our local
setting coupled with the overwhelming
resistance from many areas. Out of the 10
“dropouts” one subject was excluded,
though he was still on methadone, as he
had taken anti-tuberculosis medication
which was disallowed. For the purpose of
this trial, concurrent use of medication that
interacts with methadone is disallowed as
one of the objectives was to determine the
average dose of methadone that is required
for our local population. Out of the remain-
ing 9 “dropouts”, 6 dropped out early, all
within the first month. A valuable experi-
ence gained here was that if a subject were
to default, he or she would most likely do
so early. Therefore the initial period during
the programme should be a time when
close follow up and intense psychosocial
interventions should be in place.
What was surprising from this study was
the finding that the daily dose of metha-
done found in this study, 10-45 mg, was
much lower that what has been found
elsewhere. The average maintenance dose
of methadone usually quoted ranges from
60-120 mg a day [6,7,11]. There are two
possible explanations for this observation.
Firstly, the quality of heroin used locally is
extremely poor, frequently containing less
than 10 % heroin. This could also explain
the reason why the preference is to inject
the drugs to get the desired effects. The
other possible explanation for the low dose
of methadone needed is the different ge-
netic make up of our ethnic groups, as
compared to the Caucasian population. This
certainly would require further studies to
establish if Asian do need lower doses.
This trial also showed that methadone is a
safe drug when monitored, as only 2 sub-
jects complained of side effects, which was
mild and easily dealt with. This study also
proved what many studies before had, that
methadone can eventually lead to absti-
nence from heroin, and decreases high risk
behaviours and crime, and improves work
performance and relationship with carers.
In this study the proportion of positive
urinalysis gradually decreased over time.
This could be explained that the optimal
dose of methadone for someone needs
some time to be established. Therefore
positive urine tests, especially early on does
not equate to failure on the subjects part.
The subject should be reassured that this is
the process he has to go through, and
70 Gill JS, et al.
should not be reprimanded. It is heartening
that none of the subjects, or their carers
reported that they had been involved with
crime or indulged in high risk behaviours
since starting the methadone programme.
However, we must bear in mind that these
are based on self reports This is in keeping
with numerous other reports citing a reduc-
tion in injecting behaviour in those on
methadone [12,13].
A majority of the subjects reported an
overall improvement in their work per-
formance or had gained employment. More
importantly none reported the worsening of
work performance or losing their jobs since
the start of the programme, despite the very
frequent follow-ups that they have to go
through. Similarly, many reported an
overall improvement in their relationship
with their carers, similar to what other
studies have shown [14]. Interestingly, one
subject complained of a worsening rela-
tionship with his wife. This was caused by
the fact that he was more stable and con-
cerned about his wife’s bad attitudes. In the
past, he preoccupied with heroin use and
did not care about his wife’s behaviour.
Though we are producing results that have
already been proven time and again, we
feel it is still important as these has never
been shown in our local setting. Local data
such as this is extremely important in trying
to convince the authorities in adopting new
measures to abolish the drug abuse menace
and the rise of HIV in Malaysia.
We do recognize some limitations in our
study. Due to the budget constraints, the
study population was small, and the follow
up duration was rather short. A study with
larger sample size and longer follow up
period is warrant.
References 1. Khairuddin Y, Siti Norazah Z, Saroja B, et
al. Knowledge, attitudes and perceptions to
drug abuse in peninsula Malaysia with addi-
tional focus on parents and adolescents. a
research report, April 1994. Social Obstetrics
and Gynaecology Department, Faculty of
Medicine, University Malaya, Kuala Lumpur.
2. Hussain H. Managing heroin addicts
through medical therapy. In Haque A (Ed).
Mental health in Malaysia: issues and concerns.
University Malaya Press, Kuala Lumpur; 2001.
3. Handbook on ‘Knowing and fighting
drugs’. National Drug Agency, Home Ministry
Malaysia; 1997.
4. MMA Anti-Substance Abuse Committee.
Guidelines on substance abuse. Malaysian
Medical Association; 1993.
5. Kandel DB, Davies M and Karus D. The
consequences in young adulthood of adolescent
drug involvement. Arch Gen Psychiatry. 1986;
43:746-54.
6. Dole VP, Nyswander ME, Kreek MJ.
Narcotic blockade: a medical technique for
stopping heroin use by addicts. Trans Assoc
Am Phys. 1966;79:122-36.
7. Novick DM, Richman BL, Friedman JM,
Friedman JE, Fried C, Wilson JP, et al. The
medical status of methadone maintenance pa-
tients in treatment for 11-18 years. Drug Alco-
hol Depend. 1993;33:235-45.
8. Van den Brink W, Haasen C. Evidenced-
based treatment of opioid-dependent patients.
Can J Psychiatry. 2006;51:621-3.
9. Novick DM, Khan I, Kreek MJ. Acquired
immunodeficiency syndrome and infection with
hepatitis viruses in individuals abusing drugs by
injection. Bull Narc. 1986;38:15-25.
10. Des Jarlais DC, Friedman SR, Novick DM,
Sotheran JL, Thomas P, Yancovitz SR, et al:
HIV I infection among intravenous drug users
in Manhattan, New York City 1977 to 1987.
JAMA. 1989;261:1008-12.
11. Dole VP: Methadone treatment and the
acquired immunodeficiency syndrome epide-
mic. JAMA. 1989;262:1681-2.
12. Deren S, Kang SY, Colón HM, Robles RR.
Predictors of injection drug use cessation
among Puerto Rican drug injectors in New
York and Puerto Rico. Am J Drug Alcohol
Abuse. 2007;33:291-9.
13. Millson P, Challacombe L, Villeneuve PJ,
Strike CJ, Fischer B, Myers T, et al. Reduction
in injection-related HIV risk after 6 months in a
low-threshold methadone treatment program.
AIDS Educ Prev. 2007;19:124-36.
14. Padaiga Z, Subata E, Vanagas G. Outpa-
tient methadone maintenance treatment pro-
gram. Quality of life and health of opioid-
dependent persons in Lithuania. Medicina
(Kaunas). 2007;43:235-41.
ASEAN Journal of Psychiatry 2007;8 (2):71-81.
_____________________________________________________________________ Correspondence: Yoon Phaik Ooi, Child Guidance Clinic, 3 Second Hospital Avenue, #03-01 Health
Promotion Board Building, Singapore 168937.
Email: [email protected]
Received July 12, 2007; Accepted August 16, 2007.
ORIGINAL ARTICLE
Effects of CBT on children with disruptive behaviour disor-
ders: findings from a Singapore study
YOON PHAIK OOI1, REBECCA ANG
2, DANIEL FUNG
1, GERALDINE WONG
1, &
YIMING CAI1
1 Institute of Mental Health, Singapore
2 Nanyang Technological University, Singapore
Abstract Objective: The study examines the effectiveness of a CBT treatment programme over and
above that of Treatment As Usual (TAU), with children who were referred to an outpatient
child psychiatric clinic for disruptive behaviour disorders in Singapore. Methods: One hun-
dred and three children aged 8 to 12 (mean±SD=10.22±1.31) who participated in the study
were assigned to either the CBT+TAU (n= 51) or TAU group (n=52). Children in both the
CBT+TAU and TAU groups received a standard and typical service offered to children at the
outpatient child psychiatric clinic. In addition, children in the CBT+TAU group attended the
CBT treatment programme that consisted of nine 1.5 hour weekly sessions. Results: Findings
from ANCOVA indicated that children in the CBT+TAU treatment group showed signifi-
cantly lower levels of aggression and significantly lower levels of parental stress at post-
treatment and at 3-month follow-up in comparison to the TAU group. Conclusions: Findings
from the present study provided some evidence of the effects of CBT in reducing aggressive
behaviour and parental stress among children with disruptive behaviour disorders. Interpreta-
tion of the findings, recommendations for future research, and implications of the present
study were presented.
Key words: disruptive behaviour disorders, cognitive behavioural therapy, aggression,
parental stress
Introduction
Disruptive behaviour disorders are among
the most prevalent disorders of childhood
[1,2]. Children and adolescents with disrup-
tive behaviour disorders often exhibit
behaviours that are marked by severe
aggression, violence, defiance, impulsivity,
antisocial features, and even delinquency
[3,4]. These disruptive behaviours cluster
together and occur at higher rates than
usual for children of the same age. Normal
children may also exhibit many of the
behavioural problems seen in children with
diagnosed disruptive behaviour disorders,
but their behaviour problems are fewer and
occur less frequently. The difficulties of
these disruptive disorders would pose fewer
problems if most of these children grew out
of their disruptive behaviours. However,
studies found that over 90% of recidivist
juvenile delinquents had disruptive behav-
iour disorders as children; and 40% of 7
and 8 year olds with disruptive behaviour
disorders become recidivist delinquents as
teenagers [5].
72 Ooi YP, et al.
Although not all children with disruptive
behaviour disorders have persistent mental
health problems to adulthood, it is one of
the substantial risk factors for a lifetime of
antisocial behaviour, social dysfunction,
delinquency, substance abuse, poor peer
relations, academic failure, and school
dropout
[2,6,7]. Disruptive behaviour
disorders have been associated with severe,
aggressive and antisocial behaviours that
persist over the life course [1,8,9] and are
often resistant to treatment [10,11]. Taken
together, these studies suggest that disrup-
tive behaviour disorders may result in
enormous societal costs - a more violent
society that brings about psychological,
social, and economic consequences [12,
13].
Current literature suggests that stress within
the parent-child relationship is often asso-
ciated with behaviour problems in children
[14,15]. Parents of children with disruptive
behaviour disorders often reported high
levels of child- and parent-related stress
[16,17]. Parents who are highly stressed
tend to have lower tolerance of children’s
misbehaviour, causing parents to behave
negatively toward the child [18,19]. Almost
inevitably, these aggressive, disruptive, and
antisocial behaviours serve as a source of
negative parent-child interactions. In addi-
tion, mothers of children with disruptive
behaviour disorders tend to be more nega-
tive and directive, and less responsive to
child initiations than mothers of non-
disordered children [20]. These studies
seem to suggest that the characteristics of
children with disruptive behaviour disor-
ders create an atmosphere of fear, negativ-
ity, and conflict that increase parental stress
and undermine the quality of parent-child
relationships [21].
As a result, disruptive behaviour disorders
are among the most common reasons for
referral to child mental health services [22,
23]. In Singapore, data obtained from an
outpatient child psychiatric reflected simi-
lar trend. From 2001 to 2003, about 644
(31.1%) out of 2,072 children referred to
the outpatient child psychiatric clinic in
Singapore consisted of children and adoles-
cents with disruptive behaviour disorders
[24]. This finding indicated that disruptive
behaviour disorders are most commonly
seen at the outpatient child psychiatric
clinic and is a rising concern in Singapore.
Given the magnitude of the problem, inter-
vention programmes that forestall the
continuation of disruptive behaviour disor-
ders and prevent its long-term conse-
quences are especially crucial for countries
like Singapore that depend mainly on
human resources for growth and develop-
ment [22-24]. As such, disruptive behav-
iour disorders in childhood or adolescence
need to be taken seriously and addressed in
Singapore.
Many researchers have suggested interven-
tion programmes that are comprehensive
and integrated, and directed toward these
salient features of disruptive behaviour
disorders [25,26] CBT has gained popular-
ity due to its effectiveness and generalis-
ability [27-29]. These intervention pro-
grammes for children and adolescents
diagnosed with disruptive behaviour disor-
ders have been based on our emerging
understanding of the social-cognitive
difficulties of these children [30,31]. Vari-
ous studies have revealed these children
often exhibit deficits in social cognition
such as cognitive appraisal processes and
interpersonal problem-solving skills
[32,33]. These children tend to encode
fewer interpersonal or environmental cues
before interpreting the intention of the
behaviour of others and tend to infer hostile
intent especially in ambiguous situations
[32,33] They were also found to generate
more aggressive and ineffective solutions
to interpersonal problems compared to non-
disordered children [27]. These deficits
may lead to poor impulse control, low
frustration and stress tolerance, and limited
insight of their own feelings as well as
those of others. As a result, children with
disruptive behaviour disorders may fre-
CBT on children with disruptive behaviour disorders 73
quently face frustrations due to a lack of
skills on how to cope with their feelings
and behaviour.
Hence, instead of focusing on the teaching
of specific skills, the CBT treatment pro-
gramme focuses on modifying the thought
processes that support aggressive and
antisocial behaviour and teaching problem-
solving strategies [34]. Exposure to these
skills enables children with disruptive
behaviour disorders to enhance positive
social interactions with family and peers,
learn non-aggressive methods to resolve
conflict, and adopt non-aggressive beliefs
[35]. Findings from various studies exam-
ining the efficacy of CBT have also indi-
cated classroom behavioural improve-
ments, increased self-esteem, perceived
social competence, and reductions in par-
ents' or teachers’ ratings of aggression
following intervention [28,36]. Hence, it
appears that CBT treatment programmes
have the potential to generalise skills across
settings [28,36].
Purpose of the study
This study hopes to determine the effects of
the CBT treatment programme over and
above that of Treatment As Usual (TAU) at
post-treatment and whether gains made (if
any), are maintained three months follow-
ing the termination of the CBT treatment
programme. We predicted that children in
the CBT+TAU group would show signifi-
cantly lower levels of aggression based on
child and parent measures. In addition,
children in the CBT+TAU group would
show significantly lower levels of parental
stress at post-treatment and at 3-month
follow-up. There is a large body of research
evidence documenting the effects of CBT
treatment programmes in Western contexts
but limited published research studies can
be found in Asian contexts [37]. Hence,
there are limited data to inform teachers,
counsellors, and those in the child mental
health services about strategies that work
best for children with disruptive behaviour
disorders. Importing Western intervention
strategies without local verification and
addressing issues relevant to the local
context may not be appropriate and effec-
tive [38,39]. There is now increasing evi-
dence that suggest the need for finding
ways to improve the relevance and effec-
tiveness of intervention programmes
adopted from the Western context to the
Asian context [39]. It is then important to
investigate these issues in an Asian context
like Singapore.
Methods
Participants
One hundred and three children who had
been attending one of the local child psy-
chiatric outpatient clinics for at least 6
months participated in the present study.
These children were included only if they:
a) were diagnosed by their attending psy-
chiatrists (based on a semi-structured
clinical interview and psychological as-
sessment of the child) to have disruptive
behaviour disorders such as Attention
Deficit Hyperactivity Disorder (ADHD),
Oppositional Defiant Disorder (ODD), or
Conduct Disorder (CD), with or without a
comorbidity of other disorders by the
DSM-IV criteria [3,4], b) had a T-score
more than 70 on the aggressive behaviour
subscale of the Child Behaviour Checklist
(CBCL) [40], c) were between 8 to 12
years old (Primary 2 to Primary 6), d) had
parental consent and e) understood English
and were English-speaking. In addition,
children on medications were included in
the study on the condition that no change of
medication doses occurred one month prior
to the participation and throughout the
study.
The mean age for the sample was 10.2
years (SD=1.3). Eighty-six per cent of the
participants were boys while the remaining
11.4% were girls. The racial composition
was 89.5% Chinese, 5.7% Malay, 1.9%
Indian, and 2.9% Others (which includes
all other ethnic groups not listed). Self
reported marital status of the parents were
as follows: 83.8% were married, 2.9% were
74 Ooi YP, et al.
separate, 10.5% were divorced, 1.8% were
widowed, and 1% had never been married.
Measures
The Child Behaviour Checklist (CBCL)
was designed to quantify a broad range of
behavioural and emotional difficulties in
children [40]. For the purposes of this
study, the Aggressive Behaviour subscale
of the CBCL (A-CBCL), which consists of
20 items that measure children’s aggression
from ages 4 to 18, was used. Parents were
asked to rate how true each item was using
the following scale: 0 (Not true) to 2 (Very
or Often true). Sample items included
“Argues a lot” and “Gets in many fights”.
All items on the A-CBCL were summed to
provide a total score. Higher scores on the
A-CBCL indicated higher levels of aggres-
sion. Previous studies have reported a
Cronbach alpha value of .93 for the CBCL
total score [41,42]. In the present sample,
the Cronbach alpha value for the pre-
treatment A-CBCL score was .89.
The Parenting Stress Index (PSI) is a scale
that identifies stress within the parent-child
relationships, and consists of two domains
[43]. The PSI screens for dysfunctional
parenting and predicts the potential for
parental behaviour problems and child
adjustment difficulties within the family
system. The Child domain relates to the
parents’ perception in which the child may
be perceived as stressful. The Parent do-
main relates to parents’ view of their own
functioning. For the purposes of this study,
a total of 13 items from the Reinforces
Parent (RE) (Child domain) and Attach-
ment (AT) (Parent domain) subscales were
used. The RE subscale measures the degree
of parent-child interaction that results in
positive affective response in parents. The
AT subscale measures the level of motiva-
tion to fulfil the role of a parent. Parents
were asked to rate the description on a 5-
point Likert scale from 1 (Strongly dis-
agree) to 5 (Strongly agree). Higher scores
on the PSI indicated higher levels of stress
within the parent-child relationships. Sam-
ple items included “My child rarely does
things for me that make me feel good” and
“Most times I feel that my child likes me
and wants to be close to me.” The PSI can
be used with parents whose children are in
preschool to 12 years of age. The reliability
of the subscales used in this study are .83
for the RE subscale and .75 for the AT
subscale [43]. Previous studies have also
reported Cronbach’s alpha values of .93 for
PSI total score, .85 for the Parent domain
and .91 for Child domain [44]. In the
present sample, the Cronbach’s alpha value
for the total pre-treatment PSI score was
.72.
Design and procedures
The current study was approved by the
Institute of Mental Health’s Clinical Re-
search Committee and the National Health-
care Group’s Domain Specific Review
Board. Prior to conducting the study, the
appropriate approval from parents (or
guardians) of individual participants was
obtained. Participation in the study was
strictly voluntary and only children with
parental consent were allowed to partici-
pate in the study. Written informed consent
was obtained from the parents during the
clinic visits, and research procedures were
fully explained to the parents. All responses
obtained were kept confidential.
Power calculations were done to determine
the appropriate sample size. For a medium
effect size of .50 to be statistically signifi-
cant (at p<.05) approximately 80% of the
time, a minimum sample size of 64 would
be required [45]. Hence, the proposed
target for the CBT+TAU group and the
TAU group was 60 respectively. This
estimation was based on the assumed
attrition of 50%. Because the CBT treat-
ment programme was to be delivered in the
context of small groups consisting of about
6 to 8 children in each group, much time
was spent for the participant recruitment. In
addition, it was difficult to predict the
number of participants to be enrolled into
the study. Hence, because of these practical
CBT on children with disruptive behaviour disorders 75
constraints, random assignment was not
fully possible. This resulted in the first 51
participants referred to the study to be in
CBT+TAU and the next 52 to be in TAU.
CBT+TAU condition: Fifty-one participants
in the CBT+TAU group attended nine 1.5-
hour weekly sessions of the group-based
CBT treatment programme conducted by
the researcher [46,47] and individually
administered Treatment As Usual (TAU)
sessions once every 2 months on average.
These children were assigned to 9 sub-
groups that consisted of 6 to 8 children in
each sub-group. The 9-week CBT sessions
focused on: 1) Self-awareness, 2) Anger
Coping Techniques, 3) Perspective-taking
Skills, 4) Social Problem-Solving Skills, 5)
Fighting Fair and 6) Prosocial Skills. It was
delivered in the context of small groups (6
to 8 children in each group) and each
session followed the same general format:
(a) Review of previous lesson and home-
work, b) Introduction to a new set of skills,
(b) Structured skills rehearsal, (c) Group
activities, (d) Summary and homework
assignment, and e) Presentation of rewards.
In order to control for biases, parents and
children had no prior knowledge about the
CBT+TAU condition and were told that
those assigned to the CBT+TAU group
would be undergoing a series of 9 sessions
to help them learn some useful problem-
solving skills.
TAU condition: Fifty-two participants in
the TAU group received individually
administered TAU sessions, a typical form
of intervention provided by the outpatient
child psychiatric to children with disruptive
and aggressive behavioural problems. The
conventional therapy is usually provided by
psychiatrists and consists of medication
treatment and individual supportive therapy
and parent training using behavioural
techniques. Children who received TAU
met up with the psychiatrist once every two
months on average.
Treatment integrity: The integrity of CBT
treatment programme was assessed in the
following ways. First, the CBT treatment
programme was conducted by the re-
searcher, who holds a postgraduate degree
in counselling. The intervention pro-
gramme was manualised in order to adhere
to intervention procedures. Second, the
researcher conducted her first intervention
group with the on-site supervisor, a con-
sultant psychiatrist, as part of the direct
supervision process. Third, both the re-
searcher and on-site supervisor completed
checklists that described the specific
themes to be covered for each session. The
correlation between researcher-rated and
on-site supervisor rated protocol adherence
was .95 (p<.001), Forth, the researcher
documented children’s progress and unique
features of each session. Last, on-going
clinical supervision and feedback were
provided throughout the study through
direct observation, review and discussion
sessions with dissertation and on-site
supervisor to ensure the adherence with
intervention procedures and treatment
fidelity.
Data analysis
Descriptive statistics were used to analyze
the demographic characteristics of respon-
dents such as age, gender, ethnicity, educa-
tional level, and parents’ marital status
from both the CBT+TAU and TAU groups.
A series of Analysis of Covariance (AN-
COVA) were used. All research partici-
pants, regardless of treatment drop-outs or
missing data, were included in the intent-
to-treat analysis. The intent-to-treat analy-
sis was conducted with available pre-
treatment data carried forward to replace all
missing data at post-treatment and 3-month
follow-up. The intent-to-treat analysis
limited to 3-month follow-up was deemed
appropriate [48].
Results
Preliminary analyses
Preliminary analyses of t-tests for continu-
ous variables and chi-square for categorical
variables were conducted to examine
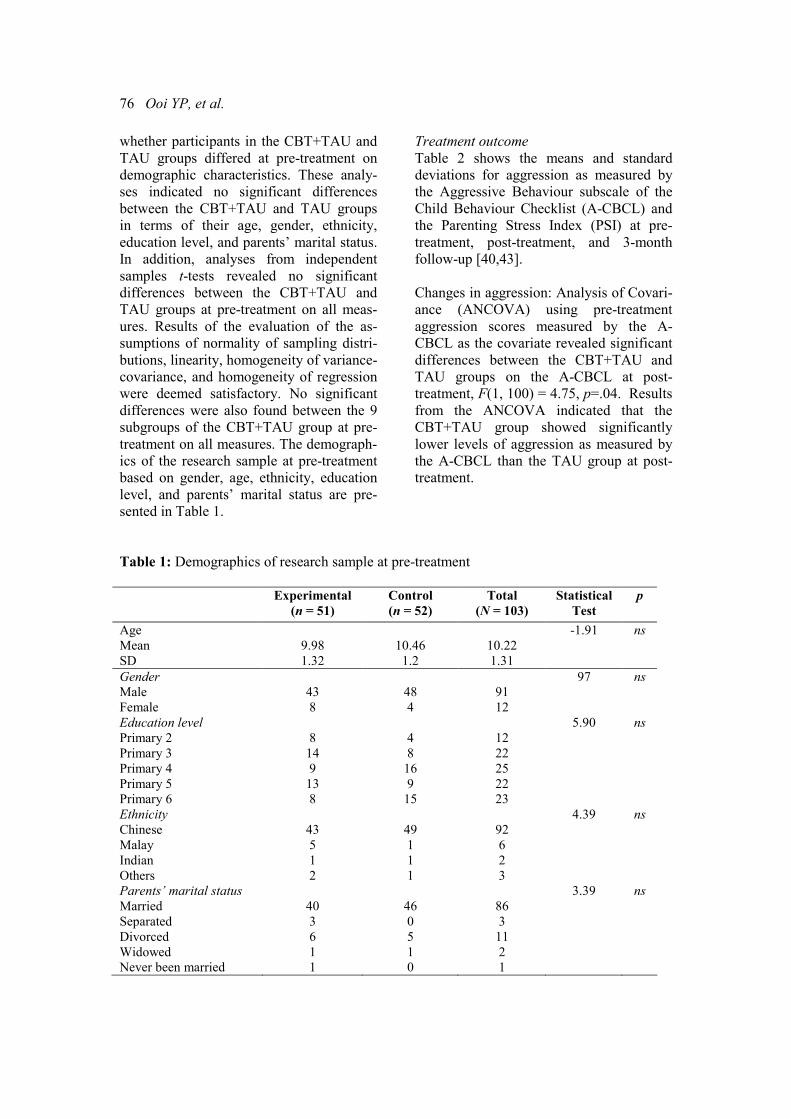
76 Ooi YP, et al.
whether participants in the CBT+TAU and
TAU groups differed at pre-treatment on
demographic characteristics. These analy-
ses indicated no significant differences
between the CBT+TAU and TAU groups
in terms of their age, gender, ethnicity,
education level, and parents’ marital status.
In addition, analyses from independent
samples t-tests revealed no significant
differences between the CBT+TAU and
TAU groups at pre-treatment on all meas-
ures. Results of the evaluation of the as-
sumptions of normality of sampling distri-
butions, linearity, homogeneity of variance-
covariance, and homogeneity of regression
were deemed satisfactory. No significant
differences were also found between the 9
subgroups of the CBT+TAU group at pre-
treatment on all measures. The demograph-
ics of the research sample at pre-treatment
based on gender, age, ethnicity, education
level, and parents’ marital status are pre-
sented in Table 1.
Treatment outcome
Table 2 shows the means and standard
deviations for aggression as measured by
the Aggressive Behaviour subscale of the
Child Behaviour Checklist (A-CBCL) and
the Parenting Stress Index (PSI) at pre-
treatment, post-treatment, and 3-month
follow-up [40,43].
Changes in aggression: Analysis of Covari-
ance (ANCOVA) using pre-treatment
aggression scores measured by the A-
CBCL as the covariate revealed significant
differences between the CBT+TAU and
TAU groups on the A-CBCL at post-
treatment, F(1, 100) = 4.75, p=.04. Results
from the ANCOVA indicated that the
CBT+TAU group showed significantly
lower levels of aggression as measured by
the A-CBCL than the TAU group at post-
treatment.
Table 1: Demographics of research sample at pre-treatment
Experimental
(n = 51)
Control
(n = 52)
Total
(N = 103)
Statistical
Test
p
Age
Mean
SD
9.98
1.32
10.46
1.2
10.22
1.31
-1.91
ns
Gender
Male
Female
43
8
48
4
91
12
97 ns
Education level
Primary 2
Primary 3
Primary 4
Primary 5
Primary 6
8
14
9
13
8
4
8
16
9
15
12
22
25
22
23
5.90 ns
Ethnicity
Chinese
Malay
Indian
Others
43
5
1
2
49
1
1
1
92
6
2
3
4.39 ns
Parents’ marital status
Married
Separated
Divorced
Widowed
Never been married
40
3
6
1
1
46
0
5
1
0
86
3
11
2
1
3.39 ns
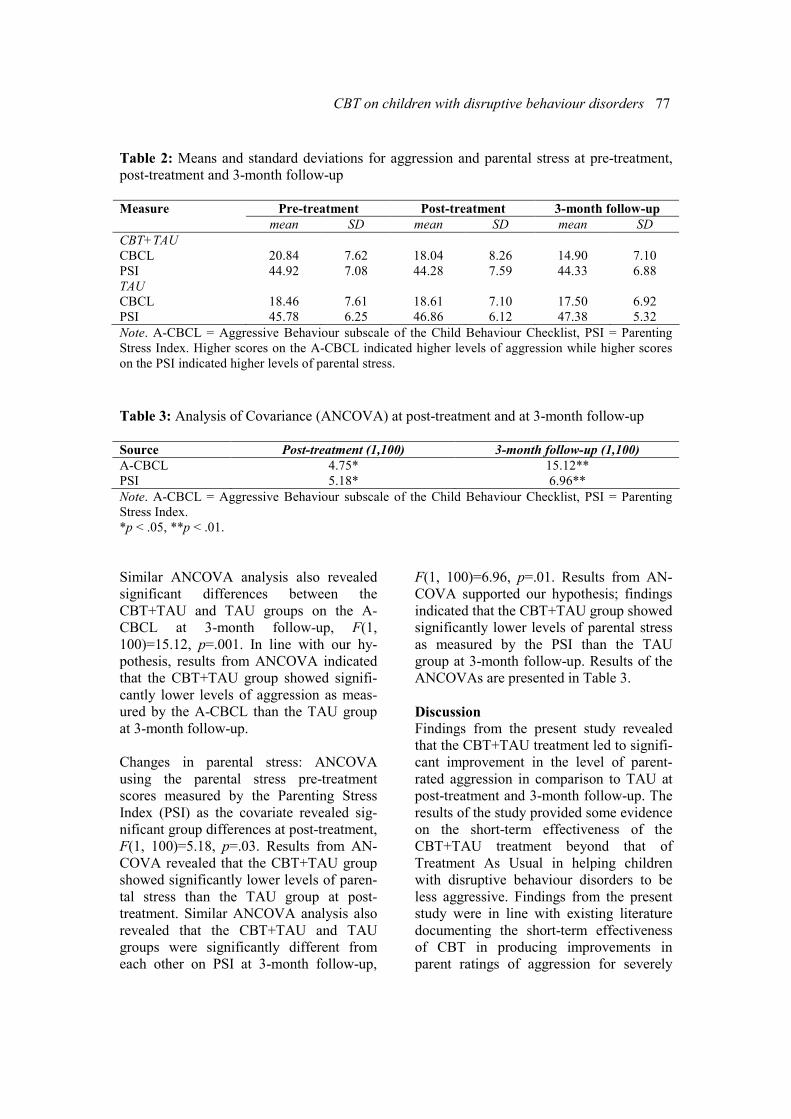
CBT on children with disruptive behaviour disorders 77
Table 2: Means and standard deviations for aggression and parental stress at pre-treatment,
post-treatment and 3-month follow-up
Pre-treatment Post-treatment 3-month follow-up Measure
mean SD mean SD mean SD
CBT+TAU
CBCL
PSI
20.84
44.92
7.62
7.08
18.04
44.28
8.26
7.59
14.90
44.33
7.10
6.88
TAU
CBCL
PSI
18.46
45.78
7.61
6.25
18.61
46.86
7.10
6.12
17.50
47.38
6.92
5.32
Note. A-CBCL = Aggressive Behaviour subscale of the Child Behaviour Checklist, PSI = Parenting
Stress Index. Higher scores on the A-CBCL indicated higher levels of aggression while higher scores
on the PSI indicated higher levels of parental stress.
Table 3: Analysis of Covariance (ANCOVA) at post-treatment and at 3-month follow-up
Source Post-treatment (1,100) 3-month follow-up (1,100)
A-CBCL 4.75* 15.12**
PSI 5.18* 6.96**
Note. A-CBCL = Aggressive Behaviour subscale of the Child Behaviour Checklist, PSI = Parenting
Stress Index.
*p < .05, **p < .01.
Similar ANCOVA analysis also revealed
significant differences between the
CBT+TAU and TAU groups on the A-
CBCL at 3-month follow-up, F(1,
100)=15.12, p=.001. In line with our hy-
pothesis, results from ANCOVA indicated
that the CBT+TAU group showed signifi-
cantly lower levels of aggression as meas-
ured by the A-CBCL than the TAU group
at 3-month follow-up.
Changes in parental stress: ANCOVA
using the parental stress pre-treatment
scores measured by the Parenting Stress
Index (PSI) as the covariate revealed sig-
nificant group differences at post-treatment,
F(1, 100)=5.18, p=.03. Results from AN-
COVA revealed that the CBT+TAU group
showed significantly lower levels of paren-
tal stress than the TAU group at post-
treatment. Similar ANCOVA analysis also
revealed that the CBT+TAU and TAU
groups were significantly different from
each other on PSI at 3-month follow-up,
F(1, 100)=6.96, p=.01. Results from AN-
COVA supported our hypothesis; findings
indicated that the CBT+TAU group showed
significantly lower levels of parental stress
as measured by the PSI than the TAU
group at 3-month follow-up. Results of the
ANCOVAs are presented in Table 3.
Discussion
Findings from the present study revealed
that the CBT+TAU treatment led to signifi-
cant improvement in the level of parent-
rated aggression in comparison to TAU at
post-treatment and 3-month follow-up. The
results of the study provided some evidence
on the short-term effectiveness of the
CBT+TAU treatment beyond that of
Treatment As Usual in helping children
with disruptive behaviour disorders to be
less aggressive. Findings from the present
study were in line with existing literature
documenting the short-term effectiveness
of CBT in producing improvements in
parent ratings of aggression for severely
78 Ooi YP, et al.
disturbed antisocial children in psychiatric
inpatient settings and those in the school
settings [28,36,49,50]. These findings
indicated that the CBT+TAU treatment
programme lead to improvement in aggres-
sive behaviour across time, suggesting that
the skills learned in the clinic were general-
ised to home settings and were maintained
over time. In addition, improvements in
aggressive behaviour suggest that children
with disruptive behaviour disorders can be
taught skills to respond to anger-provoking
situations appropriately without resorting to
aggression. The CBT treatment programme
provided these children with the under-
standing of anger, effective anger coping
skills, problem-solving skills, and perspec-
tive-taking skills that can alter their social-
cognitive skills related to aggression before
inappropriate behavioural responses occur.
Findings from the present study revealed
that the CBT+TAU treatment also led to a
significant improvement of parental stress
in comparison to TAU at post-treatment
and 3-month follow-up. High levels of
parental stress are often evident in children
with disruptive behaviour disorders
[16,17]. This is because these children’s
disruptive and aggressive behaviours tend
to be pervasive, and could lead to dysfunc-
tional, coercive patterns in the family that
are characterised by frequent yelling and
punishment [51,52]. As such, parents often
find it stressful to manage the aggressive
and disruptive behaviours manifested by
their children. With the evidence of re-
duced aggressive behaviours on parent
measures of aggression at post-treatment
and at 3-month follow-up, parents, perhaps,
felt more competent, satisfied, and en-
hanced personally in their parenting role.
These changes may have contributed to the
significant improvements in the levels of
parental stress in the present study.
While the limited support for the
CBT+TAU treatment programme is note-
worthy, findings on the positive outcomes
on parent measures of aggression should
not be over-interpreted. There is a tendency
for parents to be “biased toward perceiving
improvement following involvement in
almost any intervention” [53]. Hence, the
positive outcomes on parent measures of
aggression may be a function of parent’s
biased or exaggerated reporting behaviour.
In addition, the significant improvement on
parent measures might be caused by the
factors that were neither examined nor
controlled, such as children’s maturation
and regression to mean amongst others.
Limitations
There are several limitations to the present
study that should be acknowledged. One of
the most apparent limitations is that the
cognitive processes and mechanisms ac-
counting for changes were not investigated.
While findings from the present study
revealed significant improvements on
parent measures, conclusions about the
changes in processes and mechanisms that
accounted for significant improvements
cannot be interpreted. Another limitation of
the study derives from the use of a quasi-
CBT+TAU design. The constraints im-
posed by the quasi-CBT+TAU study have
been well documented [54]. Random
assignment of participants into treatment
groups was also not achievable in the
present study because of constraints men-
tioned in the earlier paragraphs. In addition,
it was not possible to blind parents as to
which treatment their child was receiving
because of the nature of the CBT program.
Children in the CBT+TAU group had to
attend 9 weekly sessions. Parents of chil-
dren in the CBT+TAU also have access to
workbooks that could easily allow them to
identify the type of treatment that the child
was in.
The sample employed in the present study
represented a clinical-based sample of 103
children aged 8 to 12 and thus has limited
generalisability. Hence, findings from these
studies should be regarded as tentative until
further replication studies are conducted on
larger and more representative samples.
CBT on children with disruptive behaviour disorders 79
The present study relies heavily on parent-
report of aggression, which may be subject
to biases. Child aggressive behaviour
reported by the parent may be influenced
by a biased perception affected by child’s
negative reputation. It would be interesting
to examine aggression from the child’s and
teacher’s perspectives as they may have a
very different perception of the behaviour.
Implications
Findings from the present study replicated
and extended previous literature that is
relatively sparse in demonstrating the
effects of CBT treatments in reducing
aggressive behaviour and improving par-
ent-child relationships with Asian children
clinically referred for disruptive behaviour
disorders. Without well-controlled research
and evaluation studies in an Asian context,
researchers in Asia could be putting the
children’s mental health field at risk.
Hence, it is hoped that findings from the
present study serve as an impetus for future
research efforts examining the effects of
problem-solving based treatments among
children with disruptive behaviour disor-
ders in Singapore and other parts of Asia.
This way, services and treatment pro-
grammes that are culturally appropriate can
be developed to serve these at-risk children
more effectively.
Acknowledgements
This study was supported by research
scholarships from Nanyang Technological
University and Singapore Millennium
Foundation. In addition, this study was also
sponsored by research grant NHG-
STP004004 from the National Healthcare
Group, Singapore, awarded to Daniel S. S.
Fung, MBBS, MMed (Psych), FAMS, and
Rebecca P. Ang, Ph.D.
References 1. Lahey BB, Miller TL, Gordon RA, Riley
AW. Developmental epidemiology of the
disruptive behaviour disorders. In: Quay HC,
Hogan AE, editors. Handbook of disruptive
behaviour disorders. New York: Kluwer Aca-
demic; 1999. p. 23–48.
2. Loeber R, Green SM, Lahey BB, Frick PJ,
McBurnett K. Findings on disruptive behaviour
disorders from the first decade of the Develop-
mental Trends Study. Clin Child Fam Psychol
Rev. 2000;3:37–60.
3. American Psychiatric Association. Diag-
nostic and statistical manual of mental disor-
ders. 4th edition. Washington (DC): Author;
1994.
4. American Psychiatric Association. Diag-
nostic and statistical manual of mental disorders
IV-TR. Text revision. Washington (DC):
Author; 2000.
5. Farrington DP. The development of offend-
ing and antisocial behaviour from childhood:
Key findings from the Cambridge study in
delinquent development. J Child Psychol
Psychiatr. 1995;36:929-64.
6. Capaldi DM, Stoolmiller M. Co-occurrence
of conduct problems and depressive symptoms
in early adolescent boys: III. Prediction to
young-adult adjustment. Dev Psychopathol.
1999;11:59-84.
7. Walker HM, Colvin G, Ramsey E. Antiso-
cial behaviour in school: Strategies and best
practices. Pacific Grove (CA): Brooks/Cole;
1995.
8. Loeber R, Hay D. Key issues in the devel-
opment of aggression and violence from child-
hood to early adulthood. Annu Rev Psychol.
1997;48:371-410.
9. Maughan B, Rutter M. Antisocial children
grown up. In: Hill J, Maughan B, editors.
Conduct disorders in childhood and adolescence
Cambridge: Cambridge University Press; 2001.
p. 505-52.
10. Brown SA, Gleghom A, Schuckit MA,
Myers MG, Mott MA. Conduct disorder among
adolescent alcohol and drug abusers. J Stud
Alcohol. 1996;57:314-24.
11. Myers MG, Brown SA, Mott MA. Preado-
lescent conduct disorder behaviours predict
relapse and progression of addiction for adoles-
cent alcohol and drug users. Alcohol: Clin Exp
Res. 1995;19:1528-36.
12. Hughes JN, Cavell TA. Cognitive-
behavioural approaches: Enhancing competence
in aggressive children. In: Cartledge G, Milburn
JF, editors. Teaching social skills to children
and youth: Innovative approaches. 3rd edition.
Boston: Allyn & Bacon; 1995. p. 199-236.
13. Moffitt TE, Caspi A, Harrington H, Milne
BJ. Males on the life-course-persistent and
adolescence-limited antisocial pathways:
80 Ooi YP, et al.
Follow-up at age 26 years. Dev Psychopathol.
2002;14:179-207.
14. Moss E, Rousseau D, Parent S, St-Laurent
D, Saintonge J. Correlates of attachment at
school age: Maternal reported stress, mother-
child interaction, and behaviour problems.
Child Dev. 1998;69:1390 -405.
15. Ross CN, Blanc HM, McNeil CB, Eyberg
SM, Hembree-Kigin TL. Parenting stress in
mothers of young children with oppositional
defiant disorder and other severe behaviour
problems. Child Stud J. 1998;28:93-110.
16. Mash EJ, Johnston C. A comparison of
mother-child interactions of younger and older
hyperactive and normal children. Child Dev.
1982;53:1371-81.
17. Mash EJ, Johnston C. Parental perceptions
of child behaviour problems, parenting self-
esteem, and mothers’ reported stress in younger
and older hyperactive and normal children. J
Consult Clin Psychol. 1983;51:86-99.
18. Bugental DB, Johnston C. Parental and
child cognitions in the context of the family.
Annu Rev Psychol. 2000;51:315-44.
19. Isley SL, O'Neil R, Clatfelter D, Parke RD.
Parent and child expressed affect and children's
social competence: Modelling direct and indi-
rect pathways. Dev Psychol. 1999;35:547–60.
20. Danforth JS, Barkley RA, Stokes TF.
Observations of parent-child interactions with
hyperactive children: Research and clinical
implications. Clin Psychol Rev. 1991;11:703-
27.
21. Stouthamer-Loeber M, Loeber R. The use
of prediction data in understanding delin-
quency. Behav Sci Law. 1988;6: 333–54.
22. Frick PJ, Silverthorn P. Behaviour disor-
ders in children. In: Adams HE, Sutker PB,
editors. Comprehensive handbook of psychopa-
thology. 3rd edition. New York: Plenum; 2001.
p. 879-919.
23. Kazdin AE. Conduct disorders in childhood
and adolescence. 2nd edition. Thousand Oaks
(CA): Sage; 1995.
24. Fung DSS, Cai Y. A guide to child and
adolescent psychiatry. Unpublished manuscript;
2005.
25. Cairns RB, Mahoney J, Xie H, Cadwal-
lader TW. Middle childhood. In: Silverman
WK, Ollendick TH, editors. Developmental
issues in the clinical treatment of children.
Boston: Allyn & Bacon; 1999. p. 108-24.
26. Kazdin AE. Psychosocial treatments for
conduct disorder in children and adolescents.
In: Nathan PE, Gorman JM, editors. A guide to
treatments that work. New York: Oxford
University Press; 2002. p. 57-85.
27. Dunn SE, Lochman JE, Colder CR. Social
problem-solving skills in boys with conduct and
oppositional defiant disorders. Aggress Behav.
1997;23:457-69.
28. Prinz RJ, Blechman EA, Dumas JE. An
evaluation of peer coping skills training for
childhood aggression. J Clin Child Psychol.
1994;23:193-203.
29. Kazdin AE, Weisz JR, editors. Evidence-
based psychotherapies for children and adoles-
cents. New York: Guilford Press; 2003.
30. Crick NR, Dodge KA. A review and
reformulation of social information processing
mechanisms in children's social adjustment.
Psychol Bull. 1994;115:74–101.
31. Dodge KA, Lochman J, Harnish JD, Bates
JE, Petit GS. Reactive and proactive aggression
in school children and psychiatrically impaired
assaultive youth. J Abnorm Psychol. 1997;106:
37-51.
32. Lochman JE, Dodge KA. Distorted percep-
tions in dyadic interactions of aggressive and
non-aggressive boys: Effects of prior expecta-
tions, context, and boys' age. Dev Psychopathol.
1998;10:495-512.
33. Webster-Stratton C, Lindsay DW. Social
competence and conduct problems in young
children: Issues in assessment. J Clin Child
Psychol. 1999;28:25-43.
34. Greene MB. Youth violence in the city:
The role of educational interventions. Health
Educ Behav. 1998;25:175-93.
35. Nadel H, Spellmann M, Alvarez-Canino T,
Lausell-Bryant LL, Landsberg, G. The cycle of
violence and victimisation: A study of the
school-based intervention of a multidisciplinary
youth violence prevention programme. Am J
Prev Med. 1996; 12:109-19.
36. Kazdin AE, Siegel T, Bass D. Cognitive
problem-solving skills training and parent
management training in the treatment of antiso-
cial behaviour in children. J Consult Clin
Psychol. 1992;60:733-47.
37. Ang RP. Social problem-solving skills
training: Does it really work? Child Care Pract.
2003;9:5-17.
38. Leung K, Zhang JX. Systemic considera-
tions: Factors facilitating and impeding the
development of psychology in developing
countries. Int J Psychol. 1995;30: 691-706.
39. Oei TP, editor. Behaviour therapy and
cognitive behaviour therapy in Asia. Australia:
Edumedia; 1998.
CBT on children with disruptive behaviour disorders 81
40. Achenbach TM. Manual for the child
behaviour checklist/4-18 and 1991 profile.
Burlington (VT): University of Vermont,
Department of Psychiatry; 1991.
41. Liu X, Guo C, Okawa M, Zhai J, Li Y,
Uchiyama M, et al. Behavioural and emotional
problems in Chinese children of divorced
parents. J Am Acad Child Adolesc Psychiatry.
2000;39:896-903.
42. Liu X, Sun Z, Neiderhiser J, Uchiyama M,
Okawa M, Rogan W. Behavioural and emo-
tional problems in Chinese adolescents: Parent
and teacher reports. J Am Acad Child Adolesc
Psychiatry. 2001;40 (Suppl 7):828-36.
43. Abidin R. Parenting stress index manual.
3rd edition. Charlottesville (VA): Pediatric
Psychology Press; 1990.
44. Tam K, Chan Y, Wong CM. Validation of
parenting stress index among Chinese mothers
in Hong Kong. J Community Psychol.
1994;22:211-23.
45. Cohen J. Statistical power analysis for the
behavioural sciences. 2nd edition. Hillsdale
(NJ): Lawrence Erlbaum; 1988.
46. Ang R, Ooi YP. Helping angry children
and youth: Strategies that work. Activity work-
book. Singapore: Armour Publishing; 2003.
47. Ang R, Ooi YP. Helping angry children
and youth: Strategies that work. Training
manual. Singapore: Armour Publishing; 2003.
48. Kenardy J, Dow M, Johnston D, Newman
M, Thomson A, et al. A comparison of delivery
methods of cognitive–behavioural therapy for
panic disorder: An international multicenter
trial. J Consult Clin Psychol. 2003;71:1068–75.
49. Cavell AA, Hughes JN. Secondary preven-
tion as context for assessing change processes
in aggressive children. J Sch Psychol.
2002;38:199-235.
50. Kazdin AE, Bass D, Siegel T, Thomas C.
Cognitive-behavioural therapy and relationship
therapy in the treatment of children referred for
antisocial behaviour. J Consult Clin Psychol.
1989;57:522-35.
51. Barkley RA. Attention deficit hyperactivity
disorder: A handbook for diagnosis and treat-
ment. 2nd edition. New York: Guilford Press;
1998.
52. Patterson GR, Reid JB, Dishion TJ. Anti-
social boys. Eugene (OR): Castalia; 1992.
53. Dishion TJ, Patterson GR, Kavanaugh KA.
An experimental test of the coercion model:
Linking theory, measurement, and intervention.
In: McCord J, Tremblay, RE, editors. Prevent-
ing antisocial behaviour: Interventions from
birth through adolescence. New York: Guilford
Press; 1992. p. 253-82.
54. Dennis ML, Boruch RF. Improving the
quality of randomised field experiments: Tricks
of the trade. New Dir Programme Eval.
1994;63:87-101.
ASEAN Journal of Psychiatry 2007;8 (2):82-89.
___________________________________________________________________________________
Correspondence: Ramli Musa, Senior Lecturer and Psychiatrist, Faculty of Medicine, Universiti
Teknologi MARA, 40450 Shah Alam, Selangor, Malaysia.
Email: [email protected]
Received August 10, 2007; Accepted September 17, 2007.
ORIGINAL ARTICLE
Translation, validation and psychometric properties of
Bahasa Malaysia version of the Depression Anxiety and
Stress Scales (DASS)
RAMLI MUSA, MOHD ARIFF FADZIL, & ZAINI ZAIN
Faculty of Medicine, Universiti Teknologi MARA, 40450 Shah Alam, Selangor, Malaysia.
Abstract
Background: Up to date, there are handful questionnaires that have been validated in Bahasa
Malaysia (BM). This study aimed to translate the Depression Anxiety Stress Scales 21-item
(DASS-21) and measure its psychometric properties. Objectives: To determine the construct
validity and acceptability of the DASS, BM. Methods: Two forward and backward transla-
tions were done in BM in accordance to guideline, and its validation was determined by using
confirmatory factor analysis. A total of 263 subjects were selected by systematic random
sampling to represent Malaysian population for reliability and validity purposes. Results: The
BM DASS-21 had very good Cronbach’s alpha values of .84, .74 and .79, respectively, for
depression, anxiety and stress. In addition, it had good factor loading values for most items
(.39 to .73). Correlations among scales were between .54 and .68. Conclusions: BM DASS-21
is correctly and adequately translated to Bahasa Malaysia with high psychometric properties.
Further studies are required to support these findings.
Key words: depression, anxiety, stress, reliability, validity, Bahasa Malaysia.
Introduction
The Depression Anxiety Stress Scales
(DASS) have been translated and in various
languages and validated in different popu-
lations. The original version of DASS is
42-item. DASS 21-item is a modified and
shorter version [1]. In this study, the au-
thors focused on the effort of translating the
DASS-21 into Bahasa Malaysia (BM) and
eventually validated this version. The
scoring of 21-item requires the users to
time 2 of total score 21-item to suit the
original 42-item. It is not a diagnostic
questionnaire but rather as a severity meas-
urement (dimensional rather than a cate-
gorical) [2]. DASS is suitable to be used in
any clinical or non-clinical settings [3]. The
questionnaire is easy and simple to admin-
ister to general population without any
special training is needed. Unlike certain
psychometric tests, by only using this
questionnaire, researchers would be able to
gauge levels of depression, anxiety and
stress at the same time. Almost all 21 items
in this questionnaire are relatively cultural
free as none of its item mentioned any
aspects on certain culture or religion. The
effort of translation and validation of
Bahasa Malaysia version were focused on
DASS-21 before further development of
BM DASS-42. Furthermore, DASS-21 is
less been studied across the globe.
This study aimed to translate and validate
the 21-item of DASS and to produce a well
adapted BM version of 21-item DASS for
DASS, Bahasa Malaysia version 83
Malaysian population.
Methods
Study design
This is a randomized multi-center cross
sectional study. The process of translation,
pre-test and validation of this project is
summarized in figure 1.
A special permission from the original
author of DASS (Peter Lovinbond) was
also acquired before the commencement of
this study. Informed consent was obtained
from the participants after the nature of the
procedure was fully explained.
Translation process of the DASS
Translation process was according guide-
line stipulated in US Census Bureau Guide-
line where 2 forward and 2 back transla-
tions were done in parallel by 2 medical
and 2 language experts. This method was
done to ensure the translated version would
be grammatically sounded and the terms
used were correct. At the same time, mean-
ings and contents of original DASS were
well preserved.
After the reconcilement of the two forward
and back translations, sentence revision
was done by all experts involved in the
translation in meetings. Good translations
were reflected by production of two Eng-
lish back translations which almost similar
to original English version. At the end of
this process, we produced a harmonized
version of BM DASS-21 (BM-H).
Harmonized BM version was tested in a
small group of people before authors em-
barked on real major validation study. Pre-
test was done on eight respondents with an
objective to identify any flaws in harmo-
nized version, which might affect the
comprehension of the subjects. At the end
of pre-test, we produced finalized BM
version on DASS-21 (BM-DASS).
Validation study
The finalized BM version (BM-DASS)
then was tested for its reliability and valid-
ity. Reliability in this study was determined
by its internal consistency by looking at
Cronbach’s alpha values. Confirmatory
factor analysis was used to ensure the
validity of this BM-DASS by having ac-
ceptable factor loadings (>.4).
Selection of clinics and respondents
Study population of this study was a gen-
eral population with age range between 14
to 55 years. The subjects were selected
from 3 government clinics in Klang Valley
area. A special permission was obtained
from regional Ministry of Health authority.
The selection of the clinics was done based
on a few considerations. First, the attendees
or patients that utilize these clinics should
represent the composition of Malaysian
population. Which means the location of
clinic should not be in the areas that were
highly dense with certain ethnic groups. It
should not be at private clinics where
certain economic class would affordable to
acquire the treatment. At the same time, the
convenience would also play an important
factor. Participants were given information
and consent forms prior to the study. Het-
erogeneous participants were taken care of
in the aspects of age, gender, race and
socio-economic class.
Selection of the subjects was also done at
randomization where every third patients
registered at the counter were chosen. A
total of 263 subjects with various age
groups and ethnicity were enrolled in this
study. Composition of ethnic groups was
tried to reflect the actual Malaysian popula-
tion. Based on Malaysian Statistic Depart-
ment (2005) where 54.1% were Malays,
25% were Chinese, 7.5% were Indians and
13.2% from other races [4].
Questionnaires
1. Demographic questionnaire: age, gen-
der, ethnicity and level of education.
2) Finalized BM DASS-21Version.
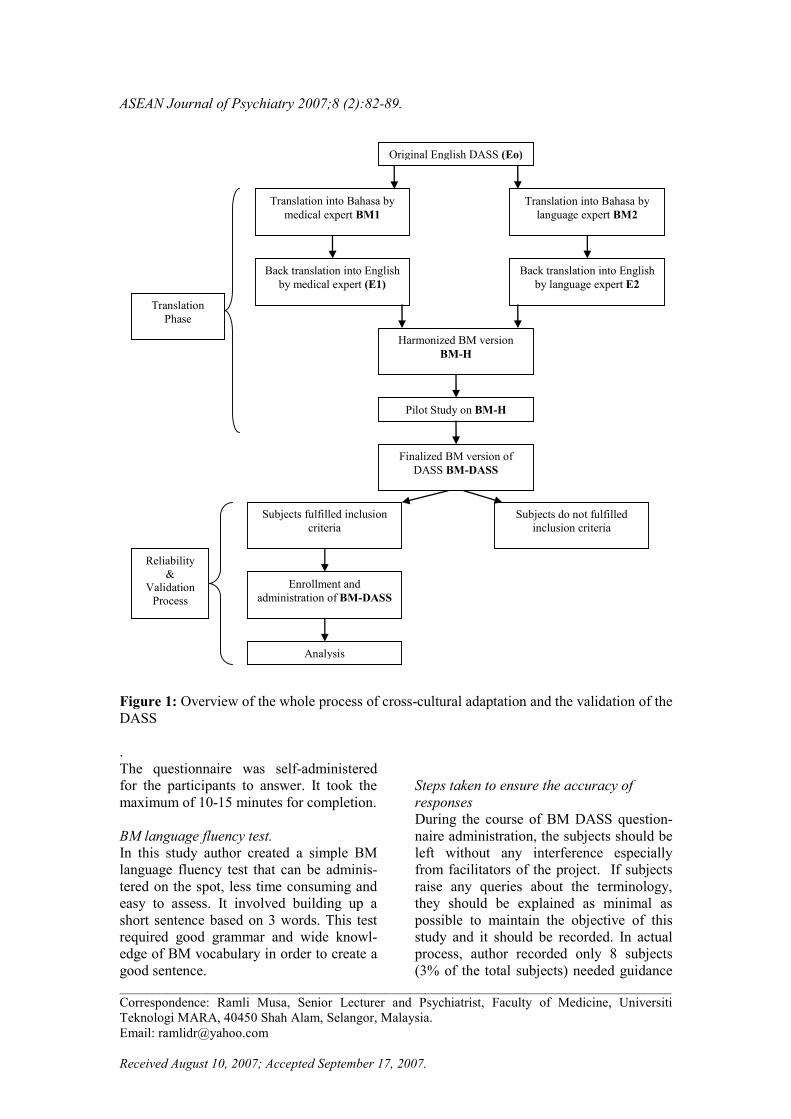
ASEAN Journal of Psychiatry 2007;8 (2):82-89.
___________________________________________________________________________________
Correspondence: Ramli Musa, Senior Lecturer and Psychiatrist, Faculty of Medicine, Universiti
Teknologi MARA, 40450 Shah Alam, Selangor, Malaysia.
Email: [email protected]
Received August 10, 2007; Accepted September 17, 2007.
Figure 1: Overview of the whole process of cross-cultural adaptation and the validation of the
DASS
.
The questionnaire was self-administered
for the participants to answer. It took the
maximum of 10-15 minutes for completion.
BM language fluency test.
In this study author created a simple BM
language fluency test that can be adminis-
tered on the spot, less time consuming and
easy to assess. It involved building up a
short sentence based on 3 words. This test
required good grammar and wide knowl-
edge of BM vocabulary in order to create a
good sentence.
Steps taken to ensure the accuracy of
responses
During the course of BM DASS question-
naire administration, the subjects should be
left without any interference especially
from facilitators of the project. If subjects
raise any queries about the terminology,
they should be explained as minimal as
possible to maintain the objective of this
study and it should be recorded. In actual
process, author recorded only 8 subjects
(3% of the total subjects) needed guidance
Translation into Bahasa by
medical expert BM1
Translation
Phase
Back translation into English
by medical expert (E1)
Back translation into English
by language expert E2
Translation into Bahasa by
language expert BM2
Original English DASS (Eo)
Harmonized BM version
BM-H
Finalized BM version of
DASS BM-DASS
Pilot Study on BM-H
Subjects do not fulfilled
inclusion criteria
Analysis
Enrollment and
administration of BM-DASS
Subjects fulfilled inclusion
criteria
Reliability
&
Validation
Process
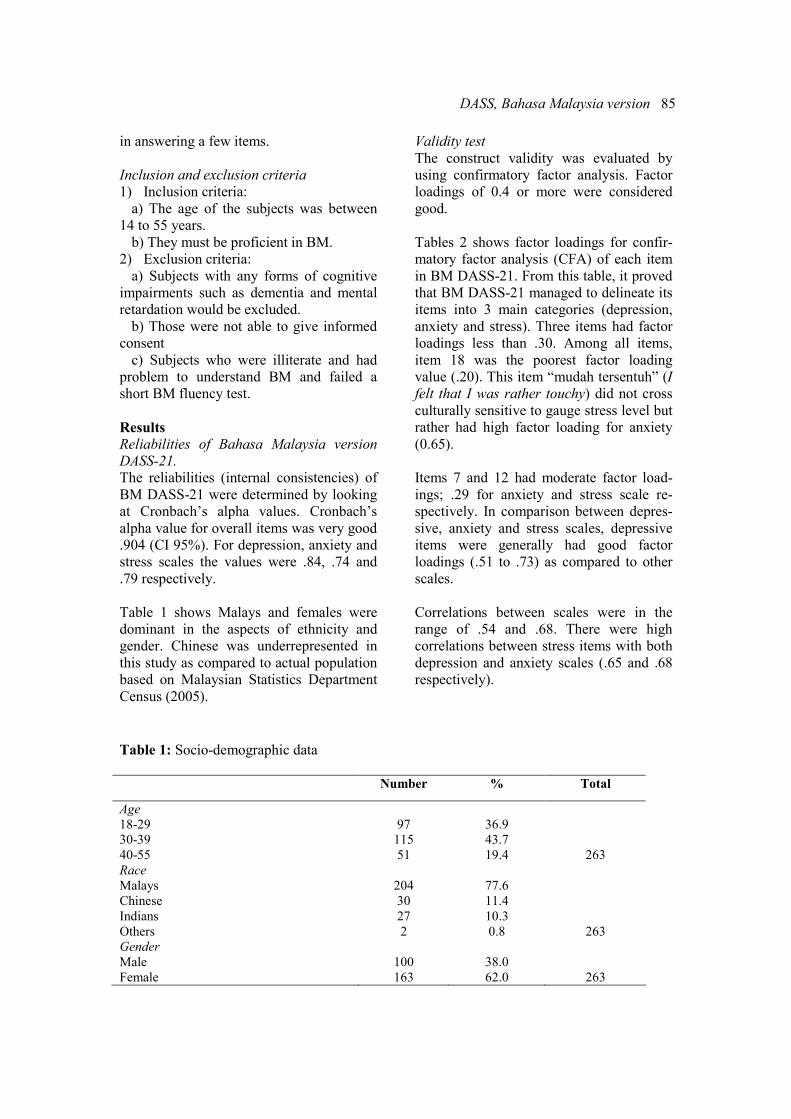
DASS, Bahasa Malaysia version 85
in answering a few items.
Inclusion and exclusion criteria
1) Inclusion criteria:
a) The age of the subjects was between
14 to 55 years.
b) They must be proficient in BM.
2) Exclusion criteria:
a) Subjects with any forms of cognitive
impairments such as dementia and mental
retardation would be excluded.
b) Those were not able to give informed
consent
c) Subjects who were illiterate and had
problem to understand BM and failed a
short BM fluency test.
Results
Reliabilities of Bahasa Malaysia version
DASS-21.
The reliabilities (internal consistencies) of
BM DASS-21 were determined by looking
at Cronbach’s alpha values. Cronbach’s
alpha value for overall items was very good
.904 (CI 95%). For depression, anxiety and
stress scales the values were .84, .74 and
.79 respectively.
Table 1 shows Malays and females were
dominant in the aspects of ethnicity and
gender. Chinese was underrepresented in
this study as compared to actual population
based on Malaysian Statistics Department
Census (2005).
Validity test
The construct validity was evaluated by
using confirmatory factor analysis. Factor
loadings of 0.4 or more were considered
good.
Tables 2 shows factor loadings for confir-
matory factor analysis (CFA) of each item
in BM DASS-21. From this table, it proved
that BM DASS-21 managed to delineate its
items into 3 main categories (depression,
anxiety and stress). Three items had factor
loadings less than .30. Among all items,
item 18 was the poorest factor loading
value (.20). This item “mudah tersentuh” (I
felt that I was rather touchy) did not cross
culturally sensitive to gauge stress level but
rather had high factor loading for anxiety
(0.65).
Items 7 and 12 had moderate factor load-
ings; .29 for anxiety and stress scale re-
spectively. In comparison between depres-
sive, anxiety and stress scales, depressive
items were generally had good factor
loadings (.51 to .73) as compared to other
scales.
Correlations between scales were in the
range of .54 and .68. There were high
correlations between stress items with both
depression and anxiety scales (.65 and .68
respectively).
Table 1: Socio-demographic data
Number % Total
Age
18-29
30-39
40-55
97
115
51
36.9
43.7
19.4
263
Race
Malays
Chinese
Indians
Others
204
30
27
2
77.6
11.4
10.3
0.8
263
Gender
Male
Female
100
163
38.0
62.0
263
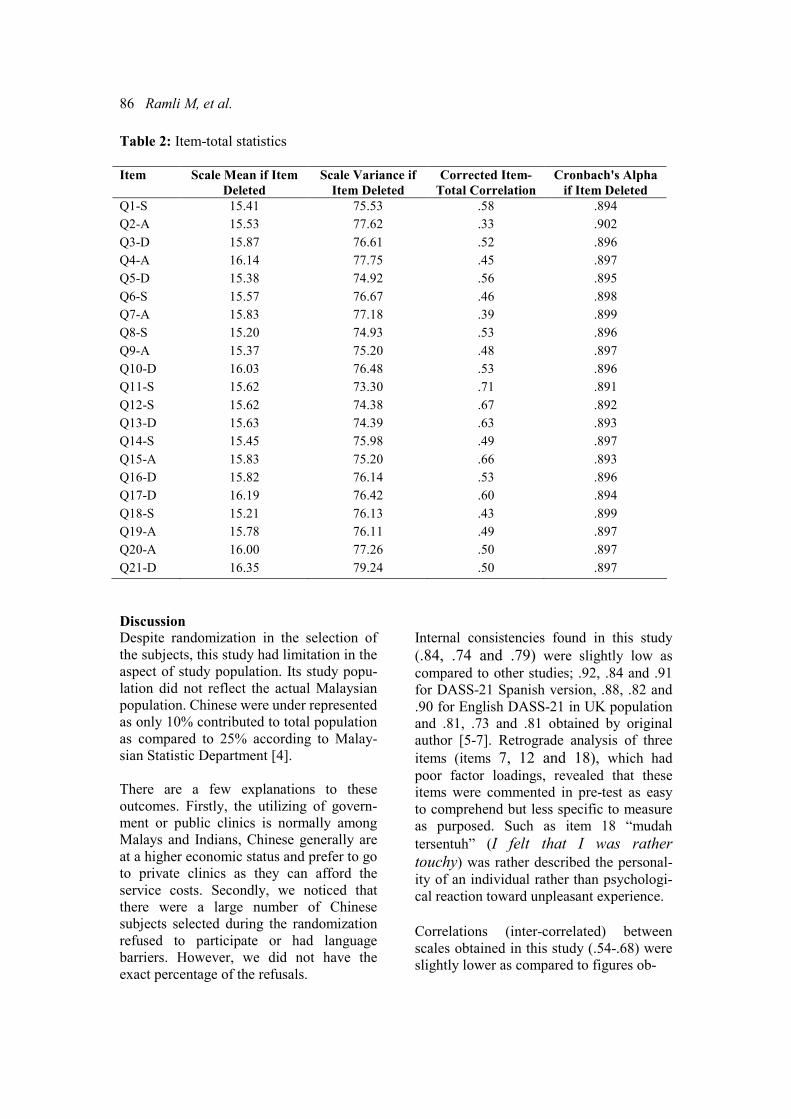
86 Ramli M, et al.
Table 2: Item-total statistics
Item Scale Mean if Item
Deleted
Scale Variance if
Item Deleted
Corrected Item-
Total Correlation
Cronbach's Alpha
if Item Deleted
Q1-S 15.41 75.53 .58 .894
Q2-A 15.53 77.62 .33 .902
Q3-D 15.87 76.61 .52 .896
Q4-A 16.14 77.75 .45 .897
Q5-D 15.38 74.92 .56 .895
Q6-S 15.57 76.67 .46 .898
Q7-A 15.83 77.18 .39 .899
Q8-S 15.20 74.93 .53 .896
Q9-A 15.37 75.20 .48 .897
Q10-D 16.03 76.48 .53 .896
Q11-S 15.62 73.30 .71 .891
Q12-S 15.62 74.38 .67 .892
Q13-D 15.63 74.39 .63 .893
Q14-S 15.45 75.98 .49 .897
Q15-A 15.83 75.20 .66 .893
Q16-D 15.82 76.14 .53 .896
Q17-D 16.19 76.42 .60 .894
Q18-S 15.21 76.13 .43 .899
Q19-A 15.78 76.11 .49 .897
Q20-A 16.00 77.26 .50 .897
Q21-D 16.35 79.24 .50 .897
Discussion
Despite randomization in the selection of
the subjects, this study had limitation in the
aspect of study population. Its study popu-
lation did not reflect the actual Malaysian
population. Chinese were under represented
as only 10% contributed to total population
as compared to 25% according to Malay-
sian Statistic Department [4].
There are a few explanations to these
outcomes. Firstly, the utilizing of govern-
ment or public clinics is normally among
Malays and Indians, Chinese generally are
at a higher economic status and prefer to go
to private clinics as they can afford the
service costs. Secondly, we noticed that
there were a large number of Chinese
subjects selected during the randomization
refused to participate or had language
barriers. However, we did not have the
exact percentage of the refusals.
Internal consistencies found in this study
(.84, .74 and .79) were slightly low as compared to other studies; .92, .84 and .91
for DASS-21 Spanish version, .88, .82 and
.90 for English DASS-21 in UK population
and .81, .73 and .81 obtained by original
author [5-7]. Retrograde analysis of three
items (items 7, 12 and 18), which had poor factor loadings, revealed that these
items were commented in pre-test as easy
to comprehend but less specific to measure
as purposed. Such as item 18 “mudah
tersentuh” (I felt that I was rather
touchy) was rather described the personal-ity of an individual rather than psychologi-
cal reaction toward unpleasant experience.
Correlations (inter-correlated) between
scales obtained in this study (.54-.68) were
slightly lower as compared to figures ob-
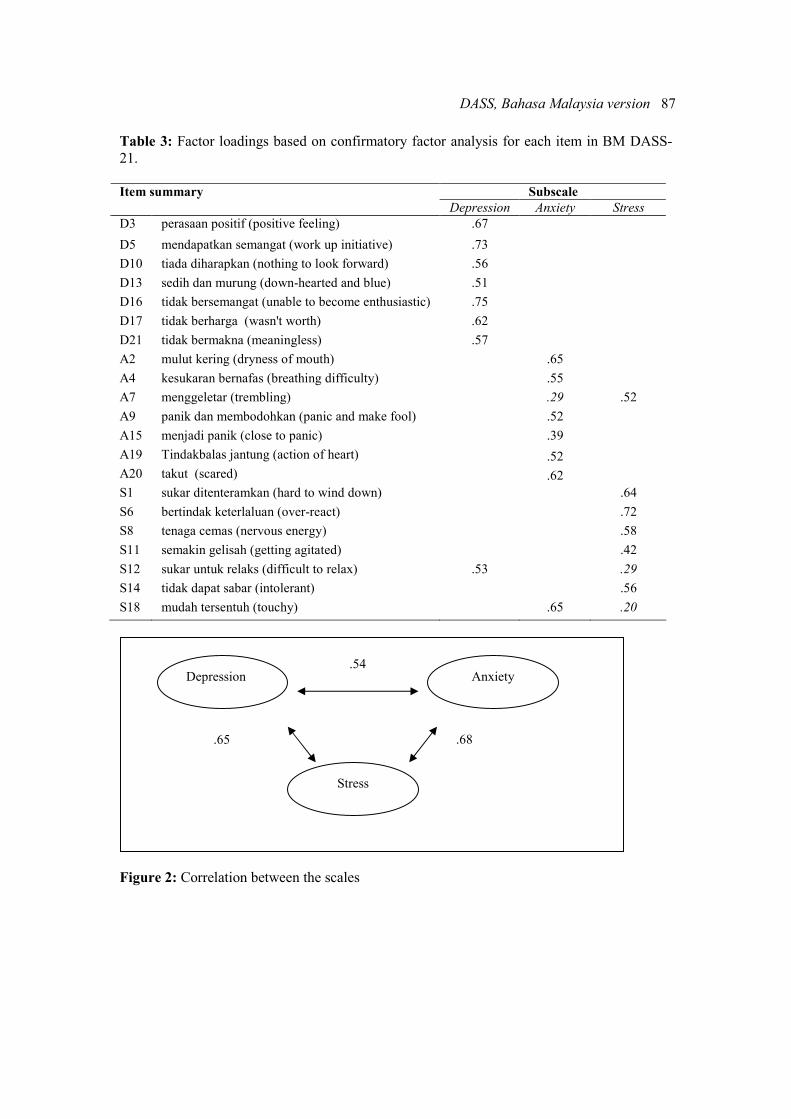
DASS, Bahasa Malaysia version 87
Table 3: Factor loadings based on confirmatory factor analysis for each item in BM DASS-
21.
Subscale Item summary
Depression Anxiety Stress
D3 perasaan positif (positive feeling) .67
D5 mendapatkan semangat (work up initiative) .73
D10 tiada diharapkan (nothing to look forward) .56
D13 sedih dan murung (down-hearted and blue) .51
D16 tidak bersemangat (unable to become enthusiastic) .75
D17 tidak berharga (wasn't worth) .62
D21 tidak bermakna (meaningless) .57
A2 mulut kering (dryness of mouth) .65
A4 kesukaran bernafas (breathing difficulty) .55
A7 menggeletar (trembling) .29 .52
A9 panik dan membodohkan (panic and make fool) .52
A15 menjadi panik (close to panic) .39
A19 Tindakbalas jantung (action of heart) .52
A20 takut (scared) .62
S1 sukar ditenteramkan (hard to wind down) .64
S6 bertindak keterlaluan (over-react) .72
S8 tenaga cemas (nervous energy) .58
S11 semakin gelisah (getting agitated) .42
S12 sukar untuk relaks (difficult to relax) .53 .29
S14 tidak dapat sabar (intolerant) .56
S18 mudah tersentuh (touchy) .65 .20
Figure 2: Correlation between the scales
Stress
Depression Anxiety .54
.65 .68
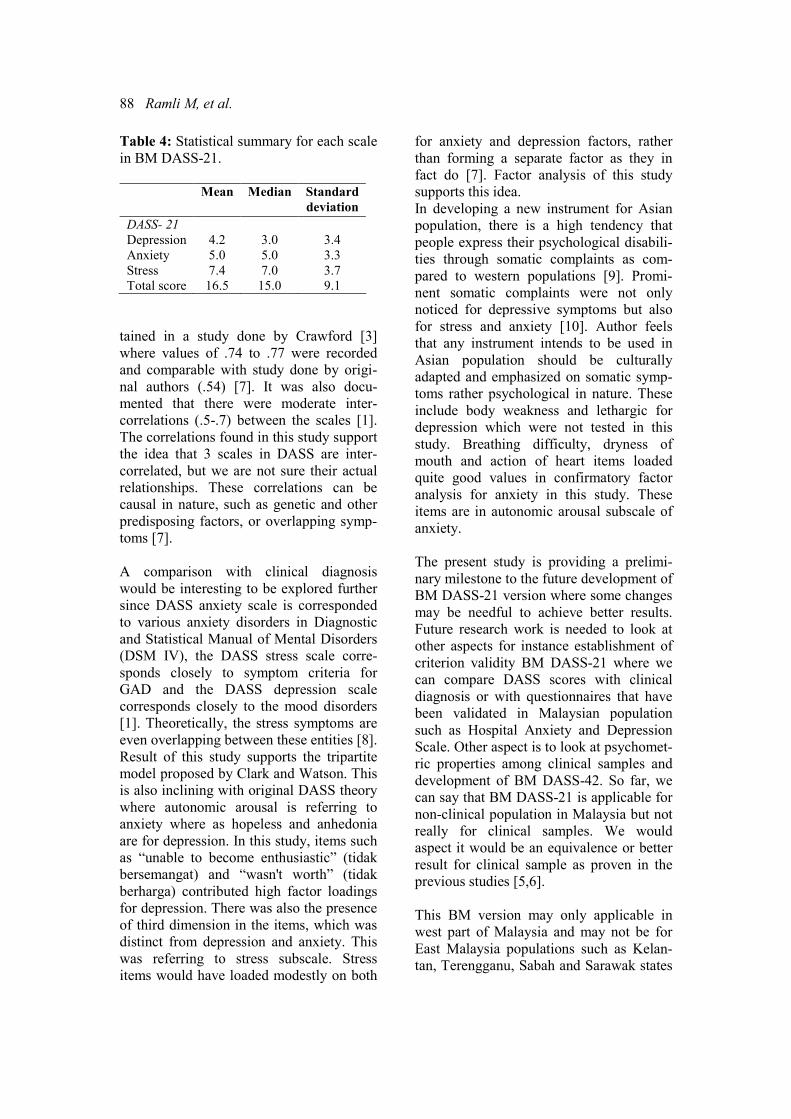
88 Ramli M, et al.
Table 4: Statistical summary for each scale
in BM DASS-21.
Mean Median Standard
deviation
DASS- 21
Depression
Anxiety
Stress
Total score
4.2
5.0
7.4
16.5
3.0
5.0
7.0
15.0
3.4
3.3
3.7
9.1
tained in a study done by Crawford [3]
where values of .74 to .77 were recorded
and comparable with study done by origi-
nal authors (.54) [7]. It was also docu-
mented that there were moderate inter-
correlations (.5-.7) between the scales [1].
The correlations found in this study support
the idea that 3 scales in DASS are inter-
correlated, but we are not sure their actual
relationships. These correlations can be
causal in nature, such as genetic and other
predisposing factors, or overlapping symp-
toms [7].
A comparison with clinical diagnosis
would be interesting to be explored further
since DASS anxiety scale is corresponded
to various anxiety disorders in Diagnostic
and Statistical Manual of Mental Disorders
(DSM IV), the DASS stress scale corre-
sponds closely to symptom criteria for
GAD and the DASS depression scale
corresponds closely to the mood disorders
[1]. Theoretically, the stress symptoms are
even overlapping between these entities [8].
Result of this study supports the tripartite
model proposed by Clark and Watson. This
is also inclining with original DASS theory
where autonomic arousal is referring to
anxiety where as hopeless and anhedonia
are for depression. In this study, items such
as “unable to become enthusiastic” (tidak
bersemangat) and “wasn't worth” (tidak
berharga) contributed high factor loadings
for depression. There was also the presence
of third dimension in the items, which was
distinct from depression and anxiety. This
was referring to stress subscale. Stress
items would have loaded modestly on both
for anxiety and depression factors, rather
than forming a separate factor as they in
fact do [7]. Factor analysis of this study
supports this idea.
In developing a new instrument for Asian
population, there is a high tendency that
people express their psychological disabili-
ties through somatic complaints as com-
pared to western populations [9]. Promi-
nent somatic complaints were not only
noticed for depressive symptoms but also
for stress and anxiety [10]. Author feels
that any instrument intends to be used in
Asian population should be culturally
adapted and emphasized on somatic symp-
toms rather psychological in nature. These
include body weakness and lethargic for
depression which were not tested in this
study. Breathing difficulty, dryness of
mouth and action of heart items loaded
quite good values in confirmatory factor
analysis for anxiety in this study. These
items are in autonomic arousal subscale of
anxiety.
The present study is providing a prelimi-
nary milestone to the future development of
BM DASS-21 version where some changes
may be needful to achieve better results.
Future research work is needed to look at
other aspects for instance establishment of
criterion validity BM DASS-21 where we
can compare DASS scores with clinical
diagnosis or with questionnaires that have
been validated in Malaysian population
such as Hospital Anxiety and Depression
Scale. Other aspect is to look at psychomet-
ric properties among clinical samples and
development of BM DASS-42. So far, we
can say that BM DASS-21 is applicable for
non-clinical population in Malaysia but not
really for clinical samples. We would
aspect it would be an equivalence or better
result for clinical sample as proven in the
previous studies [5,6].
This BM version may only applicable in
west part of Malaysia and may not be for
East Malaysia populations such as Kelan-
tan, Terengganu, Sabah and Sarawak states
DASS, Bahasa Malaysia version 89
where they have different dialects.
Acknowledgement
We wish to extend our heartfelt gratitude to
all subjects who had participated in this
study for their kind cooperation.
References 1. Lovibond SH, Lovibond PF. Manual for
the Depression Anxiety Stress Scales. Sydney:
Psychology Foundation; 1995.
2. Lovibond PF. Long-term stability of
depression, anxiety, and stress syndromes. J
Abnorm Psychol. 1998;107(3):520-26.
3. Crawford JR, Henry JD. The Depression
Anxiety Stress Scale (DASS): Normative data
and latent structure in a large non-clinical
sample. Br J Clin Psychol. 2003; 42:111-31.
4. Department of Statistics, State/District
Data Bank, Malaysia; 2005.
5. Patricia D, Diane MN, Stanley, Melinda A,
Patricia A. The Depression Anxiety Stress
Scale-21: Spanish translation and validation
with a Hispanic sample. J Psychopathol Behav
Assess. 2002:24;195-205.
6. Henry JD, Craeford JR. The short-form
version of the Depressive Anxiety Stress Scales
(DASS-21): construct validity and normative
data in a large non-clinical sample. Br J Clin
Psychol. 2005;44:227-39.
7. Lovibond PF, Lovibond SH. The structure
of negative emotional states: Comparison of the
Depression Anxiety Stress Scales (DASS) with
the Beck Depression and Anxiety Inventories.
Behav Res Ther. 1995;33:335-43.
8. Taylor R, Lovibond PF, Nicholas MK,
Cayley C, Wilson PH. The utility of somatic
items in the assessment of depression in chronic
pain patients: A comparison of the Zung Self-
rating Depression Scale (SDS) and the Depres-
sion Anxiety Stress Scales (DASS) in chronic
pain and clinical and community samples. Clin
J Pain. 2005; 21:91-100.
9. Taouk M, Lovibond PF, Laube R. Psycho-
metric properties of an Arabic version of the
Depression Anxiety Stress Scales (DASS21).
Report for New South Wales Transcultural
Mental Health Centre, Cumberland Hospital,
Sydney; 2001.
10. Kleinman A. Anthropology and psychiatry:
The role of culture in cross-cultural research on
illness. Br J Psychiatry. 1987; 151:447-54.
11. Lovibond PF, Rapee RM. The representa-
tion of feared outcomes. Behav Res Ther.
1993;31:595-608.
12. Diane MN, Stanley, Melinda A, Patricia A,
Daza, Patricia. Psychometric comparability of
English- and Spanish-language measures of
anxiety and related affective symptoms. Psy-
chol Assess. 2001;13:347-55.
13. Brown TA, Korotitsch W, Chorpita BF,
Barlow DH. Psychometric properties of the
Depression Anxiety Stress Scales (DASS) in
clinical samples. Behav Res Ther. 1997;35:79-
89.
14. Antony MM, Bieling PJ, Cox BJ, Enns
MW, Swinson RP. Psychometric properties of
the 42-item and 21-item versions of the Depres-
sion Anxiety Stress Scales (DASS) in clinical
groups and a community sample. Psychol
Assess. 1998;10:176-81.
ASEAN Journal of Psychiatry 2007;8 (2):90-96.
___________________________________________________________________________________
Correspondence: Ainsah Omar, Dept of Psychiatry, Faculty of Medicine, Hospital Universiti Kebang-
saan Malaysia, Jalan Yaacob Latif, Bdr Tun Razak, Cheras, 56000, Kuala Lumpur, Malaysia.
E-mail:[email protected]
Received: July 25, 2007; Accepted September 21, 2007.
ORIGINAL ARTICLE
Obesity among patients with schizophrenia, attending outpa-
tient psychiatric clinic, Hospital Universiti Kebangsaan Ma-
laysia
SALMI RAZALI1, AINSAH OMAR
2, OSMAN CHE BAKAR
2, & SHAMSUL AZMAN
SHAH3
1 Unit of psychiatry, Universiti of Technology Mara, Shah Alam, Selangor, Malaysia. 2 Dept of Psychiatry, Faculty of Medicine, Hospital Universiti Kebangsaan Malaysia, Jalan Yaacob
Latif, Bdr Tun Razak, Cheras, 56000, Kuala Lumpur, Malaysia. 3 Dept. of Public Health, Faculty of Medicine, Hospital Universiti Kebangsaan Jalan Yaacob Latif, Bdr
Tun Razak, Cheras, 56000, Kuala Lumpur, Malaysia.
Abstract
Objective: This study aimed to determine the prevalence of obesity among patients with
schizophrenia and its association with the demographic profile. Methods: This is a cross
sectional study. Subjects were selected using systematic sampling. Patients attending the out
patient psychiatric clinic, Hospital Universiti Kebangsaan Malaysia, who fulfilled the criteria
and able to give consent were included in this study. Diagnosis of schizophrenia was made
using Structured Clinical Interview (SCID) for DSM-IV. Demographic profiles of the patients
were obtained and anthropometric measurements were measured and classified according to
Body Mass Index (BMI) and Waist Circumference (WC) of Asian population. Results: A total
of 97 patients were included. The prevalence of overweight (BMI: 23.0- 27.4 kg/m2) was
39.2% (n=38), and the prevalence of obesity (BMI: >27.0 kg/m2) was 35.1% (n=34). BMI
was higher among non-Chinese (Malay and Indian, p=.03) and those who had low total
household income (p=.03). Sixty-two patients (63.9%) had high WC, which was associated
with male (p=.003) and non-Chinese (p=.03). Conclusions: Obesity is highly prevalent among
patients with schizophrenia. The risk factors for obesity include male, non-Chinese and those
with low total income. The high WC among non-Chinese and male patients suggests that they
are at a higher risk of developing obesity-related physical illnesses. These findings support
that obesity is a common critical issue among schizophrenic patients, and it warrants serious
clinical interventions.
Key words: schizophrenia, obesity, body mass index, waist circumference
Introduction
There are increasing numbers of studies
that documented high prevalence of obesity
and metabolic abnormalities among psy-
chiatric populations compared to general
population [1,2]. Sixty-three percent of
schizophrenic patients had metabolic
syndrome [3]. In a study on 29,000 Malay-
Obesity in schizophrenic patients 91
sian adults (≥20 years of age), 20.7% was
overweight, while 5.8% were obese [4]. In
the United State, the prevalence of obesity
among general population was 20% to 30%
[5]. Unpublished data of one year outcome
from the National Mental Health Registry
showed that 4%, 5%, 6.2%, 12.4% and
41.3% of 339 patients with schizophrenia
gained weight for more than 20 kg, 15-20
kg, 10-15 kg, 5-10 kg and 5 kg, respec-
tively [6]. Both men and women with
schizophrenia had higher prevalence of
obesity than their counterparts without
schizophrenia [7,8].
The nature of schizophrenic illness (e.g.,
negative symptoms, social withdrawal,
apathy, lack of motivation), as well as the
patients sedentary life style, further in-
crease their risks of obesity. Recent review
suggests that approximately 40% to 80% of
patients taking antipsychotic medications
experience weight gain that exceed ideal
body weight for 20% or greater [9]. Al-
though the introduction of newer antipsy-
chotic medications cause minimal side
effects and improve cognitive function and
improve quality of social functioning [10],
these drugs however cause significant
weight gain, especially olanzapine and
clozaril, compared to typical antipsychotic
medications [11]. Patients with schizophre-
nia both with the first episodes and those
chronically exposed to conventional medi-
cations have been found to have more than
three times as much intra-abdominal fat as
controls matched for age, gender and
lifestyle [12]. Thus, the magnitude of
weight gain among them is very high, and
this would in turn increase morbidity and
mortality due to diabetes, heart diseases,
hypertension and other obesity-related
diseases [13-16] and finally would affect
their quality of life. Prevention programs
namely by regular routine monitoring of
body weight, identifying risk factors and
introducing wellness program in these
patients are critical. The effective manage-
ment of obesity requires a strong motiva-
tion and commitment from patients. This is
significantly lacking in patients with
schizophrenia. The other important factor is
that the central acting anti-obesity drugs
may induce psychotic episodes. These
critical issues need further extensive studies
and interventions. Thus, this study aimed at
examining the prevalence of obesity and its
associated demographic factors among
schizophrenic patients attending psychiatric
clinic, Hospital Universiti Kebangsaan
Malaysia (HUKM).
Methods
This study was conducted at Psychiatric
Outpatient Clinic, Hospital Universiti
Kebangsaan Malaysia (HUKM) between
April 2006 and July 2006. HUKM is a
teaching, tertiary government hospital,
located in the capital city of Malaysia. It
receives referral from government clinics,
i.e., district, primary health, and private
clinics. Approximately 13 to 14 patients of
schizophrenia are seen everyday.
The subjects were selected using systematic
sampling. The diagnosis of schizophrenia
were reviewed by researchers (a postgradu-
ate psychiatric trainee and a consultant
psychiatrist) using Structured Clinical
Interview for DSM-IV Axis Disorder
(SCID) [17]. The kappa, measuring the
inter-rater agreement for this study, was
one. The anthropometric measurements
were assessed by a single examiner and
standardized according to Malaysian Prac-
tice Guideline in Management of Obesity
using beam balance (Health 0 Meter Kilo-
pound Beam) and measurement tape. Body
Mass Index (BMI) and Waist Circumfer-
ence (WC) were classified according to
Malaysian Practice Guideline, proposed by
WHO to be used for Asian population [18].
BMIs of 18.5- 22.9 kg/m2 , 23-27.4 kg/m
2,
27.5 kg/m2.are considered normal, over-
weight and obese, respectively.
Waist Circumferences (WCs) of <80 cm
and <90 cm are considered abnormal for
female and male, respectively.
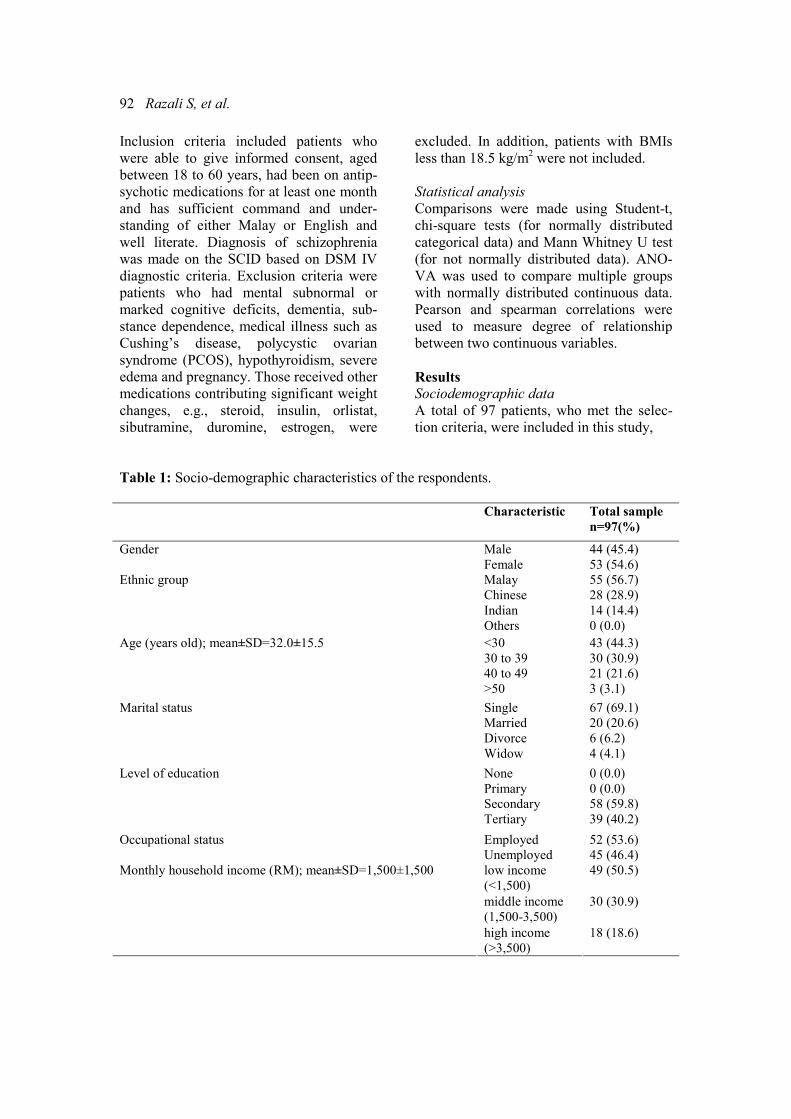
92 Razali S, et al.
Inclusion criteria included patients who
were able to give informed consent, aged
between 18 to 60 years, had been on antip-
sychotic medications for at least one month
and has sufficient command and under-
standing of either Malay or English and
well literate. Diagnosis of schizophrenia
was made on the SCID based on DSM IV
diagnostic criteria. Exclusion criteria were
patients who had mental subnormal or
marked cognitive deficits, dementia, sub-
stance dependence, medical illness such as
Cushing’s disease, polycystic ovarian
syndrome (PCOS), hypothyroidism, severe
edema and pregnancy. Those received other
medications contributing significant weight
changes, e.g., steroid, insulin, orlistat,
sibutramine, duromine, estrogen, were
excluded. In addition, patients with BMIs
less than 18.5 kg/m2 were not included.
Statistical analysis
Comparisons were made using Student-t,
chi-square tests (for normally distributed
categorical data) and Mann Whitney U test
(for not normally distributed data). ANO-
VA was used to compare multiple groups
with normally distributed continuous data.
Pearson and spearman correlations were
used to measure degree of relationship
between two continuous variables.
Results
Sociodemographic data
A total of 97 patients, who met the selec-
tion criteria, were included in this study,
Table 1: Socio-demographic characteristics of the respondents.
Characteristic Total sample
n=97(%)
Male 44 (45.4) Gender
Female 53 (54.6)
Malay 55 (56.7)
Chinese 28 (28.9)
Indian 14 (14.4)
Ethnic group
Others 0 (0.0)
<30 43 (44.3)
30 to 39 30 (30.9)
40 to 49 21 (21.6)
Age (years old); mean±SD=32.0±15.5
>50 3 (3.1)
Single 67 (69.1)
Married 20 (20.6)
Divorce 6 (6.2)
Marital status
Widow 4 (4.1)
None 0 (0.0)
Primary 0 (0.0)
Secondary 58 (59.8)
Level of education
Tertiary 39 (40.2)
Employed 52 (53.6) Occupational status
Unemployed 45 (46.4)
low income
(<1,500)
49 (50.5)
middle income
(1,500-3,500)
30 (30.9)
Monthly household income (RM); mean±SD=1,500±1,500
high income
(>3,500)
18 (18.6)
Obesity in schizophrenic patients 93
consisting of forty four (45.4%) males and
53 (54.6%) females. Fifty-five (56.7%)
patients were Malays, 28 (28.95%) patients
were Chinese and 14 (14.4%) patients were
Indians. The characteristics of the respon-
dents are shown in Table 1.
Prevalence
The prevalence of overweight (BMI: 23.0-
27.4 kg/m2) was 39.2%, whilst obesity
(BMI: >27.0 kg/m2) was 35.1% (Figure 1)
and the prevalence of patient with high
waist circumferences (WC: male > 90cm,
female > 80cm) was 63.9%.
The association between obesity and pa-
tients’ sociodemographic profile
• Age
Age of respondents had no association and
relation with BMI (p=.28) and WC (p=.46).
• Gender
Mean WC of male respondents was
93.98±13.16 cm, significantly higher than
mean WC of female respondents
86.78±10.22 cm (t=3.04, p=.003*). About
48.6% (n=17) of male and 51.4% (n=18) of
female had normal WC, whilst 43.5%
(n=27) and 56.5% (n=35) of male and
female respectively had high WC (p=.633).
However, the difference in BMI between
male and female respondents were not
significant (t=0.24, p=.81).
• Ethnic Groups
There was significant difference in the
mean BMI between different ethnic groups
(ANOVA: F=3.58, p=.03*). Chinese re-
spondents (mean BMI =24.23±.09 kg/m2)
had significantly lower BMI than Malays
(27.14±.32 kg/m2) and Indians (27.06±.12
kg/m2).
Household income
There was significant difference in mean
total household income between patient
who had normal weight (mean=RM 2,700
±2,825) and obese (mean=1,300±1,025),
(Z=2.78, p=.006). The total household
income was found inversely correlated with
WC of respondents (Spearman Correlation:
rs=-.22, p=.03*) but not with BMI.
Occupational status
Of the total respondents, 52 (53.6%) re-
spondents were employed and 45 (46.4%)
were unemployed. 71.4% (n=20) of Chi-
nese were employed while only 46.6%
from non-Chinese respondents were em-
ployed. Employment rate among Chinese
respondents were significantly higher than
other ethnic groups (χ2=5.03, p=.02*)
Occupational status of the patients had no
association with the anthropometric meas-
urements.
Educational level
There was no difference in BMI and WC of
respondents in relation to educational level.
Discussion
Our findings indicate that overweight
(34.5%) and obesity (33.8%) are highly
prevalent among patients with schizophre-
nia. About 63.0% of the patients had high
WC. These findings are three times and
two times higher than the prevalence of
general population in Malaysia [20] and
global prevalence of obesity, respectively.
Other findings also found that schizo-
phrenic patients are more obese than gen-
eral population. Several reasons were given
to explain, such as the nature of the illness,
which lead to sedentary life style, lack of
exercise, diet preference of taking high fat
and low fiber diet and the effects of the
medications [21,22]
To our knowledge, this is the first study in
Malaysia examining the relationship be-
tween various anthropometric measure-
ments in relation to patients’ demographic
profiles among schizophrenic patients,
using the WHO classifications proposed for
Asian populations (BMI and WC).
Three important socio-demographic factors
(i.e., gender, WC; ethnic group, BMI and
total household income, WC) were found
significantly associated with obesity. These
similar findings have been found by others
[23,24]. The higher waist circumference
94 Razali S, et al.
among males schizophrenic patients com-
pared to female suggests that they are at the
higher risk of developing obesity-related
diseases. This is consistent with the find-
ings that diabetic, hypertension and heart
problems are highly prevalent among
American males [25].
The preponderance of high BMI among
non-Chinese may be due to various rea-
sons. Culturally the composition of non-
Chinese food contents high calorie ingredi-
ents, i.e., the used of “coconut milk”, and
ways of preparing the meal. Most Chinese
food is steamed and boiled, while non-
Chinese one is often fried. Majority of the
Chinese are working compared to non-
Chinese. However, there is no significant
difference found between those who are
employed and unemployed and obesity in
this study, suggesting that their jobs are
sedentary in nature. Low total income is
associated with obesity, this could possibly
be due to the lack of awareness on the
importance of taking healthy balance diet,
exercise, healthy life style and its relation-
ship with health, obesity and chronic physi-
cal illness [26,27]. This may also suggest
that patients with low total income are
more likely to take food with high saturated
fat and calorie as generally this nourish-
ment is cheaper than food containing
unsaturated fat and high calories [26,27].
BMI classification for Asian population
proposed by WHO [18] were used in this
study, but not the BMI values recom-
mended for non-Asian. This is caused by
the fact that Asian populations are at a
higher risk of developing health problems
at a lower BMI and have higher body
percentage fat than non-Asian [29,30]. This
risk would be even higher in schizophrenic
patients, who are chronically on antipsy-
chotic medications. Antipsychotics particu-
larly atypical antipsychotics, e.g., olanzap-
ine, clozaril, are associated with a high risk
of metabolic syndrome [31]. Certain demo-
graphic factors are significantly associated
with WC but not BMI and vise-versa, i.e.,
gender is associated with high WC but not
BMI. This is because BMI is related to
percentage of body fat, irrespective of the
site of fat deposition. Whilst WC is associ-
ated with central obesity, it is an estab-
lished indicator associated with metabolic
diseases [3]. Since BMI is influenced by
age, sex, composition of body muscle and
population dependent, it is less accurate in
predicting percentage of body fat as well as
the risk of obesity-related diseases. Al-
though BMI is commonly and widely used
to estimate the body fat, WC is the most
accurate indicator among the five anthro-
pometric measurements [32,33]. WC
should be measured especially in groups,
who are at a higher risk of developing
metabolic diseases, as in schizophrenic
patients. Routine WC monitoring should be
done on these patients.
This is a cross sectional study, the assess-
ments were only done at one point in time.
A prospective case control study should be
carried out, including only new cases (for
baseline data) and follow-up the patients to
a certain period to examine the magnitude
of weight gain. Prospective study would
also help to ascertain the effects of duration
of illness and antipsychotic medications on
patients’ body weight.
The subjects are hospital based. They are
probably motivated patients and have better
insight towards their illness, thus these
findings may not reflect the community
based population.
In conclusions, the overweight, obesity and
high waist circumference are highly preva-
lent among patients with schizophrenia.
Male, non-Chinese patients and low in-
come are predictors of overweight and
obesity. High waist circumference among
schizophrenic patients particularly males
and those from low income suggest that
these patients are at a higher risk of devel-
oping obesity-related physical illnesses.
Finally, these findings support that body
weight is a common critical problem
Obesity in schizophrenic patients 95
among patients with schizophrenic, and it
warrants serious interventions. Regular
monitoring of patients anthropometric
measurements, including, WC, medical and
physical assessment, as well as metabolic
markers, namely lipid and sugar profiles,
should be done. Otherwise our objective in
managing our schizophrenic patients that is
not only to control their symptoms but also
to ensure good quality of life would not be
achieved.
References 1. Allison DB, Fontaine KR, Heo M, et al.
The distribution of body mass index among
individual with and without schizophrenia. J
Clin Psychiatry. 1999;60:215-20.
2. Consensus Development. Conference on
Antipsychotic Drugs and Obesity and Diabetes.
Obes. Res. 2004;12: 362-8.
3. Kato MM, Currier MB, Gomez CM, Hall
L, Gonzalez-Blanco M. Prevalence of metabolic
syndrome in Hispanic and Non-Hispanic
patients with schizophrenia. Prim Care Com-
panion J Clin Psychiatry 2004;6:74-7.
4. 2nd Malaysia National Health and Morbid-
ity survey. Institute of Public Health, Ministry
of Health Malaysia. 1996.
5. Flegal KM, Carroll MD, Ogden CL, et al.
Prevalence and trends in obesity among US
adults, 1999-2000. JAMA. 2002;288:1723-7.
6. National Mental Health Registry, Malaysia.
Institute of Public Health, Ministry of Health
Malaysia; 2003.
7. Coodin S. Body mass index in persons with
schizophrenia. Can J Psychiatry. 2001;46:549–
55.
8. Daumit GL, Clark JM, Steinwachs DM,
Graham C, Lehman A, Ford DE. Prevalence
and correlates of obesity in a community
sample of individuals with severe and persistent
mental illness. J Nerv Ment Dis. 2003;191:799-
805.
9. Green A, Patel JK, Goisman RM, Allison
DB, Blackburn G. Weight gain from novel
antipsychotic drugs: need for action. Gen Hosp
Psychiatry. 2000;22:224-35
10. Citrome L, Volavka J. Atypical antipsy-
chotics: Revolutionary or incremental advance?
Expert Rev Neurother. 2002; 2:69-88.
11. Wirshing DA, Mhirsing WC, Kysar L, et
al. Novel antipsychotics:comparison of weight
gain liabilities. J Clin Psychiatry. 1999; 60:358-
63.
12. Thakore JH. Metabolic syndrome and
schizophrenia. Br J Psychiatry 2005;186: 455-6
13. Brown S. Excess mortality of schizophre-
nia. A meta-analysis. Br J Psychiatry. 1997;171:
502-8.
14. Aronne LJ. Epidemiology, morbidity and
treatment of overweight. J Clin psychiatry.
2001;62:13-22.
15. Kannel WB, Wilson PW, Nam BH, et al.
Risk stratification of obesity as a coronary risk
factor. Am J Cardiol. 2002;90: 697-701.
16. American Diabetes Association, American
Psychiatric Association, American Association
of Clinical Endocrinologists, and North Ameri-
can Association for the Study of Obesity.
Consensus development conference on antipsy-
chotic drugs and obesity and diabetes. Diabetes
Care. 2004;27:596-601.
17. American Psychiatric Association: Diag-
nostic and Statistical manual of mental Disor-
der; DSM IV Washington DC: American
Psychiatric Assocation; 2000.
18. WHO, expert consultation. Appropriate
body-mass index for Asian populations and its
implications for policy and intervention strate-
gies. Lancet. 2004;363:157-63.
19. Weisell RC. Body mass index as indicator
of obesity. Asia Pacific J. Clin. Nutr.
2002;11:681-4.
20. Malaysia National Health Survey Malaysia.
Institute of Public Health, Ministry of Health
Malaysia; 2003.
21. Brown S, Birtwistle J, Roe L, et al. The
unhealthy lifestyle of people with schizophre-
nia. Psychol Med. 1999; 29:697-701.
22. McCredie RG, MacDonald E, Blacklock C,
et al. Dietry intake of schizophrenia patients in
Nithsdale, Scotland: Case Control Study. BMJ.
1999;317:784-5.
23. Cheng CH, Shao CR,Yuan LC, Song SY,
Chih KC. Obesity in schizophrenic outpatients
receiving antipsychotic in Taiwan. Psychiatry
Clin Neurosci. 2004;58:403-9.
24. Shriqui CL. Atypical antipsychotics: The
Canadian Journal of CME 66-80.
25. American National Health and Nutrition
Examination Survey, 1999-2002.
26. Hays LM, Clark DO. Correlates of physical
activity in a sample of older adults with type 2
diabetes. Diabetes Care. 1999; 22:706-12.
27. Moira C, Ciara K. Lifestyle and physical
health in schizophrenia. Advances in Psychiat-
ric Treatment. 2005; 11:125-32.
28. Pomerleau J, Pederson LL, Ostbye T,
Speechley M, Speechly KN. Health behaviours

96 Razali S, et al.
and socio-economic status in Ontario, Canada.
Eur J Epidemiol. 1997;13:613-22.
29. Druenberg-Yap M, Schmidt G, Stavaren
Van WA, Druenberg P, The paradox of low
body mass index and high body fat percent
among Chinese, Malays and Indians in Singa-
pore. Int J Obes. 2000;24:1011-7.
30. He M, Tan KCB, Li ETS, Kung AWC.
Body fat determination by dual energy X-ray
absorptiometry and its relation to body mass
index and waist circumference in Hongkong
Chinese. Int J Obes. 2001; 25:748-52.
31. Lindenmayer JP, Czobor P, Volavka J et al.
Changes in glucose and cholesterol levels in
patients with schizophrenia treated with typical
or atypical antipsychotics. Am J Psychiatry.
2003;160:290-6.
32. Jia WP, LU JX, Xiang KS, et al. Prediction
of abdorminal visceral obesity from body mass
index, waist circumference and waist hip ratio
in Chinese adults: receiver operating character-
istic curves analysis. Biomed Environ Sci.
2003;16: 206-11.
33. Ng K-C, Lai S-W. Application of anthro-
pometric indices in childhood obesity. South
Med J. 2004;16:206-11.
ASEAN Journal of Psychiatry 2007:8 (2):97-105.
___________________________________________________________________________________
Correspondence: Hatta Sidi, Department of Psychiatry, Universiti Kebangsaan Malaysia (UKM), Jalan
Yaakob Latif, 56000, Kuala Lumpur, Malaysia.
Email: [email protected]
Received: June 26, 2007; Accepted August 01, 2007.
ORIGINAL ARTICLE
The prevalence of genital arousal disorder during sexual
activity and potential risk factors that may impair genital
arousal among Malaysian women
HATTA SIDI1, MARHANI MIDIN
1, SHARIFAH EZAT WAN PUTEH
2,
& NORNI ABDULLAH3
1 Department of Psychiatry, Faculty of Medicine, Universiti Kebangsaan Malaysia.
2 Department of Community Health, Faculty Medicine, Universiti Kebangsaan Malaysia.
3 Department of Psychiatry, Hospital Tengku Ampuan Rahimah, Klang, Malaysia.
Abstract
Objective: To investigate the prevalence of genital arousal disorder and the potential risk
factors that may impair genital arousal among women at a primary care setting in Malaysia.
Methods: A validated questionnaire for sexual function was used to assess genital arousal
function. A total of 230 married women aged 18–70 years old participated in this study. Their
sociodemographic and marital profiles were compared between those who had genital arousal
disorder and those who did not. The risk factors were examined. Results: The prevalence of
genital arousal disorder in the primary care population was 50.4% (116/230). Women with
genital arousal disorder were found to be significantly higher in groups of more than 45 years
old (p<.001), among the non-Malay (p=.01), those with lower academic status (p=.025), those
married for more than 14 years (p=.001), those married to older husbands (aged>55) (p
=.001), those having 4 children or more (p=.028), those having less sexual intercourse (less
than 1–2 times a week) (p=.001), and those at post-menopausal state (p=.002). There was no
significant difference between these two groups in term of salary (p=.29), suffering from
medical problems (p=.32), dysmenorrhea (p=.95), menarche (p=.5) and hormonal replace-
ment therapy (p=.6). Conclusion: Women with infrequent sexual intercourse are less likely to
be sexually aroused (OR=0.29, 95% CI: 0.11-0.74).
Key words: genital arousal disorder, potential risk factors, Malaysian women
Introduction
Meaningful sexual relationship is one of
the gratifying experiences enjoyed by
couples. This could be achieved when
normal sexual response cycle takes place
during sexual activity [1,2]. Genital arousal
in contrast to subjective sexual arousal has
been a part of the cycle in the traditional as
well as the contemporary models of sexual
response cycle [3,4]. Difficulties in genital
arousal, which constitute of lack of vaginal
lubrication (LVL) [4], may prohibit or-
gasm, cause sexual pain and dissatisfaction.
Lack of vaginal lubrication is not rare
among women and in fact, it is considered
as one of the major sexual health problems
[5], especially with increasing age due to
menopause or physical illnesses [2]. Lack
of vaginal lubrication has been indexed as
one of 7 dichotomous response items in
sexual dysfunctions [6,7]. Given the vari-
able correlation between genital vasocon-
98 Sidi H, et al.
gestion and subjective sexual arousal in
women with and without sexual dysfunc-
tion, there was a smaller subgroup of
women who remain to able to be subjec-
tively become aroused from a variety of
non-genital stimuli [3,4]. The women with
LVL reported loss of sexual excitement
from genital stimulation and acquired loss
of any awareness of genital congestion.
LVL is a form of female sexual dysfunction
(FSD) [4], which may result from multiple
factors including anatomical, physiological,
medical, psychological, cultural and social
components [1,8,9].
The prevalence of LVL is estimated to be
about 14% in western population [5]. Even
though, this is lower than the prevalence of
FSD in general, which ranges from 25% to
63% [10,11], it is nevertheless still high. Its
prevalence in Asian countries is not known.
However, it is possibly as high as that in
the western countries, given the fact that
the prevalence of FSD as a whole is also
high at 30% [12].
In Malaysia, the whole area of sexual
dysfunctions in women especially LVL is
still largely uninvestigated [13,14]. This is
despite clear need for the area to be ex-
plored, especially in the context of quality
of life. Sexual problems among spouses
have been reported to be the second leading
cause for divorce between Malay Muslim
couples. ‘Wife not ready to have sexual
intercourse’ has been quoted as one of the
reasons. This may be associated with lack
of vaginal lubrication leading to sexual
dissatisfaction and sexual pain [13]. It is
noted that there have been increasing
demands for clinical service related to
sexual problems among men and women
[13-16]. It is felt that women in this country
still feel embarrassed to disclose details of
their sexuality and sexual life and do not
usually discus them openly [13,14].
While sexual problems among women have
started to receive its due attention in the
western countries, it is not the case in
Malaysia [13,14]. To date, as far as our
knowledge, there has been no study looking
into the area in Malaysia [13]. It is the
purpose of this study to explore this area in
further detail.
The objective of this research paper is to
investigate the prevalence of genital sexual
arousal disorder during sexual activity and
the potential risk factors that may impair
genital sexual arousal in Malaysian women.
Methods
This was a cross-sectional study on women
attending a primary health clinic. It was
conducted over a period of four months
(March to June 2005) at one of the gov-
ernment primary health care clinics located
in Bandar Tun Razak, a rather busy subur-
ban area of Kuala Lumpur. This study used
a non-probability sampling (universal
sampling) method.
Inclusion criteria included: i) female sub-
ject; ii) aged between 18 and 70 years old;
iii) married and have a sexually active
partner; iv) ability to read and understand
the study languages (Malay or English) and
(v) consent for participation in the study.
Exclusion criteria included: i) chronic and
severe medical illness/illnesses; ii) psychi-
atric illness/illnesses; iii) pregnancy iv)
postpartum period of 2 months or less.The
instruments used in this study were: i)
sociodemographic and marital profile form;
ii) the Malay version of Female Sexual
Function Index (MVFSFI) and iii). the
Mini International Neuropsychiatric Inter-
view (M.I.N.I.).
Sociodemographic and marital profile form
is a brief questionnaire was devised to
obtain respondents’ sociodemographic and
marital information. It includes name, age,
educational level, employment status,
monthly family income, medical history,
menstrual history, duration of marriage, age
of husband, number of children and fre-
quency of sexual intercourse. Malay Ver-
sion of Female Sexual Function Index
(MVFSFI) is a Malay translated version of
the Female Sexual Function Index (FSFI)
developed by Dr. Raymond Rosen. The
original FSFI [17] is a 19-item, multidi-
mensional self-report measure of female
Genital arousal disorder in Malaysian women 99
sexual functioning. It covers 6 basic do-
mains of female sexual functioning: desire,
arousal, lubrication, orgasm, satisfaction,
and pain. It is a validated questionnaire and
has been shown to have discriminate reli-
ability between women with and without
female sexual dysfunction (FSD) and lack
of lubrication [17,18]. The domain scoring
for lack of lubrication is 7, 8, 9 and 10 with
a minimum score of 0 and a maximum
score of 20. The validation of MVFSFI
took place at the same time of this study
with the permission from the original
author and was done in multiple aspects
including the face, content, concurrent
(criterion – specificity and sensitivity) and
discriminant validity [19]. The reliability
test for agreement using Pearson product-
moment correlation coefficient (r) ranged
from 0.767 to 0.973. The internal consis-
tency using Cronbach’s alpha ranged from
0.87 to 0.97. The cut-off score for lubrica-
tion domain (genital sexual disorder) was
established at < 10 for lack of lubrication
(sensitivity 79% and specificity 87%). The
lower the scores, the more likely the
women would suffer from FSD [19]. A
score of 10 and below on the domain of
lubrication was taken as positive of having
genital arousal disorder in this study. The
Mini International Neuropsychiatric Inter-
view (M.I.N.I.) was used to exclude any
respondents with psychiatric illnesses from
this study. This is a brief structured inter-
view for major Axis I psychiatric disorders
in DSM-IV and ICD-10. The inter-rater
reliability for this study was ascertained by
administering the instrument on 10 cases
selected randomly. This was done by two
of the authors and yielded a kappa value of
1.
Approval was obtained to conduct the
study from the university ethical committee
as well as from the administration authority
of the particular clinic. All respondents
who fulfilled the inclusion criteria were
given an explanation about the study. A
written consent was obtained from them.
They were assured with regards to their
anonymity and the confidentiality of the
data obtained. A coding system was used to
identify the respondents if it was necessary.
The socio-demographic form and the
MVFSFI [19] were given to each respon-
dent to be filled up in a room with some
privacy. After the MVFSFI was completed,
each respondent was engaged in a clinical
interview for diagnosing sexual dysfunc-
tion based on the DSM-IV criteria [20] and
administered the M.I.N.I for exclusion of
the other psychiatric illnesses. Those who
were found to have sexual dysfunction
were referred to a sexologist for further
management.
Analysis of the data was done using SPSS
12.0.1 for Windows (SPSS Inc., 2003,
Chicago). The relationship between the
studies parameters were analyzed using
appropriate statistical tests. Chi-square tests
(χ² tests) were used to determine risk fac-
tors for FSD among categorical variables.
Regression analysis using Multiple Logistic
Regression (MLR) with 95% confidence
interval (95% CI) was used to assess pa-
rameters that were actually considered as
predictors of FSD.
Results Two hundred and forty eight patients who
attended the Bandar Tun Razak primary
care clinic, Cheras, Kuala Lumpur were
invited to participate in the study. How-
ever, 18 patients were unable to complete
the study because of multiple reasons, such
as unable to make time (4 patients), did not
feel comfortable with the questions (7
patients) and did not bring their reading
glasses to the clinic (5 patients). The re-
sponse rate was 93% with total subjects of
230. By the use of MINI, two patients were
excluded due to the positive screening and
diagnosis of anxiety disorder and major
depressive disorder.
The socio-demographic and marital charac-
teristics of the respondents are shown in
Table 1.
The studied urban women population was
relatively of younger ages [mean of 39.2
years, SD=10.5], slightly younger than
their spouses (mean of 42.7 years, SD=
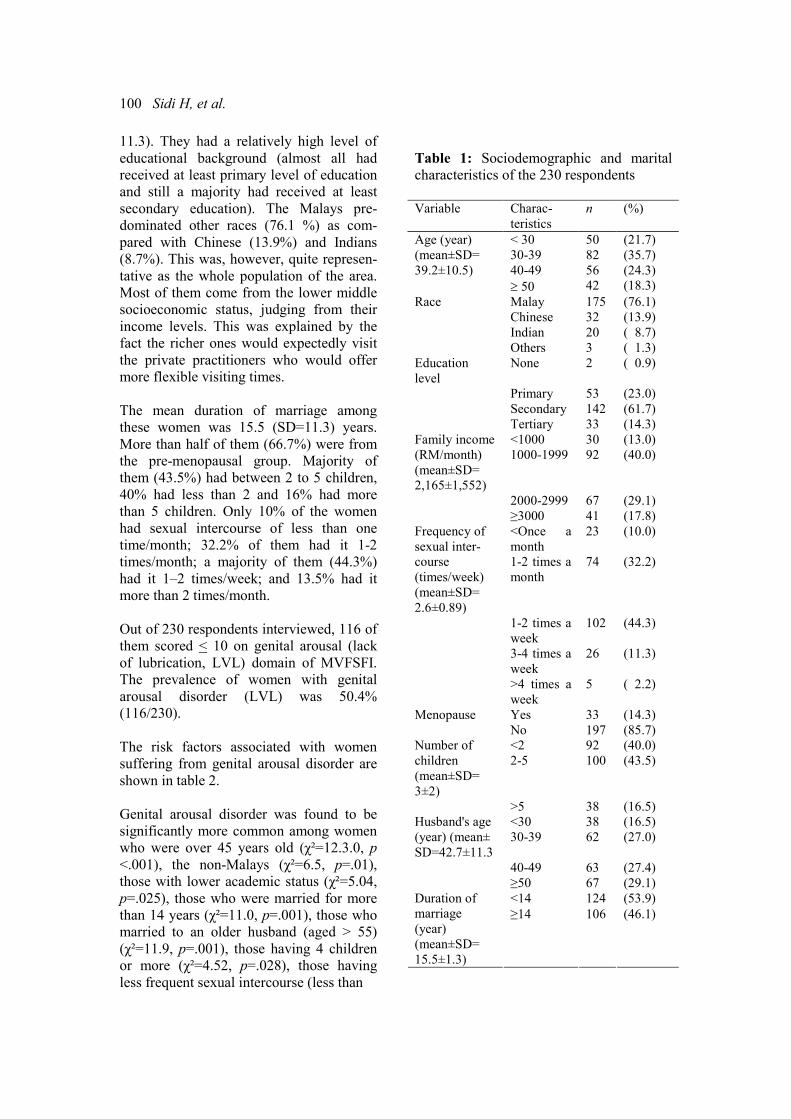
100 Sidi H, et al.
11.3). They had a relatively high level of
educational background (almost all had
received at least primary level of education
and still a majority had received at least
secondary education). The Malays pre-
dominated other races (76.1 %) as com-
pared with Chinese (13.9%) and Indians
(8.7%). This was, however, quite represen-
tative as the whole population of the area.
Most of them come from the lower middle
socioeconomic status, judging from their
income levels. This was explained by the
fact the richer ones would expectedly visit
the private practitioners who would offer
more flexible visiting times.
The mean duration of marriage among
these women was 15.5 (SD=11.3) years.
More than half of them (66.7%) were from
the pre-menopausal group. Majority of
them (43.5%) had between 2 to 5 children,
40% had less than 2 and 16% had more
than 5 children. Only 10% of the women
had sexual intercourse of less than one
time/month; 32.2% of them had it 1-2
times/month; a majority of them (44.3%)
had it 1–2 times/week; and 13.5% had it
more than 2 times/month.
Out of 230 respondents interviewed, 116 of
them scored < 10 on genital arousal (lack
of lubrication, LVL) domain of MVFSFI.
The prevalence of women with genital
arousal disorder (LVL) was 50.4%
(116/230).
The risk factors associated with women
suffering from genital arousal disorder are
shown in table 2.
Genital arousal disorder was found to be
significantly more common among women
who were over 45 years old (χ²=12.3.0, p
<.001), the non-Malays (χ²=6.5, p=.01),
those with lower academic status (χ²=5.04,
p=.025), those who were married for more
than 14 years (χ²=11.0, p=.001), those who
married to an older husband (aged > 55)
(χ²=11.9, p=.001), those having 4 children
or more (χ²=4.52, p=.028), those having
less frequent sexual intercourse (less than
Table 1: Sociodemographic and marital
characteristics of the 230 respondents
Variable Charac-
teristics
n (%)
Age (year) < 30 50 (21.7)
(mean±SD= 30-39 82 (35.7)
39.2±10.5) 40-49 56 (24.3)
≥ 50 42 (18.3)
Race Malay 175 (76.1)
Chinese 32 (13.9)
Indian 20 ( 8.7)
Others 3 ( 1.3)
Education
level
None 2 ( 0.9)
Primary 53 (23.0)
Secondary 142 (61.7)
Tertiary 33 (14.3)
<1000 30 (13.0) Family income
(RM/month)
(mean±SD=
2,165±1,552)
1000-1999 92 (40.0)
2000-2999 67 (29.1)
≥3000 41 (17.8)
<Once a
month
23 (10.0) Frequency of
sexual inter-
course
(times/week)
(mean±SD=
2.6±0.89)
1-2 times a
month
74 (32.2)
1-2 times a
week
102 (44.3)
3-4 times a
week
26 (11.3)
>4 times a
week
5 ( 2.2)
Menopause Yes 33 (14.3)
No 197 (85.7)
<2 92 (40.0) Number of
children
(mean±SD=
3±2)
2-5 100 (43.5)
>5 38 (16.5)
<30 38 (16.5) Husband's age
(year) (mean±
SD=42.7±11.3
30-39 62 (27.0)
40-49 63 (27.4)
≥50 67 (29.1)
<14 124 (53.9) Duration of
marriage
(year)
(mean±SD=
15.5±1.3)
≥14 106 (46.1)
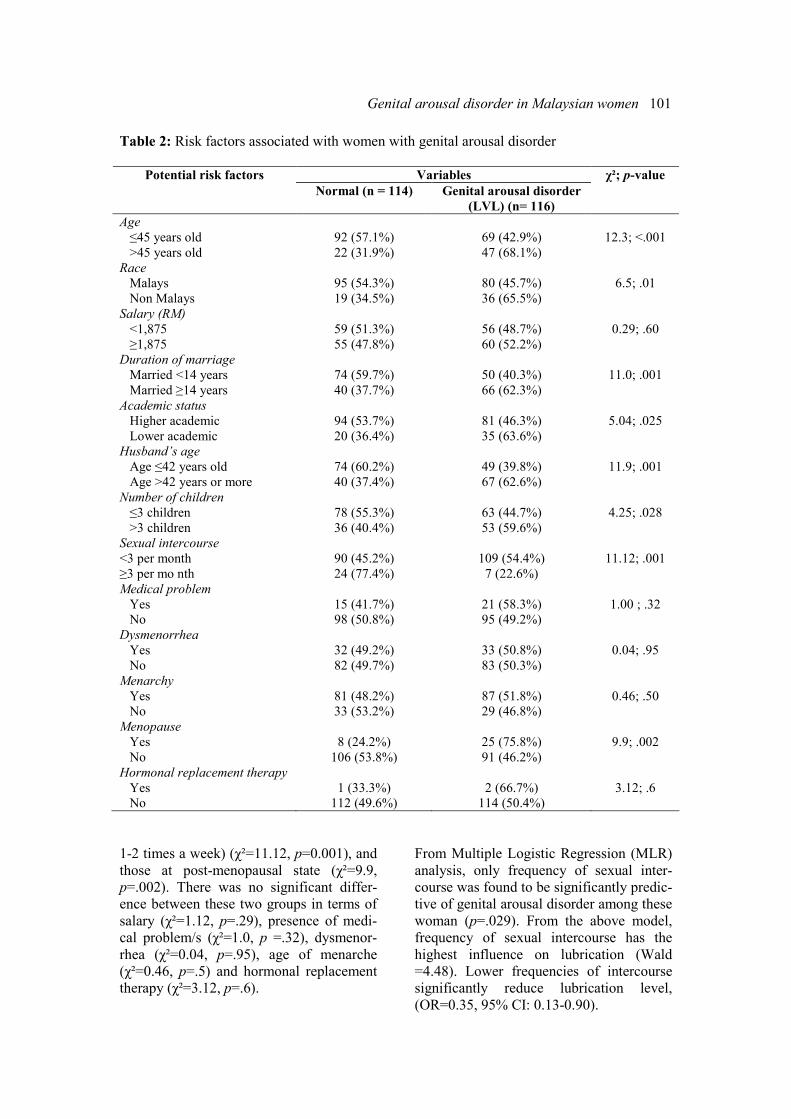
Genital arousal disorder in Malaysian women 101
Table 2: Risk factors associated with women with genital arousal disorder
Variables Potential risk factors
Normal (n = 114) Genital arousal disorder
(LVL) (n= 116)
χ²; p-value
Age
≤45 years old 92 (57.1%) 69 (42.9%) 12.3; <.001
>45 years old 22 (31.9%) 47 (68.1%)
Race
Malays 95 (54.3%) 80 (45.7%) 6.5; .01
Non Malays 19 (34.5%) 36 (65.5%)
Salary (RM)
<1,875 59 (51.3%) 56 (48.7%) 0.29; .60
≥1,875 55 (47.8%) 60 (52.2%)
Duration of marriage
Married <14 years 74 (59.7%) 50 (40.3%) 11.0; .001
Married ≥14 years 40 (37.7%) 66 (62.3%)
Academic status
Higher academic 94 (53.7%) 81 (46.3%) 5.04; .025
Lower academic 20 (36.4%) 35 (63.6%)
Husband’s age
Age ≤42 years old 74 (60.2%) 49 (39.8%) 11.9; .001
Age >42 years or more 40 (37.4%) 67 (62.6%)
Number of children
≤3 children 78 (55.3%) 63 (44.7%) 4.25; .028
>3 children 36 (40.4%) 53 (59.6%)
Sexual intercourse
<3 per month 90 (45.2%) 109 (54.4%) 11.12; .001
≥3 per mo nth 24 (77.4%) 7 (22.6%)
Medical problem
Yes 15 (41.7%) 21 (58.3%) 1.00 ; .32
No 98 (50.8%) 95 (49.2%)
Dysmenorrhea
Yes 32 (49.2%) 33 (50.8%) 0.04; .95
No 82 (49.7%) 83 (50.3%)
Menarchy
Yes 81 (48.2%) 87 (51.8%) 0.46; .50
No 33 (53.2%) 29 (46.8%)
Menopause
Yes 8 (24.2%) 25 (75.8%) 9.9; .002
No 106 (53.8%) 91 (46.2%)
Hormonal replacement therapy
Yes 1 (33.3%) 2 (66.7%) 3.12; .6
No 112 (49.6%) 114 (50.4%)
1-2 times a week) (χ²=11.12, p=0.001), and
those at post-menopausal state (χ²=9.9,
p=.002). There was no significant differ-
ence between these two groups in terms of
salary (χ²=1.12, p=.29), presence of medi-
cal problem/s (χ²=1.0, p =.32), dysmenor-
rhea (χ²=0.04, p=.95), age of menarche
(χ²=0.46, p=.5) and hormonal replacement
therapy (χ²=3.12, p=.6).
From Multiple Logistic Regression (MLR)
analysis, only frequency of sexual inter-
course was found to be significantly predic-
tive of genital arousal disorder among these
woman (p=.029). From the above model,
frequency of sexual intercourse has the
highest influence on lubrication (Wald
=4.48). Lower frequencies of intercourse
significantly reduce lubrication level,
(OR=0.35, 95% CI: 0.13-0.90).
102 Sidi H, et al.
Discussion
The terminology of female genital sexual
disorder is relatively very new in local
Malaysian population and appear briefly
only in the clinical context recently [13],
even in the Western society [3,4]. Sexual
excitement – both subjective and physio-
logical can precede sexual desire [4,21].
Issues related to genital arousal disorder are
traditionally considered to be too private to
be disclosed and could only be shared with
certain people like parents or traditional
healers or confined between spouses in the
bedroom: therefore neglected and remain
untreated [13,14,22]. To complicate the
matter, in the past, many researchers cre-
ated their own definitions for sexual disor-
ders, which inevitably led to confusing and
incongruent results. An attempt to address
this issue globally was made through a
panel of experts at the Consensus Devel-
opment Conference on FSD in 1998 [23].
With the introduction of academic sexology
linked to medicine, discussion on female
sexual disorder would become more ac-
ceptable in Malaysian society [14].
Research in the area of female sexual
dysfunction are scanty and at infantile stage
in Malaysia – and it is hoped that this piece
of research work would enlighten academi-
cians, politicians and health care policy
makers in future planning for sex education
and providing sex counseling to couples
and women with sexual disorder. However,
research in sexual difficulties was not given
adequate attention compared to the male
sexual function, as there was no apparent
“cure” or current revolutionary pharmaco-
therapy in women than compare to male –
and partly because sexual function in
women are more complex and does not
follow the linear male sexual response
cycle [12,21]. Whipple (2002) highlighted
the difficulties in studying women sexual
function, in which so many non-anatomic
and non-physiological factors play a role
[21]. Male sexual dysfunction can be more
objectively define and diagnosed, and
interventions can be more objectively
ranked regarding efficacy comparing to
female sexual difficulties [24]. Further-
more, sexual activity frequency, a measure
used for male sexual function, cannot be
used as an accurate marker of female
sexual function because women may still
be able to remain sexually active with
partner while experiencing sexual difficul-
ties [25]. Female sexual function may also
be more dynamic than a male sexual dys-
function. Although there are significant
anatomic and embryologic parallels be-
tween men and women, the complex nature
of female sexual dysfunction is clearly
distinct from that of the male.
This research is an attempt to look on the
gravity of genital sexual arousal disorder in
women attending a primary care setting.
The studied urban Malaysian population
has relatively younger age with high level
of educational background. They came
from the lower middle socioeconomic
group based on their monthly family in-
come with a majority of them having been
married for more than 10 years. Nearly half
of them are very active sexually, with
frequency of sexual intercourse 1–2 times/
week and more than half are from pre-
menopausal group.
The prevalence of females with genital
sexual arousal disorder was 50.4%. This
figure is about 3 more times more common
than the Western population [5]. This is
also higher than that in another study [26].
This international survey [26] on 407
subjects found 19% of women and 11% of
men reporting of not considering sex pleas-
urable. Of the women interviewed, 23%
reported inadequate lubrication, with a
significant increase of this complaint in
women aged 50-65 years.
This high prevalence of women reporting
genital arousal disorder may be explained
by the fact that they were assessed privately
using a rather simple questionnaire in a
medical setting where anonymity was
assured. In addition, helps could be offered
if they needed it. This finding shows that
despite the societal, cultural, and religious
norms, the chance of Malaysian women to
disclose their sexual discontentment is
Genital arousal disorder in Malaysian women 103
high, given the right situation and the right
way. The high prevalence of sexual diffi-
culties only reported after a systematic
assessment (rather than spontaneous reports
to their doctors) also confirmed the finding
of another study on female sexual difficul-
ties in Asia, which found that nearly half of
them did not seek treatment for the prob-
lems [12].
Increasing age as a factor to be associated
with genital arousal disorder in this study is
not surprising and has been found in other
studies [26]. It is rather expected that
sexual difficulties would be less reported
among the Malay women, who are syn-
onymously Muslims. The Malays are
traditionally more inhibited when it comes
to sex, as well as, Islam prohibits sexual
disclosure except only for treatment pur-
poses [13]. However, we are not sure
specifically, why genital sexual arousal
disorder affects more on the non-Malays
(mainly Chinese and Indians). This finding
needs further replication using a larger
sample size. The non-Malays included in
this study had to be able to speak the study
languages (English and Malay). This ability
reflects higher education levels and being
more liberated, which may explain the
spontaneity of reporting sexual difficulties.
We found that the potential risk factors that
may impair genital sexual arousal in Ma-
laysian women are old age, non-Malay, a
lower academic status, married longer and
older husband, having more children and
having less sexual intercourse (less than 1–
2 times a week). There were no significant
findings in term of having any medical
problems, but women at postmenopausal
age were at risk. We have significantly
more non-Malays reporting the lack of
lubrication, probably due to cultural belief
on sexual issues, despite of more Malays
were recruited in this study. Having less
sexual intercourse could be due to the
complications of genital sexual arousal
disorder as we could not determine the
cause and effect in this study. The longer
period of marriage would provide more
chances of reporting sexual dysfunction.
Women with genital sexual arousal disor-
der tend to have more children – probably
the psychobiological aspect of parity has a
significant effect on their sexual function-
ing, either due to hormonal changes, in-
crease responsibility to take care of the
family and due to lack of privacy for sexual
encounters. The lower educational status
would reflect their ignorance of sexual
rights. Interestingly, in our study, salary
income, medical problem or dysmenorrhea
was not found to be associated with genital
arousal disorder. However, serious medical
and psychiatric disorders that could obvi-
ously impair sexual functioning had been
excluded from the study [27-29].
Sexual desire and vaginal lubrication of a
woman may be affected by hormonal
changes that occur as a result of normal
female physiology, such as menstrual
cycle, postpartum states, lactation and
menopause – or due to fatigue and decrease
well-being [28] – or psychological and
intimate relationship [1].
There are a few limitations of this research.
First, relationship issues, e.g., marital
satisfaction between couple, were not
investigated in this study. Genital arousal
disorder during sexual activity could actu-
ally be reflective of lack of intimacy and
eroticism between couples [1]. Second, we
did not look into the sexual functioning of
the male spouses. Sexual difficulties in
women may be associated with sexual
dysfunction among their spouses, espe-
cially, erectile dysfunction [30]. However,
we found that women with genital arousal
disorder tend to have older husbands with
possible medical problems. It is known that
that medical problems among older men
[12] could affect their sexual performance,
and this may have indirectly contributed
the women’s sexual dysfunction [2,4].
In term of respondents, this study included
only the married women with sexually
functioning partners. Those who were not
married (single, divorce or widow) were
excluded from this study because most
Malaysians were unable to accept the
104 Sidi H, et al.
extramarital sexual relationship. However,
there were many unmarried women sexu-
ally were active [Sirat HH personal com-
munication, February 10, 2005]. Those
who were not married but sexually active
were approached during the pilot stage but
they were reluctant to participate due to
religious and cultural reasons.
Another limitation is the language barrier
that caused a significant number of the
Chinese and Indians to be excluded from
the study. With this limitation, the author
would recommend the development of
validated Female Sexual Function Index
Questionnaire in various languages such as
in Mandarin or Tamil in the future.
This research has an important impact to
our current understanding of the magnitude
of female sexual dysfunction in our pri-
mary care population. It indicates the need
for treatment and services for sexual dys-
function in the clinical settings, which are
tailored to the local needs of women popu-
lation. Psychological and intimacy based
approaches for sexual difficulties in women
are very crucial in sex therapy [1,2,4,13].
Aside from hormone replacement therapy,
medical management of female sexual
dysfunction remains in experimental phases
[2,4,32]. Nevertheless, it is crucial to
understand that not all female sexual com-
plaints are psychological, and that there are
possible therapeutic options.
With the improvements of medical atten-
tion, female sexual difficulties have been
recognized as an important element as in
their male counterpart in terms of diagnosis
[33,34] and right for treatment in a more
widely accepted, and understood diseases.
The importance of addressing issues of
sexual difficulties in women has emerged
recently with more interest to do research
in this area, including using a validated
questionnaire [17,18] for health planning
purpose and improvement of quality of life.
The ideal approach to treat female sexual
dysfunction, including genital sexual
arousal disorder, is a collaborative effort
between psychiatrists and physicians.
These include a complete medical and
psychosocial evaluation [1-4], as well as
inclusion of the partner or spouse in the
evaluation and treatment process [35].
References 1. Schnarch D. Passionate Marriage: Keeping
Love & Intimacy Alive in Committed Relation-
ship. New York: Owl Books; 1997.
2. Basson R. Women’s sexual dysfunction:
revised and expanded definitions. CMAJ.
2005;172:1327-33.
3. Lewis RW, Fugl-Meyer KS, Bosch R,
Fugl-Meyer AR, Laumann EO, Lizza E, et al.
Epidemiology/risk factors of sexual dysfunc-
tion. J Sex Med. 2004;1:35-9.
4. Basson R, Brotto LA, Laan E, Redmond G,
Utian WH. Assessment and management of
women’s sexual dysfunctions: problematic
desire and arousal. J Sex Med. 2005;2:291–300.
5. Laumann EO, Paik Anthony MA, Rosen R.
Sexual dysfunction in the United States: preva-
lence and predictors. JAMA. 1999;281:537-44.
6. Rosen R, Brown C, Heiman J, Leiblum S,
Meston CM, Shabsigh R, et al. The Female
Sexual Function Index (FSFI): A multidimen-
sional self-report instrument for the assessment
of female sexual function. J Sex & Marital
Ther. 2000;26:191–208.
7. Rosen R. Female sexual dysfunction:
industry creation or under-recognized pro-
blem? Br J Urol Inter. 2003;92:3.
8. Salonia A., Munarriz R. Naspro R.
Women’s sexual dysfunction: A pathophysi-
ological review. Br J Urol. 2004;93:1156-64.
9. Deborah JL. Female sexual dysfunction.
Mayo Clin Proc. 2002;77:698–702.
10. Frank E, Anderson C, Rubinstein D.
Frequency of sexual dysfunction in “normal”
couples. N Engl J Med. 1978;299:111-5.
11. Spector IP, Carey MP. Incidence and
prevalence of the sexual dysfunction: a critical
review of the empirical literature. Arch Sex
Behav. 1990;19:389-408.
12. Nicolosi A, Dale B, Glasser SC, Kim KM,
Laumann EO. Sexual behaviour and dysfunc-
tion and help-seeking patterns in adult age 40-
80 years in the urban population of Asian
countries. Br J Urol. 2005;95: 609-14.
13. Hatta S, Hatta SM, Ramli H. Seksualiti
Manusia: Keharmonian Jalinan Antara Jantina.
Dewan Bahasa dan Pustaka. Edisi-ke 2 (Human
Sexuality: The harmony between sexes, 2nd
ed.). Kuala Lumpur:Dewan Bahasa Pustaka;
2006.
14. Thambi I. Soal-selidik Kesihatan Seksual
Genital arousal disorder in Malaysian women 105
[questions and answers in sexual health].
Bentong:PTS Publication and Distribution;
2005.
15. Bermann JR, Goldstein I. Female sexual
dysfunction. Urol Clin North America. 20011:
405-16.
16. Bachmann G. Evaluation and management
of female sexual dysfunction. The Endocrinolo-
gist. 2004;14:337-45.
17. Rosen R, Brown C, Heiman J, Leiblum S,
Meston CM, Shabsigh R, et al. The Female
Sexual Function Index (FSFI): A multidimen-
sional self-report instrument for the assessment
of female sexual function. J Sex Marital Ther.
2000; 26:191-208.
18. Meston C.M. Validation of the Female
Sexual Function Index (FSFI) in women with
female orgasmic disorder and in women with
hypoactive sexual desire disorder. J Sex Marital
Ther. 2003;29:39-46.
19. Sidi H, Wan Puteh SE, Abdullah N, Midin
M. The Female Sexual Function Index (FSFI):
validation of the Malay version. J Sex Med Mac
2007;4:1642-54 (Epub 30 June 2007).
20. American Psychiatric Association Guide-
lines. Diagnostic and statistical manual of
mental disorders (4th ed) (DSM IV). Washing-
ton, DC: Author; 1994.
21. Wipple B. Women’s sexual pleasure and
satisfaction: a new view of female sexual
function. Scand. J. Sexol. 2002;4:191-7.
22. Malaysia Today: The Independent News.
Parlimentary discussion by Parlimentary Secre-
tary in the Prime Minister’s Department [cited
2005 April 25]. Available from:
http://www.malaysia-today.net/ parlimen
23. Basson R, Berman J, Burnet A, Derogatis
L, David Fl. Report of the international consen-
sus development conference on female sexual
dysfunction: definitions and classifications. J
Urol. 2000;163:888.
24. Baumeister RF, Catanese KR, Vohs KD. Is
there a gender difference in strength of sex
drive? Theoretical views, conceptual distinc-
tions, and a review of relevant evidence. Pers
Soc Psychol Rev. 2001;1: 242-73.
25. McHorney C, Rust J, Golombok S, Davis S,
Bouchard C, Brown C, et al. Profile of female
sexual function: a patient based, international,
psychometric instrument for the assessment of
hypoactive sexual desire in oophorectomized
women. Menopause 2004;11:474-83.
26. Brock G, Laumann E, Glasser DB, Gingell
C, King R. Prevalence of sexual dysfunction
among mature men and women in USA, Can-
ada, Australia and New Zealand J Urol. 2003;
163:888-93.
27. Basson R. Female sexual response: the role
of drugs in the management of sexual dysfunc-
tion. Obst Gynaecol J. 2001;98:522.
28. Bachmann G, Bancroft J, Braunstein G, et
al. Female androgen insuffiecieny: the Prince-
ton consensus statement on definition, classifi-
cation and assessment. Fertil Steril. 2002;77:
660-5.
29. Boulet MJ, Oddens BJ, Lehert P. Climac-
teric and menopause in seven South-east Asian
countries. Maturitas. 1994;19: 157-76.
30. Selahittin C, Akbay E, Bozlu M, Canpolat
B, Acar D, Ulusoy E. The assessment of sexual
function in women with male partners com-
plaining of erectile dysfunction: Does treatment
of male sexual dysfunction improve female
partner’s sexual function? J Sex Marital Ther.
2004;30: 333-41.
31. Heiman J, Meston C. Evaluating sexual
dysfunction women. Clin Obst Gynaecol.
1997;40:616-29.
32. Walton B, Thorton T. Female sexual dys-
function. Current Women’s Health Report.
2003;3:319-26.
33. Merkatz RB. Female sexual dysfunction. J
Women’s Health Gender-Based Med. 2002;11:
4.
34. Meston CM. The psychological assessment
of female sexual function. J Sex Educat Ther.
2000;25:1.
35. Clayton A.H. Sexual function and dysfunc-
tion in women. Psych Clin North America.
2003;26:673-82.
ASEAN Journal of Psychiatry 2007:8 (2):106-110.
___________________________________________________________________________________
Correspondence: Sirijit Suttajit, Department of Psychiatry, Faculty of Medicine, Chiang Mai Univer-
sity, Muang, Chiang Mai, 50200 Thailand.
Email: [email protected]
Received: September 2, 2007; Accepted September 30, 2007.
ORIGINAL ARTICLE
Benzodiazepine overuse in an internal medicine out-patient
department: a prospective study
SIRIJIT SUTTAJIT1, MANIT SRISURAPANONT
1, PEERASAK LERTTRAKARNNON
2
1 Department of Psychiatry, Faculty of Medicine, Chiang Mai University, Muang, Chiang Mai, 50200
Thailand. 2 Department of Family Medicine, Faculty of Medicine, Chiang Mai University, Muang, Chiang Mai,
50200 Thailand.
Abstract Objective: This study aims to assess benzodiazepine overuse, in particular indications, pro-
longed use, and dependence for usage in out-patients treated at the internal medicine clinic of
Chiang Mai University Hospital. Methods: The indications of benzodiazepine usage were
examined by using the Thai Hospital Anxiety and Depression Scale in patients who were
started on benzodiazepines. The duration of benzodiazepine usage was classified into: i) less
than 1 month; ii) 1-6 months; and iii) longer than 6 months, and benzodiazepine dependence
was assessed by using the Severity of Dependence Scale. Results: Of 40 out-patients started
on benzodiazepines, only one of them (2.5%) had clinically significant anxiety. Of 58 out-
patients receiving benzodiazepines, 42 patients (72.4%) had used benzodiazepines longer than
6 months. In addition, 8 patients (13.8%) were dependent on benzodiazepines. Conclusions:
Benzodiazepine overuse is common in physically ill out-patients, even in the university
hospital. Almost half of the surveyed patients appear to have prolonged benzodiazepine use;
however, only a few patients are dependent on benzodiazepines.
Key words: benzodiazepine overuse, indication, duration, dependence
Introduction
Benzodiazepines are among the most
widely prescribed psychiatric drugs in the
world [1]. They have been used not only in
psychiatric patients but also in physically
ill patients. Previous studies found that
besides psychiatrists, neurologists and
internists are the doctors who most fre-
quently use benzodiazepines in their prac-
tices [1,2]. Although benzodiazepines are
considered well tolerated, especially when
compared with older drugs, their adverse
side effects can cause a number of prob-
lems, such as sedation, motor incoordina-
tion, cognitive impairment and disinhibi-
tion [3,4]. Moreover, long term use of
benzodiazepines may leads to dependence,
tolerance and withdrawal [4,5].
There are greater concerns about benzodi-
azepine’s side effects particularly in the
elderly, in whom adverse events include
falls from ataxia, which cause hip fractures,
and confusion [4,6]. Although increasing
awareness of benzodiazepine’s side effects
may decrease their overall usage [5,7,8],
they are still frequently prescribed for a
long period of time, especially in develop-
ing countries where there is no clearly
recommended guideline.
As a drug class without definite indication,
Benzodiazepine overuse in a tertiary hospital 107
the rationales for the use of benzodiaze-
pines have been controversial. In clinical
practice, their main indications are treating
anxiety and depression [1]. However, these
drugs are commonly prescribed for a vari-
ety of somatic complaints which leads to
the problem of overuse [9]. Srisurapanont
and his colleagues carried out a study in the
northern part of Thailand and reported that,
for general practitioners, the most common
use of benzodiazepines is for anxiety with
insomnia (93%), followed by panic disor-
der (78%) and depression (43%). Some
general practitioners also gave these medi-
cations for essential hypertension and low
back pain. Moreover, 45% of them admit-
ted that they had used benzodiazepines too
much in the past year [10].
Regarding the duration of benzodiazepine
treatment, some experts suggest that the
efficacy of benzodiazepines for insomnia is
decreased after 2 weeks, for anxiety after 4
weeks and for panic disorder after 12
weeks [9]. However, the appropriate dura-
tion for prescribing benzodiazepine is still
an issue of debate. The UK data sheet for
diazepam and temazepam recommends that
benzodiazepines should be used only when
the disorder is severe, disabling or causes
marked distress [9]. Its use should be
limited to short term (2-4 weeks), while
extensions beyond this time require re-
evaluation of the patient’s status [8, 9]. In
addition, the USFDA label of benzodi-
azepines states that the efficacy of these
drugs at longer than 4 months has not been
assessed by systematic studies [11]. How-
ever, a small number of studies have found
that benzodiazepines are effective for a
longer period (4-6 months) [12].
Benzodiazepine dependence is regularly
seen. De Las Cuevas and colleagues found
that 47% of patients using benzodiazepines
for more than 1 month had benzodiazepines
dependence [13]. According to the study of
Uhlenhuth et al.(1998), benzodiazepine
dependence could occur when doses within
the clinical range were taken regularly over
a 6-month period [14].
In several developed countries, various
steps have been taken to control the pre-
scription of benzodiazepines. Example
strategies include disseminated documents
on how to prescribe benzodiazepine (e.g.,
never prescribe on the first visit or to an
unknown patient), advice about sleep
hygiene, using sedative antidepressants or
non-benzodiazepine sedatives instead of
benzodiazepine, offering non-pharmacolo-
gical supports or psychotherapy as the first
choice [15,16], and reserving benzodi-
azepines for more severe cases of anxiety
and insomnia. However, in developing
countries, such as Thailand, there is still a
limited concern about the side effects of
benzodiazepines.
A study of benzodiazepine overuse, in
particular at the internal medicine out-
patient clinics, would increase the under-
standing of benzodiazepine use problems
and may be a guide for the development of
strategies to reduce benzodiazepine pre-
scription. This study therefore aims to
assess benzodiazepine overuse, mainly
regarding indications, prolonged use and
benzodiazepine dependence, in out-patients
treated at an internal-medicine clinic of a
university hospital.
Methods
This prospective study was carried out
between March and April 2005 at Chiang
Mai University Hospital, a tertiary general
hospital in northern Thailand. Chiang Mai
is the largest city in northern Thailand, with
approximately 1,650,000 inhabitants in
2006.
The study evaluated out-patients receiving
benzodiazepines from the hospital’s inter-
nal medicine clinic. This study was ap-
proved by the Ethics Committee for Human
Studies, Faculty of Medicine, Chiang Mai
University.
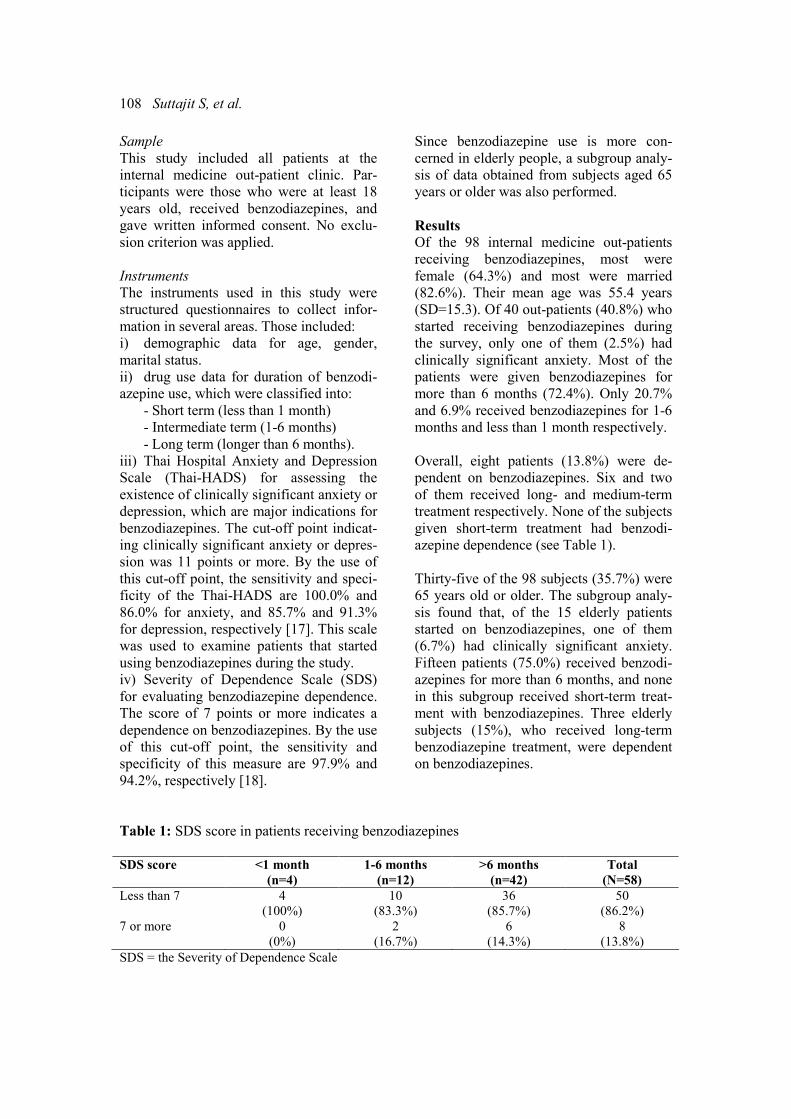
108 Suttajit S, et al.
Sample
This study included all patients at the
internal medicine out-patient clinic. Par-
ticipants were those who were at least 18
years old, received benzodiazepines, and
gave written informed consent. No exclu-
sion criterion was applied.
Instruments
The instruments used in this study were
structured questionnaires to collect infor-
mation in several areas. Those included:
i) demographic data for age, gender,
marital status.
ii) drug use data for duration of benzodi-
azepine use, which were classified into:
- Short term (less than 1 month)
- Intermediate term (1-6 months)
- Long term (longer than 6 months).
iii) Thai Hospital Anxiety and Depression
Scale (Thai-HADS) for assessing the
existence of clinically significant anxiety or
depression, which are major indications for
benzodiazepines. The cut-off point indicat-
ing clinically significant anxiety or depres-
sion was 11 points or more. By the use of
this cut-off point, the sensitivity and speci-
ficity of the Thai-HADS are 100.0% and
86.0% for anxiety, and 85.7% and 91.3%
for depression, respectively [17]. This scale
was used to examine patients that started
using benzodiazepines during the study.
iv) Severity of Dependence Scale (SDS)
for evaluating benzodiazepine dependence.
The score of 7 points or more indicates a
dependence on benzodiazepines. By the use
of this cut-off point, the sensitivity and
specificity of this measure are 97.9% and
94.2%, respectively [18].
Since benzodiazepine use is more con-
cerned in elderly people, a subgroup analy-
sis of data obtained from subjects aged 65
years or older was also performed.
Results
Of the 98 internal medicine out-patients
receiving benzodiazepines, most were
female (64.3%) and most were married
(82.6%). Their mean age was 55.4 years
(SD=15.3). Of 40 out-patients (40.8%) who
started receiving benzodiazepines during
the survey, only one of them (2.5%) had
clinically significant anxiety. Most of the
patients were given benzodiazepines for
more than 6 months (72.4%). Only 20.7%
and 6.9% received benzodiazepines for 1-6
months and less than 1 month respectively.
Overall, eight patients (13.8%) were de-
pendent on benzodiazepines. Six and two
of them received long- and medium-term
treatment respectively. None of the subjects
given short-term treatment had benzodi-
azepine dependence (see Table 1).
Thirty-five of the 98 subjects (35.7%) were
65 years old or older. The subgroup analy-
sis found that, of the 15 elderly patients
started on benzodiazepines, one of them
(6.7%) had clinically significant anxiety.
Fifteen patients (75.0%) received benzodi-
azepines for more than 6 months, and none
in this subgroup received short-term treat-
ment with benzodiazepines. Three elderly
subjects (15%), who received long-term
benzodiazepine treatment, were dependent
on benzodiazepines.
Table 1: SDS score in patients receiving benzodiazepines
SDS score <1 month
(n=4)
1-6 months
(n=12)
>6 months
(n=42)
Total
(N=58)
Less than 7 4
(100%)
10
(83.3%)
36
(85.7%)
50
(86.2%)
7 or more 0
(0%)
2
(16.7%)
6
(14.3%)
8
(13.8%)
SDS = the Severity of Dependence Scale
Benzodiazepine overuse in a tertiary hospital 109
Discussion
Of the 40 patients who were started on
benzodiazepines, only one of them had
anxiety or depression, which indicates that
97.5% did not meet the major indications
for the use of benzodiazepines. Based on
indications and contraindications, a previ-
ous study found that benzodiazepines were
prescribed inappropriately in 65% of those
receiving them [19]. Although the indica-
tions and the results of previous and the
present studies are relatively different, both
studies found high prevalent rates of the
off-label use of benzodiazepines.
Up to 72.4% of all patients received benzo-
diazepines for longer than 6 months, al-
though past studies showed there was no
evidence of efficacy. The percentage of
long-term treatment found in this study is
higher than previous studies, which were
15-37% [20, 21].
In this study, the point prevalence rate of
benzodiazepine dependence is 13.8%,
which is in the range of 3.3% and 97%
obtained from previous studies [13, 22-25].
The wide range of the prevalence rate
among these studies may cause by the
population differences, criteria and meas-
urements.
Elderly patients have higher rates of de-
pendence and prolonged use compared to
the whole studied population. These find-
ings are similar to the previous study,
which found that old people had a higher
risk of prolonged use than the general
population [21].
The strength of this study is the measures
used for screening dependence and anxi-
ety/depressive disorders. However, there
are some limitations, including small
sample size, assessing the duration of
treatment by self-reporting, and using
screening tests for anxiety/depression and
dependence.
In conclusions, benzodiazepine overuse is
common in physically ill out-patients, even
in university hospitals. This problem
should concern patients, clinicians and
policy makers. Almost half of the patients
in this study appeared to have prolonged
benzodiazepine use. Alternative treatment,
such as relaxation training and sleep hy-
giene education, should be publicized.
Despite the overuse problem, few patients
are dependent on benzodiazepines. As very
few patients initiated with benzodiazepines
have clinically significant anxiety or de-
pression, further studies may be needed to
examine the indications of benzodiazepines
in this population.
Acknowledgements
This study was supported by a grant from
the Psychiatric Association of Thailand
(PAT) and the Faculty of Medicine En-
dowment Fund, Chiang Mai University,
Thailand. We would like to thank Dr.
Siritree Suttajit and Paul Padco for im-
mensely helpful comments, criticisms and
suggestions. In addition, we are grateful for
the nursing staff of the internal medicine
clinic of Maharaj Nakorn Chiang Mai
Hospital for collecting the data in this
study.
Conflict of interest
The authors declare that they have no
conflict of interest.
Authors’ Contributions
SS and MS conceived and initiated the
study, conducted the survey and analyzed
the data. PL conceived and initiated the
study. All authors participated in the writ-
ing of successive drafts of the manuscript
and all have read and approved the final
manuscript.
References 1. Lasagna L. The role of benzodiazepines in
nonpsychiatric medical practice. Am J Psychia-
try. 1977;134:656-8.
2. Pichairaksaphorn C. A descriptive study on
out-patient benzodiazepines prescription at
Chareonkrung Pracharak Hospital. Charoenk-
rung Pracharak Hospital Gazette. 1999;17:16.
110 Suttajit S, et al.
3. Holbrook AM, Crowther R, Lotter A,
Cheng C, King D. Meta-analysis of benzodi-
azepine use in the treatment of insomnia. Cmaj.
2000;162:225-33.
4. Salzman C. The APA Task Force report on
benzodiazepine dependence, toxicity, and
abuse. Am J Psychiatry. 1991;148:151-2.
5. Stewart SH, Westra HA. Benzodiazepine
side effects: from the bench to the clinic. Curr
Pharm Des. 2002;8:1-3.
6. Wang PS, Bohn RL, Glynn RJ, Mogun H,
Avorn J. Hazardous benzodiazepine regimens
in the elderly: effects of half-life, dosage, and
duration on risk of hip fracture. Am J Psychia-
try. 2001;158:892-8.
7. Walsh JK, Engelhardt CL. Trends in the
pharmacologic treatment of insomnia. J Clin
Psychiatry. 1992;53 (Suppl:10-7);discussion 18.
8. Ashton H. The diagnosis and management
of benzodiazepine dependence. Curr Opin
Psychiatry. 2005;18:249-55.
9. Lader MH. Limitations on the use of
benzodiazepines in anxiety and insomnia: are
they justified? Eur Neuropsychopharmacol.
1999;9 (Suppl 6):S399-405.
10. Srisurapanont M, Garner P, Critchley J,
Wongpakaran N. Benzodiazepine prescribing
behaviour and attitudes: a survey among gen-
eral practitioners practicing in northern Thai-
land. BMC Fam Pract. 2005;6:27.
11. Shader RI, Greenblatt DJ. Use of benzodi-
azepines in anxiety disorders. N Engl J Med.
1993;328:1398-405.
12. Walsh JK. Pharmacologic management of
insomnia. J Clin Psychiatry. 2004;65 (Suppl
16):41-5.
13. de las Cuevas C, Sanz E, de la Fuente J.
Benzodiazepines: more "behavioural" addiction
than dependence. Psychopharmacology (Berl).
2003;67:297-303.
14. Uhlenhuth EH, DeWit H, Balter MB,
Johanson CE, Mellinger GD. Risks and benefits
of long-term benzodiazepine use. J Clin Psy-
chopharmacol. 1988;8:161-7.
15. Erman MK. Therapeutic options in the
treatment of insomnia. J Clin Psychiatry.
2005;66 (Suppl 9):18-23.
16. Wagner J, Wagner ML. Non-
benzodiazepines for the treatment of insomnia.
Sleep Med Rev. 2000;4:551-81.
17. Nilchaikovit T, Lotrakul M, Phisansuthi-
deth U. Development of Thai version of Hospi-
tal Anxiety and Depression Scale in cancer
patients. J Psychiatr Assoc Thailand. 1996;41:
13.
18. de las Cuevas C, Sanz EJ, de la Fuente JA,
Padilla J, Berenguer JC. The Severity of De-
pendence Scale (SDS) as screening test for
benzodiazepine dependence: SDS validation
study. Addiction. 2000;95:245-50.
19. Batty GM, Oborne CA, Swift CG, Jackson
SHD. Development of an indicator to identify
inappropriate use of benzodiazepines in elderly
medical in-patients. Int J Geriatr Psychiatry.
2000;15:892-6.
20. Geiselmann B, Linden M, Sachs-Ericsson
N. Benzodiazepine prescriptions and therapist
non-compliance. Eur Arch Psychiatry Neurol
Sci. 1989;239:180-7.
21. Mant A, Duncan-Jones P, Saltman D,
Bridges-Webb C, Kehoe L, Lansbury G et al.
Development of long term use of psychotropic
drugs by general practice patients. Br Med J
(Clin Res Ed). 1988;296:251-4.
22. Fleischhacker WW, Barnas C, Hackenberg
B. Epidemiology of benzodiazepine depend-
ence. Acta Psychiatr Scand. 1986;74:80-3.
23. Busto UE, Ruiz I, Busto M, Gacitúa A.
Benzodiazepine use in Chile: impact of avail-
ability on use, abuse, and dependence. J Clin
Psychopharmacol. 1996;16:363-72.
24. Kan CC, Breteler MH, Zitman FG. High
prevalence of benzodiazepine dependence in
out-patient users, based on the DSM-III-R and
ICD-10 criteria. Acta Psychiatr Scand.
1997;96 :85-93.
25. Naja WJ, Pelissolo A, Haddad RS, Bad-
doura R, Baddoura C. A general population
survey on patterns of benzodiazepine use and
dependence in Lebanon. Acta Psychiatr Scand.
2000;102:429-31.
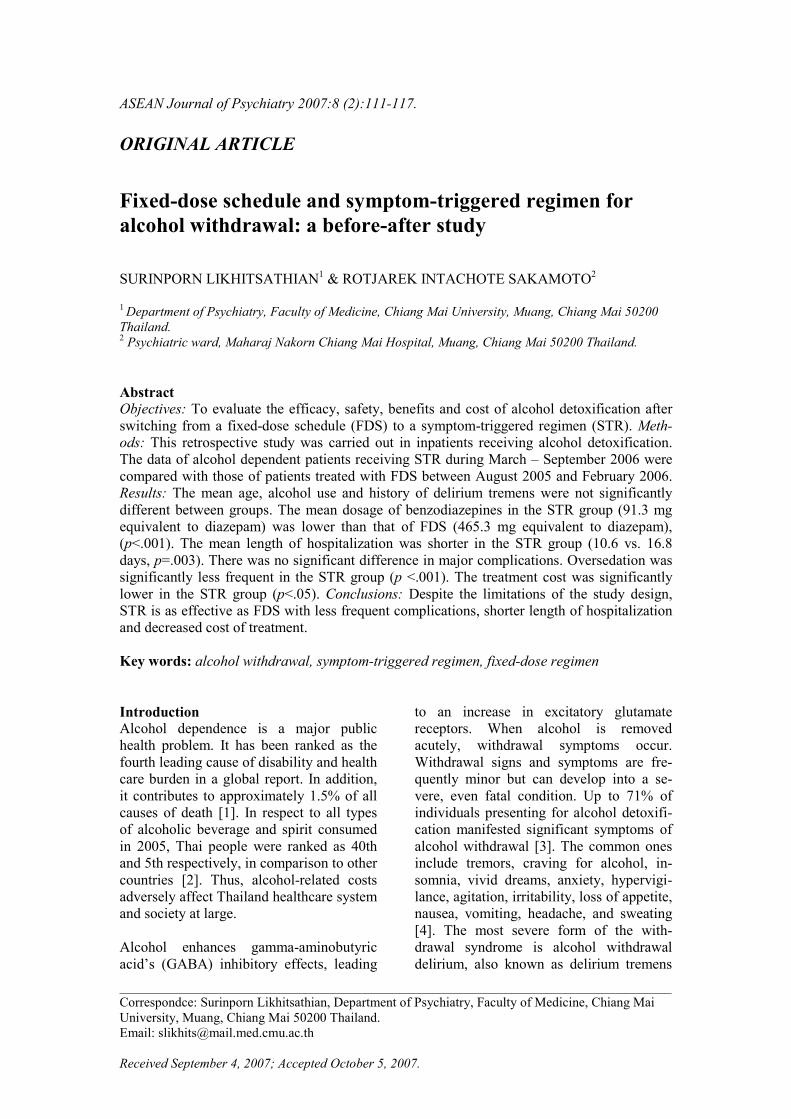
ASEAN Journal of Psychiatry 2007:8 (2):111-117.
___________________________________________________________________________________
Correspondce: Surinporn Likhitsathian, Department of Psychiatry, Faculty of Medicine, Chiang Mai
University, Muang, Chiang Mai 50200 Thailand.
Email: [email protected]
Received September 4, 2007; Accepted October 5, 2007.
ORIGINAL ARTICLE
Fixed-dose schedule and symptom-triggered regimen for
alcohol withdrawal: a before-after study
SURINPORN LIKHITSATHIAN1 & ROTJAREK INTACHOTE SAKAMOTO
2
1 Department of Psychiatry, Faculty of Medicine, Chiang Mai University, Muang, Chiang Mai 50200
Thailand. 2 Psychiatric ward, Maharaj Nakorn Chiang Mai Hospital, Muang, Chiang Mai 50200 Thailand.
Abstract Objectives: To evaluate the efficacy, safety, benefits and cost of alcohol detoxification after
switching from a fixed-dose schedule (FDS) to a symptom-triggered regimen (STR). Meth-
ods: This retrospective study was carried out in inpatients receiving alcohol detoxification.
The data of alcohol dependent patients receiving STR during March – September 2006 were
compared with those of patients treated with FDS between August 2005 and February 2006.
Results: The mean age, alcohol use and history of delirium tremens were not significantly
different between groups. The mean dosage of benzodiazepines in the STR group (91.3 mg
equivalent to diazepam) was lower than that of FDS (465.3 mg equivalent to diazepam),
(p<.001). The mean length of hospitalization was shorter in the STR group (10.6 vs. 16.8
days, p=.003). There was no significant difference in major complications. Oversedation was
significantly less frequent in the STR group (p <.001). The treatment cost was significantly
lower in the STR group (p<.05). Conclusions: Despite the limitations of the study design,
STR is as effective as FDS with less frequent complications, shorter length of hospitalization
and decreased cost of treatment.
Key words: alcohol withdrawal, symptom-triggered regimen, fixed-dose regimen
Introduction Alcohol dependence is a major public
health problem. It has been ranked as the
fourth leading cause of disability and health
care burden in a global report. In addition,
it contributes to approximately 1.5% of all
causes of death [1]. In respect to all types
of alcoholic beverage and spirit consumed
in 2005, Thai people were ranked as 40th
and 5th respectively, in comparison to other
countries [2]. Thus, alcohol-related costs
adversely affect Thailand healthcare system
and society at large.
Alcohol enhances gamma-aminobutyric
acid’s (GABA) inhibitory effects, leading
to an increase in excitatory glutamate
receptors. When alcohol is removed
acutely, withdrawal symptoms occur.
Withdrawal signs and symptoms are fre-
quently minor but can develop into a se-
vere, even fatal condition. Up to 71% of
individuals presenting for alcohol detoxifi-
cation manifested significant symptoms of
alcohol withdrawal [3]. The common ones
include tremors, craving for alcohol, in-
somnia, vivid dreams, anxiety, hypervigi-
lance, agitation, irritability, loss of appetite,
nausea, vomiting, headache, and sweating
[4]. The most severe form of the with-
drawal syndrome is alcohol withdrawal
delirium, also known as delirium tremens
112 Likhitsathian S, et al.
(DTs). Untreated DTs has a 20% mortality
rate [5]. The best treatment for DTs is
prevention. Therefore, the patients with
recognized alcohol withdrawal symptoms
should be carefully monitored to prevent
the development of alcohol withdrawal
delirium [5]. Detoxification is the first step
towards the treatment of alcohol dependent
persons. Some patients, especially those
with a history of alcohol withdrawal sei-
zure or delirium, are likely to be admitted
for inpatient detoxification.
In Maharaj Nakorn Chiang Mai Hospital,
the number of inpatients receiving alcohol
detoxification has increased enormously
since 2004. In the psychiatric ward, the
fixed-dose schedule (FDS) of benzodi-
azepines had been used prior to the imple-
mentation of symptom-triggered regimen
(STR) of benzodiazepines in early 2006.
Although FDS has been considered as a
standard treatment for individuals with-
drawing from alcohol, during 2004-2005,
56% of alcohol dependent inpatients re-
ceiving FDS at the psychiatric ward devel-
oped delirium within the first week of
treatment. Not uncommon, patients receiv-
ing medication more than necessary results
in drug-induced delirium, prolonged dura-
tion of treatment, and wastefulness of
personnel [6]. Recent recommendations for
treating alcohol withdrawal syndrome
suggest a symptom-triggered approach
based on frequent objective assessment of
the patient [7,8].
STR, a personal adaptation of medication
dosage, uses questionnaires that evaluate
the occurrence and intensity of alcohol
withdrawal. Instruments such as the revised
Clinical Institute Withdrawal Assessment
for Alcohol scale (CIWA-Ar) [9] and
Alcohol Withdrawal Scale (AWS) [10]
have been used. There are many studies
determining the use of STR together with
those objective scales. STR has been re-
ported more effective than FDS by shorten-
ing the duration of hospitalization and
benzodiazepine treatment [12-14]. Reoux
and Miller [15] also demonstrated the
decrease of hospitalization and benzodi-
azepine treatment by using STR in alcohol
withdrawal patients in a general hospital.
Rate of complication, including DTs,
occurred less frequently in the symptom-
triggered approach compared with the
fixed-dose approach [8,16].
As mentioned above, the symptom-
triggered regimen of benzodiazepines was
proved to help reduced complications
during the treatment of alcohol withdrawal.
To our knowledge, there has been a little
evidence in the application of this regimen
in less developed countries, especially with
respect to treatment cost. The purpose of
this study was to compare the treatment
efficacy, safety, benefits and cost of STR
modified by our patient care team and the
usual care (the FDS) in alcohol withdrawal
patients. Our STR called Assessing and
Benzodiazepine Dosing Regimen for
Alcohol Withdrawal (ABDRAW) [See
Appendix] was modified from an Austra-
lian Guideline [11].
Methods
Subjects
We retrospectively identified psychiatric
inpatients receiving alcohol detoxification
at our psychiatric ward between 1st August
2005 and 30th September 2006. The study
was approved by the Ethics Committee for
Research, Faculty of Medicine, Chiang Mai
University.
The inclusion criteria were: i) aged of 20
years old or older, ii) meeting the DSM-IV-
TR diagnostic criteria for alcohol depend-
ence and iii) alcohol abstinence no longer
than 7 days. Patients who initially pre-
sented with alcohol withdrawal delirium
were excluded.
Identified patients were divided into two
groups. The first one is the pre-
implementation group (Aug. 2005 - Feb.
2006), who were treated with FDS. Patients
in group two (Mar. - Sep. 2006) were
Symptom-triggered regimen for alcohol withdrawal 113
treated by the use of ABDRAW in which
the Alcohol Withdrawal Scale [10] was
used as a guide for benzodiazepine dosing.
Assessment
Age at admission, sex, alcohol use history,
medical and psychiatric comorbidities and
history of previous alcohol withdrawal
complications were collected from the
medical records of eligible patients. Out-
comes of treatment were determined by the
total benzodiazepine dosage equivalent to
diazepam (in milligrams); current compli-
cation of alcohol withdrawal including
seizure, delirium, oversedation; length of
hospital stay; and cost of treatment.
Interventions
For FDS, the medical staff gave flexible
doses of benzodiazepines at the best judge-
ments. By applying the ABDRAW, physi-
cians evaluated the severity of alcohol
withdrawal symptoms, and the nurse fol-
lowed through the protocol instructions.
Benzodiazepine doses were guided by the
AWS scores of the patient. If the patient
had an AWS score of 5 or higher, he would
receive the starting dose of diazepam,
which was 5-10 mg (or 1-2 mg of loraze-
pam). One hour after taking each dosage,
withdrawal symptoms were reevaluated,
and additional benzodiazepines were ad-
ministered as long as the AWS scores
remained at 5 or higher. The monitoring of
alcohol withdrawal severity was discontin-
ued if the AWS scores were lower than 5
for 72 consecutive hours.
Statistical analysis
Descriptive analysis was used for alcohol
use history and patients’ characteristics. To
evaluate the effect of treatment, mean
differences were assessed by the use of
student (unpaired) t-test, and Fisher’s Exact
test was used to compare categorical vari-
ables. Two-tailed, p-values less than .05
were considered as statistical significances.
Results
Characteristic of subjects
Forty-one consecutive patients were admit-
ted into psychiatric ward for alcohol de-
toxification between August 2005 and
September 2006. All subjects were men
who had alcoholic beverages within 7 days
prior to admission. Four of twenty (20.0%)
patients receiving FDS and 3 of 21 (14.3%)
patients given STR were excluded due to
delirium upon admission. The numbers of
subjects included in this analysis were 16
for the FDS group and 18 for the STR
group.
There was no significant difference be-
tween groups with respect to age, marital
status, and employment (see Table 1). In
addition, alcohol consumption, duration of
alcohol use and time since last drink and
medical and psychiatric comorbidities were
also similar. Previous episodes of alcohol
withdrawal delirium were documented in 5
patients of the STR group (27.8%) but none
in the FDS group (p=.18).
Benzodiazepine treatment
The total amount of benzodiazepines
equivalent to diazepam were calculated.
The STR group received a significantly
smaller amount of benzodiazepines than the
FDS group (91.31±107.09 mg vs. 465.34±
249.70 mg, p<.001) (see Table2). Duration
of benzodiazepine treatment was also
significantly shorter for the STR group.
Complications and adverse events
The incidence rates of oversedation and
seclusion/restraint were significantly less
frequent in the STR group (0 vs. 9 for
oversedation, p<.001; 3 vs. 9 for seclu-
sion/restraint, p=.03). Delirium was found
in 2 and 4 patients receiving STR and FDS,
respectively (p=.39). The occurrences of
other complications and adverse events,
including, seizure, aggressive behavior and
falling, were not significantly different (see
Table 2).
Length of stay and cost of treatment
Compared to the FDS group, the STR
group had significantly shorter hospitaliza-
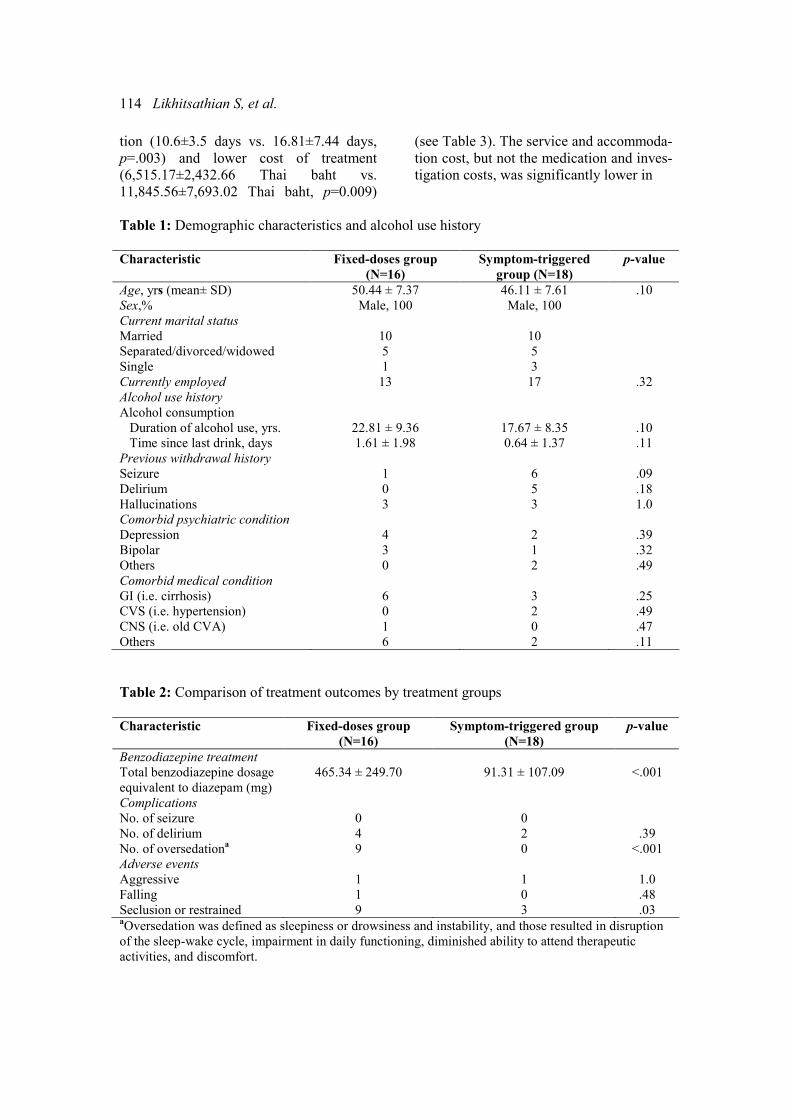
114 Likhitsathian S, et al.
tion (10.6±3.5 days vs. 16.81±7.44 days,
p=.003) and lower cost of treatment
(6,515.17±2,432.66 Thai baht vs.
11,845.56±7,693.02 Thai baht, p=0.009)
(see Table 3). The service and accommoda-
tion cost, but not the medication and inves-
tigation costs, was significantly lower in
Table 1: Demographic characteristics and alcohol use history
Characteristic Fixed-doses group
(N=16)
Symptom-triggered
group (N=18)
p-value
Age, yrs (mean± SD) 50.44 ± 7.37 46.11 ± 7.61 .10
Sex,% Male, 100 Male, 100
Current marital status
Married
Separated/divorced/widowed
Single
10
5
1
10
5
3
Currently employed 13 17 .32
Alcohol use history
Alcohol consumption
Duration of alcohol use, yrs.
Time since last drink, days
22.81 ± 9.36
1.61 ± 1.98
17.67 ± 8.35
0.64 ± 1.37
.10
.11
Previous withdrawal history
Seizure
Delirium
Hallucinations
1
0
3
6
5
3
.09
.18
1.0
Comorbid psychiatric condition
Depression
Bipolar
Others
4
3
0
2
1
2
.39
.32
.49
Comorbid medical condition
GI (i.e. cirrhosis)
CVS (i.e. hypertension)
CNS (i.e. old CVA)
Others
6
0
1
6
3
2
0
2
.25
.49
.47
.11
Table 2: Comparison of treatment outcomes by treatment groups
Characteristic Fixed-doses group
(N=16)
Symptom-triggered group
(N=18)
p-value
Benzodiazepine treatment
Total benzodiazepine dosage
equivalent to diazepam (mg)
465.34 ± 249.70
91.31 ± 107.09
<.001
Complications
No. of seizure
No. of delirium
No. of oversedationa
0
4
9
0
2
0
.39
<.001
Adverse events
Aggressive
Falling
Seclusion or restrained
1
1
9
1
0
3
1.0
.48
.03 aOversedation was defined as sleepiness or drowsiness and instability, and those resulted in disruption
of the sleep-wake cycle, impairment in daily functioning, diminished ability to attend therapeutic
activities, and discomfort.
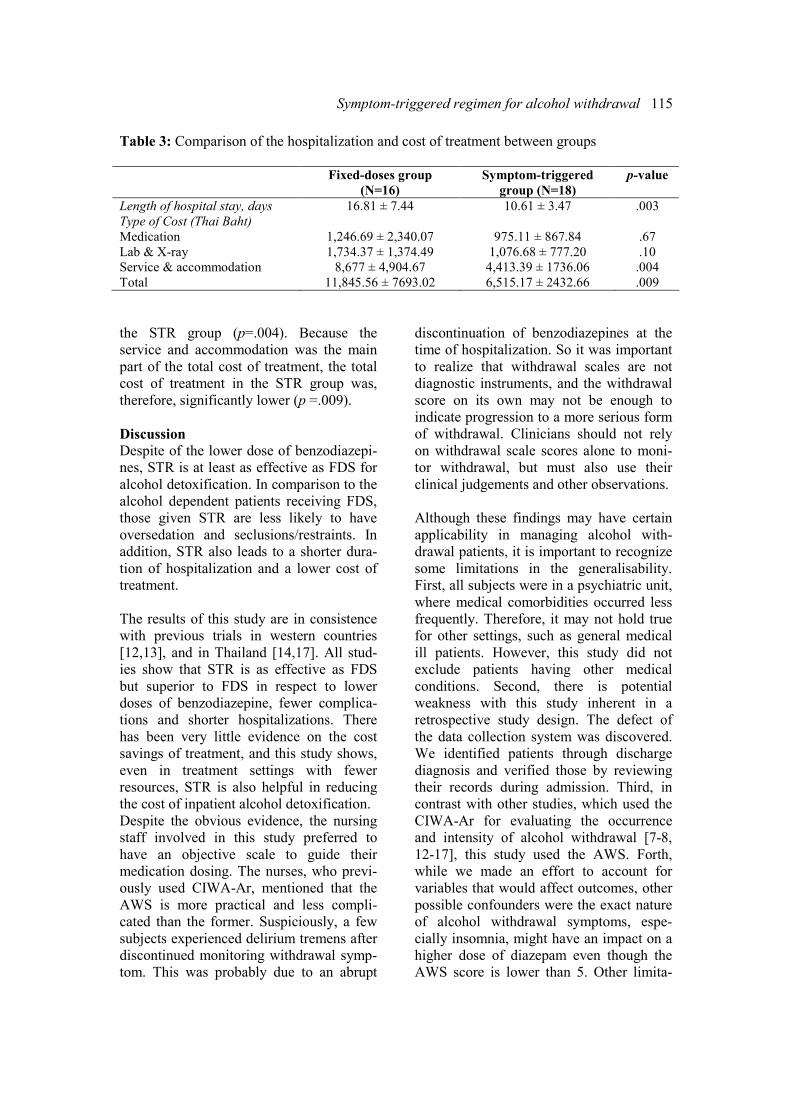
Symptom-triggered regimen for alcohol withdrawal 115
Table 3: Comparison of the hospitalization and cost of treatment between groups
Fixed-doses group
(N=16)
Symptom-triggered
group (N=18)
p-value
Length of hospital stay, days 16.81 ± 7.44 10.61 ± 3.47 .003
Type of Cost (Thai Baht)
Medication
Lab & X-ray
Service & accommodation
Total
1,246.69 ± 2,340.07
1,734.37 ± 1,374.49
8,677 ± 4,904.67
11,845.56 ± 7693.02
975.11 ± 867.84
1,076.68 ± 777.20
4,413.39 ± 1736.06
6,515.17 ± 2432.66
.67
.10
.004
.009
the STR group (p=.004). Because the
service and accommodation was the main
part of the total cost of treatment, the total
cost of treatment in the STR group was,
therefore, significantly lower (p =.009).
Discussion
Despite of the lower dose of benzodiazepi-
nes, STR is at least as effective as FDS for
alcohol detoxification. In comparison to the
alcohol dependent patients receiving FDS,
those given STR are less likely to have
oversedation and seclusions/restraints. In
addition, STR also leads to a shorter dura-
tion of hospitalization and a lower cost of
treatment.
The results of this study are in consistence
with previous trials in western countries
[12,13], and in Thailand [14,17]. All stud-
ies show that STR is as effective as FDS
but superior to FDS in respect to lower
doses of benzodiazepine, fewer complica-
tions and shorter hospitalizations. There
has been very little evidence on the cost
savings of treatment, and this study shows,
even in treatment settings with fewer
resources, STR is also helpful in reducing
the cost of inpatient alcohol detoxification.
Despite the obvious evidence, the nursing
staff involved in this study preferred to
have an objective scale to guide their
medication dosing. The nurses, who previ-
ously used CIWA-Ar, mentioned that the
AWS is more practical and less compli-
cated than the former. Suspiciously, a few
subjects experienced delirium tremens after
discontinued monitoring withdrawal symp-
tom. This was probably due to an abrupt
discontinuation of benzodiazepines at the
time of hospitalization. So it was important
to realize that withdrawal scales are not
diagnostic instruments, and the withdrawal
score on its own may not be enough to
indicate progression to a more serious form
of withdrawal. Clinicians should not rely
on withdrawal scale scores alone to moni-
tor withdrawal, but must also use their
clinical judgements and other observations.
Although these findings may have certain
applicability in managing alcohol with-
drawal patients, it is important to recognize
some limitations in the generalisability.
First, all subjects were in a psychiatric unit,
where medical comorbidities occurred less
frequently. Therefore, it may not hold true
for other settings, such as general medical
ill patients. However, this study did not
exclude patients having other medical
conditions. Second, there is potential
weakness with this study inherent in a
retrospective study design. The defect of
the data collection system was discovered.
We identified patients through discharge
diagnosis and verified those by reviewing
their records during admission. Third, in
contrast with other studies, which used the
CIWA-Ar for evaluating the occurrence
and intensity of alcohol withdrawal [7-8,
12-17], this study used the AWS. Forth,
while we made an effort to account for
variables that would affect outcomes, other
possible confounders were the exact nature
of alcohol withdrawal symptoms, espe-
cially insomnia, might have an impact on a
higher dose of diazepam even though the
AWS score is lower than 5. Other limita-
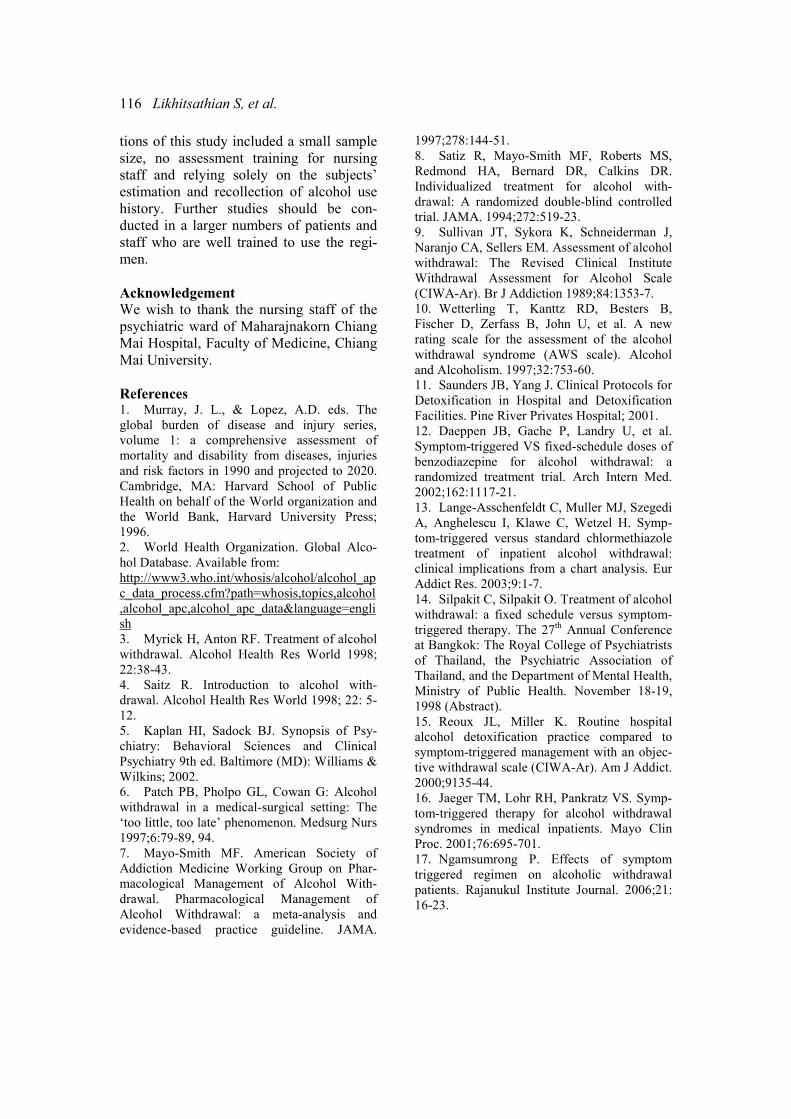
116 Likhitsathian S, et al.
tions of this study included a small sample
size, no assessment training for nursing
staff and relying solely on the subjects’
estimation and recollection of alcohol use
history. Further studies should be con-
ducted in a larger numbers of patients and
staff who are well trained to use the regi-
men.
Acknowledgement
We wish to thank the nursing staff of the
psychiatric ward of Maharajnakorn Chiang
Mai Hospital, Faculty of Medicine, Chiang
Mai University.
References 1. Murray, J. L., & Lopez, A.D. eds. The
global burden of disease and injury series,
volume 1: a comprehensive assessment of
mortality and disability from diseases, injuries
and risk factors in 1990 and projected to 2020.
Cambridge, MA: Harvard School of Public
Health on behalf of the World organization and
the World Bank, Harvard University Press;
1996.
2. World Health Organization. Global Alco-
hol Database. Available from:
http://www3.who.int/whosis/alcohol/alcohol_ap
c_data_process.cfm?path=whosis,topics,alcohol
,alcohol_apc,alcohol_apc_data&language=engli
sh
3. Myrick H, Anton RF. Treatment of alcohol
withdrawal. Alcohol Health Res World 1998;
22:38-43.
4. Saitz R. Introduction to alcohol with-
drawal. Alcohol Health Res World 1998; 22: 5-
12.
5. Kaplan HI, Sadock BJ. Synopsis of Psy-
chiatry: Behavioral Sciences and Clinical
Psychiatry 9th ed. Baltimore (MD): Williams &
Wilkins; 2002.
6. Patch PB, Pholpo GL, Cowan G: Alcohol
withdrawal in a medical-surgical setting: The
‘too little, too late’ phenomenon. Medsurg Nurs
1997;6:79-89, 94.
7. Mayo-Smith MF. American Society of
Addiction Medicine Working Group on Phar-
macological Management of Alcohol With-
drawal. Pharmacological Management of
Alcohol Withdrawal: a meta-analysis and
evidence-based practice guideline. JAMA.
1997;278:144-51.
8. Satiz R, Mayo-Smith MF, Roberts MS,
Redmond HA, Bernard DR, Calkins DR.
Individualized treatment for alcohol with-
drawal: A randomized double-blind controlled
trial. JAMA. 1994;272:519-23.
9. Sullivan JT, Sykora K, Schneiderman J,
Naranjo CA, Sellers EM. Assessment of alcohol
withdrawal: The Revised Clinical Institute
Withdrawal Assessment for Alcohol Scale
(CIWA-Ar). Br J Addiction 1989;84:1353-7.
10. Wetterling T, Kanttz RD, Besters B,
Fischer D, Zerfass B, John U, et al. A new
rating scale for the assessment of the alcohol
withdrawal syndrome (AWS scale). Alcohol
and Alcoholism. 1997;32:753-60.
11. Saunders JB, Yang J. Clinical Protocols for
Detoxification in Hospital and Detoxification
Facilities. Pine River Privates Hospital; 2001.
12. Daeppen JB, Gache P, Landry U, et al.
Symptom-triggered VS fixed-schedule doses of
benzodiazepine for alcohol withdrawal: a
randomized treatment trial. Arch Intern Med.
2002;162:1117-21.
13. Lange-Asschenfeldt C, Muller MJ, Szegedi
A, Anghelescu I, Klawe C, Wetzel H. Symp-
tom-triggered versus standard chlormethiazole
treatment of inpatient alcohol withdrawal:
clinical implications from a chart analysis. Eur
Addict Res. 2003;9:1-7.
14. Silpakit C, Silpakit O. Treatment of alcohol
withdrawal: a fixed schedule versus symptom-
triggered therapy. The 27th Annual Conference
at Bangkok: The Royal College of Psychiatrists
of Thailand, the Psychiatric Association of
Thailand, and the Department of Mental Health,
Ministry of Public Health. November 18-19,
1998 (Abstract).
15. Reoux JL, Miller K. Routine hospital
alcohol detoxification practice compared to
symptom-triggered management with an objec-
tive withdrawal scale (CIWA-Ar). Am J Addict.
2000;9135-44.
16. Jaeger TM, Lohr RH, Pankratz VS. Symp-
tom-triggered therapy for alcohol withdrawal
syndromes in medical inpatients. Mayo Clin
Proc. 2001;76:695-701.
17. Ngamsumrong P. Effects of symptom
triggered regimen on alcoholic withdrawal
patients. Rajanukul Institute Journal. 2006;21:
16-23.
Symptom-triggered regimen for alcohol withdrawal 117
Appendix Assessing and Benzodiazepine Dosing Regimen for Alcohol Withdrawal (ABDRAW)
*DZP= Diazepam
Note
• Physician’s decision is also based on other conditions of the patients and resources available at the
point of time.
• Physician should start at � if the patient has a AWS score less than 5 but has a history of alcohol
withdrawal seizure or delirium
• Physician should administer lorazepam 1 mg equivalent to Diazepam 5 mg for elderly patients and
those who have severe hepatic diseases.
• Physician has to reevaluates the patient’s condition and the dosing regimen every 24-48 hrs.
• Nurse has to notify physician if
• The patient is in stuporous condition.
• The patient has a respiratory rate of 14/minute or less
• The patient received a total dosage of 80 mg diazepam (or equivalent) or more within 8 hrs
• The patient has severe withdrawal (AWS score of 15 or more) or delirium for 4 consecutive
hours
• The patient has moderate to severe withdrawal (AWS score of 10-14) for 6 consecutive hours
Modified from:
1. John B. Saunders, Clinical Protocols for Detoxification in Hospital and Detoxification Facilities.
(2002)
2. Mayo-Smith MF. American Society of Addiction Medicine Working Group on Pharmacological Man-
agement of Alcohol Withdrawal. Pharmacological Management of Alcohol Withdrawal: a meta-analysis
and evidence-based practice guideline. JAMA. 1997;278:144-151.
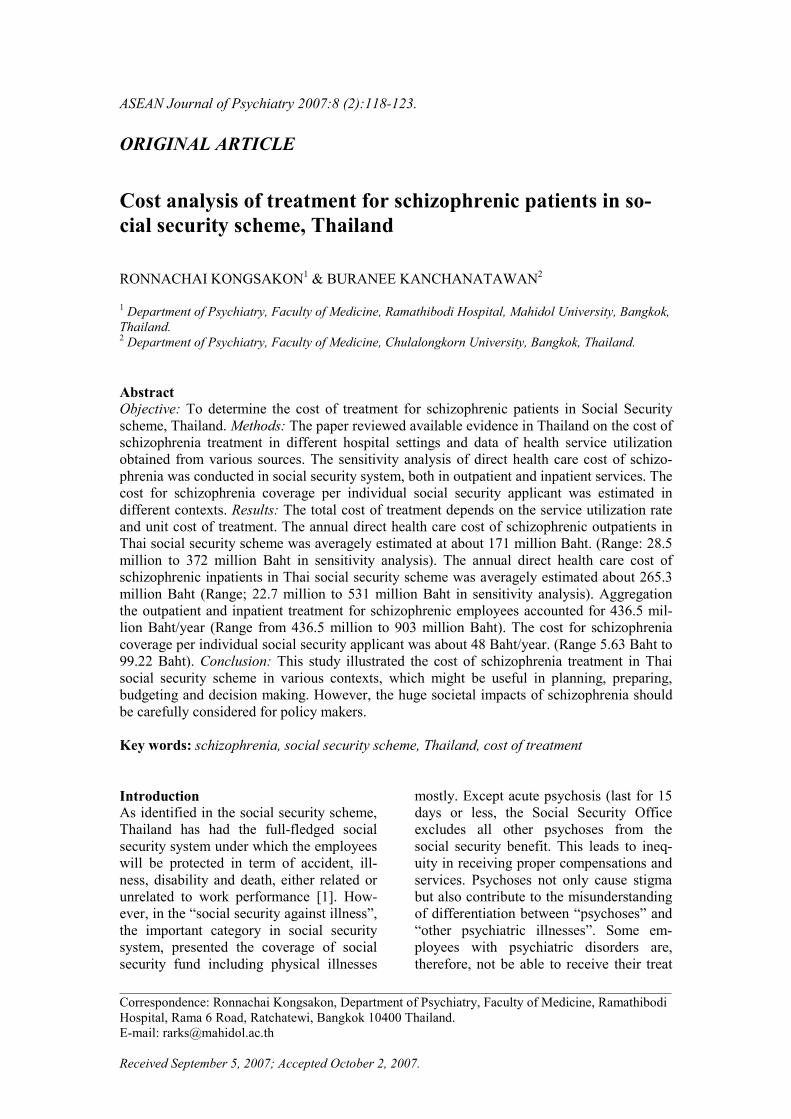
ASEAN Journal of Psychiatry 2007:8 (2):118-123.
___________________________________________________________________________________
Correspondence: Ronnachai Kongsakon, Department of Psychiatry, Faculty of Medicine, Ramathibodi
Hospital, Rama 6 Road, Ratchatewi, Bangkok 10400 Thailand.
E-mail: [email protected]
Received September 5, 2007; Accepted October 2, 2007.
ORIGINAL ARTICLE
Cost analysis of treatment for schizophrenic patients in so-
cial security scheme, Thailand
RONNACHAI KONGSAKON1 & BURANEE KANCHANATAWAN
2
1 Department of Psychiatry, Faculty of Medicine, Ramathibodi Hospital, Mahidol University, Bangkok,
Thailand. 2 Department of Psychiatry, Faculty of Medicine, Chulalongkorn University, Bangkok, Thailand.
Abstract
Objective: To determine the cost of treatment for schizophrenic patients in Social Security
scheme, Thailand. Methods: The paper reviewed available evidence in Thailand on the cost of
schizophrenia treatment in different hospital settings and data of health service utilization
obtained from various sources. The sensitivity analysis of direct health care cost of schizo-
phrenia was conducted in social security system, both in outpatient and inpatient services. The
cost for schizophrenia coverage per individual social security applicant was estimated in
different contexts. Results: The total cost of treatment depends on the service utilization rate
and unit cost of treatment. The annual direct health care cost of schizophrenic outpatients in
Thai social security scheme was averagely estimated at about 171 million Baht. (Range: 28.5
million to 372 million Baht in sensitivity analysis). The annual direct health care cost of
schizophrenic inpatients in Thai social security scheme was averagely estimated about 265.3
million Baht (Range; 22.7 million to 531 million Baht in sensitivity analysis). Aggregation
the outpatient and inpatient treatment for schizophrenic employees accounted for 436.5 mil-
lion Baht/year (Range from 436.5 million to 903 million Baht). The cost for schizophrenia
coverage per individual social security applicant was about 48 Baht/year. (Range 5.63 Baht to
99.22 Baht). Conclusion: This study illustrated the cost of schizophrenia treatment in Thai
social security scheme in various contexts, which might be useful in planning, preparing,
budgeting and decision making. However, the huge societal impacts of schizophrenia should
be carefully considered for policy makers.
Key words: schizophrenia, social security scheme, Thailand, cost of treatment
Introduction
As identified in the social security scheme,
Thailand has had the full-fledged social
security system under which the employees
will be protected in term of accident, ill-
ness, disability and death, either related or
unrelated to work performance [1]. How-
ever, in the “social security against illness”,
the important category in social security
system, presented the coverage of social
security fund including physical illnesses
mostly. Except acute psychosis (last for 15
days or less, the Social Security Office
excludes all other psychoses from the
social security benefit. This leads to ineq-
uity in receiving proper compensations and
services. Psychoses not only cause stigma
but also contribute to the misunderstanding
of differentiation between “psychoses” and
“other psychiatric illnesses”. Some em-
ployees with psychiatric disorders are,
therefore, not be able to receive their treat
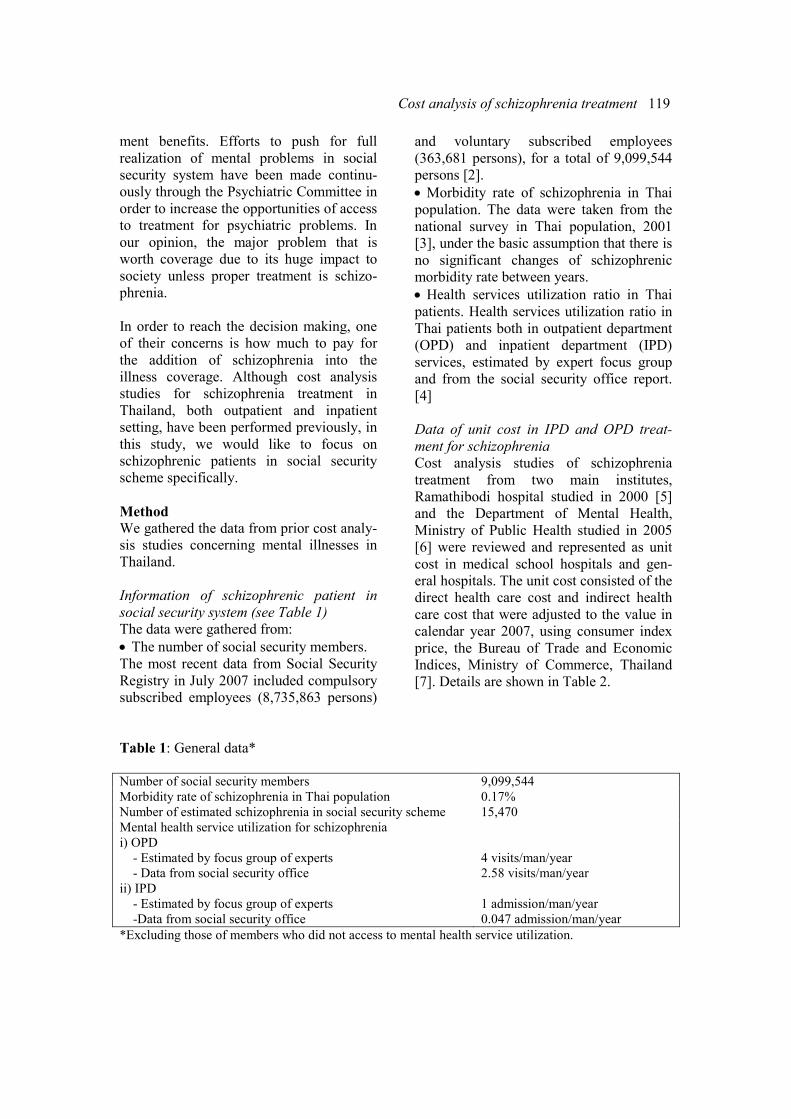
Cost analysis of schizophrenia treatment 119
ment benefits. Efforts to push for full
realization of mental problems in social
security system have been made continu-
ously through the Psychiatric Committee in
order to increase the opportunities of access
to treatment for psychiatric problems. In
our opinion, the major problem that is
worth coverage due to its huge impact to
society unless proper treatment is schizo-
phrenia.
In order to reach the decision making, one
of their concerns is how much to pay for
the addition of schizophrenia into the
illness coverage. Although cost analysis
studies for schizophrenia treatment in
Thailand, both outpatient and inpatient
setting, have been performed previously, in
this study, we would like to focus on
schizophrenic patients in social security
scheme specifically.
Method
We gathered the data from prior cost analy-
sis studies concerning mental illnesses in
Thailand.
Information of schizophrenic patient in
social security system (see Table 1)
The data were gathered from:
• The number of social security members.
The most recent data from Social Security
Registry in July 2007 included compulsory
subscribed employees (8,735,863 persons)
and voluntary subscribed employees
(363,681 persons), for a total of 9,099,544
persons [2].
• Morbidity rate of schizophrenia in Thai
population. The data were taken from the
national survey in Thai population, 2001
[3], under the basic assumption that there is
no significant changes of schizophrenic
morbidity rate between years.
• Health services utilization ratio in Thai
patients. Health services utilization ratio in
Thai patients both in outpatient department
(OPD) and inpatient department (IPD)
services, estimated by expert focus group
and from the social security office report.
[4]
Data of unit cost in IPD and OPD treat-
ment for schizophrenia
Cost analysis studies of schizophrenia
treatment from two main institutes,
Ramathibodi hospital studied in 2000 [5]
and the Department of Mental Health,
Ministry of Public Health studied in 2005
[6] were reviewed and represented as unit
cost in medical school hospitals and gen-
eral hospitals. The unit cost consisted of the
direct health care cost and indirect health
care cost that were adjusted to the value in
calendar year 2007, using consumer index
price, the Bureau of Trade and Economic
Indices, Ministry of Commerce, Thailand
[7]. Details are shown in Table 2.
Table 1: General data*
Number of social security members 9,099,544
Morbidity rate of schizophrenia in Thai population 0.17%
Number of estimated schizophrenia in social security scheme 15,470
Mental health service utilization for schizophrenia
i) OPD
- Estimated by focus group of experts
- Data from social security office
ii) IPD
- Estimated by focus group of experts
-Data from social security office
4 visits/man/year
2.58 visits/man/year
1 admission/man/year
0.047 admission/man/year
*Excluding those of members who did not access to mental health service utilization.
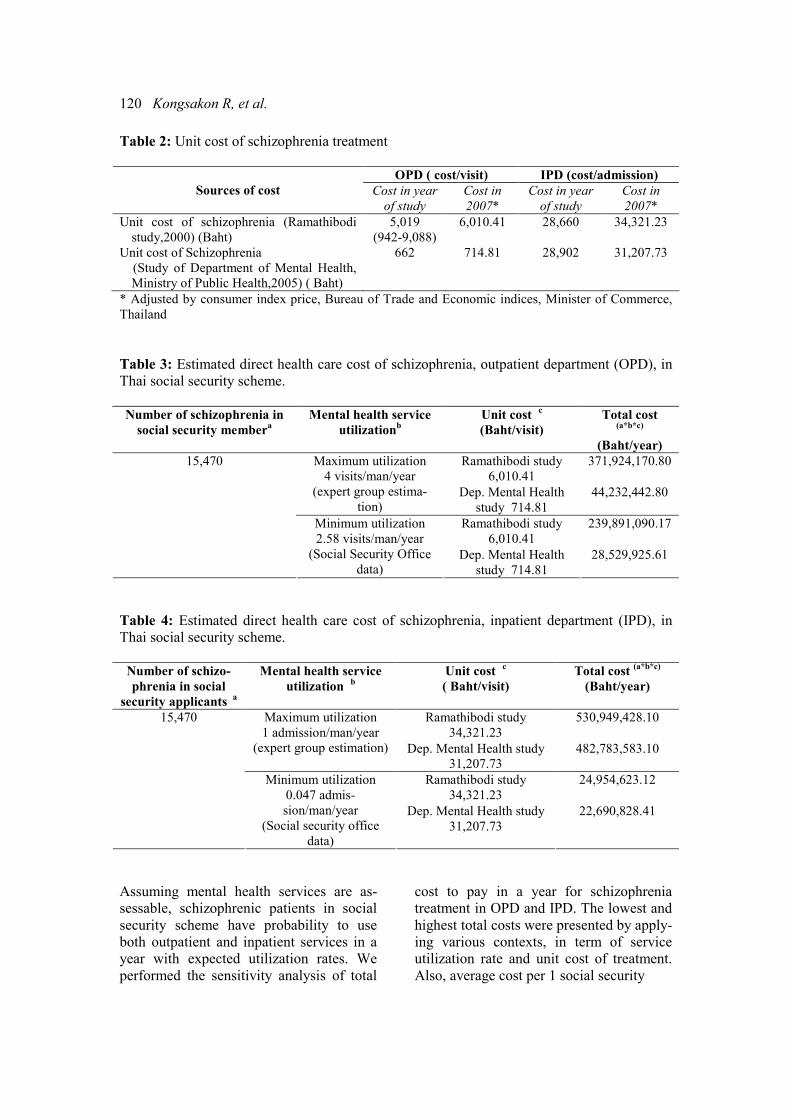
120 Kongsakon R, et al.
Table 2: Unit cost of schizophrenia treatment
OPD ( cost/visit) IPD (cost/admission)
Sources of cost Cost in year
of study
Cost in
2007*
Cost in year
of study
Cost in
2007*
Unit cost of schizophrenia (Ramathibodi
study,2000) (Baht)
5,019
(942-9,088)
6,010.41 28,660 34,321.23
Unit cost of Schizophrenia
(Study of Department of Mental Health,
Ministry of Public Health,2005) ( Baht)
662 714.81 28,902 31,207.73
* Adjusted by consumer index price, Bureau of Trade and Economic indices, Minister of Commerce,
Thailand
Table 3: Estimated direct health care cost of schizophrenia, outpatient department (OPD), in
Thai social security scheme.
Number of schizophrenia in
social security membera
Mental health service
utilizationb
Unit cost c
(Baht/visit)
Total cost (a*b*c)
(Baht/year)
Ramathibodi study
6,010.41
371,924,170.80 Maximum utilization
4 visits/man/year
(expert group estima-
tion) Dep. Mental Health
study 714.81
44,232,442.80
Ramathibodi study
6,010.41
239,891,090.17
15,470
Minimum utilization
2.58 visits/man/year
(Social Security Office
data) Dep. Mental Health
study 714.81
28,529,925.61
Table 4: Estimated direct health care cost of schizophrenia, inpatient department (IPD), in
Thai social security scheme.
Number of schizo-
phrenia in social
security applicants a
Mental health service
utilization b
Unit cost c
( Baht/visit)
Total cost (a*b*c)
(Baht/year)
Ramathibodi study
34,321.23
530,949,428.10 Maximum utilization
1 admission/man/year
(expert group estimation) Dep. Mental Health study
31,207.73
482,783,583.10
Ramathibodi study
34,321.23
24,954,623.12
15,470
Minimum utilization
0.047 admis-
sion/man/year
(Social security office
data)
Dep. Mental Health study
31,207.73
22,690,828.41
Assuming mental health services are as-
sessable, schizophrenic patients in social
security scheme have probability to use
both outpatient and inpatient services in a
year with expected utilization rates. We
performed the sensitivity analysis of total
cost to pay in a year for schizophrenia
treatment in OPD and IPD. The lowest and
highest total costs were presented by apply-
ing various contexts, in term of service
utilization rate and unit cost of treatment.
Also, average cost per 1 social security
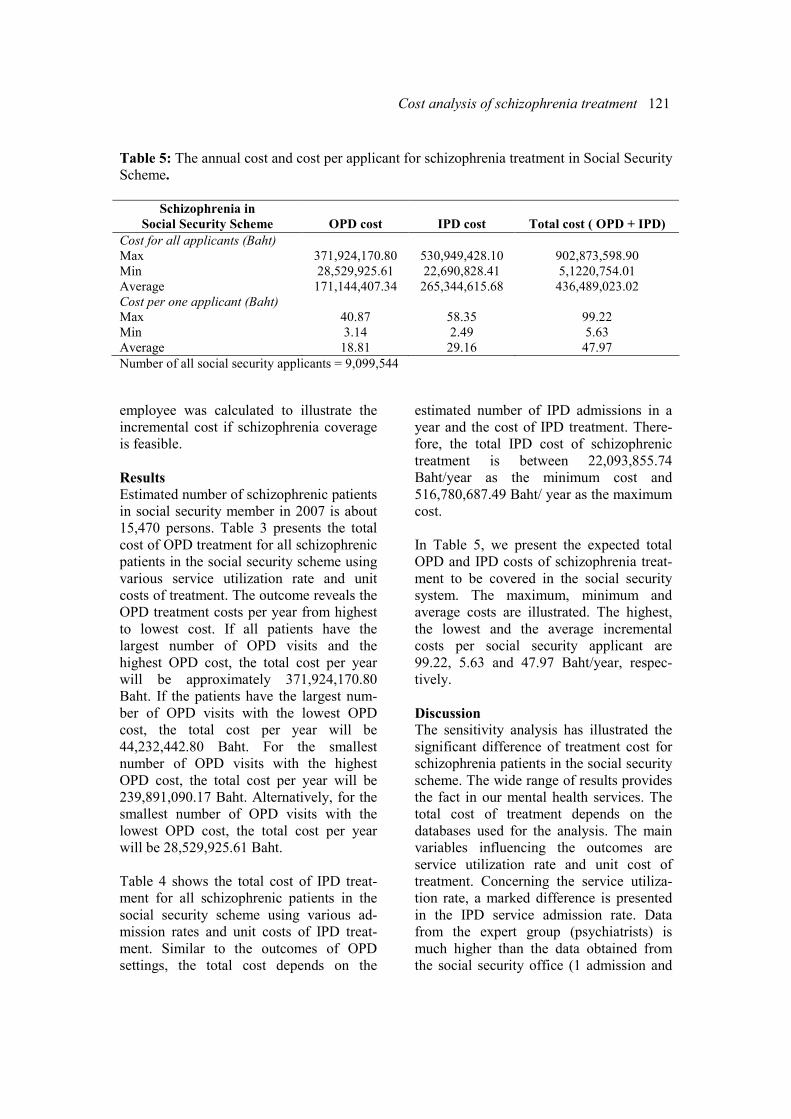
Cost analysis of schizophrenia treatment 121
Table 5: The annual cost and cost per applicant for schizophrenia treatment in Social Security
Scheme.
Schizophrenia in
Social Security Scheme
OPD cost
IPD cost
Total cost ( OPD + IPD)
Cost for all applicants (Baht)
Max 371,924,170.80 530,949,428.10 902,873,598.90
Min 28,529,925.61 22,690,828.41 5,1220,754.01
Average 171,144,407.34 265,344,615.68 436,489,023.02
Cost per one applicant (Baht)
Max 40.87 58.35 99.22
Min 3.14 2.49 5.63
Average 18.81 29.16 47.97
Number of all social security applicants = 9,099,544
employee was calculated to illustrate the
incremental cost if schizophrenia coverage
is feasible.
Results
Estimated number of schizophrenic patients
in social security member in 2007 is about
15,470 persons. Table 3 presents the total
cost of OPD treatment for all schizophrenic
patients in the social security scheme using
various service utilization rate and unit
costs of treatment. The outcome reveals the
OPD treatment costs per year from highest
to lowest cost. If all patients have the
largest number of OPD visits and the
highest OPD cost, the total cost per year
will be approximately 371,924,170.80
Baht. If the patients have the largest num-
ber of OPD visits with the lowest OPD
cost, the total cost per year will be
44,232,442.80 Baht. For the smallest
number of OPD visits with the highest
OPD cost, the total cost per year will be
239,891,090.17 Baht. Alternatively, for the
smallest number of OPD visits with the
lowest OPD cost, the total cost per year
will be 28,529,925.61 Baht.
Table 4 shows the total cost of IPD treat-
ment for all schizophrenic patients in the
social security scheme using various ad-
mission rates and unit costs of IPD treat-
ment. Similar to the outcomes of OPD
settings, the total cost depends on the
estimated number of IPD admissions in a
year and the cost of IPD treatment. There-
fore, the total IPD cost of schizophrenic
treatment is between 22,093,855.74
Baht/year as the minimum cost and
516,780,687.49 Baht/ year as the maximum
cost.
In Table 5, we present the expected total
OPD and IPD costs of schizophrenia treat-
ment to be covered in the social security
system. The maximum, minimum and
average costs are illustrated. The highest,
the lowest and the average incremental
costs per social security applicant are
99.22, 5.63 and 47.97 Baht/year, respec-
tively.
Discussion
The sensitivity analysis has illustrated the
significant difference of treatment cost for
schizophrenia patients in the social security
scheme. The wide range of results provides
the fact in our mental health services. The
total cost of treatment depends on the
databases used for the analysis. The main
variables influencing the outcomes are
service utilization rate and unit cost of
treatment. Concerning the service utiliza-
tion rate, a marked difference is presented
in the IPD service admission rate. Data
from the expert group (psychiatrists) is
much higher than the data obtained from
the social security office (1 admission and
122 Kongsakon R, et al.
0.047 admission a year). Most psychiatrists
in the focus group work in medical schools,
which are tertiary care settings, so it is
possible that most patients are severe cases
that need more frequent admissions than ill
employees, the target group of social
security office.
Accord to the unit cost of IPD and OPD
treatment settings, there are some differ-
ences between two institutes representative
of medical school hospitals and general
hospitals. Much higher labor cost and
medication cost make the unit cost of OPD
service in medical school hospitals mark-
edly different from that in general hospi-
tals. In this study, we use the minimum and
maximum utilization rates and unit costs in
order to perform the sensitivity analysis.
This information may respond to the ques-
tion of addition payment needed to include
schizophrenia in the social security cover-
age. Various contexts in this study may be
useful in planning, preparing and decision
making if application is established in
various conditions.
Some may suspect the benefits of adding
schizophrenia into the social security
coverage because their functional impair-
ment may stigmatize them as the one who
cannot employ or earn at all. Actually,
schizophrenia has a wide range of severity
and prognosis [8]. Some of them can work,
earn and live independently, in particular,
those receiving effective treatment and
being adherent to treatment. Non-adherence
to treatment, either due to the financial
problems or poor compliance, is the most
important factor in determining long term
prognosis and burden to society [9]. Un-
successful treatment of schizophrenic
patient leads to a high hospitalization rate
[10], failure in education, unemployment,
lost earning, disability, suffering, violence,
crime and premature death from suicide
and homicide. These are enormous conse-
quences to our society.
Beyond the health care cost, the economic
consequences to society are categorized
into direct non-health care cost (e.g., in-
formal care cost, criminal cost: prison,
police, justice) and indirect cost (productiv-
ity, lost due to unemployment, patients’ or
carers’ absence from work, premature
mortality) [11]. Many studies in various
countries, such as UK, USA and Canada,
have analyzed the monetary impact of
schizophrenia. The findings in England in
2007 show that the direct cost of treatment
is about 2 billion pounds but the burden of
indirect cost and non health care cost to the
society are huge with the amount of 4.7
billion pounds [12]. In 2002, the overall
cost of schizophrenia in the US was ap-
proximately 62.7 billion US dollars in
which 22.7 billion US dollars exceed the
direct health care cost. The direct non
health care excess cost estimated to be 7.6
billion US dollars, and the indirect excess
costs were estimated to be 32.4 billion US
dollars [13]. The analysis of the economic
burden of Canada in 2004 found the direct
health care cost and non-health care cost of
2.2 billion CAN dollars, the indirect cost
from unemployment and mortality loss of
4.83 billion CAN dollars, which led to the
estimated total cost of 6.85 billion CAN
dollars [14]. These data show that the
largest component of the total cost (about
70%) is the productivity losses associated
with schizophrenia.
Not only schizophrenia, but other mental
illnesses also provide a similar pattern that
that the indirect cost is higher than the
direct health care cost [15-17]. Indirect cost
and direct non-health care cost would
increase if the treatment is not effective.
Even the large part of direct health care
cost (hospital cost or IPD cost) would also
increase in treatment failure. [18,19] There-
fore, in societal view of economic evalua-
tion, we can conclude that non-treatment
(or ineffective treatment) option is more
costly than the effective treatment. The
most effective way to reduce the overall
Cost analysis of schizophrenia treatment 123
societal cost is to develop effective and
well accepted treatment [20].
In conclusions, these several lines of evi-
dence support the idea of including schizo-
phrenia into the social security coverage in
order to prevent societal impacts and to
reduce the large amount of indirect cost. At
present, schizophrenic employees receiving
no benefit from the social security fund
have a higher risk for nonadherence to
treatment. They are also at risk to be
chronic schizophrenia with poor prognosis
and being a big burden to society unless
receiving health supports. Policy makers
need to recognize the width of invisibly
economic impacts beyond the out of pocket
health care cost.
Conflict of interest: none.
References 1. Social Security Office: The Social security
scheme. available from;
http://www.sso.go.th/english/content.php?menu
id=18Content_id=86
2. Division of Research and development,
social security office. Number of social security
member in year 1999-2007. available from;
http://www.sso.go.th/spaw2/uploads/files/s5tati
sticsmid3_6.html.
3. Bunditchate A, Saosarn P, Kitiruksanon P.,
Chutha W. Epidemiology of mental disorders
among Thai people. Journal of the Psychiatric
Association of Thailand. 2001; 46:335-43.
4. Social Security Office. Health service
utilization rate. Annual report 2004. Nonth-
aburi. Social Security office; 2005: 31.
5. Kongsakon S, Roungfarnjanoset S. Olan-
zapine versus Haloperidol in the treatment of
refractory schizophrenia: a cost-effectiveness
analysis. Journal of the Psychiatric Association
of Thailand 2000;45:71-85.
6. Puapanprasert B, et al. Unit cost of health
service in Department of Mental Health, Minis-
try of Public Health 2005. Report. Nonthaburi:
Department of Mental Health, Ministry of
Public Health; 2005.
7. Bureau of Trade and Economic Indices.
Ministry of Commerce, Thailand. Consumer
index price 1994-2007. Available from :
http://www.indexpr.moc.go.th/prince_present/c
pi/stat/others/indexg_report2.asp.
8. Sadock BJ, Sadock VA. Synopsis of
Psychiatry. 10th ed. Philadephia: Lippicott
Williams & Wilkins; 2007.
9. Byerly MJ, Nakonezny PA, Lescouflair E.
Antipsychotic medication adherence in schizo-
phrenia. Psychiatr Clin North Am. 2007;30:
437-52.
10. Sun SX, Liu GG, Christensen DB, Fu AZ.
Review and analysis of hospitalization costs
associated with antipsychotic nonadhesence in
the treatment of schizophrenia in the United
States. Curr Med Res Opin. 2007;13 [Epub
ahead of print]
11. Drummond MF, O’ Brien B, Stoddard GL,
Torrance GW. Methods for the Economic
Evaluation of Health Care Programs. 2nd Ed.
New York: Oxford University Press; 1999.
12. Mangalore R, Knapp M. Cost of schizo-
phrenia in England. J Men Health Policy Econ.
2007;10:23-41.
13. Wu EQ, Bimbuam HG, Shi L, Ball DE,
Kessler RC, Moulis M, et al. The economic
burden of schizophrenia in the united states in
2002. J Clin Psychiatry. 2005;66:1122-9.
14. Goeree R, Farahati F, Burke N, Blackhouse
G, O’Reilly D, Pyne J, et al. The economic
burden of schizophrenia in Canada in 2004.
Curr Med Res Opin. 2005;21:2017-28.
15. Kanchanatawan B. Psychiatric disorders
and invisible economic losses. Chulalongkorn
Medical Journal 2002;46:525-6.
16. Guest JF, Cookson RF. Cost of schizo-
phrenia to UK Society. An incidence-based cost
of illness model for the first 5 years following
diagnosis. Pharmacoeconomics. 1999;15:597-
610.
17. Gunderson JG, Mosher LR. The cost of
schizophrenia. Am J Psychiatry. 1972132:901-
6.
18. Marcus SC, Olson M. Outpatient antipsy-
chotic treatment and inpatient costs of schizo-
phrenia. Schizphr Bull. 2007;19: [Epub ahead
of print]
19. Tediosi F, Parazzini F, Garattini L. Cost of
schizophrenia study: a methodological review.
HEPAC Health economic in prevention and
care. 2000;1:14-9.
20. Andreason NC. Assessment issues an
d the cost of schizophrenia. Schizophr Bull.
1991;17:475-81.
ASEAN Journal of Psychiatry 2007;8 (2):124-130.
___________________________________________________________________________________
Correspondence: Benchalak Maneeton, Department of Psychiatry, Faculty of Medicine, Chiang Mai
University, Muang, Chiang Mai 50200, Thailand.
Email: [email protected]
Received September 3, 2007; Accepted October 1, 2007.
ORIGINAL ARTICLE
Consultation-liaison psychiatry in Maharaj Nakorn
Chiang Mai Hospital
BENCHALAK MANEETON, WAJANA KHEMAWICHANURAT, & NARONG
MANEETON
Department of Psychiatry, Faculty of Medicine, Chiang Mai University, Muang, Chiang Mai 50200
Thailand
Abstract
Objective: The aim of this study was to evaluate common problems in consultation-liaison
psychiatry, characteristics of consulted patients, and medical and psychiatric diagnoses of the
patients in Maharaj Nakorn Chiang Mai Hospital. Methods: We performed a retrospective
descriptive study from June 2005 to August 2006. All participants were medically ill inpa-
tients who consulted for psychiatric problems. The authors reviewed the demographic data
such as age, sex, ward, systemic disease, medical disease, psychiatric provisional diagnosis
and psychiatric diagnosis. Results: Four hundreds patients were consulted for psychiatric
evaluation, 0.82 % of all general hospital inpatients, 235 (58.8 %) males and 165 (41.2 %)
females. The modal age group was between 20 - 49 years old (58.8 %) mostly referred by the
department of internal medicine and surgery. At discharge, common diagnoses were adjust-
ment disorder (35.0 %), delirium (32.5 %), substance-related disorders (17.0 %), depressive
disorders (13.3 %), and psychotic disorders (4.3 %). Sensitivity rates for diagnosis of these
psychiatric disorders were 12.1%, 50.8%, 75 %, 43.4% and 64.7% respectively. Conclusion:
Patients with high suicidal risk, in particular adjustment and depressive disorders are common
in consultation-liaison psychiatry. Attention should also be given to patients with high risks of
aggression, disruption, or disorganization, such as delirium, substance abuse, and psychotic
disorders.
Key words: consultation, medically ill patients, adjustment disorder
Introduction
Consultation-liaison psychiatry deals with
patients who have both psychological and
physical symptoms under the care of other
medical specialties. Psychiatrists have to
identify mental disorder, diagnose, as well
as work with the medical team for treat-
ment plan. In western countries, the branch
of consultation-liaison psychiatry is well
established. There are also many studies in
this area. Patients with medical illness such
as disease of nervous system, endocrine
disorder, delirium and substance use disor-
ders may have co-morbidity of psychiatric
problems. Moreover, patients with chronic
medical illness may have many problems in
coping with their health and present with
anxiety, depression or suicidal ideation.
In developing countries, consultation-
liaison psychiatry is a new branch of psy-
chiatry. Only few psychiatrists are avail-
able in most general hospitals. From this
point of view, we would like to survey the
patterns of consultation-liaison psychiatry
in our setting. The results will be analyzed
and used to improve our services, as well as
shaping the resident training program in the
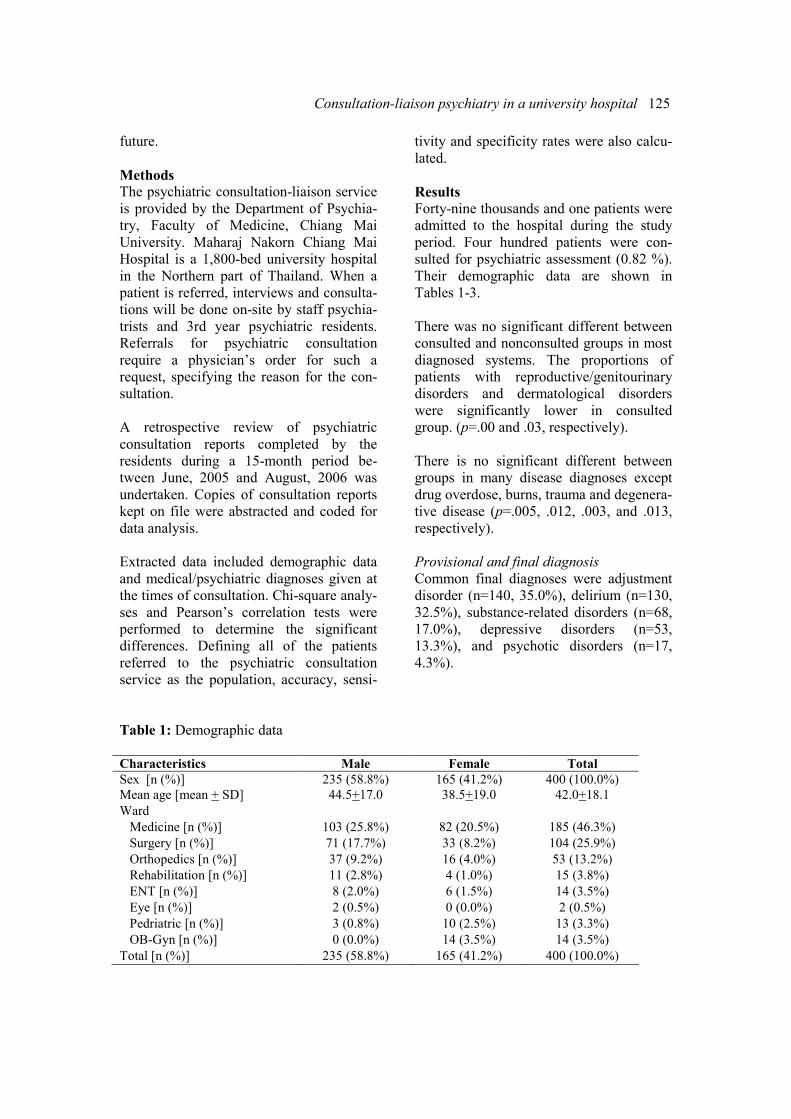
Consultation-liaison psychiatry in a university hospital 125
future.
Methods
The psychiatric consultation-liaison service
is provided by the Department of Psychia-
try, Faculty of Medicine, Chiang Mai
University. Maharaj Nakorn Chiang Mai
Hospital is a 1,800-bed university hospital
in the Northern part of Thailand. When a
patient is referred, interviews and consulta-
tions will be done on-site by staff psychia-
trists and 3rd year psychiatric residents.
Referrals for psychiatric consultation
require a physician’s order for such a
request, specifying the reason for the con-
sultation.
A retrospective review of psychiatric
consultation reports completed by the
residents during a 15-month period be-
tween June, 2005 and August, 2006 was
undertaken. Copies of consultation reports
kept on file were abstracted and coded for
data analysis.
Extracted data included demographic data
and medical/psychiatric diagnoses given at
the times of consultation. Chi-square analy-
ses and Pearson’s correlation tests were
performed to determine the significant
differences. Defining all of the patients
referred to the psychiatric consultation
service as the population, accuracy, sensi-
tivity and specificity rates were also calcu-
lated.
Results
Forty-nine thousands and one patients were
admitted to the hospital during the study
period. Four hundred patients were con-
sulted for psychiatric assessment (0.82 %).
Their demographic data are shown in
Tables 1-3.
There was no significant different between
consulted and nonconsulted groups in most
diagnosed systems. The proportions of
patients with reproductive/genitourinary
disorders and dermatological disorders
were significantly lower in consulted
group. (p=.00 and .03, respectively).
There is no significant different between
groups in many disease diagnoses except
drug overdose, burns, trauma and degenera-
tive disease (p=.005, .012, .003, and .013,
respectively).
Provisional and final diagnosis
Common final diagnoses were adjustment
disorder (n=140, 35.0%), delirium (n=130,
32.5%), substance-related disorders (n=68,
17.0%), depressive disorders (n=53,
13.3%), and psychotic disorders (n=17,
4.3%).
Table 1: Demographic data
Characteristics Male Female Total
Sex [n (%)] 235 (58.8%) 165 (41.2%) 400 (100.0%)
Mean age [mean + SD] 44.5+17.0 38.5+19.0 42.0+18.1
Ward
Medicine [n (%)] 103 (25.8%) 82 (20.5%) 185 (46.3%)
Surgery [n (%)] 71 (17.7%) 33 (8.2%) 104 (25.9%)
Orthopedics [n (%)] 37 (9.2%) 16 (4.0%) 53 (13.2%)
Rehabilitation [n (%)] 11 (2.8%) 4 (1.0%) 15 (3.8%)
ENT [n (%)] 8 (2.0%) 6 (1.5%) 14 (3.5%)
Eye [n (%)] 2 (0.5%) 0 (0.0%) 2 (0.5%)
Pedriatric [n (%)] 3 (0.8%) 10 (2.5%) 13 (3.3%)
OB-Gyn [n (%)] 0 (0.0%) 14 (3.5%) 14 (3.5%)
Total [n (%)] 235 (58.8%) 165 (41.2%) 400 (100.0%)
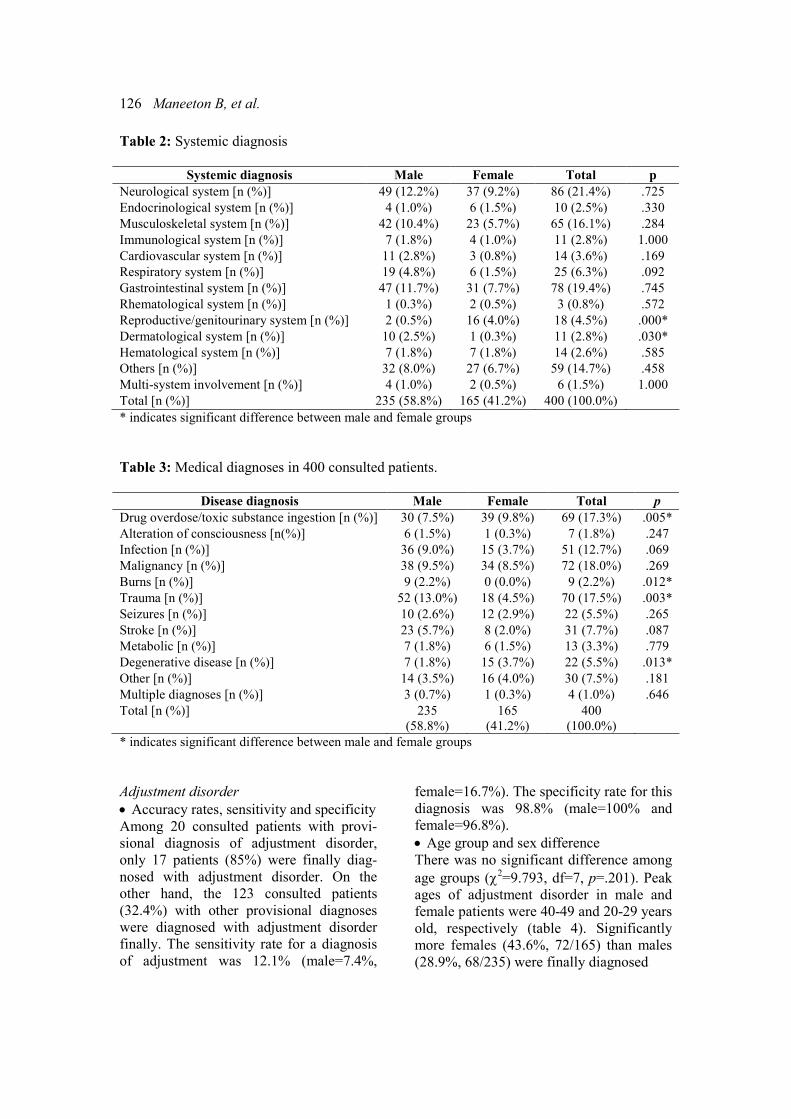
126 Maneeton B, et al.
Table 2: Systemic diagnosis
Systemic diagnosis Male Female Total p
Neurological system [n (%)] 49 (12.2%) 37 (9.2%) 86 (21.4%) .725
Endocrinological system [n (%)] 4 (1.0%) 6 (1.5%) 10 (2.5%) .330
Musculoskeletal system [n (%)] 42 (10.4%) 23 (5.7%) 65 (16.1%) .284
Immunological system [n (%)] 7 (1.8%) 4 (1.0%) 11 (2.8%) 1.000
Cardiovascular system [n (%)] 11 (2.8%) 3 (0.8%) 14 (3.6%) .169
Respiratory system [n (%)] 19 (4.8%) 6 (1.5%) 25 (6.3%) .092
Gastrointestinal system [n (%)] 47 (11.7%) 31 (7.7%) 78 (19.4%) .745
Rhematological system [n (%)] 1 (0.3%) 2 (0.5%) 3 (0.8%) .572
Reproductive/genitourinary system [n (%)] 2 (0.5%) 16 (4.0%) 18 (4.5%) .000*
Dermatological system [n (%)] 10 (2.5%) 1 (0.3%) 11 (2.8%) .030*
Hematological system [n (%)] 7 (1.8%) 7 (1.8%) 14 (2.6%) .585
Others [n (%)] 32 (8.0%) 27 (6.7%) 59 (14.7%) .458
Multi-system involvement [n (%)] 4 (1.0%) 2 (0.5%) 6 (1.5%) 1.000
Total [n (%)] 235 (58.8%) 165 (41.2%) 400 (100.0%)
* indicates significant difference between male and female groups
Table 3: Medical diagnoses in 400 consulted patients.
Disease diagnosis Male Female Total p
Drug overdose/toxic substance ingestion [n (%)] 30 (7.5%) 39 (9.8%) 69 (17.3%) .005*
Alteration of consciousness [n(%)] 6 (1.5%) 1 (0.3%) 7 (1.8%) .247
Infection [n (%)] 36 (9.0%) 15 (3.7%) 51 (12.7%) .069
Malignancy [n (%)] 38 (9.5%) 34 (8.5%) 72 (18.0%) .269
Burns [n (%)] 9 (2.2%) 0 (0.0%) 9 (2.2%) .012*
Trauma [n (%)] 52 (13.0%) 18 (4.5%) 70 (17.5%) .003*
Seizures [n (%)] 10 (2.6%) 12 (2.9%) 22 (5.5%) .265
Stroke [n (%)] 23 (5.7%) 8 (2.0%) 31 (7.7%) .087
Metabolic [n (%)] 7 (1.8%) 6 (1.5%) 13 (3.3%) .779
Degenerative disease [n (%)] 7 (1.8%) 15 (3.7%) 22 (5.5%) .013*
Other [n (%)] 14 (3.5%) 16 (4.0%) 30 (7.5%) .181
Multiple diagnoses [n (%)] 3 (0.7%) 1 (0.3%) 4 (1.0%) .646
Total [n (%)] 235
(58.8%)
165
(41.2%)
400
(100.0%)
* indicates significant difference between male and female groups
Adjustment disorder
• Accuracy rates, sensitivity and specificity
Among 20 consulted patients with provi-
sional diagnosis of adjustment disorder,
only 17 patients (85%) were finally diag-
nosed with adjustment disorder. On the
other hand, the 123 consulted patients
(32.4%) with other provisional diagnoses
were diagnosed with adjustment disorder
finally. The sensitivity rate for a diagnosis
of adjustment was 12.1% (male=7.4%,
female=16.7%). The specificity rate for this
diagnosis was 98.8% (male=100% and
female=96.8%).
• Age group and sex difference
There was no significant difference among
age groups (χ2=9.793, df=7, p=.201). Peak
ages of adjustment disorder in male and
female patients were 40-49 and 20-29 years
old, respectively (table 4). Significantly
more females (43.6%, 72/165) than males
(28.9%, 68/235) were finally diagnosed
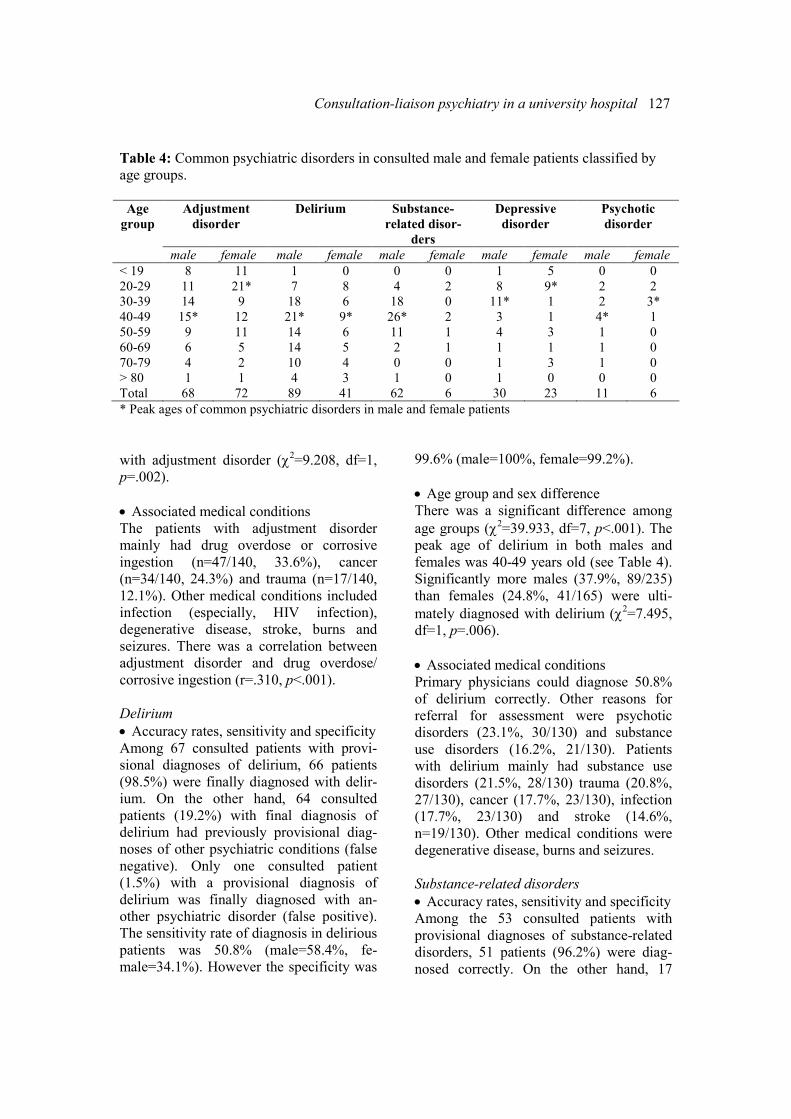
Consultation-liaison psychiatry in a university hospital 127
Table 4: Common psychiatric disorders in consulted male and female patients classified by
age groups.
Adjustment
disorder
Delirium Substance-
related disor-
ders
Depressive
disorder
Psychotic
disorder
Age
group
male female male female male female male female male female
< 19 8 11 1 0 0 0 1 5 0 0
20-29 11 21* 7 8 4 2 8 9* 2 2
30-39 14 9 18 6 18 0 11* 1 2 3*
40-49 15* 12 21* 9* 26* 2 3 1 4* 1
50-59 9 11 14 6 11 1 4 3 1 0
60-69 6 5 14 5 2 1 1 1 1 0
70-79 4 2 10 4 0 0 1 3 1 0
> 80 1 1 4 3 1 0 1 0 0 0
Total 68 72 89 41 62 6 30 23 11 6
* Peak ages of common psychiatric disorders in male and female patients
with adjustment disorder (χ2=9.208, df=1,
p=.002).
• Associated medical conditions
The patients with adjustment disorder
mainly had drug overdose or corrosive
ingestion (n=47/140, 33.6%), cancer
(n=34/140, 24.3%) and trauma (n=17/140,
12.1%). Other medical conditions included
infection (especially, HIV infection),
degenerative disease, stroke, burns and
seizures. There was a correlation between
adjustment disorder and drug overdose/
corrosive ingestion (r=.310, p<.001).
Delirium
• Accuracy rates, sensitivity and specificity
Among 67 consulted patients with provi-
sional diagnoses of delirium, 66 patients
(98.5%) were finally diagnosed with delir-
ium. On the other hand, 64 consulted
patients (19.2%) with final diagnosis of
delirium had previously provisional diag-
noses of other psychiatric conditions (false
negative). Only one consulted patient
(1.5%) with a provisional diagnosis of
delirium was finally diagnosed with an-
other psychiatric disorder (false positive).
The sensitivity rate of diagnosis in delirious
patients was 50.8% (male=58.4%, fe-
male=34.1%). However the specificity was
99.6% (male=100%, female=99.2%).
• Age group and sex difference
There was a significant difference among
age groups (χ2=39.933, df=7, p<.001). The
peak age of delirium in both males and
females was 40-49 years old (see Table 4).
Significantly more males (37.9%, 89/235)
than females (24.8%, 41/165) were ulti-
mately diagnosed with delirium (χ2=7.495,
df=1, p=.006).
• Associated medical conditions
Primary physicians could diagnose 50.8%
of delirium correctly. Other reasons for
referral for assessment were psychotic
disorders (23.1%, 30/130) and substance
use disorders (16.2%, 21/130). Patients
with delirium mainly had substance use
disorders (21.5%, 28/130) trauma (20.8%,
27/130), cancer (17.7%, 23/130), infection
(17.7%, 23/130) and stroke (14.6%,
n=19/130). Other medical conditions were
degenerative disease, burns and seizures.
Substance-related disorders
• Accuracy rates, sensitivity and specificity
Among the 53 consulted patients with
provisional diagnoses of substance-related
disorders, 51 patients (96.2%) were diag-
nosed correctly. On the other hand, 17
128 Maneeton B, et al.
consulted patients (4.9%) with a final
diagnosis of substance-related disorders
had previously provisional diagnoses of
other psychiatric conditions (false nega-
tive). However, the two consulted patients
(3.8%) with a provisional diagnosis of
substance-related disorders were ultimately
diagnosed with other psychiatric disorders
(false positive). The sensitivity rate for
these patients was 75% (male=74.2%,
female=83.3%), while the specificity was
99.4% (male=99.4%, female=99.4%).
• Age group and sex difference
There was a significant difference among
age groups (χ2=42.398, df=7, p<.001). The
peak age of substance-related disorders in
males was 40-49 years old, while there was
no peak age difference in female (see Table
4). Significantly more males (26.4%,
62/235) than females (3.6%, 6/165) were
finally diagnosed with substance-related
disorders (χ2= 35.547, df=1, p<.001).
• Associated medical conditions
We found that 41.2% of patients (28/68)
with substance-related disorders also had
delirium together. Patients with substance-
related disorders mainly had trauma
(27.9%, 19/68), infection (17.6%, 12/68),
seizures (11.8%, 8/68) and stroke (11.8%,
8/68). Other medical conditions were
cancer, drug overdose, and metabolic
disturbance.
Depressive disorders
• Accuracy rates, sensitivity and specificity
Among 91 consulted patients with a provi-
sional diagnosis of depressive disorders,
only 23 patients (25.3%) were finally
diagnosed with depressive disorders (male=
30.2%, female=20.8%). On the other hand,
only 30 consulted patients (9.7%) with a
final diagnosis of depressive disorders had
a previously provisional diagnosis of other
psychiatric conditions (false negative). In
addition, 68 consulted patients (74.7%)
with a provisional diagnosis of depressive
disorders were finally diagnosed with other
psychiatric disorders (false positive). The
sensitivity rate of the diagnosis was 43.3%
(male=43.3%, female=43.5%) with a
specificity rate of 80.4% (male=80.5%,
female=73.2%).
• Age group and sex difference
There was no significant difference among
age groups (χ2=11.868, df=7, p=.105). The
peak age of depressive disorders in men
was 30-39 years old and 20-29 years old
for women (see Table 4).
• Associated medical conditions
The consulted patients with a final diagno-
sis of depressive disorders had some medi-
cal conditions, including drug overdose or
corrosive ingestion (34.0%, 18/53), trauma
(22.6%, 12/53), infection (13.2%, 7/53) and
cancer (11.3%, 6/53). Other medical condi-
tions included seizures, stroke, degenera-
tive disease and metabolic distance. Some
patients had multiple medical conditions.
Psychotic disorders
• Accuracy rates, sensitivity and specificity
Among 45 consulted patients, 11 patients
(24.4%) were finally diagnosed with psy-
chotic disorders (males=27.3%, female=
21.7%). On the other hand, six patients
(1.7%) with a final diagnosis of psychotic
disorders had previous provisional diagno-
ses of other psychiatric conditions (false
negative). In addition, 34 consulted patients
(75.6%) with a provisional diagnosis of
psychotic disorders were finally diagnosed
with other psychiatric disorders (false
positive). Hence, the sensitivity rate for the
diagnosis of psychotic patients was 64.7%
(male=54.5%, female=83.3%), while the
specificity was 91.1% (male=92.9%, fe-
male=88.7%).
• Age group and sex different for psychotic
disorder
There was no significant difference among
age groups (χ2=5.132, df=7, p= .644). The
peak age of psychotic disorders in males
was 40-49 years old, while the females
were 30-39 years old as shown in Table 4.
Proportions of male and female patients
Consultation-liaison psychiatry in a university hospital 129
referred for psychotic disorders were not
significantly different (χ2=.260, df=1,
p=.610).
Reasons for referral and medical illnesses
Primary physicians diagnosed 64.7%
(11/17) of psychotic disorder correctly.
Other reasons for the referral were suicide
attempts, substance use disorders, and
aggressive behavior. Patients with psy-
chotic disorders mainly had drug overdose
(n=4/17, 23.5%), stroke (n=3/17, 17.6%),
infection (n =3/17, 17.6%), trauma (n=2/17,
11.8%). Other medical conditions included
seizures, degenerative diseases, cancer and
metabolic disturbance. One patient had
multiple medical illnesses.
Discussion
The consultation rate of 0.82% in our
general hospital is comparable to those of
other studies in Thailand (0.54% to 0.60%)
[1,2], and lower than those in western
countries (1.56%-3.30%) [3,4]. As in other
studies [1,2,5], the consultation rates from
medical and surgical departments were
higher than others. Most common psychiat-
ric disorders in this study, including ad-
justment disorder, delirium, substance use
disorders, depression and psychotic disor-
ders, are similar to previous studies [1,2,4].
Patients with adjustment disorder associ-
ated with suicide attempts are prevalent in
patients with drug overdose or corrosive
ingestion, cancer, trauma, infection (espe-
cially, HIV infection), degenerative dis-
ease, stroke, burns and seizures. In another
study [6], these patients were referred
significantly more often for the problems of
anxiety, coping and depression. They had
fewer psychiatric illnesses in the past and
were rated as minimal functional impair-
ment- all consistent with the construct of
adjustment disorder, a maladaptation to a
psychosocial stressor. For this diagnosis,
medical staff requesting for consultation
psychiatry service usually describe only the
psychiatric symptoms (i.e., referred for
suicide attempts or depressed mood) with-
out the specification of the diagnosis.
Although adjustment disorder was the most
common final psychiatric diagnosis
(35.0%) in this study, which is comparable
to 24.1% to 29% in other studies [6,7]. The
sensitivity rate for the diagnosis of this
condition was very low (12.1%).
In this study, we found that delirium was
significantly more common in older than
nonconsulted patients and commonly
caused by trauma, cancer, infection, stroke,
degenerative disease, burns and seizures.
Co-morbidity with delirium was substance
use disorders, especially alcohol depend-
ence, and most delirious patients had more
than one medical problem. As in other
studies, many nonpsychiatric specialists
failed to recognize a majority of patients
with delirium and referred for other per-
ceived reasons such as psychotic disorders.
Therefore, it may of concern that symptoms
of delirium may be overlooked or misinter-
preted [8]. The sensitivity rate for diagnosis
of this condition was only 50.8%.
In comparison to other psychiatric disor-
ders, the medical staff was relatively com-
petent in recognizing substance-related
disorders in the studied population. The
sensitivity and specificity rate of substance
use disorders were higher than other psy-
chiatric illnesses (75% and 99.4%). The
problems were more prevalent in male
patients. Patients with substance-related
disorders mainly had infection, trauma,
seizures and stroke.
The sensitivity rate of depressive disorder
was only 43.4%. In the consultation request
forms, medical staff described only the
psychiatric symptoms without giving any
specific diagnosis. The main reason for
consultation was suicide attempts. Patients
with depressive disorders mainly had drug
overdose or corrosive ingestion, trauma,
infection, cancer, seizures, stroke, degen-
erative disease and metabolic disturbance.
Some patients had multiple medical ill-
nesses in which their physical symptoms
130 Maneeton B, et al.
might mimic depression, e.g., fatigue, sleep
difficulties and appetite disturbances.
The sensitivity rate for making a diagnosis
of psychotic disorders was 64.7%. These
patients mainly came up with drug over-
dose, stroke, infection, trauma, seizures,
degenerative disease, cancer and metabolic
distance. Medical staff failed to differenti-
ate patients with psychotic disorder from
delirium.
Primary physicians may be more concern
on patient safety, e.g., consulted for suici-
dal assessment or confusion, than making a
proper psychiatric diagnosis. Previous
research has demonstrated that referring
services focus on behavior problems rather
than identifying and treating underlying
psychiatric disorders [9,10].
Medically ill patients with psychiatric
complications pose a great challenge to
clinicians. Their behavioral disturbance and
psychiatric symptoms can cause non-
compliance to treatment. The findings of
this study suggest that a large proportion of
patients seen by medical staff have psychi-
atric disorders but, without psychiatric
consultation, mental problems are identi-
fied in only a small number of them. Physi-
cians should have knowledge of common
psychiatric disorders such as adjustment
disorder, depression, delirium, substance-
related disorders and psychotic disorders.
Moreover, psychiatrists should advise
primary physicians on the management of
these problems, in particular, suicide at-
tempt, which can be associated with ad-
justment disorder, depression, substance-
related disorders, psychosis and delirium.
From a study report [11], ascertaining
which components of suicide prevention
programs are effective in reducing rates of
suicide and suicide attempt is essential in
order to optimize use of limited resources.
All of these strategies may help promote
the psychiatric care for patients with com-
plex medical conditions, as well as foster
further improvement in quality of training
and research in this important area.
Acknowledgements
We wish to thank Professor Stephen D.
Martin, (Old Elvet Clinic, Durham, United
Kingdom) for his assistance on the manu-
script preparation.
References 1. Pitanupong J, Sangkul J. Psychiatric
consultation at Songklanagarind Hospital.
Songklanagarind Medical Journal. 2000;18:57-
63.
2. Paholpak S. Psychiatric consultation at
Srinagarind Hospital: a report on 271 cases. J
Med Assoc Thai. 1991;74:329-36.
3. Miles SW. Liaison psychiatry in a general
hospital. N Z Med J. 1983;96:978-80.
4. Rothenhäusler HB. Mental disorders in
general hospital patients. Psychiatr Danub.
2006;18:183-92.
5. Diefenbacher A. Implementation of a
psychiatric consultation service: a single-site
observational study over a 1-year-period.
Psychosomatics. 2001;42:404-10.
6. Strain JJ, Smith GC, Hammer JS,
McKenzie DP, Blumenfield M, Muskin P, et al.
Adjustment disorder: a multisite study of its
utilization and interventions in the consultation-
liaison psychiatry setting. Gen Hosp Psychiatry.
1998;20:139-49.
7. Smith GC, Clarke DM, Handrinos D,
Dunsis A. Consultation-liaison psychiatrists
management of depression. Psychosomatics.
1998;39:244-52.
8. van Zyl LT, Davidson PR. Delirium in
hospital: an underreported event at discharge.
Can J Psychiatry. 2003;48:555-60.
9. Loebel JP, Borson S, Hyde T, Donaldson
D, Van Tuinen C, Rabbitt TM, et al. Relation-
ships between requests for psychiatric consulta-
tions and psychiatric diagnoses in long-term-
care facilities. Am J Psychiatry. 1991;148:898-
903.
10. Borson S, Liptzin B, Nininger J, Rabins P.
Psychiatry and the nursing home. Am J Psy-
chiatry. 1987;144:1412-8.
11. Mann JJ, Apter A, Bertolote J, Beautrais A,
Currier D, Haas A, et al. Suicide prevention
strategies: a systematic review. JAMA. 2005;
294:2064-74.
ASEAN Journal of Psychiatry 2007:8 (2):131-137.
___________________________________________________________________________________
Correspondce: Ronnachai Kongsakon, Department of Psychiatry, of Medicine, Ramathibodi Hospital
Rama 6 Road, Ratchatewi, Bangkok 10400.
E-mail: [email protected]
Received September 14, 2007: Accepted October 10, 2007.
ORIGINAL ARTICLE
Thailand normative data for the SF-36 health survey:
Bangkok metropolitan
RONNACHAI KONGSAKON1, CHATCHAWAN SILPAKIT
1,
& UMAPORN UDOMSUBPAYAKUL2
1 Department of Psychiatry, Faculty of Medicine, Ramathibodi Hospital, Mahidol University
2 Clinical Epidemiology Unit, Research Center, Faculty of Medicine, Ramathibodi Hospital, Mahidol
University
Abstract
Background: The Medical Outcomes Study 36-item Short Form (SF-36) is a widely used
measure of health-related quality of life. Normative data are the key to determine whether a
group or an individual score above or below the average for their country,
age or sex. Pub-
lished norms for the SF-36 exist for other countries but have not been previously published for
Thailand. Methods: The multi-site studies of Thai Quality of Health were the cross- sectional
study involving 1,148 randomly selected Thai men and women aged 15 years or more living
in Bangkok metropolitan. The information collected included the SF-36, a measure of health-
related quality of life. These provided a unique opportunity to develop
age- and sex-adjusted
normative data for the Thai population. Results: Thai women scored substantially higher than
men on role physical, bodily pain, role emotional and physical component summary, whereas
men scored higher than women on social functioning. Conclusion: The scores of Bangkok
people are lower than their US counterparts on all SF-36 domains, although many of the
differences were not large. The differences in the SF-36 scores between age groups, sexes and
countries confirm that these Thai norms are necessary for comparative purposes. The data will
be useful for assessing the health status of the general population and patient populations, and
the effect of interventions on health-related quality of life.
Key words: quality of life, SF-36, normative data, Bangkok, Thailand
Introduction
Over the past 20 years, there has been an
increasing recognition of the patient's point
of view as an important component of the
assessment of health care outcomes. This
has resulted in the development of several
instruments to measure health-related
quality of life. One of the most widely used
and psychometrically sound instruments is
the Medical Outcomes Study 36-item Short
Form (SF-36) [1,2]. This relatively brief
and simple questionnaire contains 36 items
covering 8 health concepts chosen on the
basis of reliability, validity and frequency
of measurement in health surveys. Two
summary scores for physical and mental
health have also been developed for the SF-
36 [3].
The reliability and validity of the SF-36
have been well documented by the devel-
opers of the instrument. [4-7]. A compari-
son of a series of generic health status
measures has indicated that the SF-36 is not
only psychometrically sound but is also
more responsive to clinical improvement
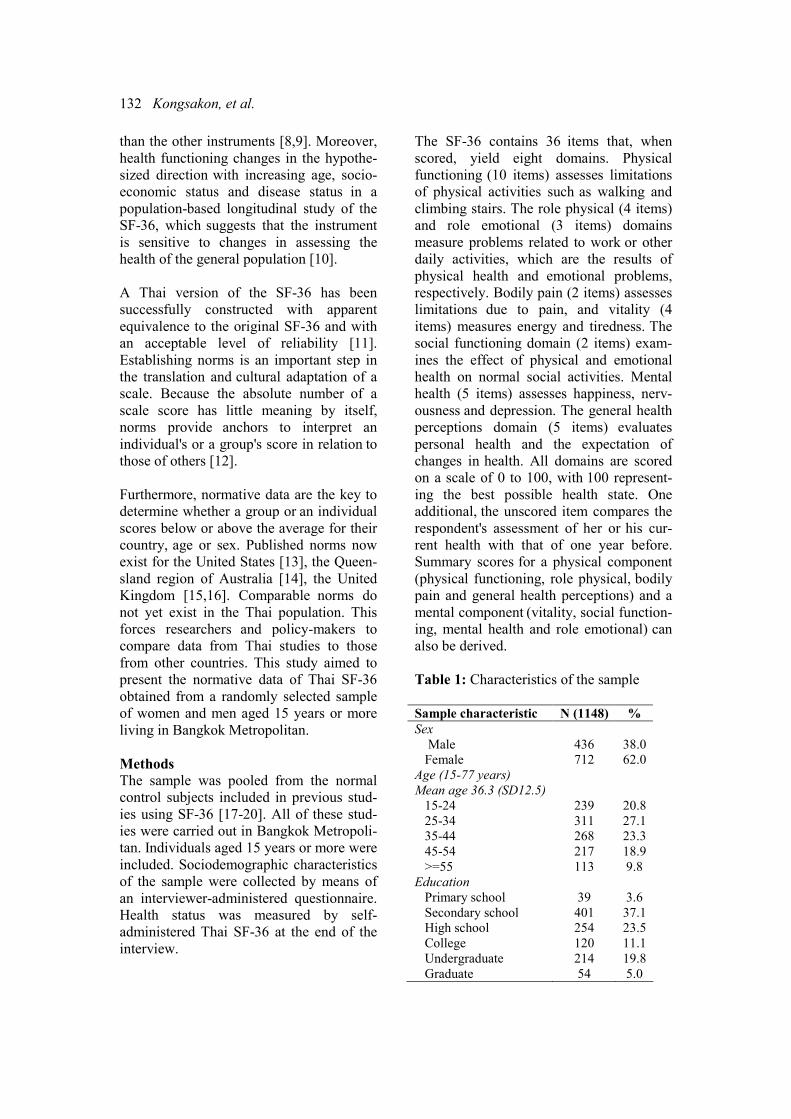
132 Kongsakon, et al.
than the other instruments [8,9]. Moreover,
health functioning changes in the hypothe-
sized direction with increasing age, socio-
economic status and disease status in a
population-based longitudinal study of the
SF-36, which suggests that the instrument
is sensitive to changes in assessing the
health of the general population [10].
A Thai version of the SF-36 has been
successfully constructed with apparent
equivalence to the original SF-36 and with
an acceptable level of reliability [11].
Establishing norms is an important step in
the translation and cultural adaptation of a
scale. Because the absolute number of a
scale score has little meaning by itself,
norms provide anchors to interpret an
individual's or a group's score in relation to
those of others [12].
Furthermore, normative data are the key to
determine whether a group or an individual
scores below or above the average for their
country, age or sex. Published norms now
exist for the United States [13], the Queen-
sland region of Australia [14], the United
Kingdom [15,16]. Comparable norms do
not yet exist in the Thai population. This
forces researchers and policy-makers to
compare data from Thai studies to those
from other countries. This study aimed to
present the normative data of Thai SF-36
obtained from a randomly selected sample
of women and men aged 15 years or more
living in Bangkok Metropolitan.
Methods
The sample was pooled from the normal
control subjects included in previous stud-
ies using SF-36 [17-20]. All of these stud-
ies were carried out in Bangkok Metropoli-
tan. Individuals aged 15 years or more were
included. Sociodemographic characteristics
of the sample were collected by means of
an interviewer-administered questionnaire.
Health status was measured by self-
administered Thai SF-36 at the end of the
interview.
The SF-36 contains 36 items that, when
scored, yield eight domains. Physical
functioning (10 items) assesses limitations
of physical activities such as walking and
climbing stairs. The role physical (4 items)
and role emotional (3 items) domains
measure problems related to work or other
daily activities, which are the results of
physical health and emotional problems,
respectively. Bodily pain (2 items) assesses
limitations due to pain, and vitality (4
items) measures energy and tiredness. The
social functioning domain (2 items) exam-
ines the effect of physical and emotional
health on normal social activities. Mental
health (5 items) assesses happiness, nerv-
ousness and depression. The general health
perceptions domain (5 items) evaluates
personal health and the expectation of
changes in health. All domains are scored
on a scale of 0 to 100, with 100 represent-
ing the best possible health state. One
additional, the unscored item compares the
respondent's assessment of her or his cur-
rent health with that of one year before.
Summary scores for a physical component
(physical functioning, role physical, bodily
pain and general health perceptions) and a
mental component (vitality, social function-
ing, mental health and role emotional) can
also be derived.
Table 1: Characteristics of the sample
Sample characteristic N (1148) %
Sex
Male 436 38.0
Female 712 62.0
Age (15-77 years)
Mean age 36.3 (SD12.5)
15-24 239 20.8
25-34 311 27.1
35-44 268 23.3
45-54 217 18.9
>=55 113 9.8
Education
Primary school 39 3.6
Secondary school 401 37.1
High school 254 23.5
College 120 11.1
Undergraduate 214 19.8
Graduate 54 5.0
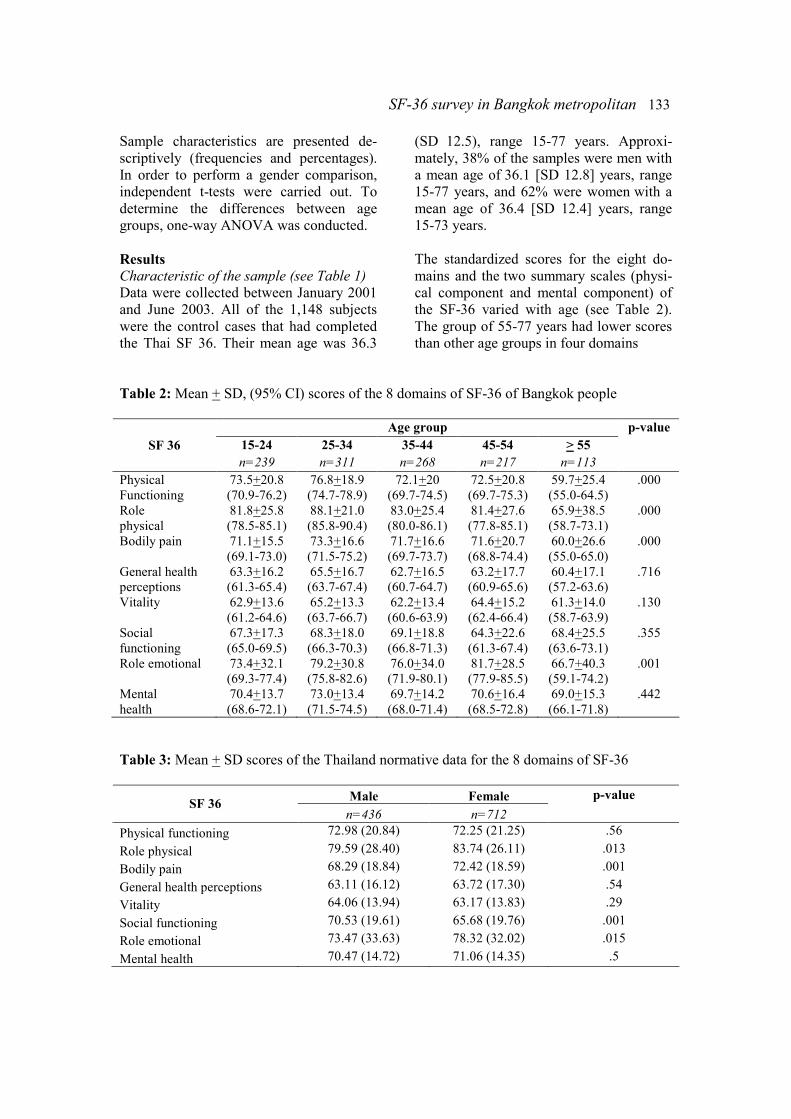
SF-36 survey in Bangkok metropolitan 133
Sample characteristics are presented de-
scriptively (frequencies and percentages).
In order to perform a gender comparison,
independent t-tests were carried out. To
determine the differences between age
groups, one-way ANOVA was conducted.
Results
Characteristic of the sample (see Table 1)
Data were collected between January 2001
and June 2003. All of the 1,148 subjects
were the control cases that had completed
the Thai SF 36. Their mean age was 36.3
(SD 12.5), range 15-77 years. Approxi-
mately, 38% of the samples were men with
a mean age of 36.1 [SD 12.8] years, range
15-77 years, and 62% were women with a
mean age of 36.4 [SD 12.4] years, range
15-73 years.
The standardized scores for the eight do-
mains and the two summary scales (physi-
cal component and mental component) of
the SF-36 varied with age (see Table 2).
The group of 55-77 years had lower scores
than other age groups in four domains
Table 2: Mean + SD, (95% CI) scores of the 8 domains of SF-36 of Bangkok people
Age group
15-24 25-34 35-44 45-54 > 55
p-value
SF 36
n=239 n=311 n=268 n=217 n=113
Physical
Functioning
73.5+20.8
(70.9-76.2)
76.8+18.9
(74.7-78.9)
72.1+20
(69.7-74.5)
72.5+20.8
(69.7-75.3)
59.7+25.4
(55.0-64.5)
.000
Role
physical
81.8+25.8
(78.5-85.1)
88.1+21.0
(85.8-90.4)
83.0+25.4
(80.0-86.1)
81.4+27.6
(77.8-85.1)
65.9+38.5
(58.7-73.1)
.000
Bodily pain 71.1+15.5
(69.1-73.0)
73.3+16.6
(71.5-75.2)
71.7+16.6
(69.7-73.7)
71.6+20.7
(68.8-74.4)
60.0+26.6
(55.0-65.0)
.000
General health
perceptions
63.3+16.2
(61.3-65.4)
65.5+16.7
(63.7-67.4)
62.7+16.5
(60.7-64.7)
63.2+17.7
(60.9-65.6)
60.4+17.1
(57.2-63.6)
.716
Vitality 62.9+13.6
(61.2-64.6)
65.2+13.3
(63.7-66.7)
62.2+13.4
(60.6-63.9)
64.4+15.2
(62.4-66.4)
61.3+14.0
(58.7-63.9)
.130
Social
functioning
67.3+17.3
(65.0-69.5)
68.3+18.0
(66.3-70.3)
69.1+18.8
(66.8-71.3)
64.3+22.6
(61.3-67.4)
68.4+25.5
(63.6-73.1)
.355
Role emotional 73.4+32.1
(69.3-77.4)
79.2+30.8
(75.8-82.6)
76.0+34.0
(71.9-80.1)
81.7+28.5
(77.9-85.5)
66.7+40.3
(59.1-74.2)
.001
Mental
health
70.4+13.7
(68.6-72.1)
73.0+13.4
(71.5-74.5)
69.7+14.2
(68.0-71.4)
70.6+16.4
(68.5-72.8)
69.0+15.3
(66.1-71.8)
.442
Table 3: Mean + SD scores of the Thailand normative data for the 8 domains of SF-36
Male Female p-value SF 36
n=436 n=712
Physical functioning 72.98 (20.84) 72.25 (21.25) .56
Role physical 79.59 (28.40) 83.74 (26.11) .013
Bodily pain 68.29 (18.84) 72.42 (18.59) .001
General health perceptions 63.11 (16.12) 63.72 (17.30) .54
Vitality 64.06 (13.94) 63.17 (13.83) .29
Social functioning 70.53 (19.61) 65.68 (19.76) .001
Role emotional 73.47 (33.63) 78.32 (32.02) .015
Mental health 70.47 (14.72) 71.06 (14.35) .5
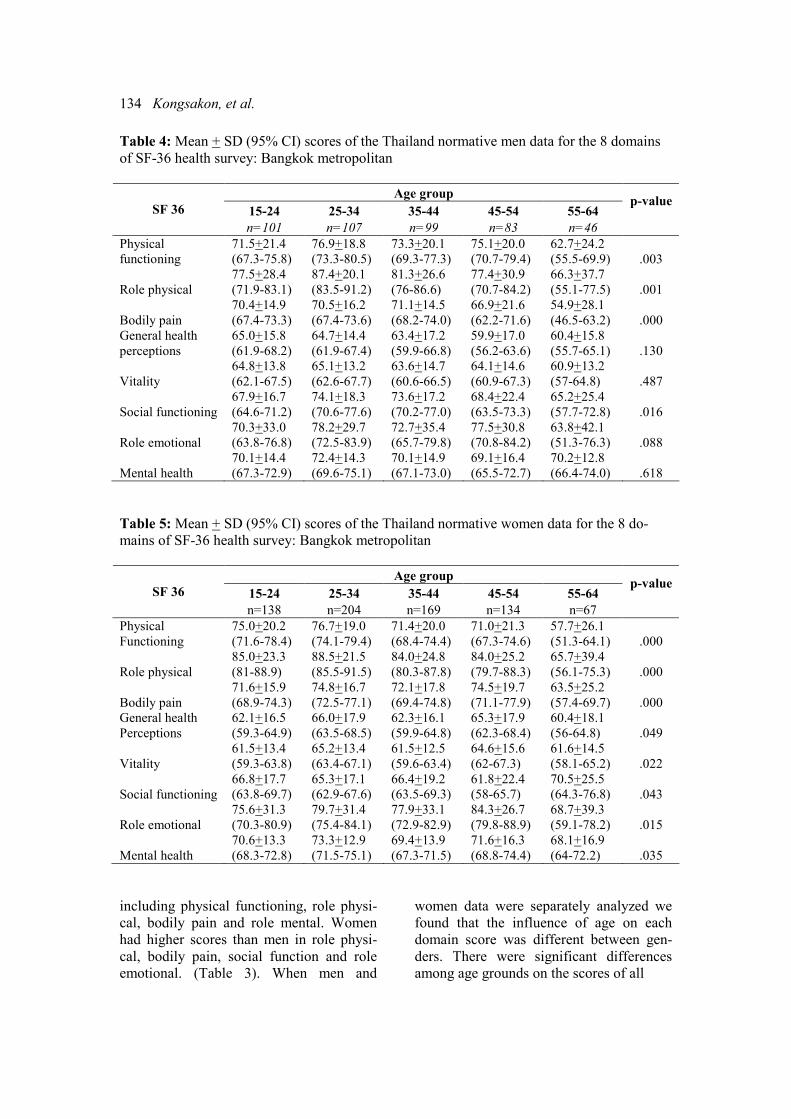
134 Kongsakon, et al.
Table 4: Mean + SD (95% CI) scores of the Thailand normative men data for the 8 domains
of SF-36 health survey: Bangkok metropolitan
Age group
15-24 25-34 35-44 45-54 55-64 p-value
SF 36
n=101 n=107 n=99 n=83 n=46
Physical
functioning
71.5+21.4
(67.3-75.8)
76.9+18.8
(73.3-80.5)
73.3+20.1
(69.3-77.3)
75.1+20.0
(70.7-79.4)
62.7+24.2
(55.5-69.9) .003
Role physical
77.5+28.4
(71.9-83.1)
87.4+20.1
(83.5-91.2)
81.3+26.6
(76-86.6)
77.4+30.9
(70.7-84.2)
66.3+37.7
(55.1-77.5) .001
Bodily pain
70.4+14.9
(67.4-73.3)
70.5+16.2
(67.4-73.6)
71.1+14.5
(68.2-74.0)
66.9+21.6
(62.2-71.6)
54.9+28.1
(46.5-63.2) .000
General health
perceptions
65.0+15.8
(61.9-68.2)
64.7+14.4
(61.9-67.4)
63.4+17.2
(59.9-66.8)
59.9+17.0
(56.2-63.6)
60.4+15.8
(55.7-65.1) .130
Vitality
64.8+13.8
(62.1-67.5)
65.1+13.2
(62.6-67.7)
63.6+14.7
(60.6-66.5)
64.1+14.6
(60.9-67.3)
60.9+13.2
(57-64.8) .487
Social functioning
67.9+16.7
(64.6-71.2)
74.1+18.3
(70.6-77.6)
73.6+17.2
(70.2-77.0)
68.4+22.4
(63.5-73.3)
65.2+25.4
(57.7-72.8) .016
Role emotional
70.3+33.0
(63.8-76.8)
78.2+29.7
(72.5-83.9)
72.7+35.4
(65.7-79.8)
77.5+30.8
(70.8-84.2)
63.8+42.1
(51.3-76.3) .088
Mental health
70.1+14.4
(67.3-72.9)
72.4+14.3
(69.6-75.1)
70.1+14.9
(67.1-73.0)
69.1+16.4
(65.5-72.7)
70.2+12.8
(66.4-74.0) .618
Table 5: Mean + SD (95% CI) scores of the Thailand normative women data for the 8 do-
mains of SF-36 health survey: Bangkok metropolitan
Age group
15-24 25-34 35-44 45-54 55-64 p-value
SF 36
n=138 n=204 n=169 n=134 n=67
Physical
Functioning
75.0+20.2
(71.6-78.4)
76.7+19.0
(74.1-79.4)
71.4+20.0
(68.4-74.4)
71.0+21.3
(67.3-74.6)
57.7+26.1
(51.3-64.1) .000
Role physical
85.0+23.3
(81-88.9)
88.5+21.5
(85.5-91.5)
84.0+24.8
(80.3-87.8)
84.0+25.2
(79.7-88.3)
65.7+39.4
(56.1-75.3) .000
Bodily pain
71.6+15.9
(68.9-74.3)
74.8+16.7
(72.5-77.1)
72.1+17.8
(69.4-74.8)
74.5+19.7
(71.1-77.9)
63.5+25.2
(57.4-69.7) .000
General health
Perceptions
62.1+16.5
(59.3-64.9)
66.0+17.9
(63.5-68.5)
62.3+16.1
(59.9-64.8)
65.3+17.9
(62.3-68.4)
60.4+18.1
(56-64.8) .049
Vitality
61.5+13.4
(59.3-63.8)
65.2+13.4
(63.4-67.1)
61.5+12.5
(59.6-63.4)
64.6+15.6
(62-67.3)
61.6+14.5
(58.1-65.2) .022
Social functioning
66.8+17.7
(63.8-69.7)
65.3+17.1
(62.9-67.6)
66.4+19.2
(63.5-69.3)
61.8+22.4
(58-65.7)
70.5+25.5
(64.3-76.8) .043
Role emotional
75.6+31.3
(70.3-80.9)
79.7+31.4
(75.4-84.1)
77.9+33.1
(72.9-82.9)
84.3+26.7
(79.8-88.9)
68.7+39.3
(59.1-78.2) .015
Mental health
70.6+13.3
(68.3-72.8)
73.3+12.9
(71.5-75.1)
69.4+13.9
(67.3-71.5)
71.6+16.3
(68.8-74.4)
68.1+16.9
(64-72.2) .035
including physical functioning, role physi-
cal, bodily pain and role mental. Women
had higher scores than men in role physi-
cal, bodily pain, social function and role
emotional. (Table 3). When men and
women data were separately analyzed we
found that the influence of age on each
domain score was different between gen-
ders. There were significant differences
among age grounds on the scores of all
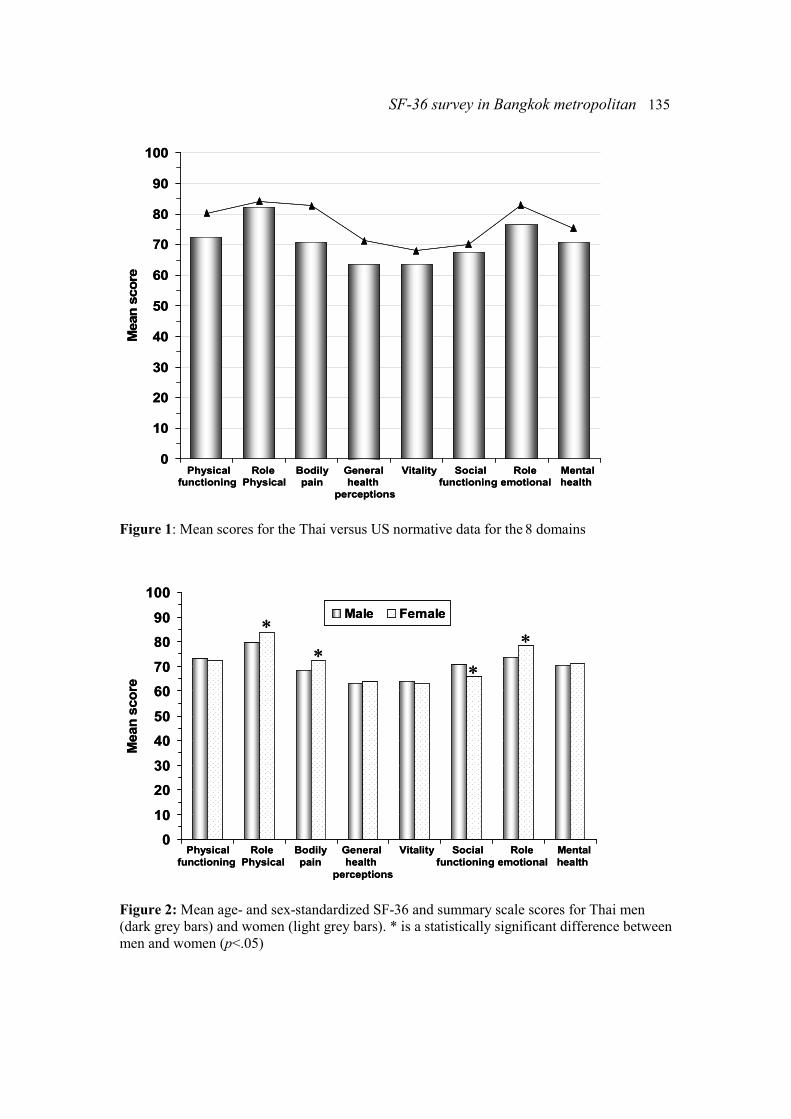
SF-36 survey in Bangkok metropolitan 135
0
10
20
30
40
50
60
70
80
90
100
Physical Role Bodily General Vitality Social Role Mental
functioning Physical pain health functioning emotional health
perceptions
Mean s
core
0
10
20
30
40
50
60
70
80
90
100
Physical Role Bodily General Vitality Social Role Mental
functioning Physical pain health functioning emotional health
perceptions
Mean s
core
Figure 1: Mean scores for the Thai versus US normative data for the 8 domains
0
10
20
30
40
50
60
70
80
90
100
Male Female
Physical Role Bodily General Vitality Social Role Mental
functioning Physical pain health functioning emotional health
perceptions
Mean s
core
∗
∗
∗
∗
0
10
20
30
40
50
60
70
80
90
100
Male Female
Physical Role Bodily General Vitality Social Role Mental
functioning Physical pain health functioning emotional health
perceptions
Mean s
core
∗
∗
∗
∗
Figure 2: Mean age- and sex-standardized SF-36 and summary scale scores for Thai men
(dark grey bars) and women (light grey bars). * is a statistically significant difference between
men and women (p<.05)
136 Kongsakon, et al.
domains in women (Table 4), but only four
domains in men showed the significant
differences of scores among age groups.
(Table 5).
Figure 1 shows the comparison of the SF-
36 normative data of Thai population living
in Bangkok Metropolitan and the normative
data of United State. The Thai norms were
lower than the US norms in all eight do-
mains, although many of the differences
were not large.
The age- and sex-standardized scores for
Thai men and women varied with age and
sex (Tables 3 and 4). As in the entire sam-
ple, several domains exhibited a ceiling
effect (87.4% for men and 88.5% for
women in the role physical domain), but a
strong floor effect did not clearly shown
(51.3 % for women in physical functioning
and 51.3 for men in the role emotional
domain).
The mean scores of Thai men and women
are shown in Figure 2. Men scored nonsig-
nificantly higher than women on physical
functioning and social functioning of the
SF-36. Thai women scored substantially
and statistically significantly higher than
men on role physical, bodily pain, role
emotional and social functioning (p <.05).
Discussion
Normative data for the SF-36 have been
obtained from the normal control subjects
included in previous studies. All of these
studies were carried out in Bangkok Met-
ropolitan and could be used as an important
basis in comparison to future studies.
By the use of SF-36, Thais have relatively
lower scores than the US counterpart on all
eight domains and two summary scales.
The differences between these two groups
may be due to the methodological differ-
ences rather than representing the true
differences. For example, the US normative
data are based not on a random sample but,
rather, on the responses of 2,474 partici-
pants in the National Survey of Functional
Status, who were selected to receive a
mailed version on the basis of previous
participation in a General Social Survey.
These differences in methodology will
introduce variation in the normative data
for international comparisons. Thus, a clear
description of methods is a vital part of the
interpretation of normative data.
The variability of the scores by age under-
scores the need of appropriate age-specific
normative data.
There are differences between men and
women in the Thai sample. Women scored
substantially and significantly higher than
men on role physical, bodily pain, role
emotional and social functioning. This
differs from those found in Norway [21],
Turkey [22] and Canada [23], in which
men had nonsignificantly higher scores
than women on all domains.
This study is the first normative data of SF-
36 in Thailand. However, our results could
not be generalisable to the whole Thai
population because our study sample was a
pooled sample from previous SF-36 studies
in Bangkok.
In conclusions, the differences of the SF-36
scores between age groups, sexes and
countries confirm that these Thai norms are
necessary for comparative purposes. These
data are useful on the assessment of health
status of the general population and of the
patient populations, as well as the effect of
interventions on the health-related quality
of life.
Conflict of interest: none
Acknowledgements
The authors wish to thank Prof. Dr. Am-
nuay Tithapun for his editorial contribu-
tion.
References 1. Ware JE Jr. SF-36 Health Survey manual
SF-36 survey in Bangkok metropolitan 137
and interpretation guide. Boston: The Health
Institute, New England Medical Centre; 1993.
2. Ware JE Jr. The SF-36 Health Survey. In:
Spilker B, editor. Quality of life and pharmaco-
economics in clinical trials. 2nd ed. Philadel-
phia: Lippincott-Raven Publishers; 1996:337-
45.
3. Ware JE Jr, Kosinski M, Keller SD. SF-36
physical and mental health summary scales: a
user's manual. Boston: The Health Institute,
New England Medical Centre; 1994.
4. Ware JE Jr, Sherbourne CD. The MOS 36-
item Short-Form Health Survey (SF-36): I.
Conceptual framework and item selection. Med
Care. 1992;30:473-83.
5. McHorney CA, Ware JE Jr, Raczek AE.
The MOS 36-Item Short Form Health Survey
(SF-36): II. Psychometric and clinical tests of
validity in measuring physical and mental
health constructs. Med Care. 1993;31:247-63.
6. McHorney CA, Ware JE Jr, Lu JFR,
Sherbourne CD. The MOS 36-Item Short Form
Health Survey (SF-36): III. Tests of data qual-
ity, scaling assumptions, and reliability across
diverse patient groups. Med Care. 1994;32:40-
66.
7. Ware JE Jr, Kosinski M, Bayliss MS,
McHorney CA, Rogers WH, Raczek A. Com-
parison of methods for the scoring and statisti-
cal analysis of SF-36 health profile and sum-
mary measures: summary of results from the
Medical Outcomes Study. Med Care. 1995;33
(4 Suppl):264-79.
8. Beaton DE, Hogg-Johnson S, Bombardier
C. Evaluating changes in health status: reliabil-
ity and responsiveness of five generic health
status measures in workers with musculoskele-
tal disorders. J Clin Epidemiol 1997; 50:79-93.
9. Essink-Bot ML, Krabbe PFM, Bonsel GJ,
Aaronson NK. An empirical comparison of four
generic health status measures. Med Care.
1997;35:522-37.
10. Hemingway H, Stafford M, Stansfield S,
Shipley M, Marmot M. Is the SF-36 a valid
measure of change in population health? Re-
sults from the Whitehall II study. BMJ. 1997;
315:1273-9.
11. Kongsakon R., Silpakit C. Thai version of
the Medical outcome study 36 items short form
health survey (SF-36): an instrument for meas-
uring clinical results in mental disorder patients.
Ramathibodi Medical Journal.2000;23:8-19.
12. Lyons RA, Fielder H, Littlepage NC.
Measuring health status with the SF-36: the
need for regional norms. J Public Health Med.
1995;17:46-50.
13. Wood-Dauphinee SW, Gauthier L, Gandek
B, Magnan L, Pierre U. Readying a US measure
of health status, the SF-36, for use in Canada.
Clin Invest Med. 1997;20:224-38.
14. Mishra G, Schofield MJ. Norms for the
physical and mental health component summary
scores of the SF-36 for young, middle-aged and
older Australian women. Qual Life Res. 1998;
7:215-20.
15. Jenkinson C, Stewart-Brown S, Petersen S,
Paice C. Assessment of the SF-36 version 2 in
the United Kingdom. J Epidemiol Community
Health. 1999;5346-50.
16. Jenkinson C, Coulter C, Wright L. Short
Form 36 (SF-36) Health Survey questionnaire:
normative data for adults of working age. BMJ.
1993;306:1437-40.
17. Kosiyakul J, Kongsakon R.The MOS.36
item short form health survey in employees of
Prasat Neurological Institute.Journal of Prasat
Neurological Institute.2001;3:34-46.
18. Jongjit J, Songjakkaew P, Komsopapong L,
Songthaveesin C, Kongsakon R. A case-control
study of physical function and quality of life in
elderly patient after hip fracture. Bulletin of the
department of medical services. 2001;26:88-95.
19. Jongjit J, Songjakkaew P, Komsopapong L,
Songthaveesin C, Kongsakon R. Health-related
quality of life after hip fracture in the elderly
community-dwelling. Southeast Asian Journal
of Tropical Medicine and Public Health. 2003;
34:670-74.
20. Sobhonslidsuk A, Silpakit C, Kongsakon
R, Satitpornkul P, Sripetch C. Chronic liver
disease questionnaire: translation and validation
in Thais. World J Gastroenterol. 2004;10:1954-
7.
21. Loge JH, Kaasa S. Short Form 36 (SF-36)
health survey: normative data from the general
Norwegian population. Scand J Soc Med. 1998;
26:250-8.
22. Hopman WM, Towheed T, Anastassiades
T, Tenenhouse A, Poliquin S, Berger C, et al.
Canadian normative data for the SF-36 health
survey. Canadian Multicentre Osteoporosis
Study Research Group. CMAJ. 2000;163:265-
71.
23. Demiral Y, Ergor G, Unal B, Semin S,
Akvardar Y, Kivircik B, et al. Normative data
and discriminative properties of short form 36
(SF-36) in Turkish urban population. BMC
Public Health. 2006.
Related Documents