Address for reprints: Lubomir Okruhlica, M.D., Ph.D., Centrum pre lieebu drogovych zavis- losti, Hranicna 2, P.O. Box 51, 827 99 Bratislava 2, Slovack Republic. Phone/Fax +421 2 5341 7475 E-mail; [email protected] Centrum pre lieebu drogovych zavislosti, Bratislava, Slovakia Farmaceuticka faculta, Univerzita Komenskeho, Bratislava, Slovakia Heroin Add & Rel Clin Probl 2005; 7(4): 49-58 Research Report Methadone serum concentration and its relationship to methadone dose revisited Lubomir Okruhlica, Jindra Valentova, Ferdinand Devinsky, Sona Formakova and Danica Klempova Summary The study sample included 64 patients, who were divided into two subgroups on the basis of their daily methadone dose: ´Group 1´: 29 patients with doses up to 80 mg; ´Group 2´: 35 patients with doses above 80 mg. The overall cor- relation in the whole group was: r = 0.570. A strong correlation was found between dose and serum concentration in ‘Group 1’: r = 0.799. Non-significant correlation close to zero was found in ‘Group 2’. Our findings suggest that the linear relationship between methadone dose and its serum concentration in lower doses cannot be extrapolated to higher doses. Key Words: methadone maintenance - serum methadone concentration - methadone dose - linear relationship Introduction By now it is generally agreed that methadone concentration in serum may be sig- nificantly correlated with the amount of a drug available at the receptor level. That still leaves open the question whether it is possible to predict the proper daily dose of metha- done required to ensure the serum concentration appropriate to a particular patient by utilizing the relationship between a methadone dose and its serum concentration [17] . A wide variety of researchers have studied the relationship between methadone dose and methadone plasma/serum concentration [1, 2, 3, 5, 7, 9, 10, 11, 12, 14, 17, 19, 20, 21, 22, 23, 24, 25, and

Welcome message from author
This document is posted to help you gain knowledge. Please leave a comment to let me know what you think about it! Share it to your friends and learn new things together.
Transcript

Address for reprints: Lubomir Okruhlica, M.D., Ph.D., Centrum pre lieebu drogovych zavis-losti, Hranicna 2, P.O. Box 51, 827 99 Bratislava 2, Slovack Republic. Phone/Fax +421 2 5341 7475 E-mail; [email protected]
Centrum pre lieebu drogovych zavislosti, Bratislava, SlovakiaFarmaceuticka faculta, Univerzita Komenskeho, Bratislava, Slovakia
Heroin Add & Rel Clin Probl 2005; 7(4): 49-58 Research Report
Methadone serum concentration and its relationship to methadone dose revisited
Lubomir Okruhlica, Jindra Valentova, Ferdinand Devinsky, Sona Formakova and Danica Klempova
Summary
The study sample included 64 patients, who were divided into two subgroups on the basis of their daily methadone dose: ´Group 1´: 29 patients with doses up to 80 mg; ´Group 2´: 35 patients with doses above 80 mg. The overall cor-relation in the whole group was: r = 0.570. A strong correlation was found between dose and serum concentration in ‘Group 1’: r = 0.799. Non-significant correlation close to zero was found in ‘Group 2’. Our findings suggest that the linear relationship between methadone dose and its serum concentration in lower doses cannot be extrapolated to higher doses.
Key Words: methadone maintenance - serum methadone concentration - methadone dose - linear relationship
Introduction
By now it is generally agreed that methadone concentration in serum may be sig-nificantly correlated with the amount of a drug available at the receptor level. That still leaves open the question whether it is possible to predict the proper daily dose of metha-done required to ensure the serum concentration appropriate to a particular patient by utilizing the relationship between a methadone dose and its serum concentration [17].
A wide variety of researchers have studied the relationship between methadone dose and methadone plasma/serum concentration [1, 2, 3, 5, 7, 9, 10, 11, 12, 14, 17, 19, 20, 21, 22, 23, 24, 25, and

50
Heroin Addiction and Related Clinical Problems
others]. Some of the studies also provided calculations of correlation coefficients between methadone doses and methadone plasma/serum concentrations, which ranged between weak and strong: Charlier et al. [3]: r = 0.20, (p < 0.05); Nicolaou et al. [15]: r = 0.41; De Vos et al. [4]: r = 0.50; Eap et al. [7]: r = 0.55, (p < 0.01); Wolff et al. [24]: r = 0.82, (p < 0.001). A strong linear correlation was reported by Wolff [24]. Many variables affect the kinetics of methadone. Some of the most pertinent include: compliance with treatment regimen, different pharmacogenetic dispositions of patients, phase of methadone treat-ment, induction period or steady state, and drug interactions with others. Variability, which may be attitutable to the out-patient treatment environment, was eliminated in the studies performed in closed metabolic wards [4]. Still, the correlation coefficient was only slightly above 0.5, so the dose could not explain much more than 25% of the methadone concentration in plasma.
The visual exploration of findings in our previous work [17] and the findings of the others on their scatter plots [2], where relationships between methadone dose and plasma/serum concentration were illustrated, suggested the relationships are different at higher and lower doses of methadone. The hypothesis was that the linear relationship between methadone doses and their serum concentrations differ significantly between the group of patients with lower methadone doses and that with the patients receiving higher doses of methadone.
Patients and Methods
Sample descriptionThe study group consisted of 64 patients who had been stabilized in the methadone
maintenance treatment programme (MMTP) for 614.8 days on average (SD ± 192.2, median 592, range 393-1,327) at the Centre for Treatment of Drug Dependencies in Bratislava. There were 52 males (81%) and 12 females (19%). Their average age was 25.8 years (SD ± 5.9; range 19-50). All of them were HIV negative and 46% were positive for HCV antibodies. There was no upper dose limit to their methadone maintenance. None of the patients had a recent history of positive urine screen for morphine. Prior to study entry, the number of days of their take-homes, which were granted on the basis of a past drug-free history of urinalyses, ranged from a minimum of one day at the end of the week to a maximum of 5 days of take-homes per week. In that case, take-homes were divided into two supervised provisions at the out-patient clinic, comprising one group of 2 and a second of 3 consecutive days per week.
Fieldwork ProceduresSubjects were asked to participate in a prospective study, in which they took metha-
done under supervision at the out-patient clinic every day for 14 consecutive days. Oral racemic methadone was dispensed in orange juice mixture once a day. After 14 days of supervised methadone intake, samples of venous blood were taken from the patients, approximately 24 hours after the previous intake of methadone dose for trough metha-

51
L. Okruhlica et al.: Methadone serum concentration and its relationship to methadone dose revisited
done serum concentration testing. All subjects had negative urinalyses for morphine at that time. Take-home privileges were renewed at a later stage.
Serum Sample AnalysisA quantitative analysis of blood samples using GC/MS methodology was performed
in a toxicological laboratory in order to detect trough serum methadone levels.Sample preparation for analysis
To a 0.5ml-aliquot of serum, 0.5 µl of proadifen (internal standard), 1ml of 0.2 M carbonate buffer, pH 10, and 5 ml of n-hexane were added. The extraction was performed in a shaker and lasted 20 min. After centrifugation (10 min, 2800 rpm), the organic layer was transferred into a separate tube and evaporated under a gentle stream of nitrogen at 40°C. The residue was reconstituted in 200µL of methanol. A sample of 1µl was analysed by GC.Conditions of GC analysis
GC analysis was performed on a HP 5890 gas chromatograph with a nitrogen-phos-phorus detector, equipped with an HP ULTRA 2 capillary column (12 x 0.2mm I.D., 0.33 µm film thickness of crosslinked 5% phenyl methyl silicone). The injection port (splitless) was set to 220°C. The column temperature had been initially held at 100°C for 1 min; later it was increased to 250°C (18°C/min), then held at 250°C for 2 min, then increased to 300°C at 30°C/min. The carrier gas was helium at 0.6 ml/min.
Statistical Analyses
Descriptive statistics (including variance), covariance and Pearson correlation (SPSS statistical software) have been applied in describing the relationship between methadone dose and methadone serum concentration. Data were then analysed with the use of AMOS statistical software. A model for testing variances and covariances equality simultaneously in the two groups allowed us to obtain more precise estimates (see Picture 1).
Ethical IssuesApproval was obtained from the Ethical Committee at the Centre for Treatment of
Drug Dependencies in Bratislava before the study was started.
Picture 1
Model
v a r _ d o s e
M e t h a d o n ed o s e ( m g )
v a r _ c o n c 1
M e t h a d o n e s e r u mc o n c e n t r a t i o n
(ng /m l )
cov1
v a r _ d o s e
M e t h a d o n ed o s e ( m g )
v a r _ c o n c 2
M e t h a d o n e s e r u mc o n c e n t r a t i o n
( n g / m l )
cov2
Picture 1. Model for testing variances and covariances equality simultaneously
52
Heroin Addiction and Related Clinical Problems
Results
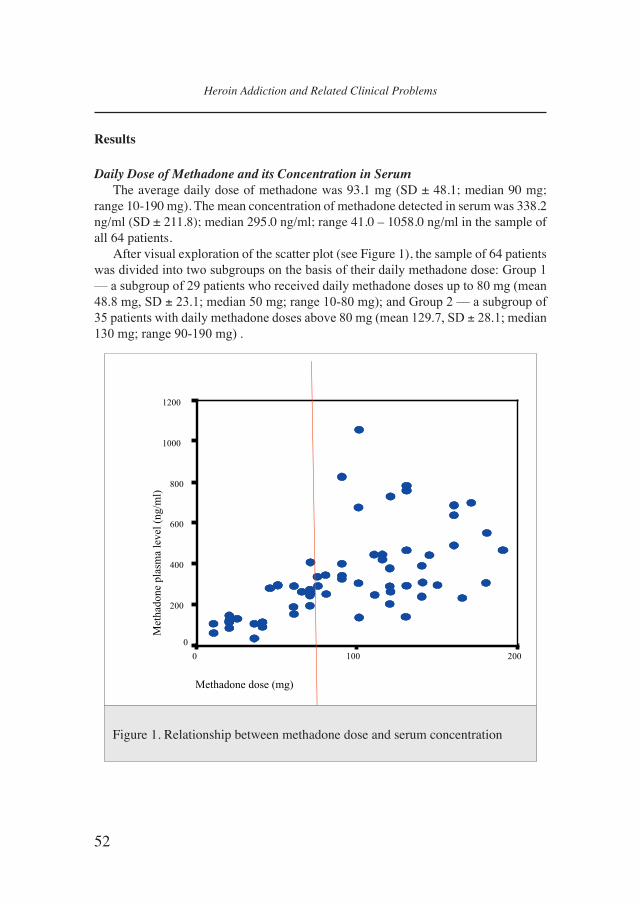
Daily Dose of Methadone and its Concentration in Serum The average daily dose of methadone was 93.1 mg (SD ± 48.1; median 90 mg;
range 10-190 mg). The mean concentration of methadone detected in serum was 338.2 ng/ml (SD ± 211.8); median 295.0 ng/ml; range 41.0 – 1058.0 ng/ml in the sample of all 64 patients.
After visual exploration of the scatter plot (see Figure 1), the sample of 64 patients was divided into two subgroups on the basis of their daily methadone dose: Group 1 –– a subgroup of 29 patients who received daily methadone doses up to 80 mg (mean 48.8 mg, SD ± 23.1; median 50 mg; range 10-80 mg); and Group 2 –– a subgroup of 35 patients with daily methadone doses above 80 mg (mean 129.7, SD ± 28.1; median 130 mg; range 90-190 mg) .
Graph 1
Relationship between methadone dose and serum concentration
Methadone dose (mg)
2001000
Methadone
plasmalevel(ng/ml)
1200
1000
800
600
400
200
0
Figure 1. Relationship between methadone dose and serum concentration
53
L. Okruhlica et al.: Methadone serum concentration and its relationship to methadone dose revisited
Variances and covariancesThe variance of methadone dose was s2 = 533.3 in Group 1, and s2 = 788.2 in Group
2. The methadone serum concentration variance was s2 = 9,609.8 in Group 1, and s2 = 47,239.1 in Group 2. The analysis of the relationship between methadone dose and methadone serum concentration revealed a covariance of 1,809.23 in Group 1, and a covariance of 27.1 in Group 2.
CorrelationsThe overall Pearson correlation found in the whole group was r = 0.570, p = 0.000.
A very strong and statistically significant correlation was found between methadone dose and methadone serum concentration in Group 1, with r = 0.799, p = 0.000. In this case, methadone dose was able to account for 64% of its serum levels. On the other hand, the correlation in Group 2 was close to zero and not significant, r = 0.004, p = 0.980.
Statistical ModelA statistical model was proposed for the simultaneous testing in the present study of
all relationships suggested by previous exploratory analysis. It has been supposed that the variance of methadone dose remains the same regardless of dose magnitude. The model assumed that while dose variance remains unchanged, methadone serum level variance might differ in the two groups. As the covariance between methadone dose and its level in serum was, statistically, not significantly different from zero in Group 2 –– implying that it could be considered noise –– it was set to zero.
Estimates: The model-induced estimate of variance of methadone dose for both groups was 652.030. For Group 1, the covariance between methadone dose and its level in serum was estimated at 2211.970 (S.E = 485.426, C.R = 4.557, p<0.001) and the estimated correlation was 0.831. In Group 2, covariance was set to 0, so the cor-relation was estimated at 0.000. The model had a good fit: Chi-Square = 1.187, df = 2, p = 0.552.
Discussion
Several authors [1, 2, 5, 9, 10, 11, 12, 14, 18, 23, 25] have suggested the use of serum levels in optimizing methadone doses for patients in a methadone maintenance treatment. A strong linear relationship between methadone dose and its plasma concentration was suggested by Wolff [24] in the early Nineties. However, Leavitt et al. [13] stated that, even if a strong correlation between methadone dose and concentration in serum has been found, the relationship may not be linear.
When reviewing the literature on the relationship between methadone doses and methadone concentrations in serum or plasma, one should be aware of many interfering and, probably, very important differences between the studies based on different sample characteristics, such as ceilings for a maximum daily dose of methadone in different MMTPs, inclusion of non-stabilized patients in studies, different take-home regimens, and so on. These are only some of the external or environmental factors that may influ-

54
Heroin Addiction and Related Clinical Problems
ence the methadone dose - serum relationship. Other variables which could play a role, such as intake of some medications during MMTP, or eating habits. The importance of these factors has been exemplified by Nicolaou’s study [15], where correlation was poor at the beginning: r = 0.37, but improved when non-compliers were excluded: r = 0.41, and was even stronger after the exclusion of outliers: r = 0.66.
The present study has attempted to minimize external interfering influences caused by possible behavioural irregularities and possibly incomplete compliance of patients with the treatment regimen, as far as possible in the out-patient conditions of the MMTP. The detected overall correlation of racemic methadone dose and its serum concentration was similar to those found by some other authors [4, 7, 15]. Despite strictly supervised methadone dispensing under experimental conditions, the correlation coef-ficient found in the whole sample in the present study was lower than those found by Loimer [14] or Wolff [24].
One hypothetical explanation for this is that it could be due to different frequency distributions of daily methadone doses of the subjects in the studies. While previous studies were based on data from MMTPs with more conservative dosing policies, the daily dose ceiling usually being around 100 mg, and, therefore, with lower average doses than those used in more recent studies, where the upper dose limit was left open, and maximum doses ranged up to 200 mg of methadone and above, with higher average daily doses of methadone in the samples.
It is probably no coincidence that, against the background of the wide variability of the findings reported in the literature, our overall correlation (r = 0.57) was practically identical with the correlation (r = 0.55) for racemic methadone found by Eap [7] for racemic methadone in his study under similar MMTP conditions and sample charac-teristics (sample size, age and gender of the patients, average dose, dose range).
The small covariance of data distribution is evident on the right side of the scatter-plot (Figure 1), which shows the relationship between higher methadone doses and their serum concentrations. This can also be seen on the scatter-plots presented by some other authors [2]. The resulting correlation coefficients in the sub-samples of patients (Group 1: r = 0.799; Group 2: r = 0.004) are in accordance with the hypothesis of the present study. The underlying cause of the phenomenon of heteroschedasticity should be a topic of future research.
Our study has not been concerned with other internal biological variables, such as body weight. A determination of phenotypes and/or genotypes of proteins such as cytochromes P450s, offers another valuable route to an understanding of methadone pharmacokinetics. What is more, the excretion of methadone via kidneys is pH-dependent [16] and methadone clearance was positively associated with haematocrit in Plummer’s study [19]. We did not, however, carry out checks one these variables in our study.
Due to the fact that racemic (R,S)-methadone consists of two enantiomers with different pharmacokinetic characteristics, of which (R)-methadone alone accounts for the majority, if not the all of the opioid effects of racemic (R,S)-methadone [8]. This must be taken into account when looking at the correlation between methadone doses and its
55
L. Okruhlica et al.: Methadone serum concentration and its relationship to methadone dose revisited
plasma concentrations. In Eap’s study [7], a correlation coefficient of r = 0.55 was found for racemic (R,S)-methadone, but only r = 0.34 for (S)-methadone; the correlation was as high as r = 0.69 for (R)-methadone. As there is marked interindividual variability in the R/S ratios of methadone in blood [6], further research could be oriented in this direction, too. One possible factor determining a weak correlation of methadone dose with serum concentration at higher doses may be differences in the pharmacokinetic action and elimination of (R)- and (S)-methadone enantiomers.
Our findings suggest that a linear model for the relationship between racemic methadone dose and methadone serum concentration can probably not be extrapolated to daily doses of methadone above 80 mg.
Conclusions
A linear relationship between methadone dose and its serum concentration was only found among patients taking lower methadone doses (up to 80 mg, in our study). Zero correlation was demonstrated for those with higher daily doses of the medication. A dose of racemic methadone is a good predictor of its serum blood levels at lower doses, but this does not hold with higher doses of methadone. The reason for this lies beyond the scope of this study and calls for further research.
Acknowledgements
We wish to acknowledge the support of the Protidrogovy Fund, which awarded us a grant, so allowing this research to be carried out. This project was also supported by the Ministry of Education of the Slovak Republic, via grant No. VEGA 1/1198/04.
References
1. BELL, J., SERES, V., BOWRON P., LEWIS, J., BATEY, R. (1988). The use of methadone levels in patients receiving methadone maintenance. Clinical Pharamcology and Therapy. 43(6):
623-629.2. BYRNE, A. (1998). Use of serum Levels for Optimising Doses in Methadone
Maintenance Treatment. Journal of Maintenance in the Addictions. 1(3): 13-14.
3. CHARLIER, C., DESSALLES, M.C., PLOMTEUX, G. (2001). Methadone maintenance treatment: is it possible to adapt the daily doses to metabolic activity of the patient? Therapeutic Drug Monitoring. 23(1): 1-3.
4. DE VOS, J.W., GEERLINGS, P.J., VAN DEN BRINK, W., UFKES, J.G.R., VAN WILGENBURG, H. (1995). Pharmocokinetics of methadone and its primary metabolite in 20 opiate addicts. European Journal of Clinical Pharmacology. 48(5): 361-366.
5. DOLE, V.P. (1988) Implications of methadone maintenance for theories of narcotic

56
Heroin Addiction and Related Clinical Problems
addiction. Journal of the American Medical Association. (260): 3025-3029. 6. EAP, C.B., FINKBEINER, T., GASTPAR, M., SCHERBAUM, M., POWELL, K., BAUMANN,
P. (1996): Replacement of (R)-methadone by a double dose of (R,S)-methadone in addicts: interindividual variability of the (R/S) ratios and evidence of adaptive changes in methadone pharmacokinetics. Eur. J. Clin. Pharmacol. 50: 385-389.
7. EAP, C.B., BERTSCHY, G., BAUMANN, P., FINKBEINER, T., GASTPAR, M., SCHERBAUM, N. (1998). Interindividual Variability of Methadone Enantiomer Blood Levels to Dose Ratios. Archives of General Psychiatry. 55(1): 89-90.
8. EAP, C.B., DÉGLON, J.J., BAUMAN, P. (1999). Pharmacokinetics and Pharmacogenetics of Methadone: Clinical Relevance. Heroin Add. & Clin. Probl. 1(1): 19-34.9.
9. HORNS, W.H., RADO, M., GOLDSTEIN A. (1975). Plasma levels and symptom complaints in patients maintained on daily dosage of methadone hydrochloride. Clinical Pharmacology and Therapy. 17(6): 636-649.
10. INTURRISI, C.E., VEREBELY, K. (1972). The levels of methadone in the plasma in methadone maintenance. Clinical Pharmacology and Therapeutics. 13(5): 633-637.
11. KELL, J.M. (1995). Utilization of Plasma and Urine Methadone Concentration Measurements to Limit Narcotic Use in Methadone Maintenance Patients: II. Generation of Plasma Concentration Response Curves. Journal of Addictive Diseases. 14(1):85-108.
12. KREEK, M.J. (1973). Plasma and urine levels of methadone. Comparison following four medication forms used in chronic maintenance treatment. New York State Journal of Medicine. 73(23): 2773-2777.
13. LEAVITT, S.B., SCHINDERMAN, M., MAXWELL, S., EAP, C.B., PARIS, P. (2000). When “Enough” is Not Enough: New Perspectives on Optimal Methadone Maintenance Dose. Mount Sinai Journal of Medicine. 67(5-6): 404- 411.
14. LOIMER, N., SCHMID, R.(1992). The use of plasma levels to optimize methadone maintenance treatment. Drug and Alcohol Dependence. 30(3): 241-246.
15. Nicolaou, K., Wollf, K., Winstock, A., Finch, E., Strang, J. (2000). The influence of body weight on the kinetics of methadone. International Harm Reduction Conference (Poster, Book of Abstracts), New Jersey.
16. NILSSON, M.I., WIDERLOV, E., MERESAAR, U., ANGGARD, E. (1982). Effect of urinary pH on the disposition of methadone in man. European Journal of Clinical Pharmacology. 22(4): 337-342.
17. OKRUHLICA, L., DEVINSKY, F., VALENTOVA, J., KLEMPOVA, D. (2002). Does therapeutic threshold of methadone concentration in plasma exist? Heroin Add. & Rel. Clin. Probl. 4(1): 29-36.
18. PAYTE, J.T., KHURI, E.T. (1993). Principles of methadone dose determination. In: State Methadone Treatment Guidelines. Rockville, Md: US Dept of Health and Human Services,47-58.
19. PLUMMER, J.L., GOURLAY, G.K., CHERRY, D.A. COUSINS, M.J. (1998). Estimation of methadone clearance: application in the management of cancer pain. Pain. 33(3):
57
L. Okruhlica et al.: Methadone serum concentration and its relationship to methadone dose revisited
313 - 322.20. TENNANT, F.S. JR., RAWSON, R.A., COHEN, A., TARVER, A., CLABOUGH, D. (1983).
Methadone plasma levels and persistent drug abuse in high dose maintenance patients. Subst. Alcohol Actions Misuse. 4(5): 369-374.
21. TENNANT, F.S. (1987). Inadequate Plasma Concentrations in Some High-Dose Methadone Maintenance Patients. American Journal of Psychiatry. 144(10):1349-1350.
22. TORRENS, M., CASTILLO, C., SAN, L., DEL MORAL, E., GONZALES, M.L., DE LA TORE, R. (1998). Plasma methadone concentrations as an indicator of opioid withdrawal symptoms and heroin use in a methadone maintenance program. Drug and Alcohol Dependendence. 52(7): 193-200.
23. WOLFF, K., SANDERSON, M., HAY, A.W.M., RAISTRICK, D. (1991). Methadone concentrations in plasma and their relationship to drug dosage. Clinical Chemistry. 37(3): 205-209.
24. WOLFF, K., SANDERSON, M., HAY, A.W.M., RAISTRICK, D. (1991). Methadone concentrations in plasma and their relationship to drug dosage. Comment in: Clinical Chemistry. 38(3): 438-439.
25. WOLFF, K., ROSTAMI-HODJEGAN, A., HAY, A.W., RAISTRICK, D., TUCKER, G. (2000).Population-based pharmacokinetic approach for methadone monitoring of opiate addicts: potential clinical utility. Addiction. 95(12): 1771-1783.
Received December 8, 2004 - Accepted August 25, 2005

58
Heroin Addiction and Related Clinical Problems
Related Documents