Federal Real Property Report An Overview of the U.S. Federal Government’s Real Property Assets FY 2005 The Federal Real Property Council’s June 2006

Welcome message from author
This document is posted to help you gain knowledge. Please leave a comment to let me know what you think about it! Share it to your friends and learn new things together.
Transcript

Federal Real Property Report
An Overview of the U.S. Federal Government’sReal Property Assets
FY 2005The Federal Real Property Council’s
June 2006
Executive Order13327 created the Federal RealProperty Council, establishedthe role of the Senior RealProperty Officer, andmandated the creation of acentralized real propertydatabase.
At the same time, “realproperty” was added to the President’sManagement Agenda.

Introduction
FY 2005 Federal Real Property Report 1
On behalf of the Federal Real Property Council (FRPC), GSA’s Office of
Governmentwide Policy (OGP) is pleased to present the results of the FY 2005
governmentwide real property data collection.
With the issuance of Executive Order 13327 in February 2004, OGP was formally recognized
as the administrator of the centralized real property database, known as the Federal Real
Property Profile (FRPP). In 2005, the FRPC defined 23 real property data elements for the
FRPP database. All executive branch agencies were required to submit data to the FRPP, at the
constructed asset level, for each of the data categories by December 15, 2005.
This executive summary marks the first reporting year for the newly defined, governmentwide
data elements, required by Executive Order 13327. In subsequent years, historical trend
analysis of the FRPP data will be possible.
The goals of Executive Order 13327 are to:
• Promote efficient and economical use of real property resources.
• Increase agency accountability and management attention to real
property reform.
• Establish clear real property goals and objectives.
The goals of the centralized database are to:
• Improve decision making with accurate and reliable data.
• Provide the ability to benchmark Federal real property assets.
• Consolidate governmentwide real property data collection into
one system.
FRPC Organization and Committees
* Performance Measures Committee became a working group of the Inventory Committee in March 2006.
*

FY 2005 Federal Real Property Report 2
We would like to recognize the tremendous effort undertaken by the Federal
agencies to capture and report on the 23 data elements defined by the FRPC.
Within one year of issuing the FRPC guidance, agencies have overcome many
obstacles in order to successfully report the required data.
We also thank the FRPC Committees, especially the Inventory Committee, for the
numerous hours they devoted to this initiative. The Committees collaborated to
develop detailed specifications for a Federal database capable of handling data for
one of the world’s most complex and diverse real estate portfolios.
We particularly thank the Chair of the Inventory Committee, Phil Grone, from the
Department of Defense, and the Co-Chairs of the Inventory Committee’s Technical
Working Group, Stan Kaczmarczyk (GSA) and Lora Muchmore (DOD).
Acknowledgements
FY 2005 Federal Real Property Report 3
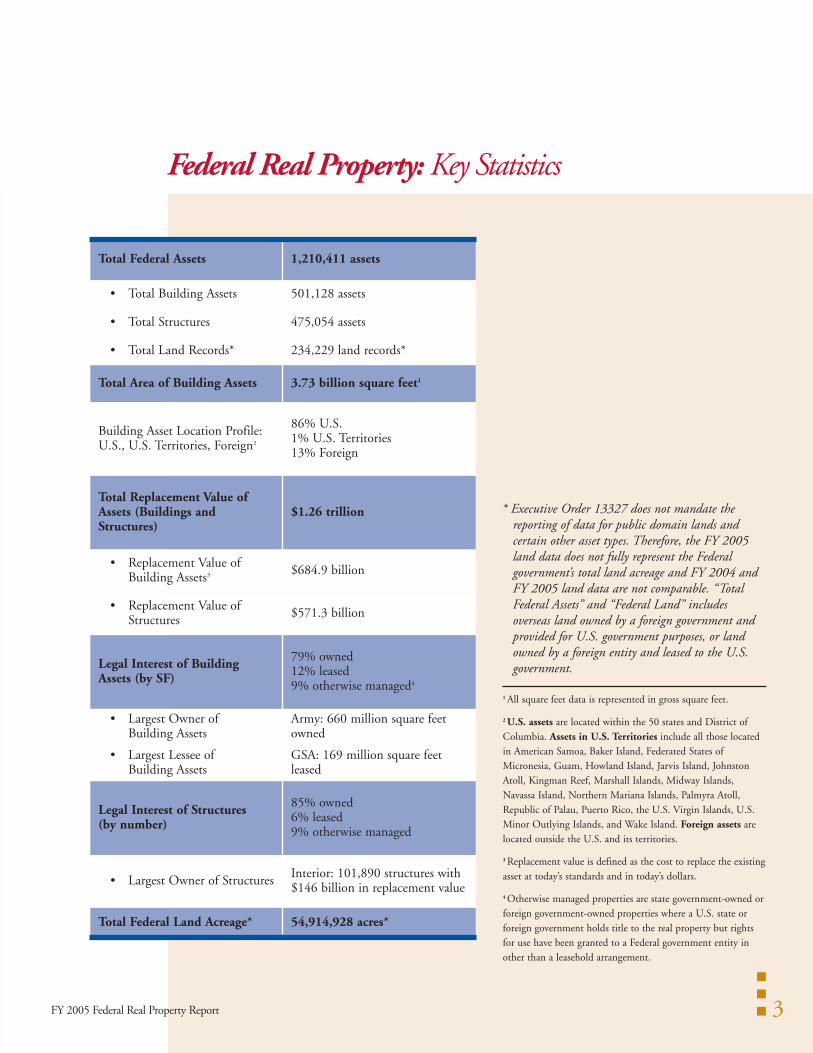
Total Federal Assets 1,210,411 assets
• Total Building Assets 501,128 assets
• Total Structures 475,054 assets
• Total Land Records* 234,229 land records*
Total Area of Building Assets 3.73 billion square feet1
Building Asset Location Profile: U.S., U.S. Territories, Foreign2
86% U.S. 1% U.S. Territories13% Foreign
Total Replacement Value ofAssets (Buildings andStructures)
$1.26 trillion
• Replacement Value ofBuilding Assets3 $684.9 billion
• Replacement Value ofStructures $571.3 billion
Legal Interest of BuildingAssets (by SF)
79% owned12% leased9% otherwise managed4
• Largest Owner of Building Assets
Army: 660 million square feetowned
• Largest Lessee of Building Assets
GSA: 169 million square feetleased
Legal Interest of Structures (by number)
85% owned6% leased9% otherwise managed
• Largest Owner of Structures Interior: 101,890 structures with $146 billion in replacement value
Total Federal Land Acreage* 54,914,928 acres*
* Executive Order 13327 does not mandate thereporting of data for public domain lands andcertain other asset types. Therefore, the FY 2005land data does not fully represent the Federalgovernment’s total land acreage and FY 2004 andFY 2005 land data are not comparable. “TotalFederal Assets” and “Federal Land” includesoverseas land owned by a foreign government andprovided for U.S. government purposes, or landowned by a foreign entity and leased to the U.S.government.
1 All square feet data is represented in gross square feet.
2 U.S. assets are located within the 50 states and District ofColumbia. Assets in U.S. Territories include all those locatedin American Samoa, Baker Island, Federated States ofMicronesia, Guam, Howland Island, Jarvis Island, JohnstonAtoll, Kingman Reef, Marshall Islands, Midway Islands,Navassa Island, Northern Mariana Islands, Palmyra Atoll,Republic of Palau, Puerto Rico, the U.S. Virgin Islands, U.S.Minor Outlying Islands, and Wake Island. Foreign assets arelocated outside the U.S. and its territories.
3 Replacement value is defined as the cost to replace the existingasset at today’s standards and in today’s dollars.
4 Otherwise managed properties are state government-owned orforeign government-owned properties where a U.S. state orforeign government holds title to the real property but rightsfor use have been granted to a Federal government entity inother than a leasehold arrangement.
Federal Real Property: Key Statistics
FY 2005 Federal Real Property Report 4
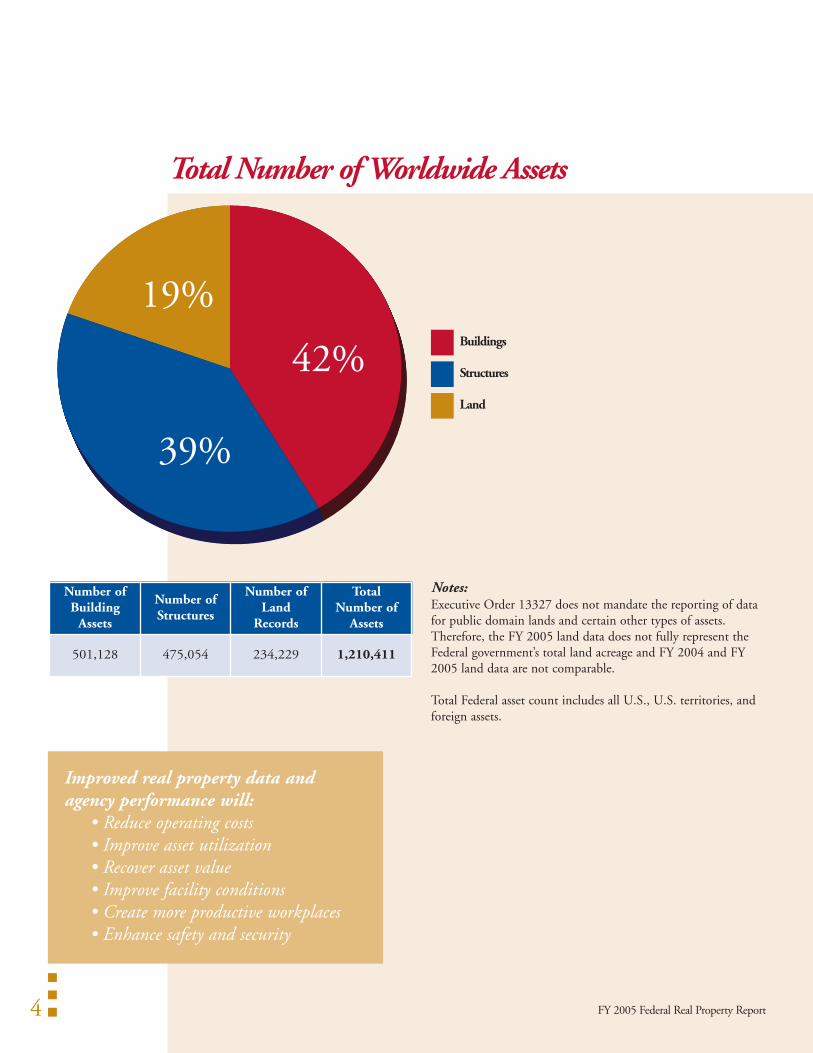
Improved real property data andagency performance will:
• Reduce operating costs• Improve asset utilization• Recover asset value• Improve facility conditions• Create more productive workplaces• Enhance safety and security
Number ofBuilding
Assets
Number ofStructures
Number ofLand
Records
TotalNumber of
Assets
501,128 475,054 234,229 1,210,411
Notes:Executive Order 13327 does not mandate the reporting of datafor public domain lands and certain other types of assets.Therefore, the FY 2005 land data does not fully represent theFederal government’s total land acreage and FY 2004 and FY2005 land data are not comparable.
Total Federal asset count includes all U.S., U.S. territories, andforeign assets.
Total Number of Worldwide Assets
Buildings
Structures
Land
39%
19%
42%
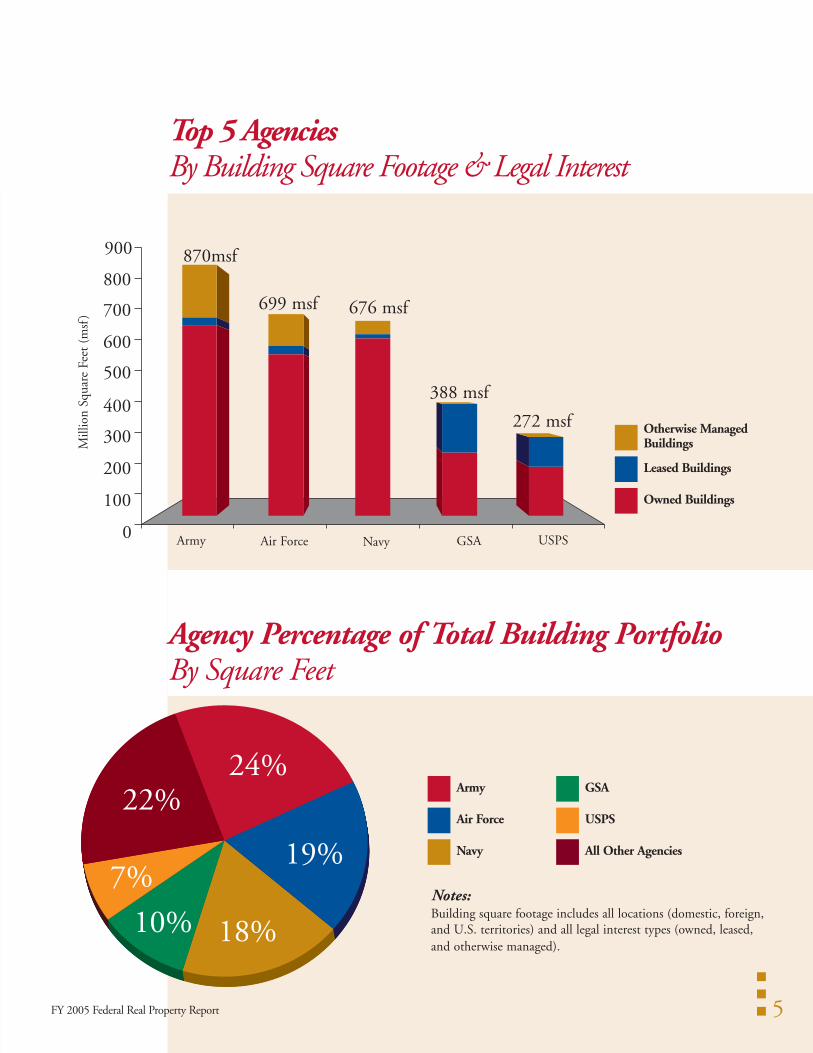
Top 5 AgenciesBy Building Square Footage & Legal Interest
FY 2005 Federal Real Property Report 5
GSA
USPS
All Other Agencies
Army
Air Force
Navy
Otherwise ManagedBuildings
Leased Buildings
Owned Buildings
Agency Percentage of Total Building PortfolioBy Square Feet
Notes:Building square footage includes all locations (domestic, foreign,and U.S. territories) and all legal interest types (owned, leased,and otherwise managed).
900 870msf
699 msf 676 msf
388 msf
272 msf
800
700
600
500
400
300
200
100
0
Mill
ion
Squa
re F
eet
(msf
)
Army Air Force Navy GSA USPS
24%
19%
18%10%
7%
22%

Predominant Use of Building AssetsTop 5 Uses By Square Footage
FY 2005 Federal Real Property Report 6
Predominant Use Square Feet (SF)
Office 745,201,480
Family Housing 687,330,307
Warehouse 466,447,830
Service Facility 455,222,266
Institutional 202,282,472
All Other Uses 1,173,300,847
TOTAL SQUARE FEET 3,729,785,202
Definitions:• Office: Buildings primarily used for office space or military
headquarters. • Family Housing: Buildings primarily used as dwellings for
families/dependents. Includes apartment houses, singlehouses, row houses, public housing, military personnelhousing, Federal employee housing, and housing forinstitutional personnel.
• Warehouse: Buildings used for storage, such as ammunitionstorage, covered sheds, and buildings primarily used forstorage of vehicles or materials. Also included areunderground or earth covered ammunition storage bunkersand magazines. This category excludes water reservoirs andPOL storage tanks which are storage structures.
• Service Facility: Buildings used for service activities, such asmaintenance and repair shops, dry cleaning plants, postexchange stores, airport hangars, and buildings primarilyused for vehicle maintenance and repair.
• Institutional: Buildings used for institutional purposes otherthan schools, hospitals, and prisons, such as libraries,chapels, museums, and out-patient clinics. This category alsoincludes food preparation and dining facilities, buildingshousing entertainment and recreational activities, andvisitor’s centers.
• All Other: Includes all other predominant use categories,which are: hospital, post office, prison, school,dormitories/barracks, industrial, communications systems,navigation and traffic aids, laboratories, and all otherbuildings that cannot be classified elsewhere.
20%
18%
13%12%5%
32%Service Facility
Institutional
All Other Uses
Office
Family Housing
Warehouse

Predominant Use of Structures By Replacement Value
FY 2005 Federal Real Property Report 7
Predominant Use Replacement Value
Utility Systems $104,737,372,926
Flood Control and Navigation $94,975,607,778
Power Development and Distribution $58,314,021,116
Reclamation and Irrigation $52,334,201,592
Roads and Bridges $42,964,094,359
All Other Structure Uses $194,972,197,162
TOTAL REPLACEMENT VALUE $571,284,928,313
Definitions:• Utility Systems: Heating, sewage, water, and electrical
systems when they serve several buildings or otherstructures of an installation. Includes heating plants andrelated steam and gas lines; sewage disposal plants; stormand sanitary sewer lines; water treatment plants, wells,pump houses, reservoirs, and pipelines; electricalsubstations; standby or auxiliary power plants; lightingstructures and conduits.
• Flood Control and Navigation: River improvements,revetments, dikes, dams, and docks.
• Power Development and Distribution: Hydroelectric andother power development projects that produce power forresale (generally consisting of dams and powerhouses).Includes transmission lines.
• Reclamation and Irrigation: Canals, laterals, pumpingstations, storage, and diversion dams.
• Roads and Bridges: Federally-owned highways, roads,related culverts, and connecting bridges. Includes surfacedand unsurfaced roads within national parks and forests,military installations, and other federal installations.
• All Other Predominant Uses include airfield pavements,harbors and ports, storage (other than buildings), industrial(other than buildings), service (other than buildings), spaceexploration structures, parking structure, research anddevelopment (other than laboratories), communicationssystems, navigation and traffic aids (other than buildings),recreational (other than buildings), railroads, monumentsand memorials, miscellaneous military facilities, weaponsranges, and other structures that cannot be classified underthe above categories.
$100
$80
$60
$40
$20
$120
0 UtilitySystems
Flood Control &Navigation
PowerDevelopment
& Distribution
Reclamation& Irrigation
Roads &Bridges
Bill
ions
($)

Legal Interest of Building AssetsBy Square Feet
FY 2005 Federal Real Property Report 8
Definitions:• Owned: The Federal government has fee-simple interest for
the real property.• Leased: The rights to use the real property have been
assigned to the Federal government by a private entity or anon-Federal government entity for a defined period of timein return for rental payments.
• Otherwise Managed properties are state government-ownedor foreign government-owned, in which a U.S. state orforeign government holds title to the real property but rightsfor use have been granted to a Federal government entity inother than a leasehold arrangement.
LOCATIONOwned Building
AssetsLeased Building
Assets
OtherwiseManaged Building
AssetsTOTALS
United States (U.S.) 2,817,471,004 379,842,263 779,264 3,198,092,531
U.S. Territories 28,515,754 1,967,310 8,570 30,491,634
Foreign (non-U.S.) 62,405,631 77,612,829 321,459,087 461,477,547
Locations Not Reported 7,291,707 703,144 31,728,638 39,723,489
TOTAL SQUARE FEET 2,915,684,096 460,125,546 353,975,559 3,729,785,201
79%
9%12%
Owned Buildings
Leased Buildings
Otherwise Managed Buildings

Location Profile of Building AssetsBy Square Feet
FY 2005 Federal Real Property Report 9
Notes:• U.S. Assets are located within the 50 states and District of
Columbia. • Foreign assets are those assets located outside the U.S. and
its territories.• Assets in U.S. Territories include assets located in American
Samoa, Baker Island, Federated States of Micronesia,Guam, Howland Island, Jarvis Island, Johnston Atoll,Kingman Reef, Marshall Islands, Midway Islands, NavassaIsland, Northern Mariana Islands, Palmyra Atoll, Republicof Palau, Puerto Rico, the U.S. Virgin Islands, U.S. MinorOutlying Islands, and Wake Island.
86%
13%1%
U.S. Assets
Foreign Assets
U.S. Territories’ Assets

State ProfileBy Building Square Footage & Legal Interest
FY 2005 Federal Real Property Report 10
State Owned SF Leased SF Otherwise
Managed SF Total SF
Alabama 53,520,462 5,897,043 8,662 59,426,167
Alaska 50,801,698 5,131,342 13,144 55,946,184
Arizona 56,426,079 4,841,312 29,786 61,297,177
Arkansas 21,502,889 2,930,705 0 24,433,594
California 355,747,932 29,520,438 72,918 385,341,288
Colorado 54,495,637 8,390,122 27,280 62,913,039
Connecticut 17,043,912 1,841,749 0 18,885,661
Delaware 7,805,392 498,157 0 8,303,549
District of Columbia
68,413,986 22,668,988 0 91,082,974
Florida 115,607,493 16,748,418 109,003 132,464,914
Georgia 112,656,529 13,208,718 0 125,865,247
Hawaii 59,967,355 1,335,903 0 59,303,258
Idaho 17,755,511 2,972,919 6,826 20,735,256
Illinois 81,040,149 8,657,352 20,000 89,717,501
Indiana 31,724,753 4,547,101 0 36,271,854
Iowa 12,453,286 3,810,197 0 16,263,483
Kansas 41,117,701 4,334,027 0 45,451,728
Kentucky 51,547,758 4,283,235 0 55,830,993
Louisiana 41,361,467 6,392,189 42,571 47,796,227
Maine 11,864,461 1,571,600 0 13,436,061
Maryland 112,762,295 22,500,682 2,450 135,265,427
Massachusetts 34,893,027 5,982,357 119,830 40,995,214
Michigan 28,710,587 6,931,845 16,990 35,659,422
Minnesota 19,351,202 3,445,479 0 22,796,681
Mississippi 34,990,961 3,489,383 0 38,480,344
400
350
300
250
200
150
100
50
0CA TX VA MD FL
Mill
ion
Squa
re F
eet
(msf
)
Owned Buildings
Leased Buildings
Otherwise Managed Buildings
Top 5 States

FY 2005 Federal Real Property Report 11
State Owned SF Leased SF Otherwise
Managed SF Total SF
Missouri 48,109,225 9,070,782 1,200 57,181,207
Montana 14,750,702 2,547,331 0 17,298,033
Nebraska 13,816,517 2,513,987 0 16,330,504
Nevada 31,710,007 2,686,735 3,091 34,399,833
New Hampshire 3,324,553 1,261,136 834 4,586,523
New Jersey 46,376,442 9,271,935 0 55,648,377
New Mexico 58,420,280 5,202,239 2,176 63,624,695
New York 98,312,394 19,163,838 16,482 117,492,714
North Carolina 86,879,855 7,433,528 0 94,313,383
North Dakota 20,069,498 1,451,558 19,836 21,540,892
Ohio 69,883,325 8,640,064 409 78,523,798
Oklahoma 56,912,654 8,526,293 0 65,438,947
Oregon 22,117,017 4,375,486 320 26,492,823
Pennsylvania 76,089,435 13,055,268 0 89,144,703
Rhode Island 13,547,767 684,116 11,634 14,243,517
South Carolina 62,958,162 3,290,609 0 66,248,771
South Dakota 15,888,229 3,221,841 0 19,110,070
Tennessee 67,833,341 6,096,336 1,812 73,931,489
Texas 184,673,541 26,290,654 39,030 211,003,225
Utah 31,745,434 4,259,063 0 36,004,497
Vermont 2,739,452 1,367,870 0 4,107,322
Virginia 155,933,110 28,997,337 0 184,930,447
Washington 85,889,378 7,805,394 0 93,694,772
West Virginia 18,261,516 3,481,825 0 21,743,341
Wisconsin 21,861,580 4,958,101 0 26,819,681
Wyoming 13,791,655 909,900 0 14,701,555
Locations NotReported
4,013,418 1,347,776 212,976 5,574,170
TOTAL SF 2,815,457,591 378,494,487 566,284 3,198,092,532
The Top 5 States (CA, TX, VA,MD, FL)comprise
33% of thetotal Federalbuildingportfolio, measured bysquare footage.

Top 5 AgenciesBy Replacement Value
FY 2005 Federal Real Property Report 12
AgencyBuilding Assets:
ReplacementValue
Structures:Replacement
Value
TotalReplacement
Value
Army $150.6 billion $70.4 billion $221.0 billion
Air Force $125.3 billion $78.3 billion $203.6 billion
Navy $122.6 billion $79.4 billion $202.0 billion
Dept. ofInterior
$18.5 billion $146.4 billion $164.8 billion
Corps ofEngineers
$4.7 billion $143.4 billion $148.1 billion
Definitions:• Replacement Value: The cost to replace the existing
constructed asset at today’s standards and today’s dollars. • Structures are classified as airfield pavements, harbors and
ports, power development and distribution, reclamationand irrigation, flood control and navigation, storage (otherthan buildings), industrial (other than buildings), service(other than buildings), space exploration structures, parkingstructure, research and development (other thanlaboratories), utility systems, communications systems,navigation and traffic aids (other than buildings),recreational (other than buildings), roads and bridges,railroads, monuments and memorials, miscellaneousmilitary facilities, weapons ranges, and other structures thatcannot be classified under the above categories.
$250
$200
$150
$100
$50
$0Army Navy Interior Corps of
EngineersAir Force
Mill
ions
Structures
Buildings
Total Replacement Values• Building Assets: $684.9 billion• Structures: $571.3 billion
Total: $1.26 trillion

Agency ProfileBuilding Assets By Legal Interest & Square Footage
Agency Name Owned Square Feet Leased Square FeetOtherwise Managed
Square FeetTotal
Square Feet
Agriculture 39,577,343 14,925,532 0 54,502,875
Air Force 559,299,887 28,859,314 111,113,849 699,273,050
American Battle MonumentsCommission
0 2,000 442,460 444,460
Army 660,398,263 25,694,426 183,565,355 869,658,044
Commerce 6,555,724 912,733 0 7,468,457
Corps of Engineers 13,385,284 20,345,169 0 33,730,453
Defense/WHS 8,639,542 758,785 0 9,398,327
Energy 125,041,236 6,439,987 0 131,481,223
Environmental Protection Agency 3,739,583 243,732 0 3,983,315
General Services Administration 218,983,699 168,857,475 0 387,841,174
Health and Human Services 31,449,459 3,952,982 0 35,402,441
Homeland Security 40,040,320 1,292,741 0 41,333,061
Independent Government Offices 711,519 28,754 0 740,273
Interior 89,923,692 3,730,792 421,376 94,075,860
Justice 65,453,695 2,879,846 0 68,333,541
Labor 20,577,776 3,906,290 0 24,484,066
National Aeronautics and SpaceAdministration
44,352,539 656,718 0 45,009,257
National Archives and RecordsAdministration
3,928,964 543,194 0 4,472,158
National Science Foundation 1,738,142 198,183 8,691 1,945,016
Navy 615,367,331 14,080,086 46,119,134 675,566,551
Peace Corps 0 2,574,659 0 2,574,659
State 22,207,031 37,006,356 12,205,842 71,419,229
State (USAID) 567,374 4,261,254 98,852 4,927,480
Tennessee Valley Authority 4,323,627 0 0 4,323,627
Transportation 19,045,921 7,512,592 0 26,558,512
Treasury 4,268,741 1,430,460 0 5,699,201
United States Postal Service 170,211,194 101,783,054 0 271,994,249
Veterans Affairs 145,896,210 7,248,432 0 153,144,642
TOTAL SF 2,915,684,096 460,125,546 353,975,559 3,729,785,201

Published by GSA Office of Governmentwide Policy
Related Documents