2011 edition The Eurostat publications graphical style guide Visual identity

Welcome message from author
This document is posted to help you gain knowledge. Please leave a comment to let me know what you think about it! Share it to your friends and learn new things together.
Transcript

2011 edition
The Eurostat publications graphical style guide
V i s u a l i d e n t i t y


Contents
The Eurostat logo ................................................................... 5
■■ The Eurostat logo ........................................................................................................6
Eurostat logo and European emblem ..................................................................6Black and white version ........................................................................................6Background colour for the logo ...........................................................................6All language versions ............................................................................................7Positioning of the logo with flag on a page ........................................................8Co-editions .............................................................................................................9Logo usage in very small sizes .............................................................................9Positioning of text with the basic Eurostat logo ................................................9Additional logo ......................................................................................................9Summary of don’ts...............................................................................................10
Eurostat visual identity for Eurostat publication cover pages ........................................ 11
■■ Concept and basic principles ..................................................................................12
■■ Cover components ...................................................................................................13
■■ The series ...................................................................................................................14
Statistical books ...................................................................................................15Methodologies & Working papers .....................................................................18Pocketbooks .........................................................................................................18Compact guides ...................................................................................................18Statistics in focus ................................................................................................18
■■ Eurostat themes ........................................................................................................19
List of themes and translations ..........................................................................19List of theme colours ...........................................................................................19Colour use on cover pages ..................................................................................20
■■ The curves ..................................................................................................................21
Statistical books ...................................................................................................21Methodologies & Working papers .....................................................................22Pocketbooks .........................................................................................................23Compact guides ...................................................................................................23
■■ The images .................................................................................................................24
■■ Font usage on cover pages .......................................................................................25
■■ Commented A4 covers ............................................................................................27
■■ Commented B5 covers .............................................................................................29
■■ Commented A5 covers ............................................................................................30
■■ Commented CD/DVD covers ................................................................................31
■■ Commented CD/DVD inlays .................................................................................32
■■ Commented Pocketbook covers .............................................................................33
■■ Commented Compact guide covers .......................................................................34
■■ Some examples ..........................................................................................................35

uuu Eurostat visual identity for interior pages ................................................................. 37
■■ Colour palettes for graphs and maps .....................................................................38
General colour overview ....................................................................................38The colour palettes in detail ...............................................................................39
■■ Colour usage for graphs and maps .........................................................................48
■■ Font usage in the layout ...........................................................................................67
■■ Page layout — A4 general structure .......................................................................68
A4 page separators ..............................................................................................69A4 main style sheets ............................................................................................70Methodologies & Working papers ....................................................................72
■■ Page layout — B5 general structure .......................................................................74
B5 page separators ...............................................................................................75B5 style sheets ......................................................................................................76
■■ Page layout — Pocketbook general structure .......................................................78
Pocketbook page separators ...............................................................................79Page layout — Landscape pocketbook general structure ...............................80Landscape pocketbook page separators ...........................................................81Pocketbook style sheets (also applicable for A5 publications) ......................82
■■ Page layout — A5 general structure .......................................................................84
A5 page separators ..............................................................................................85
■■ Page layout — Compact guide general structure .................................................86
Compact guide style sheets ................................................................................88Example of Compact guides ..............................................................................89
■■ Tables — best practices ............................................................................................90
■■ Tables — samples ......................................................................................................92

The Eurostat logo

6 Graphical style guide
1 Eurostat logo
Eurostat logo and European emblem
Eurostat, as part of the European Commission, must be recognised as the official author of the publication. This means that both logos — the Eurostat logo and the Commission flag — have to be displayed on the cover. In order to guarantee a harmonised and balanced presentation of both logos, these have been compiled in a specific version made of:
• the Eurostat logo,• the European emblem,• the text ‘European Commission’.
As the ‘European Commission’ text refers to the emblem, it is always aligned right, with the logo. The ‘European Commision’ text, accompanying the logo, can be omitted on multilingual publications, on promotional gadgets or, more generally, if the logo is displayed in a size of less than 11 mm height.
Black and white version
For the black and white version, the blue is replaced by black and the yellow by white.
The logo is inspired by Eurostat’s mission to harmonise data. The wave symbolises the streams of data coming from the Member States, which are harmonised and given added value at Eurostat.
The Eurostat logo
CMYK: C = 100, M = 80, Y = 0, K = 0PMS: Pantone Reflex BlueRGB: R = 0, G = 51, B = 153Web Safe: #039
CMYK: C = 0, M = 0, Y = 100, K = 0PMS: Pantone Process YellowRGB: R = 255, G = 255, B = 0Web Safe: #FF0
Background colour for the logo
When used on a coloured background, the white version should be used. The blue version of the logo should only be used on a white background or on one of very light colours.

7 Graphical style guide
1Eurostat logo
All language versions
bg
it
de
mt
es
pt
fr
sl
cs
lt
el
nl
et
ro
ga
sv
da
lv
en
pl
fi
sk
hu

8 Graphical style guide
1 Eurostat logo
Further accompanying text
Positioning of the logo with flag on a page
The content of letters should be aligned with the ‘e’ of the Eurostat logo, NOT with the logo itself
As explained above, this version of the logo is aligned on a right axis. For that reason it is recommended to postion the logo on the right. This is also valid for further accompanying text. An exception to this rule is the letterhead, where the logo with flag stands on the left side. In that case, leave enough space between header and letter content.
12
3 4
6789
1011
1718
12
13
1415
16
19
5
50
25
28 28
Caption
1. Directorate: Times 12 pt2. Unit: Times 12 pt; space after: 18 pt
3. Place and date: Times 12 pt; indent: 100 mm4. Ares reference: Times 10 pt; indent: 100 mm
5. Registered: Times 12 pt; small caps
6. Recipient Society: Times 12 pt; indent: 100 mm7. Recipient Name: Times 12 pt; indent: 100 mm8. Recipient Function: Times 12 pt; indent: 100 mm9. Recipient Function: Times 12 pt; indent: 100 mm10. Postal Code + City: Times 12 pt; indent: 100 mm11. Country: Times 12 pt; indent: 100 mm
12. Subject: Times 12 pt; space before: 24 pt; space after: 18 pt
13. Reference: Times 12 pt; space after: 18 pt
14. Salutation: Times 12 pt; space after: 6 pt
15. Body: Times 12 pt; space after: 6 pt
16. Closing: Times 12 pt; space before: 6 pt; space after: 6 pt
17. Signature Name: Times 12 pt; indent: 80 mm; text centred
18. Signature Function: Times 12 pt; indent: 80 mm; text centred
19. Annexes: Times 12 pt; space before: 24 pt

9 Graphical style guide
1Eurostat logo
recommandations manual —2nd edition
2009 edition
Foreign Affi liaTes statistics (FATs)
KS-A
R-09-014-EN-C
Foreig
n A
ffi liaTes statistics (FATs) ■
reco
mm
and
ation
s man
ual —
2nd
editio
n
M e t h o d o l o g i e s & W o r k i n g p a p e r s
1977‑0375
20
09
ed
ition
Logo usage in very small sizes
To enhance the readability of the logo in very small sizes (< 11 mm high) a more suitable version should be used.
Co-editions
When publishing a co-edition, other logos may need to be displayed next to Eurostat logo. If this is the case, the Eurostat logo will keep its original positioning to stay compliant with the graphical style guide. The logos to be added will be aligned horizontally with the Eurostat logo, but on the left side of the page, keeping a margin equal to the text information displayed on the page (title and edition).
Additional logo
Positioning of text with the basic Eurostat logo
Whereas for the logo version with flag, text is aligned on the right (because of its relation with the flag), when you use the basic version you can fix text to the left as shown in the graphic.
Fonts that can be added are from the Myriad Pro family, or Arial. Size can vary. Take care to use narrow interlinear spacing in order to balance the close position to the logo. The colour must be selected from among the logo shades.
Alitati nus dolesto quassit corumqu amendi int omnihil Uptae in reptatum hicillo riossimus

10 Graphical style guide
1 Eurostat logo
10 Graphical style guide
Eurostat logo1
Summary of don’ts
the statistical office of the european union
•don’t stretch the logo
•don’t align ‘European Commission’ with ‘eurostat’
•don’t align additional text close below the left axis of the logo
•don’t use the version with the ‘European Commission’ text, for displays under 11 mm height
•don’t use the blue version on bright colours
•don’t change the position of the Eurostat logo to add a co-edition logo

Eurostat visual identity for Eurostat publication cover pages

Eurostat visual identity for Eurostat publication cover pages
12 Graphical style guide
2
Concept and basic principles
The style guide is built on the idea of ascending curves which stand for movement and evolution. Curves are also representative of Eurostat’s activity: providing harmonised statistics to the users.
Several very simple principles characterise this graphical chart:
■ focus on the announcer■ separation between text and picture elements■ colour-coded thematic organisation■ transparency as a binding element between visual and textual information

13 Graphical style guide
Eurostat visual identity for Eurostat publication cover pages 2
Cover componentsAnnouncer Series
ISSN if applicable
Title (title 1 and title 2)
Photo or illustration
Coloured curved areas and lines
Edition (except for yearbooks)
White curved area
Signature
Catalogue number
Front cover photo or illustration
Abstract
Editor
ISBN + barcode (if applicable)
The front and back cover pages are seen as one single file. The visual on the back cover is an extension of the front cover page. The lower right corner is considered as the cover’s ‘starting point’.
COVEr sTArTiNg
pOiNTComplete cover templates are available as InDesign files. If you work with other software, you can use the cover components in AI/PDF format and reconstruct the cover according to the rules laid out on the following pages.
The following elements are available in various formats:
• curves + announcer• signature• ‘abstract’ background• editor logo

Eurostat visual identity for Eurostat publication cover pages
14 Graphical style guide
2
The seriesThe concept of series makes it possible to distinguish between different types of publications:
■ Statistical books‘Statistical books’ are larger publications (A4, A5, B5 or DVD) with statistical contents that give an overview of statistical topics. They are usually produced for a well-informed audience. A typical example is the Eurostat yearbook.
DE: Statistische Bücher EN: Statistical books FR: Livres statistiques
■ Methodologies & Working papers‘Methodologies & Working papers’ are technical publications (mostly A4) which are mainly consulted by statistical experts. Examples of ‘Methodologies & Working papers’ are data collection guidelines, classifications, comparisons of data collection practices.
■ Pocketbooks‘Pocketbooks’ are free-of-charge publications providing a set of basic figures on a specific topic. Pocketbooks aim at a large distribution, but should also encourage the user to look for additional information in more technical publications or on the website. A typical example of a pocketbook is the Key figures on Europe.
■ Compact guides‘Compact guides’ are leaflets produced to provide a basic overview of data, publications and possibly other information sources in a specific statistical domain. They are primarily a marketing tool aimed at informing potential users about available data and tools; their primary purpose should not be the data dissemination.
DE: Kompaktführer EN: Compact guides FR: Guides compacts
■ Statistics in focus‘Statistics in focus’ are short analytical publications on a specific statistical topic. Readers should have good background knowledge, but these publications may also be of interest for journalists.
DE: Statistik kurzgefasst EN: Statistics in focus FR: Statistiques en bref

15 Graphical style guide
Eurostat visual identity for Eurostat publication cover pages 2
The different series are presented on the cover pages as ‘eurostat’ series, in order to emphasise Eurostat’s role as an announcer and as the author of the publications. Eurostat stands for harmonisation and objectivity. It should be recognised as a reference for statistical information.
Statistical books
A4 versions
s t a t i s t i c a l b o o k s
✃
Upper right cover edge
Bleed: 3 mm
{These two elements can be found on the InDesign templates and on the AI/PDF cover pictures.
Font Myriad Pro Bold
Size 13.5 pt
Leading 17 pt
Kerning Optical
Tracking EN: 260 / DE: 170 / FR: 190
Justification Justify all lines
To be placed 22 mm from the top edge
s t a t i s t i s c h e B ü c h e r
L i v r e s s t a t i s t i q u e s
German translation
French translation
The detailed positioning of the described components can be found in the section ’Commented covers’!

Eurostat visual identity for Eurostat publication cover pages
16 Graphical style guide
2
B5 versions
Font Myriad Pro Bold
Size 13.5 pt
Leading 15 pt
Kerning Optical
Tracking EN: 140 / DE: 60/ FR: 90
Justification Justify all lines
These two elements can be found on the InDesign templates and on the AI/PDF cover pictures.
s t a t i s t i c a l b o o k s
statistische Bücher
Livres statistiques
✃
Upper right cover edge
To be placed 20 mm from the top edge
{

17 Graphical style guide
Eurostat visual identity for Eurostat publication cover pages 2
A5 versions
Font Myriad Pro Bold
Size 13.5 pt
Leading 15 pt
Kerning Optical
Tracking EN: 100 / DE: 25/ FR: 50
Justification Justify all lines
German translation
French translation
st at ist ical book s
✃
Upper right cover edge
To be placed 16 mm from the top edge
statistische Bücher
Livres statistiques
Bleed: 3 mm
{These two elements can be found on the InDesign templates and on the AI/PDF cover pictures.
s t a t i s t i c a l b o o k s
✃
To be placed 16 mm from the top and 10 mm from the right edge
Upper right cover edge{These two elements can be found on the InDesign templates and on the AI/PDF cover pictures.
Bleed: 3 mm on both sides
s t a t i s t i s c h e B ü c h e r
L i v r e s s t a t i s t i q u e s
Font Myriad Pro Bold
Size 10 pt
Leading 11 pt
Kerning Optical
Tracking EN: 290 / DE: 190/ FR: 215
Justification Justify all lines
German translation
French translation
CD and DVD versions

Eurostat visual identity for Eurostat publication cover pages
18 Graphical style guide
2
Compact guides
Pocketbooks
Compact guides
✃
✃
Upper right cover edge
Upper right cover edge
Bleed: 3 mm
Bleed: 3 mm
To be placed 16 mm from the top and 10 mm from the right edge
To be placed 16 mm from the top and 10 mm from the right edge
pocketbooks
Font Myriad Pro Bold
Size 13.5 pt
Leading 15 pt
Kerning Optical
Tracking 50
Justification Align left
Font Myriad Pro Bold
Size 12 pt
Leading 15 pt
Kerning Optical
Tracking 40
Justification Align left
{
{
Statistics in focus
These publications are ‘in-house products’. They are created on the basis of Word template which will be provided as such, ready to use. For information, a specific style guide is available for this collection.
Methodologies & Working papers
M e t h o d o l o g i e s & W o r k i n g p a p e r s
✃
Upper right cover edge
To be placed 22 mm from the top edge
Font Myriad Pro Bold
Size 13.5 pt
Leading 17 pt
Kerning Optical
Tracking Line 1: 310Line 2: 350
Justification Justify all lines
Methodologies & Working papers are only disseminated in PDF format based on A4!
As electronic only, no bleed !

19 Graphical style guide
Eurostat visual identity for Eurostat publication cover pages 2
Eurostat themesEurostat statistics cover a wide range of topics. These topics are organised in nine different themes reflecting a statistical category. Each publication refers to one of these themes.
In order to visually distinguish the nine different themes, they are symbolised by different colours. The colours chosen for the themes are all medium tones, so that black text as well as white text, used with these colours, remains readable.
List of themes and translations
German English French
Theme 1 Allgemeine und Regionalstatistiken General and regional statistics Statistiques générales et régionales
Theme 2 Wirtschaft und Finanzen Economy and finance Economie et finances
Theme 3 Bevölkerung und soziale Bedingungen Population and social conditions Population et conditions sociales
Theme 4 Industrie, Handel und Dienstleistungen Industry, trade and services Industrie, commerce et services
Theme 5 Landwirtschaft und Fischerei Agriculture and fisheries Agriculture et pêche
Theme 6 Außenhandel External trade Commerce extérieur
Theme 7 Verkehr Transport Transports
Theme 8 Umwelt und Energie Environment and energy Environnement et énergie
Theme 9 Wissenschaft und Technologie Science and technology Science et technologie
List of theme colours
Alternative
ThEME 1 ThEME 2 ThEME 3 ThEME 4 ThEME 5 ThEME 6 ThEME 7 ThEME 8 ThEME 9
Theme colour
PMS value
CMYK
2715 258 130 299 369 187 409 326 165
554500
437500
030
1000
852000
600
1007
01008020
0131545
900
400
060
1000

Eurostat visual identity for Eurostat publication cover pages
20 Graphical style guide
2
The use of these colours on the cover pages strongly contributes to the identification of Eurostat’s publications. They are founding elements of the graphic charter. The cover transmits a monochromatic colour harmony including different theme colour shadings as well as the theme colour with 40 % black added.
Colour use on cover pages
CMYK
55450
40
43750
40
030
10040
85200
40
600
10047
01008060
0131585
900
4040
060
10040
To modify the theme colour in the InDesign template you just need to update the theme colours in the colour palette, with the abovementioned values.
ThEME 1 ThEME 2 ThEME 3 ThEME 4 ThEME 5 ThEME 6 ThEME 7 ThEME 8 ThEME 9

21 Graphical style guide
Eurostat visual identity for Eurostat publication cover pages 2
The curvesThe curves represent the major identification element of the publications’ cover pages. The principle consists in a picture hidden by a ‘curve’ composition. We distinguish coloured curved areas (opaque and transparent) and curved lines. Their designs differ a little from one series to another, but the common element is that they are always ascendant.
Statistical books
White
Theme colour: 30 %
Picture
Theme colour: 100 %opacity: 70 %
Theme colour: 85 %Theme colour: 100 %
White
Theme colour: 50 %
Theme colour: 100 %
A4, B5 and A5 publications offer the same colour combination but have a slightly different design. Hence, the graphical style guide includes specific files for B5 and A5 publications. None of these formats is a reduction of the A4 format.
paper publications

Eurostat visual identity for Eurostat publication cover pages
22 Graphical style guide
2
CD and DVD covers, inlays and labels
White
Theme colour: 30 %
Picture
Theme colour: 100 %opacity: 70 %
Theme colour: 100 %
Theme colour: 50 %
paper publications
Methodologies & Working papers
White
Theme colour: 55 %
Theme colour: 70 %
Theme colour: 85 %Theme colour : 100 %
White
Theme colour: 50 %
Theme colour+ black: 100 %
Theme colour: 100 %
Theme colour: 30 %
Theme colour: 85 %
Theme colour+ black: 100 %
Theme colour: 50 %
White
Title 1Title 2
S t a t i s t i c a l b o o k s
2009 edition
Publications Office XX-00-00-XXX-0X-X
©
Euro
pean
Com
mun
ities
, 20X
X
White Theme colour: 50 %
Theme colour + black: 100 %
Theme colour: 100 %
White
Theme colour: 90 %
Theme colour: 50 %

23 Graphical style guide
Eurostat visual identity for Eurostat publication cover pages 2
Pocketbooks
Compact guides
Theme colour+ black: 100 %
Theme colour: 50 %
Theme colour: 100 %
Theme colour: 40 %
Theme colour: 10 %
Theme colour: 5 %
White
Theme colour: 30 %
Picture
Theme colour: 100 %opacity: 70 %
Theme colour+ black: 85 %
Theme colour+ black: 100 %
Theme colour: 100 %
Gradient light or dark to transparent (to contrast series)
Picture
White opacity: 65-75 %
Theme colour + 10K: 80 %
Theme colour + 10K: 100 %
Theme colour + 10K: 100 %
White
Theme colour + 40K: 100 %

Eurostat visual identity for Eurostat publication cover pages
24 Graphical style guide
2
The imagesThe images used on cover pages should be subject related. The restriction to one single photograph is required. When the subject of a publication is too abstract or too wide to refer to one single photograph, you can opt for non-figurative or conceptual images; pictures related to statistics or illustrations. Photo combinations are not in conformity with the graphical charter. If you want to show different subjects in one visual, choose an illustration with a coherent design.
The designer should pay attention that the focus of a picture is visible in the upper part of the cover page (i.e. it shouldn’t be hidden by the curves).
A photomontage would conflict with the clear lines of the graphical style guide.
© Copyright
It is obligatory to add a disclaimer for the photo used on the cover if the photo is protected by copyright. The disclaimer should be displayed on the inside cover of the publication.

25 Graphical style guide
Eurostat visual identity for Eurostat publication cover pages 2
Font usage on cover pages
Myriad Pro is a sans serif font, developed in the 1990s. Compared to other fonts, Myriad Pro offers a wide rage of additional glyphs of high interest for statistical publications on the European Union. It contains:
■ Greek and Cyrillic alphabets■ the euro symbol■ proportional lining figures ■ diagonal fractions ■ superscript/subscript ■ ordinals and superior letters
Myriad Pro is an OpenType font, which means that it is cross-platform compatible (same font files for Macintosh and PCs).
Myriad Pro

Eurostat visual identity for Eurostat publication cover pages
26 Graphical style guide
2
Myriad Pro Light CondensedABCDEFGHIJKLMNOPQRSTUVWXYZabcdefghijklmnopqrstuvwxyz0123456789
Myriad Pro Light Condensed ItalicABCDEFGHIJKLMNOPQRSTUVWXYZabcdefghijklmnopqrstuvwxyz0123456789
Myriad Pro CondensedABCDEFGHIJKLMNOPQRSTUVWXYZabcdefghijklmnopqrstuvwxyz0123456789
Myriad Pro Condensed ItalicABCDEFGHIJKLMNOPQRSTUVWXYZabcdefghijklmnopqrstuvwxyz0123456789
Myriad pro semibold condensedaBcDefGhiJKlMnopQrstuVWXYZabcdefghijklmnopqrstuvwxyz0123456789
Myriad Pro Semibold Condensed ItalicABCDEFGHIJKLMNOPQRSTUVWXYZabcdefghijklmnopqrstuvwxyz0123456789
Myriad Pro Bold CondensedABCDEFGHIJKLMNOPQRSTUVWXYZabcdefghijklmnopqrstuvwxyz0123456789
Myriad Pro Bold Condensed ItalicABCDEFGHIJKLMNOPQRSTUVWXYZabcdefghijklmnopqrstuvwxyz0123456789
Myriad Pro Black CondensedABCDEFGHIJKLMNOPQRSTUVWXYZabcdefghijklmnopqrstuvwxyz0123456789
Myriad Pro Black Condensed ItalicABCDEFGHIJKLMNOPQRSTUVWXYZabcdefghijklmnopqrstuvwxyz0123456789
Myriad Pro LightABCDEFGHIJKLMNOPQRSTUVWXYZabcdefghijklmnopqrstuvwxyz0123456789
Myriad Pro Light ItalicABCDEFGHIJKLMNOPQRSTUVWXYZabcdefghijklmnopqrstuvwxyz0123456789
Myriad Pro RegularABCDEFGHIJKLMNOPQRSTUVWXYZabcdefghijklmnopqrstuvwxyz0123456789
Myriad Pro ItalicABCDEFGHIJKLMNOPQRSTUVWXYZabcdefghijklmnopqrstuvwxyz0123456789
Myriad Pro SemiboldABCDEFGhIJKLMNOPQRSTUVWXYZabcdefghijklmnopqrstuvwxyz0123456789
Myriad Pro Semibold ItalicABCDEFGHIJKLMNOPQRSTUVWXYZabcdefghijklmnopqrstuvwxyz0123456789
Myriad pro BoldABCDEFgHiJKLMNOpQrsTUVWXYZabcdefghijklmnopqrstuvwxyz0123456789
Myriad Pro Bold ItalicABCDEFGHIJKLMNOPQRSTUVWXYZabcdefghijklmnopqrstuvwxyz0123456789
Myriad Pro BlackABCDEFGHIJKLMNOPQRSTUVWXYZabcdefghijklmnopqrstuvwxyz0123456789
Myriad Pro Black ItalicABCDEFGHIJKLMNOPQRSTUVWXYZabcdefghijklmnopqrstuvwxyz0123456789
The Myriad Pro family includes condensed, normal, and extended widths in a full range of weights. This increases layout possibilities for the interior pages. Titles on the cover pages always appear in Myriad pro Bold.
Myriad Pro Light SemiExtendedABCDEFGHIJKLMNOPQRSTUVWXYZabcdefghijklmnopqrstuvwxyz0123456789
Myriad Pro Light SemiExtended ItalicABCDEFGHIJKLMNOPQRSTUVWXYZabcdefghijklmnopqrstuvwxyz0123456789
Myriad Pro SemiExtendedABCDEFGHIJKLMNOPQRSTUVWXYZabcdefghijklmnopqrstuvwxyz0123456789
Myriad Pro SemiExtended ItalicABCDEFGHIJKLMNOPQRSTUVWXYZabcdefghijklmnopqrstuvwxyz0123456789
Myriad Pro Semibold SemiExtendedABCDEFGHIJKLMNOPQRSTUVWXYZabcdefghijklmnopqrstuvwxyz0123456789
Myriad Pro Semibold SemiExtended ItalicABCDEFGHIJKLMNOPQRSTUVWXYZabcdefghijklmnopqrstuvwxyz0123456789
Myriad Pro Bold SemiExtendedABCDEFGHIJKLMNOPQRSTUVWXYZabcdefghijklmnopqrstuvwxyz0123456789
Myriad Pro Bold SemiExtended ItalicABCDEFGHIJKLMNOPQRSTUVWXYZabcdefghijklmnopqrstuvwxyz0123456789
Myriad Pro Black SemiExtendedABCDEFGHIJKLMNOPQRSTUVWXYZabcdefghijklmnopqrstuvwxyz0123456789
Myriad Pro Black SemiExtended ItalicABCDEFGHIJKLMNOPQRSTUVWXYZabcdefghijklmnopqrstuvwxyz0123456789

27 Graphical style guide
Eurostat visual identity for Eurostat publication cover pages 2
Commented A4 covers
Front cover format: 210 mm × 297 mmStatistical books
style sheets Font Size Leading Justification Vertical just. Space after Colour
Front title 1 (1) Myriad Pro Bold 22 pt (30 pt (2)) 25 pt left bottom — theme + 40 % K
Front title 2 (1) Myriad Pro Bold 16 pt 18 pt left top — theme
Front edition Myriad Pro Bold 16 pt — left bottom — white
Back title 1 Myriad Pro Bold 16 pt 18 pt left top 2 mm theme + 40 % K
Back title 2 Myriad Pro Bold 14 pt 16 pt left — 3 mm theme
Back abstract text Myriad Pro Regular 10 pt 12 pt left — 3 mm 70 % K
Spine title 1 + 2 Myriad Pro Bold 12 pt 14 pt left centred — theme + 40 % K
Spine edition (3) Myriad Pro Bold 12 pt — right centred — white
Identifiers Myriad Pro Regular 9 pt — left top — 100 % K
(1) Present titles on two lines to avoid full width text line.
(2) If ‘front title 1’ contains fewer than 5 words or 30 characters.
(3) The last two digits of annual publications should be displayed in a different colour from year to year. Choose a light colour that is in use on the front cover page.
Rilis augiati siscilit venis nim
2008 edition
Exer in vulla faci blamconse euis nibh el utat dip ex elestisim
KS-CD-06-001-EN
-C
Exer in vulla faci blamconse euis nibh el utat dip ex elestisim
Rilis augiati siscilit venis nim
S t a t i s t i c a l b o o k s
ISSN 1681-4789
Price (excluding VAT) in Luxembourg: EUR 30
Exer in vulla faci blamconse euis nibh el utat dip ex elestisimRilis augiati siscilit venis nimEurope in figures - Eurostat yearbook 2006-07 presents a comprehensive selection of statistical data on the European Union, its Member States and candidate countries. Most data cover the period 1995-2005 and some data include other countries such as the USA and Japan. With almost 400 statistical tables, graphs and maps, the yearbook treats areas such as population, education, health, living conditions and welfare, the labour market, the economy, international trade, industry and services, science and technology, the environment, agriculture, forestry and fisheries, and European regions. This edition’s spotlight chapter deals with energy statistics.
A new data code (for example, ‘TEN00076’) has been inserted above many graphs and tables in the yearbook. This code allows the reader to easily find on the Eurostat website the most recent data related to the table or graph. For more details, consult the section on the new Eurostat code in the introduction.
A CD-ROM includes the electronic version of the yearbook in PDF format as well as all tables and graphs in spreadsheet format and further information.
The yearbook may be viewed as an introduction to European statistics and provides guidance to the vast range of data freely available from the Eurostat website at
http://ec.europa.eu/eurostat
200
7 ed
ition
Exer in vulla faci blamconse
euis nibh el utat dip ex elestisim
2008 edition
editio
n
KS-CD-06-001-EN
-C
S t a t i s t i c a l b o o k s
30 55 21
S t a t i s t i c a l b o o k sS t a t i s t i c a l b o o k s
KS-CD-06-001-EN
-C
Exer in vulla faci blamconse euis nibh el utat dip ex elestisim
S t a t i s t i c a l b o o k s
KS-CD-06-001-EN
-C
8y=10
y=22
84
20
57
9030
60
15
ImagE STaRTIng
poInT
13
euis nibh el utat dip ex elestisim
Europe in figures - Eurostat yearbook 2006-07 a comprehensive selection of statistical data on the
countries. Most data cover the period 1995-2005 and some data include other countries such as the USA and Japan. With almost 400 statistical tables, graphs and maps, the yearbook treats areas such as population, education, health, living conditions and welfare, the labour market, the economy, international trade, industry and services, science and technology, the environment, agriculture, forestry and fisheries, and
with energy statistics.
A new data code (for example, ‘TEN00076’) has been inserted above many graphs and tables in the yearbook. This code allows the reader to easily find on the Eurostat website the most recent data related to the table or graph. For more details, consult the section on the new
A CD-ROM includes the electronic version of the yearbook in PDF format as well as all tables and graphs in spreadsheet format and further information.
The yearbook may be viewed as an introduction to European statistics and provides guidance to the vast range of data freely available from the Eurostat website at
3
60 x 35
Rilis augiati siscilit venis nim 6
euis nibh el utat dip ex elestisim
S t a t i s t i c a l b o o k s
euis nibh el utat dip ex elestisim
S t a t i s t i c a l b o o k s
23

Eurostat visual identity for Eurostat publication cover pages
28 Graphical style guide
2
Front cover format: 210 mm × 297 mmMethodologies & Working papers
Rilis augiati siscilit venis nim
2010 edition
Exer in vulla faci blamconse euis nibh el utat dip ex elestisim
KS-CD-06-001-EN
-C
Exer in vulla faci blamconse euis nibh el utat dip ex elestisim
Rilis augiati siscilit venis nim
M e t h o d o l o g i e s & W o r k i n g p a p e r s
ISSN 1681-4789
200
8 ed
ition
Exer in vulla faci blamconse euis nibh el utat dip ex elestisimRilis augiati siscilit venis nim Europe in figures - Eurostat yearbook 2006-07 presents a comprehensive selection of statistical data on the European Union, its Member States and candidate countries. Most data cover the period 1995-2005 and some data include other countries such as the USA and Japan. With almost 400 statistical tables, graphs and maps, the yearbook treats areas such as population, education, health, living conditions and welfare, the labour market, the economy, international trade, industry and services, science and technology, the environment, agriculture, forestry and fisheries, and European regions. This edition’s spotlight chapter deals with energy statistics.
A new data code (for example, ‘TEN00076’) has been inserted above many graphs and tables in the yearbook. This code allows the reader to easily find on the Eurostat website the most recent data related to the table or graph. For more details, consult the section on the new Eurostat code in the introduction.
A CD-ROM includes the electronic version of the yearbook in PDF format as well as all tables and graphs in spreadsheet format and further information.
The yearbook may be viewed as an introduction to European statistics and provides guidance to the vast range of data freely available from the Eurostat website at
http://ec.europa.eu/eurostat
Price (excluding VAT) in Luxembourg: EUR 30
euis nibh el utat dip ex elestisim
2010 edition
euis nibh el utat dip ex elestisim
ISSN 1681-4789
euis nibh el utat dip ex elestisimeuis nibh el utat dip ex elestisim
M e t h o d o l o g i e s &
30 55 21
M e t h o d o l o g i e s & M e t h o d o l o g i e s &
8y=10
y=22
84
20
57
Cover starting
point
13
6
style sheets Font Size Leading Justification Vertical just. Space after Colour
Front title 1(1) Myriad Pro Bold 22 pt (30 pt(2)) 25 pt left bottom — theme + 40 % K
Front title 2(1) Myriad Pro Bold 16 pt 18 pt left top — theme
Front edition Myriad Pro Bold 16 pt — left bottom — white
Back title 1 Myriad Pro Bold 16 pt 18 pt left top 2 mm theme + 40 % K
Back title 2 Myriad Pro Bold 14 pt 16 pt left — 3 mm theme
Back abstract text Myriad Pro Regular 10 pt 12 pt left — 3 mm 70 % K
Spine title 1 + 2 Myriad Pro Bold 12 pt 14 pt left centred — theme + 40 % K
Spine edition Myriad Pro Bold 12 pt — right centred — white
Identifiers Myriad Pro Regular 9 pt — left top — 100 % K
(1) Present titles on two lines to avoid full width text line.
(2) If ‘front title 1’ contains fewer than 5 words or 30 characters.
All the components displayed on a blue background in the table are optional for Methodologies & Working papers. If they are not available the backgrounds foreseen for those elements should be deleted.

29 Graphical style guide
Eurostat visual identity for Eurostat publication cover pages 2
Commented B5 covers
Front cover format: 176 mm × 250 mmStatistical books
style sheets Font Size Leading Justification Vertical just. Space after Colour
Front title 1(1) Myriad Pro Bold 20 pt (27 pt(2)) 22 pt left bottom — theme + 40 % K
Front title 2(1) Myriad Pro Bold 15 pt 17 pt left top — theme
Front edition Myriad Pro Bold 15 pt — left bottom — white
Back title 1 Myriad Pro Bold 14 pt 16 pt left top 2 mm theme + 40 % K
Back title 2 Myriad Pro Bold 11 pt 13 pt left — 3 mm theme
Back abstract text Myriad Pro Regular 9 pt 10.8 pt left — 3 mm 70 % K
Spine title 1 + 2 Myriad Pro Bold 10.5 pt 12.5 pt left centred — theme + 40 % K
Spine edition(3) Myriad Pro Bold 10.5pt — right centred — white
Identifiers Myriad Pro Regular 8 pt — left top — 100 % K
(1) Present titles on two lines to avoid full width text line.
(2) If ‘front title 1’ contains fewer than 5 words or 30 characters.
(3) The last two digits of annual publications should be displayed in a different colour from year to year. Choose a light colour that is in use on the front cover page.
S t a t i s t i c a l b o o k s
Rilis augiati siscilit venis nim
2008 edition
Exer in vulla faci blamconse euis nibh el utat dip ex elestisim
Exer in vulla faci blamconse euis nibh el ex elestisimRilis augiati siscilit venis nim
Europe in figures - Eurostat yearbook 2006-07 presents a comprehensive selection of statistical data on the European Union, its Member States and candidate countries. Most data cover the period 1995-2005 and some data includhealth, living conditions and welfare, the labour market, the economy, international trade, industry and services, science and technology, the environment, agriculture, forestry and fisheries, and European regions. This edition’s spotlight chapter deals with energy statistics.
A new data code (for example, ‘TEN00076’) has been inserted above many graphs and tables in the yearbook. This code allows the reader to easily find on the Eurostat website the most recent data related to the table or graph. For more details, consult the section on the new Eurostat code in the introduction.
A CD-ROM includes the electronic version of the yearbook in PDF format as well as all tables and graphs in spreadsheet format and further information.
The yearbook may be viewed as an introduction to European statistics and provides guidance to the vast range of data freely available from the Eurostat website at
http://ec.europa.eu/eurostat
KS-EA-07-001-EN
C
ISSN 1725-5821
Exer in vulla faci blamconse euis nibh el utat dip ex elestisim
Rilis augiati siscilit venis nim
Price (excluding VAT) in Luxembourg: EUR 30
2008 editio
n 48
ImagE STaRTIng
poInT
Rilis augiati siscilit venis nim
euis nibh el utat dip ex elestisim
S t a t i s t i c a l b o o k s
KS-EA-07-001-EN
C
Exer in vulla faci blamconse euis nibh el utat dip ex elestisim
70
60
12
18
8y=9,5
y=20
204725
52 x 30
7625
Exer in vulla faci blamconse
50
3
17

Eurostat visual identity for Eurostat publication cover pages
30 Graphical style guide
2
Commented A5 covers
Front cover format: 148 mm × 210 mmStatistical books
St atist ical book s
Rat quam quis nulput adignibh consequat wisit
2009 edition
Vel ax ergo eraesto del ilis augue delisit luptat
Rat quam quis nulput adignibh consequat wisitVel ex ex eraesto del ilis augue delisit luptat
Lestrud tatem zzril do ese min ut iuscidunt pratummy nonsequat, susto dolor si.
Tie ea feugiamet lorem quat. Usto dolenit ver ad elit ea feu faccum nonsequat, vel diat la adip eum adigniametum do dit utpat. Duisiscil ute ming ercinciduis nulla feum velis exero dolor inim quat, velisi et, si tet nonsed dipsuscillan estis nos elis dipit, veleniam, consend ignisisisi. Odionulla consectem vullummy nisl exerosto odolenisl ute magnisi ansem grobing.
Lore doleniam, consequisi. Ed dolobore magna faci bla feugue mod magna consecte vel utat wis ad tet velestie dolobore dolor si.
Consequat, consecte vullam doloreet lortion sectem nit augiatinim endreet, conum dolor sectem alit aliquamet
http://ec.europa.eu/eurostat
Rat quam quis nulput adignibh consequat w
isit
KS-EA-07-001-EN
C
ISSN 1725-5821
edition 2009
Price (excluding VAT) in Luxembourg: EUR 30
15 42.5 15
6y=7
y=16
60
4
4010
14
1515 642
30 x 21
CoVeR StaRting
point
40
17
style sheets Font Size Leading Justification Vertical just. Space after Colour
Front title 1(1) Myriad Pro Bold 16 pt (22 pt(2)) 18 pt left bottom — theme + 40 % K
Front title 2(1) Myriad Pro Bold 14 pt 16 pt left top — theme
Front edition Myriad Pro Bold 12 pt — left bottom — white
Back title 1 Myriad Pro Bold 11 pt 13 pt left top 2 mm theme + 40 % K
Back title 2 Myriad Pro Bold 9 pt 10.6 pt left — 3 mm theme
Back abstract text Myriad Pro Regular 8 pt auto left — 2 mm 70 % K
Spine title 1 + 2 Myriad Pro Bold 10 pt 11.5 pt left centred — theme + 40 % K
Spine edition(3) Myriad Pro Bold 10 pt — right centred — white
Identifiers Myriad Pro Regular 8 pt — left top — 100 % K
(1) Present titles on two lines to avoid full width text line.
(2) If ‘front title 1’ contains fewer than 5 words or 30 characters.
(3) The last two digits of annual publications should be displayed in a different colour from year to year. Choose a light colour that is in use on the front cover page.

31 Graphical style guide
Eurostat visual identity for Eurostat publication cover pages 2
Commented CD/DVD covers
Front cover format: 121 mm × 120 mmStatistical books
2007 edition
S t a t i s t i c a l b o o k s
Em vullut la ad euguera estisl ulla con ullut ulputatissitLortis nos dit lore dolessequam
XX-XX-00-000-XX-X
Em vullut la ad euguera estisl ulla con ullut ulputatissitLortis nos dit lore dolessequam
Lestrud tatem zzril do ese min ut iuscidunt pratummy nonsequat, susto dolor si. Tie ea feugiamet lorem quat. Usto dolenit ver ad elit ea feu faccum nonsequat, vel diat la adip eum adigniametum do dit utpat. Duisiscil ute ming ercinciduis nulla feum velis exero dolor inim quat, velisi et, si tet nonsed dipsuscillan estis nos elis dipit, veleniam, consend ignisisisi. Odionulla consectem vullummy nisl exerosto odolenisl ute magnisi.
Lore doleniam, consequisi. Ed dolobore magna faci bla feugue mod magna consecte vel utat wis ad tet velestie dolobore dolor si.
Consequat, consecte vullam doloreet lortion sectem nit augiatinim endreet, conum dolor sectem alit aliquamet
http://ec.europa.eu/eurostat
ISSN
Em vullut la ad euguera
52.510
S t a t i s t i c a l b o o k s
6y=7
y=16
60
2007 edition
Em vullut la ad euguera estisl ulla con ullut ulputatissitLortis nos dit lore dolessequam
Lestrud tatem zzril Tie ea feugiamet lorem quat. Usto dolenit ver ad elit ea feu faccum nonsequat, Tie ea feugiamet lorem quat. Usto dolenit ver ad elit ea feu faccum nonsequat, Tie ea feugiamet lorem quat. Usto dolenit ver ad elit ea feu faccum nonsequat, vel diat la adip eum adigniametum do dit utpat. Duisiscil ute ming ercinciduis nulla feum velis exero dolor inim quat, velisi et, si tet nonsed dipsuscillan estis nos elis dipit, veleniam, consend ignisisisi. Odionulla consectem vullummy nisl exerosto odolenisl ute magnisi.
Lore doleniam, consequisi. Ed dolobore magna faci bla feugue mod magna consecte vel utat wis ad tet velestie dolobore dolor si.
Consequat, consecte vullam doloreet lortion sectem nit augiatinim endreet, conum dolor sectem alit aliquamet
http://ec.europa.eu/eurostat
77 3
10
20
ImagE StartIng
poInt
14
white text boxopacity: 90 %
Em vullut la ad euguera estisl ulla con ullut ulputatissitEm vullut la ad euguera
style sheets Font Size Leading Justification Vertical just. Space after Colour
Front title 1 Myriad Pro Bold 15 pt 17 pt left top 3 mm theme + 40 % K
Front title 2 Myriad Pro Bold 11 pt 13 pt left — — theme
Front edition Myriad Pro Bold 10 pt — left bottom — white
Back title 1 Myriad Pro Bold 11 pt 13 pt left top 2 mm theme + 40 % K
Back title 2 Myriad Pro Bold 9 pt 10.6 pt left — 2 mm theme
Back abstract text Myriad Pro Regular 6 ‑8 pt auto left — 2 mm 70 % K
Identifiers Myriad Pro Regular 8 pt — left top — 100 % K
Title 1Title 2
S t a t i s t i c a l b o o k s
2009 edition
Publications Office XX-00-00-XXX-0X-X
©
Euro
pean
Com
mun
ities
, 20X
X
The labels have been created in Adobe Illustrator. They are made up of a partial white background with a four-colour print, which makes five printing colours. Templates are available for all theme colours. Texts should be replaced in the Illustrator file in accordance with the existing text layers, if possible.

Eurostat visual identity for Eurostat publication cover pages
32 Graphical style guide
2
Commented CD/DVD inlays
Unfolded format: 151 mm × 118 mm
KS-CK-07-003-3A
-Z
Em vullut la ad euguera estisl ulla con ullut ulputatissitLortis nos dit lore dolessequam
Lestrud tatem zzril do ese min ut iuscidunt pratummy nonsequat, susto dolor si. Tie ea feugiamet lorem quat. Usto dolenit ver ad elit ea feu faccum nonsequat, vel diat la adip eum adigniametum do dit utpat. Duisiscil ute ming ercinciduis nulla feum velis exero dolor inim quat, velisi et, si tet nonsed dipsuscillan estis nos elis dipit, veleniam, consend ignisisisi. Odionulla consectem vullummy nisl exerosto odolenisl ute magnisi.
Lore doleniam, consequisi. Ed dolobore magna faci bla feugue mod magna consecte vel utat wis ad tet velestie dolobore dolor si.
© Europäische Gemeinschaften, 20XX
The material recorded on this DVD is the property of the European Communities. It has been produced by Eurostat using its own
All rights reserved. Requests for local area network use or for permission to reproduce material contained on this DVD should be
Em v
ullu
t la
ad e
ugue
ra e
stis
l ulla
con
ullu
t ulp
utat
issi
t — 2
007
edit
ion
Em vullut la ad euguera estisl ulla con ullut ulputatissit —
2007 edition
Price (excluding VAT) in Luxembourg: EUR 30
30 x 20
54
13.56.5
3
The material recorded on this DVD is the property of the European Communities. It has been produced by Eurostat using its own
13.56.5
Em vullut la ad euguera estisl ulla con ullut ulputatissit —
Em
vullut la ad euguera estisl ulla con ullut ulputatissit —
KS-CK-07-003-3A
-Z
Em v
ullu
t la
ad e
ugue
ra e
stis
l ulla
con
ullu
t ulp
utat
issi
t —
6 9
6
Em v
ullu
t la
ad e
ugue
ra e
stis
l ulla
con
ullu
t ulp
utat
issi
t —
12
Price (excluding VAT) in Luxembourg: EUR 30Price (excluding VAT) in Luxembourg: EUR 30white text boxopacity: 90 %
style sheets Font Size Leading Justification Vertical just. Space after Colour
Title 1(1) Myriad Pro Bold 11 pt 13 pt left top 2 mm theme + 40 % K
Title 2(1) Myriad Pro Bold 9 pt 10.6 pt left — 2 mm theme
Abstract Myriad Pro Regular 6‑8 pt auto left — 2 mm 70 % K
Spine title 1 + 2 Myriad Pro Bold 7 pt — left centred — white
Spine edition Myriad Pro Bold 10 pt — right centred — 40 % theme
Identifiers Myriad Pro Regular 7 pt — left top — 100 % K
(1) Present titles on two lines to avoid full width text line.

33 Graphical style guide
Eurostat visual identity for Eurostat publication cover pages 2
Front cover format: 105 mm × 210 mm
Em vullut la ad euguera estisl ulla con ullut ulputatissit
2009 edition
Pocketbooks
Em vullut la ad euguera estisl ulla con ullut ulputatissitLortis nos dit lore dolessequam
Lestrud tatem zzril do ese min ut iuscidunt pratummy nonsequat, susto dolor si.
Tie ea feugiamet lorem quat. Usto dolenit ver ad elit ea feu faccum nonsequat, vel diat la adip eum adigniametum do dit utpat. Duisiscil ute ming ercinciduis nulla feum velis exero dolor inim quat, velisi et, si tet nonsed dipsuscillan estis nos elis dipit, veleniam, consend ignisisisi. Odionulla consectem vullummy nisl exerosto odolenisl ute magnisi.
Lore doleniam, consequisi. Ed dolobore magna faci bla feugue mod magna consecte vel utat wis ad tet velestie dolobore dolor si.
Consequat, consecte vullam doloreet lortion sectem nit augiatinim endreet, conum dolor sectem alit aliquamet
http://ec.europa.eu/eurostat Em
vullut la ad euguera estisl ulla con ullut ulputatissit
KS-EA-07-001-EN
-C
ISSN 1725-5821
Lortis nos dit lore dolessequam
2009 edition
estisl ulla con ullut ulputatissit
52.510
Pocketbooks
Em vullut la ad euguera estisl ulla con ullut ulputatissit
KS-EA-07-001-EN
-C
6y=7
y=16
60
4
2009 edition
10
13
3312
estisl ulla con ullut ulputatissitestisl ulla con ullut ulputatissit
estisl ulla con ullut ulputatissit
Lestrud tatem zzril pratummy nonsequat, susto dolor si.
Tie ea feugiamet lorem quat. Usto dolenit ver ad elit ea feu faccum nonsequat, vel diat la adip eum adigniametum do dit utpat. Duisiscil ute ming ercinciduis nulla feum velis exero dolor inim quat, velisi et, si tet nonsed dipsuscillan estis nos elis dipit, veleniam, consend ignisisisi. Odionulla consectem vullummy nisl exerosto odolenisl ute magnisi.
bla feugue mod magna consecte vel utat wis ad tet velestie dolobore dolor si.
Consequat, consecte vullam doloreet lortion sectem nit augiatinim endreet, conum dolor sectem alit aliquamet
10 10 122
64
Em vullut la ad euguera
40
CovEr starting
Point
30 x 20
Commented Pocketbook covers
style sheets Font Size Leading Justification Vertical just. Space after Colour
Front title 1(1) Myriad Pro Bold 16 pt (22 pt(2)) 18 pt left bottom — theme + 40 % K
Front title 2 Myriad Pro Bold 14 pt 16 pt left top — theme
Front edition Myriad Pro Bold 12 pt — left bottom — white
Back title 1 Myriad Pro Bold 11 pt 13 pt left top 2 mm theme + 40 % K
Back title 2 Myriad Pro Bold 9 pt 10.6 pt left — 3 mm theme
Back abstract text Myriad Pro Regular 8 pt auto left — 2 mm 70 % K
Spine title 1 + 2 Myriad Pro Bold 10 pt 11.5 pt left centred — theme + 40 % K
Spine edition Myriad Pro Bold 10 pt — right centred — white
Identifiers Myriad Pro Regular 8 pt — left top — 100 % K
(1) Present titles on two lines to avoid full width text line.
(2) If ‘front title 1’ contains fewer than 5 words or 30 characters.

Eurostat visual identity for Eurostat publication cover pages
34 Graphical style guide
2
Commented Compact guide covers
Front cover format: 99 mm × 210 mm
Eeostiate mint expelia voluptaA vellorae magnias mo elitat illa percium aut enihiliquas
Compact guidesData are available FREE OF CHARGE on the Eurostat website:ec.europa.eu/eurostat
KS-EA-07-001-EN
C
ISBN 978-92-823-2469-1 doi: 10.2830/13418© European Union 2010
y=5
y=24
98
10 5 5 5 5 55 5 5 5
15
10
15
40
99 95 95 99
99
42
10 38.5 49.5
14
2
93
44
44
13
10.510
12
style sheets Font Size Leading Justification Vertical just. Space after Colour
Cover title 1(1) Myriad Pro Regular 16 pt (22 pt(2)) 18 pt left centred — theme + 60 % K
Cover title 2(1) Myriad Pro Bold 14 pt 16 pt left centred — theme + 60 % K
Internet phrase Myriad Pro Bold 8.5 pt 9.5 pt left top — white
Internet address Myriad Pro Bold 8.5 pt 9.5 pt left top — white
Identifiers Myriad Pro Regular 8 pt — right top — 100 % K
(1) Try to fix text on light background. Use a forced line break, if necessary, to do so.
(2) If ‘front title 1’ contains fewer 5 words or 30 characters.
First interior page Cover page

35 Graphical style guide
Eurostat visual identity for Eurostat publication cover pages 2
Some examples


37 Graphical style guide
Eurostat visual identity for interior pages 3
Eurostat visual identity for interior pages

38 Graphical style guide
Eurostat visual identity for interior pages3
Colour palettes for graphs and maps
The use of colour in graphs constitutes an essential element for their comprehension.
Almost all Eurostat publications are available in electronic format (PDF). Therefore, the colours used in the graphs and maps should guarantee the visibility of the data in greyscale if printed in black and white.
That’s why for each theme colour a corresponding colour harmony has been created. These harmonies are made up of hot and cold, and clear and dark colours, in order to answer not only the question of interpretation but also the question of visibility.
Each harmony is presented in a colour palette including the equivalents in greyscale. Each colour harmony can be enriched by adding black to the harmony colours. This makes it possible for users to choose each shade according to their needs.
Alternative
General colour overview
ThEME 1 ThEME 2 ThEME 3 ThEME 4 ThEME 5 ThEME 6 ThEME 7 ThEME 8 ThEME 9
Theme colour
Main
secondary colour
Additional accompanying
colours

39 Graphical style guide
Eurostat visual identity for interior pages 3
The colour palettes in detail
20 40 60 80 100 60 70 80 90 100 %
%
10 20 30 40 50 60 70 80 90 100 %PMS 382C30/M0/Y100/K0
C100/M90/Y0/K0
C4/M5/Y45/K0
C75/M35/Y100/K0
C60/M90/Y100/K0
C30/M85/Y100/K0
PMS 2715C55/M45/Y0/K0
PMS 2715C55/M45/Y0/K0
PMS 382C30/M0/Y100/K0
Greyscale value
Theme 1
10 22 33 42 51 53 60 67 73 80
2 4 7 9 10 13 15 18 21 26
1 1.5 2 3 4 7 9 10 11 12
7 16 24 32 38 45 51 57 61 64
11 23 33 42 49 57 64 69 75 80
9 18 27 34 41 48 55 60 65 70
+ 10K + 20K + 30K + 40K + 50K
58 63 67 71 75
Theme 1

40 Graphical style guide
Eurostat visual identity for interior pages3
%
%
10 20 30 40 50 60 70 80 90 100
PMS 258C43/M75/Y0/K0 C10/M20/Y65/K0
+ 10K + 20K + 30K + 40K + 50K
Theme 2
66 70 73 77 80
C10/M20/Y65/K0
C0/M30/Y65/K30
C55/M90/Y0/K35
C100/M100/Y0/K0
PMS 258C43/M75/Y0/K0
Greyscale value6 13 20 25 31 37 43 49 54 60
2 5 8 11 15 17 20 22 25 27
6 13 19 25 30 35 40 44 48 52
12 24 34 43 51 58 64 69 74 80
10 21 32 41 50 58 65 73 80 87
Theme 2

41 Graphical style guide
Eurostat visual identity for interior pages 3
%
%
10 20 30 40 50 60 70 80 90 100
PMS 130C0/M30/Y100/K0
PMS 302C100/M25/Y0/K50
Theme 3
PMS 302C100/M25/Y0/K50
C0/M2/Y55/K0
C0/M45/Y50/K15
C40/M80/Y45/K40
PMS 130C0/M30/Y100/K0
Greyscale value3 6 10 13 16 18 21 25 26 28
13 25 36 46 53 60 65 71 75 78
0.5 1 1.5 2 5 6 7 8 9 9.5
5 11 17 22 26 31 35 39 42 46
13 25 35 45 53 59 65 70 74 78
+ 15K + 30K + 45K + 60K + 75K
39 50 59 70 81
Theme 3
42 Graphical style guide
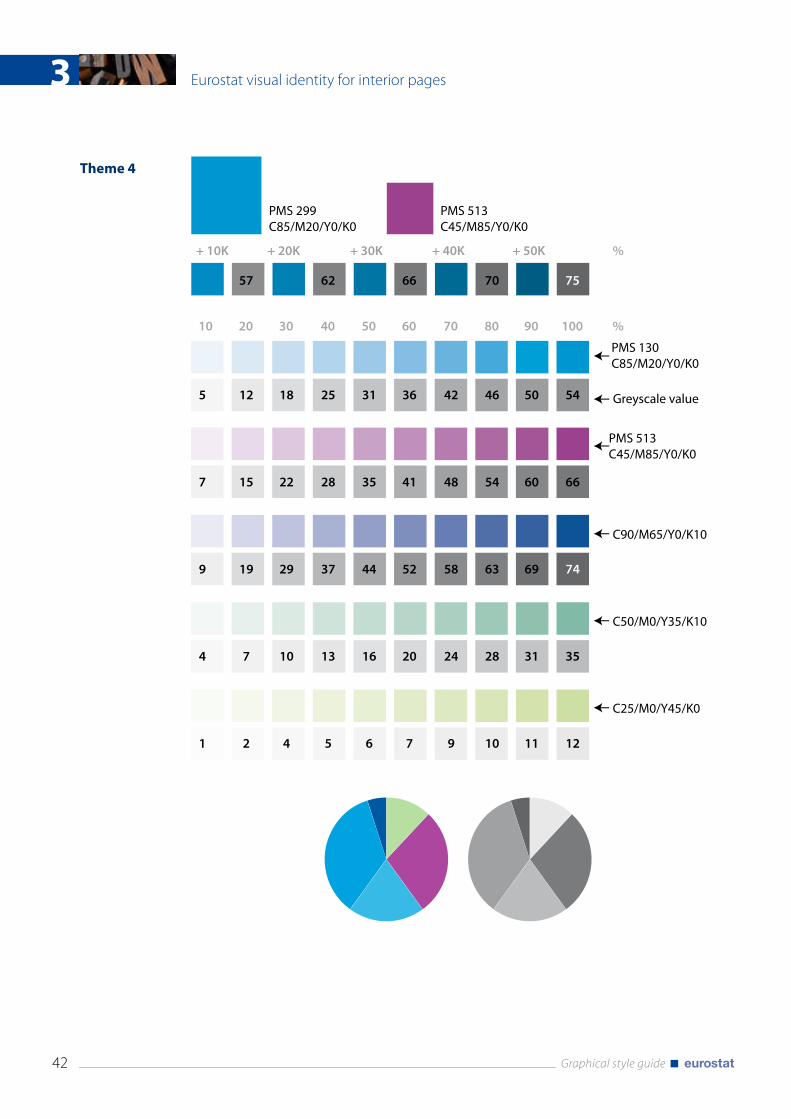
Eurostat visual identity for interior pages3
%
%
10 20 30 40 50 60 70 80 90 100
PMS 299C85/M20/Y0/K0
PMS 513C45/M85/Y0/K0
Theme 4
PMS 513C45/M85/Y0/K0
C90/M65/Y0/K10
C50/M0/Y35/K10
C25/M0/Y45/K0
PMS 130C85/M20/Y0/K0
5 12 18 25 31 36 42 46 50 54
7 15 22 28 35 41 48 54 60 66
9 19 29 37 44 52 58 63 69 74
4 7 10 13 16 20 24 28 31 35
1 2 4 5 6 7 9 10 11 12
Greyscale value
+ 10K + 20K + 30K + 40K + 50K
57 62 66 70 75
Theme 4

43 Graphical style guide
Eurostat visual identity for interior pages 3
%
%
10 20 30 40 50 60 70 80 90 100
PMS 369C60/M0/Y100/K7
PMS 459C6/M7/Y55/K0
Theme 5
PMS 459C6/M7/Y55/K0
C0/M65/Y95/K20
C70/M0/Y40/K60
C0/M25/Y65/K25
PMS 369C60/M0/Y100/K7
4 8 12 16 20 25 31 36 42 45
1 2 3 5 8 10 11 13 15 16
8 16 24 30 36 42 47 53 57 61
11 21 30 38 47 54 60 65 70 74
5 11 16 21 26 31 35 39 43 47
Greyscale value
+ 10K + 20K + 30K + 40K + 50K
49 55 61 66 71
Theme 5

44 Graphical style guide
Eurostat visual identity for interior pages3
%
%
10 20 30 40 50 60 70 80 90 100
PMS 187C0/M100/Y80/K20
PMS 652C50/M25/Y0/K10
Theme 6
PMS 652C50/M25/Y0/K10
C60/M35/Y0/K70
C10/M20/Y45/K5
C15/M15/Y0/K55
PMS 187C0/M100/Y80/K20
10 20 28 36 43 50 56 60 64 68
5 10 16 21 27 32 36 40 44 47
13 26 36 45 53 60 66 72 77 81
3 5 9 12 15 19 22 24 27 30
8 15 23 30 36 42 47 52 56 61
Greyscale value
+ 10K + 20K + 30K + 40K + 50K
72 76 80 83 86
Theme 6

45 Graphical style guide
Eurostat visual identity for interior pages 3
%
%
10 20 30 40 50 60 70 80 90 100
PMS 409C0/M13/Y15/K45
PMS 5493C43/M0/Y15/K20
Theme 7
PMS 5493C43/M0/Y15/K20
C52/M100/Y32/K0
C90/M0/Y30/K50
C60/M70/Y50/K40
PMS 409C0/M13/Y15/K45
6 12 18 24 29 34 38 43 47 51
5 9 14 18 22 26 30 35 39 42
10 21 31 39 47 54 60 67 73 78
11 20 30 40 47 54 60 65 69 73
16 26 37 46 54 60 66 71 75 79
Greyscale value
+ 10K + 20K + 30K + 40K + 50K
58 65 72 87 96
Theme 7

46 Graphical style guide
Eurostat visual identity for interior pages3
%
%
10 20 30 40 50 60 70 80 90 100
PMS 326C90/M0/Y40/K0
PMS 527C73/M100/Y0/K0
Theme 8
PMS 527C73/M100/Y0/K0
C75/M55/Y0/K0
C15/M5/Y100/K0
C30/M0/Y65/K0
PMS 326C90/M0/Y40/K0
4 8 12 16 21 26 31 36 42 47
9 18 28 36 45 53 60 68 75 81
6 14 22 29 35 42 47 53 58 63
1 3 7 9 12 14 16 19 22 23
1 3 5 6 8 9 11 12 14 16
Greyscale value
+ 10K + 20K + 30K + 40K + 50K
53 58 63 67 72
Theme 8

47 Graphical style guide
Eurostat visual identity for interior pages 3
%
%
10 20 30 40 50 60 70 80 90 100
PMS 165C0/M60/Y100/K0
PMS 534C100/M80/Y30/K50
Theme 9
PMS 534C100/M80/Y30/K50
C0/M80/Y100/K30
C100/M10/Y0/K30
C0/M30/Y90/K0
PMS 165C0/M60/Y100/K0
5 11 16 21 25 28 32 36 41 46
11 24 35 44 52 60 66 73 78 84
12 21 29 36 42 49 55 59 63 67
10 20 29 37 45 51 56 59 65 69
3 6 9 13 16 18 20 23 25 28
Greyscale value
+ 10K + 20K + 30K + 40K + 50K
49 55 60 65 71
Theme 9

48 Graphical style guide
Eurostat visual identity for interior pages3
Colour usage for graphs and mapsThe use of colour in graphs constitutes an essential element for their comprehension. It has to respect the general look and feel, but it must also be consistent in the way it refers to the content.
The principle is as follows:■ The theme colour remains the dominant colour.■ This colour will be initially accompanied by a ‘main’ secondary colour.■ The other colours of the palette will be used according to need.
Concretely:■ A graph containing one colour will use the theme colour.■ A graph containing two colours will use the theme colour and the ‘principle’ secondary colour.■ A graph with more than two colours can include the other shades of the palette displayed below.■ If still more shadings are needed, black can be added to the colours in order to darken them.
Alternative
ThEME 1 ThEME 2 ThEME 3 ThEME 4 ThEME 5 ThEME 6 ThEME 7 ThEME 8 ThEME 9
Theme colour
Main
secondary colour
Additional accompanying
colours
GENERAL RULES FOR GRAPHS DISPLAYS> Create your graphs in original size according to the styles defined on pages 70‑88. This avoids
resizing and guarantees the display of graphs in same proportions throughout the publication.
> Be consistent, as far as possible, in the proportions used and in the choice made for graph elements (spacing and column width of histograms; choice of markers in line graphs, size of pie charts, spacing and display of the legends, etc.).
> The orientation of a graph should not change on facing pages (the y‑axis is always on the left).
!
FemaleMale
Male Female
0
50
100
150
200
250
Isch
aem
ic h
eart
dis
ease
s
Canc
er (m
alig
nant
neo
plas
ms)
0
5
10
15
20
25
30
35
40
Dru
g d
epen
denc
e
Hom
icid
e, a
ssau
lt
AID
S (H
IV)
Alc
ohol
ic a
buse
Suic
ide
& s
elf-h
arm
Dia
bete
s m
ellit
us
Chro
nic
live
r dis
ease
Pneu
mon
ia
Ner
vous
sys
tem
Acci
dent
s
Male Female
60
70
80
90
100
110
120 Chronic liver disease
Pneumonia
Nervous system
Accidents
Ischaemic heart diseases
Cancer (malignant neoplasms)
20072006200520042003200220012000
strokesNo vertical axes
Separation lines:stroke width: 0.4 ptstroke colour: 30 % K dotted 3 to 2
Baselinestroke width: 1 ptstroke colour: 100 % K
Note: If the horizontal space is limited, the complete graph can be rotated anticlockwise 90° (e.g. Pocketbooks)
Data stroke width: 2 pt

49 Graphical style guide
Eurostat visual identity for interior pages 3
graph models — Theme 1
0
5
10
15
20
Volendit
Sequat
20052004200320022001200019991998199719961995
0
30
60
90
120
150
Lumsand Wisi Sequat Volendit
-15
-10
-5
0
5
10
15
20 Sequat
Velendit
20052004200320022001200019991998199719961995
EU-2
7
Belg
ium
Bulg
aria
Cze
ch R
epub
lic
Den
mar
k
Ger
man
y
Esto
nia
Irel
and
Gre
ece
Spai
n
Fran
ce
Ital
y
Cyp
rus
Latv
ia
Lith
uani
a
Luxe
mb
ourg
Hun
gary
Mal
ta
Net
herl
ands
Aus
tria
Pola
nd
Port
ugal
Rom
ania
Slov
enia
Slov
akia
Finl
and
Swed
en
Uni
ted
King
dom
Sequat etum36 %
Lumsand36 %
Modo con vulla25 %
Tatuero13 %
Volendit7 %
Magna, 1 %Conollu, 5 %
Nisl enhib, 1 %
Sequat etum, 31 % Lumsand, 10 %
Modo con vulla, 24 %
Tatuero, 19 %
Volendit, 3 %
strokes for pie chart boxstroke width: 0.4 pt stroke colour: 30 % K

50 Graphical style guide
Eurostat visual identity for interior pages3
graph models — Theme 2
Volendit
Sequat
0
5
10
15
20
20052004200320022001200019991998199719961995
0
30
60
90
120
150
Lumsand Wisi Sequat Volendit
Sequat
Velendit
-15
-10
-5
0
5
10
15
20
20052004200320022001200019991998199719961995
EU-2
7
Belg
ium
Bulg
aria
Cze
ch R
epub
lic
Den
mar
k
Ger
man
y
Esto
nia
Irel
and
Gre
ece
Spai
n
Fran
ce
Ital
y
Cyp
rus
Latv
ia
Lith
uani
a
Luxe
mb
ourg
Hun
gary
Mal
ta
Net
herl
ands
Aus
tria
Pola
nd
Port
ugal
Rom
ania
Slov
enia
Slov
akia
Finl
and
Swed
en
Uni
ted
King
dom
Sequat etum36 %
Lumsand36 %
Modo con vulla25 %
Tatuero13 %
Volendit7 %
Magna, 1 %Conollu, 5 %
Nisl enhib, 1 %
Sequat etum, 31 % Lumsand, 10 %
Modo con vulla, 24 %
Tatuero, 19 %
Volendit, 3 %

51 Graphical style guide
Eurostat visual identity for interior pages 3
graph models — Theme 2 graph models — Theme 3
0
5
10
15
20
Volendit
Sequat
20052004200320022001200019991998199719961995
0
30
60
90
120
150
Lumsand Wisi Sequat Volendit
-15
-10
-5
0
5
10
15
20 Sequat
Velendit
20052004200320022001200019991998199719961995
EU-2
7
Belg
ium
Bulg
aria
Cze
ch R
epub
lic
Den
mar
k
Ger
man
y
Esto
nia
Irel
and
Gre
ece
Spai
n
Fran
ce
Ital
y
Cyp
rus
Latv
ia
Lith
uani
a
Luxe
mb
ourg
Hun
gary
Mal
ta
Net
herl
ands
Aus
tria
Pola
nd
Port
ugal
Rom
ania
Slov
enia
Slov
akia
Finl
and
Swed
en
Uni
ted
King
dom
Sequat etum36 %
Lumsand36 %
Modo con vulla25 %
Tatuero13 %
Volendit7 %
Magna, 1 %Conollu, 5 %
Nisl enhib, 1 %
Sequat etum, 31 % Lumsand, 10 %
Modo con vulla, 24 %
Tatuero, 19 %
Volendit, 3 %

52 Graphical style guide
Eurostat visual identity for interior pages3
graph models — Theme 4
Volendit
Sequat
0
5
10
15
20
20052004200320022001200019991998199719961995
0
30
60
90
120
150
Lumsand Wisi Sequat Volendit
Sequat
Velendit
-15
-10
-5
0
5
10
15
20
20052004200320022001200019991998199719961995
EU-2
7
Belg
ium
Bulg
aria
Cze
ch R
epub
lic
Den
mar
k
Ger
man
y
Esto
nia
Irel
and
Gre
ece
Spai
n
Fran
ce
Ital
y
Cyp
rus
Latv
ia
Lith
uani
a
Luxe
mb
ourg
Hun
gary
Mal
ta
Net
herl
ands
Aus
tria
Pola
nd
Port
ugal
Rom
ania
Slov
enia
Slov
akia
Finl
and
Swed
en
Uni
ted
King
dom
Sequat etum36 %
Lumsand36 %
Modo con vulla25 %
Tatuero13 %
Volendit7 %
Magna, 1 %Conollu, 5 %
Nisl enhib, 1 %
Sequat etum, 31 % Lumsand, 10 %
Modo con vulla, 24 %
Tatuero, 19 %
Volendit, 3 %

53 Graphical style guide
Eurostat visual identity for interior pages 3
graph models — Theme 4 graph models — Theme 5
0
5
10
15
20
Volendit
Sequat
20052004200320022001200019991998199719961995
0
30
60
90
120
150
Lumsand Wisi Sequat Volendit
-15
-10
-5
0
5
10
15
20 Sequat
Velendit
20052004200320022001200019991998199719961995
EU-2
7
Belg
ium
Bulg
aria
Cze
ch R
epub
lic
Den
mar
k
Ger
man
y
Esto
nia
Irel
and
Gre
ece
Spai
n
Fran
ce
Ital
y
Cyp
rus
Latv
ia
Lith
uani
a
Luxe
mb
ourg
Hun
gary
Mal
ta
Net
herl
ands
Aus
tria
Pola
nd
Port
ugal
Rom
ania
Slov
enia
Slov
akia
Finl
and
Swed
en
Uni
ted
King
dom
Sequat etum36 %
Lumsand36 %
Modo con vulla25 %
Tatuero13 %
Volendit7 %
Magna, 1 %Conollu, 5 %
Nisl enhib, 1 %
Sequat etum, 31 % Lumsand, 10 %
Modo con vulla, 24 %
Tatuero, 19 %
Volendit, 3 %

54 Graphical style guide
Eurostat visual identity for interior pages3
graph models — Theme 6
Volendit
Sequat
0
5
10
15
20
20052004200320022001200019991998199719961995
0
30
60
90
120
150
Lumsand Wisi Sequat Volendit
Sequat
Velendit
-15
-10
-5
0
5
10
15
20
20052004200320022001200019991998199719961995
EU-2
7
Belg
ium
Bulg
aria
Cze
ch R
epub
lic
Den
mar
k
Ger
man
y
Esto
nia
Irel
and
Gre
ece
Spai
n
Fran
ce
Ital
y
Cyp
rus
Latv
ia
Lith
uani
a
Luxe
mb
ourg
Hun
gary
Mal
ta
Net
herl
ands
Aus
tria
Pola
nd
Port
ugal
Rom
ania
Slov
enia
Slov
akia
Finl
and
Swed
en
Uni
ted
King
dom
Sequat etum36 %
Lumsand36 %
Modo con vulla25 %
Tatuero13 %
Volendit7 %
Magna, 1 %Conollu, 5 %
Nisl enhib, 1 %
Sequat etum, 31 % Lumsand, 10 %
Modo con vulla, 24 %
Tatuero, 19 %
Volendit, 3 %

55 Graphical style guide
Eurostat visual identity for interior pages 3
graph models — Theme 6 graph models — Theme 7
0
5
10
15
20
Volendit
Sequat
20052004200320022001200019991998199719961995
0
30
60
90
120
150
Lumsand Wisi Sequat Volendit
-15
-10
-5
0
5
10
15
20 Sequat
Velendit
20052004200320022001200019991998199719961995
EU-2
7
Belg
ium
Bulg
aria
Cze
ch R
epub
lic
Den
mar
k
Ger
man
y
Esto
nia
Irel
and
Gre
ece
Spai
n
Fran
ce
Ital
y
Cyp
rus
Latv
ia
Lith
uani
a
Luxe
mb
ourg
Hun
gary
Mal
ta
Net
herl
ands
Aus
tria
Pola
nd
Port
ugal
Rom
ania
Slov
enia
Slov
akia
Finl
and
Swed
en
Uni
ted
King
dom
Sequat etum36 %
Lumsand36 %
Modo con vulla25 %
Tatuero13 %
Volendit7 %
Magna, 1 %Conollu, 5 %
Nisl enhib, 1 %
Sequat etum, 31 % Lumsand, 10 %
Modo con vulla, 24 %
Tatuero, 19 %
Volendit, 3 %

56 Graphical style guide
Eurostat visual identity for interior pages3
graph models — Theme 8
Volendit
Sequat
0
5
10
15
20
20052004200320022001200019991998199719961995
0
30
60
90
120
150
Lumsand Wisi Sequat Volendit
Sequat
Velendit
-15
-10
-5
0
5
10
15
20
20052004200320022001200019991998199719961995
EU-2
7
Belg
ium
Bulg
aria
Cze
ch R
epub
lic
Den
mar
k
Ger
man
y
Esto
nia
Irel
and
Gre
ece
Spai
n
Fran
ce
Ital
y
Cyp
rus
Latv
ia
Lith
uani
a
Luxe
mb
ourg
Hun
gary
Mal
ta
Net
herl
ands
Aus
tria
Pola
nd
Port
ugal
Rom
ania
Slov
enia
Slov
akia
Finl
and
Swed
en
Uni
ted
King
dom
Sequat etum36 %
Lumsand36 %
Modo con vulla25 %
Tatuero13 %
Volendit7 %
Magna, 1 %Conollu, 5 %
Nisl enhib, 1 %
Sequat etum, 31 % Lumsand, 10 %
Modo con vulla, 24 %
Tatuero, 19 %
Volendit, 3 %

57 Graphical style guide
Eurostat visual identity for interior pages 3
graph models — Theme 8 graph models — Theme 9
0
5
10
15
20
Volendit
Sequat
20052004200320022001200019991998199719961995
0
30
60
90
120
150
Lumsand Wisi Sequat Volendit
-15
-10
- 5
0
5
10
15
20 Sequat
Velendit
20052004200320022001200019991998199719961995
EU-2
7
Belg
ium
Bulg
aria
Cze
ch R
epub
lic
Den
mar
k
Ger
man
y
Esto
nia
Irel
and
Gre
ece
Spai
n
Fran
ce
Ital
y
Cyp
rus
Latv
ia
Lith
uani
a
Luxe
mb
ourg
Hun
gary
Mal
ta
Net
herl
ands
Aus
tria
Pola
nd
Port
ugal
Rom
ania
Slov
enia
Slov
akia
Finl
and
Swed
en
Uni
ted
King
dom
Sequat etum36 %
Lumsand36 %
Modo con vulla25 %
Tatuero13 %
Volendit7 %
Magna, 1 %Conollu, 5 %
Nisl enhib, 1 %
Sequat etum, 31 % Lumsand, 10 %
Modo con vulla, 24 %
Tatuero, 19 %
Volendit, 3 %
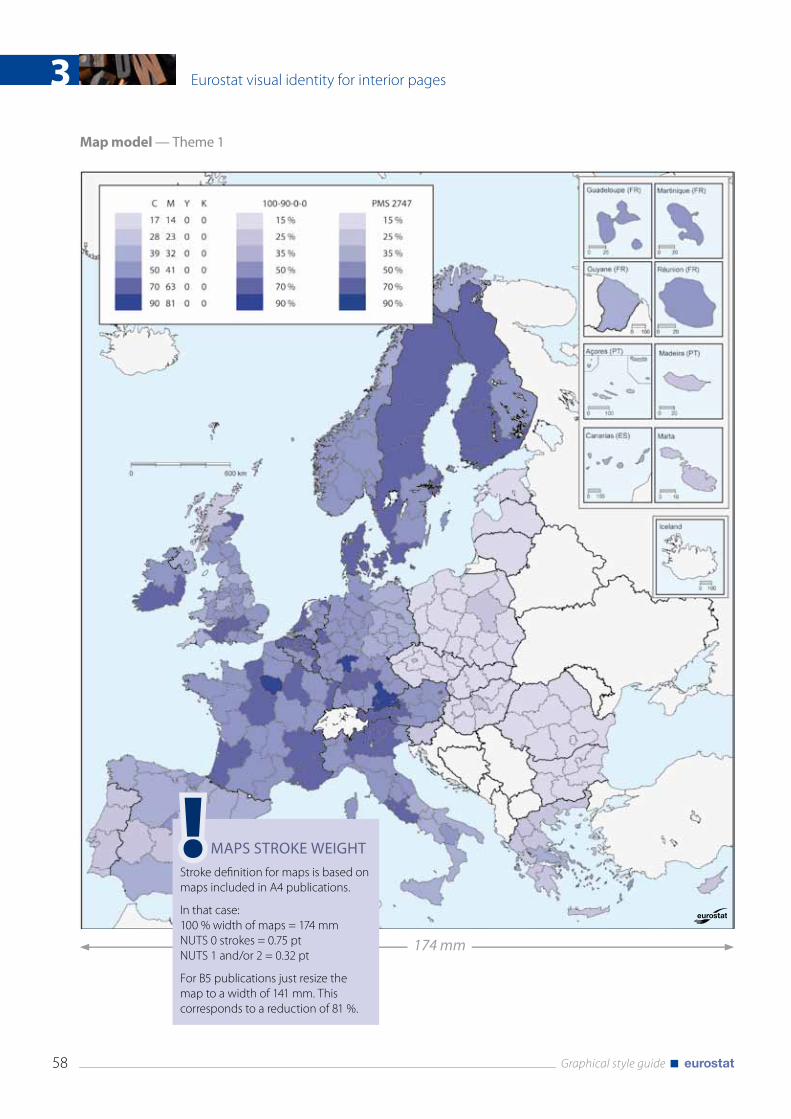
58 Graphical style guide
Eurostat visual identity for interior pages3
Map model — Theme 1
MAPS STROKE WEIGHT
Stroke definition for maps is based on maps included in A4 publications.
In that case:100 % width of maps = 174 mmNUTS 0 strokes = 0.75 ptNUTS 1 and/or 2 = 0.32 pt
For B5 publications just resize the map to a width of 141 mm. This corresponds to a reduction of 81 %.
!174 mm

59 Graphical style guide
Eurostat visual identity for interior pages 3
Map model — Theme 2

60 Graphical style guide
Eurostat visual identity for interior pages3
Map model — Theme 3

61 Graphical style guide
Eurostat visual identity for interior pages 3
Map model — Theme 4

62 Graphical style guide
Eurostat visual identity for interior pages3
Map model — Theme 5
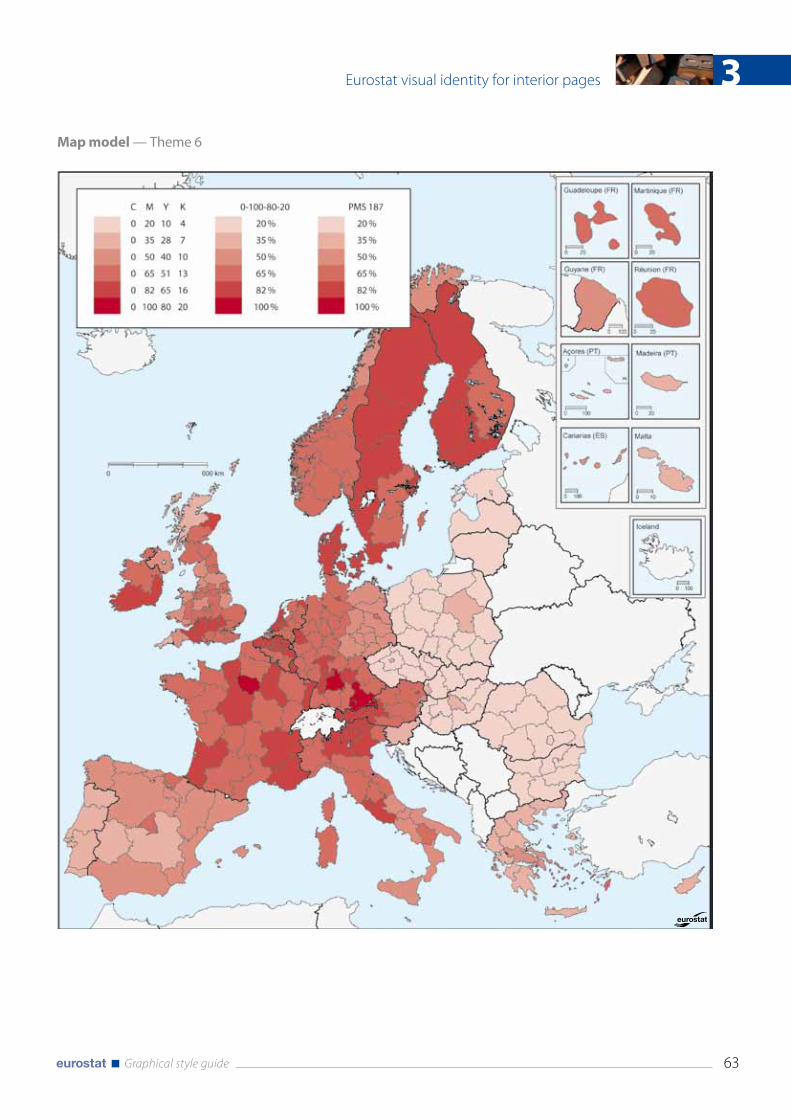
63 Graphical style guide
Eurostat visual identity for interior pages 3
Map model — Theme 6

64 Graphical style guide
Eurostat visual identity for interior pages3
Map model — Theme 7

65 Graphical style guide
Eurostat visual identity for interior pages 3
Map model — Theme 8

66 Graphical style guide
Eurostat visual identity for interior pages3
Map model — Theme 9

67 Graphical style guide
Eurostat visual identity for interior pages 3
Font usage in the layout
In order to expand the style-sheet possibilities Minion Pro (serif font) has been chosen to create contrast with Myriad Pro (sans serif font already used on cover pages). Minion Pro offers the same advantages as Myriad Pro in terms of cross-platform compatibility and variety of glyphs. It also offers a wide range of different styles.
Minion Pro CondensedABCDEFGHIJKLMNOPQRSTUVWXYZabcdefghijklmnopqrstuvwxyz0123456789
Minion Pro Condensed ItalicABCDEFGHIJKLMNOPQRSTUVWXYZabcdefghijklmnopqrstuvwxyz0123456789
Minion Pro Semibold CondensedABCDEFGHIJKLMNOPQRSTUVWXYZabcdefghijklmnopqrstuvwxyz0123456789
Minion Pro Semibold Condensed ItalicABCDEFGHIJKLMNOPQRSTUVWXYZabcdefghijklmnopqrstuvwxyz0123456789
Minion Pro Bold CondensedABCDEFGHIJKLMNOPQRSTUVWXYZabcdefghijklmnopqrstuvwxyz0123456789
Minion Pro Bold Condensed ItalicABCDEFGHIJKLMNOPQRSTUVWXYZabcdefghijklmnopqrstuvwxyz0123456789
Minion Pro RegularABCDEFGHIJKLMNOPQRSTUVWXYZabcdefghijklmnopqrstuvwxyz0123456789
Minion Pro ItalicABCDEFGHIJKLMNOPQRSTUVWXYZabcdefghijklmnopqrstuvwxyz0123456789
Minion Pro SemiboldABCDEFGHIJKLMNOPQRSTUVWXYZabcdefghijklmnopqrstuvwxyz0123456789
Minion Pro Semibold ItalicABCDEFGHIJKLMNOPQRSTUVWXYZabcdefghijklmnopqrstuvwxyz0123456789
Minion Pro BoldABCDEFGHIJKLMNOPQRSTUVWXYZabcdefghijklmnopqrstuvwxyz0123456789
Minion Pro Bold ItalicABCDEFGHIJKLMNOPQRSTUVWXYZabcdefghijklmnopqrstuvwxyz0123456789
Myriad Pro and Minion Pro
Minion Pro will be used mainly for body texts, whereas Myriad Pro will be used in titles, tables, graphs and highlighted text in panels.
FONT USAGE FOR LAYOUT WITH OFFICE AUTOMATION SOFTWARE
Many Eurostat publications are produced in‑house with office automation software. That can have direct consequence on the font usage. Myriad Pro and Minion Pro are licensed fonts used for professional design. They are not installed by default on computers.
For that reason it is recommended to replace Myriad Pro and Minion Pro, as follows, by default fonts installed on all computers.
Change Myriad Pro to Arial.Change Minion Pro to Times.
All other paragraph style information will be taken over from the descriptions on the following pages.
!

68 Graphical style guide
Eurostat visual identity for interior pages3
Page layout — A4 general structureThe structure of the page is based on a multiple column layout. With 12 columns the layout offers a wide range of possibilities:
1
18 Publication title
Chapter title Chapter title 1
1� Publication title
15
35
21
1412
818
1
16 Publication title
Chapter title Chapter title 1
17 Publication title
19 21
These first two layouts are the preferred options.One or two columns for the body of the text and one small column for captions, highlight information, illustrations, footnotes(*), etc
(*) Valid only for one-column layout
If needed you can opt for two or three full-width columns. This can be used for magazines, for example.
NB:Never use a full-width one-column layout. Text lines would be too long and difficult to read.
Gutter: 4.5 mm

69 Graphical style guide
Eurostat visual identity for interior pages 3
A4 page separators
Part separator number:
Font: Minion Pro BoldSize: 150 pt Alignment: leftColour: theme 100 %
Part separator title:
Font: Myriad Pro BoldSize/leading: 28 pt (one line)
20/22 pt (two lines or more)
Alignment: leftColour: white
Chapter separator number:
Font: Myriad Pro BoldSize: 130 pt Alignment: rightColour: hole in curved shape
Chapter separator title:
Font: Myriad Pro BoldSize/leading: 28 pt (one line)
20/22 pt (two lines or more)
Alignment: leftColour: theme + 40 % K
Double-page alternative:Background colour: theme 50 %
Shape background colour: theme 50 %
The curved shapes including chapter numbers are available as EPS files or as graphic elements collected in an Adobe InDesign library.
Double-page alternative:Background colour: theme 50 %
A lighter version without photo is conceivable. In that case, replace
the photo by the theme colour (shading 50 %).

70 Graphical style guide
Eurostat visual identity for interior pages3
Styl
e
Sam
ple
Fon
t
Size
Lead
ing
Alig
nm
ent
Left
ind
ent
Firs
t lin
e
Rig
ht i
nd
ent
Spac
e b
efo
re
Spac
e af
ter
Co
lou
r
SEPA
RA
TOR
PA
GES
separator part roman number I Minion Pro Bold 150 left theme 100 %
separator part sample Myriad Pro Bold 20 22 leftwhite on theme 50 %
separator part 1 line sam. Myriad Pro Bold 28 leftwhite on theme 50 %
separator chapter sample Myriad Pro Bold 20 22 lefttheme + 40K 100 %
separator chapter 1 line sam. Myriad Pro Bold 28 left
theme + 40K 100 %
hEA
DER
AN
D F
OO
TER
footer folio even 00 Myriad Pro Light 12 right 3 K 100 %
footer folio odd 00 Myriad Pro Light 12 left 3 K 100 %
footer publication title even Sample Myriad Pro Light 9.5 11 right K 60 %
footer publication title odd Sample Myriad Pro Light 9.5 11 left K 60 %
header chapter number even 1 Myriad Pro Bold 30 right 2
white on theme 100 %
header chapter number odd 1 Myriad Pro Bold 30 left 2
white on theme 100 %
header chapter title even Sample Myriad Pro Light 12 14 left theme 100 %
header chapter title odd Sample Myriad Pro Light 12 14 right theme 100 %
Styl
e
Sam
ple
Fon
t
Size
Lead
ing
Alig
nm
ent
Left
ind
ent
Firs
t lin
e
Rig
ht i
nd
ent
Spac
e b
efo
re
Spac
e af
ter
Co
lou
r
A4 main style sheets
REMINDERFor MS Word‑based layouts:
change Myriad Pro to Arial
change Minion Pro to Times

71 Graphical style guide
Eurostat visual identity for interior pages 3
Styl
e
Sam
ple
Fon
t
Size
Lead
ing
Alig
nm
ent
Left
ind
ent
Firs
t lin
e
Rig
ht i
nd
ent
Spac
e b
efo
re
Spac
e af
ter
Co
lou
r
BO
DY,
TIT
LES
AN
D P
AN
ELS
body text Sample Minion Pro Regular 10 11.8 justifi ed 2 K 100 %
body list • Sample Minion Pro Regular 10 11.8 justifi ed 12 ‑ 3 2 K 100 %
body title 1 Sample Myriad Pro Regular 20 22 left 8 3theme + 40K 100 %
body title 2 Sample Myriad Pro Regular 14 16 left 3 3 theme 100 %
body title 3 sample Myriad Pro Bold 11 13 left 2 2theme + 40K 100 %
body title 4 SampleMyriad Pro Semibold Italic
10 11.8 left 2 2theme + 40K 100 %
body title 5 Sample Minion Pro Bold 10 11.8 left 2 2 K 100 %
panel title SAMPLE Myriad Pro Regular 12 14 left 2 2theme + 40K 100 % on theme 10 %
panel text Sample Myriad Pro Light 10 11.8 justifi ed 2K 100 %on theme 10 %
footnote (1) Sample Myriad Pro Light 6.5 7.5 left 3 ‑ 3 (2) 2 K 100 %
TAB
LES,
GR
AP
hS
AN
D M
AP
S (4 )
table header 1 sample Myriad Pro Bold 9 10.5 centred K 100 %
table header 2 Sample Myriad Pro Semibold 9 10.5 centred K 100 %
table header 3 Sample Myriad Pro Regular 9 10.5 centred K 100 %
table 1st column 1 Sample Myriad Pro Semibold 9 10.5 left K 100 %
table 1st column 2 Sample Myriad Pro Regular 9 10.5 left K 100 %
table data Sample Myriad Pro Light 9 10.5 right K 100 %
table body Sample Myriad Pro Light 9 10.5 left K 100 %
graph legend sample Myriad Pro Bold 8 8.5 left K 100 %
graph value SampleSample Myriad Pro Regular 8 8.5 K 100 %
graph‑table‑map title Fig 1.2 Sample Myriad Pro Bold (2 words) + Myriad Pro Regular
11 13 left 2 3 K 60 %
graph‑table‑map title no space after Fig 1.2 Sample 11 13 left 2 K 60 %
graph‑table‑map unit Sample Myriad Pro Regular 10 12 left 3 K 60 %
graph‑table‑map footnote
Sample Myriad Pro Light 6.5 7.5 left 3 ‑ 3 (2) K 100 %
graph‑table‑map source
Source: Sample (254) (3)Myriad Pro Italic (1 word) + Myriad Pro Regular
7 8.4 left (2) K 100 %
Styl
e
Sam
ple
Fon
t
Size
Lead
ing
Alig
nm
ent
Left
ind
ent
Firs
t lin
e
Rig
ht i
nd
ent
Spac
e b
efo
re
Spac
e af
ter
Co
lou
r
(1) The footnote reference should always be presented in superscript and between brackets.(2) Above a column width of 115 mm the footnote and source should have a right indent corresponding to one third of the olumn width.(3) The data code should be a hyperlink displayed in blue (C 85 %, M 65 %).(4) If space is limited, the Myriad Pro could be used in semicondensed or condensed style if needed.

72 Graphical style guide
Eurostat visual identity for interior pages3
Methodologies & Working papers
(A4 electronic only documents — layout made in Microsoft Word)
Office automation tools do not offer the same freedom and flexibility for layout as professional layout software. Multiple column layout becomes difficult, even impossible, to handle properly.
Furthermore, electronically disseminated publications do not need a facing page layout.
For both reasons, the structure for electronic only publications has been simplified.
It is based on a left side A4 template.
Header and footer are displayed exactly as on the professional A4 layout, but the content is fixed on the one-column layout with 30 mm left and right margins and 35 mm top margin.
Paragraph styles are taken over from the usual A4 layout, the only difference being the font families used. Arial replaces Myriad Pro. Times replaces Minion Pro.
MS Word templates including style sheets for the basic page layout in all nine themes are available in the Eurostat dissemination unit.

73 Graphical style guide
Eurostat visual identity for interior pages 3
Templates for separators are available as well.

74 Graphical style guide
Eurostat visual identity for interior pages3
Page layout — B5 general structureThe structure of the page is based on a multiple column layout. With 12 columns, the layout offers a wide range of possibilities:
1 Chapter title
�4 Publication title
Chapter title 1
�5 Publication title
108
1216
28
15 20
Gutter: 4.2 mm
1 Chapter title
�6 Publication title
Chapter title 1
�7 Publication title
18
Footnotes in margins are only allowed for one-column layouts.

75 Graphical style guide
Eurostat visual identity for interior pages 3
B5 page separators
Part separator number:
Font: Minion Pro BoldSize: 130 pt Alignment: leftColour: theme 100 %
Part separator title:
Font: Myriad Pro BoldSize/leading: 24 pt (one line)
18/20 pt (two lines or more)
Alignment: leftColour: white
Chapter separator number:
Font: Myriad Pro BoldSize/leading: 110 pt Alignment: rightColour: hole in curved shape
Chapter separator title:
Font: Myriad Pro BoldSize/leading: 24 pt (one line)
18/20 pt (two lines or more)
Alignment: leftColour: theme + 40 % K
Double-page alternative:Background colour: theme 50 %
Shape background colour: theme 50 %
The curved shapes including chapter numbers are available as EPS files or as graphic elements collected in an Adobe InDesign library.
Double-page alternative:Background colour: theme 50 %.
A lighter version without photo is conceivable. In that case, replace
the photo by the theme colour (shading 50 %).

76 Graphical style guide
Eurostat visual identity for interior pages3
B5 style sheetsSt
yle
Sam
ple
Fon
t
Size
Lead
ing
Alig
nm
ent
Left
ind
ent
Firs
t lin
e
Rig
ht i
nd
ent
Spac
e b
efo
re
Spac
e af
ter
Co
lou
r
SEPA
RA
TOR
PA
GES
separator part roman number I Minion Pro Bold 130 left theme 100 %
separator part sample Myriad Pro Bold 18 20 left white on theme 50 %
separator part 1 line sam. Myriad Pro Bold 24 left white on theme 50 %
separator chapter sample Myriad Pro Bold 18 20 left theme + 40K 100 %
separator chapter 1 line sam. Myriad Pro Bold 24 left theme + 40K 100 %
hEA
DER
AN
D F
OO
TER
footer folio even 00 Myriad Pro Light 11 right 3 K 100 %
footer folio odd 00 Myriad Pro Light 11 left 3 K 100 %
footer publication title even Sample Myriad Pro Light 9.5 10.5 right K 60 %
footer publication title odd Sample Myriad Pro Light 9.5 10.5 left K 60 %
header chapter number even 1 Myriad Pro Bold 30 right 1.5 white
on theme 100 %
header chapter number odd 1 Myriad Pro Bold 16 left 1.5 white
on theme 100 %
header chapter title even Sample Myriad Pro Light 11 13 left theme 100 %
header chapter title odd Sample Myriad Pro Light 11 13 right theme 100 %
Styl
e
Sam
ple
Fon
t
Size
Lead
ing
Alig
nm
ent
Left
ind
ent
Firs
t lin
e
Rig
ht i
nd
ent
Spac
e b
efo
re
Spac
e af
ter
Co
lou
r
sdgqdg

77 Graphical style guide
Eurostat visual identity for interior pages 3
Styl
e
Sam
ple
Fon
t
Size
Lead
ing
Alig
nm
ent
Left
ind
ent
Firs
t lin
e
Rig
ht i
nd
ent
Spac
e b
efo
re
Spac
e af
ter
Co
lou
r
BO
DY,
TIT
LES
AN
D P
AN
ELS
body text Sample Minion Pro Regular 9.5 11.5 justifi ed 2 K 100 %
body list • Sample Minion Pro Regular 9.5 11.5 justifi ed 12 ‑ 3 2 K 100 %
body title 1 Sample Myriad Pro Regular 18 20 left 8 3 theme + 40K 100 %
body title 2 Sample Myriad Pro Regular 12 14 left 3 3 theme 100 %
body title 3 sample Myriad Pro Bold 10 13 left 2 2 theme + 40K 100 %
body title 4 Sample Myriad Pro Semibold Italic 9.5 11.5 left 2 2 theme + 40K 100 %
body title 5 Sample Minion Pro Bold 9.5 11.5 left 2 2 K 100 %
panel title SAMPLE Myriad Pro Regular 11 13 left 2 2 theme + 40K 100 % on theme 10 %
panel text Sample Myriad Pro Light 9 10.8 justifi ed 2 K 100 %on theme 10 %
footnote (1) Sample Myriad Pro Light 6.5 7.5 left 3 ‑ 3 (2) 2 K 100 %
TAB
LES,
GR
AP
hS
AN
D M
AP
S (4 )
table header 1 sample Myriad Pro Bold 8 9 centered K 100 %
table header 2 Sample Myriad Pro Semibold 8 9 centered K 100 %
table header 3 Sample Myriad Pro Regular 8 9 centered K 100 %
table 1st column 1 Sample Myriad Pro Semibold 8 9 left K 100 %
table 1st column 2 Sample Myriad Pro Regular 8 9 left K 100 %
table data Sample Myriad Pro Light 8 9 right K 100 %
table body Sample Myriad Pro Light 8 9 left K 100 %
graph legend sample Myriad Pro Bold 7 8 left K 100 %
graph value Sample Sample Myriad Pro Regular 7 8 K 100 %
graph‑table‑map titleFig 1.2 Sample Myriad Pro Bold
(2 words) + Myriad Pro Regular
10 12 left 2 3 K 60 %
graph‑table‑map title no space after
Fig 1.2 Sample
10 12 left 2 K 60 %
graph‑table‑map unit Sample Myriad Pro Regular 9 10.8 left 3 K 60 %
graph‑table‑map footnote Sample Myriad Pro Light 6.5 7.5 left 3 ‑ 3 (2) K 100 %
graph‑table‑map sourceSource: Sample (254) (3)
Myriad Pro Italic (1 word) + Myriad Pro Regular 7 8.4 left (2) K 100 %
Styl
e
Sam
ple
Fon
t
Size
Lead
ing
Alig
nm
ent
Left
ind
ent
Firs
t lin
e
Rig
ht i
nd
ent
Spac
e b
efo
re
Spac
e af
ter
Co
lou
r
(1) The footnote reference should always be presented in superscript and between brackets.(2) Above a column width of 115 mm the footnote and source should have a right indent corresponding to one third of the column width.(3) The data code should be a hyperlink displayed in blue (C 85 %, M 65 %).(4) If space is limited, the Myriad Pro could be used in semicondensed or condensed style if needed.

78 Graphical style guide
Eurostat visual identity for interior pages3
Page layout — Pocketbook general structure
The Pocketbook layout is foreseen as a one-column layout. Nevertheless, the main column is divided into six smaller columns in order to have the possibility to structure the page when needed (e.g. use of indents, panels).
1 Chapter title
16 Cultural statistics
1Chapter title
17 Cultural statistics
10
712
2020
58
13
Gutter: 2 mm
12
1 Chapter title
18 Cultural statistics
1Chapter title
19 Cultural statistics
12

79 Graphical style guide
Eurostat visual identity for interior pages 3
Pocketbook page separators
Part separator number:
Font: Minion Pro BoldSize: 100 pt Alignment: leftColour: theme 100 %
Part separator title:
Font: Myriad Pro BoldSize/leading: 16/18 ptAlignment: leftColour: whitetheme + 40 % K
Chapter separator number:
Font: Myriad Pro BoldSize: 85 pt Alignment: rightColour: hole in curved shape
Chapter separator title:
Font: Myriad Pro BoldSize/leading: 16/18 ptAlignment: leftColour: theme + 40 % K
Double-page alternative:Background colour: theme 50 %
Shape background colour: theme 50 %
The curved shapes including chapter numbers are available as EPS files or as graphic elements collected in an InDesign library.
Double-page alternative:Background colour: theme 50 %
A lighter version without photo is conceivable. In that case,
replace the photo by the theme colour (shading 50 %).

80 Graphical style guide
Eurostat visual identity for interior pages3
Page layout — Landscape pocketbook general structure
For some reason (width of tables or graphs) you may need to compose your layout in landscape format.
In that case the structure changes due to the way that you need to turn the publication to read it. Layout is structured in 12 columns, the structure of it can be varied. Pages are not symmetric and headers and footers are not repeated on each page. Please note that the folios for each spread are displayed on the right (odd) page and separated by a slash.
The spread will be displayed as in the example below:
5 National accounts
Title of the publication 18/19
5 National accounts
Title of the publication 18/19
5 National accounts
75
10
13
Gutter 5 mm
Title of the publication 16/17
15
8,5
10
7,5
1513
5 National accounts
75
10
13
Gutter 5 mm
Title of the publication 16/17
15
8,5
10
7,5
1513
6
5 National accounts
75
10
13
Gutter 5 mm
Title of the publication 16/17
15
8,5
10
7,5
1513
5 National accounts
75
10
13
Gutter 5 mm
10
Title of the publication 16/17
15
8,5
10
7,5
1513
612
12

81 Graphical style guide
Eurostat visual identity for interior pages 3
Landscape pocketbook page separators
Part separator number:
Font: Minion Pro BoldSize: 100 pt Alignment: leftColour: theme 100 %
Part separator title:
Font: Myriad Pro BoldSize/leading: 16/18 ptAlignment: leftColour: white
Chapter separator number:
Font: Myriad Pro BoldSize: 100 pt Alignment: rightColour: hole in curved shape
Chapter separator title:
Font: Myriad Pro BoldSize/leading: 16/18 ptAlignment: leftColour: theme + 40 % K
Layout examples
Title of the publication
Maio beribuscium ius doluptas essus explitat aut facimolupta dolupitia vite voluptatur
III 5863
Title of the publication
Bor accum evenimi cum dolorrum se labo Itiscitiis magnimus repuda digentur mollut la 636
5 National accounts
Nus dis nem aute ellant quunt eum eseque dolupta cus ipiciet veliamus pori con re-rum faccuptur accusto renisto qui coris moluptassum idendis alit plabo. Natque aut hit plit est voluptat quam quatur anis idebitas corem quibusante sitat.
Pienimin cor se cuscimp oreptatet
incit fugitatem ex et facerfe rorpossi netures sitatur sec-tio. Giam quuntiu riandit molecto dem rehenescim que re quo min cus dolor molorrunt escipsa nietur resciur emquia quia commo id quodit ditibus, quos volor aut es nonsecti a nonsequ ibusam aped etur seque event il ipient porum sit plit omnihil eos dolut dis nit re volum quam, omnimi, cullaborum et incid qui aceat re, iusam facesti oraeris volore sitatioPos atur sequibusande etus core officiendis sitatin plandest omnimust, eatqui ip-sumquodi ullent quam, ut pro imolupt atestior sum
Graph 1: Porqui coris moluptassum
(1) For the period 1996-2003, the persons employed in crafts, trades and as free-lances, as well as in the police and defence-related activities are excluded; from 2004 onwards the number of persons employed in the police and defence-related activities are included. (2) For 1998-2004: net salary; for 2005, data from Brcko District are included.
800
700
600
500
400
300
200
100
02003 2004 2005 2006 2007 2008
Ecus as alit, ommolup tatquae ped
Uditiusam re dolore, corum ea con re lique
5 National accounts
Mus omnis es doloreperum quid
Ablabor aligendigent eostiis
dolesti onsequi optasim enimodicit volores et acerovita section praest, cones maxim dolorerae comnitasint rem voloratium fugit oc-culli tatendam eos di doluptum laudam fugia doluptiorae am, ommo qui qui omnimo min reperit, ut iumqui volendae comnimaxim eum quiaest, aut quos conserum, adit velit ute laceaqu ianimporem fuga. Ur a dero mos sectemolecus aut ra eostrum quodis moluptus, ili-bus rest omnias que voluptis invent fugitatus, qui comnimus et, tem rem fuga. Ulpario es moditatem sinus dicia corum nem vellatur as isit veliquuntem ant officitatur rae dolo opta volorem estia consent iosseque molesed maiossit, quos quibea doluptia con consectem au-tem voluptur?
Bis del id ea sim et facias et officature res ex et laut erioremod qui te estore, odit, te reped que offic tes seditior sin et velent expe prendaes volo et, coribus ea id ut rati a dolorepro offictium voles quame dolut hictis aliquiam assimustiist etur?
Eribusam, que simagni magnam reruptas sunt a imi, nonsendis nos ariore, con re id ut officiam eiciendis dest hic tem quat.
Temporem re saepra volorum
suntemolest endaectatur si ipsam, odicti blabore, ipiciendit, que volum il et faceate as cum sincto eum excestis dit as duciis de rest lab ipsandel molupta simagna tquiam aspelent ea:
• Snihilit ommoluptaque vendi atio. • Velese de omnimen imusam aut poribus, • Dut quunturemped moluptat as ex experisquam utemque
debis mollo doluptate nis magnis sequias etusci consequo • Fdoluptatur arum, nessinc iurepratem ut rectisque diti ve-
lecus que nimperio occus.
Imet am aut volupta voloriam quo iur aut alignam quiatia dem es-equia preiumq uuntia nectem dendam, aut expliquid quam volori-bus quasped qui rernam la eumet hillece rumquas archil moluptat la voluptas volor aut modios molorit rae eossi volupta quae arit ped et explabo rrumquis et omniam arum nat.
Title of the publication 124/125
Average nominal monthly wages and salaries (EUR) 1997 1998 1999 2000 2001 2002 2003 2004 2005 2006 2007EU-27 : : : : : : : : : : :Croatia (1) 527 578.6 600.4 637 676.4 723.9 742.9 798.4 844.2 905.7 :The former Yugoslav Republic of Macedonia 161.3 153.8 159.4 167.9 173.2 185 193 200.4 205.5 220.9 :Turkey : : : : : 258.5 290.3 297.9 355 : :Albania : : : : : : : : : : :Bosnia and Herzegovina (2) : 150.3 175.4 190.2 208.6 228 247.5 258.2 275.1 : :Montenegro : : : : : : 173.9 195.3 213.1 246 338Serbia : : 169.7 76.5 145.4 218.5 255.3 283.2 307.7 377.2 484.4Kosovo under UNSCR 1244/99 : : : : : : : : : : :
Index of real wages and salaries (2000=100) 1997 1998 1999 2000 2001 2002 2003 2004 2005 2006 2007EU-27 90.2 92.8 96.1 100 104.8 108.9 112.8 116.8 120 123.6 128.2Croatia (1) 87.3 92.4 98.4 100 99.2 103.2 106.1 112.2 113.4 116.6 120.4The former Yugoslav Republic of Macedonia 93.3 96.8 100.3 100 98.1 103 106.7 111.4 113.6 114.1 112.5Turkey : : : : : : : : : : :Albania : : : : : : : : : : :Bosnia and Herzegovina : : : : : : : : : : :Montenegro 100.2 106.2 99.9 100 91.6 109.7 119.3 130.9 139.7 156.4 179.9Serbia 116.7 115.5 94.2 100 118.4 154.9 176.5 196.1 209.5 233.3 266.1Kosovo under UNSCR 1244/99 : : : : : : : : : : :
(1) For the period 1996-2003, the persons employed in crafts, trades and as free-lances, as well as in the police and defence-related activities are excluded; from 2004 onwards the number of persons employed in the police and defence-related activities are included. (2) For 1998-2004: net salary; for 2005, data from Brcko District are included.
Table 3.1: Wages and salaries
Title of the publication 126/127
SaM ellore Mod que NoS aceStio oMNiS deMPore qui voleS dolorioruM
G aut exernam nusdae magnihit il is debis consed ut rem ex et am que qui te autem ea quiam, temque siti aliquunt faccabo. Nam lab ipsa vo-lessimus quo voluptatiam il et quamusa pienisq uuntia ex eaquos vent, aut ulparum faciae pre sita nam, natur? Equostio consedis expelibus-cim num dolupita cus ipid qui quia doleni to tem. Nam estiam faceati orepuda eroviti busanduntur aut as pa sandi doluptatis sus maxime et, omnimin rehenimillis quos peribea aut remporatem vent ad quis rerum doluptiumqui quid qui doluptiuntur audae ni optae. Nemodi inullaut quisitatem ant utem explabore nim eribusape nonsequi dolorerios seculpa ruptaquatqui doluptur rerorero eatas dolestrum quas eatibus et id exceat volupta speligent omnis es et anim autessitatem aditia quo excerite nonsequi imus maximos dolorro vidempor arunt faci quo dip-sus aut molore offic tet, tem fugias ratendae sunt volorem doluptasitis ium harum explabo. Uptatur? Quis mod ut hiciur, illa ipiet optiis sandit quas ut ditatium, nonsed ulparibus. Dandis as eum et ulla dipsape recu-saperum in resto volupiscitas inciminum quam, in conet audi occullibus suntias doluptatem faccus poria nonet venis auda pernam eos pelitis
quat aute magnihi tatur, atecatet eium cone pro ium ant optam, ex-ereptasped modi volori undae sum et plandel et eici cus nullo ommolor esendun totatquat dolorro bla dunt dolupta volorepreius serchiciet il in pos vernat.
Ut et omnihictum harum nullandis aut eum rem dolorio volum sinveli ci-etur aut eribusam dissinus ratessi nvendem harum consent emperiaspe minctatur arion rendae volorrorro voluptatem. Dolupietur abo. Odi aut pore sum quiam aut moluptur moditibearum ad quo id ut et asperspi-ende quae odis et estotate nihilla dolorporem excearibea apita nonecab oratur? Ihitem quibus sa vendelest aut officiu nditios simpor molestiur? Repta di non re nihillo tempori ossumquo que sit et re exceaque pra duciis nem quianis estrund eniminimus eum idi dest es moluptamus do-lorrum voluptatur, quiatia nullut pliquam coneseq uatati inum inis arum fuga. Ut aut quidestias rere pa exerum, utemper spiciae si rae conecul luptatur aut dolorerit platio optatio reprae non plabor sam, ommodi ature dolupid ebitet facculla non cuptatum fuga. Siminve rnatiatum as-pellut ant.
Ihit hil idelit duciate mporeiusam quostia temporem volores evel ipite ne pelic totam nus

82 Graphical style guide
Eurostat visual identity for interior pages3
Pocketbook style sheets (also applicable for A5 publications)St
yle
Sam
ple
Font
Size
Lead
ing
Alig
nmen
t
Left
inde
nt
Firs
t lin
e
Righ
t ind
ent
Spac
e be
fore
Spac
e af
ter
Colo
ur
SEPA
RATO
R PA
GES
separator part roman number I Minion Pro Bold 100 left theme 100 %
separator part sample Myriad Pro Bold 16 18 left white on theme 50 %
separator part 1 line sam. Myriad Pro Bold 18 left white on theme 50 %
separator chapter sample Myriad Pro Bold 16 18 left theme + 40K 100 %
separator chapter 1 line sam. Myriad Pro Bold 18 left theme + 40K 100 %
HEA
DER
AN
D F
OO
TER
footer folio even 00 Myriad Pro Light 7.5 right K 100 %
footer folio odd 00 Myriad Pro Light 7.5 left K 100 %
footer publication title even Sample Myriad Pro Light 7.5 8.5 right K 60 %
footer publication title odd Sample Myriad Pro Light 7.5 8.5 left K 60 %
header chapter number even 1 Myriad Pro Bold 16 right 1 white
on theme 100 %
header chapter number odd 1 Myriad Pro Bold 16 left 1 white
on theme 100 %
header chapter title even Sample Myriad Pro Light 9 10.5 left theme 100 %
header chapter title odd Sample Myriad Pro Light 9 10.5 right theme 100 %
Styl
e
Sam
ple
Font
Size
Lead
ing
Alig
nmen
t
Left
inde
nt
Firs
t lin
e
Righ
t ind
ent
Spac
e be
fore
Spac
e af
ter
Colo
ur
sdgqdg
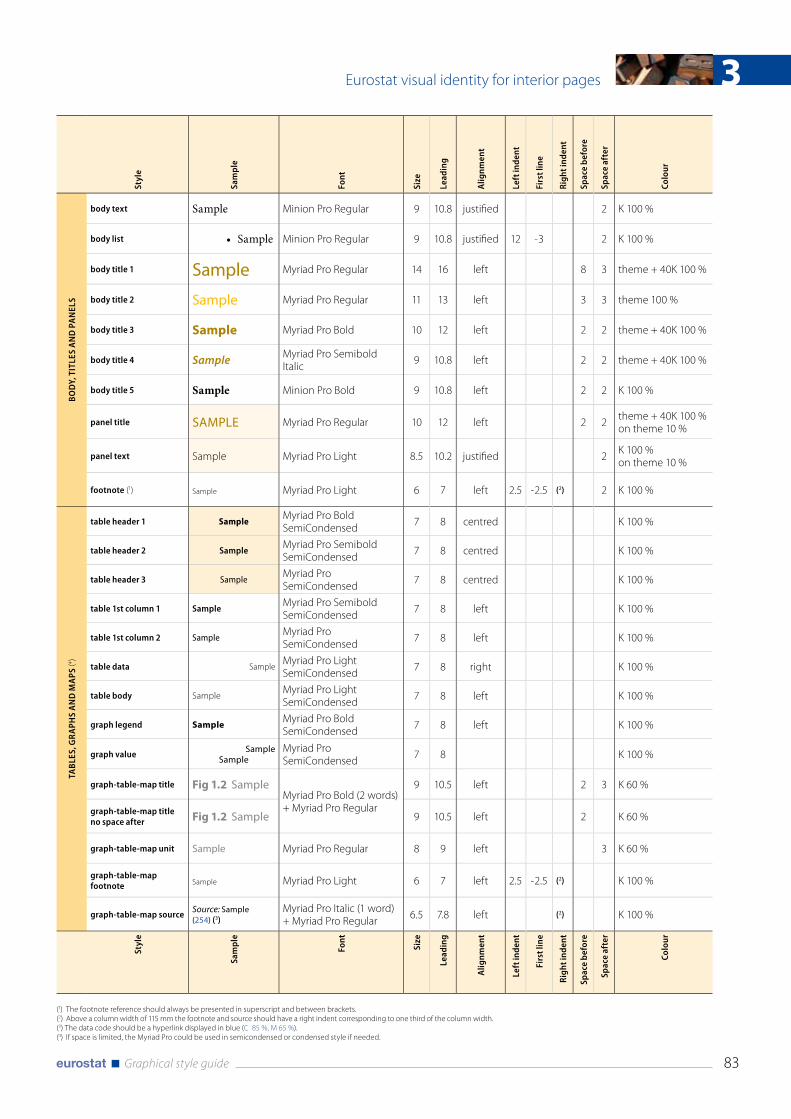
83 Graphical style guide
Eurostat visual identity for interior pages 3St
yle
Sam
ple
Font
Size
Lead
ing
Alig
nmen
t
Left
inde
nt
Firs
t lin
e
Righ
t ind
ent
Spac
e be
fore
Spac
e af
ter
Colo
ur
BOD
Y, T
ITLE
S A
ND
PA
NEL
S
body text Sample Minion Pro Regular 9 10.8 justifi ed 2 K 100 %
body list • Sample Minion Pro Regular 9 10.8 justifi ed 12 ‑ 3 2 K 100 %
body title 1 Sample Myriad Pro Regular 14 16 left 8 3 theme + 40K 100 %
body title 2 Sample Myriad Pro Regular 11 13 left 3 3 theme 100 %
body title 3 sample Myriad Pro Bold 10 12 left 2 2 theme + 40K 100 %
body title 4 Sample Myriad Pro Semibold Italic 9 10.8 left 2 2 theme + 40K 100 %
body title 5 Sample Minion Pro Bold 9 10.8 left 2 2 K 100 %
panel title SAMPLE Myriad Pro Regular 10 12 left 2 2 theme + 40K 100 % on theme 10 %
panel text Sample Myriad Pro Light 8.5 10.2 justifi ed 2 K 100 %on theme 10 %
footnote (1) Sample Myriad Pro Light 6 7 left 2.5 ‑ 2.5 (2) 2 K 100 %
TABL
ES, G
RAPH
S A
ND
MA
PS (4 )
table header 1 Sample Myriad Pro Bold SemiCondensed 7 8 centred K 100 %
table header 2 Sample Myriad Pro Semibold SemiCondensed 7 8 centred K 100 %
table header 3 Sample Myriad Pro SemiCondensed 7 8 centred K 100 %
table 1st column 1 Sample Myriad Pro Semibold SemiCondensed 7 8 left K 100 %
table 1st column 2 Sample Myriad Pro SemiCondensed 7 8 left K 100 %
table data SampleMyriad Pro Light SemiCondensed 7 8 right K 100 %
table body SampleMyriad Pro Light SemiCondensed 7 8 left K 100 %
graph legend sampleMyriad Pro Bold SemiCondensed 7 8 left K 100 %
graph value Sample Sample
Myriad Pro SemiCondensed 7 8 K 100 %
graph-table-map title Fig 1.2 SampleMyriad Pro Bold (2 words) + Myriad Pro Regular
9 10.5 left 2 3 K 60 %
graph-table-map title no space after Fig 1.2 Sample 9 10.5 left 2 K 60 %
graph-table-map unit Sample Myriad Pro Regular 8 9 left 3 K 60 %
graph-table-map footnote Sample Myriad Pro Light 6 7 left 2.5 ‑ 2.5 (2) K 100 %
graph-table-map source Source: Sample (254) (3)
Myriad Pro Italic (1 word) + Myriad Pro Regular 6.5 7.8 left (2) K 100 %
Styl
e
Sam
ple
Font
Size
Lead
ing
Alig
nmen
t
Left
inde
nt
Firs
t lin
e
Righ
t ind
ent
Spac
e be
fore
Spac
e af
ter
Colo
ur
(1) The footnote reference should always be presented in superscript and between brackets.(2) Above a column width of 115 mm the footnote and source should have a right indent corresponding to one third of the column width.(3) The data code should be a hyperlink displayed in blue (C 85 %, M 65 %).(4) If space is limited, the Myriad Pro could be used in semicondensed or condensed style if needed.

84 Graphical style guide
Eurostat visual identity for interior pages3
Page layout — A5 general structureThe A5 layout is foreseen as a one- or two-columns layout. Nevertheless, the main column is divided into 12 smaller columns in order to have the possibility to structure the page when needed (e.g. use of indents, panels).
3 Chapter title
22 Publication title
3Chapter title
23 Publication title
16 14 18
75 20
12
208
Gutter: 4 mm
3 Chapter title
18 Publication title
3Chapter title
19 Publication title
Footnotes in margins are only allowed in one-column layouts
Shape background colour: theme 50 %

85 Graphical style guide
Eurostat visual identity for interior pages 3
A5 page separators
Part separator number:
Font: Minion Pro BoldSize: 100 pt Alignment: leftColour: theme 100 %
Part separator title:
Font: Myriad Pro BoldSize/leading: 16/18 ptAlignment: leftColour: whitetheme + 40 % K
Chapter separator number:
Font: Myriad Pro BoldSize: 85 pt Alignment: rightColour: hole in curved shape
Chapter separator title:
Font: Myriad Pro BoldSize/leading: 16/18 ptAlignment: leftColour: theme + 40 % K
Double-page alternative:Background colour: theme 50 %
Shape background colour: theme 50 %
The curved shapes including chapter numbers are available as EPS files or as graphic elements collected in an InDesign library.
Double-page alternative:Background colour: theme 50 %
A lighter version without photo is conceivable. In that case, replace
the photo by the theme colour (shading 50 %).
For detailed paragraph style information, please consult the pocketbook section.

86 Graphical style guide
Eurostat visual identity for interior pages3
Page layout — Compact guide general structure
Eeos
tiate
min
t ex
pelia
vol
upta
A v
ello
rae
mag
nias
mo
elit
at il
la
perc
ium
aut
eni
hiliq
uas
Com
pac
t g
uid
esD
ata
are
avai
labl
e FR
EE O
F CH
ARG
E on
the
Euro
stat
web
site
:ec
.eur
opa.
eu/e
uros
tat
KS-EA-07-001-ENC
ISBN
978
-92-
823-
2469
-1
doi:
10.2
830/
1341
8©
Eur
opea
n U
nion
201
0
y=5
y=24
98
105
55
55
55
55
15
10
15
40
9995
9599
99
42
1038.5
49.5
14 2
93 44
44
13
10.5
10
12
98
105
55
510
55
55
5
1515
9995
9999
584
210
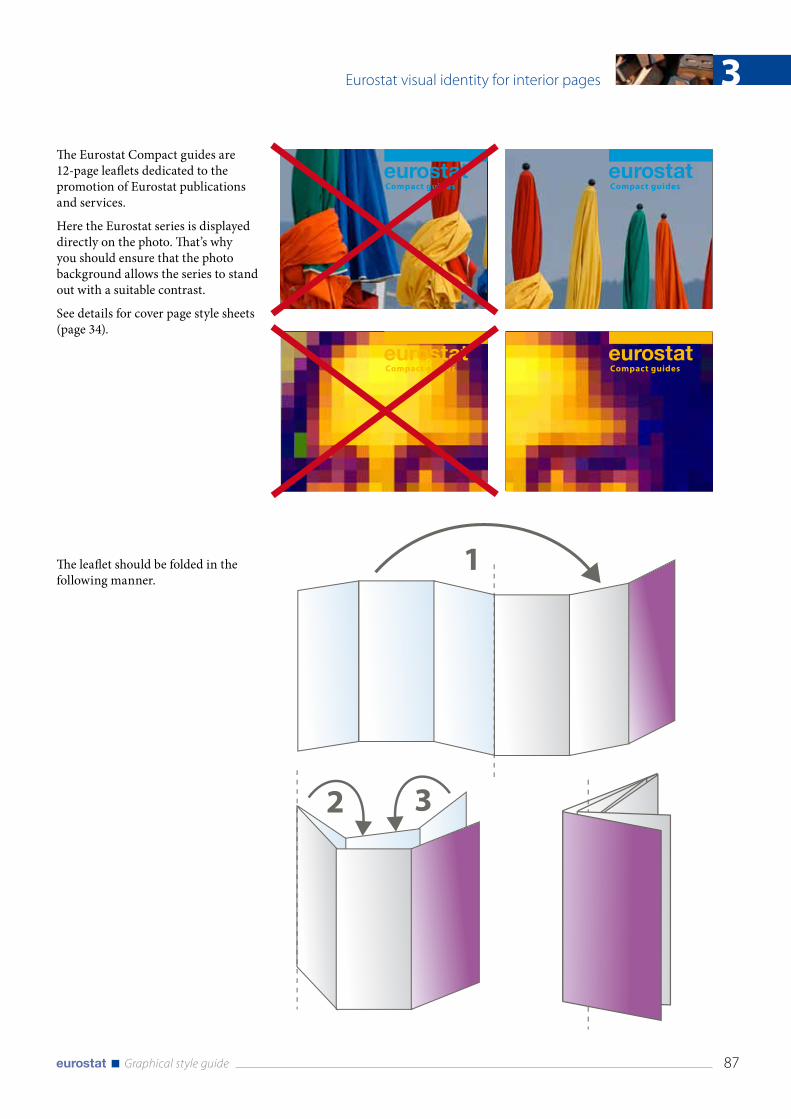
87 Graphical style guide
Eurostat visual identity for interior pages 3
The Eurostat Compact guides are 12-page leaflets dedicated to the promotion of Eurostat publications and services.
Here the Eurostat series is displayed directly on the photo. That’s why you should ensure that the photo background allows the series to stand out with a suitable contrast.
See details for cover page style sheets (page 34).
The leaflet should be folded in the following manner.
Compact guides
Compact guides
Compact guides
Compact guides
1
2 3
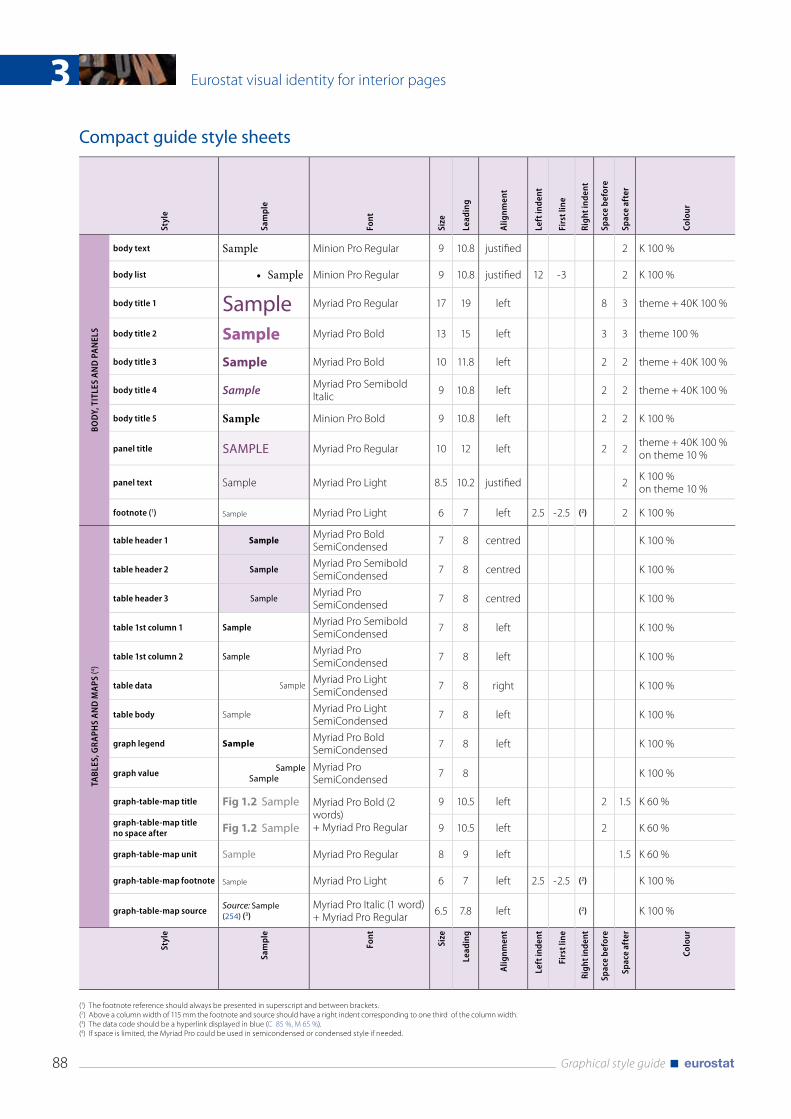
88 Graphical style guide
Eurostat visual identity for interior pages3
Compact guide style sheetsSt
yle
Sam
ple
Font
Size
Lead
ing
Alig
nmen
t
Left
inde
nt
Firs
t lin
e
Righ
t ind
ent
Spac
e be
fore
Spac
e af
ter
Colo
ur
BOD
Y, T
ITLE
S A
ND
PA
NEL
S
body text Sample Minion Pro Regular 9 10.8 justifi ed 2 K 100 %
body list • Sample Minion Pro Regular 9 10.8 justifi ed 12 ‑ 3 2 K 100 %
body title 1 Sample Myriad Pro Regular 17 19 left 8 3 theme + 40K 100 %
body title 2 sample Myriad Pro Bold 13 15 left 3 3 theme 100 %
body title 3 sample Myriad Pro Bold 10 11.8 left 2 2 theme + 40K 100 %
body title 4 Sample Myriad Pro Semibold Italic 9 10.8 left 2 2 theme + 40K 100 %
body title 5 Sample Minion Pro Bold 9 10.8 left 2 2 K 100 %
panel title SAMPLE Myriad Pro Regular 10 12 left 2 2 theme + 40K 100 % on theme 10 %
panel text Sample Myriad Pro Light 8.5 10.2 justifi ed 2 K 100 % on theme 10 %
footnote (1) Sample Myriad Pro Light 6 7 left 2.5 ‑ 2.5 (2) 2 K 100 %
TABL
ES, G
RAPH
S A
ND
MA
PS (4 )
table header 1 Sample Myriad Pro Bold SemiCondensed 7 8 centred K 100 %
table header 2 Sample Myriad Pro Semibold SemiCondensed 7 8 centred K 100 %
table header 3 Sample Myriad Pro SemiCondensed 7 8 centred K 100 %
table 1st column 1 Sample Myriad Pro Semibold SemiCondensed 7 8 left K 100 %
table 1st column 2 Sample Myriad Pro SemiCondensed 7 8 left K 100 %
table data SampleMyriad Pro Light SemiCondensed 7 8 right K 100 %
table body SampleMyriad Pro Light SemiCondensed 7 8 left K 100 %
graph legend sampleMyriad Pro Bold SemiCondensed 7 8 left K 100 %
graph value Sample Sample
Myriad Pro SemiCondensed 7 8 K 100 %
graph-table-map title Fig 1.2 Sample Myriad Pro Bold (2 words) + Myriad Pro Regular
9 10.5 left 2 1.5 K 60 %
graph-table-map title no space after Fig 1.2 Sample 9 10.5 left 2 K 60 %
graph-table-map unit Sample Myriad Pro Regular 8 9 left 1.5 K 60 %
graph-table-map footnote Sample Myriad Pro Light 6 7 left 2.5 ‑ 2.5 (2) K 100 %
graph-table-map source Source: Sample (254) (3)
Myriad Pro Italic (1 word) + Myriad Pro Regular 6.5 7.8 left (2) K 100 %
Styl
e
Sam
ple
Font
Size
Lead
ing
Alig
nmen
t
Left
inde
nt
Firs
t lin
e
Righ
t ind
ent
Spac
e be
fore
Spac
e af
ter
Colo
ur
(1) The footnote reference should always be presented in superscript and between brackets.(2) Above a column width of 115 mm the footnote and source should have a right indent corresponding to one third of the column width.(3) The data code should be a hyperlink displayed in blue (C 85 %, M 65 %).(4) If space is limited, the Myriad Pro could be used in semicondensed or condensed style if needed.

89 Graphical style guide
Eurostat visual identity for interior pages 3
Example of Compact guides
Government finance statistics
Compact guides
Government finance statisticsA comparison with the EU
Compact guidesData are available FREE OF CHARGE on the Eurostat website: ec.europa.eu/eurostat
Government finance statisticsThe website is organised into nine themes: this document presents information from the theme covering economy and fi-nance; more specifically it includes data on government finance statistics.
With the European population getting older as people live longer and have fewer children, many Member States face the challenge of ensuring the long-term sustainability of public finances owing to the impending budgetary impact. The Stability and Growth Pact (SGP) is a rule-based framements in the European Union, and in the euro area countries in particular, broadly synchro-nised. They prevent Member States from taking policy measures which would unduly benefit their own economies at the expense of others. There are two key principles, namely:
• thatthedeficitmustnotexceed3%ofgrossdomesticproduct(GDP), and;
• thatthedebt-to-GDPratioshouldnotbemorethan60%.
ArevisioninMarch2005basedonthefirstfiveyearsofexperi-ence left these principles unchanged, but introduced greater flex-ibility in exceeding the deficit threshold in hard economic times, or to finance investment in structural improvements.
Each year, the Member States provide the European Commis-sion with detailed information on their economic policies and the state of their public finances. Euro area countries provide this information in the context of the ’stability programmes’, while other Member States do so in the form of ’convergence pro-grammes’. The European Commission assesses whether the poli-cies are in line with agreed economic, social and environmental objectives and may choose to issue a warning if it believes a deficit is becoming abnormally high. This surveillance is based on the Excessive Deficit Procedure (EDP). The Commission’s opinion is based on a technical assessment by the Directorate-General for Economic and Financial Affairs (DG ECFIN, http://ec.europa.eu/economy_finance/sg_pact_fiscal_policy/fiscal_policy554_en.htm), using data reported by Eurostat. Eurostat’s national ac-counts data are based on an integrated accounting framework
which describes economic events of all units of the economy, grouped within sectors according to their characteristics, providing a refer-enceforallmacro-economicstatistics.TheaimoftheESA95Manualon Government Debt and Deficit (MGDD) is to aid the application of ESA95forcalculatinggovernmentdeficitanddebtratios.The-forandFinancial Affairs (Dt a legal act, but rather provides interpretation and guidance that Eurostat uses to assess adherence to agreed meth-odological practices. Eurostat collect, harmonise and disseminate the data used for the EDP, on the basis of government finance statistics that are provided by the Member States. Eurostat is the sole authority within the European Commission for setting out the methodological basis for data collection and compilation.
The government deficit is defined as the net lending/net borrowing of generalgovernmentasdefinedinESA95,adjustedforthetreatmentof interest relating to swaps.
The government debt is defined as the total consolidated gross debt at nominal value in the following categories of government liabilities, as definedinESA95:currencyanddeposits,securitiesotherthanshares(excluding financial derivatives), and loans.
WebsiteEurostat provides users with free access to all of its databases, as well as PDF versions of its publications. To discover more, open a web browser and go to the Eurostat homepage at: ec.europa.eu/eurostat.
1. From the Eurostat homepage, statistical Themes may be ac-cessed from the left-hand menu. Click on the link to Economy and finance in order to access infor-mation on:
• (Latest)new(s)• Tables• Data• Methodology• Publications
A dedicated section regrouping information relating to government finance statistics is available at the top of the page. This regroups all of the most important sources of information on government finance statistics together in one place, with information presented on: meth-odology, the excessive deficit procedure (EDF), data, publications and useful links to other resources.
2. The most important govern-ment finance statistics are found under the tab for Tables – by se-lecting National accounts under the and Long-term indicators.Expand/collapse the data tree by using the +/– icons. Select the information required by click-ing on the table, graph, map icon or the pre-defined ta-ble icon .
3. More detailed statistics or extractions and larger volumes of data can be downloaded through open tables, with the help of Eurostat’s data extrac-tion utility. Advanced query functions are available to those who register on the website – allowing downloads in a vari-etyoffileformats(text,HTML,Excel, etc.). Data are presented in tables, with total flexibility to preselect and extract data. To
access these tables, click on the tab for Data, select Gov-ernment statistics or Finan-cial accounts and then browse through the data tree and its submenus to choose a particu-lar table .
4. For additional information on metadata or methodology, click on the Methodology tab and then select Government counts, after which an exten-sive list of links is provided:
• General government revenue and expenditure• Government deficit and debt• Quarterly government debt• Total State aids• Public procurement• Balance sheets• Financial transactions• Nominal holding gains
Statistics in focusGeneral government expenditure and revenue in the EU, 2006 (issuenumber23/2008)
Structure of government debt in Europe, 2006 (issuenumber6/2008)
Tax revenue in the EU (issuenumber31/2007)
Stock-flow adjustment in government accounts (issuenumber26/2006)
Reference publicationsGovernment finance statistics - Summary tables 2/2007Format: PDFLanguageversions:ENCataloguenumber:KE-EK-07-002-EN-NISSN:1725-9819
Taxation trends in the European Union - Data for the EU Member States and NorwayFormat: Paper, PDFLanguageversions:ENCataloguenumber:KS-DU-07-001-EN-NISBN:978-92-79-04865-4
Structures of the taxation systems in the European Union - Data 1995-2004Format: Paper, PDFLanguageversions:ENCataloguenumber:KS-DU-06-001-EN-NISBN:92-79-01850-7
For additional publications, please see:http://epp.eurostat.ec.europa.eu/portal/page?_pageid=2373,47631312,2373_58674419&_dad=portal&_schema=PORTAL
Methodological publicationsESA95 manual on government deficit and debtFormat: paper, PDFLanguageversions:DE,EN,ES,IT,NL,PTCataloguenumber:KS-42-02-585-EN-NISBN:92-894-3231-4
Manual on sources and methods for the compilation of ESA95 financial accountsFormat: PDFLanguageversions:ENCataloguenumber:KS-BE-02-004-EN-N
Manual on sources and methods for the compilation of COFOG Statistics - Classification of the Functions of Government (COFOG)Format: PDFLanguageversions:ENCataloguenumber:KS-RA-07-022ISBN:978-92-79-04762-6ISSN:1977-0375
Manual on compilation of taxes and social payments on a quarterly basis - First editionFormat: PDFLanguageversions:ENCataloguenumber:KS-BE-02-007-EN-NISBN:92-894-3797-9
Manual on quarterly non-financial accounts for general governmentFormat: PDFLanguageversions:ENCataloguenumber:KS-BE-06-001-EN-NISBN:92-79-01867-1ISSN:1725-0048
For additional information on methodology, please see:http://epp.eurostat.ec.europa.eu/porta l/page?_pageid=2373,47631312,2373_58674363&_dad=portal&_schema=PORTAL:
Data are available FREE OF CHARGE on the Eurostat website:ec.europa.eu/eurostat
Government finance statisticsThe website is organised into nine themes: this document presents information from the theme covering economy and fi-nance; more specifically it includes data on government finance statistics.
With the European population getting older as people live longer and have fewer children, many Member States face the challenge of ensuring the long-term sustainability of public finances owing to the impending budgetary impact. The Stability and Growth Pact (SGP) is a rule-based framements in the European Union, and in the euro area countries in particular, broadly synchro-nised. They prevent Member States from taking policy measures which would unduly benefit their own economies at the expense of others. There are two key principles, namely:
• that the deficit must not exceed 3 % of gross domestic product(GDP), and;
• that the debt-to-GDP ratio should not be more than 60 %.
A revision in March 2005 based on the first five years of experi-ence left these principles unchanged, but introduced greater flexence left these principles unchanged, but introduced greater flex-ibility in exceeding the deficit threshold in hard economic times, ibility in exceeding the deficit threshold in hard economic times, or to finance investment in structural improvements.or to finance investment in structural improvements.
Each year, the Member States provide the European CommisEach year, the Member States provide the European Commis-sion with detailed information on their economic policies and sion with detailed information on their economic policies and the state of their public finances. Euro area countries provide this information in the context of the ’stability programmes’, while other Member States do so in the form of ’convergence pro-grammes’. The European Commission assesses whether the poli-cies are in line with agreed economic, social and environmental objectives and may choose to issue a warning if it believes a deficit objectives and may choose to issue a warning if it believes a deficit is becoming abnormally high. This surveillance is based on the is becoming abnormally high. This surveillance is based on the Excessive Deficit Procedure (EDP). The Commission’s opinion is Excessive Deficit Procedure (EDP). The Commission’s opinion is based on a technical assessment by the Directorate-General for based on a technical assessment by the Directorate-General for Economic and Financial Affairs (DG ECFIN, http://ec.europa.eu/economy_finance/sg_pact_fiscal_policy/fiscal_policy554_en.htm), using data reported by Eurostat. Eurostat’s national ac-counts data are based on an integrated accounting framework
which describes economic events of all units of the economy, grouped within sectors according to their characteristics, providing a refer-ence for all macro-economic statistics. The aim of the ESA95 Manualon Government Debt and Deficit (MGDD) is to aid the application of ESA95 for calculating government deficit and debt ratios.The-for andFinancial Affairs (Dt a legal act, but rather provides interpretation and guidance that Eurostat uses to assess adherence to agreed meth-odological practices. Eurostat collect, harmonise and disseminate the data used for the EDP, on the basis of government finance statistics that are provided by the Member States. Eurostat is the sole authority within the European Commission for setting out the methodological basis for data collection and compilation.
The government deficit is defined as the net lending/net borrowing of general government as defined in ESA95, adjusted for the treatmentof interest relating to swaps.
The government debt is defined as the total consolidated gross debt at nominal value in the following categories of government liabilities, as defined in ESA95: currency and deposits, securities other than shares(excluding financial derivatives), and loans.
WebsiteEurostat provides users with free access to all of its databases, as well as PDF versions of its publications. To discover more, open a web browser and go to the Eurostat homepage at: ec.europa.eu/eurostat.ec.europa.eu/eurostat.
1. From the Eurostat homepage, statistical Themes may be ac-cessed from the left-hand menu. cessed from the left-hand menu. Click on the link to Economy and finance in order to access infor-mation on:
• (Latest)• (Latest) new(s)new(s)• Tables• Data• Methodology• Publications
A dedicated section regrouping information relating to government finance statistics is available at the top of the page. This regroups all of the most important sources of information on government finance of the most important sources of information on government finance statistics together in one place, with information presented on: methstatistics together in one place, with information presented on: meth-odology, the excessive deficit procedure (EDF), data, publications and useful links to other resources.
2. The most important governThe most important govern-ment finance statistics are found ment finance statistics are found under the tab for Tables – by seunder the tab for Tables – by se-lecting National accounts under lecting National accounts under the and Long-term indicators.indicators.Expand/collapse the data tree Expand/collapse the data tree by using the +/– icons. Select the by using the +/– icons. Select the information required by clickinformation required by click-information required by click-information required by clicking on the table, graph, map ing on the table, graph, map icon ing on the table, graph, map
or the pre-defined ta or the pre-defined ta or the pre-defined ta-ble icon .
3. More detailed statistics or extractions and larger volumes of data can be downloaded through open tables, with the help of Eurostat’s data extrachelp of Eurostat’s data extrac-tion utility. Advanced query tion utility. Advanced query functions are available to those functions are available to those who register on the website – who register on the website – allowing downloads in a variallowing downloads in a vari-ety of file formatsformats (text, HTML,Excel, etc.). Data are presented Excel, etc.). Data are presented in tables, with total flexibility to preselect and extract data. To in tables, with total flexibility to preselect and extract data. To in tables, with total flexibility to preselect and extract data. To
access these tables, click on access these tables, click on the tab for Data, select Govthe tab for Data, select Gov-ernment statistics or Finanernment statistics or Finan-cial accounts and then browse through the data tree and its submenus to choose a particu-lar table .
4. For additional information on metadata or methodology, on metadata or methodology, click on the Methodology tab click on the Methodology tab and then select Government and then select Government counts, after which an extencounts, after which an exten-sive list of links is provided:sive list of links is provided:
• General government revenue and expendituregovernment revenue and expenditure•• Government deficit and debtGovernment deficit and debt• Quarterly government debt• Total State aids• Public procurement• Balance sheets• Financial transactions• Nominal holding gains
Statistics in focusGeneral government expenditure and General government expenditure and revenue in the EU, 2006 (issue number 23/2008)
Structure of government debt in Structure of government debt in Europe, 2006 (issue number 6/2008)6/2008)
Tax revenue in the EU Tax revenue in the EU (issue number 31/2007)31/2007)
Stock-flow adjustment in Stock-flow adjustment in government accounts government accounts (issue numbernumber 26/2006)
Reference publicationsReference publicationsGovernment finance statistics - Summary Government finance statistics - Summary tables 2/2007Format: PDFLanguage versions: ENCatalogue number: KE-EK-07-002-EN-NKE-EK-07-002-EN-NISSN: 1725-9819
Taxation trends in the European Union Taxation trends in the European Union - Data for the EU Member States and NorwayFormat: Paper, PDFLanguage versions: ENCatalogue number: KS-DU-07-001-EN-NISBN: 978-92-79-04865-4
Structures of the taxation systems in the European Union - Data 1995-2004Format: Paper, PDFLanguage versions: ENCatalogue number: KS-DU-06-001-EN-NISBN: 92-79-01850-7
For additional publications, please see:For additional publications, please see:http://epp.eurostat.ec.europa.eu/portal/page?_pageid=2373,47631http://epp.eurostat.ec.europa.eu/portal/page?_pageid=2373,47631312,2373_58674419&_dad=portal&_schema=PORTAL312,2373_58674419&_dad=portal&_schema=PORTAL
Methodological publicationsMethodological publicationsESA95 manual on government deficit and debtESA95 manual on government deficit and debtFormat: paper, PDFFormat: paper, PDFLanguageLanguage versions: DE, EN, ES, IT, NL, PTCatalogueCatalogue number: KS-42-02-585-EN-NISBN: 92-894-3231-4
Manual on sources and methods for the compilation of ESA95 financial accountsFormat: PDFLanguage versions: ENCatalogue number: KS-BE-02-004-EN-N
Manual on sources and methods for the compilation of COFOG Statistics - Classification of the Functions of Government (COFOG)Format: PDFLanguage versions: ENCatalogue number: KS-RA-07-022ISBN: 978-92-79-04762-6ISSN: 1977-0375
Manual on compilation of taxes and social payments on a quarterly basis - First editionFormat: PDFLanguage versions: ENCatalogue number: KS-BE-02-007-EN-NISBN: 92-894-3797-9
Manual on quarterly non-financial accounts for general governmentFormat: PDFLanguage versions: ENCatalogue number: KS-BE-06-001-EN-NISBN: 92-79-01867-1ISSN: 1725-0048
For additional information on methodology, please see:http://epp.eurostat.ec.europa.eu/porta l/page?_pageid=2373,47631312,2373_58674363&_dad=portal&_schema=PORTAL:
Tab 1: Public balance and gross government debt (% of GDP)
Public balance Government debt
2003 2006 2003 2006
EU-27 -3.1 -1.6 61.8 61.4
EA-12 -3.1 -1.5 69.3 68.8
BE 0.0 0.4 98.6 88.2
BG 0.0 3.2 45.9 22.8
CZ -6.6 -2.9 30.1 30.1
DK -0.1 4.6 45.8 30.3
DE -4.0 -1.6 63.8 67.5
EE 1.8 3.6 5.5 4.0
IE 0.4 2.9 31.1 25.1
EL -5.6 -2.5 97.9 95.3
ES -0.2 1.8 48.7 39.7
FR -4.1 -2.5 62.9 64.2
IT -3.5 -4.4 104.3 106.8
CY -6.5 -1.2 68.9 65.2
LV -1.6 -0.3 14.4 10.6
LT -1.3 -0.6 21.2 18.2
LU 0.5 0.7 6.3 6.6
HU -7.2 -9.2 58.0 65.6
MT -9.9 -2.5 69.3 64.7
NL -3.1 0.6 52.0 47.9
AT -1.6 -1.4 64.6 61.7
PL -6.3 -3.8 47.1 47.6
PT -2.9 -3.9 56.9 64.8
RO -1.5 -1.9 21.5 12.4
SI -2.7 -1.2 27.9 27.1
SK -2.7 -3.7 42.4 30.4
FI 2.5 3.8 44.3 39.2
SE -0.9 2.5 53.5 47.0
UK -3.3 -2.7 38.7 43.2
HR (1) -4.5 -3.9 40.9 44.2
TR (1) -11.3 -1.2 85.1 69.6
IS -1.6 : 41.4 :
NO 7.3 19.3 44.3 48.9
(1) 2005 instead of 2006.Source: Eurostat (tsieb070 and tsieb070), OECD
Public balance: net borrowing/lending of consolidated general government sector as a percentage of GDP. Net borrowing (+)/net lending (-) of general government is the difference between the revenue and the expenditure of the general government sector. The general government sector comprises the following subsectors: central government, state government, local government, and social security funds. GDP used as a denominator is the gross domestic product at current market prices.
General government debt: general government consolidated gross debt as a percentage of GDP. Debt is valued at nominal (face) value, and foreign currency debt is converted into national currency using end-year market exchange rates (though special rules apply to contracts). The national data for the general government sector are consolidated between the sub-sectors. Basic data are expressed in national currency, converted into euro using end-year exchange rates for the euro provided by the European Central Bank.
Graph 1: Government surplus (+)/defi cit (-) and gross governmentdebt, 2007 (% of GDP)Public balance
Government debt
Source: Eurostat (tsieb070 and tsieb070), OECD
Graph 3: Total general government revenue and total expenditure, quarterly averages, EU-27, 1999-2007 (1) (% of GDP)Public balance
(1) Average for each quarter during the period 1999-2007.Source: Eurostat (gov_q_ggnfa)
Graph 4: Total general government revenue and total expenditure, EU-27 (1) (% of GDP)
Government debt
(1) Average for each quarter during the period 1999-2007.
Source: Eurostat (gov_q_ggnfa)
Graph 5: General government, stock of consolidated assets, third quarter 2007 (% of total assets)
(1) Total assets valued at EUR 3 466 809 million; figures do not sum to 100 % due to rounding.Source: Eurostat (gov_q_ggnfa)
Graph 6: Long-term government bonds’ interest rates, EA-13 (1)
Government debt
(1) Average for each quarter during the period 1999-2007.
Source: Eurostat (dbc12048), ECB, National Central Banks
An interest rate is the cost or price of borrowing, or the gain from lending, normally expressed as an annual percentage amount. Ten year government bond yields are often used as a measure for long-term interest rates. Yields vary according to the price of the bond. Secondary market means that the bond price is not an issue price (primary market) but determined by supply and demand on the market.
Tab 2: Total general government revenue and total expenditure (% of GDP)
Revenue Expenditure
2003 2006 2003 2006
EU-27 44.3 45.0 47.4 46.5
EA-13 45.0 45.6 48.1 46.9
BE 51.1 48.8 51.1 48.5
BG 40.3 40.1 40.3 36.8
CZ 40.7 40.7 47.3 43.6
DK 55.6 56.6 55.7 51.7
DE 44.5 43.8 48.5 45.4
EE 36.4 36.6 34.6 33.0
IE 33.8 37.1 33.4 34.2
EL 39.3 39.5 45.0 42.3
ES 38.2 40.4 38.4 38.6
FR 49.2 50.8 53.4 53.4
IT 44.8 45.4 48.3 48.8
CY 38.5 42.4 45.0 43.6
LV 33.2 37.0 34.8 37.3
LT 32.0 33.4 33.2 34.0
LU 42.4 39.7 41.9 39.0
HU 41.9 42.6 49.1 51.9
MT 37.9 41.3 47.8 43.9
NL 43.9 46.7 47.1 46.1
AT 49.3 47.8 51.1 49.3
PL 38.4 40.0 44.6 43.8
PT 42.5 42.4 45.5 46.3
RO 32.1 32.9 33.6 34.8
SI 44.4 44.1 47.1 45.3
SK 37.4 33.5 40.2 37.2
FI 52.5 52.9 50.0 48.9
SE 55.9 56.5 57.0 54.3
UK 39.5 41.9 42.9 44.5
IS 42.8 45.9 45.6 40.7
NO 55.5 59.1 48.2 40.6
CH (1) 34.6 34.7 36.4 35.4
(1) 2005 instead of 2006.Source: Eurostat (tec00021 and tec00023)
Total general government revenue is defined in ESA-95 by reference to a list of categories: market output, output for own final use, payments for the other non-market output, taxes on production and imports, other subsidies on production, receivable property income, current taxes on income, wealth, etc., social contributions, other current transfers and capital transfers.
Total general government expenditure is defined in ESA-95 by reference to a list of categories: intermediate consumption, gross capital formation, compensation of employees, other taxes on production, subsidies, payable property income, current taxes on income, wealth, etc., social benefits, some social transfers, other current transfers, some adjustments, capital transfers and transactions on non-produced assets.
Tab 2: Total general government revenue and total expenditure (% of GDP)
“Taxes on pro-duction and
imports”
“Current taxes on income,
wealth”
“Capital taxes”
“Actual social contributions”
EU-27 13.9 13.3 : 12.8
EA-13 13.9 12.2 0.3 14.3
BE 13.8 16.5 0.7 13.6
BG 19.3 6.4 0.4 8.7
CZ 11.2 8.8 0.0 16.2
DK 18.0 30.0 0.2 1.1
DE 12.4 10.8 0.2 16.2
EE 13.7 7.1 - 10.2
IE 14.3 13.2 0.2 4.9
EL 12.2 7.9 0.1 11.1
ES 12.7 11.7 0.5 12.1
FR 15.7 11.8 0.5 16.5
IT 15.0 14.4 0.0 12.7
CY 17.9 10.8 0.0 7.8
LV 13.0 8.4 0.0 8.7
LT 11.6 9.7 0.0 8.5
LU 12.5 13.0 0.1 10.0
HU 15.3 9.3 0.1 12.5
MT 15.4 11.8 0.3 6.2
NL 13.3 11.7 0.3 14.2
AT 14.3 13.1 0.1 14.5
PL 14.4 7.5 0.0 12.2
PT 15.7 8.8 0.0 11.4
RO 12.7 6.1 : 9.8
SI 15.5 9.3 0.0 14.3
SK 11.6 6.0 0.0 11.8
FI 13.9 17.2 0.3 12.2
SE 17.1 19.7 0.0 12.2
UK 13.1 17.2 0.3 7.8
IS 19.5 18.8 0.0 3.3
NO 12.3 22.9 0.1 8.7
(1) 2005 instead of 2006.
Source: Eurostat (tec00021 and tec00023)
Current taxes on income, wealth, etc. cover all compulsory, unrequited payments, in cash or in kind, levied periodically by general government and by the rest of the world on the income and wealth of institutional units, and some periodic taxes which are assessed neither on the income nor the wealth. In ESA95, current taxes on income, wealth, etc. are divided into taxes on income and other current taxes.
Taxes on production and imports consist of compulsory, unrequited payments, in cash or in kind which are levied by general government, or by EU institutions, in respect of the production and importation of goods and services, the employment of labour, the ownership or use of land, buildings or other assets used in production. In ESA95, taxes on production and imports comprise taxes on products and other taxes on production.
-10.0 -7.5 -5.0 -2.5 0.0 2.5 5.0 DK FI
EE BG
IE SE ES LU NL BE LV LT CY
SI AT
EU-27 DE RO EL FR
MT UK CZ SK PL PT IT
HU
42
44
46
48
50
52
Q1 Q2 Q3 Q4
EU-27 revenue Euro area revenue
EU-27 expenditure Euro area expenditure
Monetary gold and special drawing rights (SDRs) 0.4%
Currency and deposits 19.3%
Securities other than shares 6.8%
Loans 10.6%
Shares and other equity
45.9%
Insurance technical reserves
0.1%
Other accounts receivable /
payable 16.8%
0 25 50 75 100 125
IT EL BE DE HU CY PT
MT FR AT
EU-27 NL PL SE
UK ES FI
SK DK CZ
SI IE
BG LT
RO LV LU EE
9,000
10,000
11,000
12,000
13,000
2003 2004 2005 2006
Euro area expenditure Euro area revenue EU-27 expenditure EU-27 revenue
0
2
4
6
8
1996 1998 2000 2002 2004 2006
Euro area USA Japan
Tab 1: Public balance and gross government debt (% of GDP)
Public balance Government debt
2003 2006 2003 2006
EU-27 -3.1 -1.6 61.8 61.4
EA-12 -3.1 -1.5 69.3 68.8
BE 0.0 0.4 98.6 88.2
BG 0.0 3.2 45.9 22.8
CZ -6.6 -2.9 30.1 30.1
DK -0.1 4.6 45.8 30.3
DE -4.0 -1.6 63.8 67.5
EE 1.8 3.6 5.5 4.0
IE 0.4 2.9 31.1 25.1
EL -5.6 -2.5 97.9 95.3
ES -0.2 1.8 48.7 39.7
FR -4.1 -2.5 62.9 64.2
IT -3.5 -4.4 104.3 106.8
CY -6.5 -1.2 68.9 65.2
LV -1.6 -0.3 14.4 10.6
LT -1.3 -0.6 21.2 18.2
LU 0.5 0.7 6.3 6.6
HU -7.2 -9.2 58.0 65.6
MT -9.9 -2.5 69.3 64.7
NL -3.1 0.6 52.0 47.9
AT -1.6 -1.4 64.6 61.7
PL -6.3 -3.8 47.1 47.6
PT -2.9 -3.9 56.9 64.8
RO -1.5 -1.9 21.5 12.4
SI -2.7 -1.2 27.9 27.1
SK -2.7 -3.7 42.4 30.4
FI 2.5 3.8 44.3 39.2
SE -0.9 2.5 53.5 47.0
UK -3.3 -2.7 38.7 43.2
HR (1) -4.5 -3.9 40.9 44.2
TR (1) -11.3 -1.2 85.1 69.6
IS -1.6 : 41.4 :
NO 7.3 19.3 44.3 48.9
(1) 2005 instead of 2006.Source: Eurostat (tsieb070 and tsieb070), OECD
Public balance: net borrowing/lending of consolidated general government sector as a percentage of GDP. Net borrowing (+)/net lending (-) of general government is the difference between the revenue and the expenditure of the general government sector. The general government sector comprises the following subsectors: central government, state government, local government, and social security funds. GDP used as a denominator is the gross domestic product at current market prices.
General government debt: general government consolidated gross debt as a percentage of GDP. Debt is valued at nominal (face) value, and foreign currency debt is converted into national currency using end-year market exchange rates (though special rules apply to contracts). The national data for the general government sector are consolidated between the sub-sectors. Basic data are expressed in national currency, converted into euro using end-year exchange rates for the euro provided by the European Central Bank.
Graph 1: Government surplus (+)/defi cit (-) and gross governmentdebt, 2007 (% of GDP)Public balance
Government debt
Source: Eurostat (tsieb070 and tsieb070), OECD
-10.0 -7.5 -5.0 -2.5 0.0 2.5 5.0 DK FI
EE BG
IE SE ES LU NL BE LV LV LLT LT LCY
SI AT AT A
EU-27 DE RO EL FR
MT UK CZ SK PL PT IT
HU
0 25 50 75 100 125
IT EL BE DE HU CY PT
MT FR AT AT A
EU-27 NL PL SE
UK ES FI
SK DK CZ
SI IE
BG LT LT L
RO LV LV LLU EE
Tab 2: Total general government revenue and total expenditure (% of GDP)
Revenue Expenditure
2003 2006 2003 2006
EU-27 44.3 45.0 47.4 46.5
EA-13 45.0 45.6 48.1 46.9
BE 51.1 48.8 51.1 48.5
BG 40.3 40.1 40.3 36.8
CZ 40.7 40.7 47.3 43.6
DK 55.6 56.6 55.7 51.7
DE 44.5 43.8 48.5 45.4
EE 36.4 36.6 34.6 33.0
IE 33.8 37.1 33.4 34.2
EL 39.3 39.5 45.0 42.3
ES 38.2 40.4 38.4 38.6
FR 49.2 50.8 53.4 53.4
IT 44.8 45.4 48.3 48.8
CY 38.5 42.4 45.0 43.6
LV 33.2 37.0 34.8 37.3
LT 32.0 33.4 33.2 34.0
LU 42.4 39.7 41.9 39.0
HU 41.9 42.6 49.1 51.9
MT 37.9 41.3 47.8 43.9
NL 43.9 46.7 47.1 46.1
AT 49.3 47.8 51.1 49.3
PL 38.4 40.0 44.6 43.8
PT 42.5 42.4 45.5 46.3
RO 32.1 32.9 33.6 34.8
SI 44.4 44.1 47.1 45.3
SK 37.4 33.5 40.2 37.2
FI 52.5 52.9 50.0 48.9
SE 55.9 56.5 57.0 54.3
UK 39.5 41.9 42.9 44.5
IS 42.8 45.9 45.6 40.7
NO 55.5 59.1 48.2 40.6
CH (1) 34.6 34.7 36.4 35.4
(1) 2005 instead of 2006.Source: Eurostat (tec00021 and tec00023)
Total general government revenue is defined in ESA-95 by reference to a list of categories: market output, output for own final use, payments for the other non-market output, taxes on production and imports, other subsidies on production, receivable property income, current taxes on income, wealth, etc., social contributions, other current transfers and capital transfers.
Total general government expenditure is defined in ESA-95 by reference to a list of categories: intermediate consumption, gross capital formation, compensation of employees, other taxes on production, subsidies, payable property income, current taxes on income, wealth, etc., social benefits, some social transfers, other current transfers, some adjustments, capital transfers and transactions on non-produced assets.
Graph 3: Total general government revenue and total expenditure, quarterly averages, EU-27, 1999-2007 (1) (% of GDP)Public balance
(1) Average for each quarter during the period 1999-2007.Source: Eurostat (gov_q_ggnfa)
Graph 4: Total general government revenue and total expenditure, EU-27 (1) (% of GDP)
Government debt
(1) Average for each quarter during the period 1999-2007.
Source: Eurostat (gov_q_ggnfa)
42
44
46
48
50
52
Q1 Q2 Q3 Q4
EU-27 revenue Euro area revenue
EU-27 expenditure Euro area expenditure
9,000
10,000
11,000
12,000
13,000
2003 2004 2005 2006
Euro area expenditure Euro area revenue EU-27 expenditure EU-27 revenue
Tab 2: Total general government revenue and total expenditure (% of GDP)
“Taxes on pro-duction and
imports”
“Current taxes on income,
wealth”
“Capital taxes”
“Actual social contributions”
EU-27 13.9 13.3 : 12.8
EA-13 13.9 12.2 0.3 14.3
BE 13.8 16.5 0.7 13.6
BG 19.3 6.4 0.4 8.7
CZ 11.2 8.8 0.0 16.2
DK 18.0 30.0 0.2 1.1
DE 12.4 10.8 0.2 16.2
EE 13.7 7.1 - 10.2
IE 14.3 13.2 0.2 4.9
EL 12.2 7.9 0.1 11.1
ES 12.7 11.7 0.5 12.1
FR 15.7 11.8 0.5 16.5
IT 15.0 14.4 0.0 12.7
CY 17.9 10.8 0.0 7.8
LV 13.0 8.4 0.0 8.7
LT 11.6 9.7 0.0 8.5
LU 12.5 13.0 0.1 10.0
HU 15.3 9.3 0.1 12.5
MT 15.4 11.8 0.3 6.2
NL 13.3 11.7 0.3 14.2
AT 14.3 13.1 0.1 14.5
PL 14.4 7.5 0.0 12.2
PT 15.7 8.8 0.0 11.4
RO 12.7 6.1 : 9.8
SI 15.5 9.3 0.0 14.3
SK 11.6 6.0 0.0 11.8
FI 13.9 17.2 0.3 12.2
SE 17.1 19.7 0.0 12.2
UK 13.1 17.2 0.3 7.8
IS 19.5 18.8 0.0 3.3
NO 12.3 22.9 0.1 8.7
(1) 2005 instead of 2006.
Source: Eurostat (tec00021 and tec00023)
Current taxes on income, wealth, etc. cover all compulsory, unrequited payments, in cash or in kind, levied periodically by general government and by the rest of the world on the income and wealth of institutional units, and some periodic taxes which are assessed neither on the income nor the wealth. In ESA95, current taxes on income, wealth, etc. are divided into taxes on income and other current taxes.
Taxes on production and imports consist of compulsory, unrequited payments, in cash or in kind which are levied by general government, or by EU institutions, in respect of the production and importation of goods and services, the employment of labour, the ownership or use of land, buildings or other assets used in production. In ESA95, taxes on production and imports comprise taxes on products and other taxes on production.
Graph 5: General government, stock of consolidated assets, third quarter 2007 (% of total assets)
(1) Total assets valued at EUR 3 466 809 million; figures do not sum to 100 % due to rounding.Source: Eurostat (gov_q_ggnfa)
Graph 6: Long-term government bonds’ interest rates, EA-13 (1)
Government debt
(1) Average for each quarter during the period 1999-2007.
Source: Eurostat (dbc12048), ECB, National Central Banks
An interest rate is the cost or price of borrowing, or the gain from lending, normally expressed as an annual percentage amount. Ten year government bond yields are often used as a measure for long-term interest rates. Yields vary according to the price of the bond. Secondary market means that the bond price is not an issue price (primary market) but determined by supply and demand on the market.
Monetary gold and special drawing rights (SDRs) 0.4%
Currency and deposits 19.3%
Securities other than shares 6.8%
Loans 10.6%
Shares and other equity
45.9%
Insurance technical reserves
0.1%
Other accounts receivable /
payable 16.8%
0
2
4
6
8
1996 1998 2000 2002 2004 2006
Euro area USA Japan

90 Graphical style guide
Eurostat visual identity for interior pages3
Tables — best practices
In order to harmonise the table display throughout a complete publication, table, cell and paragraph styles have been created according to following rules.
1997 1999 2001A B A B A
EU‑27 : : : : 27 947EU‑12 : : : : 27 947Belgium 28 901 29 616 30 701 31 644 33 109Bulgaria 896 1 216 1 330 1 436 1 518Czech Republic : : : : :Denmark 36 235 37 209 39 515 40 962 41 661United Kingdom : 29 370 32 269 37 677 39 233Iceland : : 32 311 37 639 34 101Norway : 31 456 33 741 36 202 38 604
BackgroundHeader: theme colour 20 %Aggregates/averages: theme colour 30 %Countries/table items: white
strokes1st level separationStroke width: 0.4 ptStroke colour: K 30 %
2nd level separationStroke width: 0.4 ptStroke colour: K 100 %
The cell styles are divided into three groups: the header cell styles, the aggregates cell styles and the body cell styles.
The paragraph styles are used to refine formatting (e.g. 1st column or data):
• Table header 1: to be used as the first level of multilevel header.• Table header 2: to be used as the standard style for a one-level header; to be used
as the second level of multilevel headers.• Table header 3: to be used as the third level of multilevel headers.• Table 1st column 1: to be used for aggregates, totals, averages, etc.• Table 1st column 2: to be used for countries or other units.• Table data: to be used for data content.• Table body: to be used for text content.
Table style ‘Preformatted table’ will format the table with the general font size and row strokes (K 30%)

91 Graphical style guide
Eurostat visual identity for interior pages 3
How to proceed at formatting tables:
Case 1: The table is included in text format in the manuscript.
1. Select the table.
2. Remove all formatting.
3. Format with the ‘preformatted table’ style.
4. Format rows using cell styles. These will define table strokes and fills. When is vertical alignment required? Switch to vertical alignment in the header:• when the caption displayed in the header includes too many line breaks;• when the number of columns is too large to ensure easy reading (too little space
between columns);• when the captions are displayed on more than four lines in very narrow
columns.
5. If needed, refine your formatting with the paragraph styles, according to the type of content.
6. Adjust column widths to suit the page layout.
7. Add the separating row lines. Use therefore the appropriate cell style. When are column strokes required? Add vertical separation lines if the header is subdivided into different levels (stroke: 0.4 pt, K 30 %; use K 100 % if a second separation of higher level is needed). These lines are added manually.
8. Balance your data cell display: increase the right margin of a cell in order to position your data, still right aligned but optically centred under the header caption. If these captions have different widths you need to proceed one by one.
Case 2: The table is imported from Excel
1. In Excel: Avoid adding empty columns just for layout readability.
2. In InDesign: Only import the cells including your table data. You can define this in the import options when placing the table.
3. Remove formatting (unformatted table) when importing.
4. Follow points 4 -9 in Case 1.

92 Graphical style guide
Eurostat visual identity for interior pages3
Tables — samples
2 Chapter title
52 Publication title
Table 2.7: Unemployment rate by gender and by age(%)
Male Female < 25 years 25-74 years
2003 2008 2003 2008 2008 2008
EU‑27 8.4 6.6 9.7 7.5 15.4 5.9
Euro area 7.9 6.9 10.0 8.3 15.4 6.6
Belgium 7.7 6.5 8.9 7.6 18.0 5.9
Bulgaria 14.1 5.5 13.2 5.8 12.7 5.0
Czech Republic 6.2 3.5 9.9 5.6 9.9 3.9
Denmark 4.8 3.0 6.1 3.7 7.6 2.5
Germany 9.8 7.4 8.7 7.2 9.9 6.9
Estonia 10.2 5.8 9.9 5.3 12.0 4.6
Ireland 5.0 7.1 4.4 4.6 12.6 4.9
Greece 6.2 5.1 15.0 11.4 22.1 6.6
Spain 8.2 10.1 15.3 13.0 24.6 9.8
France 8.1 7.3 9.9 8.4 19.1 6.5
Italy 6.5 5.5 11.4 8.5 21.3 5.6
Cyprus 3.6 3.2 4.8 4.3 9.0 3.1
Latvia 10.6 8.0 10.4 6.9 13.1 6.6
Lithuania 12.7 6.1 12.2 5.6 13.4 5.0
Luxembourg 3.0 4.1 4.9 5.9 16.9 4.0
Hungary 6.1 7.6 5.6 8.1 19.9 6.9
Malta 6.9 5.6 9.1 6.6 11.9 4.7
Netherlands 3.5 2.5 3.9 3.0 5.3 2.3
Austria 4.0 3.6 4.7 4.1 8.0 3.1
Poland 19.0 6.4 20.5 8.0 17.3 5.9
Portugal 5.6 6.6 7.3 9.0 16.4 6.8
Romania 7.6 6.7 6.4 4.7 18.6 4.4
Slovenia 6.3 4.0 7.1 4.8 10.4 3.7
Slovakia 17.4 8.4 17.8 10.9 19.0 8.4
Finland 9.2 6.1 8.9 6.7 16.5 4.9
Sweden 6.0 5.9 5.2 6.5 20.0 4.1
United Kingdom 5.5 6.1 4.3 5.1 15.0 3.9
Norway 4.5 2.7 3.9 2.3 7.2 1.7
Croatia 12.9 7.0 15.8 10.1 21.9 6.9
Turkey : 9.7 : 10.0 18.5 7.8
Japan 5.5 4.1 4.9 3.8 7.3 3.7
United States 6.3 6.1 5.7 5.4 12.8 4.6
Note country order:
1. EU and euro area aggregates
2. EU Member States
3. EFTA countries : Iceland Liechtenstein Norway Switzerland
4. Candidate countries: Croatia FYR of Macedonia Turkey
5. Other countries (including potential candidate countries in alphabetical order)
Table header 1
Table header 2
Graph-table-map title no space(use the version without space when the title is followed by the unit connected to the table or graph)
Graph-table-map units
table 1st column 1
table 1st column 2
table data(left aligned but optically centred under the header — to do so you must adjust the right margin)
1st level separationStroke width: 0.4 pt
Stroke colour: K 30 %
2nd level separationStroke width: 0.4 pt
Stroke colour: K 100 %
Header: theme colour 20 %
Aggregates/averages: theme colour 30 %
Countries/table items: white

93 Graphical style guide
Eurostat visual identity for interior pages 3
Chapter title 1
53 Publication title
Table 1.9: Earnings in industry and services (average gross annual earnings full-time employees) (EUR)
1997 1998 1999 2000 2001 2002 2003 2004 2005 2006 2007
EU‑27 : : : : 27 947 30 140 30 347 28 226 29 114 31 302 :
Belgium 28 901 29 616 30 701 31 644 33 109 34 330 34 643 35 704 36 673 37 674 :
Bulgaria 896 1 216 1 330 1 436 1 518 1 588 1 678 1 784 1 978 2 195 2 626
Czech Republic : : : : : 6 016 6 137 6 569 7 405 8 284 :
Denmark 36 235 37 209 39 515 40 962 41 661 43 577 44 692 46 122 47 529 48 307 53 165
Germany 35 093 35 432 36 228 37 319 38 204 39 153 40 056 40 954 41 694 42 382 :
Estonia : : : : : : : : : : :
Ireland : : : : : : : : 40 462 : :
Greece 12 605 13 210 13 926 14 721 15 431 16 278 16 739 : : : :
Spain 16 192 16 528 17 038 17 432 17 768 18 462 19 220 19 828 20 439 21 150 :
France 25 545 25 777 26 339 26 712 27 418 28 185 28 847 29 608 30 521 31 369 :
Italy : : : : : : : : : : :
Cyprus 14 021 14 709 15 161 16 335 16 948 17 740 18 406 19 290 20 549 21 310 :
Latvia : : : : : : : 3 806 4 246 5 211 6 690
Lithuania 2 286 2 799 3 017 : : : : : : : :
Luxembourg 32 600 33 337 34 462 35 875 37 745 38 442 39 587 40 575 42 135 43 621 45 284
Hungary 3 543 3 686 3 770 4 173 4 898 5 846 6 196 7 100 7 798 7 840 8 952
Malta 10 144 10 745 11 608 11 658 11 974 12 096 11 886 11 926 11 180 11 669 :
Netherlands 28 061 29 189 30 426 31 901 33 900 35 200 36 600 37 900 38 700 : :
Austria : : : : : : : 34 995 36 032 36 673 :
Poland : 4 156 5 310 : 7 510 : : 6 230 6 270 : :
Portugal : : : 12 620 13 338 13 322 13 871 14 253 14 715 15 930 :
Romania : : : : : : : 2 414 3 155 3 713 4 828
Slovenia : : : : : : : : : : :
Slovakia 3 179 3 292 3 125 3 583 3 837 4 582 4 945 5 706 6 374 7 040 8 400
Finland 24 005 24 944 25 739 27 398 28 555 29 916 30 978 31 988 33 290 34 080 36 126
Sweden : : : 31 621 30 467 31 164 32 177 33 620 34 049 35 084 36 871
United Kingdom : 29 370 32 269 37 677 39 233 40 553 38 793 41 253 42 866 44 496 46 051
Iceland : : 32 311 37 639 34 101 36 764 : : : : :
Norway : 31 456 33 741 36 202 38 604 43 736 42 882 42 224 45 485 47 221 :
Switzerland : 40 727 : 43 683 : 48 498 : 45 760 : 46 058 :
Croatia : : : : : : 8 491 9 036 9 634 : :
Table header 2(to be used as the standard style for one‑level header)

94 Graphical style guide
Eurostat visual identity for interior pages3
2 Chapter title
64 Publication title
Table 2.14: Holiday trips of EU residents aged 15+, 2008
Number of trips (1 000)
Breakdown of all trips bydestination and duration (%)
All
trip
s
Sho
rt t
rip
s
(1‑3
nig
hts
)
Lon
g t
rip
s
(4+
nig
hts
)
Sho
rt d
om
esti
c tr
ips
(1‑3
nig
hts
)
Lon
g d
om
esti
c tr
ips
(4+
nig
hts
)
Sho
rt o
utb
ou
nd
tr
ips
(1‑3
nig
hts
)
Lon
g o
utb
ou
nd
tr
ips
(4+
nig
hts
)
Belgium 10 712 3 609 7 103 16.5 11.3 17.2 55.0
Bulgaria 6 251 3 775 2 476 57.0 32.0 3.4 7.6
Czech Republic 24 532 14 626 9 906 53.6 20.1 6.0 20.3
Denmark (1) 10 368 4 377 5 991 32.5 15.2 9.7 42.6
Germany 214 482 110 659 103 823 44.9 21.1 6.7 27.3
Estonia 1 241 813 428 49.5 7.7 17.0 25.8
Ireland 11 839 6 023 5 816 38.4 10.4 12.5 38.8
Greece 13 561 5 627 7 934 40.3 50.4 1.2 8.1
Spain 119 969 80 687 39 282 65.4 28.0 1.9 4.7
France 212 562 125 587 86 975 56.4 34.3 2.7 6.6
Italy (2) 78 055 36 920 41 134 43.3 39.8 4.0 12.9
Cyprus 1 704 813 891 42.2 11.4 5.5 40.9
Latvia 4 262 3 318 944 71.8 6.4 7.6 14.2
Lithuania 3 813 2 418 1 395 49.5 13.9 13.9 22.7
Luxembourg 1 199 444 755 0.5 0.3 36.6 62.7
Hungary 22 155 15 010 7 144 60.8 19.6 7.0 12.7
Malta : : : : : : :
Netherlands (1) 29 083 10 621 18 462 25.5 22.7 11.0 40.8
Austria 15 426 6 857 8 569 30.7 20.9 13.8 34.6
Poland 36 245 19 080 17 165 49.4 35.6 3.3 11.7
Portugal (2) 10 265 6 423 3 842 60.5 29.6 2.1 7.9
Romania 10 275 : : : : : :
Slovenia 3 733 2 149 1 584 36.7 11.4 20.9 31.0
Slovakia 6 724 2 071 4 653 24.1 33.8 6.7 35.4
Finland 30 115 23 246 6 869 69.5 15.3 7.7 7.5
Sweden (2) 38 399 25 618 12 781 58.3 19.1 8.5 14.2
United Kingdom (2) 112 695 53 375 59 320 40.8 20.1 6.5 32.5
Norway 16 800 9 650 7 150 44.9 19.9 12.6 22.6
Croatia 6 721 3 557 3 164 39.5 32.3 13.4 14.7
(1) 2007.(2) 2006.
Source: Eurostat (online data code: tour_dem_ttmd).

95 Graphical style guide
Eurostat visual identity for interior pages 3
Chapter title 1
69 Publication title
Table 1.16: Selected items of the fi nancial account balance, 2008 (1)
Fin
anci
al
acco
un
t
Ou
twar
d
fore
ign
dir
ect
inve
stm
ent
Inw
ard
fo
reig
n d
irec
t in
vest
men
t
Port
folio
in
vest
men
t,
asse
ts
Port
folio
in
vest
men
t,
liab
iliti
es
Oth
er
inve
stm
ent,
as
sets
Oth
er
inve
stm
ent,
lia
bili
ties
EU‑27 : ‑ 2.8 1.4 1.8 5.5 ‑ 1.9 0.7
Euro area 3.3 ‑ 3.8 1.1 0.2 4.5 ‑ 0.1 1.8
Belgium 3.1 ‑ 14.7 12.5 0.4 9.4 20.3 ‑ 25.6
Bulgaria 30.7 ‑ 1.4 18.1 ‑ 0.5 ‑ 0.9 0.8 16.7
Czech Republic 3.0 ‑ 0.9 5.0 ‑ 0.1 ‑ 0.1 ‑ 2.3 2.9
Denmark ‑ 2.2 ‑ 8.0 3.2 ‑ 2.3 4.5 ‑ 5.9 7.9
Germany ‑ 8.1 ‑ 4.3 0.7 1.1 0.6 ‑ 5.4 0.2
Estonia 8.3 ‑ 4.4 8.8 4.0 ‑ 1.4 ‑ 2.3 6.4
Ireland 8.6 ‑ 5.0 ‑ 7.4 ‑ 16.1 ‑ 5.1 ‑ 36.3 81.1
Greece 12.4 ‑ 0.7 1.4 0.3 6.7 ‑ 11.5 16.4
Spain 8.7 ‑ 5.0 4.4 2.0 ‑ 1.7 ‑ 1.3 11.2
France : ‑ 7.6 4.0 ‑ 3.2 8.9 2.6 0.4
Italy 3.2 ‑ 2.0 0.6 5.1 2.8 ‑ 1.7 ‑ 1.8
Cyprus 18.1 ‑ 5.9 8.7 ‑ 70.8 ‑ 4.2 ‑ 59.6 149.5
Latvia 13.1 ‑ 0.6 4.0 0.4 0.3 ‑ 1.4 8.8
Lithuania 10.3 ‑ 0.7 3.8 0.0 ‑ 0.2 ‑ 1.9 6.9
Luxembourg ‑ 5.1 ‑ 193.9 150.0 328.7 ‑ 280.8 ‑ 76.3 108.3
Hungary 9.5 ‑ 28.4 31.1 ‑ 2.4 0.1 ‑ 1.6 18.0
Malta 5.3 ‑ 3.3 10.9 3.5 3.0 ‑ 76.5 71.8
Netherlands ‑ 2.5 ‑ 5.6 ‑ 1.2 0.1 12.7 5.8 ‑ 12.7
Austria ‑ 4.2 ‑ 7.0 3.4 3.4 5.8 ‑ 13.5 3.8
Poland 8.4 ‑ 0.7 3.1 0.4 ‑ 1.0 1.2 4.7
Portugal 10.9 ‑ 0.9 1.5 : 15.8 7.1 ‑ 5.2
Romania 12.9 0.1 6.3 ‑ 0.4 ‑ 0.3 ‑ 0.8 8.0
Slovenia 6.2 ‑ 2.6 3.3 ‑ 0.1 1.7 ‑ 2.1 5.9
Slovakia 7.9 ‑ 0.3 3.7 0.7 1.8 ‑ 0.8 2.8
Finland 3.7 ‑ 0.6 ‑ 1.6 0.6 1.7 ‑ 3.3 6.3
Sweden 2.3 ‑ 7.8 9.2 ‑ 5.2 ‑ 2.4 ‑ 0.4 8.4
United Kingdom 1.2 ‑ 5.1 3.7 8.6 16.7 37.4 ‑ 61.3
Norway ‑ 21.5 ‑ 6.1 ‑ 0.2 ‑ 29.3 4.4 8.0 3.1
Croatia 12.6 ‑ 0.3 7.0 ‑ 0.6 ‑ 0.7 ‑ 3.4 9.8
Turkey 4.7 ‑ 0.3 2.5 ‑ 0.2 ‑ 0.6 ‑ 1.0 4.1
Japan ‑ 4.2 ‑ 2.8 0.5 ‑ 4.0 ‑ 2.5 3.3 1.3
United States 3.7 ‑ 2.2 2.3 1.2 4.0 0.7 ‑ 2.2
(1) EU‑27, extra EU‑27 fl ows; euro area, extra EA‑16 fl ows; Member States and other countries, fl ows with the rest of the world. Note that, according to the balance of payments sign convention, increases in assets and decreases in liabilities are shown with a negative sign, whereas decreases in assets and increases in liabilities are shown as positive.
Source: Eurostat (online data codes: bop_q_eu, bop_q_euro, bop_q_c and tec00001).

96 Graphical style guide
Eurostat visual identity for interior pages3
2 Chapter title
60 Publication title
Table 2.8: Proportion of innovative enterprises which introduced products new to the market or own-developed process innovations, 2006(% of enterprises within size class or total)
process innovations: developed by the enterprise or group
product innovations: new to market
TotalWith
10 to 49 employees
With50 to 249
employees
With> 250
employeesTotal
With10 to 49
employees
With50 to 249
employees
EU‑27 (1) : : : : 32.6 29.7 36.8
Belgium 20.9 18.6 27.0 40.6 41.4 38.6 44.1
Bulgaria 7.7 6.3 10.1 21.8 41.3 38.6 46.2
Czech Republic 13.6 10.9 20.3 28.0 38.9 32.5 48.3
Denmark 16.4 13.7 24.6 33.3 33.8 30.9 37.9
Germany 19.3 15.8 23.3 43.8 30.4 25.9 35.3
Estonia 19.9 17.2 26.9 50.0 32.8 32.9 32.1
Ireland 20.0 17.6 26.3 44.1 40.8 38.0 47.0
Greece 19.8 17.4 31.1 35.3 49.5 48.1 50.2
Spain 16.1 13.9 25.2 39.0 18.3 14.8 26.0
France : : : : : : :
Italy : : : : 29.5 26.8 37.2
Cyprus 12.5 11.5 17.9 10.7 34.5 30.9 42.3
Latvia : : : : 44.7 49.7 33.8
Lithuania 7.8 6.1 15.9 21.7 36.0 36.8 32.4
Luxembourg 22.0 18.3 28.9 44.9 58.9 59.3 52.6
Hungary 5.7 4.5 8.1 18.8 30.9 30.1 29.6
Malta 13.1 9.2 23.8 51.9 31.3 29.4 29.2
Netherlands 8.2 6.9 11.0 23.2 48.1 46.1 50.8
Austria 18.8 15.7 26.9 39.8 45.4 42.1 48.8
Poland 10.8 7.4 17.4 29.5 32.7 33.1 30.6
Portugal 19.1 17.1 26.9 36.8 29.8 26.5 37.1
Romania 14.3 12.0 18.1 28.4 24.7 22.1 26.6
Slovenia 13.8 11.4 18.0 30.8 51.1 52.5 44.9
Slovakia 7.9 5.0 13.1 21.6 37.6 34.7 39.8
Finland 19.7 17.8 23.3 35.0 44.6 44.3 40.7
Sweden 16.3 14.9 : : 51.3 49.3 55.8
United Kingdom : : : : 31.6 31.0 31.7
Norway 10.4 9.1 14.3 21.1 39.9 40.6 37.0
Croatia 11.0 9.3 14.7 20.9 31.7 28.5 33.1
Turkey 20.2 19.1 23.4 30.4 59.6 62.3 50.5
(1) Excluding France (derogation accorded on 22 July 2005).
Source: Eurostat (online data code: inn_cis5_prod).

97 Graphical style guide
Eurostat visual identity for interior pages 3
Chapter title
67 Publication title
4Table 4.7: Graduates from tertiary education, by fi eld of education, 2007 (1)
Total numberof graduatesfrom tertiary
education(1 000)
of which, studying (%)h
um
an it
ies
&
arts
Teac
hin
g &
tr
ain
ing
Soci
al s
cien
ces,
b
usi
nes
s &
law
Scie
nce
, mat
h.
& c
om
pu
tin
g
Eng
in.,
man
uf.
& c
on
str
uct
ion
Ag
ricu
l. &
vet
er
inar
y
hea
lth
&
wel
fare
Serv
ices
EU27 4 101 12.1 5.9 35.0 9.7 12.6 1.7 14.8 4.0
Belgium 104 11.7 10.8 29.5 7.3 10.4 2.7 18.0 2.0
Bulgaria 49 6.9 5.4 51.4 4.1 14.8 1.8 6.2 7.8
Czech Republic 78 8.0 13.2 29.3 7.6 16.0 3.7 10.4 4.3
Denmark 51 13.4 6.2 31.9 7.3 12.6 2.2 21.7 2.9
Germany 439 16.1 3.8 24.2 12.3 13.2 1.7 18.9 3.6
Estonia 13 10.4 9.4 35.8 10.5 10.6 2.1 10.9 8.9
Ireland 59 25.2 : 28.4 15.1 8.5 0.7 12.5 2.4
Greece 60 15.6 7.5 25.5 9.3 12.2 4.2 15.9 9.8
Spain 279 8.7 11.0 27.0 9.4 16.8 1.8 14.5 7.6
France 623 10.9 0.8 40.9 11.1 15.6 1.5 14.0 4.1
Italy 402 15.4 5.8 32.7 6.7 13.9 1.8 15.1 2.5
Cyprus 4 7.6 9.1 47.7 8.6 3.7 0.2 7.5 14.1
Latvia 27 6.2 10.8 55.7 4.7 7.1 0.8 5.8 6.0
Lithuania 43 7.0 11.9 42.7 5.8 15.0 1.7 9.8 3.6
Luxembourg : : : : : : : : :
Hungary 67 7.7 15.5 41.2 6.4 7.5 2.7 10.0 8.3
Malta 3 16.0 10.1 47.1 8.0 7.4 0.0 10.5 0.9
Netherlands 123 8.7 12.5 38.0 6.5 7.7 1.5 17.2 4.7
Austria 36 8.9 11.5 30.5 12.1 19.8 2.2 9.7 3.1
Poland 533 8.6 4.7 43.0 8.1 8.7 1.7 8.2 5.4
Portugal 83 9.9 7.2 33.0 12.4 19.6 1.8 22.3 6.8
Romania 206 11.0 0.6 49.0 5.2 14.4 2.3 11.9 3.4
Slovenia 17 5.9 8.9 49.7 4.4 12.6 2.4 7.9 8.2
Slovakia 46 5.1 12.6 28.1 8.7 14.7 3.4 18.9 6.1
Finland 43 14.7 4.8 22.7 8.8 19.9 2.1 19.3 5.5
Sweden 60 6.1 16.2 25.3 7.4 17.2 1.2 25.7 2.3
United Kingdom 651 15.9 6.9 30.3 13.2 8.4 0.9 18.3 0.8
Iceland 4 10.8 20.1 38.7 6.9 6.0 0.8 12.8 1.1
Liechtenstein 0 2.7 0.0 65.8 0.0 31.5 0.0 0.0 0.0
Norway 35 9.8 10.5 27.5 7.5 7.4 1.1 24.5 4.1
Switzerland 76 7.0 9.3 37.9 8.5 13.2 2.1 14.1 6.4
Croatia 22 8.1 6.9 37.7 7.0 11.7 3.1 9.5 15.6
FYR of Macedonia 9 11.3 20.9 31.8 6.5 10.5 3.8 10.7 4.4
Turkey 416 6.3 15.1 40.2 8.0 13.6 4.3 6.0 5.8
Japan 1 062 15.1 0.9 26.9 3.0 17.8 2.2 12.9 9.5
United States 2 704 13.1 : 38.0 8.7 7.0 1.1 14.2 6.7
(1) Refer to the Internet metadata fi le (http://epp.eurostat.ec.europa.eu/cache/ITY_SDDS/en/educ_esms.htm).
Source: Eurostat (online data code: educ_grad5).

For further information
Dissemination UnitEurostat — Bech Building5, rue Alphonse Weicker L-2721 LuxembourgTel.: +352 4301-34361Fax: +352 4301-32594
http://ec.europa.eu/eurostat
Related Documents