Austrian Power System 1 The Electric Power System - Austria – version 10 th July 2018

Welcome message from author
This document is posted to help you gain knowledge. Please leave a comment to let me know what you think about it! Share it to your friends and learn new things together.
Transcript
Austrian Power System 1
The Electric Power System
- Austria –
version 10th July 2018

Austrian Power System 2
Basic facts Austria
Area: 83,850 km2
Population: 8,8 Mio
Number of TSOs: 2
Number of DSOs: 122
Peak load: 10,4 GW
2
Austrian Power System 3
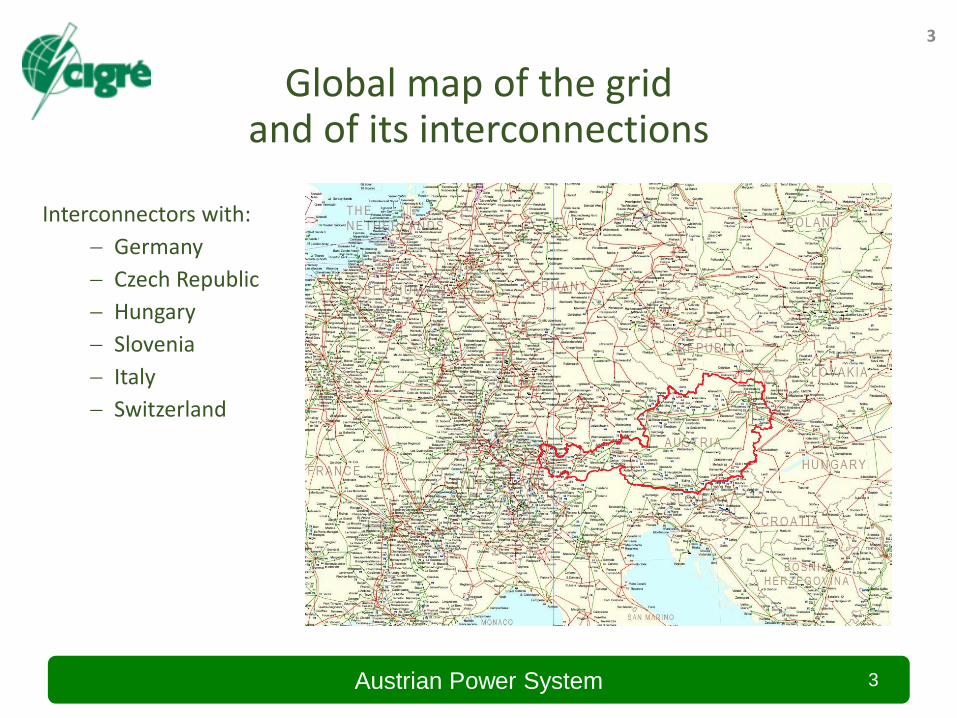
Global map of the gridand of its interconnections
3
Interconnectors with:
Germany
Czech Republic
Hungary
Slovenia
Italy
Switzerland

Austrian Power System 4
Grid facts and characteristics
The high voltage electricity grid in Austria consists of the voltage levels 380 kV, 220 kV, 110 kV and medium voltage
4
Voltage LevelTotal length
(system length in km)
380 kV 3.051
220 kV 3.714
110 kV 11.435
1 kV to 110 kV 69.062
1 kV and below 173.369
as of 31.12.2016

Austrian Power System 5
Structure of electrical power system
5
Horizontal - internationalVertical - national
DSO
TSO
SpeicherE-Mobility
Storages
DSO
TSO
National
State
Municipal utility
ConventionalPowerplants
Run of River Pump Storages Wind Energy Solar Energy
Railway Research andIndustry
Residential Areas
Industry, commerce, offices and department stores
Residential buildings StoragesAgricultureSmall businesses
Austrian Power System 6
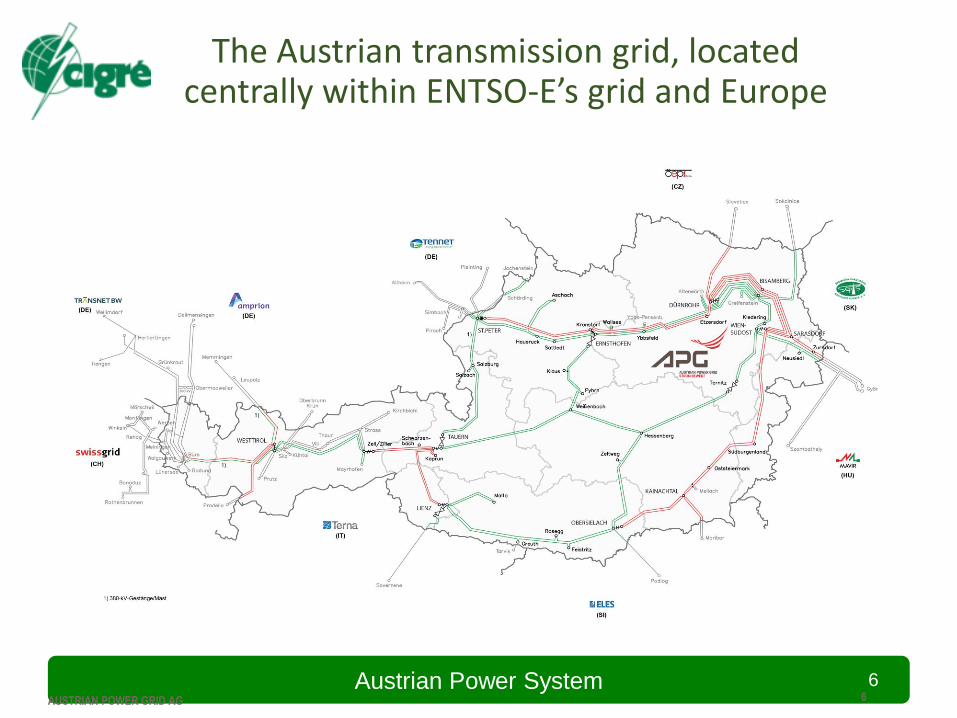
The Austrian transmission grid, located centrally within ENTSO-E’s grid and Europe
6AUSTRIAN POWER GRID AG
Austrian Power System 7
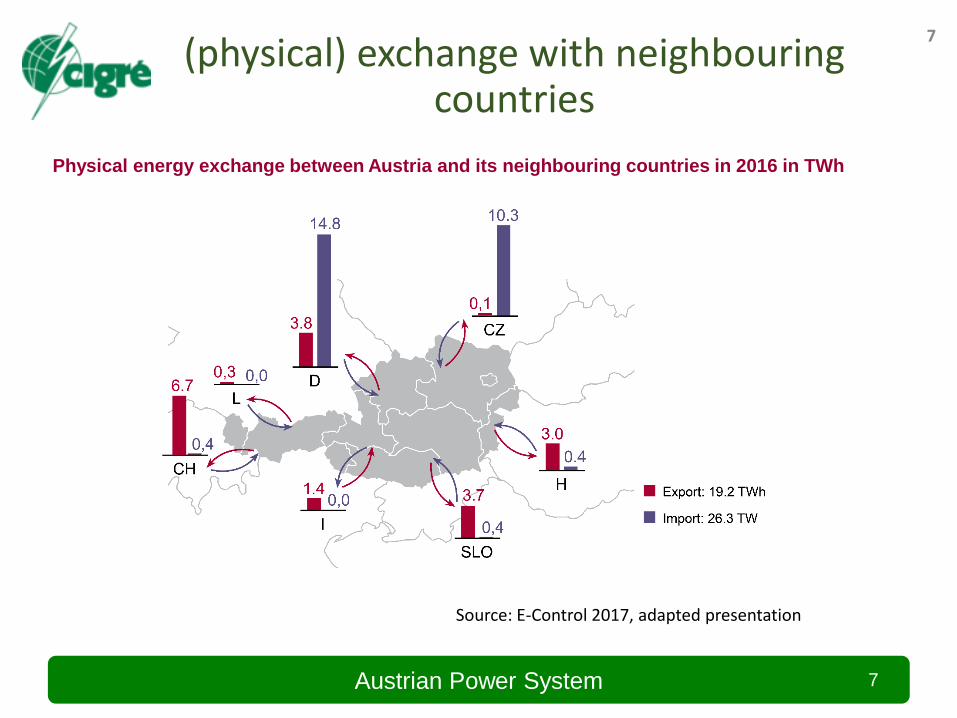
(physical) exchange with neighbouringcountries
7
Source: E-Control 2017, adapted presentation
Physical energy exchange between Austria and its neighbouring countries in 2016 in TWh

Austrian Power System 8
Austrian Power Grid AG, Key Facts and duties
8
APG is a regulated enterprise:– Sales revenues*: € 777 million– Total Assets*: € 1.578 million– Yearly Investments: € ~250 million
APG is solely responsible for – secure and reliable system operation– grid enforcement and development– market facilitation and integration– forecast and balancing the Renewable
Energy Production
APG is a full and active member of ENTSO-E, the European Network of Transmission System Operators for Electricity.
* Figures from 2017 Annual Report.
11.07.2018

Austrian Power System 911.07.2018 9
Austrian Power Grid AG (APG)
3.500 km length of lines (110kV, 220kV, 380kV) 473 employees € 1.578 Mio. Assets € 250 Mio. investments per year 100% owned by Verbund,
Austrian Electricity law § 28, ITO Member of ENTSO-E
• Austrian Transmission System Operator• unbundled & regulated enterprise
secure and reliable system operation grid enforcement & development market facilitation & integration forecast & integration of Renewable
Energy production
APG mastering today’s energy change and its conflict with security of supply

Austrian Power System 10
Cooperation of TSO and DSOs
In Austria TSO and DSOs have a very good historical basis and close cooperation (grid restoration, grid planning…)
New challenges for TSOs and DSOs
Renewable integration
Congestion management
Neutral market facilitator
Requirement for enhancement of cooperation
Data exchange
Knowledge sharing
10

Austrian Power System 11
Power structure of the country
11
Pumped storage (~ 8.400 MW)
Thermal power plant (~ 6.750 MW)
Wind power plants (~ 2.750 MW)
11.07.2018
Solar power plants (~ 1.050 MW)
Run of river power plants (~ 5.700 MW)
1) one system 220kV2) at present in service with 220kV

Austrian Power System 121211.07.2018
Installed capacity in Austria in 2016 and in visions of TYNDP 2016
Run of River Power Plants
Wind Power Plants
Pump Storage
Other Renewables
Solar PV
Coal and conventional Power Plants
Gas Power Plants

Austrian Power System 1311.07.2018 13
Renewables – current status (end of 2017)
13
outlook Austria by end of 2020 app:2 GW PV4 GW Wind
~3 GW
T: ~8 GW P: ~4 GW
56 GW
41 GW
~10 GW
~20 GW
Austrian Power System 14
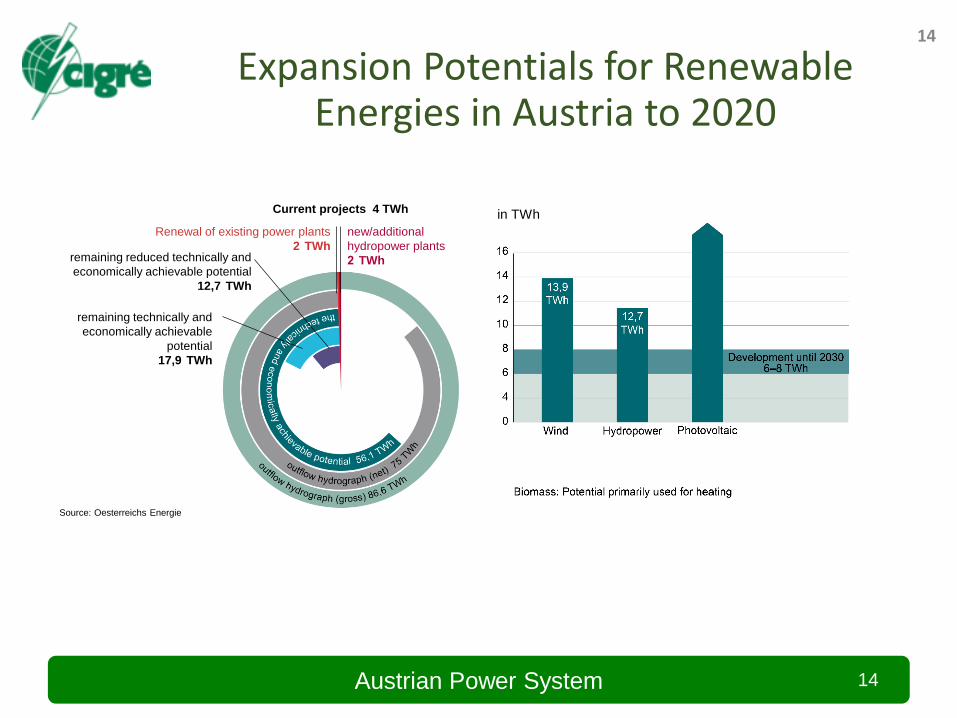
Expansion Potentials for Renewable Energies in Austria to 2020
14
in TWh
Source: Oesterreichs Energie
Renewal of existing power plants
2 TWhremaining reduced technically and
economically achievable potential
12,7 TWh
Current projects 4 TWh
remaining technically and
economically achievable
potential
17,9 TWh
new/additional
hydropower plants
2 TWh
Austrian Power System 15
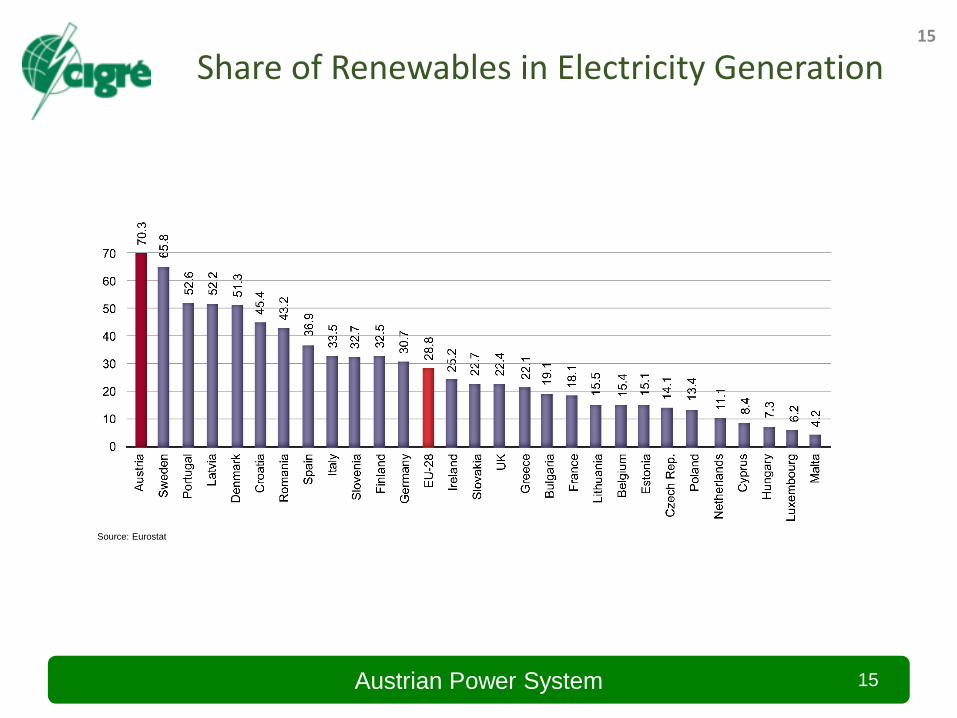
Share of Renewables in Electricity Generation15
Source: Eurostat

Austrian Power System 16
CO2 Emissions in Power Generation16
Source: Eurelectric „Power Facts 2016“, Umweltbundesamt „Klimaschutzbericht 2017“, own
calculations
Development of specific CO2 emissions (EU, Austria)
Remark: Countries with a high share of CHP might have higher specific CO2-emissions. This is
due to the fact that the emissions for heat produciton are included in the figures.
Source: Eurelectric, Power Statistics 2013; Technik: Well-to-Wheel, Umweltbundesamt GmbH
Specific CO2 emissions 2013 Data in g/kWh
Greece 869 intensive
Ø 700 g/kWhNetherlands 550
Germany 468
high
Ø 400 g/kWh
Denmark 464
UK 443
Italy 404
Portugal 325
Spain 258
moderate
Ø 200 g/kWh
Belgium 200
Finland 190
Austria 167
France 50 low
< 50 g/kWhSweden 16
The European power sector continues it‘s trajectory in
reducing CO2-emissions:
▪ 1990: 500 gCO2/kWh
▪ 2014: 331gCO2/kWh [- 33,8%]
Austria belongs to the frontrunners, regarding the trajectory
in reducing CO2-emissions in the production of electricity
(incl. CHP)
▪ 1990: ~ 170 gCO2/kWh
▪ 2015: ~ 105 gCO2/kWh [-41,1%]
Austrian Power System 17
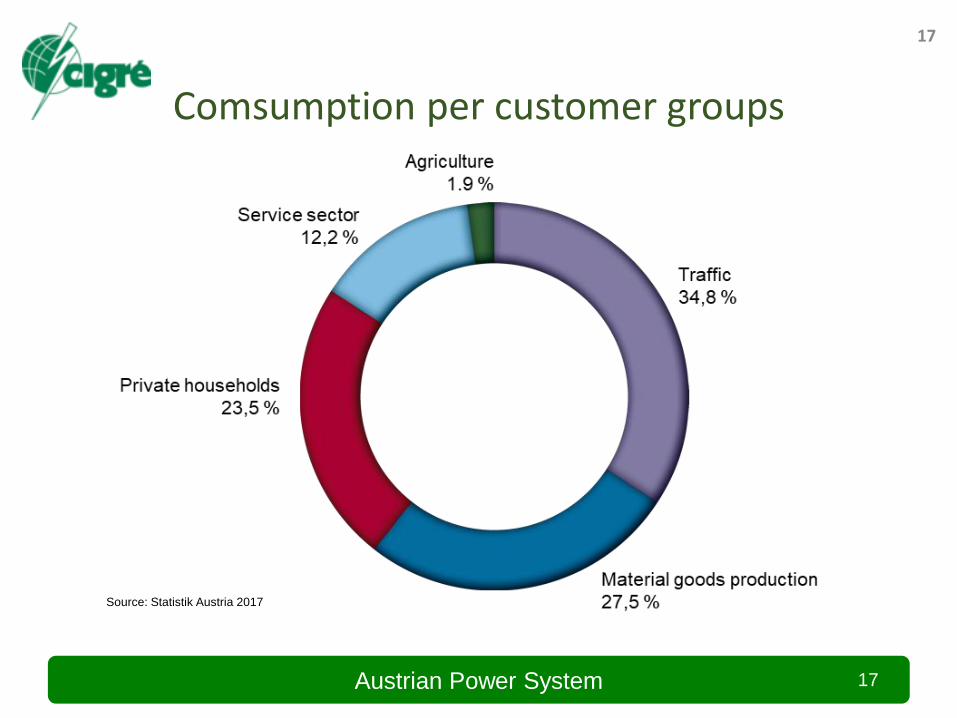
Comsumption per customer groups
17
Source: Statistik Austria 2017
Austrian Power System 1818
Winkeln
St. Peter
Hessenberg
WIENSÜDOST
Bisam-berg
Energie AG
Ranshofen
Ternitz
Lienz
CZ
SK
H
SLO
CH
Westtirol
Zell amZiller
Obermooweiler
Kainachtal
Südburgenland
Dürnrohr
Pradella
Salzach
PleintingPirach
Simbach
YbbsfeldHausruck
Weißenbach
SoverzenePodlog
Maribor
Slavetice Sokolnice
GyörGyör
Neusiedl
Steweag-Steg
Steweag-Steg
Steweag-Steg
Steweag-Steg
Oststeiermark
Pongau
SalzachNeu
Saras-dorf
IT
D
Obermooweiler
Neuötting
Altheim
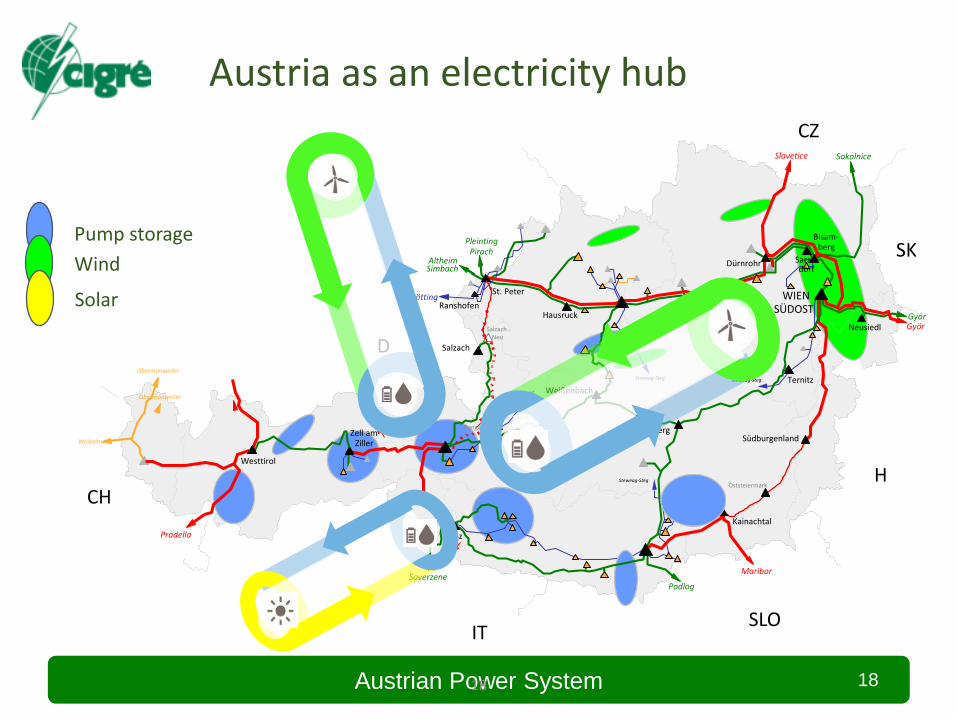
Pump storage
Wind
Austria as an electricity hub
Solar
Austrian Power System 19
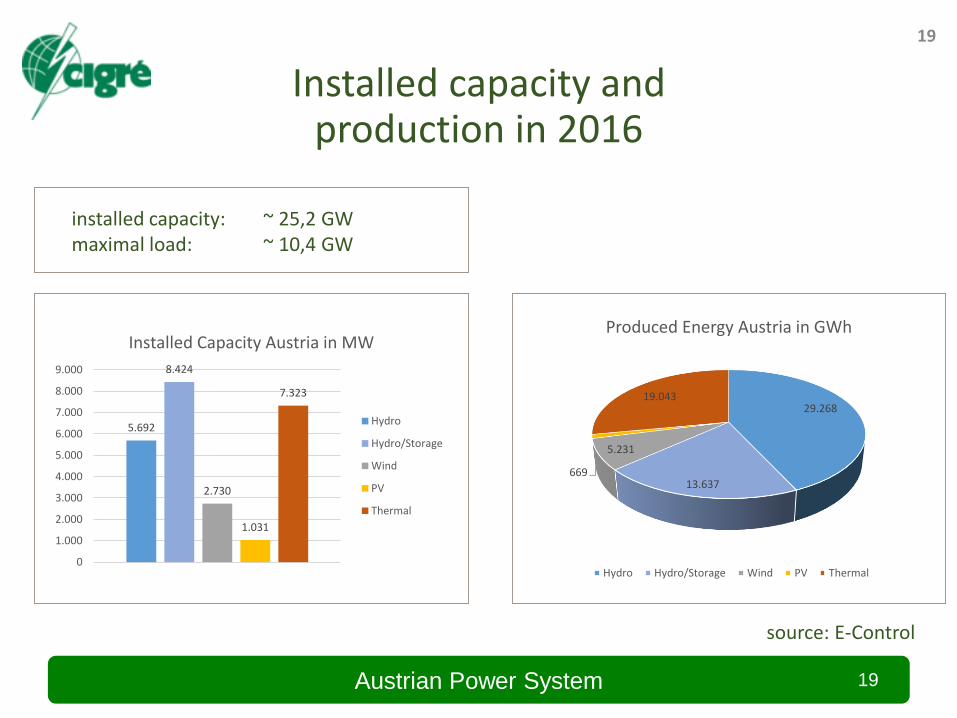
Installed capacity and production in 2016
19
installed capacity: ~ 25,2 GWmaximal load: ~ 10,4 GW
5.692
8.424
2.730
1.031
7.323
0
1.000
2.000
3.000
4.000
5.000
6.000
7.000
8.000
9.000
Installed Capacity Austria in MW
Hydro
Hydro/Storage
Wind
PV
Thermal
29.268
13.637
5.231
669
19.043
Produced Energy Austria in GWh
Hydro Hydro/Storage Wind PV Thermal
source: E-Control
Austrian Power System 20
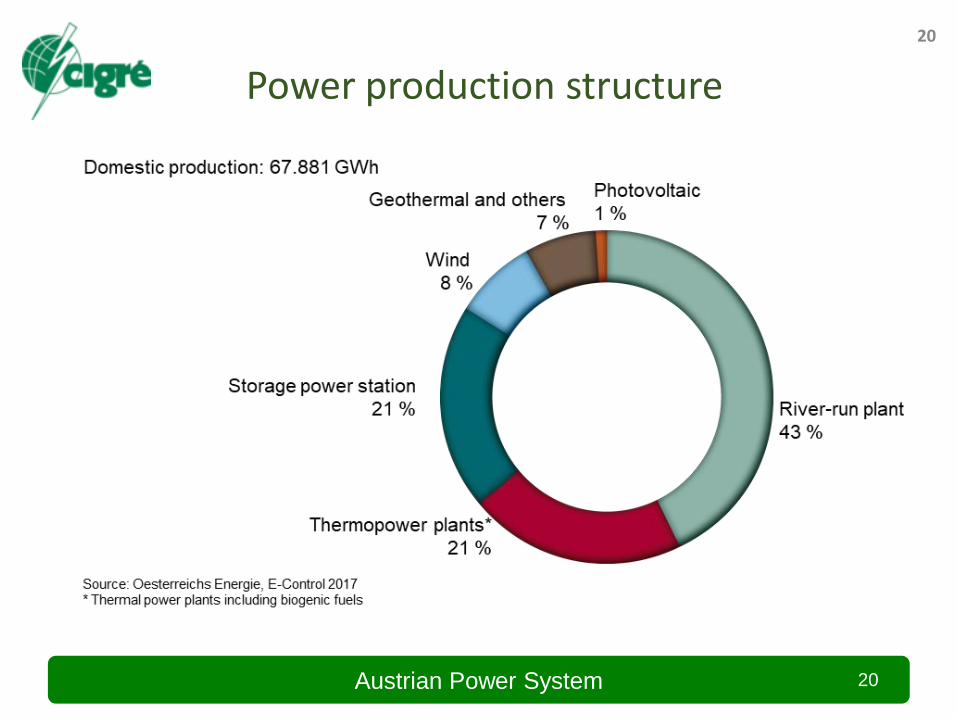
Power production structure
20
Austrian Power System 21
Power balance in 2016
Generation (TWh) 67,9 TWh
Consumption (TWh) 61,8 TWh
Imports (TWh) 26,3 TWh
Exports (TWh) 19 TWh
Losses (TWh) 3,2 TWh
21
source: E-Control
Related Documents


