The Effects of Natural and Anthropogenic Habitats on Pollinator Communities in Oak-Savannah Fragments on Vancouver Island, British Columbia by Julie Carolyn Wray B.Sc. (Hons. Ecology), University of Guelph, 2009 Thesis Submitted in Partial Fulfillment of the Requirements for the Degree of Master of Science in the Department of Biological Sciences Faculty of Science Julie Carolyn Wray 2013 SIMON FRASER UNIVERSITY Fall 2013

Welcome message from author
This document is posted to help you gain knowledge. Please leave a comment to let me know what you think about it! Share it to your friends and learn new things together.
Transcript
The Effects of Natural and Anthropogenic Habitats on
Pollinator Communities in Oak-Savannah Fragments
on Vancouver Island, British Columbia
by
Julie Carolyn Wray
B.Sc. (Hons. Ecology), University of Guelph, 2009
Thesis Submitted in Partial Fulfillment of the
Requirements for the Degree of
Master of Science
in the
Department of Biological Sciences
Faculty of Science
Julie Carolyn Wray 2013
SIMON FRASER UNIVERSITY
Fall 2013

ii
Approval
Name: Julie Carolyn Wray
Degree: Master of Science (Biological Sciences)
Title of Thesis: The effects of natural and anthropogenic habitats on pollinator communities in oak-savannah fragments on Vancouver Island, British Columbia
Examining Committee: Chair: Bernard D. Roitberg Professor
Elizabeth Elle Senior Supervisor Professor
David J. Green Supervisor Associate Professor
Meg A. Krawchuk Internal Examiner Assistant Professor Department of Geography
Date Defended/Approved: December 6, 2013
iii
Partial Copyright Licence
iv
Abstract
Fragmentation of natural habitat can lead to loss of species but landscapes surrounding
habitat fragments may provide resources and so promote species diversity. I examined
the role of the surrounding landscape – Douglas-fir forest and urban residential areas –
on pollinator communities in oak-savannah fragments. Bees in fragments surrounded by
forest were larger, and body size increased with increased availability of early-blooming,
native flowering plants. Small-bodied, mid to late-season bees were more abundant in
fragments surrounded by urban landscapes. We propose these late-season generalist
pollinators were supported by floral resources in the gardens of urban habitats. In
contrast, early-flying species were unique to oak-savannah fragments and some bumble
bees may rely on nesting resources found only in forested landscapes. Although urban
residential lawns and gardens supported a high richness and abundance of pollinator
species, conservation of these oak savannah- and forest-associated species will depend
on maintaining and restoring oak-savannah habitats.
Keywords: Habitat fragmentation; landscape matrix; pollinators; community composition; species-specific traits; oak-savannah
v
Dedication
Every bee is a really cool bee.
vi
Acknowledgements
Many thanks and gratitude goes to Elizabeth Elle, my supervisor, mentor, and friend
during my graduate degree at Simon Fraser. My development as a biologist has been
greatly influenced by your enthusiasm for science, public outreach, and fun. I especially
want to thank you for holding me to high standards while encouraging personal and
scientific creativity. Thanks to my supervisory committee member, David Green, for your
valuable insights and reminding me that not everyone is obsessed with bees. Also,
thanks to Meg Krawchuk for serving as public examiner for my thesis defense.
This research would not have been possible without the help of many field and lab
assistants, taxonomists, and property owners. Tiia Haapalainen provided exceptional
assistance and support in the field, and Eva Reimer and Alysha Martins did the lion’s
share of menial tasks in the lab. Thanks also to Lisa Neame and her field assistants (M.
Jackson, T. Jones, Z. Tulcsik, E. Udal) for collecting the data used for analysis in
Chapter 2, to Jane Pendray for measuring bees, and to Molly Rightmyer, O. Messinger,
K. Huntzinger, J. Gibbs, and H. Ikerd for identification assistance. I am grateful to the
Capitol Regional District, the National Research Council of Canada, Districts of Saanich,
Central Saanich, Municipalities of Oak Bay and Esquimalt, the City of Victoria and
especially to 62 property owners that provided site access. Special appreciation goes to
Shannon Berch for corralling all her neighbours into the project, Mark and Wendy
Saulter for providing us with accommodations and fresh eggs during our last week of
field work, and many others for their kind hospitality.
I have been extremely fortunate to have spent the past two and a half years working and
laughing alongside members of the extended Elle lab family. Sherri, Gram, Jane, Tiia,
Hannah, Jenn, Angela, Kyle, and especially Franz and Lindsey – thank you for providing
intelligent and thoughtful discussions of science and biology, as well as not so thoughtful
but necessary distractions, fun, and Sci-Fi Sundays.
Finally, thanks to my family for their love and support during the pursuit of my graduate
education, and to my friends for all the beerskis, potlucks, transit and Skype chats, cabin
trips, cold swims, bike rides and baked goods that make Vancouver feel like home.
vii
Table of Contents
Approval .......................................................................................................................... ii Partial Copyright Licence ............................................................................................... iii Abstract .......................................................................................................................... iv Dedication ....................................................................................................................... v Acknowledgements ........................................................................................................ vi Table of Contents .......................................................................................................... vii List of Tables .................................................................................................................. ix List of Figures................................................................................................................. xi
Chapter 1. Introduction ............................................................................................... 1 References ...................................................................................................................... 4
Chapter 2. Floral resources, surrounding landscape, and body size influence bee community assemblages in oak-savannah fragments .................................................................................................. 6
Introduction ..................................................................................................................... 6 Methods .......................................................................................................................... 9
Study area and bee and plant sampling .................................................................. 9 Landscape characterization .................................................................................. 10 Species-specific traits of bees .............................................................................. 11 Statistical analysis ................................................................................................ 12
Species richness, diversity, and abundance ................................................ 12 Plant and bee community composition ......................................................... 12 Floral resources and body size .................................................................... 13
Results .......................................................................................................................... 14 Species richness, diversity, and abundance ......................................................... 14 Plant and bee community composition ................................................................. 15 Floral resources and body size ............................................................................. 15
Discussion ..................................................................................................................... 16 Species richness, diversity, and abundance ......................................................... 16 Plant and bee community composition ................................................................. 18 Floral resources and body size ............................................................................. 19 Conclusions .......................................................................................................... 20
References .................................................................................................................... 22 Tables ........................................................................................................................... 29 Figures .......................................................................................................................... 33
viii
Chapter 3. Flowering phenology and nesting resources influence pollinator community composition in a fragmented ecosystem ......... 36
Introduction ................................................................................................................... 36 Methods ........................................................................................................................ 39
Study system and sites ......................................................................................... 39 Floral, nest, and pollinator sampling ..................................................................... 41 Statistical analysis ................................................................................................ 43
Preliminary analyses .................................................................................... 43 Effect of habitat type and sampling period on pollinator abundance,
richness, and diversity ......................................................................... 43 Flowering plant and pollinator community composition ................................ 44 Influence of nesting resources on bee community composition .................... 45
Results .......................................................................................................................... 47 Effect of habitat type and sampling period on pollinator abundance,
richness, and diversity ................................................................................. 47 Flowering plant and pollinator community composition ......................................... 48 Influence of nesting resources on bee community composition ............................ 49
Discussion ..................................................................................................................... 51 Effect of habitat type and sampling period on pollinator abundance,
richness, and diversity ................................................................................. 51 Flowering plant and pollinator community composition ......................................... 53 Influence of nesting resources on bee community composition ............................ 54 Conclusions .......................................................................................................... 56
References .................................................................................................................... 58 Tables ........................................................................................................................... 65 Figures .......................................................................................................................... 70
Chapter 4. Conclusions ............................................................................................ 77 Caveats and future directions ........................................................................................ 80 References .................................................................................................................... 82
ix
List of Tables
Table 2.1. Eigenvectors for the first principal component, based on an analysis of five within fragment floral resource characteristics for 19 oak-savannah fragments. I used eigenvector sign and magnitude for interpretation of PC1 as negatively related to flowering plant richness and density and positively related to the proportion of bare rock and richness and density of introduced species. .................................................................................................. 29
Table 2.2. Comparisons of total- and guild-specific species richness, diversity, and abundance of female bees between forest- (N=8) and urban-associated oak-savannah fragments (N=11). Significant differences between means were determined by two sample t-tests ....................................................................................................... 30
Table 2.3. List of forest- and urban-associated bee and plant species, based on correlations between species abundance and NMDS site ordination axis 2 scores. Site groupings separate predominantly along axis 2 (Figure 2.1), hence species positively correlated with axis 2 can be considered “forest-associated” while species negatively correlated with axis 2 can be considered “urban-associated”. Values in bold indicate that the Pearson correlation coefficient (r) is significant at P<0.05, plain text P<0.10. Correlations with P-values >0.10 are not shown. aIndicates introduced plant species. bAsteraceae floral specialist. .......................... 31
Table 2.4 Importance of floral resources (PC1), fragment area, and forest cover in predicting body size and bumble bee abundance at 19 oak-savannah fragments (only models with ∆AICc <4 presented). Competing models for best rank indicated in bold (i.e. ∆AICc ≤ 2). RI = relative importance of preceding predictor variable. The variable with the highest relative importance best explains variation in the dependent variable. Log L = log transformation of the likelihood (L) of the model being the best model, ∆AICc = difference between the most explanatory model and the model of interest, wi = Akaike weights, indicate probability that the model best explains variation in the dependent variable relative to other candidate models ................................................................................... 32
Table 3.1. Description of measured nesting resources (adapted from Potts et al. 2005) ................................................................................................. 65

x
Table 3.2. Mixed models describing the effects of habitat type, sampling period, and the interaction between habitat type and sampling period on flowering plant and pollinator richness and abundance. All P-values are ≤ 0.0001, except for the effect of habitat type on flowering plant and pollinator diversity (plants: P=0.0023; pollinators: P=0.02). ............................................................................... 66
Table 3.3. List of pollinator species that are indicators of oak-savannah and urban habitats. Letters in brackets indicate that the species is specifically associated with the one type of habitat type within the grouping (FF = forest-associated OS fragment, UF = urban-associated OS fragment, UM = urban matrix, IU = independent urban sites, from indicator species analysis in PC-ORD). IVmax is the maximum indicator value for that species across all habitat types, and P-values were obtained from permutations. *Denotes introduced species. I excluded species if less than 5 were caught, as the association may be due to rarity rather than habitat preferences (as such there were no significant indicators of forest matrix habitat). ....................................................................................... 67
Table 3.4. Means (± SE) of nesting resources in different habitat types .................. 68
Table 3.5. Description of nest location and construction characteristics for different genera (species for Bombus) included in redundancy analysis. Information on nesting biology was obtained from “The Bees of the World” (Michener, 2000) unless otherwise indicated. *Denotes introduced species. ................................................................. 69
xi
List of Figures
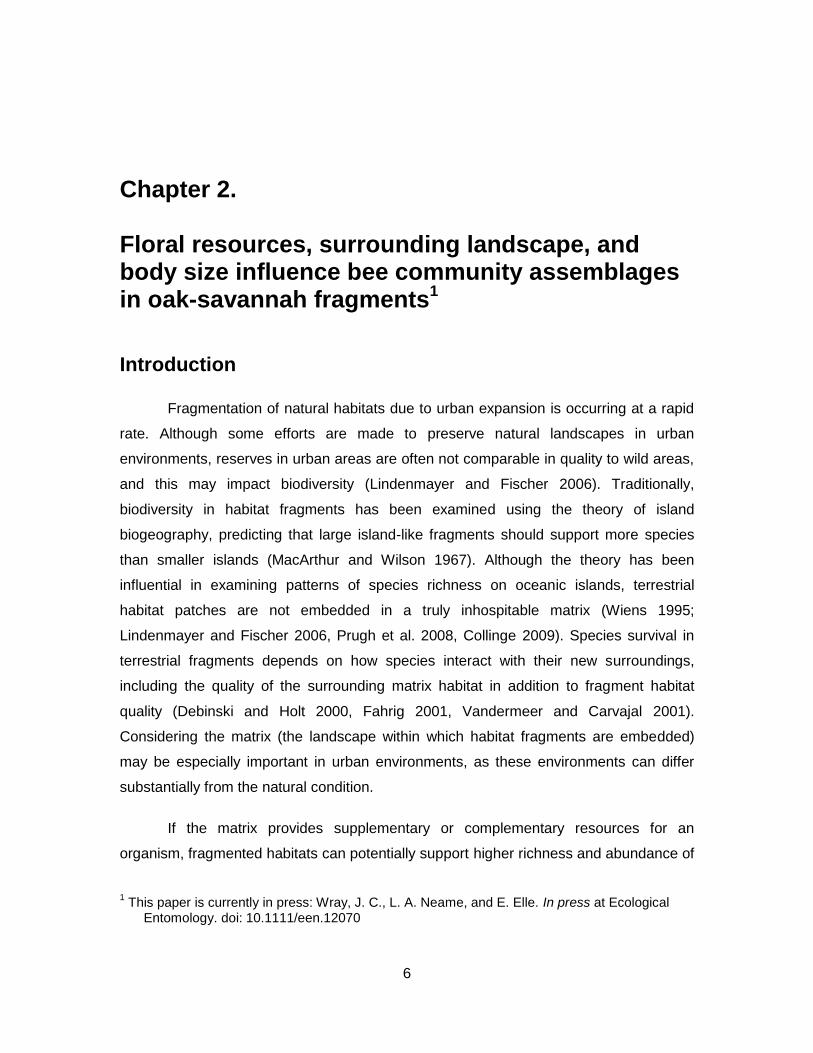
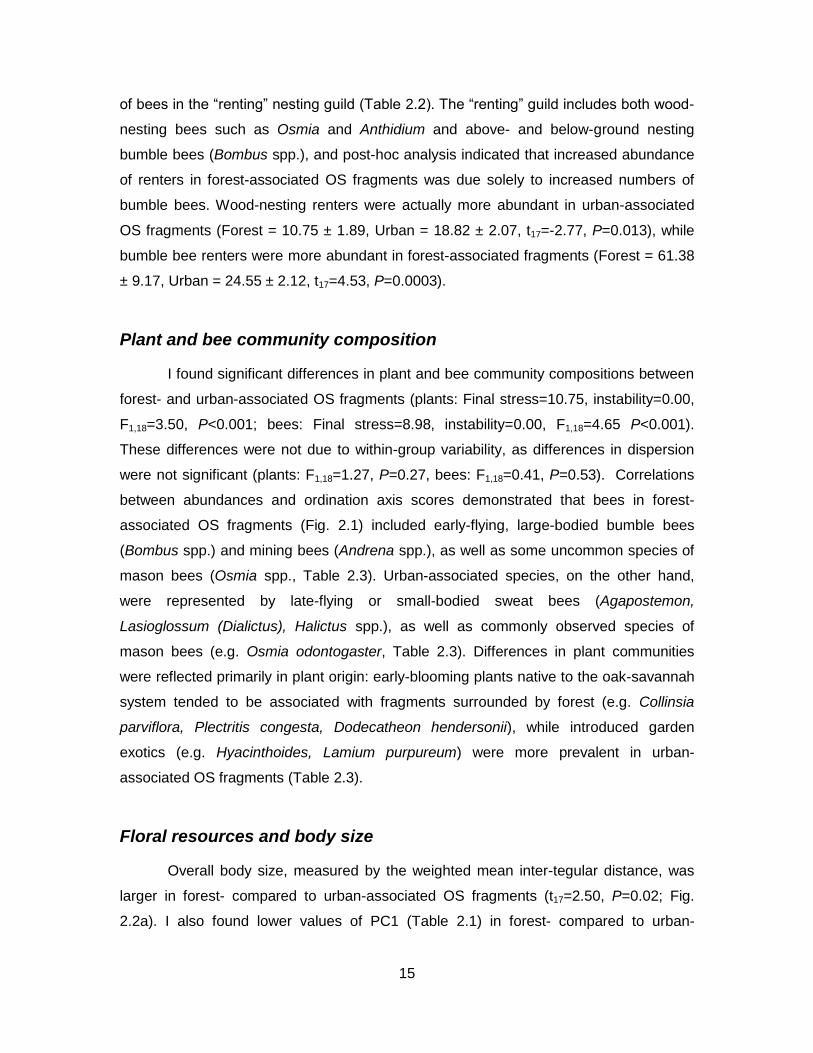
Figure 2.1. NMDS plot showing similarities in female bee community composition between forest- (N=8) and urban-associated OS fragments (N=11) (Final stress = 8.98, instability = 0.00, Non-parametric MANOVA F1,18=4.65 P<0.001) .............................................. 33
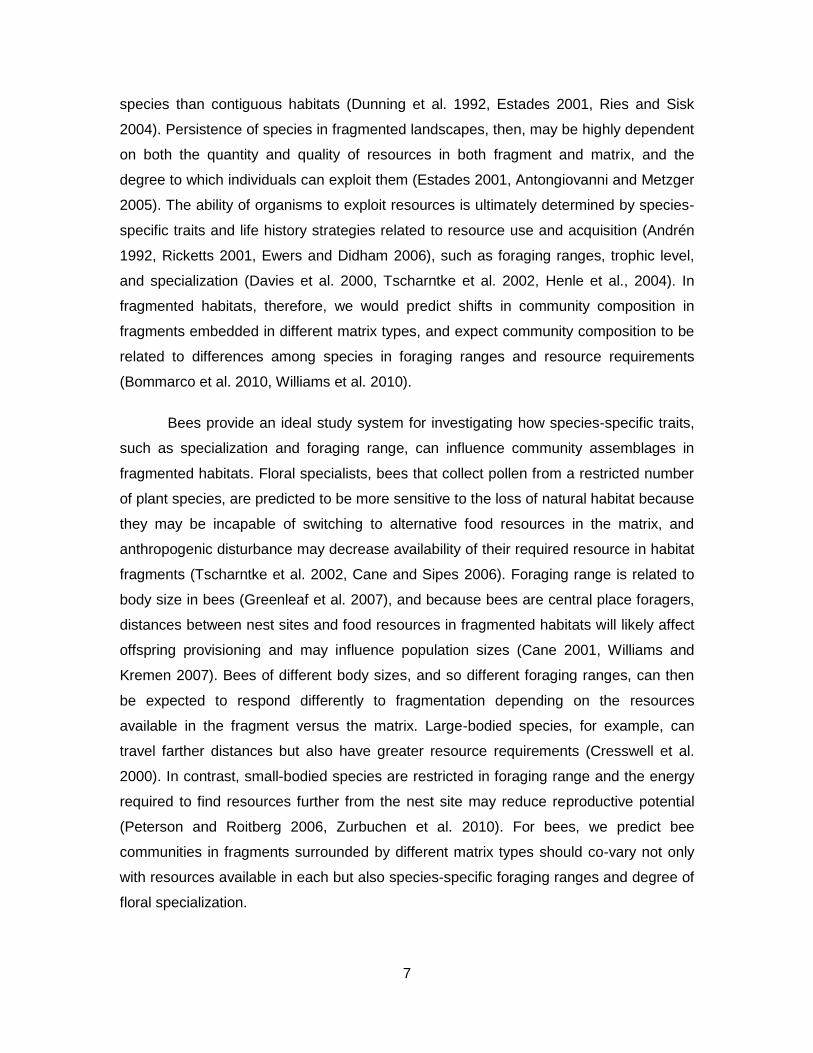
Figure 2.2. Forest-associated OS fragments (N=8) have a) larger bees than urban-associated fragments (N=11; t17=2.50, P=0.02), and b) a greater density and richness of total floral resources but reduced density and richness of introduced plants and less bare rock (Table 2.1; t17=-3.56, P=0.0024). Bars ± SE ........................................... 34
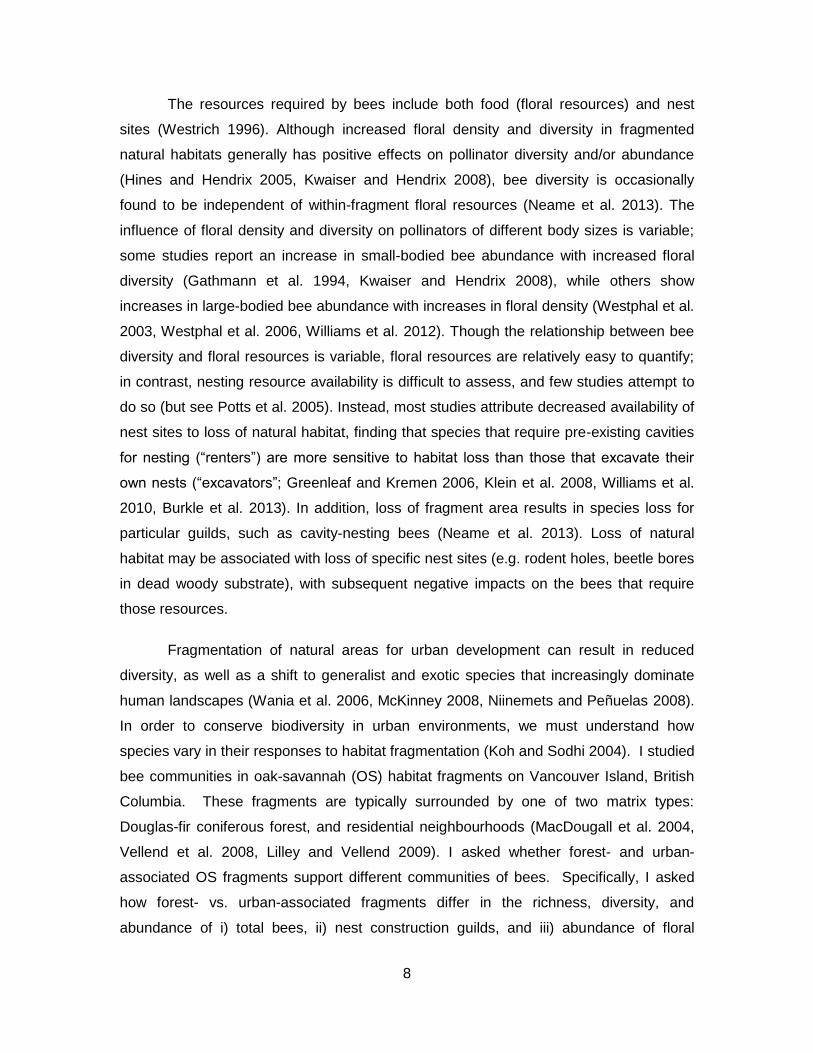
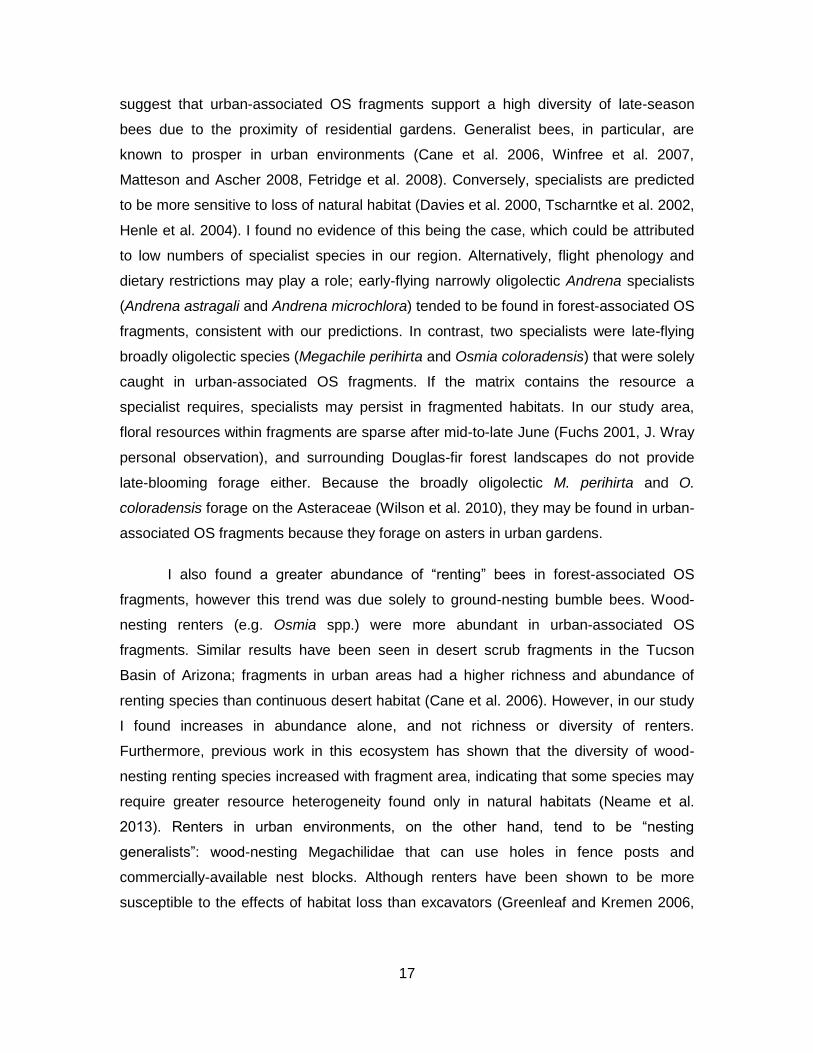
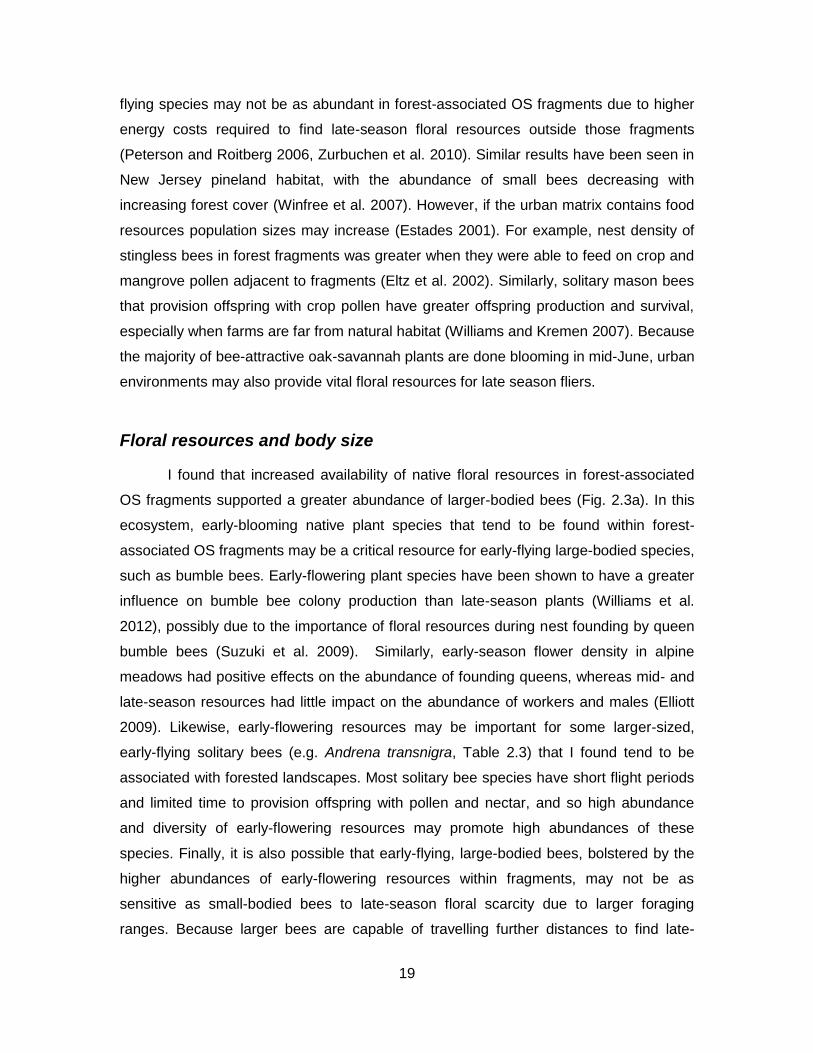
Figure 2.3. A) Body size (as measured by the weighted-mean inter-tegular distance) increases with an increase in floral richness and density and a decrease in proportional richness and density of introduced species and proportion of bare rock (PC1; Adjusted R2=0.4345, N=19) and b) bumble bee abundance within the habitat fragment increases with increasing forest cover (logit transformed) surrounding the fragment (Adjusted R2=0.4318, N=19) .......................... 35
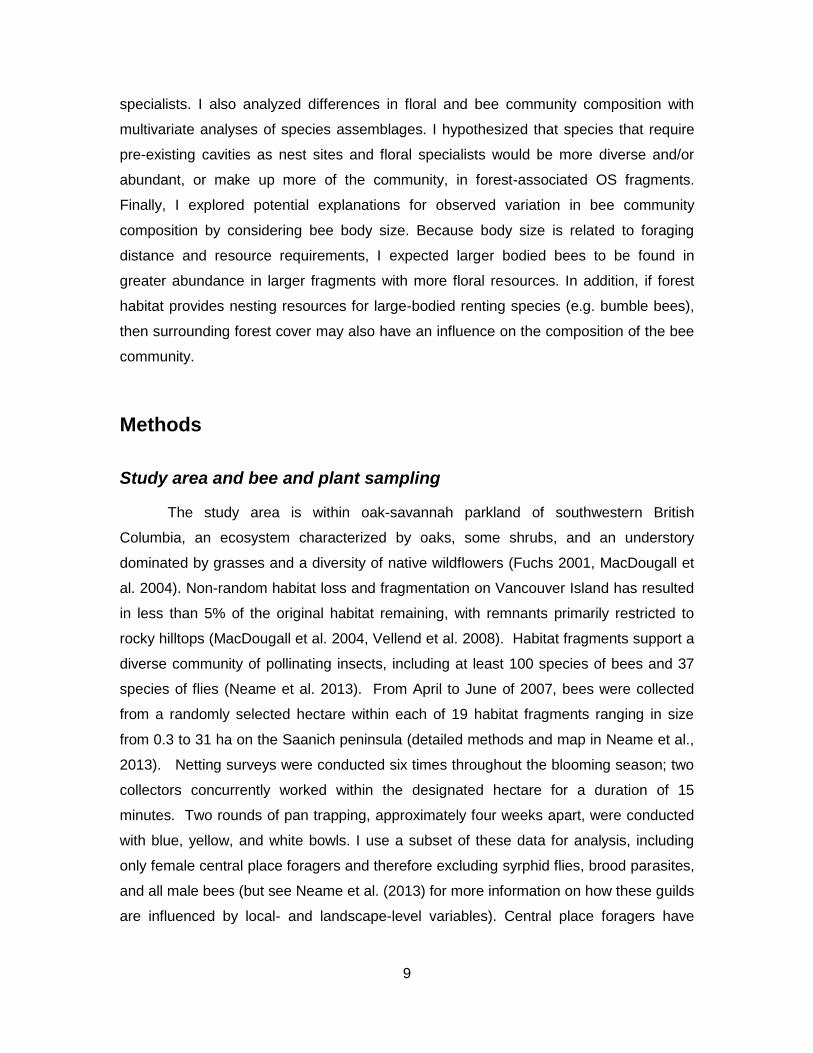
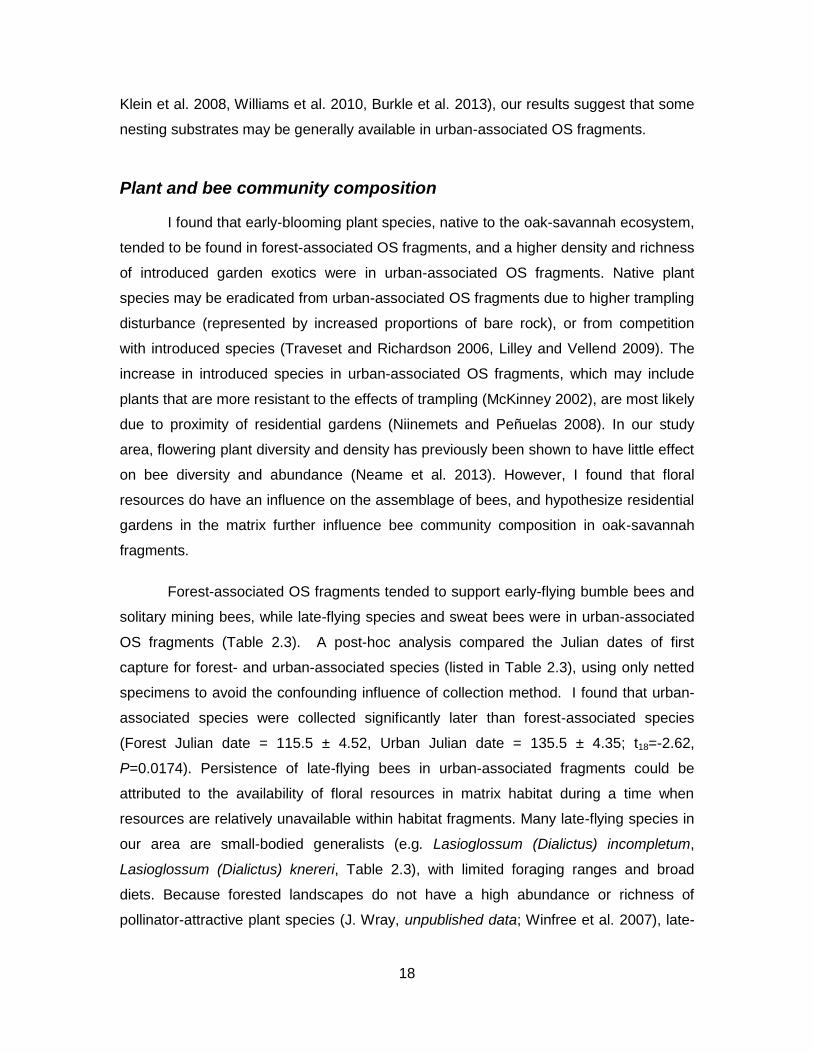
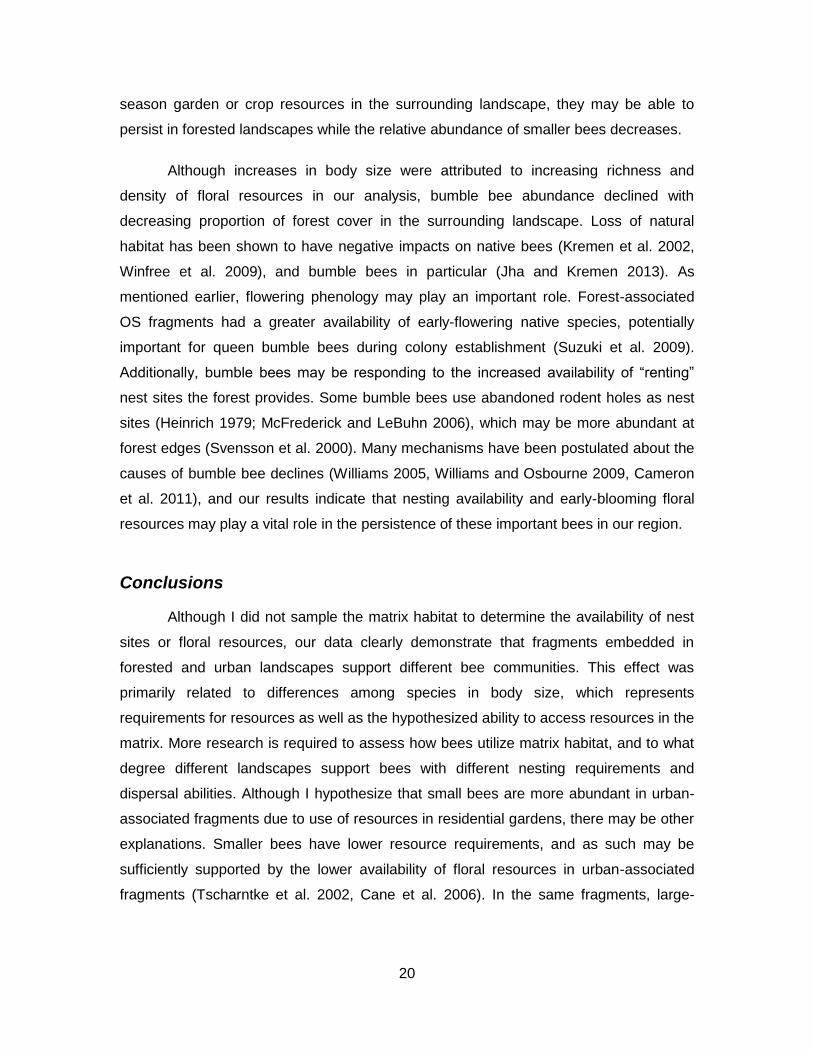
Figure 3.1. Aerial and landscape photos depicting five different habitat types included in our study: A – forest-associated oak-savannah fragment (FF), B – forest matrix (FM), C – urban-associated oak-savannah fragment (UF), D – urban matrix (UM), E – independent urban (IU) ............................................................................................... 70
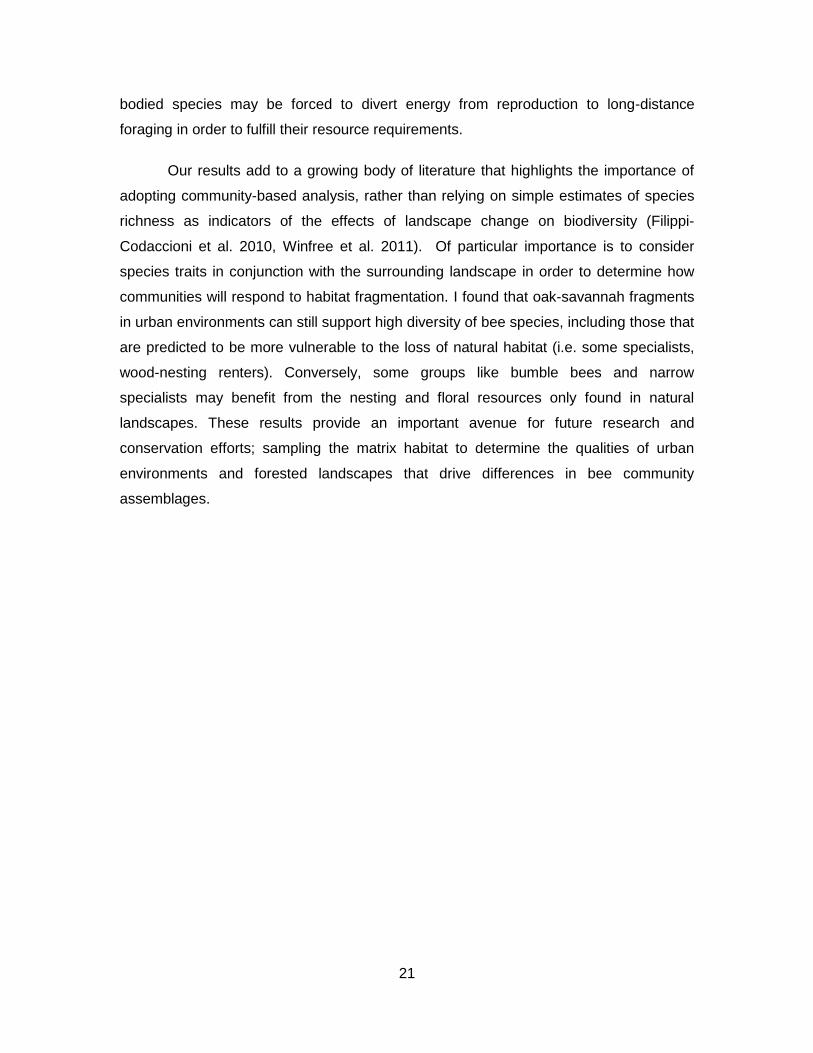
Figure 3.2. Photographs depicting typical habitat and floral resources available in a) urban- and forest-associated oak-savannah fragments, b) forest matrix, and c) urban matrix and independent urban sites ............................................................................................. 71
Figure 3.3. Map of study sites on the Saanich Peninsula, British Columbia, Canada. Sites are represented by 400-meter radii surrounding sampling location. Forest-associated OS fragments and corresponding forest matrix are coded in black/grey (respectively), urban-associated OS fragments and urban matrix in black/white (respectively), and independent urban sites are in white. Similar habitat types are represented by like colors, grey lines indicate road density ........................................................................................... 72
Figure 3.4. Effects of habitat type and sampling period on flowering plant (A, C; cube-root transformed) and pollinator (B, D; square-root transformed) abundance and richness. Bars indicate ± SE (in grey) ....................................................................................................... 73
xii
Figure 3.5. Effects of habitat type on abundance, richness, and diversity of flowering plants (A, C, E, respectively; cube-root transformed) and pollinators (B, D, F, respectively; square-root transformed) over the entire blooming season (FF = forest-associated OS fragment, FM = forest matrix, UF = urban-associated OS fragment, UM = Urban matrix, IU = independent urban). Significant differences between least square means are indicated by unique letter combinations. Bars indicate ± SE. *Differences between pollinator abundance and richness in forest- and urban-associated OS fragments approach significance (abundance: P=0.08; richness: P=0.06) .................................................................................................. 74
Figure 3.6. NMDS plot showing similarities in A) flowering plant (absolute Sorenson measure, Final stress=5.62) and B) pollinator community composition (relative Sorenson measure, Final stress=8.07) between different habitat types .......................................... 75
Figure 3.7. Redundancy analysis distance triplot showing correlations between relative female bee abundance (genera and Bombus spp.) and nesting resource variables. Angles between species and nesting resource variables represent correlations between them. Explanatory variables are depicted by bold black arrows (as defined in Table 3.1), while dashed lines represent genera/species. Abbreviations for species are: Anth-mani = Anthidium manicatum, Bomb-bifa = Bombus bifarius, Bomb-cali = B. californicus, Bomb-flav = B. flavifrons, and Bomb-vos = B. vosnesenskii. Information on nest location and construction type for different genera/species is presented in Table 3.5. ........................... 76
1
Chapter 1. Introduction
Understanding biodiversity patterns in increasingly human-dominated landscapes
is critical for maintaining our current quality of life. We depend on diverse natural
communities for clean air and water, crop pollination, pest control and other
economically important and aesthetically pleasing services (Ehrlich and Ehrlich 1992,
Daily 1997). These services, in turn, are being affected by the rapid conversion of
natural land to urban and agricultural uses (Kaye et al. 2006, Shen et al. 2008).
However, fragments of natural land and their unique species are occasionally preserved
in human landscapes. How, then, do species respond to their new surroundings?
Traditionally, ecologists have predicted that bigger is better: large fragments are
able to support increasingly diverse communities. This prediction originated from the
theory of island biogeography (MacArthur and Wilson 1967), a mathematical model that
attempts to predict species richness on oceanic islands of varying size. Islands that are
large are predicted to have higher habitat heterogeneity with a greater number of
exploitable niches. The predictor variables in the theory of island biogeography, island
size and isolation, have been extrapolated to study the effects of fragmentation in
terrestrial ecosystems (e.g. Aizen and Feinsinger 1994, Stouffer and Bierregaard 1995,
Steffan-Dewenter et al. 2000, Donaldson et al. 2002). However, terrestrial habitat
patches are not embedded in an inhospitable matrix, as true islands are (Wiens 1995).
Ecological processes in remnant habitats are affected by direct interactions with the
surrounding landscape, whereas oceanic islands do not experience the same processes
(Brotons et al. 2003).
Structural features of the surrounding landscape and biological traits can
influence how species respond to fragmentation (Antongiovanni and Metzger 2005). In
an experiment on butterfly movement in natural meadow fragments in Colorado, Ricketts
(2001) showed that the surrounding matrix and species traits can significantly influence
2
the effective isolation of habitat patches. For four out of six butterfly taxa studied,
coniferous matrix habitat was significantly more resistant to dispersal than willow matrix
habitat. Butterflies in the Argynnini taxon, however, had the greatest flight capabilities
(longest wing length) and dispersal was not restricted by any matrix habitat. In contrast,
Lycaenini had the smallest wing length and both coniferous and willow habitat equally
inhibited movement across the landscape. Although this study was not focusing on the
effects of anthropogenic fragmentation, it does indicate that responses to matrix habitat
differ even among closely related species (Ricketts 2001), and serves to demonstrate
that persistence in fragmented habitats may be determined by the quality of the matrix
habitat as well as by species characteristics (Ewers and Didham 2006).
Species’ traits that create disadvantages in fragmented habitats include having
small population size, high degrees of specialization, dependency on mutualists, large
body size, low or intermediate dispersal ability, and/or a high trophic position (Davies et
al. 2000, Tscharntke et al. 2002, Henle et al. 2004, Ewers and Didham 2006). A few of
these traits can even be represented in the same organism: large species tend to be at
higher trophic levels, with small, fluctuating populations (Lawton 1994). Small
populations have an increased risk of genetic inbreeding and are prone to random
extinctions (Pimm et al. 1988, Ellstrand and Elam 1993, Lawton 1994). In addition, large
species reproduce more slowly, require higher amounts of resources and high-ranking
trophic species are strongly dependent on lower trophic levels (Holt et al. 1999,
Tscharntke et al. 2002). Likewise, the survival of specialists and mutualists is dictated by
factors that affect their own distribution in addition to spatial processes acting on their
required resources or interacting species (Holt et al. 1999). Unlike generalists that can
switch to other resources or interact with other species that may occur in matrix habitat,
specialists are not able to use the matrix if the landscape doesn’t support the resources
or species they require. Matrix quality, therefore, is a function of the species in question,
and will be particularly important for determining persistence in fragmented habitats.
If traits can predict a species’ response to disturbance and differences in matrix
quality, we should see shifts in community or guild composition with respect to that
quality (Williams et al. 2010). Bees provide a unique system for investigating the
relationship between species traits and matrix quality, ranging in size, feeding
specialization, nesting preferences and sociality. Their sensitivity to fragmentation and
3
matrix quality should depend on these very traits (Williams et al. 2010). A recent meta-
analysis has shown that extreme habitat loss generally results in reduced bee
abundance and species richness (Winfree et al. 2009). However, moderate levels of
anthropogenic disturbance can be capable of supporting a high diversity of pollinators
(e.g. Winfree et al. 2007, Fetridge et al. 2008, Jauker et al. 2009). The goal of my thesis
is to determine how the surrounding landscape matrix influences taxonomic and
functional diversity of pollinators in remnant fragments of an endangered ecosystem,
and determine what qualities of matrix habitat promote diverse pollinator communities.
Resources in fragmented habitats and the matrix may influence species differently
depending on the resources they require to complete their life cycle, and will vary
depending on species-specific traits (e.g. body size, nesting guild, foraging specialisation
and foraging phenology).
In this thesis, I examine the influence of the surrounding landscape on plant and
pollinator communities in highly fragmented oak-savannah (OS) habitat on Vancouver
Island, British Columbia. Specifically, I investigate how pollinator communities differ
between habitat fragments surrounded by natural areas – Douglas fir coniferous forest –
and fragments surrounded by urban residential development. In Chapter 2, I focus on
female bee communities in habitat fragments, and ask how community composition in
forest- and urban-associated OS fragments is influenced by both species-specific traits
(nesting guild, specialization, and body size) and within-fragment floral resource quality.
In Chapter 3, I further explore whether differences in pollinator community composition
are due to use of the surrounding matrix habitat (forest or urban) for floral or nesting
resources. In addition, I ask whether the assemblage of pollinators in oak-savannah
habitat is unique to that ecosystem, relative to urban areas independent of any oak-
savannah habitat. This thesis gives insight not only to characteristics of species that are
vulnerable to the effects of fragmentation and habitat loss, but also to qualities of urban
and natural environments that promote diverse and abundant assemblages of
pollinators.
4
References
Aizen, M. A., and P. Feinsinger. 1994. Habitat fragmentation, native insect pollinators, and feral honey bees in Argentine “Chaco Serrano”. Ecological Applications 4:378–392.
Antongiovanni, M., and J. Metzger. 2005. Influence of matrix habitats on the occurrence of insectivorous bird species in Amazonian forest fragments. Biological Conservation 122:441–451.
Brotons, L., M. Mönkkönen, and J. L. Martin. 2003. Are fragments islands? Landscape context and density-area relationships in boreal forest birds. The American Naturalist 162:343–357.
Daily, G. C. 1997. Nature’s Services: Societal Dependence on Natural Ecosystems. . Island Press, Washington, D. C., USA.
Davies, K. F., C. R. Margules, and J. F. Lawrence. 2000. Which traits of species predict population declines in experimental forest fragments? Ecology 81:1450–1461.
Donaldson, J., I. Nänni, C. Zachariades, and J. Kemper. 2002. Effects of habitat fragmentation on pollinator diversity and plant reproductive success in renosterveld shrublands of South Africa. Conservation Biology 16:1267–1276.
Ehrlich, P. R., and A. H. Ehrlich. 1992. The value of biodiversity. Ambio 21:219–226.
Ellstrand, N. C., and D. R. Elam. 1993. Population genetic consequences of small population size: Implications for plant conservation. Annual Review of Ecology and Systematics 24:217–242.
Ewers, R. M., and R. K. Didham. 2006. Confounding factors in the detection of species responses to habitat fragmentation. Biological Reviews of the Cambridge Philosophical Society 81:117–142.
Fetridge, E. D., J. S. Ascher, and G. A. Langellotto. 2008. The bee fauna of residential gardens in a suburb of New York City (Hymenoptera: Apoidea). Annals of the Entomological Society of America 101:1067–1077.
Henle, K., K. F. Davies, M. Kleyer, C. Margules, and J. Settele. 2004. Predictors of species sensitivity to fragmentation. Biodiversity and Conservation 13:207–251.
Holt, R. D., J. H. Lawton, G. A. Polis, and N. D. Martinez. 1999. Trophic rank and the species-area relationship. Ecology 80:1495–1504.
Jauker, F., T. Diekötter, F. Schwarzbach, and V. Wolters. 2009. Pollinator dispersal in an agricultural matrix: opposing responses of wild bees and hoverflies to landscape structure and distance from main habitat. Landscape Ecology 24:547–555.
Kaye, J. P., P. M. Groffman, N. B. Grimm, L. a Baker, and R. V Pouyat. 2006. A distinct urban biogeochemistry? Trends in Ecology & Evolution 21:192–199.
5
Lawton, J. H. 1994. Population dynamic principles. Philosophical Transactions of the Royal Society B: Biological Sciences 344:61–68.
MacArthur, R. H., and E. O. Wilson. 1967. The Theory of Island Biogeography. . Princeton University Press, Princeton, New Jersey, USA.
Pimm, S. L., H. Jones, and J. Diamond. 1988. On the risk of extinction. The American Naturalist 132:757–785.
Ricketts, T. H. 2001. The matrix matters: effective isolation in fragmented landscapes. The American Naturalist 158:87–99.
Shen, W., J. Wu, N. B. Grimm, and D. Hope. 2008. Effects of urbanization-induced environmental changes on ecosystem functioning in the Phoenix Metropolitan Region, USA. Ecosystems 11:138–155.
Steffan-Dewenter, I., and T. Tscharntke. 1999. Effects of habitat isolation on pollinator communities and seed set. Oecologia 121:432–440.
Stouffer, P. C., and R. O. Bierregaard. 1995. Effects of forest fragmentation on understory hummingbirds in Amazonian Brazil. Conservation Biology 9:1085–1094.
Tscharntke, T., I. Steffan-Dewenter, A. Kruess, and C. Thies. 2002. Characteristics of insect populations on habitat fragments: A mini review. Ecological Research 17:229–239.
Wiens, J. A. 1995. Habitat fragmentation: island v landscape perspectives on bird conservation. IBIS 137:S97–S104.
Williams, N. M., E. E. Crone, T. H. Roulston, R. L. Minckley, L. Packer, and S. G. Potts. 2010. Ecological and life-history traits predict bee species responses to environmental disturbances. Biological Conservation 143:2280–2291.
Winfree, R., R. Aguilar, D. P. Vázquez, G. LeBuhn, and M. A. Aizen. 2009. A meta-analysis of bees’ responses to anthropogenic disturbance. Ecology 90:2068–2076.
Winfree, R., T. Griswold, and C. Kremen. 2007. Effect of human disturbance on bee communities in a forested ecosystem. Conservation Biology 21:213–223.
6
Chapter 2. Floral resources, surrounding landscape, and body size influence bee community assemblages in oak-savannah fragments
1
Introduction
Fragmentation of natural habitats due to urban expansion is occurring at a rapid
rate. Although some efforts are made to preserve natural landscapes in urban
environments, reserves in urban areas are often not comparable in quality to wild areas,
and this may impact biodiversity (Lindenmayer and Fischer 2006). Traditionally,
biodiversity in habitat fragments has been examined using the theory of island
biogeography, predicting that large island-like fragments should support more species
than smaller islands (MacArthur and Wilson 1967). Although the theory has been
influential in examining patterns of species richness on oceanic islands, terrestrial
habitat patches are not embedded in a truly inhospitable matrix (Wiens 1995;
Lindenmayer and Fischer 2006, Prugh et al. 2008, Collinge 2009). Species survival in
terrestrial fragments depends on how species interact with their new surroundings,
including the quality of the surrounding matrix habitat in addition to fragment habitat
quality (Debinski and Holt 2000, Fahrig 2001, Vandermeer and Carvajal 2001).
Considering the matrix (the landscape within which habitat fragments are embedded)
may be especially important in urban environments, as these environments can differ
substantially from the natural condition.
If the matrix provides supplementary or complementary resources for an
organism, fragmented habitats can potentially support higher richness and abundance of
1 This paper is currently in press: Wray, J. C., L. A. Neame, and E. Elle. In press at Ecological
Entomology. doi: 10.1111/een.12070
7
species than contiguous habitats (Dunning et al. 1992, Estades 2001, Ries and Sisk
2004). Persistence of species in fragmented landscapes, then, may be highly dependent
on both the quantity and quality of resources in both fragment and matrix, and the
degree to which individuals can exploit them (Estades 2001, Antongiovanni and Metzger
2005). The ability of organisms to exploit resources is ultimately determined by species-
specific traits and life history strategies related to resource use and acquisition (Andrén
1992, Ricketts 2001, Ewers and Didham 2006), such as foraging ranges, trophic level,
and specialization (Davies et al. 2000, Tscharntke et al. 2002, Henle et al., 2004). In
fragmented habitats, therefore, we would predict shifts in community composition in
fragments embedded in different matrix types, and expect community composition to be
related to differences among species in foraging ranges and resource requirements
(Bommarco et al. 2010, Williams et al. 2010).
Bees provide an ideal study system for investigating how species-specific traits,
such as specialization and foraging range, can influence community assemblages in
fragmented habitats. Floral specialists, bees that collect pollen from a restricted number
of plant species, are predicted to be more sensitive to the loss of natural habitat because
they may be incapable of switching to alternative food resources in the matrix, and
anthropogenic disturbance may decrease availability of their required resource in habitat
fragments (Tscharntke et al. 2002, Cane and Sipes 2006). Foraging range is related to
body size in bees (Greenleaf et al. 2007), and because bees are central place foragers,
distances between nest sites and food resources in fragmented habitats will likely affect
offspring provisioning and may influence population sizes (Cane 2001, Williams and
Kremen 2007). Bees of different body sizes, and so different foraging ranges, can then
be expected to respond differently to fragmentation depending on the resources
available in the fragment versus the matrix. Large-bodied species, for example, can
travel farther distances but also have greater resource requirements (Cresswell et al.
2000). In contrast, small-bodied species are restricted in foraging range and the energy
required to find resources further from the nest site may reduce reproductive potential
(Peterson and Roitberg 2006, Zurbuchen et al. 2010). For bees, we predict bee
communities in fragments surrounded by different matrix types should co-vary not only
with resources available in each but also species-specific foraging ranges and degree of
floral specialization.
8
The resources required by bees include both food (floral resources) and nest
sites (Westrich 1996). Although increased floral density and diversity in fragmented
natural habitats generally has positive effects on pollinator diversity and/or abundance
(Hines and Hendrix 2005, Kwaiser and Hendrix 2008), bee diversity is occasionally
found to be independent of within-fragment floral resources (Neame et al. 2013). The
influence of floral density and diversity on pollinators of different body sizes is variable;
some studies report an increase in small-bodied bee abundance with increased floral
diversity (Gathmann et al. 1994, Kwaiser and Hendrix 2008), while others show
increases in large-bodied bee abundance with increases in floral density (Westphal et al.
2003, Westphal et al. 2006, Williams et al. 2012). Though the relationship between bee
diversity and floral resources is variable, floral resources are relatively easy to quantify;
in contrast, nesting resource availability is difficult to assess, and few studies attempt to
do so (but see Potts et al. 2005). Instead, most studies attribute decreased availability of
nest sites to loss of natural habitat, finding that species that require pre-existing cavities
for nesting (“renters”) are more sensitive to habitat loss than those that excavate their
own nests (“excavators”; Greenleaf and Kremen 2006, Klein et al. 2008, Williams et al.
2010, Burkle et al. 2013). In addition, loss of fragment area results in species loss for
particular guilds, such as cavity-nesting bees (Neame et al. 2013). Loss of natural
habitat may be associated with loss of specific nest sites (e.g. rodent holes, beetle bores
in dead woody substrate), with subsequent negative impacts on the bees that require
those resources.
Fragmentation of natural areas for urban development can result in reduced
diversity, as well as a shift to generalist and exotic species that increasingly dominate
human landscapes (Wania et al. 2006, McKinney 2008, Niinemets and Peñuelas 2008).
In order to conserve biodiversity in urban environments, we must understand how
species vary in their responses to habitat fragmentation (Koh and Sodhi 2004). I studied
bee communities in oak-savannah (OS) habitat fragments on Vancouver Island, British
Columbia. These fragments are typically surrounded by one of two matrix types:
Douglas-fir coniferous forest, and residential neighbourhoods (MacDougall et al. 2004,
Vellend et al. 2008, Lilley and Vellend 2009). I asked whether forest- and urban-
associated OS fragments support different communities of bees. Specifically, I asked
how forest- vs. urban-associated fragments differ in the richness, diversity, and
abundance of i) total bees, ii) nest construction guilds, and iii) abundance of floral
9
specialists. I also analyzed differences in floral and bee community composition with
multivariate analyses of species assemblages. I hypothesized that species that require
pre-existing cavities as nest sites and floral specialists would be more diverse and/or
abundant, or make up more of the community, in forest-associated OS fragments.
Finally, I explored potential explanations for observed variation in bee community
composition by considering bee body size. Because body size is related to foraging
distance and resource requirements, I expected larger bodied bees to be found in
greater abundance in larger fragments with more floral resources. In addition, if forest
habitat provides nesting resources for large-bodied renting species (e.g. bumble bees),
then surrounding forest cover may also have an influence on the composition of the bee
community.
Methods
Study area and bee and plant sampling
The study area is within oak-savannah parkland of southwestern British
Columbia, an ecosystem characterized by oaks, some shrubs, and an understory
dominated by grasses and a diversity of native wildflowers (Fuchs 2001, MacDougall et
al. 2004). Non-random habitat loss and fragmentation on Vancouver Island has resulted
in less than 5% of the original habitat remaining, with remnants primarily restricted to
rocky hilltops (MacDougall et al. 2004, Vellend et al. 2008). Habitat fragments support a
diverse community of pollinating insects, including at least 100 species of bees and 37
species of flies (Neame et al. 2013). From April to June of 2007, bees were collected
from a randomly selected hectare within each of 19 habitat fragments ranging in size
from 0.3 to 31 ha on the Saanich peninsula (detailed methods and map in Neame et al.,
2013). Netting surveys were conducted six times throughout the blooming season; two
collectors concurrently worked within the designated hectare for a duration of 15
minutes. Two rounds of pan trapping, approximately four weeks apart, were conducted
with blue, yellow, and white bowls. I use a subset of these data for analysis, including
only female central place foragers and therefore excluding syrphid flies, brood parasites,
and all male bees (but see Neame et al. (2013) for more information on how these guilds
are influenced by local- and landscape-level variables). Central place foragers have

10
fixed nest sites and focus their foraging to minimize travel back and forth, while other
ecological groups are not expected to respond to the landscape in the same way
(Kremen et al. 2007). I therefore also excluded the managed honey bee (Apis mellifera)
from analysis, as this species is expected to respond to management and the location of
hives rather than the landscape.
Floral resources were sampled twice in 2007, using 25 random 1-m2 quadrats at
each site. Neame et al. (2013) counted the number of flowering stems by species
(excluding wind-pollinated species like grasses) and estimated the proportion of bare
rock. Although estimating pollen and nectar resources for each plant species would
provide a more accurate estimate of resources available to pollinators, it was not
feasible for the 65 plant species in this study. I interpret rockiness within a site as the
amount of trampling disturbance, which may eradicate some early-blooming native plant
species and decrease availability of pre-existing cavities in mossy substrates. For
analysis I considered whether plant species were native or introduced, using “Plants of
Coastal British Columbia” (Pojar and MacKinnon 1994) to assign species to the two
categories.
Landscape characterization
I used ArcGIS 10.0 (ESRI 2011) and a combination of ground-truthing and high
resolution aerial photographs from the Capitol Regional District Natural Areas Atlas (10-
cm resolution, © 2010-2012 Capital Regional District) to delineate polygons of
coniferous and mixed forest cover in 400-meter buffers surrounding each study site. I
chose a 400-meter buffer based on our calculation of the average typical foraging
distance of all central place foragers included in our analysis. The foraging range of each
species was calculated from Greenleaf et al. (2007), and is based on the inter-tegular
distance of bees (see next section). Previous studies have found that the effects of the
surrounding landscape on solitary wild bees are strongest at a radius of 250-meters
(Steffan-Dewenter et al. 2002, Steffan-Dewenter 2003), and similarly sized buffers are
commonly used in research on bee communities (e.g. Brosi et al. 2008, Jauker et al.
2009). The proportion of forest cover in the surrounding landscape ranged from 0 to 62
percent, and I used a natural break in the values to separate oak-savannah sites into
predominantly forest- (>24% forest) or urban-associated (<12%). Urban-associated sites
11
were embedded in a matrix of urban and suburban development within the Victoria
Census Metropolitan Area (Victoria CMA, population 344 615, density 495.0 per square
kilometer; Statistics Canada 2012). Fragment area was previously calculated using the
same high-resolution aerial images and ArcGIS 9.2 (ESRI 2009, Neame et al. 2013).
Species-specific traits of bees
I compiled information on nest construction guild for all species from a
combination of reference works (e.g. Michener 2000) and published keys (e.g. Gibbs
2010). If published data were unavailable, we inferred trait data based on phylogeny
(e.g. all species of Andrena excavate nests; Michener 2000). We categorized nest
construction type as renting or excavating. Renters included species that construct nests
within existing holes or cavities, while excavators dig or bore the nest within existing
substrate (Williams et al. 2010).
Bee species were categorized as oligolectic or polylectic based on documented
feeding preferences or using data on visit patterns from this ecosystem (G. Gielens, J.
Wray, and E. Elle unpublished data). Species were defined as oligolectic if they collect
pollen from one to a few genera within a single plant family (Cane and Sipes 2006).
For estimates of body size I measured the inter-tegular distance for each
species. Inter-tegular distance correlates strongly with other measures of body size and
is an accurate predictor of foraging range (Greenleaf et al. 2007). I measured 10 females
per species (20 for Bombus to account for greater within-species variation) using digital
callipers and a dissecting microscope. For five out of the total 75 species fewer
specimens from our reference collection were available, so a range of 2-7 bees were
measured. I only include Bombus workers in analysis, not queens. I used the mean
inter-tegular distance for each species to calculate a “weighted-mean inter-tegular
distance” for each site with the following equation:
*
1
( )i
t
ni
i
IT N
N
12
Where ITi is the mean inter-tegular distance of species i, Ni is the number of
individuals of species i caught at a site, and Nt is the total abundance of individuals
caught at a site.
Statistical analysis
All analyses were conducted in SAS (SAS/STAT® 9.3; SAS Institute 2011)
unless indicated otherwise.
Species richness, diversity, and abundance
To determine if different nesting guilds are more abundant or diverse in forest-
vs. urban-associated oak-savannah fragments, we tested for differences between site
types in species richness, Simpson’s diversity, and abundance of i) all bees, ii)
excavators, and iii) renters using two sample t-tests. Simpson’s diversity was calculated
as D= 1/ [ ∑ (ni/Nt)2], where ni is the number of individuals of species i caught at a site
and Nt is the total number of individuals at a site. Because I only collected five species of
specialists, I tested for differences in specialization between the communities of urban-
and forest-associated OS fragments with measures of abundance of specialists, not
richness or diversity.
Plant and bee community composition
I used non-metric multi-dimensional scaling (NMS; PC-ORD v. 5.0; McCune and
Mefford 2005) to describe community composition. NMS calculates dissimilarities in
species composition between sites to allow a graphical representation of differences
among site types (McCune and Grace 2002, Quinn and Keough 2002). I used the Bray-
Curtis measure of ecological distance, comparing absolute species’ abundances among
sites. To enhance the detection of relationships between community composition and
habitat type, I removed all bee and plant species for which only a single individual was
recorded (McCune and Grace 2002), resulting in the analysis of 60 bee and 55 plant
species. Floral abundance data (number of stems) was log-transformed to reduce stress
in the final configuration. To interpret the resulting NMS figure, I correlated species’
abundances with ordination axis scores to determine if certain species were associated
with different axes, and hence different matrix types (forest vs. urban; Quinn and Keough
2002).
13
I used a non-parametric multivariate analysis of variance (NPMANOVA) in R (R
2.15.3, R Core Team ©2013) to determine if plant and bee community compositions in
habitat fragments were significantly different between the two matrix types (vegan
tutorial; Oksanen 2011). NPMANOVA follows the framework of ANOVA, applying the
partitioning of sums-of squares (SS) and variances directly to dissimilarity measures,
such as the Bray-Curtis measure I use in this paper (Quinn and Keough 2002). F-ratios
are constructed from the sums of squared distances within and between groups (in our
case, our two matrix types), and the test computes permutations of the observations to
obtain a distribution of the test statistic under the null hypothesis of no differences
between groups (Anderson 2001). I used 5000 permutations, recommended for tests
with an alpha-level of 0.01 (Manly 1997).
NPMANOVA allows us to test if there is a significant difference in species
composition between groups, however it is also sensitive to dispersion of points (or
variability in species’ assemblages within a group). To determine if significant results
from the NPMANOVA were due to actual group dissimilarities, rather than within-group
variability, I also used the betadisper function in R to examine the differences in group
homogeneities (vegan tutorial; Oksanen 2011). This test is a multivariate analogue to
Levene’s test of homogeneity of variances, where deviations from a group mean are
represented by Bray-Curtis distances of sites within a group to their group centroid
(Anderson 2006).
Floral resources and body size
I assessed whether bee body size (the weighted-mean inter-tegular distance)
differed between forest- and urban-associated OS fragments using two sample t-tests.
To assess whether detected differences were associated with variation in floral
resources, fragment area, or forest cover in the surrounding landscape I performed a
series of analyses. To produce a single variable describing floral resource availability at
each site, I used principal component analysis (PCA) on the five variables associated
with floral resource availability (total richness, total density, proportion of bare rock,
proportional richness of introduced species and proportional density of introduced
species). Proportion data were transformed using a logistic transformation,
recommended for proportion data for improved interpretability (Warton and Hui 2011).
The first principal component differentiated among sites with a high density and richness
14
of flowering plants (low values of PC1) and those with a high proportion of bare rock and
high richness and density of introduced species (high values of PC1). PC1 accounted
for 56.9% of the variation in the data (Table 2.1). I used a two sample t-test to compare
floral resource availability (PC1) between forest- and urban-associated sites.
To investigate the role of local and landscape variables on weighted-mean inter-
tegular distance (weighted-mean IT) I ran a series of regressions including all possible
combinations of predictor variables. I used Akaike’s Information Criterion corrected for
small sample sizes (AICc) in R (R 2.15.3, R Core Team ©2013) and Akaike weights (wi)
to compare and evaluate the predictive strength of all possible regression models.
Predictor variables included PC1, fragment area, and proportion forest cover in a 400-
meter radius. I also included bumble bee abundance in these regressions to determine if
overall increases in weighted-mean IT could be attributed to a greater abundance of
these large-bodied bees, the largest in our dataset. Proportion data and fragment area
were transformed using logistic and log transformations, respectively. I examined
variance inflation factors to address multi-collinearity between independent variables,
however found that all variables met the required assumptions (VIF<4; Quinn and
Keough 2002). If more than one model was strongly supported (i.e. delta AICc = 0-2;
Burham and Anderson 2002) I examined the relative importance of each predictor
variable by calculating the sum of the Akaike weights over all the models in which the
predictor variable of interest occurred (MuMIn package; Bartoń 2013). To further explore
variation in bumble bee abundance among sites, I performed a multiple linear regression
including the following predictor variables: PC1, fragment area, and forest cover. As
above, I used AICc to compare models.
Results
Species richness, diversity, and abundance
Surveys collected a total of 2770 female bee central place foragers, with a total
of 75 species from 11 genera. There were no differences in species richness,
abundance, or abundance of specialists between forest- and urban-associated OS
fragments (Table 2.2). Simpson’s diversity, however, was higher in urban-associated OS
fragments, while forest-associated OS fragments tended to support a higher abundance
15
of bees in the “renting” nesting guild (Table 2.2). The “renting” guild includes both wood-
nesting bees such as Osmia and Anthidium and above- and below-ground nesting
bumble bees (Bombus spp.), and post-hoc analysis indicated that increased abundance
of renters in forest-associated OS fragments was due solely to increased numbers of
bumble bees. Wood-nesting renters were actually more abundant in urban-associated
OS fragments (Forest = 10.75 ± 1.89, Urban = 18.82 ± 2.07, t17=-2.77, P=0.013), while
bumble bee renters were more abundant in forest-associated fragments (Forest = 61.38
± 9.17, Urban = 24.55 ± 2.12, t17=4.53, P=0.0003).
Plant and bee community composition
I found significant differences in plant and bee community compositions between
forest- and urban-associated OS fragments (plants: Final stress=10.75, instability=0.00,
F1,18=3.50, P<0.001; bees: Final stress=8.98, instability=0.00, F1,18=4.65 P<0.001).
These differences were not due to within-group variability, as differences in dispersion
were not significant (plants: F1,18=1.27, P=0.27, bees: F1,18=0.41, P=0.53). Correlations
between abundances and ordination axis scores demonstrated that bees in forest-
associated OS fragments (Fig. 2.1) included early-flying, large-bodied bumble bees
(Bombus spp.) and mining bees (Andrena spp.), as well as some uncommon species of
mason bees (Osmia spp., Table 2.3). Urban-associated species, on the other hand,
were represented by late-flying or small-bodied sweat bees (Agapostemon,
Lasioglossum (Dialictus), Halictus spp.), as well as commonly observed species of
mason bees (e.g. Osmia odontogaster, Table 2.3). Differences in plant communities
were reflected primarily in plant origin: early-blooming plants native to the oak-savannah
system tended to be associated with fragments surrounded by forest (e.g. Collinsia
parviflora, Plectritis congesta, Dodecatheon hendersonii), while introduced garden
exotics (e.g. Hyacinthoides, Lamium purpureum) were more prevalent in urban-
associated OS fragments (Table 2.3).
Floral resources and body size
Overall body size, measured by the weighted mean inter-tegular distance, was
larger in forest- compared to urban-associated OS fragments (t17=2.50, P=0.02; Fig.
2.2a). I also found lower values of PC1 (Table 2.1) in forest- compared to urban-
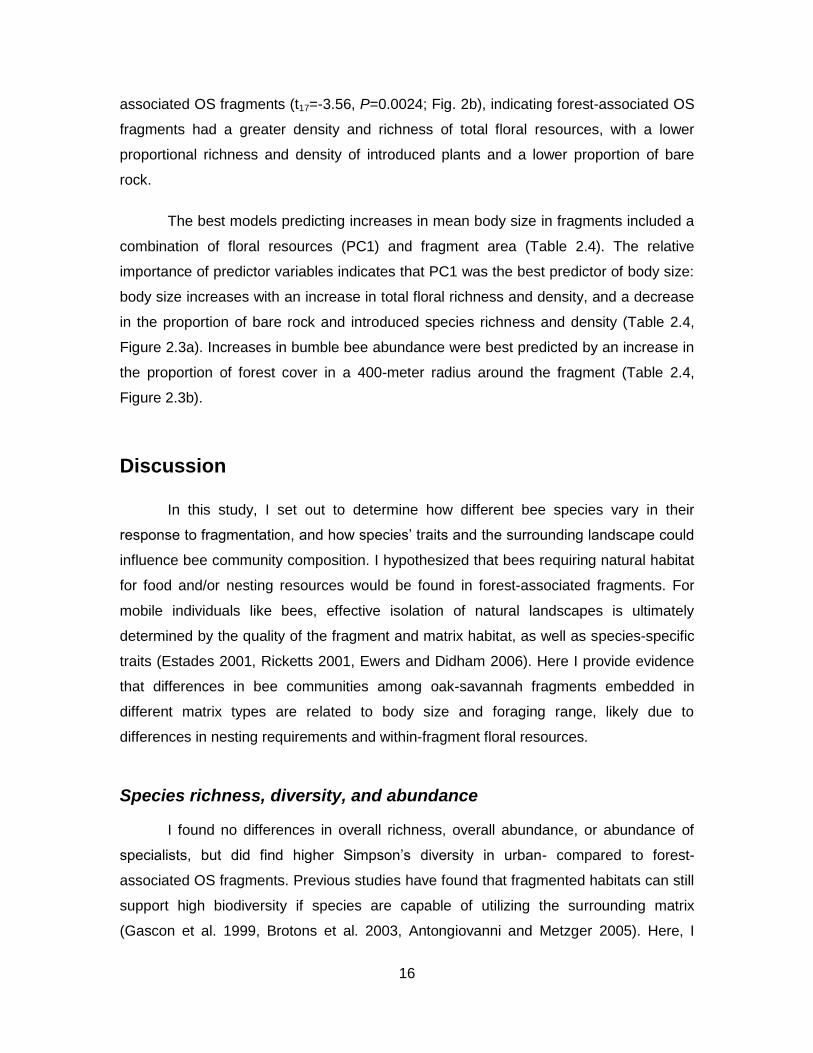
16
associated OS fragments (t17=-3.56, P=0.0024; Fig. 2b), indicating forest-associated OS
fragments had a greater density and richness of total floral resources, with a lower
proportional richness and density of introduced plants and a lower proportion of bare
rock.
The best models predicting increases in mean body size in fragments included a
combination of floral resources (PC1) and fragment area (Table 2.4). The relative
importance of predictor variables indicates that PC1 was the best predictor of body size:
body size increases with an increase in total floral richness and density, and a decrease
in the proportion of bare rock and introduced species richness and density (Table 2.4,
Figure 2.3a). Increases in bumble bee abundance were best predicted by an increase in
the proportion of forest cover in a 400-meter radius around the fragment (Table 2.4,
Figure 2.3b).
Discussion
In this study, I set out to determine how different bee species vary in their
response to fragmentation, and how species’ traits and the surrounding landscape could
influence bee community composition. I hypothesized that bees requiring natural habitat
for food and/or nesting resources would be found in forest-associated fragments. For
mobile individuals like bees, effective isolation of natural landscapes is ultimately
determined by the quality of the fragment and matrix habitat, as well as species-specific
traits (Estades 2001, Ricketts 2001, Ewers and Didham 2006). Here I provide evidence
that differences in bee communities among oak-savannah fragments embedded in
different matrix types are related to body size and foraging range, likely due to
differences in nesting requirements and within-fragment floral resources.
Species richness, diversity, and abundance
I found no differences in overall richness, overall abundance, or abundance of
specialists, but did find higher Simpson’s diversity in urban- compared to forest-
associated OS fragments. Previous studies have found that fragmented habitats can still
support high biodiversity if species are capable of utilizing the surrounding matrix
(Gascon et al. 1999, Brotons et al. 2003, Antongiovanni and Metzger 2005). Here, I
17
suggest that urban-associated OS fragments support a high diversity of late-season
bees due to the proximity of residential gardens. Generalist bees, in particular, are
known to prosper in urban environments (Cane et al. 2006, Winfree et al. 2007,
Matteson and Ascher 2008, Fetridge et al. 2008). Conversely, specialists are predicted
to be more sensitive to loss of natural habitat (Davies et al. 2000, Tscharntke et al. 2002,
Henle et al. 2004). I found no evidence of this being the case, which could be attributed
to low numbers of specialist species in our region. Alternatively, flight phenology and
dietary restrictions may play a role; early-flying narrowly oligolectic Andrena specialists
(Andrena astragali and Andrena microchlora) tended to be found in forest-associated OS
fragments, consistent with our predictions. In contrast, two specialists were late-flying
broadly oligolectic species (Megachile perihirta and Osmia coloradensis) that were solely
caught in urban-associated OS fragments. If the matrix contains the resource a
specialist requires, specialists may persist in fragmented habitats. In our study area,
floral resources within fragments are sparse after mid-to-late June (Fuchs 2001, J. Wray
personal observation), and surrounding Douglas-fir forest landscapes do not provide
late-blooming forage either. Because the broadly oligolectic M. perihirta and O.
coloradensis forage on the Asteraceae (Wilson et al. 2010), they may be found in urban-
associated OS fragments because they forage on asters in urban gardens.
I also found a greater abundance of “renting” bees in forest-associated OS
fragments, however this trend was due solely to ground-nesting bumble bees. Wood-
nesting renters (e.g. Osmia spp.) were more abundant in urban-associated OS
fragments. Similar results have been seen in desert scrub fragments in the Tucson
Basin of Arizona; fragments in urban areas had a higher richness and abundance of
renting species than continuous desert habitat (Cane et al. 2006). However, in our study
I found increases in abundance alone, and not richness or diversity of renters.
Furthermore, previous work in this ecosystem has shown that the diversity of wood-
nesting renting species increased with fragment area, indicating that some species may
require greater resource heterogeneity found only in natural habitats (Neame et al.
2013). Renters in urban environments, on the other hand, tend to be “nesting
generalists”: wood-nesting Megachilidae that can use holes in fence posts and
commercially-available nest blocks. Although renters have been shown to be more
susceptible to the effects of habitat loss than excavators (Greenleaf and Kremen 2006,
18
Klein et al. 2008, Williams et al. 2010, Burkle et al. 2013), our results suggest that some
nesting substrates may be generally available in urban-associated OS fragments.
Plant and bee community composition
I found that early-blooming plant species, native to the oak-savannah ecosystem,
tended to be found in forest-associated OS fragments, and a higher density and richness
of introduced garden exotics were in urban-associated OS fragments. Native plant
species may be eradicated from urban-associated OS fragments due to higher trampling
disturbance (represented by increased proportions of bare rock), or from competition
with introduced species (Traveset and Richardson 2006, Lilley and Vellend 2009). The
increase in introduced species in urban-associated OS fragments, which may include
plants that are more resistant to the effects of trampling (McKinney 2002), are most likely
due to proximity of residential gardens (Niinemets and Peñuelas 2008). In our study
area, flowering plant diversity and density has previously been shown to have little effect
on bee diversity and abundance (Neame et al. 2013). However, I found that floral
resources do have an influence on the assemblage of bees, and hypothesize residential
gardens in the matrix further influence bee community composition in oak-savannah
fragments.
Forest-associated OS fragments tended to support early-flying bumble bees and
solitary mining bees, while late-flying species and sweat bees were in urban-associated
OS fragments (Table 2.3). A post-hoc analysis compared the Julian dates of first
capture for forest- and urban-associated species (listed in Table 2.3), using only netted
specimens to avoid the confounding influence of collection method. I found that urban-
associated species were collected significantly later than forest-associated species
(Forest Julian date = 115.5 ± 4.52, Urban Julian date = 135.5 ± 4.35; t18=-2.62,
P=0.0174). Persistence of late-flying bees in urban-associated fragments could be
attributed to the availability of floral resources in matrix habitat during a time when
resources are relatively unavailable within habitat fragments. Many late-flying species in
our area are small-bodied generalists (e.g. Lasioglossum (Dialictus) incompletum,
Lasioglossum (Dialictus) knereri, Table 2.3), with limited foraging ranges and broad
diets. Because forested landscapes do not have a high abundance or richness of
pollinator-attractive plant species (J. Wray, unpublished data; Winfree et al. 2007), late-
19
flying species may not be as abundant in forest-associated OS fragments due to higher
energy costs required to find late-season floral resources outside those fragments
(Peterson and Roitberg 2006, Zurbuchen et al. 2010). Similar results have been seen in
New Jersey pineland habitat, with the abundance of small bees decreasing with
increasing forest cover (Winfree et al. 2007). However, if the urban matrix contains food
resources population sizes may increase (Estades 2001). For example, nest density of
stingless bees in forest fragments was greater when they were able to feed on crop and
mangrove pollen adjacent to fragments (Eltz et al. 2002). Similarly, solitary mason bees
that provision offspring with crop pollen have greater offspring production and survival,
especially when farms are far from natural habitat (Williams and Kremen 2007). Because
the majority of bee-attractive oak-savannah plants are done blooming in mid-June, urban
environments may also provide vital floral resources for late season fliers.
Floral resources and body size
I found that increased availability of native floral resources in forest-associated
OS fragments supported a greater abundance of larger-bodied bees (Fig. 2.3a). In this
ecosystem, early-blooming native plant species that tend to be found within forest-
associated OS fragments may be a critical resource for early-flying large-bodied species,
such as bumble bees. Early-flowering plant species have been shown to have a greater
influence on bumble bee colony production than late-season plants (Williams et al.
2012), possibly due to the importance of floral resources during nest founding by queen
bumble bees (Suzuki et al. 2009). Similarly, early-season flower density in alpine
meadows had positive effects on the abundance of founding queens, whereas mid- and
late-season resources had little impact on the abundance of workers and males (Elliott
2009). Likewise, early-flowering resources may be important for some larger-sized,
early-flying solitary bees (e.g. Andrena transnigra, Table 2.3) that I found tend to be
associated with forested landscapes. Most solitary bee species have short flight periods
and limited time to provision offspring with pollen and nectar, and so high abundance
and diversity of early-flowering resources may promote high abundances of these
species. Finally, it is also possible that early-flying, large-bodied bees, bolstered by the
higher abundances of early-flowering resources within fragments, may not be as
sensitive as small-bodied bees to late-season floral scarcity due to larger foraging
ranges. Because larger bees are capable of travelling further distances to find late-
20
season garden or crop resources in the surrounding landscape, they may be able to
persist in forested landscapes while the relative abundance of smaller bees decreases.
Although increases in body size were attributed to increasing richness and
density of floral resources in our analysis, bumble bee abundance declined with
decreasing proportion of forest cover in the surrounding landscape. Loss of natural
habitat has been shown to have negative impacts on native bees (Kremen et al. 2002,
Winfree et al. 2009), and bumble bees in particular (Jha and Kremen 2013). As
mentioned earlier, flowering phenology may play an important role. Forest-associated
OS fragments had a greater availability of early-flowering native species, potentially
important for queen bumble bees during colony establishment (Suzuki et al. 2009).
Additionally, bumble bees may be responding to the increased availability of “renting”
nest sites the forest provides. Some bumble bees use abandoned rodent holes as nest
sites (Heinrich 1979; McFrederick and LeBuhn 2006), which may be more abundant at
forest edges (Svensson et al. 2000). Many mechanisms have been postulated about the
causes of bumble bee declines (Williams 2005, Williams and Osbourne 2009, Cameron
et al. 2011), and our results indicate that nesting availability and early-blooming floral
resources may play a vital role in the persistence of these important bees in our region.
Conclusions
Although I did not sample the matrix habitat to determine the availability of nest
sites or floral resources, our data clearly demonstrate that fragments embedded in
forested and urban landscapes support different bee communities. This effect was
primarily related to differences among species in body size, which represents
requirements for resources as well as the hypothesized ability to access resources in the
matrix. More research is required to assess how bees utilize matrix habitat, and to what
degree different landscapes support bees with different nesting requirements and
dispersal abilities. Although I hypothesize that small bees are more abundant in urban-
associated fragments due to use of resources in residential gardens, there may be other
explanations. Smaller bees have lower resource requirements, and as such may be
sufficiently supported by the lower availability of floral resources in urban-associated
fragments (Tscharntke et al. 2002, Cane et al. 2006). In the same fragments, large-
21
bodied species may be forced to divert energy from reproduction to long-distance
foraging in order to fulfill their resource requirements.
Our results add to a growing body of literature that highlights the importance of
adopting community-based analysis, rather than relying on simple estimates of species
richness as indicators of the effects of landscape change on biodiversity (Filippi-
Codaccioni et al. 2010, Winfree et al. 2011). Of particular importance is to consider
species traits in conjunction with the surrounding landscape in order to determine how
communities will respond to habitat fragmentation. I found that oak-savannah fragments
in urban environments can still support high diversity of bee species, including those that
are predicted to be more vulnerable to the loss of natural habitat (i.e. some specialists,
wood-nesting renters). Conversely, some groups like bumble bees and narrow
specialists may benefit from the nesting and floral resources only found in natural
landscapes. These results provide an important avenue for future research and
conservation efforts; sampling the matrix habitat to determine the qualities of urban
environments and forested landscapes that drive differences in bee community
assemblages.

22
References
Anderson, M. J. 2001. A new method for non-parametric multivariate analysis of variance. Austral Ecology 26:32-46.
Anderson, M. J. 2006. Distance-based tests for homogeneity of multivariate dispersions. Biometric 62:245-253.
Andrén, H. 1992. Corvid density and nest predation in relation to forest fragmentation: a landscape perspective. Ecology 73:794-804.
Antongiovanni, M., and J. Metzger. 2005. Influence of matrix habitats on the occurrence of insectivorous bird species in Amazonian forest fragments. Biological Conservation 122:441-451.
Bartoń, K. 2013. MuMIn: multi-model inference. R package version 1.9.0 <http://cran.r-project.org/web/packages/MuMIn/index.html>
Bommarco, R., J.C. Biesmeijer, B. Meyer, S. G. Potts, J. Pöyry, S. P. M. Roberts, I. Steffan-Dewenter, and E. Ockinger. 2010. Dispersal capacity and diet breadth modify the response of wild bees to habitat loss. Proceedings of the Royal Society B – Biological Sciences 277:2075-2082.
Brosi, B.J., G. C. Daily, T. M. Shih, F. Oviedo, and G. Durán. 2008. The effects of forest fragmentation on bee communities in tropical countryside. Journal of Applied Ecology 45:773-783.
Brotons, L., M. Mönkkönen, and J. L. Martin. 2003. Are fragments islands? Landscape context and density area relationships in boreal forest birds. The American Naturalist 162:343-357.
Burkle, L.A., J.C. Marlin, and T. M. Knight. 2013. Plant-pollinator interactions over 120 years: loss of species, co-occurrence and function. Science 331: 1611-1615.
Burnham, K.P., and D. R. Anderson. 2002. Model Selection and Multimodel Inference: A Practical Information-Theoretic Approach, 2nd edn. Springer-Verlag, New York, New York, USA.
Cameron, S.A., J.D. Lozier, J. P. Strange, J. B. Koch, N. Cordes, L. F. Solter, and T. L. Griswold. 2011. Patterns of widespread decline in North American bumble bees. Proceedings of the National Academy of Sciences of the United States of America 108:662-667.
Cane, J.H. 2001. Habitat fragmentation and native bees: a premature verdict? Conservation Ecology, 5, 3. <http://www.ecologyandsociety.org/vol5/iss1/art3/>
23
Cane, J.H. and S. Sipes. 2006. Characterizing floral specialization by bees: analytical methods and a revised lexicon for oligolecty. Plant-Pollinator Interactions: From Specialization to Generalization (ed. by N.M. Waser and J. Ollerton), pp. 99-122. The University of Chicago Press, Chicago, Illinois, USA.
Cane, J.H., R. L. Minckley, L.J. Kervin, T. H. Roulston, and N. M. Williams. 2006. Complex responses within a desert bee guild (Hymenoptera: Apiformes) to urban habitat fragmentation. Ecological Applications 16:632-644.
Collinge, S.K. 2009. Ecology of Fragmented Landscapes. The John Hopkins University Press, Baltimore.
Cresswell, J.E., J. L. Osbourne, and D. Goulson. 2000. An economic model of the limits to foraging range in central place foragers with numerical solutions for bumblebees. Ecological Entomology 25:249-255.
Davies, K.F., C. R. Margules, and J. F. Lawrence. 2000. Which traits of species predict population declines in experimental forest fragments? Ecology 81:1450-1461.
Debinski, D.M. and R. D. Holt. 2000. A survey and overview of habitat fragmentation experiments. Conservation Biology 14:342-355.
Dunning, J.B., B. J. Danielson, and H. R. Pulliam. 1992. Ecological processes that affect populations in complex landscapes. Oikos 65: 169-175.
Elliott, S.E. 2009. Subalpine bumble bee foraging distances and densities in relation to flower availability. Environmental Entomology 38:748-756.
Eltz, T., C. A. Brühl, S. van der Kaars, and K. E. Linsenmair. 2002. Determinants of stingless bee nest density in lowland dipterocarp forests of Sabah, Malaysia. Oecologia 131:27-34.
ESRI 2009. ArcGIS Desktop: Release 9.2. Environmental Systems Research Institute, Redlands, California.
ESRI 2011. ArcGIS Desktop: Release 10.0. Environmental Systems Research Institute, Redlands, California.
Estades, C.F. 2001. The effect of breeding-habitat patch size on bird population density. Landscape Ecology 16:161-173.
Ewers, R.M. and R. K. Didham. 2006. Confounding factors in the detection of species responses to habitat fragmentation. Biological Reviews of the Cambridge Philosophical Society 81:117-142.
Fahrig, L. 2001. How much habitat is enough? Biological Conservation 100:65-74.
Fetridge, E.D., J. S. Ascher, and G. A. Langellotto. 2008. The bee fauna of residential gardens in a suburb of New York City (Hymenoptera: Apoidea). Annals of the Entomological Society of America 101:1067-1077.

24
Filippi-Codaccioni, O., V. Devictor, Y. Bas, and R. Julliar. 2010. Toward more concern for specialisation and less for species diversity in conserving farmland biodiversity. Biological Conservation 143:1493-1500.
Fuchs, M.A. 2001. Towards a recovery strategy for Garry oak and associated ecosystems in Canada: Ecological assessment and literature review. Technical Report GBEI/EC-00-030.
Gascon, C., T. E. Lovejoy, R. O. Bierregaard Jr., J. R. Malcolm, P. C. Stouffer, H. L. Vasconcelos, W. F. Laurance, B. Zimmerman, M. Tocher, and S. Borges. 1999. Matrix habitat and species richness in tropical forest remnants. Biological Conservation 91:223-229.
Gathmann, A., H.-J. Greiler, and T. Tscharntke. 1994. Trap-nesting bees and wasps colonizing set-aside fields: succession and body size, management by cutting and sowing. Oecologia 98:8-14.
Gibbs, J. 2010. Revision of the metallic species of Lasioglossum (Dialictus) in Canada (Hymenoptera, Halictidae, Halictini). Zootaxa 2591:1-382.
Greenleaf, S.S., and C. Kremen. 2006. Wild bees enhance honey bees’ pollination of hybrid sunflower. Proceedings of the National Academy of Sciences of the United States of America 103:13890-13895.
Greenleaf, S.S., N. M. Williams, R. Winfree, and C. Kremen. 2007. Bee foraging ranges and their relationship to body size. Oecologia 153:589-596.
Heinrich, B. 1979. Bumblebee Economics. Harvard University Press, Cambridge, Massachusetts, USA.
Henle, K., K. F. Davies, M. Kleyer, C. Margules, and J. Settele. 2004. Predictors of species sensitivity to fragmentation. Biodiversity and Conservation 13:207-251.
Hines, H.M. and S. D. Hendrix. 2005. Bumble bee (Hymenoptera: Apidae) diversity and abundance in tallgrass prairie patches: effects of local and landscape floral resources. Environmental Entomology 34:1477-1484.
Jauker, F., T. Diekötter, F. Schwarzbach, and V. Wolters. 2009. Pollinator dispersal in an agricultural matrix: opposing responses of wild bees and hoverflies to landscape structure and distance from main habitat. Landscape Ecology 24:547-555.
Jha, S. and C. Kremen. 2013. Resource diversity and landscape-level homogeneity drive native bee foraging. Proceedings of the National Academy of Sciences of the United States of America 110:555-558.
Klein, A.-M., S. A. Cunningham, M. Bos, and I. Steffan-Dewenter. 2008. Advances in pollination ecology from tropical plantation crops. Ecology 89:935-943.
Koh, L.P. and N. S. Sodhi. 2004. Importance of reserves, fragments, and parks for butterfly conservation in a tropical urban landscape. Ecological Applications 14:1695-1708.
25
Kremen, C.,N. M. Williams, and R. W. Thorp. 2002. Crop pollination from native bees at risk from agricultural intensification. Proceedings of the National Academy of Sciences of the United States of America 99:16812-16816.
Kremen, C., N. M. Williams, M. A. Aizen, B. Gemmill-Herren, G. LeBuhn, R. Minckley, L. Packer, S. G. Potts, T. Roulston, I. Steffan-Dewenter, D. P. Vázquez, R. Winfree, L. Adams, E. E. Crone, S. S. Greenleaf, T. H. Keitt, A. –M. Klein, J. Regetz, and T. H. Ricketts. 2007. Pollination and other ecosystem services produced by mobile organisms: a conceptual framework for the effects of land-use change. Ecology Letters 10:299-314.
Kwaiser, K.S., and S. D. Hendrix. 2008. Diversity and abundance of bees (Hymenoptera: Apiformes) in native and ruderal grasslands of agriculturally dominated landscapes. Agriculture, Ecosystems and Environment 124:200-204.
Lilley, P.L. and M. Vellend. 2009. Negative native-exotic diversity relationship in oak savannas explained by human influence and climate. Oikos 118:1373-1382.
Lindenmayer, D.B., and J. Fischer. 2006. Habitat Fragmentation and Landscape Changes: An Ecological and Conservation Synthesis. Island Press, Washington, D. C., USA.
MacArthur, R.H., and E. O. Wilson. 1967. The Theory of Island Biogeography. Princeton University Press, Princeton, New Jersey, USA.
MacDougall, A.S., B. R. Beckwith, and C. Y. Maslovat. 2004. Defining conservation strategies with historical perspectives: a case study from a degraded oak grassland ecosystem. Conservation Biology 18:455-465.
Manly, B.F.J. 1997. Randomization, Bootstrap, and Monte Carlo Methods in Biology, 3rd edn. Chapman & Hall, London, UK.
Matteson, K.C., and J. S. Ascher. 2008. Bee richness and abundance in New York City urban gardens. Annals of the Entomological Society of America 101:140-150.
McCune, B., and J. B. Grace. 2002. Analysis of Ecological Communities. MjM Software Design, Gleneden Beach, Oregon, USA.
McCune, B., and M. J. Mefford. 2005. PC-ORD, Multivariate analysis of ecological data, Version 5 for Windows edition. MjM Software Design, Gleneden Beach, Oregon, USA.
McFrederick, Q.S., and G. LeBuhn. 2006. Are urban parks refuges for bumble bees Bombus spp. (Hymenoptera: Apidae)? Biological Conservation 129:372-382.
McKinney, M.L. 2002. Urbanization, biodiversity, and conservation. BioScience 52:883-890.
McKinney, M.L. 2008. Effects of urbanization on species richness: A review of plants and animals. Urban Ecosystems 11:161-176.
26
Michener, C.D. 2000. The Bees of the World. John Hopkins Press, Baltimore, Maryland, USA.
Neame, L.A., T. Griswold, and E. Elle. 2013. Pollinator nesting guilds respond differently to urban habitat fragmentation in an oak-savannah ecosystem. Insect Conservation and Diversity 6:57-66.
Niinemets, U., and J. Peñuelas. 2008. Gardening and urban landscaping: significant players in global change. Trends in Plant Science 13:60-65.
Oksanen, J. 2011. Multivariate analysis of ecological communities in R: vegan tutorial <http://cc.oulu.fi/~jarioksa/opetus/metodi/vegantutor.pdf>
Peterson, J.H., and B. D. Roitberg. 2006. Impacts of flight distance on sex ratio and resource allocation to offspring in the leafcutter bee, Megachile rotundata. Behavioral Ecology and Sociobiology 59:589-596.
Pojar, J., and A. MacKinnon. 1994. Plants of Coastal British Columbia. Lone Pine Publishing, Vancouver, British Columbia, Canada.
Potts, S.G., B. Vulliamy, S. Roberts, C. O’Toole, A. Dafni, G. Ne’eman, and P. Willmer. 2005. Role of nesting resources in organising diverse bee communities in a Mediterranean landscape. Ecological Entomology 30:78-85.
Prugh, L.R., K. E. Hodges, A. R. E. Sinclair, and J. S. Brashares. 2008. Effect of habitat area and isolation on fragmented animal populations. Proceedings of the National Academy of Sciences of the United States of America 105:20770-20775.
Quinn, G.P., and M. J. Keough. 2002. Experimental Design and Data Analysis for Biologists. Cambridge University Press, Cambridge, UK.
R Core Team 2013. R: A Language and Environment for Statistical Computing. R Foundation for Statistical Computing, Vienna, Austria.
Ricketts, T.H. 2001. The matrix matters: effective isolation in fragmented landscapes. The American Naturalist 158:87-99.
Ries, L., and T. D. Sisk. 2004. A predictive model of edge effects. Ecology 85:2917-2926.
SAS Institute 2011. SAS/STAT Software version 9.3. SAS Institute Inc., Cary, North Carolina, USA.
Statistics Canada 2012. Victoria, British Columbia (Code 935) and British Columbia (Code 59) (table). Census Profile. 2011 Census. Statistics Canada Catalogue no. 98-315-XWE. Ottawa. Released October 24, 2012 <http://www12.statcan.gc.ca/census-recensement/2011/dp-pd/prof/index.cfm?Lang=E>
27
Steffan-Dewenter, I. 2003. Importance of habitat area and landscape context for species richness of bees and wasps in fragmented orchard meadows. Conservation Biology 17:1036-1044.
Steffan-Dewenter, I., U. Münzenberg, C. Bürger, C. Thies, and T. Tscharntke. 2002. Scale-dependent effects of landscape context on three pollinator guilds. Ecology 83:1421-1432.
Suzuki, Y., L. G. Kawaguchi, D. T. Munidasa, and Y. Toquenaga. 2009. Do bumble bee queens choose nest sites to maximize foraging rate? Testing models of nest site selection. Behavioral Ecology and Sociobiology 63:1353-1362.
Svensson, B., J. Lagerlöf, and B. G. Svensson. 2000. Habitat preferences of nest-seeking bumble bees (Hymenoptera: Apidae) in an agricultural landscape. Agriculture, Ecosystems and Environment 77:247-255.
Traveset, A., and D. M. Richardson. 2006. Biological invasions as disruptors of plant reproductive mutualisms. Trends in Ecology and Evolution 21:208-216.
Tscharntke, T., I. Steffan-Dewenter, A. Kruess, and C. Thies. 2002. Characteristics of insect populations on habitat fragments: A mini review. Ecological Research 17:229-239.
Vandermeer, J., and R. Carvajal, R. 2001. Metapopulation dynamics and the quality of the matrix. The American Naturalist 158:211-220.
Vellend, M., A. D. Bjorkman, and A. McConchie. 2008. Environmentally biased fragmentation of oak savanna habitat on southeastern Vancouver Island, Canada. Biological Conservation 141:2576-2584.
Wania, A., I. Kühn, and S. Klotz. 2006. Plant richness patterns in agricultural and urban landscapes in Central Germany – spatial gradients of species richness. Landscape and Urban Planning 75:97-110.
Warton, D.I., and F. K. C. Hui. 2011. The arcsine is asinine: the analysis of proportions in ecology. Ecology 92:3-10.
Westphal, C., I. Steffan-Dewenter, and T. Tscharntke. 2003. Mass flowering crops enhance pollinator densities at a landscape scale. Ecology Letters 6:961-965.
Westphal, C., I. Steffan-Dewenter, and T. Tscharntk. 2006. Foraging trip duration of bumblebees in relation to landscape-wide resource availability. Ecological Entomology 31:389-394.
Westrich, P. 1996. Habitat requirements of central European bees and the problems of partial habitats. The Conservation of Bees (ed. by A. Matheson, S. Buchanan, C. O’Toole, P. Westrich and I.H. Williams), pp. 1-16. Academic Press, London, UK.
Wiens, J.A. 1995. Habitat fragmentation: island v landscape perspectives on bird conservation. Ibis 137:S97-S104.
28
Williams, N.M., and C. Kremen. 2007. Resource distributions among habitats determine solitary bee offspring production in a mosaic landscape. Ecological Applications 17:910-921.
Williams, N.M., E. E. Crone, T. H. Roulson, R. L. Minckley, L. Packer, and S. G. Potts. 2010. Ecological and life-history traits predict bee species responses to environmental disturbances. Biological Conservation 143:2280-2291.
Williams, N.M., J. Regetz, and C. Kremen. 2012. Landscape-scale resources promote colony growth but not reproductive performance of bumble bees. Ecology 93: 1049-1058.
Williams, P.H. 2005. Does specialization explain rarity and decline among British bumblebees? A response to Goulson et al. Biological Conservation 122:33-43.
Williams, P.H., and J. L. Osborne. 2009. Bumblebee vulnerability and conservation world-wide. Apidologie 40:367-387.
Wilson, J.S., L. E. Wilson, L. D. Loftis, and T. Griswold. 2010. The montane bee fauna of north central Washington, USA, with floral associations. Western North American Naturalist 70:198-207.
Winfree, R., T. Griswold, and C. Kremen, C. 2007. Effect of human disturbance on bee communities in a forested ecosystem. Conservation Biology 21:213-223.
Winfree, R., R. Aguilar, D. P. Vázquez, G. LeBuhn, and M. A. Aizen. 2009. A meta-analysis of bees’ responses to anthropogenic disturbance. Ecology 90:2068-2076.
Winfree, R., I. Bartomeus, and D. P. Cariveau. 2011. Native pollinators in anthropogenic habitats. Annual Review of Ecology, Evolution, and Systematics 42:1-22.
Zurbuchen, A., S. Cheesman, J. Klaiber, A. Müller, S. Hein, and S. Dorn. 2010. Long foraging distances impose high costs on offspring production in solitary bees. Journal of Animal Ecology 79:674-681.
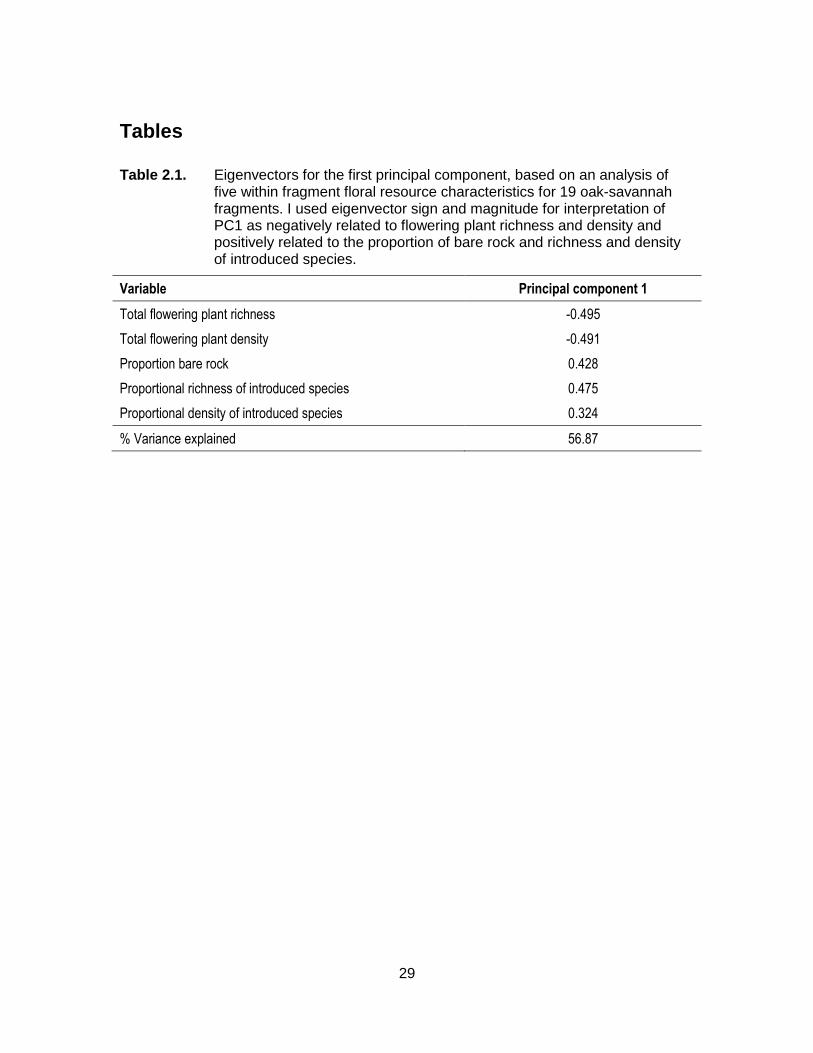
29
Tables
Table 2.1. Eigenvectors for the first principal component, based on an analysis of five within fragment floral resource characteristics for 19 oak-savannah fragments. I used eigenvector sign and magnitude for interpretation of PC1 as negatively related to flowering plant richness and density and positively related to the proportion of bare rock and richness and density of introduced species.
Variable Principal component 1
Total flowering plant richness -0.495
Total flowering plant density -0.491
Proportion bare rock 0.428
Proportional richness of introduced species 0.475
Proportional density of introduced species 0.324
% Variance explained 56.87
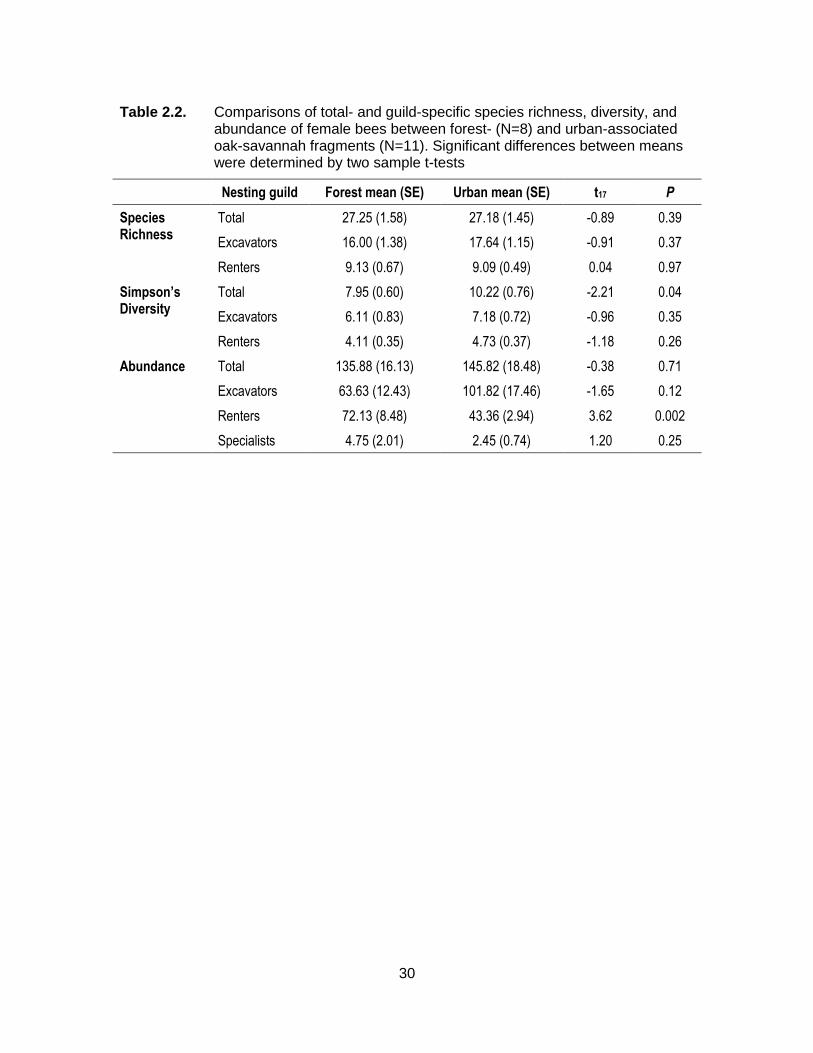
30
Table 2.2. Comparisons of total- and guild-specific species richness, diversity, and abundance of female bees between forest- (N=8) and urban-associated oak-savannah fragments (N=11). Significant differences between means were determined by two sample t-tests
Nesting guild Forest mean (SE) Urban mean (SE) t17 P
Species Richness
Total 27.25 (1.58) 27.18 (1.45) -0.89 0.39
Excavators 16.00 (1.38) 17.64 (1.15) -0.91 0.37
Renters 9.13 (0.67) 9.09 (0.49) 0.04 0.97
Simpson’s Diversity
Total 7.95 (0.60) 10.22 (0.76) -2.21 0.04
Excavators 6.11 (0.83) 7.18 (0.72) -0.96 0.35
Renters 4.11 (0.35) 4.73 (0.37) -1.18 0.26
Abundance Total 135.88 (16.13) 145.82 (18.48) -0.38 0.71
Excavators 63.63 (12.43) 101.82 (17.46) -1.65 0.12
Renters 72.13 (8.48) 43.36 (2.94) 3.62 0.002
Specialists 4.75 (2.01) 2.45 (0.74) 1.20 0.25
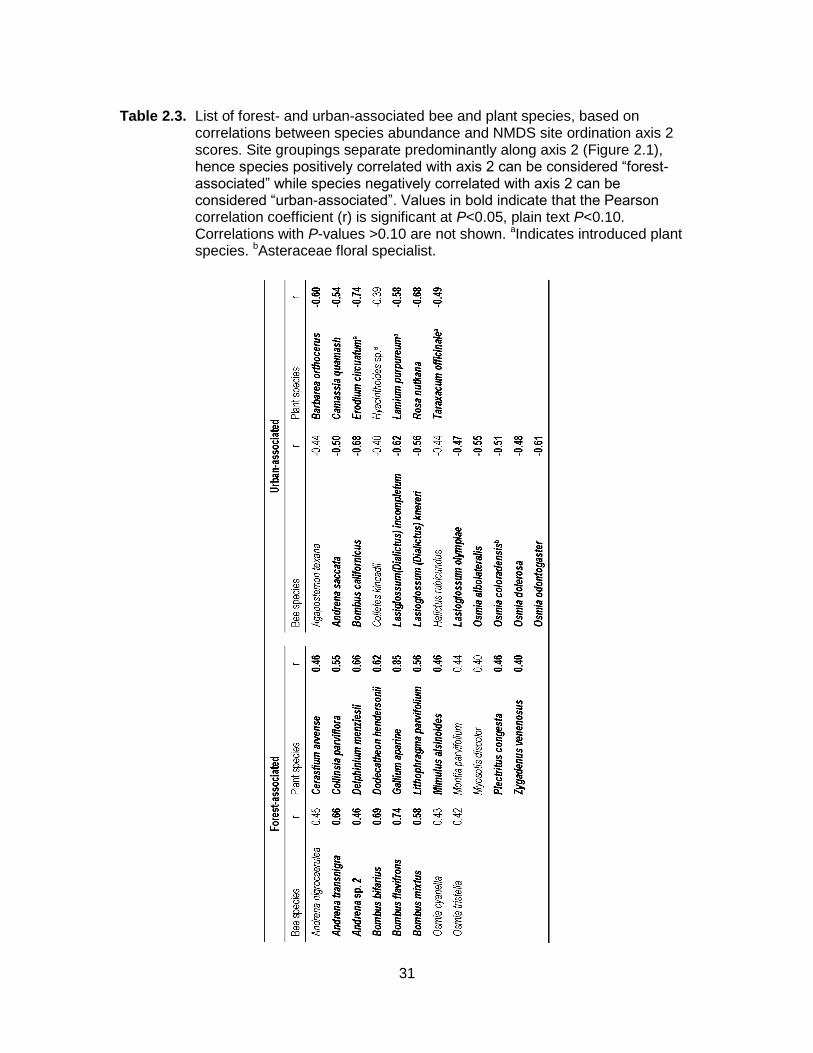
31
Table 2.3. List of forest- and urban-associated bee and plant species, based on correlations between species abundance and NMDS site ordination axis 2 scores. Site groupings separate predominantly along axis 2 (Figure 2.1), hence species positively correlated with axis 2 can be considered “forest-associated” while species negatively correlated with axis 2 can be considered “urban-associated”. Values in bold indicate that the Pearson correlation coefficient (r) is significant at P<0.05, plain text P<0.10. Correlations with P-values >0.10 are not shown. aIndicates introduced plant species. bAsteraceae floral specialist.
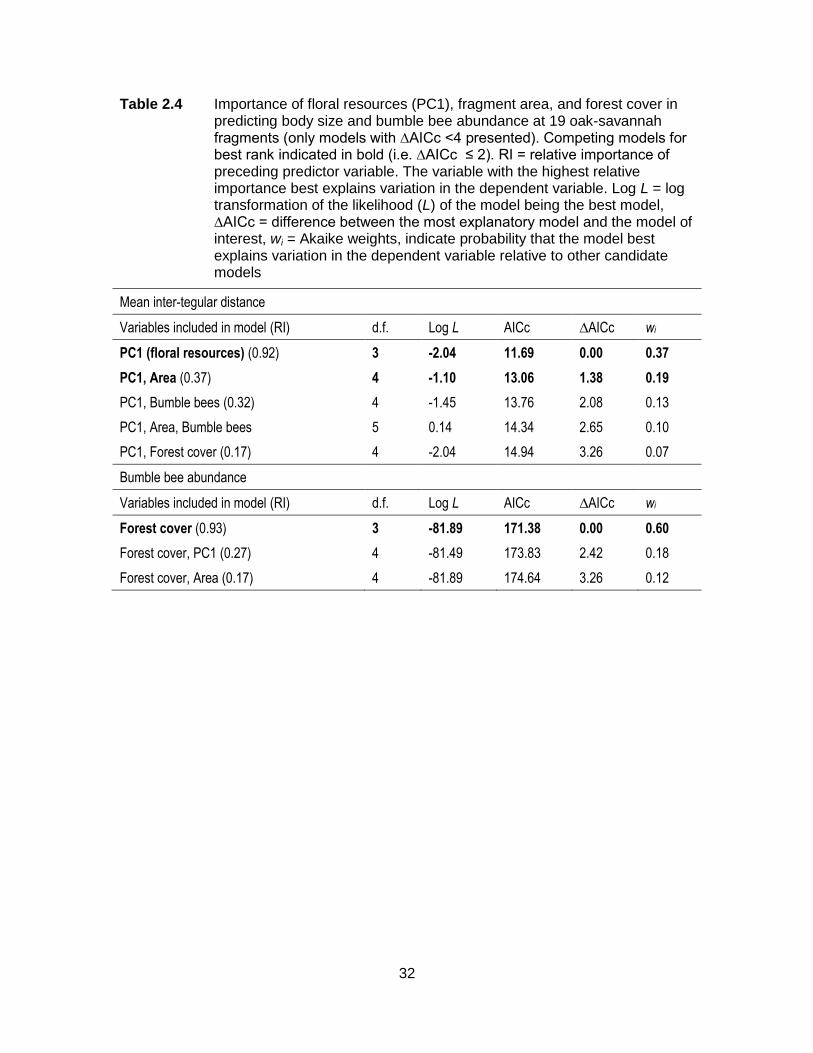
32
Table 2.4 Importance of floral resources (PC1), fragment area, and forest cover in predicting body size and bumble bee abundance at 19 oak-savannah fragments (only models with ∆AICc <4 presented). Competing models for best rank indicated in bold (i.e. ∆AICc ≤ 2). RI = relative importance of preceding predictor variable. The variable with the highest relative importance best explains variation in the dependent variable. Log L = log transformation of the likelihood (L) of the model being the best model, ∆AICc = difference between the most explanatory model and the model of interest, wi = Akaike weights, indicate probability that the model best explains variation in the dependent variable relative to other candidate models
Mean inter-tegular distance
Variables included in model (RI) d.f. Log L AICc ∆AICc wi
PC1 (floral resources) (0.92) 3 -2.04 11.69 0.00 0.37
PC1, Area (0.37) 4 -1.10 13.06 1.38 0.19
PC1, Bumble bees (0.32) 4 -1.45 13.76 2.08 0.13
PC1, Area, Bumble bees 5 0.14 14.34 2.65 0.10
PC1, Forest cover (0.17) 4 -2.04 14.94 3.26 0.07
Bumble bee abundance
Variables included in model (RI) d.f. Log L AICc ∆AICc wi
Forest cover (0.93) 3 -81.89 171.38 0.00 0.60
Forest cover, PC1 (0.27) 4 -81.49 173.83 2.42 0.18
Forest cover, Area (0.17) 4 -81.89 174.64 3.26 0.12
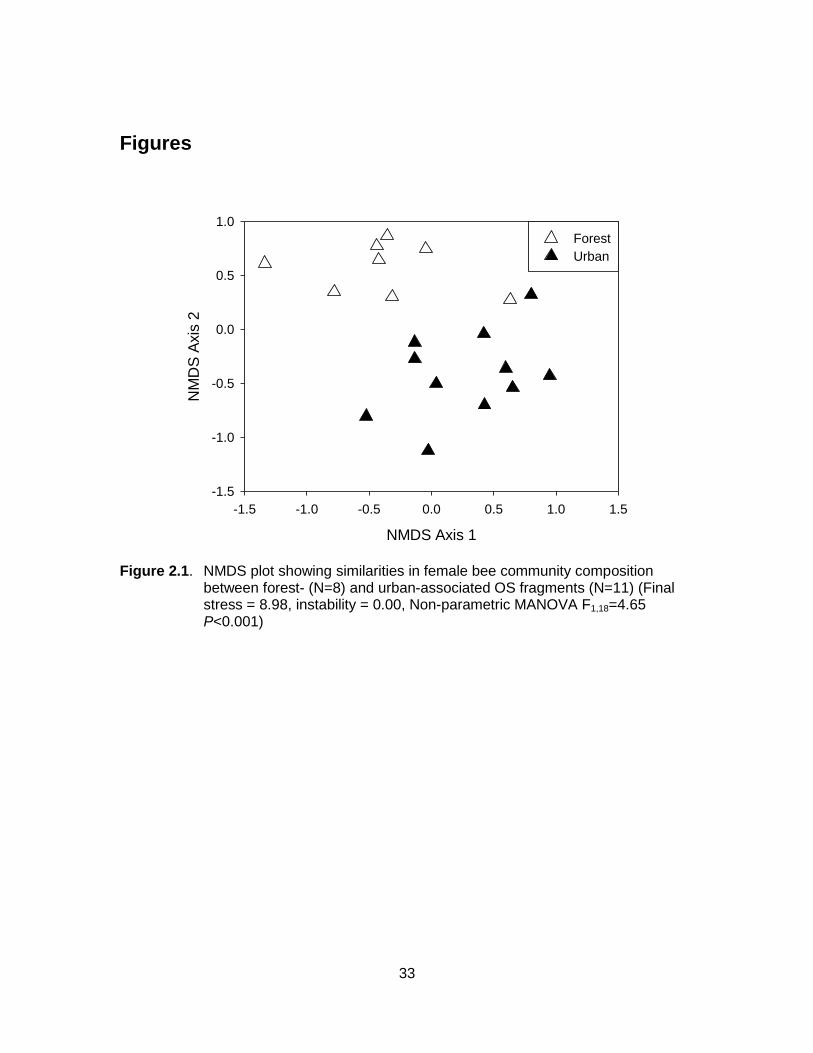
33
Figures
NMDS Axis 1
-1.5 -1.0 -0.5 0.0 0.5 1.0 1.5
NM
DS
Axis
2
-1.5
-1.0
-0.5
0.0
0.5
1.0
Forest
Urban
Figure 2.1. NMDS plot showing similarities in female bee community composition between forest- (N=8) and urban-associated OS fragments (N=11) (Final stress = 8.98, instability = 0.00, Non-parametric MANOVA F1,18=4.65 P<0.001)
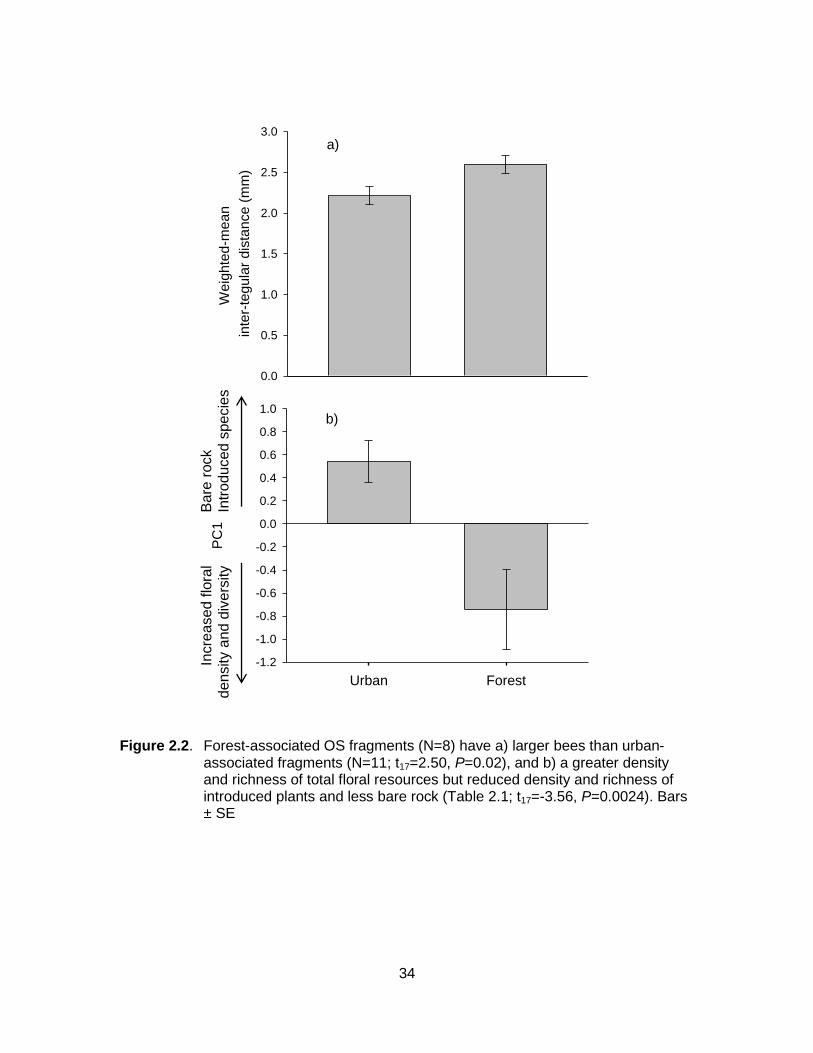
34
Urban Forest
PC
1
-1.2
-1.0
-0.8
-0.6
-0.4
-0.2
0.0
0.2
0.4
0.6
0.8
1.0b)
Weig
hte
d-m
ea
n
inte
r-te
gula
r dis
tan
ce
(m
m)
0.0
0.5
1.0
1.5
2.0
2.5
3.0a)
Figure 2.2. Forest-associated OS fragments (N=8) have a) larger bees than urban-associated fragments (N=11; t17=2.50, P=0.02), and b) a greater density and richness of total floral resources but reduced density and richness of introduced plants and less bare rock (Table 2.1; t17=-3.56, P=0.0024). Bars ± SE
Incre
ase
d f
lora
l
den
sity a
nd d
ive
rsity
Ba
re r
ock
Intr
odu
ced
spe
cie
s

35
PC1
-3 -2 -1 0 1 2
We
igh
ted
-me
an
in
ter-
teg
ula
r d
ista
nce
(m
m)
1.6
1.8
2.0
2.2
2.4
2.6
2.8
3.0
3.2
% Forest cover (400-meter radius)
-2.0 -1.5 -1.0 -0.5 0.0 0.5
Bu
mb
le b
ee
ab
un
da
nce
0
20
40
60
80
100
120
Figure 2.3. A) Body size (as measured by the weighted-mean inter-tegular distance) increases with an increase in floral richness and density and a decrease in proportional richness and density of introduced species and proportion of bare rock (PC1; Adjusted R2=0.4345, N=19) and b) bumble bee abundance within the habitat fragment increases with increasing forest cover (logit transformed) surrounding the fragment (Adjusted R2=0.4318, N=19)
Increased floral density and diversity
Bare rock Introduced species
a)
b)

36
Chapter 3. Flowering phenology and nesting resources influence pollinator community composition in a fragmented ecosystem
Introduction
Conservation of biodiversity within habitat fragments is increasingly focusing on
the influence of the surrounding landscape, rather than on measures of simple fragment
area (Laurance 2008). Although large habitat fragments are predicted to support a
greater heterogeneity of resources and niches for different species, the effects of
fragment area on richness, abundance, or diversity are inconsistent (Debinski and Holt
2000). In terrestrial habitat fragments, the quality of the surrounding landscape and
species’ use of matrix habitat can strongly influence the abundance and composition of
species within fragments (Gascon et al. 1999, Perfecto and Vandermeer 2002,
Antongiovanni and Metzger 2005, Kennedy et al. 2010). If the surrounding landscape
(the non-habitat “matrix”) provides resources that augment or complement the
availability of resources in fragmented habitat, populations may be buffered from the
negative effects of habitat loss and fragmentation (Dunning et al. 1992, Estades 2001,
Fahrig 2001, Ries and Sisk 2004).
The effects of habitat loss on wild and managed pollinator populations are facing
increasing attention in landscapes modified for human use (Potts et al. 2010, Roulston
and Goodell 2011, Winfree et al. 2011). Anthropogenic landscapes are progressively
dominating the earth’s surface (Ellis et al. 2010), and urbanization in particular is
predicted to have negative effects on biodiversity, ecosystem processes, and ecosystem
functioning (McKinney 2002, Grimm et al. 2008). However, habitat modification only
negatively affects the abundance and species richness of wild bees when losses are
severe, and not when changes are moderate (Winfree et al. 2009). Suburban gardens
and parks, in particular, are known to support a high richness and abundance of
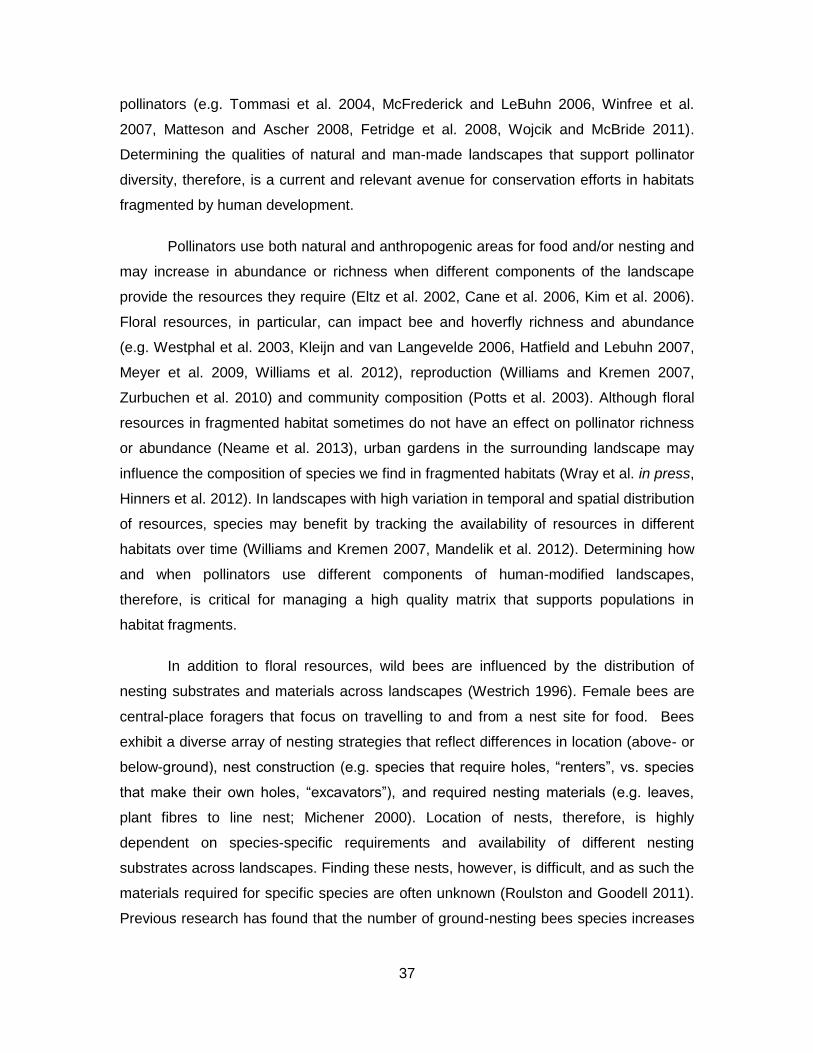
37
pollinators (e.g. Tommasi et al. 2004, McFrederick and LeBuhn 2006, Winfree et al.
2007, Matteson and Ascher 2008, Fetridge et al. 2008, Wojcik and McBride 2011).
Determining the qualities of natural and man-made landscapes that support pollinator
diversity, therefore, is a current and relevant avenue for conservation efforts in habitats
fragmented by human development.
Pollinators use both natural and anthropogenic areas for food and/or nesting and
may increase in abundance or richness when different components of the landscape
provide the resources they require (Eltz et al. 2002, Cane et al. 2006, Kim et al. 2006).
Floral resources, in particular, can impact bee and hoverfly richness and abundance
(e.g. Westphal et al. 2003, Kleijn and van Langevelde 2006, Hatfield and Lebuhn 2007,
Meyer et al. 2009, Williams et al. 2012), reproduction (Williams and Kremen 2007,
Zurbuchen et al. 2010) and community composition (Potts et al. 2003). Although floral
resources in fragmented habitat sometimes do not have an effect on pollinator richness
or abundance (Neame et al. 2013), urban gardens in the surrounding landscape may
influence the composition of species we find in fragmented habitats (Wray et al. in press,
Hinners et al. 2012). In landscapes with high variation in temporal and spatial distribution
of resources, species may benefit by tracking the availability of resources in different
habitats over time (Williams and Kremen 2007, Mandelik et al. 2012). Determining how
and when pollinators use different components of human-modified landscapes,
therefore, is critical for managing a high quality matrix that supports populations in
habitat fragments.
In addition to floral resources, wild bees are influenced by the distribution of
nesting substrates and materials across landscapes (Westrich 1996). Female bees are
central-place foragers that focus on travelling to and from a nest site for food. Bees
exhibit a diverse array of nesting strategies that reflect differences in location (above- or
below-ground), nest construction (e.g. species that require holes, “renters”, vs. species
that make their own holes, “excavators”), and required nesting materials (e.g. leaves,
plant fibres to line nest; Michener 2000). Location of nests, therefore, is highly
dependent on species-specific requirements and availability of different nesting
substrates across landscapes. Finding these nests, however, is difficult, and as such the
materials required for specific species are often unknown (Roulston and Goodell 2011).
Previous research has found that the number of ground-nesting bees species increases
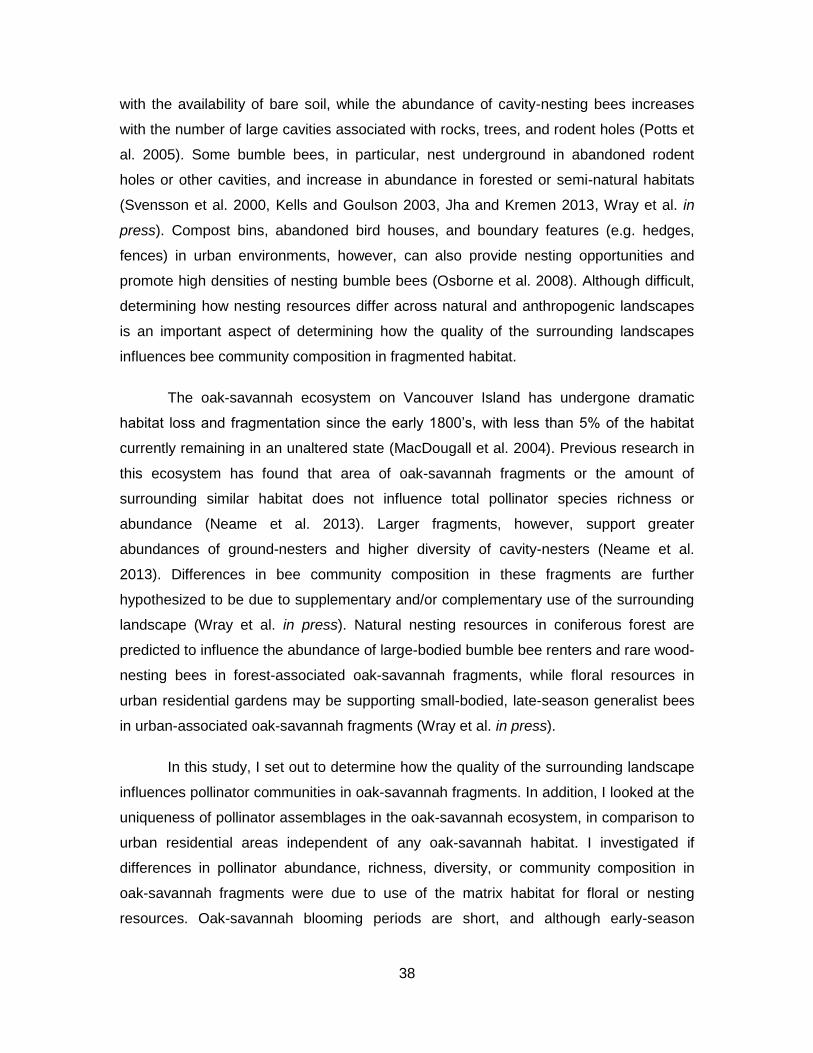
38
with the availability of bare soil, while the abundance of cavity-nesting bees increases
with the number of large cavities associated with rocks, trees, and rodent holes (Potts et
al. 2005). Some bumble bees, in particular, nest underground in abandoned rodent
holes or other cavities, and increase in abundance in forested or semi-natural habitats
(Svensson et al. 2000, Kells and Goulson 2003, Jha and Kremen 2013, Wray et al. in
press). Compost bins, abandoned bird houses, and boundary features (e.g. hedges,
fences) in urban environments, however, can also provide nesting opportunities and
promote high densities of nesting bumble bees (Osborne et al. 2008). Although difficult,
determining how nesting resources differ across natural and anthropogenic landscapes
is an important aspect of determining how the quality of the surrounding landscapes
influences bee community composition in fragmented habitat.
The oak-savannah ecosystem on Vancouver Island has undergone dramatic
habitat loss and fragmentation since the early 1800’s, with less than 5% of the habitat
currently remaining in an unaltered state (MacDougall et al. 2004). Previous research in
this ecosystem has found that area of oak-savannah fragments or the amount of
surrounding similar habitat does not influence total pollinator species richness or
abundance (Neame et al. 2013). Larger fragments, however, support greater
abundances of ground-nesters and higher diversity of cavity-nesters (Neame et al.
2013). Differences in bee community composition in these fragments are further
hypothesized to be due to supplementary and/or complementary use of the surrounding
landscape (Wray et al. in press). Natural nesting resources in coniferous forest are
predicted to influence the abundance of large-bodied bumble bee renters and rare wood-
nesting bees in forest-associated oak-savannah fragments, while floral resources in
urban residential gardens may be supporting small-bodied, late-season generalist bees
in urban-associated oak-savannah fragments (Wray et al. in press).
In this study, I set out to determine how the quality of the surrounding landscape
influences pollinator communities in oak-savannah fragments. In addition, I looked at the
uniqueness of pollinator assemblages in the oak-savannah ecosystem, in comparison to
urban residential areas independent of any oak-savannah habitat. I investigated if
differences in pollinator abundance, richness, diversity, or community composition in
oak-savannah fragments were due to use of the matrix habitat for floral or nesting
resources. Oak-savannah blooming periods are short, and although early-season
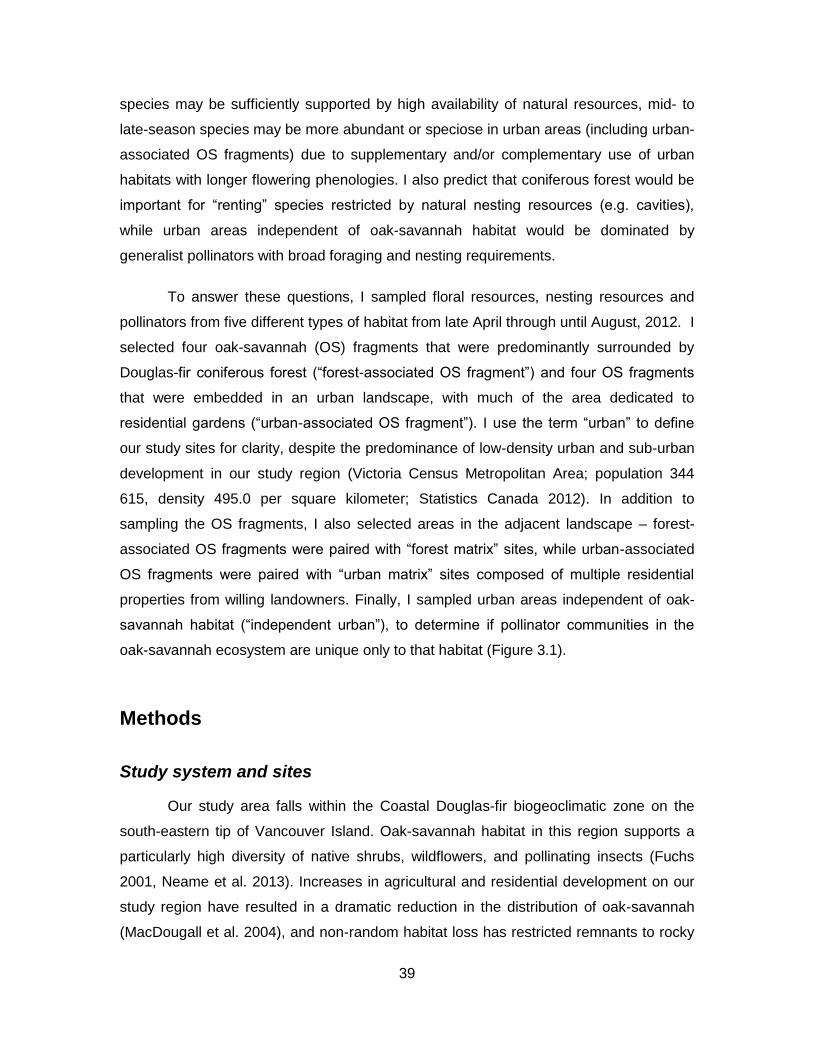
39
species may be sufficiently supported by high availability of natural resources, mid- to
late-season species may be more abundant or speciose in urban areas (including urban-
associated OS fragments) due to supplementary and/or complementary use of urban
habitats with longer flowering phenologies. I also predict that coniferous forest would be
important for “renting” species restricted by natural nesting resources (e.g. cavities),
while urban areas independent of oak-savannah habitat would be dominated by
generalist pollinators with broad foraging and nesting requirements.
To answer these questions, I sampled floral resources, nesting resources and
pollinators from five different types of habitat from late April through until August, 2012. I
selected four oak-savannah (OS) fragments that were predominantly surrounded by
Douglas-fir coniferous forest (“forest-associated OS fragment”) and four OS fragments
that were embedded in an urban landscape, with much of the area dedicated to
residential gardens (“urban-associated OS fragment”). I use the term “urban” to define
our study sites for clarity, despite the predominance of low-density urban and sub-urban
development in our study region (Victoria Census Metropolitan Area; population 344
615, density 495.0 per square kilometer; Statistics Canada 2012). In addition to
sampling the OS fragments, I also selected areas in the adjacent landscape – forest-
associated OS fragments were paired with “forest matrix” sites, while urban-associated
OS fragments were paired with “urban matrix” sites composed of multiple residential
properties from willing landowners. Finally, I sampled urban areas independent of oak-
savannah habitat (“independent urban”), to determine if pollinator communities in the
oak-savannah ecosystem are unique only to that habitat (Figure 3.1).
Methods
Study system and sites
Our study area falls within the Coastal Douglas-fir biogeoclimatic zone on the
south-eastern tip of Vancouver Island. Oak-savannah habitat in this region supports a
particularly high diversity of native shrubs, wildflowers, and pollinating insects (Fuchs
2001, Neame et al. 2013). Increases in agricultural and residential development on our
study region have resulted in a dramatic reduction in the distribution of oak-savannah
(MacDougall et al. 2004), and non-random habitat loss has restricted remnants to rocky
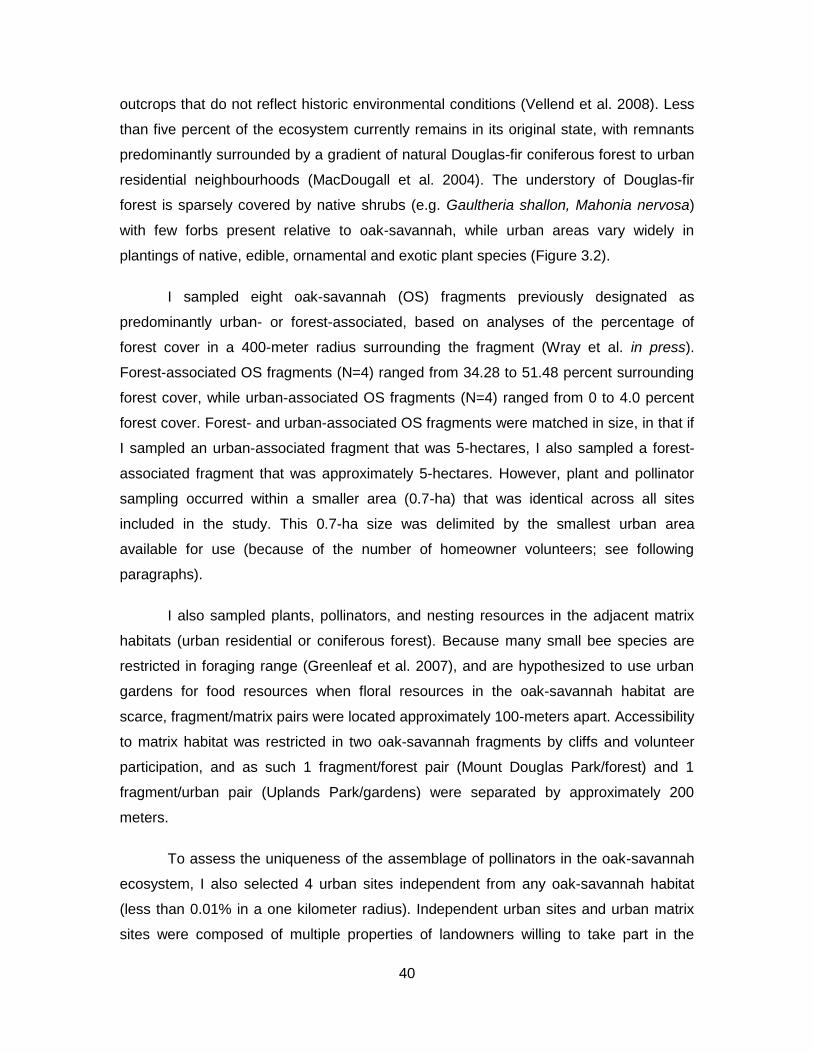
40
outcrops that do not reflect historic environmental conditions (Vellend et al. 2008). Less
than five percent of the ecosystem currently remains in its original state, with remnants
predominantly surrounded by a gradient of natural Douglas-fir coniferous forest to urban
residential neighbourhoods (MacDougall et al. 2004). The understory of Douglas-fir
forest is sparsely covered by native shrubs (e.g. Gaultheria shallon, Mahonia nervosa)
with few forbs present relative to oak-savannah, while urban areas vary widely in
plantings of native, edible, ornamental and exotic plant species (Figure 3.2).
I sampled eight oak-savannah (OS) fragments previously designated as
predominantly urban- or forest-associated, based on analyses of the percentage of
forest cover in a 400-meter radius surrounding the fragment (Wray et al. in press).
Forest-associated OS fragments (N=4) ranged from 34.28 to 51.48 percent surrounding
forest cover, while urban-associated OS fragments (N=4) ranged from 0 to 4.0 percent
forest cover. Forest- and urban-associated OS fragments were matched in size, in that if
I sampled an urban-associated fragment that was 5-hectares, I also sampled a forest-
associated fragment that was approximately 5-hectares. However, plant and pollinator
sampling occurred within a smaller area (0.7-ha) that was identical across all sites
included in the study. This 0.7-ha size was delimited by the smallest urban area
available for use (because of the number of homeowner volunteers; see following
paragraphs).
I also sampled plants, pollinators, and nesting resources in the adjacent matrix
habitats (urban residential or coniferous forest). Because many small bee species are
restricted in foraging range (Greenleaf et al. 2007), and are hypothesized to use urban
gardens for food resources when floral resources in the oak-savannah habitat are
scarce, fragment/matrix pairs were located approximately 100-meters apart. Accessibility
to matrix habitat was restricted in two oak-savannah fragments by cliffs and volunteer
participation, and as such 1 fragment/forest pair (Mount Douglas Park/forest) and 1
fragment/urban pair (Uplands Park/gardens) were separated by approximately 200
meters.
To assess the uniqueness of the assemblage of pollinators in the oak-savannah
ecosystem, I also selected 4 urban sites independent from any oak-savannah habitat
(less than 0.01% in a one kilometer radius). Independent urban sites and urban matrix
sites were composed of multiple properties of landowners willing to take part in the
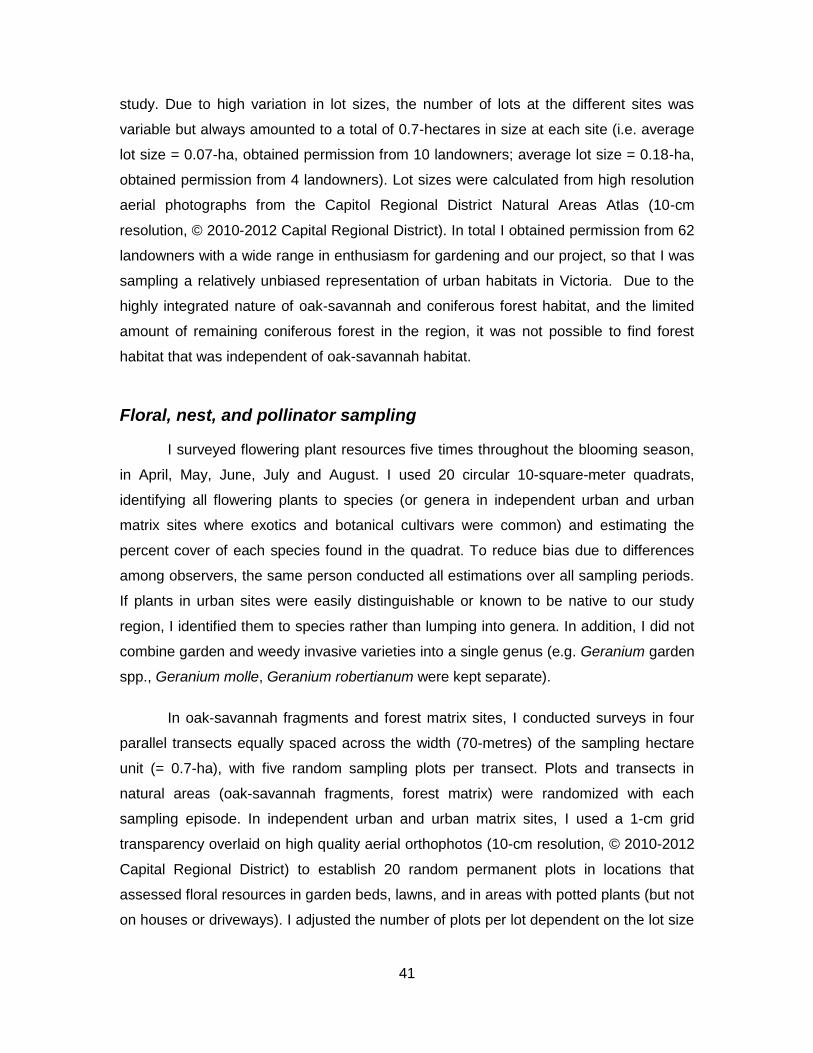
41
study. Due to high variation in lot sizes, the number of lots at the different sites was
variable but always amounted to a total of 0.7-hectares in size at each site (i.e. average
lot size = 0.07-ha, obtained permission from 10 landowners; average lot size = 0.18-ha,
obtained permission from 4 landowners). Lot sizes were calculated from high resolution
aerial photographs from the Capitol Regional District Natural Areas Atlas (10-cm
resolution, © 2010-2012 Capital Regional District). In total I obtained permission from 62
landowners with a wide range in enthusiasm for gardening and our project, so that I was
sampling a relatively unbiased representation of urban habitats in Victoria. Due to the
highly integrated nature of oak-savannah and coniferous forest habitat, and the limited
amount of remaining coniferous forest in the region, it was not possible to find forest
habitat that was independent of oak-savannah habitat.
Floral, nest, and pollinator sampling
I surveyed flowering plant resources five times throughout the blooming season,
in April, May, June, July and August. I used 20 circular 10-square-meter quadrats,
identifying all flowering plants to species (or genera in independent urban and urban
matrix sites where exotics and botanical cultivars were common) and estimating the
percent cover of each species found in the quadrat. To reduce bias due to differences
among observers, the same person conducted all estimations over all sampling periods.
If plants in urban sites were easily distinguishable or known to be native to our study
region, I identified them to species rather than lumping into genera. In addition, I did not
combine garden and weedy invasive varieties into a single genus (e.g. Geranium garden
spp., Geranium molle, Geranium robertianum were kept separate).
In oak-savannah fragments and forest matrix sites, I conducted surveys in four
parallel transects equally spaced across the width (70-metres) of the sampling hectare
unit (= 0.7-ha), with five random sampling plots per transect. Plots and transects in
natural areas (oak-savannah fragments, forest matrix) were randomized with each
sampling episode. In independent urban and urban matrix sites, I used a 1-cm grid
transparency overlaid on high quality aerial orthophotos (10-cm resolution, © 2010-2012
Capital Regional District) to establish 20 random permanent plots in locations that
assessed floral resources in garden beds, lawns, and in areas with potted plants (but not
on houses or driveways). I adjusted the number of plots per lot dependent on the lot size
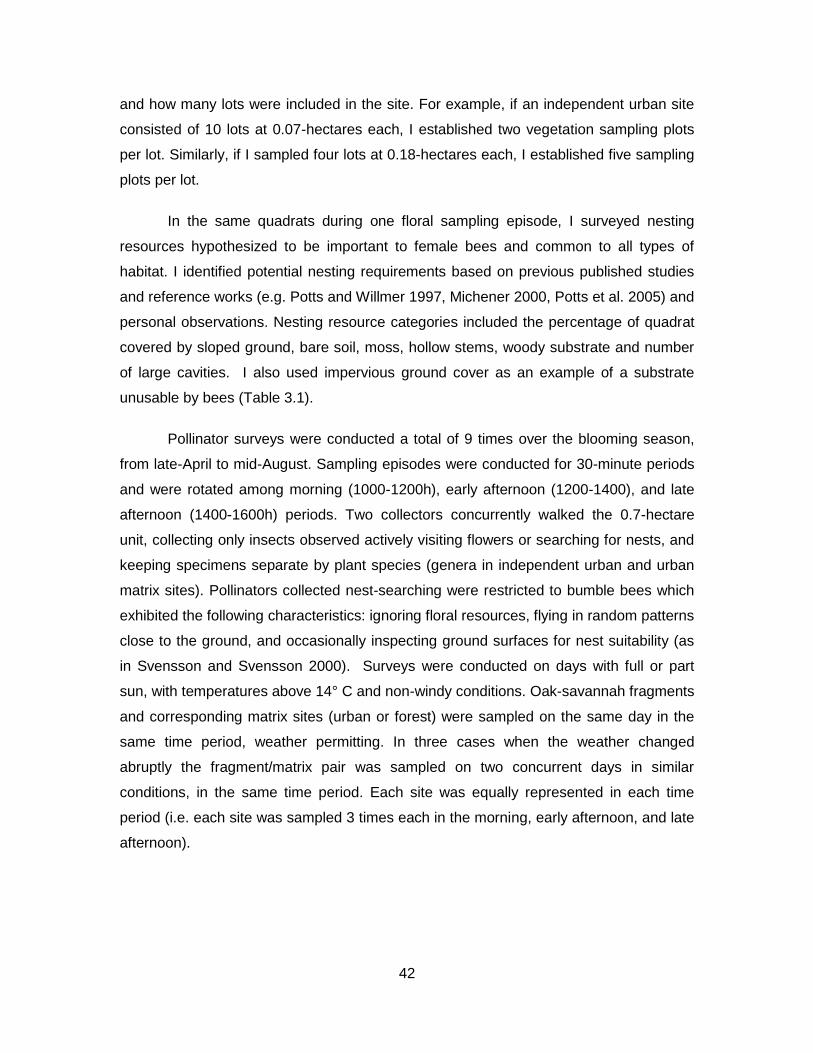
42
and how many lots were included in the site. For example, if an independent urban site
consisted of 10 lots at 0.07-hectares each, I established two vegetation sampling plots
per lot. Similarly, if I sampled four lots at 0.18-hectares each, I established five sampling
plots per lot.
In the same quadrats during one floral sampling episode, I surveyed nesting
resources hypothesized to be important to female bees and common to all types of
habitat. I identified potential nesting requirements based on previous published studies
and reference works (e.g. Potts and Willmer 1997, Michener 2000, Potts et al. 2005) and
personal observations. Nesting resource categories included the percentage of quadrat
covered by sloped ground, bare soil, moss, hollow stems, woody substrate and number
of large cavities. I also used impervious ground cover as an example of a substrate
unusable by bees (Table 3.1).
Pollinator surveys were conducted a total of 9 times over the blooming season,
from late-April to mid-August. Sampling episodes were conducted for 30-minute periods
and were rotated among morning (1000-1200h), early afternoon (1200-1400), and late
afternoon (1400-1600h) periods. Two collectors concurrently walked the 0.7-hectare
unit, collecting only insects observed actively visiting flowers or searching for nests, and
keeping specimens separate by plant species (genera in independent urban and urban
matrix sites). Pollinators collected nest-searching were restricted to bumble bees which
exhibited the following characteristics: ignoring floral resources, flying in random patterns
close to the ground, and occasionally inspecting ground surfaces for nest suitability (as
in Svensson and Svensson 2000). Surveys were conducted on days with full or part
sun, with temperatures above 14° C and non-windy conditions. Oak-savannah fragments
and corresponding matrix sites (urban or forest) were sampled on the same day in the
same time period, weather permitting. In three cases when the weather changed
abruptly the fragment/matrix pair was sampled on two concurrent days in similar
conditions, in the same time period. Each site was equally represented in each time
period (i.e. each site was sampled 3 times each in the morning, early afternoon, and late
afternoon).
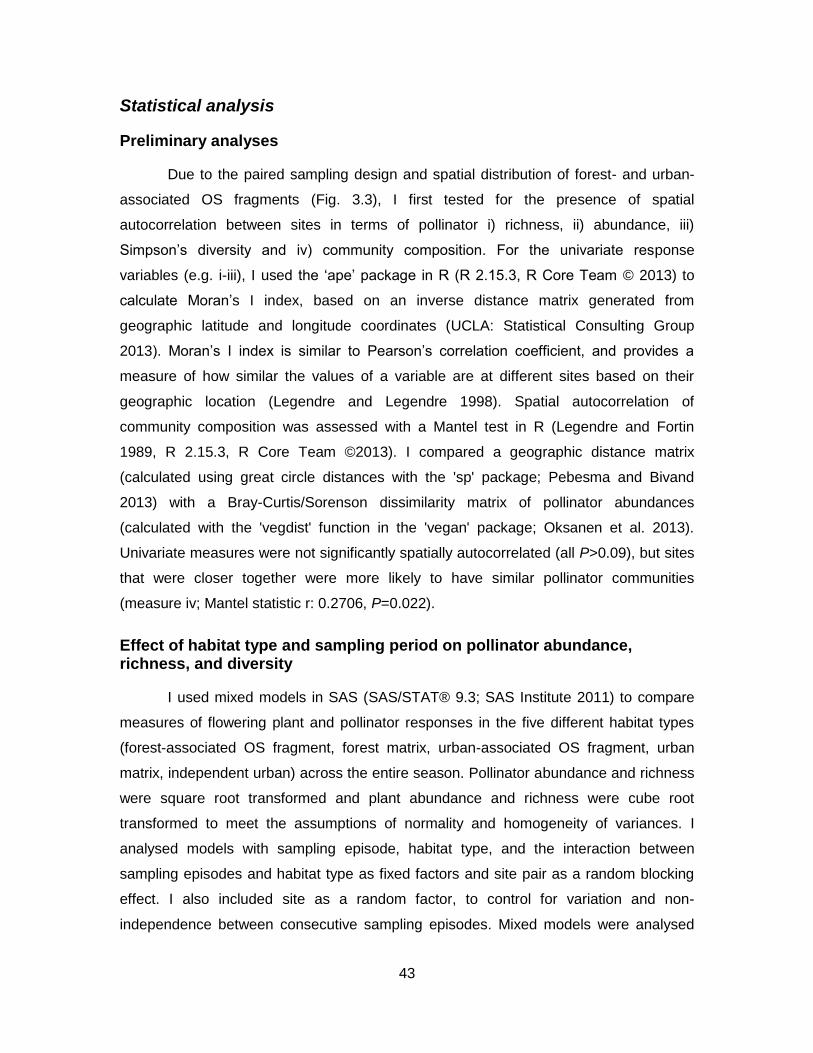
43
Statistical analysis
Preliminary analyses
Due to the paired sampling design and spatial distribution of forest- and urban-
associated OS fragments (Fig. 3.3), I first tested for the presence of spatial
autocorrelation between sites in terms of pollinator i) richness, ii) abundance, iii)
Simpson’s diversity and iv) community composition. For the univariate response
variables (e.g. i-iii), I used the ‘ape’ package in R (R 2.15.3, R Core Team © 2013) to
calculate Moran’s I index, based on an inverse distance matrix generated from
geographic latitude and longitude coordinates (UCLA: Statistical Consulting Group
2013). Moran’s I index is similar to Pearson’s correlation coefficient, and provides a
measure of how similar the values of a variable are at different sites based on their
geographic location (Legendre and Legendre 1998). Spatial autocorrelation of
community composition was assessed with a Mantel test in R (Legendre and Fortin
1989, R 2.15.3, R Core Team ©2013). I compared a geographic distance matrix
(calculated using great circle distances with the 'sp' package; Pebesma and Bivand
2013) with a Bray-Curtis/Sorenson dissimilarity matrix of pollinator abundances
(calculated with the 'vegdist' function in the 'vegan' package; Oksanen et al. 2013).
Univariate measures were not significantly spatially autocorrelated (all P>0.09), but sites
that were closer together were more likely to have similar pollinator communities
(measure iv; Mantel statistic r: 0.2706, P=0.022).
Effect of habitat type and sampling period on pollinator abundance, richness, and diversity
I used mixed models in SAS (SAS/STAT® 9.3; SAS Institute 2011) to compare
measures of flowering plant and pollinator responses in the five different habitat types
(forest-associated OS fragment, forest matrix, urban-associated OS fragment, urban
matrix, independent urban) across the entire season. Pollinator abundance and richness
were square root transformed and plant abundance and richness were cube root
transformed to meet the assumptions of normality and homogeneity of variances. I
analysed models with sampling episode, habitat type, and the interaction between
sampling episodes and habitat type as fixed factors and site pair as a random blocking
effect. I also included site as a random factor, to control for variation and non-
independence between consecutive sampling episodes. Mixed models were analysed
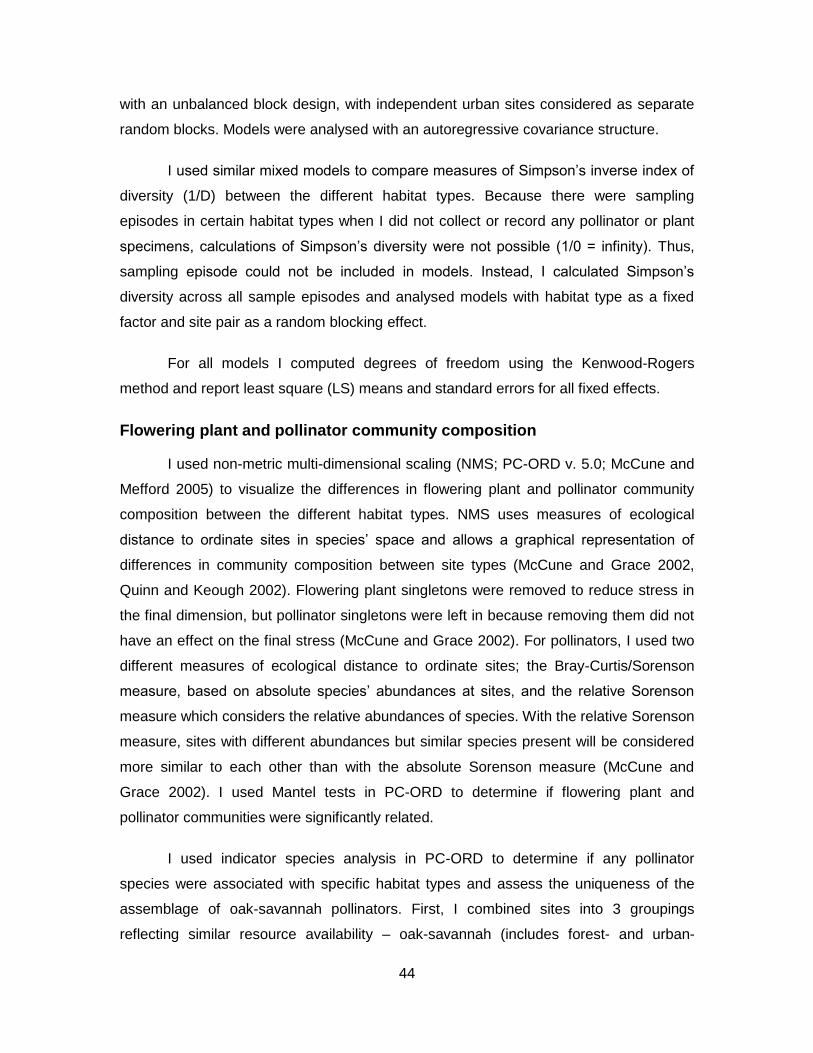
44
with an unbalanced block design, with independent urban sites considered as separate
random blocks. Models were analysed with an autoregressive covariance structure.
I used similar mixed models to compare measures of Simpson’s inverse index of
diversity (1/D) between the different habitat types. Because there were sampling
episodes in certain habitat types when I did not collect or record any pollinator or plant
specimens, calculations of Simpson’s diversity were not possible (1/0 = infinity). Thus,
sampling episode could not be included in models. Instead, I calculated Simpson’s
diversity across all sample episodes and analysed models with habitat type as a fixed
factor and site pair as a random blocking effect.
For all models I computed degrees of freedom using the Kenwood-Rogers
method and report least square (LS) means and standard errors for all fixed effects.
Flowering plant and pollinator community composition
I used non-metric multi-dimensional scaling (NMS; PC-ORD v. 5.0; McCune and
Mefford 2005) to visualize the differences in flowering plant and pollinator community
composition between the different habitat types. NMS uses measures of ecological
distance to ordinate sites in species’ space and allows a graphical representation of
differences in community composition between site types (McCune and Grace 2002,
Quinn and Keough 2002). Flowering plant singletons were removed to reduce stress in
the final dimension, but pollinator singletons were left in because removing them did not
have an effect on the final stress (McCune and Grace 2002). For pollinators, I used two
different measures of ecological distance to ordinate sites; the Bray-Curtis/Sorenson
measure, based on absolute species’ abundances at sites, and the relative Sorenson
measure which considers the relative abundances of species. With the relative Sorenson
measure, sites with different abundances but similar species present will be considered
more similar to each other than with the absolute Sorenson measure (McCune and
Grace 2002). I used Mantel tests in PC-ORD to determine if flowering plant and
pollinator communities were significantly related.
I used indicator species analysis in PC-ORD to determine if any pollinator
species were associated with specific habitat types and assess the uniqueness of the
assemblage of oak-savannah pollinators. First, I combined sites into 3 groupings
reflecting similar resource availability – oak-savannah (includes forest- and urban-
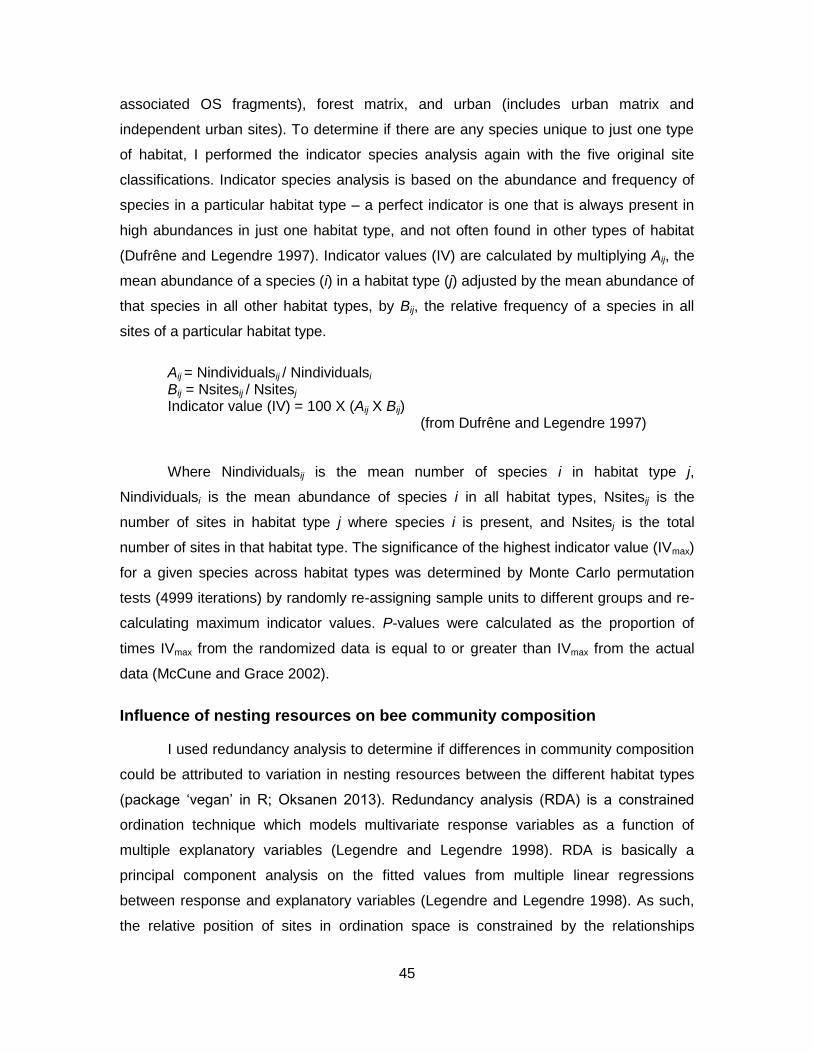
45
associated OS fragments), forest matrix, and urban (includes urban matrix and
independent urban sites). To determine if there are any species unique to just one type
of habitat, I performed the indicator species analysis again with the five original site
classifications. Indicator species analysis is based on the abundance and frequency of
species in a particular habitat type – a perfect indicator is one that is always present in
high abundances in just one habitat type, and not often found in other types of habitat
(Dufrêne and Legendre 1997). Indicator values (IV) are calculated by multiplying Aij, the
mean abundance of a species (i) in a habitat type (j) adjusted by the mean abundance of
that species in all other habitat types, by Bij, the relative frequency of a species in all
sites of a particular habitat type.
Aij = Nindividualsij / Nindividualsi
Bij = Nsitesij / Nsitesj
Indicator value (IV) = 100 X (Aij X Bij) (from Dufrêne and Legendre 1997)
Where Nindividualsij is the mean number of species i in habitat type j,
Nindividualsi is the mean abundance of species i in all habitat types, Nsitesij is the
number of sites in habitat type j where species i is present, and Nsitesj is the total
number of sites in that habitat type. The significance of the highest indicator value (IVmax)
for a given species across habitat types was determined by Monte Carlo permutation
tests (4999 iterations) by randomly re-assigning sample units to different groups and re-
calculating maximum indicator values. P-values were calculated as the proportion of
times IVmax from the randomized data is equal to or greater than IVmax from the actual
data (McCune and Grace 2002).
Influence of nesting resources on bee community composition
I used redundancy analysis to determine if differences in community composition
could be attributed to variation in nesting resources between the different habitat types
(package ‘vegan’ in R; Oksanen 2013). Redundancy analysis (RDA) is a constrained
ordination technique which models multivariate response variables as a function of
multiple explanatory variables (Legendre and Legendre 1998). RDA is basically a
principal component analysis on the fitted values from multiple linear regressions
between response and explanatory variables (Legendre and Legendre 1998). As such,
the relative position of sites in ordination space is constrained by the relationships
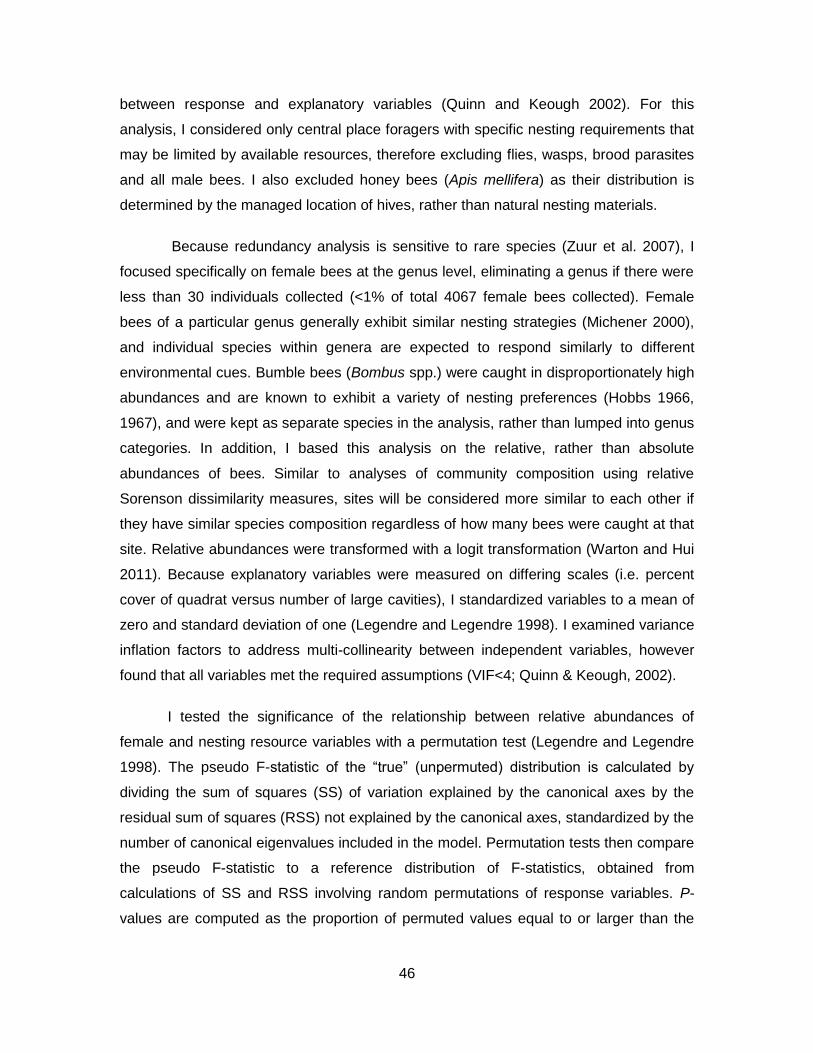
46
between response and explanatory variables (Quinn and Keough 2002). For this
analysis, I considered only central place foragers with specific nesting requirements that
may be limited by available resources, therefore excluding flies, wasps, brood parasites
and all male bees. I also excluded honey bees (Apis mellifera) as their distribution is
determined by the managed location of hives, rather than natural nesting materials.
Because redundancy analysis is sensitive to rare species (Zuur et al. 2007), I
focused specifically on female bees at the genus level, eliminating a genus if there were
less than 30 individuals collected (<1% of total 4067 female bees collected). Female
bees of a particular genus generally exhibit similar nesting strategies (Michener 2000),
and individual species within genera are expected to respond similarly to different
environmental cues. Bumble bees (Bombus spp.) were caught in disproportionately high
abundances and are known to exhibit a variety of nesting preferences (Hobbs 1966,
1967), and were kept as separate species in the analysis, rather than lumped into genus
categories. In addition, I based this analysis on the relative, rather than absolute
abundances of bees. Similar to analyses of community composition using relative
Sorenson dissimilarity measures, sites will be considered more similar to each other if
they have similar species composition regardless of how many bees were caught at that
site. Relative abundances were transformed with a logit transformation (Warton and Hui
2011). Because explanatory variables were measured on differing scales (i.e. percent
cover of quadrat versus number of large cavities), I standardized variables to a mean of
zero and standard deviation of one (Legendre and Legendre 1998). I examined variance
inflation factors to address multi-collinearity between independent variables, however
found that all variables met the required assumptions (VIF<4; Quinn & Keough, 2002).
I tested the significance of the relationship between relative abundances of
female and nesting resource variables with a permutation test (Legendre and Legendre
1998). The pseudo F-statistic of the “true” (unpermuted) distribution is calculated by
dividing the sum of squares (SS) of variation explained by the canonical axes by the
residual sum of squares (RSS) not explained by the canonical axes, standardized by the
number of canonical eigenvalues included in the model. Permutation tests then compare
the pseudo F-statistic to a reference distribution of F-statistics, obtained from
calculations of SS and RSS involving random permutations of response variables. P-
values are computed as the proportion of permuted values equal to or larger than the
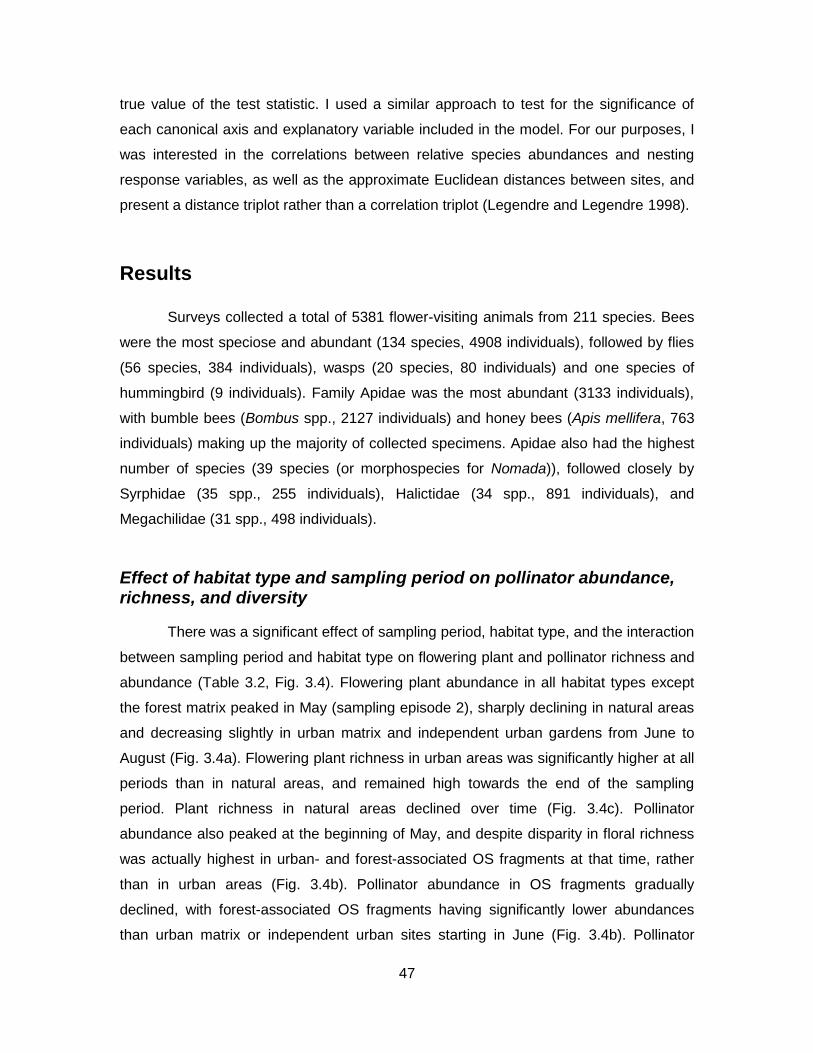
47
true value of the test statistic. I used a similar approach to test for the significance of
each canonical axis and explanatory variable included in the model. For our purposes, I
was interested in the correlations between relative species abundances and nesting
response variables, as well as the approximate Euclidean distances between sites, and
present a distance triplot rather than a correlation triplot (Legendre and Legendre 1998).
Results
Surveys collected a total of 5381 flower-visiting animals from 211 species. Bees
were the most speciose and abundant (134 species, 4908 individuals), followed by flies
(56 species, 384 individuals), wasps (20 species, 80 individuals) and one species of
hummingbird (9 individuals). Family Apidae was the most abundant (3133 individuals),
with bumble bees (Bombus spp., 2127 individuals) and honey bees (Apis mellifera, 763
individuals) making up the majority of collected specimens. Apidae also had the highest
number of species (39 species (or morphospecies for Nomada)), followed closely by
Syrphidae (35 spp., 255 individuals), Halictidae (34 spp., 891 individuals), and
Megachilidae (31 spp., 498 individuals).
Effect of habitat type and sampling period on pollinator abundance, richness, and diversity
There was a significant effect of sampling period, habitat type, and the interaction
between sampling period and habitat type on flowering plant and pollinator richness and
abundance (Table 3.2, Fig. 3.4). Flowering plant abundance in all habitat types except
the forest matrix peaked in May (sampling episode 2), sharply declining in natural areas
and decreasing slightly in urban matrix and independent urban gardens from June to
August (Fig. 3.4a). Flowering plant richness in urban areas was significantly higher at all
periods than in natural areas, and remained high towards the end of the sampling
period. Plant richness in natural areas declined over time (Fig. 3.4c). Pollinator
abundance also peaked at the beginning of May, and despite disparity in floral richness
was actually highest in urban- and forest-associated OS fragments at that time, rather
than in urban areas (Fig. 3.4b). Pollinator abundance in OS fragments gradually
declined, with forest-associated OS fragments having significantly lower abundances
than urban matrix or independent urban sites starting in June (Fig. 3.4b). Pollinator
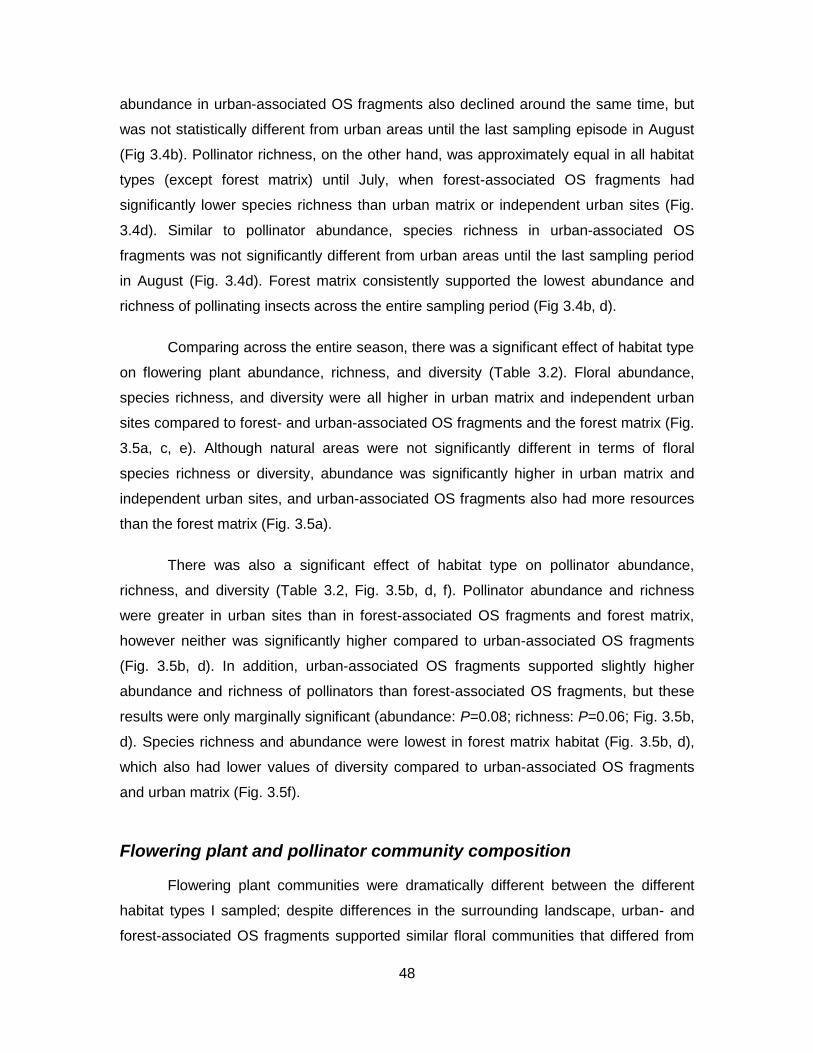
48
abundance in urban-associated OS fragments also declined around the same time, but
was not statistically different from urban areas until the last sampling episode in August
(Fig 3.4b). Pollinator richness, on the other hand, was approximately equal in all habitat
types (except forest matrix) until July, when forest-associated OS fragments had
significantly lower species richness than urban matrix or independent urban sites (Fig.
3.4d). Similar to pollinator abundance, species richness in urban-associated OS
fragments was not significantly different from urban areas until the last sampling period
in August (Fig. 3.4d). Forest matrix consistently supported the lowest abundance and
richness of pollinating insects across the entire sampling period (Fig 3.4b, d).
Comparing across the entire season, there was a significant effect of habitat type
on flowering plant abundance, richness, and diversity (Table 3.2). Floral abundance,
species richness, and diversity were all higher in urban matrix and independent urban
sites compared to forest- and urban-associated OS fragments and the forest matrix (Fig.
3.5a, c, e). Although natural areas were not significantly different in terms of floral
species richness or diversity, abundance was significantly higher in urban matrix and
independent urban sites, and urban-associated OS fragments also had more resources
than the forest matrix (Fig. 3.5a).
There was also a significant effect of habitat type on pollinator abundance,
richness, and diversity (Table 3.2, Fig. 3.5b, d, f). Pollinator abundance and richness
were greater in urban sites than in forest-associated OS fragments and forest matrix,
however neither was significantly higher compared to urban-associated OS fragments
(Fig. 3.5b, d). In addition, urban-associated OS fragments supported slightly higher
abundance and richness of pollinators than forest-associated OS fragments, but these
results were only marginally significant (abundance: P=0.08; richness: P=0.06; Fig. 3.5b,
d). Species richness and abundance were lowest in forest matrix habitat (Fig. 3.5b, d),
which also had lower values of diversity compared to urban-associated OS fragments
and urban matrix (Fig. 3.5f).
Flowering plant and pollinator community composition
Flowering plant communities were dramatically different between the different
habitat types I sampled; despite differences in the surrounding landscape, urban- and
forest-associated OS fragments supported similar floral communities that differed from
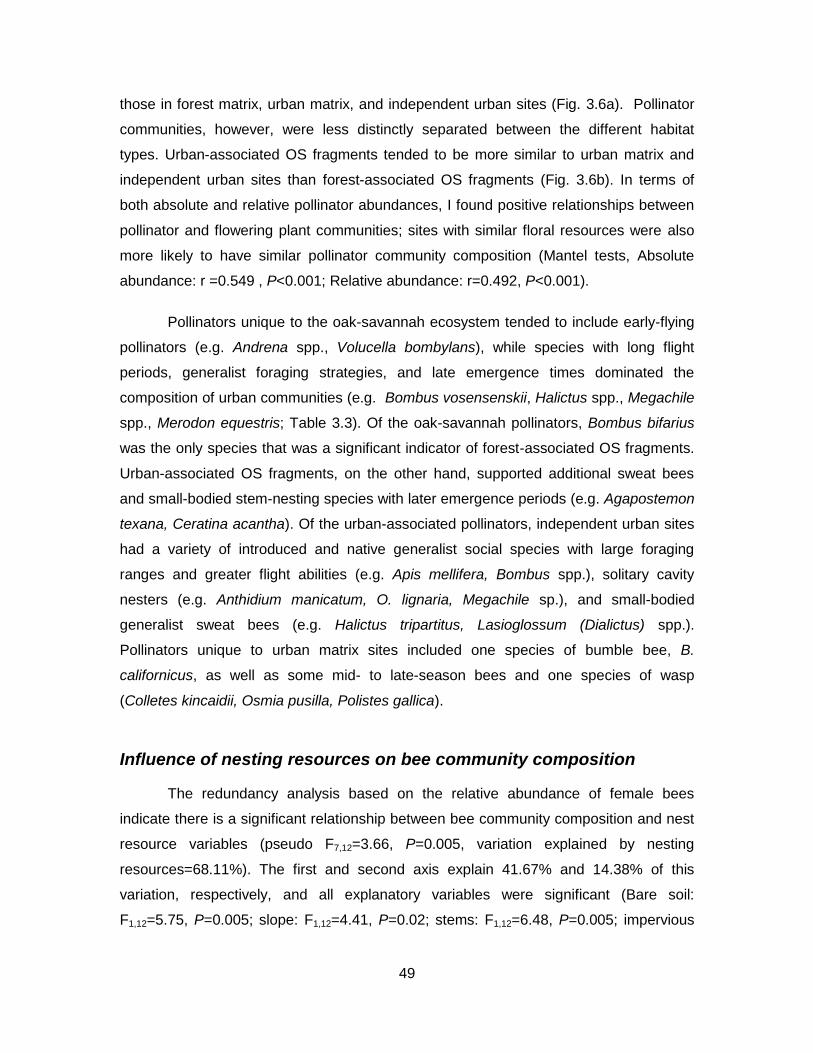
49
those in forest matrix, urban matrix, and independent urban sites (Fig. 3.6a). Pollinator
communities, however, were less distinctly separated between the different habitat
types. Urban-associated OS fragments tended to be more similar to urban matrix and
independent urban sites than forest-associated OS fragments (Fig. 3.6b). In terms of
both absolute and relative pollinator abundances, I found positive relationships between
pollinator and flowering plant communities; sites with similar floral resources were also
more likely to have similar pollinator community composition (Mantel tests, Absolute
abundance: r =0.549 , P<0.001; Relative abundance: r=0.492, P<0.001).
Pollinators unique to the oak-savannah ecosystem tended to include early-flying
pollinators (e.g. Andrena spp., Volucella bombylans), while species with long flight
periods, generalist foraging strategies, and late emergence times dominated the
composition of urban communities (e.g. Bombus vosensenskii, Halictus spp., Megachile
spp., Merodon equestris; Table 3.3). Of the oak-savannah pollinators, Bombus bifarius
was the only species that was a significant indicator of forest-associated OS fragments.
Urban-associated OS fragments, on the other hand, supported additional sweat bees
and small-bodied stem-nesting species with later emergence periods (e.g. Agapostemon
texana, Ceratina acantha). Of the urban-associated pollinators, independent urban sites
had a variety of introduced and native generalist social species with large foraging
ranges and greater flight abilities (e.g. Apis mellifera, Bombus spp.), solitary cavity
nesters (e.g. Anthidium manicatum, O. lignaria, Megachile sp.), and small-bodied
generalist sweat bees (e.g. Halictus tripartitus, Lasioglossum (Dialictus) spp.).
Pollinators unique to urban matrix sites included one species of bumble bee, B.
californicus, as well as some mid- to late-season bees and one species of wasp
(Colletes kincaidii, Osmia pusilla, Polistes gallica).
Influence of nesting resources on bee community composition
The redundancy analysis based on the relative abundance of female bees
indicate there is a significant relationship between bee community composition and nest
resource variables (pseudo F7,12=3.66, P=0.005, variation explained by nesting
resources=68.11%). The first and second axis explain 41.67% and 14.38% of this
variation, respectively, and all explanatory variables were significant (Bare soil:
F1,12=5.75, P=0.005; slope: F1,12=4.41, P=0.02; stems: F1,12=6.48, P=0.005; impervious
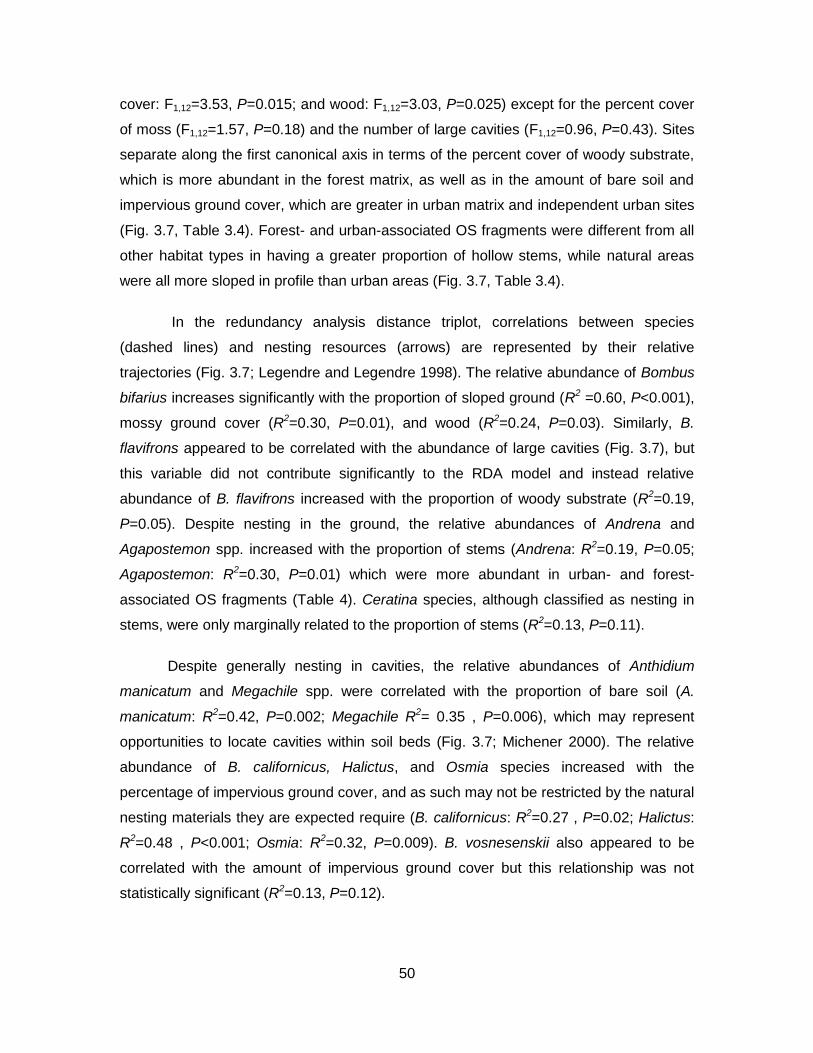
50
cover: F1,12=3.53, P=0.015; and wood: F1,12=3.03, P=0.025) except for the percent cover
of moss (F1,12=1.57, P=0.18) and the number of large cavities (F1,12=0.96, P=0.43). Sites
separate along the first canonical axis in terms of the percent cover of woody substrate,
which is more abundant in the forest matrix, as well as in the amount of bare soil and
impervious ground cover, which are greater in urban matrix and independent urban sites
(Fig. 3.7, Table 3.4). Forest- and urban-associated OS fragments were different from all
other habitat types in having a greater proportion of hollow stems, while natural areas
were all more sloped in profile than urban areas (Fig. 3.7, Table 3.4).
In the redundancy analysis distance triplot, correlations between species
(dashed lines) and nesting resources (arrows) are represented by their relative
trajectories (Fig. 3.7; Legendre and Legendre 1998). The relative abundance of Bombus
bifarius increases significantly with the proportion of sloped ground (R2 =0.60, P<0.001),
mossy ground cover (R2=0.30, P=0.01), and wood (R2=0.24, P=0.03). Similarly, B.
flavifrons appeared to be correlated with the abundance of large cavities (Fig. 3.7), but
this variable did not contribute significantly to the RDA model and instead relative
abundance of B. flavifrons increased with the proportion of woody substrate (R2=0.19,
P=0.05). Despite nesting in the ground, the relative abundances of Andrena and
Agapostemon spp. increased with the proportion of stems (Andrena: R2=0.19, P=0.05;
Agapostemon: R2=0.30, P=0.01) which were more abundant in urban- and forest-
associated OS fragments (Table 4). Ceratina species, although classified as nesting in
stems, were only marginally related to the proportion of stems (R2=0.13, P=0.11).
Despite generally nesting in cavities, the relative abundances of Anthidium
manicatum and Megachile spp. were correlated with the proportion of bare soil (A.
manicatum: R2=0.42, P=0.002; Megachile R2= 0.35 , P=0.006), which may represent
opportunities to locate cavities within soil beds (Fig. 3.7; Michener 2000). The relative
abundance of B. californicus, Halictus, and Osmia species increased with the
percentage of impervious ground cover, and as such may not be restricted by the natural
nesting materials they are expected require (B. californicus: R2=0.27 , P=0.02; Halictus:
R2=0.48 , P<0.001; Osmia: R2=0.32, P=0.009). B. vosnesenskii also appeared to be
correlated with the amount of impervious ground cover but this relationship was not
statistically significant (R2=0.13, P=0.12).
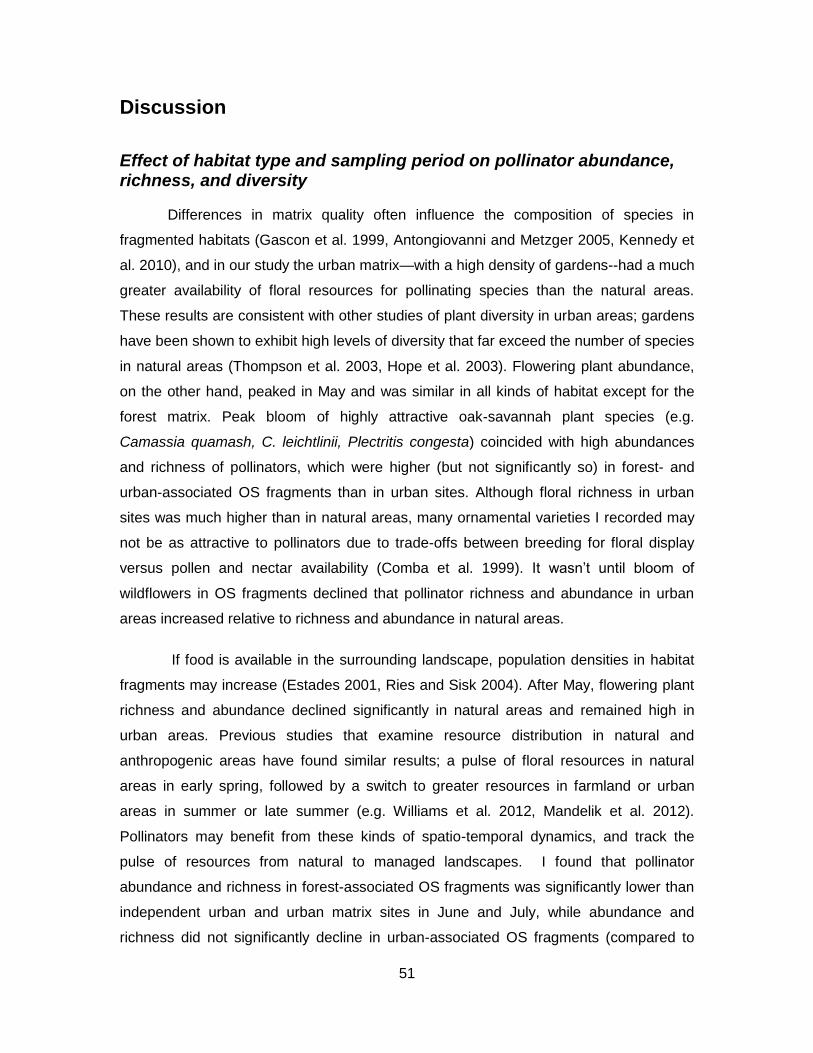
51
Discussion
Effect of habitat type and sampling period on pollinator abundance, richness, and diversity
Differences in matrix quality often influence the composition of species in
fragmented habitats (Gascon et al. 1999, Antongiovanni and Metzger 2005, Kennedy et
al. 2010), and in our study the urban matrix—with a high density of gardens--had a much
greater availability of floral resources for pollinating species than the natural areas.
These results are consistent with other studies of plant diversity in urban areas; gardens
have been shown to exhibit high levels of diversity that far exceed the number of species
in natural areas (Thompson et al. 2003, Hope et al. 2003). Flowering plant abundance,
on the other hand, peaked in May and was similar in all kinds of habitat except for the
forest matrix. Peak bloom of highly attractive oak-savannah plant species (e.g.
Camassia quamash, C. leichtlinii, Plectritis congesta) coincided with high abundances
and richness of pollinators, which were higher (but not significantly so) in forest- and
urban-associated OS fragments than in urban sites. Although floral richness in urban
sites was much higher than in natural areas, many ornamental varieties I recorded may
not be as attractive to pollinators due to trade-offs between breeding for floral display
versus pollen and nectar availability (Comba et al. 1999). It wasn’t until bloom of
wildflowers in OS fragments declined that pollinator richness and abundance in urban
areas increased relative to richness and abundance in natural areas.
If food is available in the surrounding landscape, population densities in habitat
fragments may increase (Estades 2001, Ries and Sisk 2004). After May, flowering plant
richness and abundance declined significantly in natural areas and remained high in
urban areas. Previous studies that examine resource distribution in natural and
anthropogenic areas have found similar results; a pulse of floral resources in natural
areas in early spring, followed by a switch to greater resources in farmland or urban
areas in summer or late summer (e.g. Williams et al. 2012, Mandelik et al. 2012).
Pollinators may benefit from these kinds of spatio-temporal dynamics, and track the
pulse of resources from natural to managed landscapes. I found that pollinator
abundance and richness in forest-associated OS fragments was significantly lower than
independent urban and urban matrix sites in June and July, while abundance and
richness did not significantly decline in urban-associated OS fragments (compared to

52
urban sites) until our last sampling episode in August. Previous studies have shown that
production of offspring can be affected by increased flight distances to forage rewards
(Peterson and Roitberg 2006, Zurbuchen et al. 2010). Because there are few resources
available in forest-associated OS fragments and the forest matrix from June onwards,
pollinators nesting in these areas may be expending more energy on long-distance
foraging than on reproduction, influencing population sizes and potentially restricting
late-season species from establishing in these areas.
Pollinator abundance, richness and diversity were not significantly different
between urban-associated OS fragments, urban matrix or independent urban sites, but
abundance and richness was significantly lower in forest-associated OS fragments and
the forest matrix compared to urban sites. In addition, pollinator abundance and richness
were marginally lower in forest-associated compared to urban-associated OS fragments.
Species richness of wild bees has been shown to decline with increasing distance from
natural habitat when there are insufficient floral resources in the surrounding landscape,
but not when resources are abundant (Jauker et al. 2009). Similarly, the richness and
abundance of bees in fallow strips adjacent to crop fields was enhanced by organic
agriculture in the surrounding matrix, which had greater availability of floral resources
than conventional agriculture (Holzschuh et al. 2008). Differences between habitat types
in our study were not due to differences in within-fragment quality of floral resources, as
forest- and urban-associated OS fragments did not differ in terms of species richness or
abundance of plant species. Instead, I believe that high richness and abundance of
pollinators in urban-associated OS fragments was due to supplementary and
complementary habitat use of residential gardens in the urban matrix (Dunning et al.
1992).
It is important to note, however, that diversity in forest-associated OS fragments
was not significantly different from urban matrix or independent urban sites, and
pollinator abundance and richness was only marginally lower in forest-associated than in
urban-associated OS fragments. Despite the forest matrix having comparatively little in
terms of floral richness and abundance, forest-associated OS fragments are still capable
of supporting comparatively high abundance, richness, and diversity of pollinating
insects as those surrounded by a high quality matrix with abundant floral resources. In
addition, forest-associated OS fragments had a lower abundance of a late-season
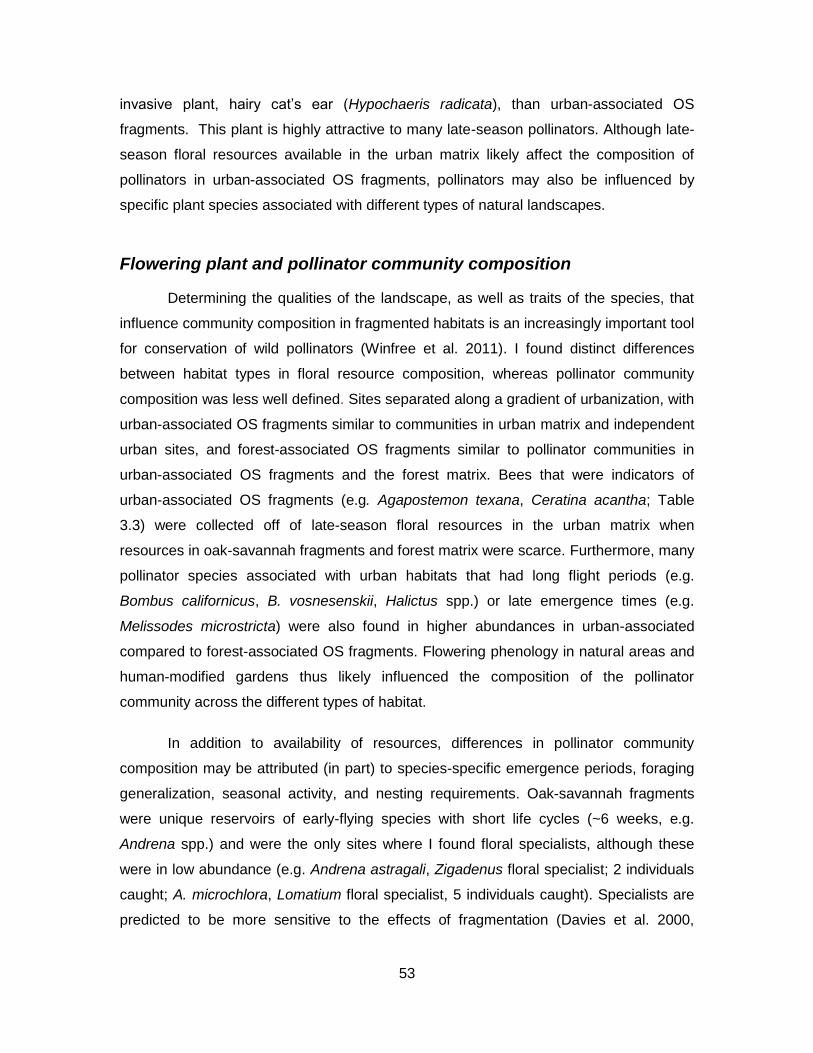
53
invasive plant, hairy cat’s ear (Hypochaeris radicata), than urban-associated OS
fragments. This plant is highly attractive to many late-season pollinators. Although late-
season floral resources available in the urban matrix likely affect the composition of
pollinators in urban-associated OS fragments, pollinators may also be influenced by
specific plant species associated with different types of natural landscapes.
Flowering plant and pollinator community composition
Determining the qualities of the landscape, as well as traits of the species, that
influence community composition in fragmented habitats is an increasingly important tool
for conservation of wild pollinators (Winfree et al. 2011). I found distinct differences
between habitat types in floral resource composition, whereas pollinator community
composition was less well defined. Sites separated along a gradient of urbanization, with
urban-associated OS fragments similar to communities in urban matrix and independent
urban sites, and forest-associated OS fragments similar to pollinator communities in
urban-associated OS fragments and the forest matrix. Bees that were indicators of
urban-associated OS fragments (e.g. Agapostemon texana, Ceratina acantha; Table
3.3) were collected off of late-season floral resources in the urban matrix when
resources in oak-savannah fragments and forest matrix were scarce. Furthermore, many
pollinator species associated with urban habitats that had long flight periods (e.g.
Bombus californicus, B. vosnesenskii, Halictus spp.) or late emergence times (e.g.
Melissodes microstricta) were also found in higher abundances in urban-associated
compared to forest-associated OS fragments. Flowering phenology in natural areas and
human-modified gardens thus likely influenced the composition of the pollinator
community across the different types of habitat.
In addition to availability of resources, differences in pollinator community
composition may be attributed (in part) to species-specific emergence periods, foraging
generalization, seasonal activity, and nesting requirements. Oak-savannah fragments
were unique reservoirs of early-flying species with short life cycles (~6 weeks, e.g.
Andrena spp.) and were the only sites where I found floral specialists, although these
were in low abundance (e.g. Andrena astragali, Zigadenus floral specialist; 2 individuals
caught; A. microchlora, Lomatium floral specialist, 5 individuals caught). Specialists are
predicted to be more sensitive to the effects of fragmentation (Davies et al. 2000,
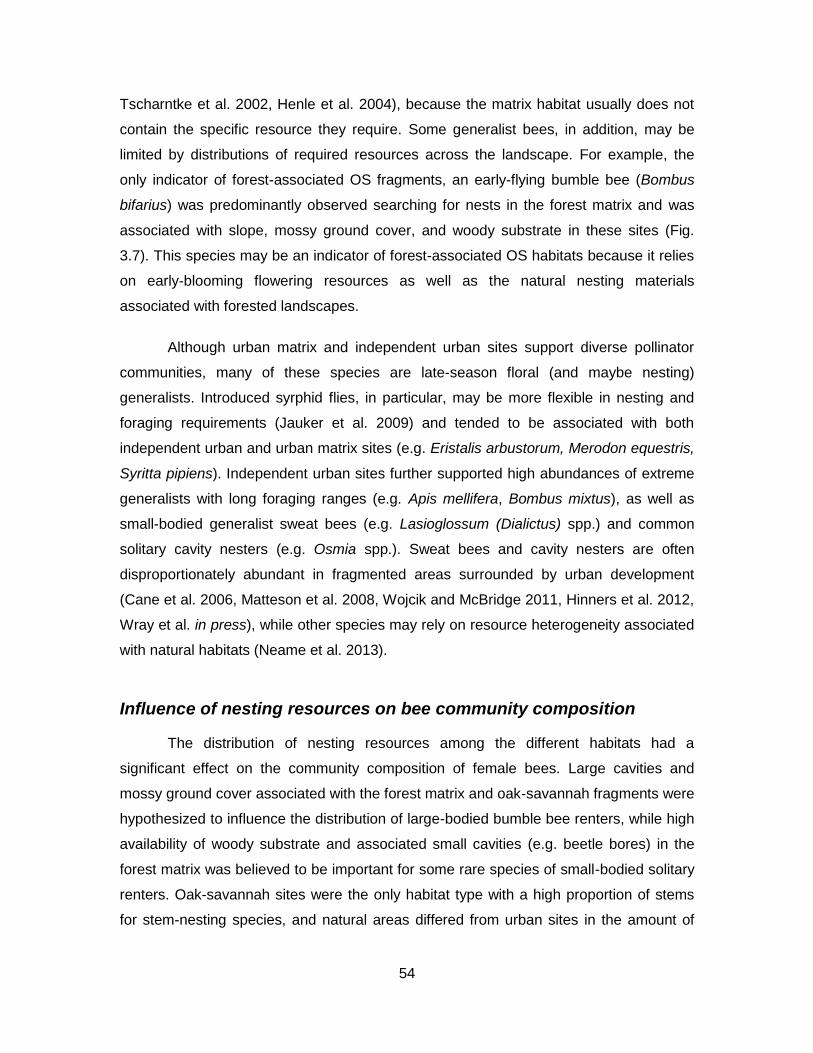
54
Tscharntke et al. 2002, Henle et al. 2004), because the matrix habitat usually does not
contain the specific resource they require. Some generalist bees, in addition, may be
limited by distributions of required resources across the landscape. For example, the
only indicator of forest-associated OS fragments, an early-flying bumble bee (Bombus
bifarius) was predominantly observed searching for nests in the forest matrix and was
associated with slope, mossy ground cover, and woody substrate in these sites (Fig.
3.7). This species may be an indicator of forest-associated OS habitats because it relies
on early-blooming flowering resources as well as the natural nesting materials
associated with forested landscapes.
Although urban matrix and independent urban sites support diverse pollinator
communities, many of these species are late-season floral (and maybe nesting)
generalists. Introduced syrphid flies, in particular, may be more flexible in nesting and
foraging requirements (Jauker et al. 2009) and tended to be associated with both
independent urban and urban matrix sites (e.g. Eristalis arbustorum, Merodon equestris,
Syritta pipiens). Independent urban sites further supported high abundances of extreme
generalists with long foraging ranges (e.g. Apis mellifera, Bombus mixtus), as well as
small-bodied generalist sweat bees (e.g. Lasioglossum (Dialictus) spp.) and common
solitary cavity nesters (e.g. Osmia spp.). Sweat bees and cavity nesters are often
disproportionately abundant in fragmented areas surrounded by urban development
(Cane et al. 2006, Matteson et al. 2008, Wojcik and McBridge 2011, Hinners et al. 2012,
Wray et al. in press), while other species may rely on resource heterogeneity associated
with natural habitats (Neame et al. 2013).
Influence of nesting resources on bee community composition
The distribution of nesting resources among the different habitats had a
significant effect on the community composition of female bees. Large cavities and
mossy ground cover associated with the forest matrix and oak-savannah fragments were
hypothesized to influence the distribution of large-bodied bumble bee renters, while high
availability of woody substrate and associated small cavities (e.g. beetle bores) in the
forest matrix was believed to be important for some rare species of small-bodied solitary
renters. Oak-savannah sites were the only habitat type with a high proportion of stems
for stem-nesting species, and natural areas differed from urban sites in the amount of
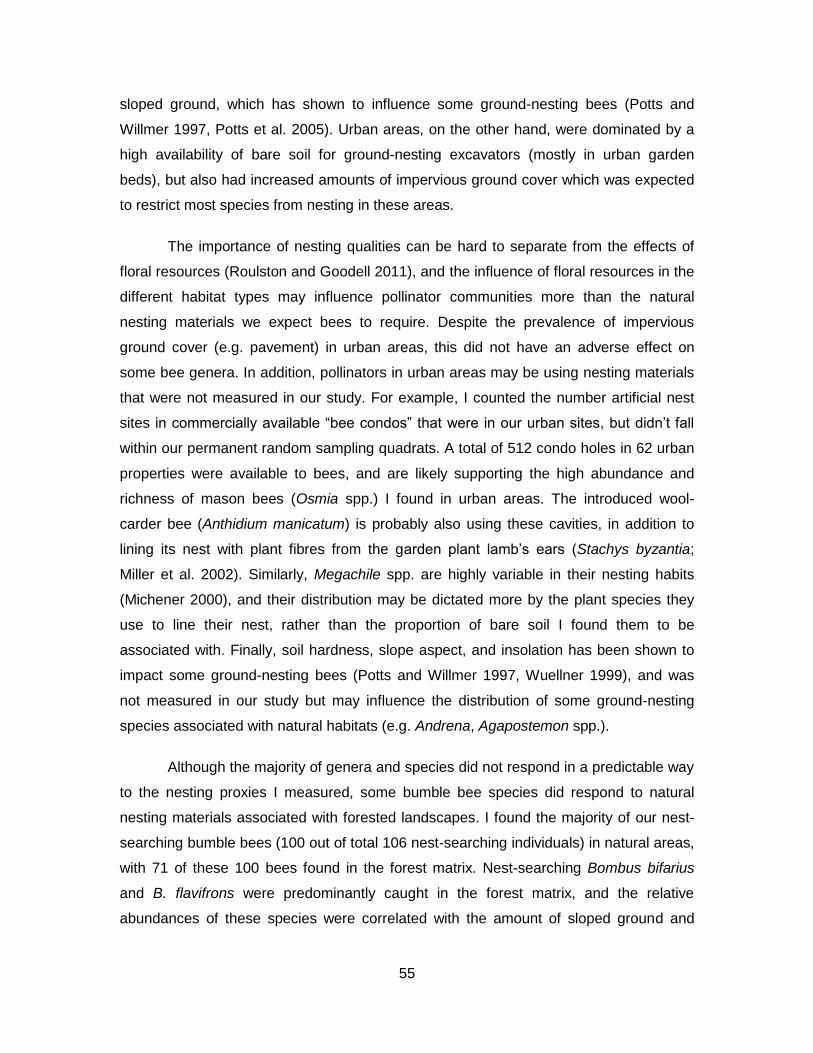
55
sloped ground, which has shown to influence some ground-nesting bees (Potts and
Willmer 1997, Potts et al. 2005). Urban areas, on the other hand, were dominated by a
high availability of bare soil for ground-nesting excavators (mostly in urban garden
beds), but also had increased amounts of impervious ground cover which was expected
to restrict most species from nesting in these areas.
The importance of nesting qualities can be hard to separate from the effects of
floral resources (Roulston and Goodell 2011), and the influence of floral resources in the
different habitat types may influence pollinator communities more than the natural
nesting materials we expect bees to require. Despite the prevalence of impervious
ground cover (e.g. pavement) in urban areas, this did not have an adverse effect on
some bee genera. In addition, pollinators in urban areas may be using nesting materials
that were not measured in our study. For example, I counted the number artificial nest
sites in commercially available “bee condos” that were in our urban sites, but didn’t fall
within our permanent random sampling quadrats. A total of 512 condo holes in 62 urban
properties were available to bees, and are likely supporting the high abundance and
richness of mason bees (Osmia spp.) I found in urban areas. The introduced wool-
carder bee (Anthidium manicatum) is probably also using these cavities, in addition to
lining its nest with plant fibres from the garden plant lamb’s ears (Stachys byzantia;
Miller et al. 2002). Similarly, Megachile spp. are highly variable in their nesting habits
(Michener 2000), and their distribution may be dictated more by the plant species they
use to line their nest, rather than the proportion of bare soil I found them to be
associated with. Finally, soil hardness, slope aspect, and insolation has been shown to
impact some ground-nesting bees (Potts and Willmer 1997, Wuellner 1999), and was
not measured in our study but may influence the distribution of some ground-nesting
species associated with natural habitats (e.g. Andrena, Agapostemon spp.).
Although the majority of genera and species did not respond in a predictable way
to the nesting proxies I measured, some bumble bee species did respond to natural
nesting materials associated with forested landscapes. I found the majority of our nest-
searching bumble bees (100 out of total 106 nest-searching individuals) in natural areas,
with 71 of these 100 bees found in the forest matrix. Nest-searching Bombus bifarius
and B. flavifrons were predominantly caught in the forest matrix, and the relative
abundances of these species were correlated with the amount of sloped ground and
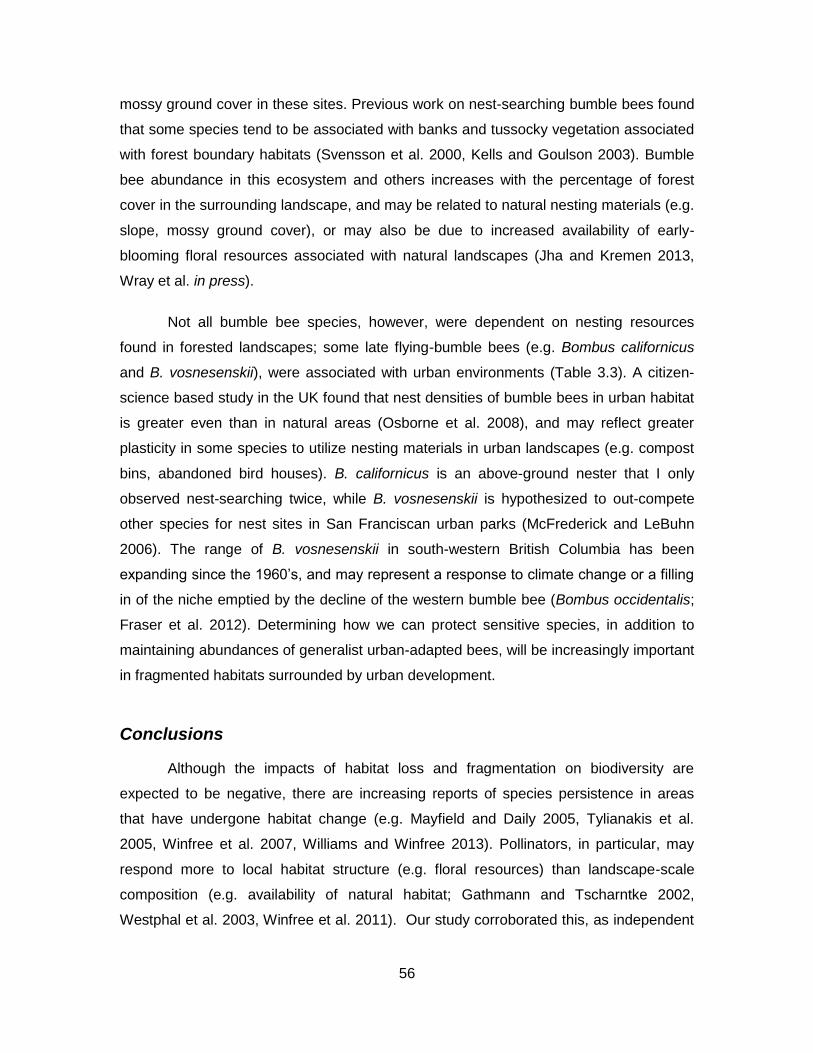
56
mossy ground cover in these sites. Previous work on nest-searching bumble bees found
that some species tend to be associated with banks and tussocky vegetation associated
with forest boundary habitats (Svensson et al. 2000, Kells and Goulson 2003). Bumble
bee abundance in this ecosystem and others increases with the percentage of forest
cover in the surrounding landscape, and may be related to natural nesting materials (e.g.
slope, mossy ground cover), or may also be due to increased availability of early-
blooming floral resources associated with natural landscapes (Jha and Kremen 2013,
Wray et al. in press).
Not all bumble bee species, however, were dependent on nesting resources
found in forested landscapes; some late flying-bumble bees (e.g. Bombus californicus
and B. vosnesenskii), were associated with urban environments (Table 3.3). A citizen-
science based study in the UK found that nest densities of bumble bees in urban habitat
is greater even than in natural areas (Osborne et al. 2008), and may reflect greater
plasticity in some species to utilize nesting materials in urban landscapes (e.g. compost
bins, abandoned bird houses). B. californicus is an above-ground nester that I only
observed nest-searching twice, while B. vosnesenskii is hypothesized to out-compete
other species for nest sites in San Franciscan urban parks (McFrederick and LeBuhn
2006). The range of B. vosnesenskii in south-western British Columbia has been
expanding since the 1960’s, and may represent a response to climate change or a filling
in of the niche emptied by the decline of the western bumble bee (Bombus occidentalis;
Fraser et al. 2012). Determining how we can protect sensitive species, in addition to
maintaining abundances of generalist urban-adapted bees, will be increasingly important
in fragmented habitats surrounded by urban development.
Conclusions
Although the impacts of habitat loss and fragmentation on biodiversity are
expected to be negative, there are increasing reports of species persistence in areas
that have undergone habitat change (e.g. Mayfield and Daily 2005, Tylianakis et al.
2005, Winfree et al. 2007, Williams and Winfree 2013). Pollinators, in particular, may
respond more to local habitat structure (e.g. floral resources) than landscape-scale
composition (e.g. availability of natural habitat; Gathmann and Tscharntke 2002,
Westphal et al. 2003, Winfree et al. 2011). Our study corroborated this, as independent
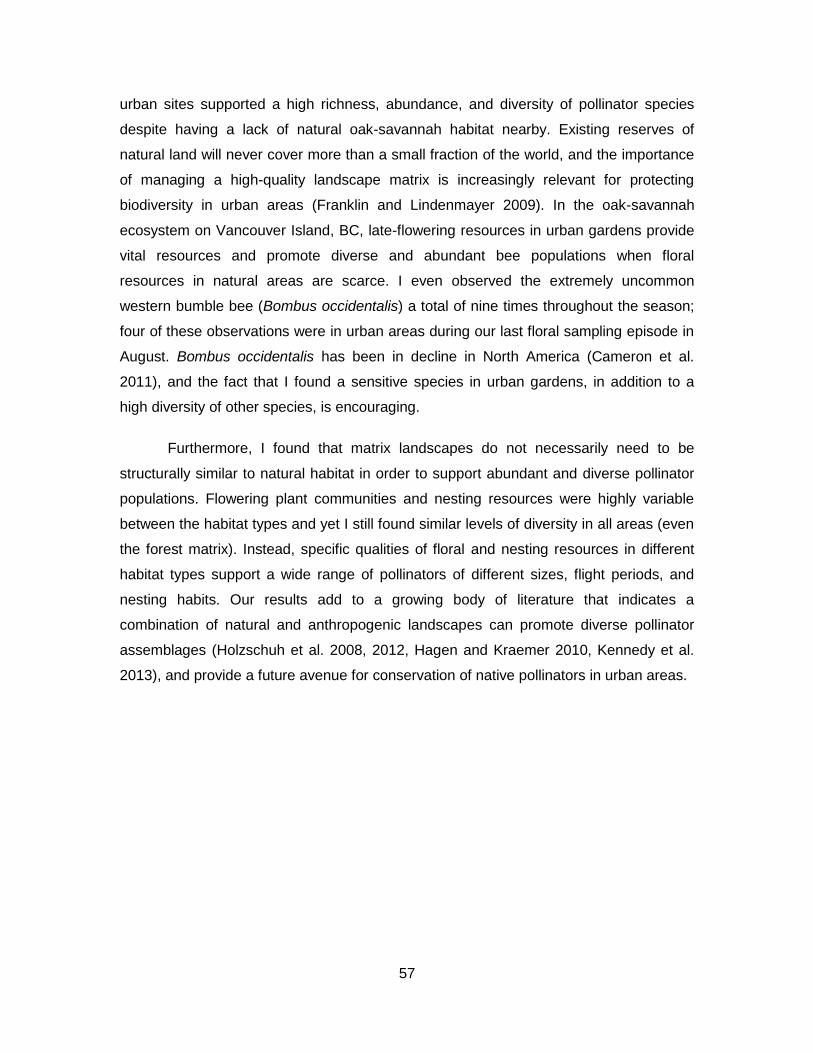
57
urban sites supported a high richness, abundance, and diversity of pollinator species
despite having a lack of natural oak-savannah habitat nearby. Existing reserves of
natural land will never cover more than a small fraction of the world, and the importance
of managing a high-quality landscape matrix is increasingly relevant for protecting
biodiversity in urban areas (Franklin and Lindenmayer 2009). In the oak-savannah
ecosystem on Vancouver Island, BC, late-flowering resources in urban gardens provide
vital resources and promote diverse and abundant bee populations when floral
resources in natural areas are scarce. I even observed the extremely uncommon
western bumble bee (Bombus occidentalis) a total of nine times throughout the season;
four of these observations were in urban areas during our last floral sampling episode in
August. Bombus occidentalis has been in decline in North America (Cameron et al.
2011), and the fact that I found a sensitive species in urban gardens, in addition to a
high diversity of other species, is encouraging.
Furthermore, I found that matrix landscapes do not necessarily need to be
structurally similar to natural habitat in order to support abundant and diverse pollinator
populations. Flowering plant communities and nesting resources were highly variable
between the habitat types and yet I still found similar levels of diversity in all areas (even
the forest matrix). Instead, specific qualities of floral and nesting resources in different
habitat types support a wide range of pollinators of different sizes, flight periods, and
nesting habits. Our results add to a growing body of literature that indicates a
combination of natural and anthropogenic landscapes can promote diverse pollinator
assemblages (Holzschuh et al. 2008, 2012, Hagen and Kraemer 2010, Kennedy et al.
2013), and provide a future avenue for conservation of native pollinators in urban areas.
58
References
Antongiovanni, M., and J. Metzger. 2005. Influence of matrix habitats on the occurrence of insectivorous bird species in Amazonian forest fragments. Biological Conservation 122:441–451.
Cameron, S. A., J. D. Lozier, J. P. Strange, J. B. Koch, N. Cordes, L. F. Solter, and T. L. Griswold. 2011. Patterns of widespread decline in North American bumble bees. Proceedings of the National Academy of Sciences of the United States of America 108:662–667.
Cane, J. H., R. L. Minckley, L. J. Kervin, T. H. Roulston, and N. M. Williams. 2006. Complex responses within a desert bee guild (Hymenoptera : Apiformes) to urban habitat fragmentation. Ecological Applications 16:632–644.
Comba, L., S. A. Corbet, A. Barron, A. Bird, S. Collinge, N. Miyazaki, and M. Powell. 1999. Garden flowers: Insect visits and the floral reward of horticulturally-modified variants. Annals of Botany 83:73–86.
Davies, K. F., C. R. Margules, and J. F. Lawrence. 2000. Which traits of species predict population declines in experimental forest fragments? Ecology 81:1450–1461.
Debinski, D. M., and R. D. Holt. 2000. A survey and overview of habitat fragmentation experiments. Conservation Biology 14:342–355.
Dufrêne, M., and P. Legendre. 1997. Species assemblages and indicator species: The need for a flexible asymmetrical approach. Ecological Monographs 67:345–366.
Dunning, J. B., B. J. Danielson, and H. R. Pulliam. 1992. Ecological processes that affect populations in complex landscapes. Oikos 65:169–175.
Ellis, E. C., K. K. Goldewijk, S. Siebert, D. Lightman, and N. Ramankutty. 2010. Anthropogenic transformation of the biomes, 1700 to 2000. Global Ecology and Biogeography 19:589–606.
Eltz, T., C. A. Brühl, S. van der Kaars, and K. E. Linsenmair. 2002. Determinants of stingless bee nest density in lowland dipterocarp forests of Sabah, Malaysia. Oecologia 131:27–34.
Estades, C. F. 2001. The effect of breeding-habitat patch size on bird population density. Landscape Ecology 16:161–173.
Fahrig, L. 2001. How much habitat is enough? Biological Conservation 100:65–74.
Fetridge, E. D., J. S. Ascher, and G. A. Langellotto. 2008. The bee fauna of residential gardens in a suburb of New York City (Hymenoptera: Apoidea). Annals of the Entomological Society of America 101:1067–1077.
59
Franklin, J. F., and D. B. Lindenmayer. 2009. Importance of matrix habitats in maintaining biological diversity. Proceedings of the National Academy of Sciences 106:349–350.
Fraser, D. F., C. R. Copley, E. Elle, and R. A. Cannings. 2012. Changes in the status and distribution of the Yellow-faced bumble bee (Bombus vosnesenskii) in British Columbia. Journal of the Entomological Society of British Columbia:31–37.
Fuchs, M. A. 2001. Towards a recovery strategy for Garry oak and associated ecosystems in Canada: Ecological assessment and literature review. Technical Report GBEI/EC-00-030.
Gascon, C., T. E. Lovejoy, R. O. Bierregaard Jr., J. R. Malcolm, P. C. Stouffer, H. L. Vasconcelos, W. F. Laurance, B. Zimmerman, M. Tocher, and S. Borges. 1999. Matrix habitat and species richness in tropical forest remnants. Biological Conservation 91:223–229.
Gathmann, A., and T. Tscharntke. 2002. Foraging ranges of solitary bees. Journal of Animal Ecology 71:757–764.
Greenleaf, S. S., N. M. Williams, R. Winfree, and C. Kremen. 2007. Bee foraging ranges and their relationship to body size. Oecologia 153:589–596.
Grimm, N. B., S. H. Faeth, N. E. Golubiewski, C. L. Redman, J. Wu, X. Bai, and J. M. Briggs. 2008. Global change and the ecology of cities. Science 319:756–760.
Hagen, M., and M. Kraemer. 2010. Agricultural surroundings support flower–visitor networks in an Afrotropical rain forest. Biological Conservation 143:1654–1663.
Hatfield, R., and G. LeBuhn. 2007. Patch and landscape factors shape community assemblage of bumble bees, Bombus spp. (Hymenoptera: Apidae), in montane meadows. Biological Conservation 139:150–158.
Henle, K., K. F. Davies, M. Kleyer, C. Margules, and J. Settele. 2004. Predictors of species sensitivity to fragmentation. Biodiversity and Conservation 13:207–251.
Hinners, S. J., C. a Kearns, and C. a Wessman. 2012. Roles of scale, matrix, and native habitat in supporting a diverse suburban pollinator assemblage. Ecological Applications 22:1923–1935.
Hobbs, G. 1967. Ecology of species of Bombus (Hymenoptera: Apidae) in southern Alberta VI. Subgenus Pyrobombus. The Canadian Entomologist 99:1271–1292.
Hobbs, G. A. 1966. Ecology of species of Bombus Latr. (Hymenoptera: Apidae) in southern Alberta. IV. Subgenus Fervidobombus Skorikov. The Canadian Entomologist 98:33–39.
Holzschuh, A., J.-H. Dudenhöffer, and T. Tscharntke. 2012. Landscapes with wild bee habitats enhance pollination, fruit set and yield of sweet cherry. Biological Conservation 153:101–107.
60
Holzschuh, A., I. Steffan-Dewenter, and T. Tscharntke. 2008. Agricultural landscapes with organic crops support higher pollinator diversity. Oikos 117:354–361.
Hope, D., C. Gries, W. Zhu, W. F. Fagan, C. L. Redman, N. B. Grimm, A. L. Nelson, C. Martin, and A. Kinzig. 2003. Socioeconomics drive urban plant diversity. Proceedings of the National Academy of Sciences of the United States of America 100:8788–92.
Jauker, F., T. Diekötter, F. Schwarzbach, and V. Wolters. 2009. Pollinator dispersal in an agricultural matrix: opposing responses of wild bees and hoverflies to landscape structure and distance from main habitat. Landscape Ecology 24:547–555.
Jha, S., and C. Kremen. 2013. Resource diversity and landscape-level homogeneity drive native bee foraging. Proceedings of the National Academy of Sciences of the United States of America 110:555–558.
Kells, A. R., and D. Goulson. 2003. Preferred nesting sites of bumblebee queens (Hymenoptera: Apidae) in agroecosystems in the UK. Biological Conservation 109:165–174.
Kennedy, C. M., E. Lonsdorf, M. C. Neel, N. M. Williams, T. H. Ricketts, R. Winfree, R. Bommarco, C. Brittain, A. L. Burley, D. Cariveau, L. G. Carvalheiro, N. P. Chacoff, S. a. Cunningham, B. N. Danforth, J.-H. Dudenhöffer, E. Elle, H. R. Gaines, L. a. Garibaldi, C. Gratton, A. Holzschuh, R. Isaacs, S. K. Javorek, S. Jha, A. M. Klein, K. Krewenka, Y. Mandelik, M. M. Mayfield, L. Morandin, L. a. Neame, M. Otieno, M. Park, S. G. Potts, M. Rundlöf, A. Saez, I. Steffan-Dewenter, H. Taki, B. F. Viana, C. Westphal, J. K. Wilson, S. S. Greenleaf, and C. Kremen. 2013. A global quantitative synthesis of local and landscape effects on wild bee pollinators in agroecosystems. Ecology Letters 16: 584-599.
Kennedy, C., P. Marra, W. Fagan, and M. Neel. 2010. Landscape matrix and species traits mediate responses of Neotropical resident birds to forest fragmentation in Jamaica. Ecological Monographs 80:651–669.
Kim, J., N. M. Williams, and C. Kremen. 2006. Effects of cultivation and proximity to natural habitat on ground-nesting native bees in California sunflower fields. Journal of the Kansas Entomological Society 79:309–320.
Kleijn, D., and F. van Langevelde. 2006. Interacting effects of landscape context and habitat quality on flower visiting insects in agricultural landscapes. Basic and Applied Ecology 7:201–214.
Laurance, W. 2008. Theory meets reality: How habitat fragmentation research has transcended island biogeographic theory. Biological Conservation 141:1731–1744.
Legendre, P., and M. J. Fortin. 1989. Spatial pattern and ecological analysis. Vegetatio 80:107–138.
Legendre, P., and L. Legendre. 1998. Numerical Ecology, 2nd edition. Elsevier Science B. V., Amsterdam, Netherlands.
61
MacDougall, A. S., B. R. Beckwith, and C. Y. Maslovat. 2004. Defining conservation strategies with historical perspectives: a case study from a degraded oak grassland ecosystem. Conservation Biology 18:455–465.
Mandelik, Y., R. Winfree, T. Neeson, and C. Kremen. 2012. Complementary habitat use by wild bees in agro-natural landscapes. Ecological Applications 22:1535–1546.
Matteson, K. C., and J. S. Ascher. 2008. Bee richness and abundance in New York City urban gardens. Annals of the Entomological Society of America 101:140–150.
Mayfield, M. M., and G. C. Daily. 2005. Countryside biogeography of neotropical herbaceous and shrubby plants. Ecological Applications 15:423–439.
McCune, B., and J. B. Grace. 2002. Analysis of Ecological Communities. Pages 1–300. . MjM Software Design, Gleneden Beach, Oregon, USA.
McCune, B., and M. J. Mefford. 2005. PC-ORD, Multivariate analysis of ecological data, Version 5 for Windows edition. MjM Software Design, Gleneden Beach, Oregon, USA.
McFrederick, Q. S., and G. LeBuhn. 2006. Are urban parks refuges for bumble bees Bombus spp. (Hymenoptera: Apidae)? Biological Conservation 129:372–382.
McKinney, M. L. 2002. Urbanization, biodiversity, and conservation. BioScience 52:883–890.
Meyer, B., F. Jauker, and I. Steffan-Dewenter. 2009. Contrasting resource-dependent responses of hoverfly richness and density to landscape structure. Basic and Applied Ecology 10:178–186.
Miller, S. R., R. Gaebel, R. J. Mitchell, and M. Arduser. 2002. Occurrence of two species of old world bees, Anthidium manicatum and A. oblongatum (Apoidea: Megachilidae), in northern Ohio and southern Michigan. The Great Lakes Entomologist 35:65–70.
Neame, L. A., T. Griswold, and E. Elle. 2013. Pollinator nesting guilds respond differently to urban habitat fragmentation in an oak-savannah ecosystem. Insect Conservation and Diversity 6:57–66.
Oksanen, A. J., F. G. Blanchet, R. Kindt, P. Legendre, P. R. Minchin, R. B. O. Hara, G. L. Simpson, P. Solymos, M. H. H. Stevens, and H. Wagner. 2013. Package “ vegan ”1–264.< http://vegan.r-forge.r-project.org/>
Osborne, J. L., A. P. Martin, C. R. Shortall, A. D. Todd, D. Goulson, M. E. Knight, R. J. Hale, and R. a. Sanderson. 2008. Quantifying and comparing bumblebee nest densities in gardens and countryside habitats. Journal of Applied Ecology 45:784–792.
Pebesma, A. E., and R. Bivand. 2013. Package “ sp ”1–104. <http://rspatial.r-forge.r-project.org/>
62
Perfecto, I., and J. Vandermeer. 2002. Quality of agroecological matrix in a tropical montane landscape: ants in coffee plantations in southern Mexico. Conservation Biology 16:174–182.
Peterson, J. H., and B. D. Roitberg. 2006. Impacts of flight distance on sex ratio and resource allocation to offspring in the leafcutter bee, Megachile rotundata. Behavioral Ecology and Sociobiology 59:589–596.
Potts, S. G., J. C. Biesmeijer, C. Kremen, P. Neumann, O. Schweiger, and W. E. Kunin. 2010. Global pollinator declines: trends, impacts and drivers. Trends in Ecology & Evolution 25:345–353.
Potts, S. G., B. Vulliamy, A. Dafni, G. Ne’eman, and P. Willmer. 2003. Linking bees and flowers: How do floral communities structure pollinator communities? Ecology 84:2628–2642.
Potts, S. G., and P. Willmer. 1997. Abiotic and biotic factors influencing nest-site selection by Halictus rubicundus, a ground-nesting halictine bee. Ecological Entomology 22:319–328.
Quinn, G. P., and M. J. Keough. 2002. Experimental Design and Data Analysis for Biologists. Pages 1–537. . Cambridge University Press, Cambridge, UK.
R Core Team. 2013. R: A language and environment for statistical computing. . R Foundation for Statistical Computing, Vienna, Austria.
Ries, L., and T. D. Sisk. 2004. A predictive model of edge effects. Ecology 85:2917–2926.
Roulston, T. H., and K. Goodell. 2011. The role of resources and risks in regulating wild bee populations. Annual Review of Entomology 56:293–312.
SAS Institute. 2011. SAS/STAT Software version 9.3. . SAS Institute Inc, Cary, North Carolina, USA.
Statistics Canada. 2012. Victoria, British Columbia (Code 935) and British Columbia (Code 59) (table). Census Profile. 2011 Census. Statistics Canada Catalogue no. 98-316-XWE. Ottawa. Released October 24, 2012. <http://www12.statcan.gc.ca/census-recensement/2011/dp-pd/prof/index.cfm?Lang=E>
Svensson, B., J. Lagerlöf, and B. G. Svensson. 2000. Habitat preferences of nest-seeking bumble bees (Hymenoptera: Apidae) in an agricultural landscape. Agriculture, Ecosystems & Environment 77:247–255.
Thompson, K., K. Austin, R. Smith, P. Warren, P. Angold, and K. Gaston. 2003. Urban domestic gardens (I): Putting small-scale plant diversity in context. Journal of Vegetation Science 14:71–78.
Tommasi, D., A. Miro, H. A. Higo, and M. L. Winston. 2004. Bee diversity and abundance in an urban setting. Canadian Entomologist 136:851–869.
63
Tscharntke, T., I. Steffan-Dewenter, A. Kruess, and C. Thies. 2002. Characteristics of insect populations on habitat fragments: A mini review. Ecological Research 17:229–239.
Tylianakis, J. M., A.-M. Klein, and T. Tscharntke. 2005. Spatiotemporal variation in the diversity of Hymenoptera across a tropical habitat gradient. Ecology 86:3296–3302.
UCLA: Statistical Consulting Group. 2013. R FAQ: How can I calculate Moran’s I in R? <http://www.ats.ucla.edu/stat/r/faq/morans_i.htm>
Vellend, M., A. D. Bjorkman, and A. McConchie. 2008. Environmentally biased fragmentation of oak savanna habitat on southeastern Vancouver Island, Canada. Biological Conservation 141:2576–2584.
Warton, D. I., and F. K. C. Hui. 2011. The arcsine is asinine: the analysis of proportions in ecology. Ecology 92:3–10.
Westphal, C., I. Steffan-Dewenter, and T. Tscharntke. 2003. Mass flowering crops enhance pollinator densities at a landscape scale. Ecology Letters 6:961–965.
Westrich, P. 1996. Habitat requirements of central European bees and the problems of partial habitats. Pages 1–16 in A. Matheson, S. Buchanan, C. O’Toole, P. Westrich, and I. H. Williams, editors. The Conservation of Bees. . Academic Press, London, UK.
Williams, N. M., and C. Kremen. 2007. Resource distributions among habitats determine solitary bee offspring production in a mosaic landscape. Ecological Applications 17:910–921.
Williams, N. M., J. Regetz, and C. Kremen. 2012. Landscape-scale resources promote colony growth but not reproductive performance of bumble bees. Ecology 93:1049–1058.
Williams, N. M., and R. Winfree. 2013. Local habitat characteristics but not landscape urbanization drive pollinator visitation and native plant pollination in forest remnants. Biological Conservation 160:10–18.
Winfree, R., R. Aguilar, D. P. Vázquez, G. LeBuhn, and M. A. Aizen. 2009. A meta-analysis of bees’ responses to anthropogenic disturbance. Ecology 90:2068–2076.
Winfree, R., I. Bartomeus, and D. P. Cariveau. 2011. Native pollinators in anthropogenic habitats. Annual Review of Ecology, Evolution, and Systematics 42:1–22.
Winfree, R., T. Griswold, and C. Kremen. 2007. Effect of human disturbance on bee communities in a forested ecosystem. Conservation Biology 21:213–223.
Wojcik, V. a., and J. R. McBride. 2011. Common factors influence bee foraging in urban and wildland landscapes. Urban Ecosystems 15:581–598.
64
Wray, J. C., L. A. Neame, and E. Elle. In press. Floral resources, body size, and surrounding landscape influence bee community assemblages in oak-savannah. Ecological Entomology.
Wuellner, C. T. 1999. Nest site preference and success in a gregarious, ground-nesting bee Dieunomia triangulifera. Ecological Entomology 24:471–479.
Zurbuchen, A., S. Cheesman, J. Klaiber, A. Müller, S. Hein, and S. Dorn. 2010. Long foraging distances impose high costs on offspring production in solitary bees. Journal of Animal Ecology 79:674–681.
Zuur, A. F., E. N. Ieno, and G. M. Smit. 2007. Analysing Ecological Data. . Springer Press, New York, New York, USA.
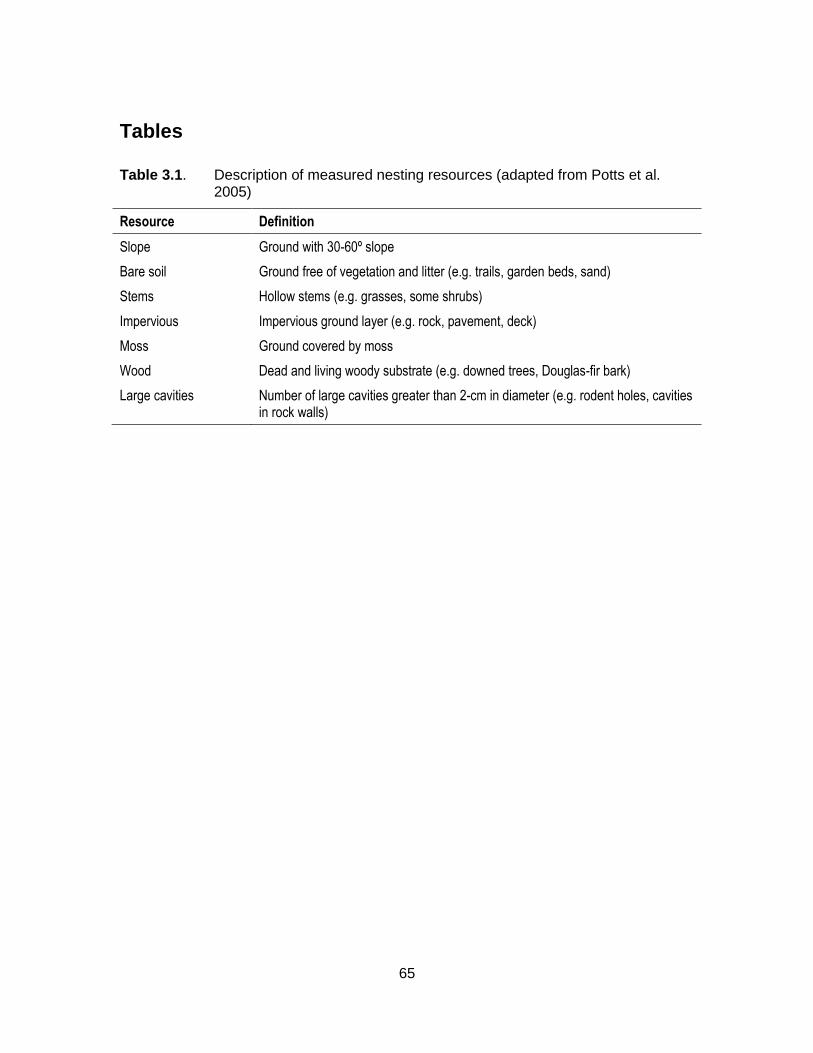
65
Tables
Table 3.1. Description of measured nesting resources (adapted from Potts et al. 2005)
Resource Definition
Slope Ground with 30-60º slope
Bare soil Ground free of vegetation and litter (e.g. trails, garden beds, sand)
Stems Hollow stems (e.g. grasses, some shrubs)
Impervious Impervious ground layer (e.g. rock, pavement, deck)
Moss Ground covered by moss
Wood Dead and living woody substrate (e.g. downed trees, Douglas-fir bark)
Large cavities Number of large cavities greater than 2-cm in diameter (e.g. rodent holes, cavities in rock walls)
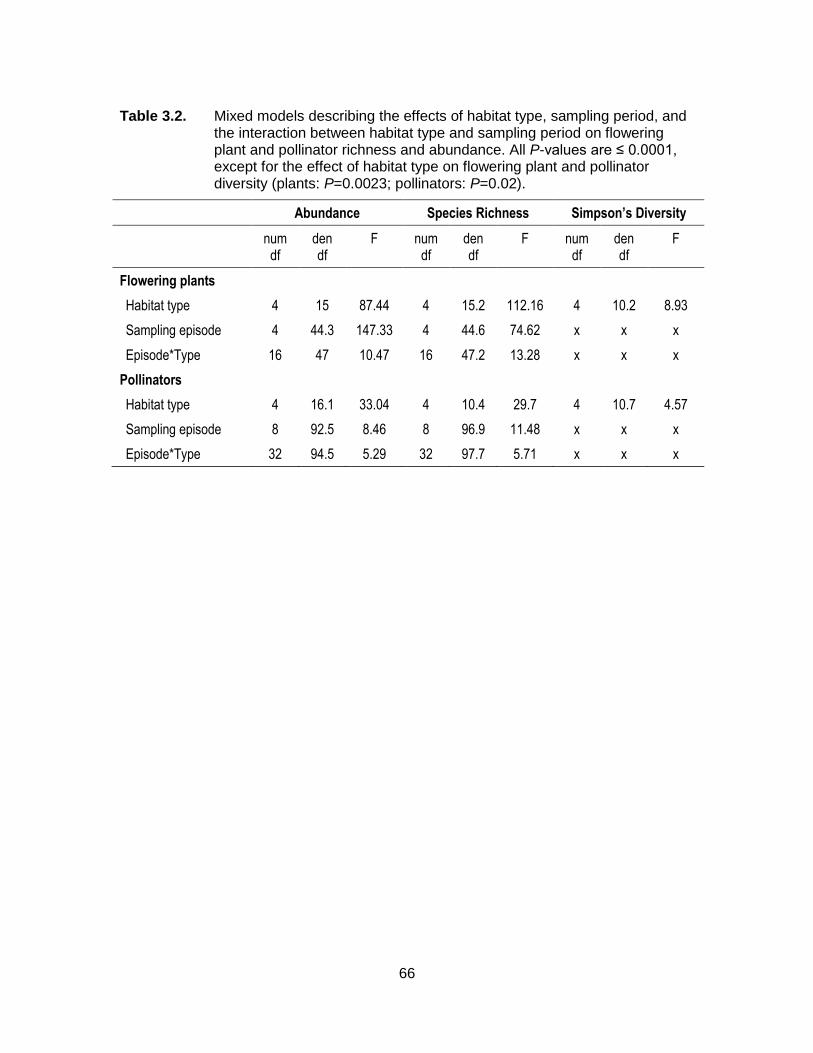
66
Table 3.2. Mixed models describing the effects of habitat type, sampling period, and the interaction between habitat type and sampling period on flowering plant and pollinator richness and abundance. All P-values are ≤ 0.0001, except for the effect of habitat type on flowering plant and pollinator diversity (plants: P=0.0023; pollinators: P=0.02).
Abundance Species Richness Simpson’s Diversity
num df
den df
F num df
den df
F num df
den df
F
Flowering plants
Habitat type 4 15 87.44 4 15.2 112.16 4 10.2 8.93
Sampling episode 4 44.3 147.33 4 44.6 74.62 x x x
Episode*Type 16 47 10.47 16 47.2 13.28 x x x
Pollinators
Habitat type 4 16.1 33.04 4 10.4 29.7 4 10.7 4.57
Sampling episode 8 92.5 8.46 8 96.9 11.48 x x x
Episode*Type 32 94.5 5.29 32 97.7 5.71 x x x
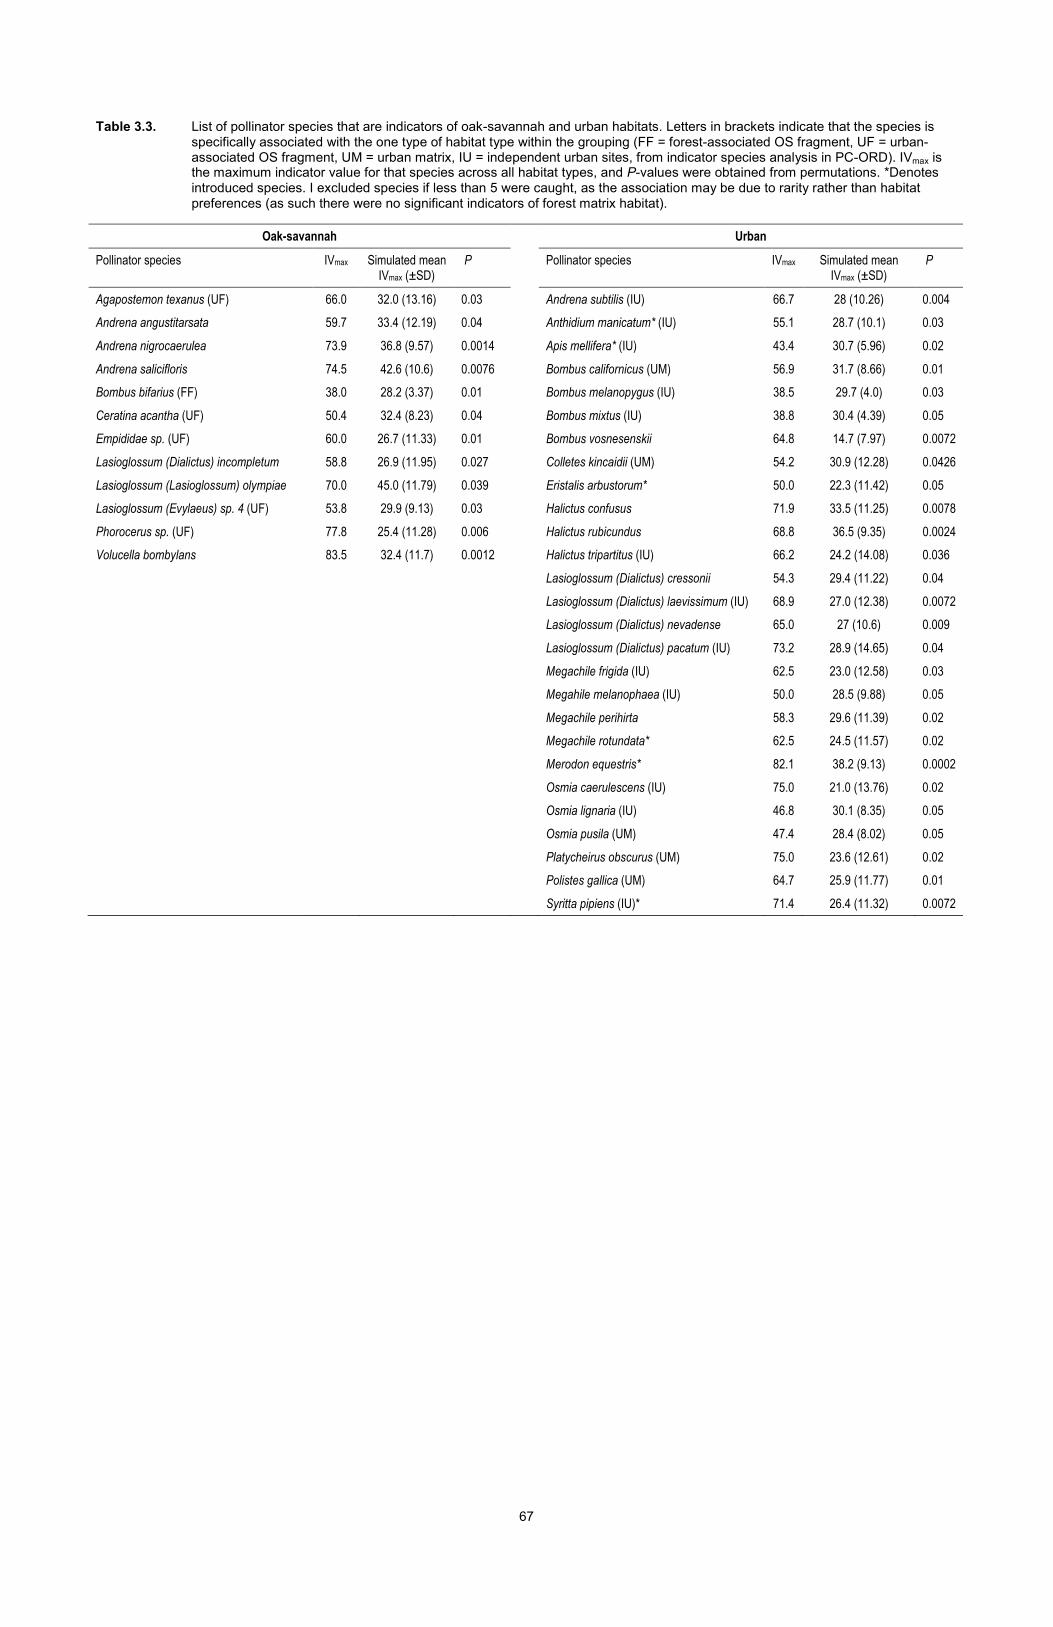
67
Table 3.3. List of pollinator species that are indicators of oak-savannah and urban habitats. Letters in brackets indicate that the species is specifically associated with the one type of habitat type within the grouping (FF = forest-associated OS fragment, UF = urban-associated OS fragment, UM = urban matrix, IU = independent urban sites, from indicator species analysis in PC-ORD). IVmax is the maximum indicator value for that species across all habitat types, and P-values were obtained from permutations. *Denotes introduced species. I excluded species if less than 5 were caught, as the association may be due to rarity rather than habitat preferences (as such there were no significant indicators of forest matrix habitat).
Oak-savannah Urban
Pollinator species IVmax Simulated mean IVmax (±SD)
P Pollinator species IVmax Simulated mean IVmax (±SD)
P
Agapostemon texanus (UF) 66.0 32.0 (13.16) 0.03 Andrena subtilis (IU) 66.7 28 (10.26) 0.004
Andrena angustitarsata 59.7 33.4 (12.19) 0.04 Anthidium manicatum* (IU) 55.1 28.7 (10.1) 0.03
Andrena nigrocaerulea 73.9 36.8 (9.57) 0.0014 Apis mellifera* (IU) 43.4 30.7 (5.96) 0.02
Andrena salicifloris 74.5 42.6 (10.6) 0.0076 Bombus californicus (UM) 56.9 31.7 (8.66) 0.01
Bombus bifarius (FF) 38.0 28.2 (3.37) 0.01 Bombus melanopygus (IU) 38.5 29.7 (4.0) 0.03
Ceratina acantha (UF) 50.4 32.4 (8.23) 0.04 Bombus mixtus (IU) 38.8 30.4 (4.39) 0.05
Empididae sp. (UF) 60.0 26.7 (11.33) 0.01 Bombus vosnesenskii 64.8 14.7 (7.97) 0.0072
Lasioglossum (Dialictus) incompletum 58.8 26.9 (11.95) 0.027 Colletes kincaidii (UM) 54.2 30.9 (12.28) 0.0426
Lasioglossum (Lasioglossum) olympiae 70.0 45.0 (11.79) 0.039 Eristalis arbustorum* 50.0 22.3 (11.42) 0.05
Lasioglossum (Evylaeus) sp. 4 (UF) 53.8 29.9 (9.13) 0.03 Halictus confusus 71.9 33.5 (11.25) 0.0078
Phorocerus sp. (UF) 77.8 25.4 (11.28) 0.006 Halictus rubicundus 68.8 36.5 (9.35) 0.0024
Volucella bombylans 83.5 32.4 (11.7) 0.0012 Halictus tripartitus (IU) 66.2 24.2 (14.08) 0.036
Lasioglossum (Dialictus) cressonii 54.3 29.4 (11.22) 0.04
Lasioglossum (Dialictus) laevissimum (IU) 68.9 27.0 (12.38) 0.0072
Lasioglossum (Dialictus) nevadense 65.0 27 (10.6) 0.009
Lasioglossum (Dialictus) pacatum (IU) 73.2 28.9 (14.65) 0.04
Megachile frigida (IU) 62.5 23.0 (12.58) 0.03
Megahile melanophaea (IU) 50.0 28.5 (9.88) 0.05
Megachile perihirta 58.3 29.6 (11.39) 0.02
Megachile rotundata* 62.5 24.5 (11.57) 0.02
Merodon equestris* 82.1 38.2 (9.13) 0.0002
Osmia caerulescens (IU) 75.0 21.0 (13.76) 0.02
Osmia lignaria (IU) 46.8 30.1 (8.35) 0.05
Osmia pusila (UM) 47.4 28.4 (8.02) 0.05
Platycheirus obscurus (UM) 75.0 23.6 (12.61) 0.02
Polistes gallica (UM) 64.7 25.9 (11.77) 0.01
Syritta pipiens (IU)* 71.4 26.4 (11.32) 0.0072
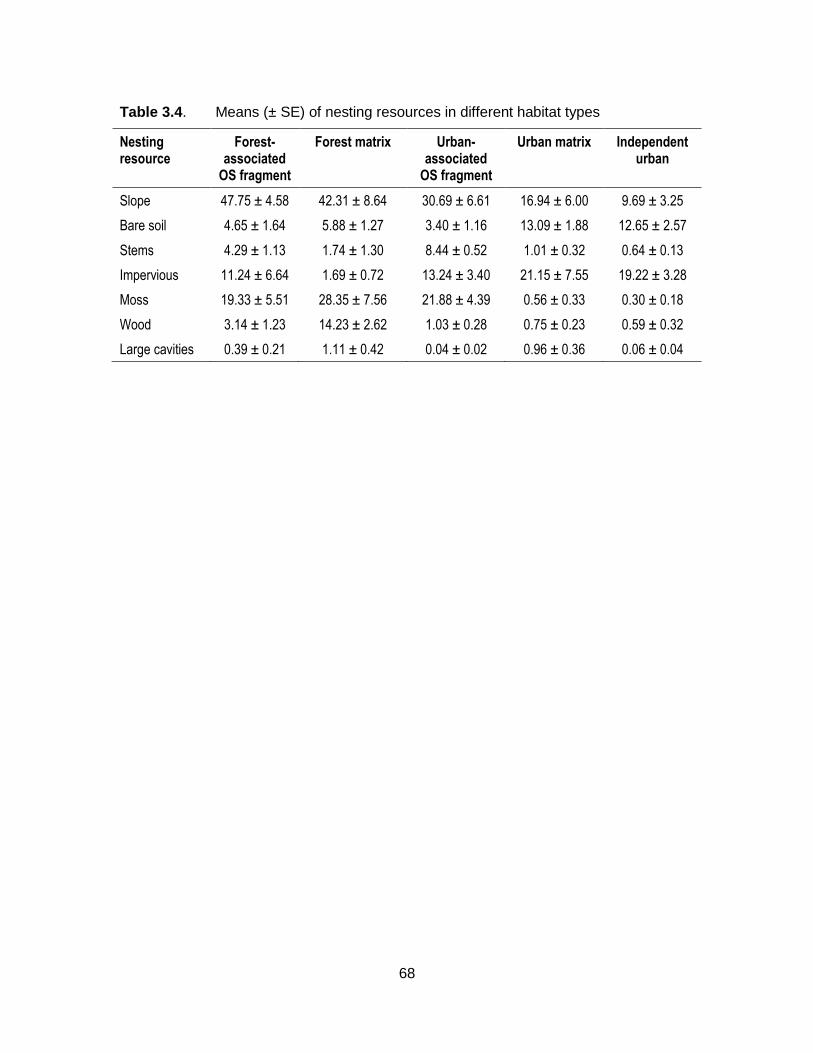
68
Table 3.4. Means (± SE) of nesting resources in different habitat types
Nesting resource
Forest-associated
OS fragment
Forest matrix Urban-associated
OS fragment
Urban matrix Independent urban
Slope 47.75 ± 4.58 42.31 ± 8.64 30.69 ± 6.61 16.94 ± 6.00 9.69 ± 3.25
Bare soil 4.65 ± 1.64 5.88 ± 1.27 3.40 ± 1.16 13.09 ± 1.88 12.65 ± 2.57
Stems 4.29 ± 1.13 1.74 ± 1.30 8.44 ± 0.52 1.01 ± 0.32 0.64 ± 0.13
Impervious 11.24 ± 6.64 1.69 ± 0.72 13.24 ± 3.40 21.15 ± 7.55 19.22 ± 3.28
Moss 19.33 ± 5.51 28.35 ± 7.56 21.88 ± 4.39 0.56 ± 0.33 0.30 ± 0.18
Wood 3.14 ± 1.23 14.23 ± 2.62 1.03 ± 0.28 0.75 ± 0.23 0.59 ± 0.32
Large cavities 0.39 ± 0.21 1.11 ± 0.42 0.04 ± 0.02 0.96 ± 0.36 0.06 ± 0.04
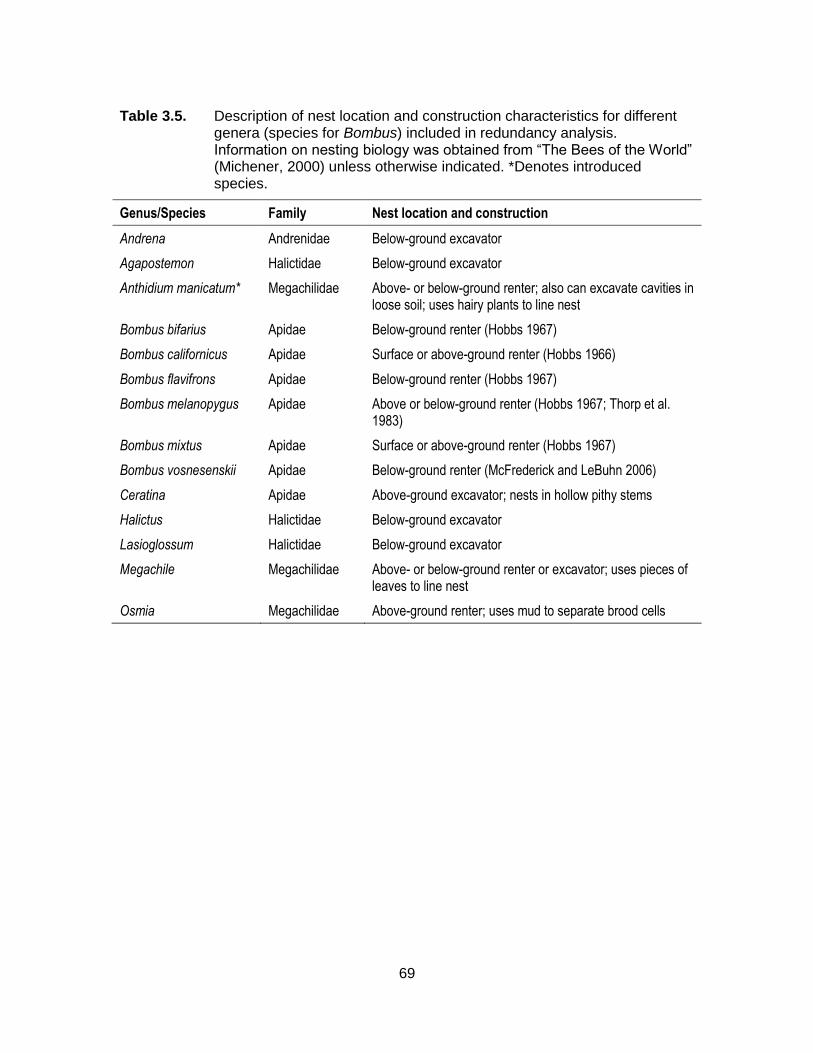
69
Table 3.5. Description of nest location and construction characteristics for different genera (species for Bombus) included in redundancy analysis. Information on nesting biology was obtained from “The Bees of the World” (Michener, 2000) unless otherwise indicated. *Denotes introduced species.
Genus/Species Family Nest location and construction
Andrena Andrenidae Below-ground excavator
Agapostemon Halictidae Below-ground excavator
Anthidium manicatum* Megachilidae Above- or below-ground renter; also can excavate cavities in loose soil; uses hairy plants to line nest
Bombus bifarius Apidae Below-ground renter (Hobbs 1967)
Bombus californicus Apidae Surface or above-ground renter (Hobbs 1966)
Bombus flavifrons Apidae Below-ground renter (Hobbs 1967)
Bombus melanopygus Apidae Above or below-ground renter (Hobbs 1967; Thorp et al. 1983)
Bombus mixtus Apidae Surface or above-ground renter (Hobbs 1967)
Bombus vosnesenskii Apidae Below-ground renter (McFrederick and LeBuhn 2006)
Ceratina Apidae Above-ground excavator; nests in hollow pithy stems
Halictus Halictidae Below-ground excavator
Lasioglossum Halictidae Below-ground excavator
Megachile Megachilidae Above- or below-ground renter or excavator; uses pieces of leaves to line nest
Osmia Megachilidae Above-ground renter; uses mud to separate brood cells
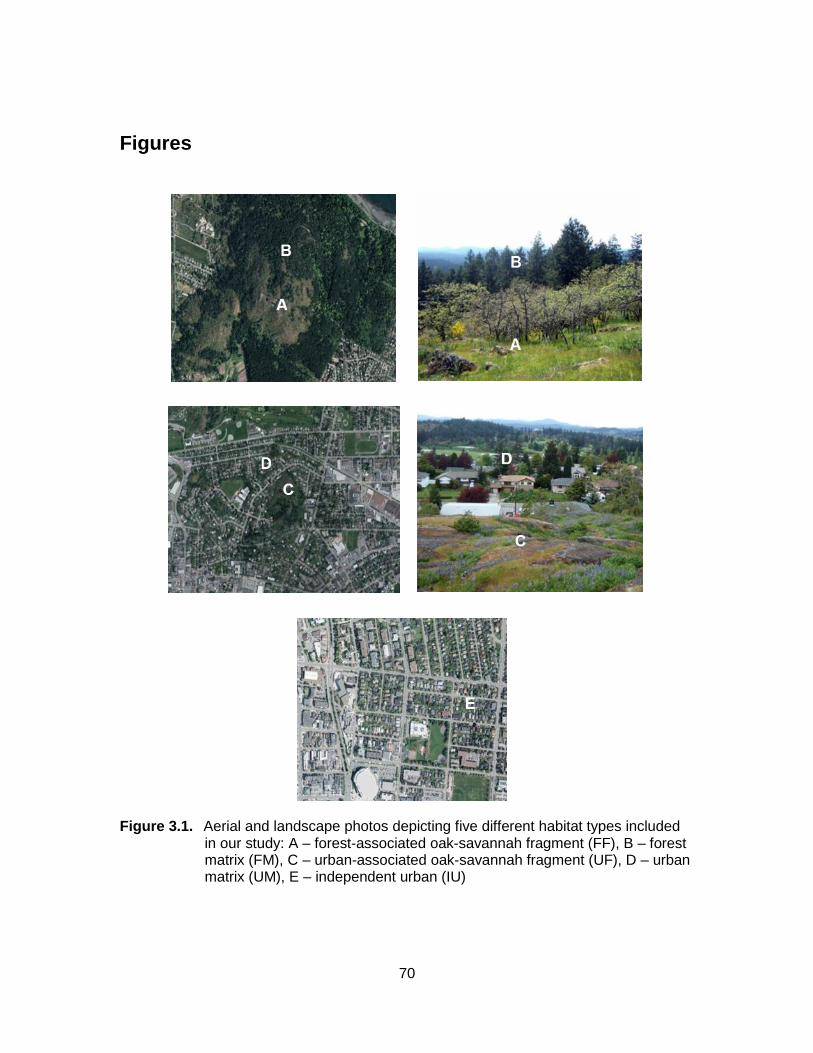
70
Figures
Figure 3.1. Aerial and landscape photos depicting five different habitat types included in our study: A – forest-associated oak-savannah fragment (FF), B – forest matrix (FM), C – urban-associated oak-savannah fragment (UF), D – urban matrix (UM), E – independent urban (IU)
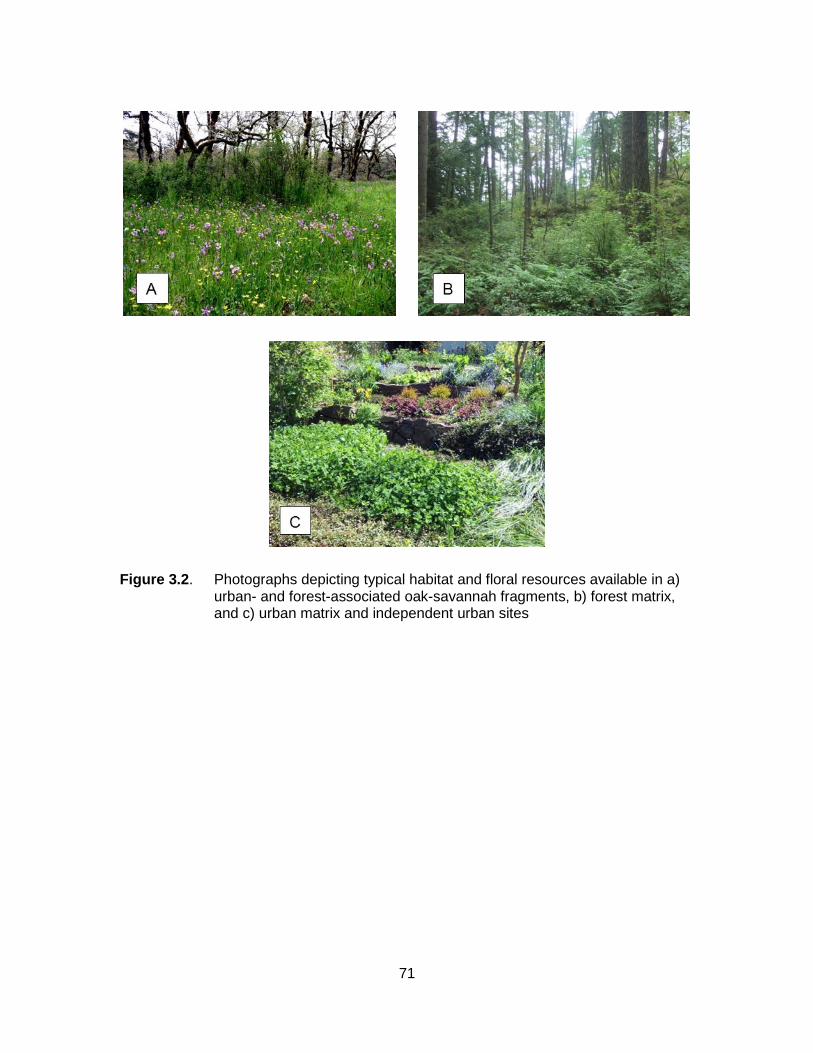
71
Figure 3.2. Photographs depicting typical habitat and floral resources available in a) urban- and forest-associated oak-savannah fragments, b) forest matrix, and c) urban matrix and independent urban sites
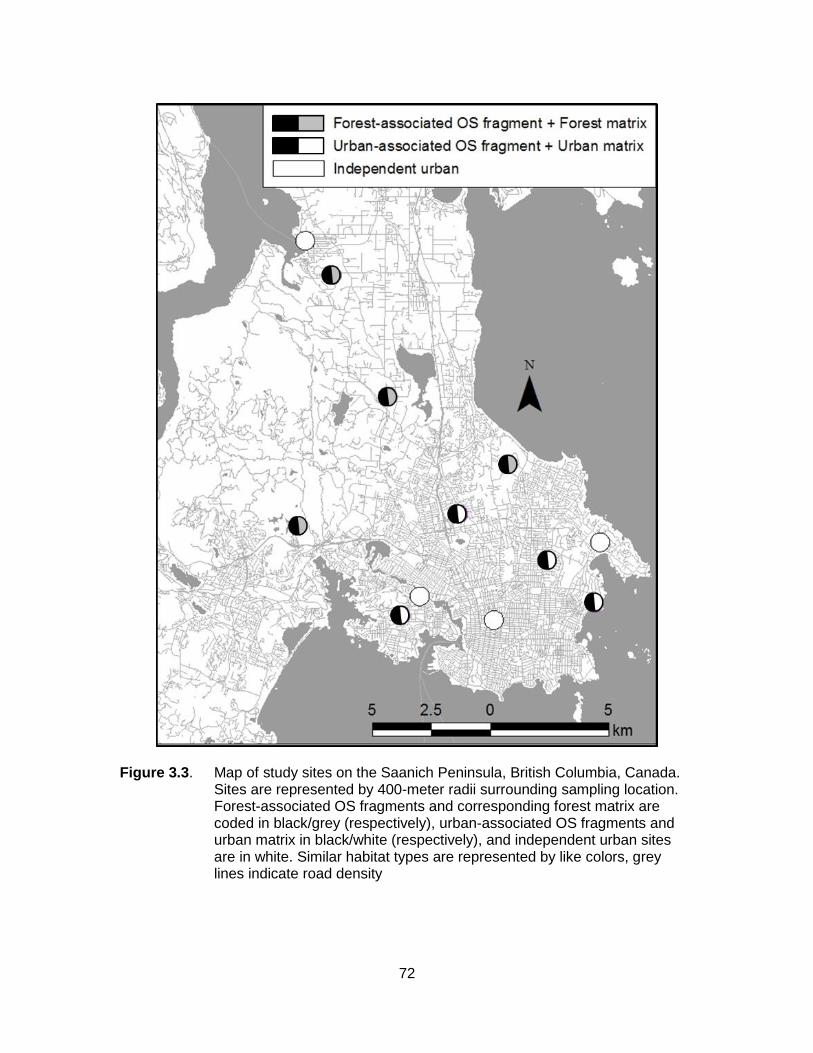
72
Figure 3.3. Map of study sites on the Saanich Peninsula, British Columbia, Canada. Sites are represented by 400-meter radii surrounding sampling location. Forest-associated OS fragments and corresponding forest matrix are coded in black/grey (respectively), urban-associated OS fragments and urban matrix in black/white (respectively), and independent urban sites are in white. Similar habitat types are represented by like colors, grey lines indicate road density
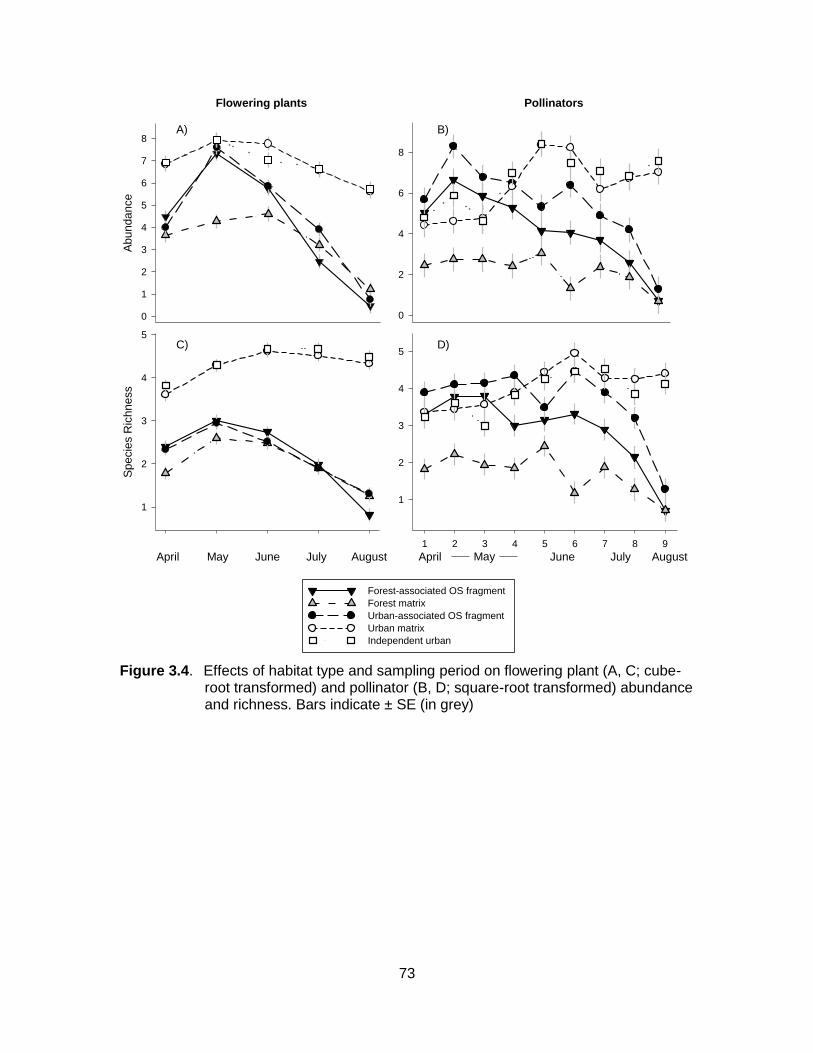
73
1 2 3 4 5 6 7 8 9
1
2
3
4
5
Forest-associated OS fragment
Forest matrix
Urban-associated OS fragment
Urban matrix
Independent urban
0
2
4
6
8
Ab
un
da
nce
0
1
2
3
4
5
6
7
8S
pe
cie
s R
ich
ne
ss
1
2
3
4
5
A) B)
C) D)
April May June July August April May June July August
Flowering plants Pollinators
Figure 3.4. Effects of habitat type and sampling period on flowering plant (A, C; cube-root transformed) and pollinator (B, D; square-root transformed) abundance and richness. Bars indicate ± SE (in grey)
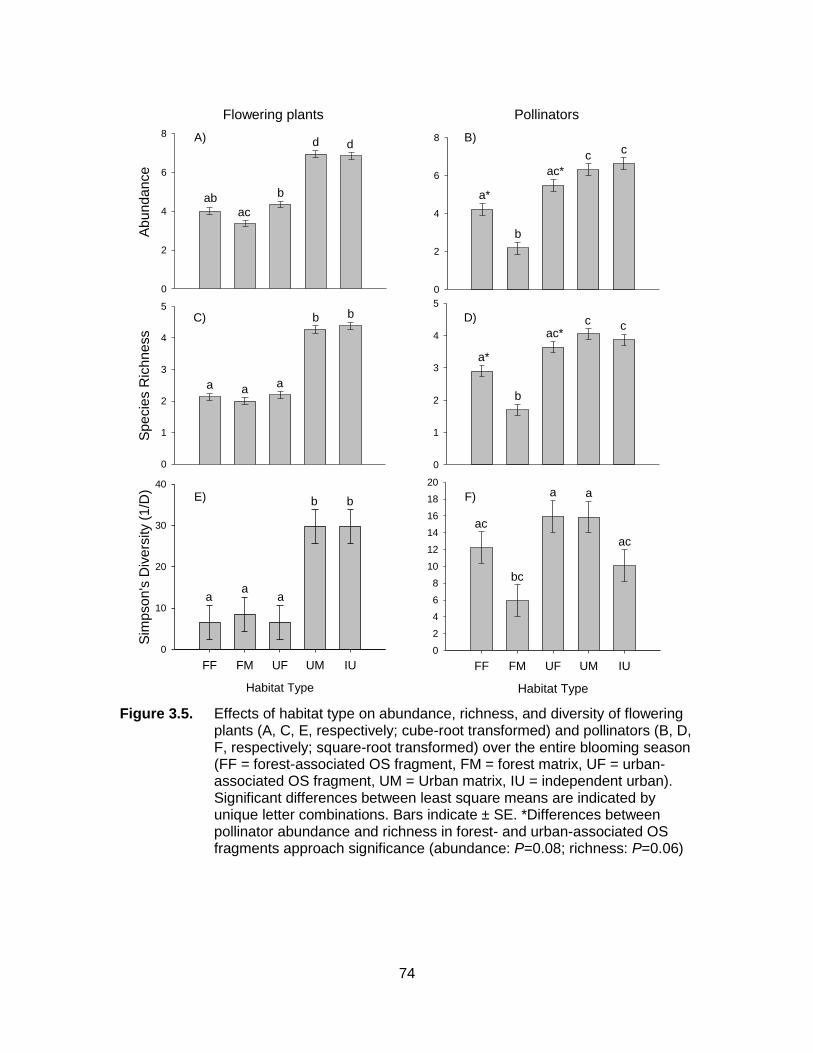
74
0
2
4
6
8
a*
b
ac*
cc
0
1
2
3
4
5
b
a*
ac*cc
Habitat Type
FF FM UF UM IU
0
2
4
6
8
10
12
14
16
18
20
ac
bc
a
ac
a
PollinatorsFlowering plants
Abunda
nce
0
2
4
6
8
Specie
s R
ichne
ss
0
1
2
3
4
5
a aa
bb
Habitat Type
FF FM UF UM IU
Sim
pso
n's
Div
ers
ity (
1/D
)
0
10
20
30
40
aa
a
b b
A) B)
C) D)
E) F)
d
ab
ac
b
d
Figure 3.5. Effects of habitat type on abundance, richness, and diversity of flowering plants (A, C, E, respectively; cube-root transformed) and pollinators (B, D, F, respectively; square-root transformed) over the entire blooming season (FF = forest-associated OS fragment, FM = forest matrix, UF = urban-associated OS fragment, UM = Urban matrix, IU = independent urban). Significant differences between least square means are indicated by unique letter combinations. Bars indicate ± SE. *Differences between pollinator abundance and richness in forest- and urban-associated OS fragments approach significance (abundance: P=0.08; richness: P=0.06)
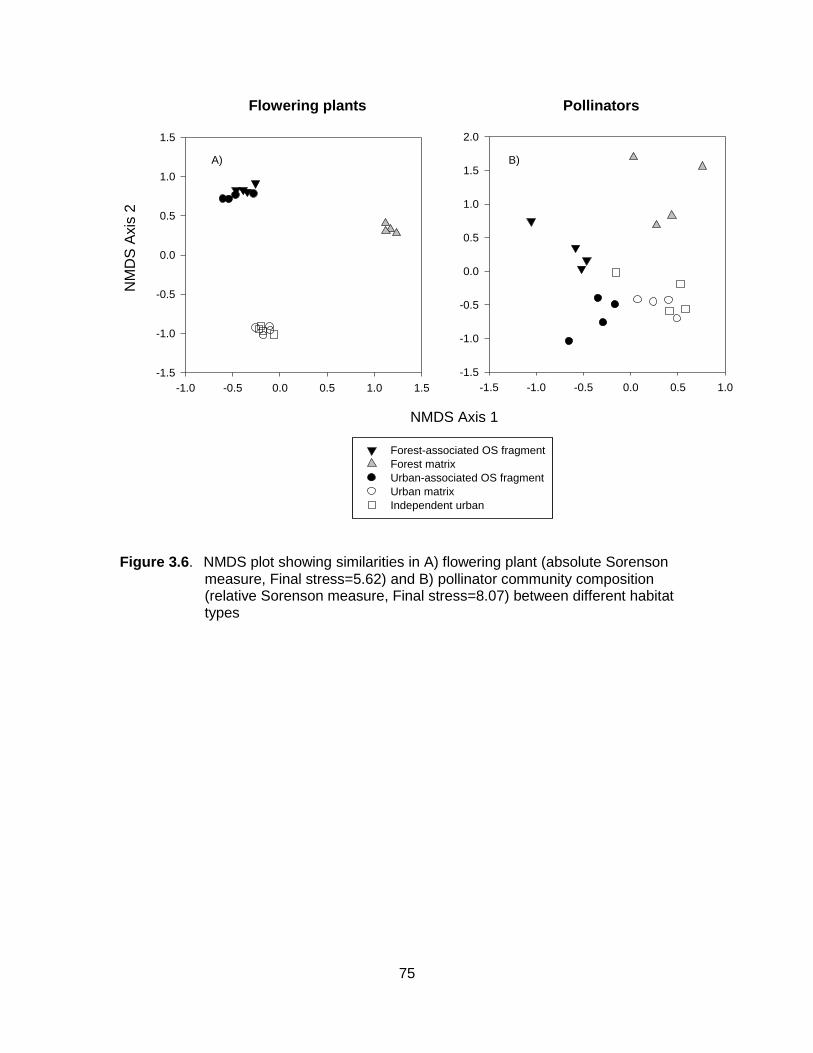
75
-1.0 -0.5 0.0 0.5 1.0 1.5
-1.5
-1.0
-0.5
0.0
0.5
1.0
1.5
Forest-associated OS fragment
Forest matrix
Urban-associated OS fragment
Urban matrix
Independent urban
A)
Flowering plants Pollinators
NMDS Axis 1
-1.5 -1.0 -0.5 0.0 0.5 1.0
NM
DS
Axis
2
-1.5
-1.0
-0.5
0.0
0.5
1.0
1.5
2.0
B)
Figure 3.6. NMDS plot showing similarities in A) flowering plant (absolute Sorenson measure, Final stress=5.62) and B) pollinator community composition (relative Sorenson measure, Final stress=8.07) between different habitat types
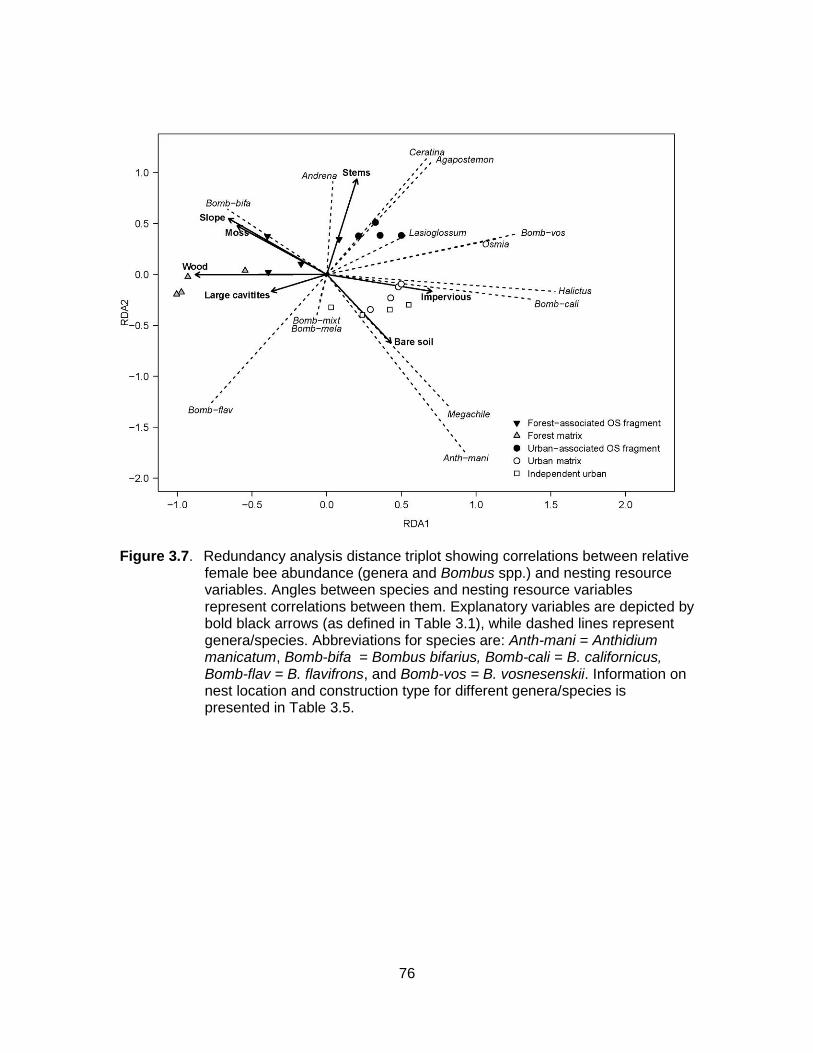
76
Figure 3.7. Redundancy analysis distance triplot showing correlations between relative female bee abundance (genera and Bombus spp.) and nesting resource variables. Angles between species and nesting resource variables represent correlations between them. Explanatory variables are depicted by bold black arrows (as defined in Table 3.1), while dashed lines represent genera/species. Abbreviations for species are: Anth-mani = Anthidium manicatum, Bomb-bifa = Bombus bifarius, Bomb-cali = B. californicus, Bomb-flav = B. flavifrons, and Bomb-vos = B. vosnesenskii. Information on nest location and construction type for different genera/species is presented in Table 3.5.
77
Chapter 4. Conclusions
Considering the role of the surrounding landscape matrix for determining species’
distributions in habitat fragments is of increasing relevance for conservation biology.
Agricultural and anthropogenic settlements now cover approximately 39% of terrestrial
surfaces, and the switch from rural to urban living is increasing (Ellis et al. 2010, United
Nations 2007). Pollinators may be negatively or positively affected by the process of
urbanization, but responses are highly dependent on their ability to use different
components of fragmented landscapes (e.g. dependent on species-specific traits). In
this thesis, I investigated how the surrounding landscape and species-specific traits
(nesting guild, body size, foraging specialization) influenced bee community composition
in oak-savannah (OS) fragments (Chapter 2), and determined whether differences in
pollinator composition could be due to differential use or quality of floral or nesting
resources in the matrix habitat (Chapter 3).
Pollinators, like any organism, require food (pollen, nectar) and a safe nest for
sleeping and rearing offspring. Responses to the availability of food and nest sites
across the landscape, however, are highly dependent on life-history strategies. For
example, large-bodied species require more resources to sustain biological processes,
species that fly for long periods need blooming phenology to span the length of their
flight period, and those with small foraging ranges require high local availability of
resources within close proximity to their nest sites. Although some pollinators have fixed
nest sites (e.g. most female bees), and focus foraging to and from the nest, other
pollinators (e.g. flies, male bees) do not have a fixed nest sites, and this flexibility may
lead to different responses to the surrounding landscape (Kremen et al. 2007). Female
bees, especially, differ among species in where they put their nest, how they construct it,
and the materials they use to protect brood cells. Pollinator populations, therefore, may
78
be highly influenced by timing in availability of floral resources and distribution of nesting
substrates and materials across the landscape.
Although the effects of habitat loss are predicted to be negative, if resources are
available in anthropogenic areas, habitat change may support certain levels of
biodiversity (e.g. Daily et al. 2001, Fernandez-Juricic 2000, Winfree et al. 2007). In this
thesis, I found that solitary cavity nesters and mid to late season generalists were
associated with oak-savannah fragments in urban areas (Ch. 2). Late season generalists
are likely responding to increased availability of floral resources in the urban matrix;
many of these species have modest foraging ranges (e.g. <200-meters), and may not be
as abundant in forest-associated OS fragments because the forest matrix does not have
a high abundance or richness of attractive flowering plants. Furthermore, although
nesting resources for cavity-nesting species were abundant in the forest matrix, the lack
of floral resources appears to limit populations more than the nest sites we expect them
to require (Ch. 3). Cavity-nesters that emerge late in the season (e.g. Anthidium
manicatum, Megachile spp., Osmia coloradensis), especially, likely rely on garden plants
in urban areas when native resources in natural areas are scarce. Furthermore, we
found a high availability of nest cavities in artificial nests (“bee condos”) in urban sites, in
addition to plant materials that some species may use for protecting brood cells (e.g. A.
manicatum uses hairs from the garden plant lamb’s ears [Stachys bizantia] to line nests;
Ch. 3). Although previous work in this ecosystem found that the diversity of cavity-
nesters increases with increasing fragment area (Neame et al. 2013), not all species
necessarily rely on the natural nesting or floral heterogeneity of natural landscapes.
Even though abundance and richness of flowering plants in urban sites was high,
I found that oak-savannah areas were unique reservoirs of early-flying species. This
pattern could be attributed to a variety of reasons, including flight phenology, foraging
specialisation, or disruption of nest sites. For example, some mining bee and syrphid fly
foraging periods have a direct overlap with peak bloom in oak-savannah fragments.
Because they are not foraging past the bloom of resources in oak-savannah, they may
not be found in urban areas because they have already finished provisioning offspring or
foraging for the season. Our data also indicate that some species of mining bees (e.g.
Andrena auricoma, A. angustitarsata) were predominantly collected off plants in the
carrot family in oak-savannah fragments, and may represent increased floral
79
specialisation in this ecosystem that has not yet been documented. Determining levels of
floral specialisation would require additional examination of pollen loads that is beyond
the scope of this study, but may be of interest for future conservation efforts of specialist
species. Finally, residential development may have extirpated some species from urban
areas (e.g. Andrena nigrocaerulea, Volucella bombylans) and because foraging
phenology overlaps with peak bloom of resources in oak-savannah, they are unlikely to
disperse to new urban environments.
Sampling over a longer time frame, in addition to sampling the surrounding
landscape, gave insight into broader patterns of potential factors limiting pollinator
populations in this fragmented ecosystem. In Chapter 2, overall body size of bees
increased with increasing abundance of early-flowering native resources, bumble bees
were more abundant in forest-associated OS sites, and bumble bee abundance
increased with increasing proportion of forest cover in the surrounding landscape. I
hypothesized that bumble bees were responding to increased nesting heterogeneity
associated with forested landscapes; however, in Chapter 3 I found that only two
species of early-flying bumble bees (Bombus bifarus, B. flavifrons) were associated with
moss, slope, and woody substrate in the forest matrix and B. bifarius was the only
significant indicator of forest-associated OS fragments. Other bumble bee species were
indicators of independent urban (e.g. B. mixtus) or urban matrix sites (B. californicus).
The reasons for the discrepancy between the two chapters could be due to longer
sampling periods in the Chapter 3 data, and sampling the matrix habitat – bumble bee
colonies with long foraging periods, especially, rely on bloom phenology that lasts from
April to October. Decreased abundance of bumble bees in urban-associated OS sites in
Chapter 2 may have been due to export to the surrounding urban landscape; floral
resources in urban residential gardens may be drawing pollinators away from less
abundant resources in urban-associated OS fragments. Such dynamics could have
important implications for plant reproduction in oak-savannah fragments in urban areas,
and may provide an interesting and relevant avenue of research for future conservation
efforts.
80
Caveats and future directions
This thesis provides some encouraging results for biological persistence in urban
environments, but there are some important caveats to consider. First, using species
richness as an indicator of biodiversity can ignore specialist responses and may mask
homogenization of biological communities (Filippi-Codaccioni et al. 2010). Many of the
pollinator species associated with urban areas were generalists (and in some cases
introduced), and overall I caught a very low abundance of floral specialists. Although
some broadly oligolectic species were more abundant in urban habitats (Ch. 2), narrowly
oligolectic species were found only in oak-savannah habitats. In addition, our data
indicate that there may be more than 2 species of narrowly oligolectic mining bees
associated with oak-savannah habitat, but would require additional examination of pollen
loads that is beyond the scope of this study. Conservation of specialists, in addition to a
broad range of generalists, will depend on maintaining diverse resources in both natural
and anthropogenic habitats.
Second, our sampling in urban habitats was dependent on homeowner
participation, and may represent some bias in availability of floral and nesting resources.
In many urban sites, at least one homeowner was an avid gardener and volunteered for
the project without hesitation. I attempted to alleviate these issues by including
properties in a similar neighbourhood regardless of interest in gardening and dividing
pollinator sampling evenly time-wise between properties. However, all urban habitats
represented a similar demographic – suburban development with flowering plant and
potential nesting resources available in lawns, potted plants, and garden beds. I did not
sample any extremely urban habitats, where buildings and concrete dominate the
landscape. Although most bees were not affected by local scale values of impervious
ground cover in urban habitats (Ch. 3), previous research has shown that impervious
cover associated with urban development on a landscape scale can have negative
effects on bumble bees abundance and genetic diversity (Jha and Kremen 2013a, b).
Pollinator populations in more developed urban areas may be influenced on a different
level (e.g. genetic) and by a larger scale than examined in this thesis, with potential
implications for species’ persistence in extreme urban habitats.
There are many avenues of public outreach and future research opportunities for
pollinator conservation in this study system. Oak-savannah sites are becoming
81
increasingly dominated by introduced grasses and flowering herbs (Fuchs 2001,
MacDougall et al. 2004). Scotch broom (Cytisus scoparius), in particular, is a large
woody flowering shrub that over-shadows native flowering herbs (J. Wray, personal
observation). Although removal of invasive species is ideal for ecosystem integrity,
removal without subsequent replacement of native flowering plants may have negative
effects on pollinator populations. For example, mid- to late-season pollinators seem to
rely heavily on hairy cat’s ear (Hypochaeris radicata), and before removal restoration
managers should consider replacement with native flowering plants (e.g. Grindelia
integrifolia, Holodiscus discolor). Previous research has shown that invasive species in
this ecosystem are becoming highly integrated into pollination networks, but the effects
of invasive species on native flowering plants’ reproduction are unclear (Gielens 2012).
Finally, pollinators in urban-associated OS fragments are being supported by
floral resources in the urban matrix, but the export of pollinating species to urban areas
may have negative consequences for wildflower reproduction in oak-savannah.
Flowering native species that bloom towards the end of peak bloom, in particular, may
suffer from competition with floral resources in urban gardens. In addition, pollination of
wildflowers may be influenced by high pollen loads of non-native residential garden
flowering plants. Extending bloom periods in urban areas with non-native, non-invasive
plants, however, seems to support a high richness, abundance, and diversity of
pollinator species, including a species of conservation concern believed to be in decline
across North America (Bombus occidentalis; Cameron et al. 2011). Continued
conservation and restoration of natural areas (e.g. oak-savannah, coniferous forest), in
addition to encouraging the public to plant non-invasive species with wide ranges in
bloom phenology, may serve to promote temporal and spatial diversity of pollinators
across the landscape.
82
References
Cameron, S. A., J. D. Lozier, J. P. Strange, J. B. Koch, N. Cordes, L. F. Solter, and T. L. Griswold. 2011. Patterns of widespread decline in North American bumble bees. Proceedings of the National Academy of Sciences of the United States of America 108:662–667.
Daily, G. C., P. R. Ehrlich, and G. A. Sánchez-Azofeifa. 2001. Countryside biogeography: use of human-dominated habitats by the avifauna of southern Costa Rica. Ecological Applications 11:1–13.
Ellis, E. C., K. K. Goldewijk, S. Siebert, D. Lightman, and N. Ramankutty. 2010. Anthropogenic transformation of the biomes, 1700 to 2000. Global Ecology and Biogeography 19:589–606.
Fernández-Juricic, E. 2000. Avifaunal use of wooded streets in an urban landscape. Conservation Biology 14:513–521.
Filippi-Codaccioni, O., V. Devictor, Y. Bas, and R. Julliard. 2010. Toward more concern for specialisation and less for species diversity in conserving farmland biodiversity. Biological Conservation 143:1493–1500.
Fuchs, M. A. 2001. Towards a recovery strategy for Garry oak and associated ecosystems in Canada: Ecological assessment and literature review. Technical Report GBEI/EC-00-030.
Gielens, G. A. 2012. Pollen limitation and network asymmetry in an endangered oak-savannah ecosystem. M.Sc. Thesis. Department of Biological Sciences, Simon Fraser University.
Jha, S., and C. Kremen. 2013a. Resource diversity and landscape-level homogeneity drive native bee foraging. Proceedings of the National Academy of Sciences of the United States of America 110:555–558.
Jha, S., and C. Kremen. 2013b. Urban land use limits regional bumble bee gene flow. Molecular Ecology 22:2483–2495.
Kremen, C., N. M. Williams, M. A. Aizen, B. Gemmill-Herren, G. LeBuhn, R. Minckley, L. Packer, S. G. Potts, T. Roulston, I. Steffan-Dewenter, D. P. Vázquez, R. Winfree, L. Adams, E. E. Crone, S. S. Greenleaf, T. H. Keitt, A.-M. Klein, J. Regetz, and T. H. Ricketts. 2007. Pollination and other ecosystem services produced by mobile organisms: a conceptual framework for the effects of land-use change. Ecology Letters 10:299–314.
MacDougall, A. S., B. R. Beckwith, and C. Y. Maslovat. 2004. Defining conservation strategies with historical perspectives: a case study from a degraded oak grassland ecosystem. Conservation Biology 18:455–465.
83
Neame, L. A., T. Griswold, and E. Elle. 2013. Pollinator nesting guilds respond differently to urban habitat fragmentation in an oak-savannah ecosystem. Insect Conservation and Diversity 6:57–66.
United Nations. 2007. World Urbanization Prospects: The 2007 Revision. United Nations, New York, New York, USA.
Winfree, R., T. Griswold, and C. Kremen. 2007. Effect of human disturbance on bee communities in a forested ecosystem. Conservation Biology 21:213–223.
Related Documents