THE EFFECTS OF DIVERGENT PRODUCTION ACTIVITIES WITH MATH INQUIRY AND THINK ALOUD OF STUDENTS WITH MATH DIFFICULTY A Dissertation by HIJA PARK Submitted to the Office of Graduate Studies of Texas A&M University in partial fulfillment of the requirements for the degree of DOCTOR OF PHILOSOPHY May 2004 Major Subject: Educational Psychology

Welcome message from author
This document is posted to help you gain knowledge. Please leave a comment to let me know what you think about it! Share it to your friends and learn new things together.
Transcript
THE EFFECTS OF DIVERGENT PRODUCTION ACTIVITIES WITH MATH
INQUIRY AND THINK ALOUD OF STUDENTS WITH MATH DIFFICULTY
A Dissertation
by
HIJA PARK
Submitted to the Office of Graduate Studies of Texas A&M University
in partial fulfillment of the requirements for the degree of
DOCTOR OF PHILOSOPHY
May 2004
Major Subject: Educational Psychology
THE EFFECTS OF DIVERGENT PRODUCTION ACTIVITIES WITH MATH
INQUIRY AND THINK ALOUD OF STUDENTS WITH MATH DIFFICULTY
A Dissertation
by
HIJA PARK
Submitted to Texas A&M University in partial fulfillment of the requirements
for the degree of
DOCTOR OF PHILOSOPHY Approved as to style and content by: _________________________ __________________________ William R. Nash Joyce E. Juntune (Chair of Committee) (Member) _________________________ __________________________ Kimberly J. Callicott John R. Hoyle (Member) (Member) _________________________ Victor L. Willson (Head of Department)
May 2004
Major Subject: Educational Psychology
iii
ABSTRACT
The Effects of Divergent Production Activities with Math Inquiry and
Think Aloud of Students with Math Difficulty. (May 2004)
Hija Park, B.A., Inchon National University of Education;
M.S., Texas A&M University
Chair of Advisory Committee: Dr. William R. Nash
The present study was designed to investigate the effects of divergent production
activities with math inquiry and think aloud strategy of students with math difficulty.
Multiple baseline across behaviors design was replicated across four participants. This
research also investigated relationships between the interventions and creativity scores
by employing pretest and posttest design as measured by the Torrance Tests of Creative
Thinking (TTCT). The results varied with the participants and the interventions. The
overall mean in all three treatments increased a mild degree based on descriptive
statistics. All four participants showed a drastic variability in math problem solving. T-
test results from the TTCT showed that there were significant differences in both fluency
and flexibility scores. Elaboration and originality scores appeared unaffected since the
instructions were mean in all three treatments increased to a mild degree based on
descriptive statistics. All four primarily involved in fluency and flexibility creativity
constructs. Originality was excluded as a measure and elaboration was not instructed
intensely enough in the program.

iv
Conclusively, 5th grade students with math difficulty improved both think aloud
and math inquiry scores based on visual/statistical inspection of Mean+Trend difference
analysis. It was found that only math inquiry intervention was effective to a mild degree
for three out of four participants. Fluency and flexibility scores increased as a result of
divergent production activities, however not enough to say that overall creativity is
fostered directly by the program. Issues emerged out of the math problem solving in
terms of controlling variability and developing content materials for the instruction.
Further research is needed to ascertain the effects of multiple interventions on students
with math difficulty. Replications are needed to expand the findings to the development
of viable instructions. Future study is also needed to use varied math inquiry skills and
think aloud strategy in order to improve both problem solving ability and creativity
associated with mathematics.

v
To my husband, Sang-yun Bae

vi
ACKNOWLEDGMENTS
I am indebted to so many people for my being here today with honor and pride.
They have all made it possible for me to complete my education and dissertation
research and most of all, to support and trust in me all the time no matter what. I would
like to express my sincere gratitude for always being there for me in every possible way:
Dr. William R. Nash for guiding me to walk in through this special area of
intelligence, creativity, and giftedness, by providing support, materials, explicit advice
and substantial help consistently; Dr. Joyce E. Juntune for encouraging me to study
whenever she saw me and for arranging everything I needed for this research; Dr. John
R. Hoyle for inspiring me to try to be a creative leader who loves life and people and for
encouraging me to be an Aggie by giving me wonderful pieces of advice; and Dr.
Kimberly J. Callicott (Kimber) for helping me out in all possible ways and for
proofreading the dissertation and consulting with me on my research and even personal
matters; A special thanks to Mrs. Beth Barnes at Bowen school, for being the instructor
and consultant willing to help with the study, a heavy responsibility; to Araceli Rivas for
her sincere friendship and for proofreading the manuscript; and to Jinsook Roh, my
friend and mentor in Korea, for trusting and loving me from the beginning of my
teaching career up until this day.
Each person I have thanked here is truly and tremendously the reason why and
how I made myself today. I would like to thank them all again and to hopefully find
ways to pass on the support and encouragement the way all my mentors have done for
me.

vii
TABLE OF CONTENTS
Page ABSTRACT............................................................................................................... .iii DEDICATION ............................................................................................................v ACKNOWLEDGMENTS...........................................................................................vi TABLE OF CONTENTS ............................................................................................vii LIST OF FIGURES.....................................................................................................ix LIST OF TABLES ......................................................................................................x CHAPTER I INTRODUCTION ..............................................................................1
Statement of the Problem ....................................................................1 Purpose of the Study ...........................................................................6 Research Questions .............................................................................7 Definition of Terms.............................................................................7 Limitations ..........................................................................................9
II REVIEW OF THE LITERATURE .....................................................11
Students with Math Difficulty.............................................................11 Divergent Production ..........................................................................15 Think Aloud ........................................................................................20 Math Inquiry........................................................................................24 Mathematical Creativity ......................................................................27
III METHODS..........................................................................................32
Design..................................................................................................32
Participants ..........................................................................................35 Context ................................................................................................38 Measurements......................................................................................39 Dependent Variables ...........................................................................40
viii
CHAPTER Page
Experimental Procedures.....................................................................42 Procedural Reliability..........................................................................44 Data Collection and Analysis ..............................................................44
IV RESULTS ...........................................................................................45
Criteria for Evaluation of Results........................................................45 Data Reported on Reliability...............................................................47 Data on Dependent Measures Reported by Participant.......................47 Data on TTCT Reported by Creativity Measures ...............................58
V CONCLUSIONS AND IMPLICATIONS ..........................................60
Summary .............................................................................................60
Strengths of the Study .........................................................................62 Limitations of the Study......................................................................64 Implications for Future Research ........................................................66
REFERENCES............................................................................................................68 APPENDIX A .............................................................................................................80 APPENDIX B .............................................................................................................81 APPENDIX C .............................................................................................................83 APPENDIX D .............................................................................................................85 APPENDIX E..............................................................................................................87 APPENDIX F..............................................................................................................88 APPENDIX G .............................................................................................................96
VITA ...........................................................................................................................118
ix
LIST OF FIGURES
FIGURE Page
1. Divergent Production Interventions on Student #1 ...........................................49
2. Divergent Production Interventions on Student #2 ...........................................53
3. Divergent Production Interventions on Student #3 ...........................................55
4. Divergent Production Interventions on Student #4 ...........................................57

x
LIST OF TABLES
TABLE Page
1. Mean and trend differences by instruction and phase .......................................50
2. Analysis of variance by participant ...................................................................51
3. t-test of pretest and posttest of TTCT................................................................59
1
CHAPTER I
INTRODUCTION
Education in general can be said to be a process or a set of processes that aim to
develop the potential of each and every student. Educators and practitioners strive to
meet students’ individual needs and goals in daily practice, hoping to help all students
achieve their potential. Some students experience problems in academic areas.
Problems in the subject matter of mathematics emerge at the elementary level and tend
to progressively worsen through secondary school levels to adult age (Miller & Mercer,
1998). Roughly up to one out of three or four students in the elementary level fall
below average achievement in mathematics (National Assessment of Educational
Progress: NAEP, 2001). Facilitating students who are achieving in all subject areas
except math is more likely if they are provided with effective, interesting, and practical
math instruction. Varied mathematics instruction should be sought to alleviate the
problems of students with math difficulty. Due to the lack of research on multiple
instructions with divergent production activities, instructional/learning possibilities
should be examined either divergent production activities alone or other strategies
combined with, for examples, think aloud and inquiry skills.
Statement of the Problem
The U.S. Department of Education (2002) reported that around 13 percent of the total
____________________
This dissertation follows the style of The Journal of Educational Research.
2
enrollment in public schools, kindergarten through 12th grade, was served in federally
supported programs for the disabled. Half of the disabled were categorized as under
the “specific learning disabilities” category. Students with learning disabilities exhibit
problems with mathematics (Scheid, 1990) and this population has been growing
steadily in numbers and percentages. Unlike the identified students in special education,
it is not clear whether students with mild math difficulty received intervention
programs or any other type of assistance in the classroom. As Miller and Mercer
(1998) have pointed out, the lack of understanding learner characteristics (information
processing, cognitive/ metacognitive, language disability, and social/emotional
perspectives) by their teachers often aggravates students’ independent growth in terms
of academic achievement since understanding students’ strengths and weaknesses in
many aspects affect math teaching strategies. The National Assessment statistics
showed that students in general are alarmingly weak in mathematical problem-solving
skills (NCES, 2001). For instance, data from the National Assessment of Educational
Progress statistics (NAEP, 2001) indicate that nationwide, 33 percent of the fourth
graders are below basic mathematics achievement with 23 percent in the state of Texas.
The National Council of Teachers of Mathematics (NCTM) has led the
mathematics reform movement in the 1990s (NCTM, 1989, 1991, 1995), which core is
a paradigm shift in mathematics instruction for all students from skill-based instruction
to problem-solving learning of active-learners facilitated by teachers’ guidance and
questioning. Five goals proposed by NCTM (1989) were that students should: learn to
value mathematics; become confident in their ability to do mathematics; become
3
mathematical problem solvers; learn to communicate mathematically; and learn to
reason mathematically. NCTM (1989) supported the curriculum standards that focus
on reasoning and communication skills that emphasize creative problem solving and
divergent thinking ability. The standards were established to promote activity based
inquiry for teaching and learning mathematics (Rivera, 1998). The instructions should
be provided students with math difficulty with materials emphasizing on problem
solving and inquiry skills as well. Students with math difficulty should receive any
alternative assistance to alleviate their problem within the school system. Therefore,
there are at least two reasons why students with math difficulty should be provided
with educational intervention. First, students with math difficulty will be affected in
the long-term. Second, special assistance is likely given to labeled or identified
students as learning disabilities. Accordingly, there is an important need to find
techniques to assist students with mild deficits in mathematics.
Research in mathematics intervention for students with learning disabilities has
primarily focused in the areas of computation and word problems (Bottage &
Hasselbring, 1993; Marzola, 1985; Montague & Bos, 1986; Smith & Lovitt, 1975
&1976; Shunk, 1985) as specific mathematical deficiencies. As Rivera (1998)
documented, mathematical interventions were largely focused on cognitive or
metacognitive strategies (Desoete et al, 2001; Marzola, 1985; Montague, 1996;
Montague & Bos, 1986). Research relevant to both divergent production and
mathematics has been conducted with an average ability student population through
various grade levels. Some researchers investigated the relationship between divergent

4
production and mathematics (Baer, 1993; Dirkes, 1978; Perry & Stacey, 1994) and the
effects of divergent production activities or creative program on the students (Carman,
1992). Some others studied the possibilities to enhance mathematical creativity by
employing a variety of divergent production problems or by instructing problem
solving skills (Balka, 1974a; Haylock, 1984; Jensen, 1973). Still little research has
been conducted on the effectiveness of divergent production intervention programs in
mathematics. Program models for students with math difficulty have not provided yet
convincing evidence on long-term effectiveness. In this regard, divergent production
activities need to be reexamined for the effects on students with math difficulty and
mathematical creativity. According to Baer (1993), there still exists a debate on
whether divergent thinking plays a significant role in creative performance. Some
creativity training programs have demonstrated contradictory conclusions on the
success of promoting creative thinking. Although problem solving skills have often
been used for students with learning disabilities in order to ease mathematical learning
difficulties (Cawley et al., 1979), many studies have been conducted on average
performing students from regular classrooms. In an attempt to benefit students with
short term and minimal mathematics difficulty and do not receive special education,
the effects of the divergent production activities need to be investigated and effective
instruction should be invented.
Another existing problem area is math inquiry skills. Both question writing and
finding missing information were used to measure creative ability as a result of
divergent production activities (Balka, 1974a; Haylock, 1984; Jensen, 1973). Studies
5
revealed that divergent problem writing is positively correlated with mathematical
creativity and higher math performance. Research has not been reported yet on the
effects of question writing when math problem-solving instruction is provided. Should
inquiry as a necessary skill for critical thinking (Glasser, 1966) be combined with
strategy training for students with math difficulty? What kind of outcomes might be
produced as a result of the special instruction? Would it be effective in improving
students’ math performance and increasing students’ mathematical creativity?
Researchers have not attempted to study the use of divergent inquiry activities and the
effects of the training on questioning skills in mathematics. Findings from relevant
studies may imply the likelihood that math question writing can be effective when
incorporated into divergent production activities. Further research is needed to develop
an exemplary instruction program and its assessment instrument on behalf of students
confronting obstacles to learn mathematics.
Cognitive and metacognitive strategies have been provided to train students
with and without LD (Desoete et al, 2001; Montague, 1996; Montague & Bos, 1986).
It was found that the strategy training programs were effective, and students improved
their problem solving ability in mathematics. However, it is uncertain that the effects
of think aloud still remain consistent when multiple treatments are brought together to
a single subject when provided with a short-term instruction. There is no information
available on whether multiple interventions in mathematics have been conducted with
students experiencing math difficulty. Think aloud has been known to be a helpful
strategy for school children with learning disabilities. Therefore, if the think aloud
6
strategy is taught to students with mild math difficulty, it would be expected to
increase mathematical performance, since students’ deficit is less likely to interrupt
students’ learning mathematics.
To recapitulate, three primary issues remain unsubstantiated. First, there is no
information on how multiple divergent production treatments that consist of
metacognitive strategies, inquiry skills, and problem solving skills are arranged in
order to impact students’ math performance. Second, there are no established
measurement scales that can reflect adequate sensitivity to growth of students in the
program. Third, divergent production models have shown conflicting results on its
effectiveness to foster creativity, and the relationship between divergent production
and mathematics needs further investigation. Future applied research is needed to
assess the effects of divergent production activities as a varied investigation of multiple
baseline across behaviors design for multiple participants. When divergent production
activities are specifically combined with three selected instructions such as
metacognitive strategy, inquiry skills, and math problem solving ability, it is expected
to contribute to mathematical performance and eventually mathematical creativity.
Purpose of the Study
Due to the lack of findings of multiple interventions in the research literature
for students with math difficulty, the purpose of this study was to extend the literature
on mathematical creativity by attempting to identify a functional relationship between
each intervention and divergent production. Three interventions used for the
investigation are: think aloud strategy, math inquiry skills, and math problem-solving
7
ability. This study assessed the effects of the divergent production activities and the
participants’ math performance as measured by researcher developed summative
scores on the above three target behaviors. This study was also designed to determine
if there were any significant differences between the pretest and posttest of four
creative abilities as measured by Torrance Tests of Creative Thinking (Torrance, 1974).
Research Questions
The research questions underlying the investigation were as follows.
1. Do participants improve their math performance on the three dependent
variables (think aloud, math inquiry, and math problem solving) as measured
by the researcher developed summative scales as a result of the instructions?
2. If students demonstrate improvement, is there any evidence to show the
program effectiveness among the three divergent production activities (think
aloud strategy, math inquiry, and math problem solving) as measured by the
researcher developed summative scales?
3. Are there any significant differences in the scores between the pretest and the
posttest of all participants as measured by the Torrance Tests of Creative
Thinking (Torrance, 1974)?
Definition of Terms
Students with Math Difficulty (S/MD). This is not a label for a special subset of
children. Students with math difficulty (S/MD) is a group of students who are
achieving in other subject areas while they are having a lack of knowledge and skills in
learning mathematics, compared to at or above average students in mathematics. The
8
deficits in math are not severe enough to be identified as learning disabilities using a
screening test. S/MD can be interchangeably used with low achiever in math (LAM) in
this study, and S/MD shows difficulty completing assignments and producing the
amount of work usually expected (ACCG, 2003).
Divergent Production (DP). Guilford (1967) defined divergent production (DP)
as the generation of information from given information, where the emphasis is upon
variety and quantity of output. Fluency, flexibility, originality, and elaboration are
considered four divergent production abilities that contribute to the more complex
construct of creativity. In this study, DP is redefined limited to three abilities: fluency,
flexibility, and elaboration only. These three constructs are imbedded in DP activities
based on math content by using three different strategies, i.e., think aloud, math inquiry,
and problem solving.
Think Aloud (TA). Think aloud is a metacognitive strategy defined as an active,
reflective process directed toward one’s own cognitive activity (Flavell, 1976). Think
aloud includes self-instruction, self-question, and self-monitor. Students recall
strategies that they know, apply them appropriately to the given situation, and monitor
their problem solving activities. While working on the task, students are encouraged to
talk aloud about how to solve the problem in a tone audible to the observer. TA in this
study is redefined as self-instruction and self-question and, therefore, TA strategy is
taught and assessed limited to these two scaling categories.
Math Inquiry (MI). Inquiry has been considered as a necessary skill for students
to be productive individuals (Glasser, 1966; McCollum, 1978; Suchman, 1962). In this

9
study, math inquiry is defined as asking the questions in writing on the worksheet and
gathering information to solve the given problems using appropriate verbal expressions
and mathematical/everyday life terms. MI instruction encourages students to fill in the
missing mathematical information or to write down as many questions and statements
as possible about the given situation.
Mathematical Problem Solving (PS). NCTM (2000) suggests that problem
solving in elementary level means engaging in a task for which the solution method is
unknown in advance. In this study, math problem solving is defined as when students
draw on their knowledge in order to find many and varied solutions and, therefore,
problem solving instruction helps develop students’ own mathematical understandings
and methods through the intervention process.
Mathematical Creativity (MC). Krutetskii (1976) defined mathematical
creativity as the ability to leave the patterned stereotyped means of solving a problem
and find a few different ways of solving it. Cornish and Wines (1980) defined
creativity in mathematics as extending patterns, rearranging models, transforming
familiar conventions in practical situations, and predicting effects. Based on the
definitions above, this study redefines mathematical creativity as fluent and flexible
thinking in math problem solving.
Limitations
There would be at least three limitations in this study. First, the reactive nature
of the subject’s responses (Foster, 1986) is a possible limitation due to the nature of the
single subject research methodology and the short-term instruction. It is likely that

10
participants show reactivity causing problems in establishing basal data and the
interpretation of contracted gains. If the individual is aware of being observed on a
particular target behavior, he or she can alter the behavior or performance as a
response to being observed (Richards et al., 1999). Second, multiple treatments
interaction, or interference is likely to occur during the study, threatening the internal
validity of the gains (Krishef, 1991). This may be caused when two or more treatments
are given in relatively quick order. Carry-over effects can influence the results that are
obtained on other behaviors. Third, the study would not allow strong generalizability
due to the nature of the single subject research design and the eight week-short term
interventions (Barlow & Hersen, 1984).
11
CHAPTER II
REVIEW OF THE LITERATURE
This study focused on the effects of divergent production activities with math
inquiry and the think aloud strategy on students with math difficulty. This chapter will
introduce theoretical frameworks of the study by reviewing the literature closely
related to five research areas: (1) students with math difficulty, (2) divergent
production, (3) think aloud, (4) math inquiry, and (5) mathematical creativity. The
literature will help imply where this study should focus and how the suggestions from
the literature are related to students with math difficulty.
Students with Math Difficulty
Students with math difficulty is not a label for a special subset of children. It is
a group of students who are achieving in other subject areas while they are
demonstrating a lack of knowledge and skills in learning mathematics compared to
students at or above average achievement in mathematics. The terms, students with
math difficulty (S/MD) and low achiever in math (LAM) can be interchangeably used
since both groups belong to the same level based on the math achievement and their
learning characteristics. Ginsburg (1998) defined students with mathematics learning
disabilities as those who have normal intellectual abilities but unusually severe
problems only in learning mathematics and who are unlikely to profit from sound
instruction. Unlike students with learning disabilities (S/LD), students with math
difficulty (S/MD) or low achiever in mathematics (LAM) show difficulty completing
12
assignments and producing the amount of work usually expected (ACCG, 2003). Their
deficits in math are not severe enough to be identified as learning disabilities using a
screening test. It is suggested that grades assigned on the quality of performance rather
than the quantity is helpful for this group. For example, if given 100 math problems
during a timed test, the grade should be determined by the percentage correct of the
total number of problems actually attempted (ACCG, 2003).
Miller and Mercer (1998) documented four learner characteristics: information
processing, cognitive/ metacognitive, language disability, and social/emotional
perspectives. In information processing perspective, learners’ math performance may
be affected by attention deficits, visual-spatial deficits, auditory-processing difficulties,
memory problems, or motor disabilities. In cognitive and metacognitive perspectives,
students with learning disabilities lack awareness of the skills, strategies, and resources
that are needed to perform a task and tend to fail to use self-regulatory mechanisms. In
language disabilities perspective, language skills become very important to math
achievement because math symbols are an expression of numerical language concepts.
For example, Smith (1994) reported that reading difficulties interfere with word
problems solving ability among many students with learning disabilities. In social and
emotional characteristics, studies show the significant relationships between
mathematics and self-esteem. For instance, repeated failure in math was believed to
lower self-esteem and produce emotional passivity in mathematical learning (Cherkes-
Julkowski, 1985; Patten, 1983). It was found that mental ability and self-efficacy had
strong direct effects on mathematical problem-solving performance of 329 high school
13
students (Pajares & Kranzler, 1995). Ability also had a strong direct effect on self-
efficacy, which mediated the indirect effect of ability and level on performance. Their
results also supported Bandura's (1986) finding that self efficacy can mediate between
the sources of its creation and subsequent outcomes. Students tend to experience strong
influence through their judgments of their own capabilities to do specific tasks in a
way that their motivation and behavior are affected. Therefore, teachers should
understand learner characteristics in order not to interfere with students’ independent
development in terms of academic achievement (Miller & Mercer, 1998).
General characteristics found in students with mathematical learning
disabilities are not synonymous with those found in students with math difficulty,
although these two groups have much in common. Kavale et al. (1994) claimed that
students with learning disabilities have rather differential learning characteristics from
low achievers so that they can be clearly differentiated. Understanding learner
characteristics of students with learning disabilities also can be helpful in that the
implications from the literature are conducive to develop intervention programs for
low achievers in math or students with mild math difficulty. As aforementioned, the
transition from low deficit to severe deficiency exists throughout all school levels
(Miller & Mercer, 1998). Educators need to find out where instruction and remedial
intervention for students with math difficulty should focus and what instruction they
need to implement in order to improve the deficits of students in mathematics.
Behrend (1994) provided individualized education programs (IEP) to examine
the problem solving processes of five second and third grade students with learning

14
disabilities. Students received individual interviews and were encouraged to share their
own strategies during group sessions. Both independent and assisted problem solving
abilities were assessed by a measure based on Cognitively Guided Instruction
(Fennema & Carpenter, 1985). Behrend found that all students in the study benefited
from utilizing their own problem solving strategies and did not need to be taught
specific strategies.
As seen in the preceding review, students with math difficulty differ from
students with mathematics learning disabilities. Students with math difficulty typically
find their mathematical ability lies between learning disabilities (LD) and achieving or
average performing students. While those who identified as LD receive special
program and extra attention from the educational system, it is uncertain that students
with math difficulty have been provided any treatment. Little information or statistics
has been available in how educators have taught S/MD in classroom levels using
systematic remedial instruction. Therefore, more consideration must be given to the yet
unlabeled but potentially to-be-math LD, since this negligible low degree of the lag in
math can be found elsewhere in the classroom and become deteriorated in-depth and
spread to other subject areas. Problems with mathematics usually begin in the
elementary school and continue to develop through elementary into adulthood (Miller
& Mercer, 1998). It is imagined that special attention plays a critical role to recover
deficits in mathematics and reinforces their self-confidence in math problem solving,
which could contribute to both a higher level of mathematical creativity and
mathematical performance.

15
Divergent Production (DP)
Creativity has attracted enormous attention and has been studied in a variety of
ways by researchers, particularly since Guilford (1950) addressed the importance of
creativity at the American Psychological Association. Divergent production has been
one of the major areas in the creativity field, along with factors such as fluency,
novelty, flexibility, synthesizing ability, analyzing ability, reorganization or
redefinition of already existing ideas, complexity, evaluation, originality, elaboration,
problem solving and such (Guilford, 1967; Runco, 1999; Torrance, 1974; Torrance &
Safter, 1999). Since the term divergent production was Guilford’s own for divergent
thinking (Runco, 1999), both divergent production and divergent thinking can be
interchangeably used in this study.
Guilford (1967) defined divergent production as the generation of information
from given information, where the variety and quantity of output is emphasized. Four
components are considered as important divergent production abilities that contribute
to creativity are fluency, flexibility, originality, and elaboration. Each was defined by
Guilford (1959) as follows:
Fluency of thinking is being able to think well and effortlessly in the given
problem situation; flexibility as being able to easily abandon old ways of
thinking and adopt new ones; originality as coming up with ideas that are
statistically unusual; and elaboration as being able to fill in details given a
general scheme. (p. 142)
16
Torrance (1974) defined creativity as:
A process of becoming sensitive to problems, deficiencies, gaps in knowledge,
missing elements, disharmonies, and so on; identifying the difficulty; searching
for solutions, making guesses, or formulating hypotheses about the
deficiencies: testing and retesting these hypotheses and possibly modifying and
retesting them; and finally communicating the results. (p. 8)
Based on his definition of creativity, Torrance attempted to find ways to test for
divergent production. He developed and validated the Torrance Tests of Creative
Thinking (1974, 1990) with four measuring variables: fluency, flexibility, originality,
and elaboration. Further, Torrance and his colleague Safter (1999) invented materials
and methods that can be used to facilitate creative abilities and the production of
creative solutions.
Balka (1974b) selected six criteria for measuring creative ability in
mathematics from a list of 25 general creativity criteria. The six criteria consist of four
divergent and two convergent aspects determined by mathematics teachers,
mathematics educators, and mathematicians. The sixth criterion was to assess the
ability to split general mathematical problems into specific subproblems through
divergent thinking activities. For example, he asked junior high school students to
solve a problem which geometric figures given are alike and why they are alike: square,
rectangle, parallelogram, rhombus, and equilateral triangle.
Dirkes (1978) reviewed the literature on the relationship between learning and
divergent production to find supporting evidence for classroom instruction. From the

17
previous studies, she found that divergent production and the learning of students are
related as creative thinking ability and problem solving are associated. In her
exploratory activity, Dirkes asked four 7-year old students to brainstorm on a
mathematical situation that was beyond their competence. She found that the response
lists get longer and transfer increases with practice. This assures that divergent
production provides students with an opportunity to generate many and varied ideas
that can be used to increase academic achievement. She suggested some guidelines for
divergent thinking to help the learning-disabled or ill prepared student with simple but
a challenging subject matter. It is suggested that divergent thinking can be used to
direct students by facilitating complex learning where sequencing is inadequate.
Carman (1992) studied seventh grade students randomly selected from clusters
of students and gave them a short mathematical problem-solving ability test. Odyssey
of the Mind (OM) is a creativity training program in which team members solve
complex, open-ended problems and present their solutions at a competition. Students
were taught essential creativity skills such as fluency, flexibility, elaboration, and
problem solving through the program. After comparison was made between the
students who participated in OM and those who did not, Carman found that
participation on an OM team was associated with a mathematical problem-solving
ability and teacher/student ratings of problem-solving ability. Although participants
were not taught directly how to solve the problem situations, this was not surprising
since the teachers and coaches worked with participants by encouraging their
leadership and motivating their problem solving. It may indicate that mathematical

18
problem-solving ability can increase with creativity skills acquired through divergent
problem solving training experiences.
Baer (1993) clarified that divergent thinking theory of creativity suggests that
creativity will be enhanced by considering three facets of ideas: many ideas; a wide
range of ideas; unusual ideas. Divergent thinking has been a major component in most
creativity training programs. As Baer stated (1993), creativity training programs made
mixed claims for their success in promoting creative thinking. Some appeared to
support the divergent thinking theory of creativity. Others seemed to contradict that
divergent thinking plays a significant role in creative performance. Baer seemed
reasonable to conclude this way in that the programs that have yielded successful
results show only students’ improvement in the specific kind of problem solving taught
in the course. It may imply that that these improvements in specific task areas cannot
necessarily be generalized to extend to general creative thinking ability. Divergent
thinking or divergent production is not synonymous with creativity. Divergent thinking
training programs have resulted in substantial increases in divergent test scores, but
may have not shown similar results in general creativity test. To assure that divergent
thinking training can improve creative performance on a variety of tasks, supporting
evidence should be found in the effects of the intervention on creativity. Further study
is needed to develop comprehensive divergent production activities that can improve
creativity in mathematics.
Baer (1993) presented the results of five studies on creative performance
across task domains. Among these, the first two studies contain mathematics closely
19
related to the creative performance of individuals on several tasks to determine if the
creative performance of individuals on one task is predictive of their creative
performance on other tasks. In the first study, eighth grade participants were given five
creativity tests, which involve verbal and math domains. All students scored above
average as measured by the California Achievement Test in reading and mathematical
achievement. In the second study, fourth grade participants were given two writing
tests: a mathematical word problem and a mathematical equation. The word-problem-
creating test asked students to write an interesting and original math word problem
including all needed information so that it can be solved by someone else. An example
written by a student is “Once there were 20 flying dogs. 10 landed. How many left? 12
more flew in. How many flying now?” (p.111). In the equation-creating test, students
were asked to write an interesting, original equation using given examples of a few
equalities. An example is “2+2=2+2; [9/3][2/6]=[2/3][9/6]” (p.50). It was found that
mathematical skill as measured by mathematical IQ and mathematical achievement
tests contributed to creativity in mathematical-domain tasks. It was also found that
word problem creating tests involve both mathematical and verbal skills. Domain-
independent creative thinking skills like divergent thinking appeared insignificant in
creative performance across a variety of task domains as Baer confirmed in verbal and
mathematical task domains.
Perry and Stacey (1994) studied the use of taught and invented methods of
math problem solving. They administered four subtraction questions in vertical format
to students attending an academically oriented private school for boys. A three item

20
assessment of lateral thinking was given to the students. Items were either lateral
thinking or divergent thinking closely related to lateral thinking. Students were asked
to show their work and to explain in writing the methods they used. It was found that
students used more invented methods at grade 12 than grade 7. Students in the below
average achievement group were twice more likely to use invented methods than those
in the above average group. There was found no difference in the lateral thinking
scores between students using taught and invented methods.
As seen in the preceding review, it appears to suggest that divergent
production activities can facilitate students with complex math problem solving:
invented materials and methods can be effectively used for students in the below
average achievement. Specific mathematical problems can be taught using divergent
thinking activities. Learning-disabled or ill prepared student can be helped with simple
but challenging math problem following creativity training. Mathematical skills were
found to contribute to creativity in mathematical-domain tasks. It may imply that
divergent production can possibly affect students’ math learning and transfer to other
subject areas. It is hypothesized that game-like or puzzle-like math problems would be
favorable to students with math difficulty. Therefore, divergent production activities
could be reconsidered as a way of supplementing students with short term and mild
math deficit.
Think Aloud (TA)
Think aloud is a way of metacognitive strategies. It can be described as verbal
mediation training that children think out loud when they think about the task and
21
solve the problem. In general, metacognition has been defined as an active, reflective
process directed toward one’s own cognitive activity (Berardi-Coletta et al., 1995;
Kluwe, 1982) and “one’s knowledge concerning one’s own cognitive processes and
products or anything related to them” (Flavell, 1976, p.232). Metacognition consists of
an awareness of skills and strategies needed to perform a task effectively as well as the
ability to use self-regulatory mechanisms to ensure the successful completion of the
task (Baker, 1982). Think aloud as a metacognition strategy has been believed to
increase self direction and autonomy of the learner both in academic and social
behavior.
Meichenbaum and Goodman (1971) trained children from a special education
classroom on modifying their classroom behavior and improving cognitive test results
by verbal mediation activity. In their study, self-instruction is defined as speaking the
directions or process statements for problem solving, personal affirmations, accuracy,
neatness checks, or other statements that are designed to regulate behavior.
Camp and Bash (1981) developed the think aloud program, which combined
cognitive training and social problem solving through verbal mediation. Based on the
research by Meichenbaum and Goodman (1971), think aloud was initially designed for
young aggressive boys. Later, Camp and Bash (1981) developed the think aloud
program for regular elementary classrooms. Four self-instruction questions are
basically used to promote children’s problem solving skills: “1) what is my problem?
Or what am I supposed to do? 2) What is my plan? Or how can I do it? 3) Am I using
my plan? and 4) How did I do?” (p. 17).

22
Montague and Bos (1986) investigated the effect of cognitive strategy training
on verbal math problem solving. They selected six students aged between 15 and 19
from small-group remediation classes for students with learning disabilities. Training
involved an eight-step strategy designed to enable students to read, understand, carry
out, and check verbal math problems encountered in math curriculum. Strategy
acquisition training was three 50-minute sessions. Students were asked to read the
problem aloud, paraphrase the problem aloud, visualize the problem, complete the
given statements aloud, complete the given statements aloud for hypothesizing, write
the estimates, show the calculation, and finally, do self-check. Montague and Bos
found that five of the six students made substantial progress in solving verbal math
problems after receiving cognitive strategy training in terms of the time reduction to
complete the test as well as the utilization of the strategy. Cognitive strategy has been
frequently used for students with learning disabilities along with think aloud. It may
imply that the cognitive strategy can be an alternative effective learning strategy for
students with mild deficit to improve the verbal math problem solving. Students are
encouraged to talk to themselves about how to solve the problem. While working on
the task, students are trained to talk in a tone audible to the observer.
Montague (1996) presented an alternative assessment procedure of
mathematical problem solving that included both cognitive and metacognitive
strategies. He addressed in the model the three metacognitive strategies that good
problem solvers use: self-instruction, self-question, and self-monitor. He pointed out
that students recall the strategies they know about, apply them appropriately, and
23
monitor their thinking during problem solving in order to seek solutions in the problem
situation.
Pressley (1986) noted that metacognitive strategies are used to organize
information, represent it accurately, execute the solution, and check the problem
solving process. Self-instruction prompts the individual to participate actively in the
behavior change process. Self-question is used to validate the process of thinking and
redirect the behavior. Self-question includes monitoring questions and evaluating
statements that are used for self-judging the answer: Am I following the steps? Or is
this answer correct?
Desoete et al. (2001) examined the relationship between metacognition and
mathematical problem solving on third graders with average intelligence. All
participants attended general elementary school without reading or mathematics
learning disabilities. They completed three types of tests individually outside the
classroom setting, which are a standardized test on mathematics (the KRT), a reading
fluency test (the EMT), and two metacognitive tests (the MAA and the MSA). Factor
analysis and multivariate analysis of variance (MANOVA) were conducted to process
the data. Metacognition explained 66 to 67 percent of the common variance and
differentiated between average and above-average mathematical problem solvers. The
findings confirmed that metacognition is important both in the initial or fore-thought
phase and in the final or self-reflection phase of mathematical problem solving as well.
The above studies may imply that think aloud can be helpful for students with
math difficulty in enhancing self-efficacy and improving their academic performance.
24
When learners believe that think aloud strategy is a useful tool, they are likely to seek
the solutions using this strategy with self-confidence and self-assertion (Davis, 1986)
and become more independent in solving given problems on their own. In this regard,
students’ own initiative and deliberately designed math instruction together can induce
students to learn more within specific domains such as mathematics (Montague, 1996).
Think aloud is assumed to be a more helpful strategy for schoolchildren with math
difficulty to increase mathematical performance since these students are in need of self
confidence and self efficacy.
Math Inquiry (MI)
The skills of inquiry have been emphasized as one of the necessary skills for
students to acquire in becoming productive individuals (Glasser, 1966; McCollum,
1978; Suchman, 1962). Glasser (1966) found that inquiry or discovery learning is
important to critical thinking since inquiry skill prepares students to confront problems,
generate, and test ideas for themselves. When students are given a relatively unguided
trial and error problem, they apply their own structure using inquiry skills. McCollum
(1978) explained that the process of inquiry begins with specific data, requires concept
clarification, and then reaches generalizations. He viewed inquiry as a necessary
process to become a productive and self-generative learner. Suchman (1962) noted
that the teacher should provide the inquiry situations that the learner controls. The
major processes of inquiry involve four skills: describing, explaining, predicting, and
choosing. The processes of inquiry have been applied to find answers by using given
information. Ellis and Alleman-Brooks (1977) provided the inquiry skills checklist for
25
the evaluation of student’s inquiry learning, which includes specific skills such as
asking questions, drawing maps, making observations, making graphs, drawing
sketches, making measurements, and recording data. Sorenson et al. (1996) affirmed
that inquiry processes help students develop their own strategies in order to seek out
information and solve problems in all subject areas. Some of the fundamental inquiry
skills include observing, classifying, inferring, predicting, and measuring. These
specific skills can be adopted in developing an assessment to measure math inquiry
skills in terms of divergent production.
Jensen (1973) studied the relationships between mathematical creativity and
numerical aptitude, and mathematical achievement in relation to computation and
problem-solving. Mathematical creativity was measured by the divergent production
tests in mathematics devised by Jensen. She presented students the problem situations
such as written form, graphic form, and chart form and asked them to write down all
the questions that they could think of from the given graph. She found moderately high
correlations among the constructs and recommended the possibility of mathematical
creativity as a supplementary evidence of a student’s mathematical performance.
Jensen (1973) viewed creativity as the ability to give numerous, different, and
applicable questions when presented with a mathematical situation in written, graphic
or chart form. Jensen’s study suggests two possibilities: One is how math instruction is
designed to train inquiry skills. The other is how possibly the effect of the instruction
can be assessed. Math inquiry skills could be trained using divergent production
activities if problems were properly presented in a question writing form. Students
26
should have ample opportunities to practice questioning to find solutions.
Balka (1974b) selected six criteria for measuring creative ability in
mathematics. His fifth criterion was to measure the ability to sense missing pieces from
a given mathematical situation and to ask questions in order to fill the missing part
through divergent thinking. He gave the students a paragraph long piece of information,
for example, a U.S. Agriculture report then directed them to make up as many
questions as they could in the given mathematical situation. Students were only to
generate questions that could be answered from given information in the paragraph.
They were not asked to solve the problems that they wrote. Each question would score
two points, one point each for fluency and flexibility. For example, a question like
“how much does an average American family spend for groceries in one year?” (p.
635) would award one point since the answer is not given but can be calculated from
the given information. Balka (1974a) found that students with high flexibility scores
perceive adjustments and changes in a given mathematical situation and make the most
of their capabilities in the given situation. He also pointed out the lack of research in
the development and use of creativity instruments in mathematics for future study.
Haylock (1984) constructed a number of tests to assess the ability of divergent
production. One of tests was called problem posing which a “scattergram” graph asks
students to make up as many and varied questions as they can from the given
information. The other test was called redefinition. For example, the students were
asked to write down as many different statements of what the two numbers 16 and 36
have in common. Students were required either to practice continual redefinition or to
27
make up questions. Math inquiry training can utilize samples similar to Haylock’s
study for developing inquiry skills and divergent thinking skills.
As discussed above, the literature indicates that inquiry skills can be important
for schoolchildren that contribute to both mathematical creativity and mathematical
performance. It also implies that math inquiry can be taught and assessed through
divergent production activities in the regular classes. Previous studies suggest that
some exemplary samples can be used for assessing students’ math inquiry skills. In this
study, math inquiry was defined as questioning skills in mathematics through divergent
production activities in pursuit of as many and varied solutions. Questions were
devised in order for students to make out as many questions or statements as they
could ask in the given situation.
Mathematical Creativity (MC)
Relatively little consideration has been given to the creativity concept within
mathematical education. As in the preliminary search by the researcher in September
2002, the Educational Resources Information Center (ERIC) database held 2,426
articles limited to English language and in journals format in the area of creativity
using the descriptor, “creativity” since 1966. Only 44 articles (less than 2 %) among
them were found on mathematics research in the area of creativity using descriptors of
“creativity” and “mathematics.” Perhaps one explanation would be that school
mathematics was thought to be associated with convergent thinking rather than
divergent thinking. Hudson (1966) found that students were explicitly or implicitly
required in mathematics to find the single best solution to each given problem. Perhaps
28
the emphasis on convergent thinking in mathematics may be attributed to the following
factors: the nature of mathematics, the perceptions of school teachers, or the
assessment instruments. However, a number of mathematical educators have seen that
divergent production tasks are potentially relevant to the assessment of mathematical
ability, since divergent thinking allows flexibility in solving math problems (Balka,
1974a; Hollands, 1972; Krutetskii, 1969; Wood, 1968).
Krutetskii (1969) viewed mathematical creativity as varied approaches to find
the solution to a problem in easy and flexible ways. Mathematical creativity appeared
to facilitate finding a few different ways of solving the problem and encouraged
resistance to use stereotyped ways of solving it. Krutetskii (1976) commented that
schoolchildren display mathematical creativity of “the independent formulation of
uncomplicated mathematical problems, finding ways and means of solving these
problems, the invention of proofs and theorems, the independent deduction of formulas,
and finding original methods of solving nonstandard problems.” (p. 68). It is clearly
seen that several traits of creative thinking were included in his definition such as
independent, different/ varied, inventive, and original in mathematical activity.
Krutetskii (1976) also stressed that flexibility significantly comprises mathematical
ability in schoolchildren and mathematical material should be mastered independently
and creatively for mathematically gifted students during school instruction. One might
conjecture that flexibility would be one of the attributes that needs to be extended for
fostering mathematical ability for other students, rather than being focused on the
mathematically gifted.
29
Some findings from the literature are in conflict regarding creativity training
and mathematics. Hiatt’s study (1970) supported that divergent production tasks in
mathematics do measure some aspect of mathematical ability which were not assessed
by conventional attainment tests. Evans (1964) reported significant positive
correlations between divergent production in mathematical situation and arithmetic
achievement, mathematics attainment, and general creativity. Meyer (1970) found no
gains when a mathematics program was instructed in a creative approach to the first
grade schoolchildren. Evidence was found in Haylock’s (1987a) study on the effects of
divergent thinking training program to mathematical performance. No significant
correlations were found in mathematics achievement tests with mathematical divergent
production tests (Mainville, 1972; Baur, 1970).
Haylock (1984) investigated mathematical creativity in school children aged
11-12 years old to identify some aspects of creativity and its significant characteristics
which the students might show in mathematics. To determine whether rigidity and
fixation played roles during doing mathematics and how students perform divergent
production in mathematics, students were given three types of puzzles like problems in
both numerical and spatial domains. Haylock (1984) reported that children may show a
fixation in mathematics, and the fixation may provide some self-restriction that may
cause them to fail to solve the problem. The study showed some limiting effect on
performance in mathematical creativity tests in that only the group within the very high
achieving band revealed the largest variation in overcoming fixation (OF) and
divergent production (DP) scores. It was found that OF/DP scores were positively
30
correlated with Category Width as measured by a modification of Pettigrew’s (1958)
test and negatively with anxiety towards mathematics as assessed by a questionnaire
based on Wallach and Kogan’s (1965) Mathematics Attitude Inventory. It suggests that
the students in the higher level of mathematics attainment would be more likely to
have abilities to overcome fixations and to demonstrate divergent thinking. This may
indicate that the fixation would restrict divergent production in mathematics and hinder
facilitating mathematical attainment by inappropriately narrowing down the
possibilities and restricting the range of elements relevant to the problem.
Haylock (1987b) stated that mathematical creativity in schoolchildren must be
defined in the areas of both mathematics and creativity, whichever more emphasis is
weighted. Haylock seemed to put the equal emphasis on both mathematics and
creativity in assessing mathematical creativity of school children. Mathematical
creativity can be rephrased as creativity in school mathematics. Since math problems
in his study were solved using divergent thinking processes, the students were asked to
redefine the given situation as many and different subsets as possible.
Bibby (2002) studied teachers’ perceptions of creativity and logic in primary
school mathematics using semi-structured interviews. The logic meant by the teachers
here is the systematic, step-by-step conception of logic rather than the logical
reasoning of deduction, argument, or justification. All the teachers in the study
believed that problem solving area was the place where mathematics could be creative,
while almost all the teachers saw creativity in mathematics as problematic. Creativity
in mathematics was thought not to be the flexible mathematical creativity of

31
association, but rather the logical creativity of algorithmic knowledge. Bibby
concluded that the teachers showed severely limited understanding of the potential for
creativity within mathematics.
The preceding review leads to questions about whether divergent production
can be an important component or strategy for schoolchildren to contribute to both
mathematical creativity and mathematical performance. This current study favors
Haylock’s viewpoint that mathematical creativity can be measured by divergent
production tests. No evidence was found yet to support directly mathematical creativity
of students with math difficulty. Divergent production implies feasibility as to
fostering creativity only for mathematically gifted under the school instruction
(Krutetskii, 1976). Other studies claim that students may benefit from creativity
instruction which raises fluency, flexibility, originality, and inventiveness as an
objective of mathematics (Hollands, 1972; Wood, 1968). Kieren (1997) suggested that
research practices place emphases on the mechanisms of student’s mathematical
thinking and on acting with students in doing mathematics. This may indicate that
mathematics education should be widely open for varied hands-on activities, divergent
thinking problems, and invented methods by the learners in order to empower learners’
own problem solving ability. Conceivably, this current study would obtain some
results based on suggestions from the literature. By introducing multiple divergent
production instructions combined with math inquiry skills and the think aloud strategy,
students with math difficulty are expected to improve their math performance and
eventually develop their creativity potential.
32
CHAPTER III
METHODS
This chapter introduces the research methods used in (1) the research design for
the study, (2) identification of participants, (3) experimental context, (4) development
of materials, (5) experimental procedures, and (6) data collection/ analysis. The study
was conducted by using a multiple baseline across behaviors design (Barlow & Hersen,
1984), along with a pretest/posttest design (Gall et al., 1996). The effects of instruction
on the target behaviors of think aloud, math inquiry, and problem solving were
measured by both the author’s Divergent Production Scales (DPS) and the Torrance
Tests of Creative Thinking (Torrance, 1974).
Design
This researcher integrated two research methods. The principal method was a
multiple baseline across behaviors design. The supplementary method was a
pretest/posttest design.
Experimental single subject research design. The advantages of single subject
research are that it is evidence-based methodology used in practical settings and that
provides directly observed gains as scientifically acceptable evidence (Kazdin, 1992;
Lundervold & Belwood, 2000). A single subject design is commonly used in
educational settings to test the effectiveness of the intervention (Swassing & Amidon,
1991). This researcher employed a multiple baseline across behaviors design, which,
in general, is used in three cases: when a single participant has more than one problem;

33
when two or more participants have a similar type of problem; or when there are two
or more settings that involve the same problem (Krishef, 1991; Richards et al, 1999).
This researcher then replicated the multiple baseline design on four participants who
were functionally similar. Each student was observed across three target behaviors.
One baseline observation is terminated and then the first treatment begins on the
behavior, while the other two behaviors are being observed, so that they will have
more extended baseline periods. Therefore, two other behaviors are under time-lagged
conditions (Krishef, 1991). Multiple baseline across behaviors design has three
strengths in terms of validity. First, external validity can be enhanced because the
treatment is applied to several behaviors of the same person in the same settings. The
term external validity is used interchangeably with generalizability or transferability
since results of the study can be transferred to different environments, different types
of instruction, or different students. By having more than a single participant under
more than one behavior or setting, a multiple baseline design can increase its external
validity (Gall et al., 1996). Second, it helps control the threat to internal validity such
as history (Krishef, 1991). Internal validity refers to the degree to which you can claim
that the effects or gains of the study are due to the program or treatment. History threat
comes from any information, directly or indirectly, related to the ongoing program if a
participant received any experience or information that affects the results other than the
treatment (Kazdin, 1982). This multiple baseline design allows more reasonable
explanation as to why some data points at a certain time of the study displayed a lot of
bounce. History threat to internal validity can be controlled through careful observation
34
of the participant and monitoring of experimental procedures and measurements. Third,
this design assures that effects can be attributed to the intervention rather than to
various extraneous variables since both direct and systematic replications under
identical conditions over several participants’ cases have been completed (Kazdin,
1982).
In this study, baseline phase (A) provided information about the subjects’
current level of the behavior as measured by Divergent Production Scales (DPS)
designed by the researcher prior to the intervention procedures. The intervention phase
(B) was composed of three types of instructions, and began when the stability of
baseline was evident for each dependent variable (Kazdin, 1982). Therefore, each
subject had differing lengths of the baseline and intervention across three behaviors.
The follow-up data was collected twice, on week one and week three. The
interventions were terminated in order to see a cause-and-effect relationship between
the instructions and the student’s ability to produce ideas divergently with math inquiry
and think aloud on math problem.
Pretest/posttest design. This researcher adopted a supplementary method as
measured by Torrance Tests of Creative Thinking (Torrance, 1974). As in Harkow’s
study (1996), TTCT was used for measuring the effect of multiple interventions in the
short term. Each student who participated in the study was administered a 30 minute
test before initiating the probe and immediately after terminating the instructions. This
pretest/posttest was intended to detect any statistically significant differences between
two means, to ensure the effects resulted from the instructions (Gall et al., 1996). A
35
pretest/posttest design provides additional information for the researcher to assist in the
interpretation of results gained by the single subject research. Combining more than
two methods may enrich the implications by looking at the gains of the study at several
different angles.
Participants
Four elementary students with math difficulty participated in the study.
Participants lived in a small suburban city in the Southwestern United States. The
selection process began with referrals from the math teacher and the learning
development specialist at the school, based on the following criteria. Each participant
1) was a fifth grader; 2) was currently identified as having below average
achievements in math; 3) referred by their mathematics teacher; 4) had never been in a
divergent production training; and 5) received parental permission and gave assent to
participate in the proposed study.
Student #1. This student was an 11-year-old Caucasian female. The following
descriptions were given by her math teacher about her typical school behavior relating to
math class:
Student #1 did not care about schoolwork. She was capable of doing better than she did. She got tutoring during the day. While her homework was always done correctly, she could not do the same problem in class. It seemed someone sat down with her one-on-one at home and helped her with the work, or did it for her. I took daily grades on homework. Journals obviously brought her grades up. If grades had been only taken on tests, the grade would have lowered, for example, to a C or D. At the time, she had problems at home between her parents and her test scores declined last year.
Her Texas Assessment of Academic Skills (TAAS) score on math last year
(2002) supported a description of math difficulty. She passed 40 percent of the total
36
objectives of understanding concepts and 66 percent of problem solving objectives. This
accounted for more than 30 percent of the failure to meet mastery at the fourth grade
math level. Her math teacher reported that she was easily distracted during the
instruction and assessment as well. She had difficulty sustaining attention to steps in
problem solving (e.g., probability). She also showed some memory problems. For
instance, she often performed poorly on review lessons and failed to retain math facts.
Student #2. This student was an 11-year-old Caucasian female. The following
observations were provided by her math teacher:
Student #2 tried hard on math problems, but information she learned in class did not stay any longer. One day she could do it, and the next she could not. She has been tested for learning disabilities, however, she was not qualified as a student with learning disability. She was in counseling and took medicine for depression at the time of the study due to her parents’ problems in their relationship. Mom had remarried and had a new baby. Student #2 was the oldest of four kids. This seemed to affect her studying and test scores. Test scores from last year showed problems in math.
Like student #1, her TAAS score on math last year showed that she fell short by
20 percent of the total objectives of understanding concepts and 66 percent of problem
solving objectives. This accounted for 25 percent of failure to meet the objective mastery
at the fourth grade math level. According to the teacher’s description and the
investigator’s observation, her math performance seemed germane to her emotional
variables (e.g., depression), which could negatively affect in mathematical learning,
along with other factors such as anxiety, low self-esteem, and passivity (Pajares &
Kranzler, 1995). She also showed some memory problems. For instance, she often failed
to recall math facts and use new strategies. She appeared to need extra help and hard
work on her problems in math.

37
Student #3. This student was an 11-year-old Caucasian male. His math teacher
observed him in the math class:
Although student #3 tried hard, he did not solve problems since information that he acquired did not stay in his brain. He attended pre-first the year between kindergarten and first grade but he still had gaps. He had never been tested for learning disabilities. He was in tutoring like student #4. Student #3 lived with both parents. Test scores from last year showed that he had math difficulty.
As reported by his math teacher, student #3 seemed to have very much
understanding of the lesson in the beginning, but did not retain the knowledge for the
next lesson. He obviously showed memory problems. For instance, he had difficulty
solving multi-step problems such as probability and counting a stack of blocks. His
TAAS math score from last year also supported that he seriously lacked understanding
of math concepts by 80 percent of the objective mastery and 66 percent in problem
solving. This accounted for 50 percent of failure to meet the objective mastery at the
fourth grade math level. His TAAS score appeared to demand of him great efforts in
math in order to achieve the fifth grade level.
Student #4. This student was a 10-year-old Hispanic male. The following were
the observations and information collected by his math teacher:
Student #4 had difficulty with math last year. He had a personal conflict with his math teacher, therefore, he didn't try hard. At the time of being in the study, he did much better than other students in the group. He had become more confident about his math abilities and was trying harder. Like other participants in the study, his grades would have been a C or D if homework and journals had not brought it up. Although student #4 made a lot of progress this year, he still had gaps in math performance. He got tutoring. He lived with both parents and had no problems with family. Since he was absent on TAAS test last year, his math score was unavailable.
Student #4 had no reference as to TAAS score. He seemed interested in math
again since he participated in the study. His avoidance behavior and poor performance in
38
math were believed not to come from the math subject itself (e.g., texts or materials) but
from the bad relationship with his math teacher last year. He showed some visual-spatial
problems. For instance, he had difficulty drawing shapes such as combined polygons.
As described above, all participants for the research had math difficulty, which
were not screened either by the letter grade inclusive of all performances or by learning
disability tests. However, they all had explicit difficulties to certain degree in
understanding the mathematical concepts and in solving math problems judged by the
math teacher and TAAS math scores alone. They appeared to have their dependency on
the teacher for extra help in understanding concepts and solving problems correctly.
Context
The research school was situated five miles away from the center of a small
southwestern town dominantly populated with middle class Anglo Americans. The
total enrollment of the school was 467 students, whose proportion was 73 percent
Anglo Americans, 13 percent Hispanic and African Americans, respectively, and .5
percent Asian Americans. This school can be called a medium size elementary school
with a well provided educational environment. Primarily instruction was conducted in
the office of the instructor who was a learning development specialist at the school.
The office was used to administer a variety of testing instruments to students at the
school. It was equipped with two large rectangular tables in a quiet, spacious, and well
enough organized setting to give the participants individual lessons without noticeable
distraction. At times the video library was used for instruction and assessment due to
either unavailability of the office or for reduction of the travel time from their

39
classrooms. The video library was closer for the students to access, located right in the
hallway across the classrooms, while the office was down the hall around the corner.
On only one assessment day when neither of the rooms was available, the session was
conducted in a small cozy corner in the library which was used for reading.
Measurements
Test materials. Two measurements were used in the study. The first measure,
the Divergent Production Scales (DPS) developed by the researcher, was used weekly
for assessments on each behavior during the intervention and two sessions for the
follow-up phase. The DPS consisted of three summative scales of behaviors, i.e., think
aloud (TA), math inquiry (MI), and problem solving (PS) (Appendix E). The DPS
consisted of the material that reflected the mathematics standards of problem solving
for the fifth graders guided by Texas Educational Agency (TEA, 2002). Subscales of
DPS were composed of two to three variables which characterize the significant
aspects of creativity. Think aloud (TA) and math inquiry (MI) were assessed for 5
minutes, respectively and problem solving (PS) for 10 minutes.
The second measure was the Torrance Tests of Creative Thinking (Torrance,
1974). The participants were given the 30 minute TTCT, Figural Form A at the
beginning and the alternate Form B following the withdrawal of the intervention
program to see if the treatment affected each student’s divergent production. The
TTCT (Torrance, 1974) provided four different measures of divergent production
ability: fluency flexibility, originality, and elaboration. In brief for both verbal and
figural forms of TTCT, fluency was the number of ideas, flexibility was the number of
40
different kinds of ideas, and originality was the unusualness of ideas scored based on
infrequency of appearance of ideas. Elaboration was details of ideas counted only on
figural test.
Development of materials. The materials used for instruction and assessment in
this study involved a wide range of researcher-made instruments. The worksheets were
developed either by revising problems used in the previous studies (Balka, 1974a;
Dirkes, 1978; Evans, 1964; Haylock, 1984; Jensen, 1973; Krutetskii, 1976; Lean &
Clements, 1981; Inoue, 1999), or by creation based on a tentative model of divergent
production with math problem solving by the investigator. Materials used for assessing
divergent production are presented in Appendix G.
Dependent Variables
Data measured by Divergent Production Scales (DPS) were reported as three
summative scores of think aloud (TA), math inquiry (MI), and problem solving (PS)
respectively. There were two scoring categories in TA, self-direct and self-question.
There were three scoring categories in MI, fluency, flexibility, and elaboration and two
in PS such as fluency and flexibility. Each category is defined as a variable of DPS as
follows.
Summative scores of think aloud (TA). Think aloud included self-instruction
and self-question. During five minute assessment time, students recalled strategies they
knew about and applied them appropriately to the given problem. When the subjects
performed with self-instructing talk in a tone audible to the rater during on-task,
41
occurrences were tallied. For example, one occurrence is “I will try another shape” or
“my estimate answer is 33” in the computation situation. Self-question refers to asking
questions oneself regarding what s/he is doing. Examples are: do I need this?; what
should I do?; or is this right answer? If the verbalization were relevant to the task and
if the subject directed his/her behavior to solve the problem or question himself/herself
to check the answer, it was counted as one occurrence.
Summative scores of math inquiry (MI). Math inquiry was defined as asking the
questions in written down fashion on the worksheet and gathers information to solve
the given problems using appropriate verbal expressions and mathematical/everyday
life terms. Students were given a mathematical situation and asked to fill in the
missing mathematical information by making inquiries, or the students wrote down as
many questions as possible about the situation so that the problem could be solved and
answered from the given information. The summative scores of math inquiry were
determined by adding the number of relevant questions written on the worksheet in
order to solve the problem (fluency), the number of questions or statement made to get
the information in different categories/ways (flexibility), and the degree of how
detailed the questions/ statements to solve problems (elaboration). Elaboration
measured how detailed the responses were in the process of solving the problem.
Examples are: drawing more lines; illustrating the solution with graphs or figures; or
combining two questions into one complex statement and such.

42
Summative scores of math problem solving (PS). Divergent production
activities were presented to the participants as a form of math problem solving, which
meant engaging in a task for which the solution method was not known in advance. In
order to find a solution, students drew on their knowledge through this process and
developed new mathematical understandings. The summative scores of PS were
determined by the composite scores of two variables: Fluency is defined as being able
to think well and effortlessly in the given problem situation (Guilford, 1959). Fluency
measured how many responses the student could think of for the given situation, i.e.,
the number of responses for a given problem (fluency). Flexibility is defined as being
able to easily abandon old ways of thinking and adopt new ones (Guilford, 1959).
Flexibility measured how many categories of responses the participant could think of
by shifting thinking from one way into different ways of thinking. It is the number of
different categories of responses (flexibility).
Experimental Procedures
Pre-consultation. Before baseline data were collected, consultation with the
instructor/rater was conducted to determine whether the material for the instruction had
the appropriate syntax difficulty level for participants and to see whether the questions
in the DPS assessment had face validity.
Baseline phase (A). The researcher started with observing each subject’s three
basal measures at the same time each session to establish baseline norms prior to the
intervention procedures. Baseline phase for each student was dependent on his/her own
schedule of maintaining a minimum of three stable data points (Barlow & Hersen,

43
1973). The investigator observed the subject for twenty minutes and rated the three
behaviors on the worksheet. The baseline data were collected until one of the three
target behaviors was stable enough to begin the instruction of Divergent Production
Activities.
Intervention phase (B1/B2/B3). Once a baseline was established as stable, the
first intervention (B1) began on that stable behavior of three behaviors under
experimental control, whichever it turned stable first. The other two behaviors were
observed for additional baseline data until they were stable. The intervention (B2) was
given on the second behavior, when it was stable. When the third behavior was stable,
the intervention (B3) was given on it. Therefore, each subject had a running baseline
until the final intervention was implemented. Each intervention (B1/B2/B3) of
divergent production activities were think aloud (TA), math inquiry (MI), and problem
solving (PS). The participants were given the maximum 20 minute-intervention three
times a week. Total intervention lasted for eight weeks. As proceeded with sessions,
the first intervention B1 was set to think aloud (TA), B2 of math inquiry (MI), and B3
of problem solving (PS) for all participants. For instruction time, problem solving was
allotted ten minutes. Both TA and MI were given five minutes, respectively.
The follow up phase. Follow-up checking was conducted week one (7th day for
all) and week three (21st day for two of the participants) after all interventions were
withdrawn, similar to the study by Brown (1979) on the 11th and 25th day. If it
indicated that the child had retained skills, it would suffice to say that there would be a
cause-and-effect relationship between the student’s performance and the instruction.
44
Procedural Reliability
Interrater reliability was checked to ensure the agreement of the raters.
Agreement was calculated by both point-by-point agreement (Richards et al., 1999)
and Kappa reliability (Barlow & Hersen, 1984). Kappa reliability is an index of rater
reliability that reflects the amount of agreement beyond chance, which is more
conservative than the percent agreement since it controls for chance (Barlow & Hersen,
1984). The two hour-training session consisted of the following activities: raters
studied the definitions of think aloud, math inquiry, and math problem solving for this
study; raters received training on measuring the variables of Divergent Production
Scales (DPS); the observers trained on recording and scoring. On 50 percent of the
sessions, this researcher observed the instructor conducting a session.
Data Collection and Analysis
The data were collected and scored primarily by the researcher and instructor
during the study. The data were analyzed visually and graphically using Mean + Trend
Difference Model (NCSS, 2000). This model measures the differences among phases
of both mean and trend among phases since a change in trend was predicted in the data.
The effect size was assessed among the phases. The t-test also was used to test for the
significance of the difference between two means or scores. If there were a statistical
significance between the pretest and the posttest of Torrance Tests of Creative
Thinking (Torrance, 1974), it can be sufficient to say that the results of the study were
meaningful and the changes in participants were attributed to the intervention.

45
CHAPTER IV
RESULTS
The purpose of the study was to investigate the effects of divergent production
activities including math inquiry and think aloud strategy for students with math
difficulty. This chapter presents the results visually as a series of multiple A-B designs
with follow-up stacked on top of one another (Richards, et al., 1999). The effect sizes
were statistically reported among the phases and interrater reliability data were
compared. The t-tests were reported to provide the statistical difference between two
means of the pretest and posttest as measured by the Torrance Tests of Creative
Thinking (Torrance, 1974).
Criteria for Evaluation of Results
Experimental single subject research in general aims to determine the effects of
the study in terms of two characteristics: the improvement of participant’s behavior
and the effectiveness of the program. In judging the improvement of the participant,
visual inspection is used to look at the variability of the data, change of mean level,
and rate of improvement. Variability of the data can be established by the effect size
represented as R-squared among phases. Since effect sizes alone are not sufficiently
significant to conclude that participants substantially improved over the three
interventions, further analysis was conducted through visual and statistical procedures
in order to obtain better technical results. To determine the subject’s improvement, the
charts showed a visual mean shift. Substantial change of the mean level can also add
46
some credibility in determining student improvement. The rate of improvement is
determined by the trend indicating either improving or deteriorating among phases. In
evaluating the effectiveness of the program, visual inspection measures the changing
trend and the gap at the beginning of the instruction phase. Increasing trend for
positive behaviors or desirable performance indicates that the program was effective
on the individual. The noticeable intercept gap at the onset of the instruction following
baseline phase can add some evidence that the intervention has impacted on the
participant’s behavior.
Data of the summative scores from three interventions were reported for each
participant, phase, and instruction. Since this study employed multiple baseline across
behaviors design, three intervention charts appeared visually as stacked on top of one
another for the expedient comparison of each participant’s multiple behaviors (Figures
1-4). Think Aloud chart is placed on top, Math Inquiry in the middle, and Problem
Solving at the bottom. All students participated in the study were exposed to the same
treatment with three phase conditions: baseline (A), intervention (B), and follow-up.
Only intervention phase differed from one another depending on both the type of
instructions and the baseline stability of each student. Mean and trend differences for
each participant were reported by instruction and phase in Table 1 in order to provide
numerical feel for the figures. Effect sizes are presented in Table 2 by participant and
instruction type. T-test results were also reported in Table 3 for pretest and posttest of
the results of the TTCT. Overall mean differences and standard deviations for four
creativity measures were reported along with statistical significance.

47
Data Reported on Reliability
Reliability between raters for TA, MI and PS behaviors were assessed on 31
percent of the sessions. Simple percent agreement of interrater reliability was 81
percent using point-by-point agreement calculations which is acceptable degree
(Hersen & Barlow, 1976). Kappa reliability was also assessed for controlling for
chance level and so that the reliability could be more robust beyond chance. Kappa test
reliability came out around 63 percent which indicates good agreement between the
raters. When Kappa reliability falls between .40 and .75, we could say that the
observations were done fair to good in terms of reliability (Fleiss, 1981). The
difference between the simple percent agreement and Kappa reliability is 18 percent
which indicates chance alone.
Data on Dependent Measures Reported by Participant
Student #1. The summative scores for student #1 are presented graphically in
Figure 1 and numerically in Table 1. The first instruction was think aloud strategy.
When the participant was in baseline phase, summative scores of TA ranged from 2 to
4 with a mean of 3. When exposed to the instruction phase, the student’s summative
score of TA gradually increased from 3 to 7 with a mean of 4.63. When the instruction
was withdrawn, student #1 was followed up one week later. Student #1 scored 4 on
the follow-up which slightly increased from the basal level, but it also decreased
slightly from the intervention phase. The data points on charts were not actual scores
that the participant earned but the derived summative scores from performance level.
Since several scores were consolidated into one derived score, small and unimportant

48
amount of increase in this study could imply substantial differences in the student
among phases.
Second instruction was math inquiry. When the participant was in baseline
phase, summative scores of MI ranged from 5 to 6 with a mean of 5.5. When exposed
to instruction phase, the student’s MI score increased two points to 7 with a mean of
6.2. After withdrawn from the instruction, student #1 scored 7, which still showed a
maintained improvement. It also showed some increase by 1.5 from the baseline phase.
Third instruction was divergent problem solving. When the participant was in
baseline phase, summative scores of PS ranged from 2 to 7 with a mean of 4.38.
Unlike the first two TA and MI behaviors, PS data points revealed a lot of bounce.
However, during the instruction phase, the student’s score was stable with no
variability and with a mean of 7. After withdrawn from the instruction, Student #1
scored 5 which fairly decreased by two points from the instruction phase, although
slightly higher than the basal level.
The R-squared value of each behavior for all participants is presented in Table
2. R-squared refers to the effect size of the mean and trend differences between phases.
Student #1 showed moderate R-squares of .636 in think aloud (TA) and .70 in math
inquiry (MI) but a mild R-squared of .43 in problem solving (PS). As seen in the
Figure 1, no instruction showed a large intercept difference between phases A and B.
No significant trend difference was found in all three instructions. Slopes appeared to
increase gradually as seen in TA and MI and then there was an abrupt stability arrived
in PS instruction.

49
Figure 1. Divergent production interventions on student #1
0 1 2 3 4 5 6 7 8 9
10 11 12 13 14
0 1 2 3 4 5 6 8 9 10 11 1 2
TA
7
BASELINE INTERVENTION FOLLOW UP
0 1 2 3 4 5 6 7 8 9
10 11 12 13 14
0 1 2 3 4 5 6 8 9 10 11 1 2
MI
7
0 1 2 3 4 5 6 7 8 9
10 11 12 13 14
0 1 2 3 4 5 8 9 10 11 1 2 Sessions
PS S
core
s
7 6
Data points
Trend line

50
Table 1 Mean and Trend Differences by Instruction and Phase
Baseline (A) Intervention (B) Follow-up (1st/2nd)
Range (L-H)
Mean
Trend
Range(L-H)
Mean
Trend
1st/2nd
Mean
Trend
S1 2-4 3 + 3-7 4.63 + 4 4 .
S2 2-4 2.67 + 3-8 5.25 + 5/6 5.5 +
S3 2-3 2.67 + 3-6 4.5 + 6 6 .
TA
S4 3 3 . 4-8 4.88 . 5/7 6 +
S1 5-6 5.5 . 5-7 6.2 + 7 7 .
S2 3-6 4.67 . 7-11 8.8 + 7/12 9.5 +
S3 3-6 4.5 - 6-9 7.2 + 7 7 .
MI
S4 4-5 4.83 - 5-7 6 + 5/7 6 -
S1 2-7 4.38 + 7 7 . 5 5 .
S2 2-8 3.75 + 7-8 7.33 - 8/11 9.5 +
S3 4-10 8.13 + 7-13 10 + 9 9 .
PS
S4 3-9 4.88 . 4-10 7.33 + 6/11 8.5 +
Note. Range (L-H): lowest score and highest score within the phase; +: increasing trend; -: decreasing trend; .: no slope in trend; 1st/2nd : first follow-up check and second follow-up check; TA: think aloud; MI: math inquiry; PS: problem solving; S1: student #1; S2: student #2; S3: student #3; S4: student #4.

51
Table 2 Analysis of Variance by Participant
Instruction
Sum of Square
Total
(Adjusted)
R-squared
F-ratio
P
Power (5%)
TA 15.05 23.67 .636 2.094 .197 .348 MI 6.23 8.92 .699 2.784 .122 .451
Student #1
PS 16.76 38.92 .431 .907 .532 .167 TA 24.13 34.77 .694 3.174 .082 .553 MI 83.92 94 .893 11.661 .003* .988
Student #2
PS 74.45 105.23 .707 3.385 .071 .583 TA 13.02 17.67 .737 3.366 .086 .531 MI 28.73 40.92 .702 2.829 .119 .457
Student #3
PS 42.13 77.67 .543 1.423 .337 .244 TA 14.35 27.08 .530 1.579 .281 .293 MI 7.15 11.23 .637 2.457 .136 .442
Student #4
PS 42.51 96 .443 1.113 .432 .214 *. p< .05 Note. TA: Think Aloud; MI: Math Inquiry; PS: Problem Solving; p: probability level.
Student #2. The summative scores for student #2 are presented in Figure 2. The
first instruction was the think aloud strategy. When the participant was on baseline
phase, the summative scores ranged from 2 to 4 with a mean of 2.67. When exposed to
TA instruction phase, the student’s score gradually increased from 3 to 8 with a mean
of 5.25. Student #1 was followed up two times after withdrawn from the instruction.
Measurements were taken one week and three weeks later. Student #2 scored 5 and 6
respectively, which increased noticeably by twice the basal level and slightly higher
than the intervention.
Second instruction was math inquiry. When the participant was in baseline
phase, the summative scores ranged from 3 to 6 with a mean of 4.67. When exposed to
52
MI instruction phase, the student’s score increased from 7 to 11 with a mean of 8.8.
After withdrawn from the instruction, student #2 scored 7 and 12, respectively.
Second follow-up revealed an abrupt increase although the absence of instruction time
passed for three weeks. Student #2 showed a maintenance effect of instruction.
Third instruction was divergent problem solving. When the participant was in
baseline phase, summative scores of PS ranged from 2 to 8 with a mean of 3.75.
Compared to the first two behaviors, the data points revealed a lot of variability similar
to students #1. When exposed to PS instruction, the student’s score ranged from7 to 8
with a mean of 7.33. After withdrawn from the PS instruction, student #1 scored 8 and
11 respectively, which showed some improvement even more when in the second
follow-up check. The mean increased by almost twice than the baseline data. As seen
in the Figure 1, no summative scores showed a large intercept difference between
phases A and B. However, MI instruction showed a slight intercept difference between
phase A and B and so did PS except for the summative score of the session eight. The
participant reported a deteriorating trend during PS instruction. There was a large trend
difference in MI instruction. As presented in Table 2, student #2 showed moderate R-
squares of .70 in TA and .71 in PS, and a high effect size of .89 in MI.

53
Figure 2. Divergent production interventions on student #2
70 1 2 3 4 5 6 7 8 9
10 11 12 13 14
0 1 2 3 4 5 6 8 9 10 11 1 2
TA
BASELINE INTERVENTION FOLLOW UP
0 1 2 3 4 5 6 7 8 9
10 11 12 13 14
0 1 2 3 4 5 6 7 9 10 1 2
MI
S
8 11
0 1 2 3 4 5 6 7 8 9
10 11 12 13 14
0 1 2 3 4 5 6 8 9 10 11 1 2 Sessions
PS S
core
s
7
Data points
Trend line

54
Student #3. The summative scores for student #3 are presented in Figure 3. The
first instruction was think aloud strategy. When the participant was in baseline phase,
the summative scores ranged from 2 to 3 with a mean of 2.67. When exposed to TA
instruction phase, the student’s score of TA ranged from 3 to 6 with a mean of 4.5.
After withdrawn from the instruction, student #1 was followed up one week later.
Student #3 scored 6 which increased slightly from the instruction phase but
considerably higher than the baseline.
Second instruction was math inquiry. When the participant was in baseline
phase, summative scores of MI ranged from 3 to 6 with a decreasing trend and a mean
of 4.5. The student showed a large intercept difference at the beginning of the
instruction with a gradual increasing trend. Scores ranged from 6 to 9 with a mean of
7.2. After withdrawn from the instruction, student #3 scored 7, appearing to retain the
gains from the instruction.
Third instruction was divergent problem solving. When the participant was in
baseline phase, the summative score of PS ranged from 4 to 10 with a mean of 8.13.
Compared to the first two behaviors, the data points demonstrated a lot of variability.
When exposed to PS instruction phase, the student showed improvement on divergent
problem solving performance with a mean of 10. There was no intercept difference.
After withdrawn from the PS instruction, student #3 scored 9 which demonstrating
instruction gains. Overall, student #3 showed a similar trend of effect sizes as student
#1. As seen in the Figure 3, MI instruction showed a large intercept difference between
phases A and B. PS instruction phase showed a large trend difference.

55
Figure 3. Divergent production interventions on student #3
0 1 2 3 4 5 6 7 8 9
10 11 12 13 14
0 1 2 3 4 5 6 7 9 10 11 1 2
TA
8
BASELINE INTERVENTION FOLLOW UP
0 1 2 3 4 5 6 7 8 9
10 11 12 13 14
0 1 2 3 4 5 6 8 9 10 11 1 2
MI
0 1 2 3 4 5 6 7 8 9
10 11 12 13 14
0 1 2 3 4 5 6 8 9 10 11 1 27
Data points
Trend line
PS S
core
s
Sessions
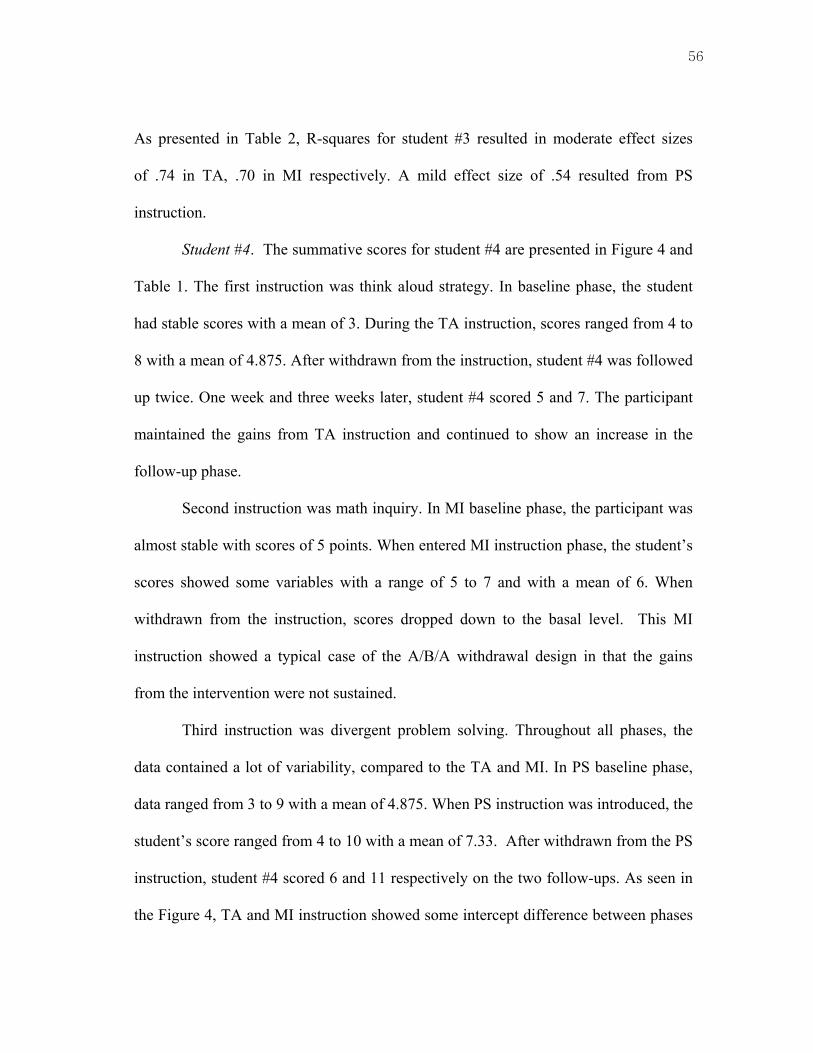
56
As presented in Table 2, R-squares for student #3 resulted in moderate effect sizes
of .74 in TA, .70 in MI respectively. A mild effect size of .54 resulted from PS
instruction.
Student #4. The summative scores for student #4 are presented in Figure 4 and
Table 1. The first instruction was think aloud strategy. In baseline phase, the student
had stable scores with a mean of 3. During the TA instruction, scores ranged from 4 to
8 with a mean of 4.875. After withdrawn from the instruction, student #4 was followed
up twice. One week and three weeks later, student #4 scored 5 and 7. The participant
maintained the gains from TA instruction and continued to show an increase in the
follow-up phase.
Second instruction was math inquiry. In MI baseline phase, the participant was
almost stable with scores of 5 points. When entered MI instruction phase, the student’s
scores showed some variables with a range of 5 to 7 and with a mean of 6. When
withdrawn from the instruction, scores dropped down to the basal level. This MI
instruction showed a typical case of the A/B/A withdrawal design in that the gains
from the intervention were not sustained.
Third instruction was divergent problem solving. Throughout all phases, the
data contained a lot of variability, compared to the TA and MI. In PS baseline phase,
data ranged from 3 to 9 with a mean of 4.875. When PS instruction was introduced, the
student’s score ranged from 4 to 10 with a mean of 7.33. After withdrawn from the PS
instruction, student #4 scored 6 and 11 respectively on the two follow-ups. As seen in
the Figure 4, TA and MI instruction showed some intercept difference between phases

57
A and B. No large trend difference was found in all three instructions.
Figure 4. Divergent production interventions on student #4
0 1 2 3 4 5 6 7 8 9
10 11 12 13 14
0 1 2 3 4 5 6 8 10 11 1 2
TA
97
BASELINE INTERVENTION FOLLOW UP
0 1 2 3 4 5 6 7 8 9
10 11 12 13 14
0 1 2 3 4 5 6 8 9 10 11 1 2
MI
7
0 1 2 3 4 5 6 7 8 9
10 11 12 13 14
0 1 2 3 4 5 6 8 9 10 11 1 2Sessions
PS S
core
s
7
Data points
Trend line
58
As presented in Table 2, student #4 demonstrated moderate R-squares both in TA and
MI of .53 and .63 respectively, and a mild R-squared of .44 in PS.
Data on TTCT Reported by Creativity Measures
The t-tests of TTCT for all participants are presented in Table 3. The four fifth
graders with math difficulty were administered a TTCT Figural Form A before the
instructions was introduced, and a TTCT Figural Form B after the instructions were
withdrawn. As seen in Table 3, mean differences between pretest and posttest were
produced by large amount for fluency and elaboration measures. Contrarily, mean
differences between pretest and posttest for both flexibility and originality measures
only increased by a small amount. In terms of statistical significance of pretest and
posttest, t-test indicates that there was a significant difference (p=.027) in two mean
scores for fluency. T-test indicates that there was a significant difference (p=.002) in
two mean scores for flexibility. There is no statistical significance found for originality
and elaboration.

59
Table 3 t-test of Pretest and Posttest of TTCT
Paired Differences |pretest-posttest|
Measures of TTCT Mean SD
t
p
Fluency 20.50 10.08 4.066 .027*
Flexibility 4.75 .96 9.922 .002**
Originality 1.00 3.46 -.577 .604
Elaboration 18.00 12.88 2.794 .068
**. p< .01 *. p< .05 Note. TTCT: Torrance Tests of Creative Thinking; p: probability level.
60
CHAPTER V
CONCLUSIONS AND IMPLICATIONS
This chapter includes a thorough discussion of the conclusions and implications
of the study. Since this study was conducted using a single subject research design, the
discussion also includes a section on interrater reliability for internal validity
(McCormick, 1990) and a section on external validity. Internal validity was achieved
to some degree by complying with instruction procedures and scoring guidelines.
External validity was established to some degree by conducting identical and
systematic replications across four participants. This chapter will discuss some of the
possible future research directions based on the findings from this study.
Summary
All participants improved over three performances. Summative mean scores
increased to a mild degree based on descriptive statistics. The effect sizes varied from
mild to high degree for all participants. Three of the four students demonstrated
improvements on both think aloud and math inquiry. Three of the students’ scores
yielded a mild effect size for problem solving activities. However, all of the
participants appeared to have a lot of variability in their summative scores of PS
performance. Therefore, it is unreasonable to conclude that students improved their
problem solving scores as a result of instruction. Only TA and MI instructions
appeared to demonstrate a small but significant improvement.

61
Three of the participants provided evidence supporting the MI intervention.
Program effectiveness was evaluated by examining intercept gap differences between
phases A and B and looking into the trends. Although immediate and observable
changes did not occur at the onset of the TA intervention, think aloud seemed to have a
gradual effect on students. In addition, student #4 showed evidence that TA instruction
was effective. No participant showed a large intercept gap at the onset of PS
intervention. Student #1 demonstrated no intercept difference across all three
interventions.
On the follow-up analysis, three students with math difficulty maintained the
gains after the MI instruction was withdrawn. Only student #4 maintained the gains
from TA instruction. Student #1 did not perform well on TA and MI and failed to
establish a stable performance on PS. Student #2 maintained gains from all three
instructions. Student #3 retained TA and MI strategies, while student #4 did TA and PS
during the follow-up phase. Since each participant showed variable changes, no
confidence was confirmed that systematic change was attributed to the instruction.
T-test results provide support for the conclusions that intervention helped
participants achieve some facets of creativity on fluency and flexibility scores. Fluency
and flexibility appeared either to be readily teachable constructs to the instructor or
easily learnable to students. Students improved greatly on the means after instructions.
The results on fluency and flexibility were included in the discussion. However,
originality and elaboration should not be discussed in this chapter because the study
did not intend to examine these two constructs. Unsurprisingly, none of the
62
participants demonstrated any significant difference or improvement on elaboration
and originality as measured by the TTCT. The findings suggest that there was
improvement in the participants in terms of some aspects of creativity as a result of
multiple divergent instructions (TA, MI, and PS). Divergent production activities
seemed to help to raise some aspects of creativity as measured by TTCT. Regardless of
summative scores from the multiple baseline across three behaviors, divergent
production activities seemed to help to raise some aspects of creativity as measured by
TTCT.
In conclusion, the experiment was carried carefully in an effort to hold internal
and external validity. Satisfied levels of consistency were obtained during the course of
study. Participants showed improvement based on mean scores over three interventions.
In terms of mean changes and effect sizes, students demonstrated limited improvement
in both think aloud and math inquiry. Only MI program proved effective to a limited
degree. Students improved both fluency and flexibility scores and significant
differences were found between two mean scores as measured by TTCT. However,
multiple instructions did not seem to provide supporting evidence to assure that the
total program was effective. Problem solving instruction was problematic presumably
due to the varied difficulty level within the assessment content.
Strengths of the Study
This study obtained interrater reliability indicating a 63 percent of good
agreement beyond chance as determined by Kappa reliability (Fleiss, 1981). Reliability
data indicated reasonable during observations and assessments.

63
Internal validity was achieved to certain degree by controlling for threats from
extraneous variables. First, multiple intervention interference would threaten this study
since multiple treatments were introduced in relatively quick order without
systematically monitoring the treatment (Krishef, 1991).The participants may have
possibly been influenced by the interaction of the three consecutive instructions based
on the different strategies. Second, multiple baseline across subjects design has the
possible selection and mortality threats to internal validity since finding three or more
subjects with similar problems may not be easy (Krishef, 1991). Losing some of the
participants during the study could possibly make the comparison difficult. This study
deliberately set the criteria for subject selection in order to reduce these threats. Third,
instructions and observation were monitored more than 50 percent of the time by the
researcher on random basis. The researcher advised the instructor strictly to follow the
guidelines during observing and scoring. The instructor was encouraged on all sessions
to comply with control procedures in order to increase the internal validity of the study.
For example, the instructor was told 1) to use the same instruction protocol, the amount
of praises, the repetitions of verbal/nonverbal directives, and 2) to abide by assigned
time for each session and procedures. Raters adhered strictly to the scoring guidelines
for sustaining interrater reliability. Frequent information exchange between the
instructor and the researcher made the research progress run smoothly and efficiently.
External validity was established by direct and systematic replications across
participants (Kazdin, 1982). Within one experimental setting, four students were taught
the same procedures through one-on-one instruction by the same single instructor.
64
Single subject research design does not hold strong generalizability due to its design
nature, nonetheless the extension of the multiple A-B designs with follow-up can
increase its generalizability to some degree. Four sample cases were utilized to
improve its generalizability.
Limitations of the Study
Experimental single subject research originally purports to measure
individuals’ behaviors repeatedly using assessments after individually tailored and
delivered instructions. Interpretation of the data and further transferability to other
cases tend to be limited to the specifically defined circumstances and participants.
Nevertheless, the significance of this single subject research exists in its rarity or
exceptionality since each case carries unique needs and demands for special assistance
in practical settings. To some intervention studies, the results seemed to rest simply
upon the art of teaching. Skillful and highly trained instructors were thought to produce
either more gains or more reliable results. Controlling for a variety of threats to
internal validity may contribute to divergent production performance. Therefore,
caution is advised when considering the impacts of the divergent production activities
(think aloud, math inquiry, and math problem solving).
First, all participants expectedly showed reactivity (Foster, 1986) especially in
the PS baseline phase. When participants are exposed relatively new and noble
materials or experience, they are likely to alter their responses abruptly. Reactive
performance caused variability that contracted gains and generated inconsistency of the
results.
65
Second, due to the eight week intervention period and the nature of the design,
this study did not have stronger generalizability although replications to multiple cases
added some credibility to the inference that the treatment was effective. Establishing a
basal level and evaluating intervention in mathematics are recommended to run more
sessions than in this study in order to assure the sensitivity of growth and detect the
change over time.
Third, instructional materials were believed to contain some variability in terms
of difficulty level because students showed varied interests and fluctuating
performance depending on problem types. Standardized interpretation would not be
feasible for this reason. Conclusive remarks were not be easily drawn with regards to
the impact of the intervention and the improvement of the participants. Further
research is needed to control inherent variability of instruction/assessment materials,
especially in math problem solving.
Fourth, the treatment interference among three instructions was problematic
and unable to eliminate completely. The participants could have possibly been
influenced by the consecutive instructions which constituted three different strategies
at any time during the study. However, it was difficult to say which treatment or which
combination of the treatments brought about the gains. Selecting dependent variables
should be in balance between being not completely independent and nor significantly
interrelated. Caution is advised when using similar assessment material repeatedly.
Some alternatives would be either to use multiple probe techniques or longer intervals
between assessments.

66
Implications for Future Research
This study provides some support for increased creativity as measured by
TTCT as a result of the multiple instructions on divergent production activities in math
along with think aloud and math inquiry. Math inquiry skills enhanced students’
divergent production ability in mathematics and expectedly affected mathematics
performance. Future studies are needed to explore the possibility of math inquiry in
order to develop programs that foster mathematics performance of students with mild
math difficulty. Further research is needed to develop TA intervention since think
aloud seemed to have a gradual effect on students. TA instruction, although no
immediate and observable intercept gaps occur, is expected to become an effective
program for students with math difficulty if instructed in more intensive and long-term
fashion.
Measuring scales should be cautiously designed to have adequate sensitivity to
growth over time so that the progress of the participant can be graphically observable.
This is particularly important when the research is carried out on cognitive/intellectual
performance due to its gradual rates of change.
Fluency and flexibility scores increased following divergent production
interventions in mathematics. Due to the measuring difficulty of originality, this study
excluded originality and included elaboration only on math inquiry assessment.
Inference from the results should be limited to the changes of some aspects of
creativity rather than divergent production ability.

67
Replication of the study is recommended to provide supplementary activities
and assessment instruments. There is no question that more cases support the
conclusions of the study. Further study is needed to expand training programs on
different behaviors or populations who experience different levels of math difficulty.
An extended baseline and prolonged interventions are recommended for ample effects.
Intensive instructional program would be necessary for the participants’ substantial
improvement as well. Future research is suggested to develop scales and activities of
divergent math problem solving that are less variable and more sensitive to the growth
of mathematical creativity. Scales should be spread out to reflect improvement of the
performance.
Further information is needed to determine if the application of multiple
creative programs can possibly enhance students’ understanding and thinking of the
solutions in given math problems in many and different ways. Efforts to supplement
findings of the study are needed to develop feasible but differential instructional
programs for students with math difficulty in order to help achieve better mathematics
performance as well as mathematical creativity.
68
REFERENCES
Associates in Counseling and Child Guidance (2003). Low achiever. Retrieved
September 26, 2003 from http://accg.net/low_achiver.htm: ACCG.
Baer, J. (1993). Divergent thinking and creativity: A task-specific approach. Hillsdale,
NJ: Erlbaum.
Baer, J. (1996). The effects of task-specific divergent-thinking training. Journal of
Creative Behavior, 30(3), 183-187.
Baker, L. (1982). An evaluation of the role of metacognitive deficits in learning
disabilities. Topics in Learning and Learning Disabilities, 2(1), 27-35.
Balka, D. S. (1974a). The development of an instrument to measure creative ability in
mathematics. Doctoral dissertation, University of Missouri, Columbia.
Balka, D. S. (1974b). Creative ability in mathematics. The Arithmetic Teacher, 21(7),
633-636.
Bandura, A. (1986). Social foundations of thought and action: A social cognitive
theory. Englewood Cliffs, NJ: Prentice-Hall.
Barlow, D. H., & Hersen, M. (1973). Single case experimental designs: Uses in applied
clinical research. Archives of General Psychiatry, 29, 319-325
Barlow, D. H., & Hersen, M. (1984). Single case experimental designs: Strategies for
studying behavior change (2nd ed.). Pergamon general psychology series. New
York: Pergamon Press.
Baur, G. R. (1970). A study of the effects of a creative classroom, creative problems,
and mathematics education on the creative ability of prospective elementary

69
teachers, Doctoral dissertation, Stanford University, Berkeley, CA.
Behrend, J. L. (1994). Mathematical problem-solving processes of primary-grade
students identified as learning disabled. Unpublished doctoral dissertation,
University of Wisconsin, Madison.
Berardi-Coletta, B., Dominowski, R. L., Buyer, L. S., & Rellinger, E. R. (1995).
Metacognition and problem solving: A process-oriented approach. Journal of
Experimental Psychology-Learning Memory and Cognition, 21(1), 205-223.
Bibby, T. (2002). Creativity and logic in primary-school mathematics: A view from the
classroom. For the Learning of Mathematics, 22(3), 10-13.
Bottage, B. A., & Hasselbring, T. S. (1993). A comparison of two approaches for
teaching complex, authentic mathematics problems to adolescents in remedial
math classes. Exceptional Children, 59, 556-566.
Brown, S. D. (1979). Effects of teacher instruction and positive reinforcement on the
questioning techniques of gifted students. Unpublished master’s thesis, Ohio
State University, Columbus.
Camp, B., & Bash, M. (1981). Think aloud. Champaign, IL: Research Press.
Carman, T. S. (1992). An investigation of the relationship between participation in the
Odyssey of the Mind program and mathematical problem-solving achievement.
Dissertation Abstracts International, 52/12-A, 4252.
Cawley, J. F., Fitzmaurice, A.M., Shaw, R. A., Kahn, H. & Bates, H. (1979). Math
word problems: Suggestions for LD students. Learning Disability Quarterly,
2, Spring.

70
Cherkes-Julkowski, M. (1985). Metacognitive considerations in mathematics
instruction for the learning disabled. In J. F. Cawley (Ed.) Cognitive strategies
and mathematics for the learning disabled (pp.99-116). Rockville, MD: An
Aspen Publication.
Cooper, J. O. (1981). Measuring behavior (2nd ed.). Columbus, OH: Merrill.
Cornish, G. & Wines, R. (1980). ACER mathematics profile series: Number test.
Hawthorn, Victoria: Australian Council for Educational Research.
Davis, G. A. (1986). Creativity is forever. (2nd ed.). Dubuque, IA: Kendall/Hunt.
Desoete, A., Roeyers, H., & Buysse, A. (2001). Metacognition and mathematical
problem solving in grade 3. Journal of Learning Disabilities, 34(5), 435-449.
Dirkes, M. A. (1978). The role of divergent production in the learning process.
American Psychologist, Sept. 815-820.
Ellis, A., & Alleman-Brooks, J. (1977). How to evaluate problem-solving-oriented
social studies. Social Studies, 68(3), 99-103.
Evans, E. W. (1964). Measuring the ability of students to respond to creative
mathematical situations at the late elementary and early junior high school
level. Doctoral dissertation, University of Michigan, MI.
Fennema, E., & Carpenter, T. P. (1985). Cognitively guided instruction: A program
implementation guide. Madison: Wisconsin Center for Education Research.
Flavell, J. H. (1976). Metacognitive aspects of problem solving. In L. B. Resnick (Ed.),
The nature of intelligence (pp.231-236). Hillsdale, NJ: Erlbaum.
Fleiss, J. L. (1981). Statistical methods for rates and proportions (2nd ed.). Wiley series
71
in probability and mathematical statistics. New York: Wiley
Foster, R. A. (1986). The application of single subject research methods to the study of
exceptional ability and extraordinary achievement, Gifted Child Quarterly,
1(1), 33-37.
Frasier, M. M. (1992). Traits aptitudes behaviors. Athens: The University of Georgia.
Gall, M. D., Borg, W. R., & Gall, J. P. (1996). Educational research: An introduction.
(6th ed.). White Plains, NY: Longman Publishers.
Ginsburg, H. P. (1998). Mathematics learning disabilities: A view from developmental
psychology in D.P. Rivera (Ed.), Mathematics education for students with
learning disabilities: theory to practice (pp.47-49), Austin, TX: PRO-ED.
Glasser, R. (1966). Variables in discovery learning. In L. S. Schulman & E. R. Keoslar
(Eds.), Learning by doing, a critical approach. Chicago: Rand-McNally.
Guilford, J. P. (1950). Creativity. American Psychologist, 5. 444-454.
Guilford, J. P. (1959). Traits of creativity. In H. H. Anderson (Ed.), Creativity and its
cultivation (pp. 142-161) (Reprinted in P. E. Vernon, Ed., 1970, Creativity, pp.
167-188, Penguin Books)
Guilford, J. P. (1967). The nature of human intelligence. New York: McGraw Hill.
Harkow, R. M. (1996). Creative thinking skills in 2nd and 3rd grade gifted students
using imagery, computers, and creative problem solving. Master’s final report,
Nova Southeastern University, Fort Lauderdale, FL.
Hayes, A. M. (1985). Classroom Implications. In J. F. Cawley (Ed.) Cognitive
strategies and mathematics for the learning disabled (pp.209-236). Rockville,
72
MD: An Aspen Publication.
Haylock, D. W. (1984). Aspects of mathematical creativity in children aged 11-12.
Doctoral dissertation, University of London, UK.
Haylock, D.W. (1987a). Mathematical creativity in schoolchildren, Journal of Creative
Behavior, 21(1), 48-59.
Haylock, D.W. (1987b). A framework for assessing mathematical creativity in
schoolchildren. Educational Studies in Mathematics, 18(1) 59-74.
Hersen, M., & Barlow, D. H. (1976). Single case experimental designs: Strategies for
studying behavior change. New York: Pergamon Press.
Hester, J. P. (1994). Teaching for thinking: A program for school improvement through
teaching critical thinking across the curriculum. Durham, NC: Carolina
Academic Press.
Hiatt, A. A. (1970). Assessing mathematical thinking abilities of sixth, ninth and
twelfth grade students. Dissertation Abstracts International, 31B (1971),
7427-7428.
Hollands, R. (1972).Educational technology: Aims and objectives in teaching
mathematics. Mathematics in School, 1(6), 22-23.
Hudson, L. (1966). Contrary Imaginations. Harmondsworth, Middlesex, UK: England
Pelican Books N.D.
Inoue, N. (1999). Silver Burdett Ginn mathematics: Assessment guide, Gr. 4.
Parsippany, NJ: Silver Burdett Ginn.
Jensen, L. R. (1973). The relationships among mathematical creativity, numerical

73
aptitude and mathematical achievement. Doctoral dissertation, The University
of Texas at Austin.
Johnson, D. M. (1972). A systematic introduction to the psychology of thinking.
New York: Harper & Row.
Johnson, L. J., Karnes, M.B., & Carr, V. W.(1997). Providing services to children with
gifts and disabilities: A critical need, In N. Colangelo & G. A. Davis (Eds.),
Handbook of gifted education (2nd ed.) (pp. 516-527). Needham Heights, MA:
Allyn & Bacon.
Kavale, K. A., Fuchs, D., & Scruggs, T. E. (1994). Setting the record straight on
earning disability and low achievement: Implications for policymaking.
Learning Disabilities Research & Practice, 9(2), 70-77.
Kazdin, A. E. (1982). Single-case research designs: Methods for clinical and applied
settings. New York: Oxford University Press.
Kazdin, A. E. (1992). Research design in clinical psychology (2nd ed.) Boston: Allyn &
Bacon.
Kieren, T. E. (1997). Theories for the classroom: Connections between research and
practice. For the Learning of Mathematics, 17(2), 31-33.
Kluwe, R. H. (1982). Cognitive knowledge and executive control: Metacognition. In D.
R. Griffin (Ed.), Animal mind-human mind (pp.201-224). Berlin: Springer-
Verlag.
Krishef, C. H.(1991). Fundamental approaches to single subject design and analysis.
Malabar, FL: Krieger Publishing Company.

74
Krutetskii, V. A. (1969). Mathematical aptitudes. In J. Kilpatrick & I. Wirzup (Eds.),
Soviet studies in the psychology of learning and teaching mathematics (pp.113-
128), 2, Chicago: University of Chicago Press.
Krutetskii, V. A. (1976). The psychology of mathematical abilities in schoolchildren (J.
Kilpatrick and I. Wirzup, Eds.; J. Teller, trans.) Chicago: University of Chicago
Press.
Lean C., & Clements, M. A. (1981). Spatial ability, visual imagery, and mathematical
performance. Educational Studies in Mathematics, 12, 267-299.
Lundervold, D. A., & Belwood, M. F. (2000). The best kept secret in counseling:
single-case (N=1) experimental designs. Journal of Counseling & Development,
78(1), 92-102.
Mainville, W. E. (1972). A study of the effects of mathematics activity material upon
certain aspects of creative thinking ability of prospective elementary school
teachers. Doctoral dissertation, Michigan State University, East Lansing, MI.
Marzola, E. (1985). An arithmetic problem solving model based on a plan for steps to
solution, mastery learning, and calculator use in a resource room setting for
learning disabled students. New York: Columbia University Teachers College.
Maxwell, A. A. (1974). An exploratory study of secondary school geometry students:
Problem solving related to convergent-divergent production. Doctoral
dissertation, University of Tennessee, Knoxville, TN.
McCollum, J. A. (1978). Ah hah! Santa Monica, CA: Goodyear Pub. Co.
McCormick, S. (1990). A case for the use of single-subject methodology in reading

75
research. Journal of Research in Reading, 13(1), 69-81.
Meichenbaum, D. H., & Goodman, J. (1971). Training impulsive children to talk to
themselves: A means of developing self control. Journal of Abnormal
Psychology, 77, 115-126.
Meyer, R.W. (1970). The identification and encouragement of mathematical creativity
in first grade students. The University of Wisconsin, Madison: Research and
Development Center for Cognitive Learning.
Miller, S. P., & Mercer, C. D. (1998). Educational aspects of mathematics disabilities.
In D. P. Rivera (Ed.), Mathematics education for students with learning
disabilities: Theory to practice (pp.81-96). Austin, TX: PRO-ED.
Moller, B. W. (1984). Special techniques for the gifted LD students. Academic
Therapy, 20, 167-171.
Montague, M. (1996). Assessing mathematical problem solving. Learning Disabilities
Research & Practice, 11(4), 238-248.
Montague, M., & Bos, C. S. (1986). The effect of cognitive strategy training on verbal
math problem solving performance of learning disabled adolescents. Journal of
Learning Disabilities, 19(1), 26-33.
National Assessment of Educational Progress. (2001). Mathematics proficiency
and selected statistics on mathematics education for 4th graders in public
schools, by region, and state: 1996-2000. Washington, DC: U.S. Department
of Education, NAEP.
National Center for Education Statistics. (2001). NAEP mathematics report card.
76
Washington, DC: Office of Educational Research & Improvement, NCES.
National Council of Teachers of Mathematics. (1989). Curriculum and evaluation
standards for school mathematics. Reston, VA: NCTM.
National Council of Teachers of Mathematics. (1991). Professional standards for
teaching mathematics. Reston, VA: NCTM.
National Council of Teachers of Mathematics. (1995). Assessment standards for school
mathematics. Reston, VA: NCTM.
National Council of Teachers of Mathematics. (2000). Principles and standards for
school mathematics. Reston, VA: NCTM.
Pajares, F., & Kranzler, J. (1995). Self-efficacy beliefs and general mental-ability in
mathematical problem-solving. Contemporary Educational Psychology, 20(4),
426-443.
Patten, M.D. (1983). Relationships between self-esteem, anxiety, and achievement in
young learning disabled students. Journal of Learning Disabilities, 16(1), 43-
45.
Perry, A.D., & Stacey, K. (1994). The use of taught and invented methods of
subtraction. Focus on Learning Problems in Mathematics, 16(3), 12-22.
Pettigrew, T. F. (1958). The measurement and correlates of category width as a
cognitive variable. Journal of Personality, 26, 532-544.
Pressley, M. (1986). The relevance of the good strategy user model to the teaching of
mathematics. Educational Psychologist, 21 (1-2): 139-161.
Richards, S. B., Taylor, R. L., Ramasamy, R., & Richards, R. Y. (1999). Single subject

77
research: Applications in educational and clinical settings. San Diego, CA:
Singular Publishing Group, Inc.
Rivera, D. P. (1998). Mathematics education and students with learning disabilities. In
D. P. Rivera (Ed.), Mathematics education for students with learning
disabilities: Theory to practice (pp.1-31). Austin, TX: PRO-ED.
Runco, M. A. (1999). Divergent thinking. In Encyclopedia of creativity (Vol. 1,
pp.557-581). San Diego, CA: Academic Press.
Scheid, K. (1990). Cognitive-based methods for teaching mathematics to students with
learning problems. Columbus, OH: Information Center for Special Education
Media and Materials.
Schunk, D. H. (1985). Participation in goal setting: Effects on self-efficacy and skills
of learning disabled children. The Journal of Special Education, 19, 307-317.
Smith, C. R. (1994). Learning disabilities: The interaction of learner, task, and setting
(3rd ed.). Boston: Allyn & Bacon.
Smith, D. D., & Lovitt, T. C. (1975). The use of modeling techniques to influence the
acquisition of computational arithmetic skills in learning-disabled children. In
E. Ramp & G. Semb (Eds.), Behavior analysis: Areas of research and
application (pp. 283-308). Englewood Cliffs, NJ: Prentice-Hall.
Smith, D. D., & Lovitt, T. C. (1976). The differential effects of reinforcement
contingencies on arithmetic performance. Journal of Learning Disabilities, 9,
32-40.
Sorenson, J. S., Buckmaster, L. R., Francis, M. K., & Knauf, K. M. (1996). The power
78
of problem solving: Practical ideas and teaching strategies for any K-8
subject area. Needham Heights, MA: Allyn & Bacon.
Suchman, J. R.(1962). The elementary school training program in scientific inquiry.
Illinois University, Urbana: IL.
Swassing, R. H., & Amidon, S. R. (1991). Single-subject research with gifted and
talented students (pp.137-156). In N. K. Buchanan & J.F. Feldhusen (Eds.),
Conducting research and evaluation in gifted education: A handbook of
methods and applications. New York: Teachers College Press.
Texas Education Agency. (1998). Texas essential knowledge and skills: Learning
standards for Texas children. Austin, TX: TEA.
Texas Education Agency. (2001). Fall PIEMS data (1999-2000). Austin, TX: TEA.
Torrance, E. P. (1974). The Torrance tests of creative thinking: Thinking creatively
with pictures, Figural booklets A & B. Bensenville, IL: Scholastic Testing
Service, INC.
Torrance, E. P. (1974). The Torrance tests of creative thinking: Norms-technical
manual. Bensenville, IL: Scholastic Testing Service, INC.
Torrance, E. P. (1990). The Torrance tests of creative thinking: Norms-technical
manual. Bensenville, IL: Scholastic Testing Service, INC.
Torrance, E. P., & Safter, H. T. (1999). Making the creative leap beyond. Buffalo, NY:
Creative Education Foundation Press.
U.S. Department of Education (2002). Annual report to congress on the
implementation of the individuals with disabilities education act. Unpublished

79
tabulation. Washington, DC: Office of Special Education and Rehabilitative
Services.
Wallach, M. A., & Kogan, N. (1965). Modes of thinking in young children: A study of
the creativity-intelligence distinction. New York: Holt Rinehart.
Wood, R. (1968). Objectives in the teaching of mathematics. Educational Research,
10(2), 83-98.

80
APPENDIX A Letters to Parents
Dear Parents: At this time, we would like to invite your child to be the part of the following
project. This project will involve your child’s classroom teacher and teacher aide. This
program involves a teacher instructing your child for about ten to twenty minutes a day,
three times a week and working with your child’s researcher to check on the results of
the task on the fourth day of the week. It is expected that this divergent production
program in math should help with creative thinking and, hopefully, improve math
problem solving skills. Thus, we are hoping to obtain your permission and cooperation
for your child’s participation in this voluntary program.
This program has three parts. Part 1 involves assessing your child’s creativity
level before the intervention. Part 2 involves training in different divergent production
activities each week. These include math problem solving, math inquiry, and think
aloud tasks. Part 3 involves assessing your child’s creativity level after the instruction.
The testing and monitoring of the program will be done by a teacher (instructor), and
the principal investigator.
To ensure that the information we collect is not misused in any manner, your
child will be identified by a number instead of his/her name. The information from this
program will be used to complete a dissertation and may be shared through articles in
professional publications.
If, at any time during the study, you should wish to withdraw your child’s
participation, you may do so after discussion with one of our program consultants.
However, participation is completely voluntary. If you would like your child to
participate in this program, sign the attached Parental/Guardian Consent Form and
return the form to the teacher with your child. You may keep this letter for your
information.
We are hoping that you will help us by allowing your child to participate in our
divergent production program. Thank you very much for your time and consideration
in this program.
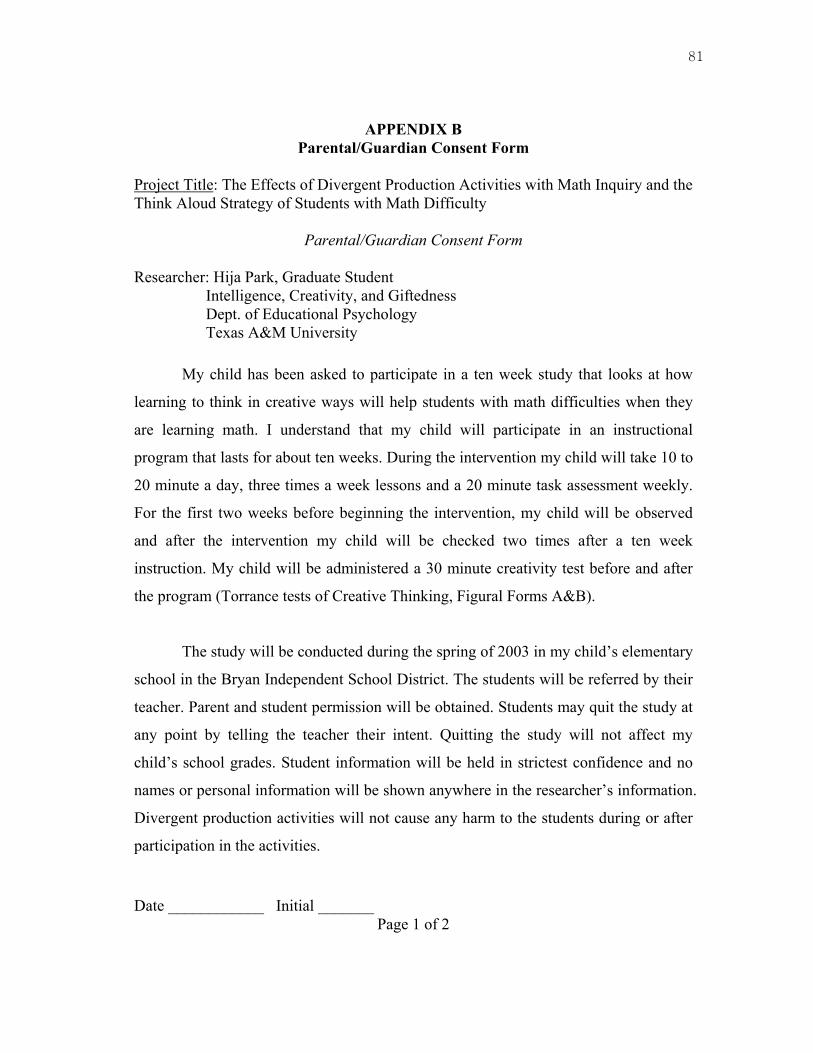
81
APPENDIX B Parental/Guardian Consent Form
Project Title: The Effects of Divergent Production Activities with Math Inquiry and the Think Aloud Strategy of Students with Math Difficulty
Parental/Guardian Consent Form Researcher: Hija Park, Graduate Student Intelligence, Creativity, and Giftedness Dept. of Educational Psychology Texas A&M University
My child has been asked to participate in a ten week study that looks at how
learning to think in creative ways will help students with math difficulties when they
are learning math. I understand that my child will participate in an instructional
program that lasts for about ten weeks. During the intervention my child will take 10 to
20 minute a day, three times a week lessons and a 20 minute task assessment weekly.
For the first two weeks before beginning the intervention, my child will be observed
and after the intervention my child will be checked two times after a ten week
instruction. My child will be administered a 30 minute creativity test before and after
the program (Torrance tests of Creative Thinking, Figural Forms A&B).
The study will be conducted during the spring of 2003 in my child’s elementary
school in the Bryan Independent School District. The students will be referred by their
teacher. Parent and student permission will be obtained. Students may quit the study at
any point by telling the teacher their intent. Quitting the study will not affect my
child’s school grades. Student information will be held in strictest confidence and no
names or personal information will be shown anywhere in the researcher’s information.
Divergent production activities will not cause any harm to the students during or after
participation in the activities. Date ____________ Initial _______
Page 1 of 2
82
The information obtained from this study will be used to complete a doctoral
dissertation and in journal articles. The results of the research will provide a better
understanding of intervention techniques and instructional insight for teachers,
researchers, and parents of gifted students with learning disabilities.
I have read and understand the explanation provided to me. I voluntarily agree
to allow my child to participate in this study. I have been given a copy of this consent
form. Signature of parent/guardian _________________________ Date _______________ Printed name of student ________________________________ I agree to conduct and report this study according to the described terms. Signature of researcher ______________________________ Date ________________ This research study has been reviewed and approved by the Institutional Review Board
Human Subjects in Research, Texas A&M University. For research-related problems
or questions regarding subjects’ rights, the Institutional Review Board may be
contacted through Dr. Michael W. Buckley, Director of Support Services, Office of
Vice President for Research and Associate Provost for Graduate Studies at (979) 845-
8585. For more information about this study, you may contact: Researcher: Dr. William R. Nash or Dept. of Educational Psychology
Texas A&M University College Station, Texas 77843-4225 (979)845-1893.
email: [email protected]
Hija Park
Dept. of Educational Psychology Texas A&M University College Station, Texas 77840 (979)862-9244.
Date ____________ Initial _______
Page 2 of 2

83
APPENDIX C Student Assent Form
Project Title: The Effects of Divergent Production Activities with Math Inquiry and the Think Aloud Strategy of Students with Math Difficulty
Student Assent Form
I have been asked by Hija Park from Texas A&M University to participate in a
study that looks at how learning to think in creative ways will help me when I am
learning math. I understand that this study will last fourteen week. During this time I
will be doing a variety of activities using creative thinking and math. I understand that
I will be taking a test on creative thinking at the beginning and the end of the study.
I understand that I will be given a number instead of my name so that no one
will know who I am any where in the paper. I may quit the study at any time by telling
the teacher. I understand that my school grades will not be affected by my choice to
participate or not participate in the study.
I have read and understand this project. I have had my questions answered and
agree to participate in this study. Printed name of student ________________________________ Signature of student ____________________________________Date _____________ I agree to conduct this study as it is described. Signature of researcher _________________________________ Date _____________ Date ____________ Initial _______
Page 1 of 2

84
This research study has been reviewed and approved by the Institutional Review Board
Human Subjects in Research, Texas A&M University. For research-related problems
or questions regarding subjects’ rights, the Institutional Review Board may be
contacted through Dr. Michael W. Buckley, Director of Support Services, Office of
Vice President for Research and Associate Provost for Graduate Studies at (979) 845-
8585. For more information about this study, you may contact: Researcher: Dr. William R. Nash or Dept. of Educational Psychology
Texas A&M University College Station, Texas 77843-4225 (979)845-1893.
email: [email protected]
Hija Park
Dept. of Educational Psychology Texas A&M University College Station, Texas 77840 (979)862-9244.
Date ____________ Initial _______
Page 2 of 2
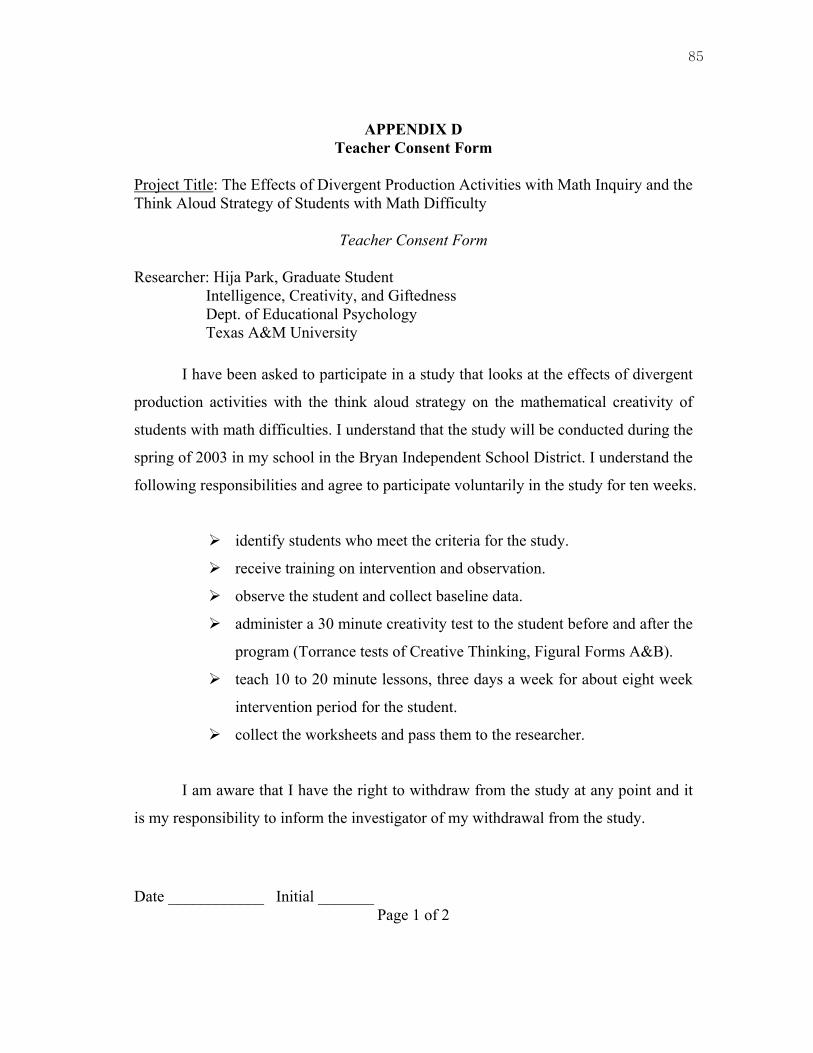
85
APPENDIX D Teacher Consent Form
Project Title: The Effects of Divergent Production Activities with Math Inquiry and the Think Aloud Strategy of Students with Math Difficulty
Teacher Consent Form Researcher: Hija Park, Graduate Student Intelligence, Creativity, and Giftedness Dept. of Educational Psychology Texas A&M University
I have been asked to participate in a study that looks at the effects of divergent
production activities with the think aloud strategy on the mathematical creativity of
students with math difficulties. I understand that the study will be conducted during the
spring of 2003 in my school in the Bryan Independent School District. I understand the
following responsibilities and agree to participate voluntarily in the study for ten weeks.
identify students who meet the criteria for the study.
receive training on intervention and observation.
observe the student and collect baseline data.
administer a 30 minute creativity test to the student before and after the
program (Torrance tests of Creative Thinking, Figural Forms A&B).
teach 10 to 20 minute lessons, three days a week for about eight week
intervention period for the student.
collect the worksheets and pass them to the researcher.
I am aware that I have the right to withdraw from the study at any point and it
is my responsibility to inform the investigator of my withdrawal from the study.
Date ____________ Initial _______
Page 1 of 2
86
I have read and understand the project. I have been adequately informed of the
procedures and responsibilities. I agree to participate in this study. The information
obtained from this study will be used to complete a doctoral dissertation and will be
publish in journal articles. Signature of teacher ____________________________ Date _______________ Printed name of teacher ________________________________ I agree to conduct and report this study according to the described terms. Signature of researcher ________________________________ Date ________________ This research study has been reviewed and approved by the Institutional Review Board
Human Subjects in Research, Texas A&M University. For research-related problems
or questions regarding subjects’ rights, the Institutional Review Board may be
contacted through Dr. Michael W. Buckley, Director of Support Services, Office of
Vice President for Research and Associate Provost for Graduate Studies at (979) 845-
8585. For more information about this study, you may contact: Researcher: Dr. William R. Nash or Dept. of Educational Psychology
Texas A&M University College Station, Texas 77843-4225 (979)845-1893.
email: [email protected]
Hija Park
Dept. of Educational Psychology Texas A&M University College Station, Texas 77840 (979)862-9244.
Date ____________ Initial _______
Page 2 of 2
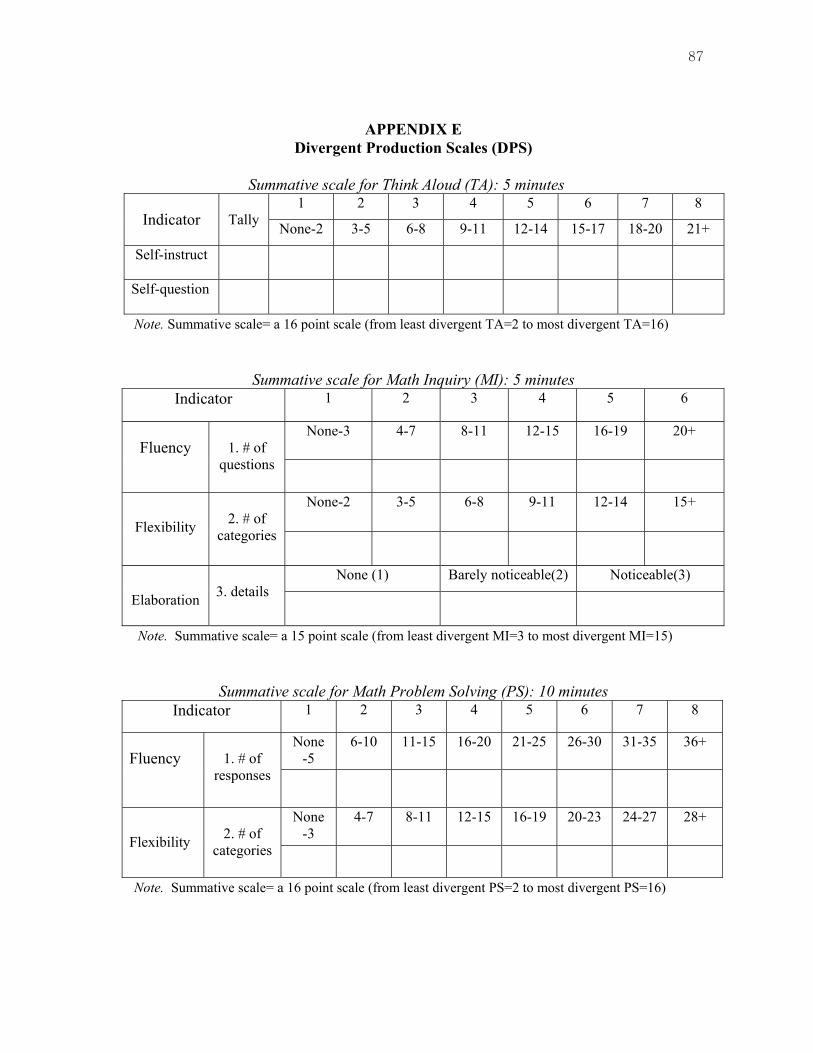
87
APPENDIX E Divergent Production Scales (DPS)
Summative scale for Think Aloud (TA): 5 minutes
1 2 3 4 5 6 7 8 Indicator Tally None-2 3-5 6-8 9-11 12-14 15-17 18-20 21+
Self-instruct
Self-question
Note. Summative scale= a 16 point scale (from least divergent TA=2 to most divergent TA=16)
Summative scale for Math Inquiry (MI): 5 minutes Indicator 1 2 3 4 5 6
None-3 4-7 8-11 12-15 16-19 20+ Fluency
1. # of
questions
None-2 3-5 6-8 9-11 12-14 15+
Flexibility
2. # of
categories
None (1) Barely noticeable(2) Noticeable(3)
Elaboration
3. details
Note. Summative scale= a 15 point scale (from least divergent MI=3 to most divergent MI=15)
Summative scale for Math Problem Solving (PS): 10 minutes Indicator 1 2 3 4 5 6 7 8
None -5
6-10 11-15 16-20 21-25 26-30 31-35 36+ Fluency
1. # of
responses
None -3
4-7 8-11 12-15 16-19 20-23 24-27 28+
Flexibility
2. # of
categories
Note. Summative scale= a 16 point scale (from least divergent PS=2 to most divergent PS=16)
88
APPENDIX F Guidelines for Divergent Production Program
I. Introduction
The “Divergent Production Activities” have been developed for the instructor and observers of the study to investigate the effects of the multiple instructions implemented with students with math difficulty. Detailed guidelines provide the standardized procedures of the instruction and observations in the course of the study so that the study can enhance internal validity by controlling the expected threats. Guidelines also provide information to help future researchers replicate the results and eventually make this study have stronger generalizability.
II. Intervention Form 1. The 10, 5, and 5 minute worksheets of math problem solving, math inquiry,
and think aloud. 2. Instruction and practice (two-thirds of the time) 3. Instructor – student interaction (one-third of the time)
III. Setting up the Divergent Production Activities 1. Selection criteria for the participants
1) Identifying eligible students 2) Having math difficulties as judged by their teachers 3) Teacher recommendations 4) Have never participated in divergent production training
2. Selecting the Intervention materials Divergent production and think aloud will be trained using worksheets and instructor-student interaction. Divergent production materials used in the intervention will be compiled that are modified from several activities developed by previous studies and by the investigator. The materials will be tried out before being used in the intervention to see whether or not they meet the grade level and the approximate time to complete one worksheet. The content and difficulty level of mathematical divergent production activities should meet the fourth grade mathematics standards of Texas Assessment of Academic Skills (TAAS, 1998).
3. Procedure to instruct problem solving
The instructor explains the directions and the student works on the problem (for approximately 6 minutes). The instructor plays a role as a guide or a director by answering questions, commenting on the work, and encouraging the participant with a verbal praise (about 4 minutes).

89
1) No instant correction of answers or negative comments is given to the student.
2) If the student completes the worksheet or the assigned time is over, the instructor tells the subject comments like “good job” and collects the worksheet.
3) During the ensuing session, the paper is returned to the student with verbal comments, not numerical scores.
4. Procedure to instruct math inquiry
1) The instructor explains the directions and the student works on the problem (at least 3 minutes). The instructor plays a role as a guide or a director by answering questions, commenting on the work, and encouraging the student with a verbal praise (about 2 minutes).
2) No instant correction of answers or negative comments is given to the student.
3) If the student completes the worksheet or the assigned time is over, the instructor tells the subject comments like “good job” and collects the worksheet.
4) During the following session, the paper is returned to the student with verbal comments not numerical scores.
5. Procedure to instruct think aloud
1) The instructor explains the directions and the student practices the example problem (at least 3 minutes). The instructor plays a role as a monitor by observing the subject working on the task, and by encouraging the student to talk out while thinking of solutions (about 2 minutes).
2) Correction of the answers or any hints can be given if the student asks for it.
3) If the student completes the worksheet or the assigned time is over, the instructor tells the subject comments like “good job” and collects the worksheet.
4) During the next session, the paper is returned to the student with verbal comments not numerical scores.
IV. Instruction Protocols Example interactions for the PS, MI, & TA instructions PS: Problem solving is to think a problem in getting the answer in many different ways. You think of as many ideas as you can. You also think of as many different ideas as possible for a limited time.
90
Today we’re going to have a new problem. What is your problem?
My problem is _____. How can you do it?
First, I’ll read the problem carefully two times. Then I look at the problem to find what information I have. I try one and draw my idea.
You have more than one idea, don’t you? I can think of other ways.
Very good, let’s try the next one. I did the second one.
What are your answers? Are they different or similar? Can you think of other ways to look at this problem differently? Keep interacting when the time is up. What are the important points when you do problem solving?
Think differently than the previous one I did. Think of as many ideas as possible. Think of other ways when I am stuck in the problem.
You did great! MI: Math Inquiry is a useful skill to ask questions in solving a given problem and find missing information. You think of as much information and many questions as you can. Think of as many different ideas as possible for a limited time. You can also use other data such as statistics, graph, drawing, and charts when explaining your idea.
Today we’re going to have a new problem. What is your problem?
My problem is _____. How can you do it?
First, I read the problem carefully two times. Then I look at the problem to find what information I have. I try one and write my idea.
What questions (information) can you ask (learn) using the given problem? (When the student seems to be stuck in the problem), you have more than one
idea, don’t you? I can think of other ways.
Very good, let’s try the next one. I did the second one.
Are the answers different or similar? Can you use any other ways when you make your own question? Can you think of some other things to make your question more meaningful and
clear? For example, you can describe your information further using other means like graph, drawing, and sketches.
Can you think of other ways to look at this problem differently?
91
Keep interacting when the time is up. What are the important points when you do math inquiry?
Think differently from the previous one I did. Think as many questions as possible. Think elaborately as much as you can. Describe the details of your solution. Think other ways when I am stuck in the problem.
You did great! You learned a lot about thinking more of the solutions.
TA: Thinking aloud is one way of teaching someone how to do something. I will teach you how to think and solve the problem. You also check the answers you got by asking yourself questions. Repeating instructor’s talk is sometimes necessary.
Today we’re going to have a new problem. What problem do you have today?
My problem is _____. Good. How can you do it?
How can I do it? First, I’ll read the problem carefully two times.
Great. Then I look at the problem to find what information I have.
What information do you have? I have _____ and ________.
What do you need to do? I need to figure out ________________ first.
Can you check the answer if it is correct? I can do __________ to check the answer.
Very good. Then what do you do next? I need to figure out ________________.
Do you think you need to check if you got the right answer? (repeat this procedure until all is done.)
Let me hear you think out loud. You don’t need to look at me and talk to me. You talk to yourself and you ask yourself just loud enough. I must hear you what you think. The instructor encourages the student to think again by asking him/herself. Let me hear you think out loud. Keep interacting when the time is up. What are the important points when you do think aloud?
Think out loud enough and always check your thinking. Think other ways or go back to the previous step when I am stuck in the
problem.

92
You did great! You learned a lot about Think Aloud skills.
V. Assessment Protocol PS assessment protocol Today, I’m going to see how you are doing on the Problem Solving question. Remember you have learned some problem solving strategies and I want you to use those skills this time. Make the most of your 5 minute time to think of plenty of new ideas. Open your folder and read the problem. Do you understand the problem? Okay, good. Let’s begin! MI assessment protocol Today, I’m going to see how you are doing on the Math Inquiry problem. Remember you have learned some Math Inquiry strategy this week. So this time, I want you to use those skills in solving this problem. You need to write down questions (information) that you can tell from the given problem. Make the most of your 5 minute time to produce lots of ideas. Open your folder and read the problem. Do you understand the problem? Okay, good. Let’s begin TA assessment protocol Today, I’m going to see how you are doing on the Think Aloud problem. Remember you have learned some Think Aloud strategy this week. So this time, I want you to use those skills in solving this problem. You need to keep talking about what you have in your head. Once you start working on it, I will not say, like “tell me what you’re thinking” or “let me hear what you think.” Make the most of your 5 minute time to think aloud. Open your folder and read the problem. Do you understand the problem? Okay, good. Let’s begin!
93
VI. Instructor Training
Instructor must be in one two hour training session with the researcher on how the instruction should be taught and directed for students’ math performance and mathematical thinking in the given problem solving situation. The divergent production training proceeds as follows through instructor–researcher discussion.
1. Instructor provides and assembles materials:
Timer, Worksheet, Pencil, and Eraser
2. First, during the instruction-practice section, instructor distributes the worksheet. Problem solving is 10 minutes. At the beginning, tell the student the following: Today, you will have only one problem you can work with. You will have chance to explore and have fun with it for about 6 minutes. You will find yourself so good at thinking up new ideas and solving problems in many different but interesting ways. Now, let’s look at the problem and read it carefully. Let’s work on the problem first until the time is called. Let the student begin to work on the task.
3. Second, at the interaction section, tell the student the following:
If you have any questions that come up while you are working on the problem, feel free to ask or talk about it. Showing the example of the problem to the student, the instructor can say something like “Can we think of it this way? What do you think of the solution? These kinds of questions can prompt the student’s thinking more differently next time than this time. The student discusses with the instructor for 4 minutes.
4. Wrapping up the session of the day, the instructor collects the worksheet from the subject and informs the next meeting schedule. The instructor says thanks and gives some encouragement to the student. Before the next instruction session, the instructor provides the subject with feedback on the work. The copy of the original worksheet with the feedback will be returned to the student. The instructor scores the worksheet of the observation and gives it to the researcher.
VII. Observation and Scoring
1. Observation and scoring will take place once a week basis for the same amount of the time instructed and practiced, i.e., problem solving for ten minutes, math inquiry for five minutes, and think aloud for five minutes. Observers other than the instructor observe and score the work and turn the recording form in to the investigator.
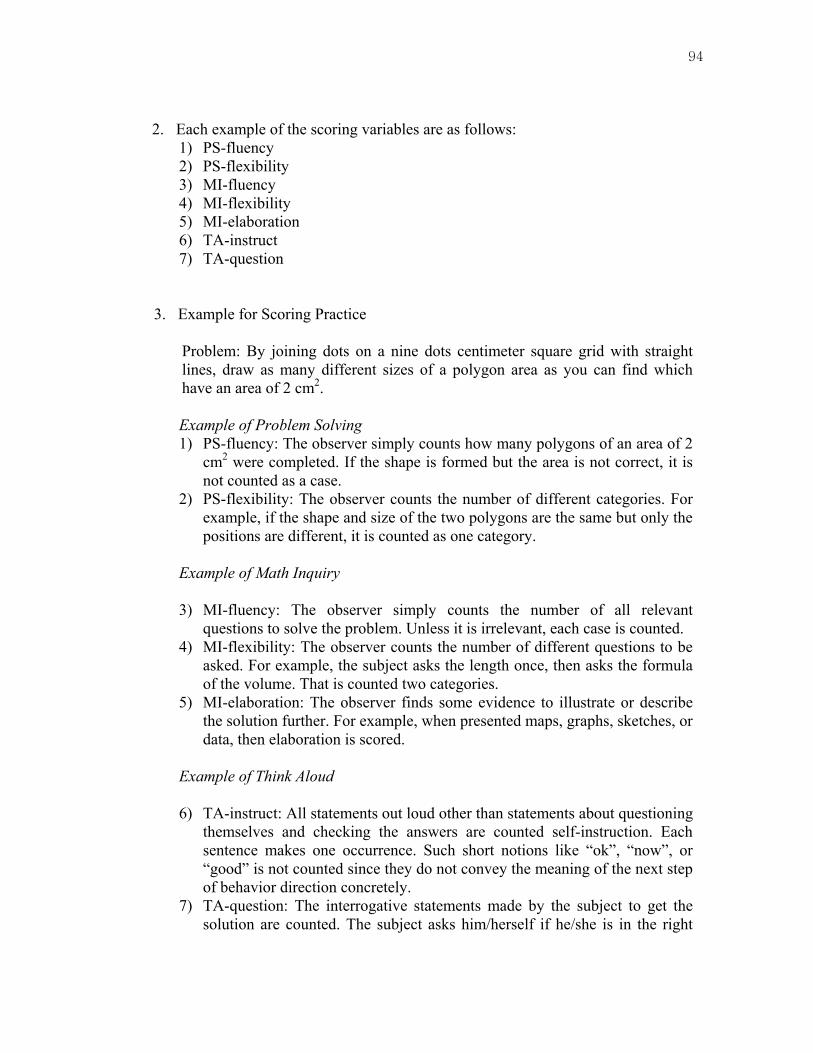
94
2. Each example of the scoring variables are as follows: 1) PS-fluency 2) PS-flexibility 3) MI-fluency 4) MI-flexibility 5) MI-elaboration 6) TA-instruct 7) TA-question
3. Example for Scoring Practice
Problem: By joining dots on a nine dots centimeter square grid with straight lines, draw as many different sizes of a polygon area as you can find which have an area of 2 cm2.
Example of Problem Solving 1) PS-fluency: The observer simply counts how many polygons of an area of 2
cm2 were completed. If the shape is formed but the area is not correct, it is not counted as a case.
2) PS-flexibility: The observer counts the number of different categories. For example, if the shape and size of the two polygons are the same but only the positions are different, it is counted as one category.
Example of Math Inquiry
3) MI-fluency: The observer simply counts the number of all relevant
questions to solve the problem. Unless it is irrelevant, each case is counted. 4) MI-flexibility: The observer counts the number of different questions to be
asked. For example, the subject asks the length once, then asks the formula of the volume. That is counted two categories.
5) MI-elaboration: The observer finds some evidence to illustrate or describe the solution further. For example, when presented maps, graphs, sketches, or data, then elaboration is scored.
Example of Think Aloud
6) TA-instruct: All statements out loud other than statements about questioning
themselves and checking the answers are counted self-instruction. Each sentence makes one occurrence. Such short notions like “ok”, “now”, or “good” is not counted since they do not convey the meaning of the next step of behavior direction concretely.
7) TA-question: The interrogative statements made by the subject to get the solution are counted. The subject asks him/herself if he/she is in the right

95
track of solving the problem. Examples are like “what will I need to find out?” or “should I try one higher?” when guessing the answer in computation.

96
APPENDIX G Summative Divergent Production Assessment
TA Assessment 1 Think aloud while you are working on the cross number puzzle. You may use any number that makes the sum of any straight line equal. You may use the space below the puzzle if you need.
1
3
2
5

97
TA Assessment 2 Think aloud while you are working on the problem. If you put your hand into a pouch, how often would you expect to pick up a red marble? Inside the pouch, there are 2 blue marbles, 3 red marbles, and 4 green marbles. You cannot see inside the pouch when you pick up a marble. You may use the picture below to figure out the answer.
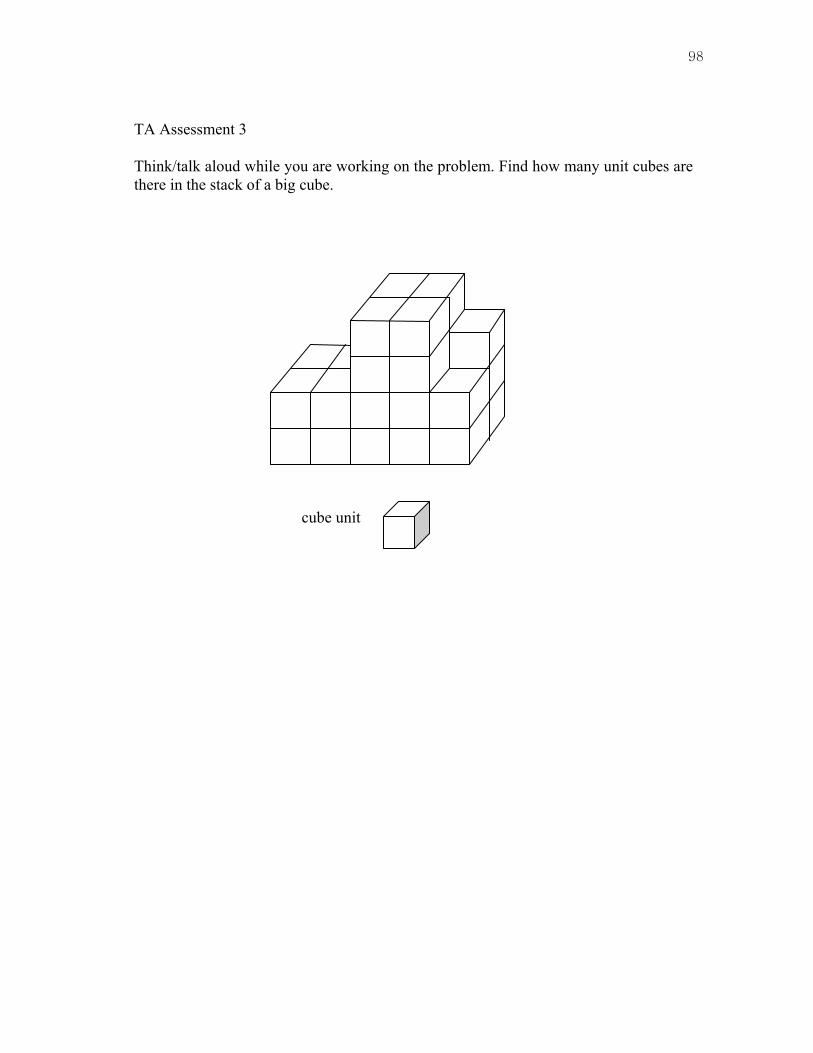
98
TA Assessment 3 Think/talk aloud while you are working on the problem. Find how many unit cubes are there in the stack of a big cube.
cube unit
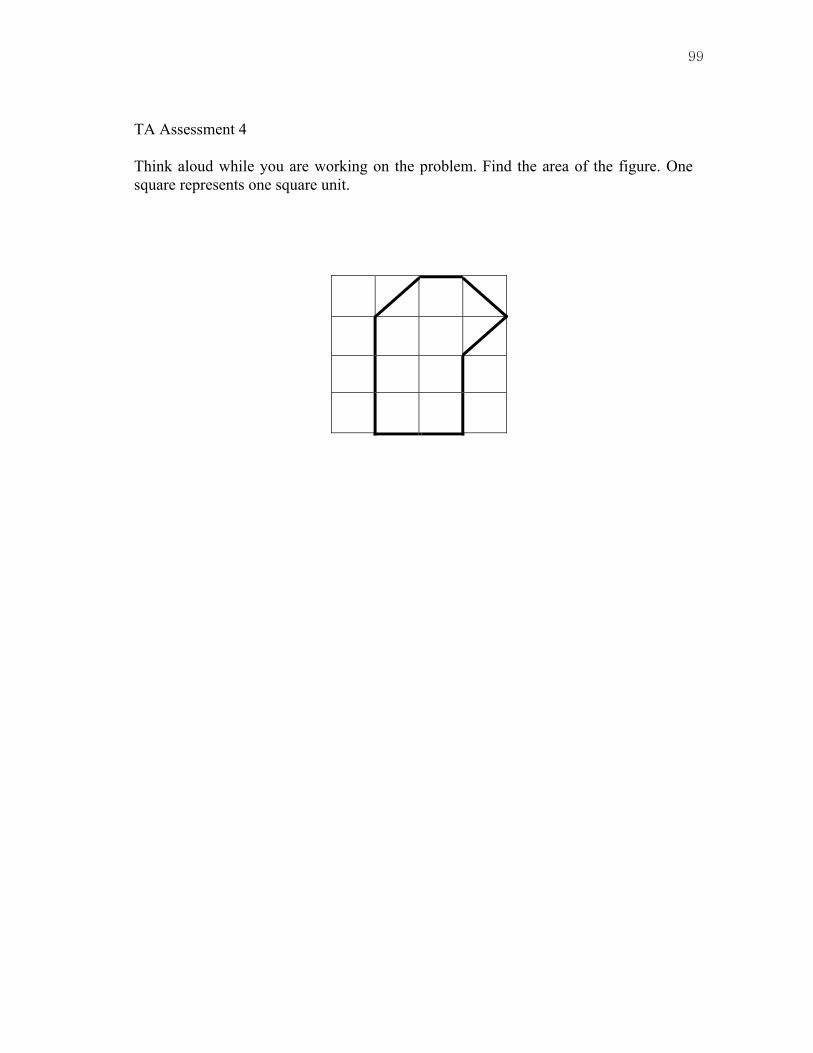
99
TA Assessment 4 Think aloud while you are working on the problem. Find the area of the figure. One square represents one square unit.
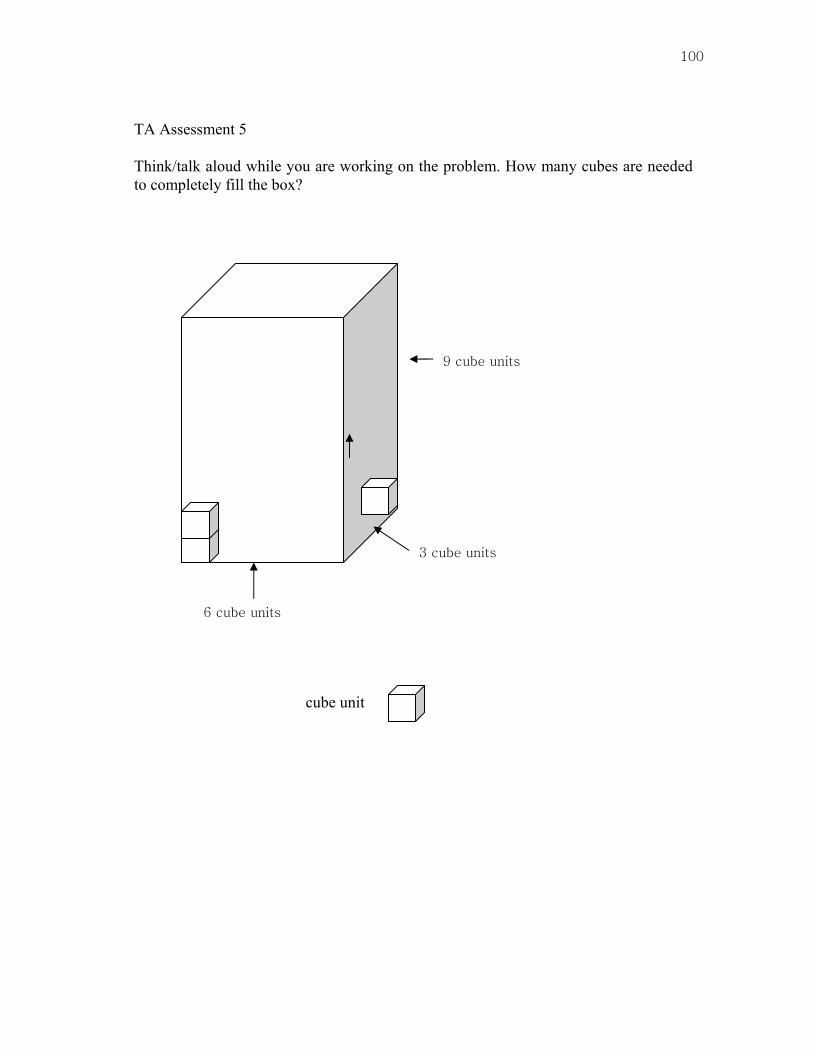
100
TA Assessment 5 Think/talk aloud while you are working on the problem. How many cubes are needed to completely fill the box?
cube unit
9 cube units
3 cube units
6 cube units

101
TA Assessment 6 Think aloud while you are finding as many paths as you can. Any path you find in the number grid must make a sum of 12 and the path consists of four neighboring numbers. Draw a line to show each path you find.
1
4
2
5
5
3
1
4
2
3
5
1
6
4
5
0
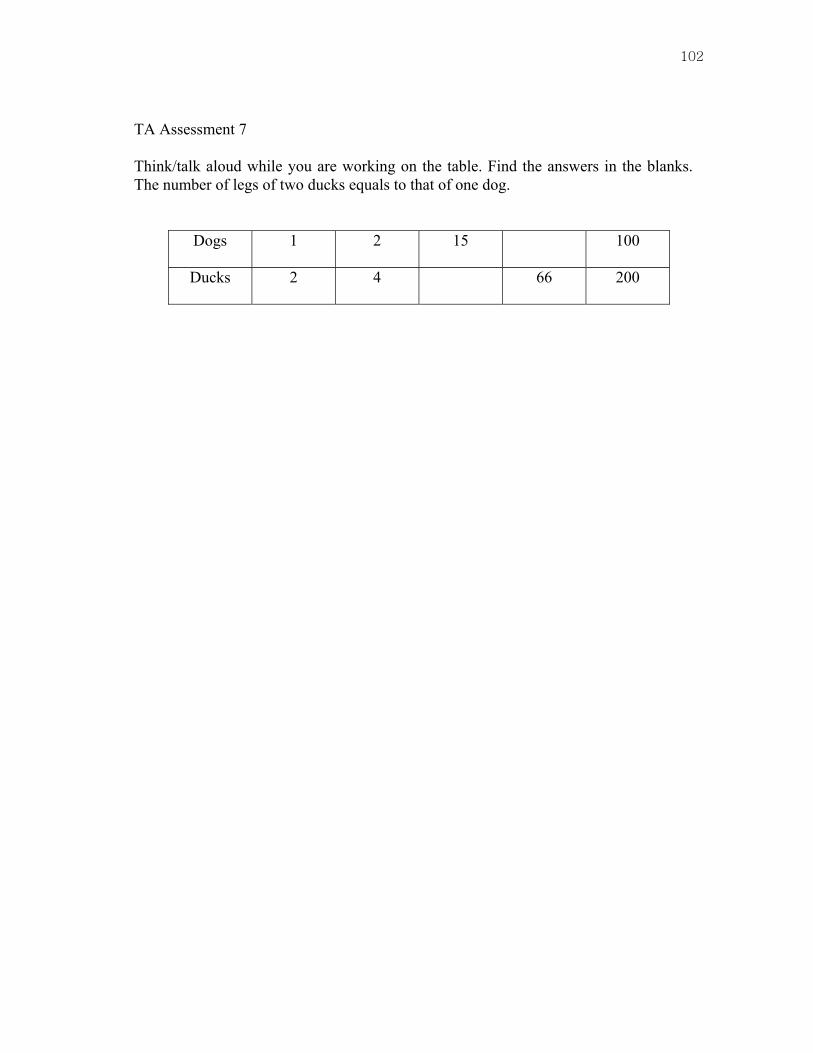
102
TA Assessment 7 Think/talk aloud while you are working on the table. Find the answers in the blanks. The number of legs of two ducks equals to that of one dog.
Dogs 1 2 15 100
Ducks 2 4 66 200

103
TA Assessment 8 Think/talk aloud while you are solving the problem. Find the area of the figure. One small square represents one square unit. Square unit
Answer: _______________________________
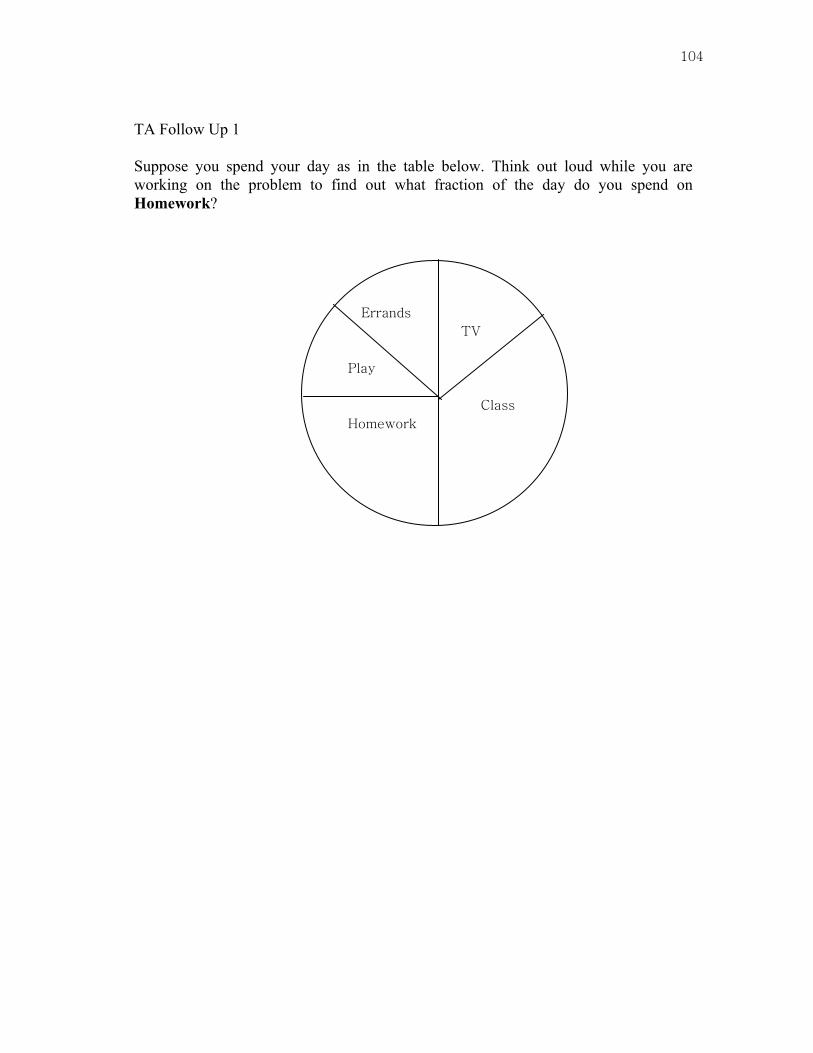
104
TA Follow Up 1 Suppose you spend your day as in the table below. Think out loud while you are working on the problem to find out what fraction of the day do you spend on Homework?
Errands
TV
Play
Class
Homework
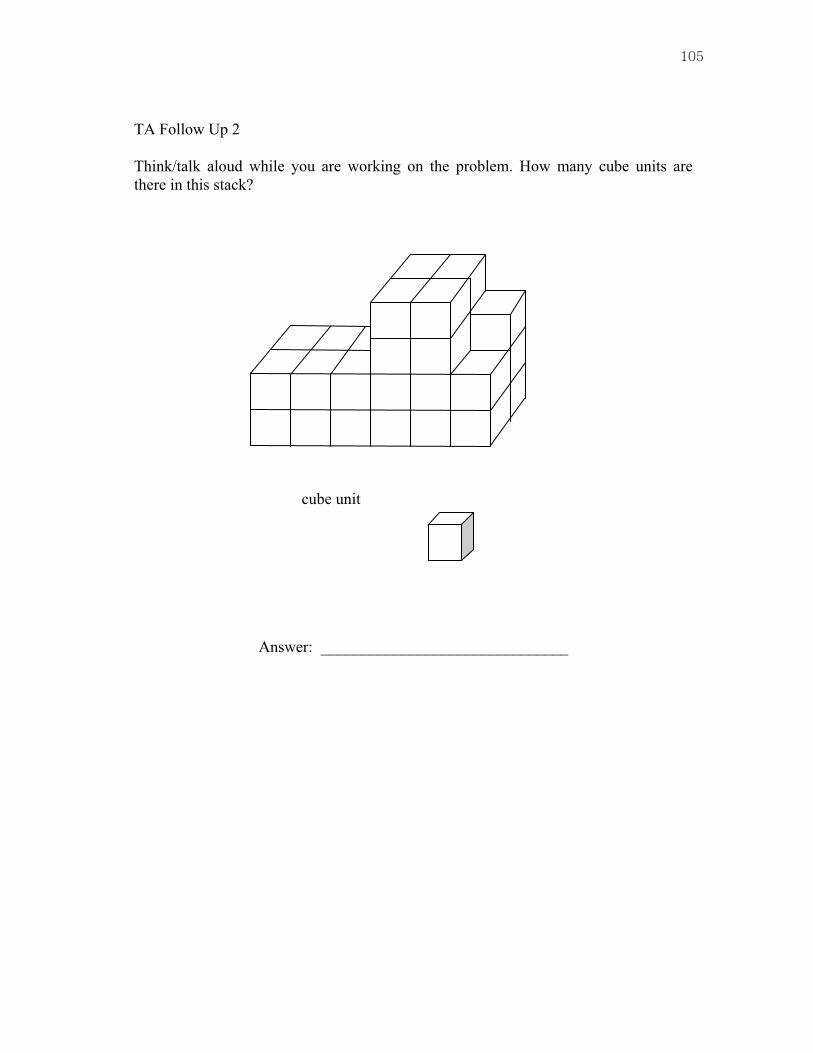
105
TA Follow Up 2 Think/talk aloud while you are working on the problem. How many cube units are there in this stack?
cube unit
Answer: _______________________________

106
MI Assessment 1 List as much information as you can tell from the given number line.
-15 -10 -5 0 5 10 15
________________________________________________________________
________________________________________________________________
________________________________________________________________
________________________________________________________________
________________________________________________________________
________________________________________________________________
________________________________________________________________
________________________________________________________________

107
MI Assessment 2 Write down as many questions as you can think of that numbers 18 and 28 have in common.
________________________________________________________________
________________________________________________________________
________________________________________________________________
________________________________________________________________
________________________________________________________________
________________________________________________________________
________________________________________________________________
________________________________________________________________
________________________________________________________________

108
MI Assessment 3
There are many shapes below. Write as many questions about how these shapes can be sorted.
________________________________________________________________
________________________________________________________________
________________________________________________________________
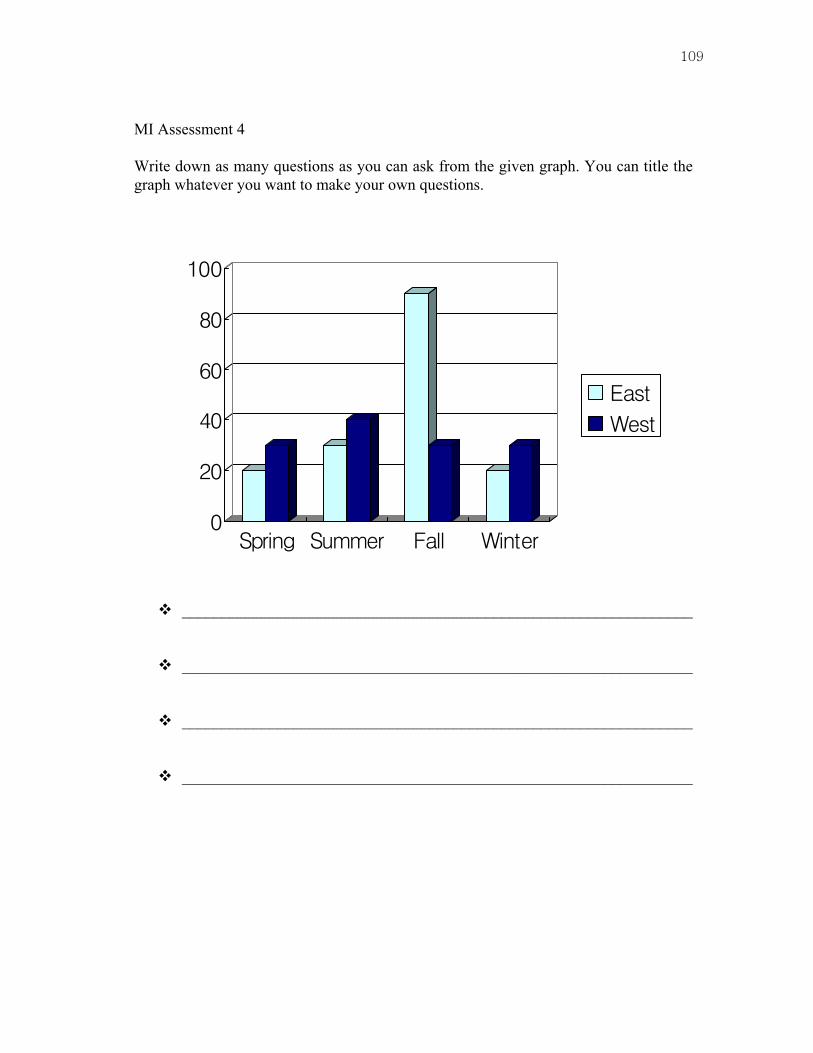
109
MI Assessment 4 Write down as many questions as you can ask from the given graph. You can title the graph whatever you want to make your own questions.
0
20
40
60
80
100
Spring Summer Fall Winter
East
West
________________________________________________________________
________________________________________________________________
________________________________________________________________
________________________________________________________________

110
MI Assessment 5 Write down as many questions as you can think of from the given problem. Each square is one square unit.
________________________________________________________________
________________________________________________________________
________________________________________________________________
________________________________________________________________
________________________________________________________________
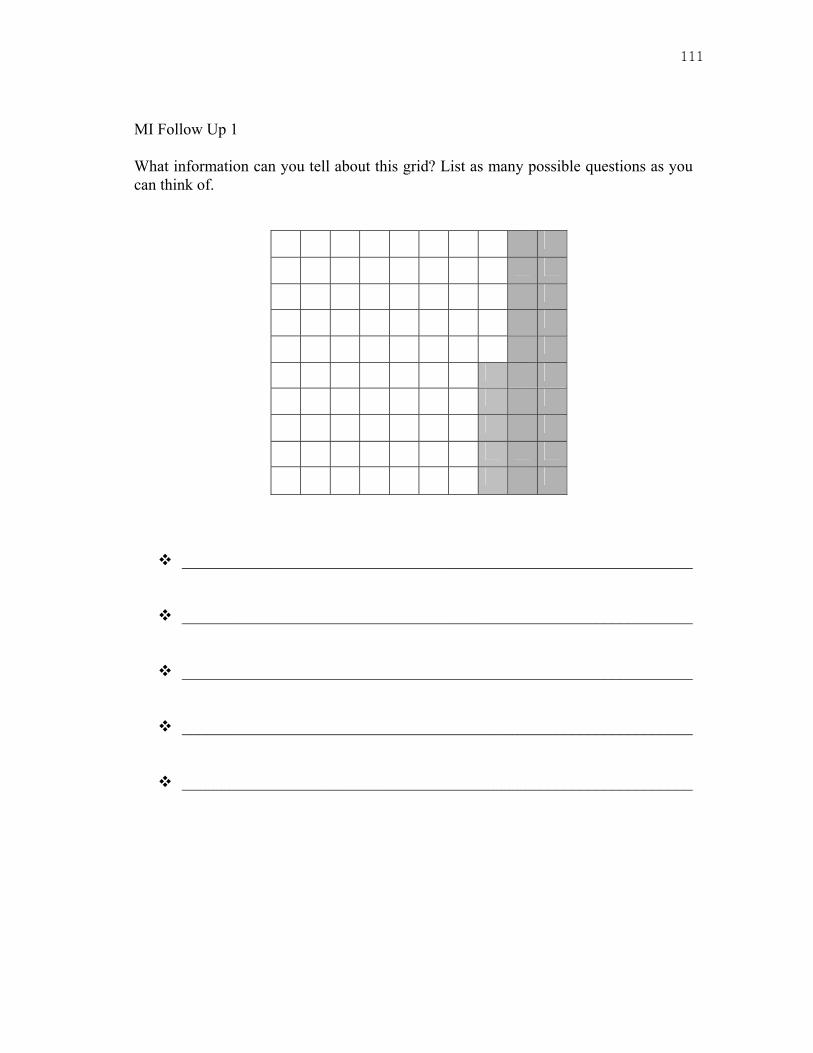
111
MI Follow Up 1 What information can you tell about this grid? List as many possible questions as you can think of.
________________________________________________________________
________________________________________________________________
________________________________________________________________
________________________________________________________________
________________________________________________________________

112
MI Follow Up 2
There are many shapes below. Write as many questions about how these shapes can be sorted.
________________________________________________________________
________________________________________________________________
________________________________________________________________
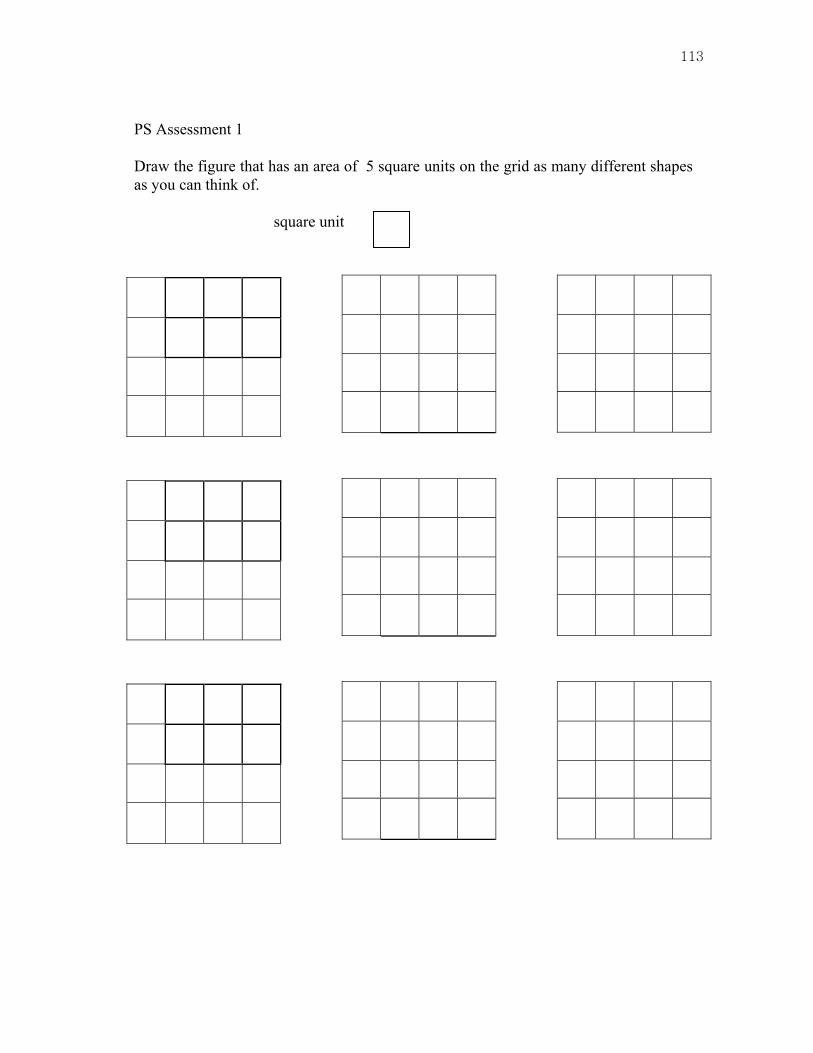
113
PS Assessment 1 Draw the figure that has an area of 5 square units on the grid as many different shapes as you can think of. square unit
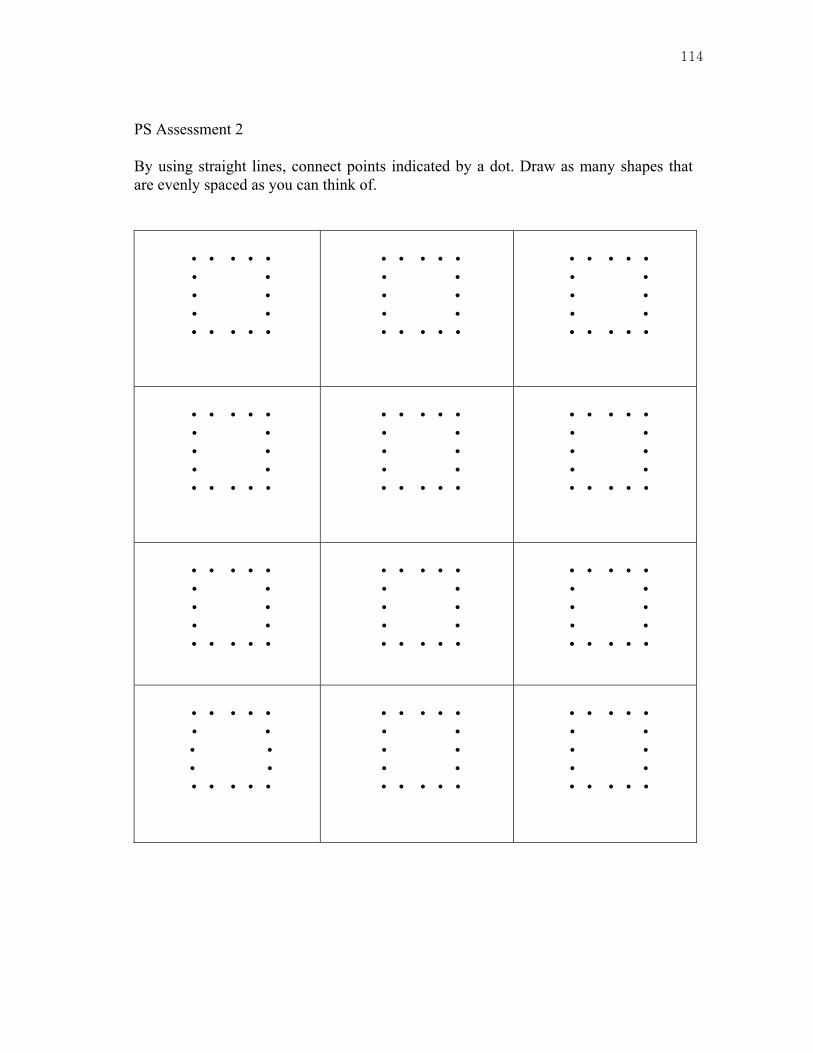
114
PS Assessment 2 By using straight lines, connect points indicated by a dot. Draw as many shapes that are evenly spaced as you can think of.
• • • • • • • • • • • • • • • •
• • • • • • • • • • • • • • • •
• • • • • • • • • • • • • • • •
• • • • • • • • • • • • • • • •
• • • • • • • • • • • • • • • •
• • • • • • • • • • • • • • • •
• • • • • • • • • • • • • • • •
• • • • • • • • • • • • • • • •
• • • • • • • • • • • • • • • •
• • • • • • • • • • • • • • • •
• • • • • • • • • • • • • • • •
• • • • • • • • • • • • • • • •
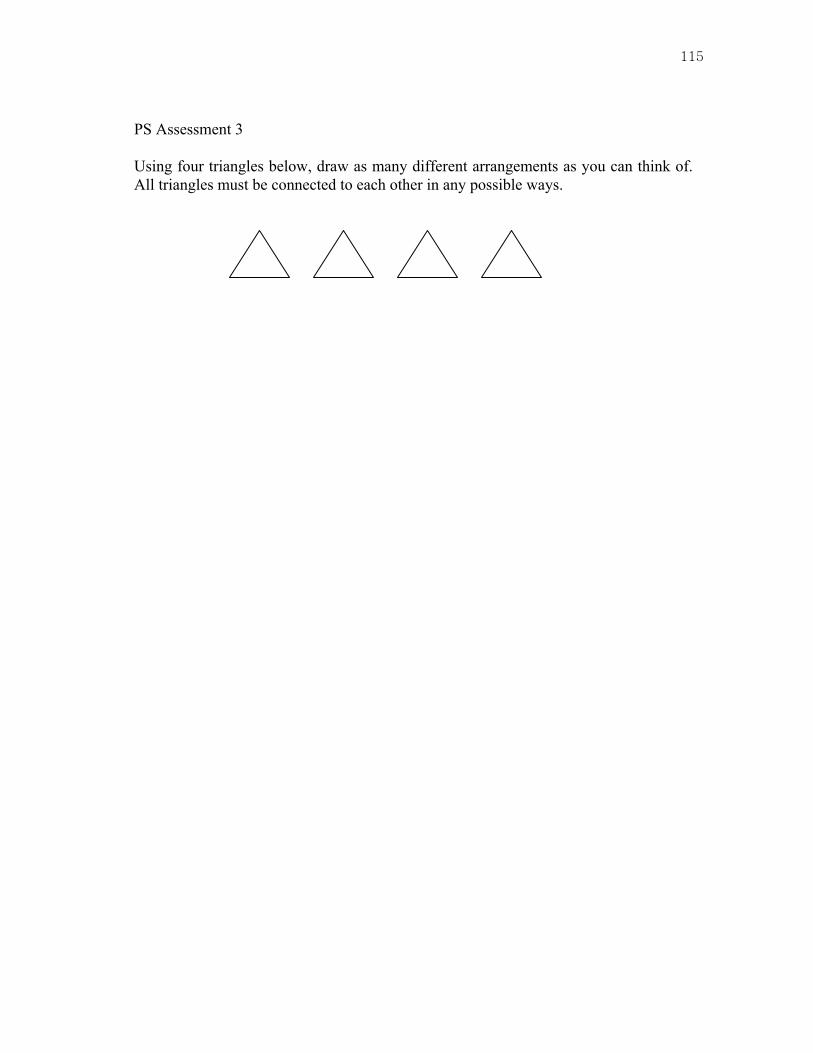
115
PS Assessment 3 Using four triangles below, draw as many different arrangements as you can think of. All triangles must be connected to each other in any possible ways.

116
PS Follow Up 1 Draw as many different arrangements as you can think of by cutting the shape into three pieces as drawn below.

117
PS Follow Up 2 By joining dots on a nine dot square grid with straight lines, draw as many shapes as you can.
• • •
• • •
• • •
• • •
• • •
• • •
• • •
• • •
• • •
• • •
• • •
• • •
• • •
• • •
• • •
• • •
• • •
• • •
• • •
• • •
• • •
• • •
• • •
• • •
• • •
• • •
• • •
118
VITA
Hija Park Texas A&M University 693-9 Simgok Bon-dong College of Education Buchon, Korea 422-240 Department of Educational Psychology (H) 032-611-7364 College Station, Texas 77843-4225 Email:[email protected]
HIGHLIGHTS OF QUALIFICATIONS
Five years of research experiences in intelligence, creativity, and
giftedness field with qualitative/quantitative methods.
Co-authoring and co-publishing experiences.
Strong teaching experience in elementary education.
EDUCATION
May, 2004 Ph.D. in Educational Psychology, Texas A&M University, College
Station, TX.
December 2000 M.S. in Educational Psychology Texas A&M University, College
Station, TX.
February, 1986 B.A. in Elementary Education, Inchon National University of
Education, Inchon, Korea.
WORK HISTORY
Fall, 2002-Present Graduate assistant. Educational Psychology, Texas A&M
University, College Station, TX
Summer-Fall. 2002 Translator, TAMU Children’s Center Family Handbook,
College Station, TX
June, 2001 & July. 2002 Camp Counselor, Youth Adventure Program, Practicum
in Educating Gifted and Talented, College Station, TX
September.1986-June. 1999 Teaching, Elementary Schools, Inchon, Korea
Related Documents