Analysis The effect of scaling and connection on the sustainability of a socio-economic resource system Rachata Muneepeerakul a, b, ⁎, Murad R. Qubbaj a a School of Sustainability, Arizona State University, 800 S. Cady Mall, P.O. Box 875502, Tempe, AZ 85287-5502, United States b Mathematical, Computational, and Modeling Sciences Center, Arizona State University, Tempe, AZ 85287-1904, United States abstract article info Article history: Received 14 September 2011 Received in revised form 14 February 2012 Accepted 15 February 2012 Available online 22 March 2012 Keywords: Sustainability Scaling Connection Bifurcation Population dynamics Policy makers dealing with complex systems oftentimes rely on “linear thinking.” This is understandable due to the ease and convenience offered by the simplicity of such conceptualization. Although this line of thinking may help facilitate decision making processes, it is only as defensible as the degree at which the system under consideration behaves linearly. Recent work shows that diverse properties of cities exhibit power-law rela- tionships with population size. Such relationships may invalidate the reliance on linear thinking. Further- more, in the era of globalization, resources and people move virtually freely through bounds of any confines used to define a system. We incorporate into a simple resource-population model the power-law scaling behavior and the influence of import and immigration, and investigate their effects on sustainable growth of communities. We explore through bifurcation analysis the different scenarios of how an unsustain- able system could be sustained. Import can be effective if: the import exceeds a critical level and a critical mass of people populates the system. In contrast, increasing immigration alone can rescue the intrinsically unsustainable system, both directly through people entering the system and indirectly by increasing its har- vesting ability, although critical values exist that cause the population to sharply rise or shrink. © 2012 Elsevier B.V. All rights reserved. 1. Introduction In dealing with socio-economic complex systems, many policy makers and managers have a tendency to be tempted toward “linear thinking,” presumably due to the convenience and ease of conceptu- alization that its simplicity provides. This line of thinking would in- variably lead them to basing their decisions and priority on simple averages, e.g., some quantities of interest normalized by population or land area. While such practice may help facilitate decision making processes, it is only as defensible as the degree at which the system under consideration behaves linearly. It turns out that “growth of cit- ies”–without a doubt, a complex and important socio-economic prob- lem–is not linear. Recent findings (Batty, 1995, 2008; Bettencourt et al., 2007; Marshall, 2007; Zhang and Yu, 2010) have shown that many growth-related phenomena are nonlinear, or more specifically, exhibit power-law scaling behavior with population size. In other words, twice as many people do not simply mean twice as much in- frastructure, nor do they mean twice as many innovations and tech- nological advances. Despite these findings, there has been relatively little theoretical work that discusses the consequences of such nonli- nearity. New insights may be obtained by considering such findings in socio-economic quantitative, predictive dynamical models. This paper contributes to this endeavor; in particular, it asks: what are the implications of the nonlinear growth patterns of these urban phe- nomena on the sustainable growth of human societies? In addition, in this era of globalization, resources and people move virtually freely in and out of bounds of any confines with which we define the system (Castles, 2002; Vanderheiden, 2008; Wolf, 2007; Young, 2009). As such, connection to a greater, outside system must also be taken into account when considering the growth of a commu- nity or city. In this article, we incorporate the scaling behavior of the urban phenomena and influence of connections, namely import/ex- port of resources and migration of people, and gain basic intuition and insights through a simple model of resource-population dynam- ics. While other approaches can be proposed for such incorporation, we believe that, by introducing these effects in a relatively familiar model, their consequences can be appreciated more readily. 2. Models, Results, and Analysis 2.1. Incorporating Scaling We first focus on incorporating the effects of scaling. We do so by modifying the simple model of resource-population dynamics. Specif- ically, we postulate that the rate of resource harvest/extraction and the rate of resource consumptions needed to maintain the existing population exhibit power-law scaling behavior with population Ecological Economics 77 (2012) 123–128 ⁎ Corresponding author at: School of Sustainability, Arizona State University, 800 S. Cady Mall, P.O. Box 875502, Tempe, AZ 85287-5502, United States. E-mail addresses: [email protected] (R. Muneepeerakul), [email protected] (M.R. Qubbaj). 0921-8009/$ – see front matter © 2012 Elsevier B.V. All rights reserved. doi:10.1016/j.ecolecon.2012.02.017 Contents lists available at SciVerse ScienceDirect Ecological Economics journal homepage: www.elsevier.com/locate/ecolecon

Welcome message from author
This document is posted to help you gain knowledge. Please leave a comment to let me know what you think about it! Share it to your friends and learn new things together.
Transcript

Ecological Economics 77 (2012) 123–128
Contents lists available at SciVerse ScienceDirect
Ecological Economics
j ourna l homepage: www.e lsev ie r .com/ locate /eco lecon
Analysis
The effect of scaling and connection on the sustainability of a socio-economicresource system
Rachata Muneepeerakul a,b,⁎, Murad R. Qubbaj a
a School of Sustainability, Arizona State University, 800 S. Cady Mall, P.O. Box 875502, Tempe, AZ 85287-5502, United Statesb Mathematical, Computational, and Modeling Sciences Center, Arizona State University, Tempe, AZ 85287-1904, United States
⁎ Corresponding author at: School of Sustainability, ACady Mall, P.O. Box 875502, Tempe, AZ 85287-5502, Un
E-mail addresses: [email protected]@asu.edu (M.R. Qubbaj).
0921-8009/$ – see front matter © 2012 Elsevier B.V. Alldoi:10.1016/j.ecolecon.2012.02.017
a b s t r a c t
a r t i c l e i n f oArticle history:Received 14 September 2011Received in revised form 14 February 2012Accepted 15 February 2012Available online 22 March 2012
Keywords:SustainabilityScalingConnectionBifurcationPopulation dynamics
Policy makers dealing with complex systems oftentimes rely on “linear thinking.” This is understandable dueto the ease and convenience offered by the simplicity of such conceptualization. Although this line of thinkingmay help facilitate decision making processes, it is only as defensible as the degree at which the system underconsideration behaves linearly. Recent work shows that diverse properties of cities exhibit power-law rela-tionships with population size. Such relationships may invalidate the reliance on linear thinking. Further-more, in the era of globalization, resources and people move virtually freely through bounds of anyconfines used to define a system. We incorporate into a simple resource-population model the power-lawscaling behavior and the influence of import and immigration, and investigate their effects on sustainablegrowth of communities. We explore through bifurcation analysis the different scenarios of how an unsustain-able system could be sustained. Import can be effective if: the import exceeds a critical level and a criticalmass of people populates the system. In contrast, increasing immigration alone can rescue the intrinsicallyunsustainable system, both directly through people entering the system and indirectly by increasing its har-vesting ability, although critical values exist that cause the population to sharply rise or shrink.
© 2012 Elsevier B.V. All rights reserved.
1. Introduction
In dealing with socio-economic complex systems, many policymakers and managers have a tendency to be tempted toward “linearthinking,” presumably due to the convenience and ease of conceptu-alization that its simplicity provides. This line of thinking would in-variably lead them to basing their decisions and priority on simpleaverages, e.g., some quantities of interest normalized by populationor land area. While such practice may help facilitate decision makingprocesses, it is only as defensible as the degree at which the systemunder consideration behaves linearly. It turns out that “growth of cit-ies”–without a doubt, a complex and important socio-economic prob-lem–is not linear. Recent findings (Batty, 1995, 2008; Bettencourt etal., 2007; Marshall, 2007; Zhang and Yu, 2010) have shown thatmany growth-related phenomena are nonlinear, or more specifically,exhibit power-law scaling behavior with population size. In otherwords, twice as many people do not simply mean twice as much in-frastructure, nor do they mean twice as many innovations and tech-nological advances. Despite these findings, there has been relativelylittle theoretical work that discusses the consequences of such nonli-nearity. New insights may be obtained by considering such findings in
rizona State University, 800 S.ited States.(R. Muneepeerakul),
rights reserved.
socio-economic quantitative, predictive dynamical models. Thispaper contributes to this endeavor; in particular, it asks: what arethe implications of the nonlinear growth patterns of these urban phe-nomena on the sustainable growth of human societies?
In addition, in this era of globalization, resources and people movevirtually freely in and out of bounds of any confines with which wedefine the system (Castles, 2002; Vanderheiden, 2008; Wolf, 2007;Young, 2009). As such, connection to a greater, outside system mustalso be taken into account when considering the growth of a commu-nity or city. In this article, we incorporate the scaling behavior of theurban phenomena and influence of connections, namely import/ex-port of resources and migration of people, and gain basic intuitionand insights through a simple model of resource-population dynam-ics. While other approaches can be proposed for such incorporation,we believe that, by introducing these effects in a relatively familiarmodel, their consequences can be appreciated more readily.
2. Models, Results, and Analysis
2.1. Incorporating Scaling
We first focus on incorporating the effects of scaling. We do so bymodifying the simple model of resource-population dynamics. Specif-ically, we postulate that the rate of resource harvest/extraction andthe rate of resource consumptions needed to maintain the existingpopulation exhibit power-law scaling behavior with population
0 0.5 1 1.5 20
0.2
0.4
0.6
0.8
1
n
0 0.5 1 1.5 2n
y
0
0.2
0.4
0.6
0.8
1
y
b
a
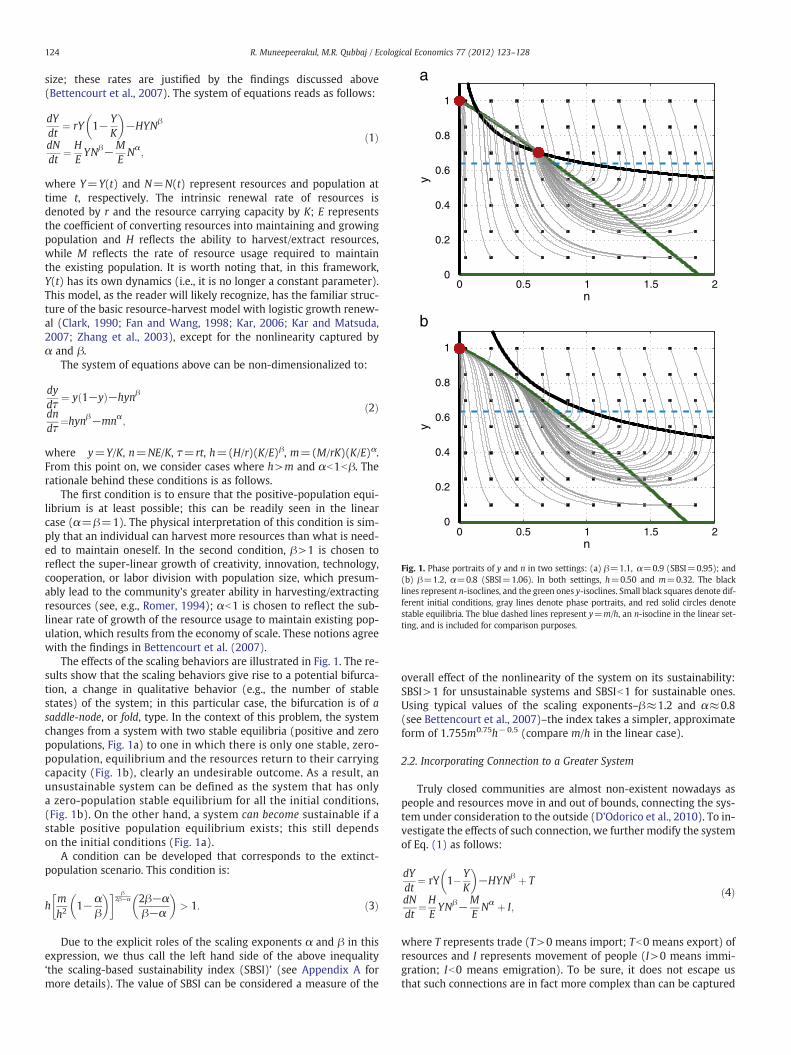
Fig. 1. Phase portraits of y and n in two settings: (a) β=1.1, α=0.9 (SBSI=0.95); and(b) β=1.2, α=0.8 (SBSI=1.06). In both settings, h=0.50 and m=0.32. The blacklines represent n-isoclines, and the green ones y-isoclines. Small black squares denote dif-ferent initial conditions, gray lines denote phase portraits, and red solid circles denotestable equilibria. The blue dashed lines represent y=m/h, an n-isocline in the linear set-ting, and is included for comparison purposes.
124 R. Muneepeerakul, M.R. Qubbaj / Ecological Economics 77 (2012) 123–128
size; these rates are justified by the findings discussed above(Bettencourt et al., 2007). The system of equations reads as follows:
dYdt
¼ rY 1− YK
� �−HYNβ
dNdt
¼ HEYNβ−M
ENα
;
ð1Þ
where Y=Y(t) and N=N(t) represent resources and population attime t, respectively. The intrinsic renewal rate of resources isdenoted by r and the resource carrying capacity by K; E representsthe coefficient of converting resources into maintaining and growingpopulation and H reflects the ability to harvest/extract resources,while M reflects the rate of resource usage required to maintainthe existing population. It is worth noting that, in this framework,Y(t) has its own dynamics (i.e., it is no longer a constant parameter).This model, as the reader will likely recognize, has the familiar struc-ture of the basic resource-harvest model with logistic growth renew-al (Clark, 1990; Fan and Wang, 1998; Kar, 2006; Kar and Matsuda,2007; Zhang et al., 2003), except for the nonlinearity captured byα and β.
The system of equations above can be non-dimensionalized to:
dydτ
¼ y 1−yð Þ−hynβ
dndτ
¼hynβ−mnα;
ð2Þ
where y=Y/K, n=NE/K, τ=rt, h=(H/r)(K/E)β, m=(M/rK)(K/E)α.From this point on, we consider cases where h>m and αb1bβ. Therationale behind these conditions is as follows.
The first condition is to ensure that the positive-population equi-librium is at least possible; this can be readily seen in the linearcase (α=β=1). The physical interpretation of this condition is sim-ply that an individual can harvest more resources than what is need-ed to maintain oneself. In the second condition, β>1 is chosen toreflect the super-linear growth of creativity, innovation, technology,cooperation, or labor division with population size, which presum-ably lead to the community's greater ability in harvesting/extractingresources (see, e.g., Romer, 1994); αb1 is chosen to reflect the sub-linear rate of growth of the resource usage to maintain existing pop-ulation, which results from the economy of scale. These notions agreewith the findings in Bettencourt et al. (2007).
The effects of the scaling behaviors are illustrated in Fig. 1. The re-sults show that the scaling behaviors give rise to a potential bifurca-tion, a change in qualitative behavior (e.g., the number of stablestates) of the system; in this particular case, the bifurcation is of asaddle-node, or fold, type. In the context of this problem, the systemchanges from a system with two stable equilibria (positive and zeropopulations, Fig. 1a) to one in which there is only one stable, zero-population, equilibrium and the resources return to their carryingcapacity (Fig. 1b), clearly an undesirable outcome. As a result, anunsustainable system can be defined as the system that has onlya zero-population stable equilibrium for all the initial conditions,(Fig. 1b). On the other hand, a system can become sustainable if astable positive population equilibrium exists; this still dependson the initial conditions (Fig. 1a).
A condition can be developed that corresponds to the extinct-population scenario. This condition is:
hmh2
1−αβ
� �� � β2β−α 2β−α
β−α
� �> 1: ð3Þ
Due to the explicit roles of the scaling exponents α and β in thisexpression, we thus call the left hand side of the above inequality‘the scaling-based sustainability index (SBSI)’ (see Appendix A formore details). The value of SBSI can be considered a measure of the
overall effect of the nonlinearity of the system on its sustainability:SBSI>1 for unsustainable systems and SBSIb1 for sustainable ones.Using typical values of the scaling exponents–β≈1.2 and α≈0.8(see Bettencourt et al., 2007)–the index takes a simpler, approximateform of 1.755m0.75h−0.5 (compare m/h in the linear case).
2.2. Incorporating Connection to a Greater System
Truly closed communities are almost non-existent nowadays aspeople and resources move in and out of bounds, connecting the sys-tem under consideration to the outside (D'Odorico et al., 2010). To in-vestigate the effects of such connection, we further modify the systemof Eq. (1) as follows:
dYdt
¼ rY 1� YK
� �−HYNβ þ T
dNdt
¼HEYNβ−M
ENα þ I;
ð4Þ
where T represents trade (T>0 means import; Tb0 means export) ofresources and I represents movement of people (I>0 means immi-gration; Ib0 means emigration). To be sure, it does not escape usthat such connections are in fact more complex than can be captured

SξH
SξH
Uξ
SξL
SξL
0 0.5 1n
1.5 20
0.2
0.4
0.6
0.8
1
y
0 0.5 1n
1.5 20
0.2
0.4
0.6
0.8
1
y
0.6
0.8
1
y
b
c
a
125R. Muneepeerakul, M.R. Qubbaj / Ecological Economics 77 (2012) 123–128
by adding the two variables. A general form of the above system thatconsiders all components of complexity can be written as follows:
dYi
dt¼FY Yi;Ni;…ð ÞþΓT Y;N;…; tð Þ
dNi
dt¼FN Yi;Ni;…ð ÞþΓ I Y;N;…; tð Þ;
ð5Þ
with Y={Yi} and N={Ni}. The functions FY and FN represent the dy-namics of the resources (Yi) and the population (Ni) in local commu-nity i, respectively, while the second functions on the right hand side,ΓT and ΓI, represent the influence of global/network dynamics (com-plex movements and connections of resources and populationsthrough trade and humanmigration, respectively). However, our phi-losophy is that one should build intuitive insights from simplemodels, which can later be brought to bear on more complex, realisticsettings (see Final Remarks for some limitations and examples ofcomplexity). As will be shown shortly, the insights gained from thesystem of Eq. (6) (below), we believe, justify its simplicity. Non-dimensionalization of Eq. (4) yields:
dydτ
¼y 1−yð Þ−hynβ þ μ
dndτ
¼hynβ−mnα þ ξ;ð6Þ
where μ=T/rK, and ξ= IE/rK.In the following, Fig. 1b is used as a baseline case—an intrinsically
unsustainable system (SBSI > 1). Fig. 2 shows the effects of import(μ>0); and Fig. 3 shows the effects of immigration (ξ>0) on the dy-namics of such systems.
μ>0 “pushes” the y-isocline upward away from y=0. There existsa critical value of μ beyond which the y-isocline intersects with one ofthe n-isoclines, allowing for a stable equilibrium with positive popu-lation size (compare Figs. 1b and 2). Note that, however, the stablezero-population equilibrium still exists, and still is the outcome ofthe system if the population size is too low. In other words, the sys-tem experiences bifurcation and becomes bistable, having two stableequilibria, one with and the other without population.
In contrast, ξ>0 immediately eliminates the zero-populationequilibrium and gives rise to a positive-population one (althoughthe population size can be very small, depending on ξ). In a similarfashion to increasing μ, there exists a critical value of ξ beyondwhich a new stable equilibrium emerges with higher population.
0 0.5 1 1.5 20
0.2
0.4
0.6
0.8
1Sμ
0 Uμ
SμH
y
n
Fig. 2. Effects of import. Phase portraits of y and n under the following set of parame-ters: β=1.2, α=0.8, h=0.50, m=0.32 (i.e., the same as in Fig. 1b), ξ=0 andμ=0.08. S0
μ, SHμ , and Uμ denote the zero-population stable equilibrium, high-population stable equilibrium, and unstable equilibrium, respectively. The remaininglegend is the same as in Fig. 1. Import of resources can help sustain the otherwiseunsustainable system.
0 0.5 1 1.5 20
0.2
0.4
n
Fig. 3. Effects of immigration. Phase portraits of y and n under the following set of pa-rameters: β=1.2, α=0.8, h=0.50, m=0.32 (i.e., the same as in Fig. 1b) and μ=0.The different panels correspond to different levels of immigration: (a) ξ=0.008; (b)ξ=0.02; (c) ξ=0.03. SLξ, SHξ , and Uξ denote the low-population stable equilibrium,high-population stable equilibrium, and unstable equilibrium, respectively. Theremaining legend is the same as in Fig. 1. Note that, unlike the previous figures, thereis only one n-isocline represented by the black line. Immigration of people can helpsustain the otherwise unsustainable system and induce hysteresis effects as shown inFig. 5. Note also that there is in fact another unstable equilibrium at y=0, but wefocus only on those equilibria involved in the bifurcations.
That is, within this range of ξ, the system becomes bistable, havingtwo stable equilibria with low and high population sizes (Fig. 3b).As ξ becomes larger still, there is yet another critical value of ξ beyondwhich there is only the high-population equilibrium (Fig. 3c). Thesetransitions are discussed in detail in the following section.

Fig. 4. Import bifurcation diagrams for β=1.2, α=0.8, h=0.50, m=0.32, and ξ=0.Refer to Fig. 2's caption for definitions of S0μ, SHμ , and Uμ. μC is the critical value of μwhere the bifurcation occurs. Consider in conjunction with Fig. 2. The intrinsicallyunsustainable system becomes sustainable when it shifts from the zero-population sta-ble equilibrium S0
μ (red lines), crossing the unstable state Uμ (dashed lines) into thebasin of attraction of the positive-population equilibrium SH
μ (blue lines). This requiresthe coexistence of two conditions: 1) μ>μC (i.e., import has to be larger than a criticalvalue), and 2) a critical mass of people Uμ must populate the system.
0 0.01 0.02 0.03
0 0.01 0.02 0.03ξ
Uξ
Uξ
S ξL
SξL
SξH
S ξH
ξA
ξA
ξB
ξB0
0.2
0.4
0.4
0.6
0.8
1
0
0.2
0.6
0.8
1
y*n*
b
a
Fig. 5. Immigration bifurcation diagrams for β=1.2, α=0.8, h=0.50, m=0.32, andμ=0. Refer to Fig. 3's caption for definitions of SL
ξ, SH
ξ , and Uξ. ξA and ξB are the criticalvalues of i where the bifurcations occur. Consider in conjunction with Fig. 3. Sharp riseof population occurs when ξ>ξB where the system shifts from the low-populationequilibrium SL
ξto the high-population equilibrium SH
ξ . When ξbξA, a sharp drop of pop-ulation occurs where the system falls from SH
ξto SL
ξ.
126 R. Muneepeerakul, M.R. Qubbaj / Ecological Economics 77 (2012) 123–128
It is worth mentioning here that the functional form of SBSI (in-equality 3) will certainly be affected by the addition of import and im-migration components. However, its analytical exact form cannot beobtained, and hence, we did not discuss it further.
3. Discussion
The following discussion is based strictly on the assumptions andmathematical analysis of the simple model presented in this paper.Despite its simplicity, the model provides useful insights for tacklingmore complicated and realistic cases of how to sustain otherwiseunsustainable systems. We also point out some caveats and suggestfuture research directions.
3.1. Scaling
At a first glance, it may not be apparent why the super-linear scal-ing of the ability to extract resources and the sub-linear scaling of therequired resources for maintenance should together have negative ef-fects, namely the bifurcation that leads to a system without positivepopulation equilibria (Fig. 1b). To see this, it is helpful to interpretthe n-isocline, denoted by Fn(n) (see Appendix A), as the resource re-quirement for net population growth, and compare it to its counter-part in the linear system, y=m/h. That is, the population can grow(dn/dτ>0) only when y>Fn(n). Accordingly, from the population'sstandpoint, the scaling behaviors are beneficial, relative to the linear
case, if Fn(n)bm/h (reduced requirement). This is the case onlywhen n>1 (see Fig. 1).
β>1 implies that the harvesting ability increases relatively slowlyat low population and accelerates at high population, while αb1 im-plies that the resource requirement grows relatively fast at low pop-ulation and decelerates at high population. It turns out that, fornb1, these two nonlinear trends interplay with each other such thatmore resources than its linear counterpart are needed for net popula-tion growth; in fact, at very low population, the required resourcesexceed the carrying capacity (Y>K).
When the nonlinearity becomes strong enough (Fig. 1b)–SBSI,which depends on h and m as shown in inequality 3, exceeds 1–ex-tinction becomes the system's only outcome. If the resource is lessthan the requirement, the population will monotonically decline toextinction. If the resource initially exceeds the required amount, thepopulation initially grows. However, its super-linear increase in har-vesting ability rapidly drives the available resource down below therequired amount. From that point forward, the population monoton-ically declines as the resource renewal–along with the super-lineardecline in harvesting ability–is never fast enough to keep up withthe resource requirement (Fig. 1b).
3.2. Connection
Depending on its type and magnitude, connection may result inbeneficial or adverse effects on the system of interest. Here, we willfocus on the beneficial effects of connection–or more specifically, ofimport and immigration–which will be collectively referred to as

127R. Muneepeerakul, M.R. Qubbaj / Ecological Economics 77 (2012) 123–128
“borrowed sustainability.” This is because these connection effects arenot intrinsic to the system. In addition, and with a larger scope of agreater system, while import and immigration may help sustain thefocal system, they may reduce the sustainability at the sources.Once these sources need to maintain their own populations or simplyhave some conflict with the system under consideration, such con-nection components of import and immigration may be interrupted,leaving the system to rely on only its own resources.
As alluded to in the previous sections and in Figs. 2 and 3, importand immigration can induce qualitative changes in behavior of thesystem, i.e., bifurcation. However, these changes differ as illustratedin Figs. 4 and 5. While the system of Eq. (6) yields a rich suite of dy-namics, in the following paragraphs, we will focus on how importand immigration can help sustain the otherwise unsustainable sys-tem (i.e., SBSI > 1; μ; ξ≥0). Important features accompanying thebifurcation such as hysteresis and regime shifts (Folke et al., 2004;Scheffer and Carpenter, 2003; Scheffer et al., 2001) will be discussedin the context of resource-population dynamics.
Fig. 4 suggests that increasing import alone cannot help the in-trinsically unsustainable system. Two changes are needed, namelythe import must exceed a critical level (i.e., μ>μC) and a criticalmass of people (represented by the dashed line Uμ in Fig. 4) mustpopulate the system, for the system to escape the basin of attractionassociated with the zero-population equilibrium; missing either one,the other is simply an ineffective and wasteful effort. Once theseconditions are met, the system will eventually gravitate toward thepositive-population equilibrium SH
μ . This is reminiscent of the prov-erb: “Give a man a fish and you feed him for a day. Teach a manto fish and you feed him for a lifetime.” Having enough populationto achieve the harvesting ability necessary to maintain themselvesis analogous to “teaching a man to fish,” and import alone “givinghim a fish.” However, SHμ can only be sustained with constant im-port; when the import drops below the critical level (μbμC), the sys-tem will see a rapidly shrinking population, which will eventuallybecome extinct.
In Fig. 5, the bifurcation diagrams of the population and resourcesshow a “folding” behavior. This implies that for a certain immigrationrange (ξAbξbξB), the system has two stable states, separated by anunstable equilibrium that marks the border between the basins of at-traction of the stable states.
The presence of two positive stable states in Fig. 5 implies that,and in contrast to the case with increasing import in Fig. 4, increasingimmigration alone can help the intrinsically unsustainable systemavoid the zero-population equilibrium (although the population canbe low, i.e., SLξ). This is because, in this formulation, immigration hasdouble effects, both the direct effect of adding more people and theindirect one of increasing harvesting ability. Importantly, once theimmigration exceeds a critical level (ξ>ξB), population will sharplyrise and eventually approach the high-population equilibrium SH
ξ .Similar to import, if the immigration flux falls below the criticallevel (ξbξA), the population will sharply drop and return to thelow-population equilibrium SL
ξ. In other words, the intrinsicallyunsustainable system under consideration collapses when the greatersystem, in which it is embedded, refuses to lend support in the formof goods and labor. Note that the system does not shift from thehigh-population equilibrium SH
ξ back to the low-population equilibri-um when the immigration level falls below the critical value ξB, thecritical value for the sharp rise in population discussed above. Inother words, the system exhibits hysteresis.
3.3. Final Remarks
As a general good practice, one must recognize limitations of one'smethod; this is particularly true for a modeling exercise. As such, afew caveats are now in order. Let us first reiterate that the key pur-pose of this article is to point out the effects that scaling and
connection potentially have on problems of sustainable growth ofcommunities. Here, we did so by incorporating them in a simpleresource-population model. Scaling behaviors are also possible viathe connection (i.e., immigration/emigration and import/export)where we can extend our model considering the nonlinear depen-dence of these components on the population size. Other different,perhaps complementary, ways to incorporate these effects are ofcourse entirely possible. For example, the logistic renewal is usedhere because it has been commonly used with various types of re-sources, mostly biological, e.g., fishery and forest. It certainly is notappropriate for all types of resources; different renewal functionswill result in different dynamics and likely yield different conclusions.
Some of the above conclusions are consequences of our assump-tion that the same scaling behaviors, i.e., power laws with constantexponents, are valid for the entire range of population size. If thesescaling behaviors differ for different ranges of population size, theseconclusions must be revisited. This is particularly important at avery low population as a different behavior may prevent the popula-tion from becoming extinct. In addition, very low populations are sus-ceptible to various types of stochastic forces not included in thiscurrent model.
Another limitation is that this formulation does not take into ac-count the roles of learning and memory—the creativity or technologyobtained during the high-population period is not retained when thepopulation shrinks. With learning and memory, although the popula-tion falls to as low a level as before, they should be able to achievebetter productivity. In other words, there will be hysteresis in the har-vesting ability of the system. The dynamics will of course becomericher, and the analysis surely more involved.
We also envision that the next significant extension or develop-ment would be via making the flows of goods and people more ex-plicit functions of their respective networks. Complex networktheory has advanced and unified many fields (Albert and Barabási,2002; Barabási and Albert, 1999; Boccaletti et al., 2006; Strogatz,2001), and sustainability science can greatly benefit from it as well.Importantly, recent advances in network research include the con-cept of controllability of networks (Liu et al., 2011): a crucial chal-lenge here is whether such network controllability can betransferred to sustainability controllability. Notwithstanding theselimitations, it is clear from our simple approach that scaling and con-nection have profound effects on the resource-population dynamicsand should thus be taken seriously into account when one tacklessustainability-related problems.
Finally, empirical studies that investigate socio-economic systemsin the light shed by some of the insights reported here will certainlybe illuminating. For instance, many of the dynamical behaviors ob-served in the models, e.g., rapid decline in population, seem reminis-cent of the ongoing global phenomenon of ‘shrinking cities’ (see, e.g.,Audirac, 2007; Kabisch et al., 2006) and collapses of ancient civiliza-tions (McAnany and Yoffee, 2009). Data and analysis based on thepresented modeling framework would greatly benefit and influencemeaningful future research directions.
Appendix A. Deriving the Scaling-based Sustainability Index
While the standard procedure of local stability analysis can be fol-lowed, the scaling-based sustainability index (inequality 3) can morereadily be derived by considering the y- and n-isoclines—lines (in a2D system such as this) in the phase plane along which dy/dτ anddn/dτ, respectively, in the system of Eq. (2) equal to zero, i.e., nochange in these variables. There are two y-isoclines, y=0 and y=1−hnβ, and two n-isoclines, n=0 and y=m/(hnβ−α). Let Fy(n) de-note y=1−hnβ, and Fn(n) denote m/(hnβ−α). It then follows fromFig. 1 that the extinct-population equilibrium is the only stable equilib-rium if Fn(n)>Fy(n),∀n>0, or equivalently, G(n)>1,∀n>0, whereG(n)=m/(hnβ−α)+hnβ. This is then equivalent to minn>0 G(n)>1.

128 R. Muneepeerakul, M.R. Qubbaj / Ecological Economics 77 (2012) 123–128
G n̂ð Þ ¼ minn>0 G nð Þ if
G′ n̂ð Þ ¼ − β−αð Þmhn̂− β−αþ1ð Þ þ βhn̂β−1 ¼ 0 ðA:1Þ
and
G″ n̂ð Þ ¼ β−αð Þ β−α þ 1ð Þmhn̂− β−αþ2ð Þ þ β β−1ð Þhn̂β−2
> 0: ðA:2Þ
The first condition yields
n̂ ¼ mh2
1−αβ
� �� � 12β−α
: ðA:3Þ
For αb1bβ (the cases we focus on), G″(n)>0 ,∀n>0. Hence, thesecond condition is satisfied. Therefore, G n̂ð Þ is indeed minn>0 G(n).Plugging n̂ into G(n) yields the expression on the left-hand side ofthe inequality 3, which we use to define the scaling-based sustain-ability index.
References
Albert, R., Barabási, A.L., 2002. Statistical mechanics of complex networks. Reviews ofModern Physics 74, 47–97.
Audirac, I., 2007. Urban shrinkage amid fast metropolitan growth (two faces of con-temporary urbanism). International Symposium on “The future of Shrinking Cities:Problems, Patterns, and Strategies of Urban Transformation in a Global Context”.Berkeley, California. February.
Barabási, A.L., Albert, R., 1999. Emergence of scaling in random networks. Science 286,509–512.
Batty, M., 1995. Fractals — new ways of looking at cities. Nature 377 (6550), 574.Batty, M., 2008. The size, scale, and shape of cities. Science 319 (5864), 769–771.Bettencourt, L.M.A., Lobo, J., Helbing, D., Kühnert, C., West, G.B., 2007. Growth, innova-
tion, scaling, and the pace of life in cities. Proceedings of the National Academy ofSciences of the United States of America 104 (17), 7301–7306.
Boccaletti, S., Latora, V., Moreno, Y., Chavez, M., Hwang, D.-U., 2006. Complex net-works: structure and dynamics. Physics Reports 424 (4–5), 175–308.
Castles, S., 2002. Migration and community formation under conditions of globaliza-tion. International Migration Review 36, 1143–1168.
Clark, C., 1990. Mathematical Bioeconomics: the Optimal Management of Renewal Re-sources, 2nd Edition. Wiley, New York, USA.
D'Odorico, P., Laio, F., Ridolfi, L., 2010. Does globalization of water reduce societal resil-ience to drought? Geophysical Research Letters 37.
Fan, M., Wang, K., 1998. Optimal harvesting policy for single population with periodiccoefficients. Mathematical Biosciences 152 (2), 165–177.
Folke, C., Carpenter, S., Walker, B., Scheffer, M., Elmqvist, T., Gunderson, L., Holling, C.,2004. Regime shifts, resilience, and biodiversity in ecosystemmanagement. AnnualReview of Ecological Systems 35, 557–581.
Kabisch, S., Haase, A., Haase, D., July 2006. Beyond growth — urban development inshrinking cities as a challenge for modeling approaches. In: Voinov, A., Jakeman,A., Rizzoli, A. (Eds.), Proceedings of the IEMSs Third Biennial Meeting: “Summiton Environmental Modelling and Software”. International Environmental Model-ling and Software Society, Burlington, USAhttp://www.iemss.org/iemss2006/sessions/all.html. cD ROM.
Kar, T.K., 2006. Modelling and analysis of a harvested prey–predator system incorpo-rating a prey refuge. Journal of Computational and Applied Mathematics 185,19–33.
Kar, T., Matsuda, H., 2007. Sustainable management of a fishery with a strong allee ef-fect. Trends in Applied Sciences Research 2, 271–283.
Liu, Y.-Y., Slotine, J.-J., Barabási, A.-L., 2011. Controllability of complex networks. Nature473 (7346), 167–173.
Marshall, J.D., 2007. Urban land area and population growth: a new scaling relationshipfor metropolitan expansion. Urban Studies 44 (10), 1889–1904.
McAnany, P.A., Yoffee, N. (Eds.), 2009. Questioning Collapse: Human Resilience, Eco-logical Vulnerability, and the Aftermath of Empire. Cambridge University Press.
Romer, P.M., 1994. The origins of endogenous growth. Journal of Economic Perspec-tives 8 (1), 3–22.
Scheffer, M., Carpenter, S., 2003. Catastrophic regime shifts in ecosystems: linking the-ory to observation. Trends in Ecology & Evolution 18, 648–656.
Scheffer, M., Carpenter, S., Foley, J., Folke, C., Walker, B., 2001. Catastrophic shifts inecosystems. Nature 413 (6856), 591–596.
Strogatz, S.H., 2001. Exploring complex networks. Nature 410, 268–276.Vanderheiden, S., 2008. Two conceptions of sustainability. Political Studies 56 (2),
435–455.Wolf, S.R., 2007. Shifting tides: migration in the era of globalization, global conflict, and
environmental collapse. Forum on Public Policy: a Journal of the Oxford RoundTablehttp://forumonpublicpolicy.com/archivesum07/wolf.pdf.
Young, R.F., 2009. Interdisciplinary foundations of urban ecology. Urban Ecosystems12, 311–331.
Zhang, J., Yu, T., 2010. Allometric scaling of countries. Physica A—Statistical Mechanicsand Its Applications 389 (21), 4887–4896.
Zhang, X., Shuai, Z., Wang, K., 2003. Optimal impulsive harvesting policy for single pop-ulation. Nonlinear Analysis: Real World Applications 4, 639–651.
Related Documents