The effect of rainstorm movement on urban drainage network runoff hydrographs Yongwon Seo* and Arthur R. Schmidt Department of Civil and Environmental Engineering, University of Illinois at Urbana-Champaign, 205 North Mathews Ave., Urbana, IL, 61801, USA Abstract: This article explores the relations between network properties and the effect from moving rainstorms in terms of the peak response and time to centroid of hydrographs. A simple conceptual rectangular catchment is introduced with different configurations of drainage network simulated by the Gibbs stochastic model. The efficiency of the urban pipe networks varies widely compared with natural river networks; hence, the Gibbs model can be an appropriate approach to represent the network properties in urban drainage system. Simple cases of rainstorms moving with upstream and downstream directions and different speeds are considered to investigate the effect of rainstorm movement on urban drainage network runoff hydrographs. The results indicate that the effect of the direction and speed of the rainstorm movement varies significantly depending on the network properties. The relationship between storm speed and direction and the change in the peak runoff is dependent on the network configuration and network efficiency. In contrast to previous studies, this study indicates that the speed and direction of the rainfall movement that produces the maximum peak discharge changes depending on the network configuration. Copyright © 2011 John Wiley & Sons, Ltd. KEY WORDS rainstorm movement; runoff hydrograph; urban drainage network; rainfall variability Received 16 February 2011; Accepted 1 November 2011 INTRODUCTION The prediction and estimation of runoff has been being a long-standing topic of hydrology for the purpose of water resources management both in quality and quantity, flood control and ecological and environmental issues. It is well recognized that the surface runoff from a watershed varies with the hydro-meteorological characteristics of the rainfall and the physiographic properties of the watershed (Yen and Chow, 1969). The factors affecting a stream- flow hydrograph can be categorized into (i) watershed characteristics, (ii) storm precipitation dynamics, (iii) infiltration and (iv) antecedent conditions (Singh, 1997). For a given amount of rainfall and duration, the temporal and spatial distributions of the rainfall vary with the movement of a rainstorm, which results in significant difference in response at the outlet of a watershed in terms of runoff hydrographs. Storm movement is the norm rather than the exception (Singh, 1997). Moreover, there exists a directional preference of rainstorm movement. Huff (1979) found that 84% of severe heavy rainstorms exhibited motion with a westerly component. Although the directional preferences of moving rainstorms have been being widely recognized (Huff, 1979; Shearman, 1977; Upton, 2002), the storm movement and the subsequent rainfall variation are hardly regarded in the design process of urban drainage networks. In view of maximizing the effective- ness of urban drainage network and minimizing potential avoidable risks, it is necessary to consider the effect of the moving rainstorms. The effect of moving rain possibly needs to be used to improve design processes for urban drainage network. A general relationship between the storm movement dynamics and the hydrograph is crucial to accomplish this. The direct influence of rainfall movement on the shape of the runoff hydrograph has been recognized for a long time (Maksimov, 1964; Yen and Chow, 1968; Wilson et al., 1979; Jensen, 1984; Niemczynowicz, 1991; Singh, 1998). Researchers have considered the rainstorm direc- tions (Marcus, 1968; Yen and Chow, 1969; Surkan, 1974; Foroud et al., 1984; Jensen, 1984; Niemczynowicz, 1991; Andersen et al., 1991; Singh, 1998; de Lima and Singh, 2002, 2003; Morin et al., 2006) and speed (Marcus, 1968; Yen and Chow, 1969; Surkan, 1974; Foroud et al., 1984; Jensen, 1984; de Lima and Singh, 2002). Rainfall intensities (Yen and Chow, 1969; Morin et al., 2006), surface slopes (Yen and Chow, 1969; de Lima and Singh, 2003) and shapes of hyetographs (de Lima and Singh, 2002) were also considered as affecting factors to the runoff hydrographs. Typically, compared with a storm moving upstream, a storm moving downstream direction shows later peak, greater peak discharge, steeper rising limb and shorter base time. However, previous studies and research related to moving storms generally focussed on the response of a specific catchment rather than generalizing to a variety of range of catchments. Therefore, it is difficult to extrapolate the results from these studies describing the effect of storm *Correspondence to: Yongwon Seo, Department of Civil and Environmental Engineering, University of Illinois at Urbana-Champaign, 205 North Mathews Ave., Urbana, IL 61801-2352, USA. E-mail: [email protected] HYDROLOGICAL PROCESSES Hydrol. Process. (2011) Published online in Wiley Online Library (wileyonlinelibrary.com) DOI: 10.1002/hyp.8412 Copyright © 2011 John Wiley & Sons, Ltd.

Welcome message from author
This document is posted to help you gain knowledge. Please leave a comment to let me know what you think about it! Share it to your friends and learn new things together.
Transcript
HYDROLOGICAL PROCESSESHydrol. Process. (2011)Published online in Wiley Online Library(wileyonlinelibrary.com) DOI: 10.1002/hyp.8412
The effect of rainstorm movement on urban drainage networkrunoff hydrographs
Yongwon Seo* and Arthur R. SchmidtDepartment of Civil and Environmental Engineering, University of Illinois at Urbana-Champaign, 205 North Mathews Ave., Urbana, IL, 61801, USA
*CEngAvE-m
Co
Abstract:
This article explores the relations between network properties and the effect from moving rainstorms in terms of the peakresponse and time to centroid of hydrographs. A simple conceptual rectangular catchment is introduced with differentconfigurations of drainage network simulated by the Gibbs stochastic model. The efficiency of the urban pipe networks varieswidely compared with natural river networks; hence, the Gibbs model can be an appropriate approach to represent the networkproperties in urban drainage system. Simple cases of rainstorms moving with upstream and downstream directions and differentspeeds are considered to investigate the effect of rainstorm movement on urban drainage network runoff hydrographs. The resultsindicate that the effect of the direction and speed of the rainstorm movement varies significantly depending on the networkproperties. The relationship between storm speed and direction and the change in the peak runoff is dependent on the networkconfiguration and network efficiency. In contrast to previous studies, this study indicates that the speed and direction of therainfall movement that produces the maximum peak discharge changes depending on the network configuration. Copyright ©2011 John Wiley & Sons, Ltd.
KEY WORDS rainstorm movement; runoff hydrograph; urban drainage network; rainfall variability
Received 16 February 2011; Accepted 1 November 2011
INTRODUCTION
The prediction and estimation of runoff has been being along-standing topic of hydrology for the purpose of waterresources management both in quality and quantity, floodcontrol and ecological and environmental issues. It is wellrecognized that the surface runoff from a watershed varieswith the hydro-meteorological characteristics of therainfall and the physiographic properties of the watershed(Yen and Chow, 1969). The factors affecting a stream-flow hydrograph can be categorized into (i) watershedcharacteristics, (ii) storm precipitation dynamics, (iii)infiltration and (iv) antecedent conditions (Singh, 1997).For a given amount of rainfall and duration, the temporaland spatial distributions of the rainfall vary with themovement of a rainstorm, which results in significantdifference in response at the outlet of a watershed in termsof runoff hydrographs.Storm movement is the norm rather than the exception
(Singh, 1997). Moreover, there exists a directionalpreference of rainstorm movement. Huff (1979) foundthat 84% of severe heavy rainstorms exhibited motionwith a westerly component. Although the directionalpreferences of moving rainstorms have been being widelyrecognized (Huff, 1979; Shearman, 1977; Upton, 2002),the storm movement and the subsequent rainfall variationare hardly regarded in the design process of urban
orrespondence to: Yongwon Seo, Department of Civil and Environmentalineering, University of Illinois at Urbana-Champaign, 205 North Mathewse., Urbana, IL 61801-2352, USA.ail: [email protected]
pyright © 2011 John Wiley & Sons, Ltd.
drainage networks. In view of maximizing the effective-ness of urban drainage network and minimizing potentialavoidable risks, it is necessary to consider the effect of themoving rainstorms. The effect of moving rain possiblyneeds to be used to improve design processes for urbandrainage network. A general relationship between thestorm movement dynamics and the hydrograph is crucialto accomplish this.The direct influence of rainfall movement on the shape
of the runoff hydrograph has been recognized for a longtime (Maksimov, 1964; Yen and Chow, 1968; Wilsonet al., 1979; Jensen, 1984; Niemczynowicz, 1991; Singh,1998). Researchers have considered the rainstorm direc-tions (Marcus, 1968; Yen and Chow, 1969; Surkan, 1974;Foroud et al., 1984; Jensen, 1984; Niemczynowicz, 1991;Andersen et al., 1991; Singh, 1998; de Lima and Singh,2002, 2003; Morin et al., 2006) and speed (Marcus, 1968;Yen and Chow, 1969; Surkan, 1974; Foroud et al., 1984;Jensen, 1984; de Lima and Singh, 2002). Rainfallintensities (Yen and Chow, 1969; Morin et al., 2006),surface slopes (Yen and Chow, 1969; de Lima and Singh,2003) and shapes of hyetographs (de Lima and Singh,2002) were also considered as affecting factors to therunoff hydrographs. Typically, compared with a stormmoving upstream, a storm moving downstream directionshows later peak, greater peak discharge, steeper risinglimb and shorter base time.However, previous studies and research related to
moving storms generally focussed on the response of aspecific catchment rather than generalizing to a variety ofrange of catchments. Therefore, it is difficult to extrapolatethe results from these studies describing the effect of storm
Y. SEO AND A. R. SCHMIDT
movement to different watersheds. In contrast, this studyexplores the idea that the effect of rainstorm movementmight be different for different network configurations.Although the relationship between the topology of anetwork and the hydrologic response has been recognizedand led to the development of the geomorphologicalinstantaneous unit hydrograph model (Rodriguez-Iturbeand Valdes, 1979; Gupta et al., 1980), a direct relationshipbetween the effect of the moving rainstorm and theconfiguration of network has not been pursued.To identify and categorize the network according to its
configuration, we adopted stochastic network models inthis study: the Scheidegger model (Scheidegger, 1967), theuniform model (Leopold and Langbein, 1962; Karlingerand Troutman, 1989) and the Gibbs model (Troutman andKarlinger, 1992) based on Gibbs’ measure (Ising, 1925;Kindermann and Snell, 1980). In contrast to the randommodels (Scheidegger, 1967; Karlinger and Troutman,1989), which were based on an assumption of theabsence of environmental controls, the Gibbs modelintroduced a control over the overall sinuosity of anetwork. This enables us to gain insight into geomor-phologically significant factors such as drainage networkefficiency, drainage density and variation of networktopology with basin shape and relief (Troutman andKarlinger, 1992).
METHODS
Stochastic network model
A stochastic network model on the basis of Gibbs’distribution suggested by Troutman and Karlinger (1992) isused in this study to identify and categorize a network. TheScheidegger model and the uniform model are the specialcases of the Gibbs model that correspond to the Gibbsparameter (b) equal to infinity and zero, respectively.In the following description, terminology based on
graph theory is used; a graph is acyclic if it has no cycles.A tree is a connected acyclic graph in which any twopoints (or vertices) are connected by exactly one simplepath and a spanning tree is an acyclic tree connecting allthe points in the network without loops (or cycles). Twospanning trees are adjacent if one may be obtained fromthe other by randomly selecting one point, defining onenew direction from that point to produce a new spanningtree. The notion of adjacency corresponds to the idea of‘minimal change’ in graph structure discussed by Aldous(1987), a change in direction of a link in this study. Togenerate a stochastic network model, a Markov chain isdefined with the spanning trees S as the state space. Let sbelong to S and two trees, s1 and s2, be adjacent. Then, thetransition probability from s1 to s2 can be defined asfollows (Troutman and Karlinger, 1992):
Rs1s2
r�1 min 1; e�b H s2ð Þ�H s1ð Þ½ �� �s2 2 N s1ð Þ
1�Ps2N s1ð Þ
Rs1s s2 ¼ s1
0 otherwise
8><>: (1)
Copyright © 2011 John Wiley & Sons, Ltd.
where N(s1) is the set of trees adjacent to s1, and b is aparameter that represents the extent to which the sinuosityof the network is reflected in generation of the newspanning tree, s2. For example, when b is equal to zero,the sinuosity has nothing to do with the transitionprobability, and the transition probabilities are same inall possible directions, which is identical to the uniformdistribution. The maximum degree of the points in S, r, isdefined as
r ¼ maxs2S
N sð Þj j (2)
The degree r means the maximum number of directionthat can be selected except the existing direction. TheMarkov chain with this transition probability has a stationarydistribution given as Gibbs’ distribution (Troutman andKarlinger 1992), which has the form of Gibbs’ measurewhere bH(s) represents a positive energy function,
Pb sf g ¼ C bð Þ½ ��1e�bH sð Þ (3)
where s belongs to S.C(b) is a normalization factor defined tomake the sum of the distribution be one,
C bð Þ ¼Xs2S
e�bH sð Þ (4)
H(s) is a measure of the sinuosity of a given spanningtree, s,
H sð Þ ¼X
v2V Bð Þds vð Þ �
Xv2V Bð Þ
dB vð Þ (5)
where v is a point of a finite and connected graphB, andV(B)is the set of the total points of B. ds is the distance to anoutlet along s from v, whereas dB is the shortest distance tothe outlet from v.The Scheidegger model and uniform distribution model
are also used in this study to examine their relationshipwith the Gibbs model and also to explore the networkproperties of natural river networks. The Scheidegger(1967) model is a directed self-avoiding random walkmodel on a lattice with flow from each point beingallowed in only two orthogonal and downstream direc-tions, each with equal probability. Four directions wereused in this study. The uniform model is defined on alattice with flow allowed in each of four possibledirections with equal probability. The uniform model isgenerated by starting from the outlet point and proceedingupstream with uniform distribution until it reaches theboundary of the network or the network cannot beextended because all adjacent points have been visitedbefore. Then, a point is selected randomly among thepoints not visited before, and the same procedure isrepeated as before. It can be started from the outlet pointagain, but the reason an unvisited point is used here is toreduce the total time needed to generate the network.Again, the steps are repeated until having every singlepoint in the entire domain visited. The uniform model canbe also generated with the Gibbs model when b equals to
Hydrol. Process. (2011)DOI: 10.1002/hyp
EFFECT OF RAINSTORM MOVEMENT ON URBAN DRAINAGE NETWORK
zero (meaning every direction has equal probability). On theother hand, the Scheidegger model can be represented as theother extreme of the Gibbs model when b tends to infinity.The procedure used in this study to generate a Gibbs’
network given a parameter, b, is as follows: first, start froma network, s1, generated by the uniform model andrandomly select a point, v, in the network and assign anew flow direction from v to generate adjacent network s2.Second, check whether the new network, s2, is acyclic. Ifnot, repeat the first step. Third, draw a random probability xbetween zero and one and check that x is greater thane�b[ΔH] where ΔH is equal to H(s2) � H(s1). If this holds,then take s2 as a new network. In the next step, use s2 as thestarting network and repeat these steps sufficiently numberof times that the resulting tree has the distribution close tothe stationary Gibbs’ distribution. In this study, the numberof iteration to produce the Gibbs network model was set totwo thousand, which is large compared with the totalnumber of points in the network matrix, sixty four points.
Test catchment and rainfall
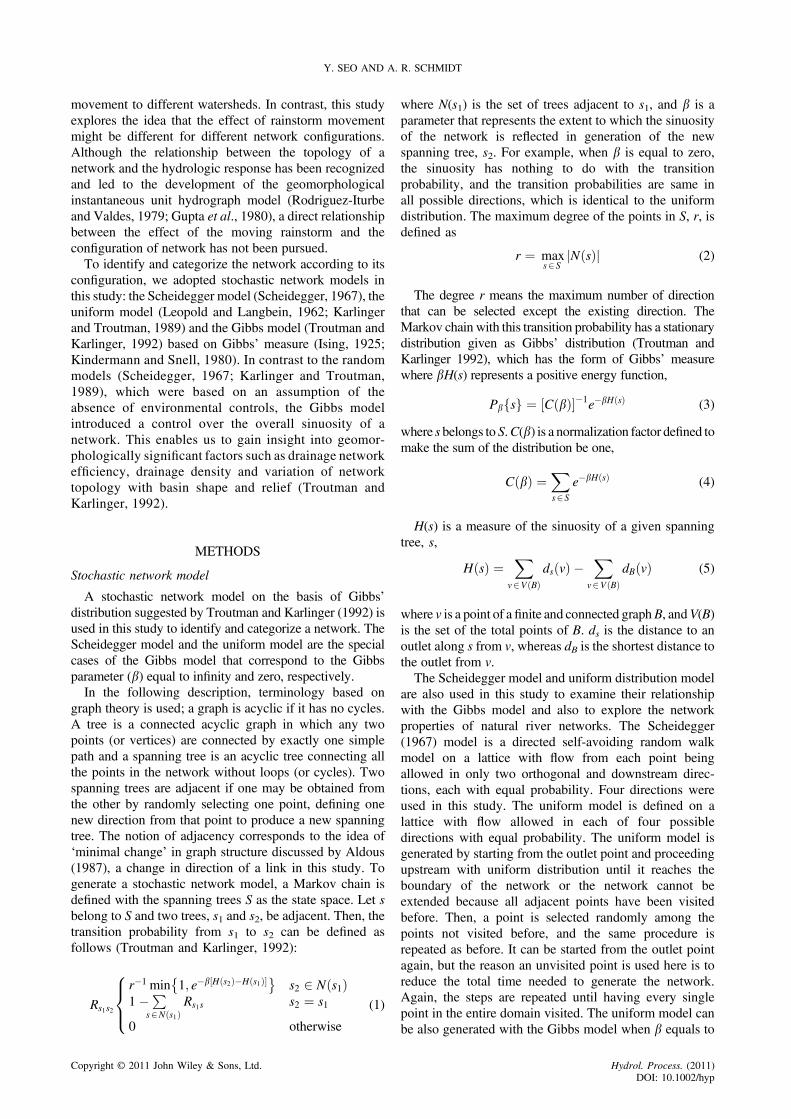
In this study, the test basin is represented by a squarelattice (8 � 8) with the bottom rightmost point as an outletpoint. To assess the effect of rainstorm movement, twotypes of rainfall are considered with different directionsand speeds. First, rainfall input is a stationary rainfall thatis uniform throughout the basin. Second, rainfall input ismoving rainstorm with different speeds. A rainfall stripwith unit width (1/8 of the total width of the basin)moving in a given direction is assumed (Figure 1). Twodifferent directions are examined; one moving to thedownstream and the other moving to the upstream asshown in Figures 1a and 1b, respectively.The width function is used to define hydrologic
response of the catchment, defined as follows: for agiven flow distance x, the width function L(x) is equal tothe number of points at distance x from the outlet. Underthe assumption of a simple routing concerning convection
Figure 1. Direction of moving rainstorms: (a) a storm m
Copyright © 2011 John Wiley & Sons, Ltd.
only through the channel network with a spatially uniformflow velocity, the width function can be scaled to beidentical to the shape of unit hydrograph (Troutman andKarlinger, 1985).
L xð Þ ¼ N v xð Þf g; x ¼ x1; x2; . . . ; xn (6)
where L(x) is the width function for network, which canbe obtained by counting the number of the grid pointswith distance x from the outlet. v(x) is the grid point ofwhich distance from the outlet is equal to x. xn is thelongest distance from the outlet. A width function isnewly defined as a time-dependent function incorporatinga rainfall excess given distance x at time t.
LI x; tð Þ ¼Pi;j
rij x; tð Þ; x ¼ x1; x2; . . . ; xn (7)
where rij(x, t) is the rainfall intensity at a grid point (i, j)of which distance from the outlet is x at time t. Then,assuming convection only for channel routing, theresponse function at the outlet for each time step can beexpressed as follows:
Q tð Þ ¼ZZ
LI x; tð Þ�d t � t� x=cð Þdxdt (8)
where c is a constant propagation celerity. In a discreteform, Equation (9) can be written as
Q tð Þ ¼Xmi¼1
Xnj¼1
LI xj; ti� ��d t � ti � xj=c
� �Δx
!Δt (9)
WIDTH FUNCTION AND HACK’S EXPONENT FORSTOCHASTIC NETWORKS
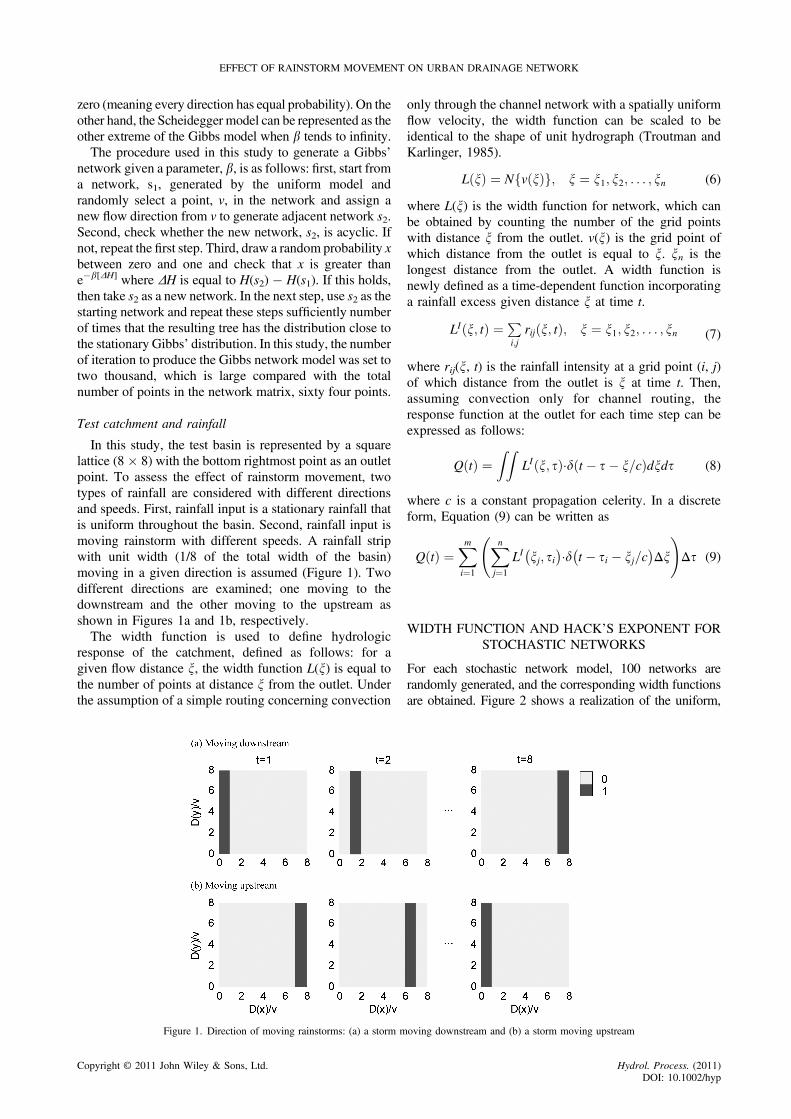
For each stochastic network model, 100 networks arerandomly generated, and the corresponding width functionsare obtained. Figure 2 shows a realization of the uniform,
oving downstream and (b) a storm moving upstream
Hydrol. Process. (2011)DOI: 10.1002/hyp
Figure 2. Realization of the stochastic network model and width function for uniform instantaneous rainfall: (a) uniform, (b) Scheidegger and (c) Gibbs (b = 1.0)
Y. SEO AND A. R. SCHMIDT
Scheidegger and the Gibbs networkmodel, respectively, andtheir corresponding width functions. For the Scheideggermodel, the distance from the outlet is exactly the same withthe shortest distance from the outlet at every grid point,which means that there is no sinuosity in the Scheideggernetwork model. The number next to the each grid point is thedistance from the outlet. In Figure 2b, the distance is equal tothe shortest distance from the outlet at every point in thenetwork for the Scheidegger model.The uniform model is highly sinuous and less realistic
than natural river network, whereas in terms of peak anddistance to the peak, the Scheidegger model shows thegreatest efficiency and shortest distance from the outletbecause H(s) is always zero in the Scheidegger model.The Gibbs model theoretically ranges from the uniform tothe Scheidegger model depending on the value of b.
Copyright © 2011 John Wiley & Sons, Ltd.
Hack’s (1957) exponent is one of the measures thatreveal geometrical characteristics of a network. Hack’sexponent describes the relationship between the length oflongest flow path and the area of the watershed. The lengthof the longest flow path is a key component of the widthfunction. Table 1 lists the values of the Hack’s exponent,characterizing the topology of the networks generated bythe uniform model, the Gibbs model with b and theScheidegger model, respectively. For each model, 100networks are generated from which an average value of theHack’s exponent is obtained with 95% confidence interval.Hack’s exponent was given as 0.6 for natural rivernetworks (Hack, 1957). Troutman and Karlinger (1992)estimated b of the natural watersheds in Montana andfound that the estimated values of b lie between 0.2 and2.21 and the averaged value of estimated b is equal to 0.92
Hydrol. Process. (2011)DOI: 10.1002/hyp
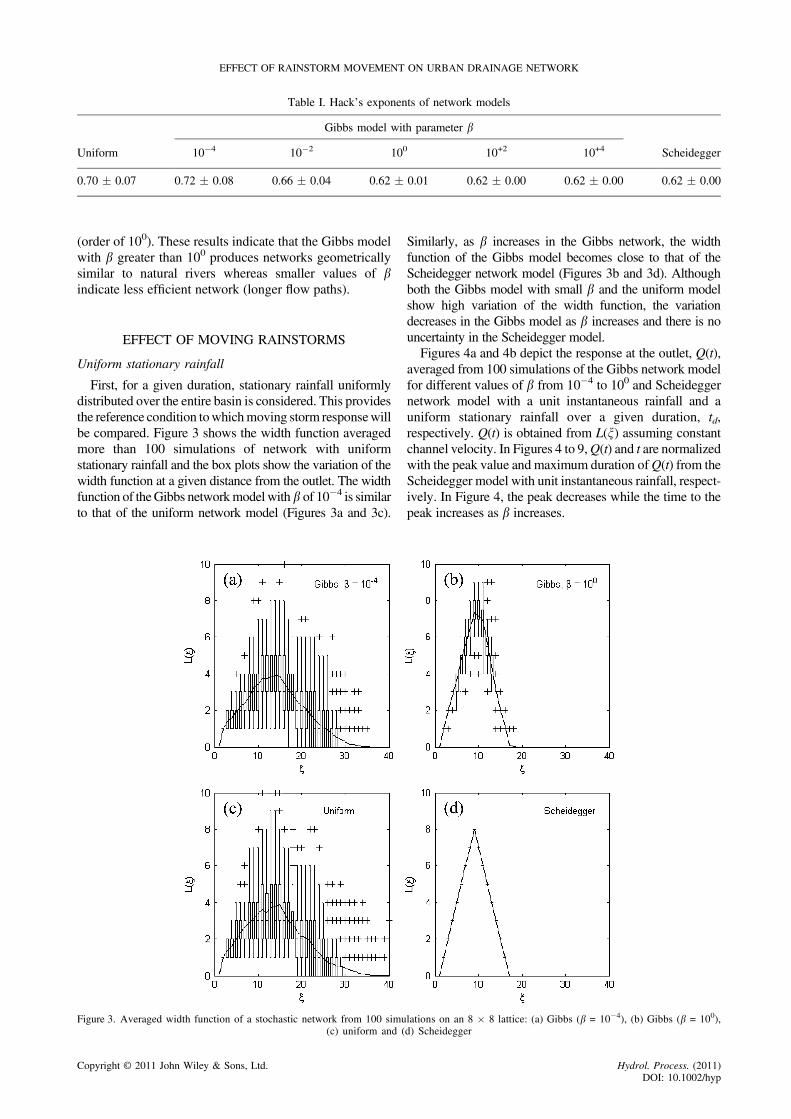
Table I. Hack’s exponents of network models
Uniform
Gibbs model with parameter b
Scheidegger10�4 10�2 100 10+2 10+4
0.70 � 0.07 0.72 � 0.08 0.66 � 0.04 0.62 � 0.01 0.62 � 0.00 0.62 � 0.00 0.62 � 0.00
EFFECT OF RAINSTORM MOVEMENT ON URBAN DRAINAGE NETWORK
(order of 100). These results indicate that the Gibbs modelwith b greater than 100 produces networks geometricallysimilar to natural rivers whereas smaller values of bindicate less efficient network (longer flow paths).
EFFECT OF MOVING RAINSTORMS
Uniform stationary rainfall
First, for a given duration, stationary rainfall uniformlydistributed over the entire basin is considered. This providesthe reference condition towhichmoving storm responsewillbe compared. Figure 3 shows the width function averagedmore than 100 simulations of network with uniformstationary rainfall and the box plots show the variation of thewidth function at a given distance from the outlet. The widthfunction of theGibbs networkmodel withb of 10�4 is similarto that of the uniform network model (Figures 3a and 3c).
Figure 3. Averaged width function of a stochastic network from 100 simu(c) uniform and (
Copyright © 2011 John Wiley & Sons, Ltd.
Similarly, as b increases in the Gibbs network, the widthfunction of the Gibbs model becomes close to that of theScheidegger network model (Figures 3b and 3d). Althoughboth the Gibbs model with small b and the uniform modelshow high variation of the width function, the variationdecreases in the Gibbs model as b increases and there is nouncertainty in the Scheidegger model.Figures 4a and 4b depict the response at the outlet, Q(t),
averaged from 100 simulations of the Gibbs network modelfor different values of b from 10�4 to 100 and Scheideggernetwork model with a unit instantaneous rainfall and auniform stationary rainfall over a given duration, td,respectively. Q(t) is obtained from L(x) assuming constantchannel velocity. In Figures 4 to 9,Q(t) and t are normalizedwith the peak value and maximum duration ofQ(t) from theScheidegger model with unit instantaneous rainfall, respect-ively. In Figure 4, the peak decreases while the time to thepeak increases as b increases.
lations on an 8 � 8 lattice: (a) Gibbs (b = 10�4), (b) Gibbs (b = 100),d) Scheidegger
Hydrol. Process. (2011)DOI: 10.1002/hyp
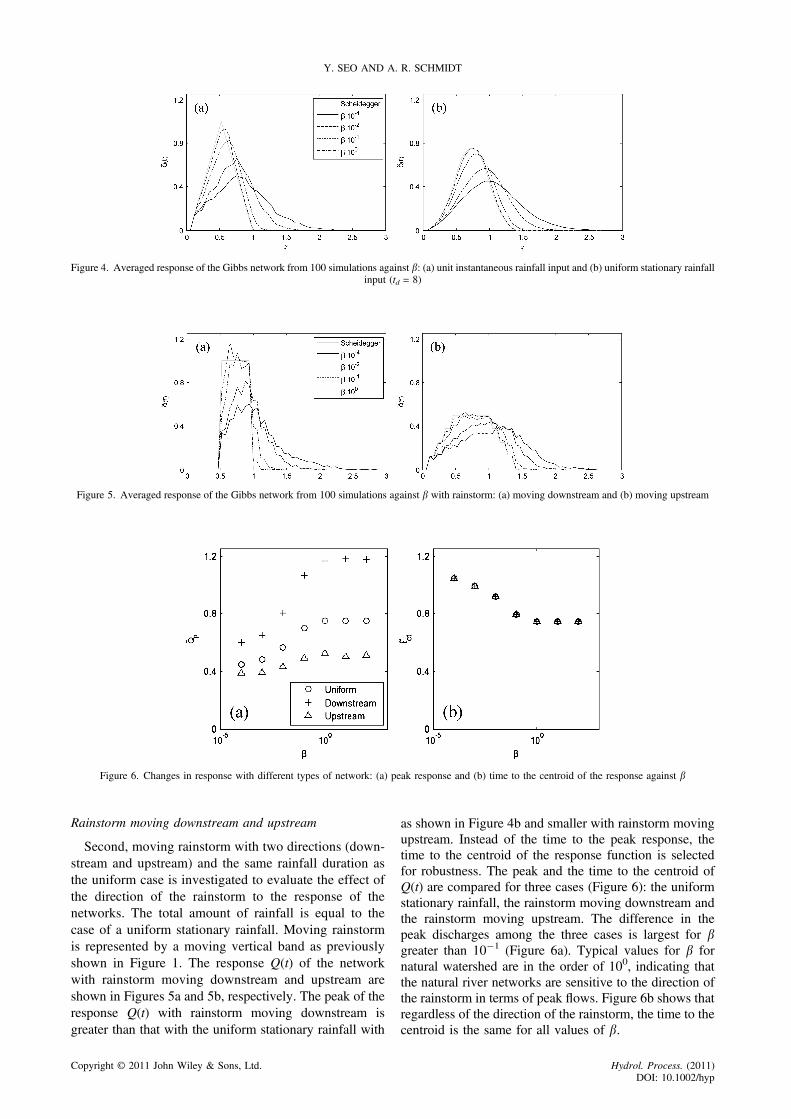
Figure 4. Averaged response of the Gibbs network from 100 simulations against b: (a) unit instantaneous rainfall input and (b) uniform stationary rainfallinput (td = 8)
Figure 5. Averaged response of the Gibbs network from 100 simulations against b with rainstorm: (a) moving downstream and (b) moving upstream
Figure 6. Changes in response with different types of network: (a) peak response and (b) time to the centroid of the response against b
Y. SEO AND A. R. SCHMIDT
Rainstorm moving downstream and upstream
Second, moving rainstorm with two directions (down-stream and upstream) and the same rainfall duration asthe uniform case is investigated to evaluate the effect ofthe direction of the rainstorm to the response of thenetworks. The total amount of rainfall is equal to thecase of a uniform stationary rainfall. Moving rainstormis represented by a moving vertical band as previouslyshown in Figure 1. The response Q(t) of the networkwith rainstorm moving downstream and upstream areshown in Figures 5a and 5b, respectively. The peak of theresponse Q(t) with rainstorm moving downstream isgreater than that with the uniform stationary rainfall with
Copyright © 2011 John Wiley & Sons, Ltd.
as shown in Figure 4b and smaller with rainstorm movingupstream. Instead of the time to the peak response, thetime to the centroid of the response function is selectedfor robustness. The peak and the time to the centroid ofQ(t) are compared for three cases (Figure 6): the uniformstationary rainfall, the rainstorm moving downstream andthe rainstorm moving upstream. The difference in thepeak discharges among the three cases is largest for bgreater than 10�1 (Figure 6a). Typical values for b fornatural watershed are in the order of 100, indicating thatthe natural river networks are sensitive to the direction ofthe rainstorm in terms of peak flows. Figure 6b shows thatregardless of the direction of the rainstorm, the time to thecentroid is the same for all values of b.
Hydrol. Process. (2011)DOI: 10.1002/hyp
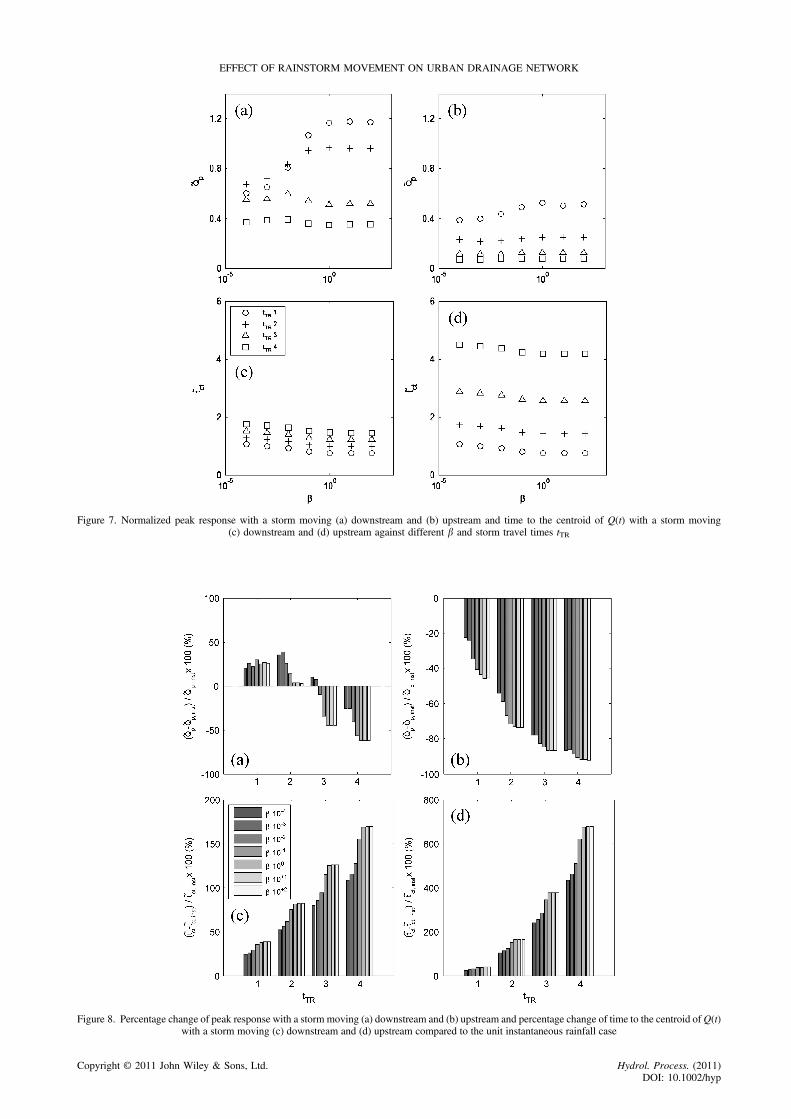
Figure 7. Normalized peak response with a storm moving (a) downstream and (b) upstream and time to the centroid of Q(t) with a storm moving(c) downstream and (d) upstream against different b and storm travel times tTR
Figure 8. Percentage change of peak response with a storm moving (a) downstream and (b) upstream and percentage change of time to the centroid ofQ(t)with a storm moving (c) downstream and (d) upstream compared to the unit instantaneous rainfall case
EFFECT OF RAINSTORM MOVEMENT ON URBAN DRAINAGE NETWORK
Copyright © 2011 John Wiley & Sons, Ltd. Hydrol. Process. (2011)DOI: 10.1002/hyp
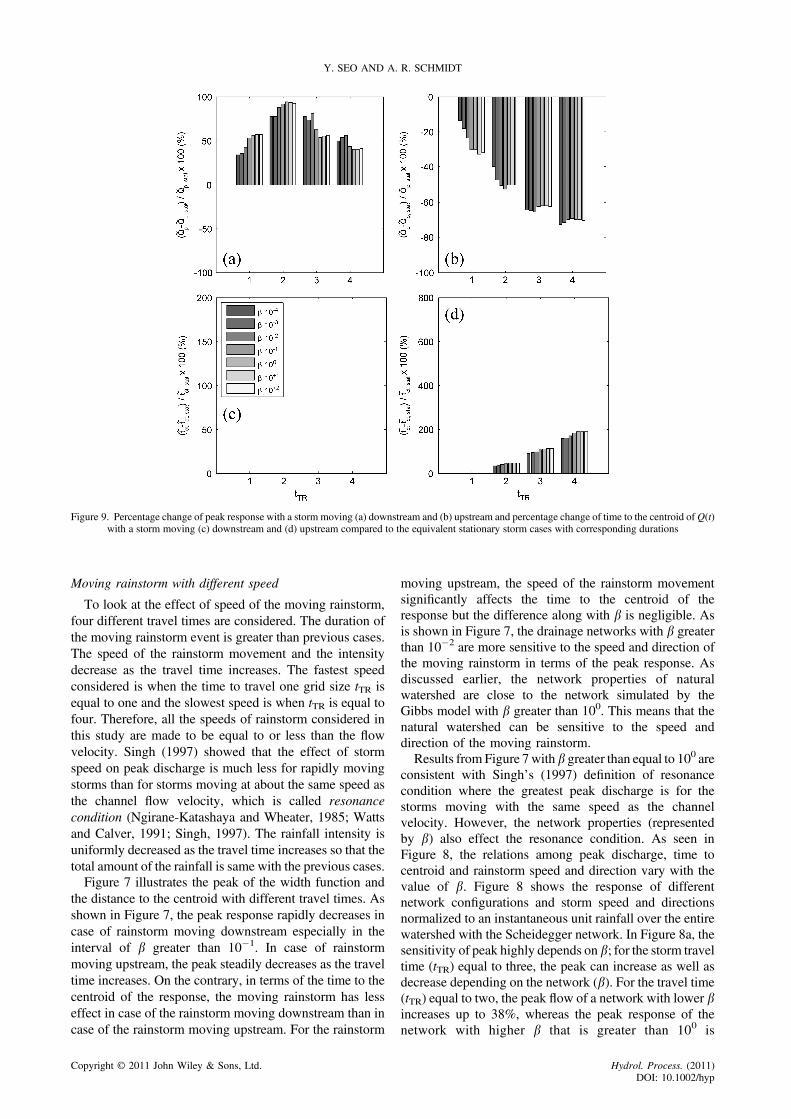
Figure 9. Percentage change of peak response with a storm moving (a) downstream and (b) upstream and percentage change of time to the centroid ofQ(t)with a storm moving (c) downstream and (d) upstream compared to the equivalent stationary storm cases with corresponding durations
Y. SEO AND A. R. SCHMIDT
Moving rainstorm with different speed
To look at the effect of speed of the moving rainstorm,four different travel times are considered. The duration ofthe moving rainstorm event is greater than previous cases.The speed of the rainstorm movement and the intensitydecrease as the travel time increases. The fastest speedconsidered is when the time to travel one grid size tTR isequal to one and the slowest speed is when tTR is equal tofour. Therefore, all the speeds of rainstorm considered inthis study are made to be equal to or less than the flowvelocity. Singh (1997) showed that the effect of stormspeed on peak discharge is much less for rapidly movingstorms than for storms moving at about the same speed asthe channel flow velocity, which is called resonancecondition (Ngirane-Katashaya and Wheater, 1985; Wattsand Calver, 1991; Singh, 1997). The rainfall intensity isuniformly decreased as the travel time increases so that thetotal amount of the rainfall is same with the previous cases.Figure 7 illustrates the peak of the width function and
the distance to the centroid with different travel times. Asshown in Figure 7, the peak response rapidly decreases incase of rainstorm moving downstream especially in theinterval of b greater than 10�1. In case of rainstormmoving upstream, the peak steadily decreases as the traveltime increases. On the contrary, in terms of the time to thecentroid of the response, the moving rainstorm has lesseffect in case of the rainstorm moving downstream than incase of the rainstorm moving upstream. For the rainstorm
Copyright © 2011 John Wiley & Sons, Ltd.
moving upstream, the speed of the rainstorm movementsignificantly affects the time to the centroid of theresponse but the difference along with b is negligible. Asis shown in Figure 7, the drainage networks with b greaterthan 10�2 are more sensitive to the speed and direction ofthe moving rainstorm in terms of the peak response. Asdiscussed earlier, the network properties of naturalwatershed are close to the network simulated by theGibbs model with b greater than 100. This means that thenatural watershed can be sensitive to the speed anddirection of the moving rainstorm.Results from Figure 7with b greater than equal to 100 are
consistent with Singh’s (1997) definition of resonancecondition where the greatest peak discharge is for thestorms moving with the same speed as the channelvelocity. However, the network properties (representedby b) also effect the resonance condition. As seen inFigure 8, the relations among peak discharge, time tocentroid and rainstorm speed and direction vary with thevalue of b. Figure 8 shows the response of differentnetwork configurations and storm speed and directionsnormalized to an instantaneous unit rainfall over the entirewatershed with the Scheidegger network. In Figure 8a, thesensitivity of peak highly depends on b; for the storm traveltime (tTR) equal to three, the peak can increase as well asdecrease depending on the network (b). For the travel time(tTR) equal to two, the peak flow of a network with lower bincreases up to 38%, whereas the peak response of thenetwork with higher b that is greater than 100 is
Hydrol. Process. (2011)DOI: 10.1002/hyp
EFFECT OF RAINSTORM MOVEMENT ON URBAN DRAINAGE NETWORK
approximately equal to uniform stationary response. Whenthe storm travel time (tTR) is largest, the response from thenetworks with higher b shows the greatest decrease interms of the peak response. As shown in Figure 8b forupstream moving rainstorms, the peak flow monotonicallydecreases as travel time as well as b increases. The time tothe centroid increases monotonically as travel time and bincrease as shown in Figures 8c and 8d.The result of a slower-moving storm is that the duration
for which rain occurs somewhere in the watershed is longerthan for a faster-moving rainstorm. The decreasing peakresponse in Figure 8a is partly caused by decreased rainfallintensity due to the increasing storm travel time. To isolatethe effect of the network has on the peak discharge andtravel time, the uniform stationary rainfall with the durationequal to the total time the catchment is receiving rainfallwas used to normalize themoving storm results in Figure 9.For example, when travel time through a unit distance tTRis equal to two, the peak response is compared with thatfrom the uniform stationary rainfall with total duration (td)equal to 16. In Figure 9a, the percentage change of the peakdischarge varies depending on b and the travel time. Thepercentage change of the peak increases as b increaseswhen the storm travel time is less than or equal to two.However, when the storm travel time is greater than two,this relationship is reversed, and the percentage change ofthe peak decreases as b increases. This is related to theresonance effect that the storm is moving with the samespeed as the flow velocity (Niemczynowicz, 1984a, 1984b;Ngirane-Katashaya and Wheater, 1985; Watts and Calver,1991; Singh, 1997). In a Schdeidegger network on a squaregrid, the length of the longest path is double the distancetravelled by a storm moving parallel to one of the flowdirections. When tTR is equal to two, the travel time of thestorm is equal to the travel time of the flow through thelongest flow path of a Scheidegger network, and it resultsin the greatest increase in peak discharge.When the travel time is greater than two, the percentage
in the peak discharge due to the upstream movingrainstorm becomes less sensitive to b as shown in
Figure 10. Location of 12
Copyright © 2011 John Wiley & Sons, Ltd.
Figure 9b. For the downstream moving storm, the time tothe centroid is controlled by the duration of the storm andnot affected by the geometry (b) or the storm travel time(Figure 9c). However, for an upstream moving storm, thetime to the centroid is strongly dependent on the stormtravel time with the largest increases for the large valuesof b (Figure 9d).
DRAINAGE NETWORKS IN CHICAGO
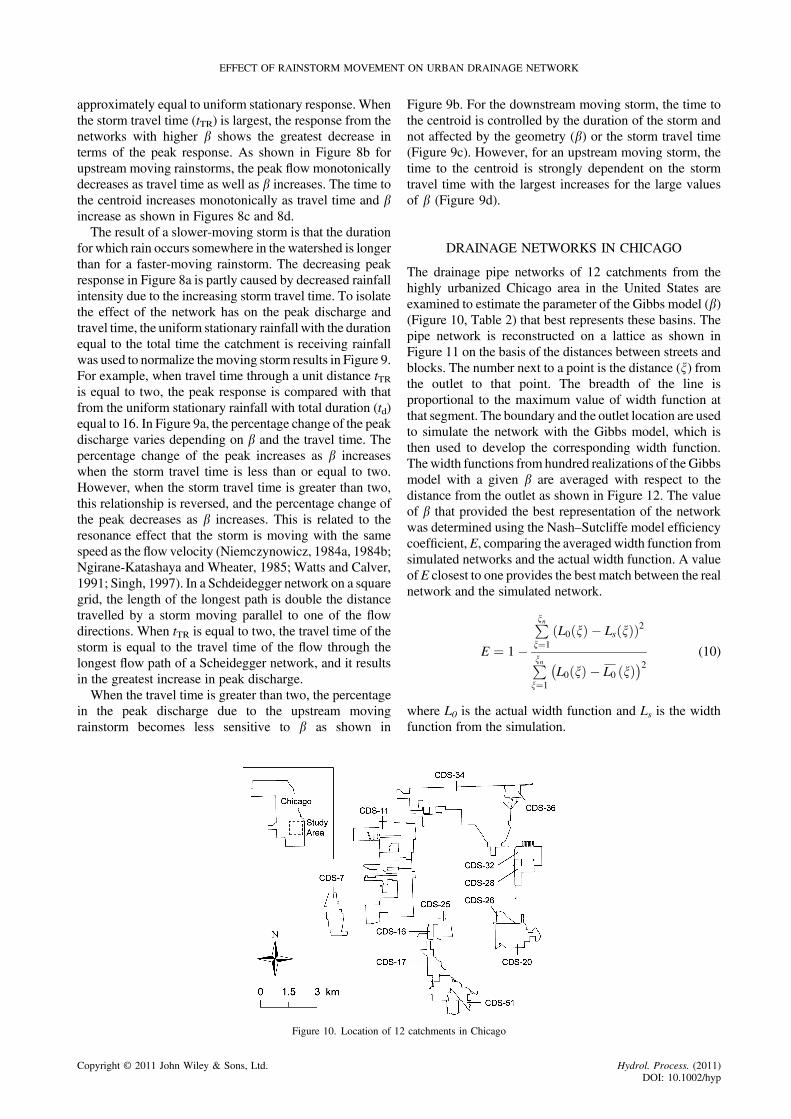
The drainage pipe networks of 12 catchments from thehighly urbanized Chicago area in the United States areexamined to estimate the parameter of the Gibbs model (b)(Figure 10, Table 2) that best represents these basins. Thepipe network is reconstructed on a lattice as shown inFigure 11 on the basis of the distances between streets andblocks. The number next to a point is the distance (x) fromthe outlet to that point. The breadth of the line isproportional to the maximum value of width function atthat segment. The boundary and the outlet location are usedto simulate the network with the Gibbs model, which isthen used to develop the corresponding width function.The width functions from hundred realizations of the Gibbsmodel with a given b are averaged with respect to thedistance from the outlet as shown in Figure 12. The valueof b that provided the best representation of the networkwas determined using the Nash–Sutcliffe model efficiencycoefficient,E, comparing the averaged width function fromsimulated networks and the actual width function. A valueof E closest to one provides the best match between the realnetwork and the simulated network.
E ¼ 1�
Pxnx¼1
L0 xð Þ � Ls xð Þð Þ2
Pxnx¼1
L0 xð Þ � L0�
xð Þ� �2 (10)
where L0 is the actual width function and Ls is the widthfunction from the simulation.
catchments in Chicago
Hydrol. Process. (2011)DOI: 10.1002/hyp
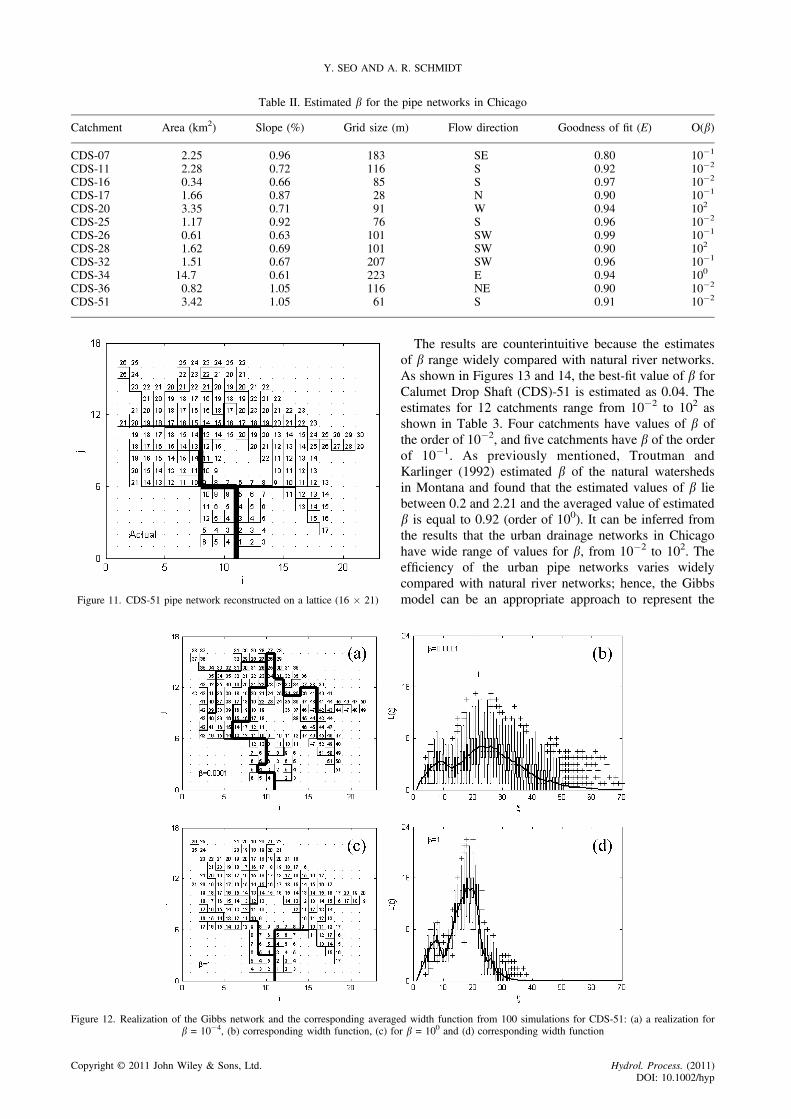
Table II. Estimated b for the pipe networks in Chicago
Catchment Area (km2) Slope (%) Grid size (m) Flow direction Goodness of fit (E) O(b)
CDS-07 2.25 0.96 183 SE 0.80 10�1
CDS-11 2.28 0.72 116 S 0.92 10�2
CDS-16 0.34 0.66 85 S 0.97 10�2
CDS-17 1.66 0.87 28 N 0.90 10�1
CDS-20 3.35 0.71 91 W 0.94 102
CDS-25 1.17 0.92 76 S 0.96 10�2
CDS-26 0.61 0.63 101 SW 0.99 10�1
CDS-28 1.62 0.69 101 SW 0.90 102
CDS-32 1.51 0.67 207 SW 0.96 10�1
CDS-34 14.7 0.61 223 E 0.94 100
CDS-36 0.82 1.05 116 NE 0.90 10�2
CDS-51 3.42 1.05 61 S 0.91 10�2
Figure 11. CDS-51 pipe network reconstructed on a lattice (16 � 21)
Figure 12. Realization of the Gibbs network and the corresponding averagb = 10�4, (b) corresponding width function, (c) fo
Y. SEO AND A. R. SCHMIDT
Copyright © 2011 John Wiley & Sons, Ltd.
The results are counterintuitive because the estimatesof b range widely compared with natural river networks.As shown in Figures 13 and 14, the best-fit value of b forCalumet Drop Shaft (CDS)-51 is estimated as 0.04. Theestimates for 12 catchments range from 10�2 to 102 asshown in Table 3. Four catchments have values of b ofthe order of 10�2, and five catchments have b of the orderof 10�1. As previously mentioned, Troutman andKarlinger (1992) estimated b of the natural watershedsin Montana and found that the estimated values of b liebetween 0.2 and 2.21 and the averaged value of estimatedb is equal to 0.92 (order of 100). It can be inferred fromthe results that the urban drainage networks in Chicagohave wide range of values for b, from 10�2 to 102. Theefficiency of the urban pipe networks varies widelycompared with natural river networks; hence, the Gibbsmodel can be an appropriate approach to represent the
ed width function from 100 simulations for CDS-51: (a) a realization forr b = 100 and (d) corresponding width function
Hydrol. Process. (2011)DOI: 10.1002/hyp
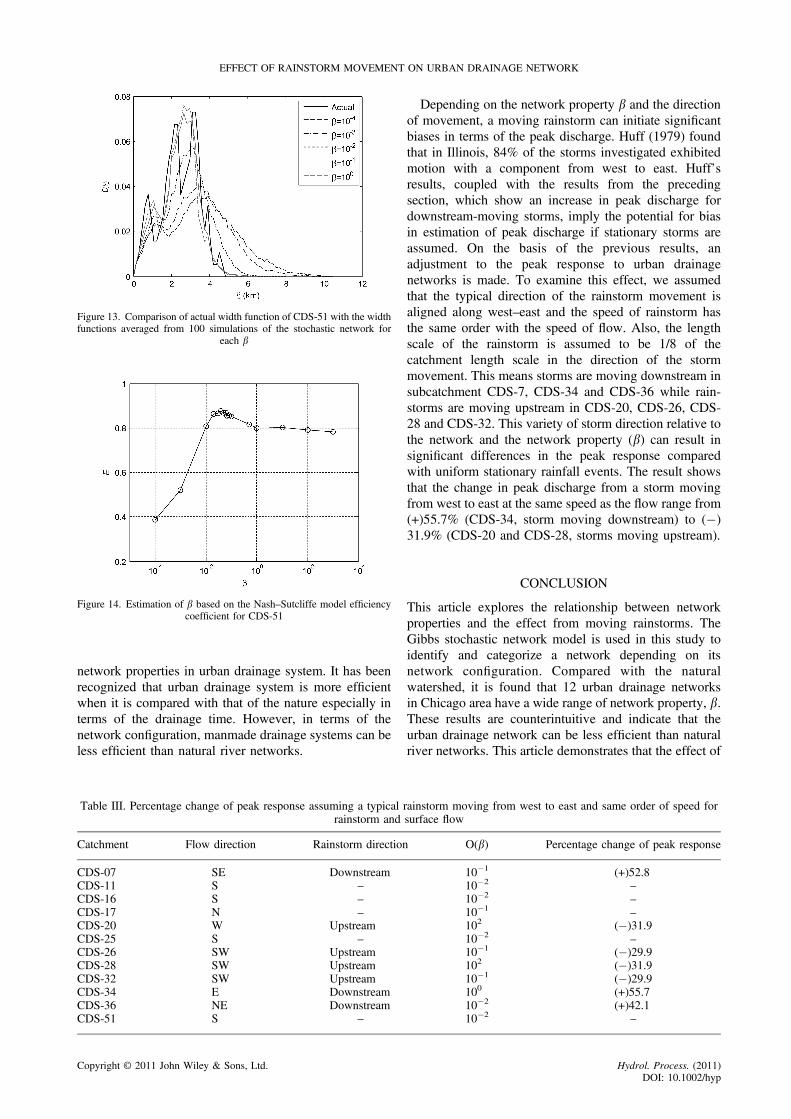
Figure 13. Comparison of actual width function of CDS-51 with the widthfunctions averaged from 100 simulations of the stochastic network for
each b
Figure 14. Estimation of b based on the Nash–Sutcliffe model efficiencycoefficient for CDS-51
EFFECT OF RAINSTORM MOVEMENT ON URBAN DRAINAGE NETWORK
network properties in urban drainage system. It has beenrecognized that urban drainage system is more efficientwhen it is compared with that of the nature especially interms of the drainage time. However, in terms of thenetwork configuration, manmade drainage systems can beless efficient than natural river networks.
Table III. Percentage change of peak response assuming a typicalrainstorm and
Catchment Flow direction Rainstorm direction
CDS-07 SE DownstreamCDS-11 S –CDS-16 S –CDS-17 N –CDS-20 W UpstreamCDS-25 S –CDS-26 SW UpstreamCDS-28 SW UpstreamCDS-32 SW UpstreamCDS-34 E DownstreamCDS-36 NE DownstreamCDS-51 S –
Copyright © 2011 John Wiley & Sons, Ltd.
Depending on the network property b and the directionof movement, a moving rainstorm can initiate significantbiases in terms of the peak discharge. Huff (1979) foundthat in Illinois, 84% of the storms investigated exhibitedmotion with a component from west to east. Huff’sresults, coupled with the results from the precedingsection, which show an increase in peak discharge fordownstream-moving storms, imply the potential for biasin estimation of peak discharge if stationary storms areassumed. On the basis of the previous results, anadjustment to the peak response to urban drainagenetworks is made. To examine this effect, we assumedthat the typical direction of the rainstorm movement isaligned along west–east and the speed of rainstorm hasthe same order with the speed of flow. Also, the lengthscale of the rainstorm is assumed to be 1/8 of thecatchment length scale in the direction of the stormmovement. This means storms are moving downstream insubcatchment CDS-7, CDS-34 and CDS-36 while rain-storms are moving upstream in CDS-20, CDS-26, CDS-28 and CDS-32. This variety of storm direction relative tothe network and the network property (b) can result insignificant differences in the peak response comparedwith uniform stationary rainfall events. The result showsthat the change in peak discharge from a storm movingfrom west to east at the same speed as the flow range from(+)55.7% (CDS-34, storm moving downstream) to (�)31.9% (CDS-20 and CDS-28, storms moving upstream).
CONCLUSION
This article explores the relationship between networkproperties and the effect from moving rainstorms. TheGibbs stochastic network model is used in this study toidentify and categorize a network depending on itsnetwork configuration. Compared with the naturalwatershed, it is found that 12 urban drainage networksin Chicago area have a wide range of network property, b.These results are counterintuitive and indicate that theurban drainage network can be less efficient than naturalriver networks. This article demonstrates that the effect of
rainstorm moving from west to east and same order of speed forsurface flow
O(b) Percentage change of peak response
10�1 (+)52.810�2 –10�2 –10�1 –102 (�)31.910�2 –10�1 (�)29.9102 (�)31.910�1 (�)29.9100 (+)55.710�2 (+)42.110�2 –
Hydrol. Process. (2011)DOI: 10.1002/hyp
Y. SEO AND A. R. SCHMIDT
the direction and speed of the rainstorm movement variesdepending on the network properties. The relationshipbetween storm speed and direction and the change in thepeak runoff is dependent on the network configurationand network efficiency. In contrast to previous studies,this study shows that the speed and direction of therainfall movement that produces the maximum peakdischarge changes depending on the network. Conse-quently, the wide range of network configuration in urbancatchments reveals that the assumption of stationaryrainfall can result in biases in terms of hydrographs whenit is applied to urban drainage system.
REFERENCES
Aldous D. 1987. On the Markov Chain Simulation Method for UniformCombinatorial Distributions and Simulated Annealing. Probability inthe Engineering and Informational Sciences 1: 33–46.
Andersen HS, Jacobsen P, Harremoes P. 1991. Influence of RainfallMovement on Peak Discharge in Urban Sewers. Nordic Hydrology 22:243–252.
De Lima JLMP, Singh VP. 2002. The influence of the pattern of movingrainstorms on overland flow. Advances in Water Resources 25: 817–828.
De Lima JLMP, Singh VP. 2003. Laboratory experiments on the influenceof storm movement on overland flow. Physics and Chemistry of theEarth 28: 277–282.
Foroud N, Broughton RS, Austin GL. 1984. The Effects of a MovingRainstorm on Direct Runoff Properties. Water Resources Bulletin 20:87–91.
Gupta VK, Waymire E, Wang CT. 1980. A Representation of anInstantaneous Unit-Hydrograph from Geomorphology.Water ResourcesResearch 16: 855–862.
Hack JT. 1957. Studies of longitudinal stream profiles in Virginia andMaryland. U.S. Govt. Print. Off.: Washington; iv, 45–97.
Huff FA. 1979. Hydrometeorological characteristics of severe rainstormsin Illinois. Illinois State Water Survey: Urbana; 18.
Ising E. 1925. Beitrag zur Theorie des Ferromagnetismus. Zeitschrift fürPhysik A Hadrons and Nuclei 31: 253–258.
Jensen M. 1984. Runoff Pattern and Peak Flows fromMoving Block RainsBased on a Linear Time Area Curve. Nordic Hydrology 15: 155–168.
Karlinger MR, Troutman BM. 1989. A Random Spatial Network ModelBased on Elementary Postulates.Water Resources Research 25: 793–798.
Kindermann R, Snell JL. 1980. Markov random fields and theirapplications. American Mathematical Society: Providence, RI; ix, 142 p.
Leopold LB, Langbein WB. 1962. The concept of entropy in landscapeevolution. U.S. Govt. Print. Off.: Washington; iii, 20.
Copyright © 2011 John Wiley & Sons, Ltd.
Maksimov VA. 1964. Computing runoff produced by a heavy rainstormwith a moving center. Soviet Hydrology 5: 510–513.
Marcus N. 1968. A laboratory and analytical study of surface runoff undermoving rainstorms. University of Illinois: Urbana-Champaign; ix, 108leaves.
Morin E, Goodrich DC, Maddox RA, Gao XG, Gupta HV, Sorooshian S.2006. Spatial patterns in thunderstorm rainfall events and their couplingwith watershed hydrological response. Advances in Water Resources29: 843–860.
Ngirane-Katashaya GG, Wheater HS. 1985. Hydrograph Sensitivity toStorm Kinematics. Water Resources Research 21: 337–345.
Niemczynowicz J. 1984a. Investigation of the Influence of RainfallMovement on Runoff Hydrograph 1. Simulation on ConceptualCatchment. Nordic Hydrology 15: 57–70.
Niemczynowicz J. 1984b. Investigation of the Influence of RainfallMovement on Runoff Hydrograph 2. Simulation on Real Catchments inthe City of Lund. Nordic Hydrology 15: 71–84.
Niemczynowicz J. 1991. On storm movement and its applications.Atmospheric Research 27: 109–127.
Rodriguez-iturbe I, Valdes JB. 1979. Geomorphologic Structure ofHydrologic Response. Water Resources Research 15: 1409–1420.
Scheidegger AE. 1967. A stochastic model for drainage patterns into anintramontane trench. International Association of Scientific HydrologyBulletin 12: 15–20.
Shearman RJ. 1977. The Speed and Direction of Movement of StormRainfall Patterns with Reference to Urban Storm Sewer Design.Hydrological Sciences Bulletin XXII: 421–431.
Singh VP. 1997. Effect of spatial and temporal variability in rainfall andwatershed characteristics on stream flow hydrograph. HydrologicalProcesses 11: 1649–1669.
Singh VP. 1998. Effect of the direction of storm movement on planar flow.Hydrological Processes 12: 147–170.
Surkan AJ. 1974. Simulation of Storm Velocity Effects on Flowfrom Distributed Channel Networks. Water Resources Research 10:1149–1160.
Troutman BM, Karlinger MR. 1985. Unit-Hydrograph ApproximationsAssuming Linear Flow through Topologically Random ChannelNetworks. Water Resources Research 21: 743–754.
Troutman BM, Karlinger MR. 1992. Gibbs Distribution on DrainageNetworks. Water Resources Research 28: 563–577.
Upton GJG. 2002. A correlation-regression method for tracking rainstormsusing rain-gauge data. Journal of Hydrology 261: 60–73.
Watts LG, Calver A. 1991. Effects of Spatially-Distributed Rainfall onRunoff for a Conceptual Catchment. Nordic Hydrology 22: 1–14.
Wilson CB, Valdes JB, Rodriguez-Iturbe I. 1979. Influence of the Spatial-Distribution of Rainfall on Storm Runoff. Water Resources Research15: 321–328.
Yen BC, Chow VT. 1968. A study of surface runoff due to movingrainstorms. Dept. of Civil Engineering, University of Illinois: Urbana,IL; x, 112p.
Yen BC, Chow VT. 1969. A Laboratory Study of Surface Runoff Due toMoving Rainstorms. Water Resources Research 5: 989–1006.
Hydrol. Process. (2011)DOI: 10.1002/hyp
Related Documents


![Hydrographs[Date] Today I will: - Be able to construct and understand flood hydrographs](https://static.cupdf.com/doc/110x72/56813b43550346895da41aa0/hydrographsdate-today-i-will-be-able-to-construct-and-understand-flood.jpg)