Research Article The Effect of Prior Upper Body Exercise on Subsequent Wingate Performance Marie Clare Grant, 1,2 Robert Robergs, 3 Marianne Findlay Baird, 1 and Julien S. Baker 1 1 Institute of Clinical Exercise and Health Science, Exercise Science Research Laboratory, School of Science, Faculty of Science and Technology, University of the West of Scotland, Hamilton ML3 OJB, UK 2 Division of Sport and Exercise Sciences, School of Social & Health Sciences, Abertay University, Bell Street, Dundee DD1 1HG, UK 3 School of Human Movement Studies, Charles Sturt University, Bathurst, NSW 2795, Australia Correspondence should be addressed to Marie Clare Grant; [email protected] Received 21 February 2014; Revised 11 April 2014; Accepted 14 April 2014; Published 7 May 2014 Academic Editor: Michael Greenwood Copyright © 2014 Marie Clare Grant et al. is is an open access article distributed under the Creative Commons Attribution License, which permits unrestricted use, distribution, and reproduction in any medium, provided the original work is properly cited. It has been reported previously that the upper body musculature is continually active during high intensity cycle ergometry. e aim of this study was to examine the effects of prior upper body exercise on subsequent Wingate (WAnT) performance. Eleven recreationally active males (20.8 ± 2.2 yrs; 77.7 ± 12.0 kg; 1.79 ± 0.04m) completed two trials in a randomised order. In one trial participants completed 2 × 30 s WAnT tests (WAnT1 and WAnT2) with a 6min recovery period; in the other trial, this protocol was preceded with 4 sets of biceps curls to induce localised arm fatigue. Prior upper body exercise was found to have a statistically significant detrimental effect on peak power output (PPO) during WAnT1 ( < 0.05) but no effect was observed for mean power output (MPO) ( > 0.05). Handgrip (HG) strength was also found to be significantly lower following the upper body exercise. ese results demonstrate that the upper body is meaningfully involved in the generation of leg power during intense cycling. 1. Introduction High intensity cycle ergometry has been widely employed in sport and exercise science research to assess indices of muscular performance [1, 2]. Among these power variables, the measurement of PPO has received considerable interest. PPO measurement has traditionally been attributed to the activity of the lower body musculature. Previous work and recent investigations in our laboratory have shown that the upper body may significantly contribute to PPO [2–4]. Surface electromyography (sEMG) has revealed that several upper body muscles (brachioradialis (BR), biceps brachii (BB), triceps brachii (TB), and upper trapezius (UT)) are continually active during high intensity cycle ergometry when a standard handlebar grip is used [4]. With the current cycle ergometer design, evidence suggests that the forearm muscles and therefore the handlebar grip are influential to overcome high resistive loads to produce an optimum PPO. is is supported by the findings of Baker et al. (2001) [2] who found PPO to be significantly greater when a standard handlebar grip was in place compared to no grip ( < 0.05). e effects of prior upper body exercise on subsequent cycling performance have previously been examined [5]. In this study, blood lactate concentrations [La − ] were elevated, via arm-crank exercise, and dynamic performance during two 30s WAnT was assessed. It was found that prior arm exercise was related to a decline in PPO during the second WAnT with the authors suggesting that the resulting elevated [La − ] caused an increased uptake in La − and H + by the inactive leg muscles, leading to an overall performance decrement. Karlsson et al. (1975) [6] have also suggested that a period of exhausting anaerobic exercise by the arms or legs might decrease the performance time of anaerobic effort in the nonexercising arm or leg region due to the possible detrimental effects of elevated [La − ] and [H + ]. Although it is now known that La − per se does not directly cause muscle fatigue, a rise in other metabolic by- products such as inorganic phosphate (P i )[7], P i is likely to Hindawi Publishing Corporation BioMed Research International Volume 2014, Article ID 329328, 7 pages http://dx.doi.org/10.1155/2014/329328

Welcome message from author
This document is posted to help you gain knowledge. Please leave a comment to let me know what you think about it! Share it to your friends and learn new things together.
Transcript
Research ArticleThe Effect of Prior Upper Body Exercise onSubsequent Wingate Performance
Marie Clare Grant,1,2 Robert Robergs,3 Marianne Findlay Baird,1 and Julien S. Baker1
1 Institute of Clinical Exercise and Health Science, Exercise Science Research Laboratory, School of Science,Faculty of Science and Technology, University of the West of Scotland, Hamilton ML3 OJB, UK
2Division of Sport and Exercise Sciences, School of Social & Health Sciences, Abertay University, Bell Street, Dundee DD1 1HG, UK3 School of Human Movement Studies, Charles Sturt University, Bathurst, NSW 2795, Australia
Correspondence should be addressed to Marie Clare Grant; [email protected]
Received 21 February 2014; Revised 11 April 2014; Accepted 14 April 2014; Published 7 May 2014
Academic Editor: Michael Greenwood
Copyright © 2014 Marie Clare Grant et al. This is an open access article distributed under the Creative Commons AttributionLicense, which permits unrestricted use, distribution, and reproduction in any medium, provided the original work is properlycited.
It has been reported previously that the upper body musculature is continually active during high intensity cycle ergometry. Theaim of this study was to examine the effects of prior upper body exercise on subsequent Wingate (WAnT) performance. Elevenrecreationally active males (20.8 ± 2.2 yrs; 77.7 ± 12.0 kg; 1.79 ± 0.04m) completed two trials in a randomised order. In one trialparticipants completed 2 × 30 s WAnT tests (WAnT1 and WAnT2) with a 6min recovery period; in the other trial, this protocolwas preceded with 4 sets of biceps curls to induce localised arm fatigue. Prior upper body exercise was found to have a statisticallysignificant detrimental effect on peak power output (PPO) during WAnT1 (𝑃 < 0.05) but no effect was observed for mean poweroutput (MPO) (𝑃 > 0.05). Handgrip (HG) strength was also found to be significantly lower following the upper body exercise.These results demonstrate that the upper body is meaningfully involved in the generation of leg power during intense cycling.
1. Introduction
High intensity cycle ergometry has been widely employedin sport and exercise science research to assess indices ofmuscular performance [1, 2]. Among these power variables,the measurement of PPO has received considerable interest.PPO measurement has traditionally been attributed to theactivity of the lower body musculature. Previous work andrecent investigations in our laboratory have shown thatthe upper body may significantly contribute to PPO [2–4].Surface electromyography (sEMG) has revealed that severalupper body muscles (brachioradialis (BR), biceps brachii(BB), triceps brachii (TB), and upper trapezius (UT)) arecontinually active during high intensity cycle ergometrywhen a standard handlebar grip is used [4]. With the currentcycle ergometer design, evidence suggests that the forearmmuscles and therefore the handlebar grip are influential toovercome high resistive loads to produce an optimum PPO.This is supported by the findings of Baker et al. (2001) [2]
who found PPO to be significantly greater when a standardhandlebar grip was in place compared to no grip (𝑃 < 0.05).
The effects of prior upper body exercise on subsequentcycling performance have previously been examined [5]. Inthis study, blood lactate concentrations [La−] were elevated,via arm-crank exercise, and dynamic performance duringtwo 30 s WAnT was assessed. It was found that prior armexercise was related to a decline in PPO during the secondWAnT with the authors suggesting that the resulting elevated[La−] caused an increased uptake in La− and H+ by theinactive leg muscles, leading to an overall performancedecrement. Karlsson et al. (1975) [6] have also suggested thata period of exhausting anaerobic exercise by the arms orlegs might decrease the performance time of anaerobic effortin the nonexercising arm or leg region due to the possibledetrimental effects of elevated [La−] and [H+].
Although it is now known that La− per se does notdirectly cause muscle fatigue, a rise in other metabolic by-products such as inorganic phosphate (Pi) [7], Pi is likely to
Hindawi Publishing CorporationBioMed Research InternationalVolume 2014, Article ID 329328, 7 pageshttp://dx.doi.org/10.1155/2014/329328
2 BioMed Research International
HGHGHGHGHG
Warm-up
0 1 2 3 1 2 3 4 5 1 2 3 4 5 6 1 2 3 4 5 6 1 2 3 4 5 6
Upper body exercise ARF trial
4th set to exhaustion
(3 × 10 reps)
Blood Blood Blood Blood Blood Blood Blood
WA
nT1
WA
nT2
30 s recovery
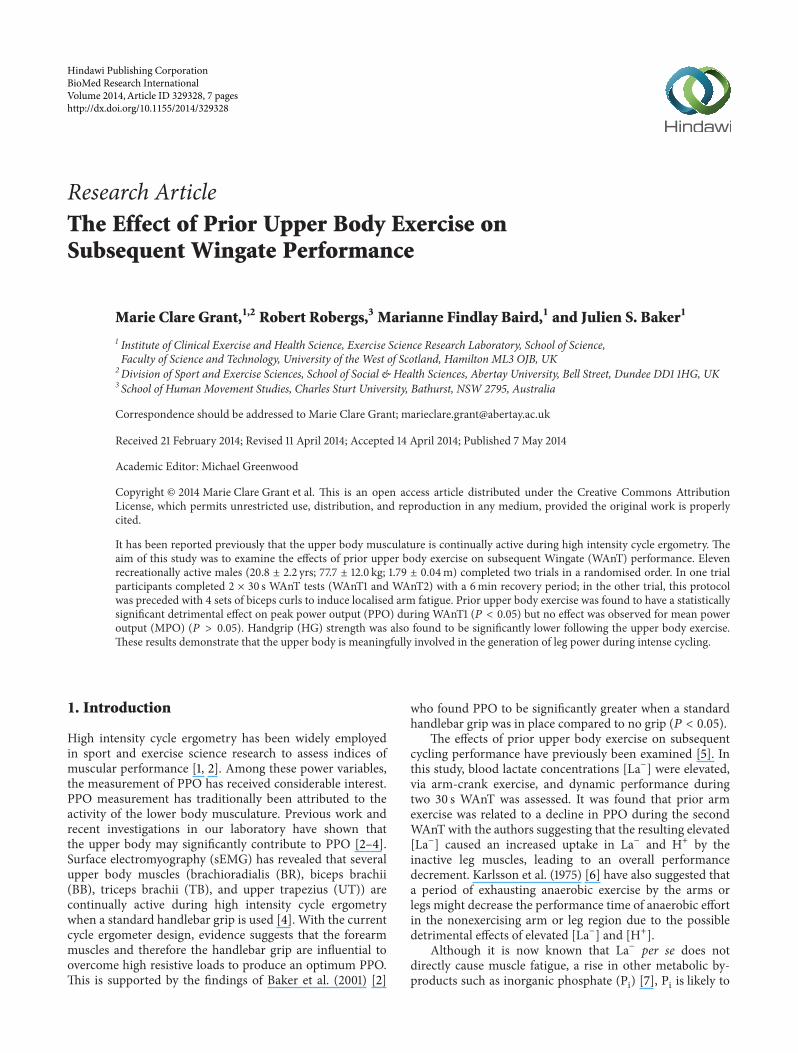
Figure 1: Schematic representation of both experimental protocols. HG = hand grip; WAnT1 =Wingate Test 1; WAnT2 =Wingate Test 2; andBS = blood fingertip sample.
play a major role in muscular fatigue during high intensityexercise. Potential mechanisms whereby high [Pi] can impaircontractile function thus affecting muscle force productioninclude hindering crossbridge transition to the stronglybound high force state; reducing myofibrillar calcium (Ca2+)sensitivity; increasing the opening probability of the sar-coplasmic reticulum (SR) Ca2+ release channels; inhibitingCa2+ uptake by the SR; and precipitating with the Ca2+in the SR, so decreasing the amount of Ca2+ available forrelease [8]. A rise in metabolic by-products is concomitantwith partial depletion and inhibition of the phosphagenand glycolytic energy systems [9] during exercise may affectmuscle function in the nonexercising arm or leg [10]. Thiseffect may contribute to decline inmuscular force productionand overall performance. Based on previous research high-lighting the importance of the upper body musculature inhigh intensity cycle ergometer performance, it is plausiblethat when the upper body is fatigued, it will be less able tosupport or stabilize the body to allow for more effective legpower development [1].
The experimental design of the present study was largelybased on that of Bogdanis et al. [5] with the aim of furtherexamining the effects of prior fatiguing upper body exerciseon subsequent WAnT performance. A secondary aim was toinvestigate if HG strength was correlated with power profiles.
2. Methodology
2.1. Participants. Eleven healthy, recreationally active males(20.8 ± 2.2 yrs; 77.7 ± 12.0 kg; 1.79 ± 0.04m) volunteeredto participate in the study. The study was approved by theuniversity ethical committee and all participants completedan informed consent form andmedical history questionnaire.Participants were instructed to maintain their normal dietduring the days leading up to and on the days of testing andthey were asked to refrain from vigorous exercise and avoidthe consumption of caffeine and alcohol during the 24 hourspreceding the testing date. Food was not consumed duringtesting and water was available ad libitum.
Participants attended the laboratory on three separateoccasions, at the same time of day, separated by 48 to 72 hrs.Participants did not report any muscle soreness before any ofthe sessions. The first session was a familiarisation session tocontrol for the potential effects of learning a novel task andincrease reliability of the results. During this session partic-ipants were briefed on experimental procedures, instructed,
and familiarised with high intensity cycle ergometry, bicepcurls, and maximal HG testing. Body mass (kg), stature (m),and 1RM were also determined during this session.
The following two experimental trials were completedin a randomised order. For the no arm fatigue (NOF)trial, participants were required to perform two maximal30 s sprints (WAnT1 and WAnT2) on a cycle ergometerwith a standard handlebar grip, separated by 6min passiverecovery. In the other arm fatigue (ARF) trial, bicep curlswere completed prior to WAnT1 and WAnT2. Blood [La−]and handgrip strength were obtained at predetermined timepoints throughout the protocols (Figure 1).
2.2. Cycle Ergometry. A leg cycle ergometer (Monark 894E,Vansbro, Sweden) was used for each experimental protocol.For each participant the saddle height was adjusted so theirknee remained slightly flexed after the completion of thepower stroke (with final knee angle approximately 170–175∘).Toe clips were used to ensure that the participants’ feet wereheld firmly in place and in contact with the pedals. The cycleergometer was connected to a PC to allow for data capture viathe Monark anaerobic test software (version 2.24.2).
Before any experimental testing, each individual com-pleted a standardised warm-up on the cycle ergometer (3minat 60 rpm, 2 kg resistance).
For both WAnT1 and WAnT2, participants were givena rolling start before resistive force application. Once thesubjects had accelerated to 60 rpm theweight basket automat-ically dropped and participants began to pedal maximally.Each participant was required to pedal with maximum effortfor a period of 30 s against a fixed resistive load of 75 gramsper kilogram (g⋅kg−1) total body mass as recommended byBar-Or (1987) [11]. All participants were given the same levelof verbal encouragement and instructed to remain seated forthe duration of the test while maintaining a standard han-dlebar grip. Variables obtained from the Monark anaerobictest software (version 2.24.2) were PPO (W), relative PPO(W⋅kg−1), MPO (W), and relative MPO (W⋅kg−1). For thepopulation used within the study the WAnT has a high test-retest reliability (𝑟 = 0.95–0.97) [11].
2.3. Bicep Curls. In a familiarisation session before anyexperimental testing, each individual carried out a series ofbicep curls to allow for their 1RM to be estimated. With eachset theweightwas adjusted so that nomore than 10 repetitionscould be completed with the final weight. Participants were
BioMed Research International 3
Table 1: Power output variables recorded during WAnT1 and WAnT2 for both experimental conditions.
WAnT1PPO (W)
WAnT2PPO (W)
WAnT1PPO
(W⋅kg−1)
WAnT2PPO
(W⋅kg−1)
WAnT1MPO (W)
WAnT2MPO (W)
WAnT1MPO
(W⋅kg−1)
WAnT2MPO
(W⋅kg−1)NOF 980.0 ± 166.5 865.4 ± 168.1∗ 12.7 ± 1.5 11.2 ± 1.7
∗
656.0 ± 84.0 589.2 ± 89.3 8.5 ± 0.5 7.6 ± 0.7∗
ARF 929.9 ± 167.7 871.7 ± 22.69∗ 12.0 ± 1.3 11.2 ± 2.0∗
649.3 ± 86.6 576.4 ± 81.8 8.4 ± 0.7 7.5 ± 0.7∗
∗This indicates significant differences between WAnT1 and WAnT2 (𝑃 < 0.05).
given 2-minute recovery between each set. All participantswere familiar with the exercise; therefore no more thanthree sets were required. The Brzycki formula was then usedto estimate 1RM based on the final weight and repetitionsrecorded (1) [12]. 70%of the 1RMwas subsequently calculatedfor each participant to establish the weight required to fatiguethe arms for protocol 2:
1RM =(weight lifted)
[1.0278 − (repetitions × 0.0278)]. (1)
For protocol 2 (ARF), participants completed 3 sets of10 repetitions and a 4th set until exhaustion (R30 s betweensets) at 70% 1RM. During the bicep curls, participants’ palmswere in the supinated position and they were instructed tokeep the feet a shoulder width apart with their elbows close totheir sides and complete each curl with a continuous, smoothmovement with minimum body disruption.
2.4. Handgrip. HG strength (kg) was measured 1min afterwarm-up and 1min after each exercise bout (Figure 1). Eachmaximal static HG test was completed with the participant’sdominant hand, while being in a seated position using a HDdynamometer (Model TKK5001, Takei, Japan).
2.4.1. Blood Sampling. Capillary blood samples (30–50 𝜇L)for the measurement of blood [La−] were taken from thefingertip using standard lancets and capillary tubes. Sampleswere taken at rest, 3min following warm-up and 3 and5min following each exercise bout (Figure 1). All sampleswere immediately mixed (2min) and duplicate samples wereanalysed to determine the whole blood lactate concentration(Analox P-LM5, Analox Instruments Ltd, London, UK).
The full protocol for each testing session is outlined inFigure 1.
2.4.2. Statistical Analysis. Data was statistically analysedusing SPSS (version 20) (IBM, Armonk, NY, USA). For asingle missing data point, data was replaced with a meandifference adjusted value for the individual compared tothe other trial data point. For each of peak power, relativepeak power, mean power, relative mean power, and fatigueindex (FI, %), repeated measures two-way (2 [TRIAL] × 2[TEST]) ANOVAs were performed to detect main effect andinteraction effects. For the blood lactate data, a balanceddesign was only evident for the postexercise data (3 and5min following exercise). For these data, data were analyzedby repeated measures three-way (2 [TRIAL] × 2 [TEST] ×2 [TIME]) ANOVA. For HG data, a balanced design was
evident when using the post-warm-up data for the NOF trialand the post-arm fatigue test data for the ARF trial as thepreexercise data. Preexercise was then compared to postex-ercise (1min WAnT1 versus 1min WAnT2) using a repeatedmeasures two-way (2 [TRIAL] × 3 [TIME]) ANOVA. Forall data variables, specific contrasts were performed to testfor mean differences for significant main or contrast effects.Isolated paired mean differences outside of the balancedANOVA designs were assessed by a paired t-test. Pearson’scorrelation analysis was used to determine the correlationbetween PPO and HG strength. Effect size statistics (ES)for selected statistically significant t- and F-ratios were alsoestablished. These calculations were based on Cohen’s (d)classification of a small (0.2 ≤ 𝑑 < 0.5), moderate (0.5 <𝑑 < 0.8), and large (𝑑 ≥ 0.8) ES [13]. Significance was set apriori at 𝑃 < 0.05. All data is presented as mean ± standarddeviation (SD).
3. Results
3.1. Cycle Parameters. There was a significant main effect forthe TEST for each of PP0 (W: 𝐹
1,8
= 19.5, 𝑃 < 0.01,𝑟df = 0.84), relative PP0 (W⋅kg−1: 𝐹
1,8
= 22.6, 𝑃 < 0.01,𝑟df = 0.86), and relative MPO (𝐹
1,8
= 43.8 𝑃 < 0.01,𝑟df = 0.91) (Table 1), revealing lower power values forWAnT2compared to WAnT1. Peak power produced in WAnT1 waslower in the ARF protocol compared to NOF protocol (𝑃 <0.01, 𝑟df = 0.75); however, no significant interaction wasfound (𝑃 > 0.05). No significant differences were found inFI (%) for TEST or TRIAL (𝑃 > 0.05) (NOF: 57.0 ± 10.5%and 57.8 ± 10.7% for WAnT1 and WAnT2, respectively, ARF:57.3 ± 9.9% and 59.1 ± 9.6% for WAnT1 and WAnT2).
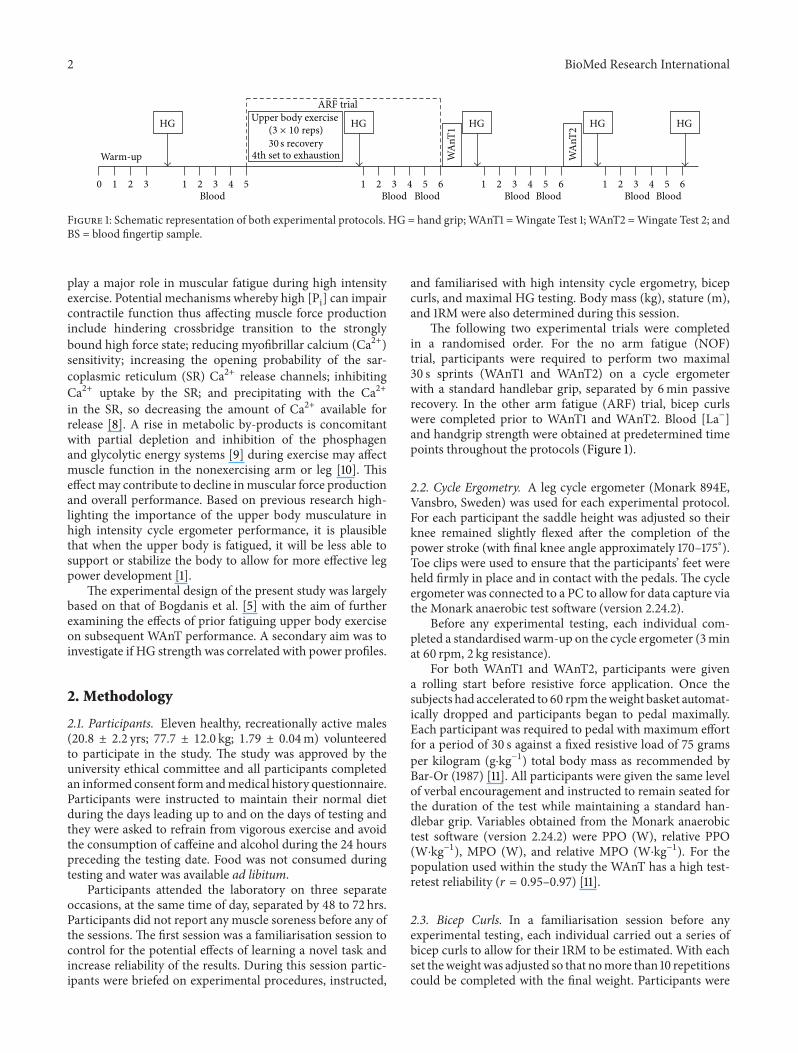
3.2. Blood Lactate. The blood lactate response to each of theexperimental protocols is displayed in Figure 2. There was asignificant TIME effect (𝐹
1,8
= 15.8, 𝑃 < 0.01, 𝑟df = 0.81)and a significant TRIAL × TEST interaction (𝑃 = 0.041,𝑟df = 0.57). The three-way interaction effect of TRIAL ×TIME × TEST revealed a trend toward statistical significance(𝑃 = 0.089, 𝑟df = 0.54). Blood lactate was significantly higher5min after the arm fatigue exercise in theARF trial comparedto post-warm-up in the NOF trial (𝑃 = 0.001). Basedon the main effect and interaction ANOVA results, bloodlactate was significantly higher throughout the recovery afterWAnT2 than WAnT1. In addition, the interaction effect wascaused by a net decrease in blood lactate between 3 and 5minof recovery in WAnT2, whereas blood lactate continued toincrease between 3 and 5min of recovery after WAnT1.
4 BioMed Research International
0
2
4
6
8
10
12
14
Base
line
Befo
re
WA
nT1
WA
nT1
WA
nT2
WA
nT2
SampleNOFARF
Lact
ate (
mm
ol·L−1)
∗3
min
after
5m
in aft
er
3m
in aft
er
5m
in aft
er
Figure 2: Blood [La−] responses prior to and during recovery fromeach of WAnT1 and WAnT2. ∗ = significant difference betweenNOF and ARF.
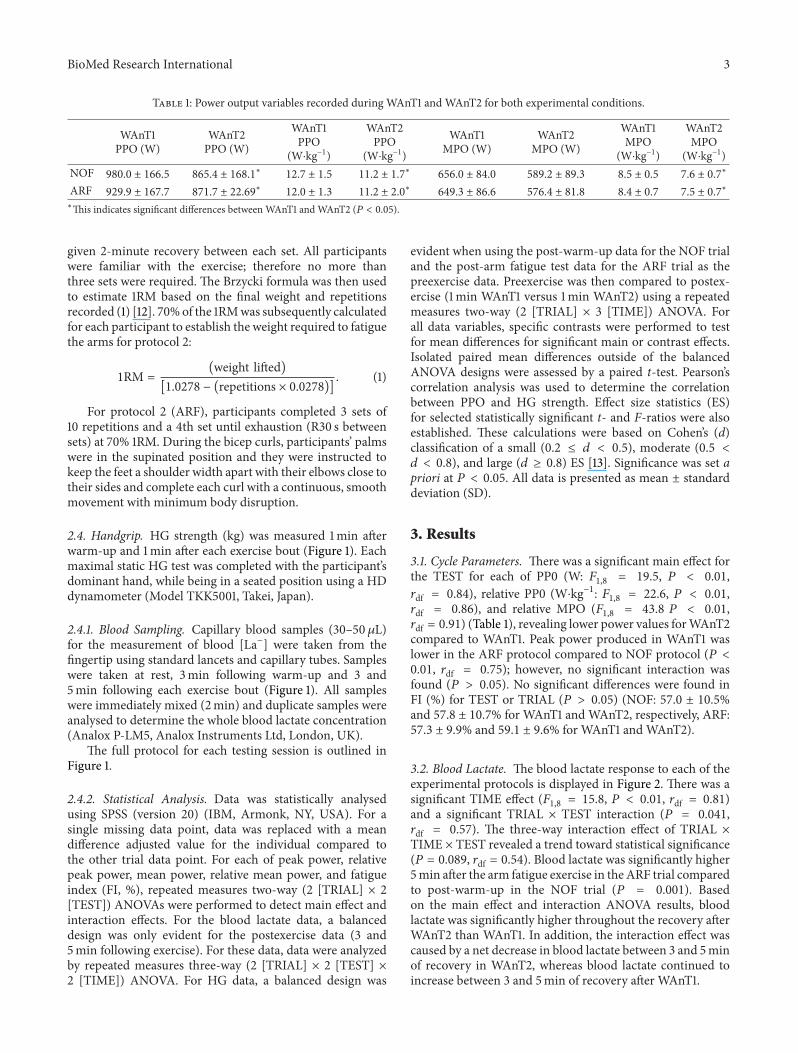
3.3. Handgrip. The HG strength response to each of theexperimental protocols is displayed in Figure 3. There was asignificant TRIAL effect (𝑃 = 0.004, 𝑟df = 0.81). Therefore,HG strength was significantly lower at all time points for theARF versus NOF trial.
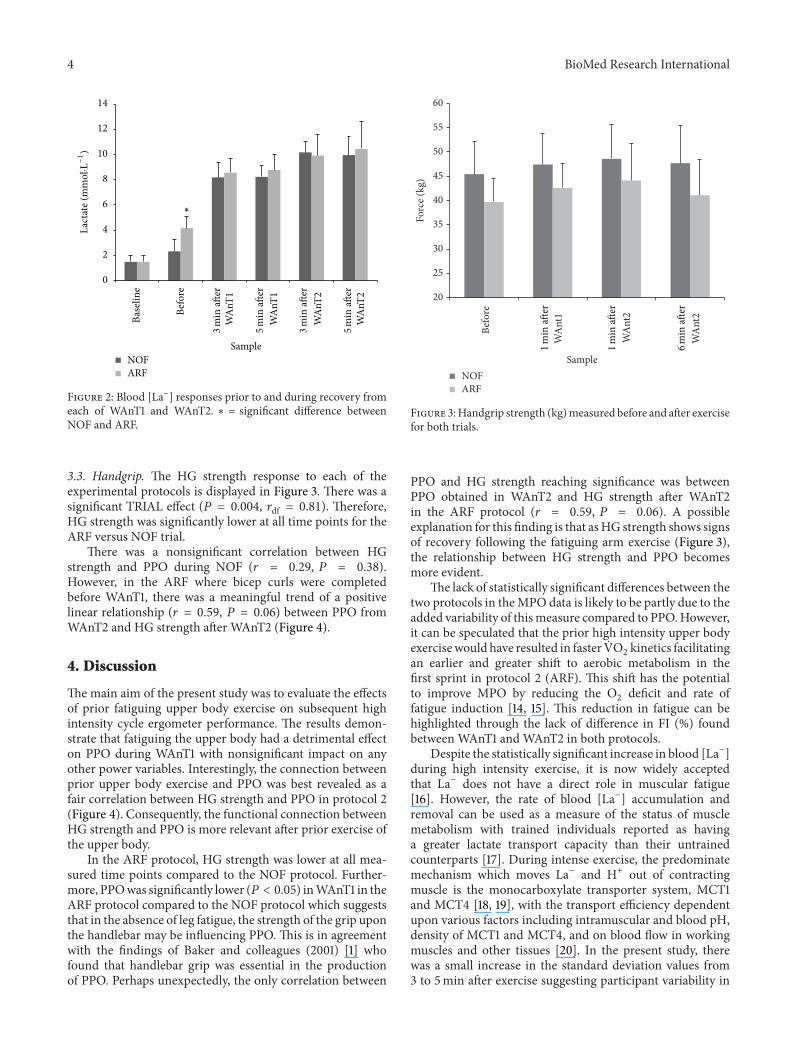
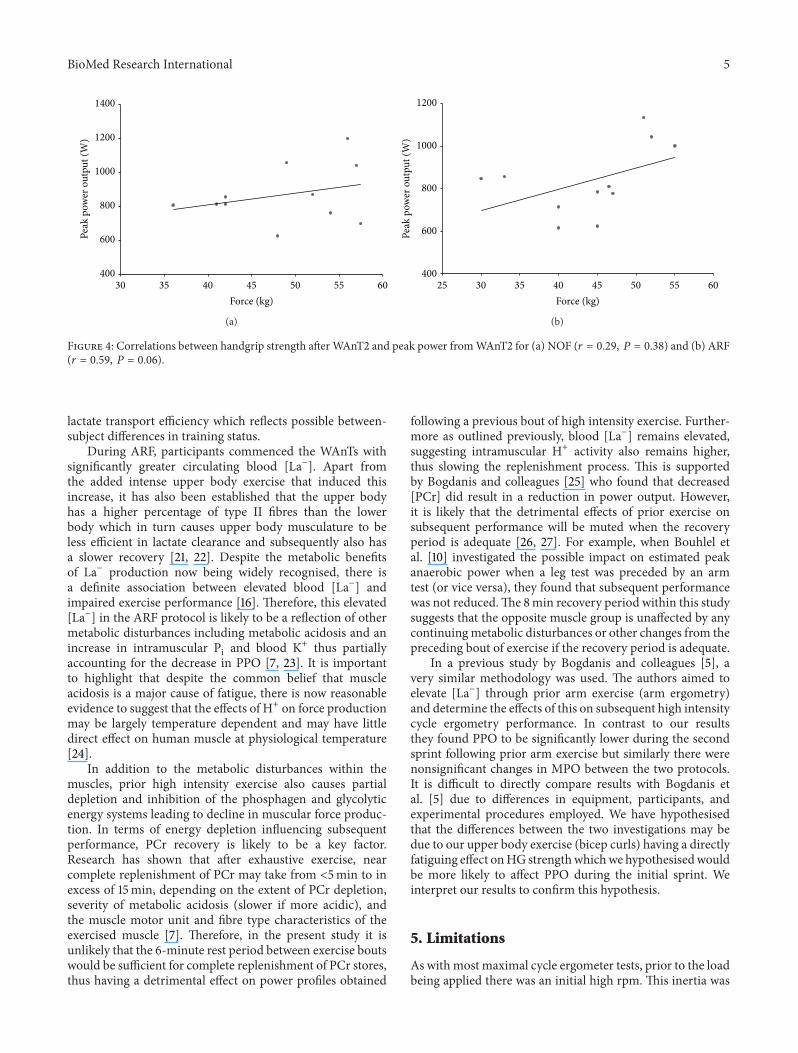
There was a nonsignificant correlation between HGstrength and PPO during NOF (𝑟 = 0.29, 𝑃 = 0.38).However, in the ARF where bicep curls were completedbefore WAnT1, there was a meaningful trend of a positivelinear relationship (𝑟 = 0.59, 𝑃 = 0.06) between PPO fromWAnT2 and HG strength after WAnT2 (Figure 4).
4. Discussion
Themain aim of the present study was to evaluate the effectsof prior fatiguing upper body exercise on subsequent highintensity cycle ergometer performance. The results demon-strate that fatiguing the upper body had a detrimental effecton PPO during WAnT1 with nonsignificant impact on anyother power variables. Interestingly, the connection betweenprior upper body exercise and PPO was best revealed as afair correlation between HG strength and PPO in protocol 2(Figure 4). Consequently, the functional connection betweenHG strength and PPO is more relevant after prior exercise ofthe upper body.
In the ARF protocol, HG strength was lower at all mea-sured time points compared to the NOF protocol. Further-more, PPOwas significantly lower (𝑃 < 0.05) inWAnT1 in theARF protocol compared to the NOF protocol which suggeststhat in the absence of leg fatigue, the strength of the grip uponthe handlebar may be influencing PPO. This is in agreementwith the findings of Baker and colleagues (2001) [1] whofound that handlebar grip was essential in the productionof PPO. Perhaps unexpectedly, the only correlation between
20
25
30
35
40
45
50
55
60
Forc
e (kg
)
Sample
WA
nt1
1m
in aft
er
WA
nt2
1m
in aft
er
WA
nt2
6m
in aft
er
NOFARF
Befo
re
Figure 3:Handgrip strength (kg)measured before and after exercisefor both trials.
PPO and HG strength reaching significance was betweenPPO obtained in WAnT2 and HG strength after WAnT2in the ARF protocol (𝑟 = 0.59, 𝑃 = 0.06). A possibleexplanation for this finding is that asHG strength shows signsof recovery following the fatiguing arm exercise (Figure 3),the relationship between HG strength and PPO becomesmore evident.
The lack of statistically significant differences between thetwo protocols in theMPO data is likely to be partly due to theadded variability of thismeasure compared to PPO.However,it can be speculated that the prior high intensity upper bodyexercisewould have resulted in faster VO
2
kinetics facilitatingan earlier and greater shift to aerobic metabolism in thefirst sprint in protocol 2 (ARF). This shift has the potentialto improve MPO by reducing the O
2
deficit and rate offatigue induction [14, 15]. This reduction in fatigue can behighlighted through the lack of difference in FI (%) foundbetween WAnT1 and WAnT2 in both protocols.
Despite the statistically significant increase in blood [La−]during high intensity exercise, it is now widely acceptedthat La− does not have a direct role in muscular fatigue[16]. However, the rate of blood [La−] accumulation andremoval can be used as a measure of the status of musclemetabolism with trained individuals reported as havinga greater lactate transport capacity than their untrainedcounterparts [17]. During intense exercise, the predominatemechanism which moves La− and H+ out of contractingmuscle is the monocarboxylate transporter system, MCT1and MCT4 [18, 19], with the transport efficiency dependentupon various factors including intramuscular and blood pH,density of MCT1 and MCT4, and on blood flow in workingmuscles and other tissues [20]. In the present study, therewas a small increase in the standard deviation values from3 to 5min after exercise suggesting participant variability in
BioMed Research International 5
400
600
800
1000
1200
1400
30 35 40 45 50 55 60
Peak
pow
er o
utpu
t (W
)
Force (kg)
(a)
400
600
800
1000
1200
25 30 35 40 45 50 55 60
Peak
pow
er o
utpu
t (W
)
Force (kg)
(b)
Figure 4: Correlations between handgrip strength after WAnT2 and peak power fromWAnT2 for (a) NOF (𝑟 = 0.29, 𝑃 = 0.38) and (b) ARF(𝑟 = 0.59, 𝑃 = 0.06).
lactate transport efficiency which reflects possible between-subject differences in training status.
During ARF, participants commenced the WAnTs withsignificantly greater circulating blood [La−]. Apart fromthe added intense upper body exercise that induced thisincrease, it has also been established that the upper bodyhas a higher percentage of type II fibres than the lowerbody which in turn causes upper body musculature to beless efficient in lactate clearance and subsequently also hasa slower recovery [21, 22]. Despite the metabolic benefitsof La− production now being widely recognised, there isa definite association between elevated blood [La−] andimpaired exercise performance [16]. Therefore, this elevated[La−] in the ARF protocol is likely to be a reflection of othermetabolic disturbances including metabolic acidosis and anincrease in intramuscular Pi and blood K+ thus partiallyaccounting for the decrease in PPO [7, 23]. It is importantto highlight that despite the common belief that muscleacidosis is a major cause of fatigue, there is now reasonableevidence to suggest that the effects of H+ on force productionmay be largely temperature dependent and may have littledirect effect on human muscle at physiological temperature[24].
In addition to the metabolic disturbances within themuscles, prior high intensity exercise also causes partialdepletion and inhibition of the phosphagen and glycolyticenergy systems leading to decline in muscular force produc-tion. In terms of energy depletion influencing subsequentperformance, PCr recovery is likely to be a key factor.Research has shown that after exhaustive exercise, nearcomplete replenishment of PCr may take from <5min to inexcess of 15min, depending on the extent of PCr depletion,severity of metabolic acidosis (slower if more acidic), andthe muscle motor unit and fibre type characteristics of theexercised muscle [7]. Therefore, in the present study it isunlikely that the 6-minute rest period between exercise boutswould be sufficient for complete replenishment of PCr stores,thus having a detrimental effect on power profiles obtained
following a previous bout of high intensity exercise. Further-more as outlined previously, blood [La−] remains elevated,suggesting intramuscular H+ activity also remains higher,thus slowing the replenishment process. This is supportedby Bogdanis and colleagues [25] who found that decreased[PCr] did result in a reduction in power output. However,it is likely that the detrimental effects of prior exercise onsubsequent performance will be muted when the recoveryperiod is adequate [26, 27]. For example, when Bouhlel etal. [10] investigated the possible impact on estimated peakanaerobic power when a leg test was preceded by an armtest (or vice versa), they found that subsequent performancewas not reduced.The 8min recovery period within this studysuggests that the opposite muscle group is unaffected by anycontinuingmetabolic disturbances or other changes from thepreceding bout of exercise if the recovery period is adequate.
In a previous study by Bogdanis and colleagues [5], avery similar methodology was used. The authors aimed toelevate [La−] through prior arm exercise (arm ergometry)and determine the effects of this on subsequent high intensitycycle ergometry performance. In contrast to our resultsthey found PPO to be significantly lower during the secondsprint following prior arm exercise but similarly there werenonsignificant changes in MPO between the two protocols.It is difficult to directly compare results with Bogdanis etal. [5] due to differences in equipment, participants, andexperimental procedures employed. We have hypothesisedthat the differences between the two investigations may bedue to our upper body exercise (bicep curls) having a directlyfatiguing effect onHG strengthwhichwe hypothesisedwouldbe more likely to affect PPO during the initial sprint. Weinterpret our results to confirm this hypothesis.
5. Limitations
As withmost maximal cycle ergometer tests, prior to the loadbeing applied there was an initial high rpm. This inertia was
6 BioMed Research International
not accounted for in the calculation; therefore the consider-able energy which had already been accumulated before the30 s test may have resulted in a possible overcalculation ofPPO and MPO [28].
All participants were physically active and accustomedto high intensity exercise. However no physiological fitnesstesting was undertaken prior to data collection which meantthere was no control over the exercise capacity of eachindividual. This is an extraneous variable which may haveled variation in power profiles observed among participantswhich was not related to the exercise protocol.
6. Conclusion
In conclusion, this investigation has shown that prior fatigu-ing upper body exercise has a statistically significant detri-mental effect on PPO during the first of twoWAnTs.This canbe related to a number of factors, including the decrease inHG strength following the upper body exercise suggestingthe upper body is less able to help overcome the highresistive loads, confirming results of previous investigationswhich suggest that the upper body is crucial in achieving anoptimum PPO. It was also found that MPO was able to bemaintained, which could be explained by prior intense exer-cise resulting in faster VO
2
kinetics and therefore increasingthe contribution from oxidative metabolism.
Conflict of Interests
The authors declare that there is no conflict of interestsregarding the publication of this paper.
References
[1] J. Baker, J. Gal, B. Davies, D. Bailey, and R. Morgan, “Poweroutput of legs during high intensity cycle ergometry: influenceof hand grip,” Journal of Science and Medicine in Sport, vol. 4,no. 1, pp. 10–18, 2001.
[2] J. Baker, E. Brown, G. Hill, G. Phillips, R. Williams, and B.Davies, “Handgrip contribution to lactate production and legpower during high-intensity exercise,” Medicine and Science inSports and Exercise, vol. 34, no. 6, pp. 1037–1040, 2002.
[3] J. S. Baker and B. Davies, “Additional considerations andrecommendations for the quantification of hand-grip strengthin the measurement of leg power during high-intensity cycleergometry,” Research in Sports Medicine, vol. 17, no. 3, pp. 145–155, 2009.
[4] M. C. McCormick, H. Watson, A. Simpson et al., “Surfaceelectromyographic activities of upper bodymuscles during highintensity cycle ergometry,” Research in Sports Medicine: AnInternational Journal, vol. 22, no. 2, pp. 124–135, 2014.
[5] G. C. Bogdanis, M. E. Nevill, and H. K. A. Lakomy, “Effectsof previous dynamic arm exercise on power output duringrepeatedmaximal sprint cycling,” Journal of Sports Sciences, vol.12, no. 4, pp. 363–370, 1994.
[6] J. Karlsson, F. Bonde Petersen, J. Henriksson, and H. G.Knuttgen, “Effects of previous exercise with arms or legs onmetabolism and performance in exhaustive exercise,” Journal ofApplied Physiology, vol. 38, no. 5, pp. 763–767, 1975.
[7] J. S. Baker, M. C. McCormick, and R. Robergs, “Interactionamong skeletal musclemetabolic energy systems during intenseexercise,” Journal of Nutrition andMetabolism, vol. 2010, ArticleID 905612, 13 pages, 2010.
[8] H. Westerblad, D. G. Allen, and J. Lannergren, “Muscle fatigue:lactic acid or inorganic phosphate the major cause?” News inPhysiological Sciences, vol. 17, no. 1, pp. 17–21, 2002.
[9] R. H. Fitts, “Mechanisms of muscular fatigue,” Medicine andSports Science, vol. 46, pp. 279–300, 2004.
[10] E. Bouhlel, M. S. Chelly, N. Gmada, Z. Tabka, and R. Shephard,“Effect of a prior force-velocity test performed with legs onsubsequent peak power output measured with arms or viceversa,” Journal of Strength and Conditioning Research, vol. 24,no. 4, pp. 992–998, 2010.
[11] O. Bar-Or, “TheWingate anaerobic test: an update on method-ology, reliability and validity,” Sports Medicine, vol. 4, no. 6, pp.381–394, 1987.
[12] M. Brzycki, “Strength testing: predicting a one-rep max froma reps-to-fatigue,” Journal of Health Physical Education, Recre-ation and Dance, vol. 64, no. 1, pp. 88–90, 1993.
[13] J. Cohen, Statistical Power Analysis for the Behavioral Sciences,Lawrence Erlbaum, Hillsdale, NJ, USA, 1988.
[14] B. Bohnert, S. A. Ward, and B. J. Whipp, “Effects of priorarm exercise on pulmonary gas exchange kinetics during high-intensity leg exercise in humans,” Experimental Physiology, vol.83, no. 4, pp. 557–570, 1998.
[15] C. Ferguson, B. J. Whipp, A. J. Cathcart, H. B. Rossiter, A. P.Turner, and S. A. Ward, “Effects of prior very-heavy intensityexercise on indices of aerobic function and high-intensityexercise tolerance,” Journal of Applied Physiology, vol. 103, no.3, pp. 812–822, 2007.
[16] R. A. Robergs, F. Ghiasvand, and D. Parker, “Biochemistry ofexercise-induced metabolic acidosis,” The American Journal ofPhysiology—Regulatory Integrative and Comparative Physiology,vol. 287, no. 3, pp. R502–R516, 2004.
[17] F. Marcello Iaia, J. Perez-Gomez, M. Thomassen, N. B. Nords-borg, Y. Hellsten, and J. Bangsbo, “Relationship between per-formance at different exercise intensities and skeletal musclecharacteristics,” Journal of Applied Physiology, vol. 110, no. 6, pp.1555–1563, 2011.
[18] L. B. Gladden, “Lactate metabolism: a new paradigm for thethird millennium,” Journal of Physiology, vol. 558, no. 1, pp. 5–30, 2004.
[19] L. Messonnier, M. Kristensen, C. Juel, and C. Denis, “Impor-tance of pH regulation and lactate/H+ transport capacity forwork production during supramaximal exercise in humans,”Journal of Applied Physiology, vol. 102, no. 5, pp. 1936–1944, 2007.
[20] F. Peronnet, “Lactate as an end-product and fuel,” DeutscheZeitschrift fur Sportmedizin, vol. 61, no. 5, pp. 112–116, 2010.
[21] J. Sanchis-Moysi, F. Idoate, H. Olmedillas et al., “The upperextremity of the professional tennis player: muscle volumes,fiber-type distribution and muscle strength,”The ScandinavianJournal of Medicine and Science in Sports, vol. 20, no. 3, pp. 524–534, 2010.
[22] L. B. Gladden, “Muscle as a consumer of lactate,”Medicine andScience in Sports and Exercise, vol. 32, no. 4, pp. 764–771, 2000.
[23] P. Menzies, C. Menzies, L. McIntyre, P. Paterson, J. Wilson, andO. J. Kemi, “Blood lactate clearance during active recovery afteran intense running bout depends on the intensity of the activerecovery,” Journal of Sports Sciences, vol. 28, no. 9, pp. 975–982,2010.
BioMed Research International 7
[24] E. P. Debold, “Recent insights into the molecular basis ofmuscular fatigue,”Medicine & Science in Sports & Exercise, vol.44, no. 8, pp. 1440–1452, 2012.
[25] G. C. Bogdanis, M. E. Nevill, H. K. A. Lakomy, and L. H.Boobis, “Power output and muscle metabolism during andfollowing recovery from 10 and 20 s of maximal sprint exercisein humans,” Acta Physiologica Scandinavica, vol. 163, no. 3, pp.261–272, 1998.
[26] S. J. Bailey, A. Vanhatalo, D. P. Wilkerson, F. J. Dimenna, andA. M. Jones, “Optimizing the “priming” effect: influence ofprior exercise intensity and recovery duration on O
2
uptakekinetics and severe-intensity exercise tolerance,” Journal ofApplied Physiology, vol. 107, no. 6, pp. 1743–1756, 2009.
[27] D. P.Wilkerson, K. Koppo, T. J. Barstow, andA.M. Jones, “Effectof prior multiple-sprint exercise on pulmonary O
2
uptakekinetics following the onset of perimaximal exercise,” Journalof Applied Physiology, vol. 97, no. 4, pp. 1227–1236, 2004.
[28] M. Coulson and D. Archer, Practical Fitness Testing: Analysis inExercise and Sport, Bloomsbury Publishing, London, UK, 2009.

Submit your manuscripts athttp://www.hindawi.com
Stem CellsInternational
Hindawi Publishing Corporationhttp://www.hindawi.com Volume 2014
Hindawi Publishing Corporationhttp://www.hindawi.com Volume 2014
MEDIATORSINFLAMMATION
of
Hindawi Publishing Corporationhttp://www.hindawi.com Volume 2014
Behavioural Neurology
EndocrinologyInternational Journal of
Hindawi Publishing Corporationhttp://www.hindawi.com Volume 2014
Hindawi Publishing Corporationhttp://www.hindawi.com Volume 2014
Disease Markers
Hindawi Publishing Corporationhttp://www.hindawi.com Volume 2014
BioMed Research International
OncologyJournal of
Hindawi Publishing Corporationhttp://www.hindawi.com Volume 2014
Hindawi Publishing Corporationhttp://www.hindawi.com Volume 2014
Oxidative Medicine and Cellular Longevity
Hindawi Publishing Corporationhttp://www.hindawi.com Volume 2014
PPAR Research
The Scientific World JournalHindawi Publishing Corporation http://www.hindawi.com Volume 2014
Immunology ResearchHindawi Publishing Corporationhttp://www.hindawi.com Volume 2014
Journal of
ObesityJournal of
Hindawi Publishing Corporationhttp://www.hindawi.com Volume 2014
Hindawi Publishing Corporationhttp://www.hindawi.com Volume 2014
Computational and Mathematical Methods in Medicine
OphthalmologyJournal of
Hindawi Publishing Corporationhttp://www.hindawi.com Volume 2014
Diabetes ResearchJournal of
Hindawi Publishing Corporationhttp://www.hindawi.com Volume 2014
Hindawi Publishing Corporationhttp://www.hindawi.com Volume 2014
Research and TreatmentAIDS
Hindawi Publishing Corporationhttp://www.hindawi.com Volume 2014
Gastroenterology Research and Practice
Hindawi Publishing Corporationhttp://www.hindawi.com Volume 2014
Parkinson’s Disease
Evidence-Based Complementary and Alternative Medicine
Volume 2014Hindawi Publishing Corporationhttp://www.hindawi.com
Related Documents