Vol. 3. No.1 Maret 2020 ISSN. 2620-5599 Jurnal Liner, Institut Pendidikan Tapanuli Selatan 226 THE EFFECT OF NATURAL APPROACH TOWARDS STUDENTS’ SPEAKING MASTERY X GRADE - SMA NEGERI 3 – PADANGSIDIMPUAN Zainuddin IAIN Padangsidimpuan [email protected] ABSTRACT : The research focused on the effect of natural approach towards students‟ speaking mastery X grade - SMA Negeri 3 - Padangsidimpuan. There are students‟ problems in speaking mastery like: 1) students are low in speaking mastery, 2) students feel shy to speak English, especially in front of class, 3) students often mispronounce words and they usually speak English in incorrect structure and grammar. Moreover, the teacher does not use suitable approach in teaching process. The purpose of this research is to know whether there is or there is not the effect of natural approach on students‟ speaking mastery X grade - SMA Negeri 3 - Padangsidimpuan.The used method of the research is experimental research. Where as the population of the research is 6 classes at the X grade of SMA Negeri 3 Padangsidimpuan, then the total population is 230 students. Consequently, two classes were chosen randomly as the sample. They were X MIA-1 as experiment class that consists of 40 students and X MIA-2 as control class that consists of 40 students. The data is taken from pre-test and post-test. To analyze the data, the researcher uses t-test formula.After analyzing the data, the researcher finds that mean score of experimental class after using Natural Approach is higher than control class. Mean score of experimental class and control class in pre test is (59.34 < 63.7), mean score experimental class and control class in post test was (79.25 > 72.48). Besides, the score of t count was bigger than t table (3.18 > 2.00). It means that the hypothesis alternative (H a ) is accepted and H 0 is rejected. So, there is a significant effect of Natural Approach on speaking mastery at the X grade students of SMA Negeri 3 Padangsidimpuan. Keywords: Natural Approach and Students’ Speaking Mastery

Welcome message from author
This document is posted to help you gain knowledge. Please leave a comment to let me know what you think about it! Share it to your friends and learn new things together.
Transcript
Vol. 3. No.1 Maret 2020 ISSN. 2620-5599
Jurnal Liner, Institut Pendidikan Tapanuli Selatan 226
THE EFFECT OF NATURAL APPROACH TOWARDS STUDENTS’ SPEAKING MASTERY
X GRADE - SMA NEGERI 3 – PADANGSIDIMPUAN
Zainuddin IAIN Padangsidimpuan
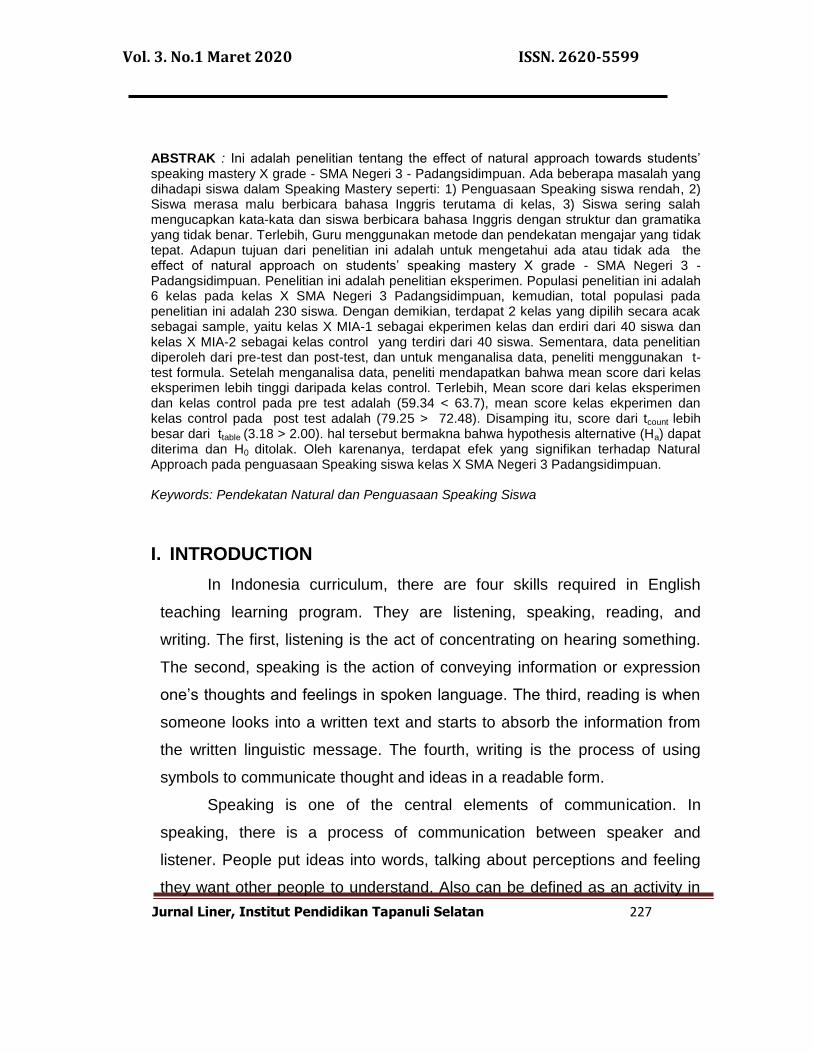
ABSTRACT : The research focused on the effect of natural approach towards students‟
speaking mastery X grade - SMA Negeri 3 - Padangsidimpuan. There are students‟ problems
in speaking mastery like: 1) students are low in speaking mastery, 2) students feel shy to
speak English, especially in front of class, 3) students often mispronounce words and they
usually speak English in incorrect structure and grammar. Moreover, the teacher does not
use suitable approach in teaching process. The purpose of this research is to know whether
there is or there is not the effect of natural approach on students‟ speaking mastery X grade -
SMA Negeri 3 - Padangsidimpuan.The used method of the research is experimental
research. Where as the population of the research is 6 classes at the X grade of SMA Negeri
3 Padangsidimpuan, then the total population is 230 students. Consequently, two classes
were chosen randomly as the sample. They were X MIA-1 as experiment class that consists
of 40 students and X MIA-2 as control class that consists of 40 students. The data is taken
from pre-test and post-test. To analyze the data, the researcher uses t-test formula.After
analyzing the data, the researcher finds that mean score of experimental class after using
Natural Approach is higher than control class. Mean score of experimental class and control
class in pre test is (59.34 < 63.7), mean score experimental class and control class in post
test was (79.25 > 72.48). Besides, the score of tcount was bigger than ttable (3.18 > 2.00). It
means that the hypothesis alternative (Ha) is accepted and H0 is rejected. So, there is a
significant effect of Natural Approach on speaking mastery at the X grade students of SMA
Negeri 3 Padangsidimpuan.
Keywords: Natural Approach and Students’ Speaking Mastery
Vol. 3. No.1 Maret 2020 ISSN. 2620-5599
Jurnal Liner, Institut Pendidikan Tapanuli Selatan 227
ABSTRAK : Ini adalah penelitian tentang the effect of natural approach towards students‟ speaking mastery X grade - SMA Negeri 3 - Padangsidimpuan. Ada beberapa masalah yang dihadapi siswa dalam Speaking Mastery seperti: 1) Penguasaan Speaking siswa rendah, 2) Siswa merasa malu berbicara bahasa Inggris terutama di kelas, 3) Siswa sering salah mengucapkan kata-kata dan siswa berbicara bahasa Inggris dengan struktur dan gramatika yang tidak benar. Terlebih, Guru menggunakan metode dan pendekatan mengajar yang tidak tepat. Adapun tujuan dari penelitian ini adalah untuk mengetahui ada atau tidak ada the effect of natural approach on students‟ speaking mastery X grade - SMA Negeri 3 - Padangsidimpuan. Penelitian ini adalah penelitian eksperimen. Populasi penelitian ini adalah 6 kelas pada kelas X SMA Negeri 3 Padangsidimpuan, kemudian, total populasi pada penelitian ini adalah 230 siswa. Dengan demikian, terdapat 2 kelas yang dipilih secara acak sebagai sample, yaitu kelas X MIA-1 sebagai ekperimen kelas dan erdiri dari 40 siswa dan kelas X MIA-2 sebagai kelas control yang terdiri dari 40 siswa. Sementara, data penelitian diperoleh dari pre-test dan post-test, dan untuk menganalisa data, peneliti menggunakan t-test formula. Setelah menganalisa data, peneliti mendapatkan bahwa mean score dari kelas eksperimen lebih tinggi daripada kelas control. Terlebih, Mean score dari kelas eksperimen dan kelas control pada pre test adalah (59.34 < 63.7), mean score kelas ekperimen dan kelas control pada post test adalah (79.25 > 72.48). Disamping itu, score dari tcount lebih besar dari ttable (3.18 > 2.00). hal tersebut bermakna bahwa hypothesis alternative (Ha) dapat diterima dan H0 ditolak. Oleh karenanya, terdapat efek yang signifikan terhadap Natural Approach pada penguasaan Speaking siswa kelas X SMA Negeri 3 Padangsidimpuan.
Keywords: Pendekatan Natural dan Penguasaan Speaking Siswa
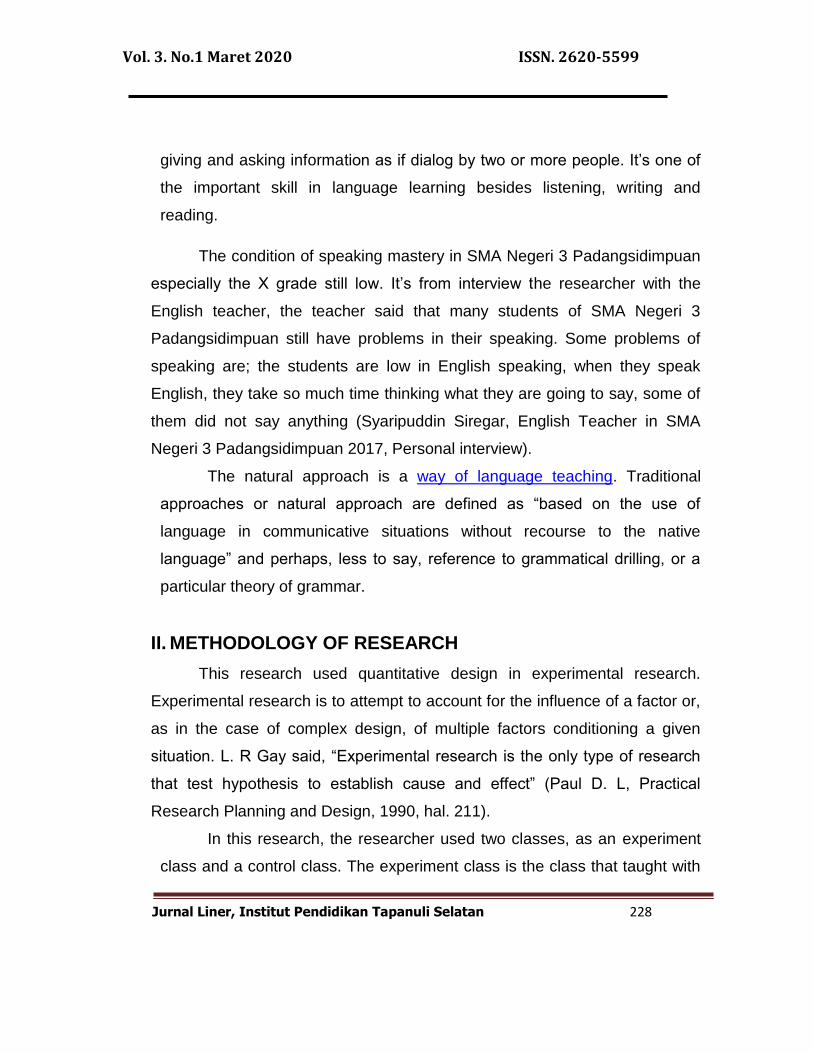
I. INTRODUCTION
In Indonesia curriculum, there are four skills required in English
teaching learning program. They are listening, speaking, reading, and
writing. The first, listening is the act of concentrating on hearing something.
The second, speaking is the action of conveying information or expression
one‟s thoughts and feelings in spoken language. The third, reading is when
someone looks into a written text and starts to absorb the information from
the written linguistic message. The fourth, writing is the process of using
symbols to communicate thought and ideas in a readable form.
Speaking is one of the central elements of communication. In
speaking, there is a process of communication between speaker and
listener. People put ideas into words, talking about perceptions and feeling
they want other people to understand. Also can be defined as an activity in
Vol. 3. No.1 Maret 2020 ISSN. 2620-5599
Jurnal Liner, Institut Pendidikan Tapanuli Selatan 228
giving and asking information as if dialog by two or more people. It‟s one of
the important skill in language learning besides listening, writing and
reading.
The condition of speaking mastery in SMA Negeri 3 Padangsidimpuan
especially the X grade still low. It‟s from interview the researcher with the
English teacher, the teacher said that many students of SMA Negeri 3
Padangsidimpuan still have problems in their speaking. Some problems of
speaking are; the students are low in English speaking, when they speak
English, they take so much time thinking what they are going to say, some of
them did not say anything (Syaripuddin Siregar, English Teacher in SMA
Negeri 3 Padangsidimpuan 2017, Personal interview).
The natural approach is a way of language teaching. Traditional
approaches or natural approach are defined as “based on the use of
language in communicative situations without recourse to the native
language” and perhaps, less to say, reference to grammatical drilling, or a
particular theory of grammar.
II. METHODOLOGY OF RESEARCH
This research used quantitative design in experimental research.
Experimental research is to attempt to account for the influence of a factor or,
as in the case of complex design, of multiple factors conditioning a given
situation. L. R Gay said, “Experimental research is the only type of research
that test hypothesis to establish cause and effect” (Paul D. L, Practical
Research Planning and Design, 1990, hal. 211).
In this research, the researcher used two classes, as an experiment
class and a control class. The experiment class is the class that taught with
Vol. 3. No.1 Maret 2020 ISSN. 2620-5599
Jurnal Liner, Institut Pendidikan Tapanuli Selatan 229
natural approach method as a treatment and the control class is the class
that taught with a treatment by conventional teaching. The researcher
design of this research can be seen from the table:
Moreover, the researcher takes 6 classes of students SMA Negeri 3
Padangsidimpuan at the X grade as population. According to Gay,
population is the group of interest to the researcher, the group to which she
or he would like the result of the study and it will be generalizeable.
Besides, the researcher used random sampling. Random sampling is
the process of selecting a sample in such a way that all in individuals in
defined population have an equal and independent chance of being selected
for sample ( L.R. Gay & Peter Airisian, Educational Research: Competent for
Analysis and Application, hal. 123)
Finally, the researcher used test as instrumentation. The instrument
that had been used in this research is speaking test. Test is some of
question or view or other tool used for measure skill, knowledge,
intelligence and ability. There are some testing speaking, like: verbal
essay, oral presentation, interview, interaction task, conversation,
discussion and so on.
III. RESULT
In order to evaluate the effect of Natural Approach on Students‟
Speaking Mastery at the grade X of SMA Negeri 3 Padangsidimpuan, the
researcher has calculated the data uing pre-test and post-test. Applying
quantitative analysis, the researcher used the formulation of Analysis
variant, continued by T-test, the researcher describe the data as follow:
Vol. 3. No.1 Maret 2020 ISSN. 2620-5599
Jurnal Liner, Institut Pendidikan Tapanuli Selatan 230
1. Data Description of Pre-test
a. Pre-test Score of Experimental Class
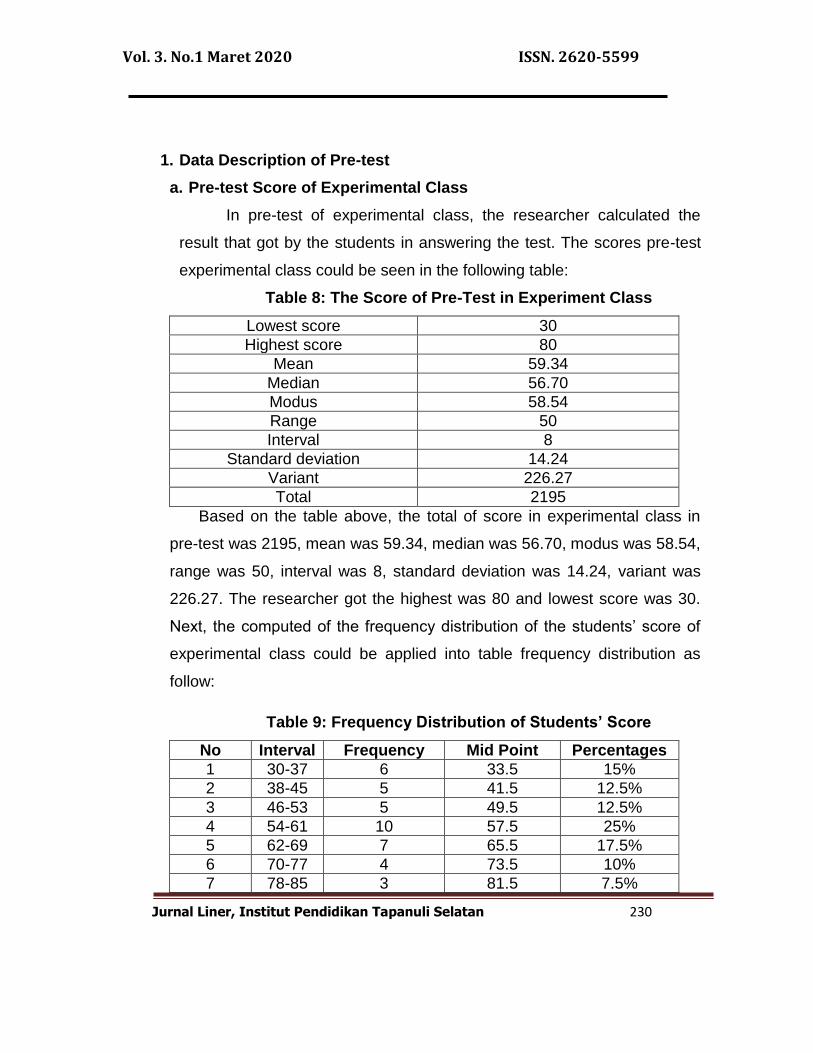
In pre-test of experimental class, the researcher calculated the
result that got by the students in answering the test. The scores pre-test
experimental class could be seen in the following table:
Table 8: The Score of Pre-Test in Experiment Class
Lowest score 30
Highest score 80
Mean 59.34
Median 56.70
Modus 58.54
Range 50
Interval 8
Standard deviation 14.24
Variant 226.27
Total 2195
Based on the table above, the total of score in experimental class in
pre-test was 2195, mean was 59.34, median was 56.70, modus was 58.54,
range was 50, interval was 8, standard deviation was 14.24, variant was
226.27. The researcher got the highest was 80 and lowest score was 30.
Next, the computed of the frequency distribution of the students‟ score of
experimental class could be applied into table frequency distribution as
follow:
Table 9: Frequency Distribution of Students’ Score
No Interval Frequency Mid Point Percentages
1 30-37 6 33.5 15%
2 38-45 5 41.5 12.5%
3 46-53 5 49.5 12.5%
4 54-61 10 57.5 25%
5 62-69 7 65.5 17.5%
6 70-77 4 73.5 10%
7 78-85 3 81.5 7.5%
Vol. 3. No.1 Maret 2020 ISSN. 2620-5599
Jurnal Liner, Institut Pendidikan Tapanuli Selatan 231
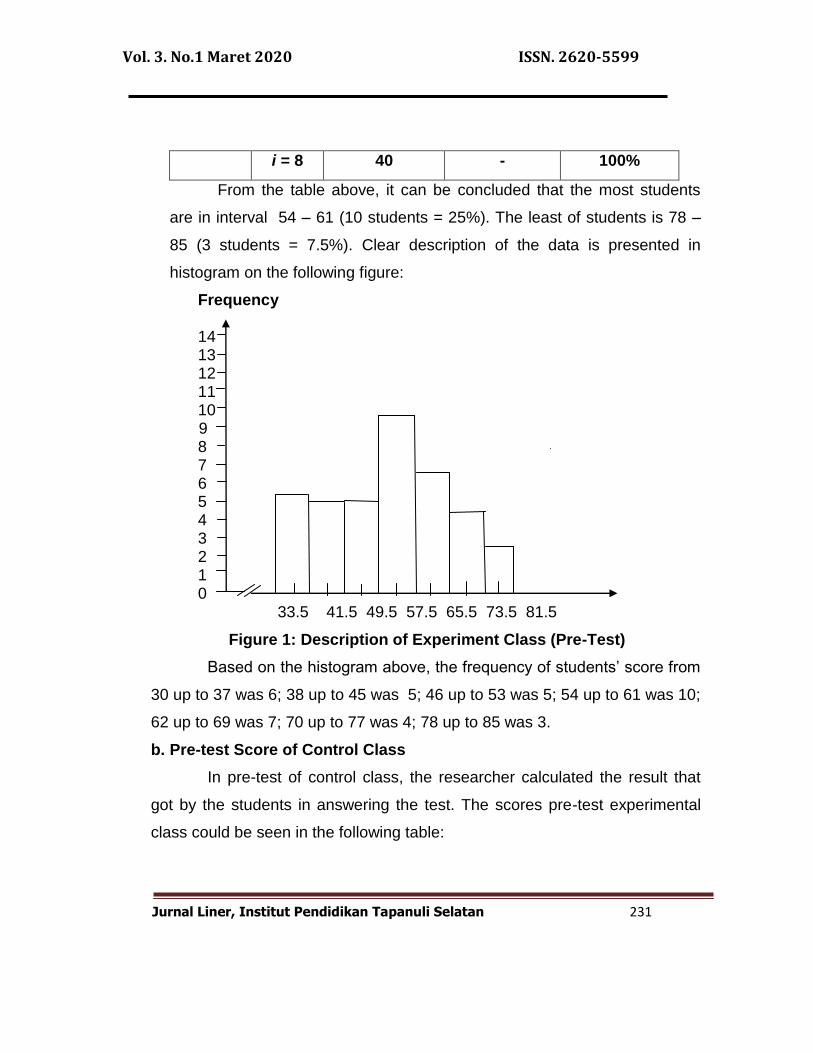
i = 8 40 - 100%
From the table above, it can be concluded that the most students
are in interval 54 – 61 (10 students = 25%). The least of students is 78 –
85 (3 students = 7.5%). Clear description of the data is presented in
histogram on the following figure:
Frequency
14 13
12 11 10 9 8 7 6 5 4 3 2 1 0
33.5 41.5 49.5 57.5 65.5 73.5 81.5
Figure 1: Description of Experiment Class (Pre-Test)
Based on the histogram above, the frequency of students‟ score from
30 up to 37 was 6; 38 up to 45 was 5; 46 up to 53 was 5; 54 up to 61 was 10;
62 up to 69 was 7; 70 up to 77 was 4; 78 up to 85 was 3.
b. Pre-test Score of Control Class
In pre-test of control class, the researcher calculated the result that
got by the students in answering the test. The scores pre-test experimental
class could be seen in the following table:
Vol. 3. No.1 Maret 2020 ISSN. 2620-5599
Jurnal Liner, Institut Pendidikan Tapanuli Selatan 232
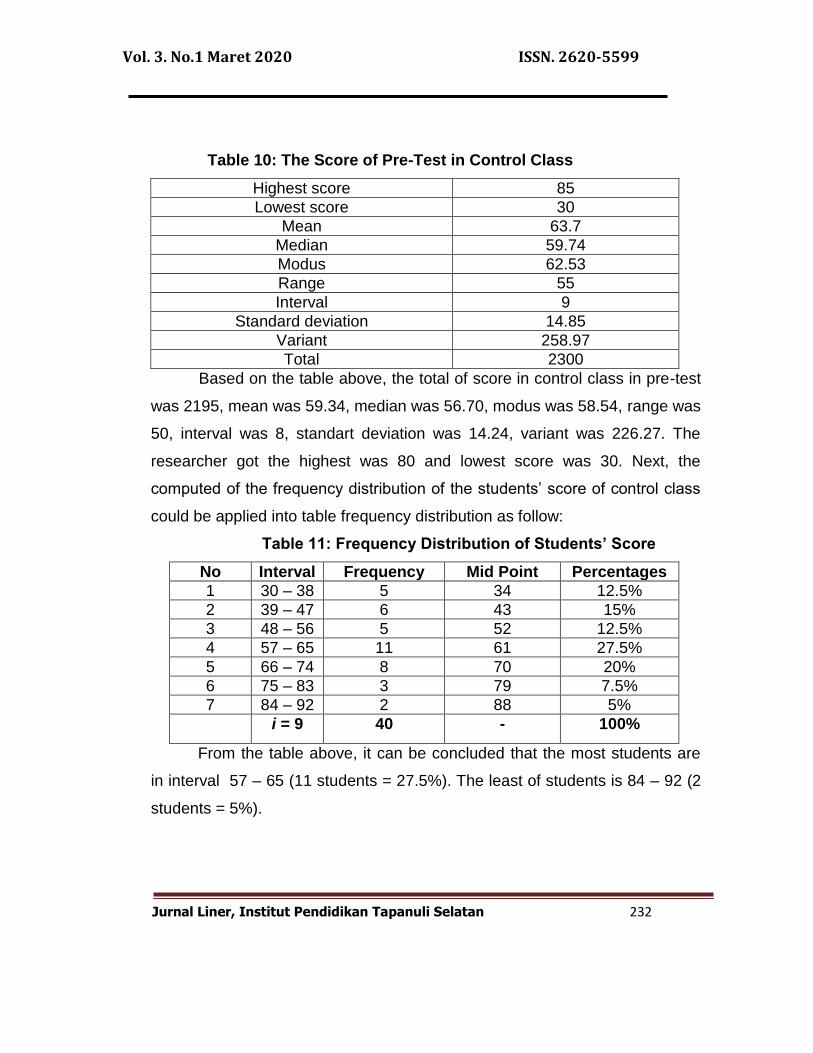
Table 10: The Score of Pre-Test in Control Class
Highest score 85
Lowest score 30
Mean 63.7
Median 59.74
Modus 62.53
Range 55
Interval 9
Standard deviation 14.85
Variant 258.97
Total 2300
Based on the table above, the total of score in control class in pre-test
was 2195, mean was 59.34, median was 56.70, modus was 58.54, range was
50, interval was 8, standart deviation was 14.24, variant was 226.27. The
researcher got the highest was 80 and lowest score was 30. Next, the
computed of the frequency distribution of the students‟ score of control class
could be applied into table frequency distribution as follow:
Table 11: Frequency Distribution of Students’ Score
No Interval Frequency Mid Point Percentages
1 30 – 38 5 34 12.5%
2 39 – 47 6 43 15%
3 48 – 56 5 52 12.5%
4 57 – 65 11 61 27.5%
5 66 – 74 8 70 20%
6 75 – 83 3 79 7.5%
7 84 – 92 2 88 5%
i = 9 40 - 100%
From the table above, it can be concluded that the most students are
in interval 57 – 65 (11 students = 27.5%). The least of students is 84 – 92 (2
students = 5%).
Vol. 3. No.1 Maret 2020 ISSN. 2620-5599
Jurnal Liner, Institut Pendidikan Tapanuli Selatan 233
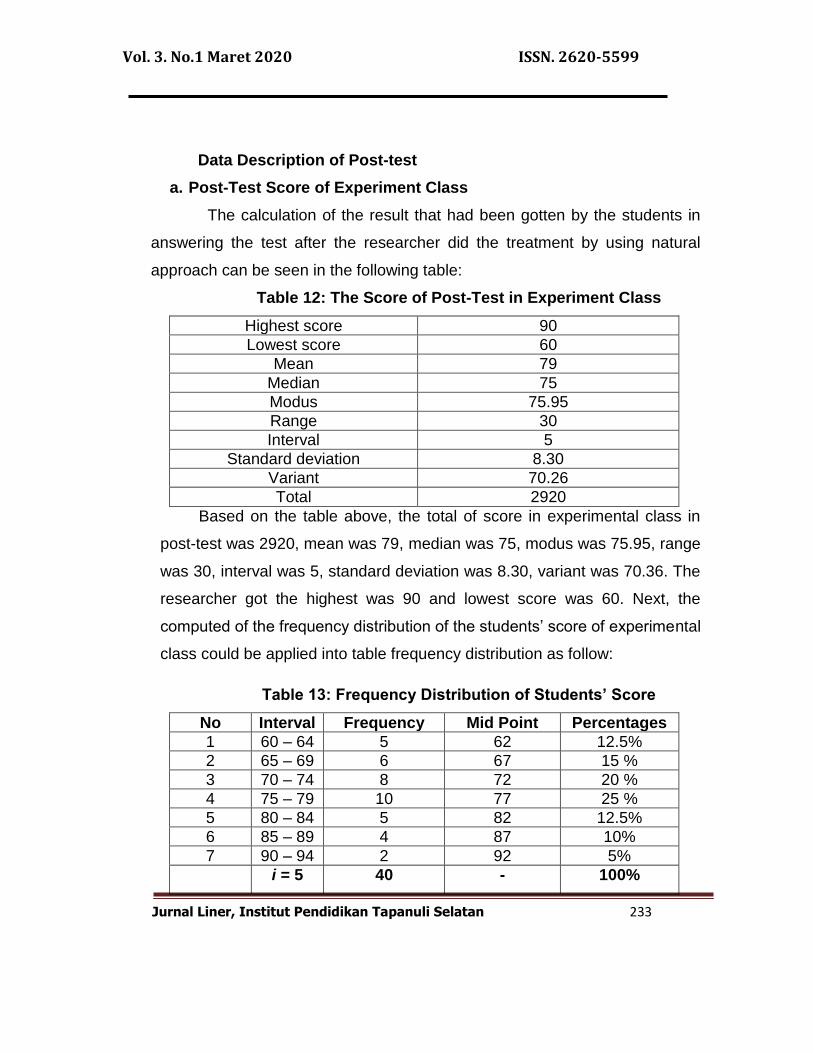
Data Description of Post-test
a. Post-Test Score of Experiment Class
The calculation of the result that had been gotten by the students in
answering the test after the researcher did the treatment by using natural
approach can be seen in the following table:
Table 12: The Score of Post-Test in Experiment Class
Highest score 90
Lowest score 60
Mean 79
Median 75
Modus 75.95
Range 30
Interval 5
Standard deviation 8.30
Variant 70.26
Total 2920
Based on the table above, the total of score in experimental class in
post-test was 2920, mean was 79, median was 75, modus was 75.95, range
was 30, interval was 5, standard deviation was 8.30, variant was 70.36. The
researcher got the highest was 90 and lowest score was 60. Next, the
computed of the frequency distribution of the students‟ score of experimental
class could be applied into table frequency distribution as follow:
Table 13: Frequency Distribution of Students’ Score
No Interval Frequency Mid Point Percentages
1 60 – 64 5 62 12.5%
2 65 – 69 6 67 15 %
3 70 – 74 8 72 20 %
4 75 – 79 10 77 25 %
5 80 – 84 5 82 12.5%
6 85 – 89 4 87 10%
7 90 – 94 2 92 5%
i = 5 40 - 100%
Vol. 3. No.1 Maret 2020 ISSN. 2620-5599
Jurnal Liner, Institut Pendidikan Tapanuli Selatan 234
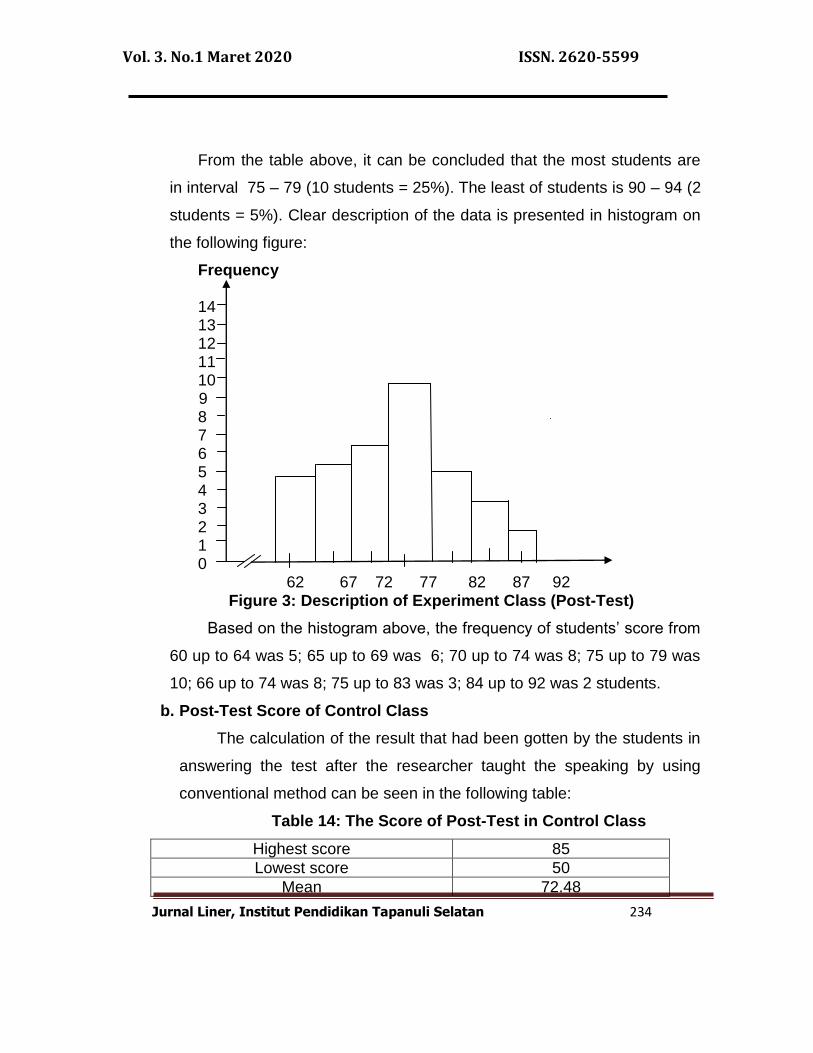
From the table above, it can be concluded that the most students are
in interval 75 – 79 (10 students = 25%). The least of students is 90 – 94 (2
students = 5%). Clear description of the data is presented in histogram on
the following figure:
Frequency 14
13 12 11 10 9 8 7 6 5 4 3 2 1 0
62 67 72 77 82 87 92 Figure 3: Description of Experiment Class (Post-Test)
Based on the histogram above, the frequency of students‟ score from
60 up to 64 was 5; 65 up to 69 was 6; 70 up to 74 was 8; 75 up to 79 was
10; 66 up to 74 was 8; 75 up to 83 was 3; 84 up to 92 was 2 students.
b. Post-Test Score of Control Class
The calculation of the result that had been gotten by the students in
answering the test after the researcher taught the speaking by using
conventional method can be seen in the following table:
Table 14: The Score of Post-Test in Control Class
Highest score 85
Lowest score 50
Mean 72.48
Vol. 3. No.1 Maret 2020 ISSN. 2620-5599
Jurnal Liner, Institut Pendidikan Tapanuli Selatan 235
Median 69.30
Modus 71.10
Range 35
Interval 6
Standard deviation 9.06
Variant 69.49
Total 2740
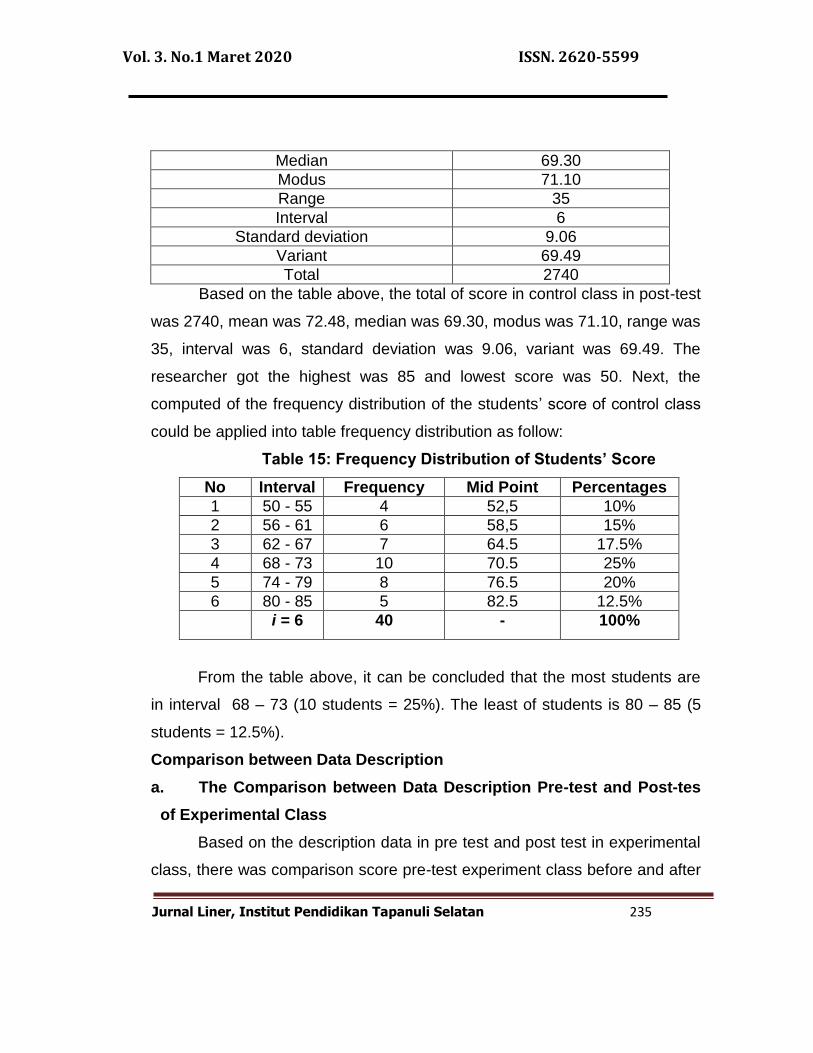
Based on the table above, the total of score in control class in post-test
was 2740, mean was 72.48, median was 69.30, modus was 71.10, range was
35, interval was 6, standard deviation was 9.06, variant was 69.49. The
researcher got the highest was 85 and lowest score was 50. Next, the
computed of the frequency distribution of the students‟ score of control class
could be applied into table frequency distribution as follow:
Table 15: Frequency Distribution of Students’ Score
No Interval Frequency Mid Point Percentages
1 50 - 55 4 52,5 10%
2 56 - 61 6 58,5 15%
3 62 - 67 7 64.5 17.5%
4 68 - 73 10 70.5 25%
5 74 - 79 8 76.5 20%
6 80 - 85 5 82.5 12.5%
i = 6 40 - 100%
From the table above, it can be concluded that the most students are
in interval 68 – 73 (10 students = 25%). The least of students is 80 – 85 (5
students = 12.5%).
Comparison between Data Description
a. The Comparison between Data Description Pre-test and Post-tes
of Experimental Class
Based on the description data in pre test and post test in experimental
class, there was comparison score pre-test experiment class before and after
Vol. 3. No.1 Maret 2020 ISSN. 2620-5599
Jurnal Liner, Institut Pendidikan Tapanuli Selatan 236
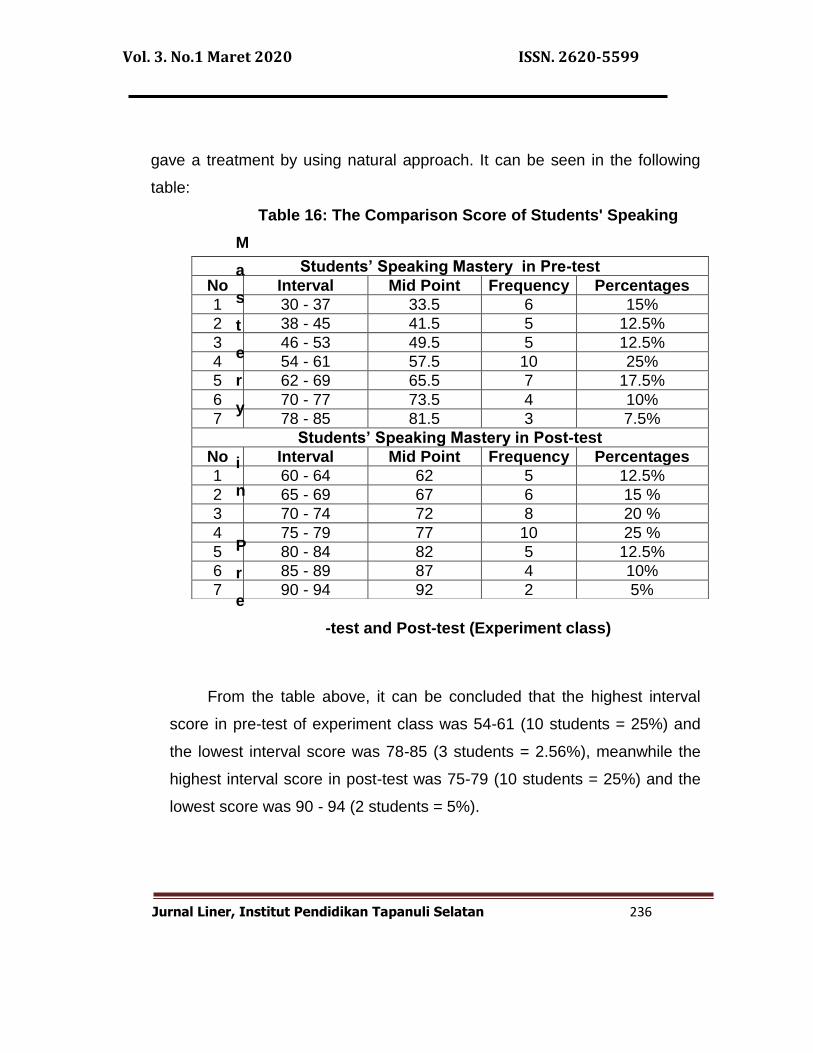
gave a treatment by using natural approach. It can be seen in the following
table:
Table 16: The Comparison Score of Students' Speaking
M
a
s
t
e
r
y
i
n
P
r
e
-test and Post-test (Experiment class)
From the table above, it can be concluded that the highest interval
score in pre-test of experiment class was 54-61 (10 students = 25%) and
the lowest interval score was 78-85 (3 students = 2.56%), meanwhile the
highest interval score in post-test was 75-79 (10 students = 25%) and the
lowest score was 90 - 94 (2 students = 5%).
Students’ Speaking Mastery in Pre-test
No Interval Mid Point Frequency Percentages
1 30 - 37 33.5 6 15%
2 38 - 45 41.5 5 12.5%
3 46 - 53 49.5 5 12.5%
4 54 - 61 57.5 10 25%
5 62 - 69 65.5 7 17.5%
6 70 - 77 73.5 4 10%
7 78 - 85 81.5 3 7.5%
Students’ Speaking Mastery in Post-test
No Interval Mid Point Frequency Percentages
1 60 - 64 62 5 12.5%
2 65 - 69 67 6 15 %
3 70 - 74 72 8 20 %
4 75 - 79 77 10 25 %
5 80 - 84 82 5 12.5%
6 85 - 89 87 4 10%
7 90 - 94 92 2 5%
Vol. 3. No.1 Maret 2020 ISSN. 2620-5599
Jurnal Liner, Institut Pendidikan Tapanuli Selatan 237
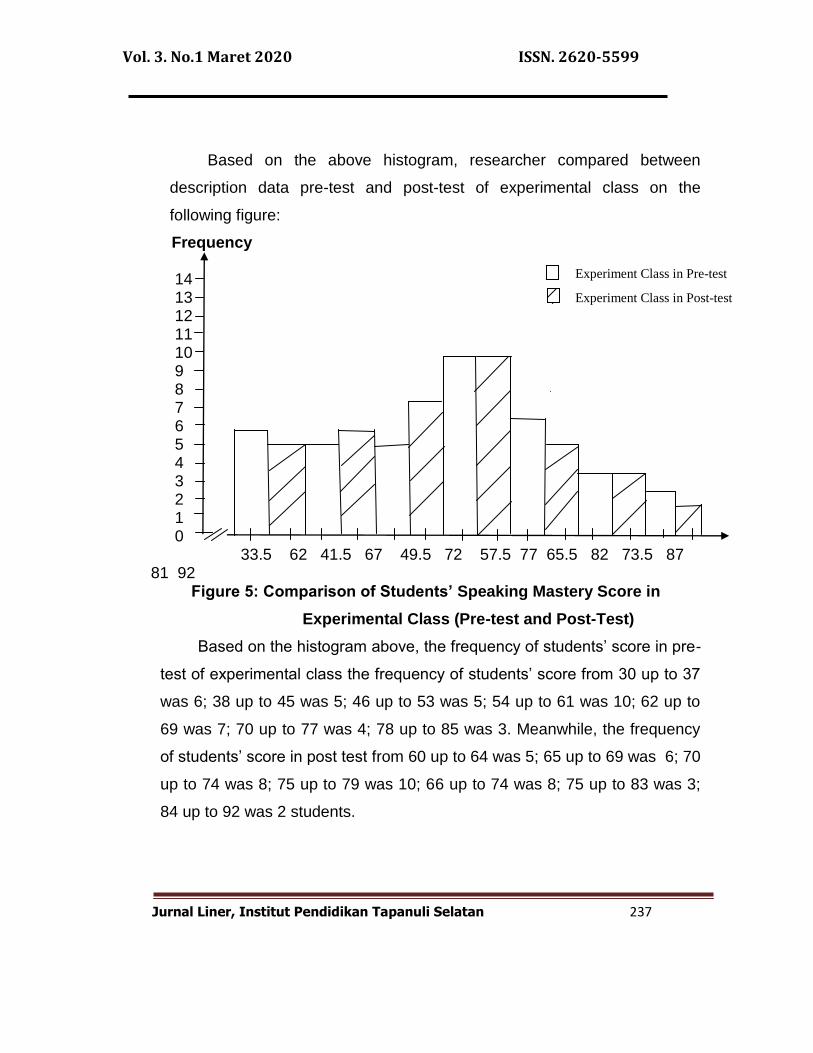
Based on the above histogram, researcher compared between
description data pre-test and post-test of experimental class on the
following figure:
Frequency
14 13 12 11 10 9 8 7 6 5 4 3 2 1 0
33.5 62 41.5 67 49.5 72 57.5 77 65.5 82 73.5 87 81 92
Figure 5: Comparison of Students’ Speaking Mastery Score in
Experimental Class (Pre-test and Post-Test)
Based on the histogram above, the frequency of students‟ score in pre-
test of experimental class the frequency of students‟ score from 30 up to 37
was 6; 38 up to 45 was 5; 46 up to 53 was 5; 54 up to 61 was 10; 62 up to
69 was 7; 70 up to 77 was 4; 78 up to 85 was 3. Meanwhile, the frequency
of students‟ score in post test from 60 up to 64 was 5; 65 up to 69 was 6; 70
up to 74 was 8; 75 up to 79 was 10; 66 up to 74 was 8; 75 up to 83 was 3;
84 up to 92 was 2 students.
Experiment Class in Pre-test
Experiment Class in Post-test
Vol. 3. No.1 Maret 2020 ISSN. 2620-5599
Jurnal Liner, Institut Pendidikan Tapanuli Selatan 238
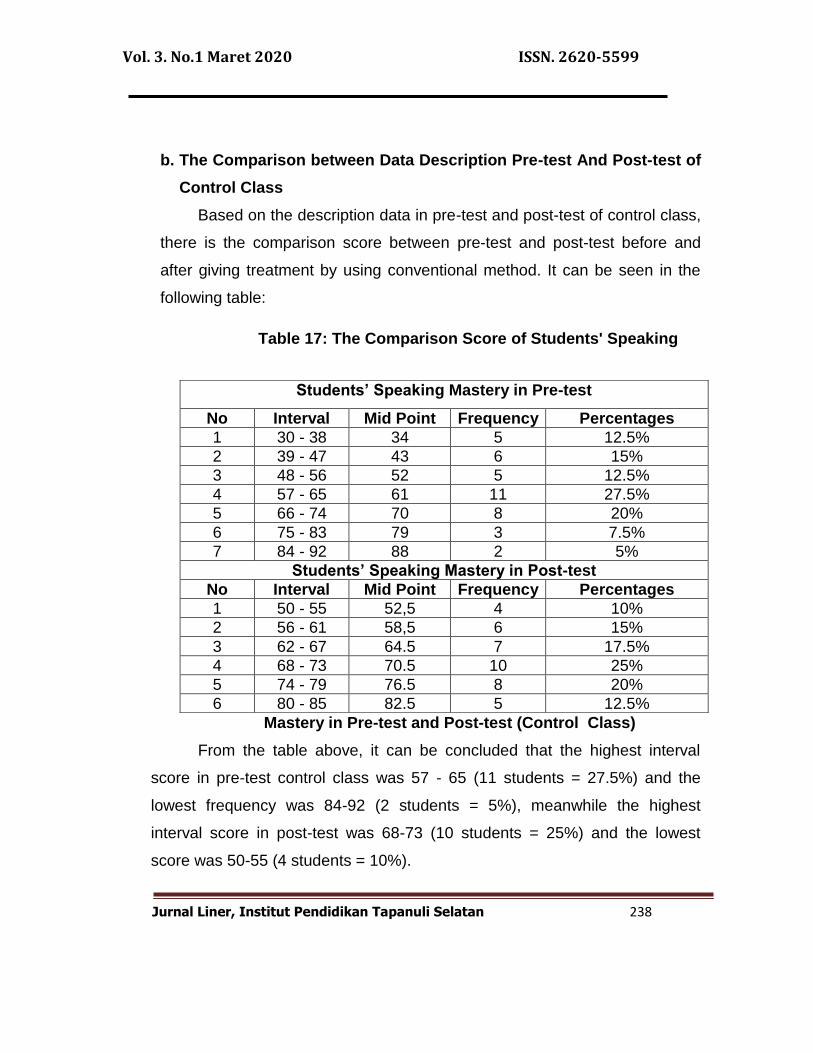
b. The Comparison between Data Description Pre-test And Post-test of
Control Class
Based on the description data in pre-test and post-test of control class,
there is the comparison score between pre-test and post-test before and
after giving treatment by using conventional method. It can be seen in the
following table:
Table 17: The Comparison Score of Students' Speaking
Mastery in Pre-test and Post-test (Control Class)
From the table above, it can be concluded that the highest interval
score in pre-test control class was 57 - 65 (11 students = 27.5%) and the
lowest frequency was 84-92 (2 students = 5%), meanwhile the highest
interval score in post-test was 68-73 (10 students = 25%) and the lowest
score was 50-55 (4 students = 10%).
Students’ Speaking Mastery in Pre-test
No Interval Mid Point Frequency Percentages
1 30 - 38 34 5 12.5%
2 39 - 47 43 6 15%
3 48 - 56 52 5 12.5%
4 57 - 65 61 11 27.5%
5 66 - 74 70 8 20%
6 75 - 83 79 3 7.5%
7 84 - 92 88 2 5%
Students’ Speaking Mastery in Post-test
No Interval Mid Point Frequency Percentages
1 50 - 55 52,5 4 10%
2 56 - 61 58,5 6 15%
3 62 - 67 64.5 7 17.5%
4 68 - 73 70.5 10 25%
5 74 - 79 76.5 8 20%
6 80 - 85 82.5 5 12.5%
Vol. 3. No.1 Maret 2020 ISSN. 2620-5599
Jurnal Liner, Institut Pendidikan Tapanuli Selatan 239
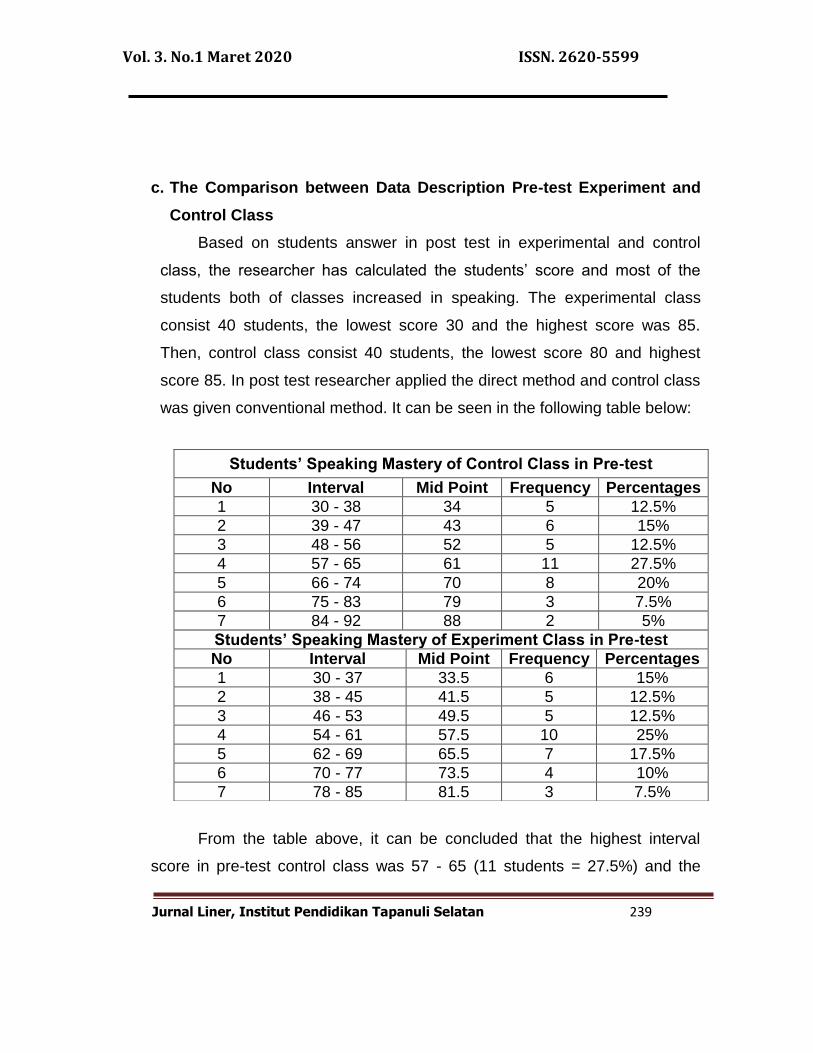
c. The Comparison between Data Description Pre-test Experiment and
Control Class
Based on students answer in post test in experimental and control
class, the researcher has calculated the students‟ score and most of the
students both of classes increased in speaking. The experimental class
consist 40 students, the lowest score 30 and the highest score was 85.
Then, control class consist 40 students, the lowest score 80 and highest
score 85. In post test researcher applied the direct method and control class
was given conventional method. It can be seen in the following table below:
From the table above, it can be concluded that the highest interval
score in pre-test control class was 57 - 65 (11 students = 27.5%) and the
Students’ Speaking Mastery of Control Class in Pre-test
No Interval Mid Point Frequency Percentages
1 30 - 38 34 5 12.5%
2 39 - 47 43 6 15%
3 48 - 56 52 5 12.5%
4 57 - 65 61 11 27.5%
5 66 - 74 70 8 20%
6 75 - 83 79 3 7.5%
7 84 - 92 88 2 5%
Students’ Speaking Mastery of Experiment Class in Pre-test
No Interval Mid Point Frequency Percentages
1 30 - 37 33.5 6 15%
2 38 - 45 41.5 5 12.5%
3 46 - 53 49.5 5 12.5%
4 54 - 61 57.5 10 25%
5 62 - 69 65.5 7 17.5%
6 70 - 77 73.5 4 10%
7 78 - 85 81.5 3 7.5%
Vol. 3. No.1 Maret 2020 ISSN. 2620-5599
Jurnal Liner, Institut Pendidikan Tapanuli Selatan 240
lowest frequency was 84-92 (2 students = 5%), meanwhile the highest
interval score of experiment class in pre-test was 54-61 (10 students = 25%)
and the lowest score was 78-85 (3 students = 7.5%).
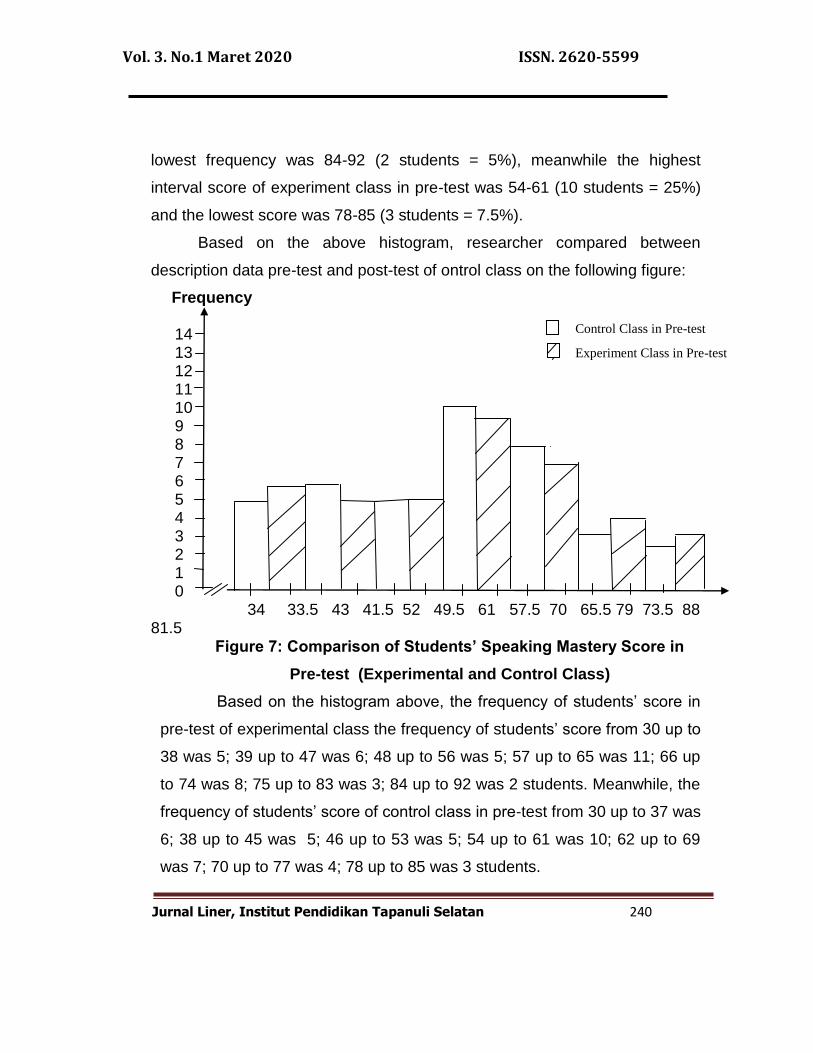
Based on the above histogram, researcher compared between
description data pre-test and post-test of ontrol class on the following figure:
Frequency
14 13 12 11 10 9 8 7 6 5 4 3 2 1 0
34 33.5 43 41.5 52 49.5 61 57.5 70 65.5 79 73.5 88 81.5
Figure 7: Comparison of Students’ Speaking Mastery Score in
Pre-test (Experimental and Control Class)
Based on the histogram above, the frequency of students‟ score in
pre-test of experimental class the frequency of students‟ score from 30 up to
38 was 5; 39 up to 47 was 6; 48 up to 56 was 5; 57 up to 65 was 11; 66 up
to 74 was 8; 75 up to 83 was 3; 84 up to 92 was 2 students. Meanwhile, the
frequency of students‟ score of control class in pre-test from 30 up to 37 was
6; 38 up to 45 was 5; 46 up to 53 was 5; 54 up to 61 was 10; 62 up to 69
was 7; 70 up to 77 was 4; 78 up to 85 was 3 students.
Control Class in Pre-test
Experiment Class in Pre-test
Vol. 3. No.1 Maret 2020 ISSN. 2620-5599
Jurnal Liner, Institut Pendidikan Tapanuli Selatan 241
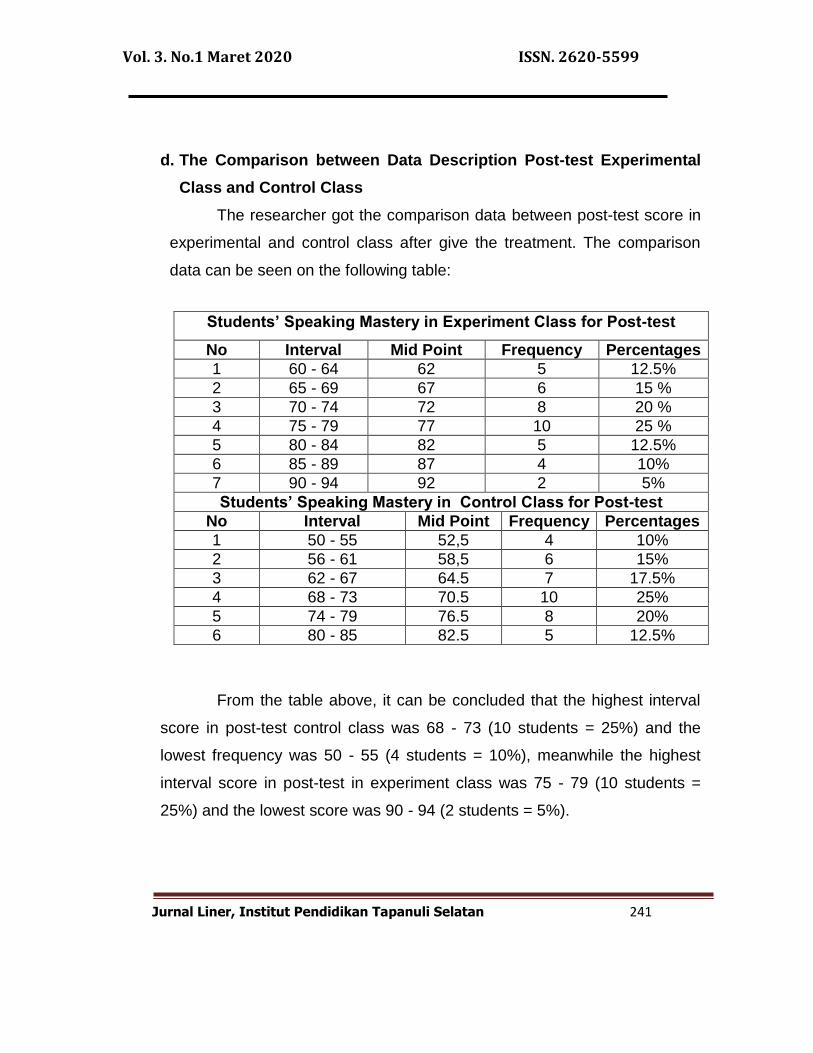
d. The Comparison between Data Description Post-test Experimental
Class and Control Class
The researcher got the comparison data between post-test score in
experimental and control class after give the treatment. The comparison
data can be seen on the following table:
From the table above, it can be concluded that the highest interval
score in post-test control class was 68 - 73 (10 students = 25%) and the
lowest frequency was 50 - 55 (4 students = 10%), meanwhile the highest
interval score in post-test in experiment class was 75 - 79 (10 students =
25%) and the lowest score was 90 - 94 (2 students = 5%).
Students’ Speaking Mastery in Experiment Class for Post-test
No Interval Mid Point Frequency Percentages
1 60 - 64 62 5 12.5%
2 65 - 69 67 6 15 %
3 70 - 74 72 8 20 %
4 75 - 79 77 10 25 %
5 80 - 84 82 5 12.5%
6 85 - 89 87 4 10%
7 90 - 94 92 2 5%
Students’ Speaking Mastery in Control Class for Post-test
No Interval Mid Point Frequency Percentages
1 50 - 55 52,5 4 10%
2 56 - 61 58,5 6 15%
3 62 - 67 64.5 7 17.5%
4 68 - 73 70.5 10 25%
5 74 - 79 76.5 8 20%
6 80 - 85 82.5 5 12.5%
Vol. 3. No.1 Maret 2020 ISSN. 2620-5599
Jurnal Liner, Institut Pendidikan Tapanuli Selatan 242
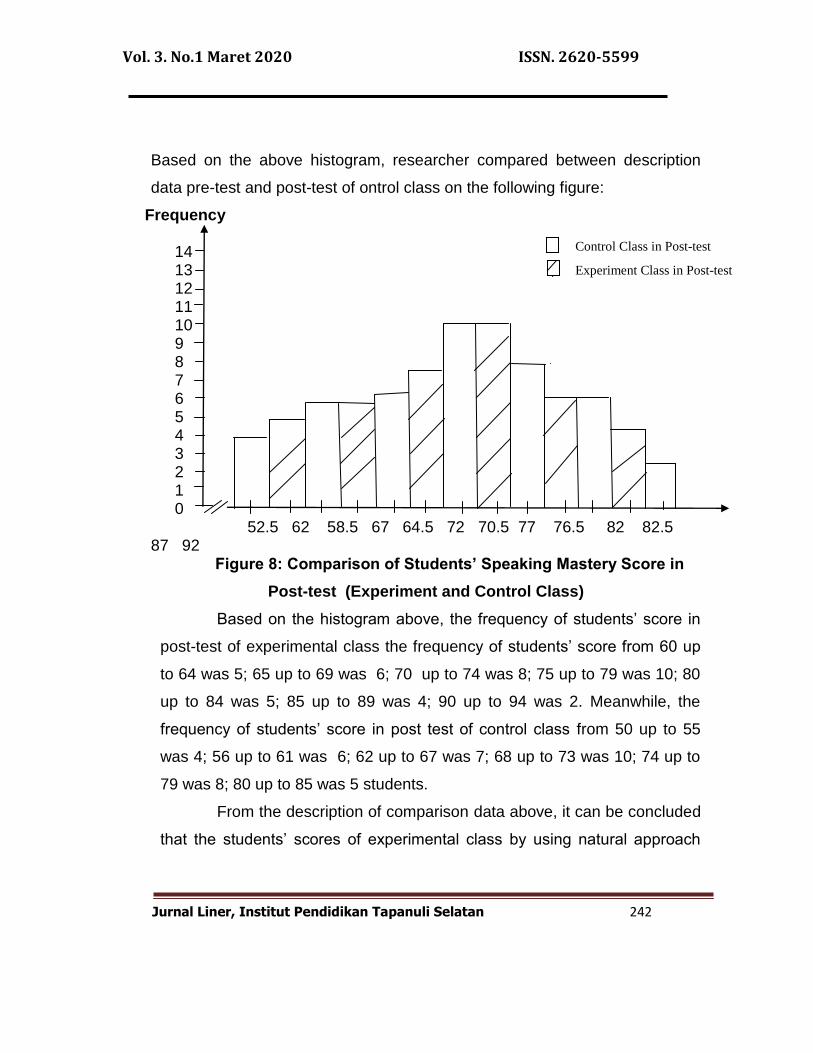
Based on the above histogram, researcher compared between description
data pre-test and post-test of ontrol class on the following figure:
Frequency
14 13 12 11 10 9 8 7 6 5 4 3 2 1 0
52.5 62 58.5 67 64.5 72 70.5 77 76.5 82 82.5 87 92
Figure 8: Comparison of Students’ Speaking Mastery Score in
Post-test (Experiment and Control Class)
Based on the histogram above, the frequency of students‟ score in
post-test of experimental class the frequency of students‟ score from 60 up
to 64 was 5; 65 up to 69 was 6; 70 up to 74 was 8; 75 up to 79 was 10; 80
up to 84 was 5; 85 up to 89 was 4; 90 up to 94 was 2. Meanwhile, the
frequency of students‟ score in post test of control class from 50 up to 55
was 4; 56 up to 61 was 6; 62 up to 67 was 7; 68 up to 73 was 10; 74 up to
79 was 8; 80 up to 85 was 5 students.
From the description of comparison data above, it can be concluded
that the students‟ scores of experimental class by using natural approach
Control Class in Post-test
Experiment Class in Post-test
Vol. 3. No.1 Maret 2020 ISSN. 2620-5599
Jurnal Liner, Institut Pendidikan Tapanuli Selatan 243
was higher than the students‟ score of control class by using conventional
method.
A. Technique of Data Analysis
1. Requirement Test
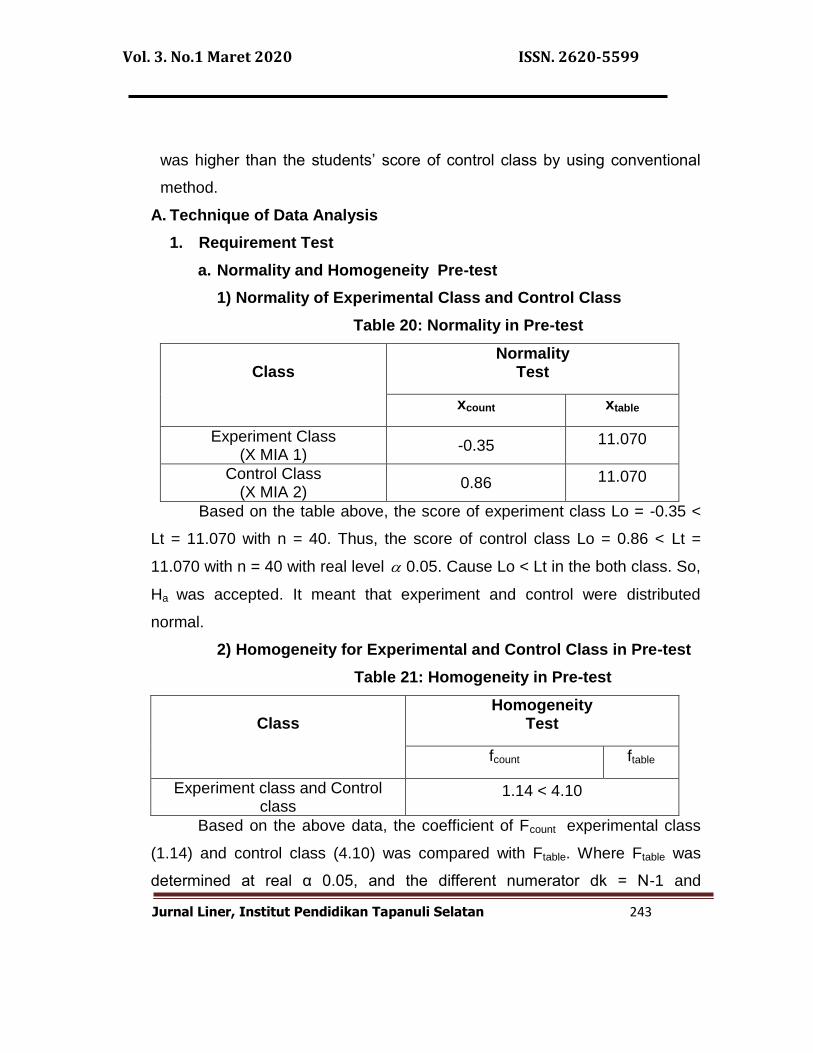
a. Normality and Homogeneity Pre-test
1) Normality of Experimental Class and Control Class
Table 20: Normality in Pre-test
Class
Normality Test
xcount xtable
Experiment Class (X MIA 1)
-0.35 11.070
Control Class (X MIA 2)
0.86 11.070
Based on the table above, the score of experiment class Lo = -0.35 <
Lt = 11.070 with n = 40. Thus, the score of control class Lo = 0.86 < Lt =
11.070 with n = 40 with real level 0.05. Cause Lo < Lt in the both class. So,
Ha was accepted. It meant that experiment and control were distributed
normal.
2) Homogeneity for Experimental and Control Class in Pre-test
Table 21: Homogeneity in Pre-test
Class
Homogeneity Test
fcount ftable
Experiment class and Control class
1.14 < 4.10
Based on the above data, the coefficient of Fcount experimental class
(1.14) and control class (4.10) was compared with Ftable. Where Ftable was
determined at real α 0.05, and the different numerator dk = N-1 and
Vol. 3. No.1 Maret 2020 ISSN. 2620-5599
Jurnal Liner, Institut Pendidikan Tapanuli Selatan 244
denominator dk 40-1 = 39 (X MIA1); 40-1= 39 ( X MIA2). So, by using the list
of critical value at F distribution, it was got F0.05 = 4.10. It showed that Fcount
1.14 < Ftable 4.10. So, it meant that the variant from the data of the Students‟
Speaking Mastery at X grade of SMA Negeri 3 Padangsidimpuan by
experimental class and control class were homogenous.
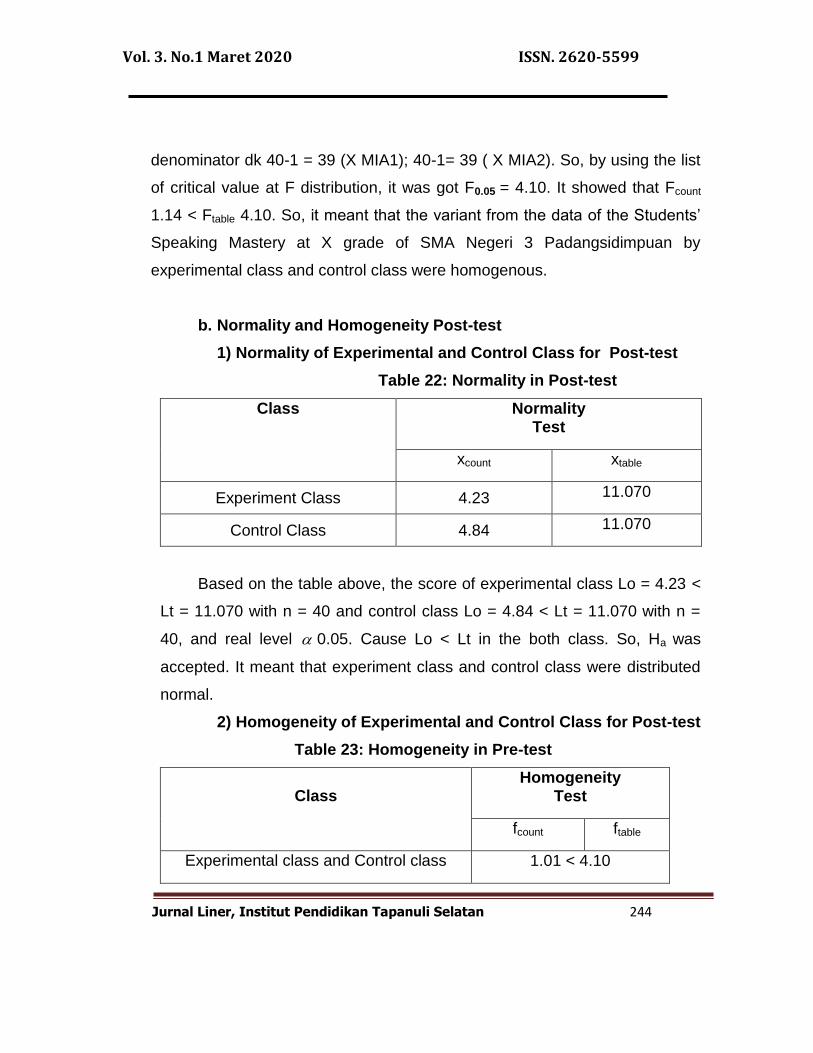
b. Normality and Homogeneity Post-test
1) Normality of Experimental and Control Class for Post-test
Table 22: Normality in Post-test
Class Normality Test
xcount xtable
Experiment Class 4.23 11.070
Control Class 4.84 11.070
Based on the table above, the score of experimental class Lo = 4.23 <
Lt = 11.070 with n = 40 and control class Lo = 4.84 < Lt = 11.070 with n =
40, and real level 0.05. Cause Lo < Lt in the both class. So, Ha was
accepted. It meant that experiment class and control class were distributed
normal.
2) Homogeneity of Experimental and Control Class for Post-test
Table 23: Homogeneity in Pre-test
Class
Homogeneity Test
fcount ftable
Experimental class and Control class 1.01 < 4.10
Vol. 3. No.1 Maret 2020 ISSN. 2620-5599
Jurnal Liner, Institut Pendidikan Tapanuli Selatan 245
The coefficient of Fcount = 1.01 was compared with Ftable. Where Ftable
was determined at real α 0.05, and the different numerator dk = N-1 = 40-1
= 39 and denominator dk N-1 = 40-1 =39. So, by using the list of critical
value at F distribution, it is got F0.05 = 4.10. It showed that Fcount 1.01 < Ftable
4.10. So, it meant that the variant from the data of the Students‟ Speaking
Mastery at X grade of SMA Negeri 3 Padangsidimpuan by experimental and
control class was homogenous.
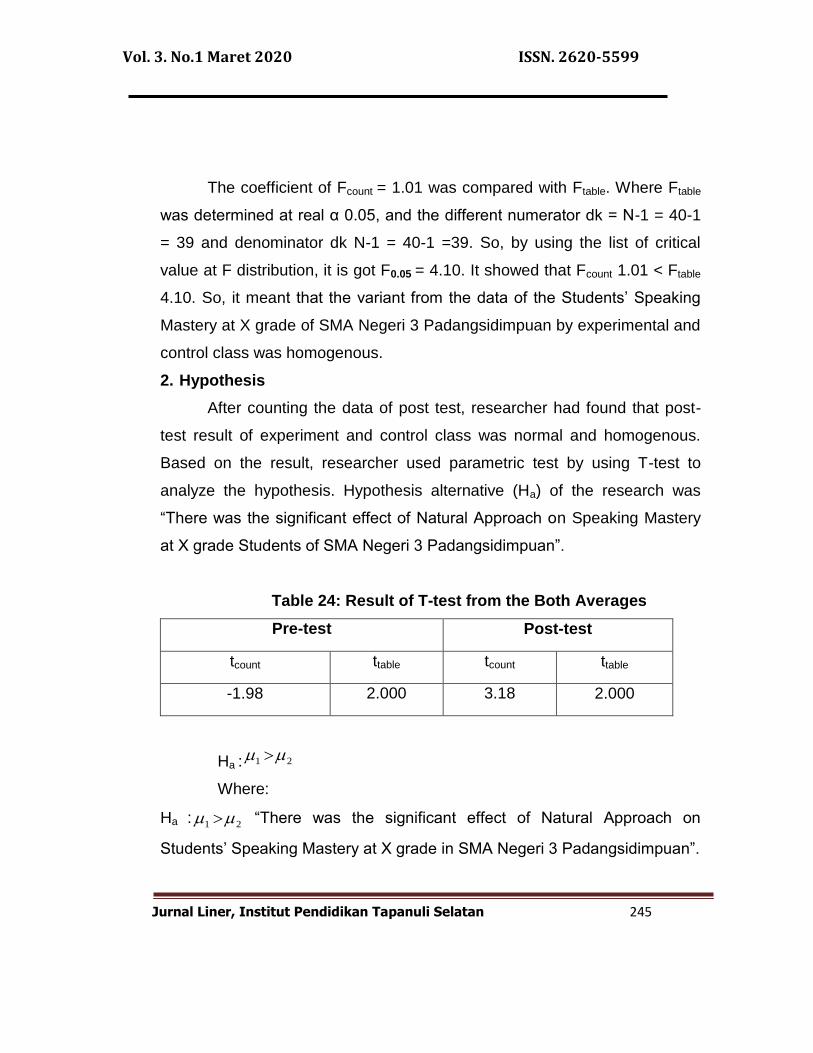
2. Hypothesis
After counting the data of post test, researcher had found that post-
test result of experiment and control class was normal and homogenous.
Based on the result, researcher used parametric test by using T-test to
analyze the hypothesis. Hypothesis alternative (Ha) of the research was
“There was the significant effect of Natural Approach on Speaking Mastery
at X grade Students of SMA Negeri 3 Padangsidimpuan”.
Table 24: Result of T-test from the Both Averages
Pre-test Post-test
tcount ttable tcount ttable
-1.98 2.000 3.18 2.000
Ha : 21
Where:
Ha : 21 “There was the significant effect of Natural Approach on
Students‟ Speaking Mastery at X grade in SMA Negeri 3 Padangsidimpuan”.
Vol. 3. No.1 Maret 2020 ISSN. 2620-5599
Jurnal Liner, Institut Pendidikan Tapanuli Selatan 246
Based on researcher count, the researcher found that tcount in post
test was 3.18 while ttable 2.000 with opportunity (1 – α ) = 1 - 5% = 95% and
dk = n1 + n2 – 2 = 40 + 40 – 2 = 78. Cause tcount > ttable (3.18 > 2.000), it
meant that hypothesis Ha was accepted and H0 was rejected. So, there was
the significant effect of Natural Approach on Students‟ Speaking Mastery at
X grade in SMA Negeri 3 Padangsidimpuan. In this case, the mean score of
experimental class by using Natural Approach was 79.25 and mean score of
control class was 72.48 by using conventional technique.
IV. DISCUSSION
The researcher discussed the result of this research and compared
with the related findings. It also discussed with the theory that has been
stated by the researcher. Related to the theory from Kreshen and Terrel
identified the natural approach with what they call “traditional” approaches to
language teaching. Traditional approaches are defined as “based on the use
of language in communicative situations without recourse to the native
language” and perhaps, need less to say, reference to grammatical drilling,
or a particular theory of grammar.
Based on the related findings, Eka L. Koncara said that
communicative approach suitable to teach speaking mastery.
Communicative approach can increase students‟ speaking mastery because
teaching learning process in the classroom easier and live. So, it was make
the class more active study and the students to understand material easily.
Next, Terri Halimah said that used technique in teaching speaking
can be more effective way to increase students speaking mastery. It can be
seen that the students‟ speaking mastery was well. So, the score of
students‟ speaking mastery after using technique than before using
Vol. 3. No.1 Maret 2020 ISSN. 2620-5599
Jurnal Liner, Institut Pendidikan Tapanuli Selatan 247
technique activity. It meant that the drama technique activity was suitable to
teach students‟ speaking mastery.
Then, Ade Ira Safitri said that chain drill technique suitable to teach
speaking mastery. Students became easier in speaking without afraid
making mistake. So, the implication clustering technique was suitable to
teach students‟ speaking mastery and give a positive effect on students‟
speaking mastery.
The researcher result and theory has proven that this approach is good
where the students were enthusiastic to follow the lesson. The students feel
easy to speaking.
This proves that natural approach was suitable to be applied in teaching
English. So, natural approach has given the effect to the research that has
been done by researcher or the other researcher who mentioned in related
findings.
Threats of the Research
The research was limited in some situations. It was the problem in the
class that appeared during doing the research, but the researcher couldn‟t
hold or improve those things. The limitation of the research was as follow:
1. The researcher was not sure whether all of students in the experimental
class and control class did the test honestly. There was a possibility that
some of them answered the test by copying or imitating their friends‟
answer.
2. Some of students were not too serious in answering the pre-test and
post-test. It may caused by the test, because they knew before that the
test would not influence their score in school. It made them answer the
test without thinking hard and the answer of the test was not pure
because they did not do it seriously
Vol. 3. No.1 Maret 2020 ISSN. 2620-5599
Jurnal Liner, Institut Pendidikan Tapanuli Selatan 248
CONCLUSION
Conclusion
Based on the result of the research, the conclusion of this research is
there was the effect of natural approach on speaking mastery at the X grade
students of SMA Negeri 3 Padangsidimpuan. The researcher found the data
before using natural approach the mean score of experimental class was
59.34.Then, after using natural approach the mean score of experimental
class was 79.25. Then, The researcher found the result of t-test where t0
was higher than tt. t0was 3.18 and tt was 2.000 (3.18 >2.000). It means that
where Ha was accepted and H0 was rejected.
REFERENCES
Ahmadi Abu, Strategi Belajar Mengajar, Bandung: Pustaka Setia, 2005. Arikunto Suharsimi, Prosedur Penelitian Suatu Pendekatan Praktik, Jakarta:
Rineka Cipta, 2006. Creswell, John W., Research Design: Qualitative, Quantitative and Mixed
Method Approaches 2nd Edition, California; Sage Publication, 2003. Deriden Jhon, Conventional Technique,
http://www.britania.com/ebchecked/topic/ 421797/nucler-strategy, accesed at October 24th , 2017 retrieved on 10.00 p.m
Djamarah Syaiful Bahri, Strategy Belajar-Mengajar, Jakarta: Asdi Mahasatya, 2006.
D. L, Paul, Practical Research Planning and Design, (Newyork: Mc Milan Publishing Company, 1990
Ekayanti, Natural Approach, http:/www.google.co.id/amp/s/. wordpress.com accessed at December 7, 2017 retrieved on 11.00 am.
Gay, L.R & Peter Airasian, Educational Research: Competent for Analysis and Application, New Jersey: Prentice Hall, 2000.
Gattegno, Caleb. Teaching Foreign Language in Schools, New York: Educational Solution,1972. Hudson, “The meaning of Conventional Teaching”, http://www.conventional-
strategy/topic/54372-strategy, retrieved on October, 02nd 2017. Harmer, Jeremy, The Practical of English Language Teaching, New York:
Longman, 2000.
Vol. 3. No.1 Maret 2020 ISSN. 2620-5599
Jurnal Liner, Institut Pendidikan Tapanuli Selatan 249
Hornby A.S, Oxford Advanced Learner’s Dictionary, New York: Oxford University Press,1995.
Hidayat Riski, Wiki Answers Community, http//www.answer.com. accessed at July 30, 2018 retrived on 14: 52 am
Irianto Agus, Statistik Konsep Dasar dan Aplikasinya, Padang: P2LPTK Departemen Pendidikan Nasional, 2003.
Istarani, Kumpulan 40 Metode pembelajaran, Medan: Media Persada, 2012 Mardalis, Metode Penelitian: Suatu Pendekatan Proposal, Jakarta: Bumi
Aksara, 2003. Nunan, David. Practical English Language Teaching, New York: Mc.Grow
Hill, 2003. Nelson, Thomas. The Award Compact English Dictionary, London: Award
Publication, 1985. Pham Thihanh, Learners‟ and Teachers‟ Preference fot Classroom Activities,
Essex University: Essex University Press, 2005. Peraturan Menteri Pendidikan Nasional No. 22 Tahun 2006 Tentang Standar Isi. Purwati Latif Dwi, Metode Strategi Pembelajaran,
http://perencanaanpembelajaran.weebly.com/uploads/1/6/6/4/16643218/tugas_mandiri_pp.pdf, accessed at October 24, 2017 retrieved on 10.12 p.m.
Richard Jack C. And Theodore S. Rodgers, Approaches and Methods in Language Teaching, Cambridge University Press, 1986.
Richard, Jack C. and Richard Schmidt, Longman Dictionary of Language Teaching and Applied Linguistics, Third Edition, Harlow: Pearson Education, 2002.
Sugiyono, Metode Penelitian Kuantitatif, Kualitatif, dan R&D, Bandung: Alfabeta, 2013.
Ur,Penny. A Course in Language Teaching, United Kingdom: University Press, 2000.
Vanderkevent, Teaching Speaking and Component of Speaking, New York: Cambridge University Press, 1990
Widiati Utami, dkk. Bahasa Inggris, Jakarta : Kementerian Pendidikan dan Kebudayaan, 2014.
Related Documents