THE EFFECT OF CONDITIONING ON FROTH FLOTATION A thesis submitted to the UNNERSITY OF CAPE TOWN in fulfilment of the requirements for the degree of MASTER OF SCIENCE IN ENGINEERING by Daryl Henwood, B.Sc. (Chem Eng) (Cape Town) Department of Chemical Engineering University of Cape Town Rondebosch 7700 Sou th Africa ,. July 1994

Welcome message from author
This document is posted to help you gain knowledge. Please leave a comment to let me know what you think about it! Share it to your friends and learn new things together.
Transcript
THE EFFECT OF CONDITIONING
ON
FROTH FLOTATION
A thesis submitted to the
UNNERSITY OF CAPE TOWN
in fulfilment of the requirements for the degree of
MASTER OF SCIENCE IN ENGINEERING
by Daryl Henwood, B.Sc. (Chem Eng) (Cape Town)
Department of Chemical Engineering
University of Cape Town
Rondebosch
7700
Sou th Africa
,. July 1994

The copyright of this thesis vests in the author. No quotation from it or information derived from it is to be published without full acknowledgement of the source. The thesis is to be used for private study or non-commercial research purposes only.
Published by the University of Cape Town (UCT) in terms of the non-exclusive license granted to UCT by the author.

SYNOPSIS
The method and extent to which mineral slurries are conditioned have been shown to greatly
affect flotation grades and recovery. Most of this work is very mineral specific and centres
around one or two operating variables. One of the major obstacles to understanding the
effects of such pretreatment more fully, and to developing a global understanding of
conditioning, is the system specific nature of the procedures applied to each mineral, and the
apparently conflicting results across a range of mineral types.
This thesis sets out to define conditioning both broadly enough to encompass _almost all
aspects of conditioning, as well as specifically enough to be useful in the study of single
mineral-collector systems. Having done this, a measure of the efficiency or effectiveness of
conditioning is devised and used to evaluate the relative effects of variables of conditioning,
as well as to gain some insight into the mechanisms affecting the results. The work is
completed by relating these observations to expected results in industrial applications and their
implications on plant procedures.
Most forms of conditioning for flotation were found to fit into two basic categories, which
if they both take place in the same process, follow one another sequentially. In this thesis,
these were termed "primary" and "secondary" conditioning, and were defined as follows:
Primary Conditioning relates to the physical preparation of the surJace of the particles,
including comminution, oxidation, acid leaching and bacterial pretreatment.
Secondary Conditioning is the process whereby prepared particles are rendered
hydrophobic or hydrophilic through mixing, control of the environment an'd contacting
wiJh reagents.
It was also found in the literature that primary conditioning is very ore specific, while
secondary conditioning is almost universally applied. For this reason, the present work
concentrates on the most common aspect of secondary conditioning, namely the adsorption
of collector onto the mineral surface in order to render it hydrophobic for flotation. In
most instances, this is carried out as a heterogeneous stirred tank reaction, with a surface
reaction (adsorption of collector onto a mineral surface) as the primary event. The variables
most likely to affect such a process were considered to be (the variables tested in this work
are indicated by italics):
1

ORE:
COLLECTOR:
SYSTEM:
SYNOPSIS
Mineral type and degree of liberation
Grind size, affecting such features as surface to volume ratio
Pulp density
T)rpe, including solubility, polarity and molecule size
Dosage
Attachment mechanism
pH
Time
Mixing (power and turbulence)
Method of agitation (turbulence distribution)
Temperature
Ionic Strength
Having thus defined conditioning, and identified the factors most likely to affect it, it was
necessary to devise a measure of conditioning efficiency or effectiveness (since none exists)
to be able to evaluate the relative effects of the variables of conditioning.
Previous work was critically analyzed to gain a better understanding of how conditioning
might be measured. In particular, the thesis of F.J.N. Stassen [1990] was scrutinised. The l
analysis showed that it would be necessary to divorce flotation from the test procedure, if
conditioning effects were to be isolated from the complicating factors of the flotation pulp and
froth phases. Hence the measurement of conditioning was divided into two aspects:
1) The measurement of collector adsorption
2) The measurement of flotation response of given levels of adsorption
Adsorption of collector was measured indirectly using UV spectrophotometry. This was used
to measure the removal of collector from solution, from which adsorption onto the mineral
surface was inferred (by difference).
Microflotation was chosen as the technique used to relate flotation response to adsorption.
The advantage of microflotation over other flotation systems, is its use of very small
quantities of mineral and the ability to operate the system without the complicating froth
phase.
The mineral-collector system finally chosen for the test work was pyrite-thiols. There were
a number of advantages to using this system over many others, including the applicability of
. 11

-------------------------------------
SYNOPSIS
this system to industry and the large body of literature available on topic. The adsorption
reactions are however complex and not completely understood.
The test work was carried out using gravity concentrated pyrite milled to +75-106 µm and
two thiol collectors, potassium n-butyl xanthate and sodium n-propyl dithiocarbamate.
Samples were conditioned in a specially designed baffled cylindrical vessel, agitated by a
pitched blade impeller. The power input into conditioning could be varied by altering the
impeller rpm, or the conditioning time. The test program investigated the effects on the
efficiency of conditioning of all the variables indicated above.
· The variables found to have the greatest effect on conditioning results are as follows:
Effect of Collector Type - It was shown that different collectors adsorb onto the mineral
surface at different rates and may have different equilibrium levels of adsorption. How
this affects collector choice depends on the kinetics of the system and the extent of
conditioning provided by the plant operated.
Effect of Duration and Power of Conditioning - The duration and power input into
conditioning were found to be the most important variables affecting adsorption.
Previous work suggested that energy input was of primary importance. This work,
however, shows both theoretically and practically that this is not the case. Rather, the
manner in which the energy is added, either through duration or power, is more crucial
and depends largely on whether the system is diffusion rate controlled or surface
reaction rate controlled. The optimal energy input for a plant could be calculated using
a costing function.
Effect of Collector Concentration and Pulp Density - Varying concentration and pulp
density led to some unexpected findings. The collector used in most of the tests was
found to ionise only weakly and hence the reaction rate constant was adversely affected
by increasing collector doses. The partial ionisation also resulted in the total lack of
any advantage to be found by increasing pulp density, concentrating the collector
without increasing dosage. Nevertheless, overdosing with collector was shown to
provide the required adsorption within a much shorter conditioning period, than would
otherwise be required for the minimum necessary dosage.
The work showed that conditioning is controlled by the factors pertaining to heterogenous
stirred tank reactions. While the actual importance of each variable is specific to the
lll

SYNOPSIS
application and conditions used, they are all explained in terms of the adsorption of collector
onto the mineral surface. Hence, the relative importance of diffusion and of the reaction, in
controlling adsorption rate, determines the variables to be considered when optimising
conditioning. With all variables, there is a trade-off between improved conditioning and
increased costs. Use of a costing function appears to be the best method of optimising
conditioning in industrial applications.
lV

AKNOWLEDGEMENTS
ACKNOWLEDGEMENTS
A thesis is never the creative product of one person, but rather a team effort. This work was
certainly no exception. A few organisations and people deserve special thanks for their help
in bringing this thesis to fruition. Thank you to:
The Foundation for Research and Development - for their funding
Anglo American Corporation - for their help and funding, especially to Mr Ian Watson
for his support and enthusiasm
My parents - for their financial and emotional support
Mrs Dee Bradshaw - for her constant support, her help and her companionship
Mrs Loma Wall and Mrs Helen Divey - for the their assistance _in the lab
Professor J-P. Franzidis - for his help, his guidance and his ample use of red ink.
Finally, Miss Caroline Haworth - without who's insistence and support this thesis would
probably never have been submitted
v

TABLE OF CONTENTS
SYNOPSIS............................................... 1
ACKNOWLEDGEMENTS .................................... v
TABLE OF CONTENTS . . . . . . . . . . . . . . . . . . . . . . . . . . . . . . . . . . . . v1
LIST OF FIGURES . . . . . . . . . . . . . . . . . . . . . . . . . . . . . . . . . . . . . . . . . x
CHAPTER 1 - INTRODUCTION . . . . . . . . . . . . . . . . . . . . . . . . . . . . . . . . 1
1.1. Background . ·. . . . . . . . . . . . . . . . . . . . . . . . . . . . . . . . . . . . . . . . . . 1
1.2. Research Outline . . . . . . . . . . . . . . . . . . . . . . . . . . . . . . . . . . . . . . . . 2
CHAPTER 2 - LITERATURE REVIEW . . . . . . . . . . . . . . . . . . . . . . . . . . . 4
2.1. Introduction . . . . . . . . . . . . . . . . . . . . . . . . . . . . . . . . . . . . . . . . . . . 4
2.2. Principles of Flotation . . . . . . . . . . . . . . . . . . . . . . . . . . . . . . . . . . . . 4
2.2.1. Flotation Sub-processes . . . . . . . . . . . . . . . . . . . . . . . . . . . . . . . 6
2.2.1.1. Conditioning of the Ore . . . . . . . . . . . . . . . . . . . . . 6
2.2.1.2. Attachment of Mineral Particles to Bubbles . . . . . . . . . 7
2.2.1.3. Froth Formation and Removal . . . . . . . . . . . . . . . . . 7
2.3. Definition of Conditioning . . . . . . . . . . . . . . . . . . . . . . . . . . . . . . . . . . 7
2.4. The Structure of Collectors . . . . . . . . . . . . . . . . . . . . . . . . . . . . . . . . 11
2.4.1. Anionic Collectors ............................. : . . . 12
2.4.2. Cationic Collectors . . . . . . . . . . . . . . . . . . . . . . . . . . . . . . . . . 13
2. 5. Stages in Conditioning . _. . . . . . . . . . . . . . . . . . . . . . . . . . . . . . . . . . 14
2.5 .1. Diffusion to the mineral surface . . . . . . . . . . . . . . . . . . . . . . . . . 15
2.5.2. Displacement of water . . . . . . . . . . . . . . . . . . . . . . . . . . . . . . . 16
2.6. Thermodynamics and Kinetics of Conditioning and Flotation . . . . . . . . . . . 18
2.6.1. Thermodynamic Criterion for Conditioning . . . . . . . . . . . . . . . . . . 18
2.6.2. Kinetic Criterion for Conditioning . . . . . . . . . . . . . . . . . . . . . . . 21
2. 7. Mathematical Modelling of Flotation - The Klimpel Flotation Model . . . . . . 24
2.8. Shear-flocculation . . . . . . . . . . . . . . . . . . . . . . . . . . . . . . . . . . . . . . 26
2.9. Research in Conditioning . . . . . . . . . . . . . . . . . . . . . . . . . . . . . . . . . 28
2.9.1. Stassen . . . . . . . . . . . . . . . . . . . . . . . . . . . . . . . . . . . . . . . . 33
2.9.2. Ralston . . . . . . . . . . . . . . . . . . .. . . . . . . . . . . . . . . . . . . . . . 37
VI

TABLE OF CONTENTS
2.9.2.1. Flotation as a function of particle size and surface
coverage . . . . . . . . . . . . . . . . . . . . . . . . . . . . . . . . . . . 3 7
2.9.2.2. Influence of Ionic Strength on Flotation Response . . . . 40
2.9.2.3. Flotation recovery as a function of time . . . . . . . . . . 41
2.10. Summary . . . . . . . . . . . . . . . . . . . . . . . . . . . . . . . . . . . . . . . . . . . . 42
CHAPTER 3 - CRITIQUE OF STASSEN'S WORK . . . . . . . . . . . . . . . . . . . 45
3.1. Introduction . . . . . . . . . . . . . . . . . . . . . . . . . . . . . . . . . . . . . . . . . . 45
3.2. Experimental Technique . . . . . . . . . . . . . . . . . . . . . . . . . . . . . . . . . . 45
3.3. Derivation of Stassen's Model . . . . . . . . . . . . . . . . . . . . . . . . . . . . . . 47
3.4. Stassen's Results and Regressed Model . . . . . . . . . . . . . . . . . . . . . . . . . 52
3.5. The Model's Assumptions . . . . . . . . . . . . . . . . . . . . . . . . . . . . . . . . . 53
3.6. Continued Conditioning During Flotation . . . . . . . . . . . . . . . . . .. . . . . . 60
3. 7. Reproducibility . . . . . . . . . . . . . . . . . . . . . . . . . . . . . . . . . . . . . . . . 66
3. 8. Graphical Re-Interpretation of Data - the Importance of Power and Time vs
Energy . : . . . . . . . . . . . . . . . . . . . . . . . . . . . . . . . . . . . . . . . . . . . 66
3.9. Attrition Mechanism . . . . . . . . . . . . . . . . . . . . . . . . . . . . . . . . . . . . 70
3.10. Conclusion . . . . . . . . . . . . . . . . . . . . . . . . . . . . . . . . . . . . . . . . . . 71
CHAPTER 4 - DEVEWPMENT OF APPROPRIATE TECHNIQUES FOR
MEASURING THE EFFECTIVENESS OF CONDITIONING . . . . . . . . 73
4.1. Introduction . . . . . . . . . . . . . . . . . . . . . . . . . . . . . . . . . . . . . . . . . . 73
4.2. Adsorption as a Measure of Conditioning ......... ; . . . . . . . . . . . . . 74
4.2.1. Surface and Monolayer Coverage . . . . . . . . . . . . . . . . . . . . . . . . 75
4.2.2. Measuring Residual Collector in Solution . . . . . . . . . . . . . . . . . . . 77
4.2.3. Choice of an Appropriate Mineral-Collector System . . . . . . . . . . . . 78
4.2.3.1. Quartz-Amine System . . . . . . . . . . . . . . . . . . . . . . 78
4.2.3.2. Pyrite-Thiol System . . . . . . . . . . . . . . . . . . . . . . . 78
4.3. Relating Adsorption to Flotation: Microflotation . . . . . . . . . . . . . . . . . . . 83
4.4. Experimental Equipment and Procedures . . . . . . . . . . . . . . . . . . . . . . . . 84
4.4.1. Conditioning Tests . . . . . . . . . . . . . . . . . . . . . . . . . . . . . . . . . 84
4.4.1.1. The Conditioning Vessel . . . . . . . . . . . . . . . . . . . . 84
4.4.1.2. Power Input . . . . . . . . . . . . . . . . . . . . . . . . . . . . 87
4.4.1.3. Collector Addition Point . . . . . . . . . . . . . . . . . . . . 88
4.4.1.4. Experimental Procedure -. . . . . . . . . . . . . . . . . . . . 88
4.4.2. Adsorption Response . . . . . . . . . . . . . . . . . . . . . . . . . . . . . . . 90
4.4.3. Flotation Response . . . . . . . . . . . . . . . . . . . . . . . . . . . . . . . . . 92
Vll

4.4.3.1.
4.4.3.2.
TABLE OF CONTENTS
Microflotation cell .......... ·. . . . . . . . . . . . . . 92
Experimental Procedure . . . . . . . . . . . . . . . . . . . . 93
4.5. Preliminary Work . . . . . . . . . . . . . . . . . . . . . . . . . . . . . . . . . . . . . . 94
4.5.1. Quartz-Amine Adsorption . . . . . . . . . . . . . . . . . . . . . . . . . . . . 94
4.5.1.1. Measurement of concentrated solutions of HPYC . . . . . 95
4.5.1.2. Measurement of dilute solutions of HPYC . . . . . . . . . 97
4.5.1.3. Absorbency of conditioned slurry with no collector
added . . . . . . . . . . . . . . . . . . . . . . . . . . . . . . . . . . . . . 97
4.5.1.4. Conclusions on amine absorbency spectra . . . . . . . . . 98
4.5.2. Quartz-Amine Microflotation . . . . . . . . . . . . . . . . . . . . . . . . . . 99
4.5.2.1., Reproducibility . . . . . . . . . . . . . . . . . . . . . . . . . . 99
4.5.2.2. Effect of collector dosage . . . . . . . . . . . . . . . . . . . 100
4.5.2.3.
4.5.2.4.
Effect of conditioning time . . . . . . . . . . . . . . . . . . 101
Shear-flocculation . . . . . . . . . . . . . . . . . . . . . . . . 103
4.5.3. Pyrite-Thiol Microflotation . . . . . . . . . . . . . . . . . . . . . . . . . . . . 103
4.5 .4. Pyrite-Thiol Adsorption . . . . . . . . . . . . . . . . . . . . . . . . . . . . . . 109
4.6. Conclusion . . . . . . . . . . . . . . . . . . . . . . . . . . . . . . . . . . . . . . . . . . 113
CHAPTER 5 - DEFINING THE EXPERIMENTAL PROGRAM . . . . . . . . . . 116
5.1. Introduction .......... '. . . . . . . . . . . . . . . . . . . . . . . . . . . . . . . . 116
5.2. Variables to be Studied .......... · . . . . . . . . . . . . . . . . . . . . . . . . . 116
5.3. Experiments Chosen . . . . . . . . . . . . . . . . . . . . . . . . . . . . . . . . . . . . 119
5.3.1. Effect of Collector Type . . . . . . . . . . . . . . . . . . . . . . . . . . . . . 119
5.3.2. Time and Power Effects of Conditioning .. ~ . . . . . . . . . . . . . . . . 119
5.3.3. Effect of Type of Power Input (Volume) . . . . . . . . . . . . . . . . . . . 123
5.3.4. Collector Concentration . . . . . . . . . . . . . . . . . . . . . . . . . . . . . . 123
5.3.5. Water content . . . . . . . . . . . . . . . . . . . . . . . . . . . . . . . . . . . . 123
5.4. Summary of Tests to be Performed . . . . . . . . . . . . . . . . . . . . . . . . . . . 124
CHAPTER 6 - RESULTS AND DISCUSSION . . . . . . . . . . . . . . . . . . . . . . 125
6.1. Introduction . . . . . . . . . . . . . . . . . . . . . . . . . . . . . . . . . . . . . . . . . . 125
6.2. Effect of Collector Type . . . . . . . . . . . . . . . . . . . . . . . . . . . . . . . . . . 125
6.3. Reaction Mechanisms of Adsorption . . . . . . . . . . . . . . . . . . . . . . . . . . . 127
6.4. Time Effects of Conditioning . . . . . . . . . . . . . . . . . . . . . . . . . . . . . . . 129
6.5. Power Effects of Conditioning . . . . . . . . . . . . . . . . . . . . . . . . . . . . . . 130
·6.6. Effect of Type of Power Input . . . . . . . . . . . . . . . . . . . . . . . . . . . . . . 132
6. 7. Relationship between Time, Power and Energy 133
Vlll

TABLE OF CONTENTS
6. 8. Effect of Collector Concentration . . . . . . . . . . . . . . . . . . . . . . . . . . . . 136
6. 9. Influence of Pulp Density . . . . . . . . . . . . . . . . . . . . . . . . . . . . . . . . . 139
6. 9 .1. Slow Ionisation of the Collector . . . . . . . . . . . . . . . . . . . . . . . . . 141
6.9.2. Ionisation Constant of the Collector . . . . . . . . . . . . . . . . . . . . . . 142
6.10. Correlation between· conditioning and flotation results . . . . . . . . . . . ·. . . . . 145
6.11. Limitations of this Work . . . . . . . . . . . . . . . . . . . . . . . . . . . . . . . . . . 146
CHAPTER 7 - CONCLUSIONS . . . . . . . . . . . . . . . . . . . . . . . . . . . . . . . . 149
REFERENCES . . . . . . . . . . . . . . . . . . . . . . . . . . . . . . . . . . . . . . . . . . . 154
APPENDIX A. - Derivation of Expression for R in Stassen' s Equations Al
APPENDIX B. - Stassen' s Experimental Data A3
APPENDIX C. - Surface Area Calculations . . . . . . . . . . . . . . . . . . . . . . . . . A6
APPENDIX D. - Quartz-Amine Microflotation Test Data A8
APPENDIX E. - Pyrite-Thiol Microflotation Test Data .................. Al2
APPENDIX F. - Pyrite-Thiol Adsorption Test Data .................... Al4
1X
LIST OF FIGURES
LIST OF FIGURES
Figure 2.1 - Basic Schematic of the Flotation Process . . . . . . . . . . . . . . . . . . . . . 5
Figure 2.2 - Schematic of Flotation Showing Conditioning . . . . . . . . . . . . . . . . . 9
Figure 2.3 - Macro-Scale Representation of Conditioning . . . . . . . . . . . . . . . . . 10
Figure 2.4 - Relationship Between Collector in Solution and on the Surface . . . . . . 12
Figure 2.5 - Structure of Potassium Ethyl Xanthate . . . . . . . . . . . . . . . . . . . . . 13
Figure 2.6 - The Electronic States of a Xanthate . . . . . . . . . . . . . . . . . . . . . . . 14
Figure 2.7 - Hydrophilic Mineral . . . . . . . . . . . . . . . . . . . . . . . . . . . . • . . . 15
Figure 2.8 - Mineral Is Made Hydrophobic . . . . . . . . . . . . . . . . . . . . . . . . . . 15
Figure 2.9 - Liquid Phases Surrounding Particle . . . . . . . . . . . . . . . . . . . . . . . 16
Figure 2.10 - Adsorption Rate vs Agitation . . . . . . . . . . . . . . . . . . . . . . . . . . 17
Figure 2.11 - Free Energy vs Distance From Particle Surface . . . . . . . . . . . . . . . 19
Figure 2.12 - Effect of Hydrophobicity on Free Energy Changes . . . . . . . . . . . . . 20
Figure 2.13 - Collector-Surfactant Interaction (from Leja and Schulman, 1954) . . . . 24
Figure 2.14 - Relative Importance of Klimpel k and R Parameters . . . . . . . . . . . . 26
Figure 2.15 - Effects of Increased k and R Values on Recovery (Yield) . . . . . . . . 26
Figure 2.16 - Hydrophobic Interaction of Shear-Flocculated Particles [Shouci and Song,
1991] . . . . . . . . . . . . . . . . . . . . . . . . . . . . . . . . . . . . . . . . . . . . . . 27
Figure 2.17 - Effect of Impeller Speed on Rate of Flotation [Duchen, 1980] . . . . . . 29
Figure 2.18 - Effect of Impeller Speed on Equilibrium Recovery [Duchen, 1980] . . 29
figure 2.19 - Effect of Method of Collector Addition on Flotation Response [Von Holt,
1992] . . . . . . . . . . . . . . . . . . . . . . . . . . . . . . . . . . . . . . . . . . . . . . 31
Figure 2.20 - Effect of Collector Dosage and Impeller Speed on Flotation Response
[Von Holt, 1992] . . . . . . . . . . . . . . . . . . . . . . . . . . . . . . . . . . . . . . 32
Figure 2.21 - Effect of Cell Size on Flotation Response [Von Holt, 1992].. . . . . . . 33
Figure 2.22 - Klimpel Parameters for Sulphur vs Conditioning Energy (from Stassen,
1991a) ............. · . . . . . . . . . . . . . . . . . . . . . . . . . . . . . . . . 35
Figure 2.23 - Klimpel Parameters for Gold vs Conditioning Energy (from Stassen,
199la) . . . . . . . . . . . . . . . . . . . . . . . . . . . . . . . . . . . . . . . . . . . . . 36
Figure 2.24 - Klimpel Parameters for Uranium vs Conditioning Energy (from Stassen,
l 991a) . . . . . . . . . . . . . . . . . . . . . . . . . . . . . . . . . . . . . . . . . . . . . 36
Figure 2.25 - Effect of Surface Coverage on Flotation [Crawford and Ralston, 1988] 38
Figure 2.26 - Flotation Recovery as a Function of Surface coverage and Particle Size
[Crawford and Ralston, 1988] . . . . . . . . . . . . . . . . . . . . . . . . . . . . . . . 39
x

LIST OF FIGURES
Figure 2.27 - Critical Surface Coverage for Flotation as a Function of Particle Size
[Crawford and Ralston, 1988] . . . . . . . . . . . . . . . . . . . . . . . . . . . . . . . 40
Figure 2.28 - Effect of Ionic Strength on Flotation Recovery [Crawford and Ralston,
1988] . . . . . . . . . . . . . . . . . . . . . . . . . . . . . . . . . . . . . . . . . . . . . . 41
Figure 2.29 - Time Dependence of Recovery [Crawford and Ralston, 1988] . . . . . . 42
Figure 3.1 - Mineral Floated vs Flotation Time . . . . . . . . . . . . . . . . . . . . . . . 60
Figure 3.2 - % Mineral Receiving Continued Conditioning vs Time . . . . . . . . . . . 61
Figure 3.3 - Effect of Conditioning Energy Input on Stassen's Klimpel Parameters
Showing ~ent and ~ . . . . . . . . . . . . . . . . . . . . . . . . . . . . . .' . . . . 64
Figure 3.4 - Klimpel k vs Energy for Sulphur, Colour Separated wrt Time (modified
from Stassen) . . . . . . . . . . . . . . . . . . . . . . . . . • . . . . . . . . . . . . . . . 69
Figure 3.5 - Klimpel k vs Energy for Gold, Colour SeJ>C!.rated wrt Time (modified from
Stassen, 1990) . . . . . . . . . . . . . . . . . . . . . . . . . . . . . . . . . . . . . . .· . 70
Figure 4.1 - Structure of HPYC . . . . . . . . . . . . . . . . . . . . . . . . . . . . . . . . . 79
Figure 4.2 ,.. Stable States of Dithiocarbamates · . . . . . . . . . . . . . . . . . . . . . . . . 82
Figure 4. 3 - Design of Axial Flow Impeller . . . . . . . . . . . . . . . . . . . . . . . . . . 87
Figure 4.4 - Partidge and Smith Microflotation Cell . . . . . . . . . . . . . . . . . . . . . 93
Figure 4.5 - UV Absorbency Plot for HPYC . . . . . . . . . . . . . . . . . . . . . . . . . 96
Figure 4.6 - Reproducibility Data Showing % Yield for Each Sample . . . . . . . . . . 100
Figure 4. 7 - Microflotation Yield vs Collector Dosage . . . . . . . . . . . . . . . . . . . 101
Figure 4.8 - Microflotation Yield vs Conditioning Time . . . . . . . . . . . . . . . . . . 102
Figure 4.9 - Pyrite Flotation Yield vs diC3 DTC Collector Dosage (near mono-
layer) . . . . . . . . . . . . . . . . . . . . . . . . . . . . . . . . . . . . . . . . . . . . . . 106
Figure 4.10 - Flotation Response for Collector and Frother (from Austin and Henwood,
1991) .... · ................ ' ......................... 107
Figure 4.11 - Collector Dosage vs Flotation Yield (high doses) . . . . . . . . . . . . . . 108
Figure 4.12 - Reproducibility Tests Showing Collector Uptake vs Time for DiC3
DTC . . . . . . . . . . . . . . . . . . . . . . . . . . . . . . . . . . . . . . . . . . . . . . 112
Figure 4.13 - Reproducibility Tests Showing Collector Uptake vs Time for PNBX . . 113
Figure 5.1 - Experimental Design Matrix . . . . . . . • . . . . . . . . . . . . . . . . . . . 121
Figure 6.1 - Adsorption Profiles of Three Thiol Collectors . . . . . . . . . . . . . . . . 126
Figure 6.2 - Log of Collector Uptake vs Time for DiC3 DTC and PNBX . . . . . . . 130
Figure 6.3 - Effect of Impeller Speed on diC3 DTC Adsorption . . . . . . . . . . . . . 131
Figure 6.4 - Effect of Impeller Speed on PNBX Adsorption . . . . . . . . . . . . . . . . 132
Figure 6.5 - Effect of Power Type on DiC3 DTC Adsorption . . . . . . . . . . . . . . . 133
Figure 6.6 - Effect of Eight Times Energy Input using DiC3 DTC . . . . . . . . . . . . 134
Figure 6. 7 - Effect of Eight Times Energy Input Using PNBX . . . . . . . . . . . . . . 135
Xl

LIST OF FIGURES
Figure 6. 8 - Effect of Collector Dosage on DiC3 DTC Adsorption 136 Figure 6.9 - Effect of Collector Dosage on PNBX Adsorption . . . . . . . . . . . . . . 137
Figure 6.10 - Effect of Collector Concentration on DiC3 Adsorption Rate Constant . 138
Figure 6.11 - Effect of Pulp Density on diC3 DTC Collector Adsorption . . . . . . . . 140
Figure 6.12 - Effect of Pyrite Content on diC3 DTC Collector Adsorption . . . . . . . 142
XU

CHAPTER 1 - INTRODUCTION
1.1. Background
An important but frequently overlooked aspect in the flotation of minerals is the
conditioning of the ore. Conditioning provides the environment in which reagent
molecules attach to particles, thereby altering their surface properties. The probability
of reagent reaching the particle surface is a function of factors such as the intensity and
duration of agitation and the concentration of reagent, while the efficiency of
subsequent attachment may be a function of the size distribution of the particles and the
electrical charges on the particle and reagent molecules, respectively.
It has been shown that the total recovery and flotation rate of gold, uranium oxide and
pyrite increase substantially when the conditioning energy is increased [Stassen, 1990].
Moreover, in column flotation test work on South African Witbank coals it has been
found that the method of conditioning has a very marked influence on the results
obtained [Von Holt, 1992].
The importance of conditioning is highlighted in column flotation since there is no
impeller in the cell to provide mixing as is the case in conventional sub-aeration cells.
Thus it is crucial that the ore is adequately conditioned prior to introduction into the
column. In conventional flotation cells, reagent is frequently added to the first cell in
a bank of sub-aeration cells, the cell essentially acting as a conditioning vessel.
While conditioning effects are known to be important in the flotation process,
conditioning is still a poorly understood sub-process. The aim of the present work is
to isolate the variables of conditioning and to determine the effect of these variables on
the efficiency of the conditioning sub-process, and hence on flotation results. The key
question to the work can thus be posed as follows:
"What is the effect of variables of conditioning on conditioning efficiency?"
This question presupposes that a precise definition of conditioning and of conditioning
efficiency exists, and that measures of determining conditioning efficiency are available.
As will be shown below, no generally agreed definition of conditioning or conditioning
efficiency exist. Moreover, the determination of "conditioning efficiency" is
1

CHAPTER I
complicated by the fact that conditioning must be isolated from the flotation process to
eliminate masking of effects. Thus answering the key question requires that a number ·
of separate steps be undertaken:
(1) Clearly define conditioning.
(2) Determine a useful measure of conditioning efficiency.
(3) · Evaluate the effect of conditioning variables on efficiency.
( 4) Determine the effect of these variables in flotation by correlating
conditioning and flotation results.
It is this that the remainder of this thesis aims to do.
1.2. Research Outline
The research began by carrying out a literature survey, in which the work of previous
researchers in the area of conditioning was studied in depth. This is covered in Chapter
2. A readily available and most detailed investigation is that of F.J.N. Stassen [1990,
l 991a, 199lb], who studied the effect of a number of conditioning parameters on gold,
uranium oxide and pyrite flotation. 'Because of the direct relevance of Stassen's
investigation to the current study, and the completeness of the data available in his
Master's thesis [Stassen, 1990], a critique of the work has been compiled and forms the
basis of Chapter 3. In that chapter, the merits and failings of Stassen's experimental
technique, results and conclusions are discussed in detail.
. Subsequently a number ?f possible methods of measuring conditioning were explored.
The technique most suitable was chosen, and preliminary experimental test work using
adsorption and microflotation was performed. This work is detailed in Chapter 4. One
of the aims of this work was to choose an appropriate mineral/collector system for
more detailed study. In order to avoid complications caused by variations in ore type
and sample, the experiments were carried out initially using a quartz-amine test system.
This system is widely used when it is desirable to decouple ore type from other effects.
Unfortunately, difficulties of measurement made this system impractical for the study
of conditioning (reasons for this are outlined in Chapter 4). Work therefore continued
using the more complex sulphide system of pyrite and thiol collectors. This system has
2

CHAPTER 1
also been studied in depth, but the attachment mechanisms are more complex and less
well understood. Chapter 4 outlines the preliminary work to determine the appropriate .
thiol collector dosage for the conditioning tests, and the optimum wave-length at which
to measure residual collector concentrations for each collector.
In Chapters 5 and 6, the effects of various physical and chemical parameters on the
conditioning of the pyrite ore were investigated. These included: duration and power
of mixing, (thiol) collector type and dosage, mechanism of collector attachment and
finally mixing method. While all of these variables have been studied individually in
detail by others, no attempt has been made previously to study a number of these
variables simultaneously in order to evaluate the conditioning process per se. Chapter
5 discusses the choice of tests to be performed, while Chapter 6 details the results of
these tests, and discusses how the results relate to the theoretical background. The
implication of these results when designing conditioning stage equipment .is also
'covered.
Finally, Chapter 7 lays out the conolusions reached on the effects of conditioning on
froth flotation.
3

CHAPTER 2 • LITERATURE REVIEW
The theory of Dota lion is complex and not completely understood. (Wills, I 988)
2.1. Introduction
This chapter discusses the findings of literature available on the aspects of flotation
relevant to the study of conditioning. It begins with an overview of flotation, covering ,
the basic sub-processes (section 2.2). Following in section 2.3 is a more in-depth
discussion on conditioning, from which a useful definition of conditioning is extracted.
This definition is used to isolate the aspect of conditioning that will be studied in this
thesis.
·Because the structure of collectors strongly affects the conditioning process, these are
discussed in some detail in section 2.4. The variables of conditioning are then
identified in section 2.5 by analysing the steps associated with the conditioning sub
process. This is followed by a discussion on how these variables are expected to affect
the thermodynamics and kinetics of conditioning (section 2.6). The effect of these
variables can be modelled, to allow easy interpretation o( their relative magnitudes,
using the Klimpel Flotation Model. How the model does this is described in section
2. 7, along with a brief discussion on the theoretical basis for this model and its
advantages and failings. One final observed effect, which lies outside of the standard
kinetic and thermodynamic models, is shear-flocculation, which is experienced in
certain very turbulent systems. How this might affect experimental results is discussed
in section 2. 8.
Finally, the results of previous studies into how all of these aspects of conditioning and
flotation affect conditioning are presented in section 2.9. This section also gives an
overview of conditioning research performed to date.
2.2. Principles of Flotation
Flotation is the most important and versatile mineral-processing technique, with millions
of tons of mixed solids processed daily to concentrate mineral values. Its applications
range from relatively simple mineral separations such as sulphide ore concentration to
4
--------------------------.--
CHAPTER 2
complex systems such as copper-lead-zinc separation and fine coal beneficiation. Other
uses of flotation include biochemical and polymer separations, the purification of ·.
sewage water and the de-inking of recycled papyr [Hickey, 1982].
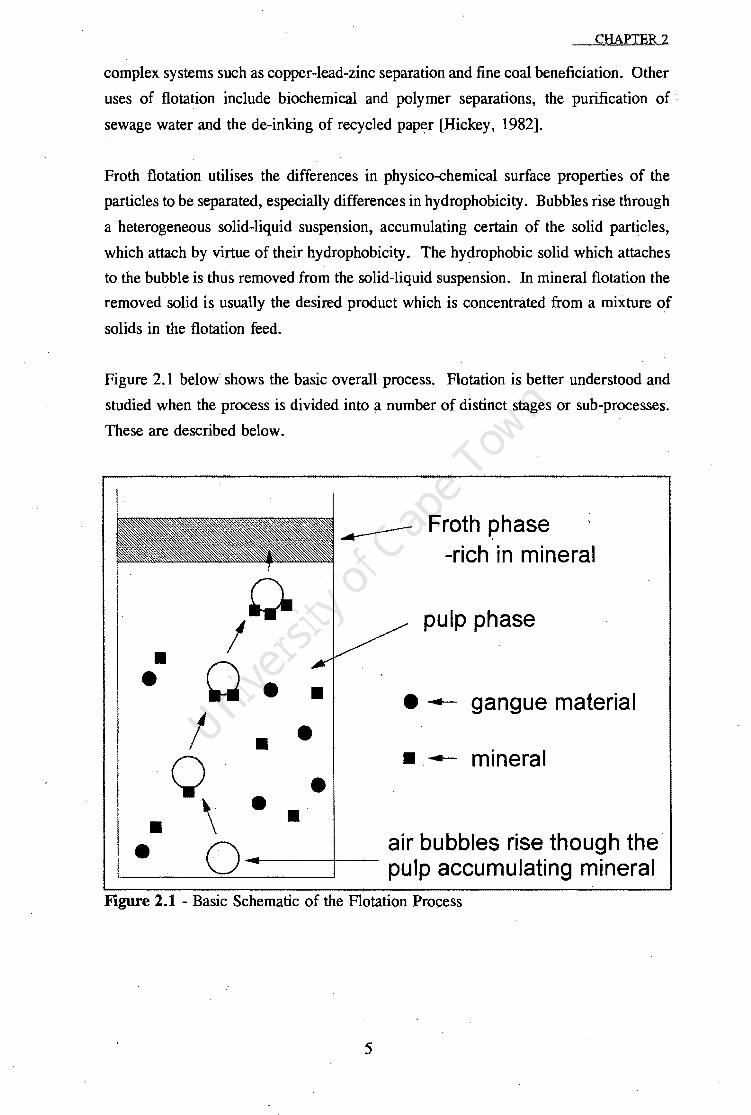
Froth flotation utilises the differences in physico-chemical surface properties of the
particles to be separated, especially differences in hydrophobicity. Bubbles rise through
a heterogeneous solid-liquid suspension, accumulating certain of the solid particles,
which attach by virtue of their hydrophobicity. The hydrophobic solid which attaches
to the bubble is thus removed from the solid-liquid suspension. In mineral flotation the
removed solid is usually the desired product which is concentrated from a mixture ~f
solids in the flotation feed.
Figure 2.1 below shows the basic overall process. Flotation is better understood and
studied when the process is divided into a number of distinct stages or sub-processes.
These are described below.
.....------ Froth phase -rich in mineral
/0 pulp phase
• Q • • • ·~ gangue material
I • • Q ·-~ mineral
• \ • • • • 0 air bubbles rise though the
pulp accumulating mineral Figure 2.1 - Basic Schematic of the Flotation Process
5

CHAPTER2
2.2.1 Flotation Sub-processes
. While all of the stages or sub-processes of flotation occur simultaneously in a
flotation cell, they must occur in the correct sequence for any particular mineral
particle to float. The basic stages are as follows:
2.2.1.1 Conditioning of the Ore
The ore is first prepared by processes including comminution (crushing
and grinding), which is aimed at liberating the valuable mineral and
making its surfaces available for attachment to bubbles. The surfaces are
then rendered hydrophobic or hydrophilic by chemical treatment.
Typically the valuable or desired mineral is made hydrophobic, using a
collector1, while the gangue is unaltered or made hydrophilic, with the
use of a depressant. Alterations may · also be made to the chemical
environment, eg the pH or Eh may be changed. It is this induced
difference in hydrophobicity that ,allows separation by flotation to take
place.
This surface preparation for flotation is generically termed conditioning.
While the term conditioning is widely used, there is no concise usable
definition for the sub-process. As a result, conditioning has widely
varying connotations for experts in different materials processing fields.
In its widest definition it can be taken to mean the general preparation of
the pulp to .be floated, while its most specific meaning might imply one
or other particular preparation process.
For the purpose of this study it is necessary to have a precise definition
of what is meant by conditioning. As a definition is not available in the
literature it is necessary to devise or propose one. This is discussed in
detail in section 2.3.
1 Collectors are molecules which have two distinct components: a hydrophobic tail, and a head which is attracted to the mineral surface. Once the head is attached to the mineral surface, the tail extends into the water, creating a hydrophobic surface around the mineral. With depressants, the opposite affect is achieved through a hydrophilic tail.
6

CHAPTER 2
2.2.1.2 Attachment of Mineral Particles to Bubbles
After the ore has been conditioned, the prepared slurry is aerated with
fine bubbles. The now hydrophobic mineral particles, on collision with
the bubbles, preferentially attach to the bubbles and are lifted out of the
bulk slurry to the surface. The flotation of a single particle thus requires
a number of steps, namely collision, attachment, and remaining on the
bubble all the way to the slurry surface [Kelly and ~pottiswood, 1982;
Jordan & Spears, 1990]. The overall probability of flotation can be
expressed as a product of the probabilities of each of the steps occurring
(equation (1)):
pflotation p collision • p attachment • p stay (1)
In this equation, Pauachmcnt is determined by the hydrophobicity of the
mineral and, hence, by the effectiveness of the conditioning stage.
2.2.1.3 Froth Formation and Removal
The mineral is removed from the slurry by formation of a froth bed
above the pulp. Rising bubbles move into this froth phase, taking with
them the hydrophobic mineral particles. A stable froth is usually created
with the addition of a chemical frothing agent. The froth is removed as
it builds up and, along with it, the concentrated mineral.
The froth phase is a complex topic beyond the scope of this work. It
must be understood only in as much as its presence complicates and may
mask the observed effects of conditioning. The froth phase strongly
influences the value of P.1ay in equation (1).
2.3 Definition 'Of Conditioning
The Concise Oxford Dictionary defines the verb condition to mean bring into desired
state or condition. This definition applies and extends to conditioning of ores for
7

1.
CHAPTER 2
flotation. The term is loosely used to describe any preparatory stage prior to flotation.
Different systems require conditioning for different purposes: while one mineral may ·
require an oxidative conditioning stage, another may need to have the mineral surface
cleaned or reduced by an acid wash.
Some examples of conditioning processes include:
comminution
oxidation
acid leaching
pre-aeration
N2 I S02 gas treatment
agitation in the presence of flotation reagents
reagent addition in the mill
boiling (to dissolve collector)
ammonia addition (in chrome flotation)
pre-grinding (attrition of surface)
activation
flocculation
depression
pH modification
acoustic vibration
split conditioning (prior size classification)
redox control
wetting
bacterial pretreatment
Because of this profusion of processes and their widely varying function, conditioning
has different connotations for different operators and researchers. No single definition
for conditioning is to be found in the literature. However for the purpose of this
project, a usable and precise definition of conditioning is required, both to limit as well
as to define the boundaries of the work to be covered. The definition m'ust be able to
account for all of the processes already mentioned and yet allow a conditioning process
· to be easily identified as such.
The processes listed above appear to fall into two distinct categories. They are
distinguished by their different function and the order in which. they typically occur.
8

CHAPTER 2
The first group relates to the physical preparation of the surfa.ce of the particles. This
. includes comminution, oxidation, acid leaching and bacterial pretreatment. The steps
usually occur first in the flotation process, preparing the mineral for the second stage
of conditioning. Hence this category of processes will be termed primary conditioning.
An important point to note is that primary conditioning, with the exception of
attritioning, almost always takes place prior to the entry of the pulp into the flotation
vessel.
The second category relates to the process whereby prepared particles are rendered
hydrophobic or hydrophilic through mixi.ng, control of the environment apd contacting
with reagents. This follows primary conditioning and will be termed secondary
conditioning. This process does not change the nature of the mineral surface, but
rather results in a change in the charges presented to the surrounding water. This is
generally achieved by the adsorption of chemical reagents in a stirred vessel.
Figure 2.2, below, is a schematic of the flotation process as it has now been defined.
This represents the sequence of microscopic processes each particle needs to undergo
in order to be floated.
Primary - Secondary - Flotation Conditioning - Co~ditioning --
Figure 2.2 - Schematic of Flotation Showing Conditioning
Secondary conditioning, defined above as a process of mixing and contacting with
reagents, can be carried out in a separate vessel (the conditioning tank). It can,
however, also occur in the flotation vessel - even during aeration and flotation. This
is because agitation is continued during flotation in conventional sub-aeration cells2•
So although, on a micro scale, each ·particle experiences the above sequence of
processes, on a macro scale the process is more correctly defined as shown below in
Figure 2.3. Some attritioning and perhaps even leaching and oxidation may also occur
2 Agitation does not continue in column cells, which is the basis of Von Holt's work [1992]. In this case, the effectiveness of the conditioning stage prior to flotation is particularly important.
9

CHAPTER 2
on a small scale in the flotation vessel during flotation, hence the reappearance of
primary conditioning (to a limited extent) in the flotation stage.
Concentrate
'
Flotation
Primary - Secondary ~
C o nditio ning -
Conditioning
~ t Primary
Conditioning
,. Tailings
Figure 2.3 - Macro-Scale Representation of Conditioning
Having thus defined conditioning, it is possible to isolate the aspect of conditioning to
be studied in this work. Primary conditioning is by its nature system dependent, while
secondary conditioning involves the more universal process of mixing in the presence
of reagents to alter hydrophobicity. For this reason secondary conditioning will be
considered. The specific aspect of secondary conditioning to be investigated is:
The mixing of prepared particles with collector with the aim of achieving
contact and successJUl attachment or adsorption of collector onto the desired
mineral, thereby rendering the surface hydrophobic for Rotation.
The variables which affect this aspect of conditioning, and the influence they have on
conditioning efficiency, are identified in section 2.5 below. First, however, it is
important to uvnderstand the structure of collectors, since they perform a vital role in
altering the surface chemistry.

CHAPTER2
2.4 The Structure of Collectors
Collectors are traditionally ionic molecules. This enables them to selectively attach to
the charged mineral surface. As previously stated, they also have hydrophobic
(typically hydrocarbon) tails, which extend into the water to increase the hydrophobicity
of the mineral-collector complex. The hydrophobicity arises from the non-polar nature
of the tail.
Owing to their chemical properties and hydrophobicity, collectors have a number of
interesting nuances. One of the most important is the formation of micelles. This
phenomenon occurs when collector is added in great excess. The hydrophobic nature
of the tails causes them to clump together, squeezing out the water. This leads to
clumps of insoluble collector forming, which are relatively immobile and do not attach
to the mineral surface effectively; thus collector is wasted. But worse than that is the
formation of micelles on the mineral surface, where the hydrophobic tails of the first
layer of collectors are shielded by the next layer of collector. This reduces the
hydrophobicity of the mineral, and hence the floatability. It is evident that there is an
optimum collector addition, which is less than the amount which results in micelle
formation (critical concentration of micellation).
The extent of collector adsorption onto the mineral surface is determined by the
equilibrium between collector in solution and surface collector. Figure 2.4 shows how
the concentration of the collector in solution relates to the surface conditions. Initially,
individual collector molecuICs attach to the mineral surface (A). There is plenty of
available mineral surface, and adsorption occurs readily. As collector addition
increases, adsorption increases, and collector molecules squeeze together, their
hydrophobic tails interacting to increase the stability of the adsorbed collector (B). This
hydrophobic interaction is termed hemi-micelle formation. Eventually, the surface is
so covered by collector that the surface charges are neutralised, and available
adsorption sites are scarce. Adsorption removes less of the added collector, until a
point is reached where the surface cannot accept any more collector (C). This is the
point of mono-layer coverage. Any increase in collector addition results in no
additional adsorption, until so much collector is added that the critical concentration of
micellation is reached (D). Above this dosage, adsorption increases rapidly as collector
particles are attracted to those on the surface by hydrophobic interaction. Since
hydrophobicity decreases when multi-layer adsorption occurs, optimum flotation is
expected to be found in the dosages between (C) and (D).
11

c 0
:;::; Q. "-0 en ~
+ (A) + (B) ~
iii+~ .... Q)
£+ E +~
CHAPTER 2
D
c
Equilibrium Collector Concentration
Figure 2.4 - Relationship Between Collector in Solution and on the Surface
The attachment mechanism of the collector onto the mineral surface strongly affects its
selectivity and its effectiveness. Since most collectors are ionic, these will be studied
briefly to gain an understanding of their mechanism.
2.4.1 Anionic Collectors
These are the most widely. used collectors in mineral flotation, of which the
most common are the sulphidryl or thiol collectors. They are very powerful
and selective in the flotation of sulphide minerals. The most widely used thiol
collectors are the xanthates (dithiocarbonates). Figure 2.5 shows the structure
of ethyl xanthate.
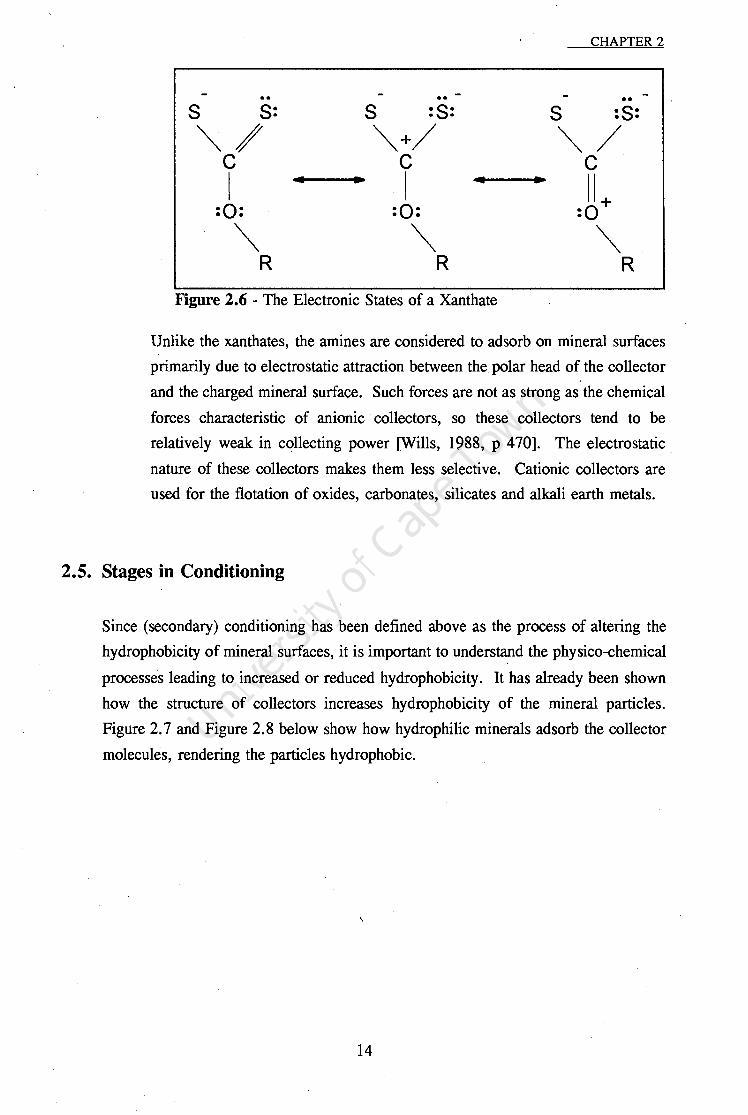
The reaction between sulphide minerals and sulphidry 1 collectors is complex .
. Xanthates are assumed to adsorb on sulphide mineral surfaces due to chemical
forces between the polar group and the surface, resulting in weakly soluble
metal xanthates or insoluble dixanthogen, which are strongly hydrophobic
[Wills, 1988, pp 468-470]. Xanthate ions exist as an equilibrium of a number
of states, as shown in Figure 2.6. The strength of attachment to the mineral
surface is dependent on the degree to which the charge can be rearranged on
12

Hydophobic Tail #s
H H o-c~ I I/ ""' _ H-C-C S I I H H
CHAPTER 2
Polar Head
Figure 2.5 - Structure of Potassium Ethyl Xanthate
the collector. The collector may even donate an electron to the mineral. Thus
a strong bond between collector and mineral is achieved. Typically thiol
collectors chemisorb onto the mineral surface.
2.4.2. Cationic Collectors
The characteristic property of this group of collectors is that the water repulsion
is produced by the hydrocarbon group in the cation, where the polar group is
based on pentavalent nitrogen [Wills, 1988]. These are amine molecules.
Amines are classified as primary, secondary, tertiary and quaternary, depending
on the number of hydrocarbon radicals attached to the central nitrogen atom.
The primary, secondary and tertiary amines are weak bases and their ionisation
is pH dependent. In contrast, the quaternary amines and the alkyl pyridinium
salts are strong bases and are completely ionised at all values of pH [King,
1982]. The hydrocarbon chain lengths strongly affect the hydrophobicity of the
collector, and hence the effectiveness. Increasing chain length results in
increased hydrophobicity. Increased chain length, however, reduces the critical
concentration of micellation. This requires a compromise between increasing
hydrophobicity and reducing micellation. Typical chain lengths for amine
collectors are between 10 and 20 carbon atoms.
13
CHAPTER 2
•• s s: s ·s· . . s ·s· . . ""' / ""'+ / ""' / c c c
I • • I • • II+ ·o· ·o· :Q • • . .
""' ""' ""' R R R
Figure 2.6 - The Electronic States of a Xanthate
Unlike the xanthates, the amines are considered to adsorb on mineral surfaces
primarily due to electrostatic attraction between the polar head of the collector
and the charged mineral surface. Such forces are not as strong as the chemical
forces characteristic of anionic · collectors, so these collectors tend to be
relatively weak in collecting power [Wills, 1988, p 470]. The electrostatic.
nature of these collectors makes them less selective. Cationic collectors are
used for the flotation of oxides, carbonates, silicates and alkali earth metals.
2.5. Stages in Conditioning
Since (secondary) conditioning has been defined above as the process of altering the
hydrophobicity of mineral surfaces, it is important to understand the physico-chemical
processes leading to increased or reduced hydrophobicity. It has already been shown
how the structure of collectors increases hydrophobicity of the mineral particles.
Figure 2. 7 and Figure 2.8 below show how hydrophilic minerals adsorb the collector
molecules, rendering the particles hydrophobic.
14
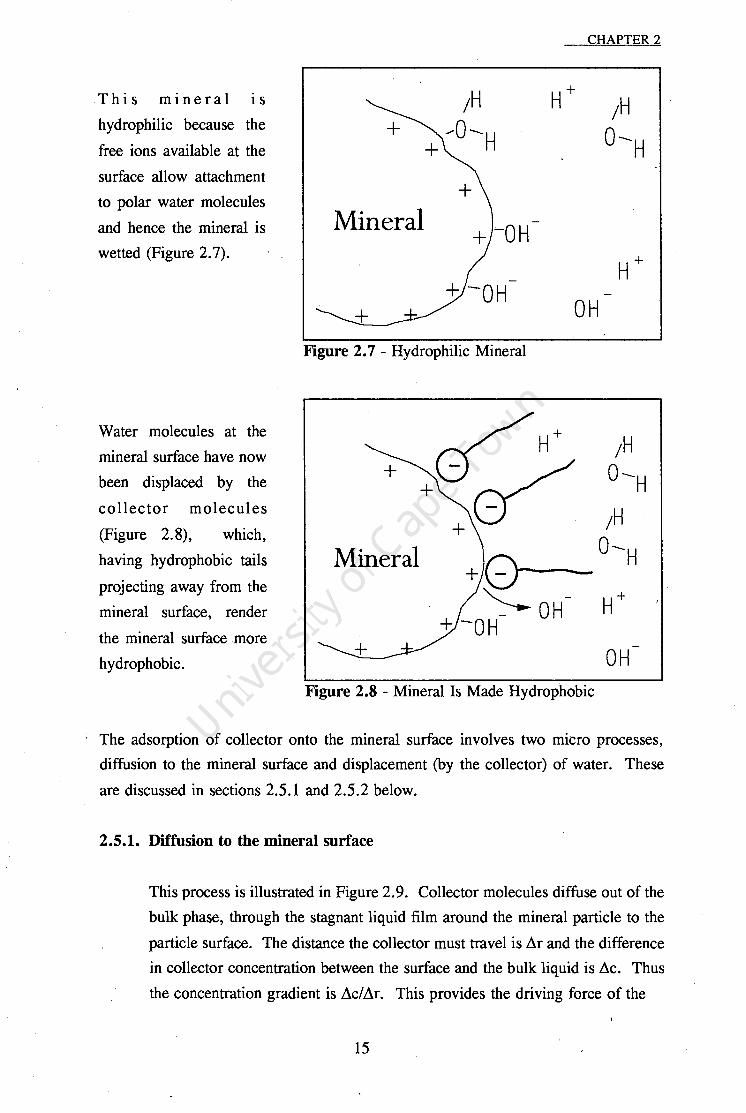
This mineral I S
hydrophilic because the
free ions available at the
surface allow attachment
to polar water molecules
and hence the mineral is
wetted (Figure 2. 7).
Water molecules at the
mineral surface have now
been displaced by the
collector molecules
(Figure 2.8), which,
having hydrophobic tails
projecting away from the
mineral surface, render
the mineral surface more
hydrophobic.
CHAPTER 2
;H H+ ;H + ,..Q-H 0-H
Mineral -oH + H+
+ OH Figure 2. 7 - Hydrophilic Mineral
Mineral
+ OH Figure 2.8 - Mineral Is Made Hydrophobic
The adsorption of collector onto the mineral surface involves two micro processes,
diffusion to the mineral surface and displacement (by the collector) of water. These
are discussed in sections 2.5.1 and 2.5.2 below.
2.5.1. Diffusion to the mineral surface
This process is illustrated in Figure 2.9. Collector molecules diffuse out of the
bulk phase, through the stagnant liquid film around the mineral particle to the
particle surface. The distance the collector must travel is Ar and the difference
in collector concentration between the surface and the bulk liquid is Ac. Thus
the concentration gradient is Ac/Ar. This provides the driving force of the
15

collector toward the
particle surface.
The rate of diffusion is
proportional to the
concentration gradient.
Thus the rate of diffusion
of the collector · to the
mineral surface can be
increased in two ways,
either by increasing the
bulk concentration of
Particle
CHAPTER 2
Bulk Liquid
Phase
Figure 2.9 - Liquid Phases Surrounding
Particle
.collector in the liquid, or by reducing .1r (by, for example, increased turbulence
in the vessel). If this stage is. the limiting factor in adsorption, then the
adsorption rate is said to be diffusion or ma:ss transfer controlling.
2.5.2 Displacement of water.
This is determined by the energy required by the collector to displace the water
at the mineral surface, and is affected by polarity and the strength of bonds.
This factor is largely determined by pH, surface chemistry and temperature.
If this stage is the limiting factor in adsorption, then the adsorption rate is said
to be reaction or adsorption controlling.
In practice (secondary) conditioning is usually carried out in an open, agitated vessel,
through which the pulp flows continuously, and to which measured quantities of reagent
(i.e. collector) are added (also continuously). In chemical engineering terms, this is
nothing more than a heterogenous stirred tank reactor (STR); thus the theory of STR' s
applies also to conditioning. This theory is to be found in any standard chemical
reaction engineering undergraduate textbook, eg Smith and Van Ness [1987].
According to heterogenous STR theory, the most important factor in determining which
variables of conditioning will have the greatest effect in any system is whether the
process is mass transfer controlling or adsorption controlling. Figure 2.10 shows how
this is typically related to the level of agitat~on in the conditioning vessel. This figure
shows that initially, with low agitation, rate of adsorption is poor (rate of adsorption
16
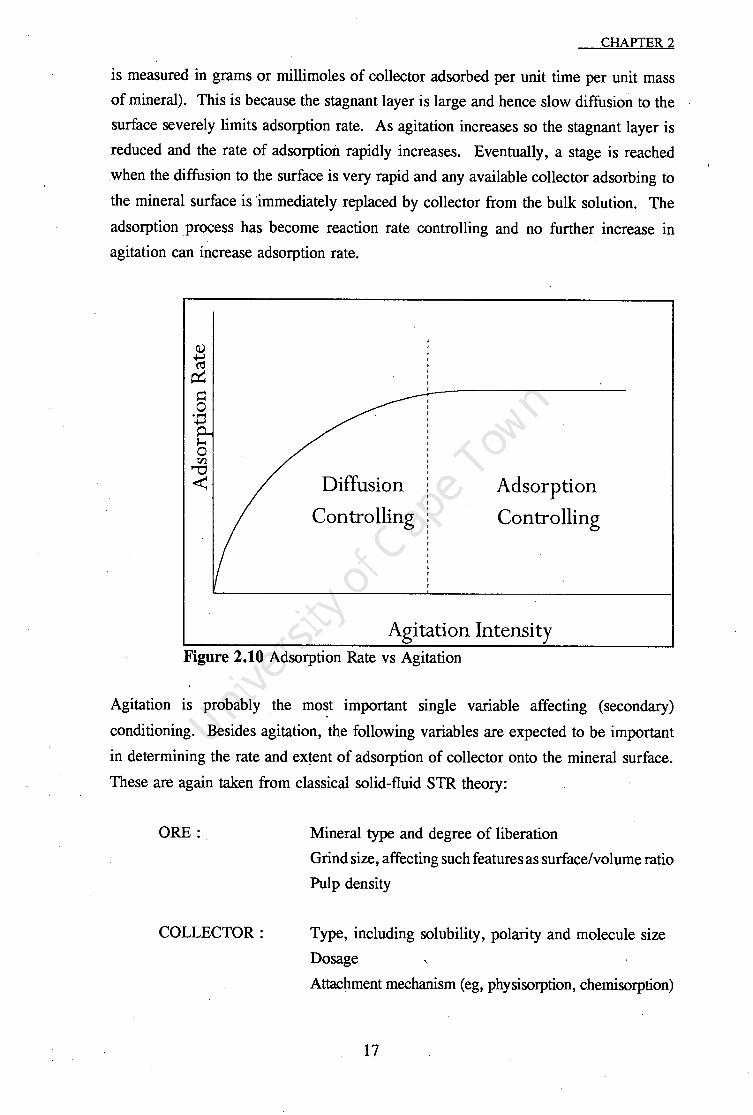
CHAPTER 2
is measured in grams or millimoles of collector adsorbed per unit time per unit mass
of mineral). This is because the stagnant layer is large and hence slow diffusion to the
surface severely limits adsorption rate. As agitation increases so the stagnant layer is
reduced and the rate of adsorption rapidly increases. Eventually, a stage is reached
when the diffusion to the surface is very rapid and any available collector adsorbing to
the mineral surface is "immediately replaced by collector from the bulk solution. The
adsorption process has become reaction rate controlling and no further increase in
agitation can increase adsorption rate.
Diffusion
Controlling
Adsorption
Controlling
Agitation Intensity Figure 2.10 Adsorption Rate vs Agitation
Agitation is probably the most important single variable affecting (secondary)
conditioning. Besides agitation, the following variables are expected to be important ·
in determining the rate and extent of adsorption of collector onto the mineral surface.
These are again taken from classical solid-fluid STR theory:
ORE:
COLLECTOR:
Mineral type and degree of liberation
Grind size, affecting such features as surface/volume ratio
Pulp density
Type, including solubility, polarity and molecule size
Dosage ,
Attachment mechanism (eg, physisorption, chemisorption)
17

CHAPTER 2
SYSTEM: pH
- Time
Mixing (power and turbulence)
Method of agitation (turbulence distribution)
Temperature
Ionic Strength
The following section discusses the effect of these variables on conditioning and
flotation in some detail.
2.6 Thermodynamics and Kinetics of Conditioning and Flotation
This section describes how the above factors affect the rate and extent of adsorption and
flotation, by analysing the thermodynamic and kinetic implications of these. variables.
Chemical thermodynamics can predict whether a reaction will proceed under a given
set of conditions of temperature and pressure. It can also predict the direction in which
the equilibrium will be shifted in response to variations in these parameters. At the
same time, all chemical reactions are functions of time, and thermodynamics cannot
explain the rate of reaction nor how rate will vary with temperature, pressure and
composition. Only chemical kinetics can provide such information. For flotation this
rate is all important, since the economic viability of a process is frequently determined
by residence time considerations.
2.6.1 Thermodynamic Criterion for Conditioning
Chemical thermodynamics allows prediction of whether a particle can attach to
a bubble and be floated. This is done by analysis of the Gibbs free energy
change of the system: the overall free energy change must be negativ~for the
attachment to proceed. This is mathematically represented in equation (2):
(2)
where ~G = Gibbs free energy
'YLv = liquid-vapour interfacial tension
18

CHAPTER 2
e = contact angle of bubble on mineral surface
This indicates that for flotation to be possible the contact angle, e, must be
> 0. The contact angle of a mineral is the classic measure of its
hydrophobicity. Thus the more negative ~G the greater the tendency for the
particle to dewet. It is important to note, though, that this cannot be used to
imply anything about the rate (kinetics) of ·flotation.
For most flotation systems the following free energy vs distance diagram applies
to the approach of a bubble to a mineral surface (Figure 2.11).
~ -··· ........ G. . .re. e.r.s.~.~oergy_b.anieL .......... B ......................... ---······················---···············-·-L.. Q) c w Q) Q) L..
LL.-
A G infinity
en ..c ..c (.!)
G adsorption
c Distance From Particle Surface
Figure 2.11 - Free Energy vs Distance From Particle Surface
Beyond point A there is no net force between particle and bubble, but on closer
approach, there is a net repulsion as Gibbs free energy of the system increases.
G is a maximum at point B and ~G = B-A is the work required to reach B and
hence overcome the resistance to attachment. As the bubble and the particle
continue to approach each other, free energy is reduced, until C is reached.
Thus C is the natural rest distance between the particle and bubble. If the two
collide and reach distance C from one another, ~G is negative and they will
have attached. While overall free energy change shows the stability and
likelihood of the attachment, the forward and reverse energy barriers are
significant in indicating the resistance to attachment and detachment and, hence,
the probable kinetics of the system .
. 19
CHAPTER 2
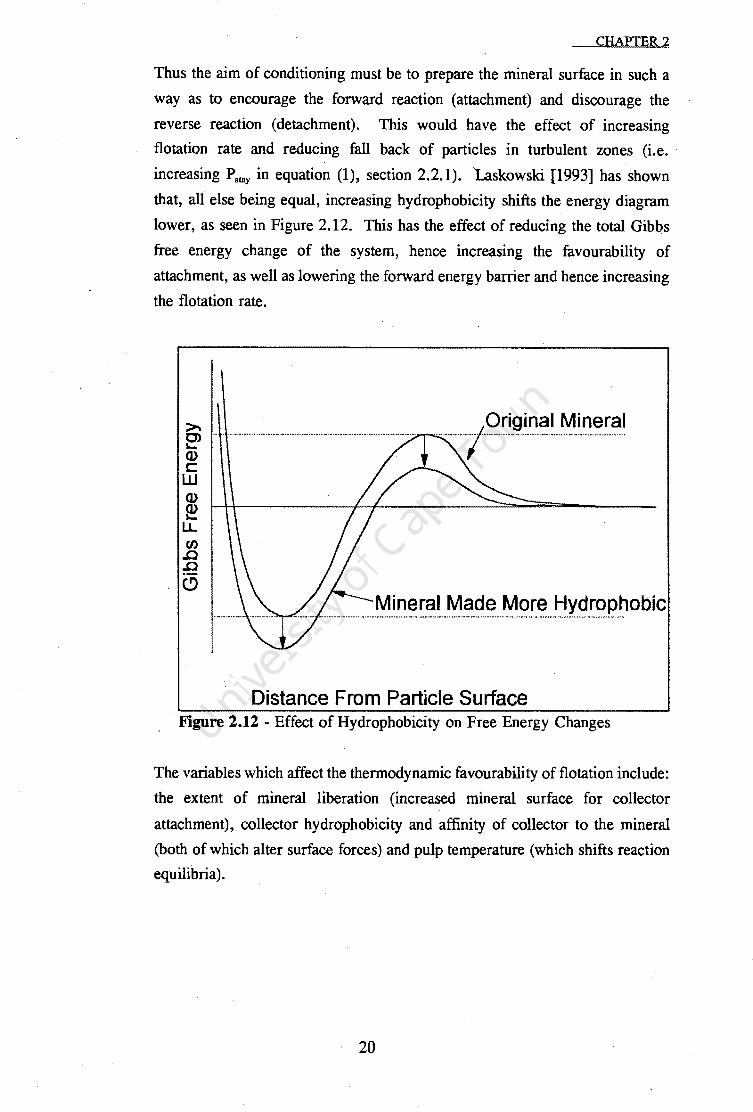
Thus the aim of conditioning must be to prepare the mineral surface in such a
way as to encourage the forward reaction (attachment) and discourage the
reverse reaction (detachment). This would have the effect of increasing
flotation rate and reducing fall back of particles in turbulent zones (i.e.
increasing Pstay in equation (1), section 2.2.1). 'Laskowski [1993] has shown
that, all else being equal, increasing hydrophobicity shifts the energy diagram
lower, as seen in Figure 2.12. This has the effect of reducing the total Gibbs
free energy change of the system, hence increasing the favourability of
attachment, as well as lowering the forward energy barrier and hence increasing
the flotation rate.
>-e> Q) c: w Q)
~ LL fl) .0 .0 (!)
Original Mineral ........ -... ·1························•"•• ............................. .
Mineral Made More Hydrophobic
Distance From Particle Surface Figure 2.12 - Effect of Hydrophobicity on Free Energy Changes
The variables which affect the thermodynamic favourability of flotation include:
the extent of mineral liberation (increased mineral surface for collector
attachment), collector hydrophobicity and affinity of collector to the mineral
(both of which alter surface forces) and pulp temperature (which shifts reaction
equilibria).
20

CHAPTER 2
2.6.2 Kinetic Criterion for Conditioning
As was discussed in section 2.2.1.2 flotation can be expressed as a product of
the probabilities of the various essential mechanisms occurring. The probability
of flotation occurring within a specified time is in fact the overall rate of
flotation when multiplied over the numerous particles and bubbles of a real
system. Thus the kinetics of flotation can be expressed using the equation (1)
introduced previously on page 7:
pflotation p collision • p attachment • p stay
or
(3)
Pc is a function of particle and bubble sizes and numbers in a given volume, and
is unaffected by conditioning. Pa on the other hand is strongly dependent on
solution and surface chemistry. For attachment to occur, particles must remain
in contact for a definite period of time during collision. This period is required
for the disjoining layer of water between particle and bubble to thin, be
disrupted and finally removed. This period is termed the induction time. The
shorter this induction time, the more likely is the particle-to-bubble attachment.
Thus Pa is essentially a function of critical induction time.
From the force-distance diagram (Figure 2.11) it can be seen that attachment
probability will be a function of the forward energy barrier (GauacJ:
(4)
This indicates that Pa is strongly dependant on factors which affect the long
range energy barriers. Hence Pa is a function of both ionic strength, which
reduces the effective distance of the electrical double-layer, and pH, which
alters surface charges of both bubbles and mineral surfaces. While the energy
21

CHAPTER 2
barrier is difficult to measure and no correlation has been found between P0
and Gauach' this term (P.) does find its way into the more useful concept of
induction time.
Eigeles and Volova [1960] performed extensive induction time measurements
under varying conditions, such as collector concentrations and temperature.
Laskowski [1989] has interpreted their findings to give the following function:
(5)
where 'ti = induction time
'to = induction time when kinetic hinderance is a minimum
i.e. when Gauach = 0
w = apparent activation energy
k = Boltzmann constant
T = absolute temperature [K]
Thus induction time, and hence P0 , is strongly affected by temperature. This
was claimed by Kirchberg and Topfer [1964] to be a result of decreased
viscosity allowing easier displacement of water at higher temperatures. Dobby
and Finch [1987] used the same concept with their assumption that:
'ti =f('f\)
where f\ is viscosity.
It is essential that contact time is greater than induction time for the mineral
particle to attach to the bubble. Hence for attachment to occur the following
statement must hold true:
't > 't. c z (6)
where 'tc = contact time between mineral particle and bubble
This is termed the kinetic criterion for flotation and must be satisfied along with
the thermodynamic criterion of AG< 0. Furthermore, for all conditions, T > 0,
and hence:
22

CHAPTER 2
(7)
So that:
't' > 't'. > 't'o c l (8)
From this Laskowski [1989] postulates that possibly:
(9)
According to this relationship, Pa=O for 'tc$'ti and Pa is close to unity when
'tc> >'ti•
The development of equation (9) shows how the probability of attachment
relates to induction time and contact time, as well as the importance of the
concept of the forward energy barrier caused by long range repulsive forces.
What this also shows is that the probability of attachment is proportional to
temperature and is ·also a strong function of both pH and ionic strength of
solution. It was not however found to be directly related to hydrophobicity.
This is because hydrophobicity is a static equilibrium (thermodynamic)
measurement of component surface forces, while induction time is a kinetic
parameter and relies on aspects of the surface forces relating to the forward
energy barrier. Thus while the thermodynamic criterion of AG< 0 is essential
for flotation to take place, the total free energy change is less important than
other hydrodynamic factors in determining probabilities (rates) of attachment.
Particle and bubble size are also important factors affecting probability of
attachment. Induction time is inversely proportional to particle size, owing to
the reduced significance of repulsion forces iri larger particles, while the contact
time available for attachment increases proportionally with bubble size.
Thus conditioning can be seen to play two important roles in flotation
thermodynamics and kinetics. The first is in creating a hydrophobic surface to
satisfy the thermodynamically necessary criterion of AG< 0. The second is in
23

CHAPTER 2
meeting the kinetic criterion of 'tc >'ti. This is done through reducing the long
range repulsion forces by altering the surface charges of the particles, thus
improving Pa and hence flotation kinetics.
Additionally, collectors on mineral surfaces are known to interact with
surfactants on bubbles [Leja and Schulman, 1954], thus further improving Pa
and Ps. The mechanisms involved are poorly understood, but are postulated
to involve hydrophobic interaction, which can be represented as shown in
Figure 2.13.
Waler Salullon.
Figure 2.13 -
Air.
Collector-Surfactant Interaction (from Leja and
Schulman, 1954)
2. 7. Mathematical Modelling of Flotation - The Klimpel Flotation Model
The Klimpel flotation model, so named after Dr R.R. Klimpel, is a widely accepted
means of describing the rate of flotation of a mineral for any given system. This model
is a regression model, which aids in expressing differences between flotation systems,
but cannot be used to predict flotation rate or recovery in any given system. Its
fundamental basis lies in combining flotation kinetics with pulp density functions,
integrated over time, to give recovery curves. The equation for the model is shown in
equation (10) below:
24

[ -kt l
Recovery = R 1 - ekt
where R = ultimate (final or equilibrium) recovery
k = initial rate of recovery
t = time
CHAPTER 2
(10)
The best way to understand how this function may be used is by looking at an example
provided by Klimpel [1984]. Figure 2.14 below shows two flotation yield - time curves
for a copper-xanthate system. A low collector dosage of 22.3 g/ton results in a low
initial flotation rate but high ultimate recovery, while a high dosage of 63.2 g/ton has
a higher initial flotation rate but lower ultimate recovery. The Klimpel model fitted to
these curves, yields the Klimpel R and k values given in Table 1, below.
Table 1: Klimpel Values for Copper Flotation at two Collector Doses
Collector Dosage Klimpel k Klimpel R
22.3 g/ton 1.59 0.908
63.2 g/ton 0.90 0.999
Figure 2.14, is a typical example of a trade-off between the kinetic and the
thermodynamic effects in flotation and has been described as the Rik trade-off. Initially
flotation is kinetically controlled, while the ultimate recovery is determined by the
thermodynamics of the system.
In an industrial application, the duration allowed for flotation would determine which
of the two recovery curves would be favoured for recovering a given mineral. The
cross-over point determines the time beyond which the equilibrium or R value becomes
more important than the rate or k value. Ideally conditioning should result in increases
in both k (rate) and R (equilibrium) values. If this happens, it will have the effect on
the recovery (yield) - time profile shown in Figure 2.15.
While the Klimpel flotation model is useful in describing recovery curves, it must be
remembered that it is a great simplification of the mechanisms in action. Particularly
it assumes that all particles remain exactly as floatable as they were when flotation
25

0.8
"O 11> >= 0.6
5 ~ 0.4
u: 0.2
0 0
Equilibrium or R control
CHAPTER 2
2 3 4 5 6 7 8 9 10 11 12 13 14 15
Flotation Time (minutes)
I .... 22 g/1Dn collector -+ 63.2 glton collector I Figure 2.14 - Relative Importance of Klimpel k and R Parameters
1.2 .----------------------------,
32 0.8 <I>
>= § 0.6
~ LL 0.4
0.2
kand R high
kand R low
0 2 3 4 5 6 7 8 9 10 11 12 13 14 15
Flotation Time (minutes)
I .._ before corditiorirg -+- after corditiorirg
Figure 2.15 - Effects of Increased k and R Values on Recovery (Yield}
began. This is a poor assumption, since secondary conditioning is known to continue
during flotation.
2.8 Shear-flocculation
Shear-flocculation refers to the observed flocculation which can occur in highly agitated
systems. The effect of shear flocculation is to change the apparent particle size
26

CHAPTER 2
distribution in the pulp. As is shown is section 2.9.2 below, particle size is one of the
most important factors affecting flotation performance. Thus shear-flocculation can
have a strong influence on the flotation of a mineral.
In shear-flocculation, the energy barrier resulting in repulsion of similarly charged
hydrophobic particles .is overcome by intense mixing [Subrahmanyam and Forssberg,
1990; Shouci and Song, 1991]. The formation of hydrophobic aggregates results from
the fact that the hydrophobic interaction energy is a few hundred times greater than the
energy of molecular or electrostatic repulsion. This type of aggregation is favoured
when the mineral is coated with collector molecules of long chain length. The
hydrophobic interaction is shown in Figure 2.16 below.
Figure 2.16 - Hydrophobic Interaction of Shear-Flocculated Particles
[Shouci and Song, 1991]
Shear-flocculation can be induced during conditioning by using very high impeller
speeds. There is a cut-off speed below which agitation merely facilitates mixing and
diffusion of reagents. If this speed is exceeded, shear-flocculation takes place and
greatly complicates the conditioning sub-process.
Shear-flocculation can have particular relevance in the flotation of ultra-fine particles.
These can be removed from the system by a technique termed carrier flotation, where
27

CHAPTER 2
a few large particles act as sites for attachment of the ultra-fines. The attached fines
are then floated as part of a larger conglomerate. The optimum sizes and ratios of fine
to large particles can be calculated from collision theories.
2.9 Research in Conditioning
Large volumes of literature can be found on almost every variable of flotation. Much
of this work is largely empirical and very system specific. However, there is no work
which tries to define conditioning in a global sense. Most conditioning work centres
on specific preparation problems. Additionally the design of conditioners has received
little attention, with retention time and the agitation required to keep the particles in
suspension being the two factors chiefly considered. It is only recently that interest has
been shown in the mechanics of conditioners and the effects of conditioning intensity
and turbulence on flotation recovery and grade. An overview of the more general
expositions on variables of conditioning, and in what direction conditioning studies are
moving, is given in this section.
The effect of the duration of conditioning on flotation has been acknowledged in some
of the earliest works including that of Wark and Sutherland [1955]. But the first in
depth investigation into the possible affect of the power input into the conditioning stage
was made by Rubio [1978]. His results showed that the grade of flotation concentrate
of copper minerals was increased with increasing energy in the conditioning stage.
Duchen [1980a, 1980b, 1982] showed similar findings for conditioning of ore bearing
Au, U30s and pyrite. His first work discusses the effect of the type of agitation used
in conditioning on the flotation of Witwatersrand pyritic ore. His results showed that
high intensity mechanical agitation provided better initial rates of recovery, at far
superior grades, than occurred as a result of agitation through aeration. This
improvement in rate and grades was greatest for high impeller speeds. This work was
extended to investigate the effect of intensity of agitation, with impeller· speeds ranging
from 700 rpm to 2 100 rpm, representing a 27 fold increase in power input.
Figure 2.17 shows the effect of impeller speed on rate of recovery, expressed as first
order rate constant k, for gold, uranium and pyrite. In all cases grade of mineral
recovery increased with increasing impeller speed. Figure 2.18 shows the effect of
impeller speed on equilibrium recovery, expressed as a percentage of mineral in the
28

CHAPTER 2
feed. The figure shows that increased impeller speed resulted in increased equilibrium
recovery for gold and pyrite; the response of uranium was more complex.
12
10
~ I 8
~
~ 6 Q)
&1 ~
,0 ~ lI:
2
0 700 900 1100 1300 1500 1700 1900 2100
lrrpeller Speed (rpm)
Figure 2.17 - Effect of Impeller Speed on Rate of Flotation [Duchen, 1980]
~ 0.£17
'H. 0 0 5 o.93 'B ~
LL
IQ ~ 0.89
j 5 0.85 E ~ w ~ .
l.ITl
0.81 '------'------"'----'-----'------1----'--------' 700
Figure 2.18 -
1300 1500 1700 1900 2100
lrrpeller Speed (rpm)
Effect of Impeller Speed on Equilibrium Recovery
[Duchen, 1980]
Later work by Duchen [1982] investigated the effects of extended conditioning time on
froth flotation of gold, uranium and pyrite form the same ore as previously used.
29

CHAPTER 2
Again, mechanical conditioning greatly improved flotation rate and grade. The
improvement with respect.to conditioning time was observed to improve to a peak and
then fall off for extended durations, in the region of 1 hour.
More recently, it has been found that the selectivity and recovery of fine particles.can
be much enhanced by increased energy input in conditioning. This is shown in work
carried out by Bulatovic and Salter [1989], where finely ground complex copper ores
were subjected to varying power input (0-4 kW/m3 of pulp) in the conditioning stage.
Anderson [ 1988] studied the flotation of coal using oily collector~. His study of various
oils revealed that "with any one oil, conditioning procedures were found to have a
rriarked influence on flotation performance". His work showed that conditioning the
coal with collector in a small volume (hence high intensity of mixing) before adding
water to dilute the pulp for flotation often produced far superior results. "The most
common way of introducing oil in batch flotation experiments (where the cell is full so
that agitation conditions are comparatively .mild) generally produced poorer grades".
· Interpretation of his work is complicated, however, by the need to disperse the oil into
fine droplets before they attach onto the coal particles.
The most recent work covering the concept of power and energy in the conditioning
stage is that of Stassen [1990, 199la, 199lb], using South African U30 8 and pyrite
ores. His complete work including experimental procedure, captured data and
development of equations and conclusions has been obtained in thesis form, and is more
fully analyzed in the next sub-section (2.9.1) and in Chapter 3 below.
Von Holt [1992] studied the column flotation of coal. His work highlights the
importance of conditioning prior to flotation. The column cell is a quiescent flotation
system. This means that while batch or other agitated cells input a high level of energy
into the slurry (often eliminating or reducing the need for a separate conditioning
stage), little energy is input during column flotation. The problems associated with
poor conditioning are thus magnified in column flotation. Von Holt showed that the
. method of conditioning strongly affected flotation performance. He also identified a
number of other conditioning variables which affected flotation performance. The most
important variables were as follows:
- Method of Collector (oil) addition
- Impeller Speed
- Cell Type
30

32 "' >-
~
a> > -0 ::i E ::l u
CHAPTER 2
- Collector (oil) dosage
- Scale of Conditioning (relates to turbulence achieved)
While conditioning in coal flotation includes the dispersion of insoluble collector, the
results are remarkably similar to those achieved for soluble collectors. Von Holt's
work is not a 'study of conditioning per se and hence the results are largely qualitative,
but they show very clearly the differences in response to the above variables. These
are shown in Figure 2.19, Figure 2.20 and Figure 2.21.
100
90
80
70
60
50
40
30
20
10
100 200 300 time (s)
400 500
Ke
---mode 1. .3.3.30 g/I --a--mode 2 .. u12 g/t
--*""" mode 1. 1556 g/I -)(--
l'l'lOd<I 2. 1602 g/I
600
Figure 3.14 ··Effect of oil dosage on bulk (mode 1.) and pre-dispersed (mode 2.) conditioning of coal pulp on flotation yield; sample - Kleinkopje thickener underflow fines: collector - ShellsolA; collector dosages - see graph legends.
Figure 2.19-Effect of Method of Collector Addition on Flotation Response [Von Holt, 1992]
Figure 2.19 shows the effect of the method of collector (oil) addition, as well as dosage
on flotation response. Addition of the oil as a bulk "slug" (mode 1.) gave the best
yields, ·with the batch addition of the oil as a pre-dispersed oil-water emulsion
substantially worse. Further work showed that continuous addition was worse still.
This was probably due to additional conditioning in the batch systems. As would be
expected, increased collector dosage resulted in increased flotation response. This is
shown again in Figure 2. 20 below.
31

100
90
80
"O 70
Q >.. 60 ~
Gl 50 >
a '3 40 E :I u
30
20
10
100 200 300 Hme {s) .
400 500
CHAPTER 2
Koy:
-& 0 1414 Q/I 1400.....,,
* O 4193 Q/I 2700 .....,,
* L 1111 Q/! 1200.....,,
* l 4l~S ri/11000 fJll'll
600
Figure 3.19 Effect of cell type and impeller speed on continuous conditioning; sample -
Kleinkopje thickener underflow; collector - ShellsolA; collector dosage - see
legends; mode 3. conditioning; D - Denver cell, L - 3 I modified Leeds cell.
'Figure 2.20 - Effect of Collector Dosage and Impeller Speed on Flotation Response
[Von Holt, 1992]
Figure 2.20 shows the effect of collector dosage and impeller speed on flotation
·performance, using both a Denver (31 laboratory) cell and a 'Leeds (31 laboratory) cell.
Increasing collector dosage and impeller speed increases flotation response, with both
cells showing marked improvement in yield when dosage is increased from 1500 g/ton
to 4000 g/ton. At both dosages the Leeds cell showed a slight improvement in
performance over the Denver cell. The effect of cell type 'is even more evident, when
the 3 1 Leeds cell is compared with a 240 1 Pilot conditioning tank (Figure 2.21). The
use of the Leeds cell for conditioning results in far more rapid flotation response and
a higher ultimate yield. Von Holt suggested that this was as a result of a much reduced
conditioning turbulence, that of the pilot cell being in the order of one magnitude below
that of the Leeds cell.
Jameson and Ralston [1992] point out that in much of the previous work in
conditioning, "much emphasis was placed on the energy input into the conditioner.
However, the hydrodynamic effects of high shear and intensive agitation are only one
part of the phenomenon. The influence of pulp chemistry in high-energy conditioning
32

" -m
90
80
70
;;:. 60
~ 50 0 :5 40 E :J 0 30
20
10
CHAPTER 2
3 I batch ceU
240 I pllol lank
o.-~~-.~~~.-~~-,-~~~.....-~~-.-~~---1
0 100 200 300 lime (s)
400 500 600
Figure 3 :21 Comparison between bulk addition of o i 1 to .a 3 1 laboratory Leeds ce 11 (batch_
ce 11) and a 240 1 capacity pi lot rig tank; sample - K le inkopje thickener underflow fines; collector dosage - nominally 1500 g/t.
Figure 2.21 - Effect of Cell Size on Flotation Response [Von Holt, 1992]
is critical." A joint research proposal prepared by these two authors suggests that
mechanisms including cleaning of oxidised surfaces, agglomeration of valuables and
dispersion of flocculated gangue particles may be involved in improving recovery in
high intensity conditioning systems. _
Ralston [Blake and Ralston, 1985; Crawford and Ralston, 1988] has been intimately
involved in studying a number of fundamental aspects of flotation relevant to the
conditioning stage and related mechanisms. Section 2.9.2 provides an overview of the
important variables covered by his work.
2.9.1 Stassen
The work of Stassen is concerned with the effect of energy input in the
conditioning of ores prior to the flotation stage. His thesis [Stassen, 1990]
investigates energy input as a function of conditioning time and impeller speed;
33

CHAPTER2
as the following abstract from a subsequent paper on the topic [Stassen, 199la]
shows:
SYNOPSIS (J.S.AIMM, vol 91, no. 5)
The effect of conditioning energy on the flotation of gold, ~08, and
pyrite was investigated in the range 0.1 to 100 k"11 per tonne of dry ore
for various combinations of conditioning time and impeller speed in a
cylindrical conditioning tank. It was found that, when the conditioning
energy was increased to between 5 and 10 k"11 per tonne of dry ore, the
total recovery and flotation rate of the valuable minerals (expressed as
Klimpel parameters) increased substantially. The Klimpel parameters are
dependent on conditioning energy, but are independent of conditioning
time or impeller speed (at constant conditioning energy). The Klimpel
parameters of the gangue are independent of conditioning energy.
The following function was derived to describe the flotation rate and final
recovery (as Klimpel parameters) obtained after conditioning in a stirred batch
tank system. The Klimpel parameters are represented by <I> (The full derivation
of the function can be found in Chapter 3 below, together with details of the
experimental equipment, technique and results obtained).
where <I> = Klimpel parameters k or R d<I> = <!>max _ <!>min
K = proportionality constant
P = power input
t = time
V =volume
y =exponent of power
c : subscript referring to conditioning
(11)
Results were obtained for a large number of combinations of power and time.
The results were then fitted to the function above using least squares regression.
34

CHAPTER 2
Stassen' s data showed that y.= 1, and that setting "( for time (initially 1) equal
to"( for power gave little loss in statistical accuracy (r). With "(power= "ftimc the
function simplifies the P and t terms, reducing them to Energy, giving:
<I> -K *E Y <I>max - 11 <I> . e c c
(12)
where E = Energy
The following charts (Figure 2.22, Figure 2.23 and Figure 2.24) ·show the
experimental results obtained by Stassen. The results are plotted as k and R
against log Energy, with the regressed function drawn through the points. This
work shows that there is a definite relationship between mixing energy and
flotation grade and recovery, though the spread of data would indicate a poor
fit to the function chosen. The work also implies, from the fact that the power
and time terms reduce to energy, that the energy input into the conditioning
stage is more critical than the components of power input .or duration of mixing .
...----,9-----------. ~ - --- .. -9 --· - ·-----·· ~
0 0
*
.,-0 0
., . "' 0 ci ci
1
1oc5Sc5 a a a a
I y + * o L __ _
w
0
* 0
* 0
*
0
0
0
w
Figure 2.22 -Klimpel Parameters for Sulphur vs Conditioning Energy (from Stassen, 199la)
35

CHAPTER 2
--e----~
B D
w w
Figure 2.23 - Klimpel Parameters for Gold vs Conditioning Energy (from Stassen, 1991a)
0 0 51 $!
e ~. 0 0
D D "' ., Q Q ., . .,
~ "' . .,
* 9 9 9 • 9 9 9 E 0 0 e Ci e .e c c a or:P Q a 0 0
+•o D
8 52 Ii soi
- -....... ....... .r=. .r=.
• + • D 3:: 3:: + tl 'b
.:£ .:Y.
+ * w w
I .. -·~ * D
* ~ CX) x+-1. ~ CD + 0 ')(. ~ 0 Xllf x ct) • -!J C"J + =? I I I I I -. =? -. a: 0 m Cl) .. !D "' ... "' "' ; 0 C> Cl) .... "'o ... .,
"' "' "' .,_ .,,o
"' "' ... ... ... ... ... ... "' ... "' "' "' "' .ll: ...,- "'- c:f
Figure 2.24 - Klimpel Parameters for Uranium vs Conditioning Energy (from Stassen, 1991a)
There are however a number of fundamental problems with this work, relating
to both the experimental procedure and the analysis of the results. Chapter 3
36

CHAPTER 2
contains a critique of the experimental procedure and a re-evaluation and re
interpretation of the data generated by Stassen.
2.9.2 Ralston
Work done by Blake and Ralston [1985] and Crawford and Ralston [1988] has
investigated the connection between floatability, particle size, hydrophobicity
and ionic strength in the absence of other complicating influences. A technique
was used in which the surfaces of quartz particles were tailored to various
known surface coverages via a methylation process with trimethylchlorosilane.
The technique enabled the trimethylsilyl groups to be firmly anchored to the
quartz surfaces. At a ~xed pH and ionic strength, the electrical double-layer
properties were not found to be altered by the presence of these surface groups,
neither was the van der Waals repulsion between the particles and air bubbles
detectably influenced by the ultra-thin trimethylsilyl adsorption layer.
"Flotation experiments were carried out in a modified Hallimond ·tube; the
height of the flotation column from the glass frit to the water/air interface was
set at 33 cm, a figure chosen in order to reduce entrainment. High purity
nitrogen was used as the flotation gas. A known mass of quartz particles,
generally 1.00 g was conditioned for five minutes (method unknown - assumed
to be mechanical agitation at a consistent energy input) before nitrogen was
introduced. Flotation was generally carried out for five minutes."
The results obtained were analyzed under three basic headings:
2.9.2.1 Flotation as a function of particle size and surface coverage
Contact angle (the primary measure of hydrophobicity) was shown to be
directly related to, and easily correlated with, surface coverage of the
quartz by trimethylchlorosilane. This is vital to the assumption generally
made that increased. surface coverage increases hydrophobicity (though
this changes at very high collector dosages, when surface coverage
becomes multi-layered).
37
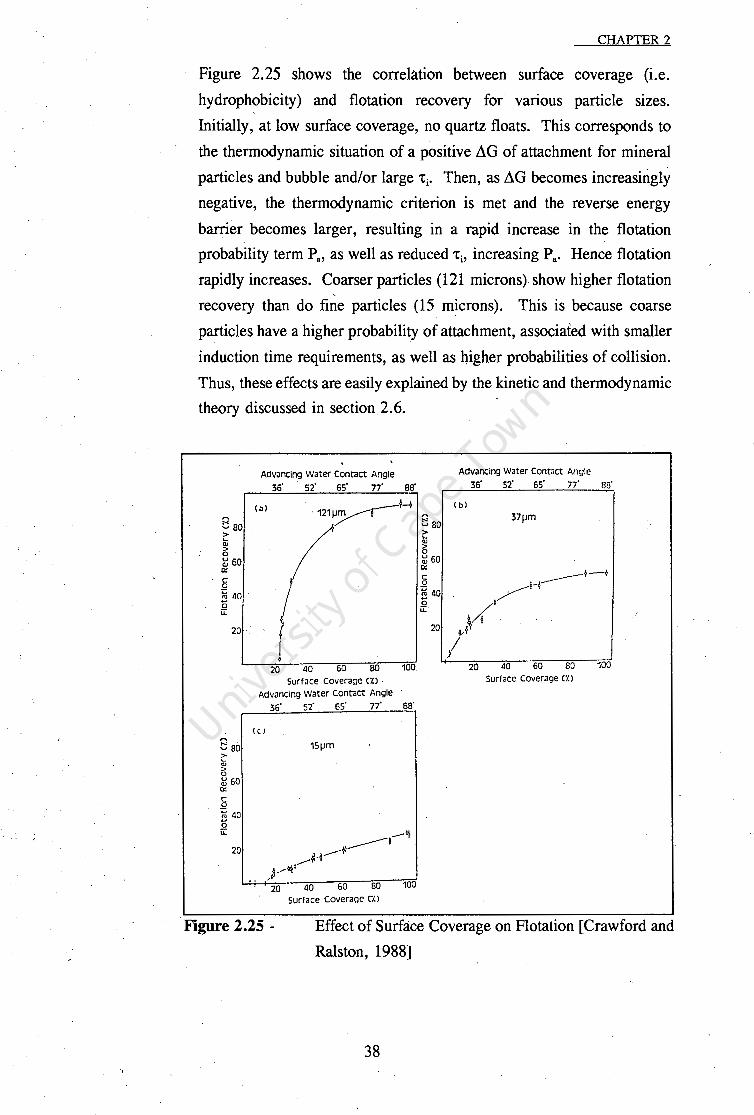
CHAPTER 2
Figure 2.25 shows the correlation between surface coverage (i.e.
hydrophobicity) and flotation recovery for vanous particle sizes.
Initially, at low surface coverage, no quartz floats. This corresponds to
the thermodynamic situation of a positive .LiG of attachment for mineral
particles and bubble and/or large 'ti. Then, as .LiG becomes increasingly
negative, the thermodynamic criterion is met and the reverse energy
barrier becomes larger, resulting in a rapid increase in the flotation
probability term P., as well as reduced 'ti, increasing Pa. Hence flotation
rapidly increases. Coarser particles (121 microns) show higher flotation
recovery than do fine particles (15 microns). This is because coarse
particles have a higher probability of attachment, associated with smaller
induction time requirements, as well as higher probabilities of collision.
Thus, these effects are easily explained by the kinetic and thermodynamic
theory discussed in section 2.6.
8 80 > ... "' ~ :;; 60 a: c 0
~ 40 a u:
20
8 ab ~ QJ
~ ~ 60 a: c 0
~ 40 a u:
20
Advancing water Contact Angle 35· · s2· 65' 77· a0·
(al· H 121~
I I I 0
20 40 60 80 100 surface Coverage C'Zl
Advancing water Contact Angle 36' 52· 65° 77• 88'
{ c}
1sµm
20 40 60 80 100 surface Coverage C'l.l
Advancing Water Contact Angle
35' 52' 55· 77' 88'
(bl
37µm
20
20 40 60 80 100 Surface Cover;:ige C'l.l
Figure 2.25 - Effect of Surface Coverage on Flotation [Crawford and
Ralston, 1988]
38

CHAPTER 2
It is important to examine more carefully, at this stage, the effect of particle
size on the extent of flc..:tation, as shown in Figure 2.26. There is an optimal
particle size, above and below which reduced flotation recovery is experienced.
This phenomenon can be understood as the result of two different mechanisms,
whose influence is maximum at opposite ends of the size spectrum. The first (
is the resistance to capture by bubbles:· electrostatic repulsion forces keep
particles and bubbles apart. This influence is measured as induction time. The
magnitude of the influence of this effect is inversely related to particle size. . '
The second mechanism is the gravitational and inertial forces experienced by
the attached particle. These forces, causing fall-back, are countered by the
reverse energy barrier. But the Gdetnch are surface forces. Surfaces increase
more slowly than mass and thus fall-back is positively related to particle size.
Hence, the flotation of large particles is limited by fall back, while small
particles are less likely to attach to the bubble surface in the first place.
"" to" ..... 80
i lil 60 D::
6 ~ 40 0 Li:
20
Advancing Water Contact ·Angle
36" st' 55· n· as· (a)
20 40 60 80 100 surface Coverage Cll
"" :::; 80 > ....
~ ~ 60 D::
20
Advancing Water Contact Angle
35· 52" 55· n· 88"
(b)
40 60 80 100 . surface coverage CXl
Figure 2.26 - Flotation Recovery as a Function of Surface coverage
and Particle Size [Crawford and Ralston, 1988]
The critical surface coverage, below which quartz will not float
regardless of flotation time, is shown in Figure 2.27. As may be seen,
this is also dependent on ~article size. Crawford and Ralston [ 1988]
draw on induction time and flotation limit equations to analyze the
39

CHAPTER 2
regions of floatability, but do not make any conclusions as to the reason
for this phenomenon.
Figure 2.27 -
Advancing Water Contact Angle 35· s2· ss· n· aa·
140
120 • n I ~100 • v
Cl.I
"' VI
Cl.I :g .... ~
"' Cl.
c:: "' Cl.I ~
80 I no flotati9n /.
60
40
20
. ~ /. . ·< flotaMn
~ no flotation
20 40 60 80 100
Critical Surface Coverage C'l.>
Critical Surface Coverage for Flotation as a Function of
Particle Size [Crawford and Ralston, 1988]
2.9.2.2 Influence of Ionic Strength on Flotation Response
Ionic strength is also seen to affect flotation, as shown in Figure 2.28
(also shown by Laskowski [1989]). Increasing the ionic strength of the
pulp results in a reduction in the critical surface coverage for all particle
sizes. The reason for this was discussed in section 2.6.2 in the kinetic
justification of conditioning, where it was stated that induction time is an
inverse function of ionic strength. The ions in solution mask the long
range repulsion interactions between particle and bubble, thereby
reducing repulsion and allowing more rapid approach and attachment.
40

100
-E 2-so Q) N
Vl
Q) 60 u ..... ._ ro 0. 40 c ro Q)
~ 20
Figure 2.28 -
CHAPTER 2
Advancing Water Contact Angle 1s· 25· 31' 35· a1·
5 10 15 20 25
Critical surface coverage 11.1
Effect of · Ionic Strength on Flotation Recovery
[Crawford and Ralston, 1988]
2.9.2.3 Flotation recovery as a function of time
Crawford and Ralston [1988] performed flotation experiments, sampling
over time to gather yield data as a function of time for three different
particle sizes (99, 46 and 15 µm). For each particle size the time
dependence of flotation was also determined as a function of surface
coverage. The results are sown in Figure 2.29.
The results show that coarse particles typically float very rapidly and that
similar recoveries can be achieved for varying surface coverages. This
finding changes as particle size decreases. For intermediate and fine
particles, flotation response slows and is critically affected by surface.
coverage. The weak flotation response of 15 µm particles is especially
notable and correlates well with other findings where, in industrial
applications, ultra-fines largely report to concentrate only because of
entrainment and are not significantly concentrated.
41
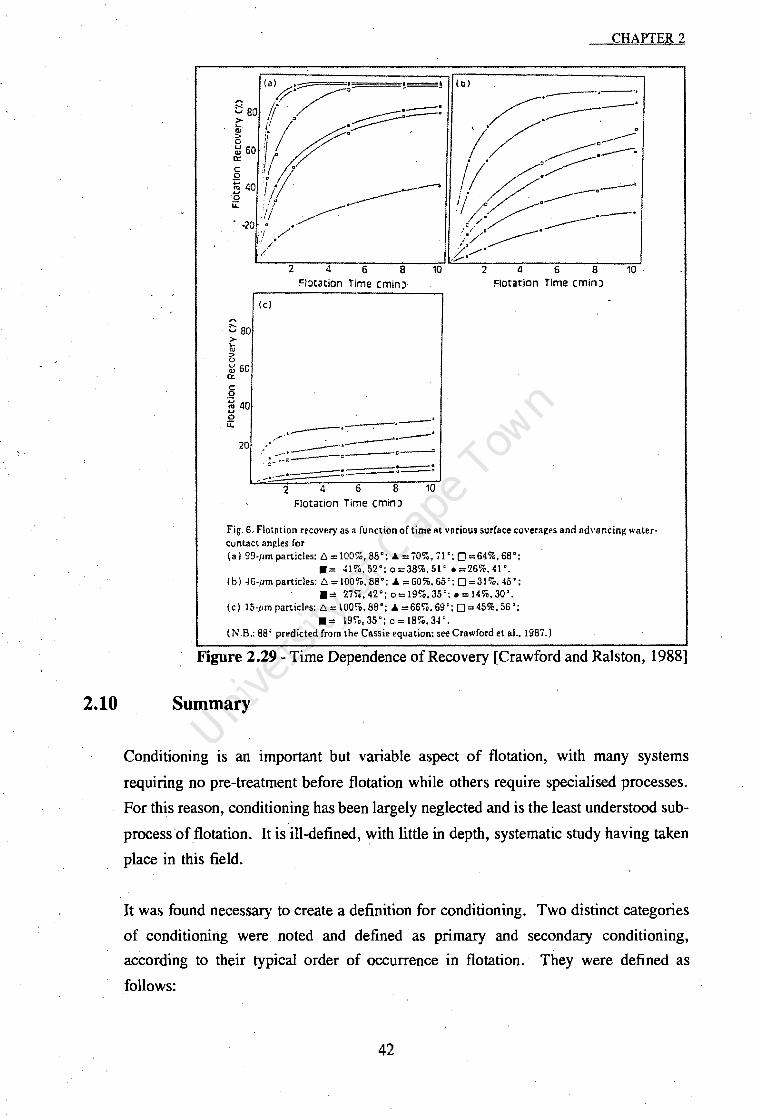
2.10
CHAPTER 2
(al •;:;:::--------:• • ~! (b) '7./ . /::==-: 0 f. .--:::::::::::= ::::::::::::=: • 0 ;:::::::;---1-v= ·. !/.~:~ ilr . 1;f -----~ II~- .
f • . ~ ----·__.:.--" '/ ~/· .'l/ ~· . (> ----·-· . .
;: ./ /, ·------· • ·20
,... ;:; 80 > .... "' :> 0 ~ 60
°' 5 ~ 40 ., 0 u::
•/ /
2 4 6 8 10
Flotation Time cmin)·
(c)
----· _ .. -.-----::-=~--u-o 2 6 8 10
Flotation Time cmin)
. /. ,,../"
~o,/"• .y-•
2 4 6 .a 10 . Flotat:ion Time cmin)
Fig. 6. Flotation recovery as a function of time at various surface coverages and advancinf( water· contact angles for (a) 99·/lffi particles: 6=100%, as·: J. = i03, 71 ': 0 =643, 68°; . •= 41%.52°:0=38%.51 •=26%,41°. (b) 46-µm particles: L'I = 100%, 88°; J. =60%, 65': 0=31%,45°; •= 2750, 42°; 0=19%, 35':. = 14%. 30'. (c) 15-iim particles: L'I = 100%, 88'; J. =66%. 69': 0=45%. 56'; •= 19%,35'; o=l8%,3~'. (N.B.: 88' predicted from the Cassie equation: see Crawford et al.. 198i.)
Figure 2.29-Time Dependence of Recovery [Crawford and Ralston, 1988]
Summary
Conditioning is an important but variable aspect of flotation, with many systems
requiring no pre-treatment before flotation while others require specialised processes.
For this reason, conditioning has been largely neglected and is the least understood sub
process of flotation. It is ill-defined, with little in depth, systematic study having taken
place in this field.
It was found necessary to create a definition for conditioning. Two distinct categories
of conditioning were. noted and defined ·as primary and secondary conditioning,
according to their typical order of occurrence in flotation. · They were defined as
follows:
42

Primary Conditioning relates to the physiral preparation of the surfa.ce of the particles.
This includes comminution, oxidation, acid leaching and bacterial pretreatment.
Secondary Conditioning is the process whereby prepared particles are rendered
hydrophobic or hydrophilic through mixing, control of the envi.ronment and contacting
with reagents.
It was also observed that primary conditioning is very ore specific, while secondary
conditioning is almost universally applied in flotation. For this reason, the work will
concentrate on the most common aspect of secondary conditioning, namely the adsorption of
collector onto the mineral surface in order to render it hydrophobic for flotation.
It was shown that this aspect of conditioning could be described by the theory pertaining to
a heterogenous stirr((d tank reaction, with a surface reaction (adsorption of collector onto a
mineral surface) as the primary event. This allowed the factors likely to affect the efficiency
of conditioning to be determined. The variables most likely to affect conditioning efficiency
were found to be (the variables to be tested in this work are indicated by italics):
ORE:
COLLECTOR:
SYSTEM:
Mineral type and degree of liberation
Grind size, affecting such features as s/v ratio
Pulp density
fype, including solubility, polarity and molecule si~
Dosage
Attachment mechanism
pH
Time
Mi.xing (power and turbulence)
Method of agitation (turbulence distribution)
Temperature
Ionic Strength
The importance of these variables of conditioning on flotation was determined by studying the
factors affecting the thermodynamics and kinetics of flotation. Thermodynamically, it is
necessary that conditioning make the particle to be floated hydrophobic (the explicitly stated
function of secondary conditioning). All else being equal, the more hydrophobic the particle
is made during conditioning, the more thermodynamically favourable the flotation. Study of
the kinetic criteria for conditioning introduced the concept of induction time, which was
43

CHAPTER 2
shown in the literature to affect the probability of attachment to rising bubbles, and hence the
probability of flotation. A number of variables were shown to affect induction time, including
particle size, ionic strength, the particle's charge and the slurry temperature.
·-'-
Modelling of flotation was then discussed, with particular reference to the Klimpel flotation
model. The uses and limitations of this model were briefly described.
Recent work in conditioning was then studied. The authors reviewed included Duchen
[1980a, 1980b, 1920], Anderson [1988], Von Holt [1992], Stassen [1990, 1991a, 1991b] and
Ralston [Blake and Ralston, 1985; Crawford and Ralston, 1988]. The works covered a wide
range of variables of conditioning, with most of the results confirming the conditioning theory
presented earlier in this chapter. The most studied variable of conditioning was energy input,
with all of the research covered showing some relationship between energy input in the
conditioning stage and flotation response. Stassen provided a regression function for the
effect of conditioning energy input on flotation response, derived from the Klimpel flotation
model. Because of the completeness of Stassen' s available work and its direct relevance to
this thesis, his work will be studied further in Chapter 3 to help gain a clearer insight into the
conditioning sub-process and the problems associated with measurement of conditioning.
44

CHAPTER 3 - CRITIQUE OF STASSEN'S WORK
3.1 Introduction
The findings of Stassen's work have been outlined in section 2.9.1 above. His
experimental results show a wide spread and a poor fit to the model he derived to
predict the data points. While the data fit might be statistically acceptable owing to
the large number of points, it is the opinion of the aut~or that there are better
explanations for the spread and shape of the data. In this chapter, the work of Stassen
is analyzed in more detail to try to find the trends and the fundamental mechanisms
causing the results.
In order to render fair criticism of Stassen' s work, both the experimental method used
and the mathematical model he derived need to be investigated. From an experimental
point of view it is important to understand the procedure used, and to check the validity
of assumptions rising out of or implicit in this. Also, the mathematical model must be
thoroughly understood. In order to simplify the function, Stassen made a number of
assumptions, which should be studied to check their validity. The rest of this chapter
examines Stassen' s experimental technique and the derivation of his function, then
questions the validity of some of the assumptions made and the experimental results
obtained. The data is then reviewed in the light of the analysis made.
3.2 Experimental Technique
Stassen's investigation was carried out on two different samples of ore bearing pyrite,
U30 8 and gold, using n-propyl xanthate as the collector. The conditioning was
perfonned in a large baffled tank, with the pulp being transferred to a Denver
laboratory batch flotation cell for the flotation stage. The standard conditions and
experimental procedure used are given below, with details taken from Stassen' s thesis
[1990]. All italicised text is a direct quotation from this work. Un-italicised text added
by the present author is intended to aid the reader in understanding the logical
progression of the discussion. Numbers in parentheses preceded by a (t) represent
issues which will be discussed in detail later in the chapter.
45

CHAPTER 3
For the suspension of solids it is necessary to use an axial Dow impeller . . For
the conditioning of flotation pulp two types of axial Dow impeller are normally
used, the pitched-blade impeller and the hydrofoil or aerofoil impeller, of which
the LIGHI'NIN A110 impeller is the most well-lmown and widely used.
Two ore samples (henceforward identified as ore A and ore B) were used in this
investigation.
The following variables were selected to be studied:
conditioning time
impeller speed
ratio of impeller diameter to tank diameter
impeller type '
ratio of impeller height above tank bottom to impeller diameter
ratio of pulp height to tank diameter
type of ore
By different combinations of these variables it was possible to vary the
conditioning energy over three orders of magnitude (0.1 to 100 k'Mllt of dry
ore), which is representative of conditioning energies likely to be encountered
in practice.
The following variables were kept constant:
pulp density (1300 kglrrt)
conditioning and. flotation temperature (25°C)
pH (11,5)
grind (65% -75 µm)
reagent additions (100 git CuS04, 60 git sodium n-propyl
xanthate, 15 git Aeropromoter 3477 and 13 git tri-ethoxy
butane)
flotation cell impeller speed (1500 rpm)
air feed rate
The experimental conditioning tank consisted of a cylindrical PVC container
with a 300 mm inside diameter,' flat bottom and a height of 600 mm. It had
four vertical bames of 1112 tank diameter at 90° to one another and which
46

CHAPTER 3
stretched to 10 mm from the bottom. 10 kg of dry ore, were conditioned per
experiment in this container.
The reported conditioning times only include the times the pulp oos conditioned
in the conditioning tank and not the extra conditioning in the flot.ation cell.
After conditioning the contents of the conditioning tank were split on a sample
splitter so that 40% oos used frJr subsequent flotation. A laboratory size 9 litre
Denver 12 flotation cell w.iS used (t1). Approximately 13 git of tri-ethoxy
but.ane oos added to the conditioned pulp and conditioned frJr roughly 1 minute.
EXll.ctly two minutes after conditioning oos completed, the air inlet oos opened
and flotation st.arted. Flotation time oos measured from this moment [frJr a
total of 12 minutes]. Five concentrate samples were t.aken (over this period).
The five concentrate samples and the tails were filtered, dried, weighed, mixed
and ground (to avoid fluctuation in chemical composition) and analyzed for Au,
Ui08 and S (pyrite) (t2).
3.3 Derivation of Stassen's Model
The derivation of Stassen's mathematical model (taken from his Masters Thesis) is also
important to the understanding of his work. Details of the derivation are given in full
below. once again, italicised text is a direct quotation, un-italicised text has been added
by the present author, and numbers in parentheses preceded by a (t) represent issues
which will be discussed in the section below.
MASS 'TRANSFER DURING CONDffiONING
It can be shown that the reaction between mineral particle and collector is the
rate determining step during conditioning and subsequent flotation (t3). This
reaction is governed by mass transfer because the difii.Jsion of collector across
a liquid film has been shown to be the rate-determining process in flot.ation with
Xll.nthates as collectors. The rate of mass transfer of collector A can be
expressed as a first order reaction
RA = akL(CA- cAsurty
47

CHAPTER 3
where = Rate of reaction of A, [kmoI.m·3.s-1]
= Concentration of collector A, [kmol. m·3]
cAsurf = Concentration of collector A at the mineral surface,
[kmoI.m-3]
Then
where
a = surface area per unit volume, [m2/m3]
kr, = mass transfer coefficient, [kmoI.m-2.s-1]
= -R :A
= -ak /C - csurry Ll' A A
tc = time, [seconds]
For mass transfer under turbulent conditions
Sh = 2.0 + cRe/Sc 13
with Rep the particle Reynolds Number, Sh the Sherwood Number and Sc the
Schmidt Number:
Rep = uDpp/µ
Sc = µlpDL
Sh = kLDp/DL
At high particle Reynolds Numbers this can be approximated by
Sh = cReaSc 13 p
because the second term of this equation is much larger than the first.
Experimental data have been co,rrelated with this equation to obtain va.lues for
(the empirical constants) c, a and f3, eg. for spherical particles:
Generally: Sh = c Re/12Sd13
or: Sh = 1.13 Re/12Sd13
In the case of non-spherical particles even more complex equations have been
derived. ~ continue this. deriva.tion with the general exponents for simple
spherical particles (t4).
Rep can be expressed as power per unit volume as
Rep = P113(P!Vj16D/13 /µ112
48
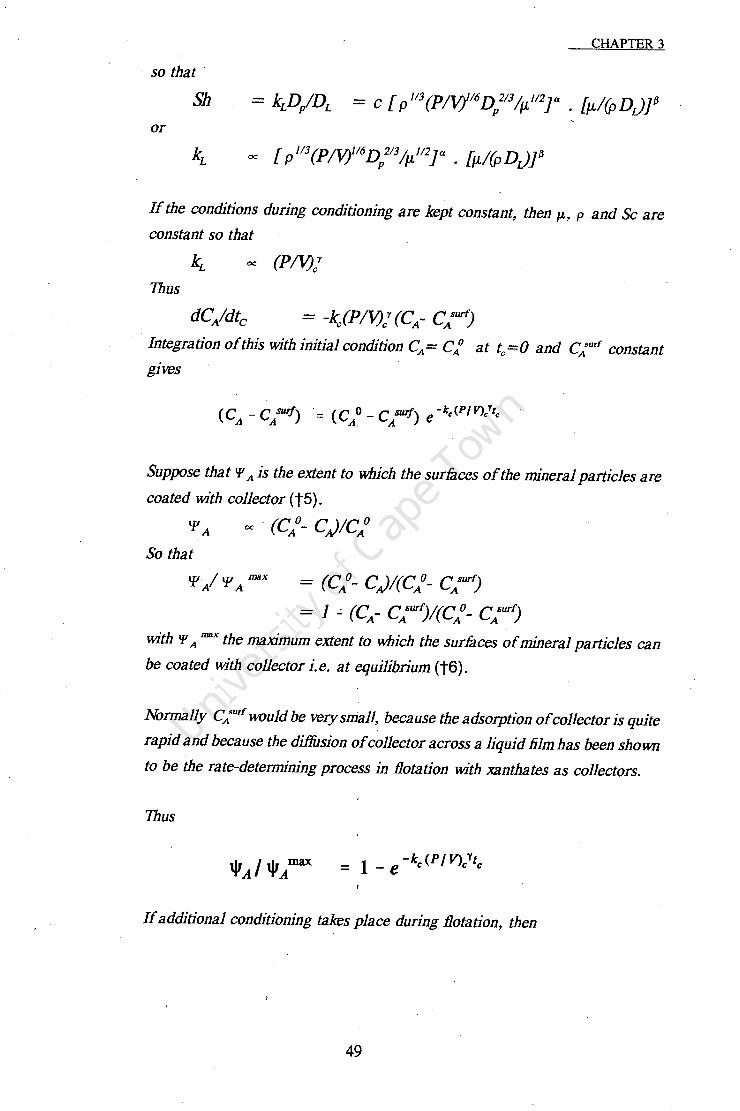
CHAPTER 3
so that
Sh = kLDp!DL = c [ p 113(PIV}116D/13/µ 112}a . [µl(pDJJ 13
or
If the conditions during conditioning are kept constant, thenµ, p and Sc are
constant so that
Thus
Integration of this wi.th initial condition CA= C} at tc=O and cAsurf constant
gives
(C _ C surf) ·= (Co_ C surf) e-kc(P/V)/tc A A A. A
Suppose that 'f' A is the extent to which the surfa.ces of the mineral particles are
coated wi.th collector (t5).
lf' A oc . (C}- c ,JIC}
So that
lf' / lf' max A A = (C}- C,J!(C}- CAsurry
= J ..: (CA- CAsurJ/(CAo - CAsurr;
wi.th 'f' A max the maximum extent to which the SUrfa.CeS Of mineral particles can
be coated wi.th collector i.e. at equilibrium (t6).
Normally cAsurr 'WOuld be very small, because the adsorption of collector is quite
rapid and because the difIUsion of collector across a liquid film has been shown
to be the rate-detennining process in flotation wi.th xanthates as collectors.
Thus
If additional conditioning takes place during flotation, then
49

CHAPTER 3
with subscripts c and f denoting conditioning and Rotation respectively.
EXPRESSION FOR k IN 1HE KUMPEL EQUATION
It has been mentioned that Roatability is proportional to the probability of
flotation, i.e.
'1> oc Pc•Pa•Ps
Pc the probability of collision between a mineral particle and an air bubble can
be expressed as
Pc = (Jn 14).DbDpvbpN,,
If the conditions during Rotation are kept constant, then Pc is a constant.
Ps the probability of formation of a stable bond between mineral particle and air
bubble can be expressed as
P = J _ /d fdcrit\[.5 d < dcril
s l' v'' v J ' v - v
Ps = 1 dcrit v (sic: p. should = 0)
with dvcrit the maxiinum (critical) nominal particle diameter of a mineral particle
which can form a stable bond with an air bubble.
If the conditions during Rotation are kept constant, Psis constant (t8).
·For this system this means
q, oc Pa
Pa the probability of adhesion between mineral particle and an air bubble can
be expressed as
Pa = sech 2 (3vbi/2Db)
I However, the concept of "induction time" introduced by this equation is not well
understood and defined differently by different investigators. This has led to
very large differences in the estimation of induction times. It is often defined
as the difference between the instant of collision and instant of adhesion, but
50

CHAPTER.3
there is no precise instant at which collision can be said to have occurred. This
concept should only be used if more is .known about induction periods.
Rather assume that Ps is proportional to the extent to which the surfa.ces of
mineral particles are coated with collector (t7). Collector concentration
through the relevant adsorption isotherm controls the surfa.ce concentration of
the reagent and through this the potential adhesion capacity of the particles for
the bubbles. This gives
Pa oc tp A
so that
Then because k = N,,cP the Klimpel flotation rate constant can be expressed as
Furthermore, if k ~ it119' as t c ~ 0 and k ~ rx as t c ~"" ,. then (t9)
or
The implicit assumption here is that conditioning in the flotation vessel is a constant and
therefore is reduced out of the equatio~ when integrated. This assumption is discussed
in more detail in section 3.6.
Exactly the same form of the function can be derived for the Klimpel R parameter .
. The derivation for this is given in Appendix A. Thus:
EXPRESSION FOR BOTH KllMPEL PARAMETERS
Summarized this means that both Klimpel parameters can be expressed as ·a
JLJnction of the conditioning energy as
51

CHAPTER 3
= -k (PI V) v t c c c
v.dth cfJ any Klimpel parameter (Rork); and r constants which are Jiinctions
only of the type of ore and type of mineral. ~ is a constant which is a !Unction
only of the conditions during Rotation, the type of mineral and the type of ore.
Having progressed through the derivation of Stassen's equation, it is necessary to see
how well the data may be made to fit the equation.
3.4 Stassen's Results and Regressed Model
Stassen used two ore types in his experimental work. A total of 74 results (data
points) were obtained for ore A and 46 points for ore B. These represent different
combinations of the variables listed on page 46 above. The complete results are shown
in Appendix B. Below is a summary of the coefficients calculated for Stassen's derived
regression model. Also included ate the co-efficients o~ determination and statistical
F values, from which Stassen inferred the applicability of his model. It was these
values that Stassen used to plot the curves in Figure 2.22, Figure 2.23 and Figure 2.24
above.
Table 2 : Coefficients for Stassen's model including statistical F and R2 (Stassen, 1990)
Coefficient of
Ore cp cpmio cp- k., 1 Determination F R2
Ore A R"" 93.8 97.5 0.0167 1.0 0.7061 173
k"" 3.8 10.0 0.0244 1.4 0.4556 60
~ 40.1 47.9 0.0150 1.0 0.7646 234
kll30S 1.4 3.0 0.0440 1.4 0.7068 174
Rs 92.7 97.6 0.01 1.25 0.6103 113
ks 1.5 9.1 0.0161 1.1 0.8420 384'
Ore B RAn 95.8 97.7 0.0288 1.0 0.5045 45
kAn 4.7 11.l 0.0229 1.4 0.6367 77 RlilOS 37.6 42.4 0.0172 1.05 0.7885 164
kul08 0.95 2.7 0.0273 1.4 0.5939 64
Rs 95.7 97.9 0.0207 1.0 0.5888 63 ;
ks 1.7 11.3 0.0133 1.15 0.8959 379
Stassen states:
The statistic R 2 is called the co-eflicient of determination and is used to judge
the adequacy of the regression model. It is a measure of the amount of ·
52

CHAPTER 3
variability in the data explained or accounted for by the regression model. It
is clear that a very high percentage (up to 89% in the case of kc for ore B) of
the variability of the data is explained by the equation (t10).
Stassen goes on to say:
Evaluation of the statistic F provides a second statistical test of the regression
model. If F is greater than the maximum theoretical value which would be
expected to occur by chance alone, it may be concluded that the distribution can
not be due to chance alone. At a selected confidence level of95% the critical
F-values for the two groups A and Bare F0.025,1,72=5.26 and F0.025,1,44 =5.39
respectively. Because the calculated F-values are much larger than the critical
F-values, it is concluded that the equation predicts the Rotation behaviour of the
three valuable minerals in l#twatersrand ore with respect to conditioning
accurately (t11 ).
3.5 The Model's Assumptions
Stassen's experimental technique, mathematical model and his data fit to the model have
been presented. In the opinion of the author, there are several aspects which are
questionable. These are discussed below, with reference to the points identified by
(t#) above. A description of the expected impact of any errors introduced is also given
for each point.
(t1) - It is important to note that Stassen's experiments were carried out using
·laboratory scale batch flotation equipment, which implies shallow unstable froth.
Stassen states:
Care was taken to ensure a constant method and rate of froth removal because
of the sensitivity of Rotation rate to both the rate and method of froth removal.
The whole froth surface was scraped in 9 seconds and a new scraping cycle
started every 10 seconds.
However, flotation sensitivity is not limited to the method of froth removal, but is also
determined by froth height and stability. This imposes additional noise and masking
53

CHAPTER 3
of effects through fall back, which is a function of froth stability, rather than mineral
attachment stability. This froth stability can actually be reduced by increased
hydrophobicity of particles, and is strongly dependent on particle sizes and the mass of
solids present in the froth. Stassen makes no mention of the possible error imposed by
this problem.
(t2) - The next problem is in the sampling technique itself and results from the
mixing of the five concentrate samples before analysing for Au, U30 8 and S (pyrite).
Stassen determined the mass yield for every interval, but only measured an average
grade for all of the samples combined. Thus recovery for each of the samples is
approximated as: yield times average grade. Since the Klimpel rate value (k) is a time
dependant variable, it is important that an accurate knowledge of recovery over time
is gained, and not just yield. Mixing the mineral before analysis averages the mineral
grades and hence requires the supposition that:
1) All of the mineral samples are of the same grade.
Or, failing this:
2) Any change in grade with time is consistent for all power inputs into the
system.
While this might be a reasonable assumption for perfectly homogeneous solid particles,
it cannot hold true for particles of varying size and degree of mineral liberation, as is
the case here. In all cases coarser and higher grade particles will be expected to float
fastest (see figure 2.31). Hence this system is immediately biased against accurate k
values. Also for poorly conditioned pulp, only the purest mineral will float initially,
while for well conditioned pulp a poorer grade of initial recovery would be expected.
This will boost the apparent k value for well conditioned material, but will not
accurately reflect the poorer grade.
Finally, mixing the samples results in the loss of useful information about the time
dependency of grade for various conditioning inputs. Klimpel's work [1984] suggests
that a trade-off between Rand k might be expected.
(t3) - Stassen's model is derived from the assumption that adsorption of the
collector onto the pyrite is diffusion controlling. This is a good assumption in as much
as most studies on pyrite ores and thiol collectors indicate that diffusion is the
54

CHAPTER 3
controlling mechanism. In Stassen's work the special case of high intensity
conditioning was studied. Under these circumstances, where conditioning was very
turbulent, the assumption might not be valid. The probability that diffusion may not
be controlling under these conditions is discussed further in section 3.8 below. This
would or could affect the interpretation of the results at the upper energy region of the
test work. It is expected that as reaction· rate becomes the rate controlling step, the
influence of energy input into the system, and on k and R values, reduces until
eventually increased intensity or duration of agitation results in no gains in flotation
yield (see Figure 2.10). Thus it would be expected that Stassen's data would flatten
off to constant k and R values at high conditioning energy inputs - whic,h is indeed what
happens, as may be seen in Figure 2.22, Figure 2.23 and Figure 2.24 in Chapter 2, as
well as Figure 3.4 and Figure 3.5, which appear at the end of this chapter.
(t4) - Stassen chose the "general exponents for simple spherical particles" for
use in the Sherwood equation. It can only be assumed that this was done for simplicity.
Pyrite is a cubic crystalline structure. When the mixed mineral particles have been
crushed and milled, the particles are highly irregular in shape. Moreover, only a
fraction of the surface of each particle would be expected to be exposed mineral and
hence an active site. Thus the particles are irregular and contain patches of active sites
rather than being spherical as implied by Stassen 1 s derivation. (It might be impossible
to model this situation and hence a spherical approximation could be the most practical
alternative, but this was not stated in the thesis.)
(t5) - Stassen's derivation continues by relating "collector uptake" to a
"maximum extent to which surfaces of mineral particles can be coated with collector"
(see equation (13) below).
CA=
C o_ A -
C surf_ A -
(13)
Concentration of collector A in solution, [kmol/m3]
Concentration of collector at time t = 0
Concentration of collector on the mineral surface
55
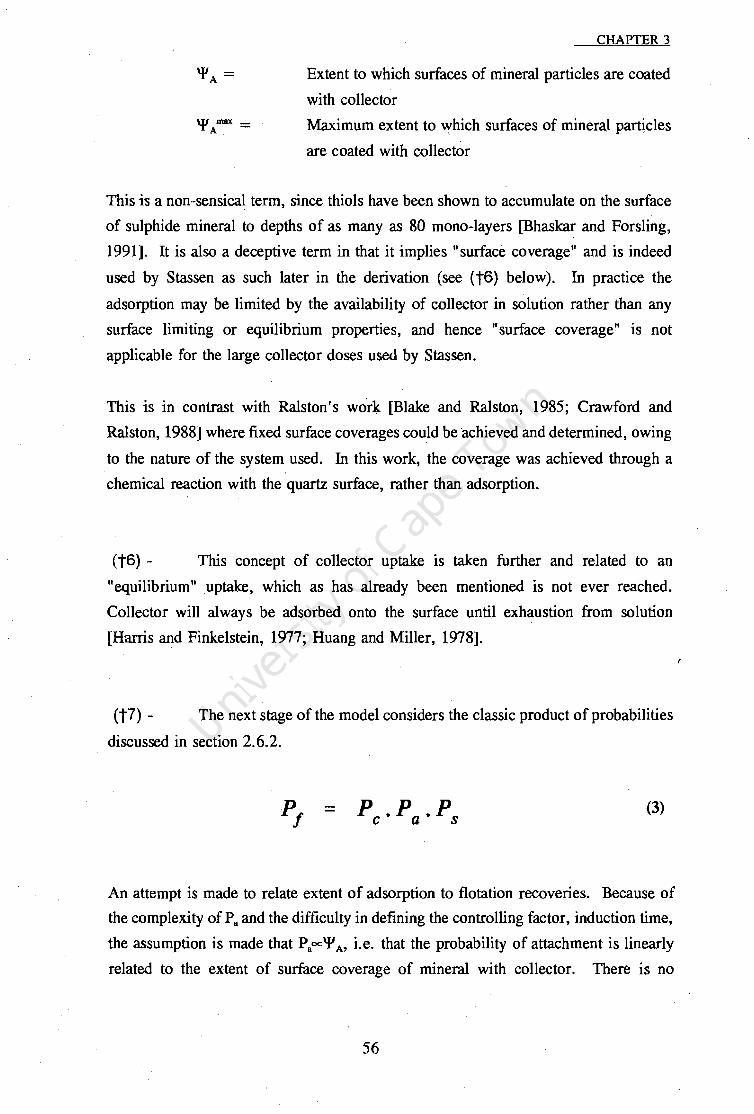
----------------------------------·--
CHAPTER 3
'¥A = Extent to which surfaces of mineral particles are coated
with collector UJ mftX _ TA - Maximum extent to 'Yhich surfaces of mineral particles
are coated with collector
This is a non-sensical term, since thiols have been shown to accumulate on the surface
of sulphide mineral to depths of as many as 80 mono-layers [Bhaskar and Forsling,
1991]. It is also a deceptive term in that it implies "surface coverage" and is indeed
used by Stassen as such later in the derivation (see (t6) below). In practice the
adsorption may be limited by the availability of collector in solution rather than any
surface limiting or equilibrium properties, and hence "surface coverage" is not
applicable for the large collector doses used by Stassen.
This is in contrast with Ralston's work [Blake and Ralston, 1985; Crawford and
Ralston, 1988] where fixed surface coverages could be achieved and determined, owing
to the nature of the system used. In this work, the coverage was achieved through a
chemical reaction with the quartz surface, rather than adsorption.
(t6) - This concept of collector uptake is taken further and related to an
"equilibrium" uptake, which as has already been mentioned is not ever reached.
Collector will always be adsorbed onto the surface until exhaustion from solution
[Harris and Finkelstein, 1977; Huang and Miller, 1978].
(t7) - The next stage of the model considers the classic product of probabilities
discussed in section 2.6.2.
(3)
An attempt is made to relate extent of adsorption to flotation recoveries. Because of
the complexity of P,. and the difficulty in defining the controlling factor, induction time,
the assumption is made that Paoc'I' M i.e. that the probability of attachment is linearly
related to the extent of surface coverage of mineral with collector. There is no
56
.. I

CHAPTER 3
scientific basis for this assumption: rather there are a number of important reasons for
refuting it. These are as follows:
1) Pyrite is naturally floatable at around pH 4 as well as pH 11 (pH 11.5
was used by Stassen). Microflotation of pyrite at pH 4.0, carried out by
the author as part of the present work, (see section 4.5.3) showed that as
much as 50% of the pyrite floated without the use of any collector.
Hence, while it is possible that a linear relationship exists, Pa is not
directly proportional to 'I' A·
2) The large xanthate collector dosage used in Stassen' s experiments exceeds
that necessary for maximum flotation at infinite conditioning. Thus
flotation is only affected by adsorption up to a fraction of the maximum
collector available for adsorption.
3) The work of Ralston [Crawford and Ralston, 1988] showed that, for
quartz, the relationship between surface coverage and flotation recovery
was quadratic in nature and definitely not linear (Figure 2.25). Thus for
many systems, P11 is neither proportional to nor even linearly related to
'I' A· This assumption should not have been made without substantiation.
(t8) - The above error is compounded by the assumption that P. in the flotation
probability equation is constant when physical flotation conditions are constant. This
is derived from literature which states that:
where
( d )1.5 p = 1 - v
s crit dv
(14)
cl_. = volumetric (nominal) diameter of particle
d_.crit = volumetric (nominal) diameter of largest particle which will
remain attached to the bubble
But from the kinetic and thermodynamic theory already presented in section 2.6 it is
clear that collector coverage on the mineral surface will alter d_.crit, because it increases
the reverse reaction energy required for detachment of mineral particles from bubbles
57
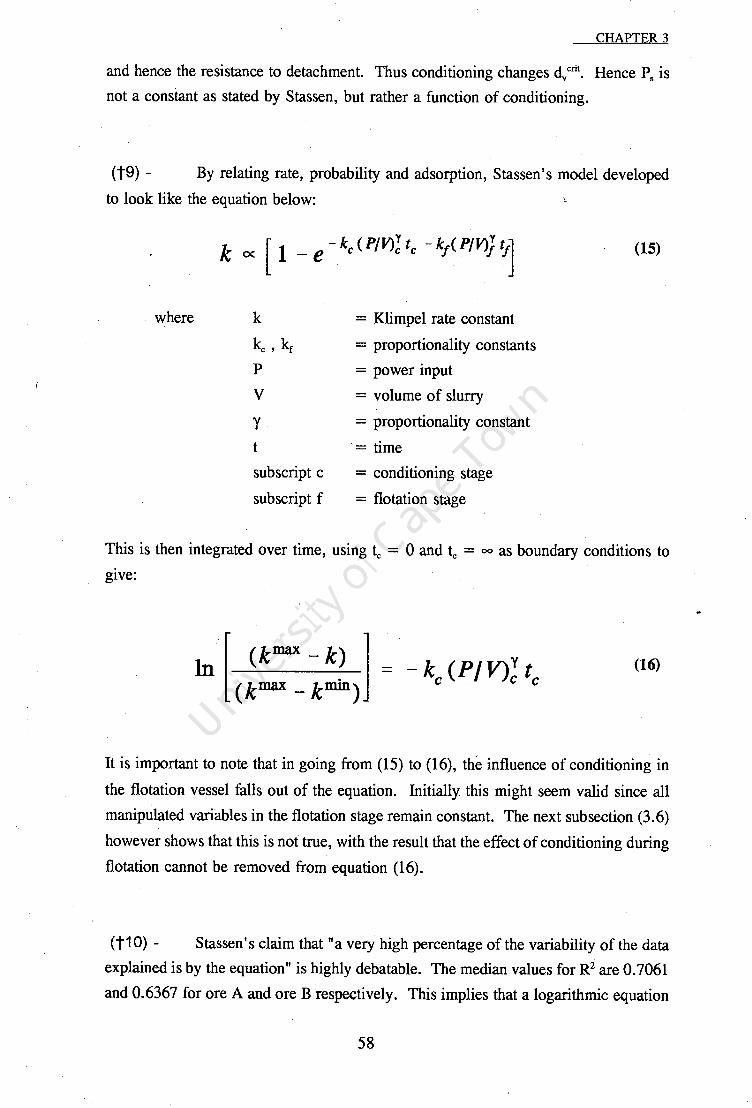
CHAPTER 3
and hence the resistance to detachment. Thus conditioning changes dvcrit. Hence P. is
not a constant as stated by Stassen, but rather a function of conditioning.
(t9) - By relating rate, probability and adsorption, Stassen's model developed
to look like the equation below: L
where k
~' kf p
v 'Y t
subscript c
subscript f
= Klimpel rate constant
= proportionality constants
= power input
= volume of slurry
= proportionality constant
'= time
= conditioning stage
= flotation stage
(15)
This is then integrated over time, using tc = 0 and tc = oo as boundary conditions to
give:
(16)
It is important to note that in going from (15) to (16), the influence of conditioning in
the flotation vessel falls out of the equation. Initially this might seem valid since all
manipulated variables in the flotation stage remain constant. The next subsection (3.6)
however shows that this is not true, with the result that the effect of conditioning during
flotation cannot be removed from equation (16).
(t10) - Stassen' s claim that "a very high percentage of the variability of the data
explained is by the equation" is highly debatable. The median values for R2 are 0.7061
and 0.6367 for ore A and ore B respectively. This implies that a logarithmic equation
58

------------------·---···-
CHAPTER 3
utilising 4 variables could not account for, on average, 35 % of the variability of the
data. This is a very poor fit for such a malleable and complex equation!
The above begs comparison with the ability of simpler equations to model this data.
Linear models were generated using a statistical computer package and with no
reference to any theoretical basis. The results are listed in Table 3 below. The form
of the function was: <!>= a + b.P + c.t + d.J>2. It is interesting to note the similarity
of the R2 results to those achieved by Stassen1s equation. While Stassen's model does
have consistently slightly higher R2 values, it must be noted that the time and power
variables have been spaced exponentially, thus better suiting a logarithmic compression
of this variable rather than linear analysis. Also, there is obviously a diminishing
return on input in such a process, which would benefit an exponential function.
Table 3: Linear Residual Errors Compared with Stassen' s Errors
Ore A Linear Linear Stassen Stassen
R...,
k ...
RU30S
ku:ic<1
Rs ks
$ R2 F R' F
0.679 36 0.7061 173
0.589 33 0.4556 60
0.690 40 0.7646 234
0.683 37 0.7068 174
0.6l0 30 0.6103 ll3
0.728 39 0.8420 384
(t11) - Stassen concludes that large F-values imply that "the equation predicts the
flotation behaviour of the three valuable mineral in Witwatersrand ore with respect to
conditioning accurately". It is more likely that the flexibility of the equation presented
is responsible for large F-values, rather than these high values being any reflection of
the fundamental correctness of Stassen's equation. This is shown both in the high F
values for the linear models presented and the fundamental errors in the derivation of
Stassen' s equation.
Having briefly discussed the areas of Stassen 's assumptions which were felt to be
problematic, it is important to analyze in more detail the expected effects of changing
these assumptions. The next section covers the area of continued conditioning. This
is followed by re-analysis of Stassen' s data.
59·

CHAPTER 3
3.6 Continued Conditioning During Flotation
In Stassen' s model, Klimpel rate and final recovery values are expressed in terms of
conditioning power and time. The additional conditioning occurring in the flotation
vessel during flotation (after the conditioning stage) is neglected; it falls out of the
calculations in going from (15) to (16). However this is valid IF AND ONLY IF
conditioning during flotation is constant. This appears to be true at a first analysis, but
when the rates of removal are taken into consideration, it may be seen that conditioning
during flotation is not constant. This may be explained as follows.
The material being floated from a cell is removed from the system at differing rates,
resulting in differing amounts of conditioning. in the flotation stage. To illustrate,
consider two extremes of conditioning prior to the flotation stage (no prior conditioning
and infinite prior conditioning). Then the results of the flotation experiments, plotted
as recovery vs time, would appear as shown in Figure 3.1 below. The material which
had received infinite conditioning would be removed from the slurry more rapidly than
that which received no conditioning.
Infinite Conditioning
No Conditioning
Time Figure 3.1 - Mineral Floated vs Flotation Time
The material which has not floated remains in the flotation vessel and receives the
benefit of further conditioning. The proportion of material receiving continued
conditioning for each of the cases is shown is shown in Figure 3.2. From the Figure,
60

CHAPTER 3
it is evident that the previously unconditioned material remains in the flotation vessel
for longer than does the infinitely conditioned material - the difference corresponding
to the shaded area between the two "continued conditioning" curves. Hence
conditioning in the flotation cell for both cases is not the same. Material which has
received some conditioning (between the two extremes of no prior conditioning and
infinite prior conditioning) would lie somewhere between the two extremes in Figure
3.2.
No Conditioning
Infinite Conditioning
Time Figure 3.2 - % Mineral Receiving Continued Conditioning vs Time
Thus the assumption of constant continued conditioning during flotation is false. Poorly
conditioned material receives the benefit of continued conditioning during flotation,
while well conditioned material does not. Thus the k and R values obtained for ore
which has received little prior conditioning will be artificially increased. While it can
be shown that this effect is minimal for higher conditioning levels, it can be shown to
be significant at low conditioning levels.
The error occurs to such an extent that continued oonditioning in the flotation cell
·totally swamps any effect in the conditioning vessel until the energy inputs are of the
same magnitudes. This may be seen by the long initial flat region in the fit to Stassen's
experimental data fork values (Figure 2.22, Figure 2.23), as well as the only marginal
losses in ultimate recovery (R values) predicted for even very poor conditioning
61

CHAPTER 3
compared to very vigorous conditioning (e.g. Rm,,=93% and Rnax=98% for pyrite).
Since mineral particles have a minimum critical surface coverage requirement which
must be fulfilled on order to float, and since poor conditioning is unlikely to allow this
critical coverage to be exceeded, a far lower ultimate recovery would be expected at
the poorer conditioning levels.
Figure 4.11 on page 107 shows much reduced recovery for reduced adsorption. This
indicates that it is not that Stassen' s system is poorly conditioned; rather (in the case
of low energy input into the conditioning vessel) the mineral is being conditioned in the
float cell instead. The Klimpel k is less affected by conditioning in the flotation cell
. as it is an initial term, whereas R is a cumulative term which is affected by the total
energy input during the entire flotation process. This accounts for the larger predicted
changes in k and very small changes in R.
The severity of this error can be checked by determining the magnitude of continued
conditioning in the flotation vessel (i.e. the additional specific energy input). Oldshue ·
[1983] states that for any particular impeller design, in an agitated vessel, a
dimensionless power number can be found, which is constant for a given Reynolds
number. This power number relates impeller diameter, rotational speed and power
input into the system, as follows:
NP = 2,158x1017 p (17)
N3Dsp
where Np = Power number
N = Rotation speed in rpm
D = Impeller Diameter in mm p = Power in Watts
p = Fluid specific gravity
Thus for a known power number, impeller diameter, pulp density and impeller speed
the power input into the flotation . vessel can be calculated. For this the function is
rearranged to the form below:
62

3
p N N3 D 5 p p
2,158 x 1017
Stassen supplies the following data for the flotation vessel:
N = 1500 rpm
time = 1 min stirring + 12 min float = 13 min
CHAPTER 3 _
(18)
The following necessary variables have been conservatively approximated as:
D = 85 mm
NP = 5 (lower limit for Rushton turbine)
p = 1.3 sg
Substituted into equation (18) above, this yields a total conditioning energy in the
flotation vessel of:
p = 460 w which applied to 4 kg of ore for 13 minutes gives
E = 25 kWh/ton
This value far exceeds most of the tested conditioning levels in the conditioning vessel,
and in many cases is orders of magnitude greater. With energy inputs ranging from
0.21 kWh/t to 99.77 kWh/tin the conditioning vessel, some tests received nearly 120
times more agitation energy during the flotation stage. Fewer than 6 % of Stassen' s
conditioning tests received more energy in the conditioning vessel than in the flotation
cell. Even if this (conservative) estimate were an order of magnitude too large, the
conditioning during flotation could still be on a par with conditioning imparted in many
of the tests in the conditioning vessel. 3
While it may be argued that much of the material will not be exposed to all of this
extra energy provided during flotation, as it will have floated, this is not true for poorly
conditioned material which will float slowly and hence will remain in the cell for most
This is equivalent to using a 53 mm impeller, with all other variables remaining the same. If on the other hand, the impeller diameter were 100 mm then energy input during flotation would be 56 kWh/ton.
63

CHAPTER 3
of the flotation time. The same applies to poorly floating material, which also will be
exposed to the full extent of conditioning provided by the flotation stage.
As a result of this error, the measured k and R values are very different from the real
k and R values. In Stassen' s work ~ppureot > > ~1 for poorly conditioned material and
k,,ppareoi""' k.cni for very well conditioned material. This can be represented as shown
below in Figure 3.3. This error has more effect on R values, since k is determined by
initial conditions (first few minutes) in the flotation vessel, while R is an equilibrium
term calculated from the final flotation recoveries. The overall result is substantially
higher measured Klimpel values than the real .Klimpel values at low conditioning
energy, with the error in measurement being reduced as the conditioning energy
increases to "infinite conditioning" ..
Kreal .
~--- Kmax
K = Klimpel parameter
korR
log(Energy Input) Figure 3.3 - Effect of Conditioning Energy Input on Stassen' s .Klimpel
Parameters Showing K;.ppureot and ~1
A partial solution, using the existing data, would be to overlay a rate function on the
flotation cell's conditioning function. This would necessitate a more complex iterative
solution, but would take into account decreases in flotation conditioning with increasing
rates and recoveries. The greatest problem with this solution would be in determining
the effects of such factors as:
Low levels of initial conditioning, which ensure that already highly
floatable particles do not adsorb unnecessary collector. These float
64
CHAPTER 3
without much collector addition, allowing better distribution of collector
to poorly floating particles.
Removal of solids from the system, resulting in slight pulp density
changes and hence conditioning power input, turbulence and collision
efficiency.
Large-scale removal of collector from solution, strongly affecting bulk
concentration and hence adsorption rates.
Large conditioning energies during flotation, totally masking effects of
small initial conditioning in the conditioning vessel.
Continued conditioning experienced during the delays between the
conditioning stage and the flotation stage.
Co-adsorption of surfactants (frothers) onto the mineral surface.
Removal of frother over time, which will affect the efficiency of flotation
of slower floating particles (or those still requiring conditioning due to
low conditioning energy in the conditioning stage).
Flotation rate (density of particles in the froth), which will influence the
froth stability.
A more effective means of counteracting these problems· would be to use a flotation
system which to some extent eliminates the above problems. This would require the
following features:
1) Flotation energy input should be small relative to conditioning energy input;
that is:
(19)
This minimises the error caused by continued conditioning in the flotation cell.
2) The system should be frotherless and should not allow fall back of material
which has left the pulp phase. This eliminates the complications caused by the
froth phase, which has different criteria for ,optimal stability, than does the
flotation phase for optimal mineral attachment to bubbles.
65

CHAPTER 3
3. 7 Reproducibility
Reproducibility is not discussed in Stassen' s work, although experimental and sampling
error is mentioned as a possible reason for the poor fit of the experimental values with
the derived equation. Stassen's tests, though, did include a number of reruns of
previously tested conditions.
If the errors are assumed to be normally distributed operator and sampling errors, a
standard deviation may be calculated for the runs. From this data, the validity of the
relationships generated for the rate and recovery may be established. This was not
done by the present author, since (as has been discussed above) the data are already
seriously deviant from what would be required for meaningful interpretation of the
effect of conditioning energy on flotation.
3.8 Graphical Re-Interpretation of Data - the Importance of Power and
Time vs Energy
Stassen suggested that the power and time variables in the equations fork and R can
be reduced to an energy term, which implies that the results are a function of the
product of time and power (E=P.t). The following analysis from Stassen's thesis
(where <l> is either of the Klimpel parameters) implies that r 1:
Thus:
The c~oseness of r to the exponent of the conditioning time (1) in the aboye
equation (equation) suggests that the regression model may be approximated
as a mnction of conditioning energy, H = (P!Vp t;, giving:
(20)
is reduced to:
(21)
66

CHAPTER 3
It is clear that there is close correlation between the Kl.impel parameters and
the conditioning energy and that this equation may be used to predict both
Klimpel parameters for all three valuable minerals accurately.
All the remarks just made concerning the coefiicients of determination and F
values (in Table 2.) also hold for [ the new values ]. Comparison of the
coefficients of determination and F-values reveals that both equations (ie. as a
/Unction of Er and pr t respectively) account for the variability in the data
with the same degree of adequacy.
Table 4 below (from Stassen's thesis) gives a comparison of the R2 and F-values for
both of Stassen's regressions (ie. using P and t versus using E in the equation).
Table 4: R2 and F-values for both of Stassen' s Equations
Ore $ P and t equation F for E equation F for
Ore A
Ore B
Rl P nnd t equation R' E equation
R"" 0.7061 173 0.7077 174
k ... 0.4556 60 0.4238 53
RU3os 0.7646 234 0.7668 237
ku3C18 0.7068 174 0.6530 136
Rs 0.6103 113 0.6137 ll4
ks 0.8420 384 0.8542 363
R"" 0.5045 45 0.5126 46
kAu 0.6367 77 0.5258 49
Ru:;os 0.7885 164 0.7973 173
k= 0.5939 64 0.4545 37
Rs ' 0.5888 63 0.5979 65
ks 0.8959 379 0.8924 365
The correlations may indeed be seen to be very similar. However, while reducing
power and time to an energy term may appear to be a simplification, Stassen has not
really .simplified or improved the equation at all. The similarity in R2 and F-values is
inevitable. The equation still contains four regressed variables, and maintains the same
basic logarithmic shape. It would be difficult to achieve different results using the new
equation! Thus Stassen has made no progress by "simplifying" the logarithmic term
to energy. What may have been of value is if y could have been removed from the
equation, reducing the number of regressed variables to 3.
Instead, a new term, energy, has been introduced, with wholly new implications on the
conditioning process. The reader is led to a conclusion which may not be true and is
certainly not substantiated. Two independent variables, power and time, have been
67

CHAPTER 3
combined into one (energy) using E=P.t and made linearly dependant in equation (21).
It is then concluded that energy input into the system is the important factor affecting
conditioning, rather than either power or time. But, as has been seen with the kinetics
and thermodynamics of adsorption, two intimately linked variables such as these can
have very different effects on the adsorption process. For example, when the reaction
is .rate controlling and diffusion is relatively quick, energy input into mixing will not
improve adsorption, but extended durations will allow more adsorption to take place.
It would appear that the only justification for replacing these two independent variables
with an energy term is that this new model is no worse at predicting results.
On the other hand, there is ample evidence in Stassen's results to show that the power
and time variables should be kept independent. This may be seen for example from
Figure 3.4 and Figure 3.5. In these figures, Stassen's data have been plotted in the
same way as in his thesis (c.f. Figure 2.22, Figure 2.23 and Figure 2.24), using they
axis for the Klimpel k and the x-axis for the energy term, but the tests were colour
coded according to the duration of conditioning. If energy were the independent
variable of conditioning then it should be unimportant whether the energy is added
using more power in a short time, or less power over a longer period. However, if
either power or time independently dominate the equation, then for any given energy
input, the Klimpel k value would be dependent on whether that energy is added quickly
or slowly. This would result in the Klimpel k values for short conditioning durations
being consistently higher or lower for every given energy than for long conditioning
times; i.e. it would be expected that banding of conditioning times would appear in the
diagram. This is exactly what happens. Thus, for example, for gold at E "" 3
kWh/ton and the given conditioning times, the following values for Klimpel k were
achieved (Figure 3.5):
t = 4.5 min k = 9.70
t = 9 min k = 8.22
t = 18 min k = 7.83
t = 32 min k = 6.25
t = 72 min k = 5.31
Thus, analysis of the data for k, splitting data by time as well as E and k, reveals that
extended time gives a lower k value for equal E. This trend continues throughout the
energy range, with conditioning for a shorter time at a given energy input (i.e. more
power) resulting in consistently higher k values.
68

That is, for P.t = constant:
pr high· tlow > pYlow• thigh
Therefore y > 1
CHAPTER 3
This is verified by Stassents regressions using power and time, giving (from Stassen,
1990):
1.1 <yk < 1.4
1.0 <yR < 1.25
Thus there is both a visual and a statistical basis for maintaining both of the variables,
power and time, in the equation. While reducing the terms to energy may "simplify11
the equation with little increased R2 error, this would reduce the model to an empirical
equation. Rather, the exact importance of power (associated with turbulence) should
be investigated. This is especially important in the light of the damping effect that the
large conditioning energy during flotation would have (as discussed in section 3.6).
D v D 10 v
A 0 A
" •A
• D 8 • D D
A A v v A v ~
A • ~ 6 A tJ El •
~ A
• . ' .,, D sz • El 4.5 Mrttes
4 A ·~A f 1' a •9Mrttes
' cP El .1. 18Mrttes • 2
A A .,,,.It. D ~Mntes
vA- •" L-J V 7lMrttes
0 0.1 10 100
Erergy(kWl'fon)
Figure 3.4 - Klimpel k vs Energy for Sulphur, Colour Separated wrt Time (modified
from Stassen)
Finally, another trend which is important to note is that the k values for given conditioning
times appear to reach a maximum at very high energy values. This may be as a result of a
69

CHAPTER 3
13
• 11 ..... a&
• \ 0 A A
A fl • v 9 >-
El .. D [] A a
~ • rl-"' 1• v 0 0
' 7- fi11.&a ' v ~ 0
~ • • a v A v
!2 LI D A
•• m, A D D V
r a 4.5Mn.tes 1r 5- • #•
A A I t 9Mntes A. .. • & 18Mn.tes
3 ,....
' v 0 3>Mn.tes
3kWYk:n V 72Mntes .. . ..
1 I I
0.1 10 1CD 8JilQ'(k\f\Maj
Figure 3.5 - Klimpel k vs Energy for Gold, Colour Separated wrt Time (modified
from Stassen, 1990)
change in the rate controlling mechanism for conditioning. As already mentioned, at very
high levels of agitation, mixing may become so efficient that diffusion is no longer the
· limiting stage in adsorption, rather the adsorption reaction becomes the rate controlling step.
Thus additional power would not improve adsorption and hence flotation (see Figure 2.11)
3.9 Attrition Mechanism
The charts above (Figure 3.4, Figure 3.5) show a reduction in flotation rate at very
high energy input. Stassen postulated that there was an attrition mechanism which
occurred at the high energy levels, causing this drop in flotation rate. Noting the above
relationship however, it is possible to refute Stassen's postulate of an attrition
mechanism (for this xanthate-pyrite system). While it is probable that an attrition
mechanism does exist, Stassen's data do not show it (even at very high energies, up to
99.7 kWh/t). What Stassen's data show is that to achieve such high energies, it was
necessary to have a large duration of conditioning. Since time has less effect on k
than does power, these extended durations have less effect on k than would large power
70

-----------------------------. ········-----~-
CHAPTER 3
values. Hence the apparent drop in k with rise in E is probably a result of poor choice
of axis rather than the existence of an attrition mechanism.
While this observed effect of poorer results at long conditioning times is counter to the
implication from the previous section, that since additional agitation is no longer
required, conditioning time would be expected to improve flotation yield, there is a
possible explanation for this observation. Ma.ny xanthates have a half-life measurable
in minutes or hours and this degradation could conceivably result in poorer flotation
occurring when extended conditioning time is given.
3.10 Conclusion
While it is easy to criticise another's work, it is important to bear in mind the reason
for analysing Stassen 1 s thesis. A number of valuable lessons and useful information
have been gleaned from an analysis of Stassen's results. The key elemertts are as
follows:
Continued conditioning occurs during flotation. Because flotation is a dynamic,
time dependent process, it cannot be ignored by assuming continued
conditioning to be a constant. In the study of conditioning, it is necessary to
minimise the power input during this stage or, better still, to eliminate it
altogether.
The relationship between conditioning and flotation yield 1s a complex
combination of thermodynamic and kinetic mechanisms. Hence, it would be
better to use a simpler measure of conditioning to gain a clearer understanding
of this sub-process, before attempting to relate changes in the variables of
conditioning directly to flotation yield.
The froth phase complicates the conditioning versus yield relationship still
further and again points to the need for another measure of conditioning.
Both power and time appear to be important variables of conditioning.
Contrary to Stassen's suggestion that energy is the important factor, the effects
of power and time on conditioning appear to be independent of each other.
Poor mixing, as found in large vessels, would result in a diffusion controlled
71

CHAPTER 3
adsorption process, whereas as power increases to a well mixed regime,
reaction rate becomes controlling and time becomes the important variable.
Stassen's data suggest that yield returns diminish exponentially with increases
in energy input into the conditioning stage. There must therefore be an
economic cut-off point.
Equipped with a better understanding of the conditioning process and the potential difficulties
of measuring the effects of conditioning variables, it is now possible to begin designing
preliminary experimental equipment and procedures for the present investigation. This
preliminary work is discussed in Chapter 4 below.
72

CHAPTER 4 - DEVELOPMENT OF APPROPRIATE TECHNIQUES FOR MEASURING THE
EFFECTIVENESS OF CONDITIONING
4.1 Introduction
In Chapter 2, a workable definition of conditioning was proposed, and in Chapter 3 an
in-depth analysis of Stassen's previous work on conditioning was carried out. This has
led to a better understanding of the conditioning process, and of the potential difficulties
of measuring the effects of conditioning variables. The way is now clear to begin the
design of experiments to study the effects of variables of conditioning on conditioning
efficiency.
This chapter and the next cover the design stage, including the development of
appropriate techniques for measuring the effectiveness of conditioning, and preliminary
test results. During this stage, a number of practical problems were experienced,
which both deepened understanding of the conditioning mechanisms and required minor
changes in direction. These problems and their solutions have also been included in
these chapters.
In order to undertake the experimental investigation, it was necessary to answer the
following questions:
1) How will conditioning b~ measured?
3) What mineral system will be used?
2) What equipment and experimental technique is required?
4) What variables will be tested?
Once these questions were answered, and the test method was found to be effective, the
work could progress to tests, results and conclusions. This chapter and the next answer
each of the above questions in turn. The rest of this chapter covers the measurement
of conditioning the choice of an appropriate mineral--collector system, and the
73

CHAPTER4
equipment and techniques to be used. Chapter 5 discusses the variables to be tested and
the experimental program devised.
4.2 Adsorption as a Measure of Conditioning
The failure of Stassef).' s work to yield meaningful data demonstrated the need to divorce
flotation effects from conditioning effe<;:ts. By ensuring that conditioning effects are not
masked by the flotation method used, more system independent observations can be
made. The function of (secondary) conditioning is to render particles hydrophobic,
chiefly through adsorption of collector onto the mineral surface. Therefore adsorption
is the obvious measure of conditioning effectiveness.
Adsorption is a surface phenomenon, with collector particles arranging themselves on
the mineral surface in such a way as to minimise the free energy of the system .. For
this reason, molar adsorption of collector will vary with both particle and collector
molecule sizes and their relative geometries. Thus molar uptake of collector onto the
mineral surface (per mass of mineral) will vary according to particle grind for any
given surface distribution. This surface distribution is termed "surface coverage" and
is a measure of the fraction of the mineral surface covered by collector.
From Ralston's work [Blake and Ralston, 1985; Crawford and Ralston, 1988] it can be
seen that "surface coverage" might be a more useful term than molar uptake, since all
particle sizes coated with collector to similar surface coverages have the same surface
properties, such as hydrophobicity. This is more readily understood and more system
independent than molar adsorption.
The concept of surface coverage also aids with understanding the· fundamental
attachment mechanisms involved in adsorption, as discussed in section 4.2.1 below.
The standard unit for surface coverage is a 11 mono-layer" of collector covering the
surface. For any particle the amount of collector required for mono-layer coverage can
be determined, either by using a series of experiments, described below, or through
calculations based on mineral surface area and molecule size and shape.
The use of adsorption, or surface coverage, as a measure of conditioning separates the
study of the effect of conditioning on flotation into two stages:
74

CHAPTER 4
1) The study of the effects of conditioning on collector adsorption
2) · The study of the effect of collector adsorption on flotation.
Thus, once the effect of conditioning on surface coverage is understood, a relationship
might be developed between adsorption and fl.oatability, much as Blake and Ralston
[1985] and Crawford and Ralston [1988] were able to do with the simpler system of
methylated quartz. This.would achieve the results that Stassen attempted to attain. The
duel model would have the additional advantage of being independent of the flotation
model m~ed. This means that the use of different flotation systems, or new
developments in flotation theory, would not render the conditioning model redundant.
To develop the work to the point of predicting fl.oatability requires not only adsorption
test work, but also flotation tests. The results of these flotation tests would be used to
correlate adsorption observations with flotation yields. The important features of any
flotation system to be used have already been mentioned in Chapter 3: the system
should have minimum turbulence and be free of frother effects.
The rest of this section discusses methods for measunng adsorption and relating
adsorption to floatability, through flotation tests.
4.2.1 Surface and Monolayer Coverage
The inherent problem with the concept of surface coverage, is the assumption
that mineral surfaces are homogeneous and that the collector attaches evenly on
these surfaces. Studies have shown that this is not the case, since collector
tends to adsorb around active sites on the mineral surface. This does not
however detract from the usefulness of the concept. It is highly workable,
explaining a number of important phenomena.
Surface coverage is not, in most cases, a directly measurable variable. For this
reason, another variable must be used to infer surface coverage. Adsorption of
collector out of solution is directly proportional to "average" surface coverage;
thus the amount of collector remaining in solution can be used to infer
adsorption and hence surface coverage. While this does not hold for insoluble
collectors, it is true for soluble collectors such as the thiols used in sulphide
flotation, or the amines used in the flotation of quartz.
75
CHAPTER4
As the concentration of collector on the mineral surface increases, so the
packing of the collector molecules changes, as described in section 2.4 and in
Figure 2.4. The observed changes correspond to specific equilibria between
surface (adsorbed) and bulk collector concentrations. It is from this that mono
layer surface coverage can be calculated.
Mono-layer coverage usually corresponds to a region where adsorption remains
constant despite an increase in collector addition, as described in section 2.4.
Since collector removed from solution must be adsorbed, the amount of
collector required to give mono-layer coverage can be measured. This is done
by performing a series of tests at increasing collector dosage and plotting
. residual collector concentration against collector uptake. The adsorption curve
flattens out at mono-layer coverage. Thereafter percent monolayer coverage·
can be calculated for any given"removal of collector from solution, i.e:
% monolaye·r coverage = · 100 x (Collector Uptake) I (AdsorptiOJ\n0 no-Iayer)
where Adsorptio11uiono-tayer = collector uptake required for monolayer
coverage
Thus, percent monolayer coverage can be found by measuring the amount of
collector remaining in solution. The disadvantage of this technique is that
Adsorptio11uiono-Iayer is specific to ,the size distribution and physical properties of
the mineral tested. Also, it is not always possible to measure the uptake
required for mono-layer adsorption, since the measurement technique may not
be sufficiently sensitive to measure the plateau. It is also possible that collector
will adsorb to the walls of the vessel instead of onto the mineral surface. If
either of these are the case, mono-layer coverage must be approximated using
knowledge of mineral and collector geometry.
In summary, a logical measure· of the effect of conditioning is the extent of
adsorption of collector onto the mineral surface. This is found indirectly by
measuring residual collector in solution. In order to have a standard against
which to measure results, mono-layer coverage is measured or calculated and
collector uptake is related to this quantity.
76

CHAPTER 4
4.2.2 Measuring Residual Collector in Solution
To measure residual collector in solution, the measurement technique used must
be able to detect and determine quantitatively very dilute quantities of collector
in the aqueous phase. The chemical complexity of the slurry in flotation does
not lend itself to standard acid-base titration, especially as collectors are
typically poor acids and bases dissolved in solutions of extreme pH (pH 4 or pH
11 in the case of pyrite flotation). Of the remaining techniques, UV
spectrophotometry is the technique most likely to be able to isolate the collector
and give accurate readings for very dilute solutions.
To be measurable using UV spectrophotometry, the collector must have an
allowed UV transition, whose absorbency can be measured and the
concentration equated by the Beer-Lambert law (equation (22)):
where
.A ecd
A = absorbency
e = extinction coefficient
c = concentration [moles/I]
d = path length [cm]
(22)
For a given known concentration of collector, the absorbency is measured and
e.d is calculated. The extinction coefficient, e, is constant for a given
chemical, with each species having its own characteristic wavelength.
Thereafter, the absorbency of a solution, measured at the collector's
characteristic wavelength, need only be found to be able to back calculate the
concentration of collector in solution. From this, residual collector dosage and
hence collector uptake are determined.
The thiol collectors, mentioned in section 2.4, have allowed transitions, as a
result of a sulphur double bond in their structure. Most amine collectors, on
the other hand, do not. To measure an amine using UV spectrophotometry, it
would be necessary to induce absorbency by the addition of a structure with an
· allowed electron transition in the UV range. Benzene type structures within a
chemical have a very strong absorbency peak and are ideal for UV
spectrophotometry.
77

CHAPTER 4
4.2.3 Choice of an Appropriate Mineral-Collector System
The initial choice of a mineral-collector test system for the present investigation,
was made on the basis of the purity of the mineral, simplicity of the adsorption
mechanism and ease of measurement. The system chosen was quartz-amine.
A s.ingle mineral was chosen to eliminate the complications of grade and degree
of liberation. Quartz-amine flotation is also a well studied system.
However, while ideal in many aspects, the quartz-amine system proved
impractical when performing adsorption tests. Thus a pyrite-thiol system was
finally chosen for more detailed investigation described in Chapters 5 and 6.
This is a more complex system on a micro-level than the quartz-amine system,
but proved far simpler to measure. Both systems are discussed below.
4.2.3.1 Quartz-Amine System
Quartz is widely available in pure form and large quantities. It is
naturally hydrophilic, allowing for a wide range of flotation results (0 to
100% ). It has the added advantage of being a well studied mineral,
where the attachment mechanisms are understood.
Typical quartz collectors are the quaternary amines. In order to measure
the collector dosage by UV analysis the chosen amine should include a
benzene-type ring. The available collector fitting both of these
requirements is Hexadecyl Pyridinium Chloride (HPYC). HPYC,
shown in Figure 4.1, has a pyridine-ring, giving a high absorbency in the ·
short UV range. To this is attached a simple saturated sixteen carbon
chain, which is the collector's hydrophobic tail. The molecule is a
cationic collector, with a c1--N+ bond off the pyridine ring resulting in
an HPYC+ and free c1- ion in the aqueous phase.
4.2.3.2 Pyrite-Thiol System
Sulphide flotation is the most common commercial flotation process.
Some sulphides, pyrite among them, are naturally floatable at certain pH
78

non polar tail
ccccccccccccccc
Figure 4.1 - Structure ·of HPYC
CHAPTER 4
' ~ .
' polar head
; ! c-c I I \
c-t-N C)c ' >t \ 1
/
(j c-c Cl
values. The collectors used for the flotation of sulphide minerals are
typically short chain thiol collectors. These collectors are discussed
briefly in section 2.4. The thiols can be measured using UV
spectrophotometry.
Pyrite was chosen as the sulphide mineral to be used, since it was most
readily available in a fairly pure form. So as not to have any chemicals
on the mineral surface before conditioning, a gravity concentrated sample
of pyrite was required. Concentrate taken from under the mill linings of
a commercial gold plant was used for all of this work.
Two different thiol collectors were chosen. The first was a xanthate,
potassium normal butyl xanthate (PNBX), which is very commonly used
in the mining industry. The second thiol collector chosen was sodium n
propy 1 dithiocarbamate (diC3 DTC). These two were chosen because
they display different reaction mechanisms. The dithiocarbamate is
expected to be chemically more predictable in its reaction mechanism, or
"better behaved", than the xanthate collector. The effect of reaction
mechanism on adsorption, and hence conditioning efficiency, will be
studied.
There are a number of advantages to using a pyrite-thiol system, as
opposed to quartz amine systems, but the added complexity creates
several disadvantages. Consequently, it is necessary to understand as
clearly as possible the reaction mechanisms involved, as well as the
conditions required to achieve them. The rest of this section discusses
the advantages and disadvantages of the pyrite-thiol system.
79

CHAPTER 4
(a) Advantages of the pyrite-thiol system
Thiols, being short chain collectors, are unlikely to undergo shear-
. flocculation, which for the quartz-amine system was found to. alter the
apparent particle sizes and hence changed the flotation properties of the
particles. There is no maximum limit to the shear that can be applied to
the pyrite-thiol system when studying the effects of high intensity
conditioning on adsorption and flotation.
Thiols are very poor surfactants. Amines, on the other hand, are both
good collectors and good frothers (surfactants): this is shown in section
4.5.2.3 to result in a dual flotation mechanism. Thus it was not possible
to divorce frother and collector effects in the quartz-amine system.
Thiols do not display any frothing characteristics and hence frother
effects are eliminated.
A large body of previous work is available, both world-wide and at the
University of Cape Town, on the mechanisms of pyrite and thiol
flotation. This will help to minimise the number of tests required to find
"good test parameters".
Since Stassen.' s work also involved pyrite flotation using a thiol collector
(sodium n-propyl xanthate), this work will more closely match that of
Stassen. Thus the effects of time and power on conditioning will be able
to be compared with those achieved by Stassen.
Finally, since pyrite flotation is commonly used in the South African
mining industry, this work may have more immediate relevance to
commercial concerns, than would quartz-amine studies.
(b) Disadvantages of the pyrite-thiol system
Thiol collector attachment to pyrite is very complex and is not completely
understood, despite in-depth studies. The reaction mechanisms vary
according to pH, redox potential, collector chain length, whether or not
oxygen is present and the degree of oxidation of the sulphide. In order
to limit the adsorption process to one mechanism only, it is necessary to
80

CHAPTER4
restrict the pH of the system, as well as maintaining constant mineral
surface conditions.
Pyrite oxidises very readily, resulting in an oxide surface which is very
reactiv.e and readily adsorbs collector. But since large-scale commercial
:flotation plants operate in oxygen limiting conditions, this adsorption is
artificially high. Many sources recommend storage of pyrite under inert
conditions (such as an argon environment) and to use oxygen-free
flotation conditions. It was not possible, in this work, to limit the free
oxygen to any great degree, nor could the surface be protected from
oxidation prior to flotation. Oxidation of the mineral surface was
minimised, though, by placing the mineral sample in an ultra-sound bath
for a constant 10 minutes, immediately before·conditioning. This would
bave the effect of cleaning the surface of the pyrite of its oxide coating
[Harris P.J., 1993].
Chemically untreated pure pyrite is scarce. As mentioned previously, a
gravity concentrate was used, but it was still necessary to limit sample
sizes; typically 4 g for both adsorption and microflotation tests.
(c) Pyrite-thiol reaction mechanisms
Xanthates and dithiocarbamates are complex chemicals which exhibit a
number of states, as shown previously for a xanthate in Figure 2,6. The
states of a dithiocarbamate are shown below in Figure 4.2. As a result
of these states, xanthates and dithiocarbamates are capable of undergoing
numerous different reactions in the presence of sulphide minerals. These
states and their consequent reaction are determined largely by the pH of
the system and the mineral type. Dithiocarbamates, for example are
largely ionised to state Il under strongly acidic conditions, whereas state
IV exists under alkali conditions only. The states ma and IDb are the
intermediate products and their pK,, value typically lies between 2 and 4.
The mineral used in this work is pyrite. The region of best floatability
for this mineral has historically been found to peat around pH 4 and pH
11. Work at UCT has centred around pH 4. For this reason, pH 4 was
81

CHAPTER 4
1\x-c( R,/ I s-
'\ H
~ "YI (III a) !;?' 1\ + s 1\N-c(S i\-« ff\ R'/'/ SH ~I R,/ s-iKT H '· (II) ~\
,, '-Ji ~ (IV)
·\· /' R S \x-c< R,/ SH
(Illb)
Figure 4.2 - Stable States of Dithiocarbamates
chosen as the set condition for the slurry. At pH 4 the reactions most
likely to occur at the mineral surface are:
and
2 DTC- => DTC- + M+ =>
DTC2
DTC-M+
There are numerous other reactions that both collectors can undergo, but
at this pH, the above reactions are most likely. Thus both collectors
either attach to the mineral in an ionised form, or they utilise the mineral
as a reaction site to form dixanthogen or DTC2• Which of these two
reaction products is formed by each collector is strongly determined by
the pH and the sulphide mineral type. At pH 4 in the presence of pyrite,
dixanthogen is the dominant xanthate product. Dixanthogen is insoluble
in water and hence the surface reaction of PNBX = > PNBX2
effectively
precipitates PNBX out of the solution [Crozier, 1993]. Thus, provided
there is pyrite present to provide the reaction site, xanthates will continue
to react until the solution is totally exhausted of any xanthate.
Dithiocarbamates, on the other hand, remain ionised on the pyrite surface
and are hence reversibly attached to the mineral. This results in the
82

CHAPTER 4
formation of an equilibrium between DTC's on the mineral surface and
in solution [Thorn and Ludwig, 1962].
4.3 Relating Adsorption to Flotation: Microflotation
A flotation system which can minimise the problems inherent in the batch flotation
process must be chosen to relate adsorption to floatability. The analysis of Stassen's
work shows two key areas which must be addressed:
1) Conditioning during flotation must be much smaller than in the
conditioning stage. This is so that coryditioning in the flotation stage does
not mask or dampen the effects of conditioning in the conditioning vessel.
2) The influence of the froth phase should be minimised. The froth phase
is subject to different hydrodynamic criteria to those affecting the pulp
phase, and thus can interfere with the flotation outcome differently, from
system to system.
Two possible flotation methods are available for performing the tests:
The first possibility is co.lumn flotation. This has the advantage that there is minimum
agitation in the column. Furthermore, the system can be run on a frothless basis,
eliminating the complex froth phase altogether. The problem here is that a column cell
is a steady-state operation, which requires complex functions to calculate particle
residence time distributions. Thus, with column flotation, conditioning can only be
defined in terms of a time distribution. Column flotation has a second limitation of
requiring very large sample sizes, which may not be feasible when performing many
tests.
The second available option is to use a batch cell that excludes the froth phase from its
processes and provides a minimum of agitation. This can be achieved using a
microflotation cell. Microflotation cells typically do not have a froth phase, but instead
deposit the floated material in specifically designed traps. Agitation can be limited to
the minimum.required for particle suspension at the base of a narrow tube. Minimising
the flotation time would also help to reduce conditioning error. Microflotation cells can
be oJ)erated for as little as one minute to achieve useful flotation yields. The
83
CHAPTER4
microflotation cell has the added advantage of requiring only very small samples. Thus
the features of the microflotation cell make it the flotation test equipment of choice.
4.4. Experimental Equipment and Procedures
This section describes the experimental equipment used and the procedures developed
for the investigation of the effect of conditioning on flotation performance. There were
three aspects to the work: the conditioning experiments themselves, and the
measurement of adsorption and flotation responses. These are described in the sections
below, with reference to both quartz-amine and pyrite-thiol systems.
4.4.1. Conditioning Tests
4.4.1.1. The Conditioning Vessel
The design of the conditioning vessel is of primary importance to this
work. Good mixing within the vessel is the main requirement for
conditioning. Adequate mixing is provided by a good tank design, along
with correct impeller choice. For good mixing the tank should be well
baffled. Too little baffling allows the liquid to swirl around with the
impeller, reducing the effectiveness of the impeller. Furthermore, as
particles swirl, they remain stationary relative to one another, and little
mixing takes place. Too much baffling results in areas of quiescence,
where particles may settle out of suspension, and again little mixing takes
place.
For the impeller to be effective in suspending solids, an axial flow
impeller is necessary. The down current produced by the axial force on
the liquid provides sufficient turbulence to suspend the particles. Radial
flow impellers, such as the traditional Rushton turbine, do not provide a
vertical flow capable of maintaining particles in suspension.
Much of the conditioning work hinges on knowing the power and energy
input into the conditioning vessel. It is therefore important to be able to
determine the power input into the vessel. Fortunately, much work has
been done by Oldshue (1983] showing that, for a given impeller type and
84
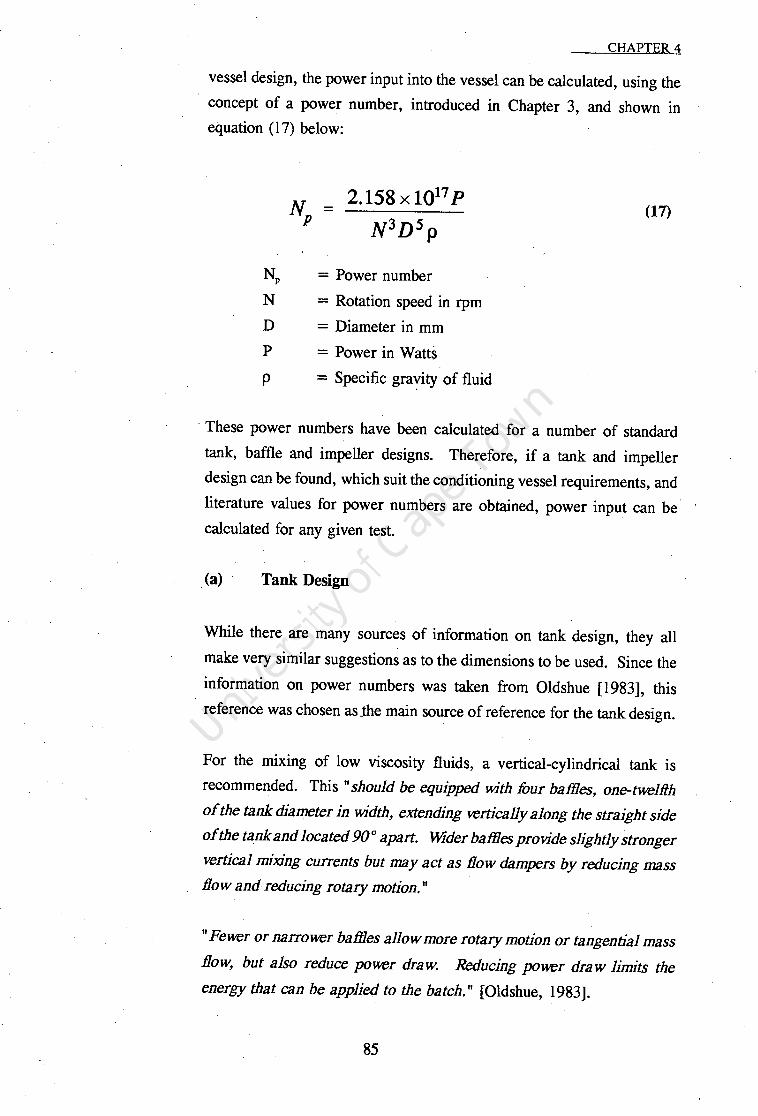
CHAPTER 4
vessel design, the power input into the vessel can be calculated, using the
concept of a power number, introduced in Chapter 3, and shown in
equation (17) below:
N = p 2.158x10¹⁷ p
N3Dsp
NP = Power number
N = Rotation speed in rpm
D = Diameter in mm
P = Power in Watts
p = Specific gra~ity of fluid
(17)
· These power numbers have been calculated for a number of standard
tank, baffle and impeller designs. Therefore, if a tank and impeller
design can be found, which suit the conditioning vessel requirements, and
literature values for power numbers are obtained, power input can be·
calculated for any given test.
. (a) Tank Design
While there are many sources of information on tank design, they all
make very similar suggestions as to the dimensions to be used. Since the
information on power numbers was taken from Oldshue [1983], this
reference was chosen as Jhe main source of reference for the tank design.
For the mixing of low viscosity fluids, a vertical-cylindrical tank is
recommended. This 11 should be equipped with four bames, one-twelfth
of the tank diameter in width, extending vertically along the straight side
of the tank and located 90° apart. "1der bames provide slightly stronger
vertical mixing currents but ma.y act as Dow dampers by reducing ma.ss
Dow and reducing rotary motion. 11
11
Fewer or narrower baffles allow more rotary motion or tangential mass
Dow, but also reduce power draw. Reducing power draw limits the
energy that can be applied to the batch. 11 [Oldshue, 1983].
85

CHAPTER 4
The final design of the conditioning vessel and parameters used for the
test work described in this thesis is given below. The volume was
chosen to minimise resource requirements, while still being sufficiently
large to allow reasonable control over the manipulated variables. It was
necessary to bear in mind that the contents needed to be added to the
microflotation cell, without delays caused by such procedures as sample ·
division to reduce the volume transferred. The final capacity of the cell
was 400 ml.
The cell was made of PVC, and was constructed to the following
dimensions:
height
diameter
no. of baffles
baffle width
baffle height
baffle distance from cell bottom
baffle distance from cell wall
(b) Impeller Design
= 150 mm
= 95 mm
=4
= 9.5 mm
= 10 cm
= Ocm
= 0 cm
As stated above, an axial flow impeller is required to keep the solid
particles in suspension. The impeller chosen was a simple four blade
impeller, with blades pitched at 45 ° from the vertical. This was chosen
because of the ease of design and construction, as well as the simplicity
with which the power consumption for this impeller can be calculated.
Calculation for this design is relatively independent of size, vertical
placement and depth of liquid. The impeller dimensions are shown in
Figure 4.3 below.
The impeller dimensions were:
diameter = 40 mm
blade height = 8 mm
shaft diameter = 5 mm
86

W=l/50 ~ =45 •.
CHAPTER4
Figure 4.3 - Design of Axial Flow Impeller
4.4.1.2 Power Input
The impeller was driven by a 38 W Heidolph variable-speed motor.
The impeller was located 20mm (i.e. 1/2 impeller diameter from the tank
bottom. The impeller speed was measured using an electronic
tachometer, with the speed set correct to an accuracy of 1 rpm.
The standard power number for this impeller in turbulent conditions
(Reynolds Numbers in excess of 100) is NP= 1.27 [Oldshue, 1983]. The
effect of the tank conditions, including height of impeller from base of
tank and ratio of tank to impeller diameter, are calculated from charts
given by Oldshue [1983]. Any deviation from the standard geometry
requires a correction factor. These are determined as follows:
Standard height above tank bottom = 1 impeller diameter
Actual height above tank bottom = 1/2 impeller diameter
Correction factor = 1.12
Standard baffle width = 1/12 tank diameter
Actual baffle width - 1/10 tank diameter
Correction factor = 1.10
87

CHAPTER4
- Therefore the power number for the conditioning vessel is:
= 1.27 x 1.12 x 1.10 = 1.56
Thus, for a given impeller diameter and pulp density, any desired power
input can be calculated and achieved by altering the impeller speed. This
is shown in the rearrangement of equation (17) as equation (22) below:
4.4.1.3
3
N= 2,158x1017 P
N D5 p p
Collector Addition Point
(22)
Dye tracer tests were performed to evaluate the best position for injection
of the collector into the conditioning vessel, to maximise the rate at
which good mixing was achieved. This position was found to be
immediately above the impeller, approximately half the impeller radius
away from the centre shaft. From visual observation of the dye, the
colour was homogeneous within 3 to 5 seconds of injection when the
impeller speed was 500 rpm. This indicated that mixing was rapid and
delay of adsorption caused by poor mixing was negligible.
4.4.1.4 ExperinlentalProcedure
A predetermined procedure was followed strictly during the conditioning
tests to try to ensure maximum reproducibility of the results. This
included the method of mineral preparation, and the order and techniques
used to add and mix the chemical components.
The standard procedure was developed with the subsequent analyses very
much in mind, i.e. the quantification of adsorption and microflotation
·response. Consequently, de-ionised water was used as the base liquid in
each test, to eliminate random error in the adsorption tests which might
88

CHAPTER 4
have resulted from fluctuations in water purity. The solution chemistry
was also closely controlled; for example, different pH values were
maintained for the quartz-amine and pyrite-thiol systems.
The steps listed below comprise the general procedure developed for the
conditioning tests; special conditions pertaining to the quartz-amine or
pyrite-thiol systems are discussed in brief thereafter.
The mineral was prepared, weighed and introduced into the
··conditioning vessel with the appropriate volume of liquid.
The stirrer was switched on (at a predetermined rpm).
The pulp was brought to the correct conditions using acid and
buffer.
Collector was injected into the pulp, near the impeller to
maximise mixing speed.
Timing began at the moment of injection of collector.
(a) Special conditions for quartz-amine system
The quartz used was a high purity quartz (Delmas quartz), wet sieve
sized to +38-53 µ.m, +75-106 µ.m and+ 106-150 µ.m. The dry ore was
added to the, conditioning tank, followed by the .de-ionised water. The
impeller was immediately turned on and the material preconditioned for
one minute without reagents. This allowed time· for the quartz to be
completely wetted by the liquid.
The collector used was laboratory grade hexadecyl pyridinium chloride
(HPYC), a 16 carbon chain alkyl pyridinium salt. Since the collector is
a powder in its natural state it was first diluted to approximately 100
times the final desired concentration, which was then injected into the
slurry after the one minute wetting period. Timing then began.
Amines are highly effective collectors over a large range of pH values
[King, 1982], thus a neutral pH of 7 was used as the standard condition.
The pH did not drift appreciably with the system used, so it was felt
unnecessary to add a buffer to stabilise the pH.
89

CHAPTER4
(b) Special conditions for pyrite-thiol system
As with the quartz-amine system, de-ionised water was used as the base
liquid for all of the tests. A quantity of 400 ml was usually used.
The pyrite mineral used was a (Durban Roodepoort Deep) gravity
concentrate, milled (laboratory scale steel rod mill) and wet sieved to
+ 75-106 µm. The sample, typically 4g, was cleaned of oxides using
ultra-sound followed by a rinse using de-ionised water, and partially dried
using a Buchner funnel to remove free water.
This cleaned pyrite was added to the de-ionised water. Stirring began,
after which a buffer was added to the slurry to reduce it to pH 4. A
buff~r was used in preference to pure H2S04 to maintain the pH at a
constant value, since previous work has shown [Bradshaw, 1992] that pH
drift tended to occur. Changing pH would change the reaction
mechanism, which might affect the results obtained. The buffer used was
0.5 ml of a standard phosphate pH 4 buffer. This was tested to confirm
that it did not react with either the mineral, or the collector.
When the pH was stabilised, collector was injected into the slurry and
timing began. The collectors used were laboratory grade thiols, supplied
by Carbochem's research division. The xanthate used (potassium n-butyl
xanthate) was mixed up from powder immediately before use, while the
dithiocarbamates used, were premixed and samples were measured out
using a micro-syringe. The collectors were injected into the conditioning
vessel at the required point of addition.
4.4.2 Adsorption Response
As discussed in section 4.2. above, adsorption was chosen as an appropriate
measure of conditioning effectiveness. Thus samples were removed from the
. conditioning vessel at various times, and analyzed using UV spectroscopy to
determine the extent of collector adsorption onto the mineral surface.
90

CHAPTER 4
Since the technique relies on the measure of residual collector concentration in
solution to determine collector uptake (see section 4.2.2.), it was important to
ensure that,all the collector in the samples removed from the conditioning vessel
remained in solution. This meant that no mineral should be taken up with the
liquid sample, as this might result in continued adsorption. This required the
use of a filtering system to remove any solids taken up with the samples.
Since adsorption is a continuous process, with time being one of the important
variables of conditioning, it would have been ideal to be able to sample the
conditioning vessel continuously. This would have allowed an adsorption/time
curve to be plotted for each test, as well as minimising the number of test runs
required to determine, the combined effects of other conditioning variables with
respect to time. However, in practice it was not feasible to sample
continuously; samples were taken on a number of occasions during a single test
run.
The procedure that was finally adopted to measure the extent of adsorption that
had taken place in the conditioning vessel was as follows:
Liquid samples were removed from the vessel at given times,
using a pippetteman.
The liquid was immediately forced through millipore filters to
remove any solids and hence "freeze" the level of collector in
solution.
The liquid was measured for UV absorbency at the characteristic
frequencies for which the chosen collector displayed a peak.
The characteristic frequencies employed for each of the collectors used, and the
details of the adsorption work, are given in the section on preliminary work
below.
91

CHAPTER4
4.4.3 Flotation Response
4.4.3.1 Microflotation cell
As discussed in section 4.3 above, microflotation was chosen as the
appropriate means of determining the· flotation response of samples
subjected to different levels of conditioning. The microflotation cell used
in the test work is based on the design of Partridge and Smith [ 1981] and
is shown diagramatically in Figure 4.4 below. A very low density pulp
is used in the microflotation cell. The solid material is suspended using
a magnetic stirrer which rests at the bottom of the cell. Stirrer speed is
minimised to just suspend the mineral, thus reducing additional
conditioning in the cell.
Air bubbles are created by. air introduced through a sintered glass filter
at the base of the cell. Bubble size increases as air rate is increased.
Thus bubble size limits the extent to which air rate can be increased.
The maximum air rate, which still gave acceptably small bubbles, was
chosen and kept constant. · . <:1\,: .
. •\/
The bubbles collect hydrophobic mineral as. they rise through the pulp.
The long path to the top of the cell helps to minimise entrainment of
gangue. · Once. a bubble reaches the top of the cell it is guided by the
centre cone outward, where it breaks on contact with air. The floated
mineral particles then drop into the collection zone at the top of the cell.
The one drawback of this technique is that only one sample can be taken
per run; samples cannot be taken over a number of intervals to produce
a yield vs time plot. To do this, it would be necessary to perform a
number of runs at the same conditioning conditions, but different flotation
times.
The dimensions of the cell are as follows:
column height
column diameter
cone angle
catchment diameter
92
=20cm
= 4.cm
= 45°
= 8cm
. -·--·--·=-=·======== ........ -----------------------

CHAPTER4
'4---+t-- Cone - preventing fallback
Stirrer
liquid level
rotameter
sintered
lass filter
Figure 4.4 - Partidge and· Smith Microflotation Cell
Q
air tap
Air flow rate varied, depending on ~e mineral used and the stirrer type
employed. ' · >·: .
4.4.3.2 ExperhnentalProcedure
"·r' ·'
The ma.J.n problem with microflotation in this application is that
conditioning continu~s after the conditioning stage. The experimental
procedure must therefore minimise this by ensuring rapid transfer of the
slurry from .the conditioning vessel to the microflotation· cell; thereafter
as short a flotation test run as possible should be performed. This should
include as little agitation as possible. The minimum practical duration of
a flotation test run was found to be one minute. If times were reduced
below this, poor reproducibility was achieved. The lack of
reproducibility appears. to· be a result of the need for the system to
stabilise, and because errors in timing were magnified by short durations.
The following procedure was deviSed · for conducting microflotation te~t
work (including the conditioning step):
93

Dry ore was added to the conditioning vessel.
Deionised water was added~
CHAPTER4
The slurry is agitated for 30 seconds to wet the ore.
Collector was injected using a syringe, while agitating .
. The material was conditioned for the required time.
The contents of the conditioning tank were poured into the
microflotation cell and additional water was used to clean all ore
into the cell, as well as topping up the cell.
Air was turned· on.
Agitation began.
As soon as bubbles begin to rise through the glass filter timing
began.
The mineral was floated for 1 minute.
Agitation and aeration were turned off.
All floated mineral was collected, dried· and weighed .
. Tailings were sometimes weighed to check mass balance, if
necessary.
' ' ·. '-.·»
4.S· Preliminary Work .. ·:
·',/
The following sections describe the preliminary tests carried out with the quartz-amine
and pyrite-thiol systems. Adsorption and microflotation results are presented and
discussed. The aim of this work was to establish "good" parameter conditions and to
achieve reproducibility, so· that a study of the effect of variables of conditioning on
flotation could begin.
On the basis of the results obtained~ it was decided to abandon the quartz-amine system
and continue the investigation using the pyrite-thiol system.
4.5.1 Quartz-Amine Adsorption
It was first necessary to.determine the absorbency peak for HPYC. From this
the important wave-length to be measured could be found. The co-efficient of
extinction was also calculated, to. facilitate later calculations of the concentration
of collector in solution from UVabsorbency·data. Once these were ascertained,
94

CHAPTER 4
the suitability of residual amine absorbency testing as a measure of adsorption
of collector onto the mineral could be determined.
The first conditioning tests involved the- study of amine adsorption onto quartz
particles closely sized to -75 + 106 µm. Initial conditioning work was
performed on a test system designed to give approximately 60% flotation of
quartz after .one minute using the Partridge and Smith microflotation vessel.
Microflotation was not only a useful method for evaluating the floatability of the
conditioned mineral: it 3.lso provided a means for determining "good" collector
concentration and mixing energy. Previous work on HPYC and quartz flotation
by Stonestreet [1991] provided a starting point for collector concentration and
conditioning times to be used. The initial conditions, including collector dosage
and conditioning times, were:
HPYC Dosage = 0.4 µg
Conditioning time =·2 minutes
Quartz- mass = 10 g
Liquid volume = 200 ml
Pulp percent solids = 5%
HPYC concentration = 2 µg/l - .
{ .: ... ,.-, Microflotation yield- = 74.4%
.<
- The conditioning procedure outlined in section 4.4.2 was followed, with the
exception that only one sample was taken, at the end of the conditioning period.
To ascertain the UV adsorption .response-. of HPYC, the following tests were
performed, from which important observations were made:
4.5.1.1 Measurement of concentrated solutions of HPYC
High concentrations of HPYC in water give a clear peak at the allowed
transition frequency of- 259 -nm. The coefficient of extinction was
calculated as follows:
e (23)
where A = 0.225
95
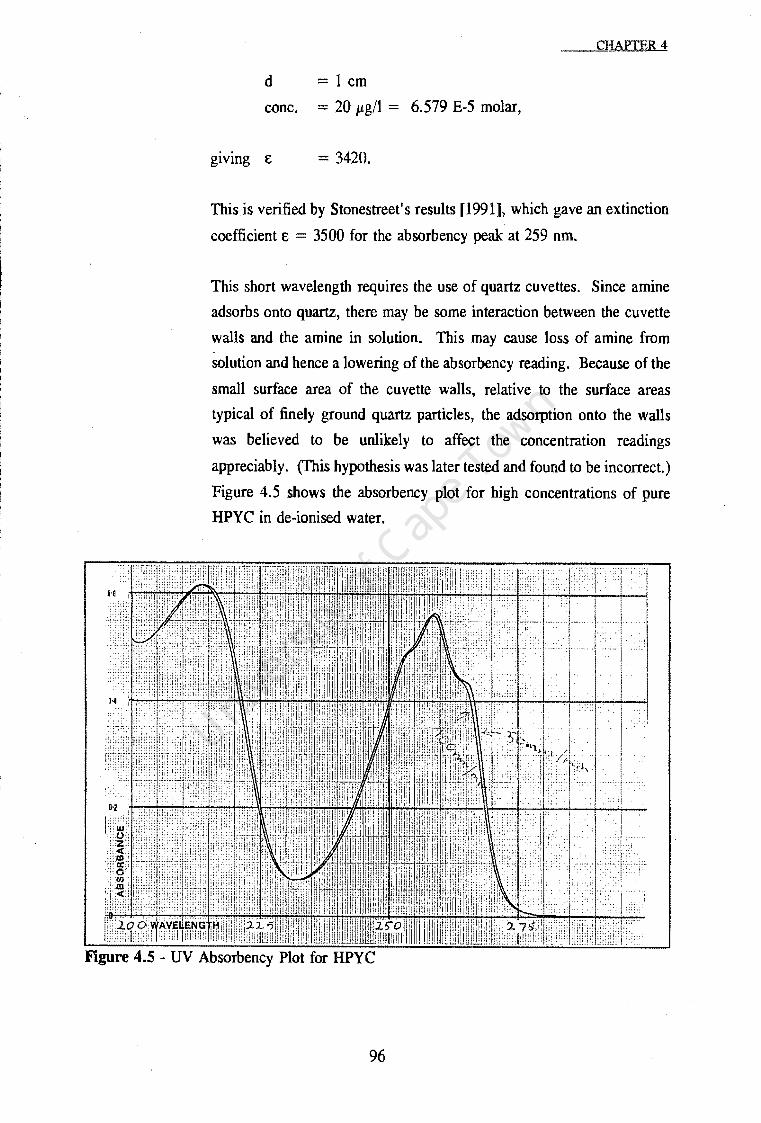
CHAPTER 4
d = 1 cm
cone. = 20 µg/l = 6.579 E-5 molar,
giving e = 3420.
This is verified by Stonestreet's results [1991], which gave an extinction
coefficient £ = 3500 for the absorbency peak at 259 nm.
This short wavelength requires the use of quartz cuvettes. Since amine
adsorbs onto quartz, there may be some interaction between the cuvette
walls and the amine in solution. This may cause loss of amine from
solution and hence a lowering of the absorbency reading. Because of the
small surface area of the cuvette walls, relative to the surface areas
typical of finely ground quartz particles, the adsorption onto the walls
was believed to be unlikely to affect the concentration readings
appreciably. (fhis hypothesis was later tested and found to be incorrect.)
Figure 4.5 shows the absorbency plot for high concentrations of pure
HPYC in de-ionised water.
96

CHAPTER4
4.5.1.2 Measurement of dilute solutions of HPYC
Dilute solutionsofHPYC, corresponding to the concentrations ofHPYC
found in the conditioning vessel at the start of conditioning, gave a noisy
but definite peak. The absorbency values corresponded roughly with
those predicted by the Beer-Lambert law for increased dilution.
For cone = 2 µg/l
predicted A = 0.0225
actual A = 0.026
The readings at this dilution are at the lower limit of this technique's
capacity to measure accurately. Longer cuvettes, typically 5 cm instead
of 1 cm, are required to amplify the absorbency for any more dilute
solutions. The minimum concentration that can be measured with any
reasonable certainty is 1 µg/l for 1 cm cuvettes and 0.2 µg/l for 5 cm
cuvettes.
In dilute solutions it was possible to test the hypothesis that the quartz
cuvette had little effect on the amine in solution. A dilute sample was
measured several times over a number of minutes. It was observed that,
for extremely dilute solutions, the amine peak diminished over time. The
drop in absorbency was very rapid initially, but stabilised quickly at a
lower value than predicted by Beer's law. The loss of amine over time
from dilute solutions was probably due to adsorption onto the side walls
of the quartz cuvettes. While the surface area of the walls is very small,
the dilution would have magnified the effect of any adsorption onto the
walls. This was expected to cause measurement problems when
measuring the small concentrations anticipated at the end .of the
conditioning process.
4.5.1.3 Absorbency of.conditioned slurry with no collector added
A quartz slurry was conditioned without any collector added to determine
the effect of impurities in the quartz on sample solution absorbency
readings. A filtered liquid sample was taken from the quartz slurry after
97
CHAPTER4
conditioning without collector. A UV absorbency measurement of this
sample gave a very high baseline when measured against de-ionised
water: this was probably the result of dissolved impurities such as
silicates in the slurry or ultra fine particles.
The quartz sample had been sized to +75 -106 microns by wet sieving
and the liquid sample was drawn off through filter paper. ,The sample
was well washed and filtered. Hence, the interference was more likely
to be dissolved silicatesthan ultra-fine particles. The silicates could have
dissolved off the extremely high surface area of the fine quartz particles.
The same sample procedure was used for a second test, but this time a
small quantity of.collector was added at the start of conditioning. After
conditioning, the UV absorbency baseline was found to be lower (than it
was when no collector was added), but no amine peaks could be
observed. The drop in baseline indicates that there is a reaction between
HPYC and the solution impurities. The lack of amine peaks after
conditioning may have been the result of two possible effects: either all
of the amine had been adsorbed from solution, or the silicates swamped
the amine peak.
4.5.1.4 Conclusions on amine absorbency spectra
High amine collector doses were found to give strong absorbency peaks.
The low doses of collector required for quartz flotation, however,
approached the lower limit of the UV spectrophotometer's capacity to
measure accurately.
The baseline of the liquid was shifted after quartz had been added. The
probable cause of this was dissolved silicates. This shift in the base line
and the extreme dilution of the collector, especially after adsorption,
made UV studies ,impractical. While the use of a longer measurement
vessel would have increased the amine peak (in accordance with Beer's
law), the silicate noise would also have been amplified.
98
/
CHAPTER4
For adsorption measurement to be feasible it would have been necessary
to find another system or to use another measurement technique for
measuring residual collector dosages. One possibility would have been
to isolate and concentrate the collector using an organic phase to absorb
the collector out of the aqueous.mixture. Radio-tracers could also have
been used, since the sensitivity would be greatly enhanced. The simplest
solution was to choose another system: the pyrite/thiol system, as
described in section 4.2.3.2 above and in section 4.5.3 below.
4.5.2 Quartz-Amine Microflotation
Although the quartz-amine system was eventually discarded, the microflotation
tests yielded some interesting results which are worth discussing. The areas of
interest include effect of collector dosage, degradation of collector, effect of
conditioning time and occurrence of shear-flocculation. However, the first topic
of interest is the. problem of reproducibility.
4.5.2.1 Reproducibility
.... ,..
The small. scale of ·microflotation makes· .reproducibility notoriously
difficultto achieve. This system proved to be no exception. The system
required gradual addition of. regulatory procedures and equipment.
Problem areas included:
i) Fluctuating air flow rate - The system was very sensitive to
fluctuations in air flow, resulting from a varying supply. The
problem was solved by addition of an air flow rotameter, and
adding a large diameter pipe between the air outlet valve and the
rotameter, to absorb fluctuations in supply pressure.
ii) Collector degradation - The collector, a dry power, was
dissolved in water to a ci>ncentration of 0.1 g/1, in order to
simplify the addition to the slurry. This solution was found to
degrade over time, with a half-life of several days. This
problem was addressed by refrigerating the solution. This
completely halted the degradation process.
99

CHAPTER 4
iii) Water quality fluctuations - random error in the
microflotation results was reduced by using de-ionised water
instead of Cape Town tap water in making up the slurry.
Reproducibility was eventually achieved, using quartz particles sized
+76-106 µm, and was then confirmed using particles sized +38-53 µm.
Figure 4.6 shows these results for both particle size ranges (runs B18-
B28). Details of the results of the microflotation runs using quartz can
be found in Appendix D .
0.8
0.2
0
• +76-100
0 +38-53
- M+7S.106
-- Mi+38-53
~ ~ ~ ~ ~ ~ ~ ~ ~ w ~
Run N.Jrrbr
Figure 4.6 - Reproducibility Data Showing % Yield for Each Sample
For quartz particles sized + 76-106 µm the standard deviation was:
0.021 = 2.1 % deviation on total mass
For quartz particles sized + 38-53 µm the standard deviation was:
0.005 = 0.5% deviation on total mass
4.5.2.2 Effect of collector dosage
Once reproducibility had been confirmed in the microflotation tests, a
number of sets of experiments were carried out. The effect of collector
dosage (into the conditioning vessel) was seen to be by far the most
important variable studied. Flotation yield was directly related to
100

CHAPTER4
collector dosage: there was a one-to-one correspondence between dosage
and yield, with flotation improving linearly with increased dosage, as
shown in Figure 4.7 (runs El4, El6, Ell and El). This can be
compared to the linear region of Ralston's plot for surface coverage
versus yield (Figure 2.25). It is clear therefore that for most runs,
coverage was less than mono-layer. This is verified using calculations
for surface area taken from collector geometry:
0
particle surface area = 2.49 x 10⁻² m2/g
maximum collector attachment area = 100 x 10-20
dosage required for mono-layer coverage = 1.4 ml/run
0.5 1
Ollle::tor [):sage (rr1/run)
1.5
Figure 4. 7 - Microflotation Yield vs Collector Dosage
4.5.2.3 Effect of conditioning time
No measurable effect was seen with changing conditioning time
(Figure 4.8 - runs E20, Ell and El9). This is contrary to what was
expected. It is stated in the literature [Ewers, 1984; Laskowski, 1993]
that amine molecules diffuse and react very rapidly and, with the small
system used, it is possible that stirring within the microflotation cell
during flotation was sufficient to provide complete conditioning; but other_
101

CHAPTER 4
observations indicate that another mechanism may have been responsible .
for this effect.
0.8 >--
0.2 >--
1te d:lla p;ir1s a-e a\Elcgsd fra:ti<nll reco.eries ct Q 2 cn::t 3'.l rrin.tes ci cxrdticrirg
0'--~~~~~~~~~~~~~~~1~~~~~~~~
0 10 20 30
Cbrdticning Tirre
Figure 4.8 - Microflotation Yield vs Conditioning Time
It was noted that there were observable differences in the froth obtained
with a well conditioned pulp and a poorly conditioned one. Poorly
conditioned slurry gave a more stable froth, with smaller bubbles and a
deeper froth. The reason for these differences is believed to be the same
as the reason for there being no change in the flotation results with
increasing conditioning time. The mechanism involved is postulated to
be as follows: Amines are both good collectors and surfactants
(frothers). Thus, collector still in solution during the microflotation step
may attach to rising bubbles. On collision with mineral particles, they
may then attach to the particle and serve to bond the two together. This
is just as would have occurred if collector were on the mineral surface
(instead of on the bubble surface). Thus different mechanisms result in
similar collecting efficiencies. However, since collector (surfactant)
attachment to bubbles results in increased froth stability, the froth appears
visibly different.
The dual function of amines has been observed by other researchers
[Wark and Sutherland, 1955; Ewers, 1984]. Also, this phenomenon of I
102

CHAPTER 4
amine on bubbles increasing flotation yield above the predicted value is
described by [Digre, Sandvik, 1968]. Thus this dual mechanism both
explains the observations made and is scientifically supported by previous
research. It is very likely that this is why no observable improvements
in flotation took place as a result of longer conditioning. This work
shows that it is important to ensure that any other collector chosen for
conditioning test work is not a surfa.ctant.
4.5.2.4 Shear-flocculation
The effect of power input on the flotation of quartz was found to be
somewhat more dramatic. Since HPYC is a long chain collector, shear
flocculation can play a major role under conditions of high intensity
agitation. It was found that at impeller speeds of 1000 rpm and above,
shear flocculation was very noticeable in the conditioning vessel (runs
C4, CS and C6). While this work does not aim to study shear
flocculation (and hence was not studied in depth), the following
observations were noted:
A critical impeller speed was required, below which no duration
of agitation could induce shear-flocculation.
Above the critical speed, longer conditioning times resulted in
the formation of larger flocculated particles.
Greater impeller speeds resulted in more rapid formation of
flocculated particles.
Flocculated particles were sufficiently stable to remain intact
during flotation and filtering, but broke down on drying.
Flotation appeared to improve with flocculation. This is
believed to be a function of floatability of particle sizes and
should hold especially true for very fine particles, which (un
flocculated) are poorly floating.
4.5.3 Pyrite-Thiol Microflotation
The primary aim of the pyrite microflotation tests was to find the correct
collector dosage range for "good" flotation. The best collector dosage to use
103

CHAPTER 4
as a mid-point value would be the smallest dosage that provided maximum
flotation yield at "infinite" conditioning. This because the same dosage at lower
conditioning energies would provide a spectrum of yields, according to the
extent of adsorption on the mineral surface. Larger doses would be expected
to reach maximum flotation at shorter conditioning times, while smaller doses
would never achieve maximum flotation. This is the area that is of interest
commercially, where there is a trade-off between reagent costs and equipment
or energy costs. Only diC3 DTC was used in the microflotation tests since
previous work has shown that equivalent molar doses of PNBX result in
comparible flotation responses to those of diC3 DTC, especially when
comparing the doses required to achieve maximum flotation [Bradshaw, 1994].
Since pyrite is naturally floating at pH 4, it was important to find the extent of
natural floatability of the pyrite sample (using no collector). A pyrite sample
was conditioned exactly as the other samples were, in order to subject the
mineral surface. to the same shear and oxidation forces, but with no collector
added (run no. F2 in Appendix E). It was found that 25 minutes of
conditioning at 500 rpm corresponded to "infinite" conditioning, beyond which
no improvement in floatability was. achieved at any collector dosage. The
following conditions were used:
impeller speed
buffer addition
liquid volume
pyrite mass
collector dosage
conditioning time
= 500 rpm
= 0.5 ml
= 400 ml
= 4 g
=0 = 25 min
The pyrite yield for this run = 46. 8 %
Thus the minimum expected yield for any run was 46. 8 % . It was expected that
collector adsorption would increase this to a maximum near 100%. Stassen's
[1990] maximum yield was 98.6%.
Reproducibility tests for the system using no collector gave the following results
(runs F2, F3 and F7):
104
Number of tests
Std deviation
=3
= 0.020 = 2%
CHAPTER 4
Thus the microflotation technique was felt to produce reproducible results.
The initial assumption made was that flotation would be optimum at doses
which would provide mono-layer coverage. Thus the amount of collector
required for mono-layer coverage was calculated, using particle surface area
and collector attachment area approximations. Pyrite is a cubic crystalline
structure, but surface irregularities and grinding may change the surface area.
Thus a number of calculations were used to approximate surface area. The
pyrite was sized to +53-75 µ.m using wet sieving. It is appropriate then to
assume a geometric mean size for the particles, which is 63 µm.
Spherical Particle Surface Area = 0.01835 m2/g
Minimum Cubic Particle Surface Area = 0.01835 m2/g
Maximum Cubic Particle Surface Area = 0.02595 m2/g
The attachment area of Sodium dipropyl dithiocarbamate ""' 37 x 10-20 m2
[Bhaskar and Forsting, 1991]. Also, the collector concentrate used contains an
active ingredient of 35%, giving a concentration of 6.94 x 10⁻⁴ mole/ml
solution. Thus, assuming total coverage, the dosage of collector required to
exactly cover the mineral surface is:
Spherical particles
Minimum cubic
Maximum cubic
= 8.235 x 10-s moles/g = 0.118 µ.Ilg
= 8.235 x 10-s moles/g = 0.118 µJig
= 11.65x10⁻⁸ moles/g = 0.167 µIlg
In reality the collector adsorbs in patches of active sites and mono-layer
coverage would be substantially below the above value, but it does provide a
starting point for microflotation test work. Figure 4.9 (showing runs F2, F6,
F4, F5 and F9) shows the flotation response for a number of collector doses of
the magnitude of mono-layer coverage (results are expressed as µ.Ilg of pyrite
·rather than as reported in Appendix E as µ.I/run of 4g of pyrite).
These results show no improvement in flotation yield over the results achieved
with no collector. This result was unexpected. It indicated that the dosage was
105

CHAPTER 4
0 0.2 0.4 0.6 0.8 1 1.2 1.4 1.6 1.8
Colledcr D.:S'g3 (n1/run)
Figure 4.9 - Pyrite Flotation Yield vs diC3 DTC Collector Dosage (near
mono-layer)
far too low. Thus previous work using standard flotation was studied to
determine a more appropriate collector dosage. Previous work by the author
[Austin and Henwood, 1991] included a factorial design to evaluate the
optimum collector and frother doses for a pyrite-sodium dipropyl
dithiocarbamate system. The mineral system used was St Helena slimes
concentrate and contained 3.5% pyrite. Figure 4.10 below shows that flotation
went through an optimum at 80 g/ton of collector. If it is assumed that the
collector attached only onto the pyrite, optimum collector dosage is 3.6 µl/g
pyrite. This is 20-30 times more than that calculated through mono-layer
coverage estimations.
Microflotation tests performed at this concentration gave 83.2% yield. This
dosage was still expected to be too high so microflotation yields were
determined using fractions of this dosage, as well as at double this dosage. The
results are shown in Figure 4.11 below (runs F2, F6, F4, F5, F9, F8 and FlO).
These tests confirm that the results of Austin and Henwood [1991] are correct
for pure pyrite, given the assumption that adsorption takes place on the pyrite
surface only. The yield improves linearly from 46.8% at no collector addition
to 83.2% at 3.6 µVg collector addition. Above this dosage, the yield flattens off
and doubling the collector dosage results in almost no improvement in flotation
106

Figure 4.10 -
CHAPTER 4
Flotation Response for Collector and Frother (from
Austin and Henwood, 1991)
yield, which only increases to 84.5% at 7.2 µl/g of collector addition.
This dosage is many times more than that required ·for mono-layer coverage.
Thus, either equilibrium between collector in solution and on the mineral
surface is very strongly shifted to the solution phase, or the collector is reacting
on the mineral surface or in solution. Exactly what is happening can be
determined by analysis of the adsorption curves. This is done in section 4.5.4,
. below.
An important observation is that for· both the quartz-amine system and the
pyrite-thiol system, adsorption is linear over a large range. In the case of
quartz, this was in the region below mono-layer coverage, while for pyrite, this
occurs well above mono-layer coverage. Since all other variables have been
kept constant, a definite relationship can be developed between P0 (probability
of attachment) and collector dosage. Assuming that adsorption is proportional
to dosage (since an equilibrium is reached) this implies a linear relationship
between surface coverage and flotation· recovery. This appears to be contrary
to previous work, such as Crawford and Ralston [1988], where surface
107'
'

0 0.5 ~ 2 ~ 3 e 4 U 5 ~ B U
O:lled.cr O:sage (ntlg CJJa~
CHAPTER4
7.5
Figure 4.11 - Collector Dosage vs Flotation Yield (high doses)
coverage produced a definite quadratic relationship. Stassen 1 s model assumed
direct proportionality between collector ·dosage and recovery, whereas this
shows proportionality, but not direct. This result may be the basis for further
investigation, in the future.
Another aspect to note is the initial dip in flotation recovery. While a more in
depth study of this is beyond the scope of this thesis, the author postulates that
diC3 DTC may display some depressant properties at very small doses. Pyrite
at this pH (pH4) is naturally very floatable and small doses of diC3 may
negatively affect the surface properties. If diC3 DTC were, for example, to
increase the forward energy barrier (of attachment between particles and
bubbles), while at the same time increasing hydrophobicity (see Chapter 2 for
a discussions on the thermodynamic and kinetic factors of conditioning) these
two factors of flotation would have opposing effects on the probability of any
particle being floated. The change in floatability would be determined by which
factor dominates. It is entirely feasible that the forward energy barrier initially
reduces the probability of flotation ,more than the opposing factor of increased
hydrophobicity can increase the probability of flotation. This would lead to the
results observed, where flotation initially drops slightly with increasing collector
dosage, before increasing toward the optimum dosage (and maximum flotation).
108

CHAPTER4
Since the optimum collector dosage, as defined above, has now been
determined, all further test work was conducted around this collector dosage of
3.6 µllg. This translates to 2.5 micromoles/g. The equivalent dosage of PNBX
(in pure powder form, molar mass 188 g) is 470 µg of PNBX /g of pyrite.
4.5.4 Pyrite-Thiol Adsorption
Preliminary UV absorbency tests were carried out at known collector dosage
to determine the optimum wave-length at which to measure the residual
collector concentrations for each collector. The results showed peaks for diC3
at 280 nm and for PNBX at 300 nm respectively. The absorbency measured
for this known collector dosage allowed the calculation of the extinction co
efficients. Table 4 gives the results for these tests.
Table 4: Thiol Collector Absorbency Values
Collector Type Collector Cone. Absorbency Peak Absorbency Extinction co-eff.
di-C3 25 µmoles/I 280 nm 0.293 11 720
PNBX 25 jLmoles/l 300 nm 0.392 15 680
Since thiols are notoriously unstable in aqueous solutions, tests were performed
to determine the half-life of these two collectors used at pH 4. It was important
that the collectors should be stable under the test operating conditions, for
adsorption of collector out of solution not to be confused with degradation of
the collector. The half-life for xanthate is 90 minutes, while the diC3 is more
stable under these conditions, with a half-life of 950 minutes [Bradshaw, 1994 ].
Since most of the tests took place within 8 minutes of achieving correct pH,
degradation of the collector over the conditioning test period was not considered
to be a factor in the test work.
It was als9 necessary to determine the expected absorbency of dissolved solids
from pyrite in solution, as well as buffer in solution. This was so as to correct
for these values when measuring conditioned solution absorbencies to find
residual collector concentrations. The quartz solutions resulted in an extremely
high base-line, which swamped any amine values expected at the desired
concentrations. Table 5 below shows that this was not the case for pyrite, with
109

CHAPTER 4
an absorbency of 0.062 for a solution sample taken from a well mixed pyrite
water system., But both pyrite and the buffer did show some absorbency at the
peak for collectors. These absorbency values are given in Table 5 below, for
"conditioned" pyrite in the absence of collector or buffer, buffer alone (at the
concentration to be used - namely 0.5 ml I 400 ml), and pyrite "conditioned"
with buffer only.
Table 5: Absorbency of Pyrite and Buffer
Pyrite Only Buffer Only Pyrite and Buffer
Absorbency at 280nm 0.062 0.078 0.086
Absorbency at 300nm 0.004 0.06 0.03
The table shows that for UV measurements in the region of 300 nm, the
readings are below the machines level of experimental error and will be
ignored. At 280 nm on the other hand, the values are significant and should be
taken into account. What is significant is that the buffer and the pyrite do not
show an additive absorbency effect, as might be expected of two chemicals
which are completely unaffected by one another. The reduced absorbency
observed is believed to be the result of redox reactions within the solution. The
buffer ionic strength may reduce pyrite dissolution and the pyrite dissolution
may shift the buffer to an ionic state which is less UV active. Evidence of
these effects is that pH and redox shifts naturally occur when pyrite is mixed
with water, implying that the ionic state of the water is changing. Much work
has been done on these phenomena by Bradshaw [1994]. With the buffer
present, pH shift is still experienced, but to a much lesser extent.
So, while accurate estimation of diC3 DTC adsorption has been made somewhat
more difficult, adsorption of PNBX can be measured directly from the drop in
absorbency readings. This is because, unlike diC3 DTC, PNBX is not affected
by interference at its characteristic wavelength of 300 nm. The measurement
problems of diC3 DTC were resolved by analysing absorbency at its
characteristic wavelength of 280 nm with and without buffer in:
Final adsorption at STD conditions without buffer = 0.03
Final adsorption at STD conditions with buffer = 0.08
110

CHAPTER 4
The first value shows that, since final absorbency is lower after adsorption,
diC3 DTC suppresses pyrite dissolution. This would be expected, since the
mineral surface is covered by collector, obstructing dissolution. . Reduced
dissolution results in reduced redox impact on the buffer. Thus increased
absorbency would be expected, in the case of collector adsorption in the
presence of buffer, over a pyrite-buffer mixture. This indeed the case. It is
conceivable that some collector remains in solution, but previous work shows
that a DTC-metal complex is very stable and has a low ionisation constant, as
low as 10-14 in the case of nickel complexes [Thorn and Ludwig, 1962]. Thus
for the purposes of this work it can be assumed that diC3 DTC adsorbs· to
completion. Hence the residual UV absorbency will be taken to be the result
of buffer and pyrite in solution.
Likewise, a very small interaction between collector and buffer was measured
at 280 nm. At standard conditions this resulted in approximately 0.008 less
absorbency than calculated through addition of absorbencies. Again this is
ascribed to a shift in the ionic state of the buffer. This value is very small, but
can easily be accounted for in collector adsorption calculations.
It is important to know that none of the reagents reacts to form new stable
products, excepting the collector attached to the pyrite. The phosphate buffer
has been used by many researchers in the past [Harris, 1993] and no new
product peaks could be found on the UV curve to suggest [Bradshaw, 1994] that
any new products are formed.
Knowing that both the initial readings and the final readings of absorbency are
affected- by pyrite and buffer, it was important to use an effective interpolation
scheme to achieve meaningful results. It has been shown by Bradshaw [1994]
that the adsorption of collector onto the pyrite surface is well represented by a
linear interpolation. It would be unwise to attempt any other form of
interpolation, without sound theoretical reasons. The effectiveness of linear
interpolation was confirmed by the high linearity of the first order reaction rate
fits to the adsorption reaction. This is shown in Chapter 6. While the use of
linear interpolation may be challenged, it is important to note that this work is
a comparative analysis and consistency of measurement is more important than
absolute accuracy.
111

CHAPTER4
Preliminary tests on conditioning of the ore were performed at standard
conditions, and were repeated to determine the reproducibility of the
conditioning and measurement processes. Figure 4.12 and Figure 4.13 show
the plots of collector uptake over time, for diC3 DTC (runs ID, 9D and 12D)
and for PNBX (runs IP, 2P and 3P) respectively, repeated several time for each
collector. The shape of the curves will be analyzed in detail in section 6.3.
What can be understood from them now, is that the conditioning and
measurement procedures are highly reproducible. The standard deviation for
diC3 DTC was 0.050 micromoles collector uptake and that for PNBX was
0.051 micromoles. The absorbency error expected of the UV
spectrophotometer is in the region of 6.005, which translates to 0.055
micromoles DiC3 DTC and 0.041 micromoles PNBX collector uptake. This
is of the same magnitude as the standard deviation for the two standard
deviation tests. Therefore, the error can be explained by the measurement error
of the UV spectrophotometer. The results achieved are reproducible.
"6! ]l 1.5 1--#F----
! ~ t3 11-M----
"' 'O
i -a RI.In 1
0.5------------------+Rm2
.. Rl.ln3
o _____ ___._ ____ _._ ____ ,__ ___ _.__ ___ ____.
0 5
Figure 4.12 -
10 15 20 25
nrra (ninutes)
Reproducibility Tests Showing Collector Uptake vs
Time for DiC3 DTC
112

0
Figure 4.13 -
4.6 Conclusion
5 10 15
Tirre (nin..tes) 20
CHAPTER4
-a· Rn1
+R.n2
+Rn3
25
Reproducibility Tests Showing Collector Uptake vs
Time for PNBX
This chapter set about answering three questions. The first was: how will conditioning
be measured? The measuring system proposed was two tier. First adsorption studies
would be used to directly measure the effect of conditioning on the mineral-collector
system. This would be supplemented by the use of microflotation to relate adsorption
results to flotation response and hence provide a relationship between conditioning and
flotation response. Adsorption studies provide the advantage of directly measuring
conditioning effectiveness rather than attempting to infer conditioning effects through
measuring the more complex process of :flotation. While, micro:flotation was chosen for
measuring :flotation response as it eliminated the complicating froth phase, which can
mask the conditioning effects. Adsorption was calculated by measuring the loss of
collector from solution, using UV spectroscopy.
The second question was: what mineral system will be used? A quartz-amine mineral
collector system was initially chosen, for its simplicity. This was eventually discarded
because of difficulties with measuring the very small doses of collector used. A pyrite
thiol system was finally chosen as the system to be used in the conditioning test work.
While this is a more complex system, the effects of conditioning could be readily
113

CHAPTER 4
measured. The results of conditioning pyrite with both, diC3 DTC and PNBX as the
collector were found to be reproducible. ·
The third question answered was: what equipment and experimental technique is
required? A cylindrical baffled vessel was designed for the conditioning stage. A pitch
blade impeller driven by a heidolph variable speed motor was used to agitate the slurry.
The iqipeller design was chosen to allow the power input into the conditioned slurry to
be calculated using equation (17) derived by Oldshue [1983]. The microflotation cell
used was based on a design by Partidge and Smith [1981]. The experimental
procedures for adsorption studies and microflotation studies were standardised to
minimise experimental error. The procedures are as follows:
General Conditioning Procedure
The mineral was prepared, weighed and introduced into the
conditioning vessel with the appropriate volume of liquid.
The stirrer was switched on (at a predetermined rpm).
The pulp was brought to the correct conditions using acid and
buffer.
Collector was injected into the pulp, near the impeller to
maximise mixing speed.
- · Timing began at the moment of injection of collector.
Adsorption Study Procedure
Liquid samples were removed from the conditioning vessel at
given times, using a pippetteman.
The liquid was immediately forced through millipore filters to
remove any solids and hence "freeze" the level of collector in
solution.
The liquid was measured for UV absorbency at the characteristic
frequencies for which the chosen collector displayed a peak.
114

CHAPTER 4
Microflotation Procedure
The contents of the conditioning tank were poured into the
microflotation cell and additional water was used to clean all ore
into the cell, as well as topping up the cell.
Air was turned on.
Agitation began.
As soon as bubbles begin to rise through the glass filter timing
began.
The mineral was floated for 1 minute.
Agitation and aeration were turned off.
All floated mineral was collected, dried and weighed.
Tailings were sometimes weighed to check mass balance, if
necessary ..
The next chapter discusses the variables of conditioning to be studied and experimental
program to be followed.
115
CHAPTER 5 - DEFINING THE EXPERIMENTAL
PROGRAM
5.1 Introduction
Chapter 4 described the investigation which resulted in the choice of the (pyrite-thiol)
mineral-collector system to be used in the study of the effect of the variables of
conditioning on conditioning effectiveness. The chapter also described the experimental
procedures to be used in the conditioning, adsorption and microflotation tests. This
chapter covers the choice of variables to be studied in the experimental program, as
well as developing an efficient method of testing the effects of all these variables.
Some of the variables included in the program were chosen in order to address
questions left unanswered after the analysis of Stassen's work (Chapter 3). The
remainder of the tests revolve around the concept of conditioning being a heterogeneous
stirred tank reaction, with adsorption as the important reaction. It was hoped that a
better understanding of this could lead to better efficiencies of conditioning.
The choice of variables to be studied is discussed in section 5.2 below. The
·development of the experimental program is presented in section 5.3.
5.2 Variables to be Studied
To date most studies of conditioning have centred on the energy input into the
conditioning process. This has been studied both as a function of time and of power:
Stassen's work attempted to link these variables and related conditioning effectiveness
to energy input. Critical analysis of his work (section 3.8) showed that power and time
appeared to affect flotation performance independently of each other and not merely as
two components of the same input variable, namely energy. Thus, the first aspect to
be studied in this investigation was the relationship between time, power and energy ·
input into the systerp, to allow Stassen 1 s claim to be either confirmed or refuted.
Industrial experience shows that collector type plays an important role in the flotation
of minerals. The choice of collector is often ad hoc and little is known about why
116
CHAPTER 5
different classes of collector, displaying similar properties, vary in their effectiveness
from one complex ore. to another. It is expected that the mechanism of attachment
plays some role in this variability: this would affect adsorption rates and equilibrium
concentrations. Thus, another key aspect of the study was the effect of collector type
on its rate of adsorption onto the pyrite surface. From this, reaction mechanisms of
adsorption, for each collector, might be deduced. Each of the other variables was
studied in terms of its effect when using different collectors.
Owing to the experimental procedure, time was always a tested variable of the system.
The taking of regular samples from the same test, over time, greatly reduces the
number of experiments required for the study of any combination of variables which
includes time. A logarithmical increasing time interval was chosen to maximise the
information· gained (see section 5.3.2). Power input, on the other hand, could be
altered through changing the impeller speed, or the impeller type or size, or by
changing the volume of liquid to be conditioned. For this work, impeller speed was
chosen as the means of varying power input. Impeller speed strongly affects the shear
forces and eddies within the slurry. However, since the conditioning of pyrite [Bhaskar
and Forsting, 1991] is thought to be diffusion controlling, varying the power input by
changing the impeller speed was expected to influence adsorption rate different! y than
maintaining the same shear whil~ changing the volume to which it is applied. For this
reason, a few tests were run at a constant impeller speed, using different slurry sample
volumes. It was hoped that this would indicate whether future work should be
performed to investigate more efficient methods of adding power to the slurry. Thus
type of power input was also covered by the tests.
The concentration of collector is a vitally important consideration in the flotation of
minerals. Too much collector is wasted money, while too little collector results in poor
recoveries. The concentration of collector in solution affects adsorption rate in both
diffusion and reaction controlling systems; sufficient adsorption for flotation can be
achieved more rapidly at high collector doses. This can lead to a trade-off between the
cost of additional collector incurred by overdosing and the capital and energy costs
incurred by the use of too little collector. A clear understanding of the effect of
collector dosage on adsorption rate will facilitate design decisions such as this. Thus
dosage of collector was a further variable to be included in the study.
If the adsorption of collector onto pyrite were diffusion controlling, the bulk collector
concentration would affect the diffusion gradient, and hence the rate of diffusion. This
117

CHAPTER 5
implies that any change that increased bulk concentration of collector would improve
adsorption rate, e.g. reduction in the water content of the slurry in the conditioning
stage of flotation. The reduction in water content would additionally reduce the
dissipation of power into water, which is wasted energy. Thus the effect of reducing
water content during conditioning was studied, to determine the possible advantages of
high pulp density conditioning. Extremely high solids content has problems of its own,
including increased viscosity. It was appreciated that this may cause process problems
when trying to increase pulp density in some commercial systems, but the tests in this
work were still performed at very low pulp densities .
. Finally, as the test work progressed it was expected that some of the results obtained
would require further investigation, or might uncover some unexpected new area of
interest. For this reason, the test work was left slightly open ended to allow expansion
into new areas if necessary.
Thus the experimental programme was planned to include the following topics:
1) Effect of collector type
2) Reaction Mechanisms of adsorption
3) Time effects of conditioning
4) Power effects of conditioning
5) Effect of type of power input into conditioning
6) Relationship between time, power and energy input
7) Effect of collector concentration on adsorption rates
8) Influence of water content on conditioning effectiveness
9) Other observed effects
With the variables and topics of study clearly defined, the experimental program of
investigation could be developed.
118

CHAPTER 5
5.3. Experiments Chosen
For simple multi-variate analysis of a system, a factorial design is often the most
effective and complete way of determining the effects of variables and their
interactions. This work, however, was aimed at analysing separate aspects of J
conditioning. A number of these, such as collector type, are non-continuous variables,
while others were included to provide only a qualitative assessment of the effect of the
altered variable. Also, factorial design often becomes cumbersome, when more than
4 variables are to be tested. For these reasons a factorial design for the whole test
program was not considered; the areas of interest were studied one at a time. Having
said this, some variables were studied in a matrix design, to maximise the information
gained by studying them together. The tests designed for the areas to be studied are
discussed individually below:
5.3.1. Effect of Collector Type
Collector type was studied because it was felt that the adsorption mechanism of
different collectors affects their rate and extent of adsorption. Thus adsorption
time plots generated for each of the collectors, would be expected to reveal
information on their mechanisms and adsorption characteristics. Two collector
types were chosen for the study (see section 4.2.3.2), namely diC3 DTC and
PNBX. A third collector, cyclo-hexyl dithiocarbamate (oC6 DTC), was added
for comparison purposes (for this part of the work only - owing to the shortage
of mineral). To compare the collectors, each was tested at the same dosage,
with all other conditions held constant.
How each collector mechanism influences the relative effects of other variables
was also tested, by repeating all of the following tests using both diC3 DTC and
PNBX collectors.
5.3.2. Time and Power Effects of Conditioning
Previous work [Stassen, 1991; Bulatovic and Salter, 1989] has shown that 5-10
kWh/ton ore provides the optimum energy input for flotation. While the
present system varies greatly from those described in the literature, the
119

CHAPTERS
consistency of this as the optimum for the other systems suggested that 5-10
kWh/ton would be a good mid-point for this work. The only change is that the
present experiments were carried out at very low pulp density and thus power
is be reported in terms of kWh/ton slurry, with the desired mid-point at 10
kWh/ton.
One further constraint was the minimum stirrer speed ·for adequate suspension
of solids in the slurry. Pyrite has a high density and thus good mixing of pyrite
throughout the conditioning vessel could not be achieved without very vigorous
agitation. But since suspension of the solids off the vessel floor was all that
was required, it was found that a minimum impeller speed of approximately 390
rpm could be used.
With these starting values, an experimental matrix was developed to maximise
the information that would be obtained regarding the relative importance bf
power and time, and their implications on energy input calculations. This was
best achieved by using power and time values which give equivalent energy
input. Thus, for any given level of energy input, a number of permutations of
power and time were sele.cted, allowing easy comparison of their relative
importance. The matrix shown in Figure 5.1 below illustrates the idea, which
also minimised the number of tests that needed to be performed. By choosing
exponentially separated test points, it was possible to generate iso-energy lines
which intersect the test points, as in the Figure. The Figure also shows that a
4x4 level matrix will gives 7 energy levels, of which 5 will have more than one
combination of power and time.
This system may be difficult to understand without comparing values along an
iso energy line. Consider the energy line beginning at 1 time unit and n2 power
units. This corresponds to energy = 1 x n2 = n2• Moving down the energy
line to the next point, gives energy = n x n = n2• Likewise the final energy
. value is also n2• This is true for all of the energy lines. This system provides
two useful features, the first of which has been demonstrated to be iso-energy
levels, while the second is to provide an exponential set of points for variables
which are kiiown to provide exponentially diminishing returns.
The magnitude of the coefficient n for the exponent determined the range of
energy over which the extent of conditioning was tested. Stassen chose an
120
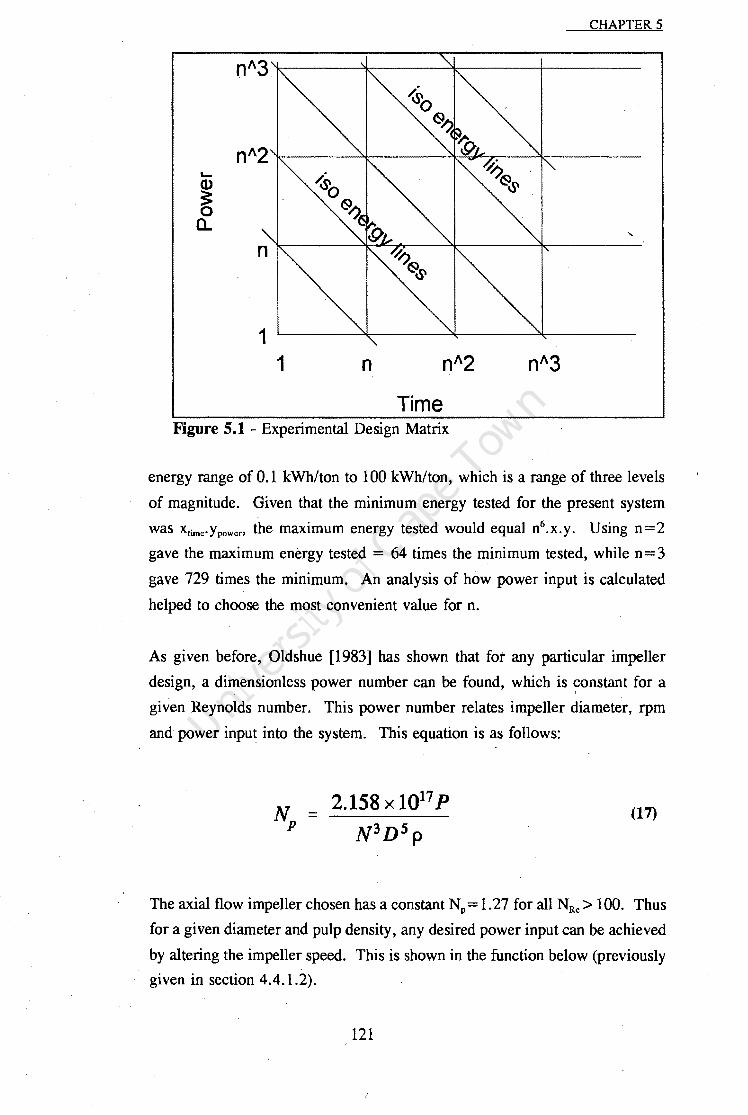
CHAPTER 5
1 n
Time Figure 5.1 - Experimental Design Matrix
energy range of 0.1 ·kWh/ton to 100 kWh/ton, which is a range of three levels
of magnitude. Given that the minimum energy tested for the present system
was xtiinc·Yvowcn the maximum energy tested would equal n6.x.y. Using n=2
gave the maximum energy tested = 64 times the minimum tested, while n = 3
gave 729 times the minimum. An analysis of how power input is calculated
helped to choose the most convenient value for n.
As given before, Oldshue [1983] has shown that for any particular impeller
design, a dimensionless power number can be found, which is ~onstant for a
given Reynolds number. This power number relates impeller diameter, rpm
and power input into the system. This equation is as follows:
2.158x10¹⁷ p N3D5p
(17)
The axial flow impeller chosen has a constant NP= 1.27 for all NRe> 100. Thus
for a given diameter and pulp density, any desired power input can be achieved
by altering the impeller speed. This is shown in the function below (previously
given in section 4.4.1.2).
121
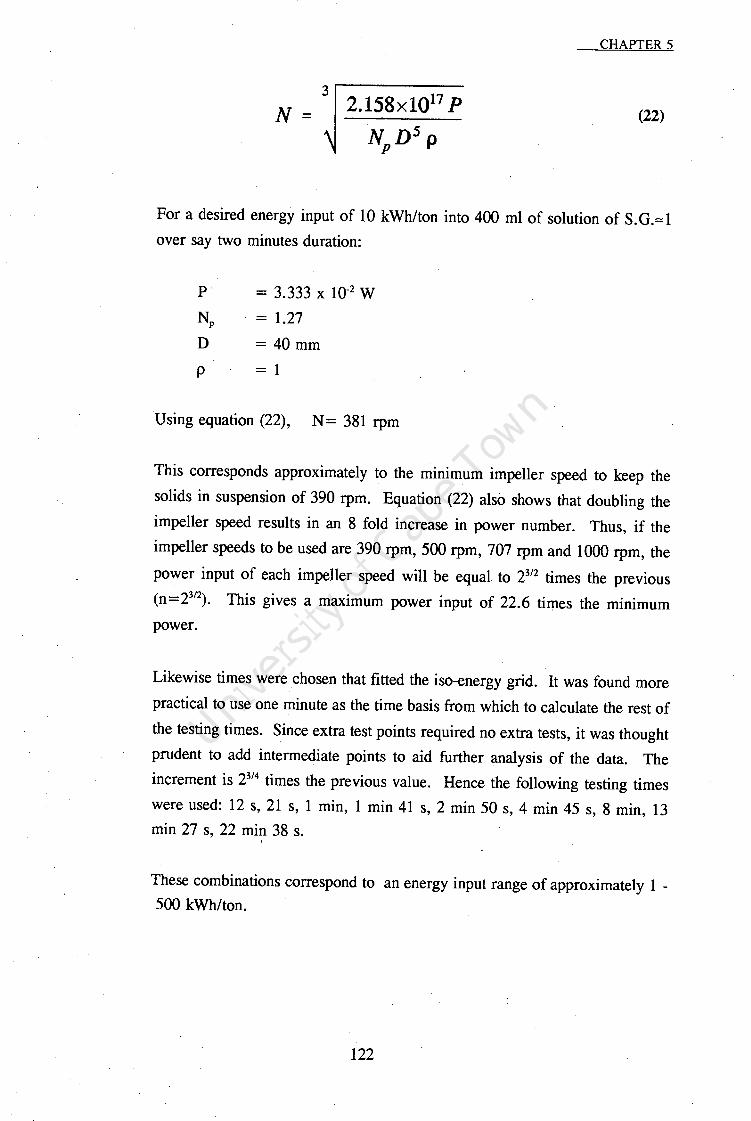
3
N= 2.158x10¹⁷ P
N D5 p p
CHAPTER 5
(22)
For a desired energy input of 10 kWh/ton into 400 ml of solution of S.G.:::::l
over say two minutes duration:
p = 3.333 x 10⁻² w Np = 1.27
D = 40 mm
p = 1
Using equation (22), N = 381 rpm
This corresponds approximately to the minimum impeller speed to keep the
solids in suspension of 390 rpm. Equation (22) also shows that doubling the
impeller speed results in an 8 fold increase in power number. Thus, if the
impeller speeds to be used are 390 rpm, 500 rpm, 707 rpm and 1000 rpm, the
power input of each impeller speed will be equal to 2312 times the previous
(n=2312). This gives a maximum power input of 22.6 times the minimum
power.
Likewise times were chosen that fitted the iso-energy grid. It was found more
practical to use one minute as the time basis from which to calculate the rest of
the testing times. Since extra test points required no extra tests, it was thought
prudent to add intermediate points to aid further analysis of the data. The
increment is 2314 times the previous value. Hence the following testing times
were used: 12 s, 21 s, 1 min, 1 min 41 s, 2 min 50 s, 4 min 45 s, 8 min, 13
min 27 s, 22 min 38 s. '
These combinations correspond to an energy input range of approximately 1 -500 kWh/ton.
122

CHAPTER 5
5.3.3. Effect of Type of Power Input (Volume)
This test was intended as a qualitative analysis of the potential for optimising
the method by which power is input into a slurry. This test involved using the
same equipment and impeller speeds, but reducing the quantity of slurry
conditioned by half from 400 ml to 200 ml. This approximately doubled the
energy input per unit volume, without affecting the shear applied near the
impeller.
5.3.4. Collector Concentration
Collector concentration has already been shown, in Chapter 4, to involve some
interesting effects. In.section 4.5.3 mono-layer doses of collector were seen to
have almost no effect on · flotation. The reason for this needed to be
investigated. The rate and extent of depletion of collector from solution at
higher doses was another important area of investigation, to determine how
rapidly equilibrium was reached and what this equilibrium value was. The
effect of increasing and decreasing this concentration on adsorption rate and
extent was also investigated.
Conditioning tests were performed at mono-layer dosage of collector and at
doses corresponding to half and double the standard dosage of 3.6 µIlg pyrite.
5.3.5. Water content
The investigation of the effect of increasing the pulp density in the conditioning
vessel to improve diffusion and power input, comprised one test at standard
conditions (given below), except that the water content of the slurry was halved.
This differed from section 5.3.3 above in that the above experiment involved
halving all components of the slurry, while in this test the collector and mineral
content were maintained at the standard quantities (3.6 µIlg pyrite of collector
and 4· g of pyrite).
123

CHAPTER 5
5.4. Summary of Tests to be Performed
The conditions chosen as standard, and against which all parameter changes were
measured were as follows:
impeller speed - 500 rpm
diC3 DTC collector concentration - 3.6 µl I g pyrite
PNBX collector concentration -Buffer dosage - 0.5 ml
Liquid volume - 400 ml
pyrite mass - 4g
A number of standard run have already been analyzed in Chapter 4, to determine
reproducibility for the adsorption technique. The following table provides a summary
of the remainder of the experimental program:
Variable Tested Conditions to be varied from STD
Collector Type use 3 collectors: diC3 DTC, PNBX and oC6 DTC
Power Effects impeller speeds of 390, 500, 707, 1000 rpm
Time Effects Every run was sampled at the times given in 5.3.2
Type of Power Input one test where every slurry component was halved
Collector Concentration collector concentration at 1/2 and 2x STD
Water Content (Pulp Density) one test using half the liquid volume
The next chapter provides a detailed discussion of the results achieved in these tests.
124

CHAPTER 6 - RESULTS AND DISCUSSION
6.1. Introduction
The results of the experiments performed are discussed in this chapter in logical order,
using the topics set out previously in section 5.2. The data are presented graphically
in most cases, to facilitate ease of interpretation. The work wa!!l carried out according
to the procedure described in section 4.4.2. The full details of every test run is given
in Appendix F. The results of these tests are discussed in terms of: 1) what was l
observed, 2) how this relates to predictions made by literature and finally 3) the impact
this has on industry.
Time and power input are naturally the most important variables to examine, since this
whole work carries through it the theme of power and time vs.energy input. But first
the discussion will cover the theme of collector type. Since the test program for each
variable was essentially repeated on each of two collectors, it is useful to determine any
characteristic differences between the collectors at this point.
6.2. Effect of Collector Type
. To determine the effect of collector type on conditioning, the adsorption rates of the
two chosen collectors, PNBX and diC3 DTC were compared with each other at
standard conditions. A third collector, cyclic C6 dithiocarbamate (OC6 OTC) was
added to this comparison, to provide additional data. As a dithiocarbamate, it was
expected to show similar. trends to diC3 DTC, but with different adsorption rates,
owing to different diffusivity and surface charges.
The tests were carried out at standard conditions. The results appear in Appendix F,
runs 3P, lD and SD. In Figure 6.1 the adsorption ·of each collector onto the pyrite
surface is plotted as a function of time. As may be seen, all of the collectors adsorbed
very rapidly onto the pyrite surface, with equilibrium adsorption reached within
approximately 10 minutes of injection into the slurry. The most rapidly adsorbing
collector was oC6 DTC, followed in tum by diC3 DTC and PNBX. The most
125

CHAPTER6
important observation here is that PNBX adsorbs substantially more slowly than do the
DTC's.
0 5 10 15
Time (minutes)
Figure 6.1 - Adsorption Profiles of Three Thiol Collectors
20
-a- PNBX
..- diC3DTC
-.. OCSDTC
25
In laboratory scale batch flotation tests on pyrite samples, using collectors of equal
alkyl chain length (the hydrophobic tail), it has been noticed that xanthates repeatedly
outperform dithiocarbamates in mineral recovery [Bradshaw,1992]. Taken together
with the adsorption profiles observed in Figure 6.1 this would imply that despite
increased adsorption, the DTC's work far less efficiently than do xanthates. There is
a plausible explanation for this, and it involves conditioning.
Laboratory scale batch flotation is a high intensity process, with very good mixing
within the cell, as demonstrated by calculations of the power input for the flotation cell
used by Stassen (section 3.6). Typical impeller speeds are around 1500 rpm, and the
power numbers of most batch flotation cells exceed 5, being Rushton turbines or similar
radial flow impellers. (The present system uses 500 rpm impeller speed and has a
power number of 1.6). Thus the 10 minutes of flotation time typically employed by
Bradshaw [1992] was more than adequate for conditioning to reach completion. At
equilibrium, all the collectors are equally adsorbed (c.f. Figure 6.1). Thus the
difference in collector efficiency of the collectors is the result of their differences in
their chemistry alone, and is not influenced by their rates of adsorption.
126

CHAPTER 6
Nonetheless, while the PNBX is a more effective collector·, the DTC' s adsorb more
rapidly. It is conceivable that there is a level of conditioning such that the DTC's
provide better flotation by virtue bf their increased adsorption level. This result can
. be likened to the R-k trade-off, described by Klimpel [1984] for flotation recovery. In
this case, there would be a trade-off between rate of adsorption and the effectiveness
of the particular collector adsorbed. Thus, the choice of whether to use a xanthate or
a dithiocarbamate collector might be determined by the initial extent of conditioning.
Since mixing in an industrial flotation cell is far poorer than in. the small, well mixed
· conditioning vessel used in these tests, this effect would be expected to be far more
pronounced on a plant (this would depend on whether the 'R-k cross-over' has been
reached or not). It is therefore recommended that plant tests be carried out to
determine whether or not this observation might be used to advantage when
conditioning resources are limited. Increases in plant throughput may for instance
result in limited conditioning time.
Having observed the different profiles for a xanthate collector and two
dithiocarbamates, it would be useful to know if this behaviour could be explained by
mechanistic theory. The next section discusses how this observation fits the reaction
mechanisms believed to occur.
6.3. Reaction Mechanisms of Adsorption
The literature cited in section 4.2.3.2 presents two reaction mechanisms for xanthate
and dithiocarbamate adsorption onto a sulphide mineral. There are numerous other
reactions that both collectors can undergo, but at this pH, the following reactions are j
. most likely to occur on the mineral surface:
and
2X· => X2
x· + M+ => x·M+
2 DTC· => DTC· + M+ =>
DTC2
DTC·M+
Thus both collectors either attach to the mineral in an ionised form, or they utilise the
mineral as a reaction site to form dixanthogen or DTC2• Which of these two products
is formed by each collector is strongly determined by the pH and the sulphide mineral
type.
127

CHAPTER 6
At pH 4 in the presence of pyrite, dixanthogen is the dominant xanthate product.
Dixanthogen is insoluble in water and hence the surface reaction of PNBX = > PNBX2
effectively precipitates PNBX out of the solution. Thus, provided there is pyrite
present to provide the reaction site, xanthates will continue to react until the solution
is totally exhausted of any xanthate. Dithiocarbamates, on the other hand, remain
ionised on the pyrite surface and are hence reversibly attached to the mineral. This
results in the formation of an equilibrium between DTC's on the mineral surface and
in solution, though this equilibrium value is very small [Thorn and Ludwig; 1962].
The formation of insoluble dixanthogen is a slower reaction than simple ionic attraction,
and the presence of the dixanthogen may inhibit the rate of electron transfer, necessary
for further adsorption and dixanthogen formation. This would result in a slower
adsorption of xanthate than dithiocarbamate onto pyrite. Figure 6.1 shows exactly this
effect. Hence the mechanisms which have been proposed by the literature are
supported by the results of the adsorption tests.
It was noted in section 4.5.3 that the diC3 DTC collector dosage was substantially in
excess of that required to provide a mono-layer coverage of the pyrite surface. Tests
also showed that the collector did not react with the buffer and was relatively stable
over the time period of the conditioning tests. This would suggest that the collector
must adsorb to the mineral surface in multi-layers. This multi-layer adsorption was
also observed by Bhaskar and Forsling [1991] who state that xanthate was observed to
adsorb "up to 80 mono-layers" on the pyrite surface.
Conditioning with small amounts of collector (runs 15D and 4P, in Appendix F), results
in extremely rapid adsorption which goes to extinction. If the adsorption were even,
this would imply that the mineral was almost completely covered by collector. Yet
flotation was shown to be poor (section 4.5.3). It is not known exactly why large
excesses are required to provide good flotation of pyrite. The mineral surface is known
to be highly irregular, with some sites more active than others in the adsorption of
collector [Harris, 1993]. It is possible that collector attaches preferentially onto the
strong sites, even forming multi-layers in these regions. Thus low doses of collector
would attach only in very. few sites on the mineral surface, not adequately increasing
the hydrophobicity of the mineral. Larger doses, on the other hand, may allow less
active sites with the increased adsorption time and overall greater driving force
available to adsorb collector, increasing overall surface coverage. It may be necessary
128

CHAPTER 6
for both weak and strong sites to be coated with collector before sufficient
hydrophobicity .is achieved for good flotation recovery.
This is largely speculative, yet jt does have foundation in literature and experimental
observation. More important than the speculated mechanisms, however, is
understanding how conditioning and collector type are linked. Understanding the
conditioning requirements of the collectors used improves the effectiveness with which
they can be utilised in industrial applications.
6.4. Time Effects of Conditioning
Conditioning has already been measured as a function of time. The adsorption of
collector was plotted against time to give the adsorption profiles of the three collectors
(PNBX, diC3 DTC and oC6 DTC) shown in Figure 6.1. The Figure show that
conditioning is very rapid, with 50% of the collector adsorbed onto the mineral surface
within the first minute of conditioning. Adsorption is complete within 10 minutes of
beginning.
It would be useful to be able to determine the reaction order to gam a better
understanding of the reaction mechanisms. Also, it is important to measure the rate of
the adsorption reaction in order to be able to make quantitative comparisons of
conditioning rates at different conditions, as well as comparing different collectors.
The same data as given in Figure 6.1 plotted as ln[ A/ A0] vs time, where A is collector
concentration in solution and A0 is initial collector concentration, allows calculation of
the reaction order and the rate of reaction. This is plotted for diC3 DTC and for
PNBX at standard conditions in Figure 6.2.
The Figure shows that the relationship is linear up to the point where collector in
solution approaches exhaustion (at approximately 5 minutes for diC3 and 8 minutes for
PNBX). A linear regression of the first eight points gives an R2 =0.977 for DiC3
DTC, a good fit which confirms statistically that the relationship is most likely linear.
The fit is even better for PNBX, where R2 =0.997.
A linear relationship between In[ A/ A0] and time shows that the reaction is first order
in collector concentration. The slope of the line is the rate constant for adsorption of
collector onto the mineral surface. This slope was calculated as being 0.569 min·1 for
129

CHAPTER6
3
-a- DiC3 OTC - Average of SID Readings
-+ PNBX • Average of S1D Reacings
D 2 4 6 a 1D
Time (minutes)
Figure 6.2 - Log of Collector Uptake vs Time for DiC3 DTC and PNBX
DiC3 DTC and as 0.338 min-1 for PNBX. This is a relatively large value for
heterogenous reactions. The linear relationships with time, and the large rate constants,
for both collectors shows that time is an important variable of the conditioning for these
collectors.
6.5 Power Effects of Conditioning
The effect of power on conditioning was measured by varying the impeller speed during
conditioning, while keeping all other variables constant at the standard conditions. The
impeller speeds were chosen in Chapter 5 to maximise the information available for
comparing the the relative effects of power and time, which is covered in more detail
in section 6. 7. The impeller speeds chosen were 390 rpm, 500 rpm (standard speed),
707 rpm and 1000 rpm. Each of these increments represents an increase in power of
.../8 over the previous power see section 5.3.2). All of the impeller speeds were tested
using diC3 DTC, but analysis of these results showed that there was no point in doing
the same for PNBX, so PNBX was only tested at 500 rpm and 1000 ·rpm. The data
from these tests can be found in Appendix F (runs 2D, 3D, 8D and the average of lD,
9D and 12D for diC3 DTC; and runs 6P and the average of 2P and 3P for PNBX).
130

CHAPTER 6
Figure 6. 3 and Figure 6.4 show the collector uptake curves at various impeller speeds
for diC3 DTC and PNBX respectively. It may be seen that for both collectors there
was a small increase in rate of adsorption of collector when the impeller speed was
increased to 1000 rpm from the standard speed of 500 rpm. For diC3 DTC, the lower
impeller speed of 390 rpm yielded erratic results, which are believed to have been be
caused by poor mixing of the mineral in the vessel, while the results at 707 rpm fell
between those at 500 and 1000 rpm.
0 5 10 15
Time (minutes)
•:Hlrpm
... flXJrpm
+707rpm
-o- 1CJDrpm
Figure 6.3 - Effect of Impeller Speed on diC3 DTC Adsorption
20 25
From Oldshue's [1983] equation of power number, power input is proportional to the
cube of the impeller speed (see eqn 18, section 3.6). Therefore, doubling the impeller
speed, from 500 to 1000 rpm, results in 8 times the power input into the system. For
diC3 DTC the increase in adsorption after 100 seconds of conditioning time, in going
from 500 to 1000 rpm, was in the region of 9%, while for PNBX the increase was
approximately 19%. This must be seen against the equivalent increase in energy added
by increasing conditioning time rather than power input; where adsorption of diC3 DTC
is 50% higher, while adsorption of PNBX is 110% higher. In both cases the influence
of time is 5 fold that of power input. Referring to Figure 2.10 of the literature section,
one may conclude that conditioning is no longer strongly affected by agitation intensity.
This implies that adsorption has moved (or is moving) out of the regime of diffusion
control, to that of a reaction controlled mechanism. The small increase in adsorption
rate, with increase in power input, shows that diffusion is still slightly limiting. Most
literature states, to the contrary, that the reaction between thiol collectors and pyrite is
131

CHAPTER6
2.5
0.5
o--~~~~~~~~~~~~~~~~~~~~~~~~~~~
0 5 10 15 20 25
Time (minutes)
Figure 6.4 - Effect of Impeller Speed on PNBX Adsorption
diffusion controlling [Bhaskar & Forsting, 1991; Crozier, 1993]. Despite this, the
result is not unexpected, since the test system was small-scale and hence well mixed.
A vessel of the scale used commercially typically has a very low power input and is
poorly mixed, resulting in the system being diffusion controlling.
6.6 Effect of Type of Power Input
This test involved reducing the contents of the conditioning vessel by half; the volume
of liquid from 400 ml to 200 ml and mass of pyrite from 4 g to 2 g. The collector
addition was also halved in order to maintain dosage at 2.5 µmoles/g. This was done
in order to ascertain the effect of increased power input without changing the maximum
shear forces in the system. The halved volume results in almost double the power input
per unit volume of the slurry (and hence unit mass of pyrite). However, the power
number changes only very slightly as a result of reduced distance between the surface
and the impeller; the change is insufficient to affect the results.
Figure 6.5 shows the adsorption curves for both standard conditions (average of runs
ID, 9D and 12D) and for the system using a halved sample volume (run 4D), using
diC3 DTC as the collector. The previous section indicated that little change could be
expected for increased power input into the system. This is confirmed by the figure.
132

CHAPTER6
There is no measurable difference between the two curves. It may be concluded that
it is not possible, using this small system, to perform more detailed analysis of the
effect of power type. This does not rule out the possibility that the method by which
power is introduced can affect adsorption. But, in order to achieve measurable
differences in adsorption rate, a larger, poorly mixed vessel must be used. A plant
scale flotation system may prove more revealing.
i ~ 2 0
·~ -
0 5 10 15
Time (minutes)
-t> Std Conditions
... 112 Quantity
20
Figure 6.5 - Effect of Power Type on DiC3 DTC Adsorption
6. 7 Relationship between Time, Power and Energy
25
Stassen [1990] hypothesised that the relationship between time, power and energy input
into conditioning was a simple one, with energy input being the independent variable
affecting the mineral flotation rate and recovery. The implication of this is that it is
unimportant whether energy is added using extended conditioning times or high impeller
speeds.
The present work has shown that for the pyrite-thiol systems studied (the same kinds
of system that Stassen used), this is untrue. Increasing power input into the system has
only a small effect on collector uptake by the mineral, while conditioning time has a
marked effect on collector uptake, up to 10 minutes. In section 6.5, it was shown that
133

CHAPTER 6
the reaction is first order in time and that time is the dominant variable in the
adsorption process. It can be deduced that this system is reaction rate controlling.
Figure 6.6 and Figure 6.7 show the percentage improvement in adsorption for 8 times
increase in energy input, using diC3 DTC and PNBX respectively. The additional
energy is added as power or as time, and is plotted against standard time in minutes
(see Figure 6.3 and Figure 6.4). The addition of 8 times the energy using power is
achieved by increasing the impeller speed to 1000 rpm (runs 2D and 6P), while the
addition of 8 times the energy as time is achieved by conditioning normally (i.e. at 500
rpm) for 8 times the duration (average of runs lD, 9D and 12D and average of runs
2P and 3P). The figure shows that adding extra energy as power resulted in hardly any
improvement in adsorption, while adding extra energy by agitating for a longer period
at the same rpm provides a very large initial increase in collector uptake, approaching
0% as adsorption approaches completion.
180
~· 160
m 0.. 140 ::J ... 0 j 120
8 100
.5 Q) 80 Ul m
~ 60
t: 40
8 a; 20 ~
-11- Bx SID lime
* 8 x SID PO'M!r
-20 .___ ________ ...__ ________ _,__ ________ _,
0 5 10 15
Standard Time (minutes}
Figure 6.6 - Effect of Eight Times Energy Input using DiC3 DTC
The dominance of time effects over power effects in conditioning is expected to be very
different for large, poorly mixed systems. In fact, analysis of Stassen's data (section
3.8) showed that power input was the more important variable for his test system. The
point to be made, however, is that power and time are independent variables. Using
various combinations of these, which correspond to the same total energy input, results
in different adsorption or flotation responses. Thus Stassen' s observation that energy
input is the variable that determines flotation response is incorrect. There may be some
134
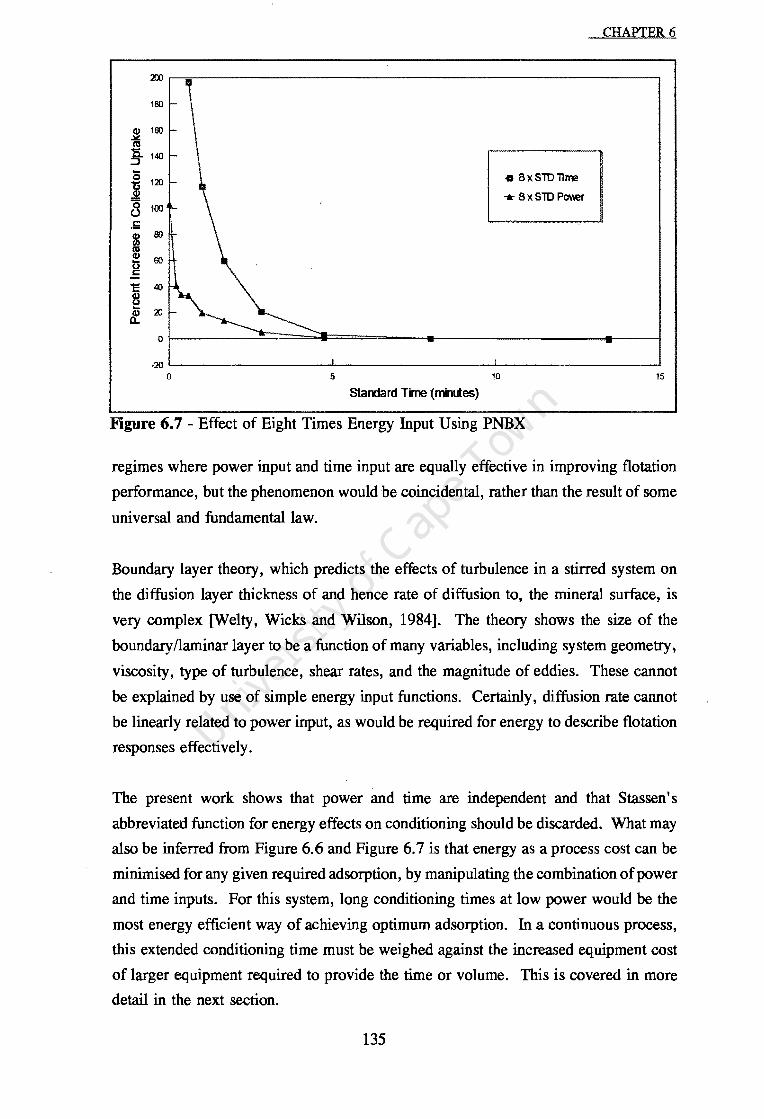
180
~ 160 ca §- 140
... 0 E 120
8 100
.5 4) BO I/)
~ 60 u c:
c 40
8 £ 20
• BxSID1irre
"* 8 x SlD P<Mer
CHAPTER6
-20~~~~~~~~~~~~~~~~~~~~~~~~~~~
0 5 10 15
Standard Time (minutes)
Figure 6. 7 - Effect of Eight Times Energy Input Using PNBX
regimes where power input and time input are equally effective in improving flotation
performance, but the phenomenon would be coincidental, rather than the result of some
universal and fundamental law.
Boundary layer theory, which predicts the effects of turbulence in a stirred system on
the diffusion layer thickness of and hence rate of diffusion to, the mineral surface, is
very complex [Welty, Wicks and Wilson, 1984]. The theory shows the size of the
boundary/laminar layer to be a function of many variables, including system geometry,
viscosity, type of turbulence, shear rates, and the magnitude of eddies. These cannot
be explained by use of simple energy input functions. Certainly, diffusion rate cannot
be linearly related to power input, as would be required for energy to describe flotation
responses effectively.
The present work shows that power and time are independent and that Stassen's
abbreviated function for energy effects on conditioning should be discarded. What may
also be inferred from Figure 6.6 and Figure 6.7 is that energy as a process cost can be
minimised for any given required adsorption, by manipulating the combination of power
and time inputs. For this system, long conditioning times at low power would be the
most energy efficient way of achieving optimum adsorption. In a continuous process,
this extended conditioning time must be weighed against the increased equipment cost
of larger equipment required to provide the time or volume. This is covered in more
detail in the next section.
135
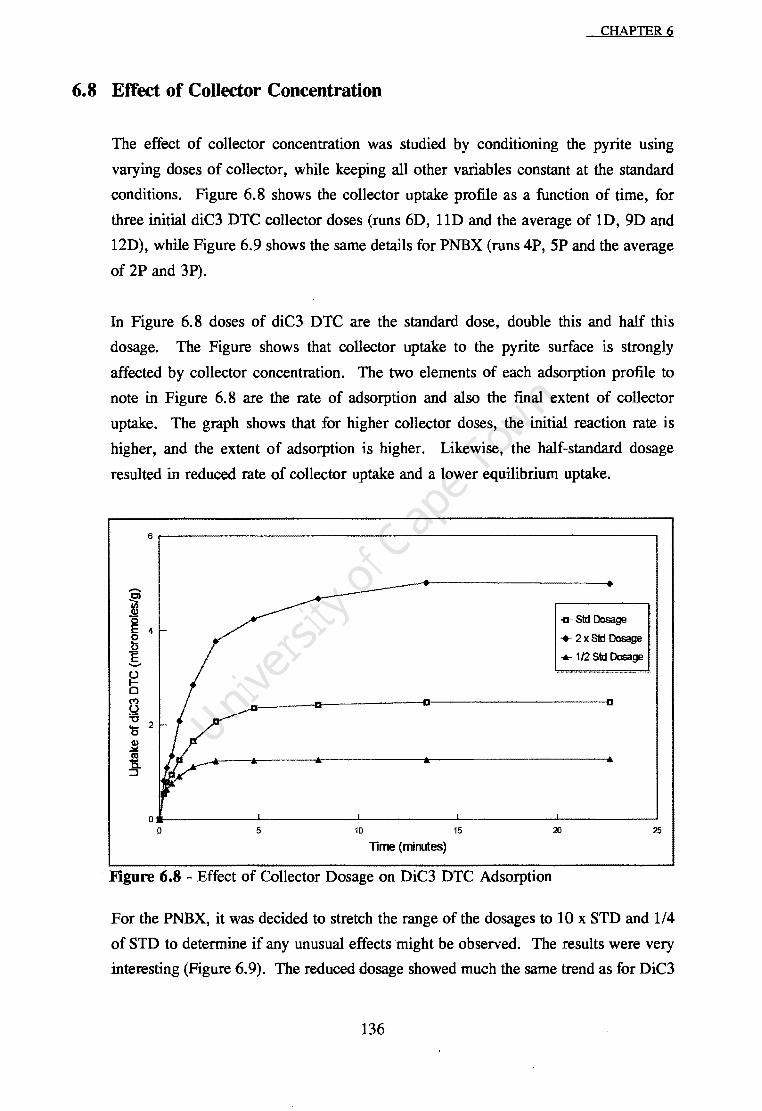
CHAPTER6
6.8 Effect of Collector Concentration
The effect of collector concentration was studied by conditioning the pyrite using
varying doses of collector, while keeping all other variables constant at the standard
conditions. Figure 6. 8 shows the collector uptake profile as a function of time, for
three initial diC3 DTC collector doses (runs 6D, 1 lD and the average of ID, 9D and
12D), while Figure 6.9 shows the same details for PNBX (runs 4P, 5P and the average
of 2P and 3P).
In Figure 6. 8 doses of diC3 DTC are the standard dose, double this and half this
dosage. The Figure shows that collector uptake to the pyrite surface is strongly
affected by collector concentration. The two elements of each adsorption profile to
note in Figure 6. 8 are the rate of adsorption and also the final extent of collector
uptake. The graph shows that for higher collector doses, the initial reaction rate is
higher, and the extent of adsorption is higher. Likewise, the half-standard dosage
resulted in reduced rate of collector uptake and a lower equilibrium uptake.
-.e>
j 4 c n .E -
~ Cl M &2 "C
2 '5 4) ~ Cll
§-
0 0 5 10 15
Time (minutes)
· Figure 6.8 - Effect of Collector Dosage on DiC3 DTC Adsorption
-a- Std Dosage
..... 2 x Std Dosage
.... 1/2 Std Dosage
20 25
For the PNBX, it was decided to stretch the range of the dosages to 10 x STD and 1/4
of STD to determine if any unusual effects ·might be observed. The results were very
interesting (Figure 6. 9). The reduced dosage showed much the same trend as for DiC3
136
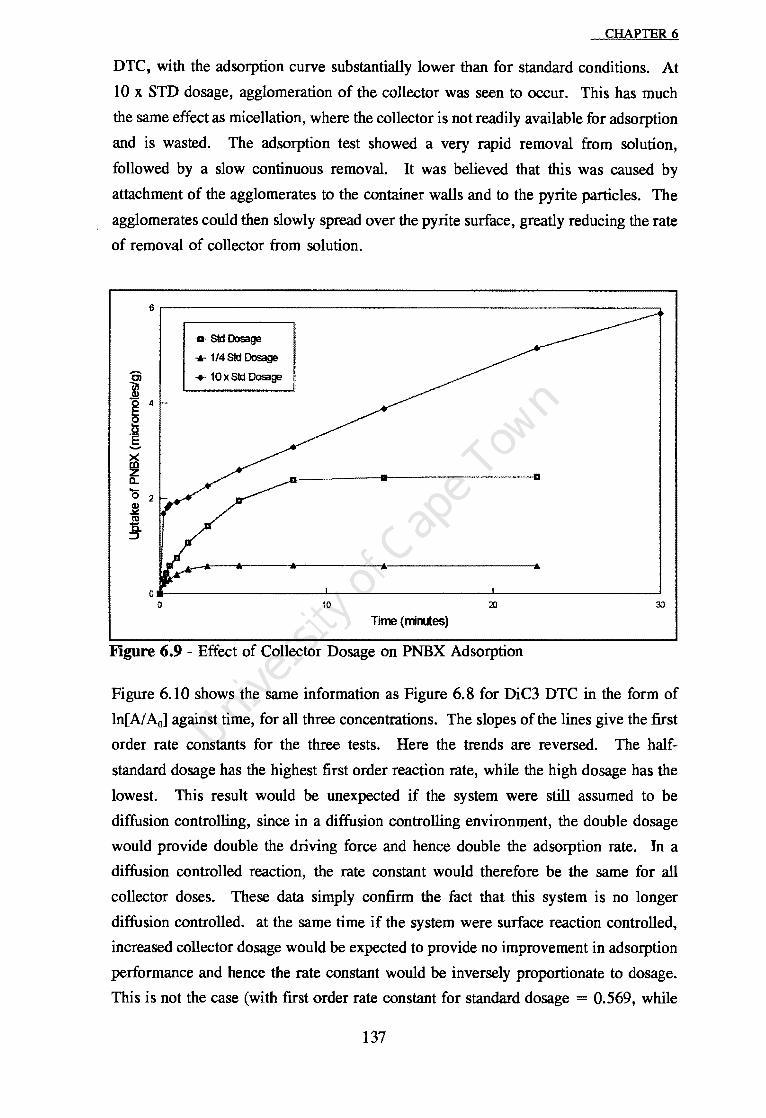
CHAPTER6
DTC, with the adsorption curve substantially lower than for standard conditions. At
10 x STD dosage, agglomeration of the collector was seen to occur. This has much
the same effect as micellation, where the collector is not readily available for adsorption
and is wasted. The adsorption test showed a very rapid removal from solution,
followed by a slow continuous removal. It was believed that this was caused by
attachment of the agglomerates to the container walls and to the pyrite particles. The
agglomerates could then slowly spread over the pyrite surface, greatly reducing the rate
of removal of collector from solution.
-o- Sid Dosage
... 1/4 Std Dosage
Cl -+- 10 x Sid Dosage
~ ~ 4 0
·~ -~ z a. -0 2 ]! ro
!
0 10
Time (minutes)
Figure 6.9 - Effect of Collector Dosage on PNBX Adsorption
30
Figure 6.10 shows the same information as Figure 6.8 for DiC3 DTC in the form of
In[ Al Ao] against time, for all three concentrations. The slopes of the lines give the first
order rate constants for the three tests. Here the trends are reversed. The half
standard dosage has the highest first order reaction rate, while the high dosage has the
lowest. This result would be unexpected if the system were still assumed to be
diffusion controlling, since in a diffusion controlling environment, the double dosage
would provide double the driving force and hence double the adsorption rate. In a
diffusion controlled reaction, the rate constant would therefore be the same for all
collector doses. These data simply confirm the fact that this system is no longer
diffusion controlled. at the same time if the system were surface reaction controlled,
increased collector dosage would be expected to provide no improvement in adsorption
performance and hence the rate constant would be inversely proportionate to dosage.
This is not the case (with first order rate constant for standard dosage = 0.569, while
137

CHAPTER6
the rate of 2 x STD = 0.401 ), thus either the adsorption reaction is affected by both
diffusion and surface reaction or another mechanism is acting on the system.
3
-a- Std Dos:lge
-. 2xDosage
.,.. 112 SlD Dos:ige
0 2 4 6 8 10 12
Time (minutes)
Figure 6.10 - Effect of Collector Concentration on DiC3 Adsorption Rate Constant
In terms of how this might affect the conditioning of minerals there are two ways to
look at the issue. Firstly, and possibly more appropriately for industry, the duration
required to achieve optimum adsorption can be analyzed. From Figure 6. 8 it can be
seen that for the double dosage of 5 µmoles/g, the optimum level of approximately 2.2
µmoles/g DiC3 DTC collector uptake was reached within one minute of commencing
conditioning. For the standard dosage, this level was only reached after 5 to 10
minutes of conditioning. On a minerals processing plant, this can be translated into the
choice between using standard conditions or adding an extra 80 g/ton of collector to
effect an 80 to 90 % savings in equipment, maintenance and power costs brought about
by the reduced conditioning required. Stassen recommends an optimum conditioning
power input of 10 kWh/ton. This might mean a ninety percent saving, translating to
9 kWh/ton energy saving. At a saving of 60 c to R 1,50 per ton on energy costs alone,
it might well be cost effective to overdose with collector. The tests with PNBX show,
though, that cognisance must always be taken of the collector's limit of solubility.
Secondly, there is once again a trade-off between two important variables. As dosage
is increased, the first order rate constant is reduced. In this case, the increase in
collector available for reaction more than off-sets the reduction in reaction rate. It may
138

CHAPTER 6
be possible, however, to reach a situation where no advantage is gained by increasing the collector dosage.
What these data, and the previous section, help to highlight is the potential for
optimisation of conditioning of mineral according to economic criteria (as well as the
need to understand the opposing mechanisms affecting the conditioning efficiency). In
a plant environment, where a proper factorial analysis of the variables of conditioning
might be difficult, this optimisation is not usually carried out effectively.
Several optimization methods and experimental design tools are available [Austin and
Henwood, 1991] for use in optimising operating systems on-line. Evolutionary design
tools such as EVOP (EVolutionary OPeration) and SSDEVOP (Simplex Self Directing
EVolutionary OPeration) allow for a plant to gradually migrate to optimum operating
conditions without drastic changes in the input or output variables. Since laboratory
scale conditioning can be seen to be very different to that in a plant, these tools would
provide the best means of reaching the most economically beneficial compromise
between power, time and collector dosage.
6.9 Influence of Pulp Density
The work of Anderson [1988] showed that conditioning efficiency could be greatly
enhanced through reduction in the pulp water content, or more precisely, increase in
pulp density. In the present work, using the diC3 DTC-pyri.te system, a similar
experiment was carried out at standard conditions, except that the water content in the
conditioning vessel was halved (run number lOD). Thus for the same collector dosage,
not only was the power input per unit volume doubled (as in section 6.6 above), but the
initial concentration of collector (defined as µIll slurry) was also doubled. Since the
adsorption of collector onto the pyrite was calculated to be first order in collector
concentration (section 6.4), it was anticipated that the initial reaction rate would be
doubled. While the advantage of increased power input was shown above to be
negligible, increased collector concentration is expected to result in substantial increases ·
in adsorption rates.
The results of the experiment are plotted in Figure 6.11 which shows the adsorption
profiles for both standard pulp density and double pulp density. As may be seen, the
curves overlap each other. This implies that adsorption rate was unaffected by the
139

CHAPTER6
increase in pulp density and conditioning power. It has already been shown that
conditioning power input does not play a major role in improving collector uptake for
this system (section 6.6). However, the lack of improvement as a result of increased
concentration goes totally against all expectation. More specifically it contradicts the
findings of section 6. 8 above that adsorption rate is a function of collector
concentration.
0 5 10
Time (minutes) 15
-a- Std Conditions
..- 2 x Pulp Density
20
Figure 6.11 - Effect of Pulp Density on diC3 DTC Collector Adsorption
25
A dimensional analysis of the results obtained gives a hint as to the possible reaction
mechanism resulting in this apparent anomaly. Three trials of importance were
isolated:
1) Standard conditioning
2) Standard conditioning, but with double collector dosage.
3) Halved water content, but standard pyrite and collector dosage
The dependent variable is reaction rate, while the input variables are: volume and
collector concentration.
Simply put, the rates achieved can be extracted from the input variables using the
function:
Rate = k . volume . collector concentration
140

CHAPTER 6
This implies that the rate controlling reaction is a liquid volume rate reaction,
dependent on both concentration and volume. Adsorption, on the other hand is a
surface reaction, independent of volume but not independent of concentration.
There are at least two possible reaction mechanisms which could give these results:
6.9.1. Slow Ionisation of the Collector
The mechanism hypothesised here is a two step reaction, involving the
ionisation of molecular diC3 DTC, followed by the adsorption reaction onto the
mineral surface. This could be represented as follows:
and
DTC- + M+
where
k1 = rate constant for ionisation
k2 = rate constant for adsorption
Therefore,
Rate=
If k2 < < k1, that is the rate is ionisation controlling, then,
Rate of uptake = k1[DTC]. volume
This proposed mechanism is able to explain the results of the three different
situations isolated for analysis.
The strongest case against this mechanism is that ionisation is normally assumed
to be instantaneous. Thus k1::::: 0 and the mechanism no longer produces the
results observed in the tests. This mechanism also implies that reaction rate is
unaffected by mineral surface area, or availability of active sites. An effective
negative test for this mechanism, then, is to determine the effect of halving
mineral content of the slurry on collector uptake. Figure 6.12 shows the result
of such a reduction in pyrite (run number 16D), with all else remaining at
141
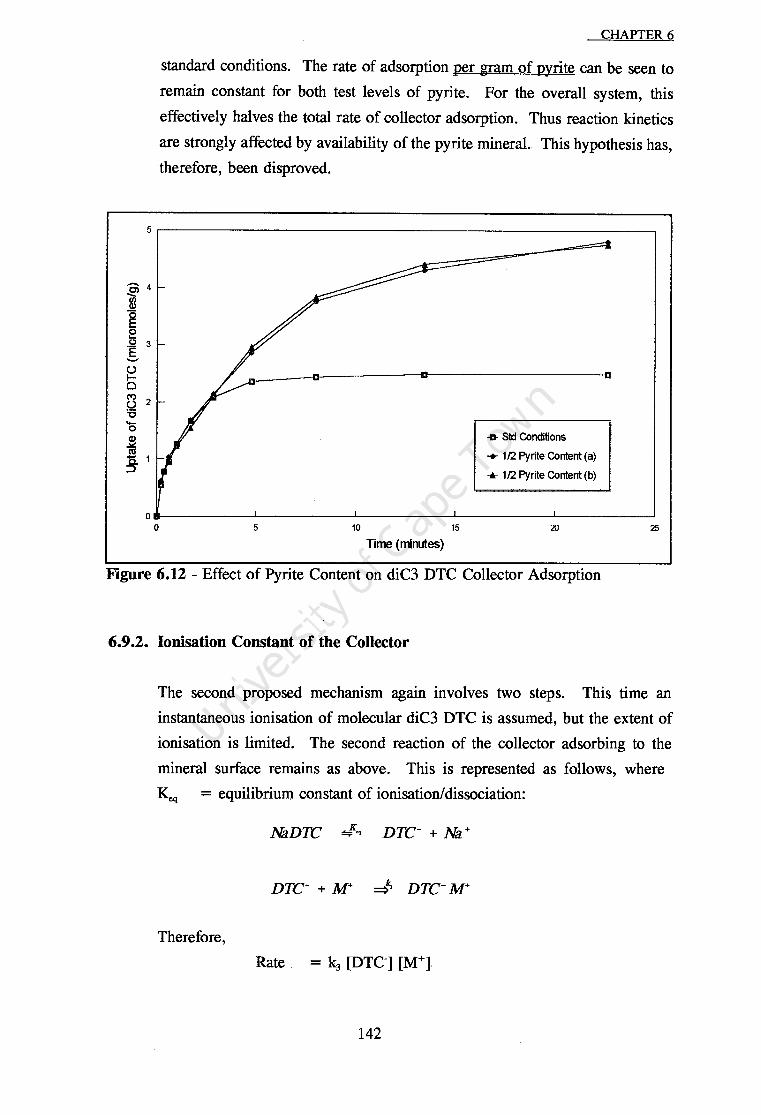
Ci 4
Kl ~ 0 ..... (J 3 .E -~ Cl ('I)
2 !=2 "C ...... 0
~ cu §- 1
0
CHAPTER6
standard conditions. The rate of adsorption per gram of pyrite can be seen to
remain constant for both test levels of pyrite. For the overall system, this
effectively halves the total rate of collector adsorption. Thus reaction kinetics
are strongly affected by availability of the pyrite mineral. This hypothesis has,
therefore, been disproved.
0 5 10
Time (minutes) 15
-a- Std Conditions
+ 112 Pyrite Content (a)
...- 112 Pyrite Content (b)
20 25
Figure 6.12 - Effect of Pyrite Content on diC3 DTC Collector Adsorption
6.9.2. Ionisation Constant of the Collector
The second proposed mechanism again involves two steps. This time an
instantaneous ionisation of molecular diC3 DTC is assumed, but the extent of
ionisation is limited. The second reaction of the collector adsorbing to the
mineral surface remains as above. This is represented as follows, where
Keq = equilibrium constant of ionisation/dissociation:
NaDTC =ff., DTC- + Na+
Therefore,
142

CHAPTER 6
Or
For this case, the previous observation that the system is well mixed is used.
It is assumed that diffusion to the mineral surface is much more rapid than the
surface reaction.
Now, after a given fraction, x, of NaDTC has been adsorbed, we have (1-x)
NaDTC remaining. If the equilibrium were almost entirely shifted to the
molecular phase of NaDTC, we have in the case of standard conditioning:
=
going to,
=
and hence,
[Na + ] • [ DTC - ]
[NaDTC]
x. [DTC-]
1 -x
1 --x = Keq·-
x
For the case where water content is halved, the concentration of NaDTC in
solution is doubled, but so is the removal of DTC- and the buildup of Sodium
ions in solution after equivalent extents of adsorption. This gives the following
equilibrium equation:
=
and hence,
2x. [DTC-] 2,.(1 - x)
143

1 -x = Keq·-
x
CHAPTER 6
Thus, the concentration of DTC- is exactly the same for any level of collector
adsorption. Since the rate is controlled by this ionised component of NaDTC,
the rates must be the same for both cases. This is what was observed.
This process has been idealised by the assumption that the ionisation is strongly
shifted to the molecular phase. But this is supported by the literature:
dithiocarbamates are indeed found to be weakly ionised. For di-n-propyl
dithiocarbamic acid, the pl(.. ::o; 5 [Thorn and Ludwig, 1962]. From the
mechanism shown in Figure 4.2 this represents the equilibrium between state
II and state ill. Thus in a solution of pH 4, the ionic form of the acid is only
present in 1/10 of the concentration of the molecular form. This indicates that
diC3 DTC is indeed weakly ionised and the mechanism described above is
possible.
In the case where the liquid volume remains constant, but the concentration of
collector has been doubled, the extent of removal from solution is x, as for the
standard case. This gives:
=
and hence,
x. [DTC-]
2 -x
2 -x = Keq·-x
The initial rate of reaction is measured when x is small. For small x, the
concentration of [DC!] is double that for standard conditions.
This mechanism also holds for the case covered in section 6. 9 .1 where mineral
content is halved. . Thus it appears that this proposed mechanism very
adequately describes the observations made.
This proposed mechanism provides valuable insight into concentration or pulp
density effects on partially dissociated collectors. This work shows that the
degree to which dissociation can be achieved can strongly influence the rate of
144

6.10.
CHAPTER 6
adsorption of collector onto the mineral surface. Also shown is that, for well
mixed systems, increasing pulp density need not be as advantageous as might
be supposed. Especially where high pulp density causes mixing and transport
problems, it may even be advantageous to dilute the slurry.
Correlation between conditioning and flotation results
From the preliminary work with both the quartz-amine system and the pyrite-thiol
system, it was seen very clearly that a number of conditioning variables very strongly
affect the adsorption of collector onto the mineral surface and also the flotation
response of the mineral. However, this work also showed that in well mixed systems,
adsorption was extremely rapid. This resulted in adsorption going to completion during
flotation, in the case of the amine collector (section 4.5.2.3) HPYC.
The pyrite-thiol tests were the most successful in terms of being able to measure extent
of adsorption onto the mineral surface. Since all of the tests shown in Figure 4.11
were conditioned for 25 minutes, it is known that'adsorption reached completion. In
this case adsorption correlated very closely to flotation response. The correlation, i.Ip
to the optimum dosage, was approximately lin~.
Adsorption was chosen as the measure for conditioning efficiency. Thus, for this case,
it was found possible to correlate conditioning efficiency to flotation results. It is the
author's belief that this correlation would extend to all of the variables tested using
collector adsorption as a measure for conditioning efficiency. Unfortunately the rate
of the continued reaction prevents a test of this hypothesis. A much larger system may
provide the key to correlating collector adsorption to flotation results for all conditions.
Thus the final objective of this thesis, to relate conditioning effects to flotation, was
only partially achievable. It is proven above that adsorption studies correlate to
flotation results in all of the tests where conditioning during flotation was no longer
significant. In all other cases, the conditioning during flotation made comparison
meaningless. This is the problem that plagued Stassen as well. Further work using
industrial-scale equipment should be performed to provide this correlation between
flotation and conditioning efficiency measurements.
145

CHAPTER 6
6.11. Limitations of this Work
As with much experimental work, this study includes a number of assumptions and
simplifications. These limitations on the accuracy or portability of the study to full
scale should be understood. This will allow the experienced reader to know the limit
of the applicability of this work to other areas of conditioning. The following are the
major limitations of this work.
(a) Well mixed system - Conditioning vessels of the dimension used are,
by necessity, well mixed, since a high energy input is required to keep
the mineral particles in suspension. Scale-up of a conditioning vessel
usually centres around suspension of particles, but solid suspension in
large tanks requires far less power input per unit volume. Scale-up using
constant power input per unit volume is often difficult, since it requires
very large motors, which are expensive and inefficient. Hence large
conditioning tanks are usually poorly mixed.
The effect of this is that power input is far more important in large
conditioning vessels than it was shown to be in this work, as evidenced
by comparison with Stassen' s work. This might also have an effect on
the relative adsorption rates of various collectors, as diffusivity of the
collectors may play larger role, than for the small well mixed system.
(b) Low pulp density - The very. low pulp density of 1 % , necessary for
these tests owing to the shortage of available pyrite, contrasts sharply
with pulp densities of around 30% typically found in industry. The low
pulp density reduces the interactive effects of solids, as well as resulting
in different types of shear occurring. These interactive effects are most
commonly seen as viscosity effects.
One mitigating factor in favour of this low pulp density, is that the pyrite
content of the pulp is realistic when compared with that of typical pyrite
slurries. The pyrite content of slurries is usually in the region of 0.5 to
5 % of the solids content. Hence the pyrite content of these tests is
consistent with industrial separations.
146
CHAPTER6
( c) High pyrite grade - This system used almost pure pyrite, with the
result that interference by gangue mineral played no part in the
adsorption profiles achieved. While gangue mineral is believed not to
adsorb collector, it does reduce the surface area available on only
partially liberated pyrite particles. As mentioned above, gangue also
adds particle-particle interaction forces to the already complex system.
(d) Adsorption vs Floatability - The speed at which the adsorption reaction
occurred precluded the possibility of measuring the floatability of any
given extent of adsorption, unless the adsorption had reached completion,
This is because the small scale of the test work res4lted in a well mixed
system. It was necessary to assume that a given extent of adsorption
resulted in a fixed floatability, allowing comparison of effectiveness of
conditioning by analysing the extent of adsorption .
. This assumption need not be true, since collector can orientate differently
on the mineral surface, depending on the conditions of adsorption. Most
tests, however, were performed over a very limited range of conditions
and hence the adsorption pattern is expected to be similar for similar
extents of adsorption.
(e) Oxygen is freely available - It was not possible in these tests to limit
the availability of oxygen (though attempts were made to reduce oxygen
to rate limiting levels by Bradshaw [1994]). In an industrial application,
the liberation of mineral surface through crushing and grinding results in
oxygen removal as a result of oxidation of the new surfaces. Hence, the
system may be oxygen limiting. Most surface reactions of thiols cannot
occur in the absence of oxygen, which catalyses the electron transfer to
the pyrite surface. Therefore~ in oxygen limiting systems, re~ction rate
can be severely retarded.
This work does not attempt to provide definitive answers to the problem of effective·
conditioning. Rather, it attempts to uncover a number of the areas in which
conditioning plays an important role in altering the floatability of minerals. Thus the
results have been interpreted to be generally applicable. It is the opinion of the author
· that these limitations do not negate the general usefulness of the results. This is
especially true since most of the limitations above refer only to the relative dominance
147

CHAPTER6
of either diffusion or reaction control. Whereas, this work concentrates on the need
to understand which mechanism controls, and to capitalise on this.
148

CHAPTER 7 - CONCLUSIONS
This work set out to answer a number of questions on conditioning, with the following steps
to be undertaken to provide the answers:
(1) Clearly define conditioning.
(2) Determine a useful measure of conditioning efficiency.
(3) Evaluate the effect of conditioning variables on efficiency.
( 4) Determine the effect of these variables in flotation by correlating
conditioning and flotation results.
Of these stages only stage (4) could not be fully implemented. This was because the
limitations of high intensity mixing imposed by laboratory scale flotation systems precluded
any accurate correlation between conditioning and flotation. Below is a ·summary of the
results from the work done for each of these stages.
Conditioning had been previously only loosely defined in the flotation literature, with its
connotations varying from one minerals industry to another. This work identified two distinct
aspects of conditioning, namely:
Primary Conditioning- the physical preparation of the surface of the particles. This includes
comminution, oxidation, acid leaching and bacterial pretreatment.
Secondary Conditioning- the process whereby prepared particles are rendered hydrophobic
or hydrophilic through mixing, control of the environment and contacting with reagents.
This covered stage ( 1) of the work and made it possible to isolate the area to be studied. This was defined as:
The mixing of prepared particles with collector with the aim of achieving contact and
successfi.Jl attachment or adsorption of collector onto the desired mineral, thereby rendering
the surfa.ce hydrophobic fiJr flotation.
149

CONCLUSIONS
Analysis of the literature on previous work on conditioning gave important insight into the
problems of measuring conditioning effects - especially in the area of separating flotation
results from conditioning results. The work of Stassen [1990] was especially useful, in that
it attempted to answer many of the questions posed by this work. The tool finally chosen to
measure conditioning efficiency was extent of adsorption. A pyrite-thiol system was chosen
as the best practical system for test work, after unsuccessful attempt to use a quartz-amine system.
Thus stage (2) was successfully completed, paving the way for stage (3), where the effect of
variables of conditioning on conditioning efficiency were to be studied. First, though the
important variables needed to be identified. Literature on previous work and heterogeneous
stirred tank reactor theory suggested that the conditioning variables should include (tested
variables are given in italics):
ORE:
COLLECTOR:
SYSTEM:
Mineral type and degree of liberation
Grind size, affecting such features as s/v ratio
Pulp density
Type, including solubility, polarity and molecule size
Dosage
Attachment mechanism
pH
Time
Mixing (power and turbulence)
Method of agitation (turbulence distribution)
Temperature
Ionic Strength
Microflotation was chosen as the best system to use for correlation of flotation effects to
conditioning effects. This was for the dual reasons that the froth phase is eliminated in
microflotation, reducing masking of effects, and the intensity of conditioning can be limited
to that required for suspension of the particles, since bubbles are produced by the sintered
glass filter. The fact that the microflotation cell uses very small mineral samples was
considered a bonus, since sample availability was extremely limited. Microflotation was also
used to test the calculated doses to be used for the adsorption tests and to find a 'good' collector dosage.
150

CONCLUSIONS
The results of the adsorption tests on the above conditioning variables, as discussed fully in
the previous chapter, must be seen in the light of data available in Jiterature and reaction
theory to' be best utilised. The exact values themselves are meaningless, in that every system
in flotation is unique and no result can be directly applied to another situatipn, even m
scaling.
The results did show that conditioning can be explained in terms of heterogenous stirred tank
reactions. As a result, conditioning effects can be predicted provided enough is known about
the reaction occurring. While the actual importance of each variable is specific to the
application and conditions used, they are all·explained in terms of the adsorption of co11ector
onto the mineral surface. Hence, the relative importance of diffusion and of the reaction, in
controlling adsorption rate, determines the variables to be considered when optimising
conditioning. Understanding the reaction mechanisms taking place between collector and
mineral is a vital tool in understanding the. expected effects of changing variables of
conditioning.
Also considered were the industrial implications of the effects of variables on conditioning
in an attempt to determine the optimum parameters for each variable. What was found is that
with all variables, there is a trade-off between improved conditioning and increased costs.
Use of a costing function appears to be the best method of optimising conditioning in
industrial applications.
Some mention should be made of the variables found to have consistently the greatest effect
on conditioning results:
1) Effect of Collector TJpe - It was shown that different collectors adsorb onto the
mineral surface at different rates. Also they may have different equilibrium levels of
adsorption. How this affects collector choice depends on the kinetics of the system and
the extent of conditioning provided.
2) Effect of Duration and Power of Conditioning - In the conditioning process, the
duration and power input into conditioning, were found to be the most important
mechanical variables affecting adsorption. Previous work [Stassen 1990] suggested that
energy input was of primary importance. This work, however, shows both theoretically
and experimentally that this is not the case. Rather, the manner in which the energy
is added, either through duration or power, is more crucial and depends largely on
whether the system is diffusion rate controlled or surface reaction rate controlled.
151

CONCLUSIONS
Industrially, there is a trade-off between volume requirements to provide conditioning
time, power consumption for turbulence and the improvement in flotation results. The
optimal energy input for a plant could be calculated using a costing function.
3) Effect of Collector Dosage - Collector concentration was consistently shown to affect
conditioning and flotation to a great extent. In both the quartz-amine and the pyrite
thiol systems flotation was linearly affected by collector dosage up to the level of
optimum adsorption, beyond which the benefits were reduced markedly. It was also
noted that overdosing with collector, in the case of thiols, gave rapid gains in the speed
at which optimum adsorption was achieved. This concept of a trade-off between dosage
and time is important in the industrial environment, where once again cost is the
deciding factor.
The final test work produced some results which were contrary to predictions from literature.
The most significant contradictions were:
1) Best flotation occurs at adsorption levels below or close to mono-layer coverage.
For the quartz-amine system, this was shown to be the case, but for pyrite-thiol
systems, the optimum dosage was as much as 30 times that required for mono-layer
adsorption. It was hypothesised that the collector tends to accumulate in multi-layers
on more active sites, with a larger dosage being required to ensure a substantial
coverage of the surface area.
2) Adsorption ofthiols onto pyrite is diRUsion controlling. For the test system used in
this work it was shown that diffusion had only a very limited effect on the adsorption
of the thiols onto the pyrite surface. The evidence pointed very strongly to an
adsorption controlling mechanism. The tests analysing the time and power variables
of conditioning showed that changes in turbulence and hence diffusion potential had
almost no effect on adsorption, while time was seen to be very important, indicating
that reaction rate rather than diffusion was limiting. The apparent contradiction with
literature is possibly explained by the small scale of the test work done. Large-scale
systems are typically poorly mixed and hence diffusion is not sufficiently aided by the
system turbulence. These are therefore diffusion controlled. The small scale of this
work meant that the system was very well mixed and diffusion requirements were
reduced, to the extent that the surface reaction became the rate limiting step.
152

CONCLUSIONS
3) Conditioning efliciency is a direct JUnction of ENERGY input into the system. This
work refutes this postulate and shows that the two components of energy, time and
power, each have different extents of influence on conditioning efficiency. The same
energy can be added to the system as different combinations of time and power which
yield vastly different results. Hence energy input is not a variable of conditioning, but
its components, time and power, are. In Stassen's test system, changes in power were
more critical to conditioning efficiency than were changes in time. In this work it was
found that power changes had almost no influence on the collector adsorption, but that
time was a very impo~t variable affecting collector efficiency. This is because
conditioning is a heterogeneous reaction, and as such, efficiency is affected by diffusion
mechanisms or by surface reaction mechanisms to greater or lesser degrees depending
on the system. Either mechanism may be controlling, in which case either turbulence
. or reaction time would be the important factor affecting adsorption and hence
conditioning efficiency.
4) Increased pulp density increases the eiJiciency of conditioning. Increasing pulp
density usually increases the driving force of the adsorption reactions and hence the rate
of the reaction. In this work, while reaction rates were increased by increasing
collector doses, increased pulp density yielded no change to the adsorption of dipropyl
dithiocarbamate onto pyrite. This led to further investigation and the development of
a reaction mechanism for diC3 DTC, which in,cluded a partial ionisation of molecular
DiC3 DTC to the reactive ionic form, which very adequately explains the results seen.
The conclusion here was that it is important to understand the reaction mechanisms of
the collector. In this was predictions can be made as to the effect of a change in any
variable.
This work answers some questions on conditioning, dispels some myths, restates old questions
and raises many new questions about the subprocess of conditioning to be studied on the path
to a clear understanding of the processes of flotation.
153

REFERENCES
REFERENCES
1. Ahmed N. and Jameson G.J., "The Effect of Bubble Size on the Rate of Flotation of
Fine Particles", International Journal of Mineral Processing, vol 14, pp 195-215, 1985
2. Anderson G. V.M., "The Role of Hydrocarbon Oils in Coal Flotation: An Investigation
into Some Pulp Phase Sub-Processes.", thesis for PhD. in Engineering, University of
Cape Town, South Africa, June 1988
3. Austin R.A. and Henwood D.V., "An Evaluation of Formal Experimental Design
Procedures for Flotation Test Work", Honours Dissertation, University of Cape Town,
1991
4. Bhaskar R. and Forsling G. W., "Adsorption mechanism of Diethyl Dithiocarbamate on
Covelite, Cuprite and Tenorite", Colloids and Surf., vol 60, pp 53-69, 1991
5. Blake P. and Ralston J., "Particle Size, Surface Coverage and Flotation Response",
Colloids and Surfaces, vol. 16, pp 41-53, 1985
6. Bogdanov O.S.; et al, "Hydrophobic-making Properties of Ionic and Molecular
Collectors in Flotation", from proceedings of 9th International Mineral Processing
Conference, Czechoslovakia, 1970, pp 148-155
7. Bradshaw D.J., O'Connor C.T., "A study of the Pyrite Flotation Efficiency of
Dithiocarbamates using Factorial Design Techniques", Min. Eng., vol 5, no. 3-5, pp
317-329, 1992
8. Bradshaw D.J., Research Official for Carbochem at the University of Cape Town,
South Africa, personal correspondence, 1994
9. Bulatovic S.M. and Salter R.S., "High-Intensity Conditioning - a New Approach to
Improving Flotation of Mineral Slimes", Proc. Int. Conf. on Processing of Complex
Ores, 28th Annual Conf. Canad. Inst. Metall., Halifax, Nova Scotia, 20-24 August
1991
154

REFERENCES
10. Crawford R. and Ralston J., "The influence of Particle Size and Contact Angle in
Mineral Flotation", International Journal of Mineral Processing, vol. 23, pp 1-24, 1988
11. Crozier R.D., "Flotation Theory, Reagents and Ore Testing", Pergammon Press, 1992
12. Cutter L.A., "Flow and Turbulence in a Stirred Tank", A.I.Ch.E. Journal, vol 12, no.
1, pp 35-44, January 1966
13. Djendova S. and Mehandjiski V., "Study of the effects of acoustic vibration
conditioning of collector and frother on flotation of sulphide ore", International Journal
of Mineral Processing, vol. 34, pp 205-217, 1992
14. Dobby G.S. and Finch J.A., Int. J. Min Proc., 21, 241, 1987
15. Duchen R.B., "The Conditioning of No. 7 Shaft Flotation", Report HGM/74, Anglo
V aal Research Laboratory, 5 May l 980a
16. Duchen R.B., "The Flotation of Gold, Uranium and Pyrite from Hartebeesfontein (2
and 7 Shaft Ores) Mine Ores Varying the Speed of Agitation During the Conditioning
Stage", Report HGM 89, Anglo Vaal Research Laboratory, 8 December 1980b
17. Duch en R. B., "The Effects of Very Long Conditioning at 7 Shaft Plant,
Hartebeesfontein Gold Mine", Report HGM 107, Anglo V aal Research Laboratory, 11
October 1982
18. Eigeles M.A., and Volova M.L., "Kinetic Investigation of Effects of Contact Time,
Temperature and Surface Condition on the Adhesion of Bubbles to Mineral Surfaces",
5th International Mineral Processing Congress, Inst. Min Met., London, pp 271-284,
1960
19. Ewers W.E., "A retrospective view of flotation", from Principles of Mineral Flotation,
The Wark Symposium, 1984
20. Giles C.H, et al, "Studies in Adsorption. Part XI. A system of Classification of
Solution Adsorption Isotherms, and its Use in Diagnosis of Adsorption Mechanisms and
in Measurement of Specific Surface Areas of Solids.", Chem. Soc. Journal, part 3, pp
3973-3992, 1960.
155
REFERENCES
21. Harris C. C., "Multiphase models of flotation machine behaviour", International Journal
of Mineral Processing, vol. 5, 107-129, 1978
22. Harris P.J. and Finkelstein N.P., "The interaction of Pyrite, Oxygen and Xanthate",
Mintek Report No 1854, 1977
23. Harris P.J., Deputy Director, Mineral and Process Chemistry Division, MINTEK,
personal communication, 1993
24. Heyes G. W. and Trahar W.J., "The natural flotability of chalcopyrite", International
Journal of Mineral Processing, vol. 4, pp 317-344, 1977
25. Hickey T.J., "Developments in Flotation", The Chemical Engineer, pp 420-423,
November 1982
26. Huang H.H. and Miller J.D., "Kinetics and Thermochemistry of Amyl Xanthate
Adsorption by Pyrite and Macasite", Int. J. Mineral Process., vol 5, pp 241-266, 1978
27. Jameson G.J. and Ralston J., "High Intensity Conditioning for Flotation", Research
proposal to Australian Mineral Industry Research Association Ltd, May 1992
28. Janusz W. and Szymula M., Szczypz J., "Flotation of synthetic zinc carbonate using
potassium ethylxanthate", International Journal of Mineral Processing, vol. 11, pp 79-
88, 1983
29. Jordan C.E. and Spears D.R., "Evaluation of a turbulent flow model for fine-bubble
and fine-particle flotation", Minerals and Metallurgical Processing, pp 65-73, May 1990
30. Kelly E.G. and Spottiswood D.J., "Introduction to Mineral Processing", Wiley, New
York, 1982
31. King R., "Principles of Flotation", SAIMM, (DS 622.752 PRIN), 1982
32. Kirchberg H. and Topfer E., "The Mineralisation of Air Bubbles in Flotation", Proc.
7th Int. Min. Proc. Congress, N.A. Arbiter (ed.), Gordon and Breach, New York, pp
157-168, 1964
156

REFERENCES
33. Klimpel R. and Hansen R., Meyer W., "The Engineering Characterization of Flotation
Reagent Behaviour in Sulphide Ore Flotation", from proceedings of XIV International
Mineral Processing Congress, Canada, 1982, pp IVJ7.1 - IV17.14
34. Klimpel R.R. and Hansen R.D., Fee B.S., "Recent Advances in New Frother and
Collector Chemistry for Sulphide Mineral Flotation", XVI International Journal of
Mineral Processing Congress, Stockholm, June, 1988
35. Klimpel R.R., "Use of Chemical Reagents in Flotation", Chemical Engineering,
September 3, pp 75-79, 1984
36. Laskowski J., "The Relationship Between Flotability and Hydrophobicity", Advances
in Mineral Processing, Chapter 11, pp 189-208,
37. Laskowski J., "Thermodynamic and Kinetic Flotation Criteria", Mineral Processing and
Extractive Metallurgy Review, vol. 5, pp. 25-41, 1989
38. Laskowski J., "Overview of Flotation", Seminar at University of Stellenbosch, 30
August 1993
39. Leja J. and Schulman J .H., "Flotation Theory: Molecular Interactions Between Frothers
and Collectors at Solid-Liquid-Air Interfaces", Trans. AIME, Mining Engineering, 221-
228, Feb 1954
40. Liimatainen V., "Conditioning and Flotation of Ilmenite at Various Pulp
Temperatures", Institute of Min. & Met. Traus., vol 86, pp C160-C161, 1977
41. Mangalam V., Khangaonkar P.R., "Zeta-potential and Adsorption Studies of the
Chalcopyrite-Sodium Die thy 1 Dithiocarbamate System", International Journal of Mineral
Processing, vol. 15, pp 269-280, 1985
42. Mellgren 0., "Heat of Adsorption and Surface Reactions of Potassium
Die thy ldithiocarbamate on Galena", Institute of Mining and Metallurgy, C65-C7 l, 10
June 1968
157

REFERENCES
43. Natarajan R. and Fuerstenau D. W., "Adsorption and Flotation Behaviour of Manganese
Dioxide in the Presence of Octyl Hydroxymate", International Journal of Mineral
Processing, vol. 11, pp 139-153, 1983
44. Oldshue J. Y., "Fluid Mixing Technology", McGraw-Hill, New York, 1983
45. Partridge A.C. and Smith G.W.; "Small Sample Flotation Testing", Institute of Min.
Metall. Trans., section c, vol. 80, page C199, September 1981
46. Pope M.1. and Sutton D.I., "Collector Adsorption During Froth Flotation", Powder
Technology, vol. 5, pp 101-104, 1971/72
47. Prabhakar S. and Khangaonkar P.R., "Flotation and Adsorption Studies od
Chalcopyrite with Cupferron", International Journal of Mineral Processing, vol. 9, pp
87-95, 1982
48. Ralston J., "Bi, and its consequences m sulphide mineral flotation", Minerals
Engineering, vol 4, pp 859-878, 1991
49. Raju G.B. and Forsling W., "Adsorption mechanism of diethyldithiocarbamate on
covellite, cuprite and tenorite", Colloids and Surfaces, vol 60, pp 53-69, 1991
50. Rubio J., "Conditioning effects on Flotation of Finely Divided Non-:-Sulphide Copper
. Ore", Trans. Inst. Min. Metal!., London, 87, C284-C287, 1978
51. Shouci Lu and Shaoxian Song, "Hydrophobic interaction in flocculation and flotation,
1. Hydrophobic flocculation of fine mineral particles in aqueous solution", Colloids and
Surfaces, vol 57, pp 49-60, 1991
52. Smith J.M. and Van Ness H.C., "Introduction to Chemical Engineering
Thermodynamics", 4th ed., Mc Graw-Hill, 1987
53. Stassen F.J.N., "Conditioning in the flotation of gold, uranium oxide, and pyrite",
Journal of S. Afr. Inst. Min. Metall., vol 91, no. 5, pp 169-174, May 1991a
54. Stassen F.J.N., "Conditioning for floultion of gold, uranium oxide, and pyrite", S. Afr.
Journal of Chemical Engineering, vol 3, no. 1, pp 1-20, 1991b
158

REFERENCES
55. Stassen F.J.N., "Conditioning for flotation of gold, uranium oxide, and pyrite", Thesis
for M.Eng, University of Pretoria, South Africa, May 1990
56. Stonestreet P., "Reverse Flotation: A Novel Process for the Benification of Fine Coal",
thesis for PhD. in Engineering, University of Cape Town, South Africa, August 1991
57. Subrahmanyam T.V. and Forssberg K.S.E., "Fine Particles Processing: Shear
Flocculation and Carrier Flotation - a Review", International Journal of Mineral
Processing, vol 30, pp 265-286, 1990
58. Thom G.D. and Ludwig, R.A., "The Dithiocarbamate and Related Compounds",
Elsivier Publishers, 1962, Ch 3, pp 43-73
59. Von Holt S.T., "An Investigation into Column Flotation of Soth African Coals", thesis
for M.Eng., University of Cape Town, South Africa, April 1992
60. Wark l.W. and Sutherland K.L., "Principles of Flotation", Australasian Institute of
Mining and Metallury, 1955
61. Wills-B.A., "Mineral Processing Technology", 4th ed., Pergammon Press, 1988
62. Yehia a. and Miller J.D., Ateya B.G., "Analysis of the adsorption behaviour of oleate
on some synthetic apatites", Minerals Engineering, vol 6, no 1, pp 79-86, 1993
159

APPENDICES
APPENDIX A. - Derivation of Expression for R in
Stassen' s Equations
Al

APPENDICES
Stassen [1990] provides the following derivation for the term R in his equations (italics
represent quotation from Stassen's thesis):
Assume R is proportional to the extent to which the surfaces of mineral particles are
coated with collector. This is in accordance with the findings of investigators who
found that the recovery of valuable mineral during flotation is proportional to the
amount of collector in the flotation concentrate, the surfa.ce area of the floated mineral
particles or the extent to which the surfa.ces of mineral particles are coated with
collector. Less than a complete monolayer of collector is sufficient for flotation with
x.anthates and many other collectors.
Thus
.R oc'l:'A
so that
Further if R ~ r as t ~ ~ 0 and R ~ 1?1'8 x as t c ~ 00' then
or
which is of the same form as the expression developed for the Klimpel flotation rate
constant, k.
A2

APPENDICES
APPENDIX B. -- Stassen' s Experimental Data
A3

APPENDICES
The following data were obtained by Stassen (1990] and used in his thesis to calculate the
regression coefficients in his model. These data are taken directly from Appendix A4 of
Stassen' s thesis. The present thesis re-analyzes these data to determine if any additional
information may be obtained from them. The results of this re-analysis can be found in
Chapter 3.
No. D/Dt N le p E Au U308 s (RPM) (min) (W) . kWh/t R k R k R k
A.I 0.33 800 18 42.1 1.26 94.12 7.21 41.32 2.42 91.93 4.91
A.2 0.33 900 18 60 1.8 95.06 7.8 43.33 2.72 93.78 5.02
A.3 0.33 1000 18 82.3 2.47 95.34 9.87 43.8 2.86 95.75 7.06
A.4 0.33 1100 18 109.5 3.28 96.04 7.83 45.16 2.85 95.19 6.94
A.5 0.33 700 18 28.2 0.85 94.04 6.01 42.39 2.27 91.29 3.82
A.6 0.33 600 18 ll7.8 0.53 95.02 4.58 41.51 1.71 92.13 2A
A.7 0.25 1000 18 19.5 0.59 94.68 5.02 40.86 1.8 94.3 ·2.24
A.8 0.25 llOO 18 26 0.78 96.83 3.75 42.78 1.59 95.34 2.32
A.9 0.25 900 18 14.2 0.43 94.01 4 40.89 1.5 93.54 1.95
A.10 0.25 800 18 IO 0.3 94.75 4.69 39.17 1.56 91.35 l.7
A.ll 0.25 700 18 6.7 0.2 95.78 3.41 41.43 1.05 94.78 1.18
A.12 0.4 500 18 25.6 0.77 94.98 5.29 36.85 1.51 92.85 2.85
A.13 0.4 700 18 70.2 2.11 95.13 7.42 42.93 2.55 95.49 5.52
A.14 0.4 800 18 IQ.:1.8 3.14 96.52 6.47 46.45 2.57 96.04 6.22
A.15 0.4 900 18 149.2 4.48 95.19 9.24 46.14 3.54 95.29 8.92
A.16 0.4 1000 18 204.7 6.14 96.67 10.36 45.84 3.14 96 9.38
A.17 0.4 llOO 18 272.4 8.17 98.64 5.8 47.23 2.67 97.67 6.68
A.18 0.5 1100 18 831.4 24.94 98.06 7.31 48.22 3.09 98.31 7.22
A.19 0.5 1000 18 624.6 18.74 97.23 11.08 46.8 3.3 97.34 9.38
A.20 0.5 900 18 455.4 13.66 97.15 10.15 47.75 3.33 96.52 9.03
A.21 0.5 800 18 319.8 9.59 96.62 10.19 45.99 3.24 93.98 7.61
A.22 0.5 700 18 214.3 6.43 95.59 10.1 45.95 3.05 93.87 7.48
A.23 0.5 600 18 134.9 4.05 94.99 7.97 44.26 2.97 93.57 6.07
A.24 0.5 500 18 78.1 2.34 I !l:>.03 7.46 42.46 2.82 89;76 4.95
A.25 0.5 500 36 78.1 4.68 96.17 5.65 46.27 2.53 94.8 4.96
A.26 0.5 . 500 9 78.1 1.17 94.48 7.76 . 41.58 2.29 90.06 3.67
A.27 0.5 500 72 78.1 9.37 95.59 7.12 43.85 2.53 95.11 7.27
A.28 0.5 500 4.5 78.1 0.59 94.15 5.71 41.36 2.23 87.52 1.95
A.29 0.5 700 9 214.3 3.21 95.12 8.22 43.8 2.82 97.95 4.96
A.30 0.5 700 72 214.3 25.71 97.74 9.83 48.58 2.9 97.5 10.42
A.31 0.5 700 4.5 214.3 1.61 95.46 8.73 42.16 2.68 94.17 3.53
A.32 0.5 700 36 214.3 12.86 97.03 7.54 47.22 2.8 97.33 7.72
A.33 . 0.5 900 9 455.4 6.83 97.1 12.42 46.59 3.37 95.91 7.95
A.34 0.5 900 72 455.4 54.64 98.61 6.09 48.4 2.09 98.2 7.34
A.35 0.5 900 4.5 455.4 3.42 94.91 9.15 41.88 2.82 92.98 3.24
A4

APPENDICES
No. D/Dt N tc p E. Au U308 s (RPM) (min) (W) kWh/L R k R k R k
A.36 0.5 900 36 455.4 27.32 98.18 6.8 47.8 2.83 97.78 8.32
A.37 0.5 1100 9 831.4 12.47 ' 97.49 9.79 46.23 3.32 97.09 9.12
A.38 0.5 1100 36 831.4 49.88 97.26 9.3 48.54 2.82 98.16 10.64
A.39 0.5 1100 4.5 831.4 6.24 96.67 8.91 45.03 2.93 97.79 6.19
A.40 0.5 1100 72 831.4 99.77 97.3 5.03 46.2 1.92 96.56 7.01
A.41 0.33 400 18 5.3 0.16 92.11 4.27 36.2 0.96 92.72 1.2
A.42 0.4 400 18 13.1 0.39 93.47 4.75 41.17 1.75 93.15 2.18
A.43 0.4 300 18 5.5 0.17 92.89 4.45 39.86 1.49 94.14 1.35
A.44 0.5 300 18 16.9 0.51 93.3 4.44 39.92 1.87 91.05 1.88
A.45 0.5 400 18 I 40 1.2 93.47 7.09 41.27 2.68 91.87 3.6
A.46 0.4 1100 9 272.4 4.09 96.25 10.5 46.39 3 .. 3 95.99 8.44
A.47 0.4 300 72 5.5 0.66 94.03 2.69 41.23 1.08 92.31 1.98
A.48 0.33 300 72 2.2 0.27 93.8 2.55 38.46 0.73 94.45 1.44
A.49 0.4 1100 4.5 272.4 2.04 94.3 6.96 41.02 2.53 93.66 4.04
A.50 0.4 1100 72 272.4 32.69 97.21 7.87 49.16 2.67 97.48 10.01
A.51 0.4 1100 36 272.4 16.35 96.79 7.44 43.85 2.35 97.41 7.85
A.52 0.4 900 72 149.2 17.91 97.29 7.02 45.47 2.93 97.38 7.36
A.53 0.4 900 4.5 149.2 1.12 95.75 7.01 43.44 2.47 94.34 3.13
A.54 0.4 900 36 149.2 8.95 96.34 10.66 44.99 3.22 96.94 9.57
A.55 0.4 900 9 149.2 2.24 94.97 7.34 41.6 2.56 93.73 4.32
A.56 0.4 700 72 70.2 8.42 96.6 6.47 45.08 2.37 96.39 6.38
A.57 0.4 700 4.5 70.2 0.53 93.5 5.24 40.72 1.97 93.61 1.67
A.58 0.4 500 72 25.6 3.07 95.3 5.31 44.62 2.11 95.13 4.9
A.59 0.4 500 9 25.6 0.38 93.82 5.16 39.47 2.09 91.4 1.68
A.60 0.4 500 4.5 25.6 0.19 94.72 4.39 40.59 1.66 92.56 0.92
A.61 0.4 500 36 25.6 1.54 94.51 5.06 40.19 1.78 93.51 3.38
A.62 0.4 700 36 70.2 4.21 97.05 6.25 45.26 2.36 95.4 5.88
A.63 0.4 700 9 70.2 1.05 96.64 4.98 39.89 2.21 91.18 2.57
A.64 0.4 700 9 70.2 1.05 94.98 6.95 42.87 2.73 92.78 3.89 /
A.65 0.4 600 18 44.2 1.33 94 7.16 42.4 2.4 93.28 3.84
A.66 0.4 500 18 25.6 0.77 94.13 6.43 42.09 2.32 91.85 2.89
A.67 0.5 500 18 78.1 2.34 95.21 8.9 43.11 2.94 94.69 5
A.68 0.5 700 4.5' 214.3 1.61 94.86 7.52 42.25 2.51 93.72 2.97
A.69 0.5 900 4.5 455.4 3.42 96.65 9.7 43.42 3.15 95.93 5.2
A.70 0.33 500 18 10.3 0.31 92.85 5.08 38.75 1.56 90.53 2.25
A.71 0.5 300 72 16.9 2.02 96.73 4.85 41.4 1.87 94.74 3.82
A.72 0.5 300 36 16.9 1.01 93.45 5.43 40.42 1.92 90.98 2.92
A.73 0.25 700 18 6.7 0.2 93.83 4.5 40.42 1.76 92.78 1.48
A.74 0.4 1100 36 272.4 16.35 97.22 11.01 44.3 3.06 97.51 10.65
A5

APPENDICES
APPENDIX C. - Surface Area Calculations
A6

APPENDICES
Calculations of particle surface areas was necessary to determine the collector dosage required
for mono-layer coverage of the quartz and pyrite minerals used. Particle surface area was
calculated for cubic and for spherical particles. Below are the derivations of formulae for
surface area per gram of particles for cubic and spherical particles:
CALCULATIONS FOR CUBIC PARTICLES
Total surface area (TS) - L all particle surfaces
TS/gram particles = (no. particles/gram) x (surface area of each particle)
surface area of each particle - 6x H x H
no. particles/gram - l/(mass of each particle)
mass of each particle - density x volume - pxHxHxH
no. particles/gram = 11 (p x H x H x H)
TS/gram = (l/(p x H x H x H)) x (6 x H x H)
TS/gram - 6/(p x H)
CALCULATIONS FOR SPHERICAL PARTICLES
The same logic as above applies except that:
surface area of each particle = 4 II (Diameter/2)2
- 4/3 Il(D/2)2 volume of each particle
Therefore,
TS/gram
TS/gram
= (l/(density x 4/3 Il(D/2)3)) x (4 II (D/2)2
)
= 6/(p x D)
A7

APPENDICES
APPENDIX D. - Quartz-Amine Microflotation Test Data
A8

Run N
o. S
ample
l'llper G
mis
Neu
l'B
per G
mis
Nett
Mas•
Weight
Recovcty
Recovety
Loss
Loss Loss
Al
1.5 0.9
5.88 4.98
0.9 1.16
A2
7.5
0.9
4.87 3.97
0.91 1.91
Al
7.5 0.91
7.21 6.3
0.92 !.07
. A4
1.5
0.94 2.71
1.77 0.87
0.91
AS 7.5
0.94 6.14
5.2
0.94
0.98
A6
1.5 0.91
S.3S 4,44
0.94 1.01
A7
1.5 0.94
5.86 4.\12
0.91 1.03
AS
1.5 0.94
6.41 5.47
0.9 0.\12
Bl
1.5 1.027
6.629 5
.()()2
l.O:l!i
1.166
B2
7.5 0.917
6,248 5.331
0.989 l.152
B3
1.5 0.959
5.523 4.564
0.998 1.058
B4
1.5 1.032
5.ro6 4.514
0.964 1.127
BS 7
.5
0.926 5.llm
4.881
l.007 1.074
B6
7.5
0.952
6.548 S.596
0.997 1.083
B7
1.5 0.935
5.55 4.615
0.'11 l.l
BS
1.5 0.97
6.01 5.04
0.99 ·1.08
B9
1.5 0.98
6.51 5.59
0.95 1.03
BIO
1.5
o.'11 5.74
4.T
I 0.98
1.07
Bil
1.S I
5.91 4.91
1.01 I.I
Bl2
1.5
0.92 5.84
4.92 LO
I 1.09
Bl3
7.5 0.96
5.6.'i 4.69
I.OJ
1.08
814 1.5
0.95 S.51
4.56 0.96
1.03
BIS
1.5 0.91
5.31 4.4
0.98 !.0
3
B16
1.5 0.91
6.05 5.14
0.92 0.98
Bl7
1.5 0.97
4.98 4.01
0.99 I
BIS
1.S 0.94
4.32 3.38
0.92 J.0
6
Bl9
7.5
0.94 4.35
3.41 1.03
l.16
82
0
1.5 0.95
4.41 3.46
0.98 l.1
2
B2I
1.5 0.'11
4.01 3.04
I.02 I.I
82
2
7,5 0.92
4.2 3.28
0.95 I.IS
823 7.5
l 4.53
3.53 0.99
1.13
024 1.S
0.96 4.2
3.24 0.95
1.13
825 1.5
0.94 5.03
4.09 0.98
l.28
82
6
1,5 I
6.78 5.78
I J.27
827 7.5
0.96 6.73
5.77 0.95
J.23
828 1.S
0.99 6.8
5.81 1.03
1.16
B29
1.5 0.97
3.58 2.61
0.96 1.01
BJO
1.5
0.91 2.76
1.85 0.89
0.117
AP
PE
ND
ICE
S
Co
rr.Frac
Liquid
Cdlector
Con
dition
i lm
pellor
ng
R<:cavorod
Vo
lum
e
Dosage(m
l) T
ime (m
in) s
pc c
d
(ml)
(ipm
)
0.260 0.688
150 3
2 500
1.000 0.611
150 3
2 500
0.150 0.857
150 6
2 500
0.040 0.237
150 l.S
2 500
0.040 0.{ff7
150 3
o.s 500
0.070 0.598
150 3
2 500
0.120 0.667
150 3
2 500
0.020 0.731
150 3
2 500
0.131 0.760
150 3
2 500
0.163 0.7'1:1
150 3
2 500
0.060 0.613
150 3
2 500
0.163 0.623
150 3
2 500
0.067 0.657
150 3
2 500
0.086 0.755
150 3
2 500
0.130 0.626
!SO
3 2
500
0.090 0.680
150 3
2 500
0.080 0.153
150 3
2 500
0.090 0.644
150 3
2 500
0.090 0.663
ISO
3 2
500
0.080 0.663
ISO
3 2
500
0.070 0.631
150 3
2 500
0.070 0.614
ISO
3 2
500
o.oso 0.591
ISO
3 2
500
O.M
l 0.691
ISO
3 2
500
0.010 0.535
ISO
2 2
500
0.140 0.459
ISO
2 2
500
0.130 0.463
ISO
2 2
500
0.140 0.470
ISO
2 2
500
0.080 0.410
ISO
2 2
500
0.200 0.449
ISO
2 2
500
0.140 0.@
>
HO
2
2 500
0.180 0.443
uo 2
2 500
0.300 0.568
ISO
2 2
500
0.'1:10 0.799
150 2
2 500
0.280 0.799
ISO
2 2
500
0.130 0.788
ISO
2 2
500
0.050 0.350
ISO
2 2
500
0.080 0.249
ISO
2 2
500
A9
Air flaw
P
article
R •
I e
s i
z O
lmln)
(mi"""1
)
con
sWll
+75-106
co
mta
nl
+1S-106
cons tan! +
1S-106
co
mta
nl
+75-106
<O
n!lta
nl
+75-106
O<l!lS
tanl +
15-106
CO
lllltan
l +
35-S3
con
stan
l +
10
6
con
stan
l +
75
-10
6
OO
DSliu:ll
+75-106
rtm!ita
ll! +
75-106
oo
nsW
l! +
75-106
con
stan
l +
7S-106
ron
sta
nl
+75-106
O.JS
+15·106
0.18 +
1S·I06
0.18 +
75-106
0.18 +
75-106
0.18 +
1S-106
0.18 +
75-106
0.18 +
75-106
0.18 +
1S·I06
0.18 +
1S-106
0.18 +
75-106
0.18 +
75-106
0.18 +
15-106
0.18 +
?S-106
0.18 +
7S
-l06
0.18 +
75-106
0.18 +
75-106
0.18 +
15-106
0.18 +
75-106
0.18 +
75
-10
6
0.18 +
35.53
0.18 +
35-53
0.18 +
35-53
0.18 +
10
6
0.18 +
10
6
Flotation
e T
ime (m
ln) 2 I l l I I I l I l l 1 I I I l l I l l 1 I I l I I I I 1 l I l I I I I I I
Mixed up oow
oolulion of HPY
C
Installed flow m
eter to improve consistency
Rotation su
ut w
as delayed
N""' scrup • 2m
1 HPY
C
Smaller C
onl.a..imr

Run N
o. S
imp
le P
•por °"""
Nett
Papor G
roso N
ett C
orr. Free
Maso
Weight
Reoow
:ry R
<=
vcry L
aio Loss
Uioo
Recovered
Cl
10 0.64
2.39 1.75
0.66 0.69
0.030 0.176
C2
10 0.63
2.58 l.95
0.63 0.65
0.020 0.195
C3
10 0.67
4.55 3.88
0.63 0.65
0.020 0.389
C4
JO
0.65 4.22
3.57 0.68
0.73 0.050
0.359
cs 10
0.68 ~.36
4.68 0.63
0.66 0.030
0.469
C6
10 0.68
4.56 3.88
0.78 0.8
0.020 0.389
C7
10 0.63
3.96 3.33
0.63 0.68
0.050 0.335
C8
10 0.7
3.47 2.n
0.67 0.7
0.030 0.278
C9
10 0.62
3.85 3.23
0.63 0.65
0.020 0.324
CIO
10
0.68 4.24
3.56 0.69
0.72 0.030
0.357
Cl!
10 0.65
4.25 3.6
0.68 0.68
0.000 0.360
Cl2
10
0.68 4.55
3.8:7 0.64
0.63 -0.010
0.387
Cl3
10
0.68 5.05
4.37 0.63
0.6<1 0.010
0.437
Ci4
10
0.67 4.54
3.8:7 0.66
0.66 0.000
0.387
Cl5
10
0.61 4.61
4 0.67
0.69 0.020
0.401
C!6
10
0.64 6.46
5.82 0.64
0.65 0.010
0.583
CJ7
10 0.69
6.51 5.82
0.65 0.65
0.000 0.582
Cl8
10
0.63 5.91!
5.35 0.65
0.66 0.010
0.536
Cl9
10
0.65 5.81
5.16 0.68
0.7 0.020
0.517
C2
0
10 0.61
S.6 4.99
0.000 0.499
C2
l' .1
0
0.65 S.08
4.43 0.000
0.443
Dl
10 0.6<1
5.69 5.05
0.000 0.505
D2
10 0.68
S.63 4.95
0.000 0
.49
5
D3
10 0.63
5.75 5.12
0.000 0.512
04
10
0.66 5.78
5.12 0.000
0.512
05
10
0.62 5.84
5.22 0.000
0.522
D6
10 0.67
6.72 6.05
0.64 0.64
0.000 0.605
D7
10 0.68
5.74 5
.06
' 0.6
0.6! 0
.0!0
0.507
08
10
0.62 5.91!
5.36 0.64
0.64 0.000
0.536
D9
10 0.63
5.16 4.53
0.000 0.453
DIO
JO
0
.59
5.94
5.35 0.64
0.64 0.000
0.535
Dll
10 0.64
'6.9
1
6.']1 0.65
0.65 0.000
0.627
01
2
10 0
.6
7.(18 6.48
0.63 0.63
0.000 0.648
· APPE
ND
ICE
S
Liquid
Cd!e<:tor
Conditioni
Impeller
ng
Vo
lum
e
Dooage(m
l) T
im>
(min)
Sp
eed
(m
l) (rpm
)
2CIO 3
2 500
200 3
2 500
200 5
2 500
200 5
2 1000
200 5
0.5 1000
200 5
o.s 2000
200 5
0.5 500
2CIO 5
8 500
2CIO 5
2 500
2CIO 5
2 500
2CIO 5
2 500
200 5
2 500
200 5
2 500
200 5
2 500
200 5
2 500
200 5
·2 500
200 5
2 500
200 5
2 500
200 s
2 500
200 s
2 500
200 5
2 500
200 s
2 500
200 5
2 500
200 5
2 500
200 5
2 500
2CIO 5
2 500
200 5
0.7 500
200 5
5.65 500
200 5
0.25 500
200 5
2 500
200 5
2 500
200 5
2 500
200 5
2 500
AlO
AirA
ow
Particle
R •
I e
s i •
QI m
in)
(micron)
0.18 +7.5-106
0.18 +
?5·106
0.18 +
75-106
0.18 +
75-106
0.18 +
75-106
0.18 +
75-106
0.18 +
75-106
0.18 +
75-106
0.18 +
75-!0i'i
0.18 +
75-!0i'i
0.18 +75-lO
i'i
0.18 +
75-lOi'i
0.18 +
?S-106
0.18 +
75-!0i'i
0.18 +
75-!0i'i
0.18 +
75-!0i'i
0.18 +
75-10i5
0.18 +75-lO
i'i
0.18 +
75-!0i'i
0.18 +75-lO
i'i
0.18 +
75-!0i'i
0.18 +
75-106
0.18 +
75-!0i'i
0.18 +
?S-10i5
G.18
+75-!0i'i
0.18 +
75-!0i'i
0.18 +
75-106
0.18 +
75-106
0.\8
+
75-106
0.18 +
75-106
0.18 +
75-106
0.18 +
75-lOi'i
0.18 +
75-!0i'i
Rotation
" Tim
o (min) 2 2 2 2 2
2 2 2 2 2 2 2 2 2 2
2 2 2 2 2 2 2 2 2 2 2 2 2 2 2 2 2 2
C"""'"'°ts
Filter paper broke -
may l:e som
e loss
too 1I111Ch oondilioning by 15 oec
Saw
U\R
GE
flocx particles
Saw sm
aller flocc pa.rtid-os
Sew lu
ge flocc particles
Fixed an air leak
Refridgeroted H
PY
C
• tU... is l l :40 w
n (fu,s)
time 12pm
time 3
:15
pm
timc 4pm
Wed, 9 am
8:30 am Thurs
9 am T
hurs
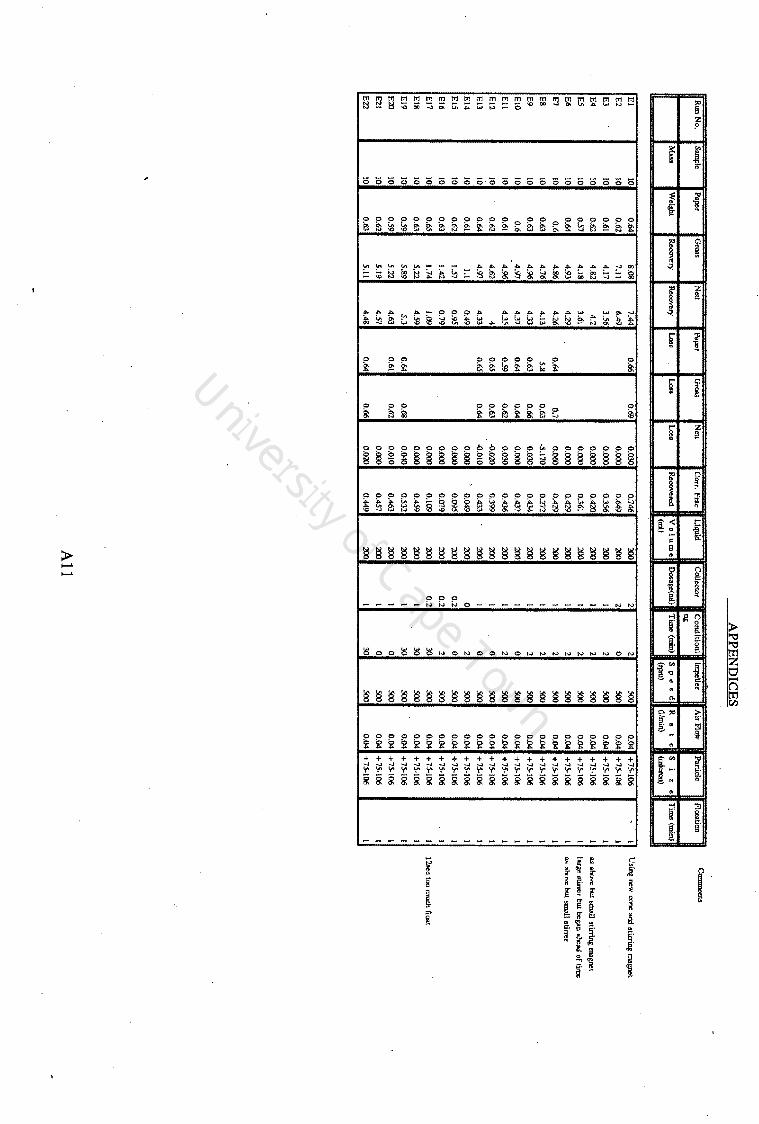
Run N
o, S
ample
Papor
Groos
Neu
l'apor G
roo• N
ett C
orr. Ftac
MllS!i
Weight
Recovery
Recovery
Loos Loos
Loe• R
eoovett:d
El
10 0.64
8,08 1.44
0.66 0
.69
0.030
0.740
E2
10
0.62 7.11
6.49 0.000
0.649
E3
JO
0.61 4.11
3.56 0.000
0.356
E4
10
0.62 4
.82
4
.2
0.000 0.420
E5
10 0.51
4.18 3.61
0.000 0.361
E6
10
0.64 4.93
4.29 0.000
0.429
E7
10
0.6
4.86
4.26 0.64
0.1 o.oro
0.429
ES
10
0.63 4
.76
4.13
5.8 0.63
-5.170 0.212
E9
10
0.63 4
.96
4.33
0.6
3
0.6
6
0.030 0.434
ElO
10
0.6
4.97
4.37 0.64
0.6
4
o.ooo 0.437
r
Ell
10 0.61
4.9
6
4.35 0.59
0.6
2
0.030 0.436
El2
1
0
0.62 4.62
4 0.65
0.6
3
-0.020 0.399
El3
10
0.6
4
4.97 4.33
0.65 0
.64
-0.010
0.433
El4
10
0.61 I.I
0.4
9
0.000 '
0.049
EIS
JO
0.62
1.S7
0.95 0.000
0.095
El6
JO
0,63 1.42
0.7
9
0.000 0.079
El7
10
0.65 1.74
1.09 0.000
0.109
El8
10
0.6
3
S.22
4.59 0.000
0.459
EJ9
10
0.59 S
.89 S
.3 0.64
0.68 0.040
0.532
E20
10 0.59
5.22 4.63
0.61 0.62
0.010 0.463
E21
10 0
.62
5.19
4.57 0.000
0.457
E2
2
JO 0.63
5.11 4.48
0.64 0.66
0.020 0.449
AP
PE
ND
ICE
S
Liquid
Collector
Con
dttion
i lm
poUcr
llll
Vo
lum
e
Dosagc(m
l) T
ime
(min)
Sp
ee
d
(ml)
(rpm)
200 2
2 500
200 2
0 500
200 I
2 500
200 1
2 500
200 I
2 500
200 l
2 500
200 l
2 500
200 l
2 500
200 1
2 500
200 1
0 500
200 I
2 500
200 I
0 500
200 I
0 500
200 0
2 500
20
0
0.2
0
500
200 0
.2
2 500
200 0
.2
30
500
200 I
30
500
200 1
30
500
200 l
0 500
200 1
0 500
200 1
30
500
All
Air F!Q
I>' P
article
R . I
e s
i z
Glm
in) (m
icron)
0.0
4
+15-1()6
0.0
4
+75-106
0.04 +
75
-10
6
0.04 +
75-106
0.04 +
15-106
0.04 +
75-106
0,04 +
15-106
0,04 +
75-106
0.04 +
15-106
0.04 +
75-106
0.0
4
+15-106
0.04 +
75
-10
6
0.04 +
7.S.106
0.04 +
75
-10
6
0.04 +
75
-10
6
0.04 +
75-106
0.0
4
+7.S
.106
0.04 +
15-106
0.0
4
+7
5-1
06
0.0
4
+7
5-1
06
0.04 +
75-106
0.0
4
+7.S
.106
Flotation
D
. Ti.mo (m
in)
. 1 I I J l 1 I l I I I I I l l I I I I 1 l 1
.. above but small stlrrin&
OIS;;n:>l
large eliner but beg1111 ahe>d of time
as abm-"C but sm
all st.im::r
l 2sec too mucli float

APPENDICES
APPENDIX E. - Pyrite-Thiol Microflotation Test Data
A12

Run N
o. Sam
ple P
al"'t G
ros• N
ett Poper
Gross
Neu
M .. ,
Woight
Rcoovcry
R.ooovery
Tailings
Tailiogo
Tailings
Fl
4 0
.63
0.94
0.31 0.63
4.2
6
3.630
F2 4
Oh
l 2.42
1.78 0.65
2.61 2.0W
F3 4
0.61 2.51
1.9 0.63
2.61 1.980
F4 4
0.6
6
2.06 1.4
0.61 3.05
2.440
F5 4
0.63 2.23
1.6 0.7
2.95 2.250
F6 4
0.7 2.71
2.01 0.61
2.44 1.830
F7 4
0.6S
2.38 1.73
0.6'i 2.73
2.080
FS 4
0.5
9
3.76 3.17
0.65 1.29
0.640
F9
4 0.69
3.19 2.5
0.5
9
1.95 1.360
FJO
4 0.58
3.79 3.21
0.6
9
1.28 0.590
AP
PE
ND
ICE
S
Fract.ian L
iquid C
ollector C
oodition
i lm
p:Uer
ng
Re~rcd
Vo
l\lme
Dooage(m
l) r,,,,. (m
lnl S
peed
(m
l) (rp
m)
0.Q78
400 0
0 .500
0.445 400
0 25
soo 0.415
400 0
25 soo
0.350 400
1.44 25
.500
0.400 400
2.88 25
soo 0.503
400 0.72
25 .500
0.433 400
0 25
.500
0.793 400
14.4 25
.500
0.625 400
7.2 25
.500
0.803 400
28.8 25
500
A13
AirA
ow
Particle
R . I •
s i •
Olm
iD)
(micron)
0.04 +
7S-106
0.04 +
75-106
0.04 +
75-106
0.0
4
+75-106
0.0
4
+75-106
0.04 +
75-106
0.04 +
75-106
0.0
4
+15·106
0.0
4
+75·106
0.0
4
+75-106
flotaticn
e T
ime (m
in) l l I I 1 I I I 1 I
Conl!ll0nl5
Pyrite at pH
7 no cordiuonini;
l Smin corditloning at pH
4 with buffer
R.opeat cf 2

APPENDICES
APPENDIX F. - Pyrite-Thiol Adsorption Test Data
A14

AP
PE
ND
ICE
S
The adsorption tests w
ere numbered according to w
hether they were perform
ed using PN
BX
or DT
C, w
ith the suffix P and D used respectively.
Much, of
this work w
as performed in collaboration w
ith DJ.B
radshaw, w
hose assistance is gratefully acknowledged.
TIM
E
Run IP
C
ollector (m
inutes) PN
BX
A
dsorption S
TD
Cond
(mols E
-6)
0 0.392
0 0.13
0.351 0.26
0.67 0.287
0.67 1
0.245 0.94
2.82 0.137
1.63 8
. 0.007 2.46
22.63 0.005
2.47
Sam
ple. T
IME
R
un
2P
Collec~or
Ru
n3
P
Collector
Ru
n4
P
Collector
Ru
n5
P
Collector
Ru
n6
P
Collector
(minutes)
PNB
X
Adsorption
PNB
X
Adsorption
PN
BX
A
dsorption PN
BX
A
dsorption P
NB
X
Adsorption
STD
Cond
(mols E
-6) ST
D C
ond (m
ols E-6)
Dos l/4std
(mols E
-6) D
os 10s (m
ols E-6)
lOO
Orpm
(m
ols E-6)
0 0
0.392 0
0.392 0
0.107 ,0
3.1
0 0.392
0.000 1
0.21 0.367
0.16 0.343
0.31 0.074
0.19 2.892
1.68 0.317
0.478 2
0.36 0.317
0.48 0.326
0.42 0.062
0.26 2.876
1.81 0.293
0.631 3
0.59 0.294
0.63 0.301
0.58 0.055
0.3 2.868
1.87 0.266
0.804 4
1 0.257
0.86 0.276
0.74 0.039
0.4 2.861
1.93 0.225
1.065 5
1.68 0.206
1.19 0.225
1.07 0.022
0.5 -2.85
2.02 0.181
1.346 6
2.83 0.134
1.65 0.17
1.42 0.01
0.57 2.82
2.26 0.119
1. 741 7
4.75 0.061
2.11 0.087
1.95 0.007
0.58 2.779
2.59 0.058
2.130 8
8 0.021
2.37 0.019
2.38 0.007
0.58 2.718
3.0
8.
0.019 2.379
9 13.45
0.01 2.44
0.009 2.44
. 0.009 0.57
2.619 3.88
0.01 2.436
10 22.63
0.01 2.44
0.008 2.45
0.01 0.57
2.461 5.15
0.013 2.417
30 2.369
5.9 38
2.315 6.33
A15

AP
PE
ND
ICE
S
TIM
E
Run lD
C
ollector R
un 2D
Collector
Ru
n3
D
Collector
Ru
n4
D
Collector
Run 5D
C
ollector Sam
ple (m
inutes) diC
3 DT
C
Adsorption
diC3 D
TC
A
dsorption diC
3 DT
C
Adsorption
diC3 D
TC
A
dsorption O
C6 D
TC
A
dsorption N
o. S
TD
·Cond
(mols E
-6) lO
OO
rpm
(mols E
-6) 390rpm
(m
ols E-6)
112 of all
(mols E
-6) ST
D C
ond (m
ols E-6)
0 0.00
0.360 0.000
0.360 0.000
0.360 0.000
0.360 0.000
0.225 0.000
1 0.21
0.295 0.580
0.278 0.732
0.305 0.491
0.315 0.481
0.164 0.680
2 0.36
0.266 0.839
0.265 0.848
0.267 0.830
0.298 0.662
0.154 0.790
3 0.59
0.252 0.964
0.242 1.054
0.263 0.866
0.267 0.994
0.135 1.000
4 1.00
0.222 l.232
0.204 1.393
0.213 1.313
0.241 1.271
0.121 1.160
5 1.68
0.173 l.670
0.157 1.813
0.166 1.732
0.195 1.763
0.093 1.470
6 2.83
0.132 2.036
0.115 2.188
0.150 1.875
0.163 2.105
0.064 1.790
7 4.75
0.097 2.348
0.083 2.473
0.118 2.161
0.144 2.308
0.048 1.970
8 8.00
0.092 2.393
0.079 2.509
0.078 2.518
0.132 2.436
0.046 1.990
9 13.45
0.081 2.491
0.080 2.500
0.074 2.554
0.128 2.479
0.047 1.980
10 22.63
0.082 2.482
0.073 2.563
0.083 2.473
0.126 2.500
0.044 2.010
TIM
E
Ru
n6
D
Collector
Run 7D
C
ollector R
un
8D
C
ollector R
un
9D
C
ollector R
un lOD
C
ollector
Sample
(minutes)
diC3 D
TC
A
dsorption diC
3 DT
C
Adsorption
diC3 O
TC
A
dsorption diC
3 DT
C
Adsorption
diC3 O
TC
A
dsorption '
No.
2* Dos
(mols E
-6) no ore
(mols E
-6) 707R
PM
(mols E
-6) ST
D C
ond (m
ols E-6)
112 H2
0
(mols E
-6)
0 0.00
0.630 0.000
0.360 0.000
0.360 0.000
0.630 0.000
1 0.21
0.548 0.820
0.321 0.286
0.685 0.299
0.545 0.523
0.535 2
0.36 0.520
1.100 0.323
0.270 0.833
0.283 0.688
0.500 0.650
3 0.59
0.495 1.350
0.328 0.248
l .037 0.263
0.866 0.458
0.860 4
1.00 0.422
2.080 0.343
0.215 1.343
0.229 1.170
0.394 1.180
5 1.68
0.345 . 2.850
0.324 0.176
1.704 0.188
1.536 0.315
1.575
6 2.83
0.253 3.770
0.339 0.132
2.111 0.133
2.027 0.228
-2.010 7
4.75 0.206
4.240 0.330
0.100 2.407
0.100 2.321
0.167 2.315
8 8.00
0.162 4.678
0.331 0.089
2.509 0.088
2.429 0.133
2.485
9 13.45
0.129 5.010
0.313 0.089
2.509 0.083
2.473 0.127
2.515 10
22.63 0.132
4.980 0.312
0.090 2.500
0.083 2.473
0.134 2.480
A16

AP
PE
ND
ICE
S
TIM
E
Run llD
C
ollector R
un 12D
Collector
Run 13D
C
ollector R
un 14D
Collector
Run 15D
C
ollector Sam
ple (m
inutes) diC
3 DT
C
Adsorption
diC3 D
TC
A
dsorption . no buffer A
dsorption diC
3 DT
C
Adsorption
diC3 D
TC
A
dsorption N
o. 1/2*D
ose (m
ols E-6)
STD
Cond
(mols E
-6) ST
D C
ond (m
ols E-6)
ST
D C
ond (m
ols E-6)
1/10 Dose
(mols E
-6) no buffer
0 0.00
0.222 0.000
0.360 0.000
0.293 0.000
0.365 0.000
0.120 0
.00
0
1 0.21
0.150 0.556
0.306 0.491
0.228 0.618
0.254 0.974
0.103 0.115
2 0.36
0.141 0.625
0.270 0.818
0.206 0.827
0.230 1.184
0.094 0.176
3 0.59
0.124 0.756
0.249 1.009
0.180 1.074
0.204 1.412
0.089 0.209
4 1.00
0.105 0.903
0.209 1.373
0.136 1.492
0.167 1.737
0.087 0.223
5 1.68
0.079 1.103
0.164 1.782
0.097 1.863
0.134 2.026
0.085 0.236
6 2.83
0.062 1.235
0.121 2.173
0.071 2.110
0.112 2.219
0.086 0
.23
0
7 4.75
0.061 1.242
0.095 2.409
0.062 2.196
0.098 2.342
0.084 0.243
8 8.00
0.060 1.250
0.089 2.464
0.050 2.310
0.086 2.447
0.083 0
.25
0
9 13.45
0.060 1.250
0.090 2.455
0.041 2.395
0.078 2.518
0.086 0.230
10 22.63
0.058 1.265
0.087 2.482
0.032 2.481
, 0.069 2.596
0.083 0
.25
0
TIM
E
Run 1
60
C
ollector R
un 17D
Collector
Sample
(minutes)
diC3 D
TC
A
dsorption diC
3 DT
C
Adsorption
No.
1/2 mineral
(mols E
-6) 1/2 m
ineral (m
ols E-6)
0 0.00
0.345 0.000
0.345 0.000
1 0.21
0.312 0.611
0.312 0.611
2 0.36
0.303 0.778
0.303 0.778
3 0.59
0.290 1.019
0.293 0.963
4 1.00
0.277 1.259
0.279 1.222
_5 1.68
0.255 1.667
0.262 1.537
6 2.83
0.230 2.130
0.231 2.111
7 4.75
0.191 2.852
0.186 2.944
8 8.00
0.142 3.759
0.138 3.833
9 13.45
0.112 4.315
0.107 4.407
10 22.63
0.085 4.815
0.088 4.759
A17
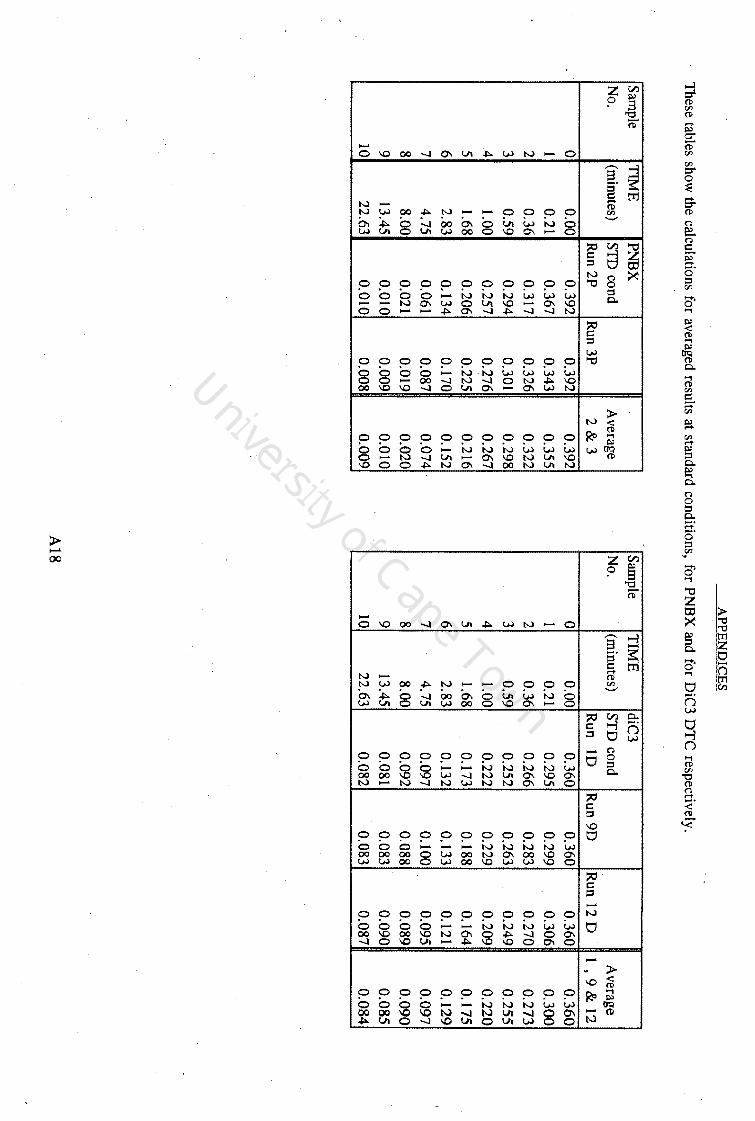
AP
PE
ND
ICE
S
These tables show
the calculations for averaged results at standard conditions, for PNB
X and for D
iC3 D
TC
respectively.
Sample
TIM
E
PNB
X
Sample
TIM
E
diC3
No.
(minutes)
STD
cond A
verage N
o. (m
inutes) S
TD
cond A
verage R
un 2P
Run 3P
2&
3
Run
ID
Run 9D
R
un 12 D
1 ' 9 & 12
0 0.00
0.392 0.392
0.392 0
0.00 0.360
0.360 0.360
0.360 1
0.21 0.367
0.343 0.355
1 0.21
0.295 0.299
0.306 0.300
2 0.36
0.317 0.326
0.322 2
0.36 0.266
0.283 0.270
0.273 3
0.59 0.294
0.301 0.298
3 0.59
0.252 0.263
0.249 0.255
4 1.00
0.257 0.276
0.267 4
1.00 0.222
0.229 0.209
0.220 5
1.68 0.206
0.225 0.216
5 1.68
0.173 0.188
0.164 0.175
6 2.83
0.134 0.170
0.152 6
2.83 0.132
0.133 0.121
0.129 7
4.75 0.061
0.087 0.074
7 4.75
0.097 0.100
0.095 0.097
8 8.00
0.021 0.019
0.020 8
8.00 0.092
0.088 0.089
0.090 9
13.45 0.010
0.009 0.010
9 13.45
0.081 0.083
0.090 0.085
10 22.63
0.010 0.008
0.009 10
22.63 0.082
0.083 0.087
0.084
Al8

AP
PE
ND
ICE
S
Below
are the calculations and values used in tli.e comparison o
f the effects of eight tim
es increase of energy, achieved through increased tim
e and increased pow
er. In each case, the averaged values for the standard conditions runs w
ere used as the basis against which the others w
ere calaculated. E
ight times
the Tim
e was achieved by taking standard conditions and reading the observation at eight tim
es the Tim
e.
PNB
X
Tim
e A
bso
rben
cy
Co
llecto
r %
readings
Adsorption
improvem
ent
Sample no.
(minutes)
Ave of ST
D
8 x Tim
e . 8 x P
ower
STD
8 x T
ime
8 x Pow
er 8 x T
ime
8 x Power
0 0.00
0.39 0.39
0.39 I
0.21 0.36
0.22 0.32
0.24 l.13
0.48 377.03
102.70 2
0.36 0.32
0.15 0.29
0.45 l.53
0.63 240.43
40.43 3
0.59 0.30
0.07 0.27
0.60 2.03
0.80 236.51
33.33 4
l.00
0.27
0.02 0.23
0.80 2.37
l.07 196.41
33.07 5
l.68 0.22
0.01 0.18
l.13 2.44
l.35 ll6.71
19.55 6
2.83 0.15
0.01 0.12
I.53 2.44
l.74 59.58
13.75 7
4.75 0.07
0.01 0.06
2.03 2.44
2.13 20.44
5.0
3
8 8.00
0.02 0.01
0.02 2.37
2.44 2.38
2.96 0.27
9 13.45
0.01 0.01
0.01 2.44
2.44 2.44
0.13 -0.13
IO
22.63 0.01
0.01 0.01
2.44 2.44
2.42 0.00
-1.04
A19

-. A
PP
EN
DIC
ES
diC3 D
TC
T
ime
Ab
sorb
ency
C
olle
cto
r %
readings
Adsorption
, im
provement
Sample no.
(minutes)
Ave of ST
D
8 x Tim
e .
8 x Pow
er ST
D
8 x Tim
e 8 x Pow
er 8 x T
ime
8 x Pow
er
0 0.00
0.36 0.36
0.36 1
0.21 0.30
0.18 0.28
0.54 1.65
0.73 208.33
36.67 2
0.36 0.27
0.13 0.27
0.78 2.07
0.85 165.90
9.20 3
0.59 0.25
0.10 0.24
0.94 2.35
1.05 149.37
12.03 4
1.00 0.22
0.09 0.20
1.25 2.41
1.39 93.10
11.43 5
1.68 0.18
0.08 0.16
1.65 2.46
1.81 48.83
9.73 6
2.83 0.13
0.08 0.12
2.07 2.46
2.19 19.31
5.91 7
4.75 0.10
0.08 0.08
2.35 2.49
2.47 6.22
5.46 8
8.00 0.09
0.08 0.08
2.41 ,
2A
9
2.51 3.21
3.95 9
13.45 0.08
0.08 0.08
2.46 2.49
2.50 1.33
1.69 10
22.63 0.08
0.08 0.07
2.46 2.49
2.56 1.09
3.99 '
A20
Related Documents