MODEL PREDICTIVE CONTROL FOR FLOTATION PLANTS M. Lundh 1 , S. Gaulocher 2 , J. Pettersson 3 , H. Lindvall 4 and *E. Gallestey 5 1 ABB AB,Corporate Research Västerås, Sweden 2 ABB Corporate Research Segelhofstrasse 1K CH-5405 Baden 5 Daettwil, Switzerland 3 ABB AB, Power Generation Västerås, Sweden 4 Garpenberg Concentrator, Boliden Mineral AB Garpenberg, Sweden 5 ABB Switzerland Ltd Segelhofstrasse 1K CH-5405 Baden 5 Daettwil, Switzerland (*Corresponding author: [email protected]) ABSTRACT This contribution summarizes the results of a project for optimization of a froth flotation circuit. A model predictive control based approach has been developed and tested on a zinc flotation circuit in Sweden. The basic idea is to use air flows and chemicals to control the concentrate in the product and in the tailing. The activities in the project covered modeling, design, implementation, and tests at a customer site. The on-line model predictive controller implementation has been done using Expert Optimizer. The result from the site test demonstrates the benefit of using model predictive control compared to the existing manual strategy.

Welcome message from author
This document is posted to help you gain knowledge. Please leave a comment to let me know what you think about it! Share it to your friends and learn new things together.
Transcript
MODEL PREDICTIVE CONTROL FOR FLOTATION PLANTS
M. Lundh1, S. Gaulocher2, J. Pettersson3, H. Lindvall4 and *E. Gallestey5
1ABB AB,Corporate Research Västerås, Sweden
2ABB Corporate Research
Segelhofstrasse 1K CH-5405 Baden 5 Daettwil, Switzerland
3ABB AB, Power Generation
Västerås, Sweden
4Garpenberg Concentrator, Boliden Mineral AB Garpenberg, Sweden
5ABB Switzerland Ltd
Segelhofstrasse 1K CH-5405 Baden 5 Daettwil, Switzerland
(*Corresponding author: [email protected])
ABSTRACT This contribution summarizes the results of a project for optimization of a froth flotation circuit. A
model predictive control based approach has been developed and tested on a zinc flotation circuit in Sweden. The basic idea is to use air flows and chemicals to control the concentrate in the product and in the tailing. The activities in the project covered modeling, design, implementation, and tests at a customer site. The on-line model predictive controller implementation has been done using Expert Optimizer. The result from the site test demonstrates the benefit of using model predictive control compared to the existing manual strategy.
INTRODUCTION Froth flotation
Froth flotation is a common method to extract a certain type of mineral from ore while depressing the amount of undesired minerals in the extracted concentrate. It is done by adding certain chemical reagents to selectively rendering the desired mineral hydrophobic. In a flotation cell, air bubbles then lifts the mineral. The resulting froth layer is then skimmed to produce the concentrate. Normally a flotation process consists of several flotation cells together with cyclones, mills, and mixing tanks. For poly-metallic ore different flotation circuits and a grinding circuit can be combined in order to form a concentrator used for extracting several mineral types from the same ore. This is the case for the Garpenberg concentrator, although our focus here is zinc.
Motivation
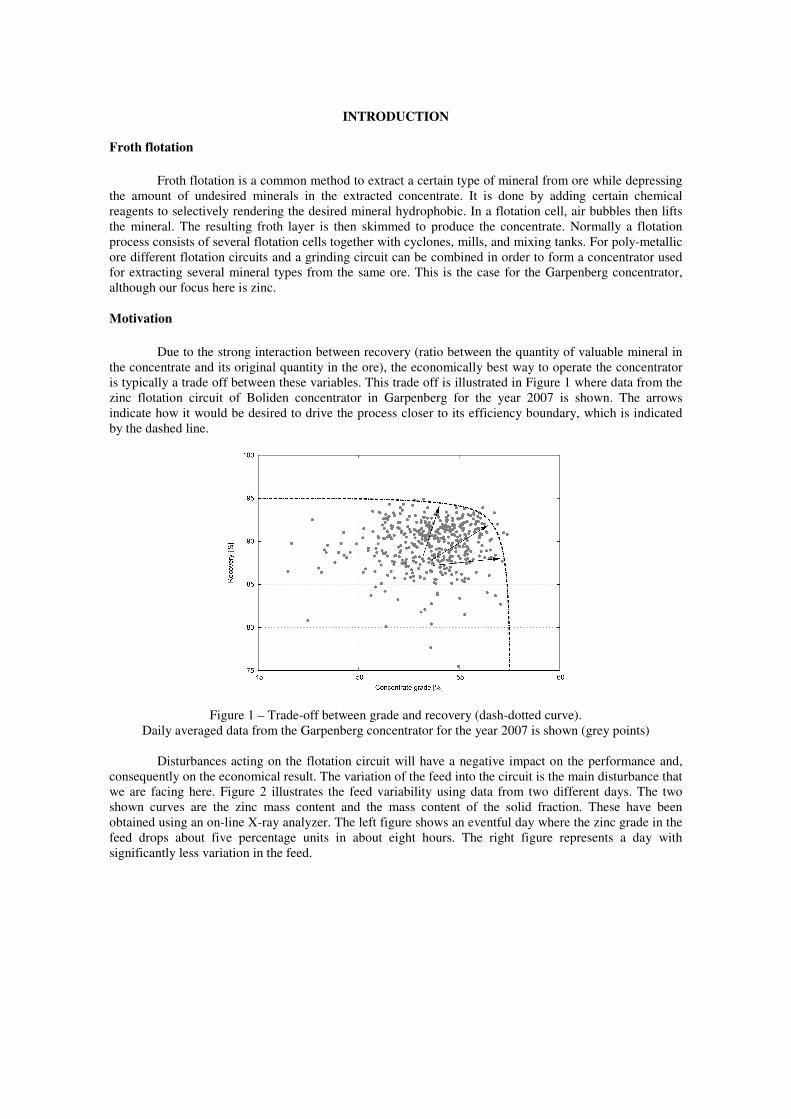
Due to the strong interaction between recovery (ratio between the quantity of valuable mineral in the concentrate and its original quantity in the ore), the economically best way to operate the concentrator is typically a trade off between these variables. This trade off is illustrated in Figure 1 where data from the zinc flotation circuit of Boliden concentrator in Garpenberg for the year 2007 is shown. The arrows indicate how it would be desired to drive the process closer to its efficiency boundary, which is indicated by the dashed line.
Figure 1 – Trade-off between grade and recovery (dash-dotted curve). Daily averaged data from the Garpenberg concentrator for the year 2007 is shown (grey points)
Disturbances acting on the flotation circuit will have a negative impact on the performance and,
consequently on the economical result. The variation of the feed into the circuit is the main disturbance that we are facing here. Figure 2 illustrates the feed variability using data from two different days. The two shown curves are the zinc mass content and the mass content of the solid fraction. These have been obtained using an on-line X-ray analyzer. The left figure shows an eventful day where the zinc grade in the feed drops about five percentage units in about eight hours. The right figure represents a day with significantly less variation in the feed.
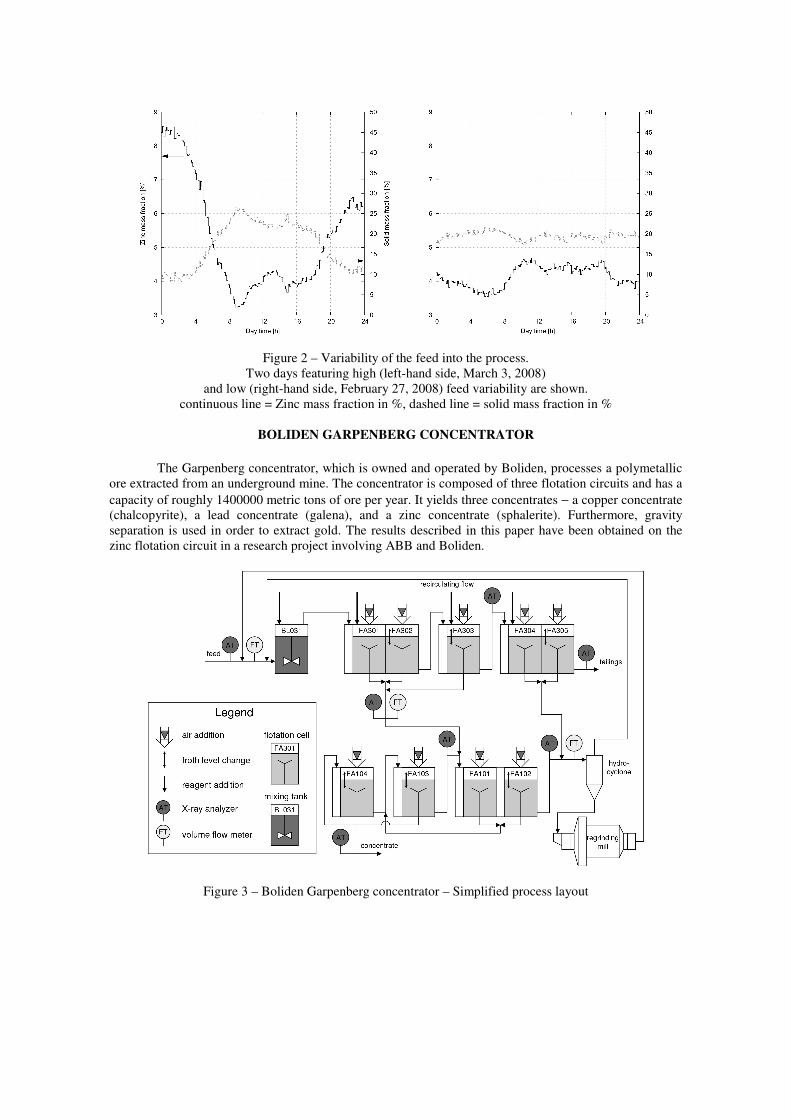
Figure 2 – Variability of the feed into the process. Two days featuring high (left-hand side, March 3, 2008)
and low (right-hand side, February 27, 2008) feed variability are shown. continuous line = Zinc mass fraction in %, dashed line = solid mass fraction in %
BOLIDEN GARPENBERG CONCENTRATOR
The Garpenberg concentrator, which is owned and operated by Boliden, processes a polymetallic
ore extracted from an underground mine. The concentrator is composed of three flotation circuits and has a capacity of roughly 1400000 metric tons of ore per year. It yields three concentrates − a copper concentrate (chalcopyrite), a lead concentrate (galena), and a zinc concentrate (sphalerite). Furthermore, gravity separation is used in order to extract gold. The results described in this paper have been obtained on the zinc flotation circuit in a research project involving ABB and Boliden.
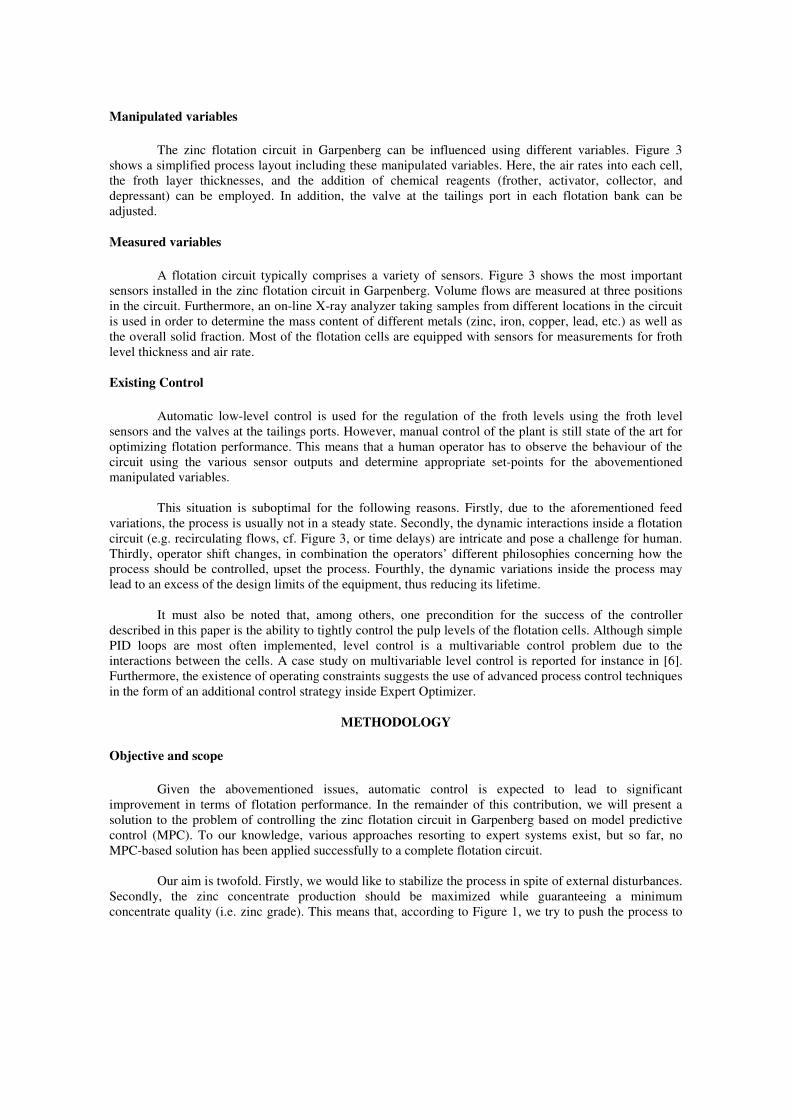
Figure 3 – Boliden Garpenberg concentrator – Simplified process layout
Manipulated variables
The zinc flotation circuit in Garpenberg can be influenced using different variables. Figure 3 shows a simplified process layout including these manipulated variables. Here, the air rates into each cell, the froth layer thicknesses, and the addition of chemical reagents (frother, activator, collector, and depressant) can be employed. In addition, the valve at the tailings port in each flotation bank can be adjusted. Measured variables
A flotation circuit typically comprises a variety of sensors. Figure 3 shows the most important sensors installed in the zinc flotation circuit in Garpenberg. Volume flows are measured at three positions in the circuit. Furthermore, an on-line X-ray analyzer taking samples from different locations in the circuit is used in order to determine the mass content of different metals (zinc, iron, copper, lead, etc.) as well as the overall solid fraction. Most of the flotation cells are equipped with sensors for measurements for froth level thickness and air rate.
Existing Control
Automatic low-level control is used for the regulation of the froth levels using the froth level sensors and the valves at the tailings ports. However, manual control of the plant is still state of the art for optimizing flotation performance. This means that a human operator has to observe the behaviour of the circuit using the various sensor outputs and determine appropriate set-points for the abovementioned manipulated variables.
This situation is suboptimal for the following reasons. Firstly, due to the aforementioned feed variations, the process is usually not in a steady state. Secondly, the dynamic interactions inside a flotation circuit (e.g. recirculating flows, cf. Figure 3, or time delays) are intricate and pose a challenge for human. Thirdly, operator shift changes, in combination the operators’ different philosophies concerning how the process should be controlled, upset the process. Fourthly, the dynamic variations inside the process may lead to an excess of the design limits of the equipment, thus reducing its lifetime.
It must also be noted that, among others, one precondition for the success of the controller described in this paper is the ability to tightly control the pulp levels of the flotation cells. Although simple PID loops are most often implemented, level control is a multivariable control problem due to the interactions between the cells. A case study on multivariable level control is reported for instance in [6]. Furthermore, the existence of operating constraints suggests the use of advanced process control techniques in the form of an additional control strategy inside Expert Optimizer.
METHODOLOGY Objective and scope
Given the abovementioned issues, automatic control is expected to lead to significant improvement in terms of flotation performance. In the remainder of this contribution, we will present a solution to the problem of controlling the zinc flotation circuit in Garpenberg based on model predictive control (MPC). To our knowledge, various approaches resorting to expert systems exist, but so far, no MPC-based solution has been applied successfully to a complete flotation circuit.
Our aim is twofold. Firstly, we would like to stabilize the process in spite of external disturbances. Secondly, the zinc concentrate production should be maximized while guaranteeing a minimum concentrate quality (i.e. zinc grade). This means that, according to Figure 1, we try to push the process to
an operating point closer to the upper limit. In order to fulfil this, optimal set-points should automatically be chosen by the controller.
A secondary objective concerns the tailoring of an efficient engineering process for the solution. It should be possible for a commissioning engineer to apply the control strategy to a different flotation circuit with a reasonable amount of effort. Model predictive control
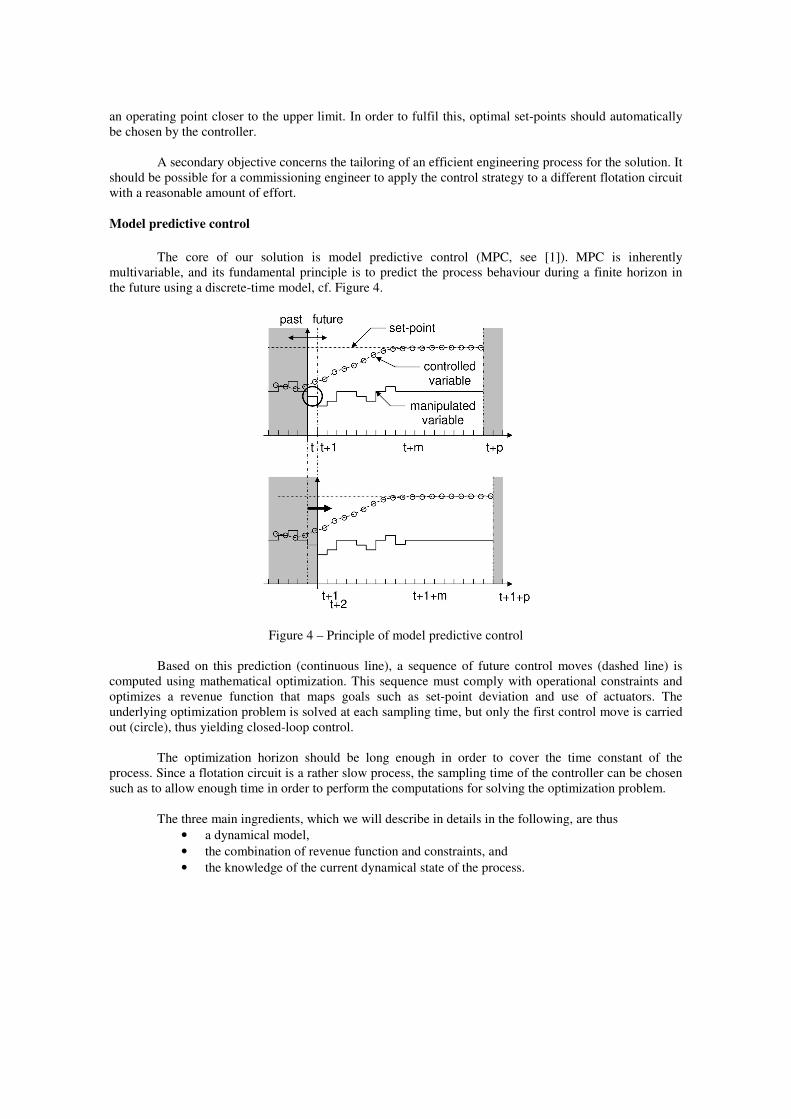
The core of our solution is model predictive control (MPC, see [1]). MPC is inherently multivariable, and its fundamental principle is to predict the process behaviour during a finite horizon in the future using a discrete-time model, cf. Figure 4.
Figure 4 – Principle of model predictive control
Based on this prediction (continuous line), a sequence of future control moves (dashed line) is computed using mathematical optimization. This sequence must comply with operational constraints and optimizes a revenue function that maps goals such as set-point deviation and use of actuators. The underlying optimization problem is solved at each sampling time, but only the first control move is carried out (circle), thus yielding closed-loop control.
The optimization horizon should be long enough in order to cover the time constant of the process. Since a flotation circuit is a rather slow process, the sampling time of the controller can be chosen such as to allow enough time in order to perform the computations for solving the optimization problem.
The three main ingredients, which we will describe in details in the following, are thus • a dynamical model, • the combination of revenue function and constraints, and • the knowledge of the current dynamical state of the process.
Generation of the dynamical model
The future behaviour of the process must be predicted using a reliable dynamical model of the flotation circuit. There are two fundamental approaches for how the model for the MPC is obtained, commonly named using the terminology “grey box models” and “first principles models”. In real applications though, the methods are blended in one way or another. Below we give a short description of both methods. Grey Box Modelling
The approach here is to use system identification [5] to obtain a discrete time model of the flotation process. The model defined as follows:
[ ] [ ] [ ] [ ]
[ ] [ ]kCxky
kdBkuBkAx1kx du
=++=+
(1)
where x[k], u[k], d[k], and y[k] are state variables, manipulated variables, measured disturbance variables, and measured output variables at time step k respectively. The matrices A, Bu, Bd, and C are obtained using gray box identification using historical time series data. Gray box identification here means that the block structures of the matrices are assumed to be known, and with certain zero elements. This approach will give an identification problem with fewer parameters, and hence also a better model than if all parameters in the A, Bu, Bd, and C matrices were identified using a black box modelling approach.
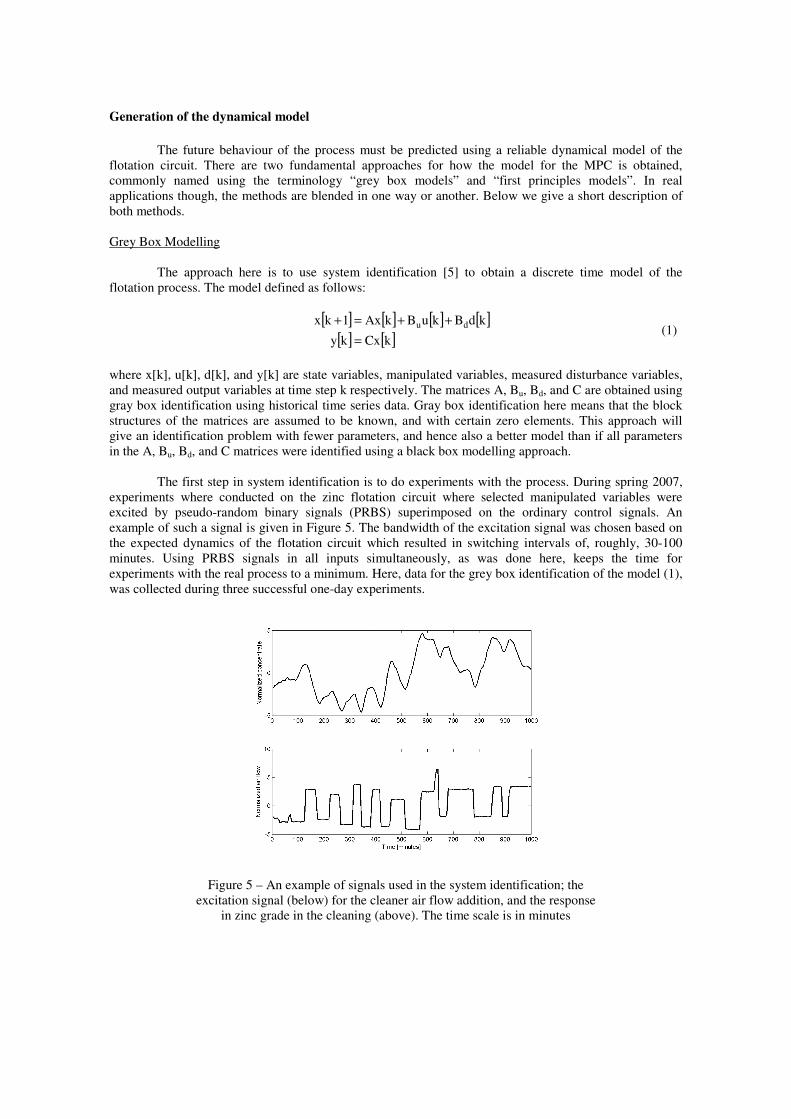
The first step in system identification is to do experiments with the process. During spring 2007, experiments where conducted on the zinc flotation circuit where selected manipulated variables were excited by pseudo-random binary signals (PRBS) superimposed on the ordinary control signals. An example of such a signal is given in Figure 5. The bandwidth of the excitation signal was chosen based on the expected dynamics of the flotation circuit which resulted in switching intervals of, roughly, 30-100 minutes. Using PRBS signals in all inputs simultaneously, as was done here, keeps the time for experiments with the real process to a minimum. Here, data for the grey box identification of the model (1), was collected during three successful one-day experiments.
Figure 5 – An example of signals used in the system identification; the excitation signal (below) for the cleaner air flow addition, and the response
in zinc grade in the cleaning (above). The time scale is in minutes
In the second step in the system identification, the free parameters of the A, Bu, Bd, and C matrices are obtained using mathematical optimization where the error between the measured and the predicted outputs is minimized. This is done off-line, using logged data from the experiments. Here ARX models were used. First Principles Modelling
This alternative approach uses the Mixed-Logical Dynamical (MLD) framework which incorporates real and boolean variables as well as constraints and offers great flexibility (e.g. piecewise linear dynamics), see [4]. An MLD is defined as follows:
[ ] [ ] [ ] [ ] [ ][ ] [ ] [ ] [ ] [ ]
[ ] [ ] [ ] [ ] 51432
321
321
EkuEkxEkzEk�E
kzDk�DkuDkCxky
kzBk�BkuBkAx1kx
++≤+
+++=
+++=+
(2)
x[k], u[k], and y[k] are real state, input, and output variables at time step k respectively. δ[k] and
z[k] are boolean and real auxiliary variables, respectively. Although boolean variables have not been used in this application, the MLD framework is of great importance because of its capability of integrating constraints (an example for such constraints are interconnections between flotation cells) in the model.
The modeling paradigms are first principles and modularity (i.e. the overall model of the flotation circuit can be assembled from basic components), thus yielding an easily comprehensible model. The required basic components are basically those shown in Figure 3, e.g. the model of a flotation cell, of a mixing tank, or of an X-ray analyzer.
For control purposes, the dynamical model must be of low complexity. Because of closed-loop control, it is generally sufficient to capture the dominant effects of the process. Our model should be considered in this light. Another important requirement is to dispose of dynamical states and parameters that have a physical meaning.
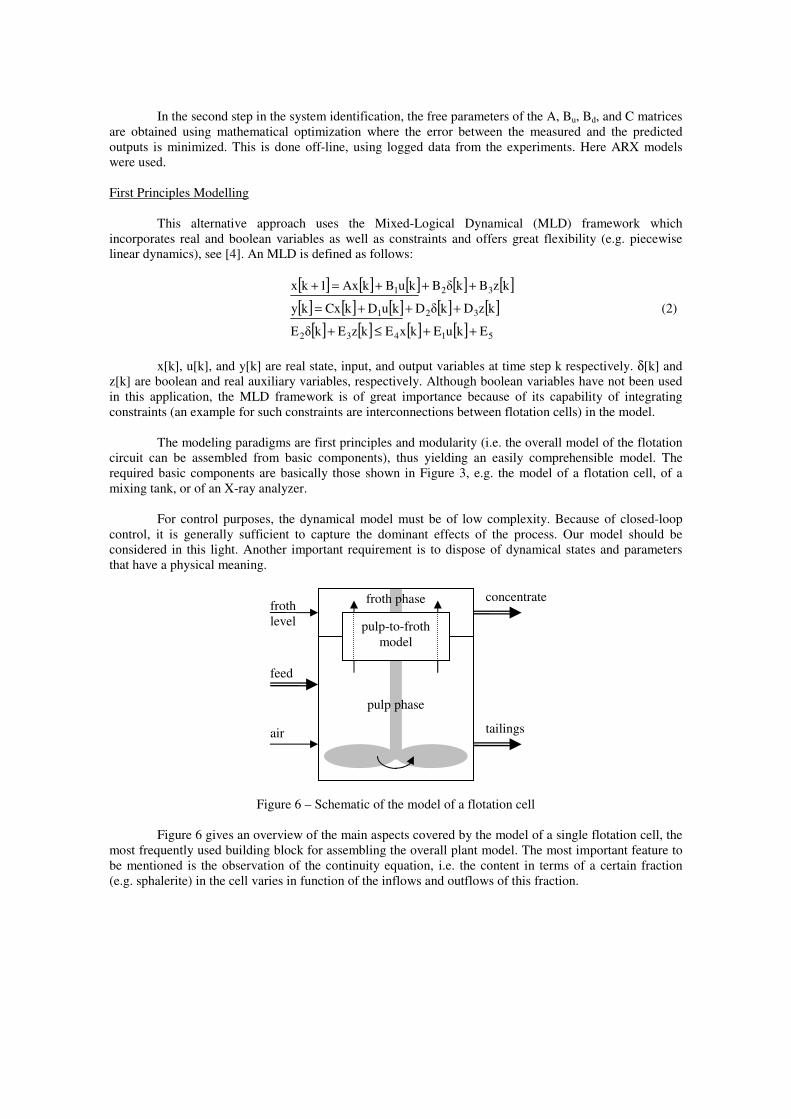
Figure 6 – Schematic of the model of a flotation cell
Figure 6 gives an overview of the main aspects covered by the model of a single flotation cell, the most frequently used building block for assembling the overall plant model. The most important feature to be mentioned is the observation of the continuity equation, i.e. the content in terms of a certain fraction (e.g. sphalerite) in the cell varies in function of the inflows and outflows of this fraction.
feed
concentrate
tailings
froth phase
pulp phase
air
froth level pulp-to-froth
model
Cost Function Design and Constraints
The cost function used in MPC consists of two components, namely • a quadratic cost for the set-point deviation of the zinc grades in the concentrate and in the
tailings and • a quadratic cost for the control signal increments.
The circulating volumetric flow was given an upper limit in the MPC. The remaining measured variables (as described in the corresponding section) were used as inputs to the state estimator. Knowledge of the current dynamical state
A prerequisite for MPC is the knowledge of the current plant state. In a multivariable process such as a flotation circuit, this is a non-trivial task.
In this case we resort to the well established Kalman filter (see for example [1]) in order to provide an estimate of the plant state based on the variables measured in the past. To obtain error free tracking, i.e. integral action, the model (1) needs to be augmented with states to handle offsets that always occur in a real world process.
A thorough description of our state estimation approach is not the scope of this contribution. Let us mention here though that Moving Horizon Estimation (see [3] for example) could also be used. It offers some advantages over the Kalman Filter like explicit consideration of process constraints at a price of a more complex computation.
IMPLEMENTATION
ABB’s cpmPlus Expert Optimizer is the advocated tool for implementation of advanced process control in general, and model predictive control in particular, for the mineral processing industry and others. In addition to the general framework for model predictive control, cpmPlus Expert Optimizer also includes tools for fuzzy logic and neural networks. The software, which runs on a separate PC, is also capable of handling a large number of communication protocols and can thus be interfaced easily with DCS (distributed control systems) from many vendors.
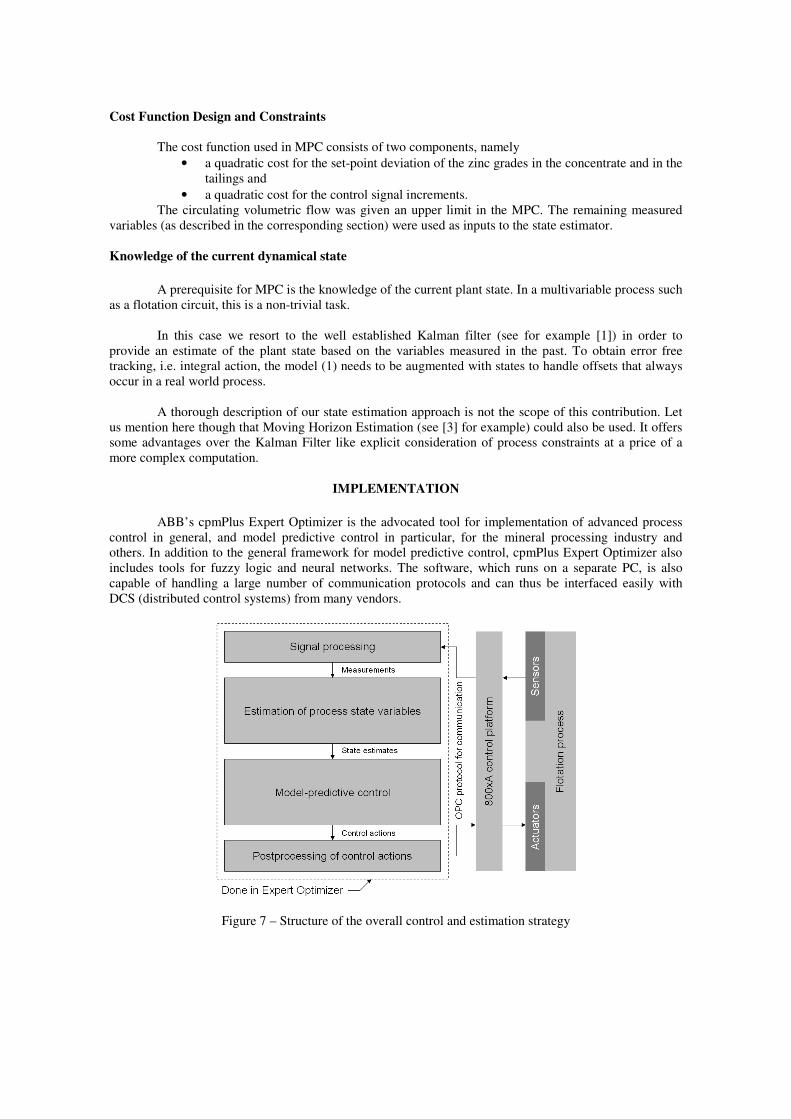
Figure 7 – Structure of the overall control and estimation strategy
Overall control and state estimation strategy
Figure 7 shows the overall control and estimation strategy used in this application. In Garpenberg the underlying DCS is the ABB 800xA system, where the communication with Expert Optimizer is achieved using OPC (OLE for Process Control). The 800xA system implements the low level controllers where some of them receive their set-points from Expert Optimizer. The 800xA system is also used for the operator interaction in Garpenberg.
The implementation in Expert Optimizer covers not only the model predictive controller and the Kalman filter state estimation, it contains also signal processing functions (e.g. validation, scaling, non-linear transformation) for the inputs and the outputs.
RESULTS FROM EVALUATION PERIOD
The performance of the control strategy based on the grey box model was evaluated during a test
period including September and November 2008. During the two month long test period the model predictive controller was in operation for one to two days, then it was turned off for one to two days. The motivation for this switching forth and back was to decrease the influence of the quality of the ore on the performance to make a fair comparison of the new MPC based strategy and the existing control strategy.
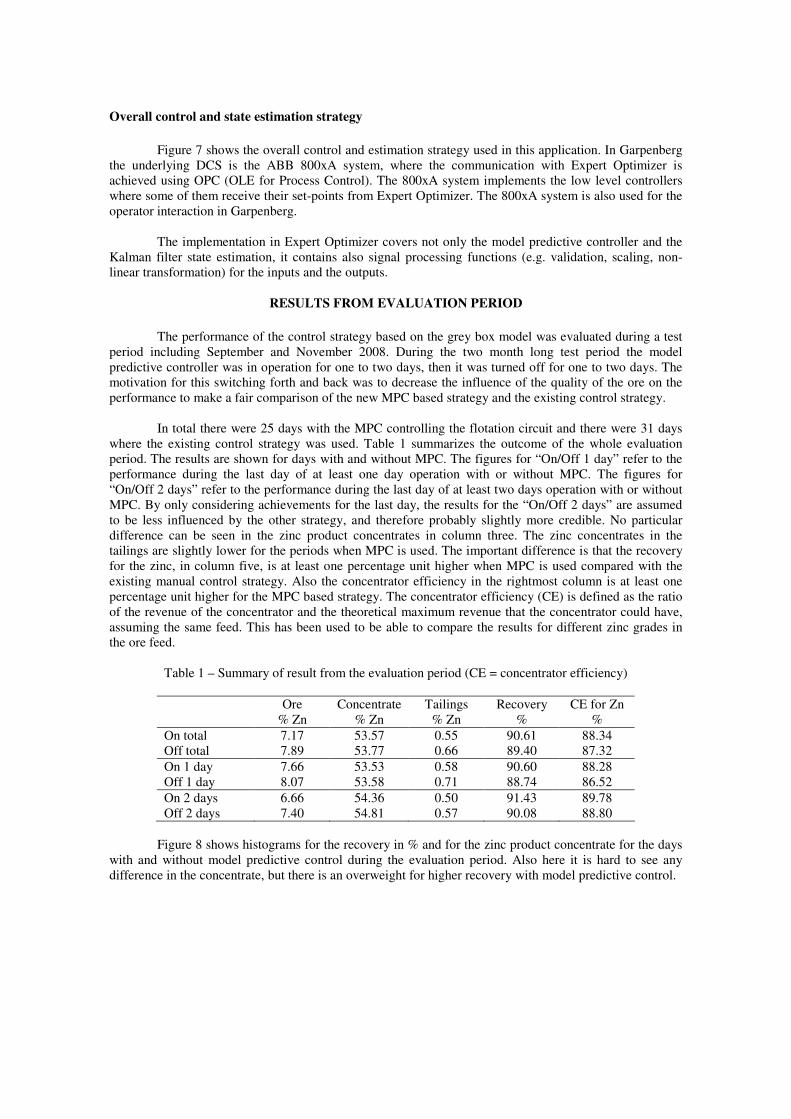
In total there were 25 days with the MPC controlling the flotation circuit and there were 31 days where the existing control strategy was used. Table 1 summarizes the outcome of the whole evaluation period. The results are shown for days with and without MPC. The figures for “On/Off 1 day” refer to the performance during the last day of at least one day operation with or without MPC. The figures for “On/Off 2 days” refer to the performance during the last day of at least two days operation with or without MPC. By only considering achievements for the last day, the results for the “On/Off 2 days” are assumed to be less influenced by the other strategy, and therefore probably slightly more credible. No particular difference can be seen in the zinc product concentrates in column three. The zinc concentrates in the tailings are slightly lower for the periods when MPC is used. The important difference is that the recovery for the zinc, in column five, is at least one percentage unit higher when MPC is used compared with the existing manual control strategy. Also the concentrator efficiency in the rightmost column is at least one percentage unit higher for the MPC based strategy. The concentrator efficiency (CE) is defined as the ratio of the revenue of the concentrator and the theoretical maximum revenue that the concentrator could have, assuming the same feed. This has been used to be able to compare the results for different zinc grades in the ore feed.
Table 1 – Summary of result from the evaluation period (CE = concentrator efficiency)
Ore Concentrate Tailings Recovery CE for Zn % Zn % Zn % Zn % % On total 7.17 53.57 0.55 90.61 88.34 Off total 7.89 53.77 0.66 89.40 87.32 On 1 day 7.66 53.53 0.58 90.60 88.28 Off 1 day 8.07 53.58 0.71 88.74 86.52 On 2 days 6.66 54.36 0.50 91.43 89.78 Off 2 days 7.40 54.81 0.57 90.08 88.80
Figure 8 shows histograms for the recovery in % and for the zinc product concentrate for the days
with and without model predictive control during the evaluation period. Also here it is hard to see any difference in the concentrate, but there is an overweight for higher recovery with model predictive control.
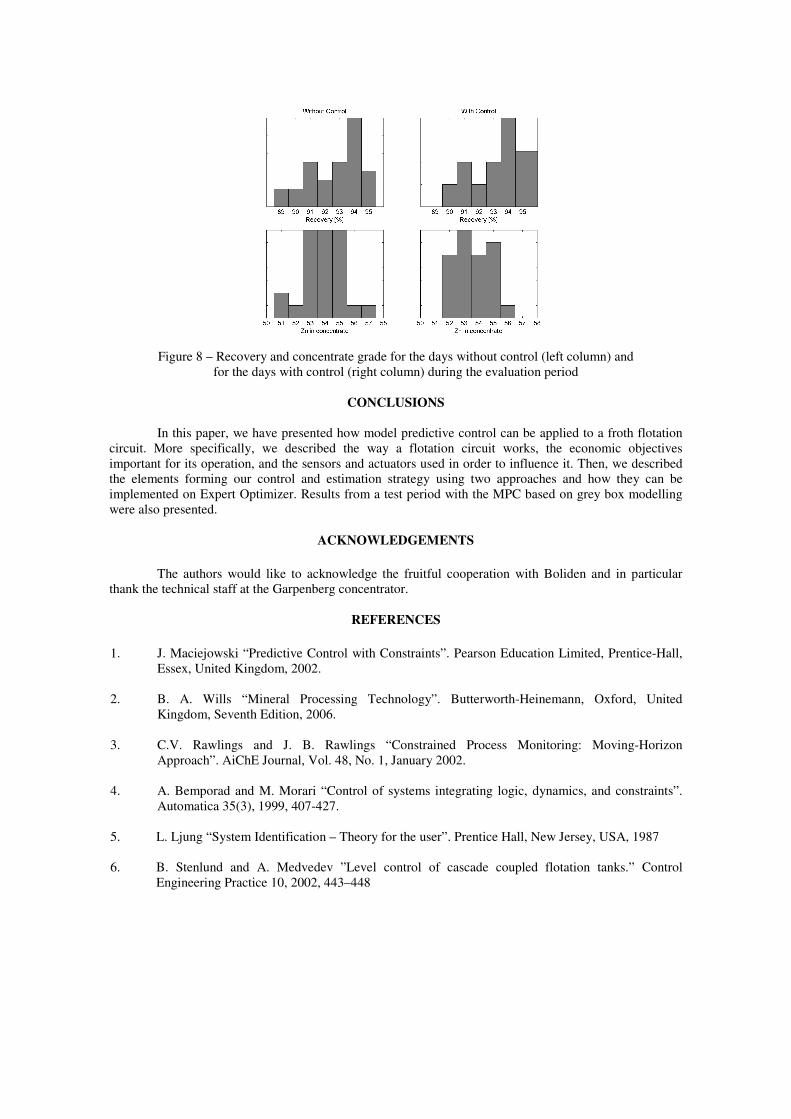
Figure 8 – Recovery and concentrate grade for the days without control (left column) and for the days with control (right column) during the evaluation period
CONCLUSIONS
In this paper, we have presented how model predictive control can be applied to a froth flotation
circuit. More specifically, we described the way a flotation circuit works, the economic objectives important for its operation, and the sensors and actuators used in order to influence it. Then, we described the elements forming our control and estimation strategy using two approaches and how they can be implemented on Expert Optimizer. Results from a test period with the MPC based on grey box modelling were also presented.
ACKNOWLEDGEMENTS
The authors would like to acknowledge the fruitful cooperation with Boliden and in particular thank the technical staff at the Garpenberg concentrator.
REFERENCES 1. J. Maciejowski “Predictive Control with Constraints”. Pearson Education Limited, Prentice-Hall,
Essex, United Kingdom, 2002. 2. B. A. Wills “Mineral Processing Technology”. Butterworth-Heinemann, Oxford, United
Kingdom, Seventh Edition, 2006. 3. C.V. Rawlings and J. B. Rawlings “Constrained Process Monitoring: Moving-Horizon
Approach”. AiChE Journal, Vol. 48, No. 1, January 2002. 4. A. Bemporad and M. Morari “Control of systems integrating logic, dynamics, and constraints”.
Automatica 35(3), 1999, 407-427. 5. L. Ljung “System Identification – Theory for the user”. Prentice Hall, New Jersey, USA, 1987 6. B. Stenlund and A. Medvedev ”Level control of cascade coupled flotation tanks.” Control
Engineering Practice 10, 2002, 443–448
Related Documents